S e t t l e m e n t B a s i n S e t t l e m e n t B a s i ...
Upload
phungxuyenCategory
view
223download
0
T E N - I n v e s tTransport Infrastructure Costs and Investments between 1996 and 2010 on the
Trans-European Transport Network and its Connection to Neighbouring Regions,including an Inventory of the Technical Status of the Transport-European Transport
Network for the Year 2000
Contract No.ETU/B2-7040-S12.328028/2001/PLANCO
F I N A L R E P O R Tpresented by
PLANCO Consulting GmbH, Essen, Germany
in cooperation with
LT Consult, FinlandNiras, PolandICCR, Austria
Technum- RA, BelgiumCDV, Czech Republic
INECO, SpainDITS, University of Rome, Italy
BCI, The NetherlandsNESTEAR, FranceSystema, Greece
Transman, HungaryTIS.pt , PortugalDTU, DenmarkTFK, Sweden
Incertrans, Romania
PLANCO Consulting GmbH Essen, 2003


TEN Invest – Final Report page 3
PLANCO Consulting GmbH Essen, 2003
Table of Content
1 INTRODUCTION ........................................................................................................................... 13
1.1 PROJECT BACKGROUND, OBJECTIVE AND APPROACH................................................ 131.2 NETWORK DETERMINATION ...................................................................................... 151.3 EXPECTED FINDINGS................................................................................................ 15
2 THE DATA COLLECTION APPROACH....................................................................................... 17
2.1 NETWORK DETERMINATION ...................................................................................... 172.2 THE INTERACTIVE DATA COLLECTION TOOL – “PLANTIS” .......................................... 18
2.2.1 Interactive Input of the Technical Status ........................................................................................ 202.2.2 Interactive Input of Investments...................................................................................................... 22
2.3 DATA COLLECTION PROCEDURE ............................................................................... 232.3.1 Regional Coverage ......................................................................................................................... 232.3.2 Data Collection Activities ............................................................................................................... 242.3.3 Availability of Data......................................................................................................................... 24
2.4 THE DATA BASE ....................................................................................................... 262.5 PLANTIS AS PRESENTATION TOOL ........................................................................... 26
3 CHANGES IN THE TECHNICAL STATUS OF THE TRANS-EUROPEAN TRANSPORTNETWORK .................................................................................................................................... 29
3.1 THE DEVELOPMENT OF THE TEN-T ROAD NETWORK .................................................. 293.1.1 Road link type ................................................................................................................................. 293.1.2 Network........................................................................................................................................... 30
3.2 THE DEVELOPMENT OF THE TEN-T RAILWAY NETWORK.............................................. 343.2.1 Railway link type............................................................................................................................. 343.2.2 Network........................................................................................................................................... 36
3.3 THE DEVELOPMENT OF THE TEN-T INLAND WATERWAY NETWORK .............................. 393.3.1 Inland waterway link type ............................................................................................................... 393.3.2 Network........................................................................................................................................... 41
3.4 THE DEVELOPMENT OF TEN-T PORTS....................................................................... 433.5 THE DEVELOPMENT OF TEN-T AIRPORTS .................................................................. 45
4 BACKGROUND TO DECISION TAKING CONCERNING INVESTMENTS IN THE TRANS-EUROPEAN TRANSPORT NETWORK ....................................................................................... 48
4.1 METHODOLOGIES OF TRANSPORT FORECASTING....................................................... 484.1.1 General remarks ............................................................................................................................. 484.1.2 Traffic forecast methods.................................................................................................................. 484.1.3 Scenarios......................................................................................................................................... 494.1.4 Information concerning forecasts in the Member States and Candidate Countries ....................... 51
4.2 SELECTION PROCEDURES......................................................................................... 53
page 4 TEN Invest – Final Report
PLANCO Consulting GmbH Essen, 2003
5 METHODS TO ESTIMATE MISSING DATA ................................................................................ 55
5.1 CALCULATION OF UNIT COSTS.................................................................................. 555.1.1 Unit cost information from available studies.................................................................................. 555.1.2 Unit cost estimation based on the collected data............................................................................ 56
5.2 ASSESSMENT OF INVESTMENT STRUCTURE................................................................ 60
6 INVESTMENT IN THE TRANS-EUROPEAN TRANSPORT NETWORK .................................... 61
6.1 INVESTMENTS IN THE COUNTRIES.............................................................................. 616.1.1 Member States................................................................................................................................. 616.1.2 Candidate Countries ....................................................................................................................... 62
6.2 INVESTMENTS BY MODE ........................................................................................... 626.2.1 Road Infrastructure......................................................................................................................... 656.2.2 Rail Infrastructure .......................................................................................................................... 686.2.3 Inland Waterways Infrastructure .................................................................................................... 736.2.4 Airports ........................................................................................................................................... 756.2.5 Ports................................................................................................................................................ 78
6.3 SPECIFIC PROJECTS ................................................................................................ 796.3.1 Highspeed train / combined transport north – south ...................................................................... 806.3.2 Highspeed train PBKAL ................................................................................................................. 806.3.3 Highspeed train south ..................................................................................................................... 806.3.4 Highspeed train east ....................................................................................................................... 816.3.5 Conventional rail/ combined transport: Betuwe line...................................................................... 816.3.6 Highspeed train/ combined transport France – Italy...................................................................... 816.3.7 Greek motorways, Pathe and Via Egnatia ...................................................................................... 826.3.8 Multimodal link Portugal- Spain- Central Europe ......................................................................... 826.3.9 Conventional rail link Cork – Stranraer......................................................................................... 826.3.10 Malpensa Airport ............................................................................................................................ 836.3.11 Fixed rail/ road link between Denmark an Sweden ........................................................................ 836.3.12 Nordic triangle (rail/ road)............................................................................................................. 836.3.13 Ireland / United Kingdom/ Benelux road link................................................................................. 846.3.14 West coast main line (rail) .............................................................................................................. 846.3.15 East European combined transport/ high-speed train .................................................................... 84
6.4 REGIONAL DISTRIBUTION OF THE INVESTMENT IN THE TEN-T NETWORK ..................... 856.5 TEN-T INVESTMENTS ON NUTS3 LEVEL .................................................................... 88
6.5.1 TEN-T network density.................................................................................................................... 886.5.2 Investments...................................................................................................................................... 91
7 SOURCES OF FINANCE .............................................................................................................. 94
7.1 FINANCIAL SUPPORT FROM TEN-T BUDGET (1996-2001) ........................................... 947.2 FINANCIAL SUPPORT FROM ISPA.............................................................................. 987.3 FINANCIAL SUPPORT FROM PHARE ......................................................................... 1007.4 STRUCTURAL AND COHESION FUNDS FOR TRANSPORT ............................................ 1037.5 FINANCING FROM THE EUROPEAN INVESTMENT BANK (EIB) ..................................... 103

TEN Invest – Final Report page 5
PLANCO Consulting GmbH Essen, 2003
7.6 SOURCES OF FINANCE ACCORDING TO THE SURVEY ................................................ 105
8 ADDITIONAL INVESTMENTS TO ACHIEVE THE GUIDELINES 1996 .................................... 106
8.1 TARGETS STIPULATED IN THE GUIDELINES 1996 ...................................................... 1068.2 FULFILMENT OF THE GUIDELINES IN 2010................................................................ 106
9 CONCLUSIONS .......................................................................................................................... 111

page 6 TEN Invest – Final Report
PLANCO Consulting GmbH Essen, 2003
Maps
Map 2-1: Display of interactive maps of selected countries (“PLANTis”).................................... 19Map 2-2: The local Contact System established by Planco Consulting GmbH and Partners.... 23Map 3-1: TEN-T road network 1996 according to link types ....................................................... 31Map 3-2: TEN-T road network 2001 according to link types ....................................................... 32Map 3-3: TEN-T road network anticipated for 2010 according to link types ............................... 33Map 3-4: TEN-T road network anticipated for 2015 according to link types ............................... 34Map 3-5: TEN-T railway network 1996 according to link types ................................................... 36Map 3-6: TEN-T railway network in 2001 according to link types ............................................... 37Map 3-7: TEN-T railway network anticipated for 2010 according to link types ........................... 38Map 3-8: TEN-T railway network anticipated for 2015 according to link types ........................... 39Map 3-9: The TEN-T inland waterway network in Germany and neighbouring countries in
1996 ............................................................................................................................. 41Map 3-10: The TEN-T inland waterway network in Germany and neighbouring countries in
2001 ............................................................................................................................. 42Map 3-11: The TEN-T inland waterway network in Germany and neighbouring countries in
2010 ............................................................................................................................. 42Map 3-12: The TEN-T inland waterway network in Germany and neighbouring countries in
2015 ............................................................................................................................. 43Map 3-13: TEN-T ports and their intermodality in 2001 ................................................................ 45Map 3-14: TEN-T airports and their intermodal capability in 2001................................................ 47Map 6-1: TEN-T road links with reported investments ................................................................ 85Map 6-2: TEN-T railway links with reported investments ............................................................ 86Map 6-3: TEN-T inland waterway links with reported investments ............................................. 86Map 6-4: TEN-T ports with reported investments ....................................................................... 87Map 6-5: TEN-T airports with reported investments ................................................................... 87Map 6-6: TEN-T railway network density in 2001 at the Nuts3 level........................................... 88Map 6-7: TEN-T railway network density in 2010 at the Nuts3 level........................................... 89Map 6-8: TEN-T road network density in 2001 at the Nuts3 level............................................... 89Map 6-9: TEN-T road network density in 2010 at the Nuts3 level............................................... 90Map 6-10: TEN-T inland waterway network density in 2001 at the Nuts3 level............................ 90Map 6-11: TEN-T inland waterway network density in 2010 at the Nuts3 level............................ 91Map 6-12: TEN-T road investment in percentage of Nuts3 GDP 1999......................................... 92Map 6-13: TEN-T railway investment in percentage of Nuts3 GDP 1999..................................... 92Map 6-14: TEN-T inland waterway investment in percentage of Nuts3 GDP 1999 ...................... 93Map 7-1: Share of TEN-T support per mode and country........................................................... 98Map 8-1: Achievement of the Guidelines 1996 until 2010 concerning the TEN-T road
network....................................................................................................................... 107Map 8-2: Achievement of the Guidelines 1996 until 2010 concerning the TEN-T railway
network....................................................................................................................... 108

TEN Invest – Final Report page 7
PLANCO Consulting GmbH Essen, 2003
Figures
Figure 2-1: Availability of data per mode and country ................................................................... 25Figure 2-2: Possibilities to display information ............................................................................... 27Figure 3-1: Quality development in the TEN-T road network ......................................................... 30Figure 3-2: Quality development in the TEN-T railway network ..................................................... 35Figure 3-3: Quality development in the TEN-T inland waterway network ...................................... 40Figure 3-4: Development of the intermodal capability of contacted ports ...................................... 44Figure 3-5: Development of intermodal capability of contacted airports ........................................ 46Figure 4-1: Selection Procedures in different Countries................................................................. 53Figure 6-1: Share of investments by mode, Member States .......................................................... 63Figure 6-2: Share of investments by mode, Candidate Countries.................................................. 64Figure 6-3: Investments in TEN-T Road Infrastructure, Member States, million Euro ................... 66Figure 6-4: Investments in TEN-T Rail Infrastructure, Member States, million Euro ..................... 69Figure 6-5: Investments in TEN-T Rail Infrastructure, Candidate Countries, million Euro ............. 72Figure 6-6: Investments in TEN-T Inland Waterways, Member States, million Euro ..................... 74Figure 6-7: Investments in TEN-T Inland Waterways, Candidate Countries, million Euro............. 75Figure 7-1: TEN- T support in million Euro by mode between 1996 and 2001 .............................. 94Figure 7-2: ISPA signed projects (2000 and 2001), estimated total eligible value per mode
and total ISPA contribution (changes possible) ........................................................... 99Figure 7-3: Total contracted amount 1991-1998 by mode and country ....................................... 101Figure 7-4: Total contracted amount 1991-1998 per country ....................................................... 101

page 8 TEN Invest – Final Report
PLANCO Consulting GmbH Essen, 2003
Tables
Table 3-1: Number and type of ports part of the TEN-T................................................................ 43Table 3-2: Number and type of TEN-T airports ............................................................................. 46Table 5-1: Average unit cost for road measures ........................................................................... 57Table 5-2: Average unit cost for railway measures ....................................................................... 58Table 5-3: Average unit cost for inland waterway measures ........................................................ 58Table 5-4: Average unit cost for inland waterway measures(continued) ...................................... 59Table 6-1: Total Investments in TEN-T Infrastructure, Member States, million Euro.................... 61Table 6-2: Total Investments in TEN-T Infrastructure, Candidate Countries, million Euro ........... 62Table 6-3: Investments by mode, Member States, million Euro.................................................... 63Table 6-4: Investments by mode, Candidate Countries, million Euro ........................................... 64Table 6-5: Investments in TEN-T Road Infrastructure, Member States, million Euro ................... 65Table 6-6: Investments in TEN-T Motorways in the Member States, million Euro........................ 66Table 6-7: Investments in TEN-T Ordinary/ High Quality Roads, Member States, million
Euro.............................................................................................................................. 67Table 6-8: Investments in TEN-T road infrastructure, Candidate Countries, million Euro ............ 67Table 6-9: Investments in TEN-T Motorways, Candidate Countries, million Euro ........................ 68Table 6-10: Investments in TEN-T Ordinary/ High Quality Roads, Candidate Countries,
million Euro...................................................................................................................68Table 6-11: Investments in TEN-T Rail Infrastructure, Member States, million Euro ..................... 69Table 6-12: Investments in TEN-T High-speed Lines, Member States, million Euro...................... 70Table 6-13: Investments in TEN-T Upgraded High-speed Lines, Member States, million Euro..... 71Table 6-14: Investments in TEN-T Conventional Lines, Member States, million Euro ................... 71Table 6-15: Investments in TEN-T Rail Infrastructure, Candidate Countries, million Euro ............. 72Table 6-16: Investments in TEN-T Rail Infrastructure, Conventional Lines, Candidate
Countries, million Euro ................................................................................................. 73Table 6-17: Investments in TEN-T inland waterway infrastructure, Member States, million
Euro.............................................................................................................................. 73Table 6-18: Investments in TEN-T Inland Waterway Infrastructure, Candidate Countries,
million Euro...................................................................................................................74Table 6-19: Investments in TEN-T airports, Member States, million Euro...................................... 76Table 6-20: Investments in TEN-T international airports, Member States, million Euro ................. 76Table 6-21: Investments in TEN-T community airports, Member States, million Euro ................... 77Table 6-22: Investments in TEN-T airports, Candidate Countries, million Euro ............................. 77Table 6-23: Investments in TEN-T airports, International Airports, Candidate Countries,
million Euro...................................................................................................................78Table 6-24: Investments in TEN-T ports, Member States, million Euro .......................................... 78Table 6-25: Investments in TEN-T ports, Candidate Countries, million Euro ................................. 79Table 6-26: Specific project 1 .......................................................................................................... 80Table 6-27: Specific project 2 .......................................................................................................... 80Table 6-28: Specific project 3 .......................................................................................................... 81Table 6-29: Specific project 4 .......................................................................................................... 81Table 6-30: Specific project 5 .......................................................................................................... 81
TEN Invest – Final Report page 9
PLANCO Consulting GmbH Essen, 2003
Table 6-31: Specific project 6 .......................................................................................................... 82Table 6-32: Specific project 7 .......................................................................................................... 82Table 6-33: Specific project 8 .......................................................................................................... 82Table 6-34: Specific project 9 .......................................................................................................... 83Table 6-35: Specific project 10 ........................................................................................................ 83Table 6-36: Specific project 11 ........................................................................................................ 83Table 6-37: Specific project 12 ........................................................................................................ 84Table 6-38: Specific project 13 ........................................................................................................ 84Table 6-39: Specific project 14 ........................................................................................................ 84Table 6-40: Specific project 17 ........................................................................................................ 85Table 7-1: Total TEN-T support 1996 - 2001 in million Euro per mode ........................................ 95Table 7-2: Total TEN-T support 1996 - 2001 in million Euro, per mode in percent ...................... 96Table 7-3: TEN-T support 1996 - 2001 in million Euro, all countries and modes ......................... 96Table 7-4: TEN-T support 1996 - 2001 in million Euro by country................................................ 97Table 7-5: TEN-T support 1996 - 2001 in million Euro, by country............................................... 97Table 7-6: ISPA resources by country as decided by the EC (2000 – 2006)................................ 99Table 7-7: Projects signed - per country per (sub) sector (committed between 1/ 1/ 2000 and
31/ 12/ 2001) in million Euro (changes possible) ....................................................... 100Table 7-8: Allocation of transport Phare funds by country between 1991 and 1998 (million
Euro)........................................................................................................................... 102Table 7-9: Funding per country in million Euro by the Cohesion Fund (1994 – 1999)................ 103Table 7-10: EIB loans, Member States, in million Euro................................................................. 104Table 7-11: EIB loans, Candidate Countries, in million Euro ........................................................ 104Table 7-12: Investment according to sources of finance mentioned by the Member States
(million Euro) .............................................................................................................. 105Table 7-13: Investment according to sources of finance mentioned by the Candidate
Countries (million Euro).............................................................................................. 105Table 8-1: Aggregated length of links which in 2010 do not comply with requirements of the
TEN-T Guidelines 1996 in km.................................................................................... 109Table 8-2: Cost estimation to quantitatively fulfil the requirements of the TEN-T Guidelines
of 1996 ....................................................................................................................... 109Table 10-1: Data collection approach............................................................................................114Table 10-2: Initial time plan ........................................................................................................... 115Table 10-3: Changes in the technical status of the road network ................................................. 129Table 10-4: Changes in the technical status of the railway network ............................................. 130Table 10-5: Changes in the technical status of the inland waterway network .............................. 131Table 10-6: Investment cost by km in local currency .................................................................... 132Table 10-7: Cost of maintenance by km in local currencies.......................................................... 132Table 10-8: Unit cost for road construction in Germany (prices 1995).......................................... 133Table 10-9: Unit cost for land acquisition for road construction in Germany (prices 1995) .......... 133Table 10-10: Unit costs for railway construction in Germany (prices 1995).................................... 134Table 10-11: Unit cost for land acquisition for railway construction (price 1995)............................ 134Table 10-12: Cost of inland waterway projects in Germany (prices of 1995) ................................. 135Table 10-13: Average unit costs for road measures, Member States, Group 1.............................. 135

page 10 TEN Invest – Final Report
PLANCO Consulting GmbH Essen, 2003
Table 10-14: Average unit costs for road measures, Member States, Group 2.............................. 136Table 10-15: Average unit costs for road measures, Member States, Group 3.............................. 136Table 10-16: Average unit costs for road measures, Candidate Countries, Group 1 ..................... 137Table 10-17: Average unit costs for road measures, Candidate Countries, Group 2 ..................... 137Table 10-18: Average unit costs for road measures, Candidate Countries, Group 3 ..................... 138Table 10-19: Average unit costs for rail measures, Member States, Group 1 ................................ 138Table 10-20: Average unit costs for rail measures, Member States, Group 2 ................................ 138Table 10-21: Average unit costs for rail measures, Member States, Group 3 ................................ 139Table 10-22: Average unit costs for rail measures, Candidate Countries, Group 1........................ 139Table 10-23: Average unit costs for rail measures, Candidate Countries, Group 2........................ 139Table 10-24: Average unit costs for rail measures, Candidate Countries, Group 3........................ 139Table 10-25: Differences with regard to rail investments (million Euro).......................................... 141Table 10-26: Differences with regard to road investments (million Euro) ....................................... 141Table 10-27: Differences with regard to airport investments (million Euro) .................................... 142Table 10-28: Differences with regard to airport investments (million Euro) .................................... 142Table 10-29: First reactions received until 10th of December.......................................................... 143Table 10-30: Detailed comments and/ or additional data sent by Member States ......................... 144Table 10-31: Detailed comments and additional data provided by countries and actions
undertaken ................................................................................................................. 145Table 10-32: Project 1 - Germany - railway, Status 2010 ............................................................... 146Table 10-33: Project 1 - Austria - railway, Status 2010................................................................... 147Table 10-34: Project 1 - Italy - railway, Status 2010........................................................................ 147Table 10-35: Project 2 - United Kingdom - railway, Status 2010 .................................................... 148Table 10-36: Project 2 - Belgium - railway, Status 2010 ................................................................. 148Table 10-37: Project 2 - The Netherlands - railway, Status 2010 ................................................... 149Table 10-38: Project 2 - Germany - railway, Status 2010 ............................................................... 149Table 10-39: Project 3 - Spain - railway, Status 2010..................................................................... 150Table 10-40: Project 3 - France - railway, Status 2010................................................................... 150Table 10-41: Project 4 - France - railway, Status 2010................................................................... 151Table 10-42: Project 4 - Germany - railway, Status 2010 ............................................................... 151Table 10-43: Project 5 - The Netherlands - railway, Status 2010 ................................................... 152Table 10-44: Project 6 - France - railway, Status 2010................................................................... 152Table 10-45: Project 6 - Italy - railway, Status 2010........................................................................ 153Table 10-46: Project 7 - Greece - road (1), Status 2010................................................................. 153Table 10-47: Project 7 - Greece - road (2), Status 2010................................................................. 154Table 10-48: Project 8 - Portugal - road (1), Status 2010 ............................................................... 154Table 10-49: Project 8 - Portugal - road (2), Status 2010 ............................................................... 155Table 10-50: Project 8 - Portugal - road (3), Status 2010 ............................................................... 155Table 10-51: Project 8 - Spain - road, Status 2010......................................................................... 156Table 10-52: Project 8 - Portugal - railway (1), Status 2010 ........................................................... 156Table 10-53: Project 8 - Portugal - railway (2), Status 2010 ........................................................... 157Table 10-54: Project 8 - Spain - railway, Status 2010..................................................................... 157Table 10-55: Project 9 - UK- railway, Status 2010 .......................................................................... 157Table 10-56: Project 9 - Ireland - railway, Status 2010 ................................................................... 158

TEN Invest – Final Report page 11
PLANCO Consulting GmbH Essen, 2003
Table 10-57: Project 10 – Malpensa airport - Status 2010.............................................................. 158Table 10-58: Project 11 – Denmark/ Sweden – road, Status 2010................................................. 159Table 10-59: Project 11 – Denmark/ Sweden – rail, Status 2010 ................................................... 159Table 10-60: Project 12 - Sweden - road (1), Status 2010.............................................................. 160Table 10-61: Project 12 - Sweden - road (2), Status 2010.............................................................. 160Table 10-62: Project 12 - Sweden - road (3), Status 2010.............................................................. 161Table 10-63: Project 12 - Sweden - road (4), Status 2010.............................................................. 161Table 10-64: Project 12 - Sweden - road (5), Status 2010.............................................................. 162Table 10-65: Project 12 - Finland - road, Status 2010 .................................................................... 162Table 10-66: Project 12 - Sweden - railway (1), Status 2010.......................................................... 163Table 10-67: Project 12 - Sweden - railway (2), Status 2010.......................................................... 163Table 10-68: Project 12 - Finland - railway, Status 2010 ................................................................ 164Table 10-69: Project 13 - Ireland - road, Status 2010 ..................................................................... 165Table 10-70: Project 13 - United Kingdom - road (1), Status 2010 ................................................. 165Table 10-71: Project 13 - United Kingdom - road (2), Status 2010 ................................................. 166Table 10-72: Project 14 - United Kingdom - railway (1), Status 2010............................................. 167Table 10-73: Project 14 - United Kingdom - railway (2), Status 2010............................................. 168Table 10-74: Project 17 - Germany - railway, Status 2010 ............................................................. 168Table 10-75: Project 17 - Austria - railway, Status 2010................................................................. 169Table 10-76: Bulgaria, total contracted amount 1991-1998 ............................................................ 170Table 10-77: Czech Republic, total contracted amount 1991-1998................................................ 170Table 10-78: Estonia, total contracted amount 1991-1998 ............................................................. 171Table 10-79: Hungary, total contracted amount 1991-1998............................................................ 171Table 10-80: Latvia, total contracted amount 1991-1998................................................................ 172Table 10-81: Lithuania, total contracted amount 1991-1998........................................................... 172Table 10-82: Poland, total contracted amount 1991-1998 .............................................................. 173Table 10-83: Romania, total contracted amount 1991-1998........................................................... 173Table 10-84: Slovenia, total contracted amount 1991-1998 ........................................................... 174Table 10-85: Slovakia, total contracted amount 1991-1998............................................................ 174Table 10-86: Multi Country, total contracted amount 1991-1998 .................................................... 175Table 10-87: EIB loans, road Member States, in million EURO...................................................... 175Table 10-88: Rail Member States, in million EURO ........................................................................ 176Table 10-89: Ports Member States, in million EURO...................................................................... 176Table 10-90: Airports Member States, in million EURO.................................................................. 177Table 10-91: ATM, Member States, in million EURO...................................................................... 177Table 10-92: Combined Transport; Member States , in million EURO ........................................... 177Table 10-93: Road Candidate Countries, in million EURO ............................................................. 177Table 10-94: Rail Candidate Countries, in million EURO................................................................ 178Table 10-95: Ports Candidate Countries, in million EURO ............................................................. 178Table 10-96: Airports, Candidate Countries, in million EURO ........................................................ 178Table 10-97: ATM, Candidate Countries, in million EURO ............................................................. 178Table 10-98: Investment in Member States .................................................................................... 179Table 10-99: Investments in Candidate Countries .......................................................................... 180

TEN Invest – Final Report page 13
PLANCO Consulting GmbH Essen, 2003
1 Introduction
1.1 Project Background, Objective and Approach
In 1990, the Council adopted an initial outline plan for high-speed railway lines, which wasproposed by the Commission. Subsequently, in 1994, in order to provide crucial political in-centives, a list of list of 14 priority projects was adopted by the Essen Council and the Euro-pean Parliament.
In 1996, the European Parliament and the Council adopted Decision No 1692/96/EC onguidelines for the development of the Trans-European transport network (TEN-T) by 2010,this decision is referred to as the 1996 guidelines. Article 21 of the Decision contains a revi-sion clause, under which the Commission is required to submit a report after five years indi-cating whether the guidelines should be adapted to take account of "economic developmentand technological developments in the field of transport, in particular in rail transport". TheGuidelines encompass the 14 priority projects, as well as the outline plans for roads, rail,inland waterways and airports.
Since then, on 22nd May 2001, the Parliament and the Council on 22 amended the outlineplans to incorporate seaports, inland ports and terminals (Decision No 1346/2001/EC).
Regarding the transport infrastructure networks in the Central and Eastern European Coun-tries a Transport Infrastructure Needs Assessment (TINA) has been conducted after the EChas proposed a structure for European transport networks serving the whole continent at theHelsinki conference in 1997.
The TEN Invest project was launched in order to provide a comprehensive overview of pastand planned future investments made in the Trans-European Transport Network (TEN-T) inthe enlarged European Union1. Hence, the scope of work covered the 15 Member Statestogether with the Candidate Countries, Bulgaria, Cyprus, Czech Republic, Estonia, Hungary,Latvia, Lithuania, Malta, Poland, Romania, Slovakia and Slovenia.
The large number of countries covered called for a substantial data collection exercise, whichproved to be a complex task. The optimum methodology for this exercise was the applicationof an approach (refer also to Annex 1-1), as proposed in Planco’s Technical Offer, compris-ing the following components:
1 The network dealt with in the course of the project is always referred to as the "TEN-T network in the enlarged
European Union". This network is made up of the TEN-T network in the Member States as set out in the 1996Guidelines and a network in the Candidate Countries, which is based on the so-called TINA network.

page 14 TEN Invest – Final Report
PLANCO Consulting GmbH Essen, 2003
• A network of direct and pro-active contacts was established with the relevant administra-tions in the Member States and the Candidate Countries with the help of sub-contractorsof Planco Consulting. Face-to-face interviews were considered a prerequisite for the datacollection. Furthermore, substantial information was also gathered by desk research cov-ering, inter alia, national investment plans, infrastructure studies, etc.
• A data collection tool called “PLANTis” was developed on the basis of the digital networksprovided by the EC to facilitate the data collection procedure and to input the collecteddata directly into a specific data management system in a consistent manner.
• “PLANTis” was developed as a stand-alone system not only to collect but also to presentthe content of the database, which could be used as input material for presentations,documentation etc. Furthermore, all information was prepared in such a way that it couldbe presented on the TEN-T WEB site.
• The organisation and management of the database in MS-Access was a further step toachieve the final objective to permit the analysis of the data in electronic form and even-tually to introduce it into a geographical information system of the Commission.
Based on the data collected in the EU Member States and Candidate Countries, the resultsprovide in-depth information on the technical status of the transport infrastructure where itforms part of the Trans-European Transport network. Both the existing and targeted TEN arecovered, as defined in the 1996 Guidelines. The results identify the technical status of allsections of the land transport links and other components of the network.
The infrastructure network not only includes roads, railways and inland waterways but alsomajor ports and airports. Since inland terminals are part of the TEN-T but not specificallydefined 1996 guidelines and displayed on a map, they were excluded from the data collec-tion exercise. However, inland terminals were covered by the TINA exercise and some rele-vant figures were collected in respect of Candidate Countries. These were included in thedatabase. The same also applied to traffic management systems.
Based on this inventory all investments in the TEN-T between 1996 and 2001 and all invest-ments anticipated by experts from national ministries up until 2010 were identified. Further-more, where available, details of planned network developments between 2010 and 2015were also collected.
Besides data on investments, sources of financing for road, rail, inland waterways, ports andairports were recorded for the years 1996 and 2001 and changes indicated for the years2010 and 2015, depending on the availability of information. Analyses of decision-makingprocesses and comments on the reliability of, e.g. past or present forecasts of traffic de-mand, were also presented. This knowledge will assist the Commission to prepare the pro-posal for revision of the Guidelines in 2004, including the estimation of the total infrastructurecosts and thus the necessary funds to be made available for this sector.

TEN Invest – Final Report page 15
PLANCO Consulting GmbH Essen, 2003
1.2 Network Determination
Due to the limited budget, the information collection had to be concentrated on the Trans-European Transport network, although originally a somewhat wider coverage was envisaged.As far as possible the data were presented at the NUTS III level provided by Eurotat. Coun-ties and municipalities, which in most of the areas form the NUTS III regions, were not con-tacted.
The results achieved depended on the data made available by the experts from nationalministries in the countries (refer to Annex 2-3) concerned as well as on the information con-cerning networks and other components of the network made available to the Consultant bythe Commission. The networks used in the data collection were based on this information.
The link determination was based on definitions and targets set out in the 1996 Guidelines.The start and finish nodes of projects reported in the implementation report of 1998 were notuseful to determine links, as these projects sometimes concentrated on small link portionsand changed every year. Taking into account the purpose of this project, it was consideredmore sustainable to determine links by the decision as to whether a link had been defined asa certain type of the network and whether the type was already in existence or whether it wasstill at the planning stage. For each link, start and end nodes had to be named.
For technical reasons, in Spain, Greece, Netherlands and Ireland, information concerningexisting or planned link types for the road network was not available. In these cases the linkswere determined using the transport information system developed in the framework of theCODETEN project.
The networks presented in the data collection tool therefore indicate the link type, whetherthe link existed in the year 2001, whether it complied with the TEN-T target, as set out in the1996 Guidelines, or whether it was still waiting upgrading.
1.3 Expected Findings
The results achieved by the project depended not only on the collaboration of the responsibleexperts working in national ministries in the Member States and the Candidate Countries, butalso on political decisions concerning future network developments. In some countries suchdecisions have not yet been taken or cannot be published due to constitutional constraints.Therefore very often network developments were reported only for the next two or threeyears.
In other cases network extensions have been studied and costs estimated but the year ofimplementation has not yet been fixed. Further, in almost all cases where the costs of differ-ent projects were provided they did not distinguish between study, planning and implementa-tion components. Investments were given only as global figures.

page 16 TEN Invest – Final Report
PLANCO Consulting GmbH Essen, 2003
Most of the ports, airports and terminals in the network are privately operated. In these casescentralised government institutions are generally not informed concerning their investmentplans. Therefore these organisations were contacted individually. To limit the extent of thedata collection only international airports and ports categorised as class A were approached.Terminals were included only in the TINA network. As long as the Candidate Countries pro-vided information on such terminals these data were included in the database.
However, in spite of all constraints and problems the project achieved the following:
• The data collection and presentation tool “PLANTis” was developed as a stand-alonesystem.
• A database was developed, based on MS Access and handed over to the Commissionfor connection to a geographical information system.
• As far as available, technical information on all networks was provided on a link-by-linkbasis for the years 1996, 2001, 2010 and 2015 for the Member States and the CandidateCountries.
• Investments for all modes of transport together with the time period during it is anticipatedthat they will be executed were collected for all countries
• Investment costs distinguished between mode specific measures and were used to de-termine the investments required to develop a link from an existing link type to a plannedlink type or to extend the network by additional links. However, unit costs could not bechecked using information stemming from the ECMT survey, as this was not available atthe time of the study though may be in the future.
• The sources of funding were determined from the data gathered at the data collectionstage and were also based on information received from financing institutions.
• An overview is given concerning the procedure and the basis on which investment deci-sions are taken (e.g. priority finding, forecasts etc.)
• The total costs to implement the Trans-European network as targeted in the guidelines1996 are estimated for different modes with regard to Member States and CandidateCountries.
• Technical parameters and cost estimates are presented for the specific projects men-tioned in Annex III of the guidelines.

TEN Invest – Final Report page 17
PLANCO Consulting GmbH Essen, 2003
2 The Data Collection Approach
2.1 Network Determination
The most important prerequisite for the data collection activity was the definition of the net-work and its components. Both those who collect and those who provide data had to be ableto assign it to a clearly specified component of the network, regardless whether the informa-tion was technical or financial. The components of the Trans-European Transport network(TEN-T) are links for road, railway or inland waterway transport and nodes for ports and air-ports, where short sea shipping, international shipping, air transport or intermodal transportare involved.
The Commission handed over details of two networks to Planco. The first network2 coveredTEN-T for both the 15 EU Member States and the Candidate Countries and consisted of alarge number of short links. For this network, short segments with different codes, the lengthand segment status (i.e. existing or planned) were indicated. No names were given for startand end nodes. A second network3 covered only the Member states with the exception ofSpain, the Netherlands, Ireland and Greece. The network consisted of different links forwhich the length, the name of the start and end node, the link type (i.e. motorway), the na-tional as well as the European road number was indicated.
Neither network was suitable to serve as basis for the data collection as the links were nei-ther defined by start and end note nor were comprehensive. The information concerningports and airports, however, could directly be used for the data collection procedure.
Based on the available information, a mode specific network was developed using the seg-ment-orientated network as geographical information. As data could not be collected for eachof these small segments, links were determined. According to the objective of the project, theinformation concerning link type (motorway, high quality road, ordinary road, conventionalline, upgraded high speed line, high speed line etc.) and link status (existing or planned, asdefined in the 1996 guidelines) was used. Each link was defined by a start node and an endnode.
As far as possible, the link with start node and end node was taken from the second networkprovided by the Commission. Where this network provided no information on routes de-scribed by a chain of segments in the geographical information, these links were determinedusing the Transport Information System (TIS) developed in the framework of the CODETENproject. In these cases the link type, start and end nodes were taken from the TIS. In caseswhere the TIS did not provide any information, the link type and the start and end nodeswere input manually. Whenever in the network used as geographical information, the status
2 name of the file provided e.g. for road rdeu1mv4.*3 name of the file provided e.g. for road rdlktr.*

page 18 TEN Invest – Final Report
PLANCO Consulting GmbH Essen, 2003
changed from one segment to another the location served as the end of one link componentand the start of another. However, the overall link remained the same. It was divided intodifferent components only to reflect changes in status in different link parts.
All link components had the same start and end node as the link. The length of a link or a linkpart was calculated by aggregating the length of the segments belonging to it.
To facilitate the data collection procedure for both sides, i.e. information providers and col-lectors, the networks were presented as follows:
• The road network distinguished between the link type (motorway, high quality road andordinary road) and the targeted status according the 1996 Guidelines for every link and/orlink part. Those links (link parts) that were already in existence in the year 2001 wereshown in thick lines and where the expected status was not achieved in thin lines de-pending on the link type.
• The railway network considered conventional lines, upgraded high-speed lines and high-speed lines as link types and the targeted status according to the 1996 Guidelines.Again, the links (link parts) that were already in existence in 2001 were shown in thicklines and where the expected status is not achieved in thin lines, depending on the linktype.
• The inland waterway network distinguished link types in the various ECMT classes. Theguidelines anticipated that all links of the Trans-European Transport network would be-long to ECMT classes higher than ECTM class IV.
Although the networks were prepared for the whole set of Member States and CandidateCountries forming the area to be covered in the framework of the study, they could be andare presented for each country individually. Examples are presented on the following pages.
2.2 The interactive Data Collection Tool – “PLANTis”
The information to be assembled in the course of the study was extensive. Therefore a com-prehensive and user-friendly tool was specifically developed to facilitate the data collection.This tool, named PLANTis, offered the possibility to insert data covering the different trans-port modes on a link-by-link/node-by-node basis. The basis of the tool was an interactivemap, which displayed the existing TEN-T networks and nodes as previously described. Thedata to be collected with the help of the tool was visualised by different dialogues coveringtechnical and investment/financial information. The detailed instructions on the use of the“PLANTis” tool and which data were to be collected are described in the manual attached tothis report. The following paragraphs however provide a summary of the function of the tooland the associated information requirements.

TEN Invest – Final Report page 19
PLANCO Consulting GmbH Essen, 2003
Map 2-1: Display of interactive maps of selected countries (“PLANTis”)
As soon a specific link was marked, the interactive data collection tool showed a mode spe-cific toolbox to be filled in. The tool showed for the link, the link ID, the link part number, the
Germany France
Hungary
Austria
Spain Poland

page 20 TEN Invest – Final Report
PLANCO Consulting GmbH Essen, 2003
number of link parts belonging to the link, the start node number, the end node number, thestart node name, the end node name, the link type and the status (existing or planned) de-termined by the 1996 Guidelines. Furthermore, the proposal for a revision of the TEN-TGuidelines issued by the EC in 2001 has been taken into account. The link type and the pro-posed status within he revised network is shown. These features were predetermined andwere not a component of the data collection. (It should be noted that the data on the pro-posed revised TEN-T network (TEN-T network 2001), made available by the Commission, isstill in the process of discussion. It has been approved by the European Parliament. Anagreement within the European Council has not been reached yet.)
2.2.1 Interactive Input of the Technical Status
The status of the specific link was input for 1996, 2001, 2010 and 20154 by means of a dropdown box, distinguishing between existing and planned investments. Where available theinformation for 1996 and 2001 was already input. Furthermore the length of each link (linkpart) was also already provided. In the event that a link did not exist in 1996 or 2001 no in-formation for these years was presented (or needed to be input.) By the years 2010 and/or2015 links may exist or may still be planned. In both cases, the technical information relatingto the existing or planned link was input. All features mentioned so far apply to all modes.
From then on, however, the requested technical data were specific to each mode and each isdiscussed below.
Road network links were categorised as follows:
• ordinary roads or all-purpose roads are open to all kinds of traffic; such roads may ormay not have a median,
• high-quality roads, motor traffic roads or express roads are limited to cars buses andtrucks; these types of road are connected to other roads via interchanges or at levelintersections. They may or may not have a median,
• motorways are internationally defined, i.e. as roads with a permanent physical division(median) between the two directions. All entrances and exits take place at inter-changes.
For all roads the following information was requested:
• the number of lanes per direction,
• the speed limit (if any),
4 The information refers always to the end of the reference years.

TEN Invest – Final Report page 21
PLANCO Consulting GmbH Essen, 2003
• the responsibility for construction and maintenance was requested.
For the railway network the link types were defined as high-speed lines, upgraded high-speed lines or conventional lines. For each link, as far as it was available, the following in-formation was input:
• the type of traffic, i.e. passenger, freight or mixed,
• whether or not the line was designated for intermodal transport,
• the type of traction and if electric, the voltage,
• the number of tracks and the track gauge,
• the minimum loading gauge and the maximum axle load,
• the maximum speed and length of train,
• the type of command control system employed.
For the inland waterway network the following were input for each link:
• the type of waterway, as between a regulated river, a channel or a perennial river,
• the number of single and double locks and the maximum draught,
• the maximum height for containers and the ECMT class.
For ports the data collected sought to verify the following:
• the type of port, i.e. maritime, inland or a combination of the two,
• the maximum draught of the approach channel,
• the existence or otherwise of transhipment facilities for short sea shipping and inter-modal transport,
• the type of throughput, as between passenger and freight together with latest operat-ing statistics,
• whether the port is connected to the Trans-European network and if so, by what kindof mode.
The data for airports covered the following:
• the type of airport: international/ international system, community connecting point orregional,
• the latest operational statistics covering freight and passengers,
• the total capacity, the number and length of the runways and the operating hours,
page 22 TEN Invest – Final Report
PLANCO Consulting GmbH Essen, 2003
• whether the airport is connected to the Trans-European network and if so, by whatkind of mode,
Terminals are covered only in the TINA network. As far as available, information was re-quested on the following:
• the type of terminal i.e. road, rail waterway or multi-modal,
• the type of goods handled the latest throughput details and the capacity,
• details of any Trans-European network connections.
2.2.2 Interactive Input of Investments
In addition to the information on the technical status for each link and node, data on invest-ments, project status, new measures etc. were also requested. This included details of newprojects and developments on every link. A project could be part of one link, cover a wholelink or could span several links. Therefore the starting and end points, together with thecommencement and completion dates of all projects were required. Furthermore a projectidentifier was also assigned. This could be related to projects mentioned in the TEN-T im-plementation report, but had to start with the country code followed by three digits. (e.g.: for aroad link in Spain, for which the referencing number to the map is "1" enter "ES001". If thereference number is e.g. "13.2" enter ES013_2.).
Next, the current status of all projects was specified, distinguishing whether they were in:
• the planning stage, involving the conduct of, e.g. feasibility studies and cost benefitanalyses,
• the design study phase: typically, when the preparatory work has been completed, con-crete design studies are launched, covering aspects such as layout, technical specifica-tions, etc.,
• construction: this is the project implementation phase,
• completed: the project is finished and ready for operation.
Investments or costs related to projects were entered in January 1999 prices excluding VAT.Where possible, costs for planning, studies and construction were separated and the sourcesof financing indicated for each (national funds, TEN-T, ERDF, EIB and others).
As projects consisted of different measures, the type of measures was to be indicated in-cluding the cost and the period of implementation. These measures differed from mode tomode and therefore for each a specific list was provided.

TEN Invest – Final Report page 23
PLANCO Consulting GmbH Essen, 2003
2.3 Data Collection Procedure
2.3.1 Regional Coverage
The large number of countries covered required not only a well-designed data collection toolbut also a well-organised and systematic collection approach. Therefore Planco establisheda system of direct and pro-active contacts with the relevant administrations in the MemberStates and the Candidate Countries. The local contact set-up included partners in almost allcountries. Furthermore, the in-house availability of information and data, together with theclose co-operation with the various ministries involved and experts in their countries werealso a great help. Based on these contacts, substantial information covering national invest-ment plans, infrastructure studies, etc. was gathered via desk research. The following mapindicates which member of the consortium covered which country.
Map 2-2: The local Contact System established by Planco Consulting GmbHand Partners

page 24 TEN Invest – Final Report
PLANCO Consulting GmbH Essen, 2003
2.3.2 Data Collection Activities
Face-to-face interviews were considered to be a prerequisite for a successful data collectionexercise. In order to optimise their effectiveness, a stepwise approach was adopted and pre-sented to the representatives of the Member States. The initial step was to send a generalquestionnaire to these representatives and the Candidate Countries (see Annex 2-2). Thepurpose of this first questionnaire was to obtain and/or verify the names and positions of theexperts at the respective ministries responsible for the different modes in the countries in-volved.
Furthermore these questionnaires also requested information concerning transportationstudies, forecasts, decision-making procedures and studies to derive unit costs for transportplanning, construction and maintenance. Several national authorities made available trans-port plans, budgetary information and other relevant material, which were screened and in-serted into the database. Several ports and airports had to be contacted directly. The table inAnnex 2-3 lists the contact persons who were consulted during this phase of the work.
Based on the results of this general questionnaire, the relevant experts at the ministries wereapproached via the country representatives to carry out a first round of face-to-face inter-views using the data collection tool. The data thus collected were directly input into the datamanagement system for analysis following completion of the first round.
A thorough check of all figures provided so far pinpointed inconsistencies and lacking infor-mation. A second round of face-to-face interviews was then undertaken in order to correctinconsistencies and to fill in the gaps.
This whole procedure commenced with a workshop in which the responsible researchers ofall members of the consortium participated. At this workshop the procedure and structure ofthe data collection was discussed and an appropriate set of instructions prepared. At thisstage, it also became clear that a recommendation letter from the Commission was neces-sary in order to explain the official nature of the enquiry and to maximise the co-operationobtained. A draft of a suitable letter was immediately submitted by Planco to the Commissionfor approval.
The intended data collection procedure was somewhat hampered by parallel activities re-lated to the TEN-T implementation report initiated by the Commission. Thus, additional ef-forts were necessary to combine both procedures and to collect information.
2.3.3 Availability of Data
The availability of data differed significantly between countries and the situation in the Candi-date Countries was often especially difficult. It should be noted that the information on portsand airports mostly had to be collected by direct requests to the organisations themselves.

TEN Invest – Final Report page 25
PLANCO Consulting GmbH Essen, 2003
Since in most countries many of these are privately operated a central authority that couldprovide global information did not exist. In some cases there was a reluctance to co-operatedue to the commercial sensitivity of the figures requested and because of the large and in-creasing number of requests for statistics from external bodies. The same also applied tosome railway organisations.
With regard to projected investments, the availability of data was sometimes not very satis-factory, since future plans either simply did not exist or they were not in the public domain.The situation in the near future, say until around 2005, was generally better than the longerterm, particularly beyond 2010.
Most of the data were collected by means of a combination of personal interviews and deskresearch. The following figure shows where information was available and has been inte-grated to the largest extent possible in the database.
Figure 2-1: Availability of data per mode and country 5
technical status
invest-ments
technical status
invest-ments
technical status
invest-ments
technical status
invest-ments
technical status
invest-ments
Austria yes yes yes yes yes yes yes yes yes yesBelgium yes yes yes yes yes yes yes yes yes yesBulgaria yes no yes yes yes no yes yes yes yesCyprus yes yes # # # # yes yes yes yesCzech Republic yes yes yes yes yes yes yes yes yes yesDenmark yes yes yes yes # # yes yes yes yesEstonia yes yes yes yes # # yes yes yes yesFinland yes yes yes yes yes yes yes yes yes yesFrance yes yes yes yes yes yes yes yes yes yesGermany yes yes yes yes yes yes yes yes yes yesGreece yes yes yes yes # # yes yes yes yesHungary yes yes yes yes yes yes yes yes yes yesIreland yes yes yes yes # # yes yes yes yesItaly yes yes yes yes # # yes yes yes yesLatvia yes yes yes no # # yes yes yes yesLithuania yes yes yes yes # # yes yes yes yesLuxembourg yes yes yes yes yes no yes yes # #Malta yes yes # # # # yes yes yes yesNetherlands yes yes yes yes yes yes yes yes yes yesPoland yes yes yes yes yes no yes no yes yesPortugal yes yes yes yes # # yes yes yes yesRomania yes no yes yes yes no yes yes yes yesSlovakia yes yes yes yes yes yes yes yes yes noSlovenia yes yes yes yes # # yes yes yes noSpain yes yes yes yes # # yes yes yes yesSweden yes yes yes yes # # yes yes yes yesUK yes yes yes yes # # yes yes yes yes
# not applicable
airports ports
Country
road rail IWW
5 Status as of 28th of February 2003
page 26 TEN Invest – Final Report
PLANCO Consulting GmbH Essen, 2003
2.4 The data base
The collected information is stored in an MS-Access data base. The most important advan-tage of the PLANTIS tool is the interactivity with the data base. Data input into the PLANTISare directly inserted into the data base and can directly be extracted from the data base permode, link part, number of links, region country.
The data base is organised according to technical information and investment information.The technical information distinguishes between the modes roads, railways, inland water-ways, ports, airports and inland terminals. For each mode a specific table has been estab-lished where each link part is described by one data set (row). The link can be identified byone identifier for ports, airports and terminals and by a combination of characteristics for in-land waterways, railways and roads. The construction of these identifiers and the content ofthe technical tables are described in the Plantis manual.
The investment cost data as well as the source of financing is organised in a separate tablewhich provides information concerning projects related to a specific link and measures theproject consists of. The measures have been determined mode specific and amount up to 15different measures per link. The aggregation of the measures result in the costs of the proj-ect. For each measure the purpose of investment, the period during which the measure iscarried out, the source of finance and the actual status and particular remarks are stored inthis table. The information which measure (project) belongs to which link is provided by thelink identifiers mentioned before, which are added to each measure. The content of the in-vestment data base is also described in the manual mentioned before.
The organisation of the data base has been developed in the framework of this project tofacilitate the data editing an to enable any user to easily extract any information needed.However, during the design of the data base the organisation of the network provided by theCommission has been taken into account in order to ensure the establishment of the database in the Commission’s system.
2.5 PLANTIS as presentation tool
The purpose of the development of the PLANTIS tool is not been to collect and edit data inthe framework of TEN Invest. The tool has to be enabled to visualise the data for any pres-entation. The tool is based on an interactive map which displays the TEN-T network with itsnetworks and nodes. The networks and nodes are arranged in layers which means thatevery single mode of transport is presented in one separate layer. This enables the user todisplay the different nodes and networks separately or to chose which layers shall be dis-played jointly on the map. Apart from the transport modes layers containing cities, Nuts3 re-gions and countries are provided.

TEN Invest – Final Report page 27
PLANCO Consulting GmbH Essen, 2003
Figure 2-2: Possibilities to display information
page 28 TEN Invest – Final Report
PLANCO Consulting GmbH Essen, 2003
Examples for the application of PLANTIS as a visualisation tool are shown in Figure 2-2. Fora marked link on the interactive map specific technical details as well as information onmeasures and investments of the link will be extracted from the data base and inserted in anexcel file. Using this template file tables and figures can be defined by the user himself.Hence, the template can be modified according to the user's needs.
The example shows the railway link Paris – Reims. It is possible to display the entire datacollected for every link or node in the course of TEN Invest. The information is extracted fromthe data base and displayed in an excel file. The kind of presentation can be determined bythe user himself. This provides the utmost achievable flexibility for user who are familiar withexcel.
For a selection of links, which have to be marked, the technical status and the investmentscan also be displayed as presented in the second example. For regions – countries or Nuts3areas – the investments can be shown per mode as presented as example.

TEN Invest – Final Report page 29
PLANCO Consulting GmbH Essen, 2003
3 Changes in the technical status of the Trans-EuropeanTransport Network
The mode-specific networks are described by technical features, which are relevant for therespective network. The links (link parts) of the road network are characterised, e.g. by thetype of road, the number of lanes in each direction, the recommended speed limits and theadministrative responsibility. Among other features, each link of the railway network is de-scribed by the type of traffic, the kind of traction, the number of tracks, the track gauge, theaxle load, the maximum length of trains and the speed limit. The links forming the inlandwaterway network are characterised e.g. by the maximum draught, the number of locks, theECMT class etc. The ports and airports, which were included in the data collection proce-dure, were requested to indicate, inter alia, capacity and inter-modality.
For all modes the link length in kilometres was calculated by aggregating information con-tained in the network, data for which were provided by the Commission. In instances wherethis information was not available, distances were estimated. Technical information was col-lected for the years 1996, 2001, 2010 and 2015. However, it should be mentioned that theministries contacted were in some cases not able to provide data beyond 2004. In many in-stances the long-term outlook is based on on-going or executed studies covering measuresthat have not yet been finally decided.
3.1 The development of the TEN-T road network
3.1.1 Road link type
Considering the type of roads, the situation in the Member States in 1996 was very differentfrom that in the Candidate Countries. In the former, approximately 55% of the Trans- Euro-pean Transport network consisted of motorways. If high quality roads were included theshare increased to over 60%. In the Candidate Countries the ordinary roads formed 60% ofthe network.
However in both parts of the study area, the relationship between ordinary roads and motor-ways is expected to change significantly in the period to 2010. In the Member States theshare of links of the TEN-T road network considered as ordinary roads will decrease to lessthan 30% and in the Candidate Countries to approximately 40 %. Whereas the role of highquality roads will not gain in importance in the Member States, in the Candidate Countriesthis type of road will become more important. The development of the road types in the TEN-T road network is presented in the following figure as well as in Annex 3-1.

page 30 TEN Invest – Final Report
PLANCO Consulting GmbH Essen, 2003
Figure 3-1: Quality development in the TEN-T road networkDevelopment ot TEN-T network in Member States
according to road types
0%
20%
40%
60%
80%
100%
1996 2001 2010 2015
perc
enta
ge o
f len
gth
rela
ted
to to
tal
leng
th
road notcategorisedmotorway
high quality road
ordinary road
Development ot TEN-T network in Candidat Countries according to road types
0%
20%
40%
60%
80%
100%
1996 2001 2010 2015
perc
enta
ge o
f len
gth
rela
ted
to to
tal
leng
th
road notcategorisedmotorway
high quality road
ordinary road
3.1.2 Network
Apart from changes in the shares of different road types, the development of the road net-work can be characterised by new links and the expansion of the number of lanes for differ-ent road types. With the assistance of the PLANTis tool these developments have beenanalysed for the years 1996, 2001, 2010 and 2015 for each country. The general changescan be illustrated by presenting the Trans-European Transport road network for the wholestudy area for the different years.

TEN Invest – Final Report page 31
PLANCO Consulting GmbH Essen, 2003
Map 3-1: TEN-T road network 1996 according to link types
Within Member States, between 1996 and 2001 significant network extension was realised inUnited Kingdom, Southern France, Spain, Portugal Sweden and Finland. Further, substantialextensions, mainly by the increase of high quality roads, can be seen in the southern Candi-date Countries. Developments in Central Europe are not so visible.
page 32 TEN Invest – Final Report
PLANCO Consulting GmbH Essen, 2003
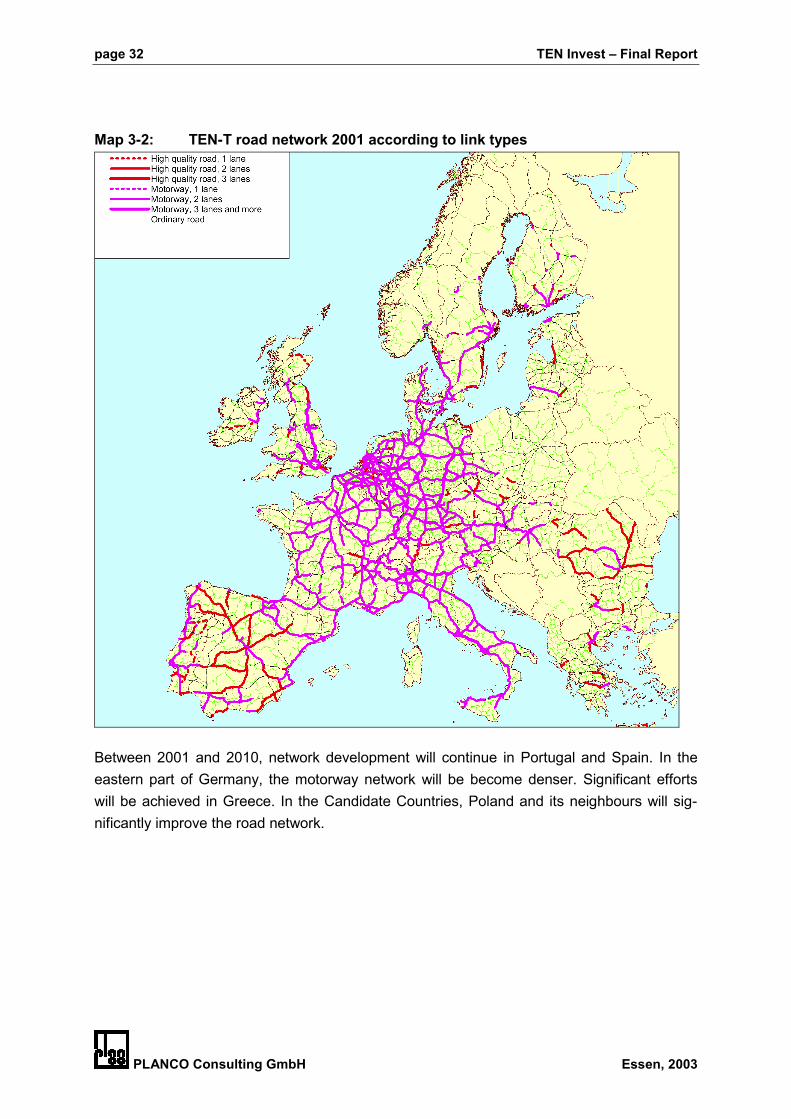
Map 3-2: TEN-T road network 2001 according to link types
Between 2001 and 2010, network development will continue in Portugal and Spain. In theeastern part of Germany, the motorway network will be become denser. Significant effortswill be achieved in Greece. In the Candidate Countries, Poland and its neighbours will sig-nificantly improve the road network.

TEN Invest – Final Report page 33
PLANCO Consulting GmbH Essen, 2003
Map 3-3: TEN-T road network anticipated for 2010 according to link types
Developments after 2010 are more difficult to forecast. However, the results of the data col-lection show that in Hungary, the Czech Republic and Slovakia the network is expected to beextended by high quality roads. In the Member States, a smaller completion of the network isforeseen. However, decisions concerning network extensions between 2010 and 2015 havenot yet been taken and therefore have largely not been recorded.

page 34 TEN Invest – Final Report
PLANCO Consulting GmbH Essen, 2003
Map 3-4: TEN-T road network anticipated for 2015 according to link types
3.2 The development of the TEN-T railway network
3.2.1 Railway link type
At first glance, considering the type of railways the situation in the Member States in 1996was not that much different from that in the Candidate Countries. In the former, the Trans-European Transport network comprised approximately 90% of conventional lines. Only 10%of the length of the railway links was up-graded high-speed lines or high-speed lines. In theCandidate Countries, almost 100% was conventional lines. However, it can be assumed thatthere were differences between the operational characteristics of the conventional lines inthe Candidate Countries. The development of the railway types in the TEN-T railway networkis presented in the following figure and in Annex 3-1.
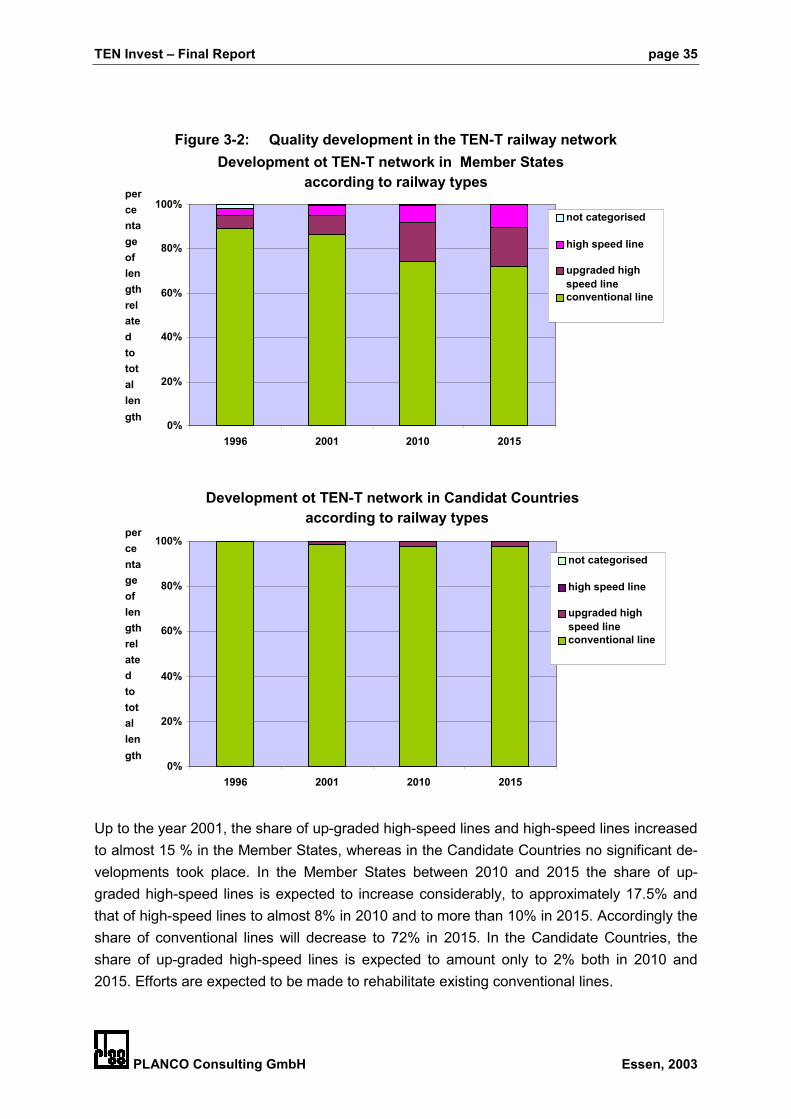
TEN Invest – Final Report page 35
PLANCO Consulting GmbH Essen, 2003
Figure 3-2: Quality development in the TEN-T railway networkDevelopment ot TEN-T network in Member States
according to railway types
0%
20%
40%
60%
80%
100%
1996 2001 2010 2015
percentageoflengthrelatedtototallength
not categorised
high speed line
upgraded highspeed lineconventional line
Development ot TEN-T network in Candidat Countriesaccording to railway types
0%
20%
40%
60%
80%
100%
1996 2001 2010 2015
percentageoflengthrelatedtototallength
not categorised
high speed line
upgraded highspeed lineconventional line
Up to the year 2001, the share of up-graded high-speed lines and high-speed lines increasedto almost 15 % in the Member States, whereas in the Candidate Countries no significant de-velopments took place. In the Member States between 2010 and 2015 the share of up-graded high-speed lines is expected to increase considerably, to approximately 17.5% andthat of high-speed lines to almost 8% in 2010 and to more than 10% in 2015. Accordingly theshare of conventional lines will decrease to 72% in 2015. In the Candidate Countries, theshare of up-graded high-speed lines is expected to amount only to 2% both in 2010 and2015. Efforts are expected to be made to rehabilitate existing conventional lines.
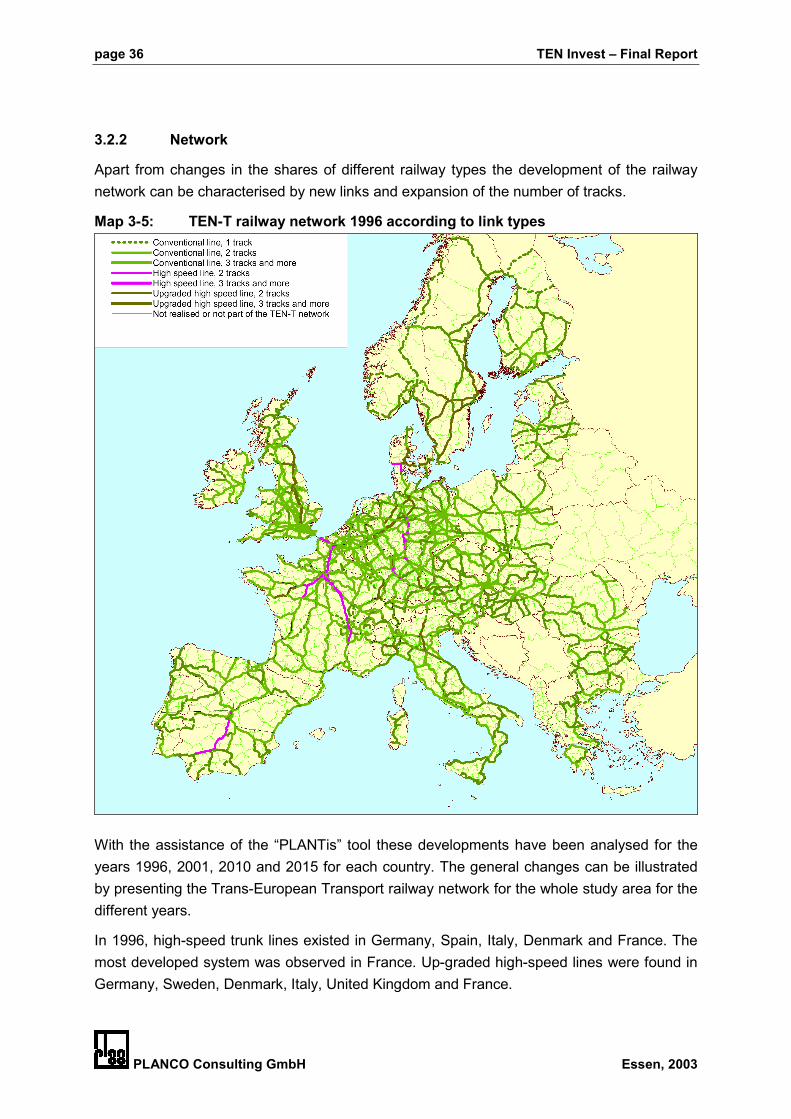
page 36 TEN Invest – Final Report
PLANCO Consulting GmbH Essen, 2003
3.2.2 Network
Apart from changes in the shares of different railway types the development of the railwaynetwork can be characterised by new links and expansion of the number of tracks.
Map 3-5: TEN-T railway network 1996 according to link types
With the assistance of the “PLANTis” tool these developments have been analysed for theyears 1996, 2001, 2010 and 2015 for each country. The general changes can be illustratedby presenting the Trans-European Transport railway network for the whole study area for thedifferent years.
In 1996, high-speed trunk lines existed in Germany, Spain, Italy, Denmark and France. Themost developed system was observed in France. Up-graded high-speed lines were found inGermany, Sweden, Denmark, Italy, United Kingdom and France.

TEN Invest – Final Report page 37
PLANCO Consulting GmbH Essen, 2003
Map 3-6: TEN-T railway network in 2001 according to link types
Up to 2001, in the northern and eastern regions of Germany, the network was improved vianew up-graded high-speed lines and by a new high-speed line between Hanover and Berlin.In France, the high-speed network was extended north to the channel tunnel, which wascompleted within this period, and to the south as far as Marseilles. Also, in Austria and Italyconventional lines were converted to up-graded high-speed lines.

page 38 TEN Invest – Final Report
PLANCO Consulting GmbH Essen, 2003
Map 3-7: TEN-T railway network anticipated for 2010 according to link types
During the period from 2001 to 2010 up-grading is expected to be realised in the UnitedKingdom (West Coast Main Line and London-Cardiff), in Greece, Germany and in Finland. InIreland the Cork-Dublin-Belfast line will become operational as an up-graded high-speed line.The extension of a European high-speed network will continue, e.g. in Germany the link fromCologne to Frankfurt will become operational as a high-speed line and in Central Europe theconnection between Paris via Brussels to Cologne and Amsterdam will be partially opera-tional. In France, the Atlantic line will be extended and the boarder crossing to Spain im-proved. In Spain and Portugal up-grading and construction of new high-speed lines will con-tinue. Between Denmark and Sweden, the fixed Øresund link will be established.

TEN Invest – Final Report page 39
PLANCO Consulting GmbH Essen, 2003
Map 3-8: TEN-T railway network anticipated for 2015 according to link types
Further developments until 2015 can are difficult to foresee. However, the high-speed net-work in Spain and Portugal will almost certainly be further developed, the French high-speednetwork will be extended and connected to Italy and Spain and the high-speed network willbe extended to the East via Germany and Austria.
3.3 The development of the TEN-T inland waterway network
3.3.1 Inland waterway link type
Link types in the inland waterway network distinguish between ECMT classes. The develop-ment of the inland waterway types in the TEN-T network is presented in the following figure.

page 40 TEN Invest – Final Report
PLANCO Consulting GmbH Essen, 2003
Figure 3-3: Quality development in the TEN-T inland waterway networkDevelopment ot TEN-T network in Member Statesaccording to ECMT classes for inland waterways
0%
20%
40%
60%
80%
100%
1996 2001 2010 2015
perc
enta
ge o
f len
gth
rela
ted
to to
tal l
engt
h greater ECMTclass VECMT class V
ECMT class IV
less ECMT classIV
Development ot TEN-T network in Candidat Countries according to ECMT classes for inland waterways
0%
20%
40%
60%
80%
100%
1996 2001 2010 2015
perc
enta
ge o
f len
gth
rela
ted
to to
tal l
engt
h greater ECMTclass VECMT class V
ECMT class IV
less ECMT classIV
The length according to the different classes are presented in Annex 3-1. Although the typeof an inland waterway being a river, a regulated river or a canal and the maximum draughtboth influence the operation of vessels, the qualitative assessment of inland waterways hasbeen based on the ECMT classes as they take into account different forms of vessels andvessel operation.
The bulk of the inland waterway network is concentrated on Central Europe with a length of10,800 km. In the Candidate Countries, the total length amounts to 4,800 km. The Main axisis the Rhine and the Danube. In the Member States, in 1996 the bulk of the links alreadybelonged to ECMT class V and VI.
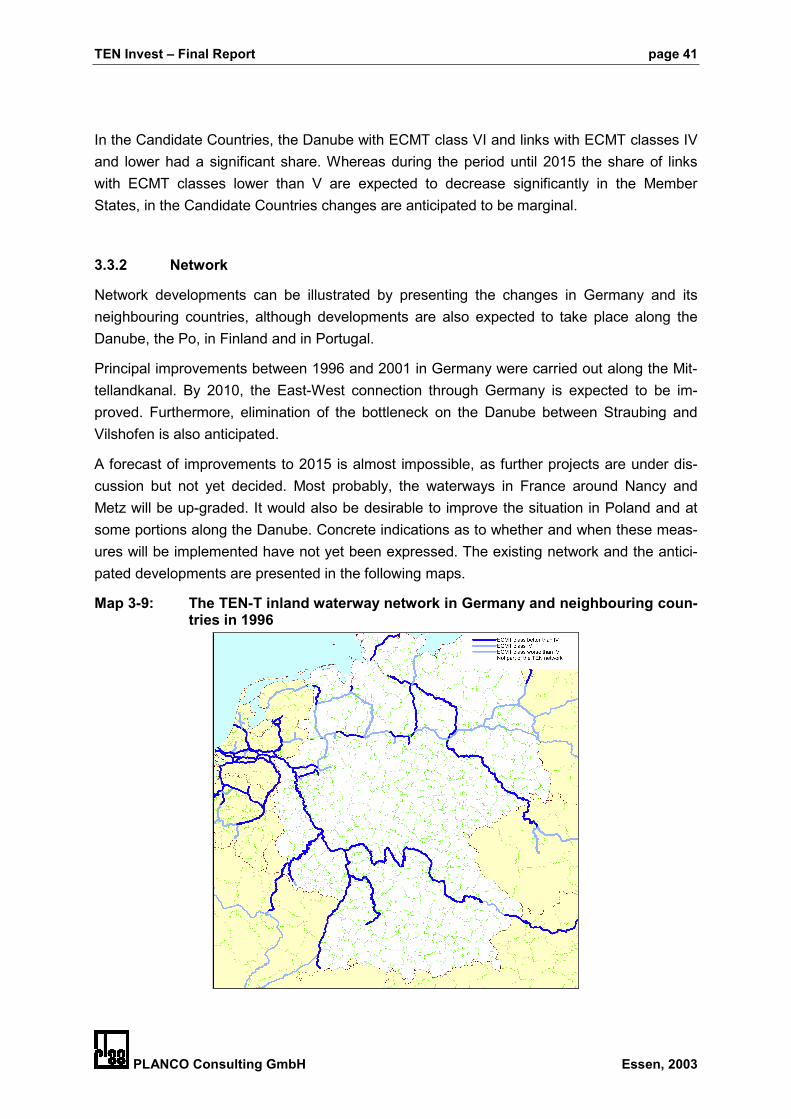
TEN Invest – Final Report page 41
PLANCO Consulting GmbH Essen, 2003
In the Candidate Countries, the Danube with ECMT class VI and links with ECMT classes IVand lower had a significant share. Whereas during the period until 2015 the share of linkswith ECMT classes lower than V are expected to decrease significantly in the MemberStates, in the Candidate Countries changes are anticipated to be marginal.
3.3.2 Network
Network developments can be illustrated by presenting the changes in Germany and itsneighbouring countries, although developments are also expected to take place along theDanube, the Po, in Finland and in Portugal.
Principal improvements between 1996 and 2001 in Germany were carried out along the Mit-tellandkanal. By 2010, the East-West connection through Germany is expected to be im-proved. Furthermore, elimination of the bottleneck on the Danube between Straubing andVilshofen is also anticipated.
A forecast of improvements to 2015 is almost impossible, as further projects are under dis-cussion but not yet decided. Most probably, the waterways in France around Nancy andMetz will be up-graded. It would also be desirable to improve the situation in Poland and atsome portions along the Danube. Concrete indications as to whether and when these meas-ures will be implemented have not yet been expressed. The existing network and the antici-pated developments are presented in the following maps.
Map 3-9: The TEN-T inland waterway network in Germany and neighbouring coun-tries in 1996

page 42 TEN Invest – Final Report
PLANCO Consulting GmbH Essen, 2003
Map 3-10: The TEN-T inland waterway network in Germany and neighbouring coun-tries in 2001
Map 3-11: The TEN-T inland waterway network in Germany and neighbouring coun-tries in 2010

TEN Invest – Final Report page 43
PLANCO Consulting GmbH Essen, 2003
Map 3-12: The TEN-T inland waterway network in Germany and neighbouring coun-tries in 2015
3.4 The development of TEN-T ports
The TEN-T network in the enlarged European Union as defined in the 1996 Guidelines andbased on the TINA study contains 480 ports, 407 in the Member States and 73 in the Candi-date Countries. The table below shows the types of the TEN-T ports in the Member Statesand Candidate Countries.
Table 3-1: Number and type of ports part of the TEN-T
As most of these are privately operated and in most Member States information concerningport developments and development strategies was not available centrally, ports were con-tacted individually. Activities were concentrated on maritime ports.
Technical information was received from 420 ports – 82 inland and 338 maritime ports. Outof the 338 maritime ports, only five considered themselves as pure passenger ports and 68

page 44 TEN Invest – Final Report
PLANCO Consulting GmbH Essen, 2003
as pure freight ports. Pure passenger inland ports were not contacted. 68 of the inland portshandle freight and 11 both freight and passengers.
Information was requested covering turnover (divided into different freight categories) andphysical characteristics, such as the maximum draught and the conditions of the accesschannel. The data received were extracted from the database using the “PLANTis” tool.
In the framework of this study, the capability of intermodal activities and the connection to theTEN-T network was considered as the most interesting. The following figure presents theactual situation as well as the expected development concerning intermodal transhipmentfacilities and the connection to the TEN-T railway network for inland and maritime ports in thestudy area. The figure shows that around 70% of the inland ports contacted and 40% ofmaritime ports provide intermodal transhipment facilities.
The situation is not expected to change significantly in the period to 2010/15. Further, almost80% of the inland ports contacted and 60% of the maritime ports are connected to the TEN-Trailway network. Clearly, the maritime ports intend to improve this situation between now and2010. However, most of the ports contacted did not provide long-term strategies concerningtheir development.
Figure 3-4: Development of the intermodal capability of contacted ports
0.00%
20.00%
40.00%
60.00%
80.00%
100.00%
inland ports w ithinterm odal
transshipm ent
m aritim e portsw ith interm odaltransshipm ent
inland portsconnected to
TEN-T railnetw ork
m aritim e portsconnected to
TEN-T railnetw ork
1996200120102015

TEN Invest – Final Report page 45
PLANCO Consulting GmbH Essen, 2003
Map 3-13: TEN-T ports and their intermodality in 2001
3.5 The development of TEN-T airports
The TEN-T network in the enlarged European Union as defined in the 1996 Guidelines andbased on the TINA study contains 379 airports, whereas 335 are located in the MemberStates and 44 in the Candidate Countries as shown in the table below.
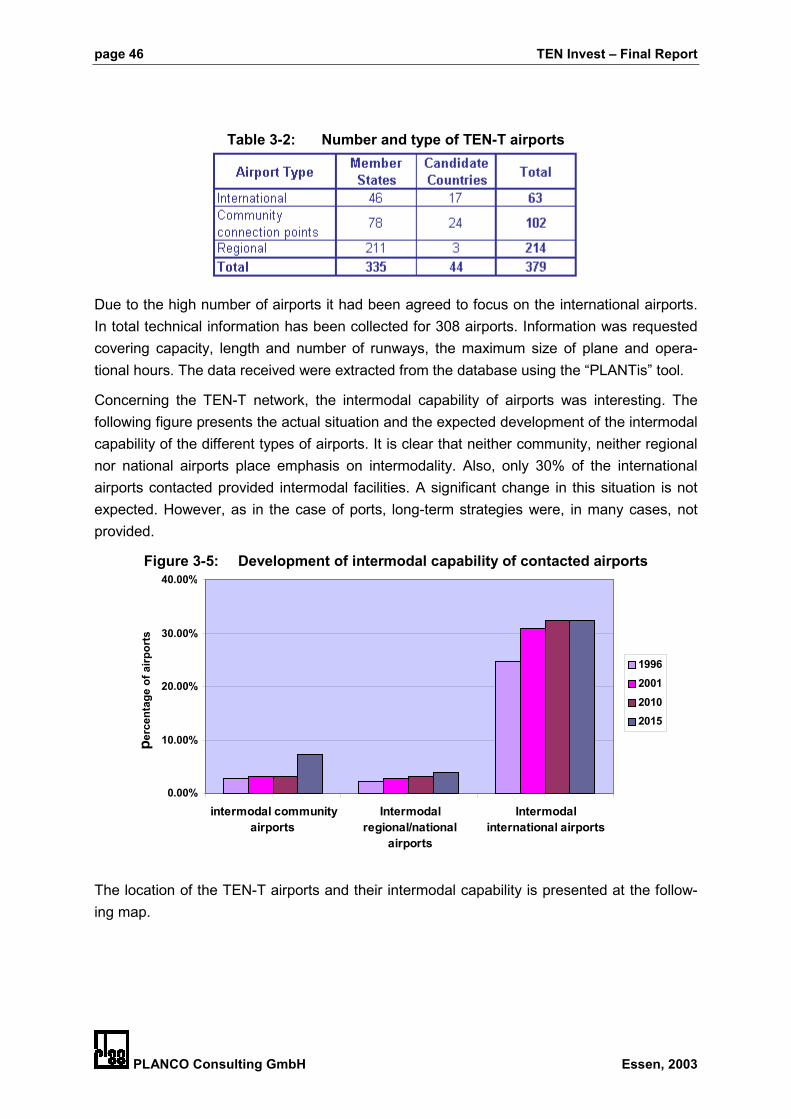
page 46 TEN Invest – Final Report
PLANCO Consulting GmbH Essen, 2003
Table 3-2: Number and type of TEN-T airports
Due to the high number of airports it had been agreed to focus on the international airports.In total technical information has been collected for 308 airports. Information was requestedcovering capacity, length and number of runways, the maximum size of plane and opera-tional hours. The data received were extracted from the database using the “PLANTis” tool.
Concerning the TEN-T network, the intermodal capability of airports was interesting. Thefollowing figure presents the actual situation and the expected development of the intermodalcapability of the different types of airports. It is clear that neither community, neither regionalnor national airports place emphasis on intermodality. Also, only 30% of the internationalairports contacted provided intermodal facilities. A significant change in this situation is notexpected. However, as in the case of ports, long-term strategies were, in many cases, notprovided.
Figure 3-5: Development of intermodal capability of contacted airports
0.00%
10.00%
20.00%
30.00%
40.00%
intermodal communityairports
Intermodalregional/national
airports
Intermodalinternational airports
perc
enta
ge o
f airp
orts
1996200120102015
The location of the TEN-T airports and their intermodal capability is presented at the follow-ing map.

TEN Invest – Final Report page 47
PLANCO Consulting GmbH Essen, 2003
Map 3-14: TEN-T airports and their intermodal capability in 2001

page 48 TEN Invest – Final Report
PLANCO Consulting GmbH Essen, 2003
4 Background to decision taking concerning investments inthe Trans-European Transport network
4.1 Methodologies of Transport Forecasting
4.1.1 General remarks
Forecasting future trends and developments in the field of transport is a difficult task. Trans-port is sensitive to all those parameters affecting “trip-making desires” such as economicdevelopment, social trends and habits. Major periodic changes in technological or regulatoryregimes can also significantly influence future developments. These changes can scarcelybe anticipated by analysing past and present developments. However, this does not negatethe fact that the future (especially the short and mid-term) is never independent of the pres-ent, or of the past.
The following elements generally influence transport demand:
• The current socio-political environment relies upon market forces as a means of regulat-ing supply and demand of transport services. Competition within the markets influencestransport demand.
• Satisfaction of individual rather than collective desires has a direct influence for all kindsof transportation.
• New, flexible, lean, just-in-time production techniques impose different requirementsupon freight transport, both quantitatively and qualitatively
• New forms of spatial organisation – more than 80% of the European population lives inmedium to large sized urban areas – affect the transport demand.
From the supply side the availability of a Trans-European Transport Network as well as newtechnological possibilities will affect transport demand.
4.1.2 Traffic forecast methods
In general, traffic forecasting attempts to predict the volume of traffic, inside one area, be-tween a number of zones or along a corridor, by one or more modes of transport on one ormore routes. Generation, distribution, modal split and assignment can all be considered aslinked components. Nevertheless, it is useful to divide the four steps into two stages: genera-tion - distribution and modal split -assignment. While the forecast of modal split and assign-ment has as its main input the changes in transport supply, generation and distribution dealwith a number of socio-economic, land-use and regional development variables that have tobe forecast by the model users. In practice, the stages are not clear-cut and discrete, butdespite their interdependence the two stages are best considered individually.
TEN Invest – Final Report page 49
PLANCO Consulting GmbH Essen, 2003
There are a number of approaches to generate and distribute transport demand, from con-ventional gravity models to complex integrated regional economics and transport models.The main issue summarised here is the type of variables that are most commonly used inthis step of transport modelling.
Trip generation depends on a number or characteristics either of population and/or house-holds: age, sex, employment status, income, car ownership, and is different for the varioustrip purposes.
Many of the Trans European Corridors are aimed to handle freight as well as passengers,and the former seems to be more relevant. There are many factors of freight demand model-ling that make it more difficult to model than passenger movements: the movement of freightinvolves more players (firms, shippers, carriers etc.) and more activities (storage, customfacilities, transhipment facilities, logistic etc.). Furthermore, freight demand is more seg-mented. The most common approaches for estimating freight movements are to use macro-economic models such as production/consumption or input/output matrices, at regionalrather than national levels.
Each approach employs a specific set of explanatory variables as inputs. Without any ambi-tion of being exhaustive the main ones, both for passengers and freight, are the following:
• travel costs (vehicle operating costs, fares, perceived costs for car users),
• vehicle occupancy ratio,
• value of time,
• description of the network (length, capacity, speed, interchange time etc.).
There are difficulties attached to the collection of comprehensive data for the purposes offorecast modelling at the regional and the strategic level, in particular there is a lack of ob-served matrix data at this scale. From several Member states such as the UK, Netherlands,Denmark, Finland, France, Germany and Sweden National Travel Surveys (NTS) have beenobtained as these countries undertook such exercises recently.
4.1.3 Scenarios
A second approach to assess future transportation requirements is to determine scenarios. Ascenario is a set of hypothesis that describes the ‘image’ of the transport system. There areinternal scenarios, which determine the development of the infrastructure variants, and alsoexternal scenario, which affect the impact of infrastructure development on costs etc.
A complicating factor when developing scenarios for the extended European area is thatthere are still many uncertainties concerning transition and integration processes. For theMember States, it is possible to adopt a trend scenario as the reference scenario since the

page 50 TEN Invest – Final Report
PLANCO Consulting GmbH Essen, 2003
element of uncertainty involved is lower. The existence of a series and a relatively stableeconomic context over the past period allows trends to be determined.
The recent situation in the Candidate Countries is characterised by oscillating production andtransport demand patterns, and makes it difficult to define a reference scenario, especiallyconsidering the major political and economic changes through the European Union expectedin future. The lack of consistent data complicates the problem even further. Various trajecto-ries are possible.
Poland, which engaged quickly in its economic transition, is an example of high growth involume. Other countries will progressively fall in line with this growth with the help of cohe-sion policies, although at a slower pace. The Candidate Countries might also gain from fur-ther European integration, facilitating the opening of all markets in Europe, the free traffic offreight and travellers and the suppression of all border constraints. But growth could alsoresult from a strong domestic demand from local companies or from a surplus in the tradebalance because of competitive advantages due to lower salaries and higher education lev-els. On the other hand, it can be assumed that structural reforms are not firmly establishedand that transition takes more time than expected. Concerning macro-economic balances,either the restrictive budgetary policies lead to a decrease of domestic demand or the do-mestic supply cannot come up to demand and the countries have to import, which is a detri-ment to the trade balance. When looking at the evolution of the GDP index, the CandidateCountries can be classified into several groups as regards their speed recovery and rate ofgrowth. These are:
• Group I – Poland, Hungary, Czech Republic and Slovenia
• Group II – Slovak Republic, Latvia, Lithuania, Estonia
• Group III – Bulgaria and RomaniaIn recent studies, the following basic scenarios have been defined:
1. The high growth and quick integration scenario, “European Renaissance”, represents anidealistic situation which is not impossible to reach when we refer to the history of inte-gration in European Union. The integration of Ireland, Portugal, Spain and also ofGreece, which was more isolated geographically with a more important gap in develop-ment, show indeed that this has been possible. Difficulties of integration have been over-come more easily than was feared initially.
2. The high growth and slow integration scenario, “European Dilution”, is more difficult todescribe and less probable than the former one. Under this scenario, reforms will be suc-cessful and European integration becomes a free trade zone with extended co-operationagreements. Globalisation would be effective under strong influence of new informationtechnologies.

TEN Invest – Final Report page 51
PLANCO Consulting GmbH Essen, 2003
3. In the low growth and quick integration scenario, “European solidarity”, transition takesmore time having in mind that the reference scenario for European Union members is as-sumed to remain almost the same.
4. The low growth and slow integration scenario, “European Fragmentation”, supposes alsoa longer transition and a limited European support to development of Candidate Coun-tries. This means also that Europe loses some of its substance for present EU members.
4.1.4 Information concerning forecasts in the Member States and CandidateCountries
The Federal Transport Investment Plan in Germany is based on a scenario approach. Threescenarios are taken into account, a trend scenario, an integration scenario and a laisser-fairescenario. This forecast was published in September 2000 by the consortium BVU, ifo, ITPand PLANCO. The forecast period is to 2015. As population growth, development of GDPand motorization do not differ between the scenarios, different assumptions concerningprices of fuel, fuel consumption, road pricing, productivity of road transport, cost of utilisationof roads, railways and inland waterways are taken into account. For the evaluation and se-lection of investments in the transport infrastructure the integration scenario was used.
Cyprus uses for the urban areas the conventional type of forecast. For all the large urbanareas (towns) in Cyprus (Nicosia, Limassol, Larnaka, and Pafos) comprehensive land-usetransport studies have been prepared. The travel estimation models were developed (tripgeneration, trip distribution, modal split and traffic assignment), using software packagessuch as TRIPS and VISSUM.
The title of the forecast under preparation in the Czech Republic is “Determination of Fore-cast Methodology for Transportation Performance and Transportation Relations.” It will beavailable in 2002 and will cover rail, road, air and inland waterways for passengers andgoods. The time horizon is 2010. The following methods are used:
• extrapolated time series, revised by experts,
• methods based on predictions (tabular form with coefficients),
• methods based on scenarios derived from regression analysis,
• transportation model based on PTV VISION software,
In Finland the forecast is not published. It is treated as a memorandum by the Ministry ofTransport and Communications (and is dated 31.10.2001.) This transport forecast is used inthe Ministry for the medium term plan for the years 2003 – 2006 and covers all modes.
In Greece the forecast has influenced the Operational Programme of Community SupportFramework 2000 – 2006 “Railways – Airports - Public Transport” as well as the Operational

page 52 TEN Invest – Final Report
PLANCO Consulting GmbH Essen, 2003
Programme of Community Support Framework 2000 – 2006 “Road Axes – Ports – UrbanDevelopment”
In Ireland the forecast of the National Development Plan will form the basis of the projectionsfor the period 2003 – 2006. Beyond 2006, however, it is very difficult to make any estimates.
In Romania, decisions are based on the General Transport Master Plan Study for Romania,which covers road, railway and river transportation. The time horizon is 2015. The transport-planning program POLIDROM is based on:
• Transport type,
• Economy development (GDP),
• Transport means,
• Infrastructure,
• Transport supply and demand,
• Transport effort (total costs).
For road transport, an isolated forecast "Forecast of Road Traffic Evolution for 2000-2020Period" is available. This forecast is a projection of trends based on:
• Economic increase (GDP),
• Vehicle’s park evolution,
• Traffic evolution,
• Vehicle mileage evolution.
The forecast used in Slovakia is called “Integration of Transport and Economic Infrastructureand Utilisation of Logistic Procedures at Quality Improvement of Transferring Processes”. Itcovers rail, road, inland waterways and airports. The time horizon is 2015.
In Sweden, Banverket and Vägverket (the Swedish National Railway and Road Administra-tions) are currently working on the railway and road investment plans for the period 2004-2015, which also means a revision of the existing long-term investment plans 1997-2008.
In France, a national transport plan based on the law "Loi d'Orientation pour l'Aménagementet le Développement Durable du Territoire" from June 1999 determines future activities con-cerning transport investment planning. This plan covers passenger and freight transport onall modes and the forecast horizon is 2010. This plan was completed in 2001 and will formthe background for all investments in the transport system.

TEN Invest – Final Report page 53
PLANCO Consulting GmbH Essen, 2003
4.2 Selection procedures
Methods of the selection of investments in the transport network considerably differ betweenthe various Member States. One of the common bases for an appraisal framework is Cost-Benefit Analysis (CBA). Its main characteristics can be summarised as follows: both the po-tential benefits and the potential costs of a particular project are estimated across a set ofimpacts and converted into monetary terms by multiplying impact units by prices (marketvalues) per unit. An alternative approach to appraisal is objective led, with the goal of maxi-mising with respect to a set of socially based objectives rather than market values. Multi-Criteria Analysis (MCA) typifies this approach and a number of techniques fall within thiscategory. MCA very often competes with CBA but the two approaches can also be used in acomplementary manner.
Taking into account a selection of European countries for which detailed information wasavailable, three points are apparent (see the following table). Firstly, all appraisal frameworkscontain a mixture of impacts that are assessed in qualitative terms, impacts that are ex-pressed in monetary terms and impacts that are measured in physical terms. Secondly,practices in different countries are not uniform. Although the direct transport impact tends tohave monetary values, and the environmental and socio-economic impacts tend not to beexpressed in monetary terms, there is a variation between countries. Thirdly, the details ofthe framework within which the impacts are brought together also vary across the CBA/MCAspectrum.
Figure 4-1: Selection Procedures in different CountriesAT BE DK FI FR DE GR IE IT NL PT ES SE UK
Capital Construction Costs CBA+MCA CBA+MCA CBA CBA CBA CBA CBA+MCA CBA CBA MCA CBA CBA CBA CBA
Disruption Costs CBA+MCA CBA+MCA CBA CBA CBA CBA
Land and Property Costs CBA+MCA CBA CBA CBA CBA+MCA CBA CBA CBA CBA CBA CBA
Recurring Maintenance Costs CBA+MCA CBA CBA CBA CBA CBA+MCA CBA CBA MCA CBA CBA CBA CBA
Operating Costs CBA CBA CBA+MCA CBA CBA MCA CBA
Vehicle Operating Costs CBA+MCA CBA+MCA CBA CBA CBA CBA CBA+MCA CBA CBA MCA CBA CBA CBA CBA
Revenues CBA+MCA CBA CBA+MCA CBA CBA CBA CBA
Passenger Cost Savings CBA+MCA
Time Savings CBA+MCA CBA+MCA CBA CBA CBA CBA CBA+MCA CBA CBA MCA CBA CBA CBA CBA
Safety CBA+MCA CBA+MCA CBA CBA CBA CBA CBA+MCA CBA CBA MCA CBA CBA CBA CBA
Service Level MCA MCA CBA CBA CBA
Information CBA+MCA CBA
EnforcementFinancing/Taxation CBA+MCA
Environment Noise MCA CBA+MCA CBA CBA CBA CBA MCA MCA
Vibration MCA
Air-pollution Local MCA CBA+MCA CBA CBA CBA CBA MCA MCA CBA
Air-pollution Global MCA CBA+MCA CBA CBA CBA CBA MCA CBA
Severance MCA CBA CBA
Visual Intrusion MCA
Loss of Important Sites MCA
Ressource Consumption MCA
Landscape MCA
Ground/Water Pollution MCA MCA
Socio-Economy Land Use MCA MCA MCA
Economic Development MCA MCA CBA MCA MCA
Employment MCA CBA MCA
Economic & Social Cohesion MCA
International Traffic CBA MCA
Interoperability MCA
Regional Policy MCA CBA MCA MCA
Conformity to Sector Plans MCA
Peripherality/Distribution MCA
CBA Cost-Benefit Analysis MCA Multi-Criteria Analysis CBA+MCA Combination CBA+MCA measured impacts
Direct Impacts
Within the broad framework spectrum, ranging from CBA dominated through to a largelyMCA or qualitative approach, it is clear that most national frameworks have CBA at the core.

page 54 TEN Invest – Final Report
PLANCO Consulting GmbH Essen, 2003
Most of the TINA countries also belong to this category. TINA itself bases the selection ofprojects more or less on CBA dominated appraisal methods. In Germany, Denmark andSweden only a few (or no) impacts are measured qualitatively in addition to CBA. In UK,Netherlands and Finland it appears that the CBA is a part of a more holistic approach en-compassing further impacts, which are either measured, formally included in the MCA, or onwhich a qualitative report is required.
The number of impacts ranges from a relatively small number (ten in Denmark) to a compre-hensive list of over thirty in Greece. However, it must be stated that in all countries, appraisalis used for prioritising projects, making recommendations and for evaluating alternative op-tions but not for making a final decision, which is always political.

TEN Invest – Final Report page 55
PLANCO Consulting GmbH Essen, 2003
5 Methods to Estimate Missing Data
5.1 Calculation of Unit Costs
5.1.1 Unit cost information from available studies
Where financial data for technical measures were not provided, investments were estimatedusing unit costs. The general questionnaire sent out to all Member states and CandidateCountries contained questions concerning country specific unit costs contained in relevantstudies. However, apart from information on unit costs that is contained in a study "Updatingof Transport Costs in Acceding Countries" carried out by COWI Consult, in the framework ofthe PHARE programme no further figures were received. For the Candidate Countries Bul-garia, Czech Republic, Estonia, Hungary, Latvia, Lithuania, Poland, Romania, Slovenia andSlovakia, unit cost for rail and road are provided by this study. The price level is 1997 and thecosts do not include VAT. General costs are included and allowances for design and super-vision are expressed as percentages of total construction costs. The figures distinguish be-tween projects in rural areas with flat, hilly and mountainous character and in urban areaswith flat or hilly character. Total costs are sub-divided into characteristic activities for roadand railways. They comprise:
• motorways – 4 lanes,• major new engineering structures,• rehabilitation/upgrading of existing 2 lane roads,• motorway, service facilities,• modernisation of a double railway line – 160 km/h,• modernisation of a single railway line – 100 km/h,• building of an additional track along the existing track,• construction of a new double railway line – 160 km/h• construction of a new single railway line – 100 km/h• electrification of a single track,• electrification of a double track.
The recommended unit costs are also presented in digital form and can be used after updat-ing.
Interesting information on unit costs at the county level is provided by the European Confer-ence of Ministers of Transport (ECMT). The ECMT published in 1999 a study dealing with"Investment in Transport Infrastructure 1985 – 1995". Volume 1 of this study presents anoverview concerning these investments. Volume 2 contains country studies reporting statisti-cal coverage, transport policy and transport infrastructure and the investments between 1987and 1995 for roads, railways, inland waterways, urban and suburban railways, metro, tram-ways, oil pipelines, maritime ports and airports. All figures presented in current prices at 1995
page 56 TEN Invest – Final Report
PLANCO Consulting GmbH Essen, 2003
levels. At present, the ECMT is preparing this information at the country level, though it is notyet available.
The anticipated unit costs will distinguish between construction costs for road, rail and inlandwaterways and those for maintenance. For some countries limited information is availablefrom data collected in the framework of the EUNET research project, covering road, railwayand inland waterways. These data are expressed in local currencies and the costs are ex-pressed using different price levels. The information is presented in Annex 5-1.In Germany,unit costs are provided by the analysis of construction measures carried out within the lastdecade and presented in the road construction report published annually.6 The total con-struction cost for road construction in different regional types and for two types of roads arepresented in Annex 2-1. The regional types are representative for Germany and derived froma cluster analysis at the district level. For one typical region characterised by a very high set-tlement density in a topographically flat area no road construction measures could be found.Therefore this area has been ignored. Unfortunately, for railways construction the databasein Germany is less concentrated. However, efforts were made to obtain some data concern-ing railway construction costs. The information obtained distinguishes between high-speedand conventional lines. The unit selected to base the cost was the track kilometre. As fewerrailway construction measures have been not all types of region could be covered. The unitcosts for land acquisition and for total construction are presented in Annex 5-1. As far asinland waterways are concerned, only a few projects have recently been implemented inGermany. Furthermore, the type of construction varies between these projects. However, adistinction can be made between costs for deepening and improvement of a waterway, costof rehabilitation of bridges and locks, cost of land acquisition, supervision and planning costs(see Annex 5-1).
5.1.2 Unit cost estimation based on the collected data
The above mentioned unit cost developed by COWI consult are related to projects and arenot applicable to the links of the network as projects do not necessarily comply with thelength of a link. Projects can cover only a part of a link or can comprise several links. Unitvalues per kilometre based on costs gained by the analysis of projects, therefore cannotsimply be used to quantify any upgrading of the network. Any cost based only on this projectrelated approach is supposed to overestimate an upgrading cost assessment or requires theexact determination of the projects necessary to upgrade a link. This information, however,cannot be supplied for future projects. By a mode and country specific unit cost assessment, 6 Usually the length of the measure in kilometres is considered as the appropriate unit to determine unit cost.
As the length does not cover works necessary at intersections the square meter of newly constructed roadsurface has been selected as unit as far roads are concerned.

TEN Invest – Final Report page 57
PLANCO Consulting GmbH Essen, 2003
which is based on the results of the data collection exercise, missing costs for investmentscan roughly be estimated. Compared to the above-mentioned unit costs these cost are re-lated to the length of a link (link part) and not to the length of a specific project. This ap-proach has been selected, as measures to grade a link will vary from case to case. By relat-ing the cost to a link (link part) the average costs have been estimated and can be used toassess the cost of upgrading or improving a link. For new construction the project length is inany case the same as the link length. The following tables show the investments mentionedduring the data collection for railways, roads and inland waterways in the Member States andthe Candidate Countries.
Table 5-1: Average unit cost for road measures
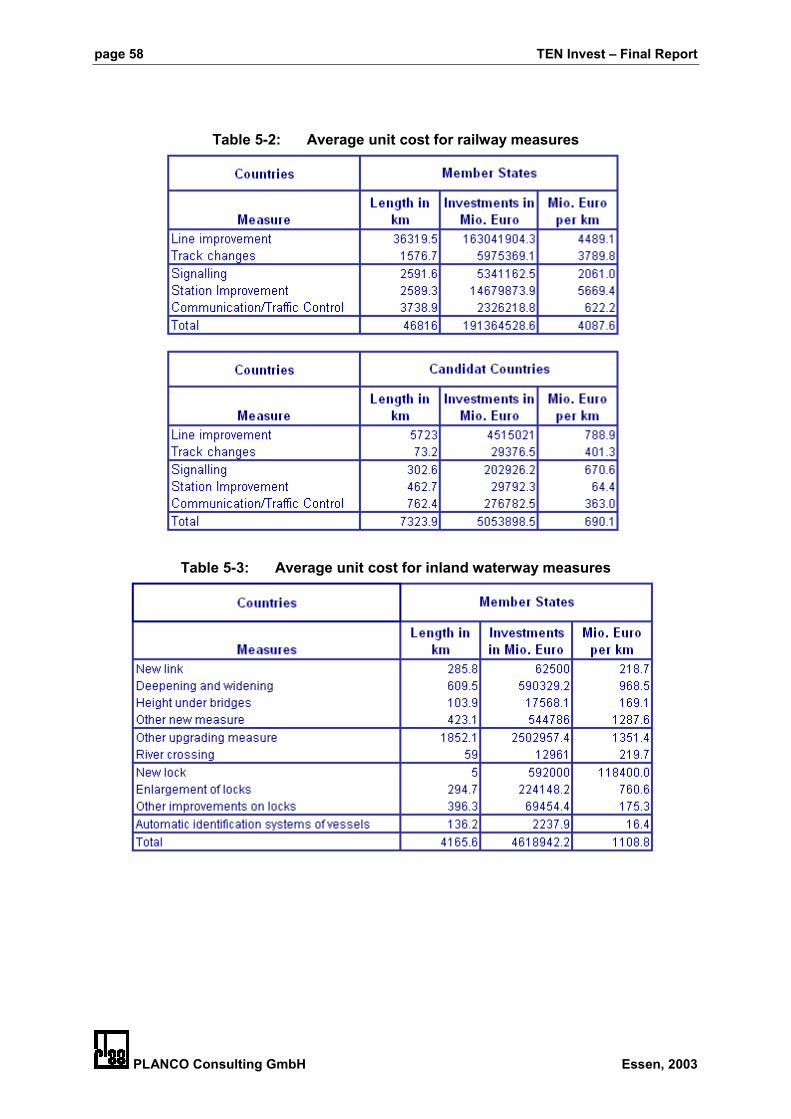
page 58 TEN Invest – Final Report
PLANCO Consulting GmbH Essen, 2003
Table 5-2: Average unit cost for railway measures
Table 5-3: Average unit cost for inland waterway measures

TEN Invest – Final Report page 59
PLANCO Consulting GmbH Essen, 2003
Table 5-4: Average unit cost for inland waterway measures(continued)
During the unit cost estimation some measures have been aggregated. For railways meas-ures to increase axle load, to add tracks, to change the alignment, electrification, to improveintersections and other line measures have been summarised under line improvement andall measures concerning stations under station improvement. For roads under traffic man-agement information services, emergency and incident management and control activitieshave been put together.
Such unit cost approach is not generally applicable to ports, airports, terminals or even inlandwaterways as measures usually are individual engineering projects such as berths, runways,terminal buildings, locks, etc.
The cost provided by the experts of the related ministries or establishments in the MemberStates and the Candidate Countries varies significantly. This depends on the different pricelevels and on different manners to estimate the cost of the foreseen projects. Many of theinvestments anticipated by the experts in the contacted ministries or establishments arebased on preliminary studies which do not provide detailed planning as basis for a reliablecost estimation. However, the cost of different measures have been derived from this infor-mation according to the following country groups:
• Germany, Netherlands, Belgium, Luxembourg, France, Austria,
• Spain, Portugal, Italy, Greece,
• Denmark, Sweden, Finland, United Kingdom, Ireland,
• Lithuania, Estonia, Latvia, Poland, Czech Republic,
• Slovakia, Slovenia, Hungary,
• Bulgaria, Romania, Malta, Cyprus.

page 60 TEN Invest – Final Report
PLANCO Consulting GmbH Essen, 2003
Furthermore by plausibility tests some inconsistencies have been eliminated resulting fromdifferent understanding about what is a new link and what is upgrading from an existing linkquality to a higher link quality. The cost by country groups are presented in Annex 5-1.
5.2 Assessment of investment structure
Unfortunately, the results of the data collection exercise are to some extent incomplete. Al-though it can be assumed that information for all relevant measures either already decided oranticipated to be initiated until 2010 were made available by the experts employed by therespective ministries in both the Member States and the Candidate Countries, data concern-ing the distribution of costs between components such as studies, planning and constructionwere available only for a few projects. Furthermore, some projects were not yet decided butstudies concerning the implementation costs had already been executed. In these instancesthe total cost of the projects were mentioned but not the cost of the studies.
However, based on experience a general pattern concerning the percentage of the compo-nents can be assumed. The cost of studies usually ranges between 3% and 5%, the cost ofplanning between 12% and 15% and the construction cost range between 80% and 83% ofthe total cost of a project. The higher share applies for the construction of new links, for addi-tional lanes or tracks and for all measures related to ports, airports or to the inland water-ways. The lower share for studies and planning is related to rehabilitation measures. How-ever the costs occurring in the public administrations and in the political bodies concerningdecision taking are not included in these estimations.
Based on the information gained during the data collection and based on general experiencea time schedule pattern for mode specific investments can be neglected as most of the in-vestment are executed continuously as far as budget is available. Investment can be distrib-uted on implementation years with constant shares. This approach assumes that financingusually will provided at he beginning of the year and will be used as soon as possible. Thecase that a project cannot be terminated at the end of the year and a smaller portion will beexecuted in the following year happens quite often, but to anticipate such a development willcreate bigger faults than to neglect this effect. However for the past, until 2001 and in manycases until 2003 the investment are known year by year.

TEN Invest – Final Report page 61
PLANCO Consulting GmbH Essen, 2003
6 Investment in the Trans-European Transport Network
6.1 Investments in the countries
Investments have been aggregated on the basis of the data collected in the course of theproject. Where expenditure information was provided for a period of time instead of indicatingfigures for each single year, the investments were distributed equally across the number ofyears covered. This method was selected since execution plans for different infrastructureprojects for the single countries were in some cases lacking. Some of the information on fu-ture investments was estimated and these figures should be treated with caution. They werederived from future investment plans or provided by national ministerial experts. Data coversthe modes rail, road, inland waterways, ports and airports of the TEN-T network in the en-larged European Union.
6.1.1 Member States
Investments in the TEN-T network in the Member States between 1996 and 2001 amountedto 178.6 billion Euro. Between 2002 and 2005, expenditure of a further 159 billion Euro isforeseen, while the corresponding spend between 2006 and 2010 is put at 97.6 billion Euro.
Table 6-1: Total Investments in TEN-T Infrastructure, Member States, million Euro
Investments increased from 1996 until 1999 and were then slightly lower in the years2000/2001. For the period 2002-2003 an increase of 30% over the previous period is esti-mated followed by a further decrease until 2005. From 1996 until 2001 Germany had thehighest share of the total (20%) followed by France (15%) and Italy (12%). From 2002 until2005 the highest investments were reported for Italy (17%) followed the UK (16%), Germany

page 62 TEN Invest – Final Report
PLANCO Consulting GmbH Essen, 2003
(14), the Netherlands and France (12% each). With regard to Denmark only limited futureinvestments were reported, due to the fact that future plans have not yet been made public.
6.1.2 Candidate Countries
In the Candidate Countries, investments of 7.8 billion Euro were reported between 1996 and2001. The highest share was in the Czech Republic (29%), followed by Poland (19%), Slo-venia (16%) and Hungary (13%).
Future expenditure of 20 billion Euro is projected for the period 2002 to 2005, of which Po-land accounts for 29% and the Czech Republic for 27%. Another 20.7 billion Euro are esti-mated from 2006 until 2010. For the period 2011 to 2015, expenditure totalling 4.5 billionEuro was reported. The actual sums are likely to be much higher, but information on a long-term basis was not available.
It has to be noted that no road investment data were available for Bulgaria and Romania. Forinland waterways, Bulgaria, Poland and Romania are missing, for ports Slovakia and Slove-nia, and for airports, Poland.
Table 6-2: Total Investments in TEN-T Infrastructure, Candidate Countries, millionEuro
6.2 Investments by Mode
During the indicated time periods the highest share of investments in the Member States wasassigned to rail infrastructure (33% - 55%), followed by road infrastructure (22% - 34%). Thelowest share was invested in inland waterways (1% - 2%), though it should be noted thatthere are only six out of 15 Member States with river systems which are interconnected:Austria, Belgium, France, Germany, Luxembourg and the Netherlands.

TEN Invest – Final Report page 63
PLANCO Consulting GmbH Essen, 2003
Between 1996 and 2001, investments in airports accounted for 17% to 13% of the total, whileport expenditure ranged from 14% to 11%. Their decreasing share in the future is due to thefact that it was difficult to receive figures related to long-term investments.
Figure 6-1: Share of investments by mode, Member States
Table 6-3: Investments by mode, Member States, million Euro
In the Member States the total reported investments ranged between 45.7 billion Euro in1996 and 1997 and estimated expenditure of 97.1 billion Euro between 2006 and 2010. Thetotal amount of future investments in the TEN-T foreseen between 2002 and 2010 amountedto 256,2 billion Euro. In practice these latter figures are likely to be higher since informationfrom 2005 onwards was less readily available.
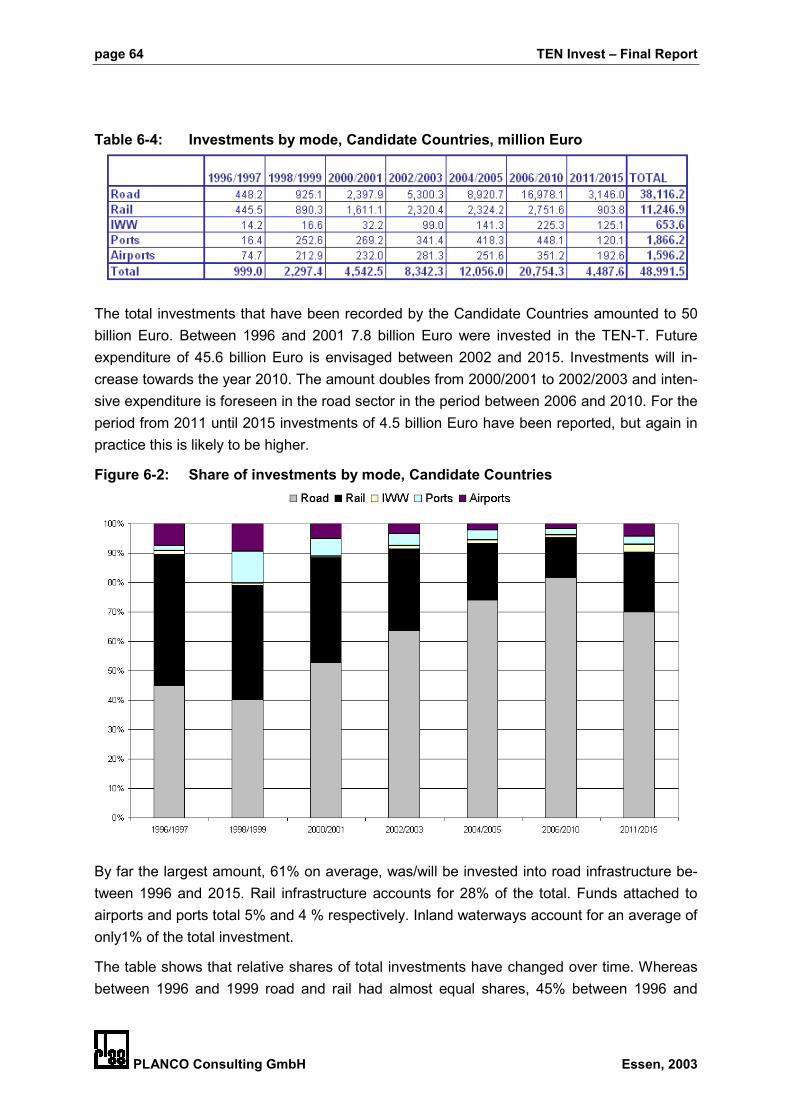
page 64 TEN Invest – Final Report
PLANCO Consulting GmbH Essen, 2003
Table 6-4: Investments by mode, Candidate Countries, million Euro
The total investments that have been recorded by the Candidate Countries amounted to 50billion Euro. Between 1996 and 2001 7.8 billion Euro were invested in the TEN-T. Futureexpenditure of 45.6 billion Euro is envisaged between 2002 and 2015. Investments will in-crease towards the year 2010. The amount doubles from 2000/2001 to 2002/2003 and inten-sive expenditure is foreseen in the road sector in the period between 2006 and 2010. For theperiod from 2011 until 2015 investments of 4.5 billion Euro have been reported, but again inpractice this is likely to be higher.
Figure 6-2: Share of investments by mode, Candidate Countries
By far the largest amount, 61% on average, was/will be invested into road infrastructure be-tween 1996 and 2015. Rail infrastructure accounts for 28% of the total. Funds attached toairports and ports total 5% and 4 % respectively. Inland waterways account for an average ofonly1% of the total investment.
The table shows that relative shares of total investments have changed over time. Whereasbetween 1996 and 1999 road and rail had almost equal shares, 45% between 1996 and

TEN Invest – Final Report page 65
PLANCO Consulting GmbH Essen, 2003
1997 and 40% between 1998 and 1999, from 2000 onwards investments in road infrastruc-ture are increasing significantly at the expense of rail, which drops to 13% between 2006 and2010.
6.2.1 Road Infrastructure
Road infrastructure expenditure makes up the second largest share of total investment in theTrans-European Transport Network in the Member States. Between 1996 and 2003 this in-vestment is steadily increasing, except for the period between 2000 and 2001.
Table 6-5: Investments in TEN-T Road Infrastructure, Member States, million Euro
One quarter of the total investment between 1996 and 2001 was made in France while 23%was invested in Germany and 11% in Spain. With regard to future expenditure, the highestshare was reported for Italy (28%), followed by Germany (21%) and Ireland (14%).

page 66 TEN Invest – Final Report
PLANCO Consulting GmbH Essen, 2003
Figure 6-3: Investments in TEN-T Road Infrastructure, Member States, million Euro
The figure above shows the investments in road infrastructure from 1996 to 2010 by individ-ual Member States. The largest shares were reported for Italy, Germany and France. Par-ticularly in Italy, relatively high future investments were indicated. The general trend showsthat road investments are decreasing towards the end of the decade, with the exception ofItaly. Investments can be divided into those designated in the Guidelines of 1996 as motor-ways, ordinary roads or high quality roads.
Table 6-6: Investments in TEN-T Motorways in the Member States, million Euro

TEN Invest – Final Report page 67
PLANCO Consulting GmbH Essen, 2003
Table 6-7: Investments in TEN-T Ordinary/ High Quality Roads, Member States, mil-lion Euro
Of the total expenditure, 64% was related to motorways, with the highest levels recorded inItaly and Germany7. Total investments from 1996 until 2001 in TEN-T motorways in theMember States totalled 30 billion Euro. The investments in ordinary roads and high qualityroads are shown in the tables Table 6-6 and Table 6-7.
Table 6-8: Investments in TEN-T road infrastructure, Candidate Countries, millionEuro8
7 This data has been handed over by the EC. Unfortunately in four EU countries (Ireland, Spain, The Netherlands
and Greece) the TEN types are often lacking. This explains also the slight differences when adding up invest-ments of the road types compared to the total investments. Hence the figures have to be treated with caution.
8 n.a. = data not available; # = mode of transport does not exist in the specific country

page 68 TEN Invest – Final Report
PLANCO Consulting GmbH Essen, 2003
Table 6-9: Investments in TEN-T Motorways, Candidate Countries, million Euro
Table 6-10: Investments in TEN-T Ordinary/ High Quality Roads, Candidate Coun-tries, million Euro
Investment in road infrastructure in the Candidate Countries was/will be 38 billion Euro from1996 until 2015. Future expenditure (post 2003) of 28.9 billion Euro is envisaged. Neverthe-less, as data from some countries was not available, the actual figure is likely to be higher.58% of the investments is related to high quality and ordinary road, 40% is spend on motor-ways.
6.2.2 Rail Infrastructure
Large investments have been – and will be - made in railway infrastructure. Between 1996until 2001 88,5 billion Euro was spent. The highest amounts were recorded in Italy, Franceand Germany. From 2002 onwards 118 billion Euro are projected for the entire TEN-T rail-way network.

TEN Invest – Final Report page 69
PLANCO Consulting GmbH Essen, 2003
Table 6-11: Investments in TEN-T Rail Infrastructure, Member States, million Euro
Figure 6-4: Investments in TEN-T Rail Infrastructure, Member States, million Euro
There was no general trend within the 15 Members States regarding increasing or decreas-ing investment in rail infrastructure as the situation differed significantly among the countries.
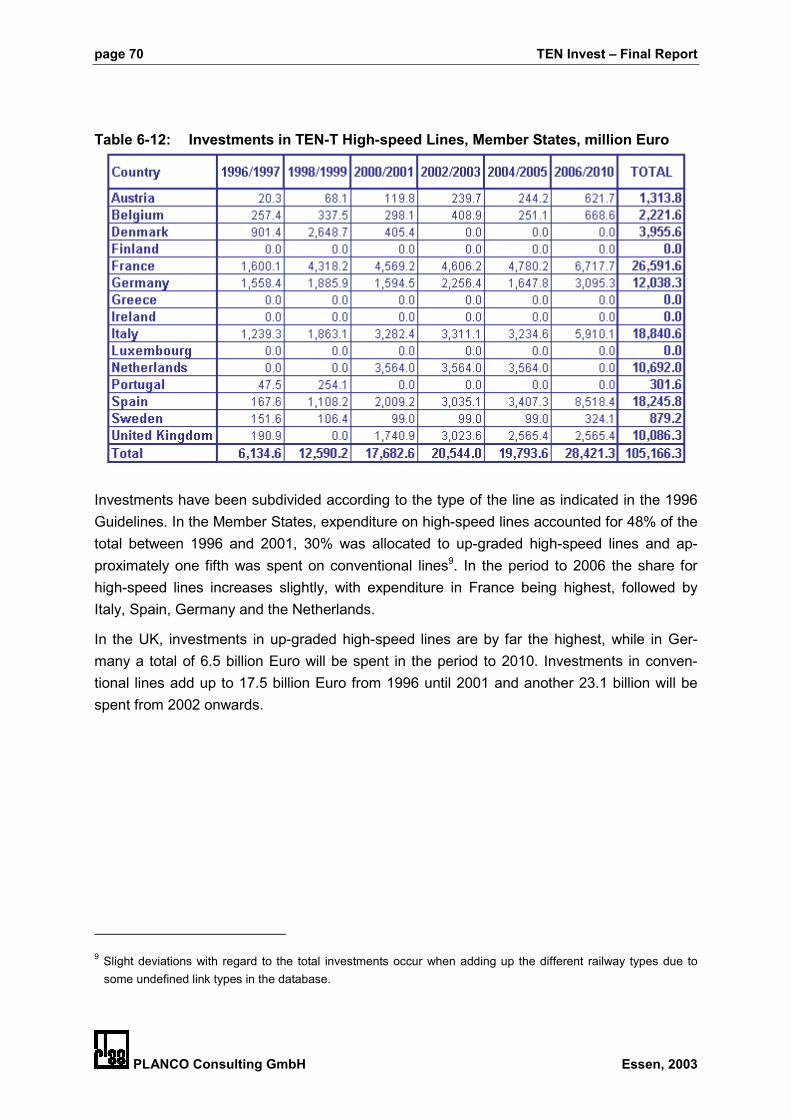
page 70 TEN Invest – Final Report
PLANCO Consulting GmbH Essen, 2003
Table 6-12: Investments in TEN-T High-speed Lines, Member States, million Euro
Investments have been subdivided according to the type of the line as indicated in the 1996Guidelines. In the Member States, expenditure on high-speed lines accounted for 48% of thetotal between 1996 and 2001, 30% was allocated to up-graded high-speed lines and ap-proximately one fifth was spent on conventional lines9. In the period to 2006 the share forhigh-speed lines increases slightly, with expenditure in France being highest, followed byItaly, Spain, Germany and the Netherlands.
In the UK, investments in up-graded high-speed lines are by far the highest, while in Ger-many a total of 6.5 billion Euro will be spent in the period to 2010. Investments in conven-tional lines add up to 17.5 billion Euro from 1996 until 2001 and another 23.1 billion will bespent from 2002 onwards.
9 Slight deviations with regard to the total investments occur when adding up the different railway types due to
some undefined link types in the database.
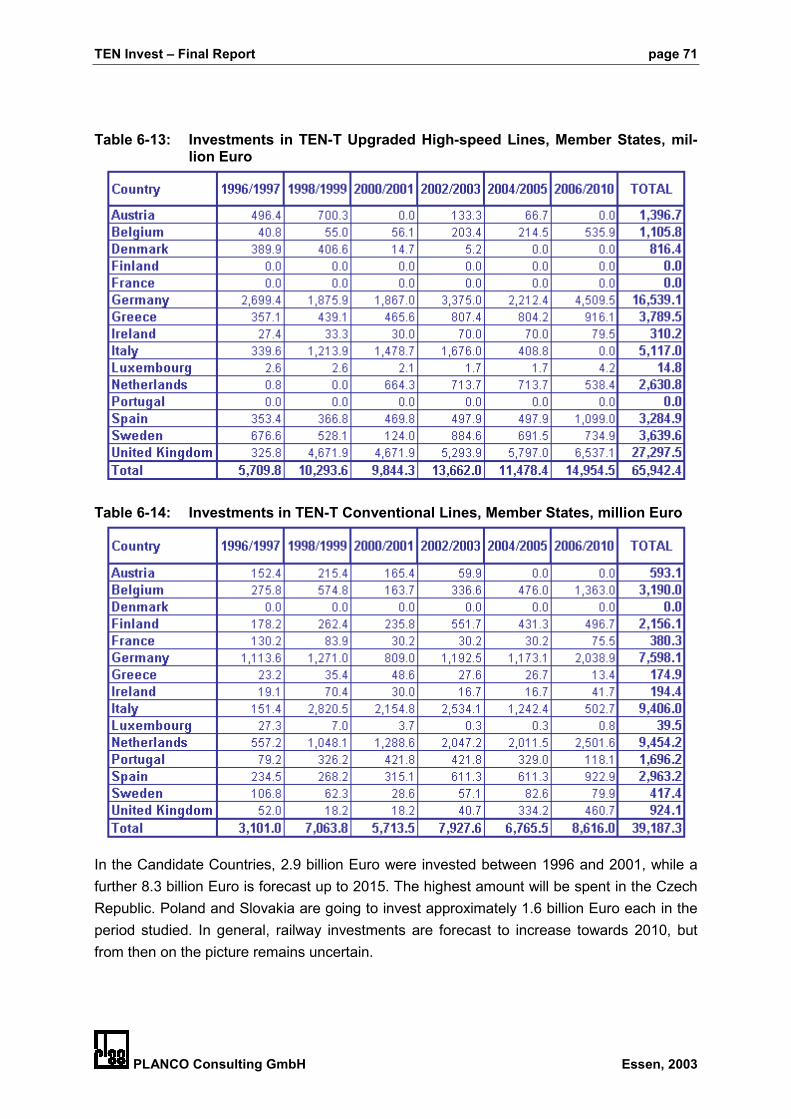
TEN Invest – Final Report page 71
PLANCO Consulting GmbH Essen, 2003
Table 6-13: Investments in TEN-T Upgraded High-speed Lines, Member States, mil-lion Euro
Table 6-14: Investments in TEN-T Conventional Lines, Member States, million Euro
In the Candidate Countries, 2.9 billion Euro were invested between 1996 and 2001, while afurther 8.3 billion Euro is forecast up to 2015. The highest amount will be spent in the CzechRepublic. Poland and Slovakia are going to invest approximately 1.6 billion Euro each in theperiod studied. In general, railway investments are forecast to increase towards 2010, butfrom then on the picture remains uncertain.

page 72 TEN Invest – Final Report
PLANCO Consulting GmbH Essen, 2003
Table 6-15: Investments in TEN-T Rail Infrastructure, Candidate Countries, millionEuro
Figure 6-5: Investments in TEN-T Rail Infrastructure, Candidate Countries, millionEuro
Information on Latvian railways is missing, while neither Cyprus nor Malta possesses anyrailway infrastructure. In the Candidate Countries nearly all investments are related to con-ventional lines. Only in Bulgaria and Poland is there significant expenditure on up-gradedhigh-speed lines. (Between 1996 and 2015, 410 million Euro in Bulgaria and 168 million Euroin Poland.)

TEN Invest – Final Report page 73
PLANCO Consulting GmbH Essen, 2003
Table 6-16: Investments in TEN-T Rail Infrastructure, Conventional Lines, CandidateCountries, million Euro
6.2.3 Inland Waterways Infrastructure
In the Member States inland waterways exist in nine out of the total of 15 countries. The Poin Italy and the Duoro in Portugal belong to the revised TEN-T inland waterway network,though no information for these has so far been made available.
Table 6-17: Investments in TEN-T inland waterway infrastructure, Member States,million Euro
Investments into this mode of transport amounted to three billion Euro between 1996 and2001. Future expenditure of 5.1 billion Euro is foreseen between 2002 and 2010. The highestinvestments were made in Germany, totalling 2.9 billion Euro between 1996 and 2003. For
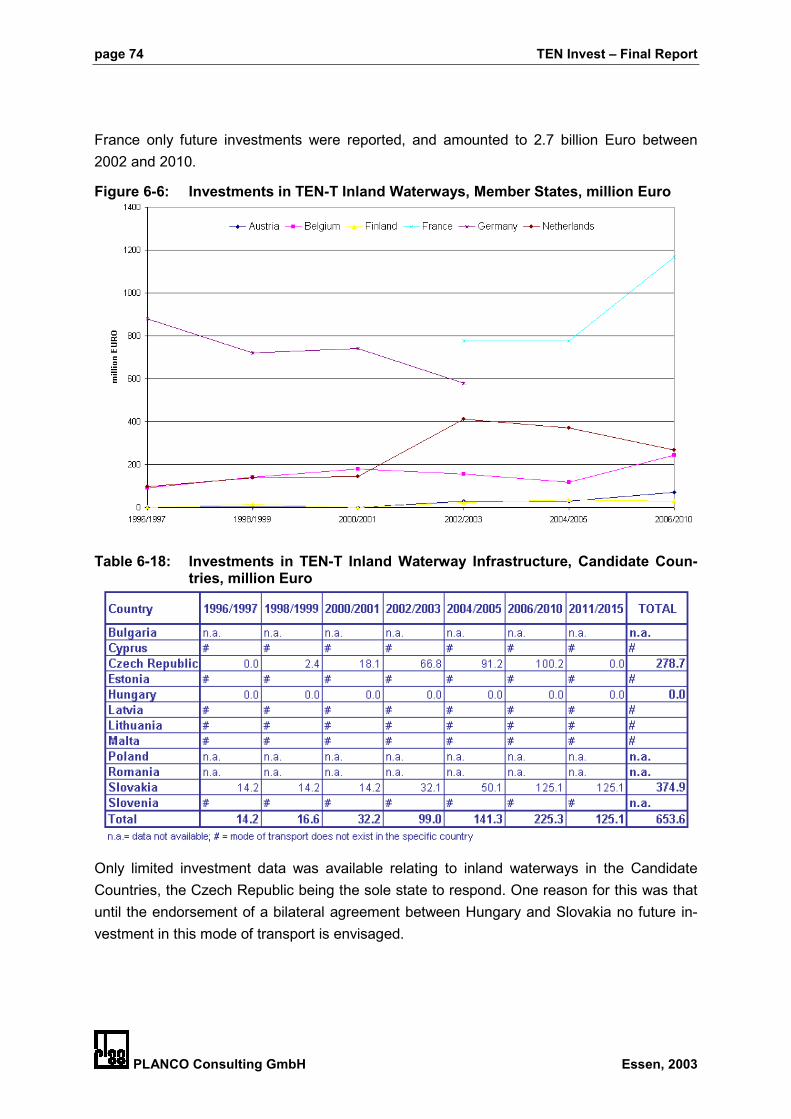
page 74 TEN Invest – Final Report
PLANCO Consulting GmbH Essen, 2003
France only future investments were reported, and amounted to 2.7 billion Euro between2002 and 2010.
Figure 6-6: Investments in TEN-T Inland Waterways, Member States, million Euro
Table 6-18: Investments in TEN-T Inland Waterway Infrastructure, Candidate Coun-tries, million Euro
Only limited investment data was available relating to inland waterways in the CandidateCountries, the Czech Republic being the sole state to respond. One reason for this was thatuntil the endorsement of a bilateral agreement between Hungary and Slovakia no future in-vestment in this mode of transport is envisaged.

TEN Invest – Final Report page 75
PLANCO Consulting GmbH Essen, 2003
Figure 6-7: Investments in TEN-T Inland Waterways, Candidate Countries, millionEuro
6.2.4 Airports
Investments were recorded for 185 airports in the Member States and 51 airports in the Can-didate Countries.
Between 1996 and 2001 22.3 billion Euro were invested in the Member States (40 interna-tional, 62 community connecting points and 114 regional airports). The largest amount wasrecorded in the Netherlands, and was related to the development of Amsterdam Schiphol.The second largest expenditure during the period was in Germany. Future investment infor-mation was incomplete, since long-term development plans were often regarded as commer-cially sensitive and thus not made public.
The following table sets out details of the investments indicated by the different airports. Fu-ture expenditure is estimated to be approximately eight billion Euro in 2002 and 2003 andanother 21 billion between 2004 and 2010 inclusive. Reported future investments in the UKwere the highest among the Member States. For the other countries only limited informationwas available.

page 76 TEN Invest – Final Report
PLANCO Consulting GmbH Essen, 2003
Table 6-19: Investments in TEN-T airports, Member States, million Euro
Approximately 56% of the total expenditure is related to International and 33% to CommunityAirports (as defined in the Guidelines in the Member States.)
Table 6-20: Investments in TEN-T international airports, Member States, million Euro

TEN Invest – Final Report page 77
PLANCO Consulting GmbH Essen, 2003
Table 6-21: Investments in TEN-T community airports, Member States, million Euro
Looking at the Candidate Countries, the availability of investment data for airports was, insome cases, incomplete. The project covered 11 international, 8 community connectingpoints and 1 regional airports.
In 1996 and 1997 69 million Euro were spent. Between 1996 and 2001 investments of 519.7million Euro were reported. Future expenditure of 1.1 billion Euro is projected in the period to2015. (Investment between 2011 and 2015 was provided only provided by Romania andamounted to 192.6 million Euro.)
Table 6-22: Investments in TEN-T airports, Candidate Countries, million Euro
Three-quarters of total investment expenditure in Candidate Countries in the period to 2015,1.1 billion Euro, is allocated to International Airports; the remaining sum - 401 million Euro -being spent on the development of Community Connecting Points.

page 78 TEN Invest – Final Report
PLANCO Consulting GmbH Essen, 2003
Table 6-23: Investments in TEN-T airports, International Airports, Candidate Coun-tries, million Euro
6.2.5 Ports
Investments into ports have been reported for 230 ports, 204 located in the Member Statesand the remaining in the Candidate Countries.
Table 6-24: Investments in TEN-T ports, Member States, million Euro
Investments in port infrastructure in the Member States (175 maritime ports and 29 maritime/inland and inland ports) amounted to 19.6 billion Euro between 1996 and 2001. Future ex-penditure in the period between 2002 and 2010 are estimated to be 18.5 billion Euro. Thetotal investment amounts to 38 billion Euro. Very high figures were reported for Belgium,where the Port of Antwerp accounted for the majority of expenditure.

TEN Invest – Final Report page 79
PLANCO Consulting GmbH Essen, 2003
In the Candidate Countries, port investment (13 maritime ports and 13 maritime/ inland andinland ports) totalled 1.7 billion Euro between 1996 and 2015, though it must be stated thatdata proved difficult to obtain. For the period 1996 until 2001, expenditure of 481 million Eurowas reported and between 2002 and 2010 1.2 billion Euro. Only Lithuania provided data be-yond 2010.
Table 6-25: Investments in TEN-T ports, Candidate Countries, million Euro
6.3 Specific Projects
The specific project play a vital role for the implementation of the TEN-T network. Invest-ments have been collected for the entire network, so that the data for the specific projects isalso on hand as far as it has been made available. Investments indicated in tables belowencompass past investments as well as future investments indicated in national investmentsplans or supplied by the experts from the national ministries.
The proposal for the revision of the 1996 guidelines has also indicated proposed extensionsof certain specific projects. The investments of the proposed extensions have been indicatedseparately.
The PLANTIS tool has been used to extract the data on a link by link basis. For the ongoingspecific projects the results are presented in this chapter in an aggregated manner. The in-vestments stated in this chapter refer to already decided investments or budget allocationsas well as estimated future investments as provided by the experts from national ministries.Information on a link by link basis can be found in Annex 6-2. The length indicated in the ta-bles refers to the entire length of the specific project encompassing completed as well asuncompleted sections.

page 80 TEN Invest – Final Report
PLANCO Consulting GmbH Essen, 2003
6.3.1 Highspeed train / combined transport north – south
The project aims at the improvement of the north- south rail corridor from Berlin (Germany) toNaples (Italy). The initial project covered the link from Berlin to Verona. An extension hasbeen proposed by the EC, which continues to Naples and also encompasses a Milan – Bolo-gna branch. The project will help to reduce travel times and improve the capacity also forfreight traffic. The following investments have been reported for the countries involved.
Table 6-26: Specific project 1
Country Measure Length from to Investments inmillion Euro
Germany upgrading/ new line 631.2 1992 2010 6,642Austria new line 103.3 1998 2010 1,238Italy upgrading/ new line 151.0 1996 2004 362.8Italy proposed extension 536.5 1994 2010 16,190.6TOTAL 1431.0 1992 2010 24,433.4
6.3.2 Highspeed train PBKAL
The highspeed train PBKAL was the first multi-country highspeed train undertaking inEurope. It connects central European capitals as well as major cities and constitutes an al-ternative to passenger air traffic since journey times are reduced significantly. The entireproject is likely to be terminated in 2007.
Table 6-27: Specific project 2
Country Measure Length from to Investments inmillion Euro
UK new line 166.4 1994 2007 10,086Belgium upgrading/ new line 297.3 1994 2012 3,308Netherlands upgrading/ new line 107.6 1988 2008 6,375Germany upgrading/ new line 338.3 1994 2007 5,693TOTAL 909.6 1998 2012 25,462
6.3.3 Highspeed train south
The highspeed train south links Madrid to the French city of Montepellier. An extension of thelink to Nimes has been proposed by the EC, on order to to connect it to the high speed lineMarseilles – Paris. The line heading from Madrid to the north runs via Valladolid and Burgosto the French – Spanish border. This line is connected to the priority project 8 (multimodallink Portugal-Spain-Central Europe). The major results after the implementation of this proj-ect is the drastic reduction of journey times.

TEN Invest – Final Report page 81
PLANCO Consulting GmbH Essen, 2003
Table 6-28: Specific project 3
Country Measure Length from to Investments inmillion Euro
Spain new line 1,217.9 1996 2010 16,415France upgrading/ new line 180.8 1996 2005 2,316France proposed extension 54.4 2004 2012 783TOTAL 1,453.1 1996 2010 19,514
6.3.4 Highspeed train east
This project has been set up in order to connect the French and the German highspeed rail-way networks. The highspeed link runs from Paris via Saarbrücken to Mannheim. The linkfrom Luxembourg to Strasbourg is also part of the project. Journey times will be reducedconsiderably.
The project also constitutes the basis for an east west corridor spanning from Central Europeto the Candidate Countries.
Table 6-29: Specific project 4
Country Measure Length from to Investments inmillion Euro
France new line 449.9 2000 2010 5,353Germany upgrading 130.1 1996 2006 446TOTAL 580.0 1996 2010 5,799
6.3.5 Conventional rail/ combined transport: Betuwe line
The Betuwe line is a freight transport line, which links the Port of Rotterdam with Europe'seconomic centres. The line runs through the Netherlands and connects to the German rail-way system. The aim of the project is to strengthen the Port of Rotterdam as a major Euro-pean freight transport hub and to shift freight traffic from road to rail thus contributing to thereduction of pollution and enhancing road safety.
Table 6-30: Specific project 5
Country Measure Length from to Investments inmillion Euro
Netherlands upgrade/ new line 159.5 1984 2010 1,057TOTAL 159.5 1984 2010 1,057
6.3.6 Highspeed train/ combined transport France – Italy
The highspeed line moves along all the way from Lyon in France via Torino, Milano, Veronaand Venezia to Triest. Its purpose is to release the congested road links running through theAlps and shift freight traffic from road to rail. Capacities for both passenger and freight traffic
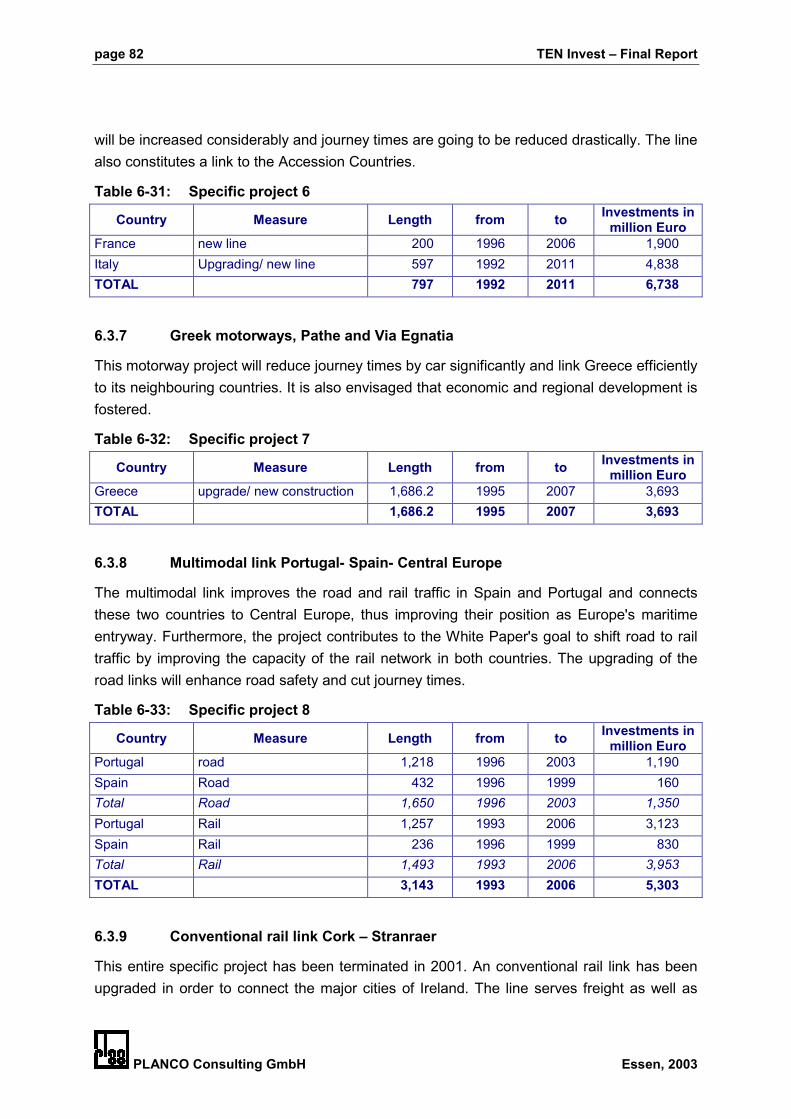
page 82 TEN Invest – Final Report
PLANCO Consulting GmbH Essen, 2003
will be increased considerably and journey times are going to be reduced drastically. The linealso constitutes a link to the Accession Countries.
Table 6-31: Specific project 6
Country Measure Length from to Investments inmillion Euro
France new line 200 1996 2006 1,900Italy Upgrading/ new line 597 1992 2011 4,838TOTAL 797 1992 2011 6,738
6.3.7 Greek motorways, Pathe and Via Egnatia
This motorway project will reduce journey times by car significantly and link Greece efficientlyto its neighbouring countries. It is also envisaged that economic and regional development isfostered.
Table 6-32: Specific project 7
Country Measure Length from to Investments inmillion Euro
Greece upgrade/ new construction 1,686.2 1995 2007 3,693TOTAL 1,686.2 1995 2007 3,693
6.3.8 Multimodal link Portugal- Spain- Central Europe
The multimodal link improves the road and rail traffic in Spain and Portugal and connectsthese two countries to Central Europe, thus improving their position as Europe's maritimeentryway. Furthermore, the project contributes to the White Paper's goal to shift road to railtraffic by improving the capacity of the rail network in both countries. The upgrading of theroad links will enhance road safety and cut journey times.
Table 6-33: Specific project 8
Country Measure Length from to Investments inmillion Euro
Portugal road 1,218 1996 2003 1,190Spain Road 432 1996 1999 160Total Road 1,650 1996 2003 1,350Portugal Rail 1,257 1993 2006 3,123Spain Rail 236 1996 1999 830Total Rail 1,493 1993 2006 3,953TOTAL 3,143 1993 2006 5,303
6.3.9 Conventional rail link Cork – Stranraer
This entire specific project has been terminated in 2001. An conventional rail link has beenupgraded in order to connect the major cities of Ireland. The line serves freight as well as

TEN Invest – Final Report page 83
PLANCO Consulting GmbH Essen, 2003
passenger traffic. The project has substantially reduced travel times and contributed to therelocation of freight flows towards rail traffic.
Table 6-34: Specific project 9
Country Measure Length from to Investments inmillion Euro
UK upgrade 220 1989 2001 117Ireland upgrade 440 1996 2010 351TOTAL 660 1989 2010 468
6.3.10 Malpensa Airport
Malpensa airport has been upgraded in order to meet the growing traffic demand, whichcould not be served by Milan's other airports. A new passenger terminal has been build withdirect link to access roads, airport car parks and the local railway station. The two existingrunways have been upgraded and expanded to serve wide-bodied aircrafts. The new Mal-pensa Cargo City will act as a multi-modal logistic platform to serve consumers and industryfrom Italy and across southern Europe.
Table 6-35: Specific project 10
Country Measure from to Investments inmillion Euro
Italy extension/ new terminal 1996 2002 747TOTAL 1996 2002 747
6.3.11 Fixed rail/ road link between Denmark an Sweden
The Øresund fixed link connects Sweden and Denmark by road and rail reducing travel timesfor road and rail significantly. It is the fundament for the development of the cross-borderregion of Copenhagen and Skane.
Table 6-36: Specific project 11
Country Measure Length from to Investments inmillion Euro
Denmark/ Sweden road 46.5 1998 2001 1,618Denmark/ Sweden rail 15.8 1996 2001 1,539TOTAL 62.3 1996 2001 3,157
6.3.12 Nordic triangle (rail/ road)
The Nordic Triangle will improve rail and road traffic in Sweden and Finland for both passen-ger and freight traffic. Journey times will be reduced regarding road and rail traffic. Roadsafety will be enhanced and the project brings relief to congested roads especially in the vi-cinity of major urban centres.

page 84 TEN Invest – Final Report
PLANCO Consulting GmbH Essen, 2003
Table 6-37: Specific project 12
Country Measure Length from to Investments inmillion Euro
Sweden road 1329 1997 2015 940Finland road 304 1995 2015 814Total road 1633 1995 2015 1,754Sweden rail 1,157 1996 2015 3,772Finland rail 743 1979 2015 1,514Total rail 1,900 1979 2015 5,286TOTAL 3,533 1979 2015 7,040
6.3.13 Ireland / United Kingdom/ Benelux road link
On Ireland the road link runs from Cork via Dublin to Belfast. Ferry links connect it withWales and Scotland. The motorways in England link the main industrial centre with the portsof Felixstowe and Harwich. The projects encompasses the building of new links as wells asthe upgrading of sections. Purpose of the project is to cut travel times and reduce congestionalong major routes. The improvement of the road links brings the region closer to the Euro-pean mainland and fosters economic development.
Table 6-38: Specific project 13
Country Measure Length from to Investments inmillion Euro
Ireland upgrade/ new construction 336 1994 2006 2,455UK upgrade/ new construction 1293 1994 2010 1,311TOTAL 1,629 1994 2010 3,766
6.3.14 West coast main line (rail)
The main goal of the project is the reduction of journey times for passenger and freight trafficand improving the capacity of the lines. A shift of traffic from road to rail is envisaged. Theline runs from Glasgow and Edinburg via Liverpool and Birmingham to London. The projectconnects to the highspeed line PBKAL across the channel to the European heartland.
Table 6-39: Specific project 14
Country Measure Length from to Investments inmillion Euro
UK upgrading 1053 1998 2007 23,616TOTAL 1053 1998 2007 23,616
6.3.15 East European combined transport/ high-speed train
The East European combined transport/ high-speed train is an important connection to theCandidate Countries and strengthens the east-west transport axes. The link runs from Stutt-

TEN Invest – Final Report page 85
PLANCO Consulting GmbH Essen, 2003
gart, via Augsburg and Munich to Salzburg and continues via Linz to Vienna. After its imple-mentation journey times are reduced and capacities especially for freight traffic are in-creased. The project is connected in the west to project 4, which connects the German andthe French highspeed networks.
Table 6-40: Specific project 17
Country Measure Length from to Investments inmillion Euro
Germany upgrading/ new line 345 1990 2004 525Austria upgrading/ new line 289 1996 1999 634TOTAL 634 1990 2004 1,159
6.4 Regional Distribution of the Investment in the TEN-T network
Having described the investments by country and mode, the purpose of the following maps isto illustrate where and when particular investments will be implemented.
Map 6-1: TEN-T road links with reported investments

page 86 TEN Invest – Final Report
PLANCO Consulting GmbH Essen, 2003
Map 6-2: TEN-T railway links with reported investments
Map 6-3: TEN-T inland waterway links with reported investments

TEN Invest – Final Report page 87
PLANCO Consulting GmbH Essen, 2003
Map 6-4: TEN-T ports with reported investments
Map 6-5: TEN-T airports with reported investments
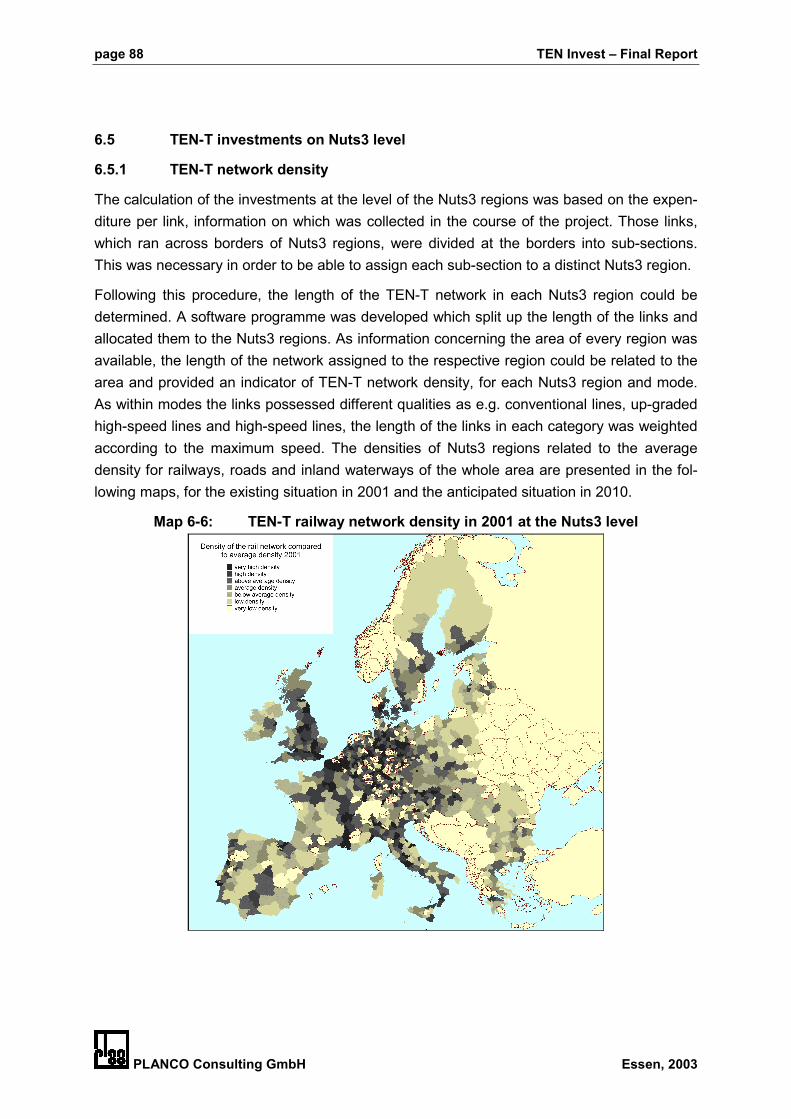
page 88 TEN Invest – Final Report
PLANCO Consulting GmbH Essen, 2003
6.5 TEN-T investments on Nuts3 level
6.5.1 TEN-T network density
The calculation of the investments at the level of the Nuts3 regions was based on the expen-diture per link, information on which was collected in the course of the project. Those links,which ran across borders of Nuts3 regions, were divided at the borders into sub-sections.This was necessary in order to be able to assign each sub-section to a distinct Nuts3 region.
Following this procedure, the length of the TEN-T network in each Nuts3 region could bedetermined. A software programme was developed which split up the length of the links andallocated them to the Nuts3 regions. As information concerning the area of every region wasavailable, the length of the network assigned to the respective region could be related to thearea and provided an indicator of TEN-T network density, for each Nuts3 region and mode.As within modes the links possessed different qualities as e.g. conventional lines, up-gradedhigh-speed lines and high-speed lines, the length of the links in each category was weightedaccording to the maximum speed. The densities of Nuts3 regions related to the averagedensity for railways, roads and inland waterways of the whole area are presented in the fol-lowing maps, for the existing situation in 2001 and the anticipated situation in 2010.
Map 6-6: TEN-T railway network density in 2001 at the Nuts3 level

TEN Invest – Final Report page 89
PLANCO Consulting GmbH Essen, 2003
Map 6-7: TEN-T railway network density in 2010 at the Nuts3 level
Map 6-8: TEN-T road network density in 2001 at the Nuts3 level

page 90 TEN Invest – Final Report
PLANCO Consulting GmbH Essen, 2003
Map 6-9: TEN-T road network density in 2010 at the Nuts3 level
Map 6-10: TEN-T inland waterway network density in 2001 at the Nuts3 level

TEN Invest – Final Report page 91
PLANCO Consulting GmbH Essen, 2003
Map 6-11: TEN-T inland waterway network density in 2010 at the Nuts3 level
The changes induced by the extension of the railway network are concentrated on severalaxis in the Member States. In the Candidate Countries the railway network does not changeintensively, therefore, related to the increased average density, the railway network density inthe Candidate Country decreases, whereas the road network densities increase not only inthe Member States but also in several Candidate Countries. The changes in the inland wa-terway networks are relatively small.
6.5.2 Investments
The investments for complete links were sub-divided accordingly, assigning the share of thelength of sub-sections as a proportion of the total length of the link (e.g., if a link crossed aNuts3 border and 40% of the length was located in region A and 60 % in region B, the linkwas split into two parts, and 40% of the investments of the link was assigned to region A and60% to region B). The investments in links located entirely and partly in Nuts3 regions wereaggregated to give the investment with regard to the different transport modes. In a secondstep, the investments in individual sub-sections and nodes were aggregated at the Nuts3level and related to GDP to present the intensity of the investments. The investments are in1999 prices and therefore the figures are related to the regional GDP for that year. The fol-lowing maps demonstrate the intensity of TEN-T investments at the Nuts3 level in 1999.

page 92 TEN Invest – Final Report
PLANCO Consulting GmbH Essen, 2003
Map 6-12: TEN-T road investment in percentage of Nuts3 GDP 1999
Map 6-13: TEN-T railway investment in percentage of Nuts3 GDP 1999
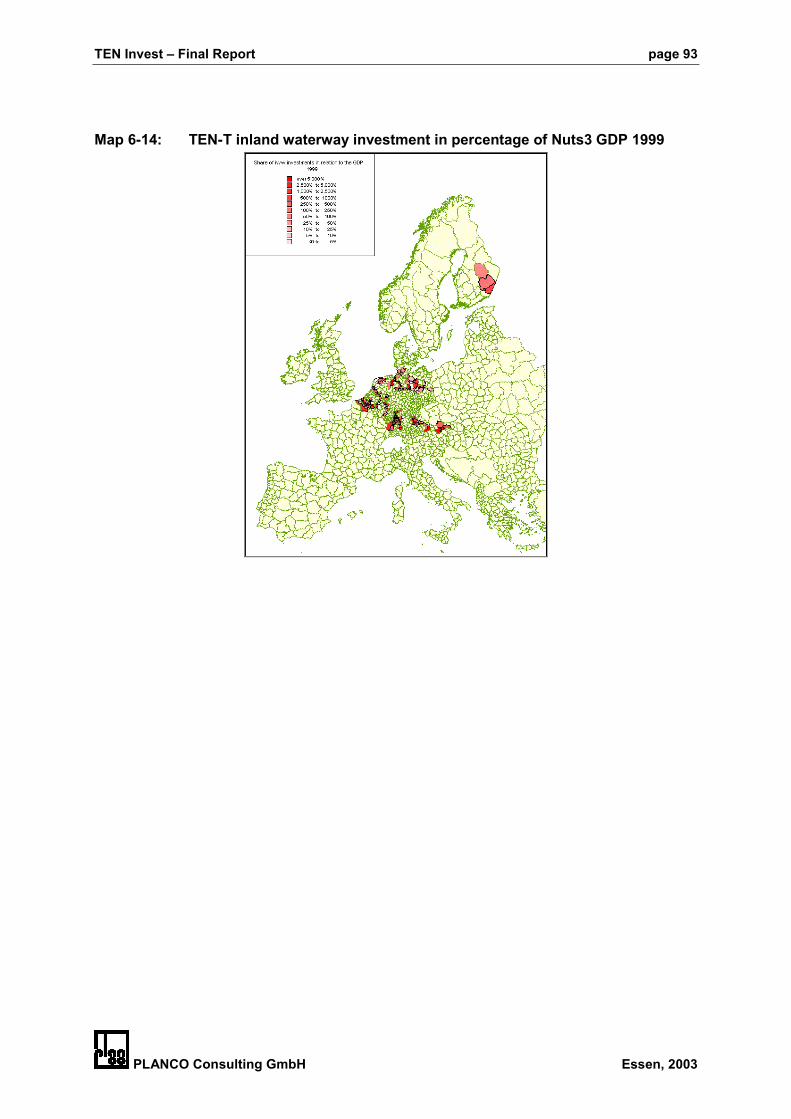
TEN Invest – Final Report page 93
PLANCO Consulting GmbH Essen, 2003
Map 6-14: TEN-T inland waterway investment in percentage of Nuts3 GDP 1999

page 94 TEN Invest – Final Report
PLANCO Consulting GmbH Essen, 2003
7 Sources of Finance
In this chapter the sources of financing for the implementation of the TEN-T network in theenlarged European Union have been reviewed.
For the Member States the financial support from the TEN-budget, the Cohesion Fund aswell as loans from the EIB, which are part of the national budget are available. From 1996until 2001 the TEN-T budget provided 2.8 billion Euro and the Cohesion fund contributed withan amount of 5,2 billion Euro from 1994 –1999. EIB loans totalled 24 billion Euro between1997 and 2001. Hence in total approximately 32 billion Euro have been provided by thesesources between 1994 and 2001.
With regard to the Candidate Countries support from the PHARE, ISPA and the EIB contrib-uted to the implementation of transport infrastructure. In the period of 1993 – 1998 1.8 billionEuro were allocated by the PHARE funds, the financial instrument ISPA is going to allocate atotal amount of one billion Euro between 2000 and 2006. EIB loans designated for transportinfrastructure of the TEN-T added up to 4.8 billion Euro between 1997 and 2001.
The financial sources are described in more detail below.
7.1 Financial support from TEN-T budget (1996-2001)
The financial support from the TEN-T budget provided by the EC is presented in the followingfigure.
Figure 7-1: TEN- T support in million Euro by mode between 1996 and 2001

TEN Invest – Final Report page 95
PLANCO Consulting GmbH Essen, 2003
After a strong increase from 1996 onwards, total TEN-T support reached its peak in the year2000 (576.17 million Euro), which was more than twice the amount spent in 1996. In 2001,support was reduced by 5% compared to the previous year. Between 1996 and 2001 morethan half of the budget was spent on rail projects. If rail traffic management is also included,the share of rail adds up to 58% (1,599.60 million Euro) of the entire TEN-T budget. Thesecond largest share, although substantially lower, was allocated to roads and amounted to13% of the total. An additional 4.9% was spent on road traffic management. The road share(without traffic management) was relatively stable up to 2000, but in 2001 it increased to 15%of the total annual support. If road traffic management is included this figure increased toalmost 20%.
The expenditure supporting the inland waterway network totalled 57.6 million Euro during theperiod 1996 – 2001. This represented approximately 4% of the support for rail or 16% of thatfor road.
Between 1996 and 2001, support for airports and ports amounted to 4 % and 1% of the totalbudget respectively. Expenditure on multi-modal transport was 6.8% of the total in the sameperiod, ranging from a peak in 1997 (15%) to a modest 0.4% in 2001. Global Navigation Sat-ellite Systems (GNSS) have become important in Europe and the GALILEO programme waslaunched jointly by the European Union and the European Space Agency. Support for GNSShas increased substantially and amounted to 20% of total TEN-T support in 2001, making itthe second largest beneficiary.
41% of total TEN-T support was spent on studies while 59% was paid out for projects.
Table 7-1: Total TEN-T support 1996 - 2001 in million Euro per mode
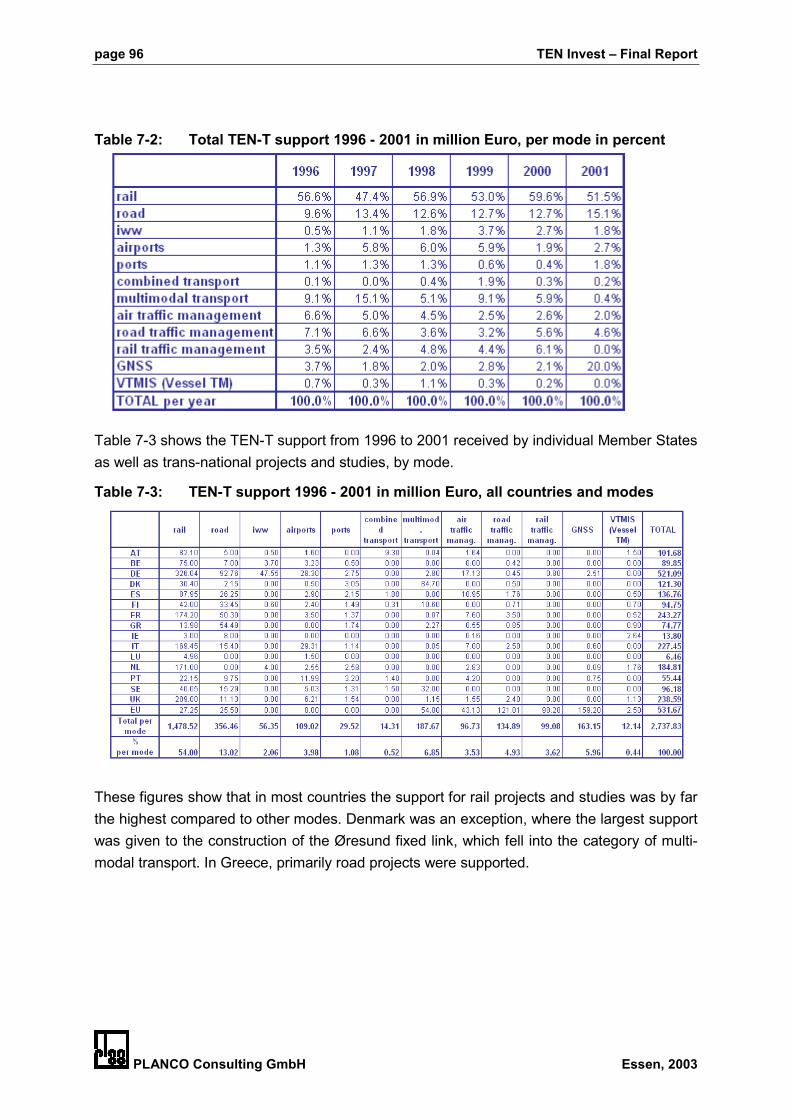
page 96 TEN Invest – Final Report
PLANCO Consulting GmbH Essen, 2003
Table 7-2: Total TEN-T support 1996 - 2001 in million Euro, per mode in percent
Table 7-3 shows the TEN-T support from 1996 to 2001 received by individual Member Statesas well as trans-national projects and studies, by mode.
Table 7-3: TEN-T support 1996 - 2001 in million Euro, all countries and modes
These figures show that in most countries the support for rail projects and studies was by farthe highest compared to other modes. Denmark was an exception, where the largest supportwas given to the construction of the Øresund fixed link, which fell into the category of multi-modal transport. In Greece, primarily road projects were supported.

TEN Invest – Final Report page 97
PLANCO Consulting GmbH Essen, 2003
Table 7-4: TEN-T support 1996 - 2001 in million Euro by country
0 . 0 0
5 0 . 0 0
1 0 0 . 0 0
1 5 0 . 0 0
2 0 0 . 0 0
2 5 0 . 0 0
3 0 0 . 0 0
3 5 0 . 0 0
A T B E D E D K E S F I F R G R
r a i lr o a diw wa i r p o r t sp o r t sc o m b in e d t r a n s p o r tm u l t im o d a l t r a n s p o r ta i r t r a f f i c m a n a g e m e n tr o a d t r a f f i c m a n a g e m e n tr a i l t r a f f i c m a n a g e m e n tG N S SV T M IS ( V e s s e l T M )
Table 7-5: TEN-T support 1996 - 2001 in million Euro, by country
0 . 0 0
5 0 . 0 0
1 0 0 . 0 0
1 5 0 . 0 0
2 0 0 . 0 0
2 5 0 . 0 0
3 0 0 . 0 0
3 5 0 . 0 0
I E I T L U N L P T S E U K E U
r a i lr o a di w wa i r p o r t sp o r t sc o m b i n e d t r a n s p o r tm u l t i m o d a l t r a n s p o r ta i r t r a f f i c m a n a g e m e n tr o a d t r a f f i c m a n a g e m e n tr a i l t r a f f i c m a n a g e m e n tG N S SV T M I S ( V e s s e l T M )
The figures with regard to trans-national activities (EU) reveal that GNSS received the high-est support, followed by road traffic management.
The following map illustrates the share of TEN-T support by mode and country. The largestproportion (19.4%) was spent on multi-national projects. The largest TEN-T support for anindividual Member State was granted to Germany, which received 19% of the total expendi-ture between 1996 and 2001. It was followed by France and the UK, which both receivedapproximately 9%, while Italy benefited with 8%. The Netherlands, Spain and Denmark re-ceived 7% each, while less than 4% was granted to the remaining countries. Ireland andLuxembourg received less than 1% of the total.

page 98 TEN Invest – Final Report
PLANCO Consulting GmbH Essen, 2003
Map 7-1: Share of TEN-T support per mode and country
7.2 Financial Support from ISPA
Besides Phare and Sapard the "Instrument for Structural Policies for Pre-Accession" (ISPA)is one of the financial instruments to assist the Candidate Countries in their preparation foraccession. Between 2000 and 2006, a total amount of 1,040 million Euro a year10 (7,280 mil-lion Euro in total) will be provided for infrastructure projects in the field of transport and envi- 10 1999 price level

TEN Invest – Final Report page 99
PLANCO Consulting GmbH Essen, 2003
ronment. The total costs are estimated at 2.3 billion Euro and will be co-financed by thebeneficiary states and international funding institutions.
Resources have been allocated to the Candidate Countries by the Commission according toa set of criteria, taking into account the specific socio-economic and environmental situation.Table 7-6 shows the ISPA resources by country. Poland was allocated the highest share(30%-37%) followed by Romania (20%-26%).
Table 7-6: ISPA resources by country as decided by the EC (2000 – 2006)
64 transport projects were launched in 2000 and 2001. They focused mainly on the rehabili-tation and construction of roads, motorways and railways, with regard to strategic priorities ofthe TEN-T. Only one project dealt with airports, which was the reconstruction, developmentand extension of the airport of Sofia in Bulgaria.
Half of the estimated total eligible support for transport projects signed in 2000 and 2001concerned rail; 47% was related to roads and 2% to airports. Two projects labelled 'road andrail' made up 0.2% of the total value. These were projects where both modes were involved,namely technical assistance for transport project management in the Czech Republic andsimilar technical assistance support for the Danube bridge in Bulgaria.
Figure 7-2: ISPA signed projects (2000 and 2001), estimated total eligible value permode and total ISPA contribution (changes possible)
Estimated Total Eligible Value3.62%
54.17%
0.16%
42.04%
Airport Rail Rail and Road Road
Estimated Total ISPA Contribution2.06%
50.74%
0.21%
46.99%
Airport Rail Rail and Road Road
The estimated total ISPA contribution per mode reflects more or less the eligible value.Slightly more than 50% was granted for rail and 47% contributed to road projects.

page 100 TEN Invest – Final Report
PLANCO Consulting GmbH Essen, 2003
Concerning the overall distribution of the eligible value and the ISPA contribution as pre-sented in Table 7-7, it is clear that Poland and Romania received the highest support, theformer 855 million Euro and the latter 642 million Euro.
In general, 65% of the estimated total eligible value for transport projects was covered by theestimated ISPA contribution. However, it should be noticed that changes of the figures arepossible due to results of calls for tender.
Table 7-7: Projects signed - per country per (sub) sector (committed between 1/ 1/2000 and 31/ 12/ 2001) in million Euro (changes possible)
7.3 Financial Support from Phare
Phare was the EU's financial assistance programme for the countries of Central and EasternEurope. This included grant financing for investments and restructuring of the transport sec-tor in the ten Candidate Countries in that region (Bulgaria, Czech Republic, Estonia, Hun-gary, Latvia, Lithuania, Poland, Romania, Slovakia and Slovenia).
The Phare financed transport sector programmes in the ten Candidate Countries were exe-cuted from 1991 until the end of 1998. The total budget allocated to these programmes to-talled 905 million Euro, or some 10% of the cumulative Phare budget for the ten countriesover that period.
The modes of transport were classified as follows:
• Road,• Rail,• Air,• Maritime,• Inland Waterways.• Combined Transport, where one mode was necessarily rail, as indicated in the EU Direc-
tives.

TEN Invest – Final Report page 101
PLANCO Consulting GmbH Essen, 2003
• Multiple, which referred to contracts that included more than one mode (usually road andrail).
• All Modes, which referred to contracts (mainly institutional types of output) covering morethan three modes.
The following figures show the contracted amount in 1,000 Euro over the period from 1991 to1998. Concerning the different modes of transport, more than half of the contracted amountfell into the road category (52%). The second largest share (32%) was assigned to rail. Theremaining 16% was allocated to other modes or projects covering more than one mode. Thesmallest share of 0.5% was spent on inland waterways.
Figure 7-3: Total contracted amount 1991-1998 by mode and countryShare of contracted amount
10.6
7.5
1.3
8.4
1.43.4
17.319.5
0.3
28.1
2.2
BulgariaCzech RepublicEstoniaHungaryLatviaLithuaniaPolandRomaniaSloveniaSlovakiaMulti- Country0
50000
100000150000
200000
250000300000
350000400000
450000
500000
1000
Eur
o
Roa
d
Rai
l
Air
Inla
ndW
ater
way
s
Mar
itime
trans
port
Com
bine
dtra
nspo
rt
Mul
tiple
mod
es
All m
odes
Total contracted amount in 1000 Euro
Figure 7-4: Total contracted amount 1991-1998 per country
0
50000
100000
150000
200000
250000
1000
Eur
o
Bul
garia
Cze
chR
epub
lic
Esto
nia
Hun
gary
Latv
ia
Lith
uani
a
Pola
nd
Rom
ania
Slov
enia
Slov
akia
Mul
ti-C
ount
ry

page 102 TEN Invest – Final Report
PLANCO Consulting GmbH Essen, 2003
The distribution of contracted amounts related to the ten Candidate Countries shows thatRomania was granted 19% of the total while Poland received 17%, the highest amounts forindividual countries. However, the highest share (28%) was allocated to multi-country proj-ects. The following figures show the distribution of contracted amounts with regard to themode of transport for the ten Candidate Countries and for multi-country projects.
The tables in Annex 7-1 present the annual distribution of the transport funds allocated bycountry from 1990 until 1998, by budget year and not by actual year of commitment or ex-penditure. The peak of allocated funds was in 1996 when 202.8 million Euro was paid. Theamount then decreased towards the end of the programme. A substantial reduction can beobserved with regard to the budget committed to institution building. Whereas in 1991 60%was reserved for this activity, the share went down to less than 5% in 1998. In total 905 mil-lion Euro were allocated for Phare transport funds, of which 83% was assigned to transportinvestments and the remainder designated for transport institution building.
Table 7-8: Allocation of transport Phare funds by country between 1991 and 1998(million Euro)

TEN Invest – Final Report page 103
PLANCO Consulting GmbH Essen, 2003
7.4 Structural and Cohesion Funds for Transport
In the last programming period (1994-1999) the Structural Funds provided 13.7 billion Eurofor investment into transport infrastructure in Objective 1 regions. About 70% of the moneywas invested in roads, while a 16% was allocated to rail infrastructure. Ports and airportswere supported by 5% respectively 3% of the total sum. 4.5 % are invested into other trans-port related actions such as the development of intermodal transport, public transport as wellas transport studies. With regard to the TEN-T approximately 3.5 billion Euro have been as-signed to the realisation of TEN projects.
The Cohesion Fund supported transport infrastructure projects, which carried out the furtherdevelopment of the TEN-T or enhanced access to it. The Cohesion Funds made available 5billion Euro for the TEN-T network in Ireland, Portugal, Greece and Spain. Almost 70% of thetotal was allocated to road infrastructure, 23% went into railways and ports, while airportsreceived 3% - 5%.11 With regard to rail infrastructure, 4.9 billion Euro were granted. The larg-est loan was given to Italy (2.3 billion Euro). Financial support for airport infrastructure to-talled 3.2 billion Euro. Spain and Greece received the largest loans, which amounted to 888million Euro and 867 million Euro respectively.
Table 7-9: Funding per country in million Euro by the Cohesion Fund (1994 – 1999)
7.5 Financing from the European Investment Bank (EIB)
The European Investment Bank has also supported the financing of transport investments.The tables in Annex 7-1 present the amounts granted by country and by mode in millionEuro, both for the Member States and the Candidate Countries. The figures are based oninformation made available by the EIB.
With regard to the Member States the largest amount was granted to road infrastructure(11.5 billion Euro), followed by loans for railway projects (8 billion Euro). Financial support forairports also played an important role and loans amounted to 3.6 billion Euro. The smallest 11 EC, DG Region: Thematic evaluation of the Impact of Structural Funds on Transport Infrastructures, Final Re-
port, November 2002

page 104 TEN Invest – Final Report
PLANCO Consulting GmbH Essen, 2003
amounts were assigned to air traffic management (22.5 million Euro) and combined transport(13 million Euro). Loans for port infrastructure totalled 822 million Euro between 1997 and2001. Concerning road investments in the Member States, Portugal received the highestamount followed by Greece and France. The largest loan for railways was given to Italy (2.3billion Euro). Support for air traffic management was granted to Belgium and the Nether-lands, while Italy received support for combined transport.
Table 7-10: EIB loans, Member States, in million Euro
The Candidate Countries received 4.8 billion Euro from the EIB in the period from 1997 to2001. Loans were granted mainly for road infrastructure (3.4 billion Euro) and railway proj-ects (1.3 billion Euro). Loans for investments in airports (70 million Euro) and ports (38 mil-lion Euro) were also granted.
Table 7-11: EIB loans, Candidate Countries, in million Euro
For road infrastructure, the largest loan was given to Poland, amounting up to 1 billion Eurobetween 1997 and 2001. The second highest amount was granted to the Czech Republic.For rail infrastructure, loans added up to 1.3 billion Euro in the period from 1997 to 2001. Portinfrastructure was supported to the value of 38 million Euro in the same period. Between1993 and 1996, Latvia received 28 million Euro in total while 35 million were granted to Ro-mania. Bulgaria, Estonia and Lithuania received financial support from the EIB for airportinfrastructure, totalling 70 million Euro between 1997 and 2001. Between 1993 and 1996loans of 135 million Euro were granted for traffic management projects to Bulgaria, Estonia,Romania and Slovakia.

TEN Invest – Final Report page 105
PLANCO Consulting GmbH Essen, 2003
7.6 Sources of Finance according to the Survey
During the data collection procedure the sources of finance have been asked for any projectmentioned. The answers to this request have been not very comprehensive, thus the inter-pretation of the data needs to be treated with cautions. However, the following tables presentthe result of the survey for selected time periods for the Member States and the CandidateCountries.
Table 7-12: Investment according to sources of finance mentioned by the MemberStates (million Euro)
Obviously the major contribution to the projects are financed by national funds, which alsoencompass the loans from the European Investment Bank. Contributions by the CohesionFund as well as by the ERDF have been reported frequently. Other sources of financing playan important role which is getting even more important until the end of the decade.
Table 7-13: Investment according to sources of finance mentioned by the CandidateCountries (million Euro)12
In Candidate Countries other sources of financing have been mentioned very often andreach their peak in the period of 2000/01. EIB loans which are part of the national budgetscontribute to the implementation of the TEN-T in the enlarged European Union. Furthermore,the Cohesion fund is a vital instrument to finance infrastructure investments.
12 Only member States are eligible for ERDF funds in case Candidate Countries mention ERDF funding they
might refer to PHARE and ISPA

page 106 TEN Invest – Final Report
PLANCO Consulting GmbH Essen, 2003
8 Additional investments to achieve the Guidelines 1996
8.1 Targets stipulated in the Guidelines 1996
The targets, which were stipulated for the networks in the Guidelines 1996, were provided bythe Commission and apply to the TEN-T network in the Member States. The Guidelines as-sign a certain railway or road type to each link of the network. Roads are divided into threecategories: ordinary roads, high quality roads or motorways. For railways the types are con-ventional line, up-graded high-speed line or high-speed line. Concerning inland waterwaysthe Guidelines stipulate that all links belonging to the Trans-European Transport networkshould fulfil the requirements of ECMT class IV. Unfortunately these targets were not formu-lated for each individual link. For some Member States, this information is still lacking, whilefor airports and ports target status criteria have not yet been developed. Hence, the addi-tional investments to complete the TEN-T network in the enlarged European Union are esti-mated for road, rail and inland waterways only.
The targets concerning the network in the Candidate Countries have been justified by theexperts from national ministries. In general it is assumed that a TEN-T network in the Mem-ber States and the Candidate Countries should be completed in 2010. The experts also re-ported projects and indicated the type of the link and the year of completion.
8.2 Fulfilment of the Guidelines in 2010
Based on the results of the data collection, the following maps indicate where the networks,which are supposed to exist in 2010, will probably not fulfil the requirements of the TEN-TGuidelines. E.g. no measures have been reported for a conventional rail link which is ac-cording to the Guidelines meant to be an upgraded high speed line operating in 2010. In or-der to achieve the target of the Guidelines measures have to be undertaken. The cost for therespective measures have been approximated on a link by link basis based on the cost esti-mations described in chapter 5 in 1999 prices. Investments expected to be carried out after2010 are not taken into account since the targeted deadline for completion is 2010.
The purpose of the following paragraphs is not to prepare an estimation of the cost neces-sary to qualitatively develop the TEN-T network. The purpose is to indicate where the net-work in spite of the investments mentioned by the ministries in the Member States and theCandidate Countries will not even fulfil the requirements of the TEN-T Guidelines stipulatedin 1996 respectively indicated by the experts of national ministries in the Candidate Coun-tries. Therefore the results can not be compared with cost estimations presented by the TINAreport in 1999 as those calculations comprise rehabilitation measures for the networks andinclude investments in airports, river ports, sea ports and terminals. Furthermore cost esti-mations in the TINA report consider the period between 1999 and 2015.
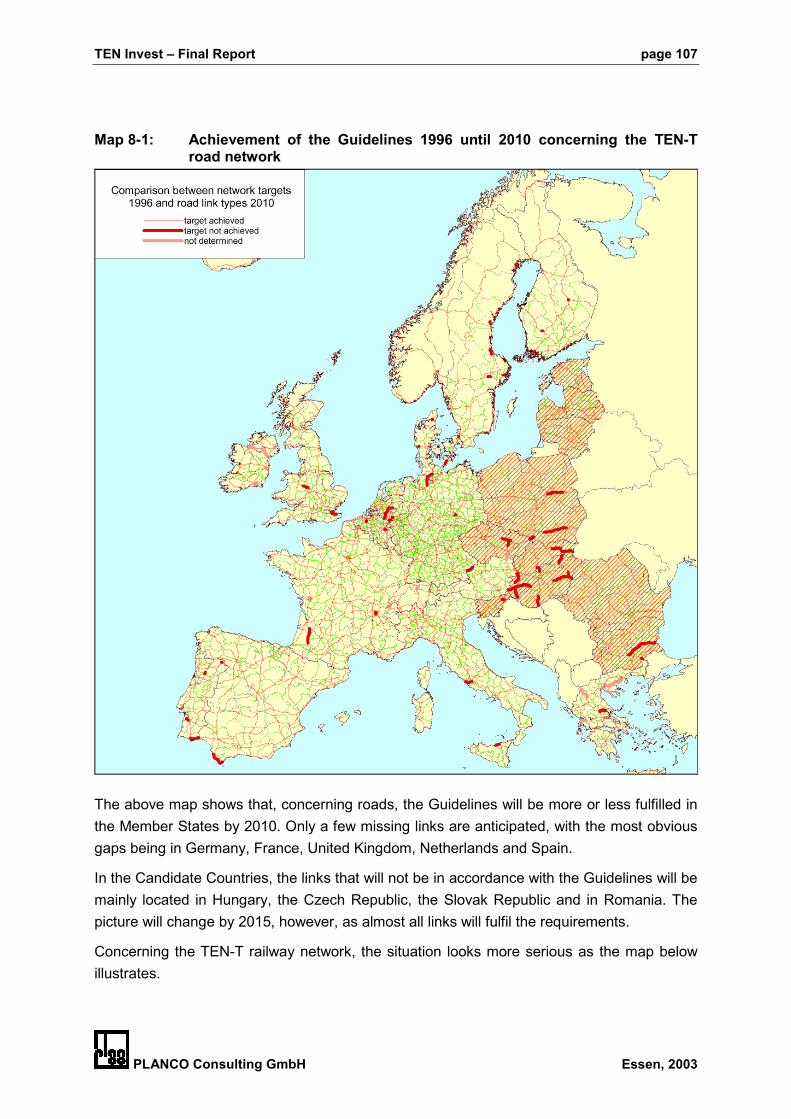
TEN Invest – Final Report page 107
PLANCO Consulting GmbH Essen, 2003
Map 8-1: Achievement of the Guidelines 1996 until 2010 concerning the TEN-Troad network
The above map shows that, concerning roads, the Guidelines will be more or less fulfilled inthe Member States by 2010. Only a few missing links are anticipated, with the most obviousgaps being in Germany, France, United Kingdom, Netherlands and Spain.
In the Candidate Countries, the links that will not be in accordance with the Guidelines will bemainly located in Hungary, the Czech Republic, the Slovak Republic and in Romania. Thepicture will change by 2015, however, as almost all links will fulfil the requirements.
Concerning the TEN-T railway network, the situation looks more serious as the map belowillustrates.

page 108 TEN Invest – Final Report
PLANCO Consulting GmbH Essen, 2003
Map 8-2: Achievement of the Guidelines 1996 until 2010 concerning the TEN-Trailway network
In 2010 a significant proportion of the network will not be in accordance with the require-ments of the Guidelines, comprising mainly the high-speed network in the Member States. Inaddition, in the Candidate Countries, considerable sections will also not comply. However, assome of the projects are likely to be implemented, the situation might be different in 2015,particularly in the Candidate Countries.
This analysis does not consider the quality of existing links. Up-grading requirements, whichdo not influence the status of the link, are not taken into account. Also, some projects areindicated on the map which were included in 1996 but which are no longer valid (e.g. thehigh speed line between Hamburg and Berlin).

TEN Invest – Final Report page 109
PLANCO Consulting GmbH Essen, 2003
The aggregated length of links which do not comply with the requirements of the TEN-TGuidelines 1996 or as reported by the Candidate Countries is presented in the following ta-ble.
Table 8-1: Aggregated length of links which in 2010 do not comply with require-ments of the TEN-T Guidelines 1996 in km
For these links which have to be either constructed or upgraded no investments have beenprovided by our counterparts in the Member States and the Candidate Countries. This lengthcannot be compared with the length mentioned in the TINA report, as rehabilitation measuresare not considered.
Concerning the TEN-T inland waterway network, it is anticipated that most of the links will bein accordance with the requirements of an ECMT class IV.
The cost estimations presented in the previous chapters are used to approximate the expen-diture to fulfil the Guidelines 1996 and the plans of the Candidate Countries. The term re-ported investments refers to the investments provided by the experts of the national minis-tries. The remaining investments refer to those investments which are needed to completethe TEN-T network but have not been mentioned by the experts. They were calculated takinginto account different types of measures based on the cost estimations set out in chapter 5.
Table 8-2: Cost estimation to quantitatively fulfil the requirements of the TEN-TGuidelines of 1996

page 110 TEN Invest – Final Report
PLANCO Consulting GmbH Essen, 2003
The table shows that in the Member States the total investments needed to implement theTEN-T road, rail and inland waterway network adds up to 458 billion Euro. One quarter ofthis sum has not been reported and has to be made available on top of the already decidedinvestments. Regarding the road network 5% of the investments needed have not been re-ported, furthermore, 31% of rail investments and 43% of the inland waterway investmentsneed to be made available additionally.
The investments in the Candidate Countries are estimated using average costs of a group ofMember States (Spain, Portugal, Italy and Greece) as it can be expected that within the pe-riod under consideration the prices in the Candidate Countries will at least become similar tothose in this group of countries. The average unit costs derived from the investments pro-vided by the experts from the ministries in the Candidate Countries are very low and resultfrom relatively few projects.
40% of the investments, which are necessary to implement the TEN-T network in the Candi-date Countries have not been reported. The total sum to construct the network sums up to 77billion Euro. Concerning the different modes of transport 13% of the road investments, 59%of the railway investments and 95% of the inland waterway investments need to be madeavailable in addition to the reported investments.

TEN Invest – Final Report page 111
PLANCO Consulting GmbH Essen, 2003
9 Conclusions
The aim of this study is to bring into knowledge of the Commission detailed technical infor-mation of the status of the TEN-T network, investments that have been made and are fore-seen until 2010 including an outlook ahead to the year 2015. The study includes the MemberStates and the Candidate Countries. The information shall help the Commission to preparethe proposal for revision of the Guidelines in 2004 by estimating the infrastructure cost andthe necessary funds to be made available. The Guidelines 1996 comprises stipulations forthe railway, road and inland waterway networks. To achieve the target to rework the Guide-lines in 2004 this study can be considered as a first step.
In the framework of the study new networks have been constructed based on the informationavailable in the European Commission. The network are constructed on a link by link basisindicating in form of a geographical information system for each link selected information onthe technical status in 1996, 2001, 2010 and as an outlook for 2015.
The information has been collected from the responsible ministries in the Member States andthe Candidate Countries by direct and pro-active contacts with the relevant administrations.A specific data collection approach has been developed and presented already in the incep-tion report. The data collection approach is divided in several steps and based on face toface interviews carried out similar to the Delphi method in at least two waves. The first wavecollects data in each country and is followed by plausibility test and identification of missingdata. Inconsistencies and missing data are the main issue of the second wave of face to faceinterviews as well as the collection of general information contained in studies or other infor-mation material.
An important prerequisite for the success of this data collection approach is the distribution ofrecommendation letters, direct contact to the members of the TEN-T committee and theTINA Senior Official group as well as the preparation by a general questionnaire asking fornational contact persons and other information. Furthermore face to face interviews can suc-cessfully carried out only with the help an interactive data collection tool, which presents theparticipants the network of the country on the screen and permits data input by marking a linkvia predefined input tables. Such a tool “PLANTis” has been developed. “PLANTis” insertsthe data direct to the connected data base. Extra input activities usual in a common datacollection procedure with the help of questionnaires can be avoided. To handle the bulk ofinformation the data have been organised in an Access data base linked to the geographicalinformation presented by “PLANTis”. As the tool is submitted to the European Commissionaccompanied by a detailed and user friendly manual the recommendation is to organise fu-ture data collection as described before and to use the data collection tool. The data collec-tion tool should be established in the Member States and the Candidate Countries to facili-tate periodical updating of the information as requested in Article 18 of the Guidelines.
page 112 TEN Invest – Final Report
PLANCO Consulting GmbH Essen, 2003
The data base handed over to the European Commission contains the selected informationfor each link and each port and airport as far as reported. The updating of the data base canbe concentrated on those links where changes (investments) happened during the periodunder consideration. However, the network constructed so far as well as the information pro-vided for each link should be carefully checked and if necessary corrected. As far as techni-cal information or the start and end names of a link have to be changed no difficulty will oc-cur. The insertion of additional links in the contrary requires substantial knowledge and ef-forts.
The “PLANTis” tool does not only perform as a data collection tool. With the help of “PLAN-Tis” also the available data can be extracted from the data base and presented for a specificlink , a selection of links or for a selected region(country). Investments can be presented yearby year according to modes and regions. This capability of “PLANTis” facilitates the discus-sion with the professionals of the ministries in the Member States and the Candidate Coun-tries as well as the identification of projects of common interest.
The guidelines have to express objectives, priorities and broad lines of measures envisagedin the area of the Trans-European Transport network in a consistent manner. Future guide-lines should distinguish between the existing type and the targeted type of any selected lineand include necessities for rehabilitation of an existing type which will not change the type.Furthermore information and objectives should be related to links or other components of thenetwork. It is recommended that links reflect the geographical and economical situation andare not determined by projects, which happened to be performed at the time the guidelinesare formulated as projects will change in terms of the kind of measure as well as in terms ofthe location.
Concerning ports, airports and terminals objectives should be oriented to interoperabilitycontributions. The capability to act as interconnection point or an intermodal platform shouldform the base to determine whether a port, airport or terminal is considered to be included inthe Trans European Transport network.
To distinguish between different components of the project cost is almost impossible for fu-ture projects as most of the involved experts in the national administrations do not possessthese information. It is recommended to include a certain investment structure to divide thecosts to different planning stages. The same applies for the timeframe of investment duringthe construction period.
The discussion with the experts at the responsible ministries in most of the contacted coun-tries shows that investments can be reported with a certain degree of accuracy only for thefollowing 3 to 4 years. Usually any further commitments depend on the approval of the re-sponsible institutions and can not be published ahead of their decision. Therefore the peri-odically upgrading of the data base is recommended also for the investments.

TEN Invest – Final Report page 113
PLANCO Consulting GmbH Essen, 2003
The preliminary cost estimation identifies that approximately 445 billion Euro have to befunded in order to fulfil the requirements of Decision No 1692/96/EC of the European Parlia-ment and of the Council of 23 July 1996 on Community guidelines for the development of theTrans-European transport network concerning roads, railways and inland waterways in theMember States between 1996 and 2010. 70% of the investments to complete the networkare related to rail infrastructure. Almost 75% of the necessary investments have been re-ported by the Member States and are considered as decided upon. The remaining 25% needto be made available on top of the reported investments.
In the Candidate Countries 76 billion are estimated to realise the TEN-T network between1996 and 2010. Approximately half of the funds are assigned to road infrastructure. 50% ofthe investments have been reported already the other half has to be made available addi-tionally.
Without preconditioning any decisions the following example is supposed to provide an im-pression concerning a future involvement by the European Commission. If it is assumed thatthe EU is financing 10% to 15% of the entire investments remaining from 2004 onwards tofulfil the guideline requirements the European Commission has to provide funds between 24and 36 billion Euro for the current Members States and between 6 and 9 billion Euro for theCandidate Countries. If only the outstanding investments are going to be co-financed 11 bil-lion to 17 billion Euro are needed to support the Member States and 3 billion to 5 billion Euroas assistance to the Candidate Countries.