T cell kinetics in HIV infected children - UCL Discovery · SIV Simian immunodeficiency virus SMM...
300
T Cell Kinetics in HIV Infected Children DELALI KORSIWOR SEFE Thesis submitted to University College London for the degree of Doctor of Philosophy Infectious Disease & Microbiology Unit Institute of Child Health University College London 2011
Transcript of T cell kinetics in HIV infected children - UCL Discovery · SIV Simian immunodeficiency virus SMM...

T Cell Kinetics in HIV Infected
Children
DELALI KORSIWOR SEFE
Thesis submitted to University College London for the degree
of Doctor of Philosophy
Infectious Disease & Microbiology Unit
Institute of Child Health
University College London
2011

2
I, Delali Korsiwor Sefe, confirm that the work presented in this thesis is my own.
Where information has been derived from other sources, I confirm that this has been
indicated in the thesis.

3
ABSTRACT
Infection with Human Immunodeficiency Virus, type 1 (HIV-1) is associated with a
gradual progressive decline in the number of CD4+ T lymphocytes. Effective
treatment suppresses viral replication and is accompanied by a concomitant increase
in the number of CD4+ T cells. Immune reconstitution of CD4
+ T cells in children
following treatment is characterised by a sustained increase of naïve cells, a pattern
that differs from that seen in adults. The aim of this thesis was to explore how these
changes occur. CD4+ T cells in blood samples from HIV-1 infected children were
identified, divided into sub-populations and analysed for apoptosis, proliferation,
activation and differentiation by flow cytometry. Four CD4+ T cell sub-populations,
with varying contributions to the total CD4+ T cell pool were thus identified: (i)
recent thymic emigrants (RTEs) made up the largest population yet maintained very
low levels of proliferation despite increased viral replication and cellular activation,
and were consistently greater in children with undetectable viraemia; (ii) central
naïve cells, which were fairly constant in HIV-1 infected children of all ages
regardless of CD4 count; (iii) CD31- memory cells that increased as CD4 count fell
and (iv) CD31+ memory cells that despite their high level of activation and
proliferation remained a small population across age, viral load and CD4 count.
Treatment interruption and the resulting increased viraemia and decreased CD4
count were associated with only transient changes to the percentage contribution of
each subset, which supports the existence of a setpoint for each subpopulation. This
thesis infers the importance of thymic output in maintaining the CD4 count and
hence the potential for using RTEs in monitoring response to treatment and sheds
light on the role and origin of CD31+ memory cells as a small but highly activated
population that may be important in disease pathogenesis.

LIST OF ABBREVIATIONS
AIDS Acquired immune deficiency syndrome
APC Antigen presenting cell
BALT Bronchus-associated lymphoid tissue
BSA Bovine serum albumin
CDC Centres for Disease Control and Prevention
cPPPT central polypurine tract
CPZ Chimpanzee
CRF Circulating recombinant form
DC Dendritic cell
DN Double negative
DP Double positive
EDTA Ethylenediaminetetraacetic acid
Env Envelope
FCS Foetal calf serum
FLICA Fluorescent inhibitor of caspases
FSC Forward scatter
Gag Group-specific antigen
GALT Gut-associated lymphoid tissue
Gp Glycoprotein
HEV High endothelial vessel
HIV Human immunodeficiency virus
HR Heptad repeat
HSC Haematopoietic stem cell
HTLV Human T-lymphotropic virus
IL Interleukin
IN Integrase
IQR Interquartile range
IRIS Immune reconstitution inflammatory syndrome
LN Lymph node
LTR Long terminal repeat
MALT Mucosa-associated lymphoid tissue

5
MFI Median fluorescence intensity
MHC major histocompatibility complex
mRNA Messenger RNA
Nef Negative regulatory factor
NKT Natural killer T
ORF Open reading frame
Pbs Primer binding site
PBS Phosphate buffered saline
PFA Paraformaldehyde
PIC Pre-integration complex
Pol Polymerase
PPT Polypurine tract
Rev regulator of virion expression
RNase Ribonuclease
Rpm Revolutions per minute
RPMI Roswell Park Memorial Institute
RT Reverse transcriptase
SIV Simian immunodeficiency virus
SMM sooty mangabey monkeys
SSC Side scatter
Tat Transactivator of transcription
TCR T cell receptor
TE Tris EDTA
Tfh T follicular helper
TGF Transforming growth factor
tRNA Transfer RNA
UCHL1 ubiquitin carboxyl-terminal esterase L1
UNAIDS Joint United Nations Programme on HIV/AIDS
Vif virion infectivity factor
Vpr Viral protein R
Vpu Viral protein U

6
CONTENTS
ABSTRACT .......................................................................................................................................... 3
TABLE OF FIGURES ........................................................................................................................... 11
LIST OF TABLES ............................................................................................................................... 14
ACKNOWLEDGEMENTS ..................................................................................................................... 15
CHAPTER 1 GENERAL INTRODUCTION ............................................................................. 17
1.1 THE HIV EPIDEMIC ................................................................................................................. 18
1.2 CD4+ T CELL IMMUNOLOGY .................................................................................................. 20
1.2.1 Generation of CD4+ T cells .......................................................................................... 20
1.2.2 CD4+ T cell circulation ................................................................................................ 23
1.2.3 CD4+ T cell function ..................................................................................................... 25
1.2.4 Numbers of CD4+ T cells during aging ........................................................................ 29
1.2.5 Maintenance of the CD4+ T cell pool ........................................................................... 32
1.3 THE HIV-1 VIRUS ................................................................................................................... 35
1.3.1 Classification of the HIV virus ..................................................................................... 35
1.3.2 Origin of HIV ............................................................................................................... 37
1.3.3 Structure of HIV ........................................................................................................... 38
1.3.4 HIV life cycle ................................................................................................................ 40
1.4 PATHOGENESIS OF HIV INFECTION .......................................................................................... 48
1.4.1 The clinical course of HIV-1 infection ......................................................................... 48
1.4.2 Direct elimination of HIV-1 infected cells by HIV and CTLs ....................................... 51
1.4.3 Indirect elimination of HIV uninfected CD4+ T cells via apoptosis ............................. 52
1.4.4 Apoptosis induced by increased activation during HIV infection ................................ 53
1.4.5 CD4+ T cell depletion in the gut ................................................................................... 55
1.4.6 Bacterial translocation and activation of circulating CD4+ T cells ............................. 57
1.4.7 Role of CD4+ T regulatory cells in HIV pathogenesis.................................................. 60
1.5 HIV INFECTION IN CHILDREN .................................................................................................. 60
1.5.1 Transmission ................................................................................................................ 61
1.5.2 Diagnosis ...................................................................................................................... 61
1.5.3 Clinical course of paediatric HIV-1 infection and pathogenesis.................................. 61
1.6 TREATING HIV INFECTION ....................................................................................................... 63
1.6.1 Anti-retroviral drugs .................................................................................................... 63
1.6.2 Non-antiretroviral agents ............................................................................................. 65
1.6.3 Highly Active Anti-retroviral Therapy ......................................................................... 66
1.7 RESPONSE OF HIV INFECTION TO THERAPY ............................................................................ 67
1.7.1 Response in adults ........................................................................................................ 67
1.7.2 Response in Children .................................................................................................... 68
CHAPTER 2 MATERIALS & METHODS ............................................................................... 71

7
2.1 MATERIALS ........................................................................................................................... 72
2.1.1 Chemicals and solvents ................................................................................................ 72
2.1.2 Tissue culture materials (including plastics) ................................................................ 72
2.1.3 qPCR reagents .............................................................................................................. 72
2.1.4 qPCR probes and primers ............................................................................................ 72
2.1.5 Antibodies ..................................................................................................................... 74
2.1.6 Patient samples ............................................................................................................ 76
2.1.7 Buffer preparation ........................................................................................................ 76
2.2 METHODS ............................................................................................................................... 77
2.2.1 PBMCs ......................................................................................................................... 77
2.2.2 Immunofluorescence methods ...................................................................................... 80
2.2.3 Cell stimulation assay .................................................................................................. 83
2.2.4 Apoptotic cell detection ................................................................................................ 84
2.2.5 Isolation of naïve and memory CD4+ T cells................................................................ 86
2.2.6 DNA extraction ............................................................................................................. 87
2.2.7 Real-time PCR conditions ............................................................................................ 87
2.2.8 Statistical analysis ........................................................................................................ 89
CHAPTER 3 CHARACTERISING CD4+ T CELLS FROM CHILDREN WITH HIV ....... 90
3.1 INTRODUCTION ....................................................................................................................... 91
3.1.1 Identifying CD4+ T cells by flow cytometry ................................................................. 91
3.1.2 Distinguishing between naïve and memory CD4+ T cells ........................................... 91
3.1.3 Sub-populations of memory CD4+ T cells ................................................................... 94
3.1.4 Recent thymic emigrants .............................................................................................. 96
3.1.5 Activated CD4+ T cells ................................................................................................. 97
3.1.6 Proliferating CD4+ T cells ........................................................................................... 99
3.1.7 Apoptosis .................................................................................................................... 101
3.2 METHODS .............................................................................................................................. 103
3.2.1 Blood collection .......................................................................................................... 103
3.2.2 Lymphocyte enrichment .............................................................................................. 103
3.2.3 Flow cytometry ........................................................................................................... 103
3.3 RESULTS ............................................................................................................................... 104
3.3.1 Identifying CD4+ T lymphocytes: density gradient centrifugation ............................ 104
3.3.2 Identifying CD4+ T lymphocytes: red cell lysis .......................................................... 105
3.3.3 Defining CD4+ T lymphocytes as naïve and memory populations by expression of
CD45RA and CD45RO ............................................................................................................. 106
3.3.4 CCR7 and CD27 expression by CD45RA CD4+ T cells ............................................. 108
3.3.5 Defining memory CD4+ Tcells by CD27 versus CCR7 expression ............................ 109
3.3.6 Defining CD4+ T cell subsets with CD45RA and CD31 ............................................. 110
3.3.7 Characterising activated CD4+ T helper cells ........................................................... 112
3.3.8 Investigating Ki67 expression by CD4 subsets ........................................................... 116

8
3.3.9 Characterisation of CD31+ and CD31- CD4+ memory cells ...................................... 118
3.3.10 Flow cytometric detection of apoptotic CD4+ T cells ex vivo and at 24 hours ...... 118
3.4 DISCUSSION ........................................................................................................................... 126
CHAPTER 4 T CELL KINETICS IN A COHORT OF HIV-1 INFECTED CHILDREN .. 134
4.1 INTRODUCTION ..................................................................................................................... 135
4.1.1 CD4+ T cell kinetics ................................................................................................... 135
4.1.2 Effect of HAART on CD4+ T cell kinetics ................................................................... 135
4.1.3 Proliferation as a mechanism of input ....................................................................... 136
4.1.4 Thymic output ............................................................................................................. 137
4.2 RESULTS ............................................................................................................................... 140
4.2.1 Sample characteristics ............................................................................................... 140
4.2.2 Aging is associated with changes to the distribution of CD4+ T cell subsets ............. 140
4.2.3 Patients with detectable viraemia and patients with undetectable viraemia have
different CD4 counts and CD4 subset distributions ................................................................. 143
4.2.4 Levels of Ki67 and HLA-DR expression differ between naïve and memory cells ....... 147
4.2.5 FLICA expression in CD4+ T cells ............................................................................. 150
4.2.6 The absolute CD4+ T cell count is associated with the distribution of CD4+ T cell
subsets and Ki67 expression ..................................................................................................... 153
4.3 DISCUSSION ........................................................................................................................... 158
CHAPTER 5 AN IMMUNOLOGICAL STUDY OF PLANNED TREATMENT
INTERRUPTION IN A COHORT OF HIV-1 INFECTED CHILDREN ................................... 163
5.1 INTRODUCTION ..................................................................................................................... 164
5.2 METHODS ............................................................................................................................. 169
5.2.1 Participants ................................................................................................................ 169
5.2.2 Sample collection and storage .................................................................................... 169
5.2.3 Immunophenotyping ................................................................................................... 170
5.2.4 Analysis ...................................................................................................................... 170
5.3 RESULTS ............................................................................................................................... 173
5.3.1 PTI and CT study populations at randomisation ........................................................ 173
5.3.2 Effect of interrupting and restarting treatment on HIV viraemia and CD4+ T cells
during 1st PTI, 1st restart and CT ............................................................................................ 173
5.3.3 The major influence of PTI is on concentration and not proportions of CD45RA and
CD31 defined subsets ............................................................................................................... 177
5.3.4 HLA-DR expression increases during PTI ................................................................. 180
5.3.5 Ki67 expression increases during PTI ........................................................................ 184
5.3.6 Changes to CD4+ T cell subsets on restarting HAART .............................................. 189
5.3.7 HLA-DR expression decreased on restarting HAART ................................................ 192
5.3.8 Ki67 expression decreased on restarting HAART ...................................................... 196
5.3.9 Early versus late restarters ........................................................................................ 199

9
5.3.10 Serial interruptions ................................................................................................ 201
5.4 DISCUSSION .......................................................................................................................... 206
CHAPTER 6 QUANTIFICATION OF HIV DNA IN CD4+ T CELL SUB-POPULATIONS
214
6.1 INTRODUCTION ..................................................................................................................... 215
6.1.1 The viral reservoir ...................................................................................................... 215
6.2 METHODS .............................................................................................................................. 218
6.2.1 Isolating Naïve and Memory CD4+ T cells ................................................................ 218
6.2.2 Separation of naïve and memory populations and assessment of purity .................... 221
6.2.3 Optimisation of CD4 selection ................................................................................... 223
6.2.4 Assessment of separation frozen PBMCs ................................................................... 225
6.3 DNA EXTRACTION AND PURITY ............................................................................................. 226
6.4 QUANTIFICATION OF HIV DNA ............................................................................................... 227
6.4.1 Aims of assay .............................................................................................................. 227
6.4.2 Introduction to multiplex real-time PCR .................................................................... 227
6.4.3 PDH primer titration .................................................................................................. 230
6.4.4 PDH probe and further primer titration ..................................................................... 232
6.4.5 Standard curve to calibrate assay for cell number ..................................................... 233
6.4.6 Titration of LTR primers ............................................................................................ 236
6.4.7 Titration of LTR probe ............................................................................................... 237
6.4.8 Calibration of HIV copy number ................................................................................ 238
6.4.9 Comparison of 2 QPCR enzyme formulations ............................................................ 239
6.4.10 New HIV-1 target sequences ................................................................................. 241
6.4.11 HIV calibration curve ............................................................................................ 242
6.4.12 Amplification of 8E5 with excess placental DNA .................................................. 245
6.4.13 Detuning the PDH signal ...................................................................................... 247
6.4.14 Dissolving 8E5 DNA in a solution of carrier RNA ................................................ 251
6.5 QUANTIFICATION OF HIV DNA IN CD4 SUBSETS FROM CHILDREN UNDERGOING TREATMENT
INTERRUPTION ................................................................................................................................ 253
6.5.1 Methods ...................................................................................................................... 253
6.5.2 Sample characteristics ............................................................................................... 253
6.5.3 Comparison of HIV-1 DNA concentration in naïve and memory CD4+ T cells ........ 254
6.5.4 Changes in levels of intracellular HIV DNA during treatment interruption .............. 256
6.5.5 Association between CD45RA- T cell HIV DNA concentration and sample
characteristics .......................................................................................................................... 257
6.6 DISCUSSION .......................................................................................................................... 259
CHAPTER 7 GENERAL DISCUSSION .................................................................................. 261
7.1 IMPORTANCE OF THIS STUDY................................................................................................. 262
7.2 RECENT THYMIC EMIGRANTS ................................................................................................ 262

10
7.3 CENTRAL NAÏVE CELLS ......................................................................................................... 263
7.4 CD31+ AND CD31-
MEMORY CELLS ...................................................................................... 264
7.5 THE RELATIONSHIP BETWEEN THE CD4+ T CELL SUB-POPULATIONS ..................................... 264
7.6 THE IMPORTANCE OF THE SET POINT IN HIV-1 INFECTION .................................................... 265
7.7 INTRACELLULAR HIV DNA .................................................................................................. 266
7.8 LIMITATIONS OF THE STUDY .................................................................................................. 266
7.9 FUTURE WORK ...................................................................................................................... 267
CHAPTER 8 APPENDIX .......................................................................................................... 268
CHAPTER 1 PENTA 11 TRIAL SUMMARY ............................................................................... 269
Chapter 2 Aim and Objectives ........................................................................................... 271
Chapter 3 Design ............................................................................................................... 272
Chapter 4 Population ......................................................................................................... 273
Chapter 5 Primary Outcome .............................................................................................. 273
Chapter 6 Secondary Outcomes ......................................................................................... 273
Chapter 7 Follow-up .......................................................................................................... 274

11
TABLE OF FIGURES
FIGURE 1.1 A GLOBAL VIEW OF HIV INFECTION, 2007 ......................................................................... 19
FIGURE 1.2 DIFFERENTIATION PATHWAY OF CD4+ T CELLS ................................................................. 29
FIGURE 1.3 AGE ASSOCIATED CHANGES TO CD4+ T CELL POPULATION AND NAIVE AND MEMORY
SUBSETS ...................................................................................................................................... 31
FIGURE 1.4 MAINTENANCE OF THE NUMBER OF CD4+ T CELLS ............................................................. 35
FIGURE 1.5 PHYLOGENETIC RELATIONSHIP TREE OF PRIMATE LENTIVIRUSES ....................................... 38
FIGURE 1.6 STRUCTURE OF AN HIV VIRION .......................................................................................... 39
FIGURE 1.7 SCHEMATIC REPRESENTATION OF THE HIV-1 GENOME ...................................................... 40
FIGURE 1.8 REPLICATION CYCLE OF HIV .............................................................................................. 48
FIGURE 1.9 GENERALISED COURSE OF UNTREATED HIV-1 INFECTION .................................................. 49
FIGURE 1.10 CHANGES TO PERCENTAGE OF CD4+ T CELLS AND SUBSETS IN CHILDREN RECEIVING
HAART ...................................................................................................................................... 69
FIGURE 2.1 CD4-PECY5 ANTIBODY TITRATION .................................................................................... 81
FIGURE 3.1 ILLUSTRATION OF THE STRUCTURE OF CD45 ...................................................................... 93
FIGURE 3.2 APOPTOSIS PATHWAYS ..................................................................................................... 102
FIGURE 3.3. HISTOGRAM OF CD4 EXPRESSION AND DOT PLOT OF FSC VERSUS SSC .......................... 104
FIGURE 3.4 HISTOGRAM OF CD4 EXPRESSION AND DOT PLOT OF FSC VERSUS SSC ........................... 106
FIGURE 3.5. REPRESENTATIVE DOT PLOT AND HISTOGRAM OF CD45RA AND CD45RO EXPRESSION . 107
FIGURE 3.6 CD45RO EXPRESSION BY CD45RA+ CD4+
CELLS IN HIV-1 INFECTED CHILDREN AND
UNINFECTED ADULTS ................................................................................................................. 108
FIGURE 3.7. COMPARISON OF CD27 AND CCR7 EXPRESSION BY CD45RA+ T CELLS ......................... 109
FIGURE 3.8 CCR7 AND CD27 BOTH DIVIDE CD45RA- CD4+
T CELLS INTO TWO POPULATIONS. ........ 110
FIGURE 3.9 . CO-EXPRESSION OF CD45RA AND CD31 BY CD4+ T CELLS ........................................... 111
FIGURE 3.10 CD45RA AND CD31 DEFINED CD4+T CELLS IN HIV-1 INFECTED CHILDREN AND
UNINFECTED ADULTS ................................................................................................................. 111
FIGURE 3.11. CD38, HLA-DR AND CD69 EXPRESSION ON CD4+ T CELLS ......................................... 112
FIGURE 3.12. EXPRESSION OF CD38, HLA-DR AND CD69 ON CD4+ T CELL S IN CHILDREN AND ADULTS
.................................................................................................................................................. 114
FIGURE 3.13 CD69 EXPRESSION BY STIMULATED AND NON-STIMULATED PBLS ................................ 115
FIGURE 3.14. RELATIVE MEAN FLUORESCENT INTENSITY (MFI) OF CD38 ON CD45RA+ CD4+
T CELLS
.................................................................................................................................................. 116
FIGURE 3.15. KI67 EXPRESSION BY CD4+ T CELLS.............................................................................. 117
FIGURE 3.16 DIFFERENTIAL KI67 EXPRESSION BY CD4+ T CELL SUB-POPULATIONS IN CHILDREN AND
ADULTS ..................................................................................................................................... 117
FIGURE 3.17. CHARACTERISTICS OF CD45RA-CD31+ VERSUS CD45RA-CD31-
CD4+ T CELL SUB-
POPULATIONS ............................................................................................................................ 118
FIGURE 3.18 FLICA EXPRESSION BY LYMPHOCYTES FROM FRESHLY DRAWN BLOOD ......................... 119
FIGURE 3.19. FLICA EXPRESSION BY LYMPHOCYTES IN 24 HOUR OLD BLOOD ................................... 120

12
FIGURE 3.20 COMPARISON OF FLICA EXPRESSION AFTER INCUBATION WITH OR WITHOUT
CAMPTOTHECIN. ........................................................................................................................ 122
FIGURE 3.21 FLICA EXPRESSION OF PBLS AFTER AMMONIUM CHLORIDE RED CELL LYSIS ................ 124
FIGURE 3.22 FLICA EXPRESSION BY CD4+ T CELLS IN WHOLE BLOOD WITHOUT ERYTHROCYTE LYSIS
.................................................................................................................................................. 125
FIGURE 4.1 ASSOCIATION BETWEEN AGE AND CD4 COUNT ................................................................ 141
FIGURE 4.2 RELATIONSHIP BETWEEN AGE AND CD4 SUBSET DISTRIBUTION ...................................... 142
FIGURE 4.7 CO-EXPRESSION BY HLA-DR AND KI67 BY CD4 SUBSETS .............................................. 150
FIGURE 4.8 FLICA EXPRESSION BY CD4+ T CELL SUB-POPULATIONS IN FRESHLY DRAWN WHOLE BLOOD
.................................................................................................................................................. 151
FIGURE 4.9. FLICA EXPRESSION BY CD4+ T CELL SUB-POPULATIONS IN WHOLE BLOOD AFTER 24
HOURS ....................................................................................................................................... 152
FIGURE 4.10 HLA-DR EXPRESSION BY FLICA POSITIVE CELLS ......................................................... 153
FIGURE 4.11. RELATIONSHIP BETWEEN CD4 COUNT AND CD4 SUBSET DISTRIBUTION. ...................... 155
FIGURE 5.1 CHANGE TO THE CONCENTRATION AND PERCENTAGE OF CD4+ T CELLS DURING 1ST
PTI . 174
FIGURE 5.2 CHANGE TO THE CONCENTRATION AND PERCENTAGE OF CD4+ T CELLS DURING TREATMENT
RESTART .................................................................................................................................... 176
FIGURE 5.3 CHANGE IN CD4+ T CELL SUBSET DURING 1ST PTI........................................................... 178
FIGURE 5.4 CHANGE IN CONCENTRATION OF CD4+ T CELL SUBSETS DURING 1ST PTI ........................ 179
FIGURE 5.5 CHANGE IN HLA-DR EXPRESSION BY CD4+ T CELLS AND SUBSETS DURING 1ST PTI ...... 181
FIGURE 5.6 CHANGE IN CONCENTRATION OF HLA-DR + CELLS AND SUBSETS DURING 1ST PTI .......... 183
FIGURE 5.7 CHANGE IN KI67 EXPRESSION BY CD4+ T CELLS AND CD45RA DEFINED SUBSETS DURING
1ST PTI ...................................................................................................................................... 185
FIGURE 5.8 CHANGE IN KI67 EXPRESSION BY CD4+ T CELLS AND CD45RA AND CD31 DEFINED
SUBSETS DURING 1ST PTI .......................................................................................................... 186
FIGURE 5.9 CHANGE IN THE CONCENTRATION OF CD45RA DEFINED KI67+ CELLS DURING 1ST
PTI .... 187
FIGURE 5.10 CHANGE IN THE CONCENTRATION OF CD45RA AND CD31 DEFINED KI67+ CELLS DURING
1ST PTI ...................................................................................................................................... 188
FIGURE 5.11 CHANGE IN CD4+ T CELL SUBSET DURING TREATMENT RESTART ................................... 190
FIGURE 5.12 CHANGE IN CONCENTRATION OF CD4+ T CELL SUBSETS DURING TREATMENT RESTART 191
FIGURE 5.13 CHANGE IN HLA-DR EXPRESSION BY CD4+ T CELLS AND SUBSETS DURING TREATMENT
RESTART .................................................................................................................................... 193
FIGURE 5.14 CHANGE IN CONCENTRATION OF HLA-DR + CELLS AND SUBSETS DURING TREATMENT
RESTART .................................................................................................................................... 195
FIGURE 5.15 CHANGE IN KI67 EXPRESSION BY CD4+ T CELLS AND CD45RA DEFINED SUBSETS DURING
TREATMENT RESTART ................................................................................................................ 197
FIGURE 5.16 CHANGE IN THE CONCENTRATION OF KI67+ CELLS AND CD45RA DEFINED SUBSETS
DURING TREATMENT RESTART ................................................................................................... 198
FIGURE 5.17 COMPARISON OF 'EARLY' AND 'LATE' RESTARTERS CD4+ T CELL SUBSETS DURING PTI AND
TREATMENT RESTART ................................................................................................................ 200

13
FIGURE 5.18 COMPARISON BETWEEN 'EARLY' AND 'LATE' RESTARTERS OF HLA-DR AND KI67
EXPRESSION BY CD4+ T CELLS DURING PTI AND TREATMENT RESTART .................................... 201
FIGURE 5.19 VARIATION OF CD4+ T CELL SUBSETS DURING SERIAL INTERRUPTIONS ......................... 203
FIGURE 5.20 VARIATION IN HLA-DR EXPRESSION DURING SERIAL INTERRUPTIONS .......................... 204
FIGURE 5.21 VARIATION IN KI67 EXPRESSION DURING SERIAL INTERRUPTIONS ................................. 205
FIGURE 6.1 SCHEMATIC ILLUSTRATING THE DYNAMICS OF HIV-1 DECAY UPON INITIATING HAART 216
FIGURE 6.2 PRINCIPLE OF IMMUNO-MAGNETIC SEPARATION WITH MILTENYI REAGENTS ................... 219
FIGURE 6.3 SCHEMATIC OF NAIVE AND MEMORY SEPARATION ........................................................... 220
FIGURE 6.4. FLOW CYTOMETRIC ANALYSIS OF PRE AND POST SEPARATION CD4+ T CELL SUB
POPULATIONS. ........................................................................................................................... 222
FIGURE 6.5 PURITY OF CD4+ CELLS RECOVERED WITH DIFFERENT INCUBATIONS ............................... 224
FIGURE 6.6 PURITY OF NAIVE AND MEMORY CD4+ T CELLS OBTAINED FROM FROZEN PBMCS .......... 225
FIGURE 6.7 PRINCIPLE OF QUANTITATIVE PCR ................................................................................... 229
FIGURE 6.8 AMPLIFICATION PLOTS OF PDH PRIMER TITRATION ......................................................... 232
FIGURE 6.9 TITRATION OF PDH PROBE AND PRIMERS CONCENTRATION ............................................. 233
FIGURE 6.10 AMPLIFICATION PLOTS FOR 10-FOLD DILUTION SERIES OF HUMAN PLACENTAL DNA ..... 235
FIGURE 6.11 STANDARD CURVE OF PDH TEMPLATE QUANTITY ......................................................... 236
FIGURE 6.12 AMPLIFICATION PLOTS OF LTR PRIMER TITRATION ........................................................ 237
FIGURE 6.13 TITRATION OF LTR PROBE CONCENTRATION .................................................................. 238
FIGURE 6.14 AMPLIFICATION PLOTS FOR 4-FOLD DILUTION SERIES OF 8E5 DNA ............................... 239
FIGURE 6.15 QPCR AMPLIFICATION USING QUANTITECT VERSUS BRILLIANT MASTERMIX ................ 240
FIGURE 6.16 AMPLIFICATION PLOTS FOR QPCR REACTIONS WITH EITHER GAG OR LTR PRIMERS ..... 242
FIGURE 6.17 AMPLIFICATION PLOTS FOR 3-FOLD DILUTION SERIES OF 8E5 DNA ............................... 244
FIGURE 6.18 STANDARD CURVE OF PDH AND GAG TEMPLATE QUANTITY .......................................... 245
FIGURE 6.19 AMPLIFICATION PLOTS OF 50 COPIES OF 8E5 COMBINED WITH HUMAN PLACENTAL DNA
.................................................................................................................................................. 246
FIGURE 6.20 TITRATION OF PDH PRIMERS FOR AMPLIFICATION OF 8E5 DNA WITH HUMAN PLACENTAL
DNA ......................................................................................................................................... 249
FIGURE 6.21 PDH AND GAG STANDARD CURVES PRODUCED BY VARIOUS CONCENTRATIONS OF PDH
PRIMERS .................................................................................................................................... 250
FIGURE 6.22 GAG AND PDH STANDARD CURVES PRODUCED FROM 8E5 DNA DISSOLVED IN CARRIER
RNA SOLUTION OR DISTILLED WATER ....................................................................................... 252
FIGURE 6.23 SCATTER GRAPH OF HIV DNA CONCENTRATION IN CD4+ T CELL POOL AND SUB-
POPULATIONS ............................................................................................................................ 255
FIGURE 6.24 CONCENTRATION OF HIV DNA IN CD4+ T CELLS AND SUB-POPULATIONS AT DIFFERENT
TIME POINTS .............................................................................................................................. 256
FIGURE 6.25 CORRELATION BETWEEN CD45RA-CD4+ T CELL HIV DNA CONCENTRATION AND SAMPLE
CHARACTERISTICS ..................................................................................................................... 258

14
LIST OF TABLES
TABLE 2.1 NUCLEOTIDE SEQUENCES OF PROBES AND PRIMERS ............................................................. 73
TABLE 2.2 ANTIBODIES USED IN FLOW CYTOMETRIC ANALYSIS ............................................................ 75
TABLE 2.3 COMPOSITION OF BUFFERS USED .......................................................................................... 76
TABLE 2.4 QPCR REACTION CONDITIONS ............................................................................................. 88
TABLE 4.1 PATIENT CHARACTERISTICS AT TIME OF SAMPLING ........................................................... 140
TABLE 5.1 CHARACTERISTICS OF STUDY POPULATIONS AT RANDOMISATION ..................................... 173
TABLE 6.1 CHARACTERISTICS OF SAMPLE POPULATION FOR HIV DNA QUANTIFICATION .................. 254

15
ACKNOWLEDGEMENTS
First, I would like to thank my primary supervisor Nigel Klein for offering me the
unique opportunity of working on such an exciting project and providing guidance
and direction. Thank you as well to Deenan Pillay for conceiving and directing the
virology component of this PhD.
I am truly grateful to the virology department at the Windeyer, especially Jeremy
Garson, one of the most inspiring people I‟ve ever met, for his endless patience in
supervising me in the lab and teaching me so much about qPCR. I also thank Paul
Grant for allowing me space in his lab, for the kind gift of aliquots of 8E5 cell line
DNA extract and for other materials.
This PhD would not have been possible without the help of our collaborators on
PENTA11, Di Gibbs, Hannah Castro and Anita De Rossi and her lab. Thank you all
for letting me join the project, for assistance with the statistics and for allowing me to
include the Italian cohort data in my thesis.
Throughout my thesis I had the benefit of amazing support, assistance and advice
from an amazing group of fellow PhD students and postdoctoral fellows. Thank you
so much to Iren Bains, Hannah Jones, Marianne Jacobsen, Vania de Toledo and
everyone else for sharing in the joys and frustrations over the years.
I completed my PhD as part of an MBPhD degree so I‟d like to thank Gordon
Stewart for giving me this amazing opportunity and for all his kind advice, help and
guidance over the years. Thank you so much to my fellow MBPhD students and
close friends Marieke Bokhoven, Nicola Wilson, Shao Ong, Abhishek Das and
everyone else who journeyed with me.

16
Finally and most importantly I would like to thank my family especially my father,
Francis Sefe, to whom this thesis is dedicated and without whom none of this would
have been possible. For inculcating in me a desire for knowledge and understanding,
for their countless sacrifices and their constant support and encouragement all the
way I am forever grateful. Thank you.

17
CHAPTER 1
GENERAL
INTRODUCTION

18
1.1 THE HIV EPIDEMIC
The human immunodeficiency virus (HIV) was identified in 1983 and is the causative
agent of acquired immunodeficiency syndrome (AIDS) (Chermann et al. 1983). AIDS
was first described in 1981 when the U.S. Centers for Disease Control and Prevention
(CDC) reported a cluster of Pneumocystis carinii (now Pneumocystis jiroveci)
pneumonia in homosexual men. (CDC 1981) but HIV/AIDS has since become a global
epidemic affecting all areas of society and is now the 6th
leading cause of death
worldwide (WHO 2009).
Since its discovery the prevalence of HIV has increased massively and the joint United
Nations programme on HIV/AIDS (UNAIDS) now estimates that there are 33 million
(30 million-36 million) people living with HIV infection worldwide. Though the
distribution of HIV is global, by far the worst afflicted region is sub-Saharan Africa
with over 20 million infected individuals. This region, which is home to only 10% of
the world‟s population, accounts for 67% of the world disease burden. An even higher
proportion of the total AIDS deaths reported annually come from this region, 72% of
the two million who died from AIDS in 2007 were in sub-Saharan Africa (UNAIDS
2008). The global prevalence is shown in Figure 1.1.
Though HIV was initially described in homosexual men most infections are transmitted
by heterosexual intercourse; contaminated needles and blood products; and from mother
to child, during birth, in utero or via breast milk (Hansasuta and Rowland-Jones 2001).
Indeed globally, women now account for half of all people living with HIV and in sub-
Saharan Africa HIV infected women exceed HIV infected men, making up 60% of the
HIV infected population.
Due mostly to perinatal transmission, HIV is also a significant infection in children. The
2008 „Report on the global AIDS epidemic‟ produced by UNAIDS reported an
estimated 2 million (1.9-2.3 million) children, under the age of 15, living with HIV
19
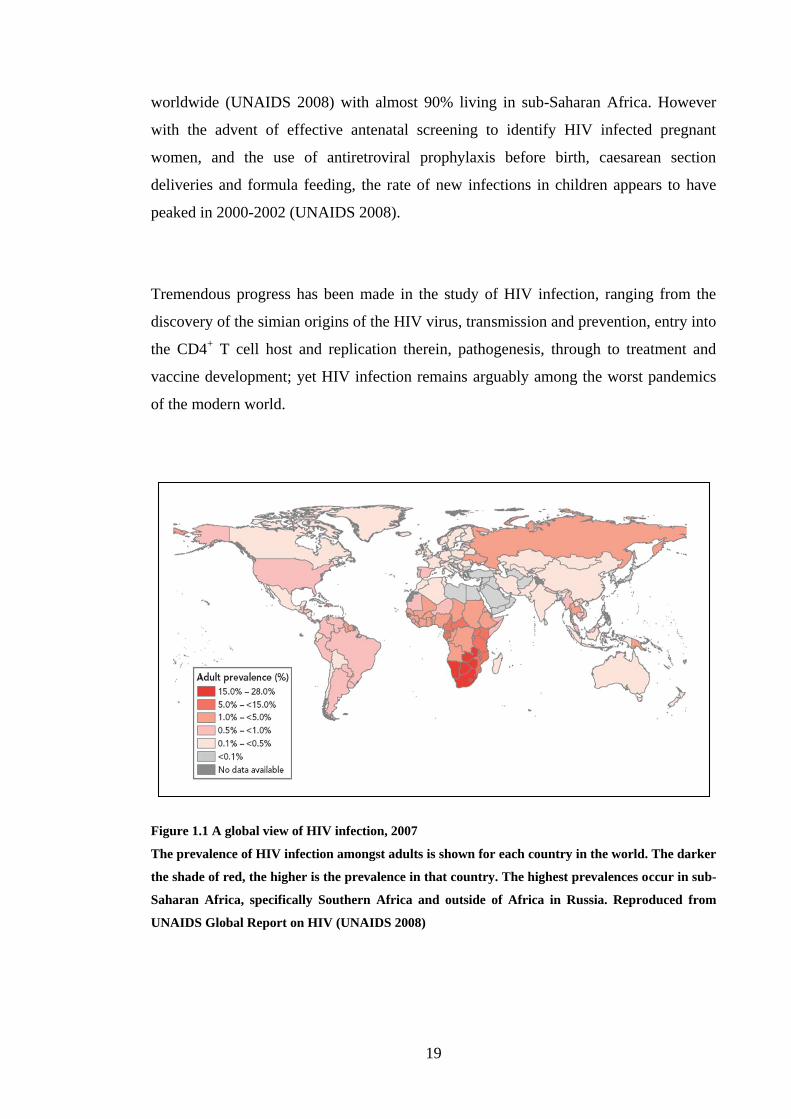
worldwide (UNAIDS 2008) with almost 90% living in sub-Saharan Africa. However
with the advent of effective antenatal screening to identify HIV infected pregnant
women, and the use of antiretroviral prophylaxis before birth, caesarean section
deliveries and formula feeding, the rate of new infections in children appears to have
peaked in 2000-2002 (UNAIDS 2008).
Tremendous progress has been made in the study of HIV infection, ranging from the
discovery of the simian origins of the HIV virus, transmission and prevention, entry into
the CD4+ T cell host and replication therein, pathogenesis, through to treatment and
vaccine development; yet HIV infection remains arguably among the worst pandemics
of the modern world.
Figure 1.1 A global view of HIV infection, 2007
The prevalence of HIV infection amongst adults is shown for each country in the world. The darker
the shade of red, the higher is the prevalence in that country. The highest prevalences occur in sub-
Saharan Africa, specifically Southern Africa and outside of Africa in Russia. Reproduced from
UNAIDS Global Report on HIV (UNAIDS 2008)

20
1.2 CD4+ T CELL IMMUNOLOGY
An understanding of CD4 lymphocyte immunology is important in the study of HIV
pathogenesis because CD4+ T cells are the major target for HIV and disturbance to their
normal homeostasis is central to disease pathogenesis.
1.2.1 Generation of CD4+ T cells
CD4+ T cells are a sub-class of lymphocytes, which also include B cells and other types
of T cells. They are derived from haematopoietic stem cells (HSC), which possess long-
term self-renewal capability. Antenatally, lymphocytes are generated from these stem
cells in the foetal liver, whereas post-natally, the bone marrow is the major source of
haematopoiesis (Abbey and O'Neill 2008), (Kawamoto and Katsura 2009). Some of
these HSC possess the capacity to emigrate to the thymus based on their expression of
the chemokine receptors 7 and 9 (CCR7 and CCR9) (Krueger et al. 2010), in addition to
the stem and progenitor cell markers: KIT (CD117), stem cell antigen 1 (SCA1) and the
growth factor receptor tyrosine kinase FLT3 (Rothenberg, Moore, & Yui 2008). The
unique microenvironment of the thymus allows the HSC to progress through multiple
developmental pathways to develop into a T-cell.
Once in the thymus, the T cell progenitors, characterized as double negative (DN) cells
that lack expression of CD4, CD8, and CD3, progress through four main stages, DN1-
DN4, although in recent years these stages have been further subdivided. The cells
begin by proliferating extensively and switching off genes that would allow
differentiation into non-T-cell lineages (Rothenberg, Moore, & Yui 2008). At the DN1-
DN2 stage of development, Notch receptors on the thymocyte cell surface interact with
their ligands present on stromal cells of the thymus and the ensuing signalling inhibits
non-T cell differentiation, which in combination with interleukin-7 (IL-7) driven
proliferation commits thymocytes to the T cell lineage (Garcia-Peydro, de Yebenes, &
Toribio 2006).

21
Somatic rearrangement of the genes encoding the T cell receptor (TCR) β, γ and δ
chains, which is essential for TCR expression, begins in DN2 cells and is mainly
completed during the DN3 stage, committing thymocytes to either the αβ or γδ T-cell
lineages. During the DN3 to DN4 transition, αβ T cells undergo selection of their β
chain via signalling of the pre-TCR complex, which consists of the TCRβ chain, the
pre-Tα chain, CD3ε, CD3γ, and TCRδ. These signals induce allelic exclusion of the β
chain and promote the survival, proliferation, and differentiation of DN thymocytes to
the double positive (DP) stage of development, where thymocytes express both CD4
and CD8 coreceptors and unique αβ TCRs (Hayday and Pennington 2007), (Taghon and
Rothenberg 2008).
Conventional αβ T cells develop from αβ thymocytes, which begin to express both TCR
co-receptor proteins, CD4 and CD8 thus are referred to as double positive (DP)
thymocytes. DP thymocytes undergo positive and negative selection depending on how
strongly they recognise self antigen. Within the thymic cortex thymocytes showing
moderate recognition of self peptide-major histocompatibility complex (MHC)
complexes are positively selected via TCR signalling that results in RAG gene
repression, long-term survival and progression to the thymic medulla for negative
selection. Negative selection in the medulla is determined by how strongly or weakly
thymocytes recognise self peptide-MHC complexes. Those thymocytes bearing TCRs
with no affinity for self peptide-MHC complexes do not receive TCR signalling and die
from neglect. Thymocytes with strong affinity for the self peptide-MHC complex are
potentially harmful; therefore these undergo programmed cell death, known as
apoptosis. Finally thymocytes that recognise self antigen-peptide weakly receive
appropriate TCR signalling and continue to differentiate (Starr, Jameson, & Hogquist
2003), (Wagner 2006).
Conventional T cells, which express αβ TCRs, are characterised by a polyclonal
repertoire and constitute the majority of T cells. More recently, unconventional subsets
of T cells called innate T cells have been described (Sigal 2005). They are generally
characterised by a more restricted TCR repertoire. Examples of innate T cells include γδ
T cells and natural killer T (NKT) cells. Other characteristics that distinguish

22
conventional versus innate T cells include differential expression of surface markers,
effector functions, and signalling pathway requirements during development (Prince et
al. 2009). Innate T cells do not require differentiation and can exert their effector
functions immediately (de Vries, Cornain, & Rumke 1974). In contrast conventional αβ
T cells exhibit a naïve phenotype and require antigen-mediated activation and
differentiation to exert their effector functions.
TCR signals generated by interactions with class II MHC-peptide complexes are
required for the CD4 αβ T-cell fate, whereas those generated by class I MHC-peptide
complexes are necessary for the CD8 αβ T-cell fate. Accordingly, interaction of DP
cells with MHC class I results in loss of CD4 expression and their maturation into CD8
T-cells, while interaction of DP cells with MHC class II results in loss of CD8
expression and their maturation into CD4 T-cells. Differences in strength, duration,
and/or the number of TCR signals integrated over time are critical factors in
determining the CD4/CD8 T-cell fate decision. A quantitative model for CD4/CD8
lineage commitment, with stronger/longer TCR signals favouring the CD4 lineage and
weaker/shorter signals favouring the CD8 lineage is widely accepted (Singer, Adoro, &
Park 2008). The difference in TCR signalling strength results in differential expression
of transcriptional regulators, which determine CD4/CD8-lineage choice. Accordingly
cells can be forced to change from one lineage to the other by artificially blocking or
lowering lineage specific transcription factors (Rothenberg 2009). The process of T cell
differentiation in the thymus to produce a CD4+ T cell is shown in Figure 1.2.

23
Figure 1.2 Intra-thymic T cell differentiation
The diagram shows development of a CD4+ T cell from a double negative (DN) cell in the cortex,
through the processes of positive selection, where thymocytes in the cortex showing moderate
recognition of self peptide-MHC complexes are positively selected via TCR signalling and then
progress to the medulla for negative selection, where those thymocytes bearing TCRs with no
affinity for self peptide-MHC complexes do not receive TCR signalling and undergo apoptosis.
Reproduced from (Savino 2006).
1.2.2 CD4+ T cell circulation
The CD4+ T cells that survive selection leave the thymus into the peripheral circulation.
They are referred to as naïve cells, as they have not encountered their specific antigen.
Naïve T cells continuously recirculate, trafficking from blood into secondary lymphoid
organs and then back into the circulation.

24
T cell generation and development occur in primary lymphoid organs: bone marrow and
thymus whereas immune responses are initiated in the secondary lymphoid organs,
which include the lymph nodes (LN), spleen and mucosal associated lymphoid tissue
(MALT). MALT comprises bronchial associated lymphoid tissue (BALT) and gut
associated lymphoid tissue (GALT). All secondary lymphoid organs share a similar
basic structure, and are organised to trap antigen from sites of infection, facilitate
antigen presentation and provide the optimum microenvironment for lymphocyte
maturation (Keogan, Wallace, & O'Leary 2006).
Naïve T cells enter secondary lymphoid organs through high endothelial vessels (HEVs)
(Mackay, Marston, & Dudler 1990). To move from the HEV into the lymphoid organs a
naïve cell undergoes a series of adhesion steps mediated by interactions between
proteins on the naïve cell surface and their respective ligands expressed on the
endothelial cell surface.
Within the HEV, naïve cells are subject to vascular shear flow pushing them through the
vessel, however interactions between the selectin CD62 ligand (CD62L) expressed on
the lymphocyte cell surface and peripheral node addressin (PNAd) on HEVs results in
weak tethering that allows the cells to “roll” along the endothelial surface (Denucci,
Mitchell, & Shimizu 2009).
The rolling cells come to a stop when CCR7, expressed by naïve cells interacts with its
ligands, CCL19 and CCL20. The resulting signalling mediates activation of integrins
and firm adhesion to the vascular endothelium. The integrin that is activated depends on
the lymphoid organ. For example in peripheral LN leukocyte function-associated
antigen-1 (LFA-1), also called α1β2 integrin or CD11a/CD18, is important for adhesion
to endothelial intercellular adhesion molecule-1 (ICAM-1) whereas within the Peyer‟s
patches, α4β4 integrin is activated and becomes firmly adherent to mucosal addressin
cell adhesion molecule-1 (MAdCAM-1), which is preferentially expressed in this tissue
(Denucci, Mitchell, & Shimizu 2009).

25
The final step is extravasation or transendothelial migration whereby the naïve cell
passes either between, paracellular, or directly through the endothelial cells,
transcellular, into the lymphoid tissue. This process is thought to be mediated by β1 and
β2 integrins, which interact with endothelial junction integrin ligands such as junctional
adhesion molecules-B and -A (JAM-B and JAM-A), respectively (Denucci, Mitchell, &
Shimizu 2009). Once within the lymphoid tissue naïve cells home to T cell areas. They
spend 12 to 24 hours in T cell areas but typically spend less than a half hour in the
circulation before homing to another lymphoid organ (von Andrian and Mempel 2003),
(Ebert, Schaerli, & Moser 2005).
T cells leave the lymphoid organs and return to the blood stream either in lymph via
efferent lymphatic vessels from lymph nodes and Peyer‟s patches, which ultimately
merge into the blood stream; or directly back into the blood stream from the spleen.
Naïve lymphocytes can live for several months by circulating continuously, receiving
survival signals through low affinity TCR engagement by self peptide-MHC and
through IL-7 receptor (Cyster 2003).
1.2.3 CD4+ T cell function
CD4+ T cells are stimulated to differentiate upon activation by antigen. This occurs
when the peptide specific for the TCR is presented by MHC class II molecules on
antigen presenting cells (APC). Naïve cells by continually trafficking through T cell
areas in lymphoid organs have access to the highest concentration of MHC II
molecules, present on dendritic cells (Weiss and Samelson 2003).
When a T cell recognises foreign antigen bound to MHC II it forms a tight synapse with
the APC at the point of the interaction. Formation of the synapse is associated with
rapid clustering of more TCR molecules binding to antigen-MHC II on the APC and the
accumulation of intracellular signalling molecules within the immunological synapse.
The TCRs form complexes with CD3 molecules. TCR/CD3 triggering is aided by

26
numerous co-stimulatory molecules that bind to complementary molecules present on
the APC. Triggering culminates in an intracellular signalling cascade that results in
differential gene expression and naïve cell proliferation (Weiss and Samelson 2003).
The differentiation pathway that a naive CD4+ T cell embarks on is determined by the
strength of TCR signalling. Strength of signalling is affected by the following: the
length of contact between the TCR and the MHC bound antigen; the number of TCRs
engaged and therefore the antigen density; the frequency of specific antigen presenting
cells and the presence of co-stimulatory molecules such as CD27 and CD28 which act
to lower the signalling threshold. They form part of the TCR complex and are involved
in signalling. Upon TCR ligation, co-stimulatory molecules are upregulated and act to
enhance cell expansion. In the absence of co-stimulatory molecules, T cells that have
received low level TCR input do not survive. Loss of co-stimulatory molecules is
irreversible and indicates T cell terminal effector differentiation. Depending on the
strength of the signalling, TCR triggering can produce three actions. Weak signalling
results in anergic cells that undergo apoptosis. Intermediate signalling produces long
lived memory cells. Strong signalling produces short lived effector cells (Hendriks et al.
2000), (Sallusto, Geginat, & Lanzavecchia 2004), (Lanzavecchia and Sallusto 2005).
Effector CD4+ T cells lack CCR7, which is required for lymph node homing and CD27,
which is involved in T cell activation, and instead express a diverse range of homing
molecules that allow them to migrate to the site of the antigen, such as the gut or skin.
Once the antigen has been eliminated most of the effector cells undergo apoptosis and
die but a small fraction remain as long lived memory cells (Sprent and Surh 2002).
APCs induce naïve CD4+ T cells to differentiate into effector cells, where the effector
subtype is determined by which cytokines are released by the APCs. Similarly, the
effector subtypes are defined by their pattern of cytokine production, which determines
their specific functional capabilities. In general CD4+ effector cells, and their cytokine
products, are involved in regulating other cells of the immune system. The effector
subtypes that are currently recognised, Th1, Th2, TReg and Th17, the cytokines that

27
induce their production, their specific functions and their characteristic effector
molecule profiles are briefly described in (Table 1.1). In addition to these effectors,
transforming growth factor beta (TGF-β)-producing Th3 cells, IL-10-producing TR1
cells, IL-9-producing Th9 cells and T follicular helper (Tfh) cells have also been
proposed as separate lineages. However, they do not have distinct cytokine release
profiles because Tregs also produce TGF-β, and all Th cells are capable of producing
IL-10 under certain circumstances, whereas IL-9 was originally described as a Th2
cytokine, and Th9 cells are developmentally related to Th2 cells (Zhu, Yamane, & Paul
2010).
Subtype Inducers Function Effectors
Th1 IL-12 and IFN-γ mediate cellular immune response to
intracellular pathogens (enhancing
microbicidal activity by macrophages and
cytotoxic cells) and induce delayed-type
hypersensitivity responses
IL-2, IFN-γ,
TNF-α and
TNF–β
(lymphotoxin)
Th2 IL-2 and IL-4 mediate humoral immunity against
helminths and other extracellular
pathogens; play a role in allergic
reactions, help B cells to develop into
antibody producing cells and recruit
neutrophils, eosinophils, and basophils to
sites of infection and inflammation
IL-4, IL-5, IL-9
and IL-13
Th17 TGF-β, IL-6, IL-
21 and IL-23
induction of tissue inflammation and
immune responses against extracellular
bacteria and fungi
IL-17
TReg IL-10 maintain self antigen tolerance by down-
regulating immune response to self and
non-self antigens by controlling
activation and function of CD4+ T cells,
CD8+ T cells and APCs
TGF–β
Table 1.1 CD4+ T cell effector subtypes
The effector lineages known to be derived from naïve CD4+ T cells in the periphery are listed in
their table with the cytokines required to induce their production, their functions and the
characteristic cytokine profiles that define them.

28
Immunological memory refers to the ability of clones of differentiated antigen-specific
CD4+ T cells to persist for considerable time after their specific antigen is no longer
present. Memory cells differ from naïve cells by undergoing expansion faster than naïve
cells in response to specific antigen. Their time to division is faster and therefore they
are able to rapidly produce a much larger response of effector cells.
Memory cells can be distinguished from naïve cells in a number of ways. They are
usually larger, more sensitive to antigenic stimulation and less dependent on co-
stimulation. CD4 memory and naïve cells also have differential expression of several
surface proteins including CD45RA and CD45RO. CD45RA and CD45RO are the high
and low molecular weight isoforms respectively of the leukocyte common antigen,
CD45. CD45 is a protein tyrosine phosphatase, essential for TCR signal transduction
(Hermiston, Xu, & Weiss 2003). CD45RA is expressed on naïve cells and CD45RO on
memory cells, therefore their expression is mostly reciprocal (Terry, Brown, & Beverley
1988) though there is frequently a tiny fraction of antigen primed cells, less than 1% of
CD4+ T cells, that co-express CD45RA and CD45RO (Hamann et al. 1996).
Two functional subsets of memory cells are recognised, central memory cells (TCM) and
effector memory cells (TEM) (Sallusto et al. 2000). Central memory cells are a pre-
effector cell type. They constitute most of the memory T cells present in peripheral
blood. When they encounter their cognate antigen, the interaction causes them to
upregulate certain chemokine receptors including CCR7, which enables them to home
to T cell areas in secondary lymphoid organs. Based on their dominant chemokine
profile of either CXCR3 or CCR4 they can be divided into preTh1 and preTh2
respectively. Within the lymphoid organ preTh1 proliferate and differentiate into Th1
effector memory cells, and preTh2 differentiate into Th2 effector memory cells.
Effector memory cells tend to express activation markers and therefore in this respect
closely resemble effector cells. Like effector cells, they are short lived and do not
express CCR7, migrating instead preferentially from blood to peripheral tissues to
provide a rapid response to pathogens at their point of entry. There they exhibit

29
cytolytic activity or secrete Th1 or Th2 type cytokines. They have short telomeres and
don‟t express telomerase so have reduced capacity to divide. The differentiation
pathway undertaken by naïve cells to produce effector and memory cells is summarised
in Figure 1.3.
Figure 1.3 Differentiation pathway of CD4+ T cells
The diagram shows how the strength of TCR signalling determines the differentiation of T cells.
Adapted from (Sallusto, Geginat, & Lanzavecchia 2004).
1.2.4 Numbers of CD4+ T cells during aging
Throughout aging the proportion of CD4+ T cells in the lymphocyte pool remains more
or less the same. In healthy children (0-18 years) CD4+ T cells make up around 30%-
60% of the total lymphocyte count (Shearer et al. 2003) and in healthy adults 32%-61%
EFFECTOR CELL
Proliferation &
persistence of
the fit
intermediate
ANERGIC CELL
INTERMEDIATE
(NON-
EFFECTOR)
CELL
APOPTOSIS
Intermediate & strong TCR
signalling
CENTRAL
MEMORY
CELL
Strong TCR
signalling
ACTIVATION
INDUCED
CELL DEATH
EFFECTOR
MEMORY
CELL
Persistence
of the fit
effectors
Secondary
activation &
differentiation
NAÏVE CELL
PERIPHERY
LYMPHOID ORGANWeak TCR
signalling

30
of lymphocytes are CD4+ cells. In adults this translates to a median absolute count of
885 cells/µl of blood (493 - 1666) (95% reference range in parenthesis) (Santagostino
1999). However in children the normal range for absolute cell counts decreases with
age. Up to 2 years of age the median CD4 count is around 2000 cells/µl and from 12-18
years it is around 800 cells/µl (Shearer et al 2003). Body size increases with age and so
does the total circulating blood volume. Therefore even though the concentration of
CD4+ T cells decreases the total body number of CD4
+ T cells increases for the first 5
years and then remains fairly constant at around 3 x 10¹¹
cells (Hazenberg et al. 2004).
The composition of the CD4+ T cell pool also changes with aging. At birth over 90% of
CD4+ T cells in cord blood express CD45RA, which is expressed by naïve cells
(Persaud et al. 2000). With increasing age, and therefore greater exposure to antigen,
more naïve cells differentiate into effector and memory CD4+ cell types. Thus the
concentration of naïve cells drops steeply within the first 8-12 years of life (Shearer et al
2003). However, the total body number of naïve cells has been demonstrated to increase
for the first five years (Hazenberg et al 2004). Measurement of CD45RO expression has
shown that though the proportion of memory cells varies greatly amongst individuals,
by age 18 years it has increased from less than 5% at birth to around 40% (Shearer et al
2003). From age 18 onwards, the proportion of memory CD4+ T cells increases slightly
with age but this increase is only statistically significant after age 70 years (Naylor et al.
2005). A regression model of the absolute counts and relative frequencies of CD4+ T
cells and CD45RA+ and CD45RO
- subsets is shown in Figure 1.4.

31
% o
f CD
3+
CD
4+
Age (years)
Figure 1.4 Age associated changes to CD4+ T cell population and naive and memory subsets
The graphs show a continuous exponential regression model of absolute size of the CD4+ T cell pool
as well as relative frequencies of the memory (CD3+CD4
+CD45RO
+) and naïve subset
(CD3+CD4
+CD45RA
+). The left y-axis shows the absolute cell count [cells/μL] of the considered
population (green) and the right y-axis shows the relative frequencies, as a % of CD4+ T cells (red).
The thickest curve indicates the predicted value, the middle width curve indicates the upper and
lower limit of a 90% confidence level of the predicted value and the thin curve a 95% confidence
interval. Reproduced from (Huenecke, Behl, & Zimmerman 2008).

32
1.2.5 Maintenance of the CD4+ T cell pool
Turnover reflects the rate at which cells within a population are replaced. T cell
turnover is a function of cell production, which is a combination of thymic export and
peripheral proliferation, and cell loss, through death or change of phenotype. Turnover
is dynamic so both input and loss occur simultaneously. If the rate of input and output
are equal, the size of the population remains constant. This is referred to as steady-state
replacement. As mentioned previously the total body number of CD4+ T cells increases
for the first 5 years of life and thereafter is relatively constant. This would suggest that
initially processes of input exceed output but after 5 years of age, input and output from
the total T cell pool are balanced. If the rates of input and loss to the system are high a
slight increase or decrease in either produces an exaggerated effect on the population
size.
The rates of proliferation and disappearance have been estimated in vivo using isotope
labelling techniques to measure DNA synthesis and loss (Macallan et al. 1998), (Neese
et al. 2001). Briefly, subjects are either given an intravenous infusion of deuterated
glucose ([6,6-2H2]glucose) or an oral dose of deuterated water (
2H2O). Therefore DNA
synthesised during the labelling period will incorporate deuterium, which is heavier
than the common hydrogen isotope because its nucleus contains a neutron. Blood is
sampled during and after the labelling period, then the cell population of interest is
isolated, the genomic DNA is extracted and further processed to isolate the
deoxyribonucleosides. The deoxyribonucleosides are subjected to gas chromatography-
mass spectrometry to measure the heavy isotope enrichment. The ratio of the heavy to
common isotype provides the fraction of newly synthesised DNA and therefore new
cells during the period. Thus the rate of accumulation and subsequent decay of the label
from a sample of DNA from the cell population of interest can be used to calculate
proliferation and disappearance from the population. Measurements have been made in
healthy young adults for naïve and memory T cells (Macallan et al. 2003), for T cell
memory subsets (Macallan et al. 2004), in the elderly for naïve and memory T cells
(Wallace et al. 2004) and also in HIV infected adults (Hellerstein et al. 1999).
Unfortunately it has not been possible to similarly determine rates of turnover in young
children.

33
From eight healthy adults the average rates of proliferation and disappearance for naïve
(CD45RA+) and memory (CD45RO
+) CD4
+ T cells were estimated to be 0.6%/day and
7.3%/day, and 2.7%/day and 7.4%/day, respectively (Macallan et al 2003). In healthy
adults there is no net change in the CD4+ T cell population size with time, yet for both
naïve and memory cells, the rate of disappearance from the population exceeds the rate
of proliferation. At present there are two key explanations for this discrepancy. Mohri
argued that this reflects the presence of a significant input from the thymus (Mohri et al.
1998). However, the large discrepancy in rates implies that thymic production must
contribute 10 times more cells than peripheral proliferation. This does not appear to be
compatible with studies showing that the contribution of peripheral proliferation is
increasingly important with age and exceeds the contribution of thymic production in
the maintenance of the naïve CD4+ T cell pool, even in young children (Kohler et al.
2005), (Berzins, Boyd, & Miller 1998), (Hazenberg et al 2004), (Bains et al. 2009). In
terms of absolute numbers, this argument requires the export of some 1010
cells per day
by the thymus. Thymic export is difficult to measure explicitly, however, current
estimates are of the order of 108 T cells per day (Haynes et al. 2000). A second
explanation is to recognise that the interpretation of in vivo labelling studies is
confounded by heterogeneity within the T cell population (Asquith et al. 2002). Label is
made available to the entire population of cells, thus it is possible to estimate an average
rate of proliferation for the entire population. However, only the rate of disappearance
of labelled cells is measured hence the estimate is biased towards the rate of loss of
rapidly proliferating cells. It is expected that recent proliferation would correlate with a
higher probability of death therefore rates of proliferation, rather than disappearance,
may likely give a better estimate of average population turnover (Bains et al 2009).
The mechanisms governing T cell homeostasis are poorly understood but it is observed
that under steady state conditions both the naïve and memory CD4+ T cell
compartments slowly turnover, in a seemingly antigen independent manner (Macallan et
al 2004). Interestingly, the rates of turnover do not appear to be changed from early
adulthood (mean age 26) to old age (mean age 76) (Wallace, 2004). Naïve CD4+ T cells
have an inter-division time of approximately 1 year, which is significantly longer than

34
the shorter-lived memory population; the inter-division time is identified as 15 and 48
days for TEM memory CD4+ T cells, CD45RO
+CCR7
-, and TCM memory CD4
+ T cells,
respectively. The rate of turnover of TEM is more than double that of TCM which would
suggest that TEM cells are short-lived and require a higher rate of replacement to
maintain their numbers.
However, the rate of CD4+ T cell turnover appears to change during HIV infection.
Stable isotope studies in HIV-1 infected and uninfected adults have shown that the half-
life of CD4+ T cells in HIV infection is one-third as long as in uninfected controls and is
not compensated for by increased production. The HIV-1 infected subjects commencing
HAART was associated with an increased rate of production of CD4+ T cells but not a
longer half-life of circulating cells. These results suggest that HIV associated CD4+
lymphopenia may be due to shortened survival time and failure to increase the
production of circulating CD4+ T cells.
The heterogeneity in the average rate of replacement of cells within the sub-populations
of CD4+ T cells likely reflects the different mechanisms that maintain naïve T cell
diversity and are responsible for the long-term survival of T cell memory. It has been
shown that survival of the naïve T cell compartment is dependent upon contact with IL-
7 (Tan et al. 2001) as well as low affinity recognition of self-peptide MHC molecules
(Takeda et al. 1996) (Tanchot et al. 1997), whereas, CD4+ memory is largely
maintained by a combination of IL-7 and IL-15 and does not appear to require IL-2,
TCR signalling or co-stimulatory molecules such as CD28. Adoptive transfer of naive
cells into T cell deficient hosts have been useful for studying the process of homeostatic
division and investigating the importance of the size of the T cell niche and space
available. However, the dividing cells rapidly convert to memory phenotype and it is
therefore thought that this is a better model of lymphopenia-induced proliferation than
the homeostatic mechanisms that drive division during steady-state (Min et al. 2003)
(Surh and Sprent 2008). The processes that maintain the number of CD4+ T cells are
summarised in Figure 1.5.

35
Cells being lost from the naïve pool are an additional source of input to the memory
population by undergoing immune activation and differentiating into memory cells, thus
the rate of activation within this naïve pool will in part determine the rate of appearance
of new cells into the memory pool.
Figure 1.5 Maintenance of the number of CD4+ T cells
Processes that contribute to maintenance of the CD4+ T cell concentration are shown.
1.3 HIV VIROLOGY
1.3.1 Classification of HIV
HIV belongs to the retrovirus family, a group of viruses with a plus sense RNA genome,
which replicate through a DNA intermediate with the help of a viral RNA-dependent
DNA polymerase. The earliest retroviruses studied were isolated from birds and were
associated with tumours in the host animal. The first human retrovirus, human T cell
Lymphotropic virus (HTLV), was discovered in 1980 by Gallo et al. (Poiesz et al.
1980). There are currently 5 known human retroviruses, HTLV-I, HTLV-II, HTLV-V,
HIV-1, and HIV-2. Both HIV type 1 (HIV-1) and HIV type 2 (HIV-2) cause AIDS.
THYMUS
NAÏVE
CELLS
MEMORY
CELLS
LYMPHOID
ORGANS
Thymic output
Activation &
Proliferation
Lymphocyte
Migration
Proliferation Proliferation
DeathDeath

36
However HIV-1, on which this work is focussed, is the more virulent type and accounts
for 90% of the entire global disease burden.
Initially retroviruses were divided into three genera based on their pathogenesis:
oncoviruses, spumaviruses and lentiviruses (Buchschacher 2001). Oncoviruses are
associated with tumourigenesis in both animals and humans. The human retroviruses,
HTLV-I, HTLV-II and HTLV-V, are oncoviruses associated with adult T cell
leukaemia. Although other oncogenic viruses, such as Epstein-Barr Virus (EBV), which
can cause Hodgkin's disease, Burkitt's lymphoma and nasopharyngeal carcinomas are
known, they differ from oncoviruses in that they cause cancer indirectly via
immunosuppression whereas oncoviruses cause cancer directly by inserting viral
oncogenes into the host genome or enhancing oncogenes already present in the host
genome (Butel 2000).
Spumaviruses, also called foamy viruses because they produce a foamy appearance in
cultured cells, are highly cytopathic in vitro. However there is currently no evidence of
pathogenesis in humans or animals though infections are common in both (Switzer et al.
2005).
The last retrovirus genus, „lentivirus‟, literally means „slow virus‟; and these viruses
were so called because the course of infection was characterized by a long interval
between initial infection and the onset of serious symptoms. HIV is the only human
member of lentivirus group. Other members are the animal immunodeficiency viruses
such as the simian immunodeficiency viruses (SIV), which infect monkeys and
chimpanzees.
Based on phylogenetic analysis of the nucleotide sequence of the env gene HIV-1
strains have been divided into three groups: M, N and O. M is the most prevalent,
globally it accounts for over 95% of HIV-1 isolates. Currently Group M is further
subdivided into nine clades A, B, C, D, F, G, H, J and K (including the sub-subtypes

37
A1, A2, A3, A4, F1 and F2). The most prevalent are clades B (found predominantly in
North America and Europe), A and D (found mainly in Africa), and C (found mainly in
Africa and Asia) Recombination between and within the clades produces recombinant
strains called circulating recombinant forms (CRFs). 18% of the global HIV burden is
due to CRFs most of which are recombinations with clade A viruses (Taylor et al.
2008).
1.3.2 Origin of HIV
Disputes about the origins of HIV were finally settled at the turn of this century and it is
now generally agreed that HIV arose from its close Lentivirus relative, Simian
Immunodeficiency Virus (SIV), by cross species transmission (zoonotic transmission)
(Sharp et al. 2001). In nature, SIV infection is common in many catarrhini, old world
monkeys and apes, such as the African green monkey, sooty mangabeys and
chimpanzees though some catarrhini simians such as macaques are not natural
reservoirs. In contrast new world monkeys, platyrrhini, do not seem to be natural
reservoirs of SIV. Within their natural hosts, SIV viruses are generally not pathogenic
but have been shown to be pathogenic in other species. When macaques are inoculated
with SIV from sooty mangabey monkeys a pathogenic infection is observed (Lewis et
al. 1992). Isolates of SIV have been shown to infect human CD4+ T cells, monocytes
and macrophages, as does HIV itself (Grimm et al. 2003).
HIV-1 and HIV-2 probably arose from different SIV lineages since each is more closely
related to a particular SIV than to each other. Thus it is believed that SIV from
chimpanzees (SIVCPZ) in southern Cameroon and SIV from sooty mangabey monkeys
(SIVSMM) in west-central Africa were responsible for the introduction of HIV-1 and
HIV-2 respectively, into the human population. The differing simian origins of HIV-1
and HIV-2 were elucidated by reconstructing the phylogenetic relationships among the
many strains of HIV-1 and HIV-2, as well as related SIV strains. A simplified
phylogenetic relationship trees for primate lentiviruses (derived from pol sequences),
which place the two HIV types in different SIV lineages is shown in Figure 1.6.

38
There was some controversy in the 1990s that SIV was introduced from its primate host
into the human population in east-central Africa during the 1950s by an oral polio
vaccine that was contaminated with SIVCPZ. This was mostly discredited because
molecular clock analysis, which uses models of HIV-1 sequence evolution, place the
HIV-1 group M ancestor earlier than 1940 with 95% certainty. It is more widely
accepted that SIV entered the human population from the practice of hunting and eating
monkeys as bushmeat in central Africa. In this region primate species including
chimpanzees and sooty mangabey monkeys are routinely killed for food. It is thus very
plausible that during the butchering or perhaps eating of poorly cooked bush meat
people were exposed to blood or other primate secretions (Sharp et al 2001).
SIVCPZ
HIV-2 subtype B
HIV-1 group M
HIV-1 group N
HIV-1 group O
HIV-2 subtype A
SIVSMM
HIV-2 subtype D
Figure 1.6 Phylogenetic relationship tree of primate lentiviruses
Diagram shows interspersion of the HIV-1 and HIV-2 groups around SIVCPZ. Horizontal distances
indicate genetic separation between strains. CPZ= chimpanzee, SMM= sooty mangabey monkey.
Adapted from (Sharp et al 2001).
1.3.3 Structure of HIV
The structure of the HIV virus (Turner and Summers 1999) consists of a nucleic acid
core, encapsulated by a capsid consisting of 2,000 copies of the viral protein, p24 as
shown in Figure 1.7 . Enclosed within the capsid are the enzymes integrase and reverse
transcriptase and other viral proteins. Around the capsid is another protein casing called

39
the matrix. The viral enzyme protease is present within the matrix. Around the matrix is
an envelope derived from the host cell plasma membrane, acquired when the virus buds
through the cell membrane. Embedded in the envelope are the viral glycoproteins,
gp120 and gp41. The core contains two copies of the single stranded RNA genome,
arranged as a dimer.
Figure 1.7 Structure of an HIV virion
The diagram shows the organisation of the HIV virion The lipid membrane, also known as the
envelope, is derived from the host cell plasma membrane. Reproduced from (CDC 2008)
Compared to other viruses the HIV-1 genome is relatively small. Shown schematically
in Figure 1.8 it is approximately 9 kilobases (kb) and contains only 3 open reading
frames (ORFs), which are common to all retroviruses: gag, pol and env. These ORFs
are flanked by long terminal repeats (LTRs), sequences of repeated nucleotides
generated during reverse transcription and found at the ends of viral DNA (the
provirus). They regulate synthesis of viral RNA.
Capsid
RNA
Matrix
Lipid Membrane
gp120
gp41
Reverse
Transcriptase

40
Gag (group specific antigen) encodes the precursor protein, gag, which is cleaved to
give the internal major structural proteins of the virus: matrix, capsid, nucleocapsid and
p6 proteins. Pol (polymerase) encodes the viral enzymes protease, reverse transcriptase
and integrase. Env (envelope) encodes the precursor (gp160) of the viral envelope
proteins gp41, also called transmembrane protein, and gp120, also called surface protein
14.
In addition to these, HIV also expresses the regulatory genes tat and rev that are
essential for viral replication, and the accessory genes vif, vpr, vpu and nef. The
accessory genes function to make the host biology promote the virus life cycle and are
important in determining the virulence of the virus (Nielsen, Pedersen, & Kjems 2005).
Figure 1.8 Schematic representation of the HIV-1 genome
Schematic representation of the HIV-1 provirus. Gag, group specific antigen; Gag-Pol, group
specific antigen-polymerase; Env, envelope; Tat, trans-activator of transcription; Rev, regulator of
expression of virion proteins; Nef, negative effector; Vif, virion infectivity factor; Vpr, viral protein
r; Vpu, viral protein u; LTR, long terminal repeat. Reproduced from (Nielsen, Pedersen, & Kjems
2005).
1.3.4 HIV life cycle
First, HIV must enter the body. This can occur in infected sexual secretions at epithelial
surfaces lining the genital tracts or it can be introduced directly into the bloodstream by

41
blood transfusions, contaminated needles and during childbirth. Infection is far more
likely if HIV is introduced directly into the blood stream than from exposure of
epithelial surfaces to infected sexual secretions. Either way the virus can be carried as
free virions in blood or lymph or bound to dendritic cells until it reaches a target cell,
where the complex HIV replication cycle then occurs.
1.3.4.1 Viral entry and uncoating
Entry into target cell is via binding of the viral glycoprotein gp120 to CD4 on the host
cell surface (Dalgleish et al. 1984), (Klatzmann et al. 1984). As was shown in Figure
1.7, gp120 is the surface subunit and is bound to the transmembrane protein gp41 in a
trimeric arrangement, 3 pairs of gp120-gp41 structures together. Gp41 contains two
amphipathic helical domains, heptad repeat-1 and heptad repeat-2 (HR1 and HR2), and
a fusion peptide. Binding to CD4 causes a conformational change in the structure of
gp120, which exposes the co-receptor binding sites. Co-receptor binding results in a
conformational change to gp41 allowing HR2 and HR1 to interact with each other to
form a stable six helix bundle structure. This produces a fusion pore and HIV enters the
cytoplasm leaving the viral envelope at the cell surface behind (Jones, Korte, &
Blumenthal 1998).
Evidence that CD4 alone is not sufficient for viral fusion came from attempts to infect
murine cells expressing human CD4; although HIV was bound the cells did not become
infected (Ashorn, Berger, & Moss 1990). Additionally HIV isolates derived from T
cells could not infect monocytes or macrophages and vice versa, suggesting the
existence of multiple co-factors that must be cell type specific (Gartner et al. 1986). The
first co-receptor identified was CCR5, previously known as fusin, which is used
preferentially by T cell line-tropic HIV isolates (Feng et al. 1996). Subsequently the co-
receptor used by macrophage-tropic isolates was found to be C-X-C motif chemokine
receptor four (CXCR4), previously known as CCKR5 (Alkhatib et al. 1996). The
chemokine receptor used as a co-receptor by a virus is determined by the V3 loop of its
gp120 but most commonly, CCR5 and CXCR4 are used (Markovic and Clouse 2004).
CCR5 is the co-receptor used by primary isolates at the beginning of HIV-1 infection
and individuals with a 32-base pair deletion in the CCR5 gene (Δ32) have been shown

42
to be highly resistant to infection by primary HIV-1 isolates (Kostrikis et al. 1999).
During later stages of HIV infection mutations by viral isolates allow them to use
CXCR4 as a co-receptor (Bahbouhi, Landay, & Al-Harthi 2004).
The requirement for CD4 and a co-receptor limits the tropism of HIV to thymocytes,
CD4+ T lymphocytes, macrophages, CCR5
+ dendritic cells and glial cells of the nervous
system (Poveda et al. 2006). For successful entry, multiple receptors and co-receptors
must be recruited therefore CD4+ T cells are the main target cells for HIV because they
are more abundant and have a higher surface density of CD4 and chemokine co-
receptors. Amongst CD4+ T cells more memory than naïve cells are infected (Spina,
Prince, & Richman 1997). This may be partly explained by their differential co-receptor
expressions. Expression of CCR5, which is used by most virus isolates, is largely
restricted to memory cells. CXCR4, which is used by viral isolates in advanced
infection, is expressed on both naive and memory cells but more so on naive cells (Mo
et al. 1998).
Retroviruses show a cell cycle restriction to infection (Yamashita and Emerman 2006).
Most can only infect dividing cells and those that can infect non-dividing cells, cells in
G0, usually do so with reduced efficiency. HIV and the other lentiviruses show the least
restriction. Cells in G0 are in a distinct quiescent phase outside of the cell cycle. They
are neither dividing nor preparing to divide and cell cycle machinery is removed. HIV
can infect with equal efficiency into dividing cells and terminally differentiated non-
dividing cells. Naïve unactivated quiescent cells in the periphery can also be infected
but at lower efficiency. This may also explain why more memory than naïve cells are
infected and also allows the establishment of major viral reservoirs such as non-
activated CD4+ T cells and terminally differentiated macrophages. For infection to be
productive, resulting in the generation of new virions, the host cell needs to be activated
because viral production has been shown to require the same cytokine signalling that is
elicited from the IL-2 receptor following TCR triggering (Oswald-Richter et al. 2004).

43
Successful interaction between the virus and a suitable cell allows the virus to enter the
cell, disassemble the capsid, referred to as uncoating, thereby exposing viral RNA and
enzymes. Although, uncoating is the least understood part of the HIV replication cycle,
it is known to occur in activated cells but not resting cells because lysate from activated
cells can trigger uncoating but lysate from resting cells cannot. This also suggests the
involvement of host cellular factors in the uncoating process. A cellular kinase,
peptidyl-prolyl isomerase Pin1, that specifically recognizes a capsid protein motif and
phosphorylates its‟ serine residue has been shown to be required for the disassembly of
the HIV-1 capsid (Misumi et al. 2010).
1.3.4.2 Reverse transcription
After uncoating the RNA genome, HIV is reverse transcribed by viral reverse
transcriptase (RT) (Freed and Mouland 2006) (Castro et al. 2006). RT is a holoenzyme
consisting of 2 protein subunits, DNA polymerase and RNase H. The DNA polymerase
subunit is an RNA dependent DNA polymerase that catalyses the addition of
deoxynucleotides complementary to the RNA strand to form the nascent DNA strand.
RNase H is a ribonuclease that catalyses the hydrolytic cleavage of the 3'-O-P-bond of
RNA in a DNA/RNA duplex. As mentioned in section 1.3.3 each HIV virion contains 2
complementary RNA molecules, the plus strand and the minus strand, also called the
positive sense strand and the negative sense strand respectively. The plus strand is the
coding strand, which means it is identical to viral messenger RNA (mRNA) and can be
directly translated into protein. The minus strand is non-coding.
RT, like all DNA polymerases, requires a primer with a free 3‟-hydroxyl to initiate
DNA synthesis. On the plus strand, where reverse transcription begins, the primer is a
host cell transfer-RNA (tRNA) molecule, added to the virus during assembly of the
viral particle The tRNA molecule anneals to an 18 nucleotide sequence close to the 5‟
end of the plus strand, called the primer binding site (pbs). The DNA polymerase
subunit of RT catalyses the addition of a deoxynucleotide to the 3‟ end of the tRNA
primer and from here synthesis of a complementary DNA strand proceeds to the 5‟ end
of the plus strand RNA (Litvak et al. 1994). The RNase H subunit then catalyses the
degradation of the RNA strand where it was hybridised to the nascent DNA strand. The
44
short DNA strand produced, called the minus-strand strong stop DNA, then moves from
the 5‟ to the 3‟ end of the plus strand, a step referred to as the first strand transfer. Here
its 3‟end acts as the primer for the synthesis of the complete minus DNA strand. The
tRNA primer is then removed by RNase H (Freed and Mouland 2006).
During DNA minus strand synthesis when the RNA plus strand was hydrolysed by
RNAse H action small fragments remained. These small fragments of plus strand RNA
are used as primers for the synthesis of the DNA plus strand. They anneal to purine rich
sequences on the RNA minus strand, the polypurine tract (PPT) and the central PPT
(cPPT). Removal of the tRNA allows RT to move to the minus strand where it adds
deoxynucleotides to the 3‟ end of the RNA primers (Freed 2001). The template
switching, where RT moves from one RNA strand to the other is one of the mechanisms
that generate genetic diversity in HIV viruses (Basu et al. 2008). If the two RNA
molecules in a virion are not identical then template switching results in a novel
recombinant DNA genome made of sequences from both RNAs. The process of reverse
transcription is summarised in Figure 1.9.

45
Figure 1.9 Process of reverse transcription
Synthesis of the first DNA strand, the minus strand, is initiated from the primer binding site (PBS)
on the RNA plus strand, utilising a tRNA as a primer. Synthesis of the second DNA strand, the plus
strand, is initiated from the central polypurine tract (cPPT) using RNA fragments generated from
hydrolysis of the RNA plus strand during DNA minus strand synthesis. Adapted from (Freed 2001).
1.3.4.3 Proviral integration and transcription
The new viral DNA, known as the provirus, is then imported into the nucleus as part of
the pre-integration complex (PIC). The PIC consists of viral and cellular proteins
required for integration. The integration of the provirus into the host genome is
mediated by the viral enzyme integrase (IN) (Delelis et al. 2008). First IN cleaves off
nucleotides from the 3‟ ends of both strands of the provirus. Then at the integration site

46
IN cleaves the host DNA in a staggered manner and the 3‟ ends of the provirus join to
the cleaved ends of the host DNA. Host cell repair enzymes then fill in the gaps
between the viral DNA and the host DNA.
The provirus can lie latent and the infected cell continues to function, or in the presence
of certain transcription factors including NF-KB, the virus can become active and
replicate. In the latter case, replication begins with transcription of viral DNA, which
starts at the long terminal repeat (LTR) with the binding of the viral protein, Tat, to an
RNA element, the transactivation response region, and results in the production of over
30 viral RNAs (Wu and Marsh 2003). They are divided into unspliced, partially spliced
and small multi-spliced RNAs. The unspliced full-length viral RNA is exported from
the nucleus under the direction of the viral protein, Rev, which binds to the Rev
responsive element in the viral RNA and is destined to be packaged into progeny
virions as genomic RNA. The spliced RNAs are translated in the cytoplasm. Translation
of the partially spliced RNAs results in the synthesis of the structural proteins, the Gag
polyprotein precursor, the Gag-Pol polyprotein precursor, the Env glycoprotein
precursor, gp160. Translation of the small multispliced RNAs results in the synthesis of
tat and rev as well as the accessory proteins Nef Vif, Vpr and Vpu.
1.3.4.4 Virion assembly and budding
The next two steps, assembly of the viral particle and budding from the cell membrane,
occur simultaneously beginning with the transportation of viral proteins and viral
genomic RNA via the golgi apparatus, to the plasma membrane. Within the golgi
apparatus the Env glycoprotein precursor, gp160, is cleaved into gp120 and gp41 by a
host protease. At the cytoplasmic side of the plasma membrane assembly is directed by
Gag. The Gag protein is divided into functional domains, each with an associated
activity that is required for efficient generation of immature viral particles. The N-
terminal matrix domain, directs Gag to the plasma membrane, the central capsid domain
determines particle morphology, the nucleocapsid domain binds RNA, enabling the
packaging of the viral genome, and the C-terminal domain, p6, is required for the
separation of the viral envelope from the host cell membrane, releasing new virions into
the extracellular space (Bieniasz 2009). Maturation of the viral particles requires the

47
action of viral protease, which catalyses a series of cleavage reactions in gag resulting in
morphological and structural changes that render the virions infectious. A pictorial
representation of the steps of the HIV replication cycle and their cellular locations are
shown in Figure 1.10.
1.3.4.5 Innate restriction factors against HIV
The HIV replication cycle is subject to the effects of innate restriction factors, proteins
produced by host cells that target intracellular HIV-1 replication, which may be
important in the development of novel therapeutic agents against HIV infection. The
restriction factors, which operate at different stages of the HIV-1 life cycle, include
Apolipoprotein B mRNA-editing enzyme 3G (APOBEC3G), which inhibits reverse
transcription by catalysing the deamination of viral minus strand cytidines to uracil,
bone marrow stromal cell antigen 2 (BST-2), which limits the release of viral particles
possibly by tethering them to the cell membrane and tripartite motif protein 5 alpha
(Trim5α), which blocks reverse transcription and nuclear import of the HIV provirus
possibly by binding to incoming virion cores and prematurely uncoating them.
Restriction factors, however, do not operate unopposed because HIV encodes proteins,
Vif, Vpu and Tat, which counteract their effects (Strebel, Luban, & Jeang 2009).

48
Figure 1.10 Replication cycle of HIV
The diagram shows the steps in the replication of an HIV virion from cell entry through to release
of the new virions. Reproduced from (Monini et al. 2004)
1.4 PATHOGENESIS OF HIV INFECTION
1.4.1 The clinical course of HIV-1 infection
HIV infection is a chronic viral infection, characterised by a decline in the CD4 count
and other immune dysregulation. The immunodeficiency allows for the opportunistic
infections and neoplastic changes that ultimately result in death. The course of HIV
infection and the associated changes in plasma viraemia and CD4 count are summarised
in Figure 1.11.

49
Figure 1.11 Generalised course of untreated HIV-1 infection
The changes to CD4 count (blue line) and plasma viral load (red line) during the different phases of
HIV-1 infection are shown. The length of each phase, especially clinical latency vary greatly
between individuals. Reproduced from Wikipedia, originally published as Figure 1 in (Pantaleo,
Graziosi, & Fauci 1993).
HIV infection in most individuals begins with an acute phase of high-level viraemia
within 2 months of infection. During this period viral replication is rampant resulting in
the dissemination and seeding of virus in all peripheral lymphoid organs as well as in
mucosal-associated lymphoid tissue. The rampant viral replication is reflected by a high
viral load that can reach millions of copies of virus per millilitre of plasma. Therefore
the acute phase is the most infectious phase. The acute phase ends as the viral load
decreases and plateaus to a set point, as the immune system mounts an anti-viral
response. This set point is very important because high viral set points are associated
with rapid disease progression to AIDS (Sterling et al. 2001), even though there is no
standard method for calculating the viral load set point The viral load set point is
determined by host factors such as gender, age, race, other diseases, and human genetic
variation as well as viral factors such as co-infection with multiple HIV subtypes, which

50
is associated with an increased set point (Streeck and Nixon 2010). During the acute
phase there is also a marked drop in the numbers of circulating CD4+ T cells but they
rebound, though still below normal values, as the viral load declines. Most patients
experience cold and flu-like symptoms such as fever, lymphadenopathy, fatigue,
malaise and myalgia during this period (Vergis and Mellors 2000), (Hicks, Gay, &
Ferrari 2007).
The immune response is characterised by a rapid increase in the concentration of CD8+
T cells and the release of antibodies against HIV-1 into the bloodstream. Activated
HIV-1 specific CD8+ T cells kill HIV-1 infected cells but are unable to entirely contain
viral replication and eradicate HIV. The decline in viral load down to the set point is
associated with a decline in CTL number and activity, which may partly explain why
HIV is not eradicated (Miedema et al. 1994). In addition HIV continually mutates to
generate virus that escapes from control by HIV-1 specific CD8+ T cells. Anti-HIV-1
antibodies appear to have little impact on viral replication but their presence in the
plasma is utilised for diagnosis. Enzyme linked immunosorbent assays (ELISA) specific
for HIV-1 antibodies are used to diagnose HIV-1 infection after seroconversion (Morris
2002).
The second phase of infection, clinical latency, is an asymptomatic chronic phase,
which without treatment is associated with a gradual decrease in CD4 count, and little
change in viral load from the set point established during primary infection. This phase
is of extremely variable length, some individuals remain asymptomatic for over 10
years without treatment and others progress rapidly to full blown AIDS within a few
years (Vergis and Mellors 2000), (Jaffar et al. 2004). Though little decrease in CD4
count is seen during this phase the rate of CD4 attrition is actually high but is
adequately compensated by rapid replacement of the cells. Kinetic measurements with
deuterated glucose have shown that in HIV infected individuals over 50% of the new
cells produced/day were short lived compared to 30% in HIV negative subjects
(Hellerstein et al 1999).

51
The last phase of infection, AIDS, is associated with a steep increase of the viral load
and rapid decline in CD4 count. During this final phase of infection, the immune system
fails and the body becomes progressively more susceptible to opportunistic infections
and neoplasms, which ultimately result in death. Typical AIDS defining opportunistic
infections include candida, mycobacterium species and Pneumocystis carinii. The most
common cancers seen in HIV-1 infected individuals include Kaposi‟s sarcoma and B
cell lymphomas (Libman 1992), (Vergis and Mellors 2000).
The pathogenesis of HIV-1 is complex and determined by both viral and host factors.
Multiple modes of pathogenesis have been proposed and studied. Pathogenesis is more
complicated than CD4 depletion resulting in compromised immunity because non CD4+
T cell populations are also depleted. B cell function and numbers have been shown to be
compromised in HIV infection independently of CD4+ T cell impairment (Moir and
Fauci 2008). Additionally virally induced CD4 depletion by SIV in the natural host
monkey has been observed without progression to AIDS (Milush et al. 2007). This
thesis however is confined to CD4+ T cell depletion and recovery, and the next sections
describe possible causes of the CD4 depletion observed in HIV infection, focussing on
the dynamic between CD4+ T cells and HIV.
1.4.2 Direct elimination of HIV-1 infected cells by HIV and CTLs
In the 1980s several groups demonstrated the cytopathic effect of HIV replication on
CD4+ T cells in culture, when productively infected cells were lysed (Fenyo, Albert, &
Asjo 1989), (De Rossi et al. 1986), (Fisher et al. 1985). The amino terminal end of the
viral protein gp41 on its‟ own can lyse up to 40% of cells in culture (Mobley et al.
1992). In vivo only infection of activated cells is cytopathic whereas infection of
quiescent cells by HIV results in a non-replicated latent infection (Briant et al. 1996).
However latently infected cells present viral antigens on their cell surface so can be
killed by CTLs (Riviere et al. 1989), (Grant, Smaill, & Rosenthal 1993) and
complement and antibody mediated lysis (Gregersen et al. 1990).
52
1.4.3 Indirect elimination of HIV uninfected CD4+ T cells via apoptosis
Direct killing of CD4+ T cells by HIV lytic infection and CTLs may mostly explain the
initial loss of CD4+ T cells during the acute phase of HIV infection. However, by the
chronic phase the number of HIV-1 specific CTLs is markedly reduced and neither lytic
infection nor CTLs can account for the depletion of uninfected cells in HIV-1 infection.
Then crosslinking of gp120 on the surface of CD4+ T cells was demonstrated to induce
their death by apoptosis (Banda et al. 1992). Additionally apoptosis was shown to occur
predominantly not in infected CD4+ T cells but in the bystander uninfected CD4
+ T cells
hence the term the „bystander effect‟ (Finkel et al. 1995). Other studies also reported
increased apoptosis in HIV infected people compared to uninfected controls (Laurent-
Crawford et al. 1991), (Patki, Georges, & Lederman 1997). It has been demonstrated in
vitro that PBMCs from HIV-1 infected patients are more likely to undergo spontaneous
apoptosis than similarly treated peripheral blood mononuclear cells (PBMCs) from
uninfected adult controls. In both the controls and the infected individuals cells in
synthesis phase (S phase), the phase of the cell cycle when DNA is replicated, were
more likely to undergo apoptosis than other cells (in G0-G1) but the CD4 cells from
infected individuals were more likely to enter S phase (Patki et al. 2000).
Increased apoptosis has been found to be associated with disease progression (Gougeon
et al. 1996). Individuals with the lowest CD4 counts (0-99 cells/µl) have higher levels
of apoptosis in PBMCs than individuals with higher CD4 counts (Patki, Georges, &
Lederman 1997). Children who are long term non progressors (LTNPs), those who have
survived with HIV for over 5 years, without significant anti-retroviral therapy (ART),
were shown to have characteristically low frequencies of apoptotic CD4 and CD8 cells
and less mitochondrial membrane disruption (Moretti et al. 2000). Expression of CD95,
a death receptor on the surface of cells that leads to programmed cell death (apoptosis),
has been shown to be strongly increased in both CD45RO+ and CD45RA
+ T cells of
HIV-1-infected children (Baumler et al. 1996). Similar apoptotic changes, increased
activation of the cyclin B complex are found in HIV and pathogenic SIV infection
(Paiardini et al. 2006).

53
1.4.4 Increased activation induced cell death during HIV infection
In 1991 Jean Claude Ameisen and André Capron proposed that the increased apoptosis
in HIV-1 infection might be mediated by activation on the basis that thymocytes
undergo apoptosis in response to activation during selection in the thymus (Ameisen
and Capron 1991). They showed that only CD4+ T cells from HIV infected individuals
underwent apoptosis after mitogen stimulation in vitro compared to CD4+ T cells from
uninfected controls (Groux et al. 1992). Studies by other groups also found that
apoptosis of CD4+ T cells in vitro was increased by activation with IL-12 (Meyaard et
al. 1992), (Estaquier et al. 1995). These findings were echoed in a murine (Saha, Yuen,
& Wong 1994) and a primate model of HIV infection (Wallace et al. 1999).
Numerous studies using different markers of activation such as CD25, CD38 and HLA-
DR have demonstrated that in both adult and paediatric HIV infections, the proportion
of activated cells within the CD4 pool is increased (Lees et al. 1993), (Mahalingam et
al. 1993), (Plaeger-Marshall et al. 1994). Immune activation has been shown to correlate
with CD4 count (Sousa et al. 2002) and disease progression (Carbone et al. 2000).
Increased activation is a plausible cause of CD4 depletion via apoptosis. As explained
in section 1.2.3 activation of the TCR, depending on signal strength, can lead to anergy
and therefore cell death, or differentiation from long lived cells into short lived effectors
that are prone to activation induced cell death. Additionally activated cells are at greater
risk of productive HIV infection (Williams and Greene 2007). All of these would
deplete CD4+ T cells, however HIV viral antigens would only be recognised by the
TCRs of HIV-1 specific CD4+ T cell and they make up a small fraction of the T cell
repertoire. Therefore if HIV antigen recognition by HIV specific CD4+ T cells alone
was the cause of CD4+ T cell activation it would be insufficient to cause the massive T
cell loss.
HIV has however been shown to increase expression of co-stimulatory molecules and as
explained previously co-stimulatory molecules lower the threshold required for immune
activation. A mechanism by which chronic expression of co-stimulatory molecules

54
might cause CD4 depletion has been shown in mice that constitutively express CD70.
CD70 is the ligand for the co-stimulatory molecule CD27 and is present on B cells
(Tesselaar et al. 2003). In these mice all TCR stimulation was accompanied by co-
stimulatory CD27-CD70 signalling and they showed a progressive fall in naïve T cells
with a concomitant increase in effector-memory cells. This ultimately resulted in the
depletion of naïve cells from the lymph nodes and spleen with the mice succumbing to
the opportunistic infection Pneumocystis carinii. Correspondingly in humans,
expression of proliferation markers, markers of terminal differentiation and effector
memory cells has been shown to be higher in HIV-1 infected individuals than in healthy
controls; whereas the proportion of naïve cells is reduced compared to healthy controls
(Jordan et al. 2006).
Initially it was assumed that HIV replication and antigens were inducing non-specific
activation but studies showing no relationship between CD4 depletion and viral load
would imply that this was unlikely (Albuquerque et al. 2007). A significant proportion
of individuals on HAART achieve suppression of viral replication yet still have low
CD4 counts (Albuquerque et al 2007). HIV infected children with a low CD4 count
(less than 15% of total lymphocyte count) have been shown to have a greater proportion
of memory CD4+ cells than uninfected controls, and this result was independent of viral
load. In addition the proportion of naïve cells (CD45RAhi+
CD62L+) was much lower
regardless of viral load. For those children with good CD4 counts (more than 25%) they
showed a proportion of CD4 memory cells similar to healthy controls regardless of their
viral load. This was also true for the proportion of CD45RAhi+
CD62L+ cells. The
proportion of activated cells increased as CD4 percentage fell regardless of each viral
load (Resino et al. 2006).
A similar observation has been made in adults. When symptomatic HIV-1 infected
adults were compared to asymptomatic long term non-progressors with equally high
viral loads, the asymptomatic long term non progressors had significantly lower levels
of CD4+ T cell activation and proliferation, as measured by HLA-DR and Ki67
expression respectively (Choudhary et al. 2007).

55
In SIV infection within the natural host there is usually persistently high viral load and
viral replication but little cell activation or cell depletion (Kornfeld et al. 2005). This
would suggest that viral replication does not directly cause immune activation. However
if a foreign host is infected, for example Asian rhesus macaques infected with SIVSM,
increased immune activation is detected. This model shows a very similar pathogenesis
to human AIDS. Both have an initial acute period of high viraemia which is then partly
controlled by CD8+ cells followed by a longer asymptomatic phase characterised by
persistent viral replication and slow but gradual CD4 depletion. In this pathogenic
model as in HIV there was an increase in immune activation. In these monkeys, as in
HIV infected individuals, lower levels of viraemia are associated with a slower disease
course.
These data in children, adults and monkeys would suggest that some other antigens, not
HIV, are acting to lower the required threshold for cell activation and thus triggering
non-specific wide spread immune activation.
1.4.5 CD4+ T cell depletion in the gut
As mentioned earlier CCR5 using viruses predominate during the early stages of HIV
infection and CCR5 expression is restricted to memory cells yet Zaunders et al were
able to demonstrate that it was the decrease in the concentration of CCR5- cells, not
CCR5+ cells, whose concentration remained unchanged, that accounted for the decline
in CD4+ T cell count during the primary phase of infection and also that it is was the
concentration of circulating CCR5- cells that increased after treatment with
antiretroviral therapy. They noted that after initiation of antiretroviral therapy during
primary phase infection the concentration of non-proliferating (Ki67-) CCR5
- cells
increased which would suggest that the increase in cell number was due to the release of
cells previously sequestered within lymphoid tissue. They also noted that the proportion
of CCR5+ cells that expressed Ki67, and therefore were proliferating, was increased yet
there was no significant increase in the number of CCR5+ cells (Zaunders et al. 2001),
which begs the questions, what is the fate of newly produced CCR5+ cells in the
circulation?

56
Previously CD4+ T cells in GALT, which have a predominantly memory phenotype,
had been shown to be depleted during primary HIV infection compared to uninfected
individuals (Lim et al. 1993) and it had been established that SIV infection of rhesus
macaques resulted in profound and selective depletion of CD4
+ T cells in the intestines
within days of infection (Veazey et al. 1998). α4β7 is the integrin required for gut
homing and Krzysiek et al have shown that the concentration of α4β7+CCR5
+ cells is
much lower in HIV infection than in healthy controls. Additionally they found that the
low concentration of α4β7+CCR5
+ cells was not improved after initiating anti-retroviral
therapy (Krzysiek et al. 2001). Taken together these data might suggest that CCR5+
cells proliferate and migrate to the gut to replace CCR5+ cells being lost here.
Indeed more recently, Brenchley et al demonstrated that the first CD4+ T cell subset
depleted from the gut in HIV infection are CCR5+ memory cells in the GI tract mucosa.
Comparing CD4+ T cell depletion in peripheral blood, mesenteric lymph nodes, inguinal
lymph nodes, and the jejunum, within 17 days after SIV infection of macaques,
Brenchley et al observed that the percentage of CD4
+ T cells within gut mucosa dropped
from over 40% down to less than 1%. In 50 HIV infected persons flow cytometric
analysis of gut biopsies showed much lower percentages of CCR5+ CD4
+ T cells
compared to healthy controls (Brenchley et al. 2004).
In SIV infected rhesus macaques gut memory cells were subsequently shown to be
productively infected during the acute phase of high viral replication and viraemia by Li
et al. and therefore likely depleted by direct killing (lytic infection) despite their
predominant resting state (Ki67-). As discussed previously the viral replication peaks
during the acute phase and declines in part due to elimination of infected cells in the
periphery by virus-specific CTLs. However CTL responses in the colon are minimal
and Li et al propose that the CD4+ T-cell depletion markedly reduces the size of the
population of susceptible cells available for infection and hence peak viraemia declines.
They also show that productive infection alone would be unlikely to explain the massive
depletion of CD4+ T cells from the gut because at the peak of viral production only 7%

57
of cells were actually infected. By demonstrating increased levels of caspase 3, Fas and
Fas ligand, Li et al provide evidence for the depletion of uninfected memory cells from
the colon by bystander apoptosis (Li et al. 2005).
1.4.6 Bacterial translocation and activation of circulating CD4+ T cells
The gut is a unique immune environment; only a thin epithelium separates GALT
immune cells within the lamina propria from high numbers of bacteria and microbial
products within the gut lumen. Gut lymphocytes need to be able to respond swiftly
against pathogenic bacteria and ignore innocuous food allergens and commensal
organisms. Inappropriate responses to commensal organisms in the gut result in atrophy
of the gut mucosa as seen in inflammatory bowel disease (Scharl and Rogler 2010).
TRegs may be important in limiting the activation of GALT T cells by harmless
organisms and their products. Additionally gut cells are predominantly resting and
proliferate poorly in response to activating cytokines (Zeitz et al. 1994). Depletion of
CD4+ T cells from the gut may enable microbial translocation, the passage of microbes
and microbial products into the body and systemic circulation. Bacterial translocation
occurs in many other conditions including inflammatory bowel disease, where it is
associated with systemic immune activation. Therefore it has been hypothesised that the
profound depletion of CD4+ T cells from the gut in HIV infection causes a breakdown
of the mucosal barrier thus increasing susceptibility to microbial translocation from the
GI tract to the systemic circulation (Douek 2007).
The endotoxins, lipopolysaccharide (LPS) and lipooligosaccharide (LOS), found within
the outer membrane of gram negative bacteria, are potent inducers of inflammation and
immune activation (Heumann and Roger 2002). Detection of LPS within the plasma
indicates bacteraemia hence measuring plasma LPS can be used as a measure of
bacterial translocation. Plasma LPS levels were measured in people without HIV and
people at various stages of HIV infection, acute, chronic and advanced disease. Plasma
LPS was significantly higher in HIV-1 infected individuals in the chronic and AIDS
phases of infection than in uninfected controls and individuals with acute phase HIV
infection. The median plasma LPS level in patients with chronic or advanced disease

58
was 75 pg/ml (Brenchley et al. 2006). 14 pg/ml is sufficient to produce systemic
immune activation therefore the level of LPS measured in HIV infection could account
for the increased immune activation characteristic of HIV infection (Douek 2007).
Plasma LPS levels in monkeys with pathogenic SIV can be dramatically reduced by
administering antibiotics that target microbes in the GI tract (Brenchley et al 2006).
This finding supports the gut as the likely source of LPS in HIV infection. However this
was associated with only a modest decrease in the measures of LPS-mediated in vivo
monocyte stimulation. SIV infection in macaques is pathogenic and plasma LPS levels
in infected macaques are significantly higher than in uninfected macaques. However
there is no difference in plasma LPS levels between SIV infected and uninfected sooty
mangabeys, the natural host (Brenchley et al 2006).
LPS triggered immune activation is transduced via surface CD14 and soluble CD14
(sCD14) therefore sCD14 increases when monocytes are stimulated by LPS (Heumann
and Roger 2002). HIV infected individuals at all stages of infection show significantly
higher levels of sCD14 compared to uninfected controls. In HIV infected individuals
starting HAART, after 48 weeks plasma LPS was inversely correlated to CD4+ T cell
count (Brenchley et al 2006). This suggests that one of the mechanisms underlying the
increase in CD4 count observed in HAART could be decreased bacterial translocation.
However this requires further substantiation, for example, by determining whether HIV
infected individuals, not receiving HAART, experience increased CD4 counts when
bacterial translocation is blocked or reduced, perhaps by administering antibiotics that
target gut microbes.
More recently depletion of CD4+ T cells has been shown to occur in non-pathogenic
SIV infection in sooty mangabey and African green monkeys but is not associated with
increased mucosal or systemic immune activation. There was also no significant
difference in depletion kinetics between non-pathogenic infection is sooty managabeys
and pathogenic infection in Rhesus macaques. Though non-pathogenic SIV infection in
sooty mangabey is not associated with increased systemic immune activation, a

59
transient increase in activated proliferating PBMCs has been shown to occur early in
infection. In 2 out of 5 monkeys followed up there was also a transient increase in
plasma LPS levels (Gordon et al. 2007). These results suggest that CD4 depletion on its
own may not be enough to compromise the mucosal barrier thus permitting microbial
translocation or that sooty managabeys may be able to adjust to the depletion of CD4+ T
cells from gut mucosa and re-establish the barrier against microbial translocation with
decreased number of cells.
As discussed previously CCR5+ CD4
+ T cells are depleted from the gut in HIV infection
however within peripheral blood Brenchley et al found no difference between the
percentages of circulating CCR5+ CD4
+ T cells in HIV infected and uninfected
individuals and that the concentration of HIV-1 infected CCR5+ memory cells in the gut
was over a 100 fold greater than the concentration of HIV-1 infected CCR5+ memory
cells in peripheral blood (Brenchley et al 2004). This difference between the rates of
infection, and the possible resulting difference in death rates, could partly explain why
depletion of CCR5+ CD4
+ T cells appears to be restricted to the gut. Compared to the
gut where they account for 40-80% of all CD4+ T cells, only 10-30% of circulating
CD4+ T cells were found to express CCR5. Memory CD4
+ T cells in GALT are quite
distinct from other populations of memory cells. As has mentioned previously they are
predominantly resting (Ki67-) and additionally it has demonstrated in non-human
primates that they do not undergo proliferation in response to antigen (Zeitz et al 1994).
As mentioned in previous sections, apart from proliferation of existing memory cells,
naïve cell activation and differentiation into memory cells contributes to the number of
memory cells. As gut memory cells poorly proliferate and low frequencies of naïve cells
are present in the gut, homeostatic mechanisms available to attempt to compensate for
the dramatic depletion of memory cells from the gut could hypothetically be limited to
immigration of peripheral blood memory cells that express α4β7 and therefore have gut
homing potential. This could be another potential mechanism contributing to CD4+ T
cell depletion from peripheral blood. The question remains though, why administration
of antiretroviral therapy is associated with an increase of CD4+ T cells in the periphery
but not in the gut?

60
Additionally the loss of memory cells from peripheral blood could be offset by
increased activation driven differentiation of naïve cells into memory cells because in
adults the composition of the CD4+ T cell pool in peripheral blood is 70-90% naïve and
10-30% memory cells as compared to 20-60% naïve and 40-80% memory in the gut
(Centlivre et al. 2007). Thus in the gut, activation driven differentiation of a small naïve
cell population would be unable to keep up with the rapid depletion of memory cells.
1.4.7 Role of CD4+ T regulatory cells in HIV pathogenesis
As described previously immune activation is usually controlled by Tregs. Tregs could
have either or both of two opposing roles in HIV infection. They could be deleterious
by inhibiting antiviral T cell responses which could lead to viral persistence and more
rapid disease progression. Tregs could be advantageous by suppressing non-specific
immune activation and thus slowing down disease progression by limiting viral
replication and activation-associated immunopathology (Hartigan-O'Connor, Abel, &
McCune 2007). However the role of Tregs in HIV infection is poorly understood in part
due to different research groups producing conflicting results, which are affected by the
poor consensus in identifying Tregs.
There is a general consensus that Tregs are increased in tissues of HIV infected
individuals and pathogenic SIV infected monkeys and that Treg tissue numbers are
proportional to viral load. However there is conflicting data about the numbers of
circulating Tregs (Chougnet and Shearer 2007). The role of Tregs in HIV remains
elusive.
1.5 HIV INFECTION IN CHILDREN
There are significant differences between adult and paediatric HIV infection in part due
to differences between the immature immune systems in children and the more mature
61
systems in adults. There are also separate distinct difficulties in diagnosis and
management that are specific to children.
1.5.1 Transmission
It is estimated that 90% of paediatric HIV infection occurs by vertical transmission from
mother to child (UNAIDS 2002). HIV infection can occur in utero during foetal
development. HIV has been detected in both foetal tissue and amniotic fluid indicating
passage of infected cells or virus across the placenta (Sprecher et al. 1986). The next
time point for infection is the intrapartum period, during birth. Then after birth in the
postpartum period the child can be infected by exposure to virus or infected cells during
breast-feeding (Sprecher et al 1986). Most neonates (65%) are infected in the
peripartum period during and after delivery (Sprecher et al 1986)
1.5.2 Diagnosis
HIV is more difficult to diagnose in children than in adults. ELISAs specific for anti-
HIV-1 IgG antibodies are commonly used for diagnosing infection in adults. However
they are not suitable for diagnosing HIV-1 infection in infants as maternally derived
antibodies continue to circulate for up to 12 or 18 months after birth. PCR detection of
HIV DNA can detect 25-30% of infected newborns and the rest can be dected by 1
month of age (Read 2007). Testing infants born to HIV infected mothers should
therefore begin within 48 hours of birth, repeated at 1 to 2 weeks and then at 1, 2, and 6
months, although guidelines vary amongst hospitals. Additionally infants with a single
positive PCR test results should have it confirmed by follow-up PCR and viral isolation.
Vertically transmitted HIV-1 infection can only be excluded in those infants with PCR
test results that remain negative through 6 months of age (Luzuriaga and Sullivan
1998).
1.5.3 Clinical course of paediatric HIV-1 infection and pathogenesis
HIV infection is more aggressive and rapid in vertically infected children. As a result
the death rate in HIV-infected children is higher than in HIV-infected adults. Before the

62
advent of HAART an estimated 23% of infected children developed AIDS before the
age of 1 year, and nearly 40% by 4 years. 10%
died before age 1 year and 28% before
age 5 years (European Collaborative Study 1994).
From birth, viral load increases rapidly and peaks at 1-2 months (median values at 1 and
2 months, 318,000 and 256,000 copies/ ml respectively) then slowly declines to a
median of 34,000 copies/ ml at 24 months (Shearer et al. 1997). This is a higher peak
and a slower decline than seen in adults. Prognostic indicators of disease progression
such as viral load and CD4 count are less reliable in children; in the first several months
of life viral load cannot be used to distinguish infants with rapid disease progression
from those with slower disease progression (Luzuriaga and Sullivan 1998). This is
because in children, the high plasma viraemia observed in the primary infection phase
usually continues for much longer than in adults yet during this time they can
sometimes maintain a CD4 count within normal levels for their age groups. During this
time the turnover of CD4+ T cells is very high with the thymus generating CD4
+ cells to
replace the high numbers being lost (Krogstad et al. 1999). This feeds viral replication
as the emergence of new cells presents a greater number of potential targets to the virus.
Deficiencies in the immature immune system may account for the high viral loads and
progression seen in children. Mature cellular and humoral responses, especially
functional cytotoxic T lymphocytes (CTLs) are mostly lacking in the young infant
(Buseyne and Riviere 1993) (Luzuriaga et al. 1993). CD4+ T cells responses are also
poorer in infants. They are characterized by lower frequencies of antigen-specific T cells
and a reduced magnitude of the response i.e. smaller clonal expansion compared to
adults. Antigen presentation in infants is also poorer. In contrast to adult DCs, infant
DCs express lower levels of MHC and adhesion molecules, their ability to produce IL-
12, which is required to stimulate naïve CD4+ T cell differentiation, is lower. Therefore
the adaptive immune response in infants is compromised and may in part explain the
high viraemia in this age group.

63
In some aspects the rapid disease progression in paediatric HIV infection is surprising.
As previously discussed, the early events in HIV infection include a profound loss of
activated memory cells from GALT. However children, especially infants, are less
antigen-experienced than adults and have lower frequencies of memory cells in lymph
nodes and peripheral blood, as discussed previously, and thus have fewer suitable
targets for HIV infection. Studies of neonatal macaques infected with SIV have shed
light on this paradox. In common with human neonates, peripheral blood and lymphoid
T cells in macaques neonates are mainly naïve however examination of intestinal lamina
propria from macaque neonates, even on the day of birth, revealed that most, 40-90% of
the CD4+ T cells were activated memory cells (defined by CD45RO and CD95
expression in macaques) and within 21 days of infection with SIV the vast majority of
were found to have been selectively eliminated by direct viral infection (Wang et al.
2007) (Veazey et al. 2003). This result is in contrast to the adult gut where the majority
of directly infected and eliminated memory cells were in the resting state.
1.6 TREATING HIV INFECTION
There is currently no cure or vaccine for HIV. Treatment mainly consists of
antiretroviral drugs that delay the progression to full-blown AIDS.
1.6.1 Anti-retroviral drugs
The first anti-retroviral (ARV) zidovudine, formerly azidothymidine (AZT), became
available over 20 years ago. AZT is a nucleoside reverse transcriptase inhibitor (NRTI)
based on the structure of deoxythymidine. During reverse transcription, the reverse
transcriptase enzyme incorporates nucleotides, which are phosphorylated nucleosides, at
the 3‟ hydroxyl (OH) end of the primer being used to synthesise the viral DNA. In
human cells, DNA polymerase normally removes misincorporated bases. However,
reverse transcriptase does not show proofreading nuclease activity so cannot remove
misincorporated bases, which allows nucleoside analogues like AZT to function. Unlike
deoxythymidine, AZT lacks the 3‟ OH required for DNA strand elongation. Like a
64
normal nucleoside, AZT is phosphorylated by host cellular kinases to produce the
nucleotide, deoxythymidine triphosphate, and then incorporated by reverse
transcriptase. Chain elongation is terminated because there is no 3‟ OH and RT cannot
remove the AZT base (Furman and Barry 1988). Many other drugs which were
analogues of other nucleosides such as lamivudine and didanosine were produced.
The next class of drug discovered were non-nucleoside reverse transcriptase inhibitors
(NNRTIs). NNRTIs are a group of structurally diverse compounds that prevent viral
replication by allosteric inhibition of the reverse transcriptase enzyme. The allosteric
inhibition is mediated by the NNRTI interacting with a hydrophobic binding pocket
near to but distinct from the enzyme‟s active site, which is where nucleotide analogues
bind. This may lead to conformational changes in the active site and inhibit the
enzyme‟s flexibility and consequently its activity (Wainberg 2003)
Protease inhibitors were discovered in 1996. They block the action of viral protease
(PR). PR is responsible for cleaving precursor molecules to produce structural proteins
of the mature virion core therefore protease inhibitors are an effective form of anti viral
therapy because new virions synthesised do not mature and are not infective. PR
inhibitors like saquinavir mimic the enzyme‟s peptide substrate (Flexner 1998).
The 3 classes of anti-retrovirals described thus far interfere with viral replication and
production. Only one class of drugs, fusion inhibitors, prevent viral entry into the cell.
As described previously in section 1.3.4 during entry HIV attaches to the host cell
membrane via the gp120-CD4 interaction which is mediated by gp41. The helices, HR1
and HR2, of gp41 pack together to form a fusion pore. Fusion inhibitors mimic the
helical domains, and inhibit fusion by interacting with their complementary domain on
gp41. Enfuvirtide (T20), the only approved fusion, is an analogue of HR2. It competes
with HR2 for binding with HR1 thus preventing formation of the fusion pore (Lazzarin
2005)

65
The newest class of ARVs, integrase inhibitors has only one approved member.
Raltegravir, approved by the FDA in October 2007, is the first commercially available
drug in this class. The drug interferes with integration of the provirus into the host cell
genome by inhibiting the strand-transfer step of integration by blocking the active site
of integrase, inhibiting the action of the viral enzyme, integrase (Cocohoba and Dong
2008).
1.6.2 Non-antiretroviral agents
Given in combination with antiretroviral drugs, other agents have a small role in the
management of HIV infection by acting upon host factors rather than the HIV virus.
The most prominent of these is maraviroc, a CCR5 inhibitor. It works by binding to a
hydrophobic pocket in the transmembrane helices of CCR5, separate from the site of
gp120 binding, thus altering the conformation of the extracellular loops bound to by
gp120 (Tilton and Doms 2009).
The association between immune activation and rapid disease progression led to the
supposition that agents that suppress inflammation and immune activation could be
beneficial against HIV infection. Use of cyclooxygenase type 2 inhibitors has been
associated with decreased expression of markers of immune activation, particularly in
patients with viraemia (Kvale et al. 2006). Use of corticosteroids as an adjunct to
HAART have shown no added advantage over HAART alone (Wallis et al. 2003).
Additionally long term use of corticosteroids is associated with significant toxicities
specifically bone necrosis and Cushing‟s disease.
Other drugs have been given to boost CD4+ T cell division. Treatment with IL-7, which
is required for T cell development and naïve cell survival, can enhance CD4+ T cell
numbers therefore IL-7 was considered as a possible adjunct to anti-retroviral drugs.
However IL-7 stimulates HIV replication in vitro as demonstrated in thymic organ
cultures, enhances HIV entry into cells through CXCR4 and chronically elevated levels
of IL-7 up-regulate Fas (or CD95) expression (Capitini, Chisti, & Mackall 2009).
Treatment with intermittent cycles of IL-2 leads to significant and sustained increases in

66
CD4 T cell counts by increasing the survival but not proliferation of CD4+ T cells.
However the effect is limited to central memory and naïve cells that express the IL-2R
(CD25). These cells have high levels of FoxP3 (Read et al. 2008). Though only weak
suppressive effects have been detected the wisdom of selectively expanding what is
potentially a population of Tregs is questionable. It could be associated with decreased
non-specific immune activation and/or decreased HIV-specific responses.
1.6.3 Highly Active Anti-retroviral Therapy
Used in isolation ARVs are effective at reducing viral replication. However this does
not last long as HIV rapidly develops resistance to all anti-retroviral agents, highly
active anti-retroviral therapy (HAART) circumvents this problem. HAART is the
description given to the most effective anti-retroviral drug regime. It consists of at least
3 drugs belonging to at least 2 of the ARV classes. A typical regimen would be two
NRTIs plus either a protease inhibitor or an NNRTI.
Within 2 weeks of instituting HAART viral loads drops in the vast majority of
individuals and a slower increase in CD4 count is seen. This is sustained during further
treatment. The increase in the CD4 count is associated with the alleviation of clinical
symptoms. HAART does not cure HIV but if strictly adhered to it keeps the plasma
viral load below the limit of detection by conventional PCR, 50 copies/ml, and the CD4
count remains close to normal. If it is stopped the viral load soon rebounds.
Most individuals on HAART regimens have to take several pills multiple times a day
without end. The regimes are further complicated by meal restrictions and other issues.
Also ARVs are associated with hepatotoxicity, renal toxicity and many unpleasant side
effects like lipodystrophy, dyslipidaemia, insulin resistance and increased risk of
cardiovascular disease. Therefore it is not surprising adherence is a significant problem
especially amongst children, drug users, individuals with psychiatric disease and
inadequate social support. Poor adherence results in the emergence of drug resistant
HIV mutant strains. Then the regimen is no longer effective and must be changed.

67
However there is a very limited number of ARVs available thus there are few options
available for patients who have failed multiple regimes.
If HAART is commenced in a severely immunosuppressed individual immune
reconstitution inflammatory syndrome (IRIS) can occur. IRIS occurrs when anti-
retroviral therapy restores immune responses in an individual who are currently or
recently infected with a pathogen. It usually results in inflammation of tissues infected
with the pathogen. As IRIS is characterised by increased numbers of circulating IFNγ
producing T cells it is considered to be the result of a protective but excessive immune
response that is inadequately regulated. The major risk factor for IRIS is initiating
antiretroviral treatment when the CD4+ T cell count is very low (<100 cells/µl) (French
2009).
Since the introduction of HAART, countries where it is widely available, have seen a
decline in the incidence of HIV related morbidity and mortality.
1.7 RESPONSE OF HIV INFECTION TO THERAPY
1.7.1 Response in adults
In adults effective treatment with HAART produces an initial quick rise in CD45RO+
memory cells in the first few months followed by a slower second phase increase in
CD45RA+ cells (Pakker et al. 1998), (Notermans et al. 1999). These findings are,
however, dependent upon the stage of HIV infection when treatment was initiated. If
HAART is initiated very early after seroconversion or before, the rate and size of
recovery of naïve cells appears the same as memory cells. This rapid phase, both for
memory and for naïve cells, is believed to be due to release of sequestered cells.
However, for both early and late treated people, after at least 3-6 months on therapy, the
rates of their naïve cell recovery become almost parallel. So by this time the method of
CD4 replacement may be similar.

68
1.7.2 Response in Children
Initially treating children was very difficult as available antiretroviral medicines were
initially developed for adults, and most standard fixed-dose combinations were
inappropriate for children. This challenge, however was overcome as a result of
increased availability of paediatric regimens (Bowen, Palasanthiran, & Sohn 2008).
One of the first studies of HAART in children, 2-16 months of age reported that the
drugs were well tolerated without clinically important adverse events and reported
marked reductions, up to 2.5 logs compared with baseline levels, in plasma HIV-1 RNA
levels during the first 14 to 28 days of therapy (Luzuriaga et al. 1997). However rates of
viral suppression below the limit of detection among children have tended to be lower
than among adults (Pavia 2008).
Numerous studies have reported increases in absolute CD4 count and percentage and
other changes in CD4 subsets in children receiving HAART (Gibb et al. 2000), (van
Rossum et al. 2001), (Hainaut et al. 2003), (Rosenblatt et al. 2005), (Newell et al. 2006),
(Zanchetta et al. 2006). The study by Hainault et al looked at the effect of age on
immune reconstitution (Hainaut et al 2003). Over the 12 months of their study they
recorded a progressive increase in CD4+ cells (as a percentage of all lymphocytes).
They observed also an increase in memory cells CD4+ cells (as a percentage of all
lymphocytes) for the first 3 months and an increase in naïve cells (as a percentage of all
lymphocytes) that continued for the whole 12 months of the study. Similar findings over
a longer period, 48 months, were made by Zanchetta et al (Zanchetta et al 2006). Figure
1.12 from Gibb et al illustrates these changes (Gibb et al 2000). Significantly higher
recovery rates of naive, memory and total CD4+ T cells were observed in children
below the age of 3 years as compared with older children and were 10-40 fold higher
than reported in adults (Cohen Stuart et al. 1998).

69
Figure 1.12 Changes to percentage of CD4+ T cells and subsets in children receiving HAART
The graph reproduced from (de Rossi A. et al. 2002) shows the rise in the percentage of CD4+ T
cells and CD45RA CD4+ T cells in children with time after initiating HAART. There was also a
small initial increase in CD45RO CD4+ T cells.
A significant question in the management of paediatric HIV infection has been when to
start treatment. Children who are younger at the start of treatment have been found to
achieve a close to normal naïve cell count faster than older children but by the end of
the study the older children had achieved the same immune recovery (Zanchetta et al
2006). This finding is echoed in work by van Rossum et al (van Rossum et al 2001) and
in Newell et al (Newell et al 2006) where there was no statistically significant
difference in the likelihood of attaining a 20% increase in CD4 count by children who
initiated therapy below 5 months compared to those who initiated after 5 years of age.
These results would suggest that efficacy of HAART in children is not affected by age
at initiation of treatment. However it does not indicate whether children who start
treatment at an older age are immunologically disadvantaged in the long term.
Additionally any immunological advantage conferred by early treatment must be
weighed against the associated risks of long term toxicities including lipid, glucose and
bone metabolism, the known difficulties of maintaining suppression in children, the risk
of resistance mutations and the possibility of running out of effective agents before the
child reaches adulthood (Pavia 2008). A recent study in adults followed people starting

70
HAART over 9 years and assessed the effect on survival of early initiation of HAART
(CD4 count≥500 cells/mm3) versus late initation (CD4 count<500 cells/mm3). The
authors found there was an increased in the risk of death of 94% in the late treatment
group (Kitahata et al. 2009). In a similar study, infants 6-12 weeks old were assigned to
start HAART immediately or to start after the CD4+ T cell percentage fell below 20%
(or 25% if the child was younger than 1 year), most of this group initiated treatment
after 40 weeks follow up. Reductions in infant mortality and HIV progression of 76%
and 75% respectively were demonstrated in the early start group over the deferred start
group (Violari et al. 2008).
In conclusion HIV is a devastating infection with a complicated pathogenesis involving
depletion of CD4+ T cells, especially memory cells initially from the gut which
compromises the mucosal barrier against bacterial translocation. The ensuing bacterial
translocation into the circulation, results in increased non-specific activation of
circulating CD4 cells, especially memory cells. The activated cells differentiate into
shorter lived cells, which are more susceptible to apoptosis. However the process of
HIV infection in children may differ from adults because initially they have a much
smaller proportion of memory cells and greater thymic potential. This thesis sought to
further elucidate the processes of CD4+ T cell depletion and recovery in HIV-1 infected
children by achieving the following aims:
Investigate the changes to CD4+ T cell sub-populations during paediatric HIV-1
infection and the role played by cellular activation, differentiation, proliferation
and apoptosis and viral replication in these changes.
Investigate the effect of planned treatment interruption on CD4+ T cell sub-
populations and the cellular processing controlling their numbers compared to
continuous treatment with anti-retrovirals
investigate the effect of planned treatment interruption on HIV latency and
replication

71
CHAPTER 2
MATERIALS &
METHODS
72
2.1 MATERIALS
2.1.1 Chemicals and solvents
All chemicals and solvents were obtained from Sigma Aldrich (Dorset, UK), except
where otherwise stated, and were of analytical grade or above. All water used for buffer
preparation was purified and deionised using a Millipore water purification system
(Millipore R010, followed by Milli-Q Plus) (Millipore Ltd., Watford, UK) to ultrapure
(Grade I).
2.1.2 Tissue culture materials (including plastics)
Sterile foetal calf serum (FCS) and Roswell Park Memorial Institute (RPMI) cell culture
medium were purchased from Invitrogen (Paisley, UK). FCS was heat inactivated for 1
min at 60 °C in a waterbath. Sterile tissue culture flasks and plates were obtained from
Nunc (Roskilde, Denmark). Polypropylene centrifuge tubes were obtained from
Corning, (Amsterdam, Holland), and disposable serological pipettes from VWR
International (Leicestershire, UK).
2.1.3 qPCR reagents
Nuclease free water and Magnesium chloride were obtained from Sigma Aldrich
(Dorset, UK). Two Taq enzyme systems were used, the Brilliant II QPCR mastermix
(Stratagene, Cedar Creek, Texas) and the Quantitect QPCR mastermix (Qiagen Inc.,
Hiden, Germany). Human placental DNA and tRNA carrier were obtained from Sigma
Aldrich (Dorset, UK). The 8e5 cell line DNA extract was a kind gift of Dr Paul Grant
(UCH Diagnostic Virology Services).
2.1.4 qPCR probes and primers
All probes and primers were obtained from Eurofins MWG Operon, Ebersberg,
Germany. The nucleotide sequences are provided in Table 2.1. The PDH nucleotide
sequences were kindly provided by UCH Diagnostic Virology Services, who use PDH,

73
the housekeeping gene in their in-house semi-quantitative HIV DNA assay. The Gag
nucleotide sequences were as described in (Douek et al. 2002).
OLIGONUCLEOTIDE SEQUENCE
LTR forward primer 5‟-GCC TCA ATA AAG CTT GCC TTG A-3‟
LTR reverse primer 5‟-GGC GCC ACT GCT AGA GAT TTT-3‟
LTR probe 5‟-FAM TGT GAC TCT GGT AAC TAG AGA
TCC CTC AGA C TAMRA-3‟
Pol forward primer 5‟-GCC TCA ATA AAG CTT GCC TTG A-3‟
Pol reverse primer 5‟-GGGCGCCACTGCTAGAGA-3‟
Pol probe 5‟-FAM CCAGAGTCACACAACAGACGGG
CACA TAMRA-3‟.
Gag forward primer 5'-GGT GCG AGA GCG TCA GTA TTA AG-3'
Gag reverse primer 5'-AGC TCC CTG CTT GCC CAT A-3'
Gag probe 5'-FAM AAA ATT CGG TTA AGG CCA GGG
GGA AAG AA TAMRA-3‟
PDH forward primer 5‟-TGA AAG TTA TAC AAA ATT GAG GTC
ACT GTT-3‟
PDH reverse primer 5‟-TCC ACA GCC CTC GAC TAA CC-3‟
PDH probe 5‟-JOE CCC CCA GAT ACA CTT AAG GGA
TCA ACT CTT AAT TGT TAMRA-3‟
Table 2.1 nucleotide sequences of probes and primers

74
2.1.5 Antibodies
The monoclonal antibodies specific to the protein of interest used for flow cytometry
are shown in Table 2.2. Each antibody was conjugated to one of the fluorochromes
fluorescein isothiocyanate (FITC), phycoerythrin (PE) peridinin chlorophyll protein
(PerCP), tandem dye phycoerythrin:cyanine (Pe-Cy5) or allophycocyanin (APC).

75
Table 2.2 Antibodies used in flow cytometric analysis
The source, isotype, fluorochrome conjugation and the dilution utilised are shown for each
antibody.
HUMAN
TARGET
MOLECULE
MOUSE
ISOTYPE CONJUGATE SOURCE DILUTION
CCR7 IgG2a PE R&D 1/50
CD31 IgG1 PE Insight
Biotechnology
1/100
CD38 IgG1 FITC Insight
Biotechnology
1/100
CD4 IgG1κ PE Insight
Biotechnology
1/200
CD4 IgG1κ PE-Cy5 Insight
Biotechnology
1/100
CD4 IgG1 PerCP Becton Dickinson 1/25
CD45RA IgG2b APC Caltag 1/200
CD45RA IgG1κ FITC Insight
Biotechnology
1/100
CD45RA IgG1 PE-Cy5 Insight
Biotechnology
1/100
CD69 IgG1 FITC Insight
Biotechnology
1/100
HLA-DR IgG1 FITC Caltag 1/100
HLA-DR IgG1 PE Insight
Biotechnology
1/100
CD45RO IgG1 FITC Insight
Biotechnology
1/100
CD3 IgG1 PE Becton Dickinson 1/50
Ki67 IgG1 FITC Becton Dickinson 1/25

76
2.1.6 Patient samples
2.1.6.1 UK samples
Whole blood samples were collected from HIV-1 infected children attending Great
Ormond Street Hospital (GOSH), according to GOSH/UCL local research ethics
council (LREC) standards and with parental consent before collection. 900 μl was
collected from these children, and larger volumes (4-10ml) from healthy adult
volunteers recruited within ICH. Venepuncture was performed either by myself or
another appropriately trained person using a butterfly needle and syringe. The blood
was collected into ethylenediaminetetraacetic acid (EDTA) to prevent coagulation.
2.1.6.2 PENTA 11 trial
6 ml whole blood in EDTA from HIV-1 infected children in London and Italy recruited
to the PENTA 11 trial according to the EU Directive on Clinical Trials 2001/20.
Samples were then stored at room temperature, before being processed within 24 hrs
after collection except samples for apoptosis investigation which were processed
immediately unless otherwise stated.
2.1.7 Buffer preparation
Buffers and solutions used were prepared as described in Table 2.3.
Buffer Composition
FACS Buffer 0.2% bovine serum albumin (BSA), 0.02% sodium
azide in phosphate buffered saline (PBS)
Perm Buffer 1% FCS, 0.1% sodium azide, 0.1% saponin in PBS
MACS Buffer 0.5% BSA, 2mM EDTA, 0.09% sodium azide in PBS.
Passed through a 0.22μm filter membrane (Nalgene)
4% paraformaldehyde
PFA
4% (PFA) in PBS dissolved by heating at 65°C for 45
min
Table 2.3 Composition of buffers used
The table describes the composition and preparation conditions of buffers used in the study.

77
2.2 METHODS
2.2.1 PBMCs
2.2.1.1 PBMC isolation
Lymphoprep centrifugation gradient medium purchased from Axis-Shield (Dundee, UK)
was used to separate PBMCs according to manufacturer‟s instructions. Briefly, blood
was diluted with an equal volume of PBS then carefully layered over an equal volume
of lymphoprep before being centrifuged in a Sorvall legend RT for 20 min at 800 xg
without brake. The buffy coat containing the PBMCs was removed by pipette to a
polypropylene centrifguge tube. The cells were then washed twice in RPMI at 300 xg
for 5 minutes. The RPMI was then removed, and the cell pellet either used immediately
or stored for future use, as described below.
2.2.1.2 PBMC storage
PBMCs intended for future use were cryopreserved, by resuspending the pellet in a
solution of 90% (v/v) fetal calf serum and 10% (v/v) dimethyl sulfoxide. The
suspension was aliquoted into volumes of 1ml into cryotubes and stored at -80°C.
2.2.1.3 PBMC preparation for experiments
Both fresh and frozen PBMCs were used. Frozen PBMCs were prepared for use by
quick thawing in a water bath at 37°C. Each aliquot was shaken in the water bath until
almost no ice remained. The tube was then transferred to a sterile flow cabinet. Initially,
approximately 1ml FCS was slowly added drop by drop until no ice remained. The cell
suspension was transferred to a polypropylene centrifuge tube and washed by adding
10ml warmed RPMI, before centrifugation at 300 xg for 10 minutes at room
temperature. The supernatant was removed, taking care not to disturb the pellet, then
this wash step was repeated with a further 10ml RPMI. Cells were then resuspended in
FACS buffer (Table 2.3.). Cell pellets that could not be resuspended were assumed to be
dead and excluded from further experimentation. Successfully resuspended cell pellets
were further evaluated for cell death by a trypan blue exclusion assay.

78
2.2.1.4 Cell counting and trypan blue exclusion assay
Trypan blue was added to a small aliquot of the cell suspension to a final concentration
of 0.02% then 10 µl of the cell suspension applied to an improved Neubauer
haemocytometer (Hawksley, Sussex). The principle of the trypan blue exclusion assay
is that viable cells, which have an intact cell membrane, are impermeable to the
negatively charged blue dye. Therefore, the cells which are dyed by the trypan blue are
counted as non-viable. The haemocytometer was viewed under the 10X objective of a
microscope and appeared as shown in Figure 2.1. Using a hand tally counter, the total
number of cells and the number of blue cells in the 5 areas, marked by red squares in
Figure 2.1, are counted.
Figure 2.1 Improved Neubauer haemocytometer
The improved Neubauer haemocytometer as viewed under a microscope 10X field is shown. The 5
counting chambers used to determine the average number of cells per chamber are marked in red.
To obtain the concentration of the cell suspension the total count from the 5 squares is
divided by 5 to yield the average number of cells per counting chamber, which is
multiplied by 2 to adjust for the 1:1 dilution in trypan blue. The volume of the counting
chamber is 0.0001 ml therefore the product multiplied by 104 is the concentration of the
cell suspension. Combining these elements together produces the equation for
determining cell concentration shown in Figure 2.2.

79
Figure 2.2 Cell concentration equation
Then using the total cell count and the number of cells stained blue in the 5 counting
chambers, the percentage viability was determined using the equation shown in Figure
2.3 (Fernandez-Botran and Vetvicka 2001).
Figure 2.3 Cell viability equation
If the viability was less than 95% the sample was rejected and discarded because the
median viability using this method of PMBC separation, freezing and thawing has been
shown to have a median viability of 95% when samples are thawed after up to 12 years
of storage (Kleeberger et al. 1999) additionally CD4+ T cell function has been shown to
be deteriorate below a PBMC viability of 90% as measured by IFNγ response to
varicella zoster virus challenge (Smith et al. 2007).
2.2.1.5 Red blood cell lysis
In order to retrieve PBMCs from the whole blood samples, the red blood cell lysis
method was used, as the sample volumes were too small to perform density gradient
PBMC separation. Unless otherwise stated FACS lysing solution (Becton Dickinson,
Oxford UK), which is a hypotonic solution of diethylene glycol, heparin, citrate buffer
and formaldehyde, pH 7.2, was used as the lysis reagent. Hypotonic lysis of RBCs relies
on osmosis thus when RBCs are placed in a hypotonic solution there is a net influx of
water into the cells and the resulting osmotic pressure is sufficient to lyse the cells (Bird

80
1972). White blood cells are not lysed because their cell membranes remain constant
during volume changes (Schmid-Schonbein, Shih, & Chien 1980).
FACS Lysing solution was diluted 10-fold with distilled water, warmed to room
temperature and 1 ml added per every 100 µl whole blood. The solution was mixed and
incubated at room temperature for 20 min. Then the lysed red blood cells were removed
by washing twice with 1 ml of FACS Buffer at 300 xg for 5 min and discarding the
supernatant each time. The cell pellet was then resuspended in 100 µl of 4% PFA (Table
2.3)
2.2.2 Immunofluorescence methods
2.2.2.1 Antibody titration
To maximise the ratio of specific to non-specific binding all antibodies were titrated
alongside a mouse immunoglobulin of the same isotype as the antibody and conjugated
to the same fluorochrome. This served as a negative controls for nonspecific binding. A
2-fold dilution series of the antibody was prepared using FACS buffer, starting at the
concentration recommended by the manufacturer. Then 2µl of each concentration was
added to 100,000 PBMCs suspended in 100 µl of FACS buffer. At each concentration
of antibody the mean fluorescence intensity (MFI) of the negative and positive cell
populations on a histogram were noted. The ideal concentration chosen was a
concentration where the maximum difference in MFI between the positive and negative
populations was achieved. (McCarthy 2007) and the MFI of the negative population
exceeds the MFI of the isotype control. The titrations of three antibodies were repeated
on whole blood samples to ensure that titration results between PBMCs and whole
blood were the same. As an example the titration curve for CD4-PECy5 is shown
(Figure 2.4) where the optimal concentration was 2%.

81
0 1 2 3 4 50.1
1
10
100
1000mouse Ig
CD4+
CD4-
% antibody concentration (v/v)
MF
I
Figure 2.4 CD4-PECy5 antibody titration
The CD4-PECy5 antibody and isotype control were titrated over a 2-fold dilution series from 4% to
0.25% (v/v). The MFI at each concentration were plotted on a graph.
2.2.2.2 Extracellular immunostaining
Extracellular staining for targets on the cell surface was carried out as previously
described (Milson et al. 1986) but briefly 100 µl of whole blood or 105 PBMCs
suspended in 100µl FACS Buffer from each patient, as available, was incubated for 30
min, either at room temperature for whole blood or at 4 °C for PBMCs, with a
combination of 3-4 antibodies added as described in Table 2.2. Two washes were then
performed with FACS Buffer to remove unbound antibody as well as lysed red blood
cells in the case of whole blood immunostaining. After decanting the supernatant, cell
pellets were fixed by resuspending in 100 µl of 4% paraformaldehyde.
2.2.2.3 Intracellular immunostaining
Intracellular staining for the nuclear target Ki67 was carried out as previously described
(Jacob, Favre, & Bensa 1991). Briefly following extracellular staining cells were
permeabilized with Perm buffer then incubated with the anti-Ki67 antibody for 30
minutes. Perm Buffer contains saponin therefore it was chosen as it does not destroy the
cell or affect membrane expression of surface antigens. The excess antibody was

82
removed by washing with Perm buffer then FACS buffer both at 300 xg for 5 min.
Finally cells were fixed with 4% paraformaldehyde
2.2.2.4 Flow cytometry
All flow cytometry was carried out on a Facs Calibre (Becton Dickinson) or Cyan
(Dako). The electronic standardisation of the instrument was performed similarly to
methods described previously (Loken, Green, & Wells 2000). First a suspension of
unstained PBMCs were run on the flow cytometer whilst observing the forward scatter
(FSC) and side scatter (SSC) dot plot. The gain setting on the FSC amplifier and the
voltage on the SSC were adjusted in order to visualise a clearly define lymphocyte
population on the FSC/SSC dot plot (see chapter 3, Figure 3.3).
With the unstained cells still flowing through the flow cytometer an electronic gate was
drawn around the lymphocyte population and applied to histograms of FL1, FL2, FL3
and also FL4 if 4 fluorescent channels were to be used. Then the voltage for each
fluorescent channel was adjusted such that almost all the signal from the unstained cells
appeared in the first decade of fluorescence (again see chapter 3, Figure 3.3).
Compensating for the overlap of emission spectra for different fluorescent dyes is a very
important part of flow cytometric analysis because without correction cells labelled with
only one fluorochrome, for example, FITC may be detected by both the FL1 (FITC) and
the FL2 (PE) detector. To perform spectral compensation cells labelled with only
antibody-fluorescent conjugate are acquired on the cytometer for each antibody to be
used. Then taking each antibody one at a time the compensation network is set such that
when singly stained cells are viewed in another fluorescent channel they record the
same fluorescence as unlabelled cells. For example cells labelled with CD4-PE should
appear in the first decade on a histogram of FITC expression. When compensation is
correctly applied the MFI of the FITC fluorescence of CD4- and CD4
+ cells are equal.
Post-acquisition compensation and analysis were performed with Summit v. 4.3 (Dako).

83
Although running unstained cells is an appropriate control that provides a measure of
non-specific binding when determining the threshold of unstained and stained cells for
an antibody, isotype controls can be also be useful when using antibodies that yield a
more continuous rather than discrete populations. Therefore in addition to the unstained
cells appropriate isotype controls were also acquired.
After mixing, all test samples were run on the flow cytometer and a minimum of 10,
000 lymphocytes were acquired and saved for each sample. Data files were then
analysed using Summit v. 4.3 (Dako) software.
During analysis the hyperviscosity of plasma from HIV infected individuals combined
with the high prevalence of nucleated red blood cells mean that it was sometimes
difficult to identify a lymphocyte population based on light scatter because of the
contamination of PBMCs by nucleated red blood cells, which failed to lyse. Where this
occurred back-gating on CD4 was used to identify the position of lymphocytes.
Antibody expression by each population of interest was expressed as percentage of
population positive for the antibody except for CD38 where in addition to percentage
positive, to indicate the intensity of CD38 staining, the shift in mean fluorescence
intensity (ΔMFI) was calculated compared to cells stained with the isotype control.
Flow cytometric data was shown on histograms and colour density dot plots.
2.2.3 Cell stimulation assay
Phorbol myristate acetate (PMA) in combination with ionomycin has been shown to
induce cellular proliferation. PMA activates the serine and threonine-specific
intracellular enzyme, protein kinase C, and ionomycin, a divalent cation ionophore
draws calcium into the cell to initate replication (Balk, Morisi, & Gunther 1984).
Therefore to stimulate lymphocytes, fresh whole blood was divided between 2 wells in

84
a sterile tissue culture plates within a sterile flow cabinet. To one aliquot PMA and
ionomycin were added to a final concentration of 25 ng/ml and1 µg/ml respectively.
Both aliquots were then thoroughly mixed and incubated in a Heraeus HERAcell
incubator (Thermo Fisher Scientific, Loughborough, UK) programmed to 37 °C and 5%
CO2 for 4 hours.
2.2.4 Apoptotic cell detection
2.2.4.1 Selection of assay method
Several factors had to be taken into consideration when selecting an appropriate method
for detecting apoptotic cells in this study. A flow cytometric method was required due
to the small volume of blood available. Additionally the agent would need to be specific
for apoptotic cells and exclude cells dying by necrosis. Activation of the caspase
pathway is specific to apoptosis and does not occur in death by necrosis. HIV is a
dangerous pathogen thus all samples must be fixed before acquired on flow cytometers
thus the assay chosen had to be amenable to fixing. This precluded the use of annexin
V, 7AAD and propidium iodide. Therefore apoptosis was measured by flow cytometry
using the Vybrant FAM poly caspase kit (Invitrogen). The active agent is a green
fluorescent inhibitor of caspases (FLICA), which binds irreversibly to the cysteine
group on active caspases.
2.2.4.2 Optimisation of protocol
The protocol supplied by the manufacturer was designed for cultured cells therefore had
to be adapted for this study. A 150X stock solution of FLICA reagent was prepared
according to manufacturer‟s instruction by adding 50 μl of DMSO (supplied in the kit)
to the lyophilized FLICA reagent and mixing. The stock solution was divided in 5
aliquots of 10 μl and then stored at -20 °C. To prepare the 30X FLICA reagent working
solution, after thawing at room temperature 40 μl of PBS was added to an aliquot of
150X FLICA and mixed. 30X FLICA solution was added to aliquots of whole blood to
produce the following dilutions 1/30 (recommended by manufacturer) 1/50, or 1/100.
After mixing, the blood was incubated for 60 min at room temperature. The red cells
were then lysed as described in section 2.2.1. Using 2 ml of the apoptosis wash buffer

85
supplied with the kit, lysed red cells were removed by washing at 300 xg for 5 min then
the remaining PBMCs were fixed using 60 µl of the formaldehyde solution provided
with the kit.
To generate a positive control, camptothecin, a potent inhibitor of topoisomerase I,
which is required for DNA synthesis was used to induce apoptosis. Fresh whole blood
was aliquoted into two wells of a tissue culture plate. Camptothecin was added to one
well to give a final concentration of 10 µM. The blood was placed in an incubator for 4
hours at 37 °C, 5% CO2. The non-induced and camptothecin blood were then divided
into 4 aliquots. Each aliquot was incubated for a further hour with no FLICA or with
FLICA at one of the following dilutions, 1/30, 1/50 and 1/100.
Use of FACS Lyse solution was associated with non-specific binding of FLICA
therefore a hypotonic ammonium chloride lysis buffer without fixative, Pharm Lyse
(Becton Dickinson, Oxford, UK) was used according to manufacturer‟s instructions. As
before 30X FLICA was added to 100 µl whole blood at a concentration of 1/50 (v/v)
and incubated for 1 hour at room temperature. Then 1 ml of Pharm Lyse was added, the
sample vortexed and incubated at room temperature for 15 min. The sample was washed
with 2 ml of apoptosis wash buffer at 200 xg for 5 min and the supernatant carefully
pipetted off. The wash step was repeated and then the remaining cells fixed. However
this method of red blood cell lysis was not robust especially when used on HIV infected
blood samples. Incomplete lysis frequently occurred. Thus it was decided not to remove
the red blood cells but instead to titrate the volume of FLICA reagent for whole blood
unlysed.
2 µl of 30X FLICA reagent was added to 100 µl of whole blood and incubated at room
temperature for 1 hour. The wash buffer and fixative supplied with the kit were used to
wash off the excess FLICA, which diffuses out of the cell, and to fix the cells as
described previously. The stained cells were then suspended in 500 µl PBS and passed
through a 40 µm cell strainer to avoid clogging the flow cytometer. The flow cytometers
used only allowed parameters to be saved for 10 million cells, which included only

86
1000-5000 CD4+ cells. Thus to allow for at least 10,000 CD4
+ T cells to be acquired the
threshold was changed from FSC to CD4 expression thus only CD4+ cells would be
considered as an event/cell.
2.2.5 Isolation of naïve and memory CD4+ T cells
CD4+ T cells were isolated from PBMCs using the Miltenyi CD4
+ T Cell Isolation Kit
II (Miltenyi Biotech, Bergisch Gladbach, Germany) according to manufacturer‟s
instructions except that PBMCs were incubated with antibody cocktail for 60 min
instead of 30 min.
PBMCs were thawed as described in 2.2.1.3 then centrifuged at 300 x g for10 min at 4
°C. The supernatant was completely removed. The pellet was resuspended in 40 µl
MACS Buffer and 12 µl of biotin-antibody cocktail was added. The solution was mixed
well and incubated for 30 min at 4 °C. After adding 30 µl MACS Buffer and 23 µl anti-
biotin microbeads and mixing, cells were washed with another 600 µl buffer at 300 x g
for 10 min. The supernatant was completely removed and the pellet resuspended in 500
µl buffer.
An MS column (Miltenyi Biotech, Bergisch Gladbach, Germany) was rinsed with 500
µl buffer and placed within the magnetic field of a MACS separator (Miltenyi Biotech,
Bergisch Gladbach, Germany). Then the PBMC cell suspension was applied to the
column. The effluent that dripped through the column, which contains the purified
CD4+ T cells was collected in a propylene centrifuge tube. The column was then
washed three times with 500 ul buffer and the entire effluent collected in the same tube.
Following this naïve and memory CD4+ T cells were isolated using the Miltenyi
CD45RO microbeads (Miltenyi Biotech) according to manufacturer‟s instructions. The
CD4+ cell suspension obtained previously was centrifuged at 300 x g for 10 min. The
supernantant was completely removed and the CD4+ cell pellet resuspended in 80 µl
MACS Buffer. 20 µl CD45RO microbeads were added. The cell suspension was mixed
87
and incubated for 30 min at 4 °C. The cells were washed with 2 ml buffer at 300 x g for
10 min. The supernatant was completely removed and the pellet resuspended in 500 µl
buffer.
MS column (Miltenyi Biotech, Bergisch Gladbach, Germany) was rinsed with 500 µl
buffer and placed within the magnetic field of a MACS separator (Miltenyi Biotech,
Bergisch Gladbach, Germany). Then the CD4+ T cell suspension was applied to the
column. The effluent that dripped through the column, which contains the purified
CD45RO-CD4
+ T cells was collected in a propylene centrifuge tube. The column was
then washed three times with 500 µl buffer and the entire effluent collected in the same
tube. The column was then removed from the magnet and bound cells, CD45RO+CD4
+,
flushed out with 1 ml buffer into a polypropylene tube.
2.2.6 DNA extraction
Cells were spun down for 10 min at 1400 rotations per minute (rpm). The supernatant
was decanted and the cells resuspended in 200 µl of supernatant and brought up to room
temperature. Whole genomic DNA was then extracted using the QIAamp DNA blood
minikit (Qiagen, Hiden, Germany) according to manufacturer‟s instructions. The kit
makes use of the broad spectrum serine protease, proteinase K, to break down the cells
exposing nucleic acid and to denature nucleases which would otherwise degrade the
nucleic acid. Buffers then stabilise nucleic acids and enhance selective DNA adsorption
to the QIAamp membrane. RNA does not adhere to the membrane.
DNA purity was assessed using a Nanodrop 2000 spectrophotometer.
2.2.7 Real-time PCR conditions
Two different enzyme formulations were available, QuantiTect (Qiagen) and Brilliant II
QPCR Mastermix (Stratagene). The thermal cycling conditions for each are shown in
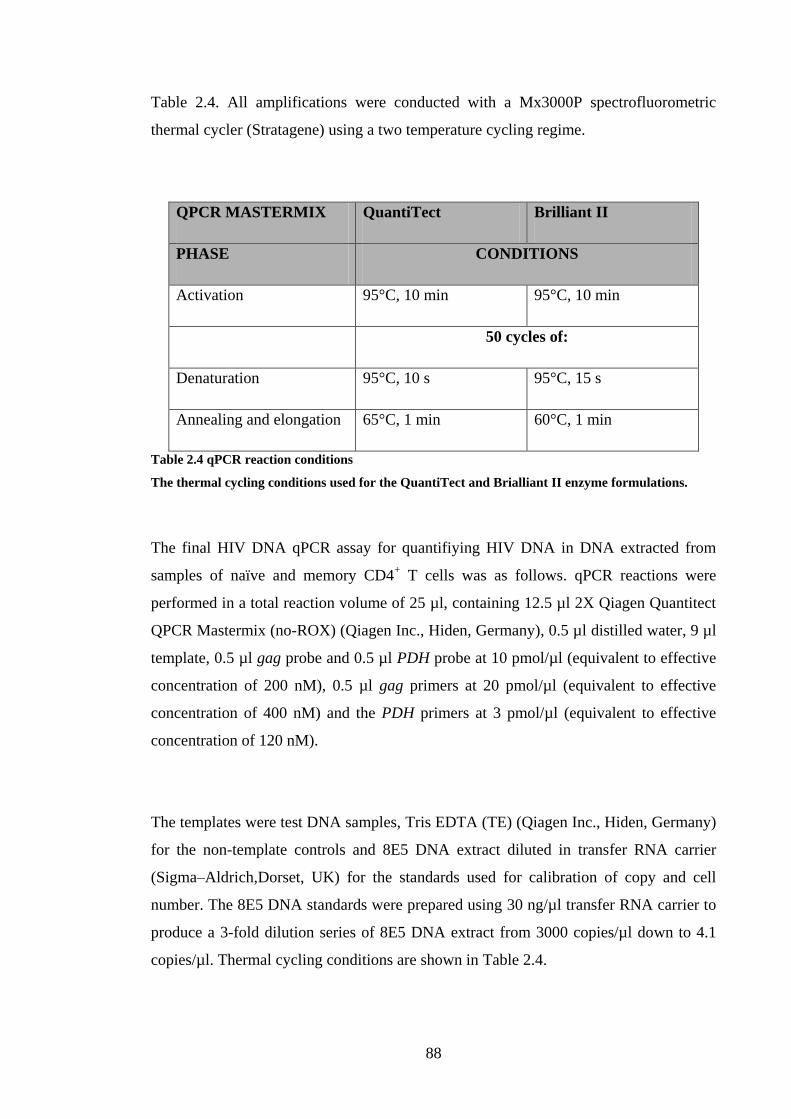
88
Table 2.4. All amplifications were conducted with a Mx3000P spectrofluorometric
thermal cycler (Stratagene) using a two temperature cycling regime.
QPCR MASTERMIX QuantiTect Brilliant II
PHASE CONDITIONS
Activation 95°C, 10 min 95°C, 10 min
50 cycles of:
Denaturation 95°C, 10 s 95°C, 15 s
Annealing and elongation 65°C, 1 min 60°C, 1 min
Table 2.4 qPCR reaction conditions
The thermal cycling conditions used for the QuantiTect and Brialliant II enzyme formulations.
The final HIV DNA qPCR assay for quantifiying HIV DNA in DNA extracted from
samples of naïve and memory CD4+ T cells was as follows. qPCR reactions were
performed in a total reaction volume of 25 µl, containing 12.5 µl 2X Qiagen Quantitect
QPCR Mastermix (no-ROX) (Qiagen Inc., Hiden, Germany), 0.5 µl distilled water, 9 µl
template, 0.5 µl gag probe and 0.5 µl PDH probe at 10 pmol/µl (equivalent to effective
concentration of 200 nM), 0.5 µl gag primers at 20 pmol/µl (equivalent to effective
concentration of 400 nM) and the PDH primers at 3 pmol/µl (equivalent to effective
concentration of 120 nM).
The templates were test DNA samples, Tris EDTA (TE) (Qiagen Inc., Hiden, Germany)
for the non-template controls and 8E5 DNA extract diluted in transfer RNA carrier
(Sigma–Aldrich,Dorset, UK) for the standards used for calibration of copy and cell
number. The 8E5 DNA standards were prepared using 30 ng/µl transfer RNA carrier to
produce a 3-fold dilution series of 8E5 DNA extract from 3000 copies/µl down to 4.1
copies/µl. Thermal cycling conditions are shown in Table 2.4.

89
2.2.8 Statistical analysis
Statistical analyses were performed using GraphPad InStat software (version 3.06;
GraphPad). All tests for statistical significance were two-tailed and p values <0.05 were
considered significant. Where p values and coefficients required rounding they were
rounded off to the nearest 2 significant figures. The population characteristics of both
cohorts are described by their medians and interquartile ranges (IQR) as data was non-
parametric. The difference in the distribution of a parameter such as percentage of a
subset between 2 groups such as HIV-1 infected children and uninfected adults was
tested for statistical significance using the Mann-Whitney test (or Kruskal-Wallis if
more than 2 groups were compared) as data was non-parametric. Associations between
2 continuous variables were tested for statistical significance using the Spearman‟s rank
correlation test. To visualise the association, the variables were plotted against each
other and GraphPad set to fit the appropriate regression line (and its associated 95%
confidence interval).

90
CHAPTER 3
CHARACTERISING
CD4+ T CELLS FROM
CHILDREN WITH
HIV

91
3.1 INTRODUCTION
3.1.1 Identifying CD4+ T cells by flow cytometry
As discussed in chapter one, HIV infection and treatment with HAART are associated
with changes to the balance of CD4+ T cell subsets. Since the conception of flow
cytometry most laboratories in the developed world and increasingly in the developing
world use flow cytometry to quickly and accurately study and quantify these sub-
populations in large numbers of samples, while requiring only very small sample
volumes. To accurately assess these sub-populations, red blood cells are excluded either
through red cell lysis leaving all the populations of peripheral blood leukocytes (PBLs)
or by density gradient centrifugation which removes red blood cells (RBCs) and
frequently polymorphonuclear cells thus only the peripheral blood mononuclear cells
(PBMCs) composed of lymphocytes and monocytes remain (Patel, Ford, & Rickwood
1998), (McCarthy 2001).
Flow cytometry identifies cell populations through differentiation of their size,
granularity and antigenic expression (Carter and Ormerod 2000). Lymphocytes, of
which CD4+ T cells are a subset, can be distinguished from other leukocytes by their
smaller size and lack of granularity. CD4+ T cells express a wide range of extracellular,
cytoplasmic and nuclear proteins, which can be used to differentiate them from other
lymphocytes. Expression of CD3, an integral part of the T cell receptor distinguishes T
cells from B cells and natural killer cells. Use of antibodies specific for CD4 and CD8
enables discrimination between CD4+ T cells and CD8
+ T cells. Monocytes and
macrophages also express CD4 but the density of CD4 molecules on the cell surface is
so much lower on these cells than on CD4+ T cells that they can be distinguished from
one another (Stewart, Fujimoto, & Levy 1986).
3.1.2 Distinguishing between naïve and memory CD4+ T cells
CD4+ T cells can be divided into numerous functional subsets with differing expression
of surface and intracellular proteins. A commonly used functional division of CD4+ T
92
cells is into naïve and memory cells which can themselves be further subdivided into
several populations.
As mentioned in chapter one, different isoforms of the leucocyte common antigen,
CD45, can be used to identify different subsets of CD4+ T cells. CD45 is a high
molecular weight glycoprotein expressed on leucocytes and immature RBCs. CD45 has
a cytoplasmic tail and an extracellular domain. The cytoplasmic region is extremely
conserved among mammals, showing 95% homology in the species analyzed. In
contrast, the expression of the extracellular domain is highly variable, showing only
35% homology. The variation in the extracellular domain means that CD45 exists as
various isoforms with molecular weight ranging from 180 kDa to 240 kDa. Variation in
the extracellular domain is produced by alternative splicing of exons 4, 5, and 6, also
called A, B and C, which can generate at least eight different isoforms, protein
expression of five of these have been detected in humans (Hermiston, Xu, & Weiss
2003). The structure of the highest, CD45RABC, and lowest, CD45RO, molecular
weight isoforms are shown in Figure 3.1.

93
Figure 3.1 Illustration of the structure of CD45
The high (CD45RABC) and low (CD45RO) molecular weight isoforms of CD45 are shown on the
left and right respectively. CD45RABC contains exons 4/A, 5/B and 6/C and CD45RO lacks all 3
consisting of just the cysteine−rich domain followed by three fibronectin type III (Fn III)−like
repeats, a single transmembrane region and a long intracellular tail containing two tandemly
duplicated PTPase homology domains, D1 and D2. Reproduced from (Penninger et al. 2001).
Peripheral blood T cells express four isoforms of CD45 with the following molecular
weights, 180, 190, 200 and 220 kDa. The monoclonal antibody CD45RA binds to the
high molecular weight isoforms and the monoclonal antibody CD45RO binds to the
low, 180 kDa molecular weight isoform (Terry, Brown, & Beverley 1988), (Rogers et
al. 1992). Akbar et al demonstrated that upon activation of T cells expressing the high
molecular weight isoforms (CD45RO-, ubiquitin carboxyl-terminal esterase L1
-
(UCHL1-)), up to 40% of the cells co-express both high (CD45RA
+) and low
(CD45RO+, UCHL1
+) molecular weight isoforms of CD45 by day 3, and by day 7
CD45RA+ UCHLl
- cells fell from 90 to less than 21 % whereas CD45RA
-UCHLl
+ cells
rose from 2 to 93%. This change was unidirectional as stimulated CD45RA-UCHLl
+
cells remain CD45RA-UCHLl
+ during 7 days in culture (Akbar et al. 1988).

94
When CD45RA+ T cells were challenged with alloantigen by culturing with allogeneic
non-T cells in a mixed lymphocyte reaction, two populations were found: a population
of small un-activated lymphocytes that remained CD45RA+ UCHL1
- and a population
of large activated blast cells, the majority of which expressed UCHL1. When these two
populations were separated and re-challenged with the same alloantigen, UCHL1+ T
cells showed 7 to 20-fold more proliferation than the CD45R+
population as determined
by [3H] thymidine incorporation (Akbar et al 1988).
Taken together these results suggest that on T cells the high molecular weight form of
CD45, CD45RA is expressed on naïve cells, that activation of naïve cells results in the
acquisition of a memory phenotype, which is characterised by acquisition of the low
molecular weight form of CD45, UCHL1, now known as CD45RO, and loss of
CD45RA expression and that memory cells do not regain expression of CD45RA.
However Rothstein et al. subsequently demonstrated that cyclic re-stimulation of
polyclonal CD45RA+ cell lines derived from peripheral blood CD4
+CD45RA
+ cells
could produce CD45RO+ cells that regained CD45RA expression after re-stimulation,
whilst still retaining CD45RO expression (Rothstein et al. 1991). This was also
demonstrated in T cells and NK cells in culture (Warren and Skipsey 1991). Arlettaz et
al also showed in bone marrow transplant recipients that reacquisition of CD45RA
expression by CD45RA-CD45RO
+ cells occurs without loss of CD45RO expression
(Arlettaz et al. 1999). In a similar study a population of CD4+ CD45RA
+ cells from
patients who had received haematopoietic cell transplants were shown to display
effector function and phenotype, and the authors suggested that the CD45RA antigen
should not be used alone to define naïve CD4+ T cells when monitoring T cell
reconstitution (Fallen et al. 2003). However it has been shown that when CD45RA+ and
CD45RO+ CD4
+ T cells are sorted from the peripheral blood of both individuals allergic
and non-allergic to house dust mite, in all the individuals tested, the larger polyclonal
response was seen in the CD45RO+ population (Richards et al. 1997).
3.1.3 Sub-populations of memory CD4+ T cells
Although CD4+ T cells are very heterogeneous, in terms of their phenotype and
functional capabilities, two memory cell subsets are commonly recognised, central
memory and effector memory cells (Sallusto et al 2000). Central memory cells, which

95
are longer lived are important in HIV infection because long lived resting memory cells
are the major stable reservoir of latent HIV virus (Chun et al. 1997), (Chomont et al.
2009). Central and effector memory cells were originally thought to be distinguishable
by differential expression of the lymphoid homing cysteine chemokine receptor, CCR7,
which is restricted to central memory cells (Sallusto et al. 1999), however, there is
contrasting evidence that most cytokine-secreting T cells, which have an effector
phenotype, are CCR7+
and may be capable of lymphoid homing (Kim et al. 2001).
Other phenotypic markers that may distinguish between central and effector memory
cells have been proposed including CD27. CD27 is a lymphocyte specific member of
the TNF receptor family that regulates T cell survival through interaction with its ligand
CD70. CD27 can be constitutively expressed on T cells but its expression is upregulated
following T cell activation. It is preferentially expressed on CD45RA+ CD4
+ T cells
(Sugita et al. 1992), (Croft 2009). Upon TCR ligation, CD27 expression is transiently
increased and then irreversibly lost after repeated antigenic stimulation. CD27- memory
cell populations contain a high frequency of differentiated T-helper cells that secrete
considerable amounts of cytokines (Hintzen et al. 1994), (Hamann et al. 1999). Thus
central memory cells are believed to express CD27, whilst effector memory cells lack
CD27 expression (Sallusto et al 1999).
Another co-stimulatory molecule that has been proposed to divide memory cells into
functionally different populations is CD28. As mentioned in chapter one, co-stimulatory
molecules act to reduce the threshold for TCR activation thus when CD28 is present
CD4+ T cells respond more rapidly to lower levels of TCR occupancy. Upon
engagement of CD28, membrane and intracellular kinase-rich raft microdomains cluster
at the sites of TCR ligation (Viola et al. 1999). CD28 is not absolutely essential for
CD4+
effector/memory T-cell development, as these cells can be generated in reduced
numbers in CD28-/-
mice (Dooms and Abbas 2006). Memory cells display differential
expression of CD28 and those lacking CD28 expression have been shown to be
terminally differentiated with shorter telomeres (Appay et al. 2002), (Appay 2004).

96
Analysing CD4+ T cells using a combination of the phenotypic markers thus far
described including, CD45RA, CCR7, CD27 and CD28 yields several populations.
CD45RA+ cells are fairly homogenous in that the majority (>90%) are
CCR7+CD27
+CD28
+. Central memory cells are also CCR7
+CD27
+CD28
+ Based on
these markers three populations of effector memory cells are defined, CCR7-
CD27+CD28
+, CCR7
-CD27
-CD28
+ and CCR7
-CD27
-CD28
- , of which the latter are the
most terminally differentiated (Okada et al. 2008).
3.1.4 Recent thymic emigrants
An increase in naïve cell numbers has been observed in children receiving ART
(Hainaut et al 2003), (Gibb et al 2000), which could be due to increased thymic output,
increased division of existing naïve cells in the periphery and/or decreased loss of naïve
cells from the periphery. Therefore it is important in understanding HAART associated
naïve cell increases to be able to quantify thymic output or identify naïve cells that have
newly emerged from the thymus, denoted as recent thymic emigrants (RTEs).
Initially thymic output was estimated by real-time PCR quantification of TCR excision
circles (TRECs). T cells in the thymus undergo a rearrangement of V, D and J gene
segments to produce a large variety of TCRs. In the process, the intervening
chromosomal DNA is excised resulting in the formation of small circular episomes,
called TRECs. As TRECs are generated during thymic T cell gene rearrangement, and
as episomal DNA is not replicated during cell division, TRECs were previously
considered as a surrogate measurement for thymic activity and the entry of newly
formed T cells into the T cell pool (Kong et al. 1999). However, this was confounded by
the discovery that altered rates of proliferation within the naïve pool will affect the
TREC count (Hazenberg et al. 2000) because a decrease in TREC count could be
accounted for both either decreased thymic output or the diluting effect of increased
CD4+ T cell proliferation.
Until recently it did not appear to be possible to distinguish phenotypically between
RTEs and long-lived naive cells in the periphery. However a seminal study using the

97
platelet endothelial cell adhesion molecule-1 (PECAM-1), also known as CD31,
identified two populations of CD45RA+ CD4
+ T cells with disparate TREC content.
TRECs were found to be highly enriched in the CD31+ population and barely present in
the CD31- population. Furthermore, the CD45RA
+CD31
+ cell population was shown to
diminish with increasing age. In addition the low production of effector cytokines by
CD45RA+CD31
+ cells indicates the suitability of using co-expression of CD31 and
CD45RA as a marker of RTEs (Kimmig et al. 2002).
Kimmig et al. put forward a model of naïve CD4+ T cell homeostasis based on an in
vitro study that showed loss of CD31 after TCR triggering. They suggested that naïve
cells can be divided into two groups: RTEs that express CD31 and central naïve cells
that do not express CD31. In this model, activation of either of these groups within the
periphery by foreign antigen leads to their differentiation into CD45RO+ (memory)
CD4+ T cells. However RTEs when presented with self antigen undergo homeostatic
proliferation and lose CD31 expression and differentiate into central naïve cells.
Although this work was concerned only with naïve cells, a subsequent study added to
this evidence by demonstrating the progressive loss of CD31 and gain of CD45RO
expression by CD31+ cells, by showing that telomere length was longest in CD45RO
-
CD31+, then CD45RO
-CD31
-, CD45RO
+CD31
+ and least in CD45RO
+CD31
- cells.
They also showed telomerase activity was much higher in CD45RO-CD31
+ than
CD45RO-CD31
- cells (Junge et al. 2007).
3.1.5 Activated CD4+ T cells
Activation, proliferation and apoptosis were discussed in chapter one as important
processes maintaining and regulating the number of CD4+ T cells. The expression of
numerous proteins have been characterised as evidence of these processes occurring.
Activation of CD4+ T cells results in a wide variety of cellular changes including the
induction of specific gene expressions. The change in expression levels of these gene
products can be used to identify changes in the activation state of a CD4+ T cell. One of
the earliest molecules to be expressed is CD69, also known as activation inducer

98
molecule, very early activation antigen, MLR-3 and Leu-23. CD69, which is a
glycoprotein that serves as a co-stimulatory molecule for T cell proliferation, can be
found on the cell surface within 2 hours of activation and can persist for at least 3 days
CD69 expression can be induced by activating T cells through the CD3/TCR complex,
CD2 or CD28 and also by stimulation with phytohaemagglutinin (PHA) or phorbol
myristate acetate (PMA) (Ziegler, Ramsdell, & Alderson 1994), (Marzio, Mauel, &
Betz-Corradin 1999). Conversion from a naïve (CD45RA+) to a memory phenotype
(CD45RO+) has been shown to be associated with activation, as determined by
increased CD69 expression, and proliferation, as determined by bromodeoxyuridine
incorporation (Johannisson and Festin 1995). When naïve cells are activated by
interferon-alpha (INF-α) they do not undergo division but express CD69, therefore
CD69 is most likely an activation specific not a proliferation specific protein (Tough et
al. 1999). In patients with rheumatoid arthritis and chronic inflammatory disease
unstimulated peripheral blood T lymphocytes do not express CD69 but high percentages
of CD69+ T cells have been found in unstimulated synovial fluid from rheumatoid
arthritis patients and in the liver of patients with chronic inflammatory liver diseases
(Marzio, Mauel, & Betz-Corradin 1999).
Another commonly used marker of T cell activation is nicotinamide adenine
dinucleotide glycohydrolases/adenosine diphosphate ribosyl cyclase (NADase/ADPRC)
enzyme, CD38. CD38 is a transmembrane glycoprotein within the extracellular domain,
and is expressed by T cells, B cells, dendritic cells and granulocytes. CD38 exerts its
functions in T cells by cell surface association with the TCR/CD3 complex and can
produce cell activation and proliferation, transcription of cytokine genes, apoptosis and
tyrosine phosphorylation of intracellular proteins. Although resting T cells express
CD38, the density of their expression is increased after activation (Malavasi et al.
2006).
Expression of HLA-DR has been detected on activated T cells (Schendel and Johnson
1985). HLA-DR is an MHC class II cell surface receptor encoded by the human
leukocyte antigen (HLA) complex on chromosome 6 (Kaufman et al. 1984). The
heterodimeric HLA-DR molecule and the specific peptide dimerise to act as a ligand for

99
TCRs on T cells specific for both the MHC and the antigen. As the primary function of
HLA-DR is to present antigen to CD4+ T cells it is typically found on APCs such as
macrophages, B cells and dendritic cells (Murphy, Travers, & Walport 2008). It is not
expressed on resting T cells but has been shown to be expressed on T cells activated by
alloantigen in a mixed leukocyte reaction (Evans et al. 1978), (Fu et al. 1978). It has
been suggested that the functional role of HLA-DR molecules expressed on activated
CD4+ T cells may be to deliver intracellular signals to opposing CD4
+ T cells
(Altomonte, Pucillo, & Maio 1999).
3.1.6 Proliferating CD4+ T cells
Numerous methods to quantify cellular proliferation or the growth fraction of a
population have been described. In chapter one the results of in vivo isotope labelling
studies which provided a measure of the rate of cell division were discussed. However
studies utilising the two most commonly used methods, heavy water and deuterated
glucose (Macallan et al 1998), (Neese et al 2001) have produced conflicting results. The
lack of consensus likely reflects the inability of these assays to distinguish between
mature cells dividing in the periphery and thymocytes that divided and were exported
during the labeling period (Bains et al 2009). Additionally such methods require the use
of large volumes of blood incompatible with paediatric studies such as those described
in this thesis.
In vitro methods based on various principles are available. Cell division requires the
synthesis of cellular DNA during S-phase therefore assays have been developed that
measure DNA synthesis. Most commonly cells are cultured in media containing
labelled nucleoside analogues such as tritiated thymidine (3H-thymidine) and
bromodeoxyuridine (BrdU), which are then incorporated into the DNA of dividing cells.
Such methods provide a measure of the DNA synthesis taking place during the period
of exposure to the label but not prior to this when the majority of proliferation may have
taken place (Lyons and Parish 1994). Therefore quantifying 3H-thymidine may well
underestimate the growth fraction.

100
The quantity of an intracellular protein will halve when a cell divides therefore
detecting the dilution of an intracellular protein that has been labelled with fluorescent
dye can be used to measure the rate of cell division over time. Carboxyfluorescein
diacetate succinimidyl ester (CFSE) represents an improvement on this method. CFSE
is an intracellular fluorescent label that is divided equally between daughter cells upon
cell division. Compared to assays utilizing nucleotide analogues, CFSE allows the
division history of different populations in culture to be quantified and compared.
The proliferation assays thus far discussed are in vitro techniques, in that the cells are
cultured and therefore no longer represent normal physiology. Ex vivo detection assays
allow the quantification of the proportion of cells proliferating during the physiological
condition by detecting metabolites or cell cycle proteins, such as Ki67, that are
associated with cellular proliferation.
The Ki67 protein was characterised in 1983 (Gerdes et al. 1983). Gerdes et al found that
a monoclonal antibody generated by immunising mice with nuclei of a Hodgkin
lymphoma cell line was specific for a nuclear structure present exclusively in
proliferating cells. Ki67 was present in the nuclei of cells in the G1, S, and G2 phases of
the cell division cycle as well as in mitosis but cells in the G0 phase (quiescent or
resting cells) did not express Ki67 (Scholzen and Gerdes 2000). Therefore unlike other
methods which require cells to be in S phase at the time of processing, Ki67 assays can
identify cells at all stages of proliferation. However, there are limitations to the Ki67
assay, such as the incorrect identification of quiescent cells which have undergone S
phase, as actively proliferating. Furthermore, Ki67-based assays can only estimate the
growth fraction but not the intermitotic time or rate of cell proliferation which would
also be relevant to any study of cell population kinetics. Additionally the functional role
of Ki67 within the cell cycle, if indeed it does perform a role in cell cycle regulation or
progression, remains unknown.

101
3.1.7 Apoptosis
In chapter one, apoptosis, programmed cell death, was described as a means of T cell
loss, thus investigating changes to the proportion of cells undergoing apoptosis is
important to understanding and characterising CD4 depletion and restoration during
HIV infection. Many methods to investigate apoptosis have been developed, however
the major limitation is the insensitivity of some assays to distinguish between apoptosis
and necrosis. Necrosis, which is cell death due to severe damage, differs significantly
from apoptosis; it is characterised by osmotic dysregulation, cell swelling and lysis
unlike apoptosis, which is characterised by chromatin condensation and
internucleosomal DNA fragmentation, together with cell shrinkage and membrane
blebbing (Hotchkiss et al. 2009). A third type of cell death, autophagy, which is an
energy generating process by which a cell digests its own organelles and
macromolecules, is recognised but is restricted to starving cells (Loos and Engelbrecht
2009). Assays based on the detection of steps common to apoptosis and necrosis will
not distinguish between the two pathways for example DNA fragmentation, detected by
TUNEL and comet assays, is common to both processes (Grasl-Kraupp et al. 1995),
(Collins et al. 2008). Although necrosis is an important process in disease no significant
increase is seen in HIV infection in vivo (Echaniz, de, & Cuadrado 1995).
Two major apoptosis pathways are recognised, one mediated by death receptors and the
other mitochondrially mediated (Figure 3.2). However they both include the activation
of the enzyme caspase 3 therefore this can be used to detect apoptosis taking place via
either pathway (Hotchkiss et al 2009).
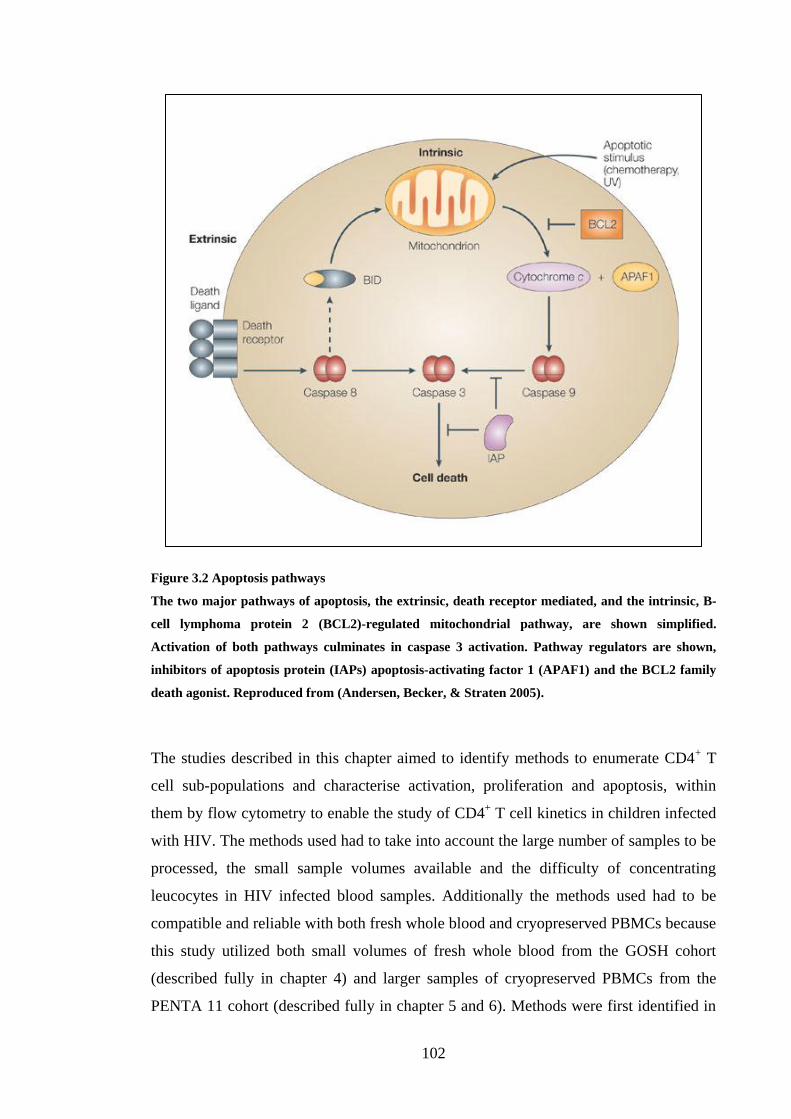
102
Figure 3.2 Apoptosis pathways
The two major pathways of apoptosis, the extrinsic, death receptor mediated, and the intrinsic, B-
cell lymphoma protein 2 (BCL2)-regulated mitochondrial pathway, are shown simplified.
Activation of both pathways culminates in caspase 3 activation. Pathway regulators are shown,
inhibitors of apoptosis protein (IAPs) apoptosis-activating factor 1 (APAF1) and the BCL2 family
death agonist. Reproduced from (Andersen, Becker, & Straten 2005).
The studies described in this chapter aimed to identify methods to enumerate CD4+ T
cell sub-populations and characterise activation, proliferation and apoptosis, within
them by flow cytometry to enable the study of CD4+ T cell kinetics in children infected
with HIV. The methods used had to take into account the large number of samples to be
processed, the small sample volumes available and the difficulty of concentrating
leucocytes in HIV infected blood samples. Additionally the methods used had to be
compatible and reliable with both fresh whole blood and cryopreserved PBMCs because
this study utilized both small volumes of fresh whole blood from the GOSH cohort
(described fully in chapter 4) and larger samples of cryopreserved PBMCs from the
PENTA 11 cohort (described fully in chapter 5 and 6). Methods were first identified in

103
blood samples from uninfected adult donors and then verified in blood samples from
HIV-1 infected children because cell separation and flow cytometry procedures to
identify sub-populations of cells in blood from HIV-1 infected donors can often produce
poorer or less distinct populations.
3.2 METHODS
3.2.1 Blood collection
As described in chapter 2, whole blood was obtained from healthy adults and HIV-1
infected children by venesection and anticoagulated by collection into tubes prepared
with EDTA.
3.2.2 Lymphocyte enrichment
Where lymphocyte enrichment was required this was achieved either by lysis of RBCs
or density gradient centrifugation as described in chapter 2.
3.2.3 Flow cytometry
A full list of the antibodies and reagents used to stain cells for flow cytometry is
provided in chapter 2 with corresponding fluorochromes along with the methods used.
Three-colour flow cytometry was performed on a FACSCalibur (BD) and four-colour
on a Cyan (Dako). All analysis was performed with Summit v4 (Dako).

104
3.3 RESULTS
3.3.1 Identifying CD4+ T lymphocytes: density gradient centrifugation
PBMCs were isolated from fresh whole blood from healthy adult donors. An aliquot
from each donor was cryopreserved and the remainder incubated with antibodies against
CD4 and CD3 then analysed by flow cytometry. Two populations were identified that
expressed CD4, one population that expressed high levels of CD4 (CD4high
) and another
that expressed low levels (CD4low
) (Figure 3.3A). The CD4high
and CD4low
populations
were found to have distinctly different FSC and SSC profiles. CD4high
was represented
by a smaller and less granular population (Figure 3.3B). Additionally the CD3
expression was found to be restricted to the CD4high
population.
A B
C
Figure 3.3. CD3 and CD4 expression in PBMCs from a healthy adult donor
A) A CD4high
(red peak, R1) and CD4low
(blue peak, R2) population are marked on the histogram
and applied to the FSC versus SSC dot plot, B). The CD4high
cells are almost exclusively located in
R3, a region of low FSC and SSC and the CD4low
cells are mostly located in R4, a region of high
FSC and SSC. C) The CD4high
(red peak, R1) and CD4low
(blue peak, R2) populations are then
applied to a histogram of CD3 expression.

105
The cryopreserved PBMC aliquots were thawed 24 hours later and similarly processed
by incubating with antibodies against CD3 and CD4. As described with the fresh
samples, two CD4 populations were identified, a CD4high
population of small non-
granular cells and a CD4low
population of larger more granular cells where CD3
expression was restricted to the CD4high
population.
Fresh and cryopreserved PBMCs from HIV-1 infected children were incubated with
antibodies against CD3 and CD4 and analysed by flow cytometry. As with the PBMCs
from the healthy adult donors, two distinct CD4 populations separated by size and
granularity with visible were CD3 expression was restricted to the CD4high
population.
(Figure 8.1).
3.3.2 Identifying CD4+ T lymphocytes: red cell lysis
Density gradient separation was not feasible on blood samples from the GOSH cohort
as theses were a great number of samples of low volume, less than 1 ml. In these
samples leukocytes would be concentrated by lysis of red cells. Therefore fresh whole
blood from healthy adult donors was incubated with antibodies against CD3 and CD4.
After red cell lysis and fixation cells were analysed by flow cytometry. As with
PBMCs, analysis revealed two distinct CD4 populations, CD4high
and CD4low
, separated
by size and granularity (Figure 3.4). Incomplete red cell lysis was occasionally observed
but as the red cells and cell fragments were very small relative to the leukocytes and did
not stain for CD3 or CD4 they were easily excluded.

106
HD red cell lysis
A B
C
Figure 3.4 CD3 and CD4 expression in red cell lysed whole blood from a healthy adult donor
A) A CD4high
(red peak, R1) and CD4low
(blue peak, R2) population are marked on the histogram
and applied to the FSC versus SSC dot plot, B). The CD4high
cells are almost exclusively located in
R3, a region of low FSC and SSC and the CD4low
cells are mostly located in R4, a region of high
FSC and SSC. C)The CD4high
(red peak, R1) and CD4low
(blue peak, R2) populations are then
applied to a histogram of CD3 expression.
Similarly fresh whole blood from HIV-1 infected children was incubated with
antibodies directed against CD4 and analysed by flow cytometry following red cell
lysis. Similarly to whole blood from healthy adult donors distinct CD4high
and CD4low
populations with greater incomplete lysis were seen (Figure 8.2).
3.3.3 Defining CD4+ T lymphocytes as naïve and memory populations by
expression of CD45RA and CD45RO
As discussed in chapter 1, CD4+ T cells can be divided into naïve and memory
populations. It has been established in CD4+ T cells that differentiation from a naïve to
memory phenotype is associated with decreased expression of the RA isoform of CD45
and increased expression of the RO isoform (Akbar et al 1988). Therefore naïve cells
and memory cells can be distinguished by either CD45RA or CD45RO expression.
However small populations of primed CD4+ T cells that express both CD45RA and
CD45RO have been described (Hamann et al 1996).

107
The proportion of CD4+CD45RA
+ cells that also expressed CD45RO was investigated
in both uninfected adult donors and in HIV-1 infected children by incubating blood with
antibodies against CD4, CD45RA and CD45RO and analysed by flow cytometry
(Figure 3.5). There was little overlap between CD45RA and CD45RO expression in
both the uninfected adults and HIV-1 infected children tested. From 6 adults and 11
children the mean proportion of CD45RA+ cells that co-expressed CD45RO was 2.4%
and 2.8% respectively, which were not significantly different (Mann-Whitney test
p=0.72). Interestingly gating on CD45RA- CD4
+ lymphocytes in the 6 adults and 14
children found that CD45RO expression was not universal, a mean proportion of 88.2%
and 91.0% expressed CD45RO, which was not significantly different (Mann-Whitney
test, p=0.27) (Figure 3.6).
A B
Figure 3.5. Representative dot plot and histogram of CD45RA and CD45RO expression
A) dot plot of CD45RA and CD45RO expression by CD4+ T cells from one individual. (B)
Histogram of CD45RA expression (red) with CD45RO expression overlayed (green).

108
Figure 3.6 CD45RO expression by CD45RA+ CD4
+ cells in HIV-1 infected children and uninfected
adults
CD45RO expression by CD45RA+ CD4
+ T cells from 11 HIV-1 infected children (red) was
compared to 6 uninfected adults (blue). Similarly CD45RO expression by CD45RA- CD4
+ T cells
was compared between the two groups. Statistical differences between the adults and children are
shown.
3.3.4 CCR7 and CD27 expression by CD45RA CD4+ T cells
As mentioned previously naïve CD4+ T cells have been described as having fairly
homogenous expression of CD27 (Croft 2009;Sugita et al 1992) and CCR7 (Okada et al
2008). Therefore the expression of CD27 and CCR7 by CD45RA+ T cells was
investigated in 10 HIV-1 infected children and 6 uninfected adults. Peripheral blood
was incubated with CD4, CD45RA and either CCR7 or CD27. In the 10 children
sampled it was found that CD4+CD45RA
+ have almost universal expression of CD27
(mean=99.43%) and CCR7 (mean=99.59%) (Figure 3.7). Similarly amongst the 6 adults
mean CD27 and CCR7 expression were 99.53% and 99.60%. Additionally a Wilcoxon
matched pairs test showed no statistical difference between the level of CCR7 and
CD27 expression (p=0.23 and p=0.34) for the children and adults respectively.

109
0
20
40
60
80
100
CD27 CCR7
% o
f C
D45R
A+ C
D4
+ T
cell
s
Figure 3.7. Comparison of CD27 and CCR7 expression by CD45RA+ T cells
CD27 and CCR7 are expressed by almost all CD45RA+ T cells in HIV-1 infected children. There
was no statistical difference between the level of CD27 and CCR7 expression for each child.
3.3.5 Defining memory CD4+ T cells by CD27 versus CCR7 expression
CD27 and CCR7 expression by memory cells is more variable than for naïve cells. Co-
staining with CD45RA and CD27 or CD45RA and CCR7 allows CD4+ memory
(CD45RA-) cells to be subdivided into 2 functionally distinct group characterised by
expression or lack of expression of CD27 or CCR7 (Sallusto et al 1999). This was
carried out on blood samples from ten children and six uninfected adults. The difference
between the percentage of CD4+ cells that were CD45RA
-CD27
+ and the percentage of
CD4+ cells that were CD45RA
-CCR7
+ was tested by Wilcoxon matched pairs test and
found to be non significant in children and adults (p=0.35 and p=0.46 respectively).
Representative dot plots from 1 child are shown (Figure 3.8).

110
Figure 3.8 CCR7 and CD27 both divide CD45RA- CD4
+ T cells into two populations.
Representative dot plots from one child showing that CD27 and CCR7 divide CD45RA- CD4
+ T
cells into two populations. The percentage of CCR7+ cells is not significantly different from the
percentage of CD27+ CD45RA
- CD4
+ T cells in each child (p=0.348).
3.3.6 Defining CD4+ T cell subsets by expression of CD45RA and CD31
Co-staining with CD45RA and CD31 allows CD4+ naive (CD45RA
+) cells to be
subdivided into 2 functionally distinct group characterised by expression or lack of
expression of CD31 (Kimmig et al 2002). Similarly the CD4+ memory (CD45RA
-) cells
are also divided. The significance, however, of CD31 expression or lack of expression
by CD4+ memory cells has not been investigated. Whole blood from 11 HIV-1 infected
children and 5 uninfected adult donors was incubated with antibodies against CD4,
CD45RA and CD31 and following red cell lysis were analysed by flow cytometry. In
both the adults and the children 4 distinct CD4+ T cell subpopulations were produced. A
representative dot plot of CD31 and CD45RA expression on CD4+ T cells from one
child is shown (Figure 3.9). However the proportions of the populations differed
significantly between the two sample groups. The percentage of CD45RA+CD31
+ was
significantly higher amongst the HIV-1 infected children than amongst the uninfected
adults (p=0.0007) whereas the percentage of CD45RA-CD31
- and CD45RA
+CD31
- cells
were significantly lower (p=0.008 and p=0.0047 respectively). There was no significant
different between the percentage of CD45RA-CD31
+ cells between the two groups
(Figure 3.10).

111
Figure 3.9 . Co-expression of CD45RA and CD31 by CD4+ T cells
Whole blood was incubated with anti-CD4, CD45RA and CD31 fluorochrome conjugated
antibodies. The immunostained cells were analysed by flow cytometry. A lymphocyte (FSC versus
SSC) and CD4 expression gate was applied and the enclosed CD4+ T cells were evaluated for their
expression of CD45RA and CD31.
0
20
40
60
80
100
p=0.0007
p=0.0047
p=0.0080
p=0.95
CD45RA+
CD31+
CD45RA+
CD31-
CD45RA-
CD31+
CD45RA-
CD31-
% o
f C
D4
+ T
cell
s
Figure 3.10 CD45RA and CD31 defined CD4+T cells in HIV-1 infected children and uninfected
adults
The proportions of CD45RA and CD31 defined CD4+ T cells were compared between 10 HIV-1
infected children (red) and 5 uninfected adults (blue) and tested for statistical significance by
Mann-Whitney test. The resulting values are indicated for each subpopulation.

112
3.3.7 Characterising activated CD4+ T helper cells
In response to specific antigen or non-specific co-factors CD4+ T cells can become
activated. Activation results in a change in global gene expression and therefore usually
results in the cell undergoing apoptosis, differentiation or division. Activation, as
discussed in chapter one section four, has been implicated in the pathogenesis of HIV
and thus should be investigated. The most common markers of CD4+ T cell activation
investigated by flow cytometry are CD38, CD69 and HLA-DR. Therefore to investigate
activation of CD4 subpopulations whole blood from 9 HIV-1 infected children and 7
uninfected adults was incubated with antibodies against CD4, CD45RA, and either
CD69, HLA-DR or CD38. CD4+ T cells were gated on and the expression of each
marker by the CD4+ T cell sub-populations, CD45RA
+ and CD45RA
- was determined
because HIV infection is associated with higher levels of activation and activation has
been demonstrated to be higher in memory cells than in naïve cells as discussed in
chapter one. The results for one child are provided (Figure 3.11), where the histograms
show the relative sizes of the CD69, CD38 and HLA-DR positive and negative fractions
in the CD4+ T cell pool and the dot plots compare the distribution of CD69, CD38 and
HLA-DR in the CD45RA+ and CD45RA
- CD4
+ T cells.
CD45RA APC
HLA-DR FITCCD38 FITCCD69 FITC
Figure 3.11. CD38, HLA-DR and CD69 expression on CD4+ T cells
Representative staining from one child. The histograms show the relative sizes of the CD69, CD38
and HLA-DR positive and negative fractions in the CD4+ T cell pool. The dot plots compare the
distribution of CD69, CD38 and HLA-DR in the CD45RA+ and CD45RA
- CD4
+ T cells.

113
The difference in expression of these proteins was tested between the sample groups
and the CD4+ T cell sub-populations (Figure 3.12). Expression of CD38 and HLA-DR
was significantly greater in HIV-1 infected children compared to uninfected adults but
CD69 expression did not differ significantly between the two groups. Within each
sample group protein expression was significantly greater by the CD45RA- population
than, CD45RA+ population. Comparing CD38, CD69 and HLA-DR, CD38 expression
was the highest and CD69 expression was the lowest in both samples and both CD4+ T
cell sub-populations.

114
Figure 3.12. Expression of CD38, HLA-DR and CD69 on CD4+ T cell s in children and adults
The box-whisker plots (A), (B) and (C) show the percentage expression of CD38, HLA-DR and
CD69 respectively by CD45RA+ and CD45RA
- CD4
+ T cell sub-populations in a group of HIV-1
infected children (red boxes) and uninfected adults (blue boxes). The line through each box
indicates the median. The statistical significance of the differences, produced by Mann-Whitney
test, between adults and children and between CD45RA+ and CD45RA
- sub-populations are shown.

115
The paucity of CD69 expression could have been due to the CD69 antibody failing to
bind or being used at too low a concentration. Thus to ensure this was not the case the
expression of CD69 by stimulated and non-stimulated cells was compared. Fresh whole
blood from three uninfected adult donors was divided into 2 aliquots. To one aliquot
from each donor PMA and ionomycin were added to a final concentration of 25 ng/ml
and 1 µg/ml respectively. Both aliquots were then incubated in an incubator for 4 hours
at 37 °C and 5% CO2. The blood was then incubated with anti-CD69 antibody and
processed and analysed as previously described. CD69 expression was greater in the
stimulated cells (Figure 3.13).
Figure 3.13 CD69 expression by stimulated and non-stimulated PBLs
Fresh whole blood from uninfected adult donors was incubated with and without PMA and
ionomycin and CD69 expression determined. Stimulated and non-stimulated cells are in red and
green respectively. The mean CD69 expression (R4) for the stimulated and non-stimulated PBLs
were 0.27% and 7.41% respectively
CD38 is constitutively expressed by naïve cells therefore it is problematic to divide cells
into a group that do not express and a group that do express CD38 (Malavasi et al
2006). So additionally, the relative fluorescent intensity was calculated (Figure 3.14).

116
FLUORESCENCE INTENSITY
MFI=4.19
MFI=18.09
ΔMFI=13.9
FLUORESCENCE INTENSITY
MFI=4.19
MFI=18.09
ΔMFI=13.9
Figure 3.14. Relative mean fluorescent intensity (MFI) of CD38 on CD45RA+ CD4
+ T cells
CD4+ CD45RA
+ T cells were evaluated for their expression of CD38. The CD38 MFI was calculated
by subtracting the MFI of a FITC conjugated IgG isotype (red peak) from the MFI of the FITC
conjugated CD38 antibody (green peak)
3.3.8 Investigating Ki67 expression by CD4 subsets
Proliferation is likely an important process in the CD4+ T cell decline and recovery
associated with HIV infection and HAART respectively because, as discussed in
chapter one, section two, it contributes to cell turnover. In this study an intracellular
antibody against the nuclear cell cycle protein, Ki67, was used to determine
proliferation. Ki67 has been shown to be expressed during the cell cycle but not in
quiescent cells, cells in G0. Ki67 expression was investigated in HIV-1 infected children
and uninfected adults and in CD45RA+ and CD45RA
- CD4
+ T cell sub-populations. A
representative dot plot of the relative Ki67 expression of CD45RA+ and CD45RA
-
CD4+ T cells for one child is shown (Figure 3.15).

117
Figure 3.15. Ki67 expression by CD4+ T cells
The figure shows Ki67 expression of CD45RA+ and CD45RA
- CD4
+ T cells for HIV-1 infected child.
The difference in Ki67 expression was compared between the HIV-1 infected and
uninfected sample groups and the CD4+ T cell sub-populations (Figure 3.16). Ki67
expression was significantly greater in HIV-1 infected children compared to uninfected
adults and within both sample groups Ki67 expression was significantly greater in the
CD45RA- population than the CD45RA
+ population.
0
10
20
30
40
CD45RA+ CD45RA-
p<0.0001
% K
i67 e
xpre
ssio
n
p<0.0001
p<0.0001
p<0.0001
Figure 3.16 Differential Ki67 expression by CD4+ T cell sub-populations in children and adults
Ki67 expression by CD45RA+ and CD45RA
- CD4
+ T cell sub-populations is displayed as a box-
whisker plots in red and blue for HIV-1 infected children and uninfected adults respectively where
horizontal bands indicate means and the significance of the differences, produced by Mann-
Whitney test, between adults and children and between CD45RA+ and CD45RA
- sub-populations
are shown.

118
3.3.9 Characterisation of CD31+ and CD31
- CD4
+ memory cells
As mentioned previously CD31 expression by CD45RA+ cells has in recent years been
used as an indication of recent thymic origin but the significance of CD31 expression by
CD4+ memory cells is not known. To investigate functional differences between CD31
+
and CD31- CD4
+ memory cells whole blood samples from 10 HIV-1 infected children
were stained with a combination of anti-CD4, anti-CD45RA, anti-CD31 and one of the
functional markers CD27, HLA-DR or Ki67 (Figure 3.17). The difference in the mean
expression of each of these markers between CD31+ and CD31
- CD4
+ memory cells
was analysed for statistical significance. There was a statistically significantly higher
expression of Ki67 in the CD31+ cells.
0
10
20
30
40
50
60
70
80
90
CD45RA-CD31
+
CD45RA-CD31
-
Ki67 HLA-DR CD27
CD4+ T cell sub-population
p=0.042
Population Characteristics
% e
xp
ressio
n
Figure 3.17. Characteristics of CD45RA-CD31
+ versus CD45RA
-CD31
- CD4
+ T cell sub-populations
The expression of the markers Ki67, HLA-DR and CD27 by CD45RA-CD31
+ and CD45RA
-CD31
-
CD4+ T cell sub-populations were compared for n=10 children.
3.3.10 Flow cytometric detection of apoptotic CD4+ T cells ex vivo and at 24 hours
Apoptosis is believed to be the principle mechanism of death of CD4+ T cells in HIV
infection hence a flow cytometric method of detecting and measuring apoptotic cells
was developed using FLICA, which binds to a caspase specific amino acid sequence. As
described in chapter 2 the FLICA reagent was obtained as part of the Vybrant FAM
Poly Caspases Assay Kit (Invitrogen, Molecular Probes, Paisley). To verify the volume

119
of FLICA required freshly drawn whole blood from three healthy donors was divided
into 3 aliquots of 100 µl. To each aliquot of blood, 30X FLICA solution was added to
produce the following dilutions 1/30 (recommended by manufacturer) 1/50, or 1/100.
The red cells were lysed, washed off and the remaining PBMCs fixed as described in
chapter 2. The percentage FLICA expressions at the 3 concentrations were compared by
flow cytometry using a lymphocyte gate (Figure 3.18). Each histogram is an overlay of
the FLICA expression of unlabelled lymphocytes (grey peak) and the FLICA expression
of labelled lymphocytes at that concentration of FLICA (red peak). All FLICA
concentrations produced similar population distributions on the histograms. Without an
isotype control for FLICA the unlabelled cells were used as a negative control. This
implied that all cells (red peak) expressed FLICA and were therefore apoptotic. It is,
however, unlikely that freshly drawn PBMCs would exhibit such high levels of
apoptosis. It is more likely that either, in each histogram the red peak, R2, was the
FLICA negative fraction, approximately 99%, and R3, a FLICA positive fraction, less
than 1% or that the FLICA was bound non-specifically and therefore expressed by all
cells.
(FLICA) (FLICA)
(FLICA)
BA
C
Figure 3.18 FLICA expression by lymphocytes from freshly drawn blood
Freshly drawn whole blood was incubated with 30X FLICA reagent at the following dilutions 1/100
(A), 1/50 (B) and 1/30 (C). A FSC versus SSC lymphocyte gate was applied and the FLICA
expression (red) overlayed with the FL1 distribution of unlabelled cells. For (A), (B) and (C)
FLICA R3 was 0.43, 0.49 and 0.59% respectively.

120
Investigating the specificity of FLICA binding without an appropriate negative control
required a positive control, a population of cells where the level of apoptosis would be
expected to be higher than in freshly drawn blood. The time taken to FLICA staining
post venesection was therefore used as a positive control, on the premise that the level
of apoptosis would have increased after 24 hours. The blood used in Figure 3.18 was
incubated for 24 hours at room temperature and processed as before using FLICA
solution at a 1/50 dilution. The sample was analysed as before, with unlabelled cells
overlayed and used as a negative control, grey peak (Figure 3.19). The blue peak of
FLICA expression showed the same distribution as Figure 3.18 and the region R4 made
up 1.06% of the histogram.
(FLICA)
Figure 3.19. FLICA expression by lymphocytes in 24 hour old blood
Freshly drawn whole blood was incubated for 24 hours at room temperature and stained with 7 µl
of 30X FLICA reagent. A FSC versus SSC lymphocyte gate was applied and the FLICA expression
(blue) overlayed with the FL1 distribution of unlabelled cells. R4 was 1.06%.
The comparison of FLICA expression in fresh versus whole blood was not conclusive
as it appeared that after 24 hours the expression of FLICA had only increased from
0.49% to 1.06%, which would have been unlikely. As the fresh and old samples were
acquired on different days though on the same flow cytometer, this small and
insignificant increase could have been due to analysing the samples on different days.

121
Therefore a second method to investigate the specificity of FLICA binding was
attempted. To generate a positive control, camptothecin, a potent inhibitor of
topoisomerase I, which is required for DNA synthesis was used to induce apoptosis.
Fresh whole blood was aliquoted into two wells of a tissue culture plate. Camptothecin
was added to one well to give a final concentration of 10 µM. The blood was placed in
an incubator for 4 hours at 37 °C, 5% CO2. The non-induced and camptothecin blood
were then divided into 4 aliquots. Each aliquot was incubated for a further hour with no
FLICA or with FLICA at one of the following dilutions, 1/30, 1/50 and 1/100. The
samples were processed as previously described and overlay histograms of the results
were generated (Figure 3.20). For each volume of FLICA used the FLICA expression of
camptothecin incubated cells, apoptosis induced (red peak) was overlayed onto the
FLICA expression of cells incubated without camptothecin (green peak). To these were
added the FLICA expression profiles of unlabelled cells incubated with and without
camptothecin, black and grey peaks respectively.
At each FLICA dilution the FLICA distribution for camptothecin incubated and non-
camptothecin incubated cells were the same except where FLICA was used at a 1/50
dilution. Here the FLICA staining of the cells incubated without camptothecin had a
higher MFI than the cells incubated with camptothecin. If FLICA staining was specific
for apoptotic cells the red and green peaks on each histogram would have represented
the FLICA negative fraction and R3 (and R5 in Figure 3.20C) would represent the
FLICA positive fraction. Therefore if FLICA expression was specific R3 would have
been greater for the camptothecin incubated cells. Instead, however, R3 was identical
for camptothecin incubated cells and for cells incubated without camptothecin. At 10 µl
and 3 µl of FLICA R3 was 0.6% and 0.5% respectively. At the 1/50 FLICA dilution the
cells incubated with and without camptothecin showed different distributions therefore
on the histogram for the FLICA concentration R3 represents the FLICA positive
fraction of cells incubated with camptothecin and R5 represents the FLICA positive
fraction of cells incubated without camptothecin. R3 and R5 were, however the same
size, 0.2%.

122
B
A
C
Figure 3.20 Comparison of FLICA expression after incubation with or without camptothecin.
Whole blood was either incubated with camptothecin and then with FLICA (red peaks) or without
FLICA (black peak) or without camptothecin and then with FLICA (green peak) or without
FLICA (grey peak). FLICA was used at the following dilutions 1/30, 1/50 and 1/100 for A, B, and C
respectively. For each concentration the FLICA expression of unlabelled cells (black and grey
peaks) was overlayed on the FLICA expression of FLICA labelled cells (green and red peaks).
Incubating fresh versus old blood and camptothecin incubated versus blood incubated
without camptothecin produced identical population distributions. If FLICA bound
specifically incubation time and camptothecin use would have resulted in a greater
123
proportion of cells expressing FLICA. This was not the case therefore either FLICA
failed to bind at all or bound non-specifically to all cells. FLICA staining produced
populations with an MFI higher than unstained cells therefore it is improbable that
FLICA failed to bind to cells and instead FLICA must have bound non-specifically to
all cells.
In flow cytometry and immunohistochemistry adding excessive quantities of an
antibody to cells can produce non-specific binding but in such a case the extent of the
non-specific binding is dose-dependent therefore the percentage of cells expressing the
antibody would decrease when the antibody is applied at lower concentrations. FLICA
was tested at a range of concentrations yet the expression of FLICA staining was
unchanged. Additionally the FLICA reagent is not an antibody but a small moiety that
passes into the cell. The unbound reagent should diffuse out of the cell and be washed
away. In the protocol used before unbound FLICA was washed off, erythrocytes were
removed with Facs Lysing solution (BD) as described in chapter 2. FACS Lysing
solution contains diethylene glycol for red cell lysis and formaldehyde to fix the
remaining PBMCs. The oxygen atoms of formaldehyde, chemical formula, CH2O, form
hydrogen bonds with the amine functional groups of certain amino acids thus cross
linking proteins (Schander and Kenneth 2003). The FLICA reagent consists of a
fluoromethyl ketone attached to the amino acid recognition sequence valine-alanine-
aspartic acid. The green fluorescence comes from the carboxyfluorescein (FAM)
attached as a reporter. Excess FLICA might therefore become cross linked to proteins
within the cell, proteins that would not be removed from the cell by washing with
phosphate buffered saline.
Isotonic ammonium chloride can also be used to lyse erythrocytes. Fresh whole blood
from a healthy donor was incubated with the FLICA reagent and the red cells lysed with
an isotonic solution of ammonium chloride (Figure 3.21). The ammonium chloride was
found to effectively remove erythrocytes from the blood sample. In the absence of
formaldehyde the non-specific FLICA binding was abrogated. The first cytogram of
FSC versus SSC showed clear and distinct populations of lymphocytes (R1) and
granulocytes (R4). The second cytogram was back gated for FLICA expression to show

124
the location of FLICA positive cells. The FLICA histograms, C and D, are gated on the
regions R1 and R4 respectively to show the FLICA expression by lymphocytes and
granulocytes, 3.9% and 87.9% respectively. Removing red blood cells from HIV
infected samples is notoriously problematic regardless of the method used and
unfortunately ammonium chloride yielded insufficient red cell lysis when used on blood
drawn from HIV infected children (data not shown) and therefore could not be used for
this study.
R1 gated. R2=3.9%
R4 gated. R5=87.9%
FLICA W/ NH4CL
HEALTHY DONOR
BA
C D
Figure 3.21 FLICA expression of PBLs after ammonium chloride red cell lysis
Whole blood was incubated with FLICA and red cells removed by addition of ammonium chloride.
The PBL populations that remained are shown in the FSC versus SSC cytogram (A) and colour
gated for FLICA expression (B). The PBL sub-populations R1, lymphocytes, and R4, granulocytes
were gated on and the FLICA expression determined for each determined. The FLICA expression
of the lymphocytes (C) and the granulocytes (D) was 3.9% and 87.9% respectively.
Given the small blood samples available from each child, less than 1 ml, a ficoll density
gradient centrifugation separation to separate the PBMCs from the erythrocytes was not

125
feasible. Additionally given the fragility of apoptotic cells red cell lysis and ficoll
protocols would likely have meant the loss of some of the apoptotic cells. It was
therefore decided not to separate the PBMCs but instead to subject the entire whole
blood fraction to flow cytometry.
Whole blood was incubated with anti- CD4 and CD45RA fluorochrome labelled
antibodies and FLICA, then washed and fixed. The samples were re-suspended in PBS
and passed through a cell strainer to avoid clogging the flow cytometer and then
evaluated by flow cytometry without red cell lysis. Events were acquired up to the 10
million event limit of the flow cytometer. This yielded a small number of CD4+ T cells,
typically 4000 cells. Their FSC/SSC location was verified and their FLICA expression
determined and found to be 3.4% (Figure 3.22).
A B
C
Figure 3.22 FLICA expression by CD4+ T cells in whole blood without erythrocyte lysis
Whole blood was incubated with FLICA and anti-CD4 antibody and analysed by flow cytometry
without red cell lysis. CD4+ T cells were gated on (region R1 in A) and their FLICA expression
determined under R4 (C). The FSC/SSC location of the CD4+ T cells is indicated by the region R2
(B)
126
Running the flow cytometer at maximum speed it took several minutes to acquire 10
million events and produced a very large data file that was very slow to load onto
analysis software. Additionally this produced a very small CD4+ T cell population as
CD4+ T cells make up only 0.2-0.3% of whole blood. With such a high ratio of red cells
to white cells it was not possible to collect sufficient CD4+ T cells by this method
especially taking into account that FLICA positive cells are rare events. The threshold
of the flow cytometer had been set only by size (FSC) to exclude debris therefore
erythrocytes were considered as events and constituted most of the 10 million event
limit. A decision was therefore taken to include a secondary threshold parameter on the
flow cytometer, CD4 expression, such that only CD4+ cells would be considered as
events. This allowed an adequate number of CD4+ T cells, at least 1000, to be acquired
and recorded by the flow cytometer.
3.4 DISCUSSION
The work in this chapter sought to demonstrate and validate flow cytometry methods to
identify and quantify CD4+ T cells and their subsets in peripheral blood from HIV-1
infected children and determine methods to investigate the processes of activation,
proliferation and apoptosis within those populations.
CD4+ T lymphocytes are the focus of this body of work and therefore the first crucial
result demonstrated their identification by flow cytometry. Within samples of peripheral
blood cells (PBMCs) lymphocytes and circulating dendritic cells can be discriminated
from other cell populations by just two physical parameters, the forward and side
scattering of light. Lymphocytes and circulating dendritic cells show intermediate
forward and side scatter in comparison to granulocytes, which show high side and
forward scatter, and red blood cells and platelets that show low side and forward scatter.
To further discriminate CD4+ T cells from other lymphocytes fluorescently labelled
antibodies specific for of CD3 and CD4 are commonly used (Perfetto, Chattopadhyay,
& Roederer 2004).

127
Although increasingly more sophisticated machines are available that can distinguish up
to 17 fluorescent parameters for each cell, most researchers do not have need of so
many parameters and furthermore such machines are usually priced beyond their reach
and require an extremely high level of technical support as the machines are very
sensitive and compensation is very complicated. Also it could be argued that there is not
a great use in further subdividing cell populations into more and more ever increasing
smaller sub-populations especially without functional studies.
I had access to 3 and 4 colour flow cytometry and therefore sought to conserve
fluorescent channels for analysing other cell parameters. I was able to demonstrate that
a single parameter, CD4 in conjunction with forward and side scatter identified the same
cell population as CD4 combined with CD3. CD4 can be expressed by both
lymphocytes and monocyte derived cells but it is unlikely that the CD4+ population
identified included the latter cell type because analysis revealed two distinct populations
with differing fluorescence intensity and intermediate versus high forward and side
scatter. Additionally CD3 expression was restricted to the CD4high
, intermediate side
and forward scatter population. The same populations were demonstrated in samples
obtained by both density gradient centrifugation and red cell lysis, an important result
because both methods would be used for this study and it has been reported that
purifying peripheral blood lymphocytes by density gradient centrifugation can produce
an unpredictable enrichment and loss of selected lymphocyte populations, however the
variability was described amongst the CD8+ T cells, which are not investigated in this
study (Renzi and Ginns 1987), (Romeu et al. 1992). Importantly this was shown in both
uninfected adults as well as HIV-1 infected children because it has been reported that
amongst HIV-1 infected individuals the lymphocyte gate is often and unpredictably
contaminated by debris and other cell types (Pacifici et al. 1998), one of the causes
being antiretroviral treatment which is associated with increased granulocyte fragility
and reduced susceptibility of red blood cells to lysis (CDC 1994).
Perhaps the most commonly used functional subdivision of CD4+ T cells is into a naïve
and memory type and therefore identifying means to discriminate between these types
by flow cytometry was the next step undertaken. Additionally changes to these

128
phenotypes have been implicated in HIV-1 infection and is a noted difference between
adults and children and this study is chiefly concerned with paediatric HIV-1 infection.
It is widely accepted that differentiation from a naïve to memory phenotype is
associated with decreased CD45RA and increased CD45RO expression. However as
discussed earlier there is some evidence that memory cells can regain expression of
CD45RA and that some CD45RA+ cells exhibit a primed phenotype. It would be
preferable to use one marker therefore I sought to verify whether CD45RA+ cells
included CD45RO+ cells and whether CD45RA
- CD4
+ cells were entirely CD45RO
+.
Amongst CD45RA+ cells from both uninfected adults and uninfected children there was
very little CD45RO expression. The CD45RA+ CD45RO
+ CD4
+ T cells, which have
been reported to be primed cells in transition from naïve to memory cells, were found to
be a very minor population, less than 4% and a mean size 1.2%. Other studies have
reported similar results, means of 3.4% and 2.4%, in healthy controls and HIV-1
infected adults respectively that did not differ significantly (Mahalingam et al. 1996).
Interestingly a not insignificant proportion of CD45RA- cells did not express CD45RO,
9-11.8%. All CD4+ T cells express some variant of the CD45 antigen because they are
leucocytes, which would suggest that that this small population of CD45RA-CD45RO
-
cells are perhaps either not leucocytes or are apoptotic cells or insufficient antibody was
used. However, all antibodies used in this study were titrated around the concentration
recommended by the manufacturer and used in excess therefore this would seem
unlikely. Lysing red blood cells in samples from HIV-1 infected individuals is
notoriously difficult. As mentioned previously amongst HIV-1 infected individuals the
lymphocyte gate is often and unpredictably contaminated by debris and other cell types
(Pacifici et al 1998), which may account for this small CD45RA-CD45RO
- population.
It has also been suggested, based on the size of these cells, that they represent apoptotic
cells (McElhaney, Pinkoski, & Meneilly 1995). Apoptosis has been shown to be
increased in HIV infection thus the greater proportion of these cells in the HIV-1
infected children compared to the uninfected adults supports this hypothesis. It has been
proposed that these apoptotic cells might be derived from memory by virtue of their
expansion post influenza vaccine and subsequent influenza virus challenge (McElhaney,
Pinkoski, & Meneilly 1995).
129
A minority of people have been reported to have a CD45 polymorphism, C77G, which
results in continuous expression of CD45RA by memory cells. The C77G
polymorphism is prevalent in around 1% of the Caucasian population and has an even
lower frequency in non Caucasians (Tchilian et al. 2002). It was not found in the 14
children investigated and is unlikely to exist in either of the cohorts described in this
study as they are mostly non Caucasian.
Therefore in conclusion defining naïve cells by CD45RA expression includes both
CD45RA+ CD45RO
- and a very small proportion of primed CD45RA
+ CD45RO
+ cells
and defining memory cells by lack of CD45RA expression both CD45RA- CD45RO
+
and CD45RA- CD45RO
- cells. The phenotype of CD45RA
- CD45RO
- cells is unknown
but they may be a population of apoptotic cells derived from memory cells.
The consensus of the MASIR 2008 conference on the phenotype and function of human
T lymphocytes was that there are 2 populations of antigen experienced CD4+ T cells
that express CD45RA but that they can distinguished from true naïve cells by their lack
of CD27 and CCR7 expression (Appay et al. 2008). Though I have shown that
CD45RA+CD45RO
+ cells are a very minor population in the children we tested I also
sought to investigate the CD27 and CCR7 expression of CD45RA+ cells in these
children. We found that CD27 and CCR7 were both expressed by over 99% of
CD45RA+ cells. Additionally there was no significant difference between the level of
CD27 and CCR7 expression in each child. This supports our view that almost all the
CD45RA+ cells are antigen naïve.
As mentioned in chapter one memory CD4+ T cells can be subdivided into two
populations based on homing or migratory potential and the presence or absence of
effector function (Sallusto et al 1999). These two populations, central and effector
memory cells, were shown to differ in CCR7 expression but subsequently CD27
expression was also shown to differ between these populations (Sallusto et al 2000),

130
(Sallusto, Geginat, & Lanzavecchia 2004). We have shown that there was no significant
difference between the percentage of CD27 and CCR7 expressed by CD45RA- cells in
each child.
Naïve CD4+ T cells have been shown to be divided into a TREC content high and
TREC content low population by the presence or absence of CD31 expression (Kimmig
et al 2002). The CD31+ population and CD31
- populations have been reported to
represent RTEs and central naive cells as detailed in chapter one. Due to greater thymic
function in children than in adults RTEs would be likely to be a greater proportion of
the CD4+ T cell population in children than in adults and accordingly a decrease in the
proportion of CD45RA+CD31
+ CD4
+ T cells with age has been shown in uninfected
individuals (Kimmig et al 2002). Our results show that HIV-1 infected children also
have a significantly greater proportion of CD45RA+CD31
+ CD4
+ T cells than the
uninfected adults. It also known that amongst uninfected individuals the proportion of
CD45RA-CD31
+ CD4
+ T cells does not change with age (Junge et al 2007). Our results
show that HIV-1 infected children also do not have a significantly different proportion
of CD45RA-CD31
+ CD4
+ T cells than the uninfected adults.
To characterise activation within CD4+ T cells we studied three surface markers
commonly used, CD38, CD69 and HLA-DR. CD38 has been found to be expressed at
higher levels on neonatal lymphocytes than adults; high levels on mature thymocytes
and activated T cells; low levels on resting (HLA-DR-) naïve cells and undetectable
levels on resting memory cells. In HIV CD38 is upregulated on uninfected cells. It was
also reported that CD38 expression has better prognostic value if mean fluorescence
intensity (MFI) not proportion of cells positive is evaluated because gating of positive
cells is subjective (Savarino et al. 2000). Similar to reported data I found CD38
expression to be higher amongst HIV infected children than uninfected adults also
amongst both groups a greater proportion of memory cells than naïve cells expressed
CD38.
We found that CD38 expression by CD4+ T cells is not a dichotomy of either high or
low expression. This made it subjective and less reliable to state the percentage of cells

131
that expressed CD38. As we have shown stating the difference between the MFI of the
CD38 antibody and its isotype control for each child would be more appropriate but
given the great number of samples to be processed for this study that would not be
feasible. Additionally the suitability of CD38 as a marker of activation must be
questioned. CD38 is constitutively expressed by naïve cells but not by memory cells
therefore only when detected on a memory cell is it an accurate indicator of activation.
Furthermore CD38 is downregulated independently by HIV (Savarino et al 2000).
Expression of CD69 by both the CD45RA+ and CD45RA
- CD4
+ T cell populations was
extremely low, less than 1% on all populations therefore the ability of the CD69
antibody to bind was verified by demonstrating elevated CD69 expression in stimulated
cells. CD69, as a very early marker is expressed at low levels, 0-5%, by T cells and
rapidly but transiently induced upon activation (Cosulich et al. 1987), (Lanier et al.
1988), (Sancho, Gomez, & Sanchez-Madrid 2005). CD69 expression by unstimulated
CD4+ T cells has been reported in HIV-1 infected adults as less than 1%, and
significantly lower than in healthy controls (Perfetto et al. 1997) but has also been
reported as up to 42% (mean 15%) in HIV-1 infected children, and was not significantly
different from healthy controls (Perfetto et al 1997), (Bohler et al. 1999).
Though the study group used here consisted of children, the range of CD69 expression
levels were found to be closer to those reported by Perfetto et al among HIV-1 infected
adults. Although as reported by Böhler et al, I too found no significant difference in
CD69 expression between HIV infected children and un-infected adults amongst both
the CD45RA+ and CD45RA
- sub-populations. I expected however, to detect higher
levels because activation is believed to occur continually in HIV infection and high
percentages of CD69+ cells have been reported in other chronic inflammatory
conditions such as rheumatoid arthritis and chronic inflammatory liver disease.
However in both these conditions the presence of CD69+ cells has been detected within
the disease sites i.e. in synovial fluid and in the liver and not peripheral blood (Marzio,
Mauel, & Betz-Corradin 1999). Apart from peripheral blood the disease sites for HIV
include the gut, lymphoid tissue and the brain. Perhaps in these organs the percentage of
CD69+ cells is greater than in peripheral blood. Accordingly a population of dense
CD69+ monocytes has been described in patients with HIV associated dementia. This
132
population was found to be absent or present in much lower numbers in controls
without dementia (Pulliam et al. 1997). As we detected a low percentage of CD69+ cells
which did not differ significantly between the CD4+ T cell subsets and donor groups
investigated we decided not to investigate CD69 expression in the cohorts described
later in this thesis.
HLA-DR expression was greater amongst HIV-1 infected children than uninfected
adults and greater by memory than naïve cells and additionally lacked the problems of
CD69 and CD38 and therefore HLA-DR was used as an indicator of T cell activation
for this study.
We used expression of Ki67, CD27 and HLA-DR to investigate the significance of
CD31 expression by memory cells. We found only Ki67 expression to differ
significantly between CD31+ and CD31
- memory cells. CD31
+ memory cells showed
higher levels of Ki67 expression therefore they may require different or lower stimulus
to proliferate than CD31- memory cells. The phenotype of this population is further
explored in chapter four.
Lastly, the adaptation of a flow cytometric caspase detection assay (method in 2.2.4),
designed for single cell populations in suspension, for use on CD4+ T cells in whole
blood was described. Initially the FLICA marker was binding non-specifically as
confirmed by the camptothecin studies, which showed no difference in FLICA
experience between cells cultured with camptothecin and those cultured without. The
non-specific binding was successfully resolved by eliminating the use of a lysis buffer
and using whole blood. Although to further confirm the specificity of the assay it could
be confirmed to other methods of measuring apoptosis.
The methods developed and validated in this chapter have been demonstrated to be
suitable for identifying CD4+ T cells subsets and exploring the kinetic processes
affecting those subsets, which is the focus of the next chapter of this thesis.

133

134
CHAPTER 4
CD4+ T CELL
KINETICS IN A
COHORT OF HIV-1
INFECTED
CHILDREN

135
4.1 INTRODUCTION
HIV-1 infection in children is associated with a gradual progressive decline in the
number of CD4+ T lymphocytes and as a consequence increased vulnerability to
opportunistic infections. Effective treatment with a combination of three or more
antiretroviral drugs, highly active anti-retroviral therapy (HAART), suppresses viral
replication and the fall in plasma viraemia is accompanied by a concomitant increase in
the number of CD4+ T cells towards non-disease levels. However the sub-populations of
CD4+ T cells which contract during HIV-1 infection and the processes behind their
decline are not fully understood in children.
4.1.1 CD4+ T cell kinetics
The size of a cell population is maintained by a balance between input and output thus
for the population to contract, input must decrease and/or output must increase.
Therefore cell kinetics in this context refers to the collective changes affecting the CD4+
T cell subsets, which together determine the size of the total CD4+ T cell population.
The potential sources of input into the CD4+ T cell pool are thymic output, homeostatic
proliferation, activation driven differentiation of cells to a memory/effector phenotype
and movement of cells out of the lymph nodes into the periphery. Whereas potential
sources of output are death by apoptosis or necrosis, conversion of cells to a
memory/effector phenotype and movement of cells from the periphery into lymphoid
tissue. These processes may also operate to differing degrees during HAART to restore
the CD4+ T cell population.
4.1.2 Effect of HAART on CD4+ T cell kinetics
The administration of HAART is associated with many effects, including an increase in
CD4 count, that are unlikely to be solely due to decreased viral replications. HAART
has also been associated in HIV infected children with an increase in TREC count
(Persaud et al 2000), (de Rossi A. et al 2002) and a decrease in activated CD4 cells

136
(CD4+HLA-DR
+, CD4
+HLA-DR
+CD38
+ and CD4
+CD45RO
+HLA-DR
+) (Resino et al.
2005), (Rosenblatt et al 2005)
The mechanisms behind the increase in CD4 count are not wholly understood. HAART
may indirectly reverse the factors associated with CD4 depletion discussed in 1.4.4.
Decreasing CD4 depletion through apoptosis may be one of the mechanisms. T cell
apoptosis was shown to decrease after treatment with protease inhibitors (Weichold et al.
1999). Using an RNA protection assay, where single stranded RNA is protected from
RNase degradation by hybridisation to RNA probes for apoptosis related genes,
Balestrieri et al found that after 12 months of successful HAART, expression of several
pro-apoptotic genes including Fas and Caspase 8 were downregulated (Balestrieri et al.
2007).
Decreased rates of CD4 loss are unlikely to entirely account for the increased CD4
count. HAART may also increase CD4 output. In vivo labelling techniques in monkeys
infected with SIV and humans infected with HIV have been undertaken in an attempt to
determine the source. In one study where bromo deoxy uridine (BrdU) was infused into
rhesus macaque monkeys a rapid decrease in the proportion of labelled CD4+ T cells
occurred. From this it was deduced that labelled cells die faster than they divide. As this
was occurring in a steady state there would have to be another source of incoming cells
into the population. This could potentially be the thymic output or proliferation within
the population. The same study found similar results in HIV infected individuals
receiving anti-retroviral therapy (Mohri et al. 2001). This would suggest that HAART is
associated with increased input to the CD4 pool either by increased rates of thymic
output or increased rates of proliferation or both.
4.1.3 Proliferation as a mechanism of input
Inducing lymphopenia in mouse models results in a peripheral T cell expansion called
homeostatic proliferation (Haynes et al 2000) and in the human newborn 50% of daily T

137
cell generation is due to peripheral T cell expansion (Haynes et al 2000) therefore it
would be reasonable to expect proliferation to play a major part in HIV infection and
reconstitution on HAART. The proliferation may be induced by lymphopenia or by
activation.
Ki67 is a cell cycle protein expressed in the nucleus in cells in G1, S and G2 phase. How
long Ki67 expression remains after mitosis is not clear but Ki67 expression is usually
confined to cycling cells. In healthy adult controls, expression of Ki67 by CD45RO-
CD27high
(naïve) cells decreases and therefore cell proliferation has been shown to
decrease with increasing age (Douek et al. 2001). In the same study the opposite, i.e. an
increase in Ki67 expression, was shown for CD45RO+ (memory) cells. They also
showed a 5.9 times greater percentage of Ki67+ memory cells in HIV infected compared
to control adults. In the naïve pool proliferation was similar for both uninfected and
infected adults, less than 1% of the cells. A different study by Di Mascio et al measuring
Ki67 expression on CD45RA+ cells showed decreased naïve cell proliferation 18 months
after HAART was initiated in 20 adults (Di Mascio et al. 2006). Decreased proliferation
by naïve cells may slow recruitment of naïve cells into the memory pool.
4.1.4 Thymic output
Thymic output, especially in children in whom thymic involution has not yet occurred,
may be a significant factor in the increased concentration of circulating CD4 T cells seen
in HAART. IL-7, a likely regulator of thymic output, has been shown to take part in the
differentiation of thymocytes and has been associated with CD4 T cell recovery in
children (Correa, Resino, & Munoz-Fernandez 2003).
4.1.4.1 Investigating thymic output by T cell receptor excision content
Thymic output was initially estimated by quantifying the number of T cell receptor
excision circles (TRECs) in naïve cells. Studies have shown that TREC counts in HIV
infected people declined faster with increasing age than in uninfected adults thus

138
suggesting thymic output is decreased in HIV. Doubts, however, about the suitability of
using TRECs as a measure of thymic output emerged when Hazenberg et al
demonstrated that in addition to decreasing thymic output a fall in TREC count could
also be explained by increased proliferation within the naïve pool which would dilute the
TREC count (Hazenberg et al 2000). However a decrease in TRECs occurring in the
absence of an increase in naïve cell proliferation would indicate a decrease in thymic
output as has been demonstrated in HIV infected adults (Douek et al 2001). In children,
however, HAART has been associated in HIV infected children with an increase in
TREC count (Persaud et al 2000), (de Rossi A. et al 2002). Increased TREC counts have
also been associated with slower disease progression in pathogenic SIV infection (Ho
Tsong et al. 2005).
4.1.4.2 Investigating thymic output by CD31 expression
A study carried out by Kimmig et al (Kimmig et al 2002) identified two populations of
CD45RA+ CD4
+ T cells with disparate TREC content. The TREC were highly enriched
in the CD31+ population and barely present in the CD31
- population. They also showed
a decrease of CD45RA+CD31
+ cells with increasing age. In addition the low production
of effector cytokines in CD45RA+CD31
+ cells indicates the suitability of using co-
expression of CD31 and CD45RA as a marker of recent thymic emigrants (RTEs).
Kimmig et al. put forward a model of naïve CD4+ T cell homeostasis predicated from an
in vitro study that showed loss of CD31 after TCR triggering. They suggested that naïve
cells can be divided into two groups: RTEs that express CD31 and central naïve cells
that do not express CD31. In this model, activation of either of these groups within the
periphery by foreign antigen leads to their differentiation into CD45RO+ (memory)
CD4+ T cells. Whereas when presented with self antigen, RTEs undergo homeostatic
proliferation, lose CD31 expression and differentiate into central naïve cells.
Unfortunately this work is concerned with naïve cells and does not report on the
significance of CD31 expression by CD45RO+ memory cells.

139
In 2007 Junge et al published a study endorsing the results of the initial Kimmig study
and additionally showed that telomere length was longest in CD31+CD45RO
-, then
CD31-CD45 RO
-, CD31
+CD45RO
+ and least in CD31
-CD45RO
+ . They also showed
telomerase activity was much higher in CD31+CD45RO
- than CD31
-CD45 RO
- cells
(Junge et al 2007).
A study by Bofill et al. used CD45RA+CD31
+ expression to investigate increased
thymic output in CD4+ T cell recovery on HAART. They found a non-significant
association between increased proportion of CD45RA+CD31
+ cells and improved CD4
+
T cell count (Bofill et al. 2006). The study population, however, were adults. In children
co-expression of CD45RA and CD31 by CD4+ T cells has not been yet been used to
investigate increased thymic output as a source of new cells in immune reconstitution.
Only one study has measured CD45RA+CD31
+ cells in HIV-1 infected children. The
study found that children who had been on HAART for over 4 years had comparable
proportions of CD45RA+CD31
+ cells to age matched controls (Vrisekoop et al. 2008).
There are no studies known that have followed changes in the CD45RA+CD31
+ cell
population before and upon starting HAART.
The aim of this chapter was to utilise the immunophenotyping methodology developed
in chapter 3 to study, within the CD4+ T cell sub-populations of a cohort of HIV-1
infected children, some of the processes that may govern the contraction and expansion
of the CD4 pool during progressive HIV infection and during the response to HAART,
respectively.

140
4.2 RESULTS
4.2.1 Sample characteristics
The expression of various markers such as CD45RA, CD45RO, CD27, CD31 and
CD62L have been used previously to describe CD4+ T cells with differing phenotype
and function. To investigate CD4+ T cell subset dynamics in paediatric HIV-1 infection,
blood samples from 58 children with vertically acquired HIV-1 infection were incubated
with antibodies against CD4, CD45RA and CD31 such that CD4+ T cells could be
identified by flow cytometry and divided into subsets defined by expression of CD31
and CD45RA. The characteristics of the cohort are displayed (Table 4.1).
Sample Characteristic Distribution
Number female 31 (53.4%)
Median age in years 10.5 (7.9-13.0)
Number ART naïve 10 (17.2%)
Number of ART at time of sampling 27 (46.6%)
Median CD4 count 516.5 (352.5-775.5)
Median CD4 % (as % of total lymphocytes) 24 (18.3-32.8)
Median viral load (log RNA copies/ml plasma)* 3.2 (1.7-4.1)
Table 4.1 Patient characteristics at time of sampling
Forty-five children with vertically acquired HIV-1 infection and varying ART experience were
recruited to the study. The characteristics of the population, median and IQR in brackets, at the
time of sampling are displayed. * Undetectable viral loads were assumed to be 50 copies/ml, which is
the limit of detection, for purposes of calculating the median and IQR.
4.2.2 Aging is associated with changes to the distribution of CD4+ T cell subsets
Aging is a normal process, which in healthy children is associated with changes to the
size and distribution of lymphocyte populations, however less is known about the effect
of age on CD45RA and CD31 defined CD4+ T lymphocytes in HIV infected children
therefore in this study the children‟s ages were compared to the size of the CD4 pool and
the distribution of CD4+ T cell subsets.

141
As has been described in healthy children, the CD4 count was negatively correlated with
age, decreasing with advancing age (Figure 4.1). Additionally aging was found to be
negatively correlated with the percentages of CD45RA+ and CD45RA
+CD31
+ cells,
positively correlated with the percentages of CD45RA- and CD45RA
-CD31
- cells but
not associated with the percentages of CD45RA+CD31
- and CD45RA
-CD31
+ cells
(Figure 4.2). The proportion of CD45RA+CD31
- cells were found to be relatively low,
compared to the other subsets, in all the children tested whereas a wider variation in the
proportion of CD45RA-CD31
+ cells was observed in children of different ages.
Figure 4.1 Association between age and CD4 count
The CD4 count for each child (n=58) was provided by GOSH diagnostic laboratories and was
plotted against the child’s age. The strength of the correlation between the age and CD4 count was
determined by Spearman’s rank coefficient (r). The statistical significance (p) is shown. The solid
and broken lines represent lines of regression and 95% confidence interval, respectively.

142
Figure 4.2 Relationship between Age and CD4 Subset distribution
Peripheral blood samples from 46 HIV-1 infected children were incubated with antibodies against
human CD4, CD45RA and CD31 and their expressions analysed by flow cytometry. The percentage
of CD4+ T cell subsets for each child were plotted against their age. The strength of the correlations
were determined by Spearman’s rank coefficient (r). The statistical significance (p) is shown. The
solid and broken lines represent lines of regression and 95% confidence intervals, respectively.

143
4.2.3 Patients with detectable viraemia and patients with undetectable viraemia
have different CD4 counts and CD4 subset distributions
Although chronic HIV infection is associated with a progressive gradual decline of
CD4+ T cells and a concomitant increase in viral load studies have failed to show an
association between viral load and CD4 count (Luzuriaga and Sullivan 1998) and none
have determined which CD4+ T cell subsets decrease as viral load increases. Viral loads
cannot be routinely quantified below 50 copies/ml plasma however detectable plasma
viraemia is indicative of unsuppressed viral replication, therefore the children were
divided into two groups, those with detectable viraemia (≥50 copies/ml plasma) at time
of sampling and those with undetectable viraemia at the time of sampling (<50 copies/ml
plasma).Then the CD4+ T cell count and subset distribution were compared between the
two groups (Figure 4.3).
The group with detectable viraemia had a lower CD4+ T cell count and lower
concentrations of the CD4+ T cell subsets; CD45RA
-CD31
+, CD45RA
-CD31
-, CD45RA
-
and especially CD45RA+ cells. Interestingly, there was no difference in the
concentration of RTEs therefore even though CD4 count is significantly lower in the
detectable viraemia group, the concentration of RTEs is unchanged, suggesting ongoing
thymic output is an important contribution. The detectable viraemia group had a
significantly higher mean age and increasing age is well known to be associated with
decreasing CD4 count. Therefore the percentage of CD4+ T cells, which is more
constant with age, was tested and this too was found to be significantly lower in the
group with detectable viraemia. Interestingly, there was no difference between the
percentages of CD4+ T cell subsets between the undetectable and detectable viraemia
groups.

144
Figure 4.3. Comparison of the CD4+ T cell population and CD4 Subsets in children with detectable
versus undetectable viral load.
The children were divided into those with undetectable viral loads (<50 copies/ml of plasma), n=21
and those with detectable viral loads, n=37. Black circles and white circles represent children with
undetectable and detectable viral loads respectively. The CD4+ T cell count, percentage of CD4
+ T
cells and the concentration of the CD4+ T cell sub-populations were compared between the two
groups in A, B and C respectively. For each variable shown the difference between the children with
undetectable viral load and those with detectable viral load was tested for statistical significance by
the Mann Whitney test.
145
Viral replication is thought to produce the non-specific generalised immune activation
seen in HIV infection, although indirectly via CD4 cell depletion from the gut which
damages the mucosal barrier allowing bacterial translocation as discussed in section 1.4
but studies have not shown an association between viral load and CD4+ T cell activation
and proliferation therefore children with undetectable versus detectable viraemia were
compared for differences in CD4+ T cell activation and proliferation as determined by
HLA-DR and Ki67 expression respectively (Figure 4.4).
Children with detectable viral load had greater Ki67 expression in the total CD4+ T cell
population and within the CD45RA- subset compared to children with undetectable
viraemia. There was however, no difference in Ki67 expression by CD45RA+ cells
between the groups. Surprisingly HLA-DR expression by the total CD4+ T cells did not
differ between the two viraemia groups but when the CD4+ T cells were subdivided by
CD45RA expression HLA-DR expression by both the CD45RA+ and the CD45RA
-cells
was found to be significantly higher in the group of children with a detectable viral load
at time of sampling.

146
Figure 4.4 Comparison of Ki67 and HLA-DR expression in children with detectable versus
undetectable viral load
The children were divided into those with undetectable viral loads (<50 copies/ml of plasma), n=19
and those with detectable viral loads, n=27. Black circles and white circles represent children with
undetectable and detectable viral loads respectively. Ki67 and HLA-DR expression by the total
CD4+ T cell pool and CD4
+ T cell sub-populations were compared between the two groups. For each
variable shown the difference between the children with undetectable viral load and those with
detectable viral load was tested for statistical significance by the Mann Whitney test.

147
4.2.4 Levels of Ki67 and HLA-DR expression differ between naïve and memory
cells
Proliferation and activation are two processes known to control the size and equilibrium
between lymphocyte populations and there is interaction between the two processes; as
discussed in section 1.2.5. T cell proliferation can occur in response to activation as well
in response to lymphopenia. Therefore to characterise the effect of these processes on
CD4+ T cell subsets and their interaction with each other two markers of lymphocyte
proliferation and activation, Ki67 and HLA-DR respectively, were used in conjunction.
Additional samples were taken from the children and co-incubated with either antibodies
against CD4, CD45RA, CD31 and Ki67 or antibodies against CD4, CD45RA, CD31 and
HLA-DR.
As was mentioned in chapter one, the memory population is more activated and
proliferating than the naïve population, which was also confirmed in section 3.3.7 and
3.3.8 where a greater proportion of memory cells where shown to express HLA-DR and
Ki67 compared to naïve cells. However it is not known how CD31 defined naïve and
memory subsets compare to each other. Therefore HLA-DR and Ki67 expression was
investigated in 28 HIV-1 infected children but only Ki67 expression was found to differ
significantly between the sub-populations (Figure 4.5). CD45RA+CD31
+ had the lowest
Ki67 expression, followed by CD45RA-CD31
+ then CD45RA
-CD31
- and finally
CD45RA+CD31
-.

148
Figure 4.5 Characteristics of CD4 subsets
The box whisker graphs show HLA-DR and Ki67expression in CD4+ T cell sub-populations (n=28).
The Ki67 and HLA-DR expression are compared in CD45RA and CD31 delineated CD4+ T cell sub-
populations in (A). and (B) respectively The differences between the populations were tested by
Kruskall-Wallis.
As discussed in section 1.4 it has been shown that CD4+ T cell activation correlates with
CD4 count and progression in adults with HIV-1 infection therefore activation as
determined by HLA-DR expression was investigated in the children described here as
well as proliferation, which can also affect the size of CD4+ T cell pool (Figure 4.6).
There was no significant association between HLA-DR expression and either the CD4
count or the percentage of CD4+ T cells. However the level of Ki67 did correlate with
both the CD4 count and the percentage of CD4+ T cells.

149
Figure 4.6 Association between the size of the CD4+ T cell population and Ki67 and HLA-DR
Blood samples from 28 children were incubated with antibodies against CD4 and either Ki67 or
HLA-DR and the CD4 count and percentage of CD4+ T cells were plotted against the level of Ki67
and HLA-DR expression. An association between CD4 count and percentage of CD4+ T cells and
Ki67 and HLA-DR expression was tested by Spearman’s rank. The Spearman’s rank correlation
coefficients, r, and p values are shown. The solid and broken lines represent lines of regression and
95% confidence intervals, respectively.
Activation does not always result in proliferation and proliferation can occur in the
absence of activation i.e. lymphopenia induced proliferation versus activation driven
proliferation therefore to investigate what proportion of activated cells proliferate and
what proportion of proliferating cells are activated in children with HIV blood samples
were incubated with antibodies against CD4, CD45RA, HLA-DR and Ki67. CD45RA-
HLA-DR+ cells were found to express significantly greater levels of Ki67 than

150
CD45RA+HLA-DR
+ cells but there was no significant difference between the level of
HLA-DR expression by CD45RA-Ki67
+ and CD45RA
+Ki67
+cells (Figure 4.7). Almost
50% of CD45RA-Ki67
+ and CD45RA
+Ki67
+ cells also express HLA-DR.
Figure 4.7 Co-expression by HLA-DR and Ki67 by CD4 subsets
In a subset of patients (n=16) peripheral blood samples were co-stained with both anti-HLA-DR and
anti-Ki67 antibodies in addition to anti CD4 and anti CD45RA. The level of Ki67 expression was
determined and compared for HLA-DR+ CD45RA
+ versus HLA-DR
+ CD45RA
- CD4
+ T cells (A)
The level of HLA-DR expression was determined and compared for Ki67+ CD45RA
+ versus Ki67
+
CD45RA- CD4
+ T cells (B) The difference between the medians of the populations was tested by
Mann-Witney test.
4.2.5 FLICA expression in CD4+ T cells
Gougeon and colleagues demonstrated that lymphocytes from HIV infected individuals
are more susceptible to spontaneous apoptosis compared to healthy controls and that this
susceptibility correlates to the level of activation, determined by HLA-DR and CD38
expression . In their studies apoptotic cells were identified by propidium iodide (P.I.)
and 7-amino-actinomycin D (7-AAD) staining and CD4 subpopulations were not

151
investigated (Gougeon et al 1996). In this present study apoptosis was identified by
fluorescent-labelled inhibitor of caspases (FLICA) staining, as described in chapter 2
and was investigated in CD45RA+ and CD45RA
- CD4
+ T cells.
Gougeon et al reported that apoptosis is low in freshly isolated PBMCs from HIV-1
infected individuals, less than 5%, and is not different from healthy controls (Gougeon et
al 1996) therefore initially FLICA staining in CD45RA+ and CD45RA
- CD4
+ T cells in
freshly drawn whole blood from six children was investigated. FLICA expression by
CD4+ T cells was very low, mean of 1.7%, and there was no difference between FLICA
expression by CD45RA+ and CD45RA
- CD4
+ T cells (Figure 4.8).
Figure 4.8 FLICA expression by CD4+ T cell sub-populations in freshly drawn whole blood
Freshly drawn whole blood from n=6 children was incubated with antibodies against CD4 and
CD45RA and the FLICA reagent. The FLICA expression was determined in the total CD4+ T cell
population and in the CD45RA+ and CD45RA
- CD4
+ T cell sub-populations. Horizontal lines
indicate the mean FLICA expression for each cell population. The difference between FLICA
expression by the CD4+ sub-populations was tested for significance by the Mann-Witney test.
As there is little apoptosis present in freshly drawn blood, whole blood from 24 children
was incubated at room temperature for 24 hours and then stained with FLICA and anti-
CD4 and CD45RA antibodies to determine which subpopulation would be more

152
susceptible to apoptosis. After 24 hours there was greater FLICA expression and it was
significantly higher in the CD45RA- than in the CD45RA
+ CD4
+ T cell population
(Figure 4.9).
Figure 4.9. FLICA expression by CD4+ T cell sub-populations in whole blood after 24 hours
Freshly drawn whole blood from n=24 children was incubated at room temperature for 24 hours
and then with antibodies against CD4 and CD45RA and the FLICA reagent. The FLICA expression
was determined in the total CD4+ T cell population and in the CD45RA
+ and CD45RA
- CD4
+ T cell
sub-populations. Horizontal lines indicate the mean FLICA expression for each cell population. The
difference between FLICA expression by the CD4+ sub-populations was tested for significance by
the Mann-Witney test.
Activated cells are more susceptible to apoptosis (Groux et al 1992), (Meyaard et al
1992), (Estaquier et al 1995) therefore to investigate whether apoptotic cells displayed
an activated phenotype whole blood from 24 children was incubated over 24 hours at
room temperature and then stained with FLICA and antibodies against CD4, CD45RA
and HLA-DR. Over 60% of FLICA+ cells also co-express HLA-DR, and the HLA-DR
expression of CD45RA- FLICA
+ cells is significantly higher than the HLA-DR
expression of CD45RA+FLICA
+ CD4
+ T cells (Figure 4.10). By contrast, when
peripheral blood from 3 subjects was stained for FLICA and then stained for Ki67 to
Figure 15. FLICA expression by na •ve and memory cell populations. Fresh peripheral blood samples from
24 HIV infected children were co -stained with CD4, CD45RA and the affinity label fluorescently li nked inhibitor of
caspases (FLICA) to investigate apoptosis within na •ve (CD45RA+) and memory (CD45RA -) cells. This is shown
in the figure where the horizontal lines are the median FLICA ex pression for na •ve and memory cells in this
group of children. The difference in FLICA expression is statist ically significant, p=0.013 (Mann Whitney test).
0
10
20
30
40
50
60
CD45RA+ CD45RA-
p=0.0021
CD4+
CD4+ T cell population
Pe
rce
nta
ge F
LIC
A e
xp
res
sio
n

153
investigate the association of apoptosis and proliferation in CD4+ T cells, only 6.7% of
FLICA+ cells were found to express Ki67 (data not shown).
Figure 4.10 HLA-DR expression by FLICA positive cells
Freshly drawn whole blood from n=24 children was incubated at room temperature for 24 hours
and then with antibodies against CD4, CD45RA, HLA-DR and the FLICA reagent. The level of
FLICA expression by FLICA positive cells was determined by flow cytometry. The mean HLA-DR
expression and 95% C.I. for each population of FLICA positive cells is displayed. The difference
between the HLA-DR expression by the FLICA positive CD45RA+ and FLICA positive CD45RA
-
CD4+ T cells was tested for significance using the Mann-Witney test.
4.2.6 The absolute CD4+ T cell count is associated with the distribution of CD4
+ T
cell subsets and Ki67 expression
CD4 count is used extensively as a prognostic indicator in the management of HIV
infection, where an increase is usually associated with improvement of the clinical
picture and a decrease with deterioration. Therefore the CD4 count was compared to the
size of each CD4+ T cell subsets (Figure 4.11) to see how the distribution of subsets was
affected by changes in the CD4 count. The CD4 count was positively correlated with the
Figure 16. HLA -DR expression by FLICA positive cells. To investigate whether apoptotic cells are activated
fresh peripheral blood samples from 24 HIV -1 infected children were co -stained with FLICA, CD4, CD45RA and
HLA-DR. The median percentage expression of FLICA positive populatio ns are shown by each column bar.
0
10
20
30
40
50
60
70
80
90
FLICA +
CD4+
p=0.0049
FLICA +
CD45RA +
CD4 +
FLICA +
CD45RA -
CD4 +
CD4+ T cell population
Pe
rce
nta
ge H
LA
-DR
ex
pre
ss
ion

154
percentage of CD45RA+CD31
+ cells, though the rate of change was not fixed. When the
CD4 count was high, above 600 CD4+ T cells/µl, a large change corresponded to a small
change in the percentage of CD45RA+CD31
+ cells. When the CD4 count was lower,
below 600 CD4+ T cells/µl, a small decrease was associated with a large fall in the
percentage of CD45RA+CD31
+ cells. This is illustrated in Figure 4.11A where children
with a higher CD4 count (greater than 600 CD4+ T cells/µl) have over 30% of their
CD4+ T cells in the CD45RA
+CD31
+ sub-population (green box, Figure 4.11A) though
for children with a low CD4 count (less than 600 CD4+ T cells/µl) one group of children
have greater than 30% CD45RA+CD31
+ (blue box, Figure 4.11A) and the other group
less than 30% (red box, Figure 4.11A). There was no correlation between CD4 count
and percentage of CD45RA-CD31
+ cells but the percentage of CD45RA
+ cells was
positively correlated with CD4 count. The CD4 count was negatively correlated with the
percentage of CD45RA- CD31
+, CD45RA
-CD31
- and CD45RA
- sub-populations.

155
0 1000 2000 30000
10
20
30
40
50
60
70
80
90
100 r=0.53p<0.0001
CD4+ T cells/ l
% C
D45R
A+C
D31
+ o
f C
D4
+ T
cell
s
0 1000 2000 30000
10
20
30
40
50
60
70
80
90
100 r=0.22p=0.094
CD4+ T cells/ l
% C
D45R
A+C
D31
- of
CD
4+ T
cell
s
0 1000 2000 30000
10
20
30
40
50
60
70
80
90
100r=-0.53p<0.0001
CD4+ T cells/ l
% C
D45R
A- C
D31
- of
CD
4+ T
cell
s
0 1000 2000 30000
10
20
30
40
50
60
70
80
90
100r=0.56p<0.0001
CD4+ T cells/ l
% C
D45R
A+ o
f C
D4
+ T
cell
s
0 1000 2000 30000
10
20
30
40
50
60
70
80
90
100
r=-0.56p<0.0001
CD4+ T cells/ l
% C
D45R
A- o
f C
D4
+ T
cell
s
A B
C D
E F
Figure 4.11. Relationship between CD4 count and CD4 Subset distribution.
CD4+ T cell immunophenotyping was performed on 58 children by incubating blood with antibodies
against CD4, CD45RA and CD31. The CD4 counts at time of sampling for each child were provided
by GOSH diagnostics labs and plotted against the percentage of the CD4+ T cell sub-populations.
The strength of the correlations between the CD4 count and the proportion of each sub-population
was determined by Spearman’s rank. The coefficient (r) is shown with corresponding p values. The
solid and broken lines represent lines of regression and 95% confidence intervals, respectively.

156
As mentioned previously cellular proliferation and viral replication can affect the size of
the CD4+ T cell pool. Figure 4.6 showed a negative correlation was found between the
CD4 count and the level of Ki67 expressed by CD4+ T cells but did not investigate the
association between the CD4 count and level of Ki67 expressed by the CD45RA+ and
CD45RA- CD4
+ T cells. Therefore to investigate if the changes in the total CD4 count
are associated with changes in the proliferation of CD4+ T cell sub-populations and viral
replication the CD4 count for each child was compared to the viral load and the level of
proliferation in the CD4+ T cell sub-populations (Figure 4.12). The CD4 count was
negatively correlated with the percentage Ki67 expression of CD45RA- CD4
+ T cells but
there was no association with the percentage Ki67 expression of CD45RA+ CD4
+ T
cells. A negative correlation was also established between the CD4 count and viral load.

157
Figure 4.12. Relationship between CD4 count and level of Ki67 expression by CD4 cells and CD4
Subsets
Peripheral blood from 27 HIV-1 infected children were incubated with antibodies against human
CD4, CD45RA, CD31 and Ki67 and their expressions analysed by flow cytometry. The CD4 count
for each child was obtained from GOSH diagnostic labs and plotted against the level of Ki67
expression by CD4+ T cell subsets and viral load, which was also provided by GOSH diagnostic labs.
The strength of the correlations between the CD4 count and the level of Ki67 expression by the sub-
populations was determined by Spearman’s rank. The coefficient (r) is shown with corresponding p
values. The solid and broken lines represent lines of regression and 95% confidence intervals,
respectively.

158
4.3 DISCUSSION
HIV infection is characterised by a progressive decline in the absolute number of CD4+
T cells where the mode of cell death is via apoptosis as was described in chapter one. In
this chapter I have shown that FLICA expression, and therefore apoptosis, is greater in
CD45RA- than in CD45RA
+ cells (Figure 4.9). More than 60% of apoptotic, FLICA
+,
cells co-express the marker of activation, HLA-DR, and HLA-DR expression is
significantly higher in the CD45RA-FLICA
+ than in the CD45RA
+FLICA
+
subpopulation (Figure 4.10). This in agreement with a study of apoptosis and activation
in HIV-1 infected individuals, which found that 50-60% of apoptotic CD4+ T cells
expressed markers of activation (Gougeon et al 1996). In that study apoptosis was
detected by 7-amino-actinomycin D (7-AAD and activation was detected by CD38 and
HLA-DR expression. From this, we can infer that activated cells are more susceptible to
apoptosis and cells with a memory phenotype, CD45RA-, are preferentially lost during
HIV infection over CD4+ T cells with a naïve phenotype, CD45RA
+. This is likely due
to the higher levels of activation, HLA-DR expression, seen in memory cells.
In early HIV infection the CD4 count remains stable and relatively high despite the loss
of CD4 cells therefore this loss must be compensated for by an equal rate of input. The
results discussed here suggest that the compensatory mechanisms may include increased
proliferation by memory cells because a decrease in CD4 count is associated with
increased Ki67 expression by CD45RA- cells but not by CD45RA
+ CD4
+ T cells (Figure
4.12). CD45RA+ CD4
+ T cells express very little Ki67 (Figure 4.5) and this does not
change when the CD4 count increases or decreases (Figure 4.12). Therefore if naïve cell
production is increased to compensate for increased loss of CD4+ T cells the source of
naïve cell production is likely to be thymic ouput of de novo naïve cells, recent thymic
emigrants (RTEs) rather than proliferation of existing cells within the periphery. It is
evidently important to maintain naïve cell production as none of the children with a high
CD4 count had a low proportion of CD45RA+CD31
+ cells (RTEs). This effect was
independent of age.
159
As HIV infection progresses, perhaps due to decreased drug sensitivity and/or poor
adherence to therapy, the viral load increases and the CD4 count begins to decline. The
CD4 count may begin to fall either because the loss of CD4 cells increases beyond what
the compensatory mechanisms can cope with and/or because the compensatory
mechanisms (proliferation of memory cells, naïve cell production and proliferation) fail.
The results shown here may suggest that the compensatory mechanisms continue to
operate because Ki67 expression by CD45RA- cells increased with declining CD4 count
(Figure 4.12) and there is no difference in the percentage of Ki67 expression, between
the group of children with a high CD4 count and high proportion of CD45RA+CD31
+
cells (RTEs) (Figure 4.11A green box) and the group of children with a low CD4 count
and a high proportion of CD45RA+CD31
+ cells (Figure 4.11A blue box). Therefore the
CD4 count falls because the rate of loss of CD4 cells is increased.
I have shown that as the CD4 count falls the balance between naïve and memory cells is
relatively unchanged until it reaches about 600 cells/µl therefore initially thymic output
may be able to adequately compensate for differentiation and proliferation, which
produce memory cells. As the CD4 count falls below about 600 cells/µl the balance
rapidly swings from naïve to memory cells. It may be because at some point thymic
output is no longer able to compensate either because it has declined and/or the drive
from naïve to memory has increased. If thymic output has declined, the decline is not
explained by age as there is no significant difference between the age of children with
low CD4 count-low proportion of CD45RA+CD31
+ cells (Figure 4.11A red box) and the
age of the children with a low CD4 count-high proportion of CD45RA+CD31
+ cells
(Figure 4.11A blue box). Either way the CD4 pool is now mostly composed of memory
cells. These cells, as detailed in chapter one, are a rapidly turning over population with
shorter half lives and telomeres than naïve cells and are more susceptible to both
apoptosis and infection by HIV. Thus unless the loss of cells is reversed or the
production of naïve cells is re-instated, by effective HAART, the CD4 count will fall to
dangerous levels.

160
In studying CD4+ T cell kinetics in HIV infected children I have also further elucidated
the significance of CD31 expression by CD4+ T cells. CD45RA
+CD31
+ CD4
+ T cells
were first put forward as RTEs by Kimmig et al., who also proposed a model of
peripheral naive CD4+ T cell homeostasis where RTEs in the periphery, compensate for
falling thymic output, by proliferating and differentiating into central naïve cells,
CD45RA+CD31
-, in response to self antigen (Kimmig et al 2002). In uninfected
individuals Kimmig and other authors have demonstrated a decline in RTEs with age
that is initially rapid then slows down. Now within a cohort of HIV-1 infected children I
have shown that the same exponential decay kinetics occur in RTEs with increasing age.
At the same time also showing the zero order kinetics of central naïve cells where
increasing age did not show an association with the size of the central naïve sub-
population. The majority of memory cells, which do not express CD31 memory cells,
shows a gradual increase with age as has been demonstrated before (Huenecke, Behl, &
Zimmerman 2008).
Kimmig et al. did not discuss CD31+ memory cells but they have been detected at very
low frequencies in healthy individuals of all ages by Junge et al (Junge et al 2007).
Similarly in the cohort of HIV-1 infected children described here CD45RA-CD31
+
remained a consistently small sub-population, however in contrast to uninfected
individuals the percentage of CD45RA-CD31
+ cells showed a significant association
with age and were negatively associated with CD4 count. Therefore this population may
be expanded during HIV infection. Additionally in chapter 3 we demonstrated that Ki67
expression in this population was higher than in the other CD4+ T cell subsets. Torimoto
et al. showed in cells in culture that after CD45RA+ cells were activated CD31
expression did not change and that activation of CD45RO+ did not produce CD31
expression (Torimoto et al. 1992). From this we can infer that CD31+ memory CD4
+ T
cells represent CD45RA+CD31
+ CD4
+ T cells post antigenic differentiation and CD31
-
memory CD4+ T cells represent CD45RA
+CD31
- CD4
+ T cells post antigenic
differentiation. Later Prager et al. provided data that suggests a suppressor role for
CD31+ memory CD4
+ T cells (Prager et al. 1996). Therefore CD31
+ memory CD4
+ T
161
cells could contribute to the immune dysregulation seen in HIV. The deleterious impact
of a decline in CD4 count may be amplified by the expansion of this population.
From the results described here and the studies by Kimmig, Junge, Torimoto and Prager
I have proposed a model of T cell kinetics in HIV infection (Figure 4.13). The CD4
count and the balance between the sub-populations are controlled by thymic output,
proliferation and antigen driven differentiation. CD45RA+CD31
+ CD4
+ T cells are
produced by thymic output. In response to activation they can differentiate into either
CD45RA-CD31
+ cells or into CD45RA
+CD31
-, which can themselves differentiate into
CD45RA-CD31
- cells (red arrows). CD45RA
-CD31
+ and CD45RA
-CD31
- cells respond
to activation by proliferating (green arrows). Death occurs in all populations, though at
different rates (black arrows). Viral replication increases activation in all populations
and activation increases the death rate in all populations. In addition increased activation
drives the differentiation of CD45RA+CD31
+ and CD45RA
+CD31
- cells and the
proliferation of CD45RA-CD31
+ and CD45RA
-CD31
- cells thus moving the equilibrium
towards memory cells.
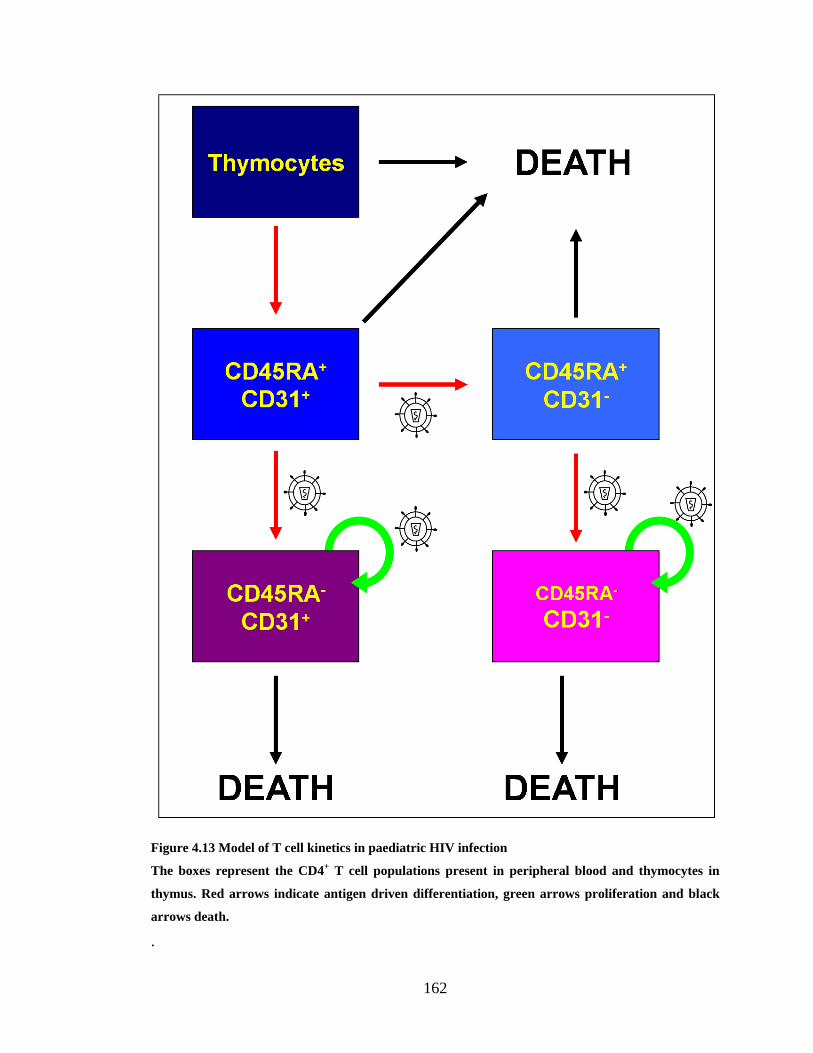
162
Figure 4.13 Model of T cell kinetics in paediatric HIV infection
The boxes represent the CD4+ T cell populations present in peripheral blood and thymocytes in
thymus. Red arrows indicate antigen driven differentiation, green arrows proliferation and black
arrows death.
.

163
CHAPTER 5
IMMUNOLOGICAL
STUDY OF PLANNED
TREATMENT
INTERRUPTION IN A
COHORT OF HIV-1
INFECTED
CHILDREN

164
5.1 INTRODUCTION
The optimum of care for HIV infected individuals, as discussed in chapter one, includes
continuous long-term administration of three of more anti-retroviral drugs, termed
highly active anti-retroviral therapy (HAART). Compliance is difficult because HAART
is a rigorous regime of multiple drugs administered several times a day and is associated
with toxicities. Yet if therapy is not strictly adhered to, viral strains with mutations that
confer drug resistance emerge resulting in virological failure, a loss of viral suppression
despite HAART. ARVs are changed in response to virological failure or drug
intolerance but there are a limited numbers of drug combinations available and life long
treatment is required. Due to these constraints, it may not be possible to achieve life long
viral suppression with the current treatments available and it is therefore important to
optimise treatment for maximum therapeutic effect balanced against patient quality of
life. One of the strategies for optimising HAART is intermittent treatment.
It has been postulated that intermittent therapy would be helpful in conserving treatment
options for the lifetime of the patient, increasing adherence, addressing virological
failure and decreasing the occurrence of anti-retroviral drug associated toxicities and
side effects. Intermittent therapy might also make long term treatment cheaper and more
affordable. It could however carry some significant risks, such as increased viral
replication and faster disease progression (Miller 2001). Since the introduction of
HAART it has not been uncommon for individuals to transiently stop treatment, either
by choice due to drug intolerance and other reasons, or under the advice of a physician
due to virological failure. The logic being that removing drug pressure would result in
the resurgence of ARV sensitive wild type virus because in the absence of ARVs,
viruses with resistance-conferring mutations have reduced fitness compared to wildtype
virus (Miller et al. 2000b). Additionally viral suppression is associated with decreased
numbers of HIV specific CTLs therefore it has also been suggested that intermittent
therapy might work like a vaccine to boost the CTL response and thus induce immune
mediated control. of HIV-1 (Montaner 2001).

165
Intermittent therapy has been investigated in various studies. Initial trials were
performed with small groups of patients with sustained viral suppression below the
standard limit of detection. Use of treatment interruption in such patients would require
subsequent therapy to remain effective after the interruption. This was investigated by
Neumann et al, where a small group of ARV naïve patients received HAART for 28
days, interrupted for 28 days and then restarted with the same regime. They found that
upon reinitiating treatment, viral loads declined at a similar rate to that seen following
initial treatment and they did not detect resistance-conferring mutations (Neumann et al.
1999). Other investigators have also shown that the ability of HAART to suppress viral
replication was not affected by a short period of interruption (Devereux et al. 1999),
(Miller et al. 2000a).
The second scenario for the use of treatment interruption was virological failure in
treatment experienced individuals. Two such trials in the UK and Germany detected
decreased viraemia and increased CD4+ T cell counts after restarting therapy compared
to before the interruption. These changes were associated with decreased detection of
drug resistant strains. They reported that the longer the interruption period, the higher
the peak viraemia and the greater the reduction in drug resistant mutant strains. They
also reported a decrease in CD4 count during the interruption to pre-HAART levels
(Devereux et al 1999), (Miller et al 2000a).
Recently there have been larger trials of planned treatment interruption (PTI) utilising
CD4 count guided entry and restart criteria. They include the SMART trial, Trivacan
and DART, all of which were unsuccessful for the most part. They all reported excess
risk of opportunistic infections in the group allocated to treatment interruption compared
to the group assigned to continuous treatment and had to be prematurely terminated
(Danel et al. 2006), (El-Sadr et al. 2006), (DART Trial Team 2008). Additionally the
SMART trial did indicate that individuals with low nadir CD4+ T cell count or advanced
disease most likely could not tolerate a treatment interruption (El-Sadr et al 2006).

166
Amongst untreated individuals and those receiving continuous therapy, viral load, does
not correlate, as well as CD4 count and level of immune activation with disease
progression (Resino et al 2006), (Albuquerque et al 2007). The trials discussed thus far
assessed CD4+ T cell count during PTI and mostly found that though CD4
+ T cell count
declined to some degree during the interruption it could be restored by restarting
therapy. However to date, only one trial has looked at immune activation during PTI,
and that was in CD8+ T cells, in which an increased CD38 expression was noted
following interruption (Ruiz et al. 2000). No PTI trials have assessed immune activation
of CD4+ T cells.
The trials described thus far have been conducted in adults yet treatment interruption
regimes could be more useful in children than in adults because HIV-1 infected children
will probably spend more years on treatment and therefore have a greater need to
conserve anti-retroviral combinations. Attaining strict adherence in children can also be
harder as they start school and then enter adolescence. Within growing children the
toxicities and side effects associated with anti-retroviral treatment can have different or
more deleterious effects for example stunted growth which would not be an issue in
adults. Additionally as described in chapter one the juvenile immune system is more
adaptable and therefore perhaps better able to respond to cycles of treatment interruption
and restart. Despite this, investigations of treatment interruption in children have been
limited.
There is limited evidence to support the view that treatment interruption in children may
be more successful than in adults. The earliest paediatric study was in children
undergoing unplanned treatment interruptions and therefore breaks in treatment were of
various lengths and children had wide ranges of viral load and CD4 count at treatment
cessation. This study looked at children who had interrupted ART for at least 4 weeks
and it was observed that although CD4 counts fell during interruption, within 6 months
of restarting therapy, they had returned to pre-interruption levels. At this point half the
children had viral loads lower than before interruption. However greater inter-person

167
variability and higher viral load increases than in adults have been reported (Gibb et al.
2004).
As in adults, planned treatment interruption was also considered for children with
virological failure and for children with sustained viral suppression. A trial of treatment
interruption for virological failure showed that CD4+ T cells declined, as seen in adults,
but viral load increases were higher in children (Monpoux et al. 2004).
Studies of planned treatment interruption in children with sustained viral suppression
have used interruption periods of a predetermined length or used the CD4 count to guide
the length of treatment interruption. Trials with predetermined periods of interruption
have used a wide range of interruption durations ranging from a few days to a few
months. One trial to induce cellular immunity against HIV in virally suppressed children
used alternating cyles of treatment interruption and treatment reintroduction, where the
length of the treatment interruption progressively increased with each cycle, starting
with an interruption of 3 days and increasing by 2 days with every subsequent cycle
leading up to a maximum interruption period of 27 days during the 13th
cycle. During
each cycle, the period of interruption was followed by, 18 days of treatment. Subjects
were allowed to progress to the next cycle if they had been aviraemic at the end of their
last treatment interruption otherwise they had to continue treatment until they achieved
an undetectable viral load. The study was terminated in patients who were still viraemic
after 112 days of treatment. 8 out 14 subjects achieved cycle 13 or greater i.e. they
experienced at least a 27 day interruption period. Unfortunately the authors did not
assess CD4 counts but did report that median viral loads peaked during the cycle 7,
where treatment was interrupted for 15 days (Borkowsky et al. 2008). In another trial
where patients were subjected to cycles of 4 weeks of treatment interruptions followed
by 12 weeks of treatment, the patients experienced declines in CD4 count and increases
in viraemia. (Palacios et al. 2009).

168
Considering the high degree of inter-person CD4 count variability in children assigned
to treatment interruption, a CD4 count guided trial was logical. PENTA 11 was a trial of
CD4 count guided planned treatment interruption (PTI) in 109 HIV-1 infected children
conducted by the Paediatric European Network for the Treatment of AIDS (PENTA).
Excerpts from the trial final report describing study design are provided in the appendix.
The overall aim of the PENTA 11 trial was to evaluate the role of planned treatment
interruptions in the management of HIV infected children who have responded well to
antiretroviral therapy. Entry criteria included sustained viral suppression below 50
copies/ml and the CD4 criterion in children 2-6 years was percentage CD4+ T cells of
30% or more. For children 7-15 years at least 25% CD4+ T cells and CD4 count of at
least 500 cells/µl. Therapy was restarted in children if the percentage of CD4+ T cells
fell below 20% in children under 7 years, or less than 20% or a CD4+ T cell count less
than 350 cells/µl in children 7-15 years old. Additionally each PTI period could not last
longer than 48 weeks and further PTIs could be undertaken only in children who spent
more than 10 weeks off therapy during the 1st PTI and then had been back on HAART
for 24 weeks. The children were followed for a median period of 130 weeks.
Unlike trials in adults PENTA11 reported no deaths or serious clinical events. During
the first PTI just over half the children had to restart therapy early, before 48 weeks had
lapsed. A quarter of the children in the PTI arm underwent a 2nd
PTI. 4 children on PTI
compared to 1 child on CT experienced a primary endpoint, CD4%<15% and CD4
count<200cells/µl for children 7years and older. In contrast to other trials PENTA11
reported an association between nadir CD4 count and restarting early. As expected after
72 weeks fewer children in the PTI arm than in the CT arm were virally suppressed.
Interestingly CD4 recovery after PTI was better in younger children (Gibb et al. 2008).
This chapter describes a pilot substudy in a small number of children involved in the
PENTA11 trial. It attempts specifically to address whether children with chronic HIV

169
infection undergoing planned antiretroviral treatment interruptions are disadvantaged
immunologically by periods of time without treatment. This was done by comparing the
distribution of CD4 subsets and activation and proliferation, as discussed in chapters
three and four, in children assigned to the PTI arm, during and after PTI and against the
results observed in children assigned to the continuous treatment (CT) arm.
5.2 METHODS
5.2.1 Participants
Detailed information on participant recruitment and ethical approval for the whole study
are provided in the appendix. This substudy investigated immunological parameters in
24 children in the UK, 12 assigned to PTI and 12 to CT, and within 12 children in Italy,
7 assigned to PTI and 5 to CT. The study plan for PENTA 11 allowed for multiple
interruption periods, however only 5 of the children included this substudy underwent
more than one interruption. Data was unavailable for several time points due to non-
attendance by the subjects, failure to collect the sample, failure to prepare the sample or
dead cells upon thawing of the frozen PBMCs.
5.2.2 Sample collection and storage
10 ml of whole blood were collected by venesection from each child within the
predetermined time points in EDTA tubes. Within the day PBMCs were isolated by
density gradient centrifugation as described in chapter 2. PBMCs were divided into 3
aliquots and stored at -80°C until use. At each time point viral loads and lymphocytes
were also quantified by the GOSH (UK samples) or Padova University Hospital (Italian
samples) clinical Immunology and Virology laboratories, and thus were available for
analyses.

170
5.2.3 Immunophenotyping
Single aliquots for every child at every time point, where available, were thawed and
resupended in media as described in chapter 2. Samples of dead cells, identified by
inability to form cell suspensions and flow cytometric SSC/FSC profiles were excluded
from analysis. 100 µl aliquots of cell suspension were incubated with anti-CD4,
CD45RA, CD31 antibodies and either anti-HLA-DR antibody or after permeabilisation
anti-Ki67 antibody as described in chapter 2. Samples were then acquired and analysed
by flow cytometry as described in chapter 4. Sample collection, storage and
immunophenotyping of Italian samples were similarly performed by Anita de Rossi‟s
group at the University of Padova.
5.2.4 Analysis
Immunophenotyping protocols used in this thesis and described in chapter 2 were the
same as those used by Anita de Rossi‟s group except that HLA-DR expression was not
assessed in the Italian cohort and Ki67 expression was only measured in two populations
of CD4+ T cells, the CD45RA
+ and CD45RA
- fractions. The results of the UK and
Italian cohorts showed similar trends and as they were produced by common methods,
the two cohorts were combined to increase total numbers as in both cohorts, some time
points had been missed.
14 (74%) of the children in the PTI group only underwent one period of treatment
interruption. Measurements taken during the first period of interruption (1st PTI) for all
children assigned to PTI were compared to the same variables in children assigned to CT
for a similar length of time. Measurements made once children in the PTI arm restarted
therapy (1st restart) are compared to the same variables in children on the CT arm for a
similar length of time. Measurements were fitted into nominal week windows counted as
weeks after interrupting or after restarting therapy. Nominal week windows for the
period of interruption were assigned as follows:

171
Nominal Week=0 if sample was collected before or at week 0 of interrupting
therapy
Nominal Week=2 if sample collected week>0 & week<3
Nominal Week=4 if sample collected week>=3 & week<6
Nominal Week=8 if sample collected week>=6 & week<10
Nominal Week=12 if sample collected week>=10 & week<18
Nominal Week=24 if sample collected week>=18 & week<36
Nominal Week=48 if sample collected week>=36 & week<60
And so on every 24 weeks.
Nominal week windows for the restart period were the same except that nominal week 0
of restarting treatment only included samples collected during week 0 of restarting
treatment and there was no nominal week 8. Therefore nominal week 4 included
samples collected at or after week 3 but before week 8 and nominal week 12 included
samples collected at or after week 8 but before week 18.
To compare changes to parameters in the PTI group against the CT group,
measurements during each nominal week window were transformed into percentage
change from baseline, where the baseline was either week 0 of interruption or week 0 of
restart, using the equation shown Figure 5.1. Parameter measurements at week 0 of 1st
PTI and at week 0 of 1st restart were not made for 3 out of the 19 subjects assigned to the
PTI arm of the trial because the samples of PBMCs were dead. Therefore these subjects
could not be included in the analysis.
Figure 5.1 Percentage change from baseline equation
% change from
baseline at week x value at week 0
value at week x - value at week 0X 100%=

172
A total of 168 samples from the 16 subjects included in the analysis of the PTI arm were
thawed, of these 150 (89%) were deemed to be viable. 87 samples were from time points
during the 1st interruption period, 57 from the 1
st restart period, 3 from the 2
nd
interruption period and 3 from the 2nd
restart period. For each parameter measured, the
median percentage change from baseline at each time point is presented, along with the
associated IQR where the sample numbers were greater than or equal to four. For each
parameter the numbers of samples quantified at each time point are indicated on the
graphs.
If children met the restart criteria, a confirmed CD4+ T cell count of less than 20% in
children under 7 years, or less than 20% or less than 350 cells/µl in children 7 years and
older, they resumed treatment before the full 48 week period had lapsed. Therefore the
18 children included in the analysis of the PTI arm could be divided into two groups; a
group of early restarters, 4 (22%) children, who had to restart therapy before 48 weeks
and another group of late restarters, 14 (78%) children, who completed the whole 48
week interruption period. Amongst the early restarters, 1 child restarted therapy after 8
weeks, 2 after 12 weeks and 1 after 24 weeks. Results submitted for publication by the
PENTA 11 study group found that the nadir CD4+ T cell count before PTI was
significantly lower in early versus late restarters. Changes observed in the early restart
group are compared to the late restart group for each parameters measured where
samples were available.
The concentrations of CD4+ T cell subsets were calculated by multiplying the percentage
size of the subsets against the CD4 count. The concentration of HLA-DR+ and Ki67
+
cells of each cell population were determined by multiplying the percentage HLA-DR or
Ki67 expression within each population against the concentration of each population.
Lastly results from the children who underwent more than one PTI during the period of
follow up are described.

173
5.3 RESULTS
5.3.1 PTI and CT study populations at randomisation
At randomisation there was no difference between the children assigned to PTI and the
children assigned to CT in terms of the ages of children, the CD4+ T cell counts,
percentages and concentrations of CD4+ T cell subsets and viral loads (Table 5.1). All
participants had an undetectable viral load.
Table 5.1 Characteristics of study populations at randomisation
PBMC samples were obtained from children undergoing a PTI or CT regime. Median value and
IQR are given for the PTI and CT arms. † For the purpose of analysis, undetectable VLs (below 50
copies/ml) were considered equivalent to 50 copies/ml.
5.3.2 Effect of interrupting and restarting treatment on HIV viraemia and CD4+
T cells during 1st PTI, 1st restart and CT
When CD4 count was examined over the duration of the PTI (Figure 5.2) it was found to
decrease from baseline until the 4th week, and thereafter did not change. Interestingly
the decline in the percentage of CD4 cells lagged behind the decline in concentration.
Until week 4 the percentage of CD4 cells was close to baseline, then decreased until
week 8 and then held steady after that point. The change in viral load from baseline in
VARIABLE
PTI (n=16) CT (n=17)
MEDIAN LQ UQ MEDIAN LQ UQ
Age (years) 8.9 6.05 10.9 9.25 5.75 11.25
CD4 count (cells/µl) 1049 860 1274 1013 841 1075
CD4+ T cells (% of
total lymphocytes) 36.6 32.75 40.55 35 33.3 39.6
Total lymphocytes/µl 2765 2325 3385 2827 2410 3200
Log viral load
(copies/ml) † 1.7 1.7 1.7 1.7 1.7 1.7

174
the PTI group showed a steep increase until week 4 and then plateau-ed for the
remaining time of PTI. During this time, in the CT group, there was almost no change in
viral load from baseline.
Figure 5.2 Change to the concentration and percentage of CD4+ T cells during 1
st PTI
The percentage change from baseline of the absolute concentration and percentage of CD4+ T cells
during the 1st PTI (red line and squares) were compared to the percentage change from baseline
during CT (blue line and diamonds) of the same duration. Numbers indicate the number of samples
available at each time point for both arms and vertical lines show the IQR.
0 2 4 8 12-75
-50
-25
0
25
50
75
19
24
24 48
6
15
10
15
7
13
11
15
15
15
18
13
Nominal Week of Therapy interruption
% c
han
ge f
rom
baseli
ne
CD
4 c
ou
nt
0 2 4 8 12-75
-50
-25
0
25
50
75
19
24
24 48
6
15
10
15
7
13
11
15
15
15
18
13
Nominal Week of Therapy interruption
% c
han
ge f
rom
baseli
ne
% C
D4 c
ell
s
A
B
0 2 4 8 12-100
0
100
200
300
18
14
24 48
6
10
11
11
7
9
11
10
16
11
18
7
Nominal Week of Therapy interruption
% c
han
ge f
rom
baseli
ne
log
vir
al
load
C
175
At the end of the interruption period HAART was reintroduced but an increase in the
CD4 count was not seen until after the 12th
week (Figure 5.3). The CD4 count did not
increase in all subjects, indicated by the wide IQRs. The percentage of CD4 cells did not
increase upon restarting treatment. Initially no change to viral load was detected upon
restarting treatment but by week 4 viral loads had fallen and continued to decrease for
several weeks before plateauing though by this point there are only 1-2 subjects
therefore it is difficult to comment on this trend.
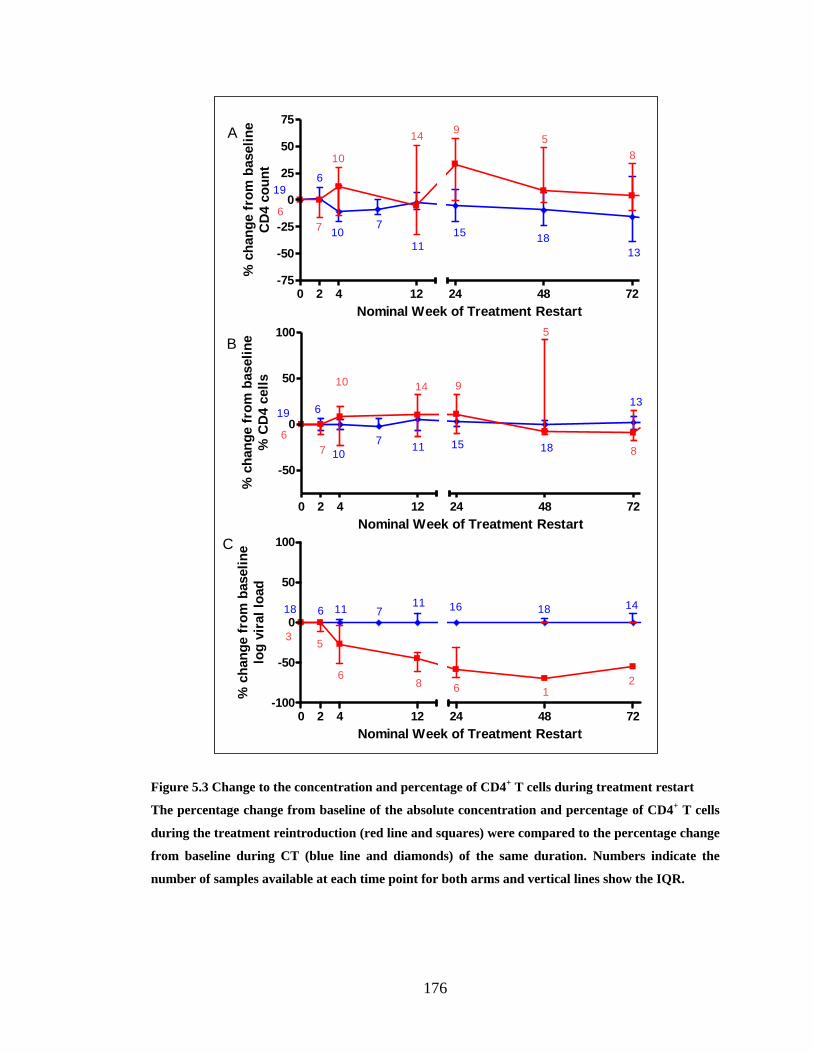
176
Figure 5.3 Change to the concentration and percentage of CD4+ T cells during treatment restart
The percentage change from baseline of the absolute concentration and percentage of CD4+ T cells
during the treatment reintroduction (red line and squares) were compared to the percentage change
from baseline during CT (blue line and diamonds) of the same duration. Numbers indicate the
number of samples available at each time point for both arms and vertical lines show the IQR.
0 2 4 12-75
-50
-25
0
25
50
75
19
6
6
710
10
14
11
9
15
5
18
8
24 48 72
Nominal Week of Treatment Restart
% c
han
ge f
rom
baseli
ne
CD
4 c
ou
nt
7
13
0 2 4 12
-50
0
50
100
24 48 72
Nominal Week of Treatment Restart
% c
han
ge f
rom
baseli
ne
% C
D4 c
ell
s
19
6
6
7 11
10 14
15
9
18
5
13
87
10
A
B
0 2 4 12-100
-50
0
50
100
24 48 72
Nominal Week of Treatment Restart
% c
han
ge f
rom
baseli
ne
log
vir
al
load
18 6 11 711 16 18 14
35
68 6 1
2
C

177
5.3.3 The major influence of PTI is on concentration and not proportions of
CD45RA and CD31 defined subsets
CD4+ T cell subsets were enumerated at specific time points after therapy interruption
(weeks 0, 2, 4, 8, 12, 24 and 48); therefore changes to the percentage and concentration
of CD4+ T cell subsets during the 1
st PTI could be examined by looking at the
percentage change from baseline with increasing time off therapy and compared to CT
of a similar duration (Figure 5.4 and Figure 5.5).
In the CT group the median percentage of CD4+ T cell subsets appeared to changed little
form baseline over 48 weeks, although considering the IQR there was considerable inter-
patient variation in the percentage change to the CD45RA-CD31
+ subset over the
treatment interruption period (Figure 5.4).
In the PTI arm the percentage of CD45RA+CD31
+ cells decreased at week 4 before
stabilising towards baseline levels by week 8 and then decreased again at week 48,
however this was within a small subject group. There also appeared to be a transient
decline in the percentage of CD45RA+CD31
- at 2 weeks. There was a transient rise in
the percentage of CD45RA-CD31
- cells at 4 weeks which had returned towards baseline
at week 8. The proportion of these cells appeared to increase towards the end of the 48
week period of interruption. As with the CT group there was substantial variation in the
percentage change from baseline in the CD45RA-CD31
+ cells during PTI. Therefore
overall there is minimal change to the distribution of CD4 subsets during PTI compared
to CT.
When the concentration of cells was compared between the two treatment arms (Figure
5.5), by 2-8 weeks all subsets had decreased in the PTI arm compared to CT.
Interestingly the concentration of cells appeared to stabilise by week 12 until the end of
the 1st PTI.

178
0 2 4 8 12-100
-50
0
50
100
150
6
1116
9
20
25
1311 10
5
24 48
Nominal week of therapy interruption
% c
han
ge f
rom
baseli
ne o
f
%C
D45R
A+C
D31
-
6 8
11
12
0 2 4 8 12-100
-50
0
50
100
24 48
Nominal Week of Therapy interruption%
ch
an
ge
fro
m b
as
elin
e o
f
%C
D4
5R
A+C
D31
+
6
1116
9
20
2513
11 10
5
68
1112
0 2 4 8 12-100
-50
0
50
100
150
200
24 48
611
169
20
25
13
1110
5
6
8
1112
Nominal Week of Therapy interruption
% c
han
ge f
rom
baseli
ne
of
%C
D45R
A- C
D31
-
0 2 4 8 12-100
-50
0
50
100
150
24 48
611
169
20
25
13
11
10 5
8
11
12
6
Nominal Week of Therapy interruption
% c
han
ge f
rom
baseli
ne
of
%C
D45R
A- C
D31
+
A
B
C
D
Figure 5.4 Change in CD4+ T cell subset during 1st PTI
The percentage change from baseline of proportions of CD4+ T cell subsets during the 1
st PTI (red
line and squares) were compared to the percentage change from baseline during CT (blue line and
diamonds) of the same duration. Numbers indicate the number of samples available at each time
point for both arms and vertical lines show the IQR.

179
0 2 4 8 12-100
-50
0
50
100
150
6
15
107
13
19
911
10
11
5
24 48
Nominal Week of Therapy interruption
% c
han
ge f
rom
baseli
ne o
f
CD
45R
A+C
D31
- co
ncen
trati
on
6
6
11
0 2 4 8 12-100
-50
0
50
100
24 48
615
10
7 13
19
911
10115
6
6
11
Nominal Week of Therapy interruption%
ch
an
ge f
rom
baseli
ne o
f
CD
45R
A+C
D31
+ c
on
cen
trati
on
0 2 4 8 12-100
-50
0
50
100
24 48
Nominal Week of Therapy interruption
% c
han
ge f
rom
baseli
ne o
f
CD
45R
A- C
D31
- co
ncen
trati
on
615
10
7
13
19
9
11
1011 5
6
6
11
0 2 4 8 12-100
-50
0
50
100
150
200
250
24 48
6
1510 7
13
19
9
11 1011 5
6
6
11
Nominal Week of Therapy interruption
% c
han
ge f
rom
baseli
ne o
f
CD
45R
A- C
D31
+ c
on
cen
trati
on
A
B
C
D
Figure 5.5 Change in concentration of CD4+ T cell subsets during 1st PTI
The percentage changes from baseline of the concentrations of CD4+ T cell subsets during the 1
st
PTI (red line and squares) were compared to the percentage changes from baseline during CT (blue
line and diamonds) of the same duration. Red and blue numbers indicate the number of samples of
1st PTI and CT respectively at each time point and vertical lines show the IQR.

180
5.3.4 HLA-DR expression during PTI
Changes in the level of HLA-DR expression by CD4+ T cells and subsets from baseline
were followed during the 1st PTI and compared to the changes during CT of the same
duration. The percentage change in HLA-DR expression by CD4+ T cells and subsets
and the concentrations of HLA-DR+ cells during PTI compared to CT are shown in
Figure 5.6 and Figure 5.7. On average HLA-DR expression by CD4+ T cells doubled
quickly from baseline by week 2 but decreased towards baseline by week 4. Within the
CD4+ T cells subsets a transient increase in HLA-DR expression occurred in all
subpopulations. Changes to the concentration of HLA-DR+ cells during PTI were also
assessed and found to be similar to that seen in the CT arm.
0 2 4 8 12-100
0
100
200
300
24 48
614 2
711
14
6
7
10
8
2
6
8
6
Nominal Week of Therapy interruption
% c
han
ge f
rom
baseli
ne o
f
% H
LA
-DR
exp
ressio
n b
y C
D4
+T
cell
s
A

181
0 2 4 8 12-100
0
100
200
300
24 48
6
14 2
711
14
6
7
10
8
2
6
8
6
Nominal Week of Therapy interruption
% c
han
ge f
rom
baseli
ne o
f
% H
LA
-DR
+ o
f C
D45R
A+C
D31
-cell
s
0 2 4 8 12-100
-50
0
50
100
150
200
250
24 48
6
14 27
11
14
6 7
10
8
2
6 8
6
Nominal Week of Therapy interruption%
ch
an
ge
fro
m b
as
eli
ne
of
% H
LA
-DR
+ o
f C
D4
5R
A+C
D31
+ce
lls
0 2 4 8 12-100
0
100
200
300
400
24 48
614 2
7 11
14
6
710
8 2
6 8
6
Nominal Week of Therapy interruption
% c
ha
ng
e f
rom
ba
seli
ne
of
% H
LA
-DR
+ o
f C
D4
5R
A- C
D31
-ce
lls
0 2 4 8 12-100
0
100
200
300
24 48
614 2
711
14
6
710
8 2
68
6
Nominal Week of Therapy interruption
% c
ha
ng
e f
rom
ba
seli
ne
of
% H
LA
-DR
+ o
f C
D4
5R
A- C
D31
+ce
lls
B
C
D
E
Figure 5.6 Change in HLA-DR expression by CD4+ T cells and subsets during 1st PTI
The percentage changes from baseline of HLA-DR expression by CD4+ T cells and subsets during
the 1st PTI (red line and squares) were compared to the percentage changes from baseline during
CT (blue line and diamonds) of the same duration. Red and blue numbers indicate the number of
samples of 1st PTI and CT respectively at each time point and vertical lines show the IQR.

182
0 2 4 8 12-100
-50
0
50
100
150
24 48
Nominal Week of Therapy interruption
% c
han
ge f
rom
bas
eli
ne o
f
co
nc
en
tra
tio
n H
LA
-DR
+C
D4
+ T
cells
9
8
6
8
5
8
2
5
5
6
6
5
8
2
A

183
0 2 4 8 12-100
-50
0
50
100
24 48
8
8
8
5
6 5
2
9
6 5
2 56
8
Nominal Week of Therapy interruption
% c
ha
ng
e f
rom
ba
selin
e o
f
HLA
-DR
+C
D4
5R
A+C
D3
1-
con
ce
ntra
tio
n
0 2 4 8 12-100
-50
0
50
100
150
200
24 48
Nominal Week of Therapy interruption
% c
ha
ng
e f
rom
ba
selin
e o
f
HLA
-DR
+C
D4
5R
A+C
D3
1+
con
ce
ntra
tio
n
8
8
8 5 65 2
9
6
5
2
56
8
0 2 4 8 12-100
-50
0
50
100
150
200
24 48
8
88
56
5
2
9
6
5
2
5
68
Nominal Week of Therapy interruption
% c
ha
ng
e f
rom
ba
selin
e o
f
HLA
-DR
+C
D4
5R
A- C
D3
1-
con
ce
ntra
tio
n
0 2 4 8 12-100
0
100
200
300
24 48
Nominal Week of Therapy interruption
% c
ha
ng
e f
rom
ba
selin
e o
f
HLA
-DR
+ CD
45
RA
- CD
31
+
con
ce
ntra
tio
n
8
8
8
5
6
5
2
96
5
2
5
6
8
B
C
D
E
Figure 5.7 Change in concentration of HLA-DR + cells and subsets during 1st PTI
The percentage changes from baseline of the concentrations of HLA-DR + cells during the 1
st PTI
(red line and squares) were compared to CT (blue line and diamonds) of the same duration. Red
and blue numbers indicate the number of samples of 1st PTI and CT respectively at each time point
and vertical lines show the IQR.

184
5.3.5 Ki67 expression increases during PTI
Changes in the level of Ki67 expression by CD4+ T cells and subsets from baseline were
followed over the course of the 1st PTI and compared to the changes during CT of the
same duration. The percentage change in Ki67 expression by CD4+ T cells and subsets
and the concentrations of Ki67+ cells during PTI compared to CT are shown in Figure
5.8 and Figure 5.9.
There was a transient increase in the percentage of Ki67+ CD4
+ cells at 4 weeks but
decreased to baseline by week 8. This transient increase was predominantly because of
Ki67 expression in the CD45RA- population. Amongst the CD45RA
- subsets, CD45RA
-
CD31- and CD45RA
-CD31
+, percentage of Ki67 expression increased in both but
remained elevated in CD45RA-CD31
+, throughout PTI.
The change from baseline in the concentration of Ki67+ cells was also assessed in Figure
5.10 and Figure 5.11. The concentration of Ki67+CD4
+ cells increased transiently.
Amongst the Ki67+CD45RA
+ and Ki67
+CD45RA
- cells the concentration of
Ki67+CD45RA
+ cells increased transiently but the increase in the concentration of was
Ki67+CD45RA
- cells was sustained. The concentration of cells was also elevated
amongst the Ki67+CD45RA
+CD31
-, Ki67
+CD45RA
-CD31
- and Ki67
+CD45RA
-CD31
+
but not the Ki67+CD45RA
+CD31
+ cells.

185
Figure 5.8 Change in Ki67 expression by CD4+ T cells and CD45RA defined subsets during 1st PTI
The percentage changes from baseline of Ki67 expression by CD4+ T cells (A) and CD45RA
+ (B) and
CD45RA- (C) subsets during the 1
st PTI (red line and squares) were compared to the percentage
changes from baseline during CT (blue line and diamonds) of the same duration. Red and blue
numbers indicate the number of samples of 1st PTI and CT respectively at each time point and
vertical lines show the IQR.

186
Figure 5.9 Change in Ki67 expression by CD4+ T cells and CD45RA and CD31 defined subsets
during 1st PTI
The percentage changes from baseline of Ki67 expression by CD45RA+CD31
-(A), CD45RA
+CD31
+
(B), CD45RA-CD31
- (C) and CD45RA
-CD31
+ (D) CD4
+ T cells subsets during the 1
st PTI (red line
and squares) were compared to the percentage changes from baseline during CT (blue line and
diamonds) of the same duration. Red and blue numbers indicate the number of samples of 1st PTI
and CT respectively at each time point and vertical lines show the IQR.
0 2 4 8 12-100
0
100
200
300
400
500
24 48
13
13
7
7
4 3
2
6
7
6
5
1
116
Nominal Week of Therapy interruption
% c
han
ge f
rom
baseli
ne o
f
%K
i67
+ o
f C
D45R
A+C
D31
-
0 2 4 8 12-100
0
100
200
300
400
500
24 48
13
13
7
7
4
3
2
6
7 6
5
1
11
6
Nominal Week of Therapy interruption
% c
han
ge f
rom
baseli
ne o
f
%K
i67
+ o
f C
D45R
A+C
D31
+
0 2 4 8 12-100
0
100
200
300
24 48
13
13
7
7
4
3
2
6
76
5
1
116
Nominal Week of Therapy interruption
% c
ha
ng
e f
rom
ba
seli
ne
of
%K
i67
+ o
f C
D4
5R
A- C
D31
-
0 2 4 8 12-100
0
100
200
300
400
24 48
13
13
77
4
3
2
6
7
6
5
1
11
6
Nominal Week of Therapy interruption
% c
ha
ng
e f
rom
ba
seli
ne
of
%K
i67
+ o
f C
D4
5R
A- C
D31
+
A
B
C
D

187
Figure 5.10 Change in the concentration of CD45RA defined Ki67+ cells during 1
st PTI
The percentage changes from baseline of the concentrations of Ki67+ CD4
+, CD45RA
+ and CD45RA
-
cells during the 1st PTI (red line and squares) were compared to the percentage changes from
baseline during CT (blue line and diamonds) of the same duration. Red and blue numbers indicate
the number of samples of 1st PTI and CT respectively at each time point and vertical lines show the
IQR.
0 2 4 8 12-100
-50
0
50
100
150
200
24 48
10
12
6
6
7
7
3
3
6
5
5
6
2
10
Nominal Week of Therapy interruption
% c
han
ge f
rom
baseli
ne o
f
Ki6
7+C
D4
+co
ncen
trati
onA
B
C
0 2 4 8 12-100
0
100
200
300
24 48
10
12
6
6
4
7
2
3 4
5
5
6
8
10
Nominal Week of Therapy interruption
% c
han
ge f
rom
baseli
ne o
f
Ki6
7+C
D45R
A+ c
on
cen
trati
on
0 2 4 8 12-100
0
100
200
300
24 48
Nominal Week of Therapy interruption
% c
han
ge f
rom
baseli
ne o
f
Ki6
7+C
D45R
A- c
on
cen
trati
on
10
12
6
6
4
72
3
4
55
6
8
10

188
Figure 5.11 Change in the concentration of CD45RA and CD31 defined Ki67+ cells during 1st PTI
The percentage changes from baseline of the concentrations of Ki67+ CD4
+, CD45RA
+ and CD45RA
-
cells during the 1st PTI (red line and squares) were compared to the percentage changes from
baseline during CT (blue line and diamonds) of the same duration. Red and blue numbers indicate
the number of samples of 1st PTI and CT respectively at each time point and vertical lines show the
IQR.
0 2 4 8 12-200
0
200
400
600
800
24 48
Nominal Week of Therapy interruption
% c
han
ge f
rom
baseli
ne o
f
Ki6
7+C
D45R
A+C
D31
- co
ncen
trati
on
4
8
4
6
4
4
2
2
3
4
2
5
1
8
A
B
C
D
0 2 4 8 12-100
0
100
200
300
24 48
Nominal Week of Therapy interruption%
ch
an
ge f
rom
baseli
ne o
f
Ki6
7+C
D45R
A+C
D31
+ c
on
cen
trati
on
4
8
4
6
4
4
2
2
3
4
2
5 1
8
0 2 4 8 12-100
0
100
200
300
24 48
4
8
4
6
4
4
2
2
3
4
2
5
1
8
Nominal Week of Therapy interruption
% c
han
ge f
rom
baseli
ne o
f
Ki6
7+C
D45R
A- C
D31
- co
ncen
trati
on
0 2 4 8 12-100
0
100
200
300
400
500
600
700
24 48
4
8
4
6
4
4
2
2
3
4
2
5
1
8
Nominal Week of Therapy interruption
% c
han
ge f
rom
baseli
ne o
f
Ki6
7+C
D45R
A- C
D31
+ c
on
cen
trati
on

189
5.3.6 Changes to CD4+ T cell subsets on restarting HAART
When children were reintroduced to treatment after a PTI the changes from baseline,
week 0 of treatment restart, to the percentages and concentrations of CD4+ T cells were
compared to the changes from baseline in children who had been on CT. The percentage
change from baseline of the percentages and concentrations of CD4+ T cell subsets
compared to CT are shown in Figure 5.12 and Figure 5.13. The percentages of CD4
subsets, similar to CT, appeared unchanged upon restarting. By week 48 of treatment
resumption there was a median increase in CD4 count of 25% but this did not occur in
all patients are seen by the wide IQRs (0.3-57%). This is in accordance with
observations in the CD4 subsets where at week 48 we detected an increase of 33% (16-
130%) in the CD45RA+CD31
+, 41% (10-285%) in the CD45RA
+CD31
-, 29% (-21-
164%) in the CD45RA-CD31
- and 100% (24-456%) in the CD45RA
-CD31
+.

190
Figure 5.12 Change in CD4+ T cell subset during treatment restart
The percentage change from baseline of proportions of CD4+ T cell subsets during the treatment
restart (red line and squares) were compared to the percentage change from baseline during CT
(blue line and diamonds) of the same duration. Red and blue numbers indicate the number of
samples of 1st PTI and CT respectively at each time point and vertical lines show the IQR.
0 2 4 12 24-100
0
100
200
300
400
21
3
48 72 96 120 144
6
8
11
9
15
10 9
12
17
5
14
8
9
1
71
3
Nominal Week of Restart
% c
han
ge f
rom
baseli
ne
CD
45R
A+C
D31
- %
0 2 4 12 24-100
-50
0
50
100
48 72 96 120 144
21
3
6
8
11
9
15
10
9
12 17
514
8
9
1
7
1
3
Nominal Week from restart
% c
han
ge f
rom
baseli
ne
CD
45R
A+C
D31
+%
0 2 4 12 24-100
-50
0
50
100
150
48 72 96 120 144
21
36
8
11
9
15
10
9
12 17
514
8
9 1
71
3
Nominal Week of Restart
% c
han
ge f
rom
baseli
ne
CD
45R
A- C
D31
- %
0 2 4 12 24-100
-50
0
50
100
150
200
250
48 72 96 120 144
21
3
6
8
11
915
10
9
12
17
5
14
8
91
7
1
3
Nominal Week of Restart
% c
han
ge f
rom
baseli
ne
CD
45R
A- C
D31
+%
A
B
C
D

191
Figure 5.13 Change in concentration of CD4+ T cell subsets during treatment restart
The percentage changes from baseline of the concentrations of CD4+ T cell subsets during the 1
st
restart (red line and squares) were compared to the percentage changes from baseline during CT
(blue line and diamonds) of the same duration. Red and blue numbers indicate the number of
samples of 1st restart and CT respectively at each time point and vertical lines show the IQR

192
5.3.7 HLA-DR expression decreased on restarting HAART
The changes from baseline, week 0 of treatment restart, to HLA-DR expression by CD4+
T cells and subsets in children who were restarting therapy after a PTI were compared to
the changes from baseline in children who had been on CT. The percentage change from
baseline of HLA-DR expression by CD4+ T cells and subsets and the concentrations of
HLA-DR+ cells compared to CT are shown in Figure 5.14 and Figure 5.15. Upon
restarting therapy there was a decrease in the percentage expression of HLA-DR, this
was predominantly due to the CD45RA- subsets, CD45RA
-CD31
- and CD45RA
-CD31
+.
There was no change in the concentration of HLA-DR+ cells except HLA-DR
+CD45RA
-
CD31+ cells which appeared to decrease.
0 2 4 12 24-100
-50
0
50
100
48 72 96 120 144
14
6
6
4
6
4
10
3
7
6
11
1
2
11
1
9
73
1
Nominal Week of Restart
% c
han
ge f
rom
baseli
ne
CD
4+ H
LA
-DR
exp
ressio
n
A

193
0 2 4 12 24-100
-50
0
50
100
150
48 72 96 120 144
14
6
6
4
6
4
10
3
7
6
11
1
2
111
9
73
1
Nominal Week of Restart
% c
han
ge f
rom
baseli
ne
CD
45R
A+C
D31
- HL
A-D
R
exp
ressio
n0 2 4 12 24
-100
-50
0
50
100
150
48 72 96 120 144
14
6
6
4
6
4
10
3
7
6
11
1
2
11 1
9
7
3
1
Nominal Week of Restart
% c
han
ge f
rom
baseli
ne
CD
45R
A+C
D31
+ H
LA
-DR
exp
ressio
n
0 2 4 12 24-100
-50
0
50
100
48 72 96 120 144
14
6
6
4
6
4
10
3
7
6
11
1
2
11
1
9
7 3
1
Nominal Week of Restart
% c
han
ge f
rom
baseli
ne
CD
45R
A- C
D31
- HL
A-D
R
exp
ressio
n
0 2 4 12 24-100
-50
0
50
100
150
48 72 96 120 144
14
6
6
4
6
410
3
7
6
11
12
11
1
9
73
1
Nominal Week of Restart
% c
han
ge f
rom
baseli
ne
CD
45R
A- C
D31
+ H
LA
-DR
exp
ressio
n
B
C
D
E
Figure 5.14 Change in HLA-DR expression by CD4+ T cells and subsets during treatment restart
The percentage changes from baseline of HLA-DR expression by CD4+ T cells and subsets during
the 1st restart (red line and squares) were compared to the percentage changes from baseline during
CT (blue line and diamonds) of the same duration. Red and blue numbers indicate the number of
samples of 1st restart and CT respectively at each time point and vertical lines show the IQR.

194
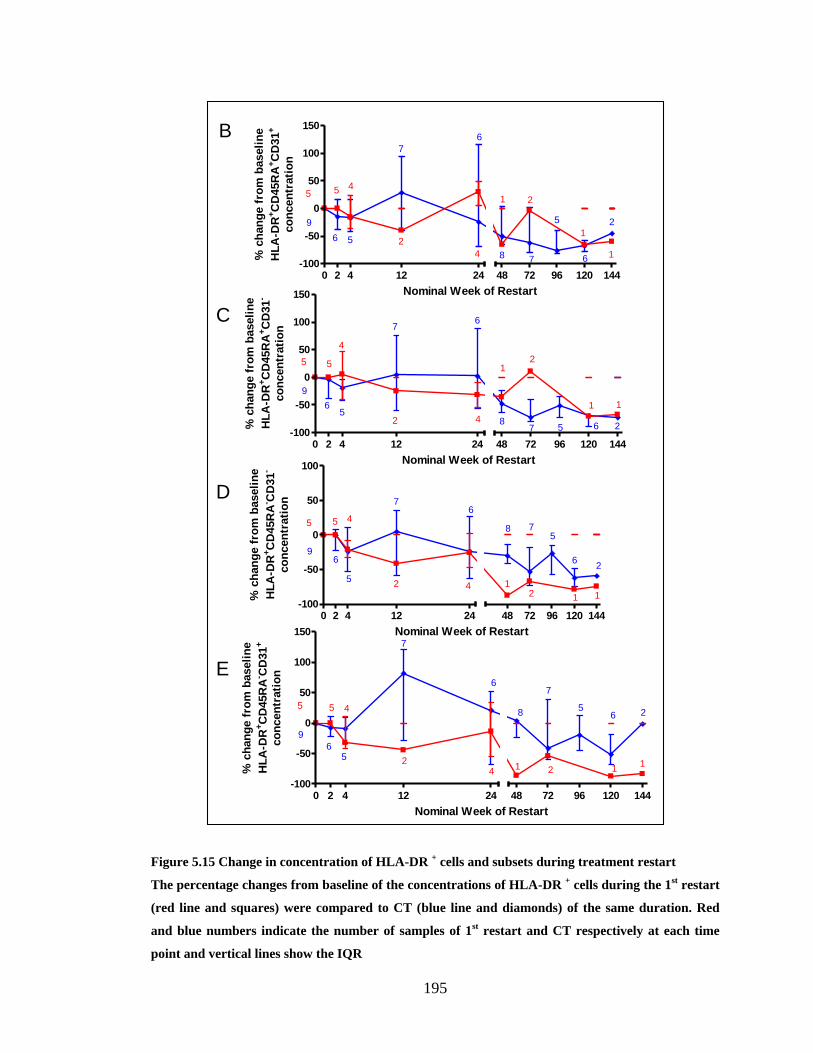
195
0 2 4 12 24-100
-50
0
50
100
150
48 72 96 120 144
9
5
6
5
5
4
7
2
6
4 8
1
7
2
5
1
6
1
2
Nominal Week of Restart
% c
han
ge f
rom
baseli
ne
HL
A-D
R+C
D45R
A+C
D31
-
co
ncen
trati
on
0 2 4 12 24-100
-50
0
50
100
150
48 72 96 120 144
9
5
6
5
5
4
7
2
6
4 8
1
7
2
5
1
6 1
2
Nominal Week of Restart
% c
han
ge f
rom
baseli
ne
HL
A-D
R+C
D45R
A+C
D31
+
co
ncen
trati
on
0 2 4 12 24-100
-50
0
50
100
48 72 96 120 144
9
5
6
5
5
4
7
2
6
4
8
1
7
2
5
1
6
1
2
Nominal Week of Restart
% c
han
ge f
rom
baseli
ne
HL
A-D
R+C
D45R
A- C
D31
-
co
ncen
trati
on
0 2 4 12 24-100
-50
0
50
100
150
48 72 96 120 144
9
5
6
5
5
4
7
2
6
4
8
1
7
2
5
1
6
1
2
Nominal Week of Restart
% c
han
ge f
rom
baseli
ne
HL
A-D
R+C
D45R
A- C
D31
+
co
ncen
trati
on
B
C
D
E
Figure 5.15 Change in concentration of HLA-DR + cells and subsets during treatment restart
The percentage changes from baseline of the concentrations of HLA-DR + cells during the 1
st restart
(red line and squares) were compared to CT (blue line and diamonds) of the same duration. Red
and blue numbers indicate the number of samples of 1st restart and CT respectively at each time
point and vertical lines show the IQR

196
5.3.8 Ki67 expression decreased on restarting HAART
The changes from baseline, week 0 of treatment restart, to Ki67 expression by CD4+ T
cells and subsets in children who were restarting therapy after a PTI were compared to
the changes from baseline in children who had been on CT. Figure 5.16 and Figure 5.17
show that upon restarting treatment the percentage of Ki67+ cells decreased, specifically
in the CD45RA- cells. Similarly the concentrations of Ki67
+ cells also decreased
following treatment restart.

197
Figure 5.16 Change in Ki67 expression by CD4+ T cells and CD45RA defined subsets during
treatment restart
The percentage changes from baseline of Ki67 expression by CD4+ T cells (A) and CD45RA
+ (B) and
CD45RA- (C) subsets during the 1
st restart (red line and squares) were compared to the percentage
changes from baseline during CT (blue line and diamonds) of the same duration. Red and blue
numbers indicate the number of samples of 1st restart and CT respectively at each time point and
vertical lines show the IQR
0 2 4 12 24-100
-50
0
50
100
150
200
48 72
17
9
6
3
7
7
11
8
6
6
14
1
13
5
Nominal Week of Restart
% c
han
ge f
rom
baseli
ne
CD
4+ K
i67 e
xp
ressio
n
0 2 4 12 24-100
0
100
200
300
17
6
6
2
7
3
11
3
6
3
13
113
5
48 72
Nominal Week of Restart
% c
han
ge f
rom
baseli
ne
CD
45R
A+ K
i67 e
xp
ressio
n
0 2 4 12 24-100
-50
0
50
100
150
200
48 72
17
6
6
2
7
3
11
3
6
3
13
1
13
5
Nominal Week of Restart
% c
han
ge f
rom
baseli
ne
CD
45R
A- K
i67 e
xp
ressio
n
A
B
C

198
Figure 5.17 Change in the concentration of Ki67+ cells and CD45RA defined subsets during
treatment restart
The percentage changes from baseline of the concentrations of Ki67+ CD4
+, CD45RA
+ and CD45RA
-
cells during the 1st restart (red line and squares) were compared to the percentage changes from
baseline during CT (blue line and diamonds) of the same duration. Red and blue numbers indicate
the number of samples of 1st restart and CT respectively at each time point and vertical lines show
the IQR
0 2 4 12 24-100
-50
0
50
100
12
5
6
2
7
4
8
4
6
3
10
1
10
4
48 72
Nominal Week of Restart
% c
han
ge f
rom
baseli
ne
Ki6
7+C
D4
+ c
on
cen
trati
on
0 2 4 12 24-100
-50
0
50
100
150
12
5
6
1
7
2
8
2
6
2
10
1 10
4
48 72
Nominal Week of Restart
% c
han
ge f
rom
baseli
ne
Ki6
7+C
D45R
A+ c
on
cen
trati
on
0 2 4 12 24-100
-50
0
50
100
48 72
Nominal Week of Restart
% c
han
ge f
rom
baseli
ne
Ki6
7+C
D45R
A- c
on
cen
trati
on
12
5
6
1
7
2
8
2
6
2
10
1 10
4
A
B
C

199
5.3.9 Early versus late restarters
Of the 18 children assigned to PTI, 4 „early restarters‟ experienced a decline in CD4+ T
cells below 20% and therefore had to restart therapy within 48 weeks, 14 „late restarters‟
completed the full 48 weeks of PTI. Starting age, CD4+ T cell count and percentage,
CD4+ T cell subsets counts and percentages, level of HLA-DR and Ki67 expression at
start were investigated as possible predictors of time to restart in children assigned to
PTI. However the sample sizes were too small to yield statistically significant results.
There is however, a tentative suggestion that changes to the relative sizes of CD4+ T cell
subsets during PTI and subsequent treatment restart, do not appear dissimilar between
the two groups. It also appears that both groups experience transient increases in HLA-
DR and Ki67 expression, levels were higher amongst the early restarters (Figure 5.18
and Figure 5.19).
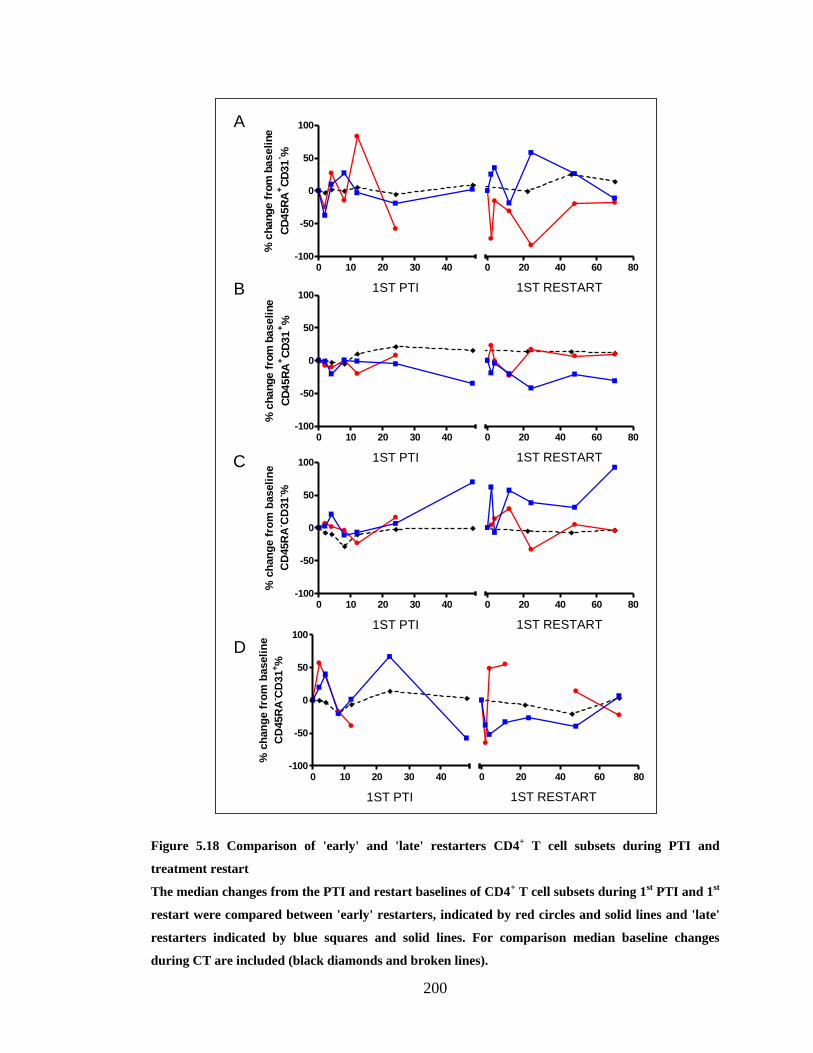
200
Figure 5.18 Comparison of 'early' and 'late' restarters CD4+ T cell subsets during PTI and
treatment restart
The median changes from the PTI and restart baselines of CD4+ T cell subsets during 1
st PTI and 1
st
restart were compared between 'early' restarters, indicated by red circles and solid lines and 'late'
restarters indicated by blue squares and solid lines. For comparison median baseline changes
during CT are included (black diamonds and broken lines).
0 10 20 30 40-100
-50
0
50
100
0 20 40 60 80
1ST PTI 1ST RESTART
% c
hange f
rom
baseline
CD
45R
A+C
D31
- %
0 10 20 30 40-100
-50
0
50
100
0 20 40 60 80
1ST PTI 1ST RESTART
% c
hange f
rom
baseline
CD
45R
A+C
D31
+%
0 10 20 30 40-100
-50
0
50
100
0 20 40 60 80
1ST PTI 1ST RESTART
% c
han
ge f
rom
baseli
ne
CD
45R
A- C
D31
- %
0 10 20 30 40-100
-50
0
50
100
0 20 40 60 80
1ST PTI 1ST RESTART
% c
han
ge f
rom
baseli
ne
CD
45R
A- C
D31
+%
A
B
C
D

201
Figure 5.19 Comparison between 'early' and 'late' restarters of HLA-DR and Ki67 expression by
CD4+ T cells during PTI and treatment restart
The median changes from the PTI and restart baselines of percentage HLA-DR and Ki67
expression by CD4+ T cells during 1
st PTI and 1
st restart were compared between 'early' restarters,
indicated by red circles and solid lines and 'late' restarters indicated by blue squares and solid lines.
For comparison the median baseline changes during CT are included (black diamonds and broken
lines)
5.3.10 Serial interruptions
Individuals who maintained their CD4+ T cells above 20% during the full 48 week PTI
were allowed to undergo a second interruption after restarting treatment for at least 24
weeks. 5 out of the 18 children assigned to PTI underwent a second further PTI during
the follow up period. In one child CD4+ T cell subsets, HLA-DR and Ki67 parameters
were measured during the 1st PTI, 1
st restart, the 2
nd PTI and 2
nd restart. The variation of
0 10 20 30 40-100
0
100
200
300
0 20 40 60 80
1ST PTI 1ST RESTART
% c
han
ge f
rom
baseli
ne
CD
4 H
LA
-DR
exp
ressio
n
0 10 20 30 40-100
0
100
200
300
0 20 40 60 80
1ST PTI 1ST RESTART
% c
han
ge f
rom
baseli
ne
CD
4 K
i67 e
xp
ressio
n
A
B

202
CD4+ T cell subsets, HLA-DR and Ki67 with time of follow up are shown in Figure
5.20, Figure 5.21 and Figure 5.22 respectively.
Apart from during the 1st PTI there seemed to be little change to the proportions of CD4
+
T cell subsets during the whole study period. During the 1st PTI there seemed to be a
transient increase in the percentage of CD45RA- cells and a transient decrease in
CD45RA+ cells within the first 4 weeks. Thereafter there was little change during 1
st
restart, 2nd
PTI and 2nd
restart.
The absolute counts of CD4+ T cell subsets declined during both 1
st and 2
nd PTI except
for the concentration of CD45RA+CD31
- cells, which appeared constant throughout. The
decline in the CD4+ T cell concentrations experienced during the 1
st interruption is
greater than the 2nd
interruption. During the 1st PTI cell counts declined until week 12
and held steady thereafter. Initiating the 1st restart the absolute counts increased back
towards baseline. The declines in CD4 subset count during the 2nd
PTI were smaller than
during the 1st PTI but once again increased during the 2
nd restart.

203
Figure 5.20 Variation of CD4+ T cell subsets during serial interruptions
Percentage size and concentrations of CD4+ T cell subsets are shown for a child who underwent 2
PTIs during the follow up period. CD45RA+CD31
-, CD45RA
+CD31
+, CD45RA
-CD31
- and CD45RA
-
CD31+ cells are shown in red, blue, purple and green respectively.
Percentage HLA-DR expression by CD4+ T cells increased transiently during the 1
st PTI
and then reduced after the 1st restart. During the 2
nd PTI the increase in HLA-DR
expression was less than during the 1st PTI but was sustained before declining slightly
during the 2nd
restart. Within the CD4+ T cell pool the largest increases in HLA-DR
1st PTI
0 10 200
10
20
30
40
50
60
CD45RA+ CD31-
CD45RA+ CD31+
CD45RA- CD31-
CD45RA- CD31+
60 70 80 90 100 110 140 150 160
1st restart 2nd PTI 2nd restart
Week
% o
f C
D4
+ T
cells
1st PTI
0 10 200
10
20
30
40
50
60
CD45RA+ CD31-
CD45RA+ CD31+
CD45RA- CD31-
CD45RA- CD31+
60 70 80 90 100 110 140 150 160
1st restart 2nd PTI 2nd restart
Week
% o
f C
D4
+ T
cell
s
1st PTI
0 10 200
100
200
300
400
500
600
700
60 70 80 90 100 110 140 150 160
1st restart 2nd PTI 2nd restart
CD45RA+ CD31-
CD45RA+ CD31+
CD45RA- CD31-
CD45RA- CD31+
Week
co
ncen
trati
on
of
CD
4+ T
cell
s/
l
1st PTI
0 10 200
10
20
30
40
50
60
CD45RA+ CD31-
CD45RA+ CD31+
CD45RA- CD31-
CD45RA- CD31+
60 70 80 90 100 110 140 150 160
1st restart 2nd PTI 2nd restart
Week
% o
f C
D4
+ T
cell
s
A
B

204
expression occurred in the CD45RA-CD31
- subset, then the CD45RA
+CD31
- subset and
least in the CD45RA+CD31
+ and CD45RA
-CD31
+ subsets.
Figure 5.21 Variation in HLA-DR expression during serial interruptions
Percentage HLA-DR expression by CD4+ T cells and concentration of HLA-DR
+ CD4
+ T cells (light
blue) are shown for a child who underwent 2 PTIs during the follow up period. Percentage HLA-DR
expression and concentration of HLA-DR+ cells are also shown for the specific subsets
CD45RA+CD31
-, CD45RA
+CD31
+, CD45RA
-CD31
- and CD45RA
-CD31
+ cells in red, blue, purple
and green respectively.
0 10 200
2
4
6
8
10
12
14
CD4CD45RA+ CD31-
CD45RA+ CD31+
CD45RA- CD31-
CD45RA- CD31+
60 70 80 90 100 110 140 150 160
20
30
Week
% H
LA
-DR
exp
ressio
n1st PTI 1st restart 2nd PTI 2nd restart
0 10 200
10
20
30
40
50
60
70
80
90
60 70 80 90 100 110 140 150 160
1st PTI 1st restart 2nd PTI 2nd restart
130
135
140
Week
co
ncen
trati
on
of
HL
A-D
R+
cell
s/
l
A
B
0 10 200
2
4
6
8
10
12
14
CD4CD45RA+ CD31-
CD45RA+ CD31+
CD45RA- CD31-
CD45RA- CD31+
60 70 80 90 100 110 140 150 160
20
30
Week
% H
LA
-DR
exp
ressio
n
1st PTI 1st restart 2nd PTI 2nd restart

205
The pattern seen with Ki67 was similar to HLA-DR. Specifically percentage Ki67
expression by CD4+ T cells increased transiently during the 1
st PTI and then again
during the 1st restart. The increase during the 2
nd PTI was smaller but declined again by
the end of the 2nd
PTI. Within the CD4+ T cell pool the largest increases occurred in the
CD45RA- subsets followed by the CD45RA
+CD31
- subset. Ki67 expression by
CD45RA+CD31
+ cells appeared unchanged throughout. During the 1
st PTI there was a
transient increase in the concentration of Ki67+CD45RA
- cells against a decline in the
total subset but this had declined by the 8th
week and held steady until the 2nd
PTI when
they again increased transiently. The concentration of Ki67+CD45RA
+ cells remained
low throughout.
Figure 5.22 Variation in Ki67 expression during serial interruptions
Percentage Ki67 expression by CD4+ T cells and concentration of Ki67
+ CD4
+ T cells (light blue) are
shown for a child who underwent 2 PTIs during the study. Expression and concentration are also
shown for the subsets CD45RA+CD31
-, CD45RA
+CD31
+, CD45RA
-CD31
- and CD45RA
-CD31
+ cells
in red, blue, purple and green respectively.
0 10 200.0
2.5
5.0
7.5
10.0
12.5
15.0
60 70 80 90 100 110 140 150 160
1st PTI 1st restart 2nd PTI 2nd restart
Week
% K
i67 e
xp
ressio
n
0 10 200
5
10
15
20
25
30
35
40
45
50
55
60 70 80 90 100 110 140 150 160
1st PTI 1st restart 2nd PTI 2nd restart
Week
co
ncen
trati
on
of
Ki6
7+
cell
s/
l
A
B
0 10 200
2
4
6
8
10
12
14
CD4CD45RA+ CD31-
CD45RA+ CD31+
CD45RA- CD31-
CD45RA- CD31+
60 70 80 90 100 110 140 150 160
20
30
Week
% H
LA
-DR
exp
ressio
n
1st PTI 1st restart 2nd PTI 2nd restart

206
5.4 DISCUSSION
This chapter describes the results of the first immunology study of its kind, in a trial of
CD4 guided planned treatment interruption in children with sustained viral suppression,
PENTA 11. Changes in proliferation and activation as determined by Ki67 and HLA-DR
expression were investigated in CD45RA and CD31 defined CD4+ T cell subsets during
sequential periods of interruption and restart. Results were analysis was performed by
assessing the relative change from baseline at various timepoints during both PTI and
restart and compared to changes from baseline in the CT arm.
Most of the variables measured displayed a wide distribution in both the PTI and CT
group and therefore their IQRs often overlapped. In fact CD4 count has been reported to
be more variable in children undergoing unplanned PTI than in adults undergoing
unplanned PTI (Gibb et al 2004).
Changes from baseline were detected in the PTI group for most parameters but
interestingly even in the CT group parameters tended to show some variation from
baseline during the study. These changes may reflect the dynamic nature of the CD4+ T
cell pool. The study was long, in excess of 2 years; therefore it was important to
compare trends in the PTI group to age associated changes which would also occur in
the CT group.
Changes to viral loads and lymphocytes were assessed in children assigned to CT and
PTI using the values quantified by the GOSH and Padova University Hospital Clinical
Immunology and Virology Laboratories. Over the follow up period there was a slow
gradual decrease in the concentration of CD4+ T cells in the CT arm, median 15%
decrease from baseline at week 72 but there was no change to the percentage of CD4
cells during this time. The viral load was also unchanged in the CT group, remaining
undetectable in almost all subjects. In comparison, both CD4+ T cells and viral load

207
changed considerably in the PTI arm. By weeks 4 and 8 of PTI the concentration and
percentage of CD4+ T cells had decreased by a median of over 25% from baseline.
Interestingly they did not fall any further after this point but remained at this level for
the remainder of the PTI period. Similarly viral load increased by a median of almost
200% by week 4 of the PTI and stayed at this level for the duration of the PTI period.
Within 4 weeks of restarting treatment in the PTI arm, the CD4 concentration and
percentage began to increase although only by a median of 12 and 10% respectively.
However by week 24 of restarting treatment the median CD4 concentration had
increased by over 25% but the median CD4 percentage had not increased any further.
The IQRs ranges for percentage change in CD4 count were wide therefore some children
experienced much larger increases than others and this in addition to the fact that
children were older after restarting therapy than they were at the beginning of the PTI
could explain why the median CD4 count experienced during treatment restart was less
than that experienced in the CT arm and also lower than experienced during the PTI.
Furthermore, in accordance with the results published for the whole PENTA 11 trial, the
largest increases from base line occurred in the younger children, for example after 24
weeks of restarting therapy half the children were under 8 years and had a percentage
change from baseline approximately 8-fold greater than in children 8 years and older.
Viral load fell slowly upon restarting treatment, by week 24 of restarting treatment the
median viral load had decreased by 75%. After this timepoint numbers were too small to
draw further conclusions.
CD4+ T cell subsets defined by CD45RA and CD31 were enumerated in children
assigned to CT and children assigned to PTI. Over the follow up period the median
percentages of subsets were unchanged in the CT group though there was some variation
to the proportion of CD45RA-CD31
+ cells. In the PTI arm there were transient changes
to the median percentage of each subset by week 4, specifically decreases in the
percentages of CD45RA+CD31
+ and CD45RA
+CD31
- cells and increases in the
percentages of CD45RA-CD31
+ and CD45RA
-CD31
- cells. Where after the subset
208
percentages returned to baseline until at least week 24 of PTI. After week 24 of PTI the
CD45RA+CD31
+ and CD45RA
-CD31
- cells decreased and increased respectively from
baseline.
The absolute concentrations of the CD4 subsets were also determined for both treatment
groups. In the CT group there was a slow gradual decline in the median concentration of
CD45RA+CD31
+ cells but the concentrations of the other subsets seemed unchanged.
During PTI the concentrations of all CD4+ T cell subsets appeared to decrease.
Upon treatment restart there did not appear to be any changes to the proportions of CD4+
T cell subsets. However after 24 weeks of resuming treatment increases to the
concentrations of CD4 subsets were observed. Although there was significant inter-
patient variation the greatest percentage increases from baseline were in the CD45RA-
CD31+ subset though this is partly a reflection of the small size of this subset i.e. a
modest absolute increase would translate into a large percentage increase. The increased
concentrations of CD4+ T cell subsets upon treatment restart are more marked when
compared to children undergoing CT who experienced decreased percentage changes
from baseline.
CD4+ T cell activation was monitored during the study by measuring the percentage
HLA-DR expression in the total CD4+ T cell population as well as in the subsets. In the
CT arm there appeared to be little change from baseline to HLA-DR expression except
for unexpected increase at week 8, which is most likely an anomaly. During PTI there
were transient increases in the percentage expression of HLA-DR at week 2 which
quickly returned to baseline and were unchanged for the rest of the PTI period.
Intriguingly the transient increases were of higher magnitude in the CD45RA+ subsets.
During PTI there were decreases in the concentrations of CD4+ T cells yet the
concentration of HLA-DR+ cells did not appear to change which would suggest that gain
of HLA-DR+CD4
+cells offsets loss of HLA-DR
+CD4
+cells.

209
Upon restarting treatment with HAART there was a slow and gradual decrease in the
percentage HLA-DR expression and in the concentration of HLA-DR+ cells.
CD4+ T cell proliferation was monitored during the study by measuring the percentage
Ki67 expression in the total CD4+ T cell population as well as in the subsets. In the CT
arm there was little change to Ki67 expression however during treatment interruption in
the PTI arm Ki67 expression increased. Within the CD45RA+ subsets there were
transient early increases but in the CD45RA- subsets the increases were sustained for
longer. The concentration of Ki67+ cells was unchanged in the CT arm but increased
during PTI despite decreased concentrations of all subsets. This would suggest that gain
of Ki67+CD4
+ cells exceeds loss of Ki67
+CD4
+ cells.
Upon restarting treatment there were moderate percentage decreases from baseline to
both the percentage Ki67 expression and to the concentration of Ki67+ cells.
Perhaps the most important theme to consistently emerge from these data is the
importance of set points in HIV infection. Although treatment interruption results in
initial perturbations to the percentage size of the CD4 subsets they quickly return to their
baseline levels, their set point levels. Also the CD4 count and viral load only fell and
rose respectively for the first few weeks of treatment interruption until they reach a set
point. It is likely that processes controlling cell numbers such as activation and
proliferation are important in re-establishing these set points because we detected early
increases in HLA-DR and Ki67 expression in the CD4+ T cell subsets, especially within
the memory populations. A key to optimising PTI and HAART may to working out
when these set points are established, how they are established and how they could be
altered in favour of higher CD4 counts and lower viral loads.

210
Upon restarting treatment, Ki67 expression decreased but cell numbers increased which
may suggest that the recovery is due to decreased loss rather than increased production.
In some children CD4 cells fell below 20% and therefore they resumed therapy after a
shortened PTI but children who maintained CD4 cells above 20% were permitted to
complete the full 48 week PTI. These children were termed „early‟ and „late‟ restarters
respectively. 25% of children assigned to PTI in PENTA11 were early restarters, which
is reflected in this substudy where 22% of the children on PTI therapy fell into this
group. The starting values of age, CD4 count, CD4 subsets and HLA-DR and Ki67
expression were compared between the two groups in order to identify predictors of
response to PTI i.e. factors associated with children who had to restart early but we
found no statistically significant associations. However it is not clear if this is because
none of these factors are predictors or because the numbers of children, especially in the
early restart group, were too small.
An attempt was made to determine whether early and late restarters underwent
dissimilar changes in response to interruption and restart. This could not realistically be
interpreted because of small numbers and missing time points within subjects though the
results may tentatively suggest that the transient increases in HLA-DR and Ki67
expression during PTI mentioned previously are steeper in early restarters than in late
restarters, though this must be confirmed with more children and more samples. In this
case higher HLA-DR expression in early restarters may explain why they experience a
quicker fall in CD4 count and hence had to restart treatment sooner.
Data was also provided on a 2nd
further PTI and 2nd
restart period for one child. The
decrease in absolute cell numbers was around 15% smaller in the 2nd
PTI compared to
the 1st PTI. Smaller increases to HLA-DR and Ki67 expression occurred during the 2nd
PTI compared to the 1st. Although data from more than one child is required to make any
conclusions the data does suggest that there may be an improvement to cell loss and the

211
degree of immune activation and proliferation as measured by HLA-DR and Ki67
expression respectively, during subsequent PTIs. This has also been suggested by an
adult PTI trial that employed several short cycles of treatment interruption (Borkowsky
et al 2008). Therefore it would be interesting to assess further periods of interruption in
more children. The child described here was followed for 3 years so any trial
investigating more periods of interruption would be liable to run for over 5 years.
This study was constrained by low numbers and this is most evident in the analysis of
„early‟ and „late‟ restarters. Greater numbers were required therefore ideally we would
have liked to extend the study by obtaining aliquots of PBMCs from other PENTA11
trial sites within Europe specifically biased towards children who restarted early. Equal
numbers of early and late restarters of adequate sample size would have strengthened the
results of any analysis. A number of time points had been missed for the various reasons
discussed. This was especially problematic if baseline PTI and baseline restart values
were not available because changes during PTI and restart could not be investigated. A
significant number of the time points missed were for samples that contained mostly
dead cells and were not viable.
CD4+ T cell sub-populations, immune activation and proliferation have not been
investigated in paediatric PTI trials. However a recent adult PTI trial conducted by
Libois et al investigated immune activation and naïve and memory cell dynamics during
cycles of PTI (Libois et al. 2006). They used 5 cycles of 2 weeks off and 8 weeks on
therapy followed by a 12 week treatment interruption after which most patients
remained off therapy until viral load peaked. They assessed immune activation of CD4+
T by CD38 expression and found no significant increase in CD38 expression during
neither the short nor the long treatment interruptions, compared to period of HAART
before the interruption. (Libois et al 2006). However this trial featured much shorter PTI
periods, 2 weeks compared to the 48 weeks used for the PENTA trial and we did not
detect increased HLA-DR expression until week 2-4. We presented data from the 2nd
interruption period for one child in PENTA 11 where HLA-DR expression was around

212
80% lower than during the 1st PTI therefore we propose that multiple interruption cycles
decrease the sensitivity of CD4+ T cells to immune activation which may explain why
Libois et al found CD38 expression unchanged after the long interruption.
Libois et al assessed naïve and memory cells by CD45RO, CD45RA and CD62L and
found that that during the 2 week PTI periods the percentage of naïve cells was higher
and the percentage of memory cells were lower than during the prior 8 week HAART.
During the 12 week treatment interruption they found that the percentage of naïve cells
was unchanged and the percentage of memory cells had decreased and when the viral
load peaked after 50-106 weeks of interruption they found that the percentage of naïve
cells and memory cells had decreased and increased respectively (Libois et al 2006). By
comparison we found that percentages of naïve and memory cells appeared unchanged
after 48 weeks of interruption. However as we determined the concentrations of the
subsets we noted that the concentrations of naïve and memory subsets fell during
interruption. The concentration of naïve and memory cells were not provided by Libois
et al therefore the increased naïve and decreased memory percentages could be
associated naïve cell concentration falling slower than the memory cell concentration or
the memory cell concentration rising faster than the naïve cell concentration.
The increased immune activation during PTI that we reported in this study appeared to
be transient but immune activation is associated with CD4 depletion as discussed in
chapter one. Garcia et al have proposed that the therapeutic use of treatment interruption
might be improved by use of immuomodulating agents such as corticosteroids to
decrease non-specific activation without blunting the anti-HIV CTL response (Garcia,
Fumero, & Gatell 2008).
The results of this study cannot strongly advocate the use of PTI as part of the
management of HIV infection in children. Greater sample numbers and a longer follow
up period are required to look for any long term consequences. However the study does
suggest that in the short term there are unlikely to be any major deleterious effects of
PTI especially in younger children and that most changes are transient or at least

213
reversed by re-introducing treatment. Therefore weighed against the prospect of running
out of ARV combinations as HIV-infected children grow into adulthood and toxic
effects of ARVs, PTI should be given serious consideration as a long term treatment
modality.

214
CHAPTER 6
QUANTIFICATION
OF HIV DNA IN CD4+
T CELL SUB-
POPULATIONS

215
6.1 INTRODUCTION
As described in chapter one, most anti-retroviral drugs prevent the infection of new cells
and virus production by interference with either HIV viral enzymes or structural proteins
(Pomerantz and Horn 2003). Therefore, HAART is only usually efficacious against
replicating virions. This allows non-replicating viruses to make up the latent viral reservoir.
Virions can enter this latent phase at any point after target cell entry. The virion can be
found in RNA or DNA forms, generated by reverse transcription. Unintegrated RNA and
DNA forms of HIV are highly labile and are not transmitted to daughter cells during
mitosis. However, the viral genome is stabilised following integration into the host genome,
which permits HIV transmission to daughter cells during cell division. During this phase,
the integrated virus, known as the provirus, requires active transcription and translation by
host cellular machinery to generate new virions. The provirus is lost when the host cell dies
(Blankson, Persaud, & Siliciano 2002). HIV infection is higher in populations of cells that
have a high turnover. Homeostatic proliferation in the absence of new infection will dilute
the proviral concentration. As such the concentration of the latent HIV reservoir in CD4
cell populations is at least partly determined by the rate of cell turnover.
6.1.1 The viral reservoir
Shortly after implementation of HAART, it was predicted that long-term HAART treatment
would lead to complete eradication of HIV from the body. During effective HAART, HIV
RNA could not be detected in the plasma by commercially available assays with detection
limits of 50 copies/ml.
By contrast, ultrasensitive assays which can detect a single copy have demonstrated a low
level viraemia and ongoing replication in virally-suppressed individuals. Without treatment,
viral suppression is not sustained, and HAART discontinuation leads to rapid resurgence of
viral load, which may be due to the latent persistence of replication-competent virus in
long-lived populations of resting memory cells (Garcia et al. 1999), (Stephenson 1999).

216
In section 1.4.1, the evolution of plasma viral load during untreated HIV-1 infection from
first an acute phase of high-level viraemia, which then declines to a set point that exists for
an extremely variable length of time before finally a steep increase of viral load occurs was
described. HAART alters the natural course of viral load. During HAART the plasma viral
load decreases over three distinct phases, as shown in Figure 6.1. During the first phase, an
exponential decrease in viral load by 1-2 logs, during the first 2 weeks of therapy is seen,
due to rapid viral clearance and turnover of short-lived productively infected CD4+ T cells.
The second phase is slower and reflects turnover in longer lived populations if HIV infected
cells; these include infected macrophages and less activated CD4+ T cells which permit
limited viral replication. The third phase occurs several months after initiating HAART and
can last for several years. At this time plasma viral load is below the limit of detection but
low level viraemia persists in plasma and other compartments such as semen while
replication competent virus persists in latently infected cells (Kim and Perelson 2006).
Figure 6.1 Schematic illustrating the dynamics of HIV-1 decay upon initiating HAART
The graph shows the decay in plasma viral load over three phases. From (Kim and Perelson 2006)

217
Mathematical models of the decay of the latent HIV reservoir have been formulated, which
take into account entry of newly infected cells into the latent reservoir, latent cell activation
and homestatic proliferation of latently infected cells. They suggest that the stability of the
latent reservoir is unlikely to be due to ongoing replication during HAART and that
therefore intensification of HAART is unlikely to have significant effects on the decay of
the latent reservoir (Sedaghat et al. 2007), (Kim and Perelson 2006).
Large populations of HIV infected cells reside in lymphoid tissue in the gut in gut
associated lymphoid tissue (GALT). It has been proposed that progressive loss of CD4+ T
cells from the gut may irreversibly damage the immune barrier required to prevent bacterial
translocation into the bloodstream (Douek 2007). Vulnerability to bacterial translocation
increases the risk of opportunistic infection and the levels of bacterial products which can
increase T cell activation in the blood and lymphoid tissue. It is not generally feasible,
however, to investigate the HIV viral reservoirs outside the circulation and therefore this
study is limited to studying intracellular HIV in CD4+ T cells sampled from peripheral
blood.
The majority of the latent reservoir resides in central memory cells as these are both
preferentially infected, and have a longer life-span than effect memory cells.
It is not known if planned treatment interruption (PTI), previously discussed in chapter 5,
affects the size of the viral reservoir in different CD4+ T cell populations. Initially the loss
of viral suppression might result in expansion of the latent viral reservoir if replication is
free to occur.
The aim of this chapter was to
1. Develop methods to separate naïve and memory CD4+ T cells from PBMCs

218
2. Develop methods to quantify intracellular HIV within these cells.
These techniques were then applied to a group of children participating in a PTI trial (see
chapter 5).
6.2 METHODS
6.2.1 Isolating Naïve and Memory CD4+ T cells
As discussed in chapters one and three, the transition of CD4+ T cells from a naïve to
memory phenotype is associated with decreased expression of CD45RA and increased
expression of CD45RO (Akbar et al 1988). Therefore a population of naïve cells can be
defined as a group of CD4+ T cells that highly express CD45RA and a population of
memory cells as cells that highly express CD45RO. Antibodies specific for the CD4,
CD45RA and CD45RO cell surface proteins can be used to separate these populations from
PBMCs either by fluorescence activated cell (FACS) sorting or immuno-magnetic cell
separation.
To comply with safety regulations, HIV infected samples must be fixed with formaldehyde
before introduction to the fluorescence activated cell sorting facility at the Institute of Child
Health (ICH). However it is difficult to extract viable DNA from formaldehyde fixed
samples because formaldehyde cross links DNA to protein and formaldehyde residue
inhibits PCR by reacting with the cytosine, guanine and adenine bases (Schander and
Kenneth 2003). As such it was not feasible to employ a FACS sorting method at ICH and
therefore an immuno-magnetic method was employed (Miltenyi) which uses antibodies
covalently bound to metal beads to separate cells within a magnetic field. Cells which
express the target epitope of the antibody are separated from those not expressing the target
antigen by passing the cell-antibody-bead suspension through a column matrix within a

219
magnetic field. The magnetically labelled cells are retained in the column (positive
selection) and unlabelled cells pass through into a collection vessel (negative selection)
Cells retained in the magnetic field can be collected by removing the cell column from the
field and washing the cells into a suitable container. The process is shown in Figure 6.2.
unlabelled cells
labelled cells
MACS column
matrix within
magnetic field
unlabelled cells
Figure 6.2 Principle of immuno-magnetic separation with Miltenyi reagents
The diagram shows how after incubation with antibody bound microbeads labelled cells are retained
on the column and unlabelled cells pass through. Adapted from (Miltenyi Biotech 2009)
Ideally, if sufficient PBMCs are available, naïve and memory populations can be obtained
using the 4 step separation shown in Figure 6.3. A cocktail of antibodies is used to
negatively select CD4+ T cells followed by CD45RO microbeads to obtain relatively pure
populations of naïve, CD45RO-, and memory, CD45RO
+ cells. These populations can then
be further purified using CD45RA microbeads. However this four step separation protocol
was not feasible in this study because of the small numbers of cells available. As CD45RA

220
and CD45RO expression is almost reciprocal, contamination with cells positive for both
CD45RA and CD45RO is low. In chapter 3 CD45RA+CD45RO
+ cells were found to make
up less than 5% of the CD4+ T cell population and therefore the first two steps, the CD4
negative selection and the CD45RO separation, were considered sufficient.
PBMCs
CD4+ T cells
CD45RO+ CD4+ T cells CD45RO- CD4+ T cells
CD45RO+
CD45RA+
CD4+ T cells
CD45RO+
CD45RA-
CD4+ T cells
Memory cells
CD45RO-
CD45RA+
CD4+ T cells
CD45RO-
CD45RA-
CD4+ T cells
Naive cells
cocktail of biotin-conjugated antibodies against CD8, CD14,
CD16, CD19, CD36, CD56, CD123, TCR γ/δ, and CD235a.
Anti-biotin microbeads
CD45RA microbeads CD45RA microbeads
CD45RO microbeads
Figure 6.3 Schematic of naive and memory separation
The diagram shows how 4 immuno-magnetic separations, a CD4 negative selection, a CD45RO
selection and two CD45RA selections could be used to obtain populations of naïve and memory cells.

221
6.2.2 Separation of naïve and memory populations and assessment of purity
Isolation of PBMCs from whole blood, and the separation of naïve and memory
populations, were carried out as described in methods and materials section 2.2.1 and 2.2.5.
The purity of the enriched CD45RA+ CD4
+ T cells and CD45RA
- CD4
+ T cells was
determined and compared to PBMCs by incubating 105 cells with antibodies against CD4
and CD45RA and analysed by flow cytometry. Typically 70% and 80% purity were
achieved for CD45RA+ CD4
+ T cells and CD45RA
- CD4
+ T cells respectively compared to
less than 20% before separation (Figure 6.4).
In accurately assessing purity it was important that the epitopes of the fluorescently tagged
antibody did not coincide with the epitopes of the metallic bead tagged antibody. As the
clones used by the manufacturer could not be disclosed purity was assessed using a
CD45RA antibody instead of both CD45RO and CD45RA antibodies. Figure 6.4 showed
that contamination of naïve cells and memory cells would be CD45RA-CD45RO
- cells and
CD45RA+ CD45RO
+ cells therefore the use of a CD45RA antibody enabled that
contamination to be assessed.

222
18.0% 16.9%
CD
4
CD45RA
B
A
C
73.0% 80.9%
Figure 6.4. Flow cytometric analysis of pre and post separation CD4+ T cell sub populations.
PBMCs pre separation and cell post separation were incubated with antibodies against CD4 and
CD45RA and analysed by flow cytometry. A) Pre separation CD45RA+ CD4
+ T cells and CD45RA
-
CD4+ T cells were 16.9% and 18.0% respectively. B) After CD4
+ T cell selection and CD45RA positive
selection CD45RA+ CD4
+ T cells were 73%. C) After CD4
+ T cell selection and CD45RA depletion
CD45RA- CD4
+ T cells were 80.9%.
This method of separation resulted in a population purity considered to be insufficient to
accurately quantify the HIV DNA in the cell populations of interest. This was primarily
caused by CD4- cells passing through the column in the first step and contaminating the
population. Thus, the CD4+ T cell negative selection step was optimised, as described
below in section 6.2.3.

223
6.2.3 Optimisation of CD4 selection
Initially, the CD4+ T cell isolation was carried out according to the manufacturer‟s
instructions, as described in materials and methods section 2.2.5. This included incubating
the PBMCs with a biotin-antibody cocktail for 10 minutes. To investigate whether I could
improve the purity of separation by increasing the length of this incubation, so increasing
the chance of antibody interaction with cell surface antigens, I incubated aliquots of the
PBMCs with the biotin-antibody cocktail for 10, 30 or 60 minutes. The remainder of the
protocol was carried out according to the manufacturer‟s protocol.
The purity/enrichment of CD4+ T cells was compared across the 3 incubation periods by
flow cytometric analysis. It was possible that increasing the incubation time could have
increased the amount of non-specific binding and as such, CD4+ T cells would have been
retained within the magnetic field. Therefore the proportion of CD4+ T cells retained in the
CD4- fraction was also assessed, and compared across the 3 incubation periods. Dot plots of
the results are displayed in Figure 6.5. After 30 and 60 minutes the purity of CD4+ T cells
was much greater than after 10 min: 95.7% and 94.0% compared to 85.2% respectively.
The proportion of CD4+ T cells within the CD4
- fraction, a measure of non-specific
binding, did not increase greatly as the incubation period was extended from 10 minutes to
30 minutes and 60 minutes: 1.7% to 1.8% and 1.9% respectively. As a result of these
studies the 30 minute incubation was used for subsequent studies.

224
10
min
30
min
60
min
FSC
CD
4
85.2%
1.9%94.0%
1.8%95.7%
1.7%A B
C D
E F
Figure 6.5 Purity of CD4+ cells recovered with different incubations
PBMCs were incubated with a cocktail of antibodies for 10, 30 or 60 min. The purity of CD4+ T cells
obtained for each period and the percentage of CD4+ T cells within the CD4
- fraction, lost by non-
specific binding, were assessed by flow cytometry. The purity of cells recovered using a 10 min
incubation is shown in A and the corresponding proportion of cells in the CD4- fraction is shown in B.
C and D, and E and F show the same results from a 30 and 60 min incubation respectively.
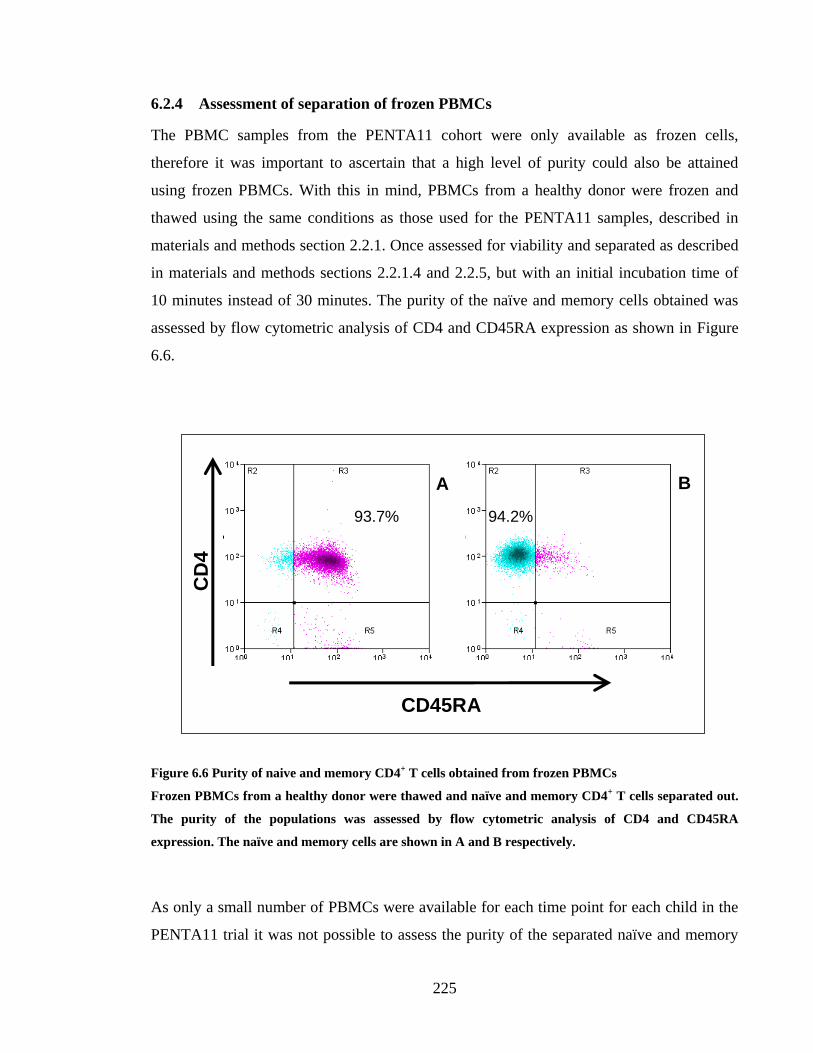
225
6.2.4 Assessment of separation of frozen PBMCs
The PBMC samples from the PENTA11 cohort were only available as frozen cells,
therefore it was important to ascertain that a high level of purity could also be attained
using frozen PBMCs. With this in mind, PBMCs from a healthy donor were frozen and
thawed using the same conditions as those used for the PENTA11 samples, described in
materials and methods section 2.2.1. Once assessed for viability and separated as described
in materials and methods sections 2.2.1.4 and 2.2.5, but with an initial incubation time of
10 minutes instead of 30 minutes. The purity of the naïve and memory cells obtained was
assessed by flow cytometric analysis of CD4 and CD45RA expression as shown in Figure
6.6.
CD45RA
A B
CD
4
93.7% 94.2%
Figure 6.6 Purity of naive and memory CD4+ T cells obtained from frozen PBMCs
Frozen PBMCs from a healthy donor were thawed and naïve and memory CD4+ T cells separated out.
The purity of the populations was assessed by flow cytometric analysis of CD4 and CD45RA
expression. The naïve and memory cells are shown in A and B respectively.
As only a small number of PBMCs were available for each time point for each child in the
PENTA11 trial it was not possible to assess the purity of the separated naïve and memory

226
cells for every sample. Two PENTA 11 and four healthy donor samples were assessed to
determine if the purities obtained could be reliably generated with other samples. The
lowest and highest purities of naïve cells were 93.1 and 99.7% CD4+CD45RA
+
respectively. The lowest and highest purities of memory cells were 93.8 and 96.5%
CD4+CD45RA
- respectively.
However, it is important to remember that a population of memory cells obtained in this
manner, with 100% CD45RO expression, would also have low level CD45RA expression.
6.3 DNA EXTRACTION AND PURITY
Following separation of the CD4 cells into CD45RA and CD45RO population, DNA was
extracted. The microbeads used for the separation do not affect subsequent experiments
with the cells, as stated by the manufacturer and demonstrated in (Rambaldi et al. 1998).
DNA extraction and quantification was performed and DNA purity assessed as described in
materials and methods section 2.2.6. However, the DNA was eluted in Tris EDTA (TE)
buffer instead of water to minimise degradation during storage at -80⁰C (Kaneko and
Nakagata 2006). Although the negatively selected naïve cells CD45RO- did not have bound
microbeads, the positively selected memory cells did. However, both the naïve and memory
cells had 260/280 ratios, as assessed by nanodrop spectrophotometry, of between 1.78 and
1.82. A ratio of 1.8 is considered to be the ratio obtained with pure DNA.

227
6.4 QUANTIFICATION OF HIV DNA
6.4.1 Aims of assay
The following sections of this chapter describe the development of a quantitative real-time
polymerase chain reaction assay. The assay was adapted from a semi-quantitative protocol
used by University College Hospital (UCH) Diagnostic Virology Services to diagnose HIV
infection in newborns. The following features were considered desirable in the assay
required for the intended studies:
To quantify the number of cells (equivalent to the DNA present in the reaction) and
the number of copies of HIV DNA in the same tube at the same time so the
concentration of HIV DNA could be assessed.
To be specific so that no pseudogenes would be amplified while all HIV-1 virus
subtypes could be amplified and accurately quantified
To linearly amplify a wide range of template quantities for accurate and reliable
quantification
To be sensitive enough that even very small template quantities could be amplified
and accurately quantified
To be reproducible when repeated with multiple different samples
6.4.2 Introduction to multiplex real-time PCR
Quantitative real-time Polymerase Chain Reaction (qPCR) follows the general principles of
PCR in that large quantities of a specific nucleotide sequence are generated using a DNA
polymerase enzyme, usually Taq, a heat-stable DNA polymerase originally isolated from
Thermus Aquaticus. First heat is applied to DNA to separate the strands, referred to as the
template, then two short lengths of nucleotide sequence, around 20 bases, called primers or
oligonucleotides anneal to their complementary sequence on the template. The DNA
polymerase, which is usually heat activated (hot start PCR) attaches to a primer-template
hybrid and synthesizes a complementary strand from the 5‟ end until it reaches the primer-

228
template hybrid at the 3‟ end when it detaches. Multiple cycles result in an exponential
increase in the amount of DNA template.
In qPCR a DNA sequence is simultaneously amplified and quantified by coupling PCR
amplification to the principle of fluorescence resonance energy transfer (FRET). Thus in
addition to a pair of primers, the system includes another oligonucleotide. This probe bears
a fluorescent reporter at one end and a fluorescence quencher at the other. Like the primers,
the probe hybridises to a complementary sequence on the template located between the
binding sites of the primers. While the probe remains intact fluorescence is quenched by the
proximity of the quencher to the reporter. However during PCR the probe is degraded by
Taq and fluorescence is emitted and detected by the fluorescent spectrophotometer of a
real-time PCR thermal cycler (Figure 6.7). Thus an increase in fluorescence is proportional
to an increase in the probe‟s target sequence i.e. the amount of amplicon produced. Real
time refers to the fact that after each cycle, the amplified DNA is quantified. The data is
reported as a cycle threshold (CT), the number of cycles after which the level of
fluorescence exceeds the background fluorescence threshold, set within the exponential
phase of the PCR. In reactions with low target sequence abundance enough PCR cycles
must be allowed to achieve the CT.

229
3’
3’
5’
5’
Forward
primer
Reverse
primer
R Q
3’
3’
5’
5’
Forward
primerReverse
primer
RQ
DNA
polymerase
Figure 6.7 Principle of quantitative PCR
DNA polymerase is shown moving along the template and synthesising the nascent strand. Upon
encountering the probe the exonuclease activity degrades the probe, liberating the reporter molecule
(R) from the quencher molecule (Q) and fluorescence is emitted.
Multiplex PCR, where two or more targets are simultaneously amplified, enables the
quantity of HIV to be compared to a cell number by amplifying both cellular and viral
targets in the same reaction. Thus a concentration can be obtained which can be compared
between children and between different time-points of the same child. Multiplex also has
added advantages of reducing the amount of template used because multiple genes are
quantified in the same reaction tube. In addition errors in the amplification of one target are
usually cancelled out by errors in the amplification of the other target if multiplex reactions
are used.
The assay used by UCH Diagnostic Virology Services was used to confirm HIV infection
in newborns. As explained in section 1.5.2 detection of anti-HIV antibodies by ELISA is
unreliable in infants because maternally derived antibodies are present in the circulation.

230
Therefore diagnosis is made by detecting the presence of HIV virions using PCR. The HIV
virions contain an RNA genome therefore the UCH assay is an RT-qPCR assay because
first the RNA target template is reverse transcribed to DNA then the DNA is amplified and
quantified. HIV RNA is much more abundant than HIV DNA therefore a high level of
sensitivity was not required for diagnostic purposes and the assay did not produce linear
amplification of the targets. Therefore, as it stood, it could not be used to accurately
quantify the concentration of HIV DNA in DNA extracted from naïve and memory cells.
Therefore, the RT step was removed and the assay was adapted as described in the
following sections, using the reagents and reaction conditions described in materials and
methods section 2.1.3, 2.1.4 and 2.2.7.
6.4.3 PDH primer titration
The multiplex HIV DNA assay developed consisted of two reactions, amplification of the
HIV target gene and amplification of an internal reference gene also called a housekeeping
gene. The housekeeping gene is present as two copies in every somatic human cell.
Therefore the number of copies of the gene present in the reaction corresponds directly to
the cell number.
Pyruvate dehydrogenase (PDH) is an enzyme within the PDH complex involved in the
process of transforming pyruvate into acetyl-CoA for use in the citric acid cycle (Patel and
Roche 1990). Aliquots of PDH forward and reverse primers and probe were kindly
provided by UCH Diagnostic Virology Services, who use PDH as the housekeeping gene
in their in-house semi-quantitative HIV DNA assay. PDH also serves as a positive internal
control for the HIV gene amplification reaction as PDH would always be present providing
cellular DNA was present.
As the RT step was removed and the target sequences would be much less abundant than in
the original UCH assay, all reagent concentrations were re-titrated around the

231
concentrations used by the UCH assay but within the ranges recommended for the Taq
enzyme formulations used. To determine the concentration of the PDH primers to use, a set
of reactions with a 2-fold range of effective PDH primer concentration from 300 nM down
to 18.75 nM were set up in duplicate to amplify 6 ng of human placental DNA (equivalent
to 1 000 cells). An additional pair of reactions with PDH primers used at a final
concentration of 300 nM were set up as a non-template control (NTC) with water instead of
the human placental DNA template. The concentration of PDH probe was unchanged and
all other reaction conditions were as used by the UCH diagnostic virology service: 400nM
PDH probe, 12.5 µl of 2X Stratagene Brilliant II QPCR mastermix, 6 ng of human
placental DNA, equivalent to 1 000 cells, distilled water to make up a final reaction volume
of 25 µl. The thermal cycling conditions for the Stratagene Brilliant II QPCR mastermix are
shown in Table 2.4.
The results of the qPCR reactions were displayed as amplification plots as shown in Figure
6.8. Fluorescence above the threshold was detected for each pair of reactions at all
concentrations of PDH primer, except the NTC. This indicated that that the reaction
mixtures were unlikely to be contaminated. The CT increased and the relative fluorescence
decreased with decreased concentrations of PDH primers. From these experiments 300 nM
was accepted as the best PDH primer concentration in the series as it had the lowest CT and
greatest amplitude of fluorescence. However, the range of concentrations only extended up
to 300 nM therefore it was possible that a concentration higher than 300 nM might have
produced better results.
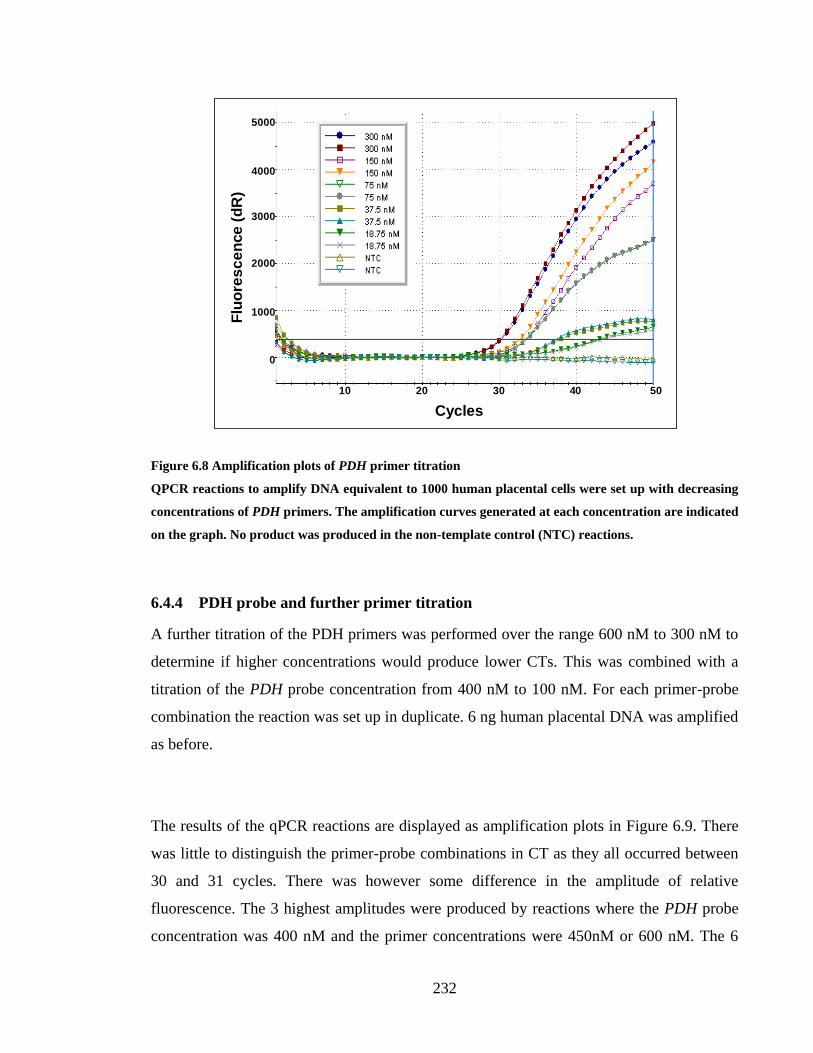
232
Amplification Plots
Delali Quantitative PCR, 14-05-2008, 14Hr 10Min.mxp
10 20 30 40 50
Cycles
Flu
ore
sc
en
ce
(d
R)
0
1000
2000
3000
4000
5000
Figure 6.8 Amplification plots of PDH primer titration
QPCR reactions to amplify DNA equivalent to 1000 human placental cells were set up with decreasing
concentrations of PDH primers. The amplification curves generated at each concentration are indicated
on the graph. No product was produced in the non-template control (NTC) reactions.
6.4.4 PDH probe and further primer titration
A further titration of the PDH primers was performed over the range 600 nM to 300 nM to
determine if higher concentrations would produce lower CTs. This was combined with a
titration of the PDH probe concentration from 400 nM to 100 nM. For each primer-probe
combination the reaction was set up in duplicate. 6 ng human placental DNA was amplified
as before.
The results of the qPCR reactions are displayed as amplification plots in Figure 6.9. There
was little to distinguish the primer-probe combinations in CT as they all occurred between
30 and 31 cycles. There was however some difference in the amplitude of relative
fluorescence. The 3 highest amplitudes were produced by reactions where the PDH probe
concentration was 400 nM and the primer concentrations were 450nM or 600 nM. The 6

233
lowest curves were all produced by reactions where the PDH probe concentration was 100
nM and the primer concentrations were 600 nM, 450 nM and 300 nM. These results
suggest over the ranges tested the optimum concentrations for the PDH probe and primers
were 400 nM and 600 nM respectively.
Amplification Plots
Delali Quantitative PCR, 15-05-2008, 16Hr 04Min.mxp
10 20 30 40 50
Cycles
Flu
ore
scence (
dR
)
0
1000
2000
3000
4000
5000
6000
Figure 6.9 Titration of PDH probe and primers concentration
QPCR reactions to amplify DNA equivalent to 1000 human placental cells were set up at varying
concentrations of PDH probe and primers. The amplification curves generated with a probe
concentration of 400 nM and 100 nM are indicated on the graph. The green horizontal line indicates
the fluorescence threshold and NTC indicates the pair of the non-template controls.
6.4.5 Standard curve to calibrate assay for cell number
The PDH qPCR reaction was to be used to quantify the cell number equivalent in each
well. Therefore the following experiments were performed to assess if a wide range of
template quantities could be amplified linearly and thus generate an accurate standard curve

234
to quantify cell number. A 10-fold dilution series of human placental DNA was made up
with distilled water. PCR reactions for each template quantity were set up in duplicate and
an additional pair of NTC reactions using distilled water instead of human placental DNA.
PDH probe and primers were used at the optimised concentrations obtained from the
previous experiments, 400 nM and 600 nM respectively. In the previous experiment where
the template quantity was equivalent to 1000 cells, the CT was approximately 30 cycles
therefore the CT for 1 cell would be 40 cycles, because when PCR is efficient there is a
doubling of amplicon after each cycle. With this in mind the reaction was reduced from 50
cycles to 40 cycles, otherwise reaction conditions and thermal cycling conditions remained
unchanged. Increasing the number of cycles in a PCR reaction increases the likelihood of
generating spurious products however increasing the number of cycles in this study would
not affect accuracy of quantification because Taqman probes will only hybridize to true
targets in a PCR reaction and not to primer-dimers or other spurious products. The resulting
amplification curves generated are shown in Figure 6.10. Fluorescence above the threshold
was detected for every DNA template quantity except the 1 cell equivalent. This established
that a wide range of template quantities could be amplified. Though the 1 cell equivalent
was not successfully amplified, this was not an obstacle to using the assay because the
PENTA 11 patient samples would have DNA equivalent to approximately 10 000 cells.

235
Amplification Plots
Delali Quantitative PCR, 17-05-2008, 14Hr 44Min.mxp
10 20 30 40
Cycles
Flu
ore
sc
en
ce
(d
R)
1000
2000
3000
4000
0
105
105
104
104
103
103
102
102
10
10
1
1
NTC
NTC
Figure 6.10 amplification plots for 10-fold dilution series of human placental DNA
QPCR reactions to amplify varying quantities of human placental DNA were set up. The amplification
curves generated by each cell number equivalent are indicated on the graph. The green horizontal line
indicates the fluorescence threshold and NTC indicates the pair of the non-template controls.
To produce a calibration curve to quantify unknown template quantities by their CT,
amplification of the DNA dilution series would have to be linear. In Figure 6.11 each
quantity was plotted against CT to assess the linear relationship between template quantity
and CT. The PCR efficiency of the amplification reaction was 90.0%, which is determined
by comparing the number of cycles between each pair of CTs to the number expected under
ideal conditions. The R2 value was 0.996, which indicates how closely the CTs obtained fit
the linear line of regression, where 1 is a perfect fit.

236
Standard Curve
Delali Quantitative PCR, 17-05-2008, 14Hr 44Min.mxp
10510410310210
CT
(d
R)
36
34
32
30
28
26
24
22
20
Initial Quantity (copies)
Figure 6.11 Standard curve of PDH template quantity
The standard curve was generated by plotting each template quantity against the CT obtained during
qPCR amplification and fitting a linear regression line. PCR effiency was 90% and R2 was 0.996.
6.4.6 Titration of LTR primers
The second reaction in the UCH multiplex assay utilises primers and probe specific for
sequences of the HIV-1 long terminal repeat (LTR) were used to amplify and quantify the
HIV DNA copy number. As described in section 1.3.3 LTRs are sequences of repeated
nucleotides generated during reverse transcription and found at the ends of viral DNA.
They regulate synthesis of viral RNA. The concentrations of the LTR primers were titrated
using a 2-fold dilution series, ranging from a final reaction concentration of 600 nM to 75
nM. HIV DNA was obtained from the 8e5 cell line, cloned by Folks et al., which is a
lymphocyte derived cell line containing one provirus per cell (Folks et al. 1985). Reactions
were set up in duplicate using each primer concentration and template, 8e5 DNA extract
equivalent to 100 HIV copies. The LTR probe was added at a final reaction concentration of
200 nM. Reaction conditions and thermal cycling conditions were unchanged. The
amplification curves generated for each concentration are shown in Figure 6.12. There was
little difference in CT or fluorescent amplitude over the range of concentrations tested
therefore the primer concentration remained 300 nM as used by UCH Diagnostic Virology

237
Services. At all primer concentrations tested the amplification curves were weak and of low
amplitude (less than 2000). It was assumed that optimising the concentration of the LTR
probe might improve the amplification.
Amplification Plots
Delali Quantitative PCR, 27-05-2008, 15Hr 02Min hiv primer titn- probe 350.mxp
10 20 30 40 50
Cycles
Flu
ore
scen
ce (
dR
)
0
200
400
600
800
1000
1200
1400
Figure 6.12 Amplification plots of LTR primer titration
QPCR reactions to amplify DNA equivalent to 100 human copies of HIV provirus were set up with
varying concentrations of LTR primers. The amplification curves generated at each concentration are
indicated on the graph. The blue horizontal line indicates the fluorescence threshold.
6.4.7 Titration of LTR probe
Using the optimised primer concentration a set of reactions were set up with varying
concentrations of LTR probe ranging from 500 nM to 100 nM. Reaction and thermal
cycling conditions were unchanged. The resulting amplification curves are shown in Figure
6.13. There was little difference in CT or fluorescent amplitude over the range of
concentrations tested therefore the probe concentration remained 350 nM as used by UCH
Diagnostic Virology Services. No probe concentration improved improved the

238
amplification reaction, at all probe concentrations tested the amplification curves remained
weak and of low amplitude (less than 2000).
Amplification Plots
Delali Quantitative PCR, 23-05-2008, 14Hr 26Min.mxp
10 20 30 40 50
Cycles
Flu
ore
sce
nc
e (
dR
)
0
200
400
600
800
1000
1200
1400
1600
Figure 6.13 Titration of LTR probe concentration
QPCR reactions to amplify DNA equivalent to 100 human copies of HIV provirus were set up at
varying concentrations of PDH probe. The amplification curves generated at each concentration are
indicated on the graph. The blue horizontal line indicates the fluorescence threshold.
6.4.8 Calibration of HIV copy number
Despite the poor amplification of 1000 copies of HIV DNA, the following experiment was
performed to assess if a wide range of template quantities could be amplified linearly and
thus generate an accurate standard curve to quantify HIV proviral copy number. A 4-fold
dilution series of 8E5 DNA from 1000 to 0.24 copies was generated with distilled water.
PCR reactions for each template quantity were set up in duplicate and an additional pair of
NTC reactions using distilled water instead of 8E5 DNA. The amplification curves

239
generated are shown in Figure 6.14. Only high copy numbers could be detected, above 60
copies, and amplification was not linear.
Amplification Plots
Delali QPCR, 10-06-2008, anneal 55, extend 60, 11Hr 34Min.mxp
10 20 30 40 45
Cycles
Flu
ore
scen
ce (
dR
)
0
200
400
600
800
1000
Figure 6.14 Amplification plots for 4-fold dilution series of 8E5 DNA
QPCR reactions to amplify varying quantities of 8E5 DNA were set up. The amplification curves
generated by each proviral copy number equivalent are indicated on the graph. The blue horizontal
line indicates the fluorescence threshold.
6.4.9 Comparison of 2 qPCR enzyme formulations
Despite titrating the LTR probe and primers and testing new syntheses of the
oligonucleotides (data not shown), the amplification of 8E5 DNA remained poor.
Amplification of a range of template quantity was not linear and at the lower range of
template quantity detection was not possible. Therefore a different qPCR enzyme
formulation, Quantitect QPCR mastermix (Qiagen), was evaluated against the Brilliant II
QPCR mastermix (Stratagene) used thus far in the study. Additionally the Magnesium
chloride (MgCl2) concentration was titrated for Brilliant II QPCR mastermix (Stratagene).

240
The concentration of MgCl2 in the Brilliant mastermix is 5.5 mM. By adding varying
dilutions of MgCl2 solution to aliquots of the mastermix, a series of mastermix solutions
with effective MgCl2 concentrations of 6.0 mM, 6.5 mM and 7.0 mM were produced.
Using the optimised concentrations of LTR probe and primers and adding 8E5 DNA
equivalent to 1000 proviral copies qPCR reactions were set up in duplicate with Quantitect
mastermix and Brilliant mastermix with varying concentrations of MgCl2. The resulting
amplification curves are displayed in Figure 6.15. Varying the MgCl2 concentration
between 5.5 mM and 7.0 mM had no impact on either CT or the level of fluorescence
emitted. There was minimal difference in CT between the reactions amplified with either
mastermix, however higher levels of fluorescence were detected where the Quantitect
master mix was used.
Amplification Plots
Delali QPCR, 17-06-2008, mgcl2 n quantitect mm 15Hr 18Min.mxp
10 20 30 40 50
Cycles
Flu
ore
scence (
dR
)
0
200
400
600
800
1000
1200
1400
1800
1600
2000
2200
Figure 6.15 QPCR amplification using Quantitect versus Brilliant mastermix
8E5 DNA equivalent to 1 000 proviral copies was amplified with LTR targeted primers and probe using
either Quantitect mastermix (QT) or Brilliant mastermix (BR). The BR mastermix was made up with
MgCl2 concentrations of 5.5 mM, 6.0 mM, 6.5 mM and 7.0 mM. The blue horizontal line indicates the
fluorescence threshold and NTC the pair of the non-template controls.
241
Further experiments were performed using the Quantitect mastermix and new thermal
cycling conditions as recommended by the manufacturer, which were 10 min activation at
95°C, followed by 50 cycles of 10s denaturation at 95°C and 1 min annealing and
elongation at 65°C. The PDH and LTR probes and primers were re-titrated within the range
recommended by the manufacturers to find the optimum concentrations for the new
reaction and thermal cycling conditions (data not shown). These were 350 nM for both
PDH and LTR probes and 600 nM for both pairs of PDH and LTR primers.
6.4.10 New HIV-1 target sequences
A number of parameters were altered to improve the sensitivity of the HIV DNA assay.
These included optimising the concentrations of LTR probe and primers, comparing these
oligonucleotides to other batches to ensure correct synthesis, changing the qPCR enzyme
mastermix and thermal cycling conditions. However none of these substantially improved
the sensitivity, CT or level of fluorescence emitted. Therefore the quality of the LTR
primers were evaluated with primer analysis software Primer 3 (available from
Sourceforge, http://sourceforge.net/) and Beacon Designer (available from
http://www.premierbiosoft.com/molecular_beacons/index.html)and compared to 2 other
pairs of primers, available in the lab, specific for sequences within HIV-1 Pol and Gag. The
LTR and Pol primers were rated low to fair. The Gag sequence specific primers, GagF and
GagR, were rated good additionally a BLAST search
(http://www.ncbi.nlm.nih.gov/BLAST) showed efficacy against A, B, C and D HIV-1
subtype viruses.
This was also tested experimentally by set up qPCR reactions, in duplicate, to amplify 1000
copies of 8E5 with either the Gag or LTR primers. The reactions using the Gag primers
were set up at varying concentrations, 600 nM, 500 nM and 400 nM, to determine the
optimum concentration. The amplification plots generated are shown in Figure 6.16.
Fluorescence amplitude was much greater for reactions using the Gag primers instead of
LTR primers. Amongst the qPCR reactions with Gag primers, there was a moderate

242
difference in level of fluorescence with varying concentrations, with the highest
fluorescence achieved at 400 nM. The concentration of the Gag probe was also titrated, but
there was no difference in fluorescence over the range tested, 350 nM to 200 nM, (data not
shown) and therefore the probe was used at a concentration of 200 nM.
Amplification Plots
Delali QPCR, 26-06-2008, gag vs ltr, 16Hr 16Min.mxp
10 20 30 40 50
Cycles
Flu
ore
sc
en
ce
(d
R)
1000
2000
3000
4000
0
Figure 6.16 Amplification plots for qPCR reactions with either Gag or LTR primers
8E5 DNA equivalent to 1,000 proviral copies was amplified with either LTR targeted or Gag targeted
primers. Gag primers were used at varying concentrations. The amplification plots generated using
each primer pair and the concentrations of Gag primers, 600nM, 500 nM and 400 nM are indicated on
the graph. The blue horizontal line indicates the fluorescence threshold and NTC the pair of the non-
template controls.
6.4.11 HIV calibration curve
After individually optimising both the HIV and housekeeping reactions these reactions
were combined together in a multiplex reaction to ensure both HIV and cell copy numbers
over a wide range could be simultaneously amplified in a linear fashion. Reactions were set
up with Quantitect mastermix and the optimised concentrations of Gag and PDH probes
and primers. 8E5 DNA template was added to each reaction at either 1000, 333, 111, 37,

243
12.3 or 4.1 copy number. As mentioned previously the 8E5 cell line contains exactly one
integrated HIV provirus per cell and one pair of the PDH gene thus the cell number and
proviral copy number are equal. An additional pair of NTC reactions were set up with
distilled water. For ease of viewing, the Gag amplification plots are shown on a separate
graph (Figure 6.17A) from the PDH amplification plots (Figure 6.17B). The full range of
proviral copy or cell number, from 1,000 to 4.1 copies were successfully amplified, this
amplification was not linear over the whole concentration range. Therefore only the first
four values in the range were plotted against CT to test the strength of the linear
relationship. The standard curve for both Gag and PDH are shown in Figure 6.18. The PCR
efficiency and R2 for Gag were 99.2% and 0.924 respectively. The PCR efficiency and R
2
for PDH were 91.3% and 0.966 respectively.

244
10 20 30 40 50
Cycles
Flu
ore
scen
ce (
dR
)
1000
2000
3000
4000
0
5000
10 20 30 40 50
Cycles
Flu
ore
scen
ce (
dR
)
1000
2000
3000
4000
0
5000
A
B
Figure 6.17 Amplification plots for 3-fold dilution series of 8E5 DNA
QPCR reactions to amplify varying quantities of 8E5 DNA were set up. The amplification curves
generated for PDH and gag at each equivalent cell number and proviral copy number are shown in (A)
and (B) respectively. The horizontal lines indicate the fluorescence threshold and NTC the pair of the
non-template controls.

245
Standard Curve
Delali QPCR, 27-06-2008, 8e5 calibration, 14Hr 04Min.mxp anlysed v1.mxp
100
CT
(d
R)
Initial Quantity (copies)
31
30
29
32
33
35
34
37
36
1000
Figure 6.18 Standard curve of PDH and Gag template quantity
The intial template quantity of each well for each well were plotted against the CT produced during the
reaction. The yellow squares and line are the PDH standard curve and the purple squares and line, the
Gag standard curve.
6.4.12 Amplification of 8E5 with excess placental DNA
The multiplex qPCR assay developed with 8E5 DNA does not reflect HIV-1 infection in
vivo. In the 8E5 cell line every cell contains an integrated provirus therefore there is one
copy of provirus to each pair of PDH genes, in vivo the majority of CD4+T cells are not
infected with virus therefore in DNA extracted from a sample of CD4+T cells there are
thousands of copies of the PDH to each Gag gene. Therefore to establish if the assay could
work in the scenario of HIV-1 infection, experiments were performed in which inhibition of
Gag in the presence of excessive PDH was investigated.
HIV-1 multiplex qPCR reactions of 50 copies of 8E5 DNA with or without the presence of
human placental DNA were set up. Human placental DNA was added at amounts
equivalent to cells numbers, between 6.25 x 10³ and 1 x 10
5 cells. The Gag amplification

246
plots generated are shown in Figure 6.19. For the PDH amplification curves (data not
shown) the difference in CT between each pair of curves was approximately one cycle, as
expected for a 2-fold dilution series. Reactions in the presence of placental DNA had higher
CTs for Gag than the reactions without. In fact, in the presence of 25, 000 copies or more
of placental DNA, Gag could not be detected. This limit is equivalent to an HIV DNA
concentration of 1 proviral copy per 500 cells or 200 copies per 105 cells. These results
suggested inhibition of the Gag PCR reaction by PDH PCR reaction because there is much
more substrate available for the PDH reaction.
Amplification Plots
Delali QPCR, 02-07-2008, 8e5 calibn at 94c 1min, 8e5 xs sigma 14Hr 28Min.mxp
105
105
5 x 10⁴
5 x 10⁴
2.5 x 10⁴
2.5 x 10⁴
1.25 x 10⁴
1.25 x 10⁴
6.25 x 10³
6.25 x 10³
8E5 only
8E5 only
NTC
NTC
10 20 30 40 50
Cycles
Flu
ore
scence (
dR
)
1000
2000
3000
0
Figure 6.19 Amplification plots of 50 copies of 8E5 combined with human placental DNA
Varying concentrations of placental DNA were added to qPCR reactions of 50 copies of 8E5 DNA. The
cell number equivalents of the amount of placental DNA added are indicated on the graph. The blue
line indicates the fluorescence threshold.

247
6.4.13 Detuning the PDH signal
A method for overcoming the inhibition of a component within a multiplex PCR reaction is
to alter the reaction conditions as to modify the signal of the inhibiting component. This is
called detuning. To detune the PDH signal, and thus overcome its inhibition of Gag, the
previous experiment was repeated with progressively lower concentration of PDH primers
100, 75 or 50 nM. Inhibition of Gag, confirmed by higher CTs, increased in the presence of
increasing concentrations of placental DNA therefore the upper range of placental DNA,
equivalent to 105, 5x10
4 and 2.5x10
4cells, were used.
The effect of PDH primer concentration on inhibition is shown in Figure 6.20. The CTs for
reactions with placental DNA decreased with decreasing PDH concentration. At a PDH
primer concentration of 100 nM the difference in CT between the reactions of 8E5 alone
and 8E5 in the presence of placental DNA was more than 3 cycles. The difference in CT
was less at 75 nM. Finally at a PDH primer concentration was 50 nM the CTs for 8E5
DNA alone and 8E5 DNA combined with placental DNA were approximately equal.
Therefore inhibition of Gag by PDH was removed at this concentration.
However, as concentration of the PDH primers decreased, the amplification efficiency of
PDH also decreased. At 50 nM the PCR efficiency and R2 were 92% and 0.99 respectively
compared to 100% and 1 respectively for 75 nM and 100 nM. The optimum concentration
would therefore appear to lie between 50 and 75 nM. The HIV-1 qPCR multiplex assay was
carried out using the PDH primers at a concentration of 75, 60 or 50 nM on a 3-fold
dilution series of 8E5 DNA from 3,000 to 4.1 copies. Every template quantity was detected
and the 4 upper values in the 8E5 series were used to produce standard curves for Gag and
PDH by plotting the initial template copy number for each reaction against the associated
CT. The efficiencies of the PCR reaction at each PDH primer concentration are displayed
along with the R2 value in Figure 6.21. The PCR efficiency and R
2 for both PDH and Gag
were highest at 60 nM and therefore this was chosen as the optimum PDH primer

248
concentration. The limit of detection for the assay was 4.1 copies of HIV DNA per 105 cells
or 1 copy per 2.5x10⁵ cells.

249
10 20 30 40 50
Cycles
Flu
ore
scence (
dR
)
1000
2000
3000
4000
0
5000
10 20 30 40 50
Cycles
Flu
ore
scence (
dR
)
1000
2000
3000
4000
0
5000
105
105
5 x 10⁴
5 x 10⁴
2.5 x 10⁴
2.5 x 10⁴
8E5 only
8E5 only
105
105
5 x 10⁴
5 x 10⁴
2.5 x 10⁴
2.5 x 10⁴
8E5 only
8E5 only
10 20 30 40 50
Cycles
Flu
ore
scence (
dR
)
1000
2000
3000
4000
0
5000
105
105
5 x 10⁴
5 x 10⁴
2.5 x 10⁴
2.5 x 10⁴
8E5 only
8E5 only
A
B
CConcentration of PDH
primers = 50 nM
Concentration of PDHprimers = 75 nM
Concentration of PDH
primers = 100 nM
Figure 6.20 Titration of PDH primers for amplification of 8E5 DNA with human placental DNA
The HIV assay was performed with a template of 50 copies of 8E5 DNA combined with varying
quantities of placental DNA. The reactions were carried out with PDH primer concentrations of 100
nM in A, 75 nM in B and 50 nM in C. The curves for 8E5 DNA alone and combined with placental
DNA are indicated.

250
100
CT
(d
R)
Initial Quantity (copies)
31
30
29
32
33
35
34
37
36
100028
100 Initial Quantity (copies)
31
30
29
32
33
35
34
37
36
1000
100 Initial Quantity (copies)
31
30
29
32
33
35
34
37
36
1000
38
A
B
C
CT
(d
R)
CT
(d
R)
Concentration of PDH
primers = 75 nM
Concentration of PDH
primers = 50 nM
Concentration of PDH
primers = 60 nM
GAG: PCR efficiency = 95.5%, R2 = 0.995
PDH: PCR efficiency = 95.5%, R2 = 0.995
GAG: PCR efficiency = 99.2%, R2 = 0.995
PDH: PCR efficiency = 93.3%, R2 = 0.991
GAG: PCR efficiency = 88.8%, R2 = 0.991
PDH: PCR efficiency = 82.4%, R2 = 0.991
Figure 6.21 PDH and Gag standard curves produced by various concentrations of PDH primers
The HIV-1 qPCR assay was carried out using the PDH primers at a concentration of 75 (A), 60 (B) or
50 nM (C) on a 3-fold dilution series of 8E5 DNA from 3 000 to 4.1 copies. The 4 upper values in the
8E5 series were used to produce standard curves for Gag (purple) and PDH (yellow) by plotting the
intial template copy number for each reaction against the associated CT. The efficiencies of the PCR
reaction at each concentration of PDH primer are displayed with the R2 value, which indicates how
closely the points fit the regression line.

251
6.4.14 Dissolving 8E5 DNA in a solution of carrier RNA
The results of section 6.4.13 showed that PCR efficiency in the assay decreased with lower
template quantities. In tubes with a low DNA concentration, the DNA molecules may
adsorb to the plastic of the tube where the PCR reaction is unlikely to occur. Carrier RNA
can be added to PCR reactions containing low concentrations of template DNA to
reduce/prevent non-specific binding of target DNA to the tube and also provides an
alternative target for any RNase that might be present in the sample. PCR plastics that are
non-DNA binding were already in use therefore the assay was carried out with 8E5 DNA
diluted in distilled water or a solution of carrier RNA to determine if the addition of carrier
RNA improved PCR efficiency at low template concentration. The standard curves
generated are shown in Figure 6.22. The PCR efficiency was much higher when carrier
RNA was used, 95% and 99% for Gag and PDH respectively, compared to 75% and 77%
for Gag and PDH respectively, when distilled water was used. In the following sections the
8E5 standards were generated by dissolving 8E5 DNA in a solution of carrier RNA.

252
100Initial Quantity (copies)
31
30
29
32
33
35
34
37
36
1000
38
39
CT
(d
R)
100Initial Quantity (copies)
31
30
29
32
33
35
34
37
36
1000
38
39
CT
(d
R)
40
41
A
B
GAG: PCR efficiency = 95.5%, R2 = 0.996
PDH: PCR efficiency = 98.0%, R2 = 0.995
GAG: PCR efficiency = 74.5%, R2 = 0.982PDH: PCR efficiency = 76.9%, R2 = 0.990
8E5 DNA dissolved in
carrier RNA solution
8E5 DNA dissolved in
distilled water
Figure 6.22 Gag and PDH standard curves produced from 8E5 DNA dissolved in carrier RNA solution
or distilled water
The HIV-1 qPCR multiplex assay was performed on a 3-fold dilution series of 8E5 DNA dissolved
either in carrier RNA solution or in distilled water. The 5 upper values in the 8E5 series were used to
produce calibration curves for Gag and PDH by plotting the initial Gag and PDH template quantities
against the associated CTs. The calibration curves produced using carrier RNA solution and distilled
water are shown in A and B. The efficiencies of the PCR reactions when carrier RNA solution and
distilled water were used are displayed with the R2 value, which indicates how closely the points fit the
regression line.

253
6.5 QUANTIFICATION OF HIV DNA IN CD4 SUBSETS FROM CHILDREN
UNDERGOING TREATMENT INTERRUPTION
6.5.1 Methods
As explained previously aliquots of PBMCs isolated from children at various stages of
treatment interruption were thawed and subjected to immuno-magnetic separation to isolate
populations of CD45RA+ and CD45RA
- CD4
+ T cells, referred to as naïve and memory
cells respectively. DNA was extracted from these naïve and memory CD4+T cell sub-
populations and amplified in duplicate in a HIV-1 DNA qPCR multiplex assay alongside a
series of known concentrations of 8E5 DNA also in duplicate. PBMCs were separated from
6 ml whole blood and divided into three aliquots, one of which was used for the HIV DNA
study described here. qPCR was carried out according to the methods described in methods
and materials section 2.2.7, with 9μl template DNA (equivalent to the extraction from
approximately 10,000 cells).
6.5.2 Sample characteristics
The HIV DNA concentration was quantified in 29 PBMC samples. The characteristics of
the samples are shown in Table 6.1. Results from 2 samples from subject QUT036011 were
excluded from further analysis. This was because when DNA from these samples was
amplified the slopes of the amplification curves were flatter than slopes for other samples
or for the 8E5 DNA series. This indicated that amplification was less efficient, most likely
due to mismatching between the template sequence and the Gag primers or probe. Values
reported by the assay would therefore underestimate the true concentrations. As stated in
chapter 5 the inclusion criteria for the trial required 2 consecutive undetectable viral load
tested 1-4 months apart therefore all children had an undetectable viral load (less than 50
copies/ml of plasma) at the start of trial. HIV DNA was quantified in nine baseline samples
at which time viral load had been undetectable. The median viral load and IQR given in the
table therefore refer to detectable viral loads measured after the start of therapy
interruption. The immunological inclusion criterion for the trial was a percentage CD4+ T

254
cell 30% in children 2-6 and in children 7-15 a percentage CD4+ T cell 25% and a CD4
count 500 cells/mm3.
VARIABLE MEDIAN IQR
Age at start (years) 8.9 6.5-10.9
Age at sample (years) 9.0 6.7-11.4
Viral load (log genomes/ml) 4.7 3.8-5.4
CD4 count (cells/µl) 870 550-1060
CD4+ T cells (as % of total lymphocytes) 33.0 22.0-41.9
CD4+ T cell subsets (as % of total CD4
+ T cell count):
CD45RA+CD31
- 12.7 7.2-19.7
CD45RA+CD31
+ 47.8 42.5-53.7
CD45RA-CD31
- 24.5 21.1-35.0
CD45RA-CD31
+ 9.0 5.2-15.4
Concentration of CD4+ T cell subsets (cells/ µl):
CD45RA+CD31
- 98 45.0-181.5
CD45RA+CD31
+ 320 204-560.5
CD45RA-CD31
- 213 148.5-269.5
CD45RA-CD31
+ 52 31.5-147.0
Table 6.1 Characteristics of sample population for HIV DNA quantification
HIV DNA was quantified in 29 samples. The median and IQR of characteristics of this population are
given in the table. The viral load refers to viral loads in samples after week 0.
6.5.3 Comparison of HIV-1 DNA concentration in naïve and memory CD4+ T cells
In the 27 samples of memory cell DNA analysed, the HIV DNA concentration in all
samples was quantified. In the 27 samples of naïve cell DNA extract, Gag was detected in
22 samples although in 1 of these samples, Gag was detected in only one of the duplicate
qPCR reactions. Amplification may have failed in the 5 samples because there was no HIV
DNA in the sample. However it could also have been because there was insufficient
template in the tube to enable an effective reaction. Of the 5 samples, 2 had low template

255
numbers (equivalent to 800 and 1,000 cells) and 3 had sufficient template (equivalent to
5,000, 6,000 and 9,000 cells) but an undetectable viral load at the time of sampling. The
mean amount and IQR of naïve cell DNA used in the reactions was equivalent to 9,400
cells and 5 200-109 300 cells.
The range of HIV DNA concentrations in the total CD4+ T cell pool and in the naïve and
memory sub-populations are shown in Figure 6.23. A very wide range of concentrations
were found in the naïve population but the concentration of HIV DNA in the memory
population was usually significantly higher (Mann-Whitney test, p=0.0012). The median
concentration of HIV DNA in the memory cell population was just over 10 times greater
than that detected in the naïve cells from the same PBMC sample.
-2
-1
0
1
2
3
4
5
CD4+ Tcells CD45RA+
CD4+ TcellsCD45RA-
CD4+ Tcells
p=0.0012
Cell population
log
HIV
DN
A c
op
ies/1
05
cell
s
Figure 6.23 Scatter graph of HIV DNA concentration in CD4+ T cell pool and sub-populations
The log of the concentration of HIV DNA in the total CD4+ T cell pool and in the CD45RA
+ and
CD45RA- sub-populations taken from 27 treatment interruption samples were plotted on a scatter
graph.

256
6.5.4 Changes in levels of intracellular HIV DNA during treatment interruption
There were insufficient sample numbers to analyse changes in the concentration of HIV
DNA at each time point, therefore it was decided to group the time points into nominal
periods of early (weeks 0 and 2), mid (weeks 4 and 12) and late phases of treatment
interruption (weeks 24 and 48). The changes in concentration of HIV DNA during this time
are shown in Figure 6.24. In all 3 populations the HIV DNA concentration increased with
time. The difference between the medians was found to be statistically significant by
Kruskall Wallis test.
Figure 6.24 Concentration of HIV DNA in CD4+ T cells and sub-populations at different time points
DNA samples were assigned to 3 time points early (weeks 0 and 2), mid(weeks 4 and 12) and late (weeks
24 and 48) based on week of treatment interruption they were obtained. For the total CD4 T cell pool,
the CD45RA+ and CD45RA
- populations the median HIV DNA concentrations were compared across
the 3 time points by Kruskal-Wallis test for statistical significance, p values are indicated.

257
6.5.5 Association between CD45RA- T cell HIV DNA concentration and sample
characteristics
The CD4, CD45RA-, CD45RA
+ HIV DNA concentration for each sample was plotted
against the respective age, viral load, CD4 count, percentage of CD4+T cells, proportion
and concentrations of CD4+T cell subsets to investigate for associations between the
variables. No statistically significant results were found for the CD4 and CD45RA+ HIV
DNA concentrations. However, the CD45RA- CD4
+T cell HIV DNA concentration was
significantly correlated with the viral load, the percentage of CD4+T cells and the
concentration of CD45RA-CD31
- CD4
+T cells as shown in Figure 6.25.

258
Figure 6.25 Correlation between CD45RA-CD4
+ T cell HIV DNA concentration and sample
characteristics
The concentration of HIV DNA in CD45RA- CD4
+ T cells was found to correlate significantly with the
viral load, CD4 percentage and concentration of CD45RA-CD31
- CD4
+ T cells at the time of sampling.
Solid and dashed lines are the lines of linear regression and 95% confidence interval respectively. R2
and p values given indicate the goodness of fit and statistical significance.

259
6.6 DISCUSSION
I have described the optimisation of an immuno-magnetic separation method to obtain high
purity populations of naïve and memory CD4+T cells ideal for use where cell numbers are
limited and FACS sorting is not possible. I also described the development and successful
of application of an HIV-1 DNA multiplex qPCR assay to samples of naïve and memory
CD4+T cell DNA.
The purity of the naïve and memory populations has been demonstrated to be on average
95%, ranging from 93-99%. Although this is very high purity any contamination of the
naïve population could affect the reliability of the HIV DNA concentration measured
because the concentration of HIV DNA in the memory population is over 10-fold greater.
However it is unlikely that greater purity could be attained without FACS sorting.
The limit of sensitivity of the qPCR assay developed was 4 copies of HIV DNA. No assays
thus far developed have a lower limit than 4 copies.
Most of the CD4+ T cells that contain HIV DNA have a memory phenotype. To the best of
my knowledge HIV DNA has not been quantified in CD4 subsets in HIV-1 infected
children but the results of this study are similar to data published for HIV-1 infected adults.
In agreement with HIV literature I found that most HIV DNA was located in the memory
CD4+T cell population. Indeed the median HIV DNA concentration in the memory is over
10 times greater than in the naïve CD4+T cell sub-population. I also found that with
increasing time without treatment the HIV DNA concentration increased significantly in all
populations. At each time point there was a lot of variation in the HIV DNA concentration,
which would likely be affected by changes in the size of the cell population and viral
replication. Thus we found that the memory cell HIV DNA concentration was significantly
associated with the CD4 percentage, the plasma viral load and the concentration of

260
CD45RA-CD31
- CD4
+T cells, which is the likely reservoir of HIV DNA amongst the
CD4+T cell subsets.
Although these preliminary results are very interesting little can be concluded due to the
small number of samples tested as well as the lack of treatment restart samples because
although I have shown that the concentration of HIV DNA increases with increased time
off treatment, what is more important is the effect of restarting treatment on the HIV DNA
concentration. Does it decrease on resuming treatment and if so does it decrease to baseline
levels or perhaps even lower? Also if more samples were evaluated it would be interesting
to determine if the baseline HIV DNA concentration predicts peak rebound viraemia during
treatment interruption in children in this study as has been reported in adults in the Swiss
cohort study (Yerly et al. 2004). Therefore future work would concentrate on testing more
samples both during treatment interruption and upon resuming treatment. Additionally if
viral load set point data from before the children were ever treated with HAART were
available, I could assess investigate if viral load set point predicts the concentrations of
HIV DNA measured during treatment interruption.

261
CHAPTER 7
GENERAL
DISCUSSION

262
The overall aim of this thesis was the study of how sub-populations are involved in
changes to size of the CD4+ T cell population in HIV-1 infection in children with or
without treatment and the processes controlling those changes.
7.1 IMPORTANCE OF THIS STUDY
This study is very important because it included the first investigation of recent thymic
emigrants (RTEs) and central naïve, CD4+ T cells, as defined by CD31 expression in
HIV-1 infected children. It also shed greater understanding on the differences between
CD31+ and CD31
- memory cells and their possible roles and origins. Furthermore these
populations were investigated in a trial of planned treatment interruption (PTI), the first
of its kind to carried out in children and also the first to included a detailed
immunological study. This seminal trial also led to the development of a uniquely
sensitive assay to quantify intracellular HIV DNA in highly purified populations of
naïve and memory CD4+ T cells, showing the effect of ceasing treatment on the proviral
load and showing for the first time the possible importance of naïve cells as an
important reservoir of HIV viral latency in children.
7.2 RECENT THYMIC EMIGRANTS
In uninfected individuals RTEs have been shown to constitute a greater proportion of
the peripheral CD4+ T cell population in children than in adults and to decrease as a
proportion of the CD4+ T cell population with increasing age (Kimmig et al 2002),
(Junge et al 2007). This present work shows for the first time that also in HIV-1 infected
children RTEs comprise a significantly greater proportion of the CD4+ T cell population
than un-infected adults. Additionally the relationship of a decreased percentage of RTEs
with increased age is also seen in HIV-1 infected children.

263
RTEs by virtue of their telomere length and telomerase measurement are believed to
have very limited replicative history (Junge et al 2007), which is supported by the
findings from this present work that in both uninfected adults and HIV-1 infected
children even when treatment is interrupted, with detectable viral replication or
increased activation, the proportion of RTEs that proliferate remains extremely low,
much lower than the other sub-populations investigated. This would also further support
the belief that CD45RA+CD31
+ cells are truly RTEs as they are unlikely to be produced
by proliferation of existing CD45RA+CD31
+ cells.
Although the proportion of RTEs proliferating remained low despite changing
parameters such as viral replication and CD4 count this was not so for the activation
level of RTEs. Increased proportions of RTEs expressing the activation marker HLA-
DR did appear to be associated with decreased CD4 counts, viral replication, and
interrupting treatment.
From this present study it could also be proposed that the percentage of RTEs is a useful
indicator of disease progression because in the children studied, both ART naïve and
ART experienced, increased CD4 counts were associated with increased percentage of
RTEs, independent of age.
7.3 CENTRAL NAÏVE CELLS
With the focus of researchers naturally directed at RTEs there has been limited study of
central naïve cells. Throughout this work central naïve cells come across as a population
of cells in dynamic equilibrium. Firstly the difference in the proportions of central naïve
cells between HIV-1 infected children and uninfected adults is only just statistically
significant and is much smaller than the difference in RTEs. Accordingly the proportion
of central naïve cells within the CD4+ T cell peripheral population appears unchanged
with increased age. It also appears unchanged with increased total proliferation in the

264
CD4+ T cell population. Taken together these findings would suggest that although cell
parameters and the proportions of the CD4+ T cell peripheral pool composed of RTEs
and memory cells may change, the percentage of central naïve cells remains fairly
constant. As this study has also shown changed levels of proliferation and activation in
the central naïve population we would suggest that increased loss from this population.
7.4 CD31+ AND CD31
- MEMORY CELLS
The proportion of the CD4+ T cell peripheral pool composed of memory cells has been
shown to increase with age and with decreased CD4 count in HIV-1 infection in
children and adults. More recently the percentage of CD31+ memory cells has been
reported to be unchanged with increased age in uninfected individuals (Junge et al
2007) thus inferring that it is the percentage of CD31- memory cells that increases with
age. The results discussed in this thesis support and add to these described by Junger
and colleagues. I have shown for the first time that there is no significant difference
between the percentage of CD31+ memory cells between HIV-1 infected children and
uninfected adults and that with increased age of HIV-1 infected children the proportion
of CD31- memory cells increases and the proportion of CD31
+ memory cells is
unchanged.
The finding from this study that Ki67 expression in significantly greater in CD31+
memory cells than CD31- memory cells supports the proposal that CD31
+ memory cells
have a longer replicative history than CD31- memory cells (Junge et al 2007).
7.5 RELATIONSHIP BETWEEN THE CD4+ T CELL SUB-POPULATIONS
From the results obtained by us and other researchers (Torimoto et al 1992), (Prager et
al 1996), (Kimmig et al 2002), (Junge et al 2007), we have proposed a model of T cell

265
dynamics in HIV infection The CD4 count and the balance between the sub-populations
are controlled by thymic output, proliferation and antigen driven differentiation. RTEs
are produced by thymic output. In response to activation they can differentiate into
either CD31+ memory cells or into central naïve cells, which can themselves
differentiate into CD31- memory cells. CD31
+ and CD31
- memory cells respond to
activation by proliferating. Death occurs in all populations, though at different rates,
being higher in the memory population. Viral replication indirectly produces increased
activation, perhaps as been suggested due to increased bacterial translocation from the
gut (Douek 2007), in all populations and via activation induced cell death, the death rate
in all populations increases. In addition increased activation drives the differentiation of
RTEs and central naïve cells and the proliferation of memory cells thus moving the
equilibrium towards memory cells.
7.6 THE IMPORTANCE OF THE SET POINT IN HIV-1 INFECTION
We undertook the first immunological study of planned treatment interruption (PTI) in
children. We showed that even in virally suppressed children on continuous therapy
(CT) who maintain their CD4 count, in a year there is still considerable variation in
most parameters, a finding which highlights the dynamic equilibrium in stable HIV
infection.
Perhaps the most important theme to consistently emerge from these data is the
importance of set points in HIV infection. Although treatment interruption resulted in
initial perturbations to the percentage size of the CD4 subsets; specifically decreases in
the proportions of RTEs and central naive cells and increases in the proportions of
CD31+ and CD31
- memory cell; however the distribution of these cells quickly returned
to their baseline levels, their set point contribution to the CD4 pool. Also the CD4 count
and viral load only fell and rose respectively for the first few weeks of treatment
interruption until they too reached set points. It is likely that processes controlling cell
numbers such as activation and proliferation are important in re-establishing these set

266
points because we detected early increases in HLA-DR and Ki67 expression in the
CD4+ T cell subsets, especially within the memory populations. A key to optimising
PTI and HAART may be to determine when these set points are established, how they
are established and how they could be altered in favour of higher CD4 counts and lower
viral loads.
7.7 INTRACELLULAR HIV DNA
In this study we described the development of a highly sensitive qPCR assay to quantify
intracellular HIV DNA in highly purified naïve and memory CD4+ T cells. Thus we
quantified for the first time in HIV-1 infected children the concentration of HIV DNA
and found that as in adults almost all the HIV DNA is located in the memory pool, over
90%. This is a very interesting result as suggests that even though naïve cells make up a
much greater proportion of the CD4+ T cell pool in children, naïve cells are still infected
at much lower rates than memory cells.
HIV DNA was quantified in children who had stopped anti-retroviral treatment and
therefore we were able to confirm that in children as has already been reported in adults
the concentration of HIV DNA increases with increasing time off treatment. This
finding would suggest that PTI is associated with increased latent viral load during the
interruption period. It would, however, be interesting and important to determine what
happens to the concentration of HIV DNA upon resuming treatment, which has been
reported in adult patients to decrease again when treatment is resumed.
7.8 LIMITATIONS OF THE STUDY
Although the findings in this work, describing a dynamic relationship between CD4+ T
cell sub-populations and the importance of the set point in controlling changes in this

267
relationship, are valuable contributions to the understanding of CD4+ T cell dynamics in
HIV-1 infected children their strength is limited because only the peripheral CD4+ T
cell pool was studied, most explanations were extrapolated from associations between
sub-populations and parameters rather than direct causal relationships and small sample
groups were used especially in the investigations of PTI.
7.9 FUTURE WORK
Further work should certainly focus on testing the explanations proposed herein for
causal relationships such as for example studies to showing the direct effect of
activation on the sub-populations discussed. More samples from the PTI trial should be
tested and it would be fascinating to determine the effect of intracellular HIV DNA
concentration in naïve and memory cells upon recommencing anti-retroviral treatment
and even more interesting to undertake a study of the HIV DNA genotypes before
treatment interruption, during treatment interruption and after restarting treatment again.
The proposed intracellular HIV DNA study would be even more noteworthy if
performed in the RTE, central naïve and CD31+ and CD31
- CD4
+ T cell sub-
populations. This would however require development of a method to isolate highly
purified populations and either a great number of cells would be required and/or a more
sensitive qPCR assay developed.

268
CHAPTER 8
APPENDIX

269
8.1 SUPPLEMENTARY FIGURES
8.1.1 CD3 and CD4 expression in PBMCs from an HIV-1 infected child
Figure 8.1 CD3 and CD4 expression in PBMCs from an HIV-1 infected child
A) A CD4high
(red peak, R1) and CD4low
(blue peak, R2) population are marked on the histogram and
applied to the FSC versus SSC dot plot, B). The CD4high
cells are almost exclusively located in R3, a
region of low FSC and SSC and the CD4low
cells are mostly located in R4, a region of high FSC and SSC.
C) The CD4high
(red peak, R1) and CD4low
(blue peak, R2) populations are then applied to a histogram of
CD3 expression showing that all the CD4high
cells also express CD3.
R3
R4

270
8.1.2 CD3 and CD4 expression in red cell lysed whole blood from an HIV-1 infected
child
Figure 8.2 CD3 and CD4 expression in red cell lysed whole blood from an HIV-1 infected child
A) A CD4high
(red peak, R1) and CD4low
(blue peak, R2) population are marked on the histogram and
applied to the FSC versus SSC dot plot, B). The CD4high
cells are almost exclusively located in R3, a
region of low FSC and SSC and the CD4low
cells are mostly located in R4, a region of high FSC and SSC.
C) The CD4high
(red peak, R1) and CD4low
(blue peak, R2) populations are then applied to a histogram of
CD3 expression showing that all the CD4high
cells also express CD3.
R3
R4

271
8.1.3 Failed ammonium chloride mediated red cell lysis in whole blood from an HIV-1
infected child
Figure 8.3 Failed ammonium chloride mediated red cell lysis in whole blood from an HIV-1 infected child
The scatter plot is an example of failed red cell lysis in an HIV-1 infected child. The bottom left shows the
characteristic high density of cell debris and poor separation of leukocyte populations.
8.2 PENTA 11 TRIAL SUMMARY
8.2.1 Aim and Objectives
The overall aim of the PENTA 11 trial is to evaluate the role of planned treatment
interruptions in the management of HIV infected children who have responded well to
antiretroviral therapy.
The specific objectives are:
To determine whether children with chronic HIV infection undergoing planned
antiretroviral (ART) treatment interruptions are disadvantaged clinically, immunologically
or virologically by periods of time off ART.
To assess HIV-specific immune responses during and after interruptions of ART,
compared with continuous ART, in an immunology/virology substudy.

272
8.2.2 Design
An open, randomised, controlled phase II exploratory trial in HIV-1 infected children on
antiretroviral therapy (ART) with HIV-1 RNA <50 copies/ml and
in children aged 2-6 years: CD4 percent 30%
in children aged 7-15 years: CD4 percent 25% and CD4 500 cells/mm3
to compare the effect of intermittent versus continuous antiretroviral therapy (ART) on
disease progression, CD4 percent, HIV-1 RNA and toxicity in children in whom clinicians
would consider interrupting treatment until
in children aged 2-6 years: CD4 percent declines to below 20%
in children aged 7-15 years: CD4 percent declines to below 20% or CD4 declines to
below 350 cells/mm3
Immunological and virological eligibility criteria must be met at the screening visit and at the
prior visit between 1 and 4 months before; immunological re-start criteria should be
confirmed on a second sample as soon as possible and within 4 weeks.
100 children will be randomised to continue on their current ART regimen or to a strategy of
CD4-driven planned treatment interruption(s) (PTI) for 72 weeks. Children randomised to
PTI will stop all ART, and will restart ART if the CD4 percent falls to <20% (age 2-6) or
CD4 percent falls to <20%, or CD4 falls to < 350 cells/mm3 (age 7).
Children should spend no more than 48 weeks off therapy and should be restarted at their
week 48 visit if they have not already reached the immunological restart threshold.
Once HIV-1 RNA is again suppressed <50 copies/ml and either CD4 percent has increased
above 30% (age 2-6) or CD4 percent 25% and CD4 500 cells/mm3 (age 7) ART should
be interrupted again if these results are confirmed at 2 visits, 1- 3 months apart and the child
has been back on therapy for at least 24 weeks.

273
Enrolment will take place over 24 months and follow-up will continue until the last
randomised child has completed 72 weeks follow-up.
8.2.3 Population
100 HIV-1 infected children, aged 2 to 15 years old inclusive, on any ART regimen
containing 3 or more drugs which they have taken for at least 24 weeks with confirmed (on 2
occasions at least one month apart) HIV-1 RNA <50 copies/ml and either CD4 percent 30%
(age 2-6 years) or CD4 percent 25% and CD4 500 cells/mm3 (age 7).
8.2.4 Primary Outcome
Any of
CD4 percent <15% (age 2-6)
CD4 percent <15% and CD4<200 cells/mm3 (age 7)
new CDC stage C diagnosis
death
8.2.5 Secondary Outcomes
change in ART (defined as any change from the ART regimen at randomisation)
acute retroviral syndrome (see section 9.7)
ART-related grade 3 and 4 clinical and laboratory adverse events
HIV-1 RNA 400 copies/ml at week 72 having received ART continuously for the
preceding 12 weeks
HIV-1 RNA 50 copies/ml at week 72 having received ART continuously for the
preceding 12 weeks
number of HIV mutations present at 72 weeks conferring resistance to drugs taken at entry
or during the trial
adherence to ART as assessed by caregiver completed questionnaire
acceptability of the two strategies of ART administration to families as assessed by
caregiver completed questionnaire

274
8.2.6 Follow-up
All children will be seen at weeks –2 and 0 (screening and trial entry/randomisation), 12, 24,
36, 48, 60 and 72. All children starting a PTI, and at least 20 children in the continuous
therapy arm in the immunology/virology substudy, will also be seen at weeks 2, 4 and 8. CD4
and viral load measurements will be performed locally and plasma stored at each assessment.
Additional visits should be undertaken as clinically indicated (particularly in the PTI arm),
and will be at the discretion of the clinician. Any child approaching a re-start threshold (i.e
CD4% <22% or CD4 count <400 cells/mm3) should be seen every 4 weeks.
Children in the PTI group should remain off ART until they meet one of the following
conditions:
age 2-6 years: CD4% <20% (confirmed on a separate sample)
age 7 years: CD4% <20% or absolute CD4 <350 cells/mm3 (confirmed on a separate
sample)
new or recurrent CDC stage C or severe stage B event
the child has spent 48 weeks on the current PTI.
Any child who reaches a primary endpoint should restart immediately without a confirmatory
test and should not undergo a further PTI:
CD4% <15% (age 2-6)
CD4% <15% and CD4 < 200 cells/mm3 (age 7),
new CDC Stage C diagnosis
In addition children whose CD4 drops rapidly reaching re-start criteria within 10 weeks of
stopping should NOT undergo further PTIs.
Children can undergo a further PTI, if, after at least 24 weeks back on therapy:
age 2-6 years: the CD4 percent increases to 30% and HIV RNA is <50 c/ml (both at 2
visits, 3 months apart) or
age 7 years: the CD4 percent increases to 25% and CD4 500 cells/mm3 and HIV-1
RNA < 50 copies/ml (all at 2 visits, 3 months apart).

275
References
Abbey, JL & O'Neill, HC 2008. Expression of T-cell receptor genes during early T-cell
development. Immunol.Cell Biol., 86, (2) 166-174 available from: PM:17955035
Akbar, AN, Terry, L, Timms, A, Beverley, PC, & Janossy, G 1988. Loss of CD45R and gain
of UCHL1 reactivity is a feature of primed T cells. J.Immunol., 140, (7) 2171-2178 available
from: PM:2965180
Albuquerque, AS, Foxall, RB, Cortesao, CS, Soares, RS, Doroana, M, Ribeiro, A, Lucas, M,
Antunes, F, Victorino, RM, & Sousa, AE 2007. Low CD4 T-cell counts despite low levels of
circulating HIV: insights from the comparison of HIV-1 infected patients with a discordant
response to antiretroviral therapy to patients with untreated advanced HIV-2 disease.
Clin.Immunol, 125, (1) 67-75 available from: PM:17692571
Alkhatib, G, Combadiere, C, Broder, CC, Feng, Y, Kennedy, PE, Murphy, PM, & Berger,
EA 1996. CC CKR5: a RANTES, MIP-1alpha, MIP-1beta receptor as a fusion cofactor for
macrophage-tropic HIV-1. Science, 272, (5270) 1955-1958 available from: PM:8658171
Altomonte, M, Pucillo, C, & Maio, M 1999. The overlooked "nonclassical" functions of
major histocompatibility complex (MHC) class II antigens in immune and nonimmune cells.
J.Cell Physiol, 179, (3) 251-256 available from: PM:10228943
Ameisen, JC & Capron, A 1991. Cell dysfunction and depletion in AIDS: the programmed
cell death hypothesis. Immunol.Today, 12, (4) 102-105 available from: PM:1676268
Andersen, MH, Becker, JC, & Straten, P 2005. Regulators of apoptosis: suitable targets for
immune therapy of cancer. Nat.Rev.Drug Discov., 4, (5) 399-409 available from:
PM:15864269
Appay, V 2004. The physiological role of cytotoxic CD4(+) T-cells: the holy grail?
Clin.Exp.Immunol., 138, (1) 10-13 available from: PM:15373899
Appay, V, Dunbar, PR, Callan, M, Klenerman, P, Gillespie, GM, Papagno, L, Ogg, GS,
King, A, Lechner, F, Spina, CA, Little, S, Havlir, DV, Richman, DD, Gruener, N, Pape, G,
Waters, A, Easterbrook, P, Salio, M, Cerundolo, V, McMichael, AJ, & Rowland-Jones, SL
2002. Memory CD8+ T cells vary in differentiation phenotype in different persistent virus
infections. Nat.Med., 8, (4) 379-385 available from: PM:11927944
Appay, V, van Lier, RA, Sallusto, F, & Roederer, M 2008. Phenotype and function of human
T lymphocyte subsets: consensus and issues. Cytometry A, 73, (11) 975-983 available from:
PM:18785267
Arlettaz, L, Barbey, C, Dumont-Girard, F, Helg, C, Chapuis, B, Roux, E, & Roosnek, E
1999. CD45 isoform phenotypes of human T cells: CD4(+)CD45RA(-)RO(+) memory T
cells re-acquire CD45RA without losing CD45RO. Eur.J.Immunol., 29, (12) 3987-3994
available from: PM:10602008
276
Ashorn, PA, Berger, EA, & Moss, B 1990. Human immunodeficiency virus envelope
glycoprotein/CD4-mediated fusion of nonprimate cells with human cells. The Journal of
Virology, 64, (5) 2149-2156 available from: PM:2109100
Asquith, B, Debacq, C, Macallan, DC, Willems, L, & Bangham, CR 2002. Lymphocyte
kinetics: the interpretation of labelling data. Trends Immunol., 23, (12) 596-601 available
from: PM:12464572
Bahbouhi, B, Landay, A, & Al-Harthi, L 2004. Dynamics of cytokine expression in HIV
productively infected primary CD4+ T cells. Blood, 103, (12) 4581-4587 available from:
PM:14764521
Bains, I, Antia, R, Callard, R, & Yates, AJ 2009. Quantifying the development of the
peripheral naive CD4+ T-cell pool in humans. Blood, 113, (22) 5480-5487 available from:
PM:19179300
Balestrieri, E, Grelli, S, Matteucci, C, Minutolo, A, d'Ettorre, G, Di, SF, Montella, F, Vullo,
V, Vella, S, Favalli, C, Macchi, B, & Mastino, A 2007. Apoptosis-associated gene expression
in HIV-infected patients in response to successful antiretroviral therapy. J.Med Virol., 79, (2)
111-117 available from: PM:17177302
Balk, SD, Morisi, A, & Gunther, HS 1984. Phorbol 12-myristate 13-acetate, ionomycin or
ouabain, and raised extracellular magnesium induce proliferation of chicken heart
mesenchymal cells. Proc.Natl.Acad.Sci.U.S.A, 81, (20) 6418-6421 available from:
PM:6333683
Banda, NK, Bernier, J, Kurahara, DK, Kurrle, R, Haigwood, N, Sekaly, RP, & Finkel, TH
1992. Crosslinking CD4 by human immunodeficiency virus gp120 primes T cells for
activation-induced apoptosis. J.Exp.Med, 176, (4) 1099-1106 available from: PM:1402655
Basu, VP, Song, M, Gao, L, Rigby, ST, Hanson, MN, & Bambara, RA 2008. Strand transfer
events during HIV-1 reverse transcription. Virus Res., 134, (1-2) 19-38 available from:
PM:18279992
Baumler, CB, Bohler, T, Herr, I, Benner, A, Krammer, PH, & Debatin, KM 1996. Activation
of the CD95 (APO-1/Fas) system in T cells from human immunodeficiency virus type-1-
infected children. Blood, 88, (5) 1741-1746 available from: PM:8781430
Berzins, SP, Boyd, RL, & Miller, JF 1998. The role of the thymus and recent thymic migrants
in the maintenance of the adult peripheral lymphocyte pool. J.Exp.Med, 187, (11) 1839-1848
available from: PM:9607924
Bieniasz, PD 2009. The cell biology of HIV-1 virion genesis. Cell Host.Microbe, 5, (6) 550-
558 available from: PM:19527882
Bird, GW 1972. The red cell. Br.Med J., 1, (5795) 293-297 available from: PM:4550379
Blankson, JN, Persaud, D, & Siliciano, RF 2002. The Challenge of viral reservoirs in HIV-1
infection. Annu.Rev.Immunol., 53, 557-593
Bofill, M, Martinez-Picado, J, Ruiz-Hernandez, R, Cabrera, C, Marfil, S, Erkizia, I, Bellido,
R, Romeu, J, Clotet, B, & Ruiz, L 2006. Naive CD4(+) T cells and recent thymic emigrant

277
levels in treated individuals with HIV: clinical relevance. AIDS Res.Hum.Retroviruses, 22,
(9) 893-896 available from: PM:16989615
Bohler, T, Walcher, J, Holzl-Wenig, G, Schnitzler, P, Geiss, M, Buchholz, B, Linde, R,
Rutschle, H, & Debatin, KM 1999. Expression of CD69 on T-cells from HIV-1-infected
children and adolescents increases with increasing viral load. Eur.J.Pediatr., 158, (8) 638-
644 available from: PM:10445342
Borkowsky, W, Yogev, R, Muresan, P, McFarland, E, Frenkel, L, Fenton, T, Capparelli, E,
Moye, J, Harding, P, Ellis, N, Heckman, B, & Kraimer, J 2008. Planned multiple exposures
to autologous virus in HIV type 1-infected pediatric populations increases HIV-specific
immunity and reduces HIV viremia. AIDS Res.Hum.Retroviruses, 24, (3) 401-411 available
from: PM:18327977
Bowen, A, Palasanthiran, P, & Sohn, AH 2008. Global challenges in the development and
delivery of paediatric antiretrovirals. Drug Discov.Today, 13, (11-12) 530-535 available
from: PM:18549980
Brenchley, JM, Price, DA, Schacker, TW, Asher, TE, Silvestri, G, Rao, S, Kazzaz, Z,
Bornstein, E, Lambotte, O, Altmann, D, Blazar, BR, Rodriguez, B, Teixeira-Johnson, L,
Landay, A, Martin, JN, Hecht, FM, Picker, LJ, Lederman, MM, Deeks, SG, & Douek, DC
2006. Microbial translocation is a cause of systemic immune activation in chronic HIV
infection. Nat Med, 12, (12) 1365-1371 available from: PM:17115046
Brenchley, JM, Schacker, TW, Ruff, LE, Price, DA, Taylor, JH, Beilman, GJ, Nguyen, PL,
Khoruts, A, Larson, M, Haase, AT, & Douek, DC 2004. CD4+ T cell depletion during all
stages of HIV disease occurs predominantly in the gastrointestinal tract. J.Exp.Med, 200, (6)
749-759 available from: PM:15365096
Briant, L, Coudronniere, N, Robert-Hebmann, V, Benkirane, M, & Devaux, C 1996. Binding
of HIV-1 virions or gp120-anti-gp120 immune complexes to HIV-1-infected quiescent
peripheral blood mononuclear cells reveals latent infection. J.Immunol., 156, (10) 3994-4004
available from: PM:8621941
Buchschacher, GL 2001. Introduction to retroviruses and retroviral vectors. Somat.Cell
Mol.Genet., 26, (1-6) 1-11 available from: PM:12465459
Buseyne, F & Riviere, Y 1993. HIV-specific CD8+ T-cell immune responses and viral
replication. AIDS, 7 Suppl 2, S81-S85 available from: PM:7909230
Butel, JS 2000. Viral carcinogenesis: revelation of molecular mechanisms and etiology of
human disease. Carcinogenesis, 21, (3) 405-426 available from: PM:10688861
Capitini, CM, Chisti, AA, & Mackall, CL 2009. Modulating T-cell homeostasis with IL-7:
preclinical and clinical studies. J.Intern.Med, 266, (2) 141-153 available from: PM:19623690
Carbone, J, Gil, J, Benito, JM, Navarro, J, Munoz-Fernandez, A, Bartolome, J, Zabay, JM,
Lopez, F, & Fernandez-Cruz, E 2000. Increased levels of activated subsets of CD4 T cells
add to the prognostic value of low CD4 T cell counts in a cohort of HIV-infected drug users.
AIDS, 14, (18) 2823-2829 available from: PM:11153663

278
Carter, N. P. & Ormerod, M. G. 2000, "Introduction to the principles of flow cytometry," In
Flow cytometry: A practical approach, 3 ed. M. G. Ormerod, ed., Oxford: Oxford University
Press, pp. 1-22.
Castro, HC, Loureiro, NI, Pujol-Luz, M, Souza, AM, Albuquerque, MG, Santos, DO, Cabral,
LM, Frugulhetti, IC, & Rodrigues, CR 2006. HIV-1 reverse transcriptase: a therapeutical
target in the spotlight. Curr.Med.Chem., 13, (3) 313-324 available from: PM:16475939
CDC 1981. Kaposi's sarcoma and Pneumocystis pneumonia among homosexual men--New
York City and California. morbidity and mortality weekly report
CDC 1994. 1994 revised guidelines for the performance of CD4+ T-cell determinations in
persons with human immunodeficiency virus (HIV) infections. Centers for Disease Control
and Prevention. MMWR Recomm.Rep., 43, (RR-3) 1-21 available from: PM:7908403
CDC. Organisation of the HIV-1 virion. Centers for Disease Control and Prevention . 3-9-
2008. 16-8-2009.
Ref Type: Online Source
Centlivre, M, Sala, M, Wain-Hobson, S, & Berkhout, B 2007. In HIV-1 pathogenesis the die
is cast during primary infection. AIDS, 21, (1) 1-11 available from: PM:17148962
Chermann, JC, Barre-Sinoussi, F, Dauguet, C, Brun-Vezinet, F, Rouzioux, C, Rozenbaum,
W, & Montagnier, L 1983. Isolation of a new retrovirus in a patient at risk for acquired
immunodeficiency syndrome. Antibiot.Chemother., 32, 48-53 available from: PM:6205626
Chomont, N, El-Far, M, Ancuta, P, Trautmann, L, Procopio, FA, Yassine-Diab, B, Boucher,
G, Boulassel, MR, Ghattas, G, Brenchley, JM, Schacker, TW, Hill, BJ, Douek, DC, Routy,
JP, Haddad, EK, & Sekaly, RP 2009. HIV reservoir size and persistence are driven by T cell
survival and homeostatic proliferation. Nat.Med., 15, (8) 893-900 available from:
PM:19543283
Choudhary, SK, Vrisekoop, N, Jansen, CA, Otto, SA, Schuitemaker, H, Miedema, F, &
Camerini, D 2007. Low Immune Activation despite High Levels of Pathogenic Human
Immunodeficiency Virus Type 1 Results in Long-Term Asymptomatic Disease. The Journal
of Virology, 81, (16) 8838-8842 available from:
http://jvi.asm.org/cgi/content/abstract/81/16/8838
Chougnet, CA & Shearer, GM 2007. Regulatory T cells (Treg) and HIV/AIDS: summary of
the September 7-8, 2006 workshop. AIDS Res.Hum.Retroviruses, 23, (7) 945-952 available
from: PM:17678480
Chun, TW, Carruth, L, Finzi, D, Shen, X, DiGiuseppe, JA, Taylor, H, Hermankova, M,
Chadwick, K, Margolick, J, Quinn, TC, Kuo, YH, Brookmeyer, R, Zeiger, MA, Barditch-
Crovo, P, & Siliciano, RF 1997. Quantification of latent tissue reservoirs and total body viral
load in HIV-1 infection. Nature, 387, (6629) 183-188 available from: PM:9144289
Cocohoba, J & Dong, BJ 2008. Raltegravir: the first HIV integrase inhibitor. Clin.Ther., 30,
(10) 1747-1765 available from: PM:19014832
Cohen Stuart, JW, Slieker, WA, Rijkers, GT, Noest, A, Boucher, CA, Suur, MH, de, BR,
Geelen, SP, Scherpbier, HJ, Hartwig, NG, Hooijkaas, H, Roos, MT, de Graeff-Meeder, B, &

279
de, GR 1998. Early recovery of CD4+ T lymphocytes in children on highly active
antiretroviral therapy. Dutch study group for children with HIV infections. AIDS, 12, (16)
2155-2159 available from: PM:9833856
Collins, AR, Oscoz, AA, Brunborg, G, Gaivao, I, Giovannelli, L, Kruszewski, M, Smith, CC,
& Stetina, R 2008. The comet assay: topical issues. Mutagenesis, 23, (3) 143-151 available
from: PM:18283046
Correa, R, Resino, S, & Munoz-Fernandez, MA 2003. Increased interleukin-7 plasma levels
are associated with recovery of CD4+ T cells in HIV-infected children. J.Clin.Immunol., 23,
(5) 401-406 available from: PM:14601648
Cosulich, ME, Rubartelli, A, Risso, A, Cozzolino, F, & Bargellesi, A 1987. Functional
characterization of an antigen involved in an early step of T-cell activation.
Proc.Natl.Acad.Sci.U.S.A, 84, (12) 4205-4209 available from: PM:3295878
Croft, M 2009. The role of TNF superfamily members in T-cell function and diseases. Nat
Rev.Immunol., 9, (4) 271-285 available from: PM:19319144
Cyster, JG 2003. Lymphoid organ development and cell migration. Immunol.Rev., 195, 5-14
available from: PM:12969306
Dalgleish, AG, Beverley, PC, Clapham, PR, Crawford, DH, Greaves, MF, & Weiss, RA
1984. The CD4 (T4) antigen is an essential component of the receptor for the AIDS
retrovirus. Nature, 312, (5996) 763-767 available from: PM:6096719
Danel, C, Moh, R, Minga, A, Anzian, A, Ba-Gomis, O, Kanga, C, Nzunetu, G, Gabillard, D,
Rouet, F, Sorho, S, Chaix, ML, Eholie, S, Menan, H, Sauvageot, D, Bissagnene, E, Salamon,
R, & Anglaret, X 2006. CD4-guided structured antiretroviral treatment interruption strategy
in HIV-infected adults in west Africa (Trivacan ANRS 1269 trial): a randomised trial.
Lancet, 367, (9527) 1981-1989 available from: PM:16782488
DART Trial Team 2008. Fixed duration interruptions are inferior to continuous treatment in
African adults starting therapy with CD4 cell counts < 200 cells/microl. AIDS, 22, (2) 237-
247 available from: PM:18097226
de Rossi A., Walker, AS, Klein, N, De, FD, King, D, & Gibb, DM 2002. Increased thymic
output after initiation of antiretroviral therapy in human immunodeficiency virus type 1-
infected children in the Paediatric European Network for Treatment of AIDS (PENTA) 5
Trial. J.Infect.Dis., 186, (3) 312-320 available from: PM:12134227
De Rossi, A, Franchini, G, Aldovini, A, Del Mistro, A, Chieco-Bianchi, L, Gallo, RC, &
Wong-Staal, F 1986. Differential response to the cytopathic effects of human T-cell
lymphotropic virus type III (HTLV-III) superinfection in T4+ (helper) and T8+ (suppressor)
T-cell clones transformed by HTLV-I. Proc.Natl.Acad.Sci.U.S.A, 83, (12) 4297-4301
available from: PM:2424024
de Vries, JE, Cornain, S, & Rumke, P 1974. Cytotoxity of non-T versus T-lymphocytes from
melanoma patients and healthy donors on short- and long-term cultured melanoma cells.
Int.J.Cancer, 14, (4) 427-434 available from: PM:4549213

280
Delelis, O, Carayon, K, Saib, A, Deprez, E, & Mouscadet, JF 2008. Integrase and integration:
biochemical activities of HIV-1 integrase. Retrovirology., 5, 114 available from:
PM:19091057
Denucci, CC, Mitchell, JS, & Shimizu, Y 2009. Integrin function in T-cell homing to
lymphoid and nonlymphoid sites: getting there and staying there. Crit Rev.Immunol., 29, (2)
87-109 available from: PM:19496742
Devereux, HL, Youle, M, Johnson, MA, & Loveday, C 1999. Rapid decline in detectability
of HIV-1 drug resistance mutations after stopping therapy. AIDS, 13, (18) F123-F127
available from: PM:10630517
Di Mascio, M, Sereti, I, Matthews, LT, Natarajan, V, Adelsberger, J, Lempicki, R, Yoder, C,
Jones, E, Chow, C, Metcalf, JA, Sidorov, IA, Dimitrov, DS, Polis, MA, & Kovacs, JA 2006.
Naive T-cell dynamics in human immunodeficiency virus type 1 infection: effects of highly
active antiretroviral therapy provide insights into the mechanisms of naive T-cell depletion.
The Journal of Virology, 80, (6) 2665-2674 available from: PM:16501076
Dooms, H & Abbas, AK 2006. Control of CD4+ T-cell memory by cytokines and
costimulators. Immunol.Rev., 211, 23-38 available from: PM:16824114
Douek, D 2007. HIV disease progression: immune activation, microbes, and a leaky gut.
Top.HIV.Med, 15, (4) 114-117 available from: PM:17720995
Douek, DC, Betts, MR, Hill, BJ, Little, SJ, Lempicki, R, Metcalf, JA, Casazza, J, Yoder, C,
Adelsberger, JW, Stevens, RA, Baseler, MW, Keiser, P, Richman, DD, Davey, RT, & Koup,
RA 2001. Evidence for increased T cell turnover and decreased thymic output in HIV
infection. J.Immunol., 167, (11) 6663-6668 available from: PM:11714838
Douek, DC, Brenchley, JM, Betts, MR, Ambrozak, DR, Hill, BJ, Okamoto, Y, Casazza, JP,
Kuruppu, J, Kunstman, K, Wolinsky, S, Grossman, Z, Dybul, M, Oxenius, A, Price, DA,
Connors, M, & Koup, RA 2002. HIV preferentially infects HIV-specific CD4+ T cells.
Nature, 417, (6884) 95-98 available from: PM:11986671
Ebert, LM, Schaerli, P, & Moser, B 2005. Chemokine-mediated control of T cell traffic in
lymphoid and peripheral tissues. Mol.Immunol., 42, (7) 799-809 available from:
PM:15829268
Echaniz, P, de, J, & Cuadrado, E 1995. DNA staining changes associated with apoptosis and
necrosis in blood lymphocytes of individuals with HIV infection. Cytometry, 19, (2) 164-170
available from: PM:7538065
El-Sadr, WM, Lundgren, JD, Neaton, JD, Gordin, F, Abrams, D, Arduino, RC, Babiker, A,
Burman, W, Clumeck, N, Cohen, CJ, Cohn, D, Cooper, D, Darbyshire, J, Emery, S,
Fatkenheuer, G, Gazzard, B, Grund, B, Hoy, J, Klingman, K, Losso, M, Markowitz, N,
Neuhaus, J, Phillips, A, & Rappoport, C 2006. CD4+ count-guided interruption of
antiretroviral treatment. N.Engl.J.Med, 355, (22) 2283-2296 available from: PM:17135583
Estaquier, J, Idziorek, T, Zou, W, Emilie, D, Farber, CM, Bourez, JM, & Ameisen, JC 1995.
T helper type 1/T helper type 2 cytokines and T cell death: preventive effect of interleukin 12
on activation-induced and CD95 (FAS/APO-1)-mediated apoptosis of CD4+ T cells from

281
human immunodeficiency virus-infected persons. J.Exp.Med, 182, (6) 1759-1767 available
from: PM:7500020
European Collaborative Study 1994. Natural history of vertically acquired human
immunodeficiency virus-1 infection. The European Collaborative Study. Pediatrics, 94, (6 Pt
1) 815-819 available from: PM:7970995
Evans, RL, Faldetta, TJ, Humphreys, RE, Pratt, DM, Yunis, EJ, & Schlossman, SF 1978.
Peripheral human T cells sensitized in mixed leukocyte culture synthesize and express Ia-like
antigens. J.Exp.Med., 148, (5) 1440-1445 available from: PM:152800
Fallen, PR, Duarte, RF, McGreavey, L, Potter, M, Ethell, M, Prentice, HG, Madrigal, JA, &
Travers, PJ 2003. Identification of non-naive CD4+CD45RA+ T cell subsets in adult
allogeneic haematopoietic cell transplant recipients. Bone Marrow Transplant., 32, (6) 609-
616 available from: PM:12953134
Feng, Y, Broder, CC, Kennedy, PE, & Berger, EA 1996. HIV-1 entry cofactor: functional
cDNA cloning of a seven-transmembrane, G protein-coupled receptor. Science, 272, (5263)
872-877 available from: PM:8629022
Fenyo, EM, Albert, J, & Asjo, B 1989. Replicative capacity, cytopathic effect and cell
tropism of HIV. AIDS, 3 Suppl 1, S5-12 available from: PM:2514754
Fernandez-Botran, R. & Vetvicka, V. 2001. Methods in Cellular Immunology CRC Press.
Finkel, TH, Tudor-Williams, G, Banda, NK, Cotton, MF, Curiel, T, Monks, C, Baba, TW,
Ruprecht, RM, & Kupfer, A 1995. Apoptosis occurs predominantly in bystander cells and not
in productively infected cells of HIV- and SIV-infected lymph nodes. Nat Med, 1, (2) 129-
134 available from: PM:7585008
Fisher, AG, Collalti, E, Ratner, L, Gallo, RC, & Wong-Staal, F 1985. A molecular clone of
HTLV-III with biological activity. Nature, 316, (6025) 262-265 available from: PM:2410792
Flexner, C 1998. HIV-protease inhibitors. N.Engl.J.Med, 338, (18) 1281-1292 available from:
PM:9562584
Folks, T, Benn, S, Rabson, A, Theodore, T, Hoggan, MD, Martin, M, Lightfoote, M, & Sell,
K 1985. Characterization of a continuous T-cell line susceptible to the cytopathic effects of
the acquired immunodeficiency syndrome (AIDS)-associated retrovirus. Proceedings of the
National Academy of Sciences of the United States of America, 82, (13) 4539-4543 available
from: http://www.pnas.org/content/82/13/4539.abstract
Freed, EO 2001. HIV-1 replication. Somat.Cell Mol.Genet., 26, (1-6) 13-33 available from:
PM:12465460
Freed, EO & Mouland, AJ 2006. The cell biology of HIV-1 and other retroviruses.
Retrovirology., 3, 77 available from: PM:17083721
French, M 2009. HIV/AIDS: Immune Reconstitution Inflammatory Syndrome: A
Reappraisal. Clinical Infectious Diseases, 48, (1) 101-107 available from:
http://dx.doi.org/10.1086/595006

282
Fu, SM, Chiorazzi, N, Wang, CY, Montrazeri, G, Kunkel, HG, Ko, HS, & Gottlieb, AB
1978. Ia-bearing T lymphocytes in man. Their identification and role in the generation of
allogeneic helper activity. J.Exp.Med., 148, (5) 1423-1428 available from: PM:309915
Furman, PA & Barry, DW 1988. Spectrum of antiviral activity and mechanism of action of
zidovudine. An overview. Am.J.Med, 85, (2A) 176-181 available from: PM:3044082
Garcia, F, Fumero, E, & Gatell, JM 2008. Immune modulators and treatment interruption.
Curr.Opin.HIV.AIDS, 3, (2) 124-130 available from: PM:19372953
Garcia, F, Plana, M, Vidal, C, Cruceta, A, O'Brien, WA, Pantaleo, G, Pumarola, T, Gallart, T,
Miro, JM, & Gatell, JM 1999. Dynamics of viral load rebound and immunological changes
after stopping effective antiretroviral therapy. AIDS, 13, (11) F79-F86 available from:
PM:10449278
Garcia-Peydro, M, de Yebenes, VG, & Toribio, ML 2006. Notch1 and IL-7 receptor interplay
maintains proliferation of human thymic progenitors while suppressing non-T cell fates.
J.Immunol., 177, (6) 3711-3720 available from: PM:16951331
Gartner, S, Markovits, P, Markovitz, DM, Kaplan, MH, Gallo, RC, & Popovic, M 1986. The
role of mononuclear phagocytes in HTLV-III/LAV infection. Science, 233, (4760) 215-219
available from: PM:3014648
Gerdes, J, Schwab, U, Lemke, H, & Stein, H 1983. Production of a mouse monoclonal
antibody reactive with a human nuclear antigen associated with cell proliferation.
Int.J.Cancer, 31, (1) 13-20 available from: PM:6339421
Gibb, DM, Duong, T, Leclezio, VA, Walker, AS, Verweel, G, & Dunn, DT 2004.
Immunologic changes during unplanned treatment interruptions of highly active antiretroviral
therapy in children with human immunodeficiency virus type 1 infection.
Pediatr.Infect.Dis.J., 23, (5) 446-450 available from: PM:15131469
Gibb, DM, Newberry, A, Klein, N, de, RA, Grosch-Woerner, I, & Babiker, A 2000. Immune
repopulation after HAART in previously untreated HIV-1-infected children. Paediatric
European Network for Treatment of AIDS (PENTA) Steering Committee. Lancet, 355,
(9212) 1331-1332 available from: PM:10776748
Gibb, DM, Compagnucci, A, Green, H, Lallemant, M, & et al. 2008. Treatment Interruption
in Children with Chronic HIV-infection: the results of the Paediatric European Network for
Treatment of AIDS (PENTA) 11 trial. Journal of the International AIDS Society, 11, (S1)
O21
Gordon, SN, Klatt, NR, Bosinger, SE, Brenchley, JM, Milush, JM, Engram, JC, Dunham,
RM, Paiardini, M, Klucking, S, Danesh, A, Strobert, EA, Apetrei, C, Pandrea, IV, Kelvin, D,
Douek, DC, Staprans, SI, Sodora, DL, & Silvestri, G 2007. Severe depletion of mucosal
CD4+ T cells in AIDS-free simian immunodeficiency virus-infected sooty mangabeys.
J.Immunol., 179, (5) 3026-3034 available from: PM:17709517
Gougeon, ML, Lecoeur, H, Dulioust, A, Enouf, MG, Crouvoiser, M, Goujard, C, Debord, T,
& Montagnier, L 1996. Programmed cell death in peripheral lymphocytes from HIV-infected
persons: increased susceptibility to apoptosis of CD4 and CD8 T cells correlates with

283
lymphocyte activation and with disease progression. J.Immunol., 156, (9) 3509-3520
available from: PM:8617980
Grant, MD, Smaill, FM, & Rosenthal, KL 1993. Lysis of CD4+ lymphocytes by non-HLA-
restricted cytotoxic T lymphocytes from HIV-infected individuals. Clin.Exp.Immunol., 93,
(3) 356-362 available from: PM:8103717
Grasl-Kraupp, B, Ruttkay-Nedecky, B, Koudelka, H, Bukowska, K, Bursch, W, & Schulte-
Hermann, R 1995. In situ detection of fragmented DNA (TUNEL assay) fails to discriminate
among apoptosis, necrosis, and autolytic cell death: a cautionary note. Hepatology, 21, (5)
1465-1468 available from: PM:7737654
Gregersen, JP, Mehdi, S, Baur, A, & Hilfenhaus, J 1990. Antibody- and complement-
mediated lysis of HIV-infected cells and inhibition of viral replication. J.Med Virol., 30, (4)
287-293 available from: PM:1973445
Grimm, TA, Beer, BE, Hirsch, VM, & Clouse, KA 2003. Simian immunodeficiency viruses
from multiple lineages infect human macrophages: implications for cross-species
transmission. J.Acquir.Immune.Defic.Syndr., 32, (4) 362-369 available from: PM:12640192
Groux, H, Torpier, G, Monte, D, Mouton, Y, Capron, A, & Ameisen, JC 1992. Activation-
induced death by apoptosis in CD4+ T cells from human immunodeficiency virus-infected
asymptomatic individuals. J.Exp.Med, 175, (2) 331-340 available from: PM:1346269
Hainaut, M, Ducarme, M, Schandene, L, Peltier, CA, Marissens, D, Zissis, G, Mascart, F, &
Levy, J 2003. Age-related immune reconstitution during highly active antiretroviral therapy
in human immunodeficiency virus type 1-infected children. Pediatric Infectious Disease
Journal, 22, (1) 62-69 available from: ISI:000180455900011
Hamann, D, Baars, PA, Hooibrink, B, & van Lier, RW 1996. Heterogeneity of the human
CD4+ T-cell population: two distinct CD4+ T-cell subsets characterized by coexpression of
CD45RA and CD45RO isoforms. Blood, 88, (9) 3513-3521 available from: PM:8896418
Hamann, D, Kostense, S, Wolthers, KC, Otto, SA, Baars, PA, Miedema, F, & van Lier, RA
1999. Evidence that human CD8+CD45RA+CD27- cells are induced by antigen and evolve
through extensive rounds of division. Int.Immunol., 11, (7) 1027-1033 available from:
PM:10383934
Hansasuta, P & Rowland-Jones, SL 2001. HIV-1 transmission and acute HIV-1 infection.
Br.Med Bull., 58, 109-127 available from: PM:11714627
Hartigan-O'Connor, DJ, Abel, K, & McCune, JM 2007. Suppression of SIV-specific CD4+ T
cells by infant but not adult macaque regulatory T cells: implications for SIV disease
progression. J.Exp.Med, 204, (11) 2679-2692 available from: PM:17954571
Hayday, AC & Pennington, DJ 2007. Key factors in the organized chaos of early T cell
development. Nat Immunol., 8, (2) 137-144 available from: PM:17242687
Haynes, BF, Markert, ML, Sempowski, GD, Patel, DD, & Hale, LP 2000. The role of the
thymus in immune reconstitution in aging, bone marrow transplantation, and HIV-1 infection.
Annu.Rev.Immunol., 18, 529-560 available from: PM:10837068

284
Hazenberg, MD, Otto, SA, Cohen Stuart, JW, Verschuren, MC, Borleffs, JC, Boucher, CA,
Coutinho, RA, Lange, JM, Rinke de Wit, TF, Tsegaye, A, van Dongen, JJ, Hamann, D, de
Boer, RJ, & Miedema, F 2000. Increased cell division but not thymic dysfunction rapidly
affects the T-cell receptor excision circle content of the naive T cell population in HIV-1
infection. Nat.Med., 6, (9) 1036-1042 available from: PM:10973325
Hazenberg, MD, Otto, SA, van Rossum, AM, Scherpbier, HJ, de, GR, Kuijpers, TW, Lange,
JM, Hamann, D, de Boer, RJ, Borghans, JA, & Miedema, F 2004. Establishment of the CD4+
T-cell pool in healthy children and untreated children infected with HIV-1. Blood, 104, (12)
3513-3519 available from: PM:15297312
Hellerstein, M, Hanley, MB, Cesar, D, Siler, S, Papageorgopoulos, C, Wieder, E, Schmidt, D,
Hoh, R, Neese, R, Macallan, D, Deeks, S, & McCune, JM 1999. Directly measured kinetics
of circulating T lymphocytes in normal and HIV-1-infected humans. Nat.Med., 5, (1) 83-89
available from: PM:9883844
Hendriks, J, Gravestein, LA, Tesselaar, K, van Lier, RA, Schumacher, TN, & Borst, J 2000.
CD27 is required for generation and long-term maintenance of T cell immunity.
Nat.Immunol., 1, (5) 433-440 available from: PM:11062504
Hermiston, ML, Xu, Z, & Weiss, A 2003. CD45: a critical regulator of signaling thresholds
in immune cells. Annu.Rev.Immunol., 21, 107-137 available from: PM:12414720
Heumann, D & Roger, T 2002. Initial responses to endotoxins and Gram-negative bacteria.
Clin.Chim.Acta, 323, (1-2) 59-72 available from: PM:12135807
Hicks, CB, Gay, C, & Ferrari, G 2007. Acute HIV infection: the impact of anti-retroviral
treatment on cellular immune responses. Clin.Exp.Immunol., 149, (2) 211-216 available from:
PM:17590167
Hintzen, RQ, de, JR, Lens, SM, & van Lier, RA 1994. CD27: marker and mediator of T-cell
activation? Immunol.Today, 15, (7) 307-311 available from: PM:8086099
Ho Tsong, FR, Khatissian, E, Monceaux, V, Cumont, MC, Beq, S, Ameisen, JC, Aubertin,
AM, Israel, N, Estaquier, J, & Hurtrel, B 2005. Disease progression in macaques with low
SIV replication levels: on the relevance of TREC counts. AIDS, 19, (7) 663-673 available
from: PM:15821392
Hotchkiss, RS, Strasser, A, McDunn, JE, & Swanson, PE 2009. Cell death. N.Engl.J.Med,
361, (16) 1570-1583 available from: PM:19828534
Huenecke, S, Behl, M, & Zimmerman, S 2008. Age-matched lymphocyte subpopulation
reference values in childhood and adolescence: application of exponential regression
analysis. European Journal of Haematology, 80, (6) 532-539
Jacob, MC, Favre, M, & Bensa, JC 1991. Membrane cell permeabilization with saponin and
multiparametric analysis by flow cytometry. Cytometry, 12, (6) 550-558 available from:
PM:1764979
Jaffar, S, Grant, AD, Whitworth, J, Smith, PG, & Whittle, H 2004. The natural history of
HIV-1 and HIV-2 infections in adults in Africa: a literature review. Bull.World Health
Organ, 82, (6) 462-469 available from: PM:15356940

285
Johannisson, A & Festin, R 1995. Phenotype transition of CD4+ T cells from CD45RA to
CD45R0 is accompanied by cell activation and proliferation. Cytometry, 19, (4) 343-352
available from: PM:7796699
Jones, PL, Korte, T, & Blumenthal, R 1998. Conformational changes in cell surface HIV-1
envelope glycoproteins are triggered by cooperation between cell surface CD4 and co-
receptors. J.Biol.Chem., 273, (1) 404-409 available from: PM:9417096
Jordan, KA, Furlan, SN, Gonzalez, VD, Karlsson, AC, Quigley, MF, Deeks, SG, Rosenberg,
MG, Nixon, DF, & Sandberg, JK 2006. CD8 T cell effector maturation in HIV-1-infected
children. Virology, 347, (1) 117-126 available from: ISI:000236531600011
Junge, S, Kloeckener-Gruissem, B, Zufferey, R, Keisker, A, Salgo, B, Fauchere, JC, Scherer,
F, Shalaby, T, Grotzer, M, Siler, U, Seger, R, & Gungor, T 2007. Correlation between recent
thymic emigrants and CD31+ (PECAM-1) CD4+ T cells in normal individuals during aging
and in lymphopenic children. Eur.J.Immunol., 37, (11) 3270-3280 available from:
PM:17935071
Kaneko, T & Nakagata, N 2006. Improvement in the long-term stability of freeze-dried
mouse spermatozoa by adding of a chelating agent. Cryobiology, 53, (2) 279-282 available
from: PM:16870171
Kaufman, JF, Auffray, C, Korman, AJ, Shackelford, DA, & Strominger, J 1984. The class II
molecules of the human and murine major histocompatibility complex. Cell, 36, (1) 1-13
available from: PM:6198089
Kawamoto, H & Katsura, Y 2009. A new paradigm for hematopoietic cell lineages: revision
of the classical concept of the myeloid-lymphoid dichotomy. Trends Immunol., 30, (5) 193-
200 available from: PM:19356980
Keogan, T., Wallace, E., & O'Leary, P. 2006, "Basic Immunology," In Concise Clinical
Immunology for healthcare professionals, Routledge, pp. 1-105.
Kim, CH, Rott, L, Kunkel, EJ, Genovese, MC, Andrew, DP, Wu, L, & Butcher, EC 2001.
Rules of chemokine receptor association with T cell polarization in vivo. J.Clin.Invest, 108,
(9) 1331-1339 available from: PM:11696578
Kim, H & Perelson, AS 2006. Viral and latent reservoir persistence in HIV-1-infected
patients on therapy. PLoS.Comput.Biol., 2, (10) e135 available from: PM:17040122
Kimmig, S, Przybylski, GK, Schmidt, CA, Laurisch, K, Mowes, B, Radbruch, A, & Thiel, A
2002. Two subsets of naive T helper cells with distinct T cell receptor excision circle content
in human adult peripheral blood. J.Exp.Med., 195, (6) 789-794 available from: PM:11901204
Kitahata, MM, Gange, SJ, Abraham, AG, Merriman, B, Saag, MS, Justice, AC, Hogg, RS,
Deeks, SG, Eron, JJ, Brooks, JT, Rourke, SB, Gill, MJ, Bosch, RJ, Martin, JN, Klein, MB,
Jacobson, LP, Rodriguez, B, Sterling, TR, Kirk, GD, Napravnik, S, Rachlis, AR, Calzavara,
LM, Horberg, MA, Silverberg, MJ, Gebo, KA, Goedert, JJ, Benson, CA, Collier, AC, Van
Rompaey, SE, Crane, HM, McKaig, RG, Lau, B, Freeman, AM, & Moore, RD 2009. Effect
of early versus deferred antiretroviral therapy for HIV on survival. N.Engl.J.Med, 360, (18)
1815-1826 available from: PM:19339714

286
Klatzmann, D, Champagne, E, Chamaret, S, Gruest, J, Guetard, D, Hercend, T, Gluckman,
JC, & Montagnier, L 1984. T-lymphocyte T4 molecule behaves as the receptor for human
retrovirus LAV. Nature, 312, (5996) 767-768 available from: PM:6083454
Kleeberger, CA, Lyles, RH, Margolick, JB, Rinaldo, CR, Phair, JP, & Giorgi, JV 1999.
Viability and recovery of peripheral blood mononuclear cells cryopreserved for up to 12
years in a multicenter study. Clin.Diagn.Lab Immunol., 6, (1) 14-19 available from:
PM:9874657
Kohler, S, Wagner, U, Pierer, M, Kimmig, S, Oppmann, B, Mowes, B, Julke, K, Romagnani,
C, & Thiel, A 2005. Post-thymic in vivo proliferation of naive CD4+ T cells constrains the
TCR repertoire in healthy human adults. Eur.J.Immunol., 35, (6) 1987-1994 available from:
PM:15909312
Kong, FK, Chen, CL, Six, A, Hockett, RD, & Cooper, MD 1999. T cell receptor gene
deletion circles identify recent thymic emigrants in the peripheral T cell pool.
Proc.Natl.Acad.Sci.U.S.A, 96, (4) 1536-1540 available from: PM:9990059
Kornfeld, C, Ploquin, MJ, Pandrea, I, Faye, A, Onanga, R, Apetrei, C, Poaty-Mavoungou, V,
Rouquet, P, Estaquier, J, Mortara, L, Desoutter, JF, Butor, C, Le, GR, Roques, P, Simon, F,
Barre-Sinoussi, F, Diop, OM, & Muller-Trutwin, MC 2005. Antiinflammatory profiles during
primary SIV infection in African green monkeys are associated with protection against AIDS.
J.Clin.Invest, 115, (4) 1082-1091 available from: PM:15761496
Kostrikis, LG, Neumann, AU, Thomson, B, Korber, BT, McHardy, P, Karanicolas, R,
Deutsch, L, Huang, Y, Lew, JF, McIntosh, K, Pollack, H, Borkowsky, W, Spiegel, HM,
Palumbo, P, Oleske, J, Bardeguez, A, Luzuriaga, K, Sullivan, J, Wolinsky, SM, Koup, RA,
Ho, DD, & Moore, JP 1999. A polymorphism in the regulatory region of the CC-chemokine
receptor 5 gene influences perinatal transmission of human immunodeficiency virus type 1 to
African-American infants. The Journal of Virology, 73, (12) 10264-10271 available from:
PM:10559343
Krogstad, P, Uittenbogaart, CH, Dickover, R, Bryson, YJ, Plaeger, S, & Garfinkel, A 1999.
Primary HIV infection of infants: The effects of somatic growth on lymphocyte and virus
dynamics. Clinical Immunology, 92, (1) 25-33 available from: ISI:000081452100005
Krueger, A, Willenzon, S, Lyszkiewicz, M, Kremmer, E, & Forster, R 2010. CC chemokine
receptor 7 and 9 double-deficient hematopoietic progenitors are severely impaired in seeding
the adult thymus. Blood, 115, (10) 1906-1912 available from: PM:20040757
Krzysiek, R, Rudent, A, Bouchet-Delbos, L, Foussat, A, Boutillon, C, Portier, A, Ingrand, D,
Sereni, D, Galanaud, P, Grangeot-Keros, L, & Emilie, D 2001. Preferential and persistent
depletion of CCR5+ T-helper lymphocytes with nonlymphoid homing potential despite early
treatment of primary HIV infection. Blood, 98, (10) 3169-3171 available from: PM:11698309
Kvale, D, Ormaasen, V, Kran, AM, Johansson, CC, Aukrust, P, Aandahl, EM, Froland, SS,
& Tasken, K 2006. Immune modulatory effects of cyclooxygenase type 2 inhibitors in HIV
patients on combination antiretroviral treatment. AIDS, 20, (6) 813-820 available from:
PM:16549964

287
Lanier, LL, Buck, DW, Rhodes, L, Ding, A, Evans, E, Barney, C, & Phillips, JH 1988.
Interleukin 2 activation of natural killer cells rapidly induces the expression and
phosphorylation of the Leu-23 activation antigen. J.Exp.Med., 167, (5) 1572-1585 available
from: PM:3259252
Lanzavecchia, A & Sallusto, F 2005. Understanding the generation and function of memory
T cell subsets. Curr.Opin.Immunol., 17, (3) 326-332 available from: PM:15886125
Laurent-Crawford, AG, Krust, B, Muller, S, Riviere, Y, Rey-Cuille, MA, Bechet, JM,
Montagnier, L, & Hovanessian, AG 1991. The cytopathic effect of HIV is associated with
apoptosis. Virology, 185, (2) 829-839 available from: PM:1683728
Lazzarin, A 2005. Enfuvirtide: the first HIV fusion inhibitor. Expert.Opin.Pharmacother., 6,
(3) 453-464 available from: PM:15794736
Lees, O, Ramzaoui, S, Gilbert, D, Borsa, F, Humbert, G, Leblanc, D, Lagarde, M, & Tron, F
1993. The impaired in vitro production of interleukin-2 in HIV infection is negatively
correlated to the number of circulating CD4+DR+ T cells and is reversed by allowing T cells
to rest in culture: arguments for in vivo CD4+ T cell activation.
Clin.Immunol.Immunopathol., 67, (3 Pt 1) 185-191 available from: PM:8500265
Lewis, MG, Zack, PM, Elkins, WR, & Jahrling, PB 1992. Infection of rhesus and
cynomolgus macaques with a rapidly fatal SIV (SIVSMM/PBj) isolate from sooty
mangabeys. AIDS Res.Hum.Retroviruses, 8, (9) 1631-1639 available from: PM:1457209
Li, Q, Duan, L, Estes, JD, Ma, ZM, Rourke, T, Wang, Y, Reilly, C, Carlis, J, Miller, CJ, &
Haase, AT 2005. Peak SIV replication in resting memory CD4+ T cells depletes gut lamina
propria CD4+ T cells. Nature, 434, (7037) 1148-1152 available from: PM:15793562
Libman, H 1992. Pathogenesis, natural history, and classification of HIV infection.
Prim.Care, 19, (1) 1-17 available from: PM:1594691
Libois, A, Lopez, A, Garcia, F, Castro, P, Maleno, MJ, Garcia, A, Climent, N, Arnedo, M,
Gallart, T, Gatell, JM, & Plana, M 2006. Dynamics of T cells subsets and
lymphoproliferative responses during structured treatment interruption cycles and after
definitive interruption of HAART in early chronic HIV type-1-infected patients. AIDS
Res.Hum.Retroviruses, 22, (7) 657-666 available from: PM:16831090
Lim, SG, Condez, A, Lee, CA, Johnson, MA, Elia, C, & Poulter, LW 1993. Loss of mucosal
CD4 lymphocytes is an early feature of HIV infection. Clin.Exp.Immunol., 92, (3) 448-454
available from: PM:8099858
Litvak, S, Sarih-Cottin, L, Fournier, M, Andreola, M, & Tarrago-Litvak, L 1994. Priming of
HIV replication by tRNA(Lys3): role of reverse transcriptase. Trends Biochem.Sci., 19, (3)
114-118 available from: PM:7515521
Loken, M. R., Green, C. L., & Wells, D. A. 2000, "Immunofluorescence of surface markers,"
In flow cytometry, 3rd ed. M. G. Ormerod, ed., Oxford: Oxford University Press, pp. 61-82.
Loos, B & Engelbrecht, AM 2009. Cell death: a dynamic response concept. Autophagy., 5,
(5) 590-603 available from: PM:19363298

288
Luzuriaga, K, Bryson, Y, Krogstad, P, Robinson, J, Stechenberg, B, Lamson, M, Cort, S, &
Sullivan, JL 1997. Combination treatment with zidovudine, didanosine, and nevirapine in
infants with human immunodeficiency virus type 1 infection. N.Engl.J.Med., 336, (19) 1343-
1349 available from: PM:9134874
Luzuriaga, K, McQuilken, P, Alimenti, A, Somasundaran, M, Hesselton, R, & Sullivan, JL
1993. Early viremia and immune responses in vertical human immunodeficiency virus type 1
infection. J.Infect.Dis., 167, (5) 1008-1013 available from: PM:8486935
Luzuriaga, K & Sullivan, JL 1998. Prevention and treatment of pediatric HIV infection.
JAMA, 280, (1) 17-18 available from: PM:9660351
Lyons, AB & Parish, CR 1994. Determination of lymphocyte division by flow cytometry.
J.Immunol.Methods, 171, (1) 131-137 available from: PM:8176234
Macallan, DC, Asquith, B, Irvine, AJ, Wallace, DL, Worth, A, Ghattas, H, Zhang, Y, Griffin,
GE, Tough, DF, & Beverley, PC 2003. Measurement and modeling of human T cell kinetics.
Eur.J.Immunol., 33, (8) 2316-2326 available from: PM:12884307
Macallan, DC, Fullerton, CA, Neese, RA, Haddock, K, Park, SS, & Hellerstein, MK 1998.
Measurement of cell proliferation by labeling of DNA with stable isotope-labeled glucose:
studies in vitro, in animals, and in humans. Proc.Natl.Acad.Sci.U.S.A, 95, (2) 708-713
available from: PM:9435257
Macallan, DC, Wallace, D, Zhang, Y, De Lara, C, Worth, AT, Ghattas, H, Griffin, GE,
Beverley, PC, & Tough, DF 2004. Rapid turnover of effector-memory CD4(+) T cells in
healthy humans. J.Exp.Med., 200, (2) 255-260 available from: PM:15249595
Mackay, CR, Marston, WL, & Dudler, L 1990. Naive and memory T cells show distinct
pathways of lymphocyte recirculation. J.Exp.Med, 171, (3) 801-817 available from:
PM:2307933
Mahalingam, M, Peakman, M, Davies, ET, Pozniak, A, McManus, TJ, & Vergani, D 1993. T
cell activation and disease severity in HIV infection. Clin.Exp.Immunol., 93, (3) 337-343
available from: PM:8103715
Mahalingam, M, Pozniak, A, McManus, TJ, Senaldi, G, Vergani, D, & Peakman, M 1996.
Abnormalities of CD45 isoform expression in HIV infection. Clin.Immunol.Immunopathol.,
81, (2) 210-214 available from: PM:8906753
Malavasi, F, Deaglio, S, Ferrero, E, Funaro, A, Sancho, J, Ausiello, CM, Ortolan, E, Vaisitti,
T, Zubiaur, M, Fedele, G, Aydin, S, Tibaldi, EV, Durelli, I, Lusso, R, Cozno, F, &
Horenstein, AL 2006. CD38 and CD157 as receptors of the immune system: a bridge
between innate and adaptive immunity. Mol.Med., 12, (11-12) 334-341 available from:
PM:17380201
Markovic, I & Clouse, KA 2004. Recent advances in understanding the molecular
mechanisms of HIV-1 entry and fusion: revisiting current targets and considering new
options for therapeutic intervention. Curr.HIV.Res., 2, (3) 223-234 available from:
PM:15279586

289
Marzio, R, Mauel, J, & Betz-Corradin, S 1999. CD69 and regulation of the immune function.
Immunopharmacol.Immunotoxicol., 21, (3) 565-582 available from: PM:10466080
McCarthy, D. A. 2001, "Introduction to the general principles of sample preparation," In
Cytometric analysis of cell phenotype and function, D. A. McCarthy & M. G. Macey, eds.,
Cambridge: Cambridge University Press, pp. 15-44.
McCarthy, D. A. 2007, "cell preparation," In Flow cytometry: principles and applications, M.
G. Macey, ed., Totowa: Humana, pp. 17-59.
McElhaney, JE, Pinkoski, MJ, & Meneilly, GS 1995. Changes in CD45 isoform expression
vary according to the duration of T-cell memory after vaccination. Clin.Diagn.Lab Immunol.,
2, (1) 73-81 available from: PM:7719917
Meyaard, L, Otto, SA, Jonker, RR, Mijnster, MJ, Keet, RP, & Miedema, F 1992.
Programmed death of T cells in HIV-1 infection. Science, 257, (5067) 217-219 available
from: PM:1352911
Miedema, F, Meyaard, L, Koot, M, Klein, MR, Roos, MT, Groenink, M, Fouchier, RA, Van't
Wout, AB, Tersmette, M, Schellekens, PT, & . 1994. Changing virus-host interactions in the
course of HIV-1 infection. Immunol.Rev., 140, 35-72 available from: PM:7821927
Miller, V 2001. Structured treatment interruptions in antiretroviral management of HIV-1.
Curr.Opin.Infect.Dis., 14, (1) 29-37 available from: PM:11979112
Miller, V, Cozzi-Lepri, A, Hertogs, K, Gute, P, Larder, B, Bloor, S, Klauke, S, Rabenau, H,
Phillips, A, & Staszewski, S 2000a. HIV drug susceptibility and treatment response to mega-
HAART regimen in patients from the Frankfurt HIV cohort. Antivir.Ther., 5, (1) 49-55
available from: PM:10846593
Miller, V, Sabin, C, Hertogs, K, Bloor, S, Martinez-Picado, J, D'Aquila, R, Larder, B, Lutz,
T, Gute, P, Weidmann, E, Rabenau, H, Phillips, A, & Staszewski, S 2000b. Virological and
immunological effects of treatment interruptions in HIV-1 infected patients with treatment
failure. AIDS, 14, (18) 2857-2867 available from: PM:11153667
Milson, TJ, Patrick, CW, Torke, NJ, & Keller, RH 1986. Holding medium for cell surface
phenotypic analysis. J.Immunol.Methods, 87, (2) 155-159 available from: PM:3485157
Miltenyi Biotech. CD4+ T cell isolation kit II (#130-091-155). Miltenyi Biotech website .
2009. 7-8-2009.
Ref Type: Online Source
Milush, JM, Reeves, JD, Gordon, SN, Zhou, D, Muthukumar, A, Kosub, DA, Chacko, E,
Giavedoni, LD, Ibegbu, CC, Cole, KS, Miamidian, JL, Paiardini, M, Barry, AP, Staprans, SI,
Silvestri, G, & Sodora, DL 2007. Virally Induced CD4+ T Cell Depletion Is Not Sufficient to
Induce AIDS in a Natural Host. The Journal of Immunology, 179, (5) 3047-3056 available
from: http://www.jimmunol.org/cgi/content/abstract/179/5/3047
Min, B, McHugh, R, Sempowski, GD, Mackall, C, Foucras, G, & Paul, WE 2003. Neonates
support lymphopenia-induced proliferation. Immunity., 18, (1) 131-140 available from:
PM:12530982

290
Misumi, S, Inoue, M, Dochi, T, Kishimoto, N, Hasegawa, N, Takamune, N, & Shoji, S 2010.
Uncoating of human immunodeficiency virus type 1 requires prolyl isomerase PIN1.
J.Biol.Chem. available from: PM:20529865
Mo, H, Monard, S, Pollack, H, Ip, J, Rochford, G, Wu, L, Hoxie, J, Borkowsky, W, Ho, DD,
& Moore, JP 1998. Expression patterns of the HIV type 1 coreceptors CCR5 and CXCR4 on
CD4+ T cells and monocytes from cord and adult blood. AIDS Res.Hum.Retroviruses, 14, (7)
607-617 available from: PM:9591715
Mobley, PW, Curtain, CC, Kirkpatrick, A, Rostamkhani, M, Waring, AJ, & Gordon, LM
1992. The amino-terminal peptide of HIV-1 glycoprotein 41 lyses human erythrocytes and
CD4+ lymphocytes. Biochim.Biophys.Acta, 1139, (4) 251-256 available from: PM:1355363
Mohri, H, Bonhoeffer, S, Monard, S, Perelson, AS, & Ho, DD 1998. Rapid turnover of T
lymphocytes in SIV-infected rhesus macaques. Science, 279, (5354) 1223-1227 available
from: PM:9469816
Mohri, H, Perelson, AS, Tung, K, Ribeiro, RM, Ramratnam, B, Markowitz, M, Kost, R,
Hurley, A, Weinberger, L, Cesar, D, Hellerstein, MK, & Ho, DD 2001. Increased turnover of
T lymphocytes in HIV-1 infection and its reduction by antiretroviral therapy. J.Exp.Med.,
194, (9) 1277-1287 available from: PM:11696593
Moir, S & Fauci, AS 2008. Pathogenic mechanisms of B-lymphocyte dysfunction in HIV
disease. J.Allergy Clin.Immunol., 122, (1) 12-19 available from: PM:18547629
Monini, P, Sgadari, C, Toschi, E, Barillari, G, & Ensoli, B 2004. Antitumour effects of
antiretroviral therapy. Nat Rev.Cancer, 4, (11) 861-875 available from: PM:15516959
Monpoux, F, Tricoire, J, Lalande, M, Reliquet, V, Bebin, B, & Thuret, I 2004. Treatment
interruption for virological failure or as sparing regimen in children with chronic HIV-1
infection. AIDS, 18, (18) 2401-2409 available from: PM:15622316
Montaner, LJ 2001. Structured treatment interruptions to control HIV-1 and limit drug
exposure. Trends Immunol., 22, (2) 92-96 available from: PM:11286710
Moretti, S, Marcellini, S, Boschini, A, Famularo, G, Santini, G, Alesse, E, Steinberg, SM,
Cifone, MG, Kroemer, G, & De, SC 2000. Apoptosis and apoptosis-associated perturbations
of peripheral blood lymphocytes during HIV infection: comparison between AIDS patients
and asymptomatic long-term non-progressors. Clin.Exp.Immunol., 122, (3) 364-373 available
from: PM:11122242
Morris, L 2002. Neutralizing antibody responses to HIV-1 infection. IUBMB.Life, 53, (4-5)
197-199 available from: PM:12120994
Murphy, K., Travers, P. J., & Walport, M. 2008, "Antigen presentation to T Lymphocytes,"
In Janeway's immunobiology, 7th ed. New York: Garland Science, pp. 181-218.
Naylor, K, Li, G, Vallejo, AN, Lee, WW, Koetz, K, Bryl, E, Witkowski, J, Fulbright, J,
Weyand, CM, & Goronzy, JJ 2005. The influence of age on T cell generation and TCR
diversity. J.Immunol., 174, (11) 7446-7452 available from: PM:15905594

291
Neese, RA, Siler, SQ, Cesar, D, Antelo, F, Lee, D, Misell, L, Patel, K, Tehrani, S, Shah, P, &
Hellerstein, MK 2001. Advances in the stable isotope-mass spectrometric measurement of
DNA synthesis and cell proliferation. Anal.Biochem., 298, (2) 189-195 available from:
PM:11700973
Neumann, AU, Tubiana, R, Calvez, V, Robert, C, Li, TS, Agut, H, Autran, B, & Katlama, C
1999. HIV-1 rebound during interruption of highly active antiretroviral therapy has no
deleterious effect on reinitiated treatment. Comet Study Group. AIDS, 13, (6) 677-683
available from: PM:10397562
Newell, ML, Patel, D, Goetghebuer, T, & Thorne, C 2006. CD4 cell response to antiretroviral
therapy in children with vertically acquired HIV infection: is it associated with age at
initiation? J.Infect.Dis., 193, (7) 954-962 available from: PM:16518757
Nielsen, MH, Pedersen, FS, & Kjems, J 2005. Molecular strategies to inhibit HIV-1
replication. Retrovirology., 2, 10 available from: PM:15715913
Notermans, DW, Pakker, NG, Hamann, D, Foudraine, NA, Kauffmann, RH, Meenhorst, PL,
Goudsmit, J, Roos, MT, Schellekens, PT, Miedema, F, & Danner, SA 1999. Immune
reconstitution after 2 years of successful potent antiretroviral therapy in previously untreated
human immunodeficiency virus type 1-infected adults. J.Infect.Dis., 180, (4) 1050-1056
available from: PM:10479130
Okada, R, Kondo, T, Matsuki, F, Takata, H, & Takiguchi, M 2008. Phenotypic classification
of human CD4+ T cell subsets and their differentiation. Int.Immunol., 20, (9) 1189-1199
available from: PM:18635582
Oswald-Richter, K, Grill, SM, Leelawong, M, & Unutmaz, D 2004. HIV infection of primary
human T cells is determined by tunable thresholds of T cell activation. Eur.J.Immunol., 34,
(6) 1705-1714 available from: PM:15162441
Pacifici, R, Zuccaro, P, Cozzi-Lepre, A, di, CS, Bacosi, A, & Fattorossi, A 1998.
Quantification of the variation due to lysing technique in immunophenotyping of healthy and
HIV-infected individuals. Clin.Biochem., 31, (3) 165-172 available from: PM:9629490
Paiardini, M, Cervasi, B, Sumpter, B, McClure, HM, Sodora, DL, Magnani, M, Staprans, SI,
Piedimonte, G, & Silvestri, G 2006. Perturbations of cell cycle control in T cells contribute to
the different outcomes of simian immunodeficiency virus infection in rhesus macaques and
sooty mangabeys. The Journal of Virology, 80, (2) 634-642 available from: PM:16378966
Pakker, NG, Notermans, DW, de Boer, RJ, Roos, MT, de, WF, Hill, A, Leonard, JM, Danner,
SA, Miedema, F, & Schellekens, PT 1998. Biphasic kinetics of peripheral blood T cells after
triple combination therapy in HIV-1 infection: a composite of redistribution and proliferation.
Nat.Med., 4, (2) 208-214 available from: PM:9461195
Palacios, GC, Sanchez, LM, Briones, E, Ramirez, TJ, Castillo, H, Rivera, LG, Vazquez, CA,
Rodriguez-Padilla, C, & Holodniy, M 2009. Structured interruptions of highly active
antiretroviral therapy in cycles of 4 weeks off/12 weeks on therapy in children having a
chronically undetectable viral load cause progressively smaller viral rebounds.
Int.J.Infect.Dis. available from: PM:19467895

292
Pantaleo, G, Graziosi, C, & Fauci, AS 1993. New concepts in the immunopathogenesis of
human immunodeficiency virus infection. N.Engl.J.Med., 328, (5) 327-335 available from:
PM:8093551
Patel, D., Ford, T. C., & Rickwood, D. 1998, "Fractionation of cells by sedimentation
methods," In Cell Separation A Practical Approach, D. Fisher, G. E. Francis, & D.
Rickwood, eds., Oxford: Oxford University Press, pp. 43-89.
Patel, MS & Roche, TE 1990. Molecular biology and biochemistry of pyruvate
dehydrogenase complexes. FASEB J., 4, (14) 3224-3233 available from: PM:2227213
Patki, AH, Georges, DL, & Lederman, MM 1997. CD4+-T-cell counts, spontaneous
apoptosis, and Fas expression in peripheral blood mononuclear cells obtained from human
immunodeficiency virus type 1-infected subjects. Clin.Diagn.Lab Immunol., 4, (6) 736-741
available from: PM:9384300
Patki, AH, Zielske, SP, Sieg, SF, & Lederman, MM 2000. Preferential S phase entry and
apoptosis of CD4(+) T lymphocytes of HIV-1-infected patients after in vitro cultivation.
Clin.Immunol., 97, (3) 241-247 available from: PM:11112363
Pavia, A. 2008, "Managing HIV infection in children and adolescents," In Global HIV/AIDS
medicine, P. Volberding et al., eds., Philadelphia: Saunders Elsevier, pp. 475-485.
Penninger, JM, Irie-Sasaki, J, Sasaki, T, & Oliveira-dos-Santos, AJ 2001. CD45: new jobs for
an old acquaintance. Nat.Immunol., 2, (5) 389-396 available from: PM:11323691
Perfetto, SP, Chattopadhyay, PK, & Roederer, M 2004. Seventeen-colour flow cytometry:
unravelling the immune system. Nat Rev.Immunol., 4, (8) 648-655 available from:
PM:15286731
Perfetto, SP, Hickey, TE, Blair, PJ, Maino, VC, Wagner, KF, Zhou, S, Mayers, DL, St, LD,
June, CH, & Siegel, JN 1997. Measurement of CD69 induction in the assessment of immune
function in asymptomatic HIV-infected individuals. Cytometry, 30, (1) 1-9 available from:
PM:9056736
Persaud, D, Pierson, T, Ruff, C, Finzi, D, Chadwick, KR, Margolick, JB, Ruff, A, Hutton, N,
Ray, S, & Siliciano, RF 2000. A stable latent reservoir for HIV-1 in resting CD4(+) T
lymphocytes in infected children. J.Clin.Invest, 105, (7) 995-1003 available from:
PM:10749578
Plaeger-Marshall, S, Isacescu, V, O'Rourke, S, Bertolli, J, Bryson, YJ, & Stiehm, ER 1994. T
cell activation in pediatric AIDS pathogenesis: three-color immunophenotyping.
Clin.Immunol.Immunopathol., 71, (1) 19-26 available from: PM:7511081
Poiesz, BJ, Ruscetti, FW, Gazdar, AF, Bunn, PA, Minna, JD, & Gallo, RC 1980. Detection
and isolation of type C retrovirus particles from fresh and cultured lymphocytes of a patient
with cutaneous T-cell lymphoma. Proc.Natl.Acad.Sci.U.S.A, 77, (12) 7415-7419 available
from: PM:6261256
Pomerantz, RJ & Horn, DL 2003. 20 years of therapy for HIV-1 infection. Nat Med, 9, (7)
867-873
293
Poveda, E, Briz, V, Quinones-Mateu, M, & Soriano, V 2006. HIV tropism: diagnostic tools
and implications for disease progression and treatment with entry inhibitors. AIDS, 20, (10)
1359-1367 available from: PM:16791010
Prager, E, Sunder-Plassmann, R, Hansmann, C, Koch, C, Holter, W, Knapp, W, &
Stockinger, H 1996. Interaction of CD31 with a heterophilic counterreceptor involved in
downregulation of human T cell responses. J.Exp.Med., 184, (1) 41-50 available from:
PM:8691148
Prince, AL, Yin, CC, Enos, ME, Felices, M, & Berg, LJ 2009. The Tec kinases Itk and Rlk
regulate conventional versus innate T-cell development. Immunol.Rev., 228, (1) 115-131
available from: PM:19290924
Pulliam, L, Gascon, R, Stubblebine, M, McGuire, D, & McGrath, MS 1997. Unique
monocyte subset in patients with AIDS dementia. Lancet, 349, (9053) 692-695 available
from: PM:9078201
Rambaldi, A, Borleri, G, Dotti, G, Bellavita, P, Amaru, R, Biondi, A, & Barbui, T 1998.
Innovative two-step negative selection of granulocyte colony-stimulating factor-mobilized
circulating progenitor cells: adequacy for autologous and allogeneic transplantation. Blood,
91, (6) 2189-2196 available from: PM:9490708
Read, JS 2007. Diagnosis of HIV-1 infection in children younger than 18 months in the
United States. Pediatrics, 120, (6) e1547-e1562 available from: PM:18055670
Read, SW, Lempicki, RA, Di, MM, Srinivasula, S, Burke, R, Sachau, W, Bosche, M,
Adelsberger, JW, Sereti, I, Davey, RT, Jr., Tavel, JA, Huang, CY, Issaq, HJ, Fox, SD, Lane,
HC, & Kovacs, JA 2008. CD4 T cell survival after intermittent interleukin-2 therapy is
predictive of an increase in the CD4 T cell count of HIV-infected patients. J.Infect.Dis., 198,
(6) 843-850 available from: PM:18684102
Renzi, P & Ginns, LC 1987. Analysis of T cell subsets in normal adults. Comparison of
whole blood lysis technique to Ficoll-Hypaque separation by flow cytometry.
J.Immunol.Methods, 98, (1) 53-56 available from: PM:2951443
Resino, S, Galan, I, Perez, A, Ramos, JT, Bellon, JM, Fontelos, PM, de Jose, MI, Gutierrez,
MD, Cabrero, E, & Munoz-Fernandez, MA 2005. Immunological changes after highly active
antiretroviral therapy with lopinavir-ritonavir in heavily pretreated HIV-infected children.
AIDS Res.Hum.Retroviruses, 21, (5) 398-406 available from: PM:15929702
Resino, S, Seoane, E, Gutierrez, MD, Leon, JA, & Munoz-Fernandez, MA 2006. CD4(+) T-
cell immunodeficiency is more dependent on immune activation than viral load in HIV-
infected children on highly active antiretroviral therapy. J.Acquir.Immune.Defic.Syndr., 42,
(3) 269-276 available from: PM:16810122
Richards, D, Chapman, MD, Sasama, J, Lee, TH, & Kemeny, DM 1997. Immune memory in
CD4+ CD45RA+ T cells. Immunology, 91, (3) 331-339 available from: PM:9301520
Riviere, Y, Tanneau-Salvadori, F, Regnault, A, Lopez, O, Sansonetti, P, Guy, B, Kieny, MP,
Fournel, JJ, & Montagnier, L 1989. Human immunodeficiency virus-specific cytotoxic
responses of seropositive individuals: distinct types of effector cells mediate killing of targets

294
expressing gag and env proteins. The Journal of Virology, 63, (5) 2270-2277 available from:
PM:2522999
Rogers, PR, Pilapil, S, Hayakawa, K, Romain, PL, & Parker, DC 1992. CD45 alternative
exon expression in murine and human CD4+ T cell subsets. J.Immunol., 148, (12) 4054-4065
available from: PM:1351092
Romeu, MA, Mestre, M, Gonzalez, L, Valls, A, Verdaguer, J, Corominas, M, Bas, J, Massip,
E, & Buendia, E 1992. Lymphocyte immunophenotyping by flow cytometry in normal adults.
Comparison of fresh whole blood lysis technique, Ficoll-Paque separation and
cryopreservation. J.Immunol.Methods, 154, (1) 7-10 available from: PM:1401946
Rosenblatt, HM, Stanley, KE, Song, LY, Johnson, GM, Wiznia, AA, Nachman, SA, &
Krogstad, PA 2005. Immunological response to highly active antiretroviral therapy in
children with clinically stable HIV-1 infection. J.Infect.Dis., 192, (3) 445-455 available from:
PM:15995958
Rothenberg, EV 2009. Decision by committee: new light on the CD4/CD8-lineage choice.
Immunol.Cell Biol., 87, (2) 109-112 available from: PM:19079359
Rothenberg, EV, Moore, JE, & Yui, MA 2008. Launching the T-cell-lineage developmental
programme. Nat.Rev.Immunol., 8, (1) 9-21 available from: PM:18097446
Rothstein, DM, Yamada, A, Schlossman, SF, & Morimoto, C 1991. Cyclic regulation of
CD45 isoform expression in a long term human CD4+CD45RA+ T cell line. J.Immunol.,
146, (4) 1175-1183 available from: PM:1671403
Ruiz, L, Martinez-Picado, J, Romeu, J, Paredes, R, Zayat, MK, Marfil, S, Negredo, E, Sirera,
G, Tural, C, & Clotet, B 2000. Structured treatment interruption in chronically HIV-1
infected patients after long-term viral suppression. AIDS, 14, (4) 397-403 available from:
PM:10770542
Saha, K, Yuen, PH, & Wong, PK 1994. Murine retrovirus-induced depletion of T cells is
mediated through activation-induced death by apoptosis. The Journal of Virology, 68, (4)
2735-2740 available from: PM:8139049
Sallusto, F, Geginat, J, & Lanzavecchia, A 2004. Central memory and effector memory T cell
subsets: function, generation, and maintenance. Annu.Rev.Immunol., 22, 745-763 available
from: PM:15032595
Sallusto, F, Langenkamp, A, Geginat, J, & Lanzavecchia, A 2000. Functional subsets of
memory T cells identified by CCR7 expression. Curr.Top.Microbiol.Immunol., 251, 167-171
available from: PM:11036772
Sallusto, F, Lenig, D, Forster, R, Lipp, M, & Lanzavecchia, A 1999. Two subsets of memory
T lymphocytes with distinct homing potentials and effector functions. Nature, 401, (6754)
708-712 available from: PM:10537110
Sancho, D, Gomez, M, & Sanchez-Madrid, F 2005. CD69 is an immunoregulatory molecule
induced following activation. Trends Immunol., 26, (3) 136-140 available from:
PM:15745855

295
Santagostino, A 1999. An Italian national multicenter study for the definition of reference
ranges for normal values of peripheral blood lymphocyte subsets in healthy adults.
Haematologica, 84, (6) 499-504 available from:
http://metalib.ucl.ac.uk:9003/sfx_local?sid=google&auinit=A&aulast=Santagostino&atitle=
An%20Italian%20national%20multicenter%20study%20for%20the%20definition%20of%20
reference%20ranges%20for%20normal%20values%20of%20peripheral%20blood%20lymph
ocyte%20subsets%20in%20healthy%20adults&id=pmid%3A10366792
Savarino, A, Bottarel, F, Malavasi, F, & Dianzani, U 2000. Role of CD38 in HIV-1 infection:
an epiphenomenon of T-cell activation or an active player in virus/host interactions? AIDS,
14, (9) 1079-1089 available from: PM:10894271
Savino, W 2006. The thymus is a common target organ in infectious diseases. PLoS.Pathog.,
2, (6) e62 available from: PM:16846255
Schander, C & Kenneth, HM 2003. DNA, PCR and formalinized animal tissue - a short
review and protocols. Organisms Diversity & Evolution, 3, (3) 195-205 available from:
http://www.sciencedirect.com/science/article/B7GJ9-4DPMC62-
25/2/662b1231494039a9330abccd9facf536
Scharl, M & Rogler, G 2010. Microbial sensing by the intestinal epithelium in the
pathogenesis of inflammatory bowel disease. Int.J.Inflam., 2010, 671258 available from:
PM:21188218
Schendel, DJ & Johnson, JP 1985. T cells specific for different antigens express different
HLA-D region products. Eur.J.Immunol., 15, (12) 1239-1243 available from: PM:3878791
Schmid-Schonbein, GW, Shih, YY, & Chien, S 1980. Morphometry of human leukocytes.
Blood, 56, (5) 866-875 available from: PM:6775712
Scholzen, T & Gerdes, J 2000. The Ki-67 protein: from the known and the unknown. J.Cell
Physiol, 182, (3) 311-322 available from: PM:10653597
Sedaghat, AR, Siliciano, JD, Brennan, TP, Wilke, CO, & Siliciano, RF 2007. Limits on
Replenishment of the Resting CD4+ T Cell Reservoir for HIV in Patients on HAART. PLoS
Pathogens, 3, (8) e122 available from: http://dx.doi.org/10.1371%2Fjournal.ppat.0030122
Sharp, PM, Bailes, E, Chaudhuri, RR, Rodenburg, CM, Santiago, MO, & Hahn, BH 2001.
The origins of acquired immune deficiency syndrome viruses: where and when?
Philos.Trans.R.Soc.Lond B Biol.Sci., 356, (1410) 867-876 available from: PM:11405934
Shearer, WT, Quinn, TC, LaRussa, P, Lew, JF, Mofenson, L, Almy, S, Rich, K, Handelsman,
E, Diaz, C, Pagano, M, Smeriglio, V, & Kalish, LA 1997. Viral load and disease progression
in infants infected with human immunodeficiency virus type 1. Women and Infants
Transmission Study Group. N.Engl.J.Med, 336, (19) 1337-1342 available from: PM:9134873
Shearer, WT, Rosenblatt, HM, Gelman, RS, Oyomopito, R, Plaeger, S, Stiehm, ER, Wara,
DW, Douglas, SD, Luzuriaga, K, McFarland, EJ, Yogev, R, Rathore, MH, Levy, W, Graham,
BL, & Spector, SA 2003. Lymphocyte subsets in healthy children from birth through 18
years of age: the Pediatric AIDS Clinical Trials Group P1009 study. J.Allergy Clin.Immunol.,
112, (5) 973-980 available from: PM:14610491

296
Sigal, LH 2005. Basic science for the clinician 35: CD1, invariant NKT (iNKT) Cells, and
gammadelta T-cells. J.Clin.Rheumatol., 11, (6) 336-339 available from: PM:16371809
Singer, A, Adoro, S, & Park, JH 2008. Lineage fate and intense debate: myths, models and
mechanisms of CD4- versus CD8-lineage choice. Nat Rev.Immunol., 8, (10) 788-801
available from: PM:18802443
Smith, JG, Joseph, HR, Green, T, Field, JA, Wooters, M, Kaufhold, RM, Antonello, J, &
Caulfield, MJ 2007. Establishing acceptance criteria for cell-mediated-immunity assays using
frozen peripheral blood mononuclear cells stored under optimal and suboptimal conditions.
Clin.Vaccine Immunol., 14, (5) 527-537 available from: PM:17376862
Sousa, AE, Carneiro, J, Meier-Schellersheim, M, Grossman, Z, & Victorino, RM 2002. CD4
T cell depletion is linked directly to immune activation in the pathogenesis of HIV-1 and
HIV-2 but only indirectly to the viral load. J.Immunol., 169, (6) 3400-3406 available from:
PM:12218162
Spina, CA, Prince, HE, & Richman, DD 1997. Preferential replication of HIV-1 in the
CD45RO memory cell subset of primary CD4 lymphocytes in vitro. J.Clin.Invest, 99, (7)
1774-1785 available from: PM:9120023
Sprecher, S, Soumenkoff, G, Puissant, F, & Degueldre, M 1986. Vertical Transmission of
Hiv in 15-Week Fetus. Lancet, 2, (8501) 288-289 available from: ISI:A1986D428400043
Sprent, J & Surh, CD 2002. T cell memory. Annu.Rev.Immunol., 20, 551-579 available from:
PM:11861612
Starr, TK, Jameson, SC, & Hogquist, KA 2003. Positive and negative selection of T cells.
Annu.Rev.Immunol., 21, 139-176 available from: PM:12414722
Stephenson, J 1999. Hopes for HIV eradication dim as stopping HAART allows resurgence.
JAMA, 282, (14) 1317-1318 available from: PM:10527163
Sterling, TR, Vlahov, D, Astemborski, J, Hoover, DR, Margolick, JB, & Quinn, TC 2001.
Initial plasma HIV-1 RNA levels and progression to AIDS in women and men.
N.Engl.J.Med., 344, (10) 720-725 available from: PM:11236775
Stewart, SJ, Fujimoto, J, & Levy, R 1986. Human T lymphocytes and monocytes bear the
same Leu-3(T4) antigen. J.Immunol., 136, (10) 3773-3778 available from: PM:3084644
Strebel, K, Luban, J, & Jeang, KT 2009. Human cellular restriction factors that target HIV-1
replication. BMC.Med., 7, 48 available from: PM:19758442
Streeck, H & Nixon, DF 2010. T cell immunity in acute HIV-1 infection. J.Infect.Dis., 202
Suppl 2, S302-S308 available from: PM:20846037
Sugita, K, Hirose, T, Rothstein, DM, Donahue, C, Schlossman, SF, & Morimoto, C 1992.
CD27, a member of the nerve growth factor receptor family, is preferentially expressed on
CD45RA+ CD4 T cell clones and involved in distinct immunoregulatory functions.
J.Immunol., 149, (10) 3208-3216 available from: PM:1358967

297
Surh, CD & Sprent, J 2008. Homeostasis of naive and memory T cells. Immunity., 29, (6)
848-862 available from: PM:19100699
Switzer, WM, Salemi, M, Shanmugam, V, Gao, F, Cong, ME, Kuiken, C, Bhullar, V, Beer,
BE, Vallet, D, Gautier-Hion, A, Tooze, Z, Villinger, F, Holmes, EC, & Heneine, W 2005.
Ancient co-speciation of simian foamy viruses and primates. Nature, 434, (7031) 376-380
available from: PM:15772660
Taghon, T & Rothenberg, EV 2008. Molecular mechanisms that control mouse and human
TCR-alphabeta and TCR-gammadelta T cell development. Semin.Immunopathol., 30, (4)
383-398 available from: PM:18925397
Takeda, S, Rodewald, HR, Arakawa, H, Bluethmann, H, & Shimizu, T 1996. MHC class II
molecules are not required for survival of newly generated CD4+ T cells, but affect their
long-term life span. Immunity., 5, (3) 217-228 available from: PM:8808677
Tan, JT, Dudl, E, LeRoy, E, Murray, R, Sprent, J, Weinberg, KI, & Surh, CD 2001. IL-7 is
critical for homeostatic proliferation and survival of naive T cells. Proc.Natl.Acad.Sci.U.S.A,
98, (15) 8732-8737 available from: PM:11447288
Tanchot, C, Lemonnier, FA, Perarnau, B, Freitas, AA, & Rocha, B 1997. Differential
requirements for survival and proliferation of CD8 naive or memory T cells. Science, 276,
(5321) 2057-2062 available from: PM:9197272
Taylor, BS, Sobieszczyk, ME, McCutchan, FE, & Hammer, SM 2008. The challenge of HIV-
1 subtype diversity. N.Engl.J.Med, 358, (15) 1590-1602 available from: PM:18403767
Tchilian, EZ, Dawes, R, Ramaley, PA, Whitworth, JA, Yuldasheva, N, Wells, RS, Watera, C,
French, N, Gilks, CF, Kunachiwa, W, Ruzibakiev, R, Leetrakool, N, Carrington, CV,
Ramdath, DD, Gotch, F, Stephens, HA, Hill, AV, & Beverley, PC 2002. A CD45
polymorphism associated with abnormal splicing is absent in African populations.
Immunogenetics, 53, (10-11) 980-983 available from: PM:11862398
Terry, LA, Brown, MH, & Beverley, PC 1988. The monoclonal antibody, UCHL1,
recognizes a 180,000 MW component of the human leucocyte-common antigen, CD45.
Immunology, 64, (2) 331-336 available from: PM:2455685
Tesselaar, K, Arens, R, van Schijndel, GM, Baars, PA, van, d, V, Borst, J, van Oers, MH, &
van Lier, RA 2003. Lethal T cell immunodeficiency induced by chronic costimulation via
CD27-CD70 interactions. Nat.Immunol., 4, (1) 49-54 available from: PM:12469117
Tilton, JC & Doms, RW 2009. Entry inhibitors in the treatment of HIV-1 infection. Antiviral
Res. available from: PM:19683546
Torimoto, Y, Rothstein, DM, Dang, NH, Schlossman, SF, & Morimoto, C 1992. CD31, a
novel cell surface marker for CD4 cells of suppressor lineage, unaltered by state of activation.
J.Immunol., 148, (2) 388-396 available from: PM:1345920
Tough, DF, Sun, S, Zhang, X, & Sprent, J 1999. Stimulation of naive and memory T cells by
cytokines. Immunol.Rev., 170, 39-47 available from: PM:10566140

298
Turner, BG & Summers, MF 1999. Structural biology of HIV. J.Mol.Biol., 285, (1) 1-32
available from: PM:9878383
UNAIDS 2002, Paediatric HIV
infection and AIDS.
UNAIDS 2008, Report on the Global AIDS Epidemic, UNAIDS, Geneva.
van Rossum, AM, Scherpbier, HJ, van Lochem, EG, Pakker, NG, Slieker, WA, Wolthers,
KC, Roos, MT, Kuijpers, JH, Hooijkaas, H, Hartwig, NG, Geelen, SP, Wolfs, TF, Lange, JM,
Miedema, F, & de, GR 2001. Therapeutic immune reconstitution in HIV-1-infected children
is independent of their age and pretreatment immune status. AIDS, 15, (17) 2267-2275
available from: PM:11698700
Veazey, RS, DeMaria, M, Chalifoux, LV, Shvetz, DE, Pauley, DR, Knight, HL, Rosenzweig,
M, Johnson, RP, Desrosiers, RC, & Lackner, AA 1998. Gastrointestinal tract as a major site
of CD4+ T cell depletion and viral replication in SIV infection. Science, 280, (5362) 427-431
available from: PM:9545219
Veazey, RS, Lifson, JD, Pandrea, I, Purcell, J, Piatak, M, Jr., & Lackner, AA 2003. Simian
immunodeficiency virus infection in neonatal macaques. The Journal of Virology, 77, (16)
8783-8792 available from: PM:12885897
Vergis, EN & Mellors, JW 2000. Natural history of HIV-1 infection. Infect.Dis.Clin.North
Am., 14, (4) 809-8vi available from: PM:11144640
Viola, A, Schroeder, S, Sakakibara, Y, & Lanzavecchia, A 1999. T lymphocyte costimulation
mediated by reorganization of membrane microdomains. Science, 283, (5402) 680-682
available from: PM:9924026
Violari, A, Cotton, MF, Gibb, DM, Babiker, AG, Steyn, J, Madhi, SA, Jean-Philippe, P, &
McIntyre, JA 2008. Early antiretroviral therapy and mortality among HIV-infected infants.
N.Engl.J.Med., 359, (21) 2233-2244 available from: PM:19020325
von Andrian, UH & Mempel, TR 2003. Homing and cellular traffic in lymph nodes. Nat
Rev.Immunol., 3, (11) 867-878 available from: PM:14668803
Vrisekoop, N, van, GR, de Boer, AB, Otto, SA, Borleffs, JC, Steingrover, R, Prins, JM,
Kuijpers, TW, Wolfs, TF, Geelen, SP, Vulto, I, Lansdorp, P, Tesselaar, K, Borghans, JA, &
Miedema, F 2008. Restoration of the CD4 T cell compartment after long-term highly active
antiretroviral therapy without phenotypical signs of accelerated immunological aging.
J.Immunol., 181, (2) 1573-1581 available from: PM:18606713
Wagner, D 2006. Re-shaping the T cell repertoire: TCR editing and TCR revision for good
and for bad. Clinical Immunology, 123, (1) 1-6
Wainberg, MA 2003. HIV resistance to nevirapine and other non-nucleoside reverse
transcriptase inhibitors. J.Acquir.Immune.Defic.Syndr., 34 Suppl 1, S2-S7 available from:
PM:14562852

299
Wallace, DL, Zhang, Y, Ghattas, H, Worth, A, Irvine, A, Bennett, AR, Griffin, GE, Beverley,
PC, Tough, DF, & Macallan, DC 2004. Direct measurement of T cell subset kinetics in vivo
in elderly men and women. J.Immunol., 173, (3) 1787-1794 available from: PM:15265909
Wallace, M, Waterman, PM, Mitchen, JL, Djavani, M, Brown, C, Trivedi, P, Horejsh, D,
Dykhuizen, M, Kitabwalla, M, & Pauza, CD 1999. Lymphocyte activation during acute
simian/human immunodeficiency virus SHIV(89.6PD) infection in macaques. The Journal of
Virology, 73, (12) 10236-10244 available from: PM:10559340
Wallis, RS, Kalayjian, R, Jacobson, JM, Fox, L, Purdue, L, Shikuma, CM, Arakaki, R,
Snyder, S, Coombs, RW, Bosch, RJ, Spritzler, J, Chernoff, M, Aga, E, Myers, L, Schock, B,
& Lederman, MM 2003. A study of the immunology, virology, and safety of prednisone in
HIV-1-infected subjects with CD4 cell counts of 200 to 700 mm(-3).
J.Acquir.Immune.Defic.Syndr., 32, (3) 281-286 available from: PM:12626887
Wang, X, Rasmussen, T, Pahar, B, Poonia, B, Alvarez, X, Lackner, AA, & Veazey, RS 2007.
Massive infection and loss of CD4+ T cells occurs in the intestinal tract of neonatal rhesus
macaques in acute SIV infection. Blood, 109, (3) 1174-1181 available from: PM:17047153
Warren, HS & Skipsey, LJ 1991. Loss of activation-induced CD45RO with maintenance of
CD45RA expression during prolonged culture of T cells and NK cells. Immunology, 74, (1)
78-85 available from: PM:1834549
Weichold, FF, Bryant, JL, Pati, S, Barabitskaya, O, Gallo, RC, & Reitz, MS, Jr. 1999. HIV-1
protease inhibitor ritonavir modulates susceptibility to apoptosis of uninfected T cells.
J.Hum.Virol., 2, (5) 261-269 available from: PM:10551732
Weiss, A. & Samelson, L. E. 2003, "T-Lymphocyte Function," In Fundamental Immunology,
5 ed. W. E. Paul, ed., pp. 321-364.
WHO. The top 10 causes of death. WHO media centre . 2009.
Ref Type: Online Source
Williams, SA & Greene, WC 2007. Regulation of HIV-1 latency by T-cell activation.
Cytokine, 39, (1) 63-74 available from:
http://www.sciencedirect.com/science/article/B6WDF-4P7FCWN-
1/1/df87876b8ac6213c9840ed2c78652b77
Wu, Y & Marsh, JW 2003. Gene transcription in HIV infection. Microbes.Infect., 5, (11)
1023-1027 available from: PM:12941394
Yamashita, M & Emerman, M 2006. Retroviral infection of non-dividing cells: old and new
perspectives. Virology, 344, (1) 88-93 available from: PM:16364740
Yerly, S, Gunthard, HF, Fagard, C, Joos, B, Perneger, TV, Hirschel, B, & Perrin, L 2004.
Proviral HIV-DNA predicts viral rebound and viral setpoint after structured treatment
interruptions. AIDS, 18, (14) 1951-1953 available from: PM:15353981
Zanchetta, M, Walker, S, Burighel, N, Bellanova, D, Rampon, O, Giaquinto, C, & de, RA
2006. Long-term decay of the HIV-1 reservoir in HIV-1-infected children treated with highly
active antiretroviral therapy. J.Infect.Dis., 193, (12) 1718-1727 available from: PM:16703516

300
Zaunders, JJ, Kaufmann, GR, Cunningham, PH, Smith, D, Grey, P, Suzuki, K, Carr, A, Goh,
LE, & Cooper, DA 2001. Increased turnover of CCR5+ and redistribution of. J.Infect.Dis.,
183, (5) 736-743 available from: PM:11181150
Zeitz, M, Ullrich, R, Schneider, T, Schieferdecker, HL, & Riecken, EO 1994. Cell
differentiation and proliferation in the gastrointestinal tract with respect to the local immune
system. Ann.N.Y.Acad.Sci., 733, 75-86 available from: PM:7978905
Zhu, J, Yamane, H, & Paul, WE 2010. Differentiation of effector CD4 T cell populations (*).
Annu.Rev.Immunol., 28, 445-489 available from: PM:20192806
Ziegler, SF, Ramsdell, F, & Alderson, MR 1994. The activation antigen CD69. Stem Cells,
12, (5) 456-465 available from: PM:7804122


![National Horticulture Mission - midh.gov.inmidh.gov.in/technology/IPM-GUAVA-Revised-Sept2011.pdf · Polychaeton sp., Leptoxyphium sp. and Conidiocarpus sp.] Symptoms: Sooty mould](https://static.fdocuments.in/doc/165x107/5d5aa06f88c99373678b4b4c/national-horticulture-mission-midhgov-polychaeton-sp-leptoxyphium-sp.jpg)