'T ACCESSION NO. 3. RECIPIENT'S CATALOG … selection test bias 11 Advancement 17 Job performance 25...
123
SECURITY CLASSIFICATION OF THIS PAGE (When Dmta Entered) REPORT DOCUMENTATION PAGE READ INSTRUCTIONS BEFORE COMPLETING FORM 1. REPORT NUMBER CNS 1039 2. GO\'T ACCESSION NO. 3. RECIPIENT'S CATALOG NUMBER 4. TITLE (and Subtitle) Enlisted Selection Strategies 5. TYPE OF REPORT & PERIOD COVERED 6. PERFORMING ORG. REPORT NUMBER 7. AUTHORfa; Robert F. Lockman (over) B. CONTRACT OR GRANT NUMBERr«J NOOO14-68-A-0091 9. PERFORMING ORGANIZATION NAME AND ADDRESS Center for Naval Analyses 1401 Wilson Boulevard Arlington, Virginia 22209 10. PROGRAM ELEMENT, PROJECT, TASK AREA ft WORK UNIT NUMBERS 11. CONTROLLING OFFICE NAME AND ADDRESS Office of Naval Research Department of the Navy Washington, D.C. 20350 12. REPORT DATE September 1974 13. NUMBER OF PAGES 119 U. MONITORING AGENCY NAME S ADDRESSf// dlllerenl from Controlling Ollice) Office of the Chief of Naval Operations (Op96) Department of the Navy Washington, D.C. 20380 15. SECURITY CLASS, (ol this report) Unclassified 15«. DECL ASS! FICATION/DOWN GRADING SCHEDULE 16. DISTRIBUTION STATEMENT (ol this Report) 17. DISTRIBUTION STATEMENT (ol the abstract entered In Block 20, 11 dlllerenl from Report) 18. SUPPLEMENTARY NOTES The work reported here was conducted under the direction of the Center for Naval Analyses and represents the opinion of the Center for Naval Analyses at the time of issue. It does not necessarily represent the opinion of the Department of the Navy except to the extent indicated by the comments of the Chief of Naval Operations. 19. KEY WORDS (Continue on reverse side II necessary and Identity by block number) Class A schools, enlisted personnel, job analysis, performance (human), personnel, personnel development, personnel selection, predictions, promotion (advancement), ratings, recruiting, requirements 20. ABSTRACT (Continue on reverse side If necessary and Identify by block number) The efficiency and fairness of procedures used to select enlisted men for the Navy and for schools, jobs, and advancement are examined. The literature on selection-testing, training, and performance evaluation is reviewed. Ways of increasing personal performance and opportunity are suggested. ^^ 1 JAN 73 1473 EDITION OF 1 NOV 65 IS OBSOLETE S/N 0102-014-6601 I SECURITY CLASSIFICATION OF THIS PAGE (Whan Data Entarad)
Transcript of 'T ACCESSION NO. 3. RECIPIENT'S CATALOG … selection test bias 11 Advancement 17 Job performance 25...
SECURITY CLASSIFICATION OF THIS PAGE (When Dmta Entered)
REPORT DOCUMENTATION PAGE READ INSTRUCTIONS BEFORE COMPLETING FORM
1. REPORT NUMBER
CNS 1039 2. GO\'T ACCESSION NO. 3. RECIPIENT'S CATALOG NUMBER
4. TITLE (and Subtitle)
Enlisted Selection Strategies 5. TYPE OF REPORT & PERIOD COVERED
6. PERFORMING ORG. REPORT NUMBER
7. AUTHORfa;
Robert F. Lockman
(over)
B. CONTRACT OR GRANT NUMBERr«J
NOOO14-68-A-0091
9. PERFORMING ORGANIZATION NAME AND ADDRESS
Center for Naval Analyses 1401 Wilson Boulevard Arlington, Virginia 22209
10. PROGRAM ELEMENT, PROJECT, TASK AREA ft WORK UNIT NUMBERS
11. CONTROLLING OFFICE NAME AND ADDRESS
Office of Naval Research Department of the Navy Washington, D.C. 20350
12. REPORT DATE
September 1974 13. NUMBER OF PAGES
119 U. MONITORING AGENCY NAME S ADDRESSf// dlllerenl from Controlling Ollice)
Office of the Chief of Naval Operations (Op96) Department of the Navy Washington, D.C. 20380
15. SECURITY CLASS, (ol this report)
Unclassified 15«. DECL ASS! FICATION/DOWN GRADING
SCHEDULE
16. DISTRIBUTION STATEMENT (ol this Report)
17. DISTRIBUTION STATEMENT (ol the abstract entered In Block 20, 11 dlllerenl from Report)
18. SUPPLEMENTARY NOTES
The work reported here was conducted under the direction of the Center for Naval Analyses and represents the opinion of the Center for Naval Analyses at the time of issue. It does not necessarily represent the opinion of the Department of the Navy except to the extent indicated by the comments of the Chief of Naval Operations. 19. KEY WORDS (Continue on reverse side II necessary and Identity by block number)
Class A schools, enlisted personnel, job analysis, performance (human), personnel, personnel development, personnel selection, predictions, promotion (advancement), ratings, recruiting, requirements
20. ABSTRACT (Continue on reverse side If necessary and Identify by block number)
The efficiency and fairness of procedures used to select enlisted men for the Navy and for schools, jobs, and advancement are examined. The literature on selection-testing, training, and performance evaluation is reviewed. Ways of increasing personal performance and opportunity are suggested.
^^ 1 JAN 73 1473 EDITION OF 1 NOV 65 IS OBSOLETE S/N 0102-014-6601 I
SECURITY CLASSIFICATION OF THIS PAGE (Whan Data Entarad)

^LUUmTY CLASSIFICATION OF THIS PAGEflVhsn Dmtm Enfred)
7. Contributors: Robert E. May, Capt., USN Hugh E. Carroll, LCdr., USN Peter H. Stoloff Harold H. McKinley, LCdr., USN Marcella Wojdylak Dwight L. Hunter, USN
"rar SECURITY CLASSIFICATION OF THIS PAGE(T»Tl»n Dmia Bntmrmd)

CNS 1039 FOR OFFICIAL USE ONLY
ENLISTED SELECTION STRATEGIES
CENTER FOR NAVAL ANALYSES /f 1401 Wilson Boulevard
Arlington, Virginia 22209
Institute of Naval Studies
By: ROBERT F. LOCKMAN
^ ^
I.
September 19M^
Prepared for:
OFFICE OF NAVAL RESEARCH Department of the Navy Washington, DC. 20350
OFFICE OF THE CHIEF OF NAVAL OPERATIONS (Op96) Department of the Navy Washington, DC. 20380
FOR OFFICIAL USE ONLY 07 103900.00
From; To:
Subj ;
End :
DEPARTMENT OF THE NAVY OFFICE OF THE CHIEF OF NAVAL OPERATIONS
WASHINGTON, D.C. 20350 IN REPLY REFER TO
Ser 96/58659 2 6 APR 1975
Chief of Naval Operations Distribution List
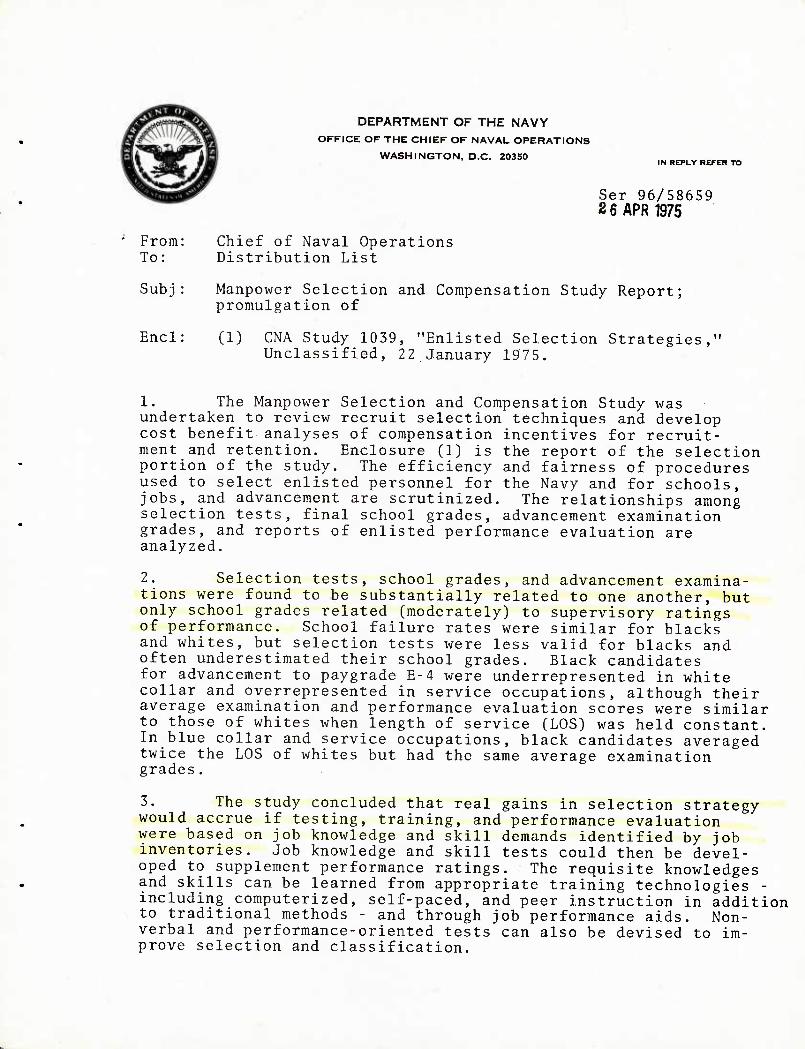
Manpower Selection and Compensation Study Report; promulgation of
(1) CNA Study 1039, "Enlisted Selection Strategies,' Unclassified, 22 January 1975,
1. under cost ment porti used jobs, selec grade analy
The taken benefi and re on of to sel and a
tion t s , and zed.
Manpower to review t analyse tention. the study ect enlis dvanceraen ests, fin reports
Selection an recruit sele
s of compensa Enclosure (1
. The effici ted personnel t are scrutin al school gra of enlisted p
d Compensation Study was ction techniques and develop tion incentives for recruit- ) is the report of the selection ency and fairness of procedures for the Navy and for schools,
ized. The relationships among des, advancement examination erformance evaluation are
2. Se tions were only schoo of perform and whites often unde for advanc collar and average ex to those o In blue CO twice the grades.
lection tests, school gr found to be substantial
1 grades related (modera ance. School failure ra , but selection tests we restimated their school ement to paygrade E-4 we overrepresented in serv amination and performanc f whites when length of liar and service occupat LOS of whites but had th
ades, and advancement examina- ly related to one another, but tely) to supervisory ratings tes were similar for blacks re less valid for blacks and grades. Black candidates re underrepresented in white ice occupations, although their e evaluation scores were similar service (LOS) was held constant, ions, black candidates averaged e same average examination
3- The study concluded that real gains in selection strategy would accrue if testing, training, and performance evaluation were based on job knowledge and skill demands identified by job inventories. Job knowledge and skill tests could then be devel- oped to supplement performance ratings. The requisite knowledges and skills can be learned from appropriate training technologies - including computerized, self-paced, and peer instruction in addition to traditional methods - and through job performance aids. Non- verbal and performance-oriented tests can also be devised to im- prove selection and classification.

Ser 96/58659
4. It was recommended that a project manager be appointed to better direct, coordinate and utilize the personnel research capability which the Navy already has within the Bureau of Naval Personnel, It was also recommended that the personnel data system be significantly upgraded to enable both managers and researchers to improve selection strategies.
5. The data used in the report was not always complete or current for a number of reasons. Consequently, the analyses should be periodically updated to provide a timely picture particularly of the fairness of Navy selection procedures.
6. Enclosure (1) is forwarded.
TT t, HAjTOARD DIRECTMl HAVY IfToGRAM FLAMING
Distribution List: See next page

Ser 96/58659
Distribution List: SNDL Part 1: 21A Fleet Commanders in Chief 24H Fleet Training Commands
SNDL Part II: Al Immediate Office of the Secretary (SO-6) (only) A2A Independent Offices (NAVCOMPT, OPA, CNR) (only) A5 CHNAVPERS (Attn: Pers 2, 2x, 3, 4, 5, 5a, Or,
212b, 524, 6, NEOCS) A6 COMDT MARCORPS Bl ASST SECDEF (M&RA) B5 COMDTCOGARD FF30 NAVMMAC (LANT & PAC) FH7 NAVMEDRSCHINSTITUTE FJ18 NAVPERSPROGSUPPACT FJ82 NAVPERSRANDCEN (3 copies) FJ76 COMNAVCRUITCOM (2 copies) FTl CNET (2 copies & Code 344) FT2 CNATRA FTIO NAVAVSCOLSCOM FT13 NATTC FT3 5 NAVPHIBSCOL FT46 FLEASWTRACEN (PAC & LANT) FT51 FLEMINEWARTRACEN FT54 NAVSUBSCOL FT69 USNA ANNA FT73 NAVPGSCOL FT75 NAVWARCOL
OpNav: OP-09BH, OP-96, OP-099, OP-01, OP-10
Other: Defense Documentation Center (2 copies) Department of the Army (Attn: Adj Gen'l)(6 copies) Department of the Air Force (Attn: AFXODL)(9 copies) Institute for Defense Analyses Human Resource Research Organization The Rand Corporation Stanford Research Institute

TABLE OF CONTENTS
Page
List of tables iii
List of figtires v
Summary vii Objectives vii Selection stages and data vii Nature of selection measures viii
ASVAB viii BTB viii SBTB ^ NVII ix REPE ix Problems with sequential selection testing ix
Selection equity x Class A school x Advancement x
Selection efficiency xi Effectiveness prediction xi Performance prediction xi
Improving selection strategies xii Selection testing xii Training techniques xii Performance measurement xii Job analysis xiii Methodology xiii
Recommendations xiii
Introduction 1 Objectives 1 Data 1 Methods 3
Improvements 3 Innovations 4
Evaluating current selection strategies 5 Composition of selection measures 5
Selection batteries 5 NVII 5 REPE 6
Selection for schools, advancement, and jobs 6 Class A school 6 Group differences 6
-i- Enclosure (1) to CNO Itr Ser 96/58659 dated 26 April 1975.
Page
Correcting selection test bias 11 Advancement 17 Job performance 25 Schools, advancement, and job performance 32
Selection for effectiveness 37 Early studies 37 Navy experience during the draft 38 Need for OFE revalidation 40 Current OFE use and potential savings 41
Improving selection strategies 43 Selection testing 43 Training techniques 45
Marginal personnel 45 Computerized and peer instruction 47 Course design 48 Job aids 49
Performance measurement 50 Job analysis 52 New methodology 53
Conclusions and recommendations 55 Current selection strategies 55
Data 55 Equity 55 Efficiency 55 Effectiveness 56
Improving selection strategies 56 Techniques 56 Resources 56
Recommendations 57
References 58
Appendix A - U. S. Navy first term enlistment process A-1 - A- 5 Appendix B - Composition and use of enlisted selection measures B-1 - B-28 Appendix C - Class A school regression lines and statistics
for blacks and whites C-1 - C-6
-u-

LIST OF TABLES
Tahie Page
1 Navy enlisted selection stages and data 1 2 Selection data availability 2 3 Distribution of a school samples 7 4 Characteristics and failure rates of a school samples 7 5 Failure rates by education and waiver status 8 6 Inputs, waivers, and failure rates by race and BTB selections . • 9 7 Type of training and BTB validities by race 10 8 Statistics on a school samples 14 9 Estimation of final school grades by school and race 16
10 E-4 candidate population data 18 11 BTB and advancement cycle statistics for E-4 candidates
in 11 ratings 20 12 Median values of advancement variables for ratings by race • • • 21 13 Within-groups correlations among final multiple components
for Caucasians (above diagonal) and non-Caucasians (below diagonal) 23
14 Regression statistics for predicting final multiple from its components for Caucasians and non-Caucasians in 11 selected ratings 23
15 Empirical contributions and policy weights of components of final multiple for E-4 candidates in 11 selected ratings. 24
16 Within-groups correlations among BTB and advancement variables 25
17 Significant correlations among BTB scores, advancement exam grades, and REPE performance evaluations by ratings and race when LOS is held constant 26
18 Background and BTB data for E-4/5 sample 27 19 Occupational distribution of E-4/5 sample 28 20 Comparative distributions of three job performance measures • 29 21 Correlations of BTB and education with comparison and paygrade 31 22 Significant correlations of BTB scores and education with
comparison and pay grade criteria 33 23 Correlations of BTB, FSG, advancement exam, and REPE by
rating 35 24 Median correlations of selection measures for occupational
groups and for all ratings 36 25 Summary of enlisted effectiveness studies 39 26 Savings in men and money assuming 75 percent of recruits
are "satisfactory" after 4 years of service without OFE and OFE validity of . 35 42
-iii-

21
A' -1 B- ■1
B- ■2
Table Page
Average correlations among background and performance measures in Army study 52
Location of enlisted selection information A- 5 ASVAB form I factors and sources of variance B-3 Comparative factor structure of ASVAB form I excluding
coding speed test B-6 B-3 ASVAB form I descriptive statistics for development and
Navy recruit samples B-8 B-4 Factor structure and weights of the parent SBTB tests in
3 samples B-11 B-5 BTB form 7 statistics for FY 1973 male accessions by race .... B-13 B-6 Intercorrelations of BTB form 7 tests for FY 1973 male
accessions by race B-15 B-7 BTB form 7 varimax factors for different samples B-16 B- 8 Best predictors of each BTB test from remaining BTB tests
for FY 1973 male accessions by race B-18 B-9 SBTB, BTB, and ASVAB II composites for rating and school
qualification B-21 B-10 Correlations between ASVAB I and BTB form 7 tests B-22 B-11 Intercorrelations of 15 NVII rating keys B-25 B-12 NVII factors B-26 B-13 Intercorrelations of REPE traits (N = 33, 918) B-27 B-14 REPE trait intercorrelations when general factor removed B-27 C-1 Descriptive statistics and regression tests for 8 A schools C-1 C-2 Unfitted data on HM(GL) school students C-2
•iv-

LIST OF FIGURES
Figure Page
1 First term selection stages and data items vii 2 Regression lines of white and black students for BTB selector score
and final school grade 12 3 Occupational distribution of Caucasian and non-caucasian candidates
for advancement to E-4 19 A-1 Navy enlisted personnel selection process A-3 B-1 Sources contributing to the variance of ASVAB tests B-5 B-2 Sources contributing to the variance of SBTB tests B-lO B-3 Sources contributing to the variance of BTB form 7 tests B-17 B-4 Diagram of correlation between WK and GCT B-22 C-1 HM school (Great Lakes) C-3 C-2 HM school (San Diego) C-3 C-3 DT school (San Diego) C-4 C-4 AMH school C-4 C-5 AMS school C-5 C-6 AZ school C-5 C-7 AV school C-6 C-8 AVI school C-6
-V-

SUMMARY
OBJECTIVES
The Assistant Chief of Naval Personnel for Personnel Planning and Programming asked CNA to review the efficiency and fairness of procedures used to select enlisted personnel for the Navy and for schools, jobs, and advancement. Ways to improve these procedures were to be suggested.
SELECTION STAGES AND DATA
The first-term enlisted selection process typically includes five stages: enlistment, classification into occupations, assignment to Class A Schools or the fleet, advancement, and reenlistment. The data used by the Navy for each stage are shown in figure 1. They include (1) selection test scores and biographical data for enlistment; (2) Basic Test Bat- tery (BTB) and in some cases Navy Vocational Interest Inventory scores for classification; (3) final Class A School grades (FSG) for assignment; (4) Report of Enlisted Performance Evaluation (REPE), advancement examination grade, experience, and Commanding Officer (CO.) recommendation for advancement; and (5) CO. recommendation for reenlistment.
STAGES
ENLISTMENT CLASSIFICATION ASSIGNMENT ADVANCEMENT REENLISTMENT
NRC RTC A-School Fleet
zr -MEAOS
DATA SBTB ASVAB BIGG BTB(6Y0)
BTB NVII
FSG REPE EXAM Experience Co Recomm
Co Recomm
FIG; 1: FIRST TERM SELECTION STAGES AND DATA ITEMS
-vii-

Data was collected from several sources by CNA for all but the reenlistment stage. Unfortunately, it was often incomplete, erroneous, or out of date. Selection test and bio- graphical data was obtained for FY 1973 accessions from the Enlisted Master Tape (EMT) maintained by the Bureau of Naval Personnel. Advancement data for the August 1970 E-4 examination was obtained from the Naval Examining Center, including selection test and biographical data as well as advancement examination grades. Final grades were obtained from the Navy Personnel Research and Development Center (NPRDC) for those Class A Schools in FY 1971-72 that had sufficient numbers of non-whites to permit statistical anal- ysis. Performance data from a previous CNA shipboard survey was used in conjunction with BTB scores obtained from the EMT for the respondents. Finally, the results of a 1964 Navy study that came closest to containing all of the main selection items on a large cohort of men were further analyzed.
NATURE OF SELECTION MEASURES
First, standard statistical techniques were used to analyze the patterns of correla- tions among selection battery tests to permit us to draw conclusions about their content and overlap.
ASVAB
The Armed Services Vocational Aptitude Battery (ASVAB) is used as an alternate to the Navy Basic Test Battery (BTB^ for recruiting and classification. It contains nine tests: word knowledge, arithmetic reasoning, coding speed, mechanical comprehension, space perception, tool knowledge, and automotive/shop/electronics information.
However, ASVAB Form 1 does not measure nine different things. It measures two kinds of aptitude factors: verbal-educational aptitude and practical knowledge of tools, autos, and shop practices. Electronics, mechanical, and spatial tests contain components of both factors, meaning that verbal-educational aptitude is necessary to do well on these tests in addition to knowing their subject matter. Form 1 of this interservice battery was too easy for Navy recruits and inferior to the BTB for predicting final grades in Class A Schools.
BTB
The Basic Test Battery is the mainstay of the enlisted selection and classification pro- gram. Form 7 contains six tests: word knowledge (GCT), arithmetic reasoning (ARI), mechanical (MECH), shop practices (SP), clerical (CLER), and the Electronics Technician Selection Test (ETST). It measures two factors similar to but more precisely than those in ASVAB 1, plus a third factor of clerical speed and accuracy.
-viii-
BTB Form 8 contains tests similar to though shorter than those of BTB Form 7. It was not analyzed, but is presumed to measure the same things as BTB Form 7. The printed instructions for all Form 8 tests are at the sixth grade reading level.
SBTB
The Short Basic Test Battery contains shorter versions of GCT, ART, and MECH tests in the BTB and is used for recruit mental screening. It measures verbal-educational apti- tude and mechanical knowledge, but the former is important in taking the MECH test.
The short and long BTBs measure the same factors for whites and non-whites, though non-whites tend to score somewhat lower on the tests except for CLER.
NVII
The Navy Vocational Interest Inventory (NVII) was designed to measure the interests of men in 15 ratings. Except for the SK, HM, and CS ratings, the interest scores corre- late very highly with each other. This suggests that only four distinct patterns of interests are being measured. However, the NVII is still usefiil for classification on a trial basis because of its standardized nature and the fact that men who are satisfied in their ratings get their highest interest scores for that rating.
REPE
The Report of Enlisted Performance Evaluation (REPE) predominantly assesses a gen- eral impression of a man in the eyes of his supervisor, and each of the five traits it con- tains contributes equally to this impression. Only in a minor way does it assess professional performance and leadership as defined on the report. This partly explains why selection tests, school grades, and advancement examinations generally do not correlate very well with REPE.
Problems with Sequential Selection Testing
"What happens when recruits are selected with the SBTB and later classified with the long BTB? If the short and long batteries correlate . 80 and only those men who score above average on SBTB are enlisted, half of the applicants will faU. Of the surviving half, one out of five will score below average or fail on the long BTB. These are the ones who cause personnel administrators problems if they have been promised school or occupational guarantees on the basis of their short battery scores. This situation can be expected when- ever two kinds of selection measures which are not perfectly correlated are used in sequence for the same purpose. It will happen if the ASVAB and BTB are used in this way. It will not liappen if only one battery is administered.
-IX-

SELECTION EQUITY
Class A School
Evidence of inadvertent selection Was came from a comparison of Class A School final grades (FSG) and E-4 advancement cycle data for blacks and whites. For ei^t A Schools in CY 1971-72 with sufficient numbers of blacks to permit statistical analysis, failure rates were found to be similar for blacks and whites, recruit and fleet inputs, and northerners and southerners. Although failure rates were much higher for non-high school graduate waivers ^hree times the rate of high school graduate non-waivers), the number of such waivers was only 15 percent of the blacks and six percent of the whites. The BTB tests were generally less valid for blacks than for whites.
Selection test bias occurs when a group does better in school than would have been ex- pected from looking at their selection test scores, e.g., when their FSGs predicted from the BTB are lower than their actual FSGs. Where this is the case, selection into school shovdd be made on the basis of predicted FSG, not BTB scores. Test bias could be re- duced and black participation increased without degrading quality of output by lowering the BTB cutting score for blacks to the point where their predicted FSGs equal those of whites at the white cutting score. However, it assumes that other factors pertinent to school success remain imchanged, and race may mask other factors that are not accounted for by simply correlating BTB scores with FSGS. Consequently, three other characteristics of blacks and whites were analyzed: high school graduate versus non- graduate; recruit versus fleet input; and northern versus southern origin. The im- portance of these factors in relation to FSG varied from school to school, but they can result in higher correlations with FSG when used with BTB scores than those attainable with BTB scores alone. Such factors should be investigated in future BTB validation studies.
Advancement
Advancement data for 11 ratings which ranged across the occupational spectrum and had enough blacks in them to permit statistical analysis was analyzed for the August 1970 E-4 advancement cycle. Using U.S. Bureau of the Census occupational classifications, we found for these ratings that:
• Half of the blacks versus two-thirds of the whites were candidates for white collar occupations (AT, ET, HM, RM, SK, and YN)
• About one-fourth of both blacks and whites were candidates for blue collar occupations (EN, EM, MM, and BM)
-X-

• One-fourth of the blacks but very few whites were candidates for the service occupation (CS)
Although occupational differences were evident, there were no differences between blacks and whites in average advancement examination and average performance evaluation (REPE) scores when length of service was held constant. However, in the blue collar and service occupations, black candidates generally averaged twice the length of service and time in rate of whites. In the white collar occupations, such differences were observed only for Storekeepers.
The contributions of the components of the final advancement multiple differed for blacks and whites, and both differed from those specified by policy. Advancement examin- ation scores contributed more for whites than for blacks, while experience factors dis- played the opposite effect. Only the REPE contribution for both groups approximated that specified by policy.
When length of service was held constant, BTB scores related moderately to highly with advancement examination scores for both blacks and whites in all three occupational groups, but neither BTB nor examination scores bore much relationship to REPE.
SELECTION EFFICIENCY
Effectiveness Prediction
In the 1960s, the three military services studied the characteristics of men who sur- vived their first enlistment and were recommended for reenlistment. The similarity of the services' findings was remarkable. The three things that best predicted survival were educational level (by fe.r the best predictor); AFQT, GCT, or a similar test of verbal ability; and age, often curvilinear in that the youngest and oldest did not survive at the rate that others did. The Navy is reanalyzing the original data and looking at recent experience including that of minorities and women. This was facilitated by the newly created Naval Recruiting Command data bank on accessions to the Navy and discharges from recruit training.
Performance Prediction
BTB, FSG, and advancement examination scores are related to one another. Although neither BTB nor advancement examination scores relate to REPE - which is at best a par- tial measure of job performance - BTB has a moderate relationship to pay grade for white and blue collar ratings when length of service is held constant.
Across occupational groups, only FSG relates to REPE, albeit modestly. What BTB, advancement examination scores, and REPE have in common, they share with FSG. Thus, FSG is a key measure of performance in the current enlisted selection system.
-xi-

Advances in enlisted selection strategy will require coordinate improvements in these selection, training, advancement, and performance tools. To this end, a review of the military and civilian research literature suggests some important ideas and techniques that merit consideration or further implementation by Navy personnel managers and researchers.
IMPROVING SELECTION STRATEGIES
Selection Testing
Nonverbal or culture fair paper-and-pencil tests have not proved useful in reducing selection bias. Job sample aptitude tests, on the other hand, have been shown to mini- mize bias and increase selection efficiency. Their development costs can be partially offset by more accurate classification, reduced training time, more efficient job per- formance, and increased job satisfaction.
Training Techniques
Two very promising training techniques have proven to be cost effective in the long run when properly implemented: computer assisted instruction and peer instruction. They have led to economies in training, better student motivation, and enhanced performance when their self-pacing and training-to-mastery procedures are geared to actual job knowl- edges and skills.
Traditional courses are more efficient when they are designed to be performance- oriented, functional in content, and provide immediate feedback on progress toward mastery of course content. The emphasis must be on teaching only what is necessary to perform operational and support job tasks, not on "nice to know" or extraneous material. What should be taught must also be taught well, and the entire training administration must focus on relevancy and instructional proficiency.
Since most training courses are rewritten periodically, the cost of "doing it the old way" can be applied to the development of computerized, peer, and performance-oriented instructional technologies.
Both fully-proceduralized job performance aids that require minimal decision making and advanced decision-making aids have been shown to reduce trainee qualifications and training and maintenance times, while improving job performance.
Performance Measurement
Job performance ratings are useful only if made ty capable performers who evaluate men in comparison with their rating and pay grade peers. Even then, ratings are supple- mentary measures at best. Job knowledge tests are the most valid measures where the
-xii-

use of perceptual, motor, cognitive, and social skills are minimal, but they must test only what is needed for actual job performance. Where such skills are Involved, job sample tests are more valid performance measures. For jobs that include both knowledge and skill factors, both kinds of tests are needed.
Job Analysis
Knowledge of the significant tasks actually performed on jobs is crucial to the design of efficient and effective selection, training, advancement, and performance evaluation procedures. The use of carefully constructed job inventories that are completed by workers themselves has proven to be an economical method that produces quantifiable and reliable information for these purposes.
Methodology
The typical correlational approach to validating selection tests ignores the base rate (proportion who can successfully perform) of aptitudes in the recruit population, the selec- tion ratio (proportion of total input selected), and the organizational gains or losses re- sulting from correct and incorrect personnel decisions. Decision theory takes these factors into account and, using recent advances in psychological scaling to measure utility to the organization, can supplement correlational analysis by producing new insights into the real value of tests for making personnel decisions.
RECOMMENDATIONS
A project manager should be appointed to better direct, coordinate, and utilize the personnel research capability that already exists in the Bureau of Naval Personnel. At the same time, the personnel data system must be upgraded to enable both managers and researchers to improve enlisted selection strategies from the recruitment through the retention stages.
-xui-

INTRODUCTION
OBJECTIVES
With the advent of an all volunteer force, the Navy had given added attention to the pol- icies and procedures used to select recruits for schools and ratings and then for advance- ment and retention. This study (1) reviews and analyzes selection policies, techniques, research, and data, and (2) suggests strategies that might increase personnel performance and effectiveness while affording equal opportunity to recruits and other first-term enlisted personnel.
From an institutional viewpoint, the Navy seeks to get the best man for the job through the selection process. From the individual viewpoint, a person seeks the job he thinks is best for him. Since what is best for the Navy is not necessarily best for the individual, some compromise between these goals is necessary. Savings due to increased personnel effectiveness and performance must be balanced against the costs of selection, so the com- promise is the partial individualization of personnel selection decisions by identifying par- ticular groups of people for whom different selection rules may apply. Thus, this study is a systematic overview of the Navy selection process to identify alternatives that might im- prove the efficiency and equity of enlisted personnel decisions.
DATA
The major stages and data of the Navy enlisted selection process are listed in table 1.
TABLE 1
NAVY ENLISTED SELECTION STAGES AND DATA
Stage Data
Selection Armed Services Vocational Aptitude Battery Short Basic Test Battery- Biographical Data
Classification Basic Test Battery Navy Vocational Interest Inventory
Assignment Class A School final grade
Advancement Advancement examination score Enlisted Performance Evaluation Length of service and time in rate CO recommendation
Reenlistment CO recommendation, including Enlisted Performance Evaluation Pay grade
-1-

Detailed descriptions of the data and procedures for each selection stage are contained in appendix A. We will concentrate on those major components for which sufficient data were available for analysis: The Armed Services Vocational Aptitude Battery (ASVAB), Short Basic Test Battery (SBTB), Basic Test Battery (BTB), final grades in Class A Schools (FSG), advancement examination data, the Report of Enlisted Performance Evaluation (REPE), and biographical data such as race and education. 1
Numerous analyses of selection data have been made by the Naval Personnel Research and Development Center (NPRDC). Most are fragmentary in the sense that the complete range of selection data on individuals is not included in one analysis. The reason for this becomes apparent upon even cursory investigation: there is no readily accessible file or set of files that contains all of the major data elements. The sources and coverage of the data we analyzed are shown in table 2.
r. , ,, ■ - •■ . TABLE 2 ■
SELECTION DATA AVAILABILITY
Source
BuPers Enlisted Master Tape
Naval Examining Center
Naval Personnel R &D Center
Center for Naval Analyses
The Enlisted Master Tape (EMT) contains BTB scores and biographical data, but no school or advancement grades or performance marks. Naval Examination Center (NEC) computer tapes include advancement grades, BTB scores, and performance marks, but not school grades. Class A School grade reports are periodically collated with EMT files by NPRDC for validating BTB against school grades, but the school data file maintained in
Selection Data Date Biog Test School Adv Perf
FY 1973 X X
Aug 1970 X X X X
CY 1964 X X X X CY 1966 X X CY 1971- 72 X X X
Tan 1972 X X X
Technically speaking, the whole process involves only selection and placement decisions. Selection denotes acceptance or rejection, and this occurs at the beginning and end of the first enlistment term. On the other hand, placement denotes assignment of all individuals to one of two or more treatments: to one of several A Schools or to the fleet; to one of several assignments; or to one of the three possibilities at the end of the advancement cycle - pass, pass but not advanced, or fail. In placement, no one is rejected from the Navy as in a selection decision.
-2-

BuPers indicates only if the person passed or failed, not his final grade. If the EMT, school grade, and NEC files were merged for a particular cohort of recruits, performance marks would be missing for those who did not take advancement examinations: this data is located in the individual's service record at his local command. There is also a prob- lem with missing data (particularly BTB scores) for perhaps one-fifth of a given cohort, and with erroneous entries for other data elements. The relatively small number of minority personnel in many schools and ratings also is a problem, requiring grouping of data to achieve sufficient sample sizes for analysis.
Because of these problems, a definitive and complete analysis of the relationships among selection data could not be made. However, different combinations of data can be put together in such a way as to indicate the general magnitude and pattern of relation- ships, and these will be useful in assessing the efficiency and equity of selection decisions.
METHODS
Analyses will focus on personnel performance when current selection procedures are used and if alternate procedures were followed to determine the gains that might result from their use.
Improvements
The major selection tool used by the Navy is the Basic Test Battery (BTB). One of its tests is a predictor of first term survival or "effectiveness, " while various combinations of the tests that maximize the prediction of final school grades (FSG) are used to select men for Class A Schools.
It follows that a measure of the efficiency of this selection strategy should compare the difference between actual and predicted FSGs. If predicted grades are higher than actual grades, students are not performing as well as expected on the basis of their test scores. If predicted grades are lower than actual grades, students are performing better than expected on the basis of their test scores. When observed differences between pre- dicted and actual grades are reduced to zero, school selection strategy is optimized.
Preliminary work has shown that in some A Schools, blacks perform better than ex- pected from their BTB scores, whereas whites perform as expected. Thus, blacks with tests scores below the established BTB cut score could have been selected who would have been as "successful" in A School as whites with higher test scores. This suggests that a more efficient policy for selection to certain A Schools could be instituted.
-3-

The approach can be applied to other stages of the selection process, for example, predicting Report of Enlisted Performance Evaluation (REPE) marks from final school grades for different groups to determine if under- or overprediction exists.
Innovations
Another alternative to current selection procedures involves the search for better measures of aptitude, achievement, and performance. If current job performance eval- uations do not adequately measure what is really necessary to do the job, this is obviously the place to start. The next step is to design training courses that efficiently teach what is immediately necessary to perform the job, taking into consideration the different ways and speeds at which people learn knowledges and skills. Once this is done, initial selec- tion measures that are directly relevant to the specific training and performance meas- ures can be developed.
Because jobs vary widely in their required different knowledges and skills, appro- priately designed selection and training procedures will vary in their content and applica- tion. For example, if a job requires verbal and arithmatic abilities, people should be selected and taught on the basis of these abilities. If a job requires motor and perceptual skills, people should be selected and taught on the basis of demonstrated motor and per- ceptual capabilities, not on the basis of other aptitudes or theoretical knowledge.
The improvement and innovative selection approaches are complementary where the total selection program is geared to actual job performance. If it is not, a search for better measures must be conducted if any real gain in selection strategy is to be made.
-4-

EVALUATING CURRENT SELECTION STRATEGIES
In this section, the relationships among Basic Test Battery scores (BTB), final school grades (FSG), advancement examination grades, and job performance measures will be evaluated for different ratings and groups to determine the efficiency and equity of cur- rent selection procedures.
COMPOSITION OF SELECTION MEASURES
Before these evaluations were made, the internal structure of three selection bat- teries, the Navy Vocational Interest Inventory (NVIl), and the Report of Enlisted Per- formance Evaluation (REPE) were analyzed to determine what they actually measure in contrast to what they purportedly measure. The several composites from the three bat- teries were also compared, and problems inherent in using different batteries for selec- tion and classification were examined. The detailed results of these analyses are contained in appendix B. A summary of the results follows.
Selection Batteries
The six BTB and nine ASVAB tests used for classifying men to Class A schools both reliably measure two aptitude factors: verbal-educational aptitude and mechanical-spatial aptitude. The BTB tests are "purer" measures of these factors than the ASVAB tests, some of which are mixtures of both aptitude factors. The three tests in the short BTB used for recruit screening measure two factors: verbal-educational aptitude and mechan- ical knowledge. The mechanical test is a mixture of both factors. The three selection batteries measure the same factors for white and non-whites, although non-whites on the average score lower than whites on most of the tests.
Because no test is perfectly reliable and similar tests cannot correlate perfectly with one another, the successive use of different batteries for selection and classification will inevitably result in some examinees who pass the first but fail the second battery. The only way to avoid this is to administer only one battery.
NVII
The 15 occupational (rating) scales on the Navy Vocational Interest Inventory measure very similar patterns of interests except for Storekeepers, Hospitalmen, and Commissary- men. They are still useful as a supplement to the selection batteries for classification because they are standardized measures of interest, and men who are satisfied with their rating get their highest interest scores for that rating.
•5-

REPE
The Report of Enlisted Performance Evaluation assesses a general impression of a man in the eyes of his supervisor. Each of the five traits rated on the report contribute equally to this impression. Only in a minor way does REPE evaluate job proficiency and leadership.
With these results in mind, we now turn to the evaluation of current selection strate- gies for enlisted personnel.
SELECTION FOR SCHOOLS, ADVANCEMENT, AND JOBS
Class A School
To determine the efficiency and equity of selection for Class A School, BTB and final grade data from eight schools with sufficient numbers of black students for analysis were obtained from the Navy Personnel Research and Development Center (NPRDC) for CY 1971- 72. Final school grades are averages of grades in knowledge or theory and practical or operations phases of a course. Thus, they are based both on written examinations and skill demonstrations.
Group E)ifferences
The distribution of trainees in these schools by race, education, source, waiver, and pass/fail status is contained in table 3. Althogether, there were nearly 7, 900 whites and 350 blacks.
Failure rates for the total sample are given in table 4. They are about the same for race, source, and geographic area, but dramatically different for high school graduation and waiver status. Non-high school graduates and waivers had failure rates three times greater than those of high school graduates and non-waivers, and this was true for both whites and blacks. However, the inputs of non-high school graduates and waivers were small, about 6 percent and 15 percent, respectively.
Little more than 4 percent of the total input was black, but 42 percent of blacks en- tered school on waivers compared to 14 percent of whites. With regard to source, there was no difference in failure rates between recruit and fleet waivers (about 20 percent each), or between recruit and fleet non-waivers (about 6 percent each).
A waiver allows men with BTB scores below those required for Class A School qualification to enter school. Normally for a recruit 3 standard score points for each test in the BTB selector composite can be waived. For a man with fleet experience, up to 10 standard score points for each test in the composite can be waived. See appendix B for a descrip- tion of the BTB selectors for Class A Schools.
-6-

TABLE 3
DISTRIBUTION OF A SCHOOL SAMPLES
Source
Fleet (1,324)
Recruit (6, 918)
Total
White HSG
(7, 894) Non-HSG
Non-white (348) HSG Non-HSG
(7, 393) Pass Fail
(501) Pass Fail
(331) Pass Fail
(17) Pass Fail Total
Waiver 153 31 23 11 21 3 1 0 243
Non- waiver 900 57 78 4 40 0 2 0 1,081
Waiver 654 153 62 36 96 16 3 5 1,025
Non- Waiver 5,124 321 237 50 147 8 6 0 5,893
6,831 562 400 101 304 27 12 5 8,242
TABLE 4
CHARACTERISTICS AND FAILURE RATES OF A SCHOOL SAMPLES
Group
White Black
HSG Non-HSG
Ret source Fleet source
Non-waivers Waivers
North South
Total
Percent input Percent failure
95.8 8.4 4.2 9.2
93.7 7.6 6.3 20.5
83.9 8.5 16.1 8.0
84.6 6.3 15.4 20.1
67.8 7.8 32.2 9.9
100.0 8.4
-7-

Table 5 shows that the feilure rate of non-high school graduates was about twice that of high school graduates for both non-waivers (14 versus 6 percent) and waivers (37 versus 18 percent). Compared to the total sample failure rate of 8 percent, non-high school grad- uate waivers failed at nearly five times the rate, 37 percent.
TABLE 5
FAILURE RATES BY EDUCATION AND WAIVER STATUS
HSG Non-HSG Pass Fail
Total Pass Fail Pass Fail
Waiver 924 203 (18.0%)
89 52 (36.9%)
1,013 255 (20.1%)
Non-waiver 6,211 386 (5.8%)
589
323 54 (14.3%)
106
6,534 440 (6.3%)
Total 7,135 412 7,547 695 (7.6%) (20.5%)
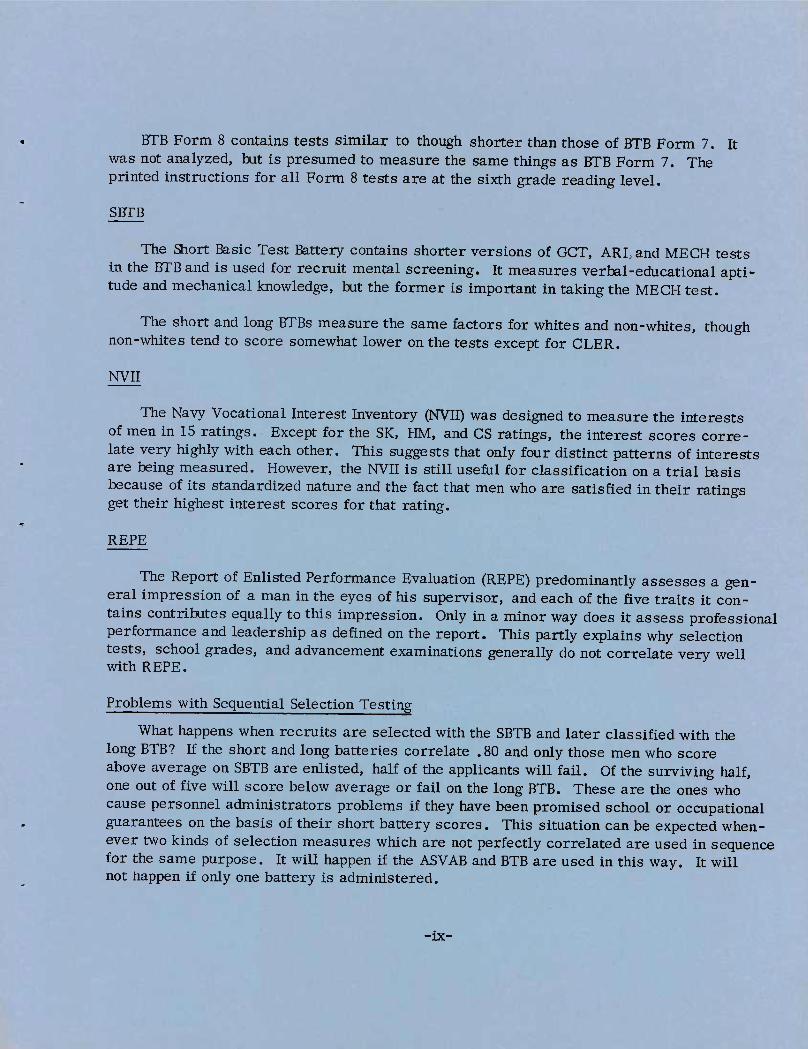
If we group the schools by BTB selectors and the type of training they offer and look at their waiver status and failure rates, the picture in table 6 emerges. The largest per- centage of blacks, 9 percent, were in the medical area (HM and DT), and 36 percent of them were waivers. Nonetheless, their feilure rate was the same as that of the whites. The smallest percentage of blacks, 2 percent, were in the mechanically-oriented aviation schools (AMH, AMS, AVI), and 56 percent entered on waivers. The feilure rate of black waivers also was the same as that of white waivers in these schools. For the total sample, 17 percent of black waivers felled compared to 21 percent of the white waivers, and the majority of both were in the mechanical schools.
The BTB selector validities (product-moment correlations between BTB tests and FSG) by type of school are shown in table 7. For both blacks and whites, corrected validitiesl
Validities were corrected for range restriction because students had been selected for school on the basis of BTB scores. The corrected validities represent what the relation- ships between BTB and school grades would have been in the population from which the students were selected. The corrected validity, R , is computed as follows.
r (E /S ) R = ^^ ^ ^
xy /"^ _ 2 , 2 _ ,„ \2 r + r {E /sy xy xy X X
where E and S are the BTB standard deviations in the population and sample, and r is -^ xy
the uncorrected correlation between selector test and FSG for the sample.
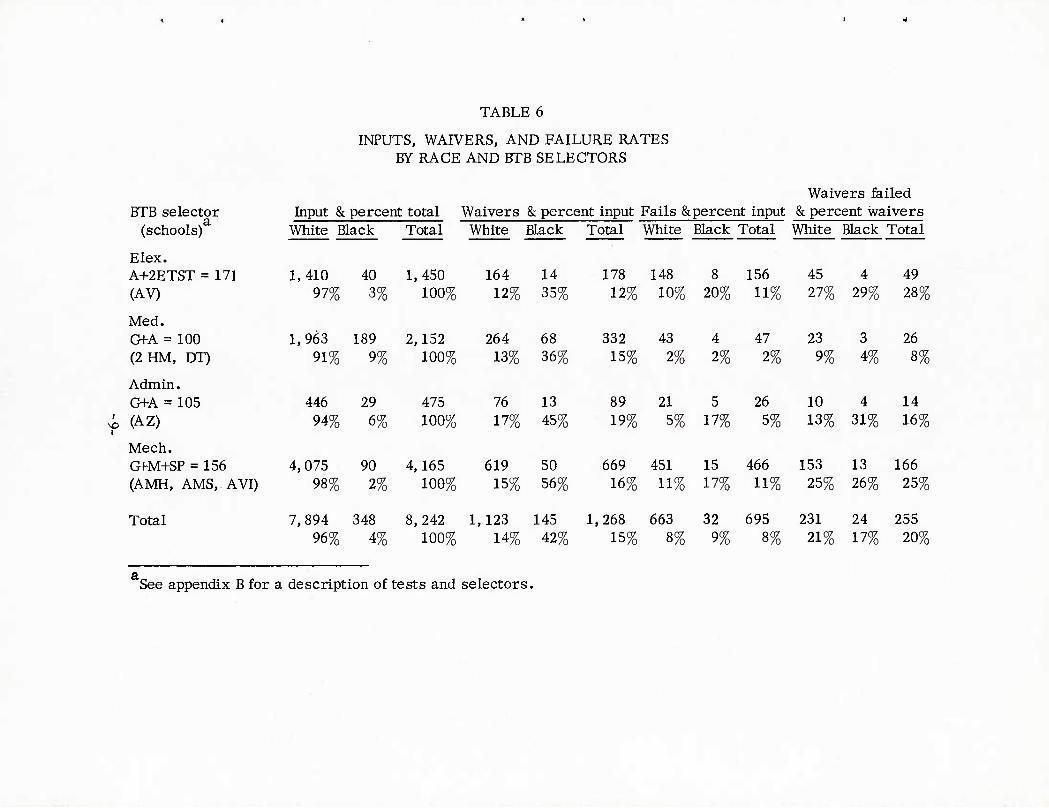
TABLE 6
INPUTS, WAIVERS, AND FAILURE RATES BY RACE AND BTB SELECTORS
BTB selector (schools)
Elex. A+2ETST = 171 (AV)
Med. G+A = 100 (2 HM, DT)
Admin. G+A = 105
^ (AZ) I
Mech. G+M+SP = 156 (AMH, AMS, AVI)
Total
Waivers felled Input & percent total Waivers & percent input Fails & percent input & percent waivers
White BlacF Total White Black Total White Black Total White Black Total
1,410 40 1,450 164 14 178 148 8 156 45 4 49 97% 3% 100% 12% 35% 12% 10% 20% 11% 27% 29% 28%
1,963 189 2,152 264 68 332 43 4 47 91% 9% 100% 13% 36% 15% 2% 2% 25
23 3 26 9% 4% 8%
446 29 475 76 13 89 21 5 26 10 4 14 94% 6% 100% 17% 45% 19% 5% 17% 5% 13% 31% 16%
4,075 90 4,165 619 50 669 451 15 466 153 13 166 98% 2% 100% 15% 56% 16% 11% 17% 11% 25% 26% 25%
7,894 348 8,242 1,123 145 1,268 663 32 695 231 24 255 96% 4% 100% 14% 42% 8% 9% 8% 21% 17% 20%
See appendix B for a description of tests and selectors.

TABLE 7
TYPE OF TRAINING AND BTB VALIDITIES BY RACE
Type of training
Electronics
Medical
Administration
Mechanical
o I
Selector & cut score Schools
A+2ETST = 171 AV
G+A = 100 HM (GL)
HM (SD)
DT (SD)
GfA = 105 AZ
G+M+SP = 156 AMH
AMS
AVI
BTB selector validity Number uncorrected corrected
Black White Black White Black White
•40 1,410 .36 .51 .21 .58
95 825 .47 .68 .64 .78
39 764 .37 .64 .61 .76
SS 374 .22 .53 .42 .66
29 446 .49 .57 .80 .70
ii 617 .00 .46 .00 .65
11 725 .12 .36 .24 .53
65 2,733 .32 ,39 .39 .57
are quite high for the medical and administration schools (.64 and .78), both of which use a Of A selector. For the mechanical schools, validities are high for the whites (.53 to .65) and moderate for the blacks (.39) in the one school with sufficient sample size, AVI. For the electronics (Avionics) school, validities are moderate for the white (. 58) and slight for the blacks (.21).
Now we turn to an analysis of inadvertent BTB test bias in selecting blacks and whites for these A Schools.
Correcting Selection Test Bias
The feet that blacks on the average score lower than whites on the BTB tests, coupled with a concern for equal opportunity in the Navy, has given rise to investigations of possible test bias and corrective actions to eliminate discrimination in the use of tests.
Numerous general guidelines on the use of tests for selection purposes have been written, and various definitions of test bias have been proposed in the literature. We will consider that test bias exists when final school grades (FSG) predicted from BTB selector tests differ from actual FSGs for a particular group of students (reference 1).
To correct for test bias, we must first identify it. For example, data from an A School on BTB selector scores and FSG by race for a sufficient sample size was used to develop the regression lines plotted for blacks and whites in figure iJ- These regression lines can be used to predict FSGs from BTB selector scores. The regression equation used operationally for school selection is based mostly on white data. But if separate re- gression lines for the two racial groups are statistically different, the test is biased. Then there exists the potential for discrimination in its use both to qualify men for entrance into a school and select men for a school in a competitive situation. For a given BTB selector score, it is imperative that the difference in predicted FSG for each group be taken into consideration when making assignments of individuals from these two groups. If this is not done, equal opportunity is not being afforded to individuals of equal potential.
In figure 2, the selector score for entrance into this A School is a composite of two BTB test scores equalling 100. Using this same qualifying score for both groups, we see that the predicted FSG for a white candidate (76) is below that of a black candidate (79). If the black and white candidates are being afforded equal opportunity for entrance based on potential, both should have the same predicted FSG.
In figure 2 and appendix C, regression lines are based on the final grades of graduates and the cumulative grade averages of disenrollees at the time of disenrollment.
■II-

93 -
91 -
89 -
• •
87 - • X
• X X • X
• • X
85 - • X
• X • X
• • X
"o O
83
81
79
77
-
• X • X
' • X • • X
• X • X
• X • • X
• X • XX
(0 c i
• • •
•
1 X X
X X
t • 1 f • X
<
75 ^ • X • X
• • X • X
73 - X X
X
(
i <^^
71 - X
X X
• Blacks
69 - ^ Whites
67 -
65 I 1 1 1 1 1 \ 1 \ 1 l_l 85 88 91 94 97 100 103 106 109 112 115 118 121 124
BTB selector score Note: See table C-2 in App, C for unfitted data.
FIG. 2: REGRESSION LINES OF WHITE AND BLACK STUDENTS FOR BTB SELECTOR SCORE AND FINAL SCHOOL GRADE
-12-

Given that the test is biased, what can be done to prevent it from inadvertently being used in a discriminatory manner? In this example, whites who have a predicted FSG of 76 are admitted to the school. Blacks who have the same predicted FSG should also be admitted. Thus, a black with a BTB selector score of 94 should be qualified to enter this school. This not only accords equal opportunity based on predicted performance, but also increases the percentage of blacks eligible to attend the school.^
Appendix C contains the regression lines for blacks and whites for eight A Schools and a table of descriptive statistics and regression tests for each school. Table 8 lists the schools, sample sizes, and increases in the percentage of black eligibles that could be realized without degrading required quality of output in five of the eight schools where sig- nificant differences in black and white regression statistics were found.
There is the possibility of creating greater inequities if adjustments in a selection strategy are made without understanding the underlying reasons for doing so. One prob- lem with the current A School strategy is that only BTB scores are used to predict FSG. We have shown instances where the BTB tests are biased and how information on racial group membership might be used to help correct this bias. A necessary assumption here is that all other fectors remain unchanged. In our cases, race could be masking other fac- tors which are not accounted for by present selection strategy. ^ If these factors could be identified, a more efficient and equitable selection strategy could be developed.
To determine what factors were being masked by the race variable, the relation- ships between FSG, BTB, and three other fectors available on individuals before A School assignment were investigated:
• education -- high school or non-high school graduate
• area -- from a northern or southern state
• source -- entered A School right after recruit training or after fleet experience.
In a study of men who attended 98 A Schools between January 1968 and January 1971, 95 percent of those with substandard BTB scores were graduated compared to 99 percent of those with qualifying scores (reference 2).
2 Using a "race" dummy variable as part of the FSG prediction equation would eliminate the bias to the extent that blacks would receive "bonus points" if the regression coef- ficient was positive and significant.
■13-

N
TABLE 8
STATISTICS ON A SCHOOL SAMPLES
8 Schools B W
AV 40 1,410
HM (GL) 95 825
HM (SD) 39 764
DT (SD) 55 374
AZ 29 446
AMH 14 617
AMS 11 725
AVI 65 2,733
Selector & K qualifying score lowered for blacks
qualifying score
New score
156
% eligible Old New
A+2ETST = 171 1 - 8 (ETST min. 55)
G+A = 100 94 17-30
G+A = 100 96 17-27
G+A = 100 98 17-20
G+A =105 - - - - .
G+M+SP = 156 - m
G+M+SP = 156 - -
G+M+SP = 156 149 9-17
G is the GCT, A is the ARI, M is the MECH, and SP is the Shop Practices test. For a more detailed description of the tests and selectors, see appendix B.
-14-

The specific results were derived from a function of the form:
FSG = bp + bj BTB + b^Area + b^ Source + b Education
where
FSG = raw final school grade
BTB = basic test battery cumulative selector score for entry into the A School
Area = dummy variable with a value of 1 for northern states (according to Bureau of the Census definition) and 2 for all other states
Source = dummy variable with a value of 1 for inputs from recruit training and 2 for all others
Education = dummy variable with a value of 1 for high school graduates and 2 for all others (non-high school graduates).
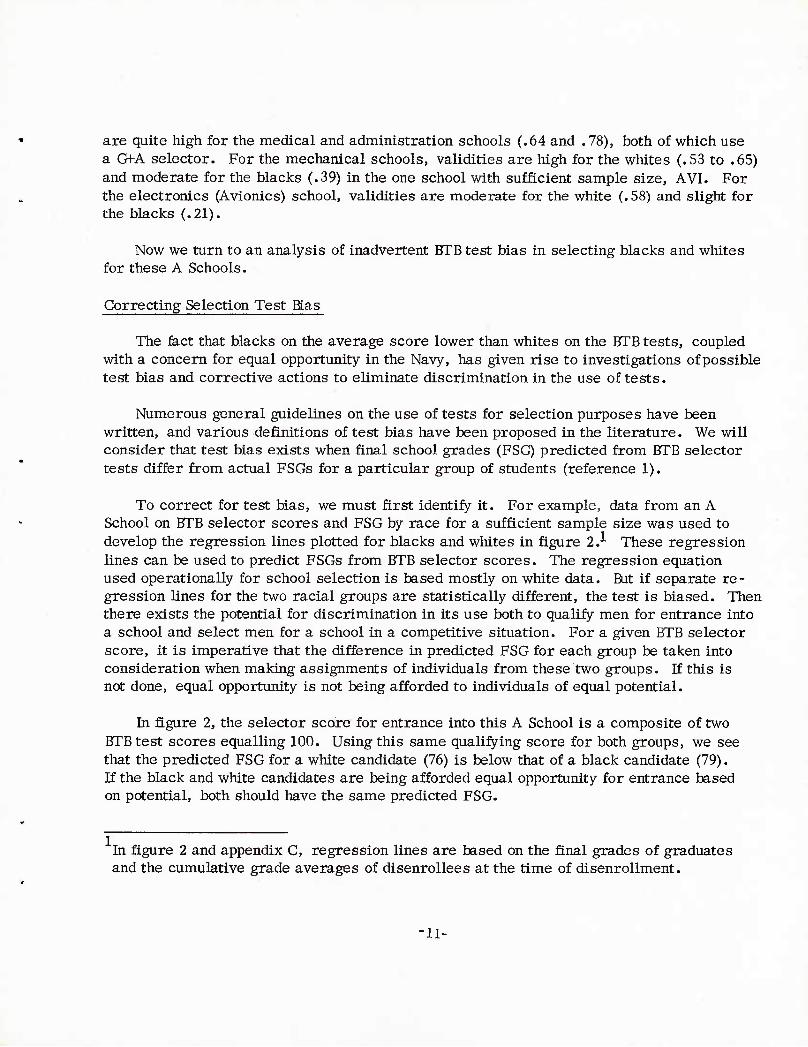
Since there was reason to beheve that the slopes of the regression lines for blacks and whites were different, separate multiple regression analyses were made for blacks and whites. This was further justified by the fact that in several schools blacks and whites also differed statistically on the other independent variables. 1 The results are pre- sented in table 11. hi general, the area (b^) variable is not significant. Regarding the
source (b^) and education (b^) variables, indications are that for a given BTB selector
score FSG is higher for fleet inputs and high school graduates.
Given a BTB selector score, the coefficients in table 9 can be used to predict FSG corrected for differences in area, source, and education. The coefficients vary between schools and thus would have to be developed and monitored by school.
Even though predicted FSG is a superior method of assigning individuals to A Schools, there may be reluctance to using different selector scores for different groups. One way to overcome this reluctance v/ould be to withhold BTB scores from a man's service record, and supply instead his predicted FSG for all schools for which he is qualified. These pre-' dieted grades would then be the basis for school selection.
In summary, the Navy presently uses a selection strategy that employs BTB qualifying scores as the main criterion for entry into Class A Schools. This strategy results in selec- tor test bias for some schools, hi addition to BTB scores, other fectors such as race, edu- cation, and source would be used to improve the prediction of FSG and correct for test bias at the same time.
See Chow, G. C, "Tests of Equality between Sets of Coefficients in Two Linear Regres- sions, " Econometrica, July 1960, pp. 591-605.
-15-
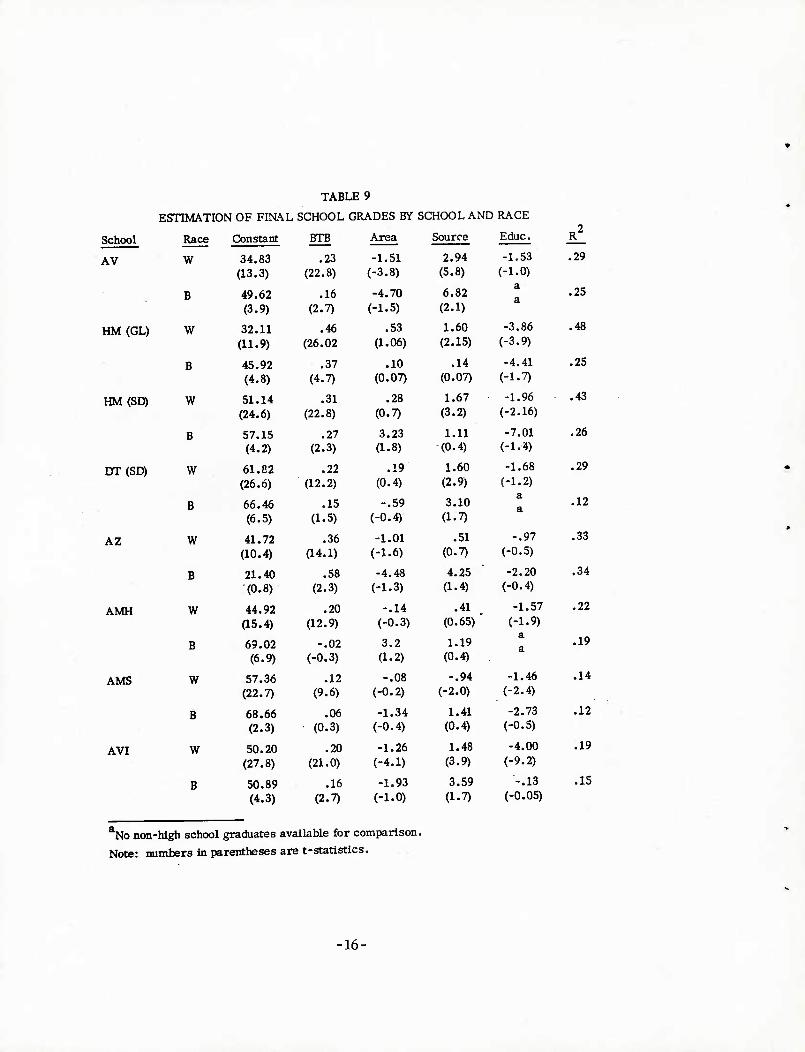
TABLE 9
ESTIMATION OF FINAL SCHOOL GRADES BY SCHOOL AND RACE n
School Race Constant BTB Area Source Educ. R2
AV W 34.83 (13.3)
.23 (22.8)
-1.51 (-3.8)
2.94 (5.8)
-1.53 (-1.0)
.29
B 49.62 (3.9)
.16 (2.7)
-4.70 (-1.5)
6.82 (2.1)
a a
.25
HM (GL) W 32.11 (11.9)
.46 (26.02
.53 (1.06)
1.60 (2.15)
-3.86 (-3.9)
.48
B 45.92 (4.8)
.37 (4.7)
.10 (0.07)
.14 (0.07)
-4.41 (-1.7)
.25
HM(SD) W 51.14 (24.6)
.31 (22.8)
.28 (0.7)
1.67 (3.2)
-1.96 (-2.16)
.43
B 57.15 (4.2)
.27 (2.3)
3.23 (1.8)
1.11 (0.4)
-7.01 (-1.4)
.26
DT(SD) W 61.82 (26.6)
.22 (12.2)
.19 (0.4)
1.60 (2.9)
-1.68 (-1.2)
.29
B 66.46 (6.5)
.15 (1.5)
-.59 (-0.4)
3.10 (1.7)
a a
.12
AZ W 41.72 (10.4)
.36 (14.1)
-1.01 (-1.6)
.51 (0.7)
-.97 (-0.5)
.33
B 21.40 (0.8)
.58 (2.3)
-4.48 (-1.3)
4.25 (1.4)
-2.20 (-0.4)
.34
AMH W 44.92 (15.4)
.20 (12.9)
-.14 (-0.3)
.41 (0.65) ■
-1.57 (-1.9)
.22
B 69.02 (6.9)
-.02 (-0.3)
3.2 (1.2)
1.19 (0.4)
a a
.19
AMS W 57.36 (22.7)
.12 (9.6)
-.08 (-0.2)
-.94 (-2.0)
-1.46 (-2.4)
.14
B 68.66 (2.3)
.06 (0.3)
-1.34 (-0.4)
1.41 (0.4)
-2.73 (-0.5)
.12
AVI W 50.20 (27.8)
.20 (21.0)
-1.26 (-4.1)
1.48 (3.9)
-4.00 (-9.2)
.19
B 50.89 (4.3)
.16 (2.7)
-1.93 (-1.0)
3.59 (1.7)
-.13 (-0.05)
.15
*No non-high school graduates available for comparison. Note: numbers in parentheses are t-statistics.
-16-

Advancement
Data was obtained from the Naval Examining Center on each candidate for advance- ment to E-4 in 11 diverse ratings with sufficient numbers of non-Caucasians (blacks and others) to permit analysis .■'• The data came from the August 1970 examination cycle when special measures of job performance were collected from the candidates' supervisors. Since these special measures were found to be available for only half of the white candi- dates, we reverted to using the regular Report of Enlisted Performance Evaluation that was available for all candidates.
Group Differences
The numbers of candidates in 11 selected ratings are arranged in table 10 by Bureau of the Census Occupational Groupings (reference 3). In two cases, similar ratings with identical BTB selectors were pooled to produce a sufficient number of non-Caucasians for analysis. The occupational groupings show that among these 11 ratings:
• Approximately twice the proportion of Caucasians as non-Caucasians were candidates for the Technical and Professional occupations.
• About the same proportion of both groups were candidates for the three Clerical occupations, although the non-Caucasians were disproportionately concentrated in the Storekeeper (SK) rating.
• About the same proportion of both groups were also candidates for the three Craftsmen occupations and the single Operative occupation, Boatswain's Mate (BM).
• Approximately four times the proportion of non-Caucasians were candidates for the Service occupation, Commissaryman (CS).
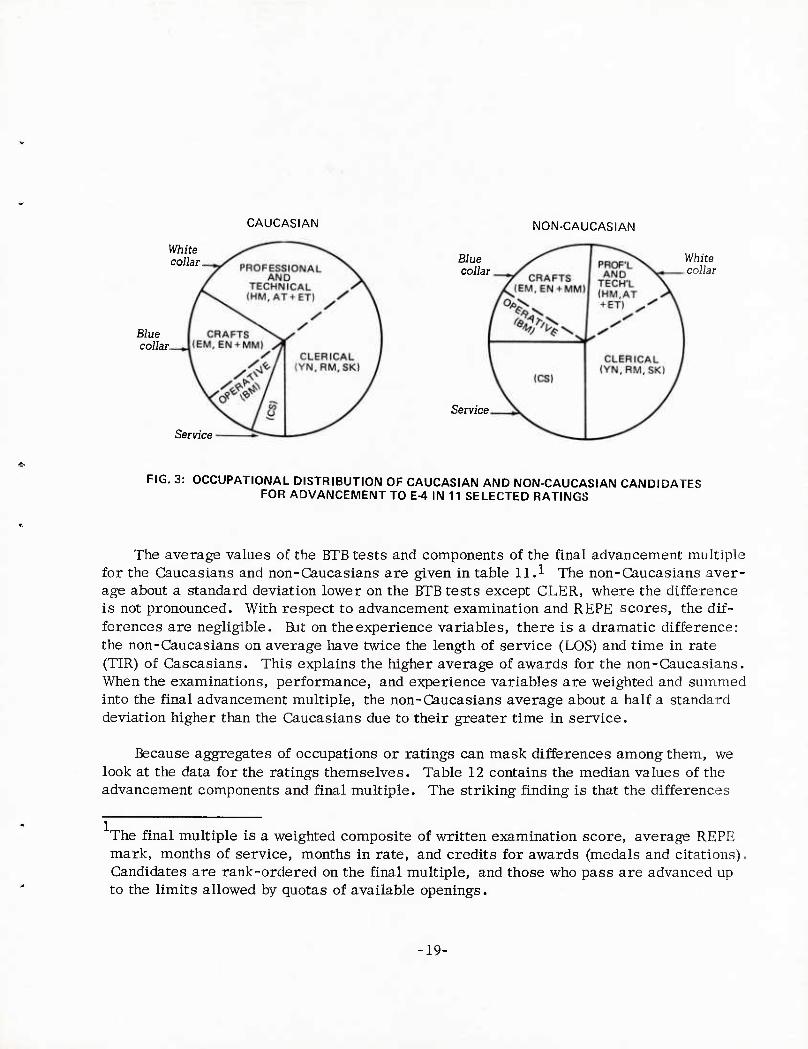
At the highest level of occupational grouping, nearly two-thirds of the Caucasians were candidates for white collar occupations compared to about half of the non-Caucasians, wliile about one-quarter of each group were candidates for blue collar occupations. Only a small fraction of Caucasians were in the Service occupation, compared to nearly one-quarter of the non-Caucasians (see figure 3). Clearly, differences in occupational distribution exist between the two racial groupings in these selected ratings. But what of their BTB, written examination, and Report of Enlisted Performance Evaluation (REPE) scores?
Eligibility to take the E-4 advancement examination requires the local commander's rec- ommendation, completion of stipulated correspondence courses, and a minimum of 6 months' service in pay grade E-3.
-17-

TABLE 10
E-4 CANDIDATE POPULATION DATA
I
Bureau of the Occupational C
Census rrouping
Tech'l &
Prof'l
Ratings
AT+ET
HM
BIB Form 7 selector
Caucasian Percent
No. of tot.
2124 12.0
3321 18.8
Candidates Non-
No.
36 30.8
90
Caucasian Percent of tot.
4.4
11.0 15
Percent of candidates who were
Non- Caucasian
White collar A+2ETST = 171 (min. ETST = 55) G+A = 100
1.7 ,4
2.6
Cler. YN G+C - 100 2366 13.4 56 6.8 ' 2.3
RM G+A = 100 2082 11.8 ■ 35. 1 48 5.9 • 33, 7 2.2
3 SK GfA = 105 1749 9.9. 172 21.0 9.0
Blue collar Crafts. EN+MM
EM
GfM+SP = 156
G+M+SP = 156
2429
975
13.7
5.5 19. 2
61
78
7.4
9.5 16.
2.4 9
7.4
Operative BM None 1589 9.0 78 9.5 4.7
Service — CS G+A = 100 1030 5.8 200 24.4 16.3
Total 17,666 99.9 819 99.9 4.4
See appendix B for a description of the tests and selectors.
t»
CAUCASIAN NON-CAUCASIAN
White collar
Blue collar.
Blue collar
Service
Service
White collar
FIG. 3: OCCUPATIONAL DISTRIBUTION OF CAUCASIAN AND NON-CAUCASIAN CANDIDATES FOR ADVANCEMENT TO E-4 IN 11 SELECTED RATINGS
The average values of the BTB tests and components of the final advancement mu]tiple for the Caucasians and non-Caucasians are given in table 11.1 The non-Caucasians aver- age about a standard deviation lower on the BTB tests except CLER, where the difference is not pronounced. With respect to advancement examination and REPE scores, the dif- ferences are negligible. But on the experience variables, there is a dramatic difference: the non-Caucasians on average have twice the length of service (LOS) and time in rate (TIR) of Cascasians. This explains the higher average of awards for the non-Caucasians. When the examinations, performance, and experience variables are weighted and summed into the final advancement multiple, the non-Caucasians average about a half a standard deviation higher than the Caucasians due to their greater time in service.
Because aggregates of occupations or ratings can mask differences among them, we look at the data for the ratings themselves. Table 12 contains the median values of the advancement components and final multiple. The striking finding is that the differences
The final multiple is a weighted composite of written examination score, average REPE mark, months of service, months in rate, and credits for awards (medals and citations). Candidates are rank-ordered on the final multiple, and those who pass are advanced up to the limits allowed by quotas of available openings.
19-

TABLE 11
BTB AND ADVANCEMENT CYCLE STATISTICS FOR E-4 CANDIDATES IN 11 RATINGS
(17, 666 Caucasians and 819 Non-Caucasians)
Mean
GCT
ARI
MECH
CLER
Cauc.
56.3
55.4
50.8
53.3
Non-Cauc.
44.5
46.0
42.1
49.2
Standard Deviation Cauc.
8.3
7.9
7.6
9.1
Non-Cauc.
8.9
7.5
6.7
10.0
Final Multiple 91.0
Adv. Exam Raw Score 78.3
Average REPE mark 3.55
Length of Service (months) 23.1
Time in Rate (months) 15.0
Awards 0.10
97.0
80.7
3.64
42.6
28.2
0.69
13.0
19.0
0.20
12.7
8.8
0.49
17.6
23.5
0.21
31.3
23.5
1.29
■20-

TABLE 12
MEDIAN VALUES OF ADVANCEMENT VARIABLES FOR RATINGS BY RACE
E-4 Advance. Exam Months Raw Percent REPE Final
sc ore correct avg. score LOS TIR Multiple Occup. Grouping Rating Cauc. Non Cauc. Non Cauc. Non Cauc. Non Cauc. Non Cauc. Non
White Tech'l & AT+ ET 77 71 51 47 3.5 3.5 19 19 12 12 89 85 Collar Profl HM 69 66 46 44 3.6 3.6 20 20 12 12 90 87
Cler'l YN 68 66 45 44 3.6 3.6 22 22 17 14 87 82 RM 81 78 54 52 3.6 3.6 18 19 11 11 90 89 SK 66 70 44 47 3.6 3.7 22 46 15 31 92 106
Blue Crafts. EN + MM 91 75 61 50 3.5 3.6 23 33 14 19 90 88 Collar EM 78 64 52 43 3.5 3.6 23 36 14 29 98 93
1
I— Operative BM 64 63 43 42 3.6 3.6 23 24 14 13 91 90
Service CS 108 113 72 75 3.6 3.8 24 52 15 39 93 110
Based on 150 items designed so that approximately 50 percent of them will be answered correctly on the average.

in LOS and TIR were concentrated in the Service and Craftsmen occupations and in the Storekeeper Clerical occupation. There were no differences in length of service between the Caucasians and non-Caucasians in the Professional and Technical, other Clerical, or Operative occupations. Only in the case of the Craftsmen occupations were there sizeable differences in the median examination score, the Caucasians having the higher average. Few if any differences in REPE existed between Caucasians and non-Caucasians or among ratings.
Final Advancement Multiple Weights
To statistically control differences among ratings and maximize sample size, the within-groups correlations among the five components of the final multiple were calcu- lated for all candidates in the 11 ratings. They are shown in table 13.
For both groups, the advancement examination raw score and REPE do not correlate with one another or with the experience variables (LOS, TIR, and Awards), but they have high correlations with the final multiple. The experience variables correlate fairly highly among themselves, particularly for the non-Caucasians, but they have negligible correla- tions with the final multiple for Caucasians and only moderate ones for the non-Caucasians.
The regression weights (p) for predicting final multiple from all five components were calculated for each group and multiplied by the simple correlations (r) between each com- ponent and the final multiple to ascertain the proportion of the variance (R2) of the final multiple they accounted for. The results are contained in table 14.
As a final step, the f3r weights from table 14 were standardized so that their total would then equal 100. The results are the empirical contributions which are compared with the policy weights in table 15.
Compared to the policy weights, the empirical contributions for both groups are much higher for examination raw score, about the same for REPE, and lower for the experience factors.
For the Caucasians, 70 percent of the final multiple is contributed by exam raw score, about 25 percent by REPE, and virtually nothing by the experience factors. For the non- Caucasians, nearly 60 percent of final multiple is contributed by exam raw score and about 20 percent each by the REPE and experience factors. Consequently, the statistical proper- ties of the final multiple components result in different contributions than those expected from looking at the policy weights. Similar results and more detailed analyses have been reported by NPRDC (reference 4).
1 6r Empirical weight = 100 (-^) .
R'^
-22-

' TABLE 13
WITHIN-GROUPS CORRELATIONS AMONG FINAL MULTIPLE COMPONENTS FOR CAUCASIANS (ABOVE DIAGONAL) AND NON-CAUCASIANS (BELOW DIAGONAL)
Final Exam REPE TIR LOS Awards Multiple
Adv. Exam Raw Score - .' .06 -.06 -.08 -.02 .81
Average REPE Mark .10 -- .09 .02 ,06 .53
Time in Rate -.02 .16 - .60 .30 .16
Length of Service .06 .18 .68 - .39 .10
Awards .10 .20 .50 .64 - .12
Final Multiple .77 .54 .41 .48 .44 -
TABLE 14
REGRESSION STATISTICS FOR PREDICTING FINAL MULTIPLE FROM ITS COMPONENTS FOR CAUCASIANS AND NON-CAUCASIANS
IN 11 SELECTED RATINGS
Caucasians (N=17, 660) Non-Caucasians (N=819) a t* r r jS t* r r
Adv. Exam Raw Score .80 383 .81 .65 .72 108 .77 .55
Average REPE Mark .46 222 .53 .24 .38 57 .54 .21
TIR .11 43 .16 .02 .21 23 .41 .09
LOS Experience .07 26 .10 .01 .18 17 .48 .09
Awards .05 21 .12 .01 .08 9 .44 .04
. R^ = .93 R^ = .98
*t test of significance of P; all are highly significant.
-23-

TABLE 15
EMPIRICAL CONTRIBUTIONS AND POLICY WEIGHTS OF COMPONENTS OF FINAL MULTIPLE FOR E-4 CANDIDATES
IN 11 SELECTED RATINGS
Empiric al Contrib. Policy Cauc. Non-Cauc. Wts.
Adv. Exam Raw Score 70 57 43 Average REPE 26 22 27 TIR
2 ) 9 ) 11 LOS Experience 1 4 8 21 11 Awards 1 '
100 4 '
100 8
100
30
Relationships Among BTB and Advancement E)ata
One of the most pertinent questions that can be asked about the data from the advance- ment cycle is: How do the BTB scores, advancement examination grades, performance evaluations, and length of service relate to one another for the two racial groups? The within-groups correlations are presented in table 16 for the Caucasian and non-Caucasian groups. Correlations that involve BTB tests have been corrected for range restriction due to selection on the basis of BTB scores.
The main conclusions that can be drawn from table 16 are:
BTB, particularly the GCT, correlates positively with advancement examina- tion raw score, for both groups
negligibly with REPE, and negatively with length of service
Advancement examination raw score, REPE, and length of service correlate negligibly with each other for both groups.
GCT is the best single predictor of final multiple for both Caucasians and non-Cascasians. The correlation is moderately high for Caucasians (.43) but slight for non-Caucasians (.11).
The simple correlation of GCT and exam score is practically as high as the multiple correlation of all four BTB tests with exam score.
•24-

TABLE 16
WITHIN-GROUPS CORRELATIONS AMONG BTB AND ADVANCEMENT VARIABLES^
Caucasians (N=17, 666) Non-Caucasians (N^819)
Exam R.S, REPE LOS FM
Exam R.S. REPE LOS FM
GCT .60 -.05 -.45 .43 GCT .47 -.19 -.36 .11
ART .44 .01 -.32 .32 ARI .24 -.04 -.18 .09
MECH .29 .00 -.20 .19 MECH .21 -.07 -.02 .10
CLER .10 .06 -.21 .08 CLER .03 .06 -.17 -.01
LOS -.09 .02 LOS .06 .18
REPE .06 REPE .10
Corrected for range restriction on BTB
Since these results are based on the total groups and may mask different relation- ships for ratings, the nine rating groups were looked at individually. The results are shown in table 17 wherein length of service has been held constant using partial correla- tion technique. Here, BTB selector tests relate positively, and in some cases highly, to advancement examination raw scores for both Caucasians and non-Caucasians in nearly all of the 11 ratings. BTB scores show little relationship to REPE marks, which mainly reflect a supervisor's overall impression of a man. Advancement examination raw scores have small positive relationship to REPE in all but one of the v/hite collar and service oc- cupations for Caucasians, and a moderate positive correlation in two of these six ratings for non-Caucasians. These advancement examinations do exhibit some relationship to REPE marks in jobs where verbal skill is important, but they do not relate to REPE marks in blue collar jobs that involve mainly motor and perceptual skills.
Job Performance
Since the Report of Enlisted Performance Evaluation is not a particularly sensitive or complete measure of job performance, we looked for other measures of job performance to which BTB scores might be related. In late 1971, a carefully drawn sample of 3,115 first-term enlisted men in paygrades E-4 and E-5 aboard two aircraft carriers and 18 destroyers was surveyed for an analysis of the correlates of reenlistment intentions
-25-

TABLE 17
SIGNIFICANT CORRELATIONS AMONG BTB SCORES, ADVANCEMENT EXAM GRADES, AND REPE PERFORMANCE EVALUATIONS BY RATINGS
AND RACE WHEN LOS IS HELD CONSTANT
Correlations when LOS held constant (p^.05) BTB Hl'B, ] Exam R.S. BTB, Perf. Exam R .S., Perf.
Occup. Group Rating Selector Cauc. Non-Cauc. Cauc. Non-Cauc. Cauc. Non-Cauc.
White Tech'l AT+ET A+ .43 — — —
Collar & ETST NA NA NA NA —
Prof'l HM G+ .69 .58 — .33 .16 A .48 .24 — — — —
ClerT YN G+ .46 .69 — — .11 —
C .19 — — — — —
RM Of .56 .49 .17 — .13 .40 A .50 .39 .17 —
to SK G+ .33 .16 — .10 Ox A .29 .32 —
Blue Crafts. EN+MM G+ .57 .27 -.40 —
Collar M+ .55 .62 —
SP NA NA NA NA
EM Of .61 .58 -.27 -.13
SP NA NA NA NA —
Oper. BM None (G) .51 .38 — — — - —
Service CS G+ .20 .45 — -.17 .18 .30 A .18 .27 ■■ ™ ~
... ... ...
NA: Test scores not available.

(reference 5). When the sample members were matched with the FY 1971 Enlisted Master Tape, GCT, ARI, MECH, and CLER scores were found for 87 percent of them, and SP, ETST, SPMT, and RCAT scores for 80 percent of them. The background characteristics and BTB data for the sample are given in table 18.
TABLE 18
BACKGROUND AND BTB DATA FOR E-4/5 SAMPLE
Mean Std. Etev.
22, .8 3, .3
10, .4
.25
.71
.96
.80
.33
.95 59, .7 58, .1 54, .1 52, .8
55, .9 60, .6 56, .0 56, .6
Age 22.8 1.5 Length of Service (years) 3.3 1.0 Months to EAOS 10.4 12.7 Proportion:
E-4 (vs. E-5) CVA (vs. DD) High School graduate A School graduate Married Caucasian
GCT 59.7 7.4 ARI 58.1 7.0 MECH 54.1 7.5 CLER 52.8 8.4
SP 55.9 7.0 ETST 60.6 8.1 SPMT 56.0 9.7 RCAT 56.6 ~ 9.5
The 68 ratings in the sample were grouped into the occupational categories shown in table 19. Ratings listed in the table are those that accounted for at least 10 percent of the men in their respective groupings.
Most of the men joined the Navy in FY 1968 and 1969, a period of high draft pressure, and most were at least high school graduates. Nevertheless, we felt that the quality and nature of the data justified its use for analyzing BTB scores and educational level against two measures of performance collected during the survey.
•27-

TABLE 19
Occupation
White Collar
Blue Collar
Service
OCCUPATIONAL DISTRIBUTION OF E-4/5 SAMPLE
Rating Group
Electronics operators and technicians (AT, ET, AQ, RD, RM, FT, STG, DS)
Clerical and technical (SK, YN, AX, HM, QM, RN, AK)
Electro-mechanical (AM, EM, AE, AD, HT, IC, AS, MR)
Tradesmen (MM, AO, AB, BT, BM, GM, SM, EN)
CS, SH
No. with BTB
869
272
615
676
55
Performance Measures
Two items in the survey questionnaire dealt with the man's evaluation of his own performance: one phrased exactly as the professional performance item on the Report of Enlisted Performance Evaluation (REPE) and the other phrased to elicit a comparison with peers:
70. How do you rate your professional performance? !
A. Extremely effective and reliable, and work well on my own '
B. Highly effective and reliable, and need only limited supervision
C. Effective and reliable, and need occasional supervision
D. Adequate, but need routine supervision
E. Need constant supervision
71. How do you think you compare with other men in the same paygrade who do the same kind of work?
A.I am the best
B. I am better than most of them
C. I am above average
D. I am average
E. Most of them do better than I do -28-
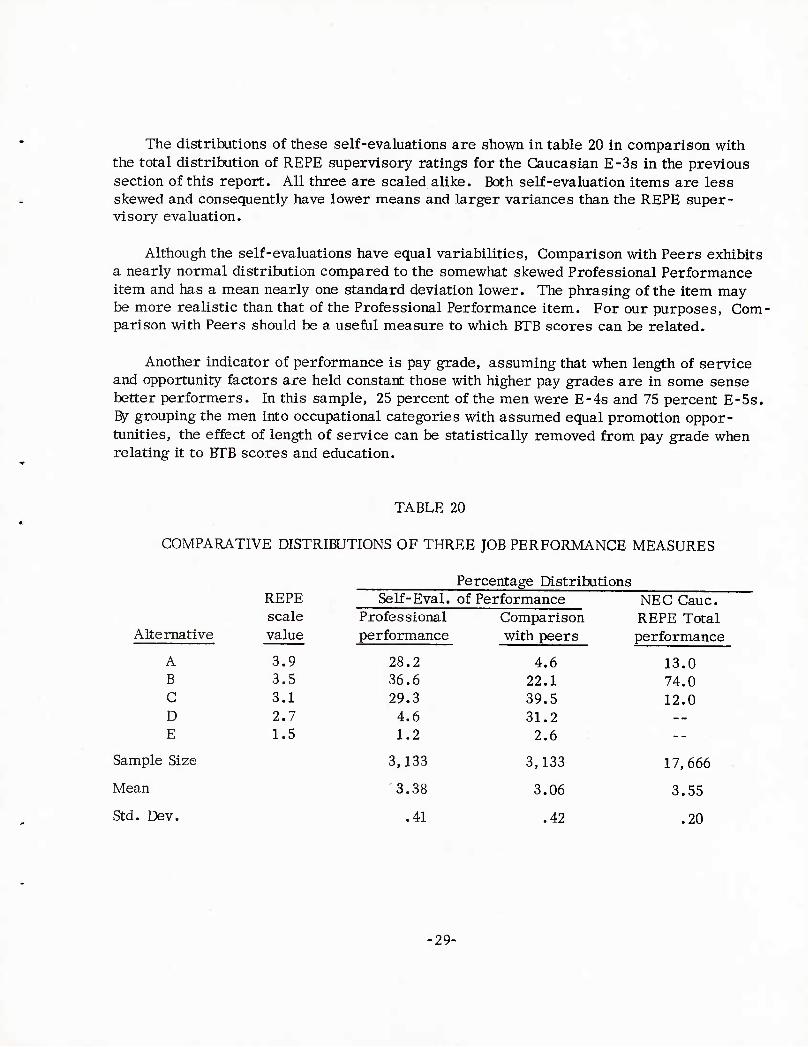
The distributions of these self-evaluations are shown in table 20 in comparison with the total distribution of REPE supervisory ratings for the Caucasian E-3s in the previous section of this report. All three are scaled alike. Both self-evaluation items are less skewed and consequently have lower means and larger variances than the REPE super- visory evaluation.
Although the self-evaluations have equal variabilities, Comparison with Peers exhibits a nearly normal distribution compared to the somewhat skewed Professional Performance item and has a mean nearly one standard deviation lower. The phrasing of the item may be more realistic than that of the Professional Performance item. For our purposes, Com- parison with Peers should be a useful measure to which BTB scores can be related.
Another indicator of performance is pay grade, assuming that when length of service and opportunity factors are held constant those with higher pay grades are in some sense better performers. In this sample, 25 percent of the men were E-4s and 75 percent E-5s, By grouping the men into occupational categories with assumed equal promotion oppor- tunities, the effect of length of service can be statistically removed from pay grade when relating it to BTB scores and education.
TABLE 20
COMPARATIVE DISTRIBUTIONS OF THREE JOB PERFORMANCE MEASURES
Alternative
A B G D E
Sample Size
Mean
Std. Dev.
REPE scale value
3.9 3.5 3.1 2.7 1.5
Percentage Distributions Self-Eval. of Performance
Professional performance
28.2 36.6 29.3 4.6 1.2
3,133
3.38
.41
Comparison with peers
4.6 22.1 39.5 31.2 2.6
3,133
3.06
.42
NEC Cauc. REPE Total performance
13.0 74.0 12.0
17,666
3.55
.20
■29-

Relationships of BTB and Performance
Six BTB tests and educational level were correlated with the Comparison with Peers and pay grade criteria. The BTB Radio Code Aptitude and Sonar Pitch Memory Tests were not used because they apply to so few ratings, and the Services occupational group was dropped because only 55 men in it had BTB scores.
Semipartial correlation was used to remove the effects of pay grade from Comparison, and the effects of length of service from pay grade•'■ (reference 6, p. 83). The correla- tions of the BTB tests with each criterion were corrected for range restriction due to selection. The results are shown in table 21. When interpreting them, the homogeneity of the sample must be kept in mind: only two pay grades (E-4 and E-5) were represented, 96 percent of the sample were at least high school graduates, and 80 percent attended Class A Schools.
There was a_slight correlation between Comparison and pay grade for the four occu- pational groups (r = .16), but practically no relationship between Comparison and length of service (LOS). LOS, as expected, exhibited a moderate correlation with pay grade: the mean correlation for the four groups was .32.
When the effect of pay grade was held constant, the average multiple correlation of Comparison with the BTB tests was slight (.15) and about the same as the correlation be- tween Comparison and pay grade alone. Educational level showed a pattern of relation- ships similar to that of the BTB tests but at a lower level. It added little or nothing to the multiple correlation of BTB with Comparison.
When the effect of LOS was removed, the average multiple correlation of pay grade with the BTB tests was . 41 compared to . 25 for educational level, which again added little to the BTB-pay grade multiple correlation.
In general, then, BTB tests and educational level exhibit small positive relationships to self-evaluations of performance when the effect of pay grade is removed and moderately high positive relationships to pay grade when the effect of length of service is removed.
For example, the correlation between BTB and Pay Grade when LOS is removed from the latter is
_ ^PG, BTB " ^PG, LOS^^BTB. LOS^ ^BTB(PG-LOS) / 2
' ^PG, LOS
-30-

TABLE 21
CORRELATIONS OF BTB AND EDUCATION WITH COMPARISON AND PAYGRADE
Comp. w/effect of PG removed PGw/effect of LOS removed
00
Occupati ional Group
Electronics Oper. & Tech'n
Comp PG
.21
• ~LOS
PG, LOS Bl'B
.13
Educ. BTB & Educ. BTB Educ
BTB & Educ
White Collar
.11 .42 .12 .16 .42 .23 .45
Clerical & Technical .18 .00 .23 .24 .18 .25 .46 .38 .50
Blue Collar
Electro- Mech'l .11 .09 .25 .14 .12 .17 .43 .24 .44
Tradesmen .13 .11 .36 .07 .03 .07 .33 .13 .34
Mean correlation .16 .08 .32 .15 .11 .16 .41 .25 .43
NOTES: (1) r^os_g,„,. ^-^LOS. HTB = ^^"^°- '^Educ.. KTB = "^^"
(2) Correlations involving BTB have been corrected for range restriction of BTB scores.

The relationships of the individual BTB tests to the Comparison and pay grade criteria are contained in table 22. For the two white collar occupations, the BTB tests used as selec- tors for the majority of the ratings show significant relationships with the Comparison cri- terion. This is less true of the two blue collar occupations, where verbal-educational abilities are less important to job performance. For all four occupations, all BTB tests except CLER had moderate positive correlations with pay grade.
In summary, appropriate BTB tests do relate significantly and in some cases sizeably with the performance criteria in this sample, particularly for white collar occupations. These relationships can be explained partly by the facts that (1) recruits are selected into the Navy and classified into Class A Schools on the basis of BTB scores, which are related to final grades in Class A Schools, and (2) both BTB scores and final school grades are related to advancement examination scores, which have the largest single effect on advancement.
Schools, Advancement, and Job Performance
Only one Navy study has looked at the realtionships among all of the major selection variables -- BTB, FSG, advancement examinations, and REPE. It included 3,000 men in 11 different ratings who were beginning students in 19 Class A Schools in 1964 (refer- ence 7). Two years after each man left A School, his REPE and E-4 advancement exam- ination grades were obtained from the Naval Examining Center. The 11 ratings are classified below by Census Bureau occupational groups:
White Collar Technical ET, FT, ST
Professional HM, PH
Clerical CTR, RM, SK, YN
Blue Collar Craftsmen EN, MM
The correlations of ETBwith the other measures could not be corrected for range re- striction, so they understate the actual relationships. The feet that the men entered the Navy in 1964, a period of low draft pressure, makes them somewhat representative of those entering in the current all-volunteer environment, but possible differences between Caucasians and non-Caucasians were not assessed. Indeed, non-Caucasians in 1964 were only 5 percent of total accessions compared to over twice that percentage in 1973, Corre- lations between advancement examination scores and REPE were not given in the report, so they were estimated from data we analyzed earlier.
hi 10 of the schools (for ET, FT, ST, RM, and PH), the academic failure rate was at least ten percent. For these schools, the multiple correlations between BTB tests and
■32-

TABLE 22
SIGNIFICANT CORRELATIONS OF BTB SCQRES AND EDUCATION WITH COMPARISON AND PAY GRADE CRITERIA^
t
CO
Modal - Occup. BTB
Group Selector
White Electronics A+2ETST Collar Oper. &
Tech'n.
Clerical G+A & Tech'l
Blue Electro- G+M+SP Collar Mech'l
Tradesmen GfM-fSP
N
869
272
615
676
Simple correlation Criterion GCT ARI MECH CLER SP ETSTEDUC R
Multiple correlation
Vbls. Included
Comparison Pay grade
Comparison Pay grade
Comparison Pay grade
Comparison Pay grade
.12 .13 • 36 .32 .23
.18 .22 -- .17
.45 .36 .22
" .11 .12 .41 .29 .17
— .07 - .31 .28 .23
.24
.27
.11 .12 .16 ARI. Educ.
.41 .23 .45 ETST, GCT, Educ.
.15 .18 .25 ARI, Educ.
.39 .38 .50 GCT, Educ.
" .11 .12 .17 MECH, Educ. .28 .34 .24 .44 GCT, SP,
Educ, MECH
.17 .28 .13 .34 GCT, ETST, MECH, SP
Statistically the effect of pay grade was removed from Performance, and the effect of LOS was removed from Pay Grade.
Correlations of BTB tests with Performance and Pay Grade were first corrected for range restriction.
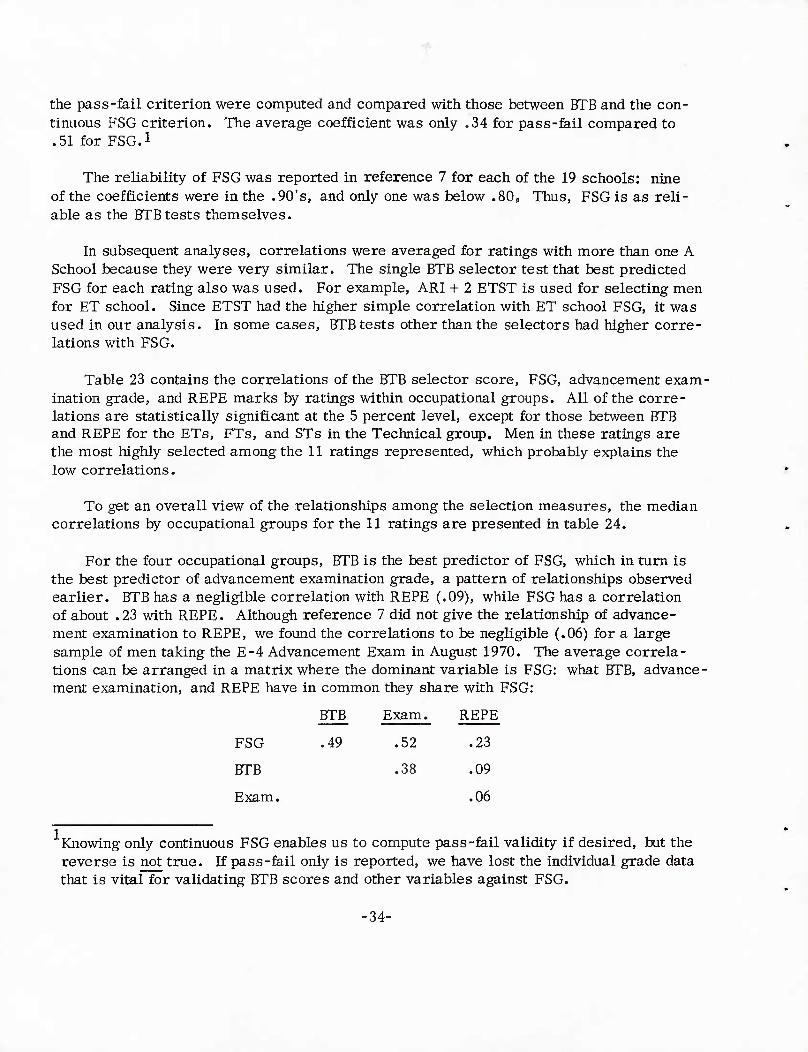
«fr
the pass-fail criterion were computed and compared with those between BTB and the con- tinuous FSG criterion. The average coefficient was only .34 for pass-fail compared to . 51 for FSG. 1
The reliability of FSG was reported in reference 7 for each of the 19 schools: nine of the coefficients were in the .90's, and only one was below .80, Thus, FSG is as reli- able as the BTB tests themselves.
In subsequent analyses, correlations were averaged for ratings with more than one A School because they were very similar. The single BTB selector test that best predicted FSG for each rating also was used. For example, ARI + 2 ETST is used for selecting men for ET school. Since ETST had the higher simple correlation with ET school FSG, it was used in our analysis. In some cases, BTB tests other than the selectors had higher corre- lations with FSG.
Table 23 contains the correlations of the BTB selector score, FSG, advancement exam- ination grade, and REPE marks by ratings within occupational groups. All of the corre- lations are statistically significant at the 5 percent level, except for those between BTB and REPE for the ETs, FTs, and STs in the Technical group. Men in these ratings are the most highly selected among the 11 ratings represented, which probably explains the low correlations.
To get an overall view of the relationships among the selection measures, the median correlations by occupational groups for the 11 ratings are presented in table 24.
For the four occupational groups, BTB is the best predictor of FSG, which in turn is the best predictor of advancement examination grade, a pattern of relationships observed earlier. BTB has a negligible correlation with REPE (.09), while FSG has a correlation of about . 23 with REPE. Although reference 7 did not give the relationship of advance- ment examination to REPE, we found the correlations to be negligible (.06) for a large sample of men taking the E-4 Advancement Exam in August 1970. The average correla- tions can be arranged in a matrix where the dominant variable is FSG: what BTB, advance- ment examination, and REPE have in common they share with FSG:
BTB Exam. REPE
FSG .49 .52 .23
BTB .38 .09
Exam. .06
Knowing only continuous FSG enables us to compute pass-fail validity if desired, but the reverse is not true. If pass-fe.il only is reported, we have lost the individual grade data that is vital for validating BTB scores and other variables against FSG.
-34-

TABLE 23
CORRELATIONS OF BTB, FSG, ADVANCEMENT EXAM, AND REPE BY RATING
Best R
BTB, r Single
BTB, BTB, FSG, FSG, Hi'B Occup. Group Rating N FSCa Exam REPE Exam REPE Selector
White Technical ET 678 .58 .28 -.05 .52 .18 ETST Collar FT 518 .68 .47 -.03 .58 .23 ETST
ST 428 .40 .42 -.01 .20 .23 GCT
Professional HM 547 .62 .51 .09 .58 .26 GCT PH 257 .59 .36 .19 .58 .18 GCT
Clerical CTR 436 .34 .23 .21 .18 .04 ARI CO RM 721 .49 .36 .07 .46 .16 GCT
1 SK 489 .43 .38 .05 .42 .28 GCT YN 412 .47 .16 .10 .45 .32 CLER
Blue Craftsmen EN 247 .49 .50 .10 .54 .32 MECH Collar MM 268 .51 .53 .12 .62 .11 MECH
Similar correlations were obtained on later samples of men in these schools which were reported in reference 2.

TABLE 24
MEDIAN CORRELATIONS OF SELECTION MEASURES FOR OCCUPATIONAL GROUPS AND FOR ALL RATINGS
Multiple correlation Simple correlation
Occup. Group BTB, FSG BTB, Adv. BTB, REPE FSG, Adv. FSG, REPE
White Collar
Technical Professional Clerical
.58
.61
.45
.42
.43
.29
-.03 .14 • .08
.52
.58
.44
.23
.22
.22
Blue Collar
Craftsmen .50 .51 .11 .58 .22
Median of 11 Ratings .49 .38 .09 .52 .23
I
'^ a ^Adv REPE ^ '^^ ^^°"^ ^^^ ^^^ presented earlier in table 16.

This means the final grade in Class A School is a central variable in the Navy enlisted selection system. FSGs are averages of grades in knowledge and practical phases of a course based on written examinations and demonstrations of skills learned.
Our conclusion from this body of data is that FSG has a modest relationship with REPE, but that BTB and advancement examinations have negligible relationships with REPE. One would expect that advancement examinations taken two years after entry into the Navy would exhibit higher correlations with REPE than BTB tests taken early in recruit training, but such was not the case.
As data is amassed on the new enlisted performance evaluation form, the opportunity arises to do an analysis of the relationships among BTB, FSG, advancement examinations, and job performance for a cohort of enlisted personnel in the current all volunteer force.
SELECTION FOR EFFECTIVENESS
No more than 75 of every 100 Navy recruits complete their first enlistments without being prematurely separated for neuropsychiatric disability, unsuitability, or unfitness (reference 8). If, for example, 100, 000 USN males were recruited in a given fiscal year, 25, 000 would not survive four years of service, that is, be "militarily effective." At a cost of $2702 to get one recruit into the Navy, uniformed, trained, paid, and to his first duty station in 1972 (reference 9), the financial loss to the Navy due to military ineffective- ness in this cohort would be nearly $68 million over the first enlistment term.
Early Studies
The Navy looked at the problem of premature separations in 1960, when a cohort of recruits was followed through four years of service (reference 8). The percentage of in- effective men at the end of successive time periods were as follows:
Percent ineffective Cumulative percent
Recruit Training / 7.7 7.7
1st year 3.1 10.8
2nd year 4.6 15.4
3rd year 3.5 18.9
4th year 1.9 20.8
Not recommended for reenlistment 6.3 27.1
Two-thirds of the premature separations were due to unsuitability (mainly character and behavior disorders) and unfitness (principally disciplinary problems).
-37-

Various background characteristics and selection test scores were compared for the survivors and non-survivors. The combination of variables which best differentiated be- tween them were AFQT score, years of school completed, number of suspensions and/or expulsions from school, and number of arrests for non-traffic violations. These variables were used to develop an Odds for Effectiveness (OFE) table for screening out applicants whose probabilities of first term effective service were low. '
The other militaiy services also studied enlisted effectiveness during the 1960s (ref- erences 10, 11, 12, 13, 14). All services found that the three best preservice predictors of military effectiveness were educational level, some measure of intelligence, and age at enlistment. Table 25 describes the samples and effectiveness criteria and shows the va- lidities for the three variables computed from the data provided in five studies. The Navy, Air Force, and Army results are remarkably similar. The Marine Corps results are based on new mental standards recruits who had a mean AFQT score of 15 compared to about 50 for the recruit samples in the other services. Nonetheless, the Marine results are still similar to those of the other services.
The addition of variables from basic or recruit training, such as peer and instructor ratings, increased the prediction of two-year effectiveness attainable with the pre-service variables in all services. Additional information on Navy performance after two years of service (reference 15) substantially increased the predictability of effectiveness at the four year point (completion of the first term) from a multiple correlation of .35 to .50. How- ever, such data cannot be used for screening applicants.
A study of 15 Air Force occupational groups found an improvement in prediction using occupational effectiveness scores derived from pre-service and basic training peer rating data (reference 19). There were also sizeable differences in validity of the overall score among the occupational groups.
Navy Experience During the Draft
The service studies of effectiveness were made when draft pressure was low. Sub- sequent analysis of Navy accessions in the late 1960s when draft pressure was high showed that for high school graduates, there were no appreciable differences across AFQT mental groups I through IV in separation rates due to administrative and disciplinary discharges during the first two years of service (reference 22). For non-high school graduates, there was a small negative relationship between mental group and premature separation. Thus, most of the variation in separation rates across mental groups was explained by educa- tional status, the best single pre-service predictor of effectiveness in the earlier studies. Data on age was not available.
■38-

TABLE 25
SUMMARY OF ENLISTED EFFECTIVENESS STUDIES
6> I
Sample USN USN USAF USA USMC New
Mental Standards
N 1,776
Group 1
812
Group 2
821 10,812 3,803 1,342
Entry Date 4 periods 1960-61
May and August 1960 Aug 59 - May 60 Oct-Dec 61 Oct 67-Mar 68
Effectiveness Criterion
No premature separation and recomm. for reenl. after 4 years
For 2-year survivors (85% of cohort), Division Officer rating of adjustment, discipli- nary or commendatory action, pay grade, and average semi- annual marks.
Rated at least very good on overall per- formance after 2 years.
Composite score based on pay- grade, awards, and infractions after 3 years.
No separation for psychiatric reasons, no bad conduct, recomm. for reenl. after 2 years
Percent Effective 72 - 75 77 61
Validities of best selectors*
Multiple R
r P Educ .33 .26 AFQT .22 .14 Age .16 .06
.35
r ^ Educ .26 .16 GCT .23 .17 Age .16 .12
.31
r P Educ .29 .10 GCT .23 .14 Age .16 .08
.32
r 3 Educ .34 .17 AFQT .29 .14 Age .27 .13
.38
r a Educ .34 .17 GT .29 .14 Age .27 .13
.39
r ;3 Educ .20 .18 AQB .11 .09 Age .13 .11
.24
Reference 15 16,17,18 19 20 21
•Intercorrelations: Educ./Age = .35, Educ./AFQT = .32, Age/AFQT = .09 are mean coefficients computed for all samples except USMC, where all correlations are restricted by selection based on maximum AFQT percentile score of 20 .

The following separation rates for disciplinary reasons, unsuitability, and convenience of the government were observed for FY 1967-1970:
Percent Cumulative percent
1st year 6.1 6.1
2nd year 4.2 10.3
3rd year 2.8 13.1
4th year 1.2 14.3
The cumulative rate through the fourth year is about 70 percent of that reported for the 1960 Navy cohort on which the OFE table was based. This may reflect the use of the OFE in recruitment (although it was not mandatory until FY 1973) and/or a change in recruit characteristics due to draft pressure when more older men with more education and higher AFQT scores joined the Navy.
Need for OFE Re validation
The OFE could be monitored on a yearly basis to make corrections necessary because of changes in the effectiveness criterion or in the characteristics of recruits. There is no evidence that significant changes in the effectiveness criterion have occurred since 1969, but some characteristics of recruits have changed. For example, in 1960 only 45 percent of recruits had completed high school. In 1967, the figure was 85 percent, although this change did not alter the OFE weights.
In 1973, when draft pressure was approaching zero, the figure had declined to 69 per- cent. Consequently, yearly OFE monitoring would keep abreast of the fluctuations in pre- dictors and criterion that might occur. A one percent randomly drawn cohort of accessions each year has been recommended as a sample (reference 23). However, one percent sam- ples will produce less than 1000 cohort members per year, a sufficient number for moni- toring the overall OFE, but not for investigating specific OFEs for sub-groups such as race or sex. The Navy Personnel Research and Development Center (NPRDC) is reanalyz- ing the original OFE data, but even granting its validity today, the results will apply only to white male accessions.
In mid-1972, the Navy Recruiting Command (NRQ began collecting data on all Navy accessions from the Armed Forces Entrance and Examining Stations. The data include age, education, AFQT or equivalent score, sex, and race; NRC also made provision to obtain data on attritions from recruit training, including the reason, date, and type of dis- charge. This data bank represents the beginning of a complete cohort tracking system that can be extended through A Schools and eventually through the first enlistment term. It can serve as the basis for new OFE tables and for future evaluations of the efficiency and equity of selection strategies.
-40-

Current OFE Use and Potential Savings
Pending revalidation of the OFE, the existing OFE table in conjunction with a favorable recruit selection ratio can still be useful in preventing the assignment of recruits with low effectiveness scores to jobs involving expensive training or high risk.
Table 26 illustrates hypothetical annual savings from the use of OFE with a validity of .35 for several selection ratios: savings from using the OFE under these conditions range from 15 to 28 million dollars where the recruit quota is 100, 000. From 5, 500 to 10, 500 fewer men would have to be recruited under these conditions to obtain the same number of effectives after four years of service.
The cost of getting a recruit to his first permanent duty station undoubtedly has in- creased since 1972, and the Navy Recruiting Command does use the existing OFE table. Thus, this illustration only shows that OFE savings can be estimated and that they can be substantial if the selection ratio is favorable. ■*■
The selection ratio is the ratio of job openings to available job applicants. If >1, the use of any selection device, regardless of its validity has no value since all applicants must be taken. If <1, there are more applicants than openings and the employer can be selec- tive in choosing those he thinks will best fill the openings.
-41-
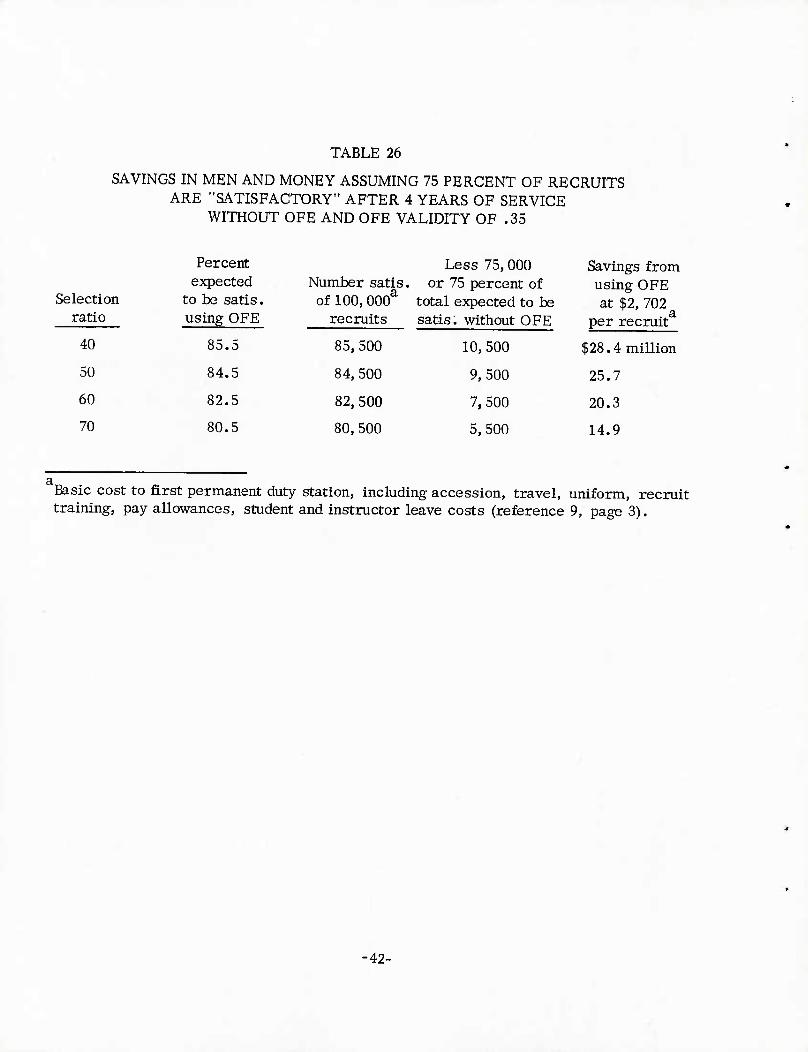
TABLE 26
SAVINGS IN MEN AND MONEY ASSUMING 75 PERCENT OF RECRUITS ARE "SATISFACTORY" AFTER 4 YEARS OF SERVICE
WITHOUT OFE AND OFE VALIDITY OF .35
Selection ratio
Percent expected
to be satis. using OFE
85.5
Number satis. of 100,000^
recruits
Less 75, 000 or 75 percent of
total expected to be satis, without OFE
10, 500
Savings from using OFE at $2, 702
per recruit
40 85, 500 $28.4 million
50 84.5 84,500 9,500 25.7
60 82.5 82,500 7, 500 20.3
70 80.5 80,500 5, 500 14.9
Basic cost to first permanent duty station, including accession, travel, uniform, recruit training, pay allowances, student and instructor leave costs (reference 9, page 3).
■42-

IMPROVING SELECTION STRATEGIES
Throughout our analyses, we have pointed out that ASVAB, BTB, FSG, and advance- ment examinations measure verbal-educational ability more than they do practical skills important particularly for blue collar and service occupations. We have also criticized the Report of Enlisted Performance Evaluation as being more a supervisor's overall impression of a man than a measure of actual ability to do the job.
Selection tests might be devised which would better tap nonverbal aptitudes, but if training courses also emphasize verbal-educational ability when it is not critical to job performance, little would be gained. If improvements were made in both selection tests and school courses without corresponding changes in advancement examinations, the relevance of the examinations both to prior selection tools and subsequent job per- formance measures would be diminished. Finally, if improvements were made in selection tests, school courses, and advancement exams but not in performance measures, we would be left with an inferior ultimate criterion of on-the-job performance.
Consequently, all four selection tools need parallel improvements if overall enlisted selection strategy is to be advanced. When such improvements are made, questions about mental level differences, racial differences, and other group differences will recede in importance because the Navy will have come closer to recruiting, teaching, advancing, and evaluating men and women for the actual duties they perform on their jobs.
Now we turn to possible ways of improving Navy selection tools that have been sub- gested by studies in the Navy, Army, Air Force and civilian world. These suggestions are not exhaustive, but they highlight important, practical ideas that deserve serious con- sideration by Navy personnel managers and researchers.
SELECTION TESTING
Aside from the NVII, the use of nonverbal tests as predictors of school grades in the Navy has not been particularly successful, particularly where school final grades have a heavy verbal-educational component (references 24 and 25).
A review of personnel selection research in 1972 (reference 26) reached the following conclusions. The so-called culture-fair selection test movement has waned. Extensive civilian research has shown that the use of nonverbal tests do not result in additional fairness for disadvantaged group members, but rather consistently enhance differences. Further, where significant difference in black and white aptitude test scores have been found, providing either extra time or extra test practice has had no effect in reducing the differences. Finally, most studies that have found differences
■43-

in the validities of selection tests for blacks and whites have been based on poor criteria of performance, mainly supervisory ratings. Studies where no appreciable differences in validities have been found have used better criteria of performance, mainly pertinent job proficiency measures.
Some success has been reported using tests which minimize the use of words in their administration. Job sample aptitude tests that simulate an on-the-job training situation for Machinist Mates have been developed. They include meter reading, trouble shooting, equipment operation, assembly of parts, and equipment use and nomenclature. For men who did not qualify for MM Class School on the BTB, the job sample tests correlated higher than did BTB tests with hands-on performance of typical Machinist Mate tasks after six months of experience. Class A School graduates with sis months of experience still outperformed these men (reference 27).
A commercial pre-vocational training evaluation program based on hands-on self- instruction has been devised. Ten work stations are equipped with tools for machine shop; electronic assembly; plumbing and pipe fitting; refrigeration, heating, and air conditioning; soldering and welding; office and sales; and so on. The program provides the evaluator with information on an applicant's vocational aptitudes, interests, and work tolerances, but takes as long as five working days to administer (reference 28).
Although such situational, job-oriented testing programs often are superior to tradi- tional paper-and-pencil tests for predicting the performance of specific job tasks, they are more costly to administer. Their value may accordingly be diminished, particularly in large selection programs where the supply of applicants is not sharply limited. Similar kinds of programs for selecting managerial personnel, often referred to as assessment centers, have shown excellent operational validities, but their costs are even higher because of the relatively few candidates that can be handled at one time and the need for a team of assessors (reference 29).
What, then is the best direction for improved selection testing? Scores on perceptual speed tests are related to clerical proficiency, and motor ability tests scores are related to proficiency as a vehicle operator because these tests amount to samples of what clerks or drivers actually do in their jobs. This implies that the best testing is job sampling of the kind mentioned above. If you want to know how well a person can solder, give him a soldering test, not a paper-and-pencil test of tool knowledge.
There is ample evidence that tests which sample job skills will predict proficiency on the job. The development of such tests is not particularly difficult for traditional blue collar and service occupations, such as carpentry, plumbing, cooking, and auto- motive repair. For less well defined military jobs, actual job performance will have to be analyzed and a manageable sample of the critical components used as a basis for test
-44-

•f^A;^,»_;*es;?*f»JiiS
development. Using such tests will not only increase the accuracy of classification, but also provide a basis for evaluating training progress rather than simply identifying fixed characteristics for selection purposes (reference 30).
Consequently, real improvement in selection testing can occur only through the job sampling-testing path. Its cost can be offset by later savings in training, effici- encies in performance, increases in job satisfaction, and avoidance of litigation if suggested federal guidelines on employee selection procedures ever are applied to the military services (reference 31).
TRAINING TECHNIQUES
Under the topic of training, we will discuss:
1. Programs for marginal personnel 2. Computerized and peer instruction 3. Course design and revision 4. Job aids.
Marginal Personnel
Project 100, 000 was established by DoD in 1966 "to give to a broader segment of the Nation's youth the opportunity to serve in the country's defense and, at the same time, to improve their competence and prepare them for a more productive life upon return to civilian status. " All three of the military services closely followed the progress of Project 100, 000 enlistees, particularly those who previously would have been rejected because of failure to meet minimum mental ability standards on the AFQT (percentile scores from 10 to 20).
The Air Force reported that these recruits had more disciplinary actions and unsuitability discharges, higher attrition rates from basic and technical training, more shifts in occupational specialities, and a lower percentage attaining pay grade E-3 or higher than regular enlistees (reference 32). Further, the performance of high school non-graduates was lower than that of high school graduates.
The Army conducted a special study of training where instructional methods were chosen to maximize the low aptitude recruit's opportunity to learn eight training tasks of varying complexity (reference 33). Where practical, slides and video tapes were used to ensure standardization and clarity. Verbal instructions were given in simple language with ample pictorial examples. All instruction was conducted individually with an in- structor present to prompt, answer questions, and provide immediate knowledge of results. The low aptitude subjects consistently required more training time to attain
■45-

a given level of proficiency, needed more guidance and repetition of instruction, and were decidedly more variable than the middle and high aptitude subjects. Similar results were found in basic training.
Navy research included the evaluation and follow-up of Project 100, 000 recruits assigned to six regular Class A Schools (reference 34). The results indicated that Group IV recruits should not be assigned to ratings that have high reading and/or computational skill requirements, but rather to jobs with a high practical performance content where they will have an opportunity for longer than average training periods and greater than average supervisory guidance.
Literacy training has also been explored by the services in an attempt to increase the effectiveness of marginal recruits. Perhaps typical of all services, the Army found that the reading difficulty levels of publications in four of five military occupational specialities exceeded the average reading ability of the average mental aptitude man by from one to six years. High as well as low aptitude readers were hurt when the reading difficulty level of materials was increased (reference 35).
The Navy recently completed a pilot program that sent non-eligible minority and non-minority recruits to Class A School so that their achievement and adjustment could be compared with that of a random sample of eligible students in the same classes. The non-eligibles were not identified upon entry into school, so that instructor expectations might not influence the results as may have happened with Project 100. 000 trainees. An interim report of results (reference 36) shows that:
• Both minority and non-minority non-eligibles had greater failure, setback, and disciplinary rates than eligibles;
• Minority non-eligibles were the same as eligibles with respect to civilian education ability to work and study with others
- enthusiasm and courtesy neatness and trimness disruptive behavior and accidents in class
o Non-minority non-eligibles required more special help than minority non-eligibles, but both required more help than eligibles;
• There were no differences among the groups in their feelings that the instructors treated them fairly.
■46-

The picture that emerges from these studies is that marginal personnel are more expensive to train and supervise than non-marginal personnel. On the other hand, individual differences among them are such that some are very proficient at practical tasks and some can improve their reading ability to the extent that job performance re- quiring such ability is enhanced. Where the issue of selection test fairness can be raised, those marginal personnel whose abilities are not fairly assessed by typical paper-and- pencil selection tests are the ones who can be expected to make the greatest improvements with proper training and assignment. Job sample testing is one way to identify such candidates.
Computerized and Peer Instruction
NPRDC developed and tested a computer assisted instruction (CAI) program and investigated the feasibility of integrating it into Navy technical training (reference 37), CAI trained students scored higher than class instructed students on both school exams and supplemental tests, while requiring from up to 50 percent less training time.
With increased use of branching technology, further savings in training time could be expected. The most costly and time consuming part of CAI course development is the initial preparation of basic instruction. But where a common core of material is involved for several ratings, the initial preparation phase has a wider applicability for amortization of development costs.
When self-pacing as represented by CAI is introduced, concern arises that students may spend more time than they need to master a course in order to avoid earlier assign- ment or transfer. NPRDC devised an incentive plan based on the difference between the student's actual rate of progress and the rate predicted from his aptitude test scores (reference 38). Incentives to progress as rapidly as possible were choice of service rating upon completion and time off after completing the course. Both incentives were applied on the basis of performance rather than aptitude. Groups studied under both incentive conditions did not differ in performance, but the first group finished training in 17 percent less time than average non-incentive groups, while the second group finished in 11 percent less time.
A recent study looked at computerized instruction in 50 randomly selected Navy technical training courses (reference 39). Generalizing the results to all Navy technical training, it was estimated that technical training costs would drop at least ten percent and manpower costs at least 20 percent if this instructional technology were implemented at its current state of effectiveness and cost. Routine course maintenance and updating requires completely rewriting a course every five years, based on Air Force experience in rewriting about 75 percent of training materials in a four-year period (reference 39).
•47-

For jobs where computerized instruction is less relevant, those where practical skills are important, the Army has developed a training model featuring peer instruc- tion in a job-simulated context (reference 40). It is organized around job performance stations where an advanced trainee performs job duties under the supervision of an instructor, while a new trainee observes. After the new trainee is familiar with the duties, he learns the necessary job skills from the advanced trainee over a flexible period of time. When both trainees are sure that the new trainee has mastered the skills, they have an instructor test his proficiency. If he fails the test, he repeats the cycle. If he passes, he becomes an advanced trainee with a new trainee observer. Then he progresses to teaching new trainees while they observe and learn. The sequence is:
Observation period (new trainee) , Learning period (new trainee) Job-performance period (advanced trainee) Teaching period (advanced trainee)
Both the computerized and peer training regimes take into account individual differences in the capabilities of trainees by gearing their pace to his progress in what amounts to a one-to-one instructor-student relationship. They also provide immediate knowledge of results and experience with the "materials" of the job. Obviously startup costs are high, but with widespread applicability and a focus only on what is actually needed to do the job, benefits in reduced training time, increased efficiency, and heightened interest will accrue.
Course Design
For training coiirses characterized by a rigid schedule of lecture, demonstration, and practice, significant increases in efficiency can still be made. The Experimental Volunteer Army Training Program (EVATP) is one example (reference 41). It is based on:
1. Performance oriented instruction - doing, rather than passive absorption of information;
2. Learning in a functional context - theoretical and technical materials are presented only when the trainee needs to learn to perform a skill and at such time as he can see the relation between the information and the skill he is learning;
3. Self-pacing of instruction - practice at the trainee's own pace with a check out by the instructor when he feels he is ready;
-48-

4. Insistence on mastery - the trainee must perform the skill without error, and if he does not, is retested until he does;
5. Feedback to instructors and trainees - so that trainees know their weaknesses and problems, instructors can gauge the effectiveness of their instruction, and remediators or reviewers can tackle specific faults and weaknesses;
6. Quality control - immediate checks as part of instruction, a diagnostic test part way through training, and a test at the end of training to assure the reliability of the training center's output.
In general, EVATP produced soldiers with a high degree of skill attainment in the sub- jects tested and enabled lower aptitude trainees to reach the standard of mastery by the repeated retraining/retesting procedure.
The NPRDC has written a manual for job training course design and improvement (reference 42). It stresses the need for identifying the job tasks for which training is given and the restriction of course content, especially information and theory, to the minimum needed to learn to perform the job task. The reasons for this are (1) what is not soon used is soon forgotten, and (2) there is so much that is relevant to be learned that there simply is no time for the irrelevant or the nice to know.
Application of the course design procedure requires effort on the part of all con- cerned, from the instructor to top training management. It is easy to document that much training is ineffective, e. g., mathematics not used is taught electronic technicians and physics not used is taught welders. However, it is not only that much of what is taught is not needed, but much that should be taught is not taught or taught well. For example, surveys of electronics technicians have found much more inadequacy than there should be in the operation of test equipment. Surveys of sonar technicians over time show that this situation has become worse. That electronic equipment operates at all is a tribute to the efforts of the few technicians who are able to do their jobs well, perhaps in spite of poor training or even the lack of training (reference 42).
Job Aids
A job performance aid provides step by step instructions for performing the job at hand. The Air Force Human Resource Laboratory has done extensive work with aiding the performance of electronic maintenance tasks, the most unique being the development of fully procedTxralized or non-decision aids for electronic maintenance (reference 43). Air Force Project PIMO (Presentation of Information for Maintenance and Operations) considered other job performance factors, developing aids for both mechanical and electronics tasks in flight line maintenance (reference 43). Length and content of training and trainee aptitude were considered in both efforts. Evidence showed that
■49-

great savings both in training and system maintenance efficiency can be obtained by well designed job performance aids. If a maintenance man uses good job performance aids, he requires less training and makes fewer errors in his work.
The Navy and Army have developed advanced type decision aids to improve check- out procedures. The Navy has symbolic integrated maintenance manuals (SIMM) that contain diagrams and related information for electronic decision-type troubleshooting (reference 44). Decision-type aids developed for the Army have cut training time for fire control technicians by 60 percent.
Either kind of job performance aid can significantly reduce training and maintenance time and trainee aptitude requirements with no degradation in performance. The Air Force has continued to implement its aids, devising specifications and manuals for their widespread use (reference 45). The Navy has over 100 applications of SIMM (reference 44, p. 25).
PERFORMANCE MEASUREMENT
Where ratings of job performance have to be used, behaviorally-oriented scales represent one of the best approaches. Their scale anchors are succinct descriptions of actual work behavior, both effective and ineffective (reference 46). These descrip- tions are more objective than the usual graphic ratings scale descriptions (such as outstanding, very good, and so on) and provide for greater discrimination among various levels of performance. The problem with behaviorally-anchored ratings scales is three- fold: their development cost, length, and the fact that raters can still bias the results.
With these problems in mind, but still faced with the fact that the Report of En- listed Performance Evaluation did not adequately differentiate among levels of job performance or enable timely processing and application of the results for personnel actions (e.g., advancement, assignment, and quality retention), the Navy in 1968 introduced an automated system using an optically read document for pay grades E-7 through E-9. This was followed by the development and implementation of new marking scales for pay grades E-5 and E-6 (reference 47). The distributions of marks on the new form are substantially more discriminating than on the REPE, especially for pay grades E-5/6.1
Forms were also developed for pay grades E-1 through E-4, but they have not been implemented because the volume of reports would greatly overload the processing capability at the Bureau of Naval Personnel.
-50-

The new items are still rated by supervisors using designations such as outstanding, superior, typical effective, but in a normative fashion to convey a ratee's standing with others of his rate and pay grade known to the rater.
A decade of Navy contract research on job performance aboard submarines (mainly in EM and EN ratings) summarized the utility of supervisory ratings, job knowledge tests, and job sample tests (reference 48). The conclusion was that reliable, objectively scorable, and easily administered job sample tests can be developed to measure per- formance factors not measured by ratings or written tests of performance. Job sample tests were found to be more predictable from selection and training variables than ratings of abilities to perform specific tasks, ratings on general traits pertaining to job know- ledge, or written job knowledge tests. They could be used for advancement in rating and as shipboard criteria for validating selection and training procedures. Graphic ratings scales of the man-to-man variety can also be developed that are reliable and which evaluate technical competence and personnel adjustment to shipboard life, but they should be done separately for different ratings and pay grades and supplemented by job performance tests.
The Army intensively studied different job performance measures across AFQT mental groups in four occupations: Supply Specialist, General Vehicle Repairman, Armor Crewman, and Cook (reference 49). Half of the men in each occupation were mental group I Vs. They were matched on job experience with non-IV personnel for a cross-sectional look at background and performance characteristics. What is important here is that the wide range of mental abilities approximates those of an unselected sample of recruits. Supervisory rating scales, job knowledge tests, and job sample tests of performance were used. The job knowledge tests were multiple choice paper- and-pencil exams, much like Navy advancement exams. The job sample tests were standardized measures of actual job duties. No differences between blacks and whites were found on any of the performance measures, despite lower black AFQT scores. However, without exception, non- IVs outperformed mental group IVs. Averaged correlations among background and performance measures are shown in table 27 .
AFQT was the best pre-service predictor of both job sample and job knowledge tests, but had only a slight relationship to supervisory ratings (of about the same mag- nitude that we observed in our analyses of Navy data). When months-on-the-job (MOJ) is held constant, the validity of AFQT rises to . 45 for predicting job knowledge and . 35 for predicting job sample test scores. At the same time, the relationship between supervisory ratings and each of the job tests drops to about . 20 each, while the cor- relation between job knowledge and sample tests drops to . 50 . Based on these and other results, several interpretations were made in reference 49 :
-51-

1. Supervisory ratings evaluate general personality, not job proficiency; they are susceptible to rater bias (such as "halo" judgments) and fail to differentiate among men with different levels of job performance.
2. Job knowledge tests should be used for occupations where skill com- ponents (perceptual, motor, cognitive, and social) are minimal, but they must test only what is needed for actual job performance.
3. Where the job emphasizes skills, job sample tests should be used to measure performance.
4. If the job includes both knowledge and skill factors, both kinds of job tests should be used.
TABLE 27
AVERAGE CORRELATIONS AMONG BACKGROUND AND PERFORMANCE MEASURES IN ARMY STUT)Y
Job Educ. MOJ Age Sample Knowl. Rating
APQT .26 .02 -.02 .31 .39 .11
Education -.01 .00 .10 .10 .08
MOJ .65 .48 .52 .20
Age .36 .42 .30
Sample .64 .26
Knowledge .30
Thus, both Navy and Army experience point to the differential usefulness of job sample and job knowledge tests as measures of task performance superior to traditional supervisory ratings alone.
JOB ANALYSIS
The foundation of efficient and effective selection, training, advancement, and performance evaluation procedures is the method by which the nature, importance, and frequency of tasks actually performed on a job are determined.
The Air Force has found that the use of job inventories is the only feasible method for collecting work-task information from large numbers of workers. The method is economical, and the information obtained from its use is quantifiable and can be validated and checked for stability using conventional statistical techniques (reference 50).
-52-

A job inventory contains background items and task listings. A worker answers questions about his job and himself - name, ID number, previous education, time on the job, tools used, job location, equipment worked on, training schools, pay grade, attitudes, and so on. Then from a list of all the significant tasks performed by workers at all levels in the occupation, he chooses those that define his job and indicates the relative amount of time he spends on each. Task lists are constructed by trained in- ventory writers and supervisors, and 500 or more tasks will normally be included in an inventory. Research and experience has shown that workers are thorough and honest when they fill out job task inventories. The worker identifies himself on the form, and the information he provides is objectively verifiable.
The USAF Comprehensive Occupational Data Analysis Program (CODAP) provides ways for analyzing, organizing, and reporting occupational information to answer as many management questions as possible from the voluminous amount of data collected. The Navy has conducted several large-scale occupational surveys using job inventories and processed the data with CODAP. It recently established an operational job-task group that will use the CODAP system for routine analyses under the Navy Occupational Task Analysis Program (NOTAP),
The uses of job siirvey information are many. In the Air Force, the greatest pay- off has been in training course revision. An ideal basis is also provided for establishing and maintaining individual experience records, and the relative difficulty levels of tasks and jobs can be evaluated. '
Task and job difficulty indices then can be used to (1) compare formal schooling versus on the job training, (2) examine the relation of aptitude scores to task assignments, (3) assess differences in work assigned to different groups (e.g., blacks and whites) in the same jobs in terms of difficulty, interest, and felt utilization, (4) evaluate the pay and grade levels associated with jobs, (5) determine training and advancement require- ments, and (6) investigate relative aptitude requirements.
NEW METHODOLOGY
In evaluating selection measvires for training and jobs, the conventional correlation analysis approach ignores three important situational factors: how well the organization could do by chance alone (the base rate in the population), the proportion to be selected from the population (the selection ratio), and the organizational gains and losses re- sulting from correct and incorrect decisions (reference 51). This statement came from a very important Navy study of methods for evaluating selection tests completed nearly ten years ago. Unfortunately, it has had little impact on subsequent selection research, but the same may be said for the other services and the civilian community. The reason is the rather formidable and complex process of quantifying the relative utility, or value,
-53-

of decision outcomes. However, there has been extensive work on value measurement and scaling in the past decade that directly applies to the problem.
Values have always entered into personnel decisions, but only implicitly or un- systematically. The study developed a method based on statistical decision theory to handle values explicitly and systematically. The method involved the construction of a payoff matrix corresponding to a contingency table relating a test to a criterion. The cell frequencies were weighted in a utility equation by the payoff values in the corres- ponding cells of the payoff matrix. TTie utility equation yielded a test evaluation index that directly expressed the utility of the test to the organization.
A utility function method was also studied that compared criterion groups, e. g., satisfactory and unsatisfactory, in terms of their scaled utility to the organization using a selection test.
The correlational, decision-theoretic, and utility function approaches were com- pared for BTB tests used to select students for ten Navy Class A Schools. Scaling techniques were used to measure the values inherent in the Navy situation: the pass- fail criterion was translated to a utility scale and corresponding jobs were scaled on the relative utility of a school graduate to the Navy. Then a payoff matrix was constructed for each school, assuming that the currently used test cutoffs were optimal.
The three methods led to different indications of the utility of the BTB tests. The decision-theoretic and utility function methods agreed on the proportion of improvement over chance provided by the tests, while the correlation method underestimated it. The decision-theoretic method indicated that the tests were worth much more to the Navy than did the other two methods. It was concluded that:
1. Statistical decision theory is well suited to the usual Navy selection testing situation;
2. Scaling methods provide a solution to the measurement of values re- quired in applying the theory to test evaluation;
3. Supplementing correlational analysis of tests with decision-theoretic analysis should produce new insights into the real utility of tests and other measures used for selection decisions.
Current selection strategies also need a systems approach that includes organizational and job factors in addition to the individual factors used almost exclusively today. Broader- band selection methods, such as assessment center techniques, should be investigated be- cause they emphasize samples of behavior rather than mere test signs of abilities (reference 30). In short, the selection strategy of the future should broaden its focus to encompass situational factors, and its effectiveness should be evaluated in terms of the utility of adaptative procedures which integrate job performance with training and selection measures.
-54-

CONCLUSIONS AND RECOMMENDATIONS
CURRENT SELECTION STRATEGIES
These conclusions stem from the analyses conducted during the study.
Data
• Individual data on selection tests, background information, school grades, advancement exams, and performance evaluations for first term enlistees is not readily accessible, sometimes missing and out of date, and occasionally erroneous.
Equity
•
•
Efficiency
Navy selection batteries reliably measure verbal-educational aptitude, practical mechanical knowledge, and visual perception. When used sequentially for selection and classification, they inevitably will initially qualify some recruits for schools or occupations who will subsequently fail to qualify. The Report of Enlisted Performance Evaluation (REPE) mainly assesses the general impression of a man as perceived by his supervisor; only in a minor sense does it evaluate job proficiency and supervisory skills.
There were no differences in Class A School failure rates for normal inputs of blacks and whites, but the BTB was less valid for blacks and often under- estimated their final school grades (FSG). The use of predicted FSG reduces test bias and can increase school participation of blacks without increasing failure rates. The use of biographic and demographic variables in addition to BTB scores could increase the predictability of FSG for blacks.
• Among candidates for 11 selected ratings who took the E-4 advancement examination, there were proportionately fewer blacks in white collar ratings and more in service ratings than whites. Blacks in blue collar and service ratings had twice the length of service (LOS) than whites,but overall there were no differences in examination means and variablities. In the final advancement multiple, the contribution of the advancement examination for whites and blacks was much higher than the specified policy weights might lead one to believe.
• BTB generally predicts final school grades (FSG), and both BTB and FSG predict advancement examination scores.
• BTB and advancement examination scores have only slight relationships with supervisory ratings of performance (REPE) when length of service is held con- stant. BTB has a higher relationship with pay grade when length of service is held constant.
-55-

• Across occupational groups, the best, although modest, predictor of REPE is FSG. What BTB, advancement examination scores, and REPE have in common they share with FSG.
Effectiveness
9 Studies of first term survival with recommendation for reenlistment in all three services during the 1960s found that education was the best predictor followed by AFQT (or GCT or a similar measure of mental ability) and age. The Navy work is being updated and will cover minorities and women.
IMPROVING SELECTION STRATEGIES
These conclusions come from a review of other studies and from extended observa- tions of the Navy's personnel research program.
Techniques
Selection, training, and performance measurement techniques must be jointly improved to effect real progress in enlisted selection strategy.
Nonverbal and culture fair paper-and-pencil tests are less useful for reducing selection bias than job sample aptitude tests.
Training can be improved by the appropriate use of computerized, self-paced, and peer instruction and performance-oriented course design. Job per- formance aids can reduce trainee requirements, training and maintenance time, and enhance performance.
Job performance measurement can be improved by testing for those know- ledges and skills, actually required by the job. Supervisory performance ratings can supplement them if they are made in comparison with peers by rating and paygrade.
Decision theory and scaling methods produce an evaluation index of a se- lection measure that directly expresses its utility (value) to the organization and supplement the traditional correlation approach to validation.
Resources
The Navy has the research capability at NPRDC to improve enlisted selection strategies.
It does not yet have either the management structure in the Bureau of Naval Personnel to plan, coordinate, and capitalize on selection, training, and performance research, or readily accessible data on all of these important phases to support timely solutions to selection problems - although steps are being taken toward these ends.
-56-

REC OMMENDATIONS
• Establish a Project Manager for enlisted selection control in the Bureau of Naval Personnel with direct access to the Chief of Naval Personnel and his R&D Advisory Council. Provide this Project Manager with the authority and resources to monitor and control the selection process from recruiting through reenlistment.
• In conjunction with CNRC and CNET, continue to upgrade the enlisted personnel selection data system so that important data on selection, training, and performance is made readily accessible and useful to both Navy personnel managers and the Navy research community.
-57-

REFERENCES
1. Einhom, H.J. and Bass, A.R., "Methodological Considerations Relevant to Discrimination in Employment Testing, " Psychological Bulletin, Apr 1971, pp. 261-269
k ■ -■
2. Naval Personnel and Training Research Laboratory, Research Report SRR 72-22, "The Relationship Between Navy Classification Test Scores and Final School Grades in 98 Class "A" Schools, " Unclassified, Apr 1972
3. Little, R.D. and Turner, R.F., "Non-Caucasian Recruiting and the Occupational Structure of the Navy, " Naval War College Review, Mar-Apr 1974, pp. 74-85
4. Naval Personnel and Training Research Laboratory, Technical Bulletin STB 72-11, "Comparison of Alternative Criteria and Weighting Methods for the Enlisted Advancement System, " Unclassified, Jun 1972
5. Center for Naval Analyses, Research Contribution 232, "An Analysis of First-Term Reenlistment Intentions, " Unclassified, Nov 1972
6. Blum, M.L. and Naylor, J.C., "Industrial Psychology, " Harper & Row, New York, 1968
7. Naval Personnel and Training Research Laboratory, Technical Bulletin STB 71-10, "Prediction of Enlisted Performance: 1. Relationships Among Aptitude Tests, Navy School Grades, the Report of Enlisted Performance Evaluation, and Advancement Examinations, " Unclassified, Jun 1971
8. Plag, J. A. and Goffman, J.M., "The Prediction of Four-Year Military Effectiveness from Characteristics of Naval Recruits, " Military Medicine, Aug 1966, pp. 729-735
9. Occupational Systems Division, Bureau of Naval Personnel, NAVPERS 18660, "Personnel Rating (NEC) Inventory of Cost Elements, " Unclassified, FY 1974 Edition
10. Personnel Laboratory, Wright Air Development Center, Air Research and Development Command, WADC-TN-59-201, "Factors Relating to Discharge for Unsuitability Among 1956 Airman Accessions to the Air Force, " Unclassified, Dec 1959
11. Personnel Laboratory, Wright Air Development Division, Air Research and Develop- ment Command, WADD-TN-60-260, "Prediction of Unsuitability Discharges, " Unclassified, Oct 1960
12. Human Factors Research Branch, TAG Research and Development Command, Re- search Note 113, "Prediction of Unacceptable Performance in the Army, " Unclassified, Jun 1961
13. Personnel Research Laboratory, Aerospace Medical Division, Air Research and Development Command, PRL-TDR-62-5, "Prediction of Unfavorable Discharge by Separate Educational Levels, " Unclassified, Apr 1962
-58-

14. Personnel Research Laboratory, Aerospace Medical Division, Air Force Systems Command, Technical Documentary Report PRL-TDR-63-17, "Prediction of Un- suitability Among First-Term Airmen From Aptitude Indexes, High School Reference Data, and Basic Training Evaluations, " Unclassified, Jun 1963
15. U.S. Navy Neuropsychiatric Research Unit, Report No. 70-21, "A Decade of Research in the Prediction of Naval Enlistee Effectiveness, " Unclassified, 1971
16. U.S. Navy Neuropsychiatric Research Unit, Report No. 63-5, "The Unsuitable Naval Reciruit: His Adjustment and Performance During Two Years of Service, " Unclassified, Jan 1963
17. U.S. Navy Neuropsychiatric Research Unit, Report No. 64-15, "The Validity of Age, Education, and GCT Score as Predictors of Two-Year Attrition Among Naval Enlistees, " Unclassified, Jun 1964
18. U.S. Navy Neuropsychiatric Research Unit, Report No. 65-19, "Age, Years of Schooling, and Intelligence as Predictors of Military Effectiveness for Naval Enlistees, " Unclassified, Jul 1965
19. Personnel Research Laboratory, Aerospace Medical Division, Air Force Systems Command, Technical Documentary Report PRL-TDR-64-5, "Prediction by Career Field of First-Term Airman Performance from Selection and Basic Training Variables, " Unclassified, Mar 1964
20. Human Resources Research Office, The George Washington University, Technical Report 69-5, "Relationship between Army Recruit Characteristics and First Tour Performance, " Unclassified, Apr 1969
21. U.S. Navy Neuropsychiatric Research Unit, Report No. 71-42, "Predicting the . Effectiveness of New Mental Standards Enlistees in the U. S. Marine Corps, "
Unclassified, Dec 1970
22. Center for Naval Analyses, Research Contribution 218, "Comparison of Navy and Air Force Administrative and Disciplinary Discharges, " Unclassified, Jul 1972
23. U.S. Navy Neuropsychiatric Research Unit, "Notes on Briefing to Commander, Navy Recruiting Command, " 30 Aug 1973
24. Naval Personnel and Training Research Laboratory, Technical Bulletin STB 70-5, "A Non-Cognitive Test Battery as a Predictor of Class "A" School Performance, " Unclassified, Mar 1970
25. Naval Personnel and Training Research Laboratory, Research Memorandum SRM 72-12, "An Evaluation of Two Non-Intellective Measures as Predictors of Performance in the Avionics Technician Course, " Unclassified, May 1972
■59-

26. Bray, D.W. and Moses, J.L., "Personnel Selection, " Annual Review of Psychology, Palo Alto, 1972
27. Applied Psychological Services, Science Center, Wayne, Pa., "Nonverbal and Culture Fair Performance Prediction Procedures: II. Initial Validation, " Unclassified, Sap 1973
28. Singer/Graflex Vocational Evaluation Systems, Graf lex Education and Training Division, Rochester, N.Y.
29. Cohen, B.M. and Jaffee, C.L., "Assessment Centers Aid Government Agencies," Government Executive, Oct 1973, pp. 42-44
30. McClelland, D.C., "Testing for Competence Rather Than for Intelligence, " American Psychologist, Jan 1973, pp. 1-14
31. Equal Employment Opportunity Coordinating Council, "The Uniform Guidelines on Employee Selection Procedures, " Discussion Draft, 23 Aug 1973
32. Personnel Research Division, Air Force Human Resources Laboratory, Air Force Systems Command, AFHRL-TR-70-4, "Comparative Performance of Low-Ability Airmen, " Unclassified, Jan 1970
33. Human Resources Research Office, The George Washington University, Technical Report 69-6, "Aptitude Level and the Acquisition of Skills and Knowledges in a Variety of Military Training Tasks, " Unclassified, May 1969
34. Naval Personnel and Training Research Laboratory, Research Report SRR 70-12, "Fleet FoUowup on Group IV Graduates of A Schools, " Unclassified, Oct 1969
35. Human Resources Research Organization, Professional Paper 25-70, "Literacy Demands of Publications in Selected Military Occupational Specialties, " Unclassified, Oct 1970
36. Navy Personnel Research and Development Center Itr Ser 675, Unclassified, 28 Dec 1973
37. Naval Personnel and Training Research Laboratory, Research Report SRR 73-13, "Computer Assisted Instiniction in Navy Technical Training Using a Small Dedicated Computer System: Final Report, " Unclassified, Nov 1972
38. Naval Personnel and Training Research Laboratory, Technical Bulletin STB 73-2, "The Effects of Incentives on Student-Paced Instruction," Unclassified, 1972
39. Stanford Research Institute, Final Report, "Analysis of Some Potential Policies for the All Volunteer Navy, " Unclassified, Jun 1973
40. Human Resources Research Organization, Professional Paper 32-70, "The Devel- opment of a Low-Cost Performance-Oriented Training Model, " Unclassified, Dec 1970
-60-

41. Human Resources Research Organization, Technical Report 72-7, "The Concepts of Performance-Oriented Instruction Used in Developing the Experimental Volunteer Army Training Program, " Unclassified, Mar 1972
42. Naval Personnel and Training Research Laboratory, Research Report SRR 71-4, "Job Training Course Design and Improvement (Second Edition),'" Unclassified, Sep 1970
43. Training Research Division, Air Force Human Resources Laboratory, Air Force Systems Command, "Job Performance Aids Research, Summary and Recommen- dations, " Unclassified, Apr 1969
44. Human Resources Research Organization, Technical Report 72-36, "A Plan for ULMS Weapon System Maintenance and its Personnel Implications, " Unclassified, Nov 1972
45. Advanced Systems Division, Air Force Human Resources Laboratory, Air Force Systems Command, AFHRL-TR-73-43 (I), (II), and (III), "Fully Proceduralized Job Performance Aids, " Unclassified, Dec 1973
46. Schwyhart, W.R., "Development of Behaviorally Anchored Scales for Evaluating Job Performance with Naval Personnel, " Proceedings of the 12th Annual Military Testing Association, San Diego, 1970, pp. 145-160
47. Naval Personnel and Training Research Laboratory, Research Report SRR 73-11, 'T)esign and Fleet Trial of Automated Performance Evaluation Forms for Two Pay Grade Groups: E5-E6 and E1-E4, " Unclassified, Nov 1972
48. Human Factors Research, Final Report, "Research on the Development of Ship- board Performance Measures and Performance Judgments, " Unclassified, Jan 1965
49. Human Resources Research Organization, Technical Report 72-23, "Performance in Four Army Jobs by Men at Different Aptitude (AFQT) Levels: 4. Relationships Between Performance Criteria, " Unclassified, Aug 1972
50. Occupational Research Division, Air Force Human Resources Laboratory, Air Force Systems Command, AFHRL-TR-73-75, "The United States Air Force Occupational Research Project, " Unclassified, Jan 1974.
51. U.S. Naval Personnel Research Activity, Technical Bulletin STB 67-18, "The Application of Decision Theory and Scaling Methods to Selection Test Evaluation, " Unclassified, Feb 1967
52. U.S. Army Behavior and Systems Research Laboratory, Technical Research Report 1161, "The Armed Services Vocational Aptitude Battery, " Unclassified, Feb 1970
53. Cronbach, L.J., "Essentials of Psychological Testing, " Harper & Row, New York, 1970
-61-

54. Naval Personnel and Training Research Laboratory, Technical Bulletin STB 70-4, "A Comparison Between the Armed Services Vocational Aptitude Battery and the Navy Basic Test Battery in Predicting Navy School Performance, " Unclassified, Jan 1970
55. Naval Personnel and Training Research Laboratory, Technical Bulletin STB 70-7, "Validation of Form 7 of the USN Basic Test Battery in 108 Class "A" Schools, " Unclassified, Apr 1970
56. Naval Personnel and Training Research Laboratory, Technical Bulletin STB 70-3, "A Preliminary Evaluation of Brief Navy Enlisted Classification Tests, " Unclassified, Jan 1970
57. Dunnette, M.D., "Personnel Selection and Placement, " Wadsworth Publishing Company, Belmont, California, 1966
58. Flesch, R., "How to Test Readability, " Harper, New York, 1951
59. Clark, K.E., "The Vocational Interests of Nonprofessional Men, " University of Minnesota Press, Minneapolis, 1961
60. U.S. Naval Personnel Research Activity, Research Memorandum SRM 65-3, "A Comparison of Responses to a Vocational Interest Test Taken Under Standard Conditions at Recruiting Stations and Responses to the Same Test Taken as a Self- Administered Test at Home, " Unclassified, May 1965
61. Navy Personnel Research and Development Center, NPRDC TR 74-5, Occupational Scales of the Navy Vocational Interest Inventory: II. Reliability, " Unclassified, Oct 1973
62. Navy Personnel Research and Development Center, NPRDC TR 74-4 "Occupational Scales of the Navy Vocational Interest Inventory: I. Development, " Unclassified, Oct 1973
63. U.S. Naval Persoimel Research Activity, Technical Bulletin STB 69-2, "An Analysis of the Navy Enlisted Performance Evaluation System, " Unclassified, Oct 1968
-62-

APPENDIX A
U.S. NAVY FIRST TERM ENLISTMENT PROCESS

The Navy Recruiting Command seeks to enlist men and women for periods of 3, 4, 5, or 6 years' service. An applicant enlisting in a 3 year program has restrictions placed on his training options. A 4 year enlistment is considered normal. A 5 or 6 year en- listment is limited to those qualified for the Nuclear Field (NF) or Advanced Electronics Field (AEF).
At a recruiting station, an applicant records his Biographical History (DD form 398), Police Record Check (DD form 369-N), Record of Emergency Data (NavPers 1070/602), and Education Level (DD form 4). At this time, an enlisted service record (NavPers 1070/600) is initiated.
The Navy recruit is further processed at the Armed Force Entrance and Examining Station (AFFES), where he fills out a Report of Medical History (SF form 93) and the examining physician completes a Report of Medical Examination (SF form 88).
If the applicant has taken the Armed Services Vocational Aptitude Battery (ASVAB) in high school within the past year, no other tests are necessary for selection processing at this time. Otherwise, the applicant is given the Short Basic Test Battery (SBTB) for en- listment processing and school selection screening. For those applicants desiring AEF or NF training, the Basic Test Battery (BTB form 8) is administered by a PN 2612 Classification Interviewer to determine qualification.
Final processing at the recruiting station includes completion of the Enlistment Contract (DD form 4), and school guarantee commitment information is confirmed on the Administration Remarks page (NavPers 1070/613).
The Navy's training classification and assignment cycle begins at the Recruit Training Command (RTC) with 9 weeks of basic military training. During this period, the recruit is given the BTB Form 8 and interviewed by a Classification Interviewer. Recommendations concerning training assignment are made at this time and recorded on the Enlisted Classifi- cation Record (NavPers 1070/603). A summary of this interview is placed on the Recruit Data Card (RDC) for integration into the Computer Assisted Selection System (COMPASS) and the Enlisted Master Tape (EMT) at the Bureau of Naval Personnel.
Upon completion of basic training. Navy men and women are assigned to a Class A School (61.4% in FY 1973) or to an apprentice training program of two weeks duration for direct input to fleet units (39.6% in FY 1973).
Advancement in the Navy from E-1 to E-2 is based upon the local commander's recommendation, a minimum of 4 months as an E-1, and completion of specific job per- formance factors. Advancement from E-2 to E-3 is based on the local commander's recommendation, passing an examination offered at the option of the command, a minimum of 8 months as an E-2, and completion of required correspondence courses and job
A-1

performance factors. Advancement to E-4 is based on the local commander's recom- mendation, passing the semi-annual Navy-wide advancement in rating examination, com- pletion of required correspondence courses, and a minimum of 6 months in pay grade E-3. The multiple for advancement includes points for examination score, performance marks, total active service, time in present grade, awards, and past examination performance.
Retention of first-term personnel in the Navy is administered by each local command with eligible numbers and names furnished by the Bureau of Naval Personnel. The station or ship personnel office works closely with the Career Counselor to single out those eligible for reenlistment. Eligibility for reenlistment of first term personnel is based on a formula of performance evaluations, pay grade (E-4 or an E-3 selected for E-4), and a suitable disciplinary record. Ten months prior to his EAOS, the first-term sailor is asked to meet with his Career Counselor to discuss reenlistment options. If he desires to reenlist and is qualified in all respects, he is reenlisted within three months of his EAOS by his local command.
Figure A-1 depicts the total selection process for a typical first term enlistee and table A-1 shows the location of selection data.
A-2

> I
CO
SELECTION
(1) School
(2) ASVAB (51 OFE (3) NVII (6) Interview (4) SBTB (7) Physical exam
(BTB-6YO)
II 1
CLASSIFICATION I III
ASSIGNMENT
A-School ^
^
Pass
Fail hi FLEET
(On the job training)
I (8) BTB Form 8 |
Interview (10) Preferences I
(111 FSG (12) REPE
(13) Correspondence courses
(14) On job experience
IV
ADVANCEMENT
Adv. cycle
Pass
PNA
f-iC Fail
(15) Advancement exam (16) REPE
RETENTION
(17) Preference (18) REPE (191 Paysrada (20) CO. racommendation
FIG. A-1: NAVY ENLISTED PERSONNEL SELECTION PROCESS

KEY FOR FIGURE A-1, ENLISTED PERSONNEL SELECTION PROCESS (S/R = Enlisted Service Record NAVPERS 1070/600 (rev 8.69), retained by individual's local command, duplicate S/R retained by
Bureau of Naval Personnel, Washington, D.C., but forms in duplicate record may lag original record by 2 or more years.)
1. School Years education noted in individual's Service Record (S/R) NAVPERS 1070/600 (rev. 8/69), page 1 {DDform4), the Enlistment Contract, blocl< no. 2, retained by local command.
2. Armed Services Vocational Aptitude Battery (ASVAB), S/R page 13 entry-Administrative Remarks (if entered), recorded at Recruiting Command. 1973-74 school year quota on ASVAB of 4800-5200.
3. Navy Vocational Interest Inventory (NVII) — 15 critical/high input ratings being keyed; requires machine scoring and 3 RTCs have different scoring machines. S/R, page 13-Administrative Remarks, if recorded.
4. Short Basic Test Battery (SBTB) time = 1 hour; G-^A-^M = AFQT. (AFQT stopped 1 Jan 73). School guarantee on SBTB Test scores kept locally if no S/R entry. IVIental Test Scores, GCT, ARI, MECH, in S/R page 1 — Enlistment Contract, item no. 44 and no. 47, and page 13-Administrative Remarks.
5. Odds for Effectiveness Table (OFE). S/R, page 1-Enlistment Contract, block no. 47 coded entry, OFE Table is an Appendix to the Navy Recruiting Manual.
6. Interviews — Enlistment Contract, block 47 coded.
7. Physical Exam — Health Record maintained by local command, SP88-Report of Medical Examination (SF 93 and SF 513 also). Pulhes Profile enlistment contract, page 1 blocks no. 25, 48.
I 8. BTB Form 8 — Basic Test Battery, Form 8 (current 1973 format). Enlisted classification record page 3, page 13-entry on GCT, ARI, MECH, CLER, SP, ETST, SONAR scores as applicable in Administrative Remarks.
9. Interview — S/R page 3, Enlisted Classification Record.
10. Preferences — S/R page 3 — Enlisted Classification Record.
11. Final School Grade (FSC) for Navy Schools — S/R page 4-Navy Occupational/Training & Awards History.
12. Keport of Enlisted Performance Evaluation (REPE) - NAVPERS 792, S/R page 9, Enlisted Performance Record (a cumulative record-NAVPERS 601-9); NAVPERS 792 orig. for E-5 and senior forwarded to SUPERS for inclusion in BUPERS S/R; duplicate in local S/R; E-4 and junior originals only kept locally, no copy to BUPERS.
13. Correspondence Courses — record kept as pwr (11), also S/R page 13 Administrative Remarks for special courses.
14. Experience — S/R page 4-Navy Occupational/Training and Awards History; S/R page 5-Hi$tory of Assignments.
15. Advancement Exams — results may be in S/R "P," "F," and "PNA." Only with "PNA" are scores provided.
16. KEPE-See 12. 17. Preferences - NAVPERS 1306/7
, 18. REPE-See 12.
19. Pay Grade — S/R page 9-Enlisted Performance Record (cumulative), S/R page 4-Navy Occupation/Training and History, S/R page 13-Administrative Remarks.
20. CO. Recommendation — for advancement/reenlistment, S/R page 9-Enlisted Performance Record; S/R page 13-Admin. Remarks.
)<^

TABLE A-1
LOCATION OF ENLISTED SELECTION INFORMATION
Edu
catio
n
AS
VA
B
NV
II
SB
TB
OF
E
Inte
rvie
w
Phy
sica
l
BT
B 7
or
8
Inte
rvie
w
Pre
fere
nce
FSG
RE
PE
Cor
r. C
rs.
OJT
Exp
er.
Adv. E
xam
R
EP
E
Pre
fere
nce
RE
PE
Pay
Gra
de
CO
. R
ec.
Q g page IX XXX
g pages
Q page 4
> page 5 w •^ page 9
W page 10
3 page 13 X X Z w left
side X
XXX
X X2
X XX
X
X
X
X X
X
X X
X X
X X
X
X
X
XXX
X X
Health Record X
BuPers X XXX S/R ^ ^
Enlisted Master tape X X
Naval Exam. Center
Navy Schools Command
XjX^X^
1
X
X
^1 ^1
X
X X
X X^
X
X,
X.
Duplicate of S/R page 4 forwarded to BuPers when S/R closed out (upon discharge or reenlistment), otherwise retained by local command Page 13 made only when recruit changes or relinquishes procurement program
A-5

APPENDIX B
COMPOSITION AND USE OF ENLISTED SELECTION MEASURES

This appendix contains internal analyses of the ASVAB, SBTB, BTB, NVII and REPE to determine what they measure in contrast to what they purport to measure. Com- posites from the three selection batteries are also compared, and a problem inherent in using different batteries for selection and classification is pointed out.
ARMED SERVICES VOCATIONAL APTITUDE BATTERY
The armed Services Vocational Aptitute Battery (ASVAB) is a battery of nine tests developed by a Joint Services Committee from items in interchangeable military service tests. It takes 140 minutes to administer (reference 52).
CS - Coding speed (100 items) evaluates the examinee's ability to quickly and accurately assign coded numbers by relating them to specific words.
WK - Word Knowledge (25 items) is a test of verbal ability involving the definition of words; this is a classical vocabulary test involving non- technical terms.
f AR - Arithmetic Reasoning (25 items) evaluates the examinee's ability to think through mathematical problems presented in verbal form. It involves the discovery and application of the general mathematical principles required to arrive at a correct solution to each problem, as well as performance of the necessary calculations to attain that solution.
TK - Tool Knowledge (25 items) is a pictorial test that requires the examinee to identify pictured tools and determine related items with which they are used.
SP - Space Perception (25 items) involves visualizing the folding of flat patterns into three-dimensional objects.
MC - Mechanical Comprehension (25 items) evaluates the ability of the examinee to determine from pictures of mechanical devices their operating characteristics.
SI - Shop Information (25 items) determines the examinee's previous knowledge about shop practices and the use of tools in specific situations.
AI - Automotive Information (25 items) is designed to evaluate specific knowledge about automobiles and automobile motors.
El - Electronics Information (25 items) involves the ability to apply previously acquired knowledge of electricity and electronics toward the solution of problems in practical situations.
Since the ASVAB is an alternate to the BTB as a selection and classification tool, we are interested in its comparative structure and efficiency in predicting A School grades.
B-1

ASVAB Development Sample
In 1966, the Army was designated as the lead service to develop a common aptitude battery for the services to be used in testing high school seniors. The interchangeable counterpart tests of the three services were identified and items were selected from them to produce standardized tests shorter than the parent tests so that total testing time would not exceed two and a half hours. The resultant nine tests were standardized on over 3,000 Selective Service registrants from the three services and the Marine Corps at 11 AFEES throughout the country. In the developmental study, it was not feasible to determine directly the correlation between the original service tests and their ASVAB counterparts. Rather, ASVAB correlations with the AFQT were examined and in most instances were found to be similar to those of the parent tests with the AFQT.
The intercorrelations of the ASVAB Form I tests had been calculated for 2, 800 men in the standardization sample (reference 52, p. 25). They were all positive, and the average correlation of . 60 suggested that nine different aptitudes were not being measured by the battery. To find the different kinds of aptitudes that were being measured, we factored the correlation matrix (reference 53). 1 The results are shown in table B-1.
Two aptitude factors were found to be measured by the nine ASVAB test scores. Three tests dominated the first factor: "Word Knowledge (vocabulary), Arithmetic Reasoning (math problems in verbal form), and Coding Speed (relating coded numbers to specific words). In contrast, the second factor was dominated by three other tests that involve practical knowledge about tools, autos, and shop practices. The remaining tests, dealing with electronics information, mechanical comprehension, and space per- ception, load about equally but moderately on both factors.
Following Cronbach's hierarchial interpretation factors (reference 53, p. 333), factor I represents a verbal-educational complex which includes verbal and numerical tests that enter into many kinds of achievement tests and jobs requiring paper work,
Principal components analysis was the method used in factoring the correlation matrix, and both unities and squared multiple correlation coefficients (SMC) were tried as com- munality estimates. The principal components with eigenroots equal to or greater than one were retained and rotated using both orthogonal (Varimax) and oblique (Quartimin) rotation schemes. Both kinds of communality estimates and rotation schemes produced very similar patterns of loadings, so only the results based on unit communalities and orthogonal rotation are presented.
B-2

•ifri;;'i;i;^i4^. W »■ J'T
while factor II represents a mechanical-spatial complex that refers to a broad compre- hension relevant to practical nonverbal tasks.
Since the electronics, mechanical, and spatial tests load on both, they are not pure measures, but combinations of both kinds of aptitudes. This means that verbal-educa- tional aptitude is required to do well on these tests in addition to knowing their subject matter.
TABLE B-1
ASVAB FORM 1 FACTORS AND SOURCES OF VARIANCE
Sources of variance
■■
Square factor
d rotated loadings Communality Reliability Specificity
S=KR21 -
Error
e=l- Test
.74
+ 11^
.08
h« KR21
.96
h^ KR21
WK .82 .14 .04 AR .77 .08 .85 .93 .08 .07 CS .74 .01 .75 .95 .20 .05 TK .00 .84 .84 .85 .01 .15 AI .11 .69 .80 .92 .12 .08 SI .20 .62 .82 .86 .04 .14 El .34 .43 .77 .88 .10 .12 MC .33 .43 .76 .85 .09 .15 SP .34 .24 .58 .88 .30 .12
Trace 40% 38% 78% (rotated)
\* 5.7 1.3 (unrotated)
*The eigenroot of a third factor was only 0.5.
The KR 21 values in the last column of table B-1 are estimates of the internal relia- bility of the tests. •'■ All are sufficiently high for practical use of the tests as selection
KR21 is computed from the number of items, mean, and standard deviation of the test and assumes that it measures a single factor and has equal item intercorrelations, standard deviations, and difficulties. To the extent that these assumptions are not met, the formula underestimates reliability (Gulliksen, H., "Theory of Mental Tests," John Wiley & Sons, 1950, p. 223.
B-3

measures. The average difficulty of the tests (mean divided by the number of items) is .53 and ranges from .45 to .59 with the exception of the Work Knowledge test which at .70 is too easy a measure for maximum discrimination of vocabulary knowledge among examinees.
Figure B-1 graphically illustrates the sources of variance in the ASVAB tests in the development sample. It is based on the principle that the total variance of a test (1.0) can be broken up into reliable and error variance, and that reliable variance in turn can be fractionated into common or shared variance (h^) and specific variance that is not shared with other tests.
WK, AR, and CS contain predominantly common variance due to the verbal-educa- tional factor. In addition, CS contains about 20 percent specific variance, probably attributable to perceptual speed and accuracy. TK, on the other hand, is almost a pure measure of common variance that we have called a knowledge factor. AI and SI also contain heavy portions of this knowledge factor. El, MC, and SP have roughly equal por- tions of verbal-educational and knowledge common variance. SP, however, has nearly one third of its reliable variance due to a specific factor that probably relates to the « spatial ability to perceive how complex unfolded solids would appear when folded.
In summary, the first form of the ASVAB measured two common factors, verbal- , educational aptitude and practical knowledge, and a specific perceptual speed factor. All of the tests were sufficiently reliable for use in selection.
Navy Experience with ASVAB
Since the advantages of the ASVAB as a common selection battery for the services would be partly offset by the existence of unique jobs within a service and differences in available manpower pools, the Navy compared ASVAB Form I with the Basic Test Battery (BTB) for classifying recruits (reference 54). ASVAB and BTB were administered to over 47,000 recruits at the San Diego and Great Lakes Naval Training Centers in FY 1968. Final School Grades were later obtained for all who completed Class A Schools. The major findings were that ASVAB was too easy for effective discrimination of aptitudes among the school students and that BTB validities (correlations with FSG) were uniformly higher than those of ASVAB. Data from this study was used by the ser- vices in developing the current ASVAB Form II.
The Coding Speed (CS) test was not given to the Navy recruit sample. Nevertheless, * the results of our analysis in table B-2 show that the factor structure of the remaining eight tests is similar to that of the ASVAB development sample both with and without CS. The verbal-educational and practical knowledge factors observed earlier again ♦ emerge.
B-4

\
WK
AR
CS
TK
Al
SI
El
MC
SP
D .1 1 1 1
.3 1
A .5 1 1
6 1
.7 1
.£ .9 J
1.C
1 1 1 1 7 I 1 I I I 1
Verbal-Educational PK s e
Verbal-Educational PK s e
Verbal-Educational PK s ' > e
Practical Knowledge s e
V-E Practical KnowJedge s e
V-E Practical Knowledge s e
Verbal -Educa tional Practical Knowledge s •
Verbal-Educational Practical Knowledge s •
Verbal -Educational Practical Knowledge Specific error
FIG. B-1: SOURCES CONTRIBUTING TO THE VARIANCE OF ASVAB TESTS
B-5

TABLE B-2
COMPARATIVE FACTOR STRUCTURE OF ASVAB FORM I EXCLUDING CODING SPEED TEST
Navy recruit sample (r = .51) I
WK .84 .39 AR .87 .43 TK - - AI - - SI - - El .-60 .14 MC .63 .18 SP .67 .25
D3 Trace 36% ON
ASVAB development sample (r = .63) n < I II
i_ P h^ ^ 1 i3 1 ^ h^ -^ :■> .73 WK .90 .51 - . .83 - ■ - .77 AR .91 .46 - - .85 91 .48 .83 TK - - .94 .73 .88 81 .34 .76 AI .40 -.23 .80 .29 .80 79 .32 .75 SI .52 -.14 .73 .16 .81 57 .12 .68 El .69 .12 .57 .07 .79 - - .64 MC .67 .09 .57 .03 .77 - - .55 SP .67 .15 .40 -.10 .61
35% Trace 43% 36%
.#
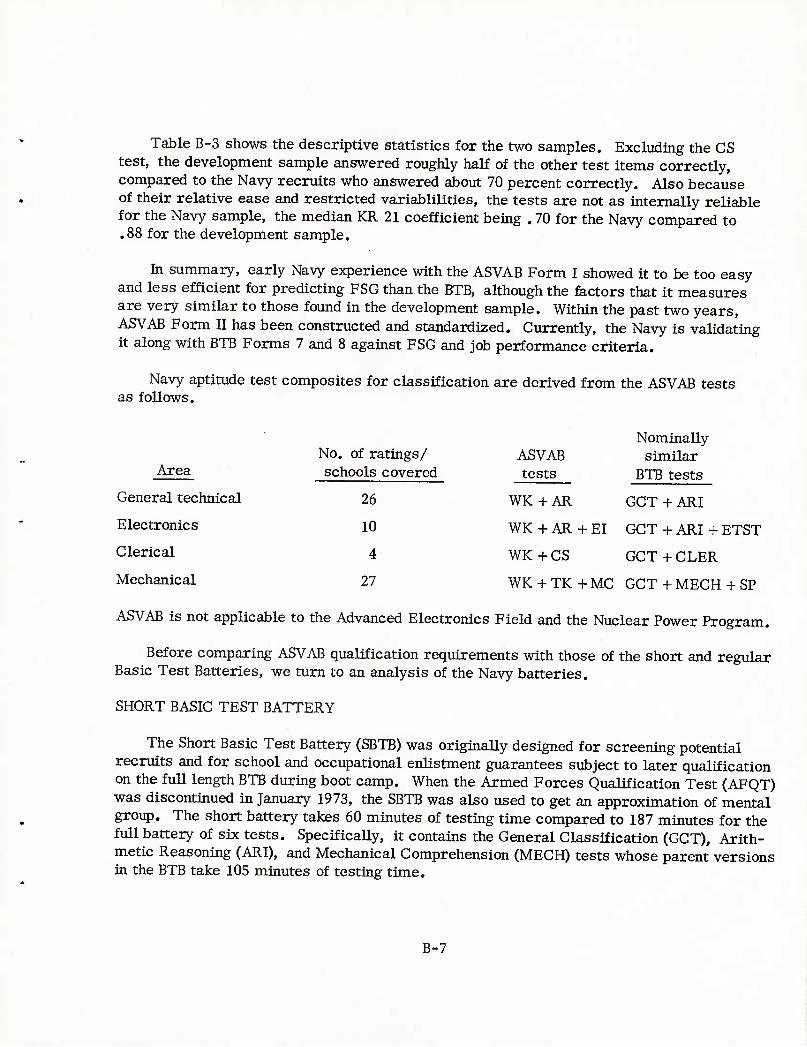
Table B-3 shows the descriptive statistics for the two samples. Excluding the CS test, the development sample answered roughly half of the other test items correctly, compared to the Navy recruits who answered about 70 percent correctly. Also because of their relative ease and restricted variablilities, the tests are not as internally reliable for the Navy sample, the median KR 21 coefficient being . 70 for the Navy compared to .88 for the development sample.
In summary, early Navy experience with the ASVAB Form I showed it to be too easy and less efficient for predicting FSG than the BTB, although the fectors that it measures are very similar to those found in the development sample. Within the past two years, ASVAB Form II has been constructed and standardized. Currently, the Navy is validating it along with BTB Forms 7 and 8 against FSG and job performance criteria.
Navy aptitude test composites for classification are derived from the ASVAB tests as follows.
Area
General technical
Electronics
Clerical
Mechanical
No. of ratings/ schools covered
26
10
4
27
ASVAB tests
WK+AR
Nominally similar
BTB tests
GCT + ARI
WK + AR + El GCT + ARI + ETST
WK+CS GCT + CLER
WK + TK+MC GCT+MECH + SP
ASVAB is not applicable to the Advanced Electronics Field and the Nuclear Power Program.
Before comparing ASVAB qualification requirements with those of the short and regular Basic Test Batteries, we turn to an analysis of the Navy batteries.
SHORT BASIC TEST BATTERY
The Short Basic Test Battery (SBTB) was originally designed for screening potential recruits and for school and occupational enlistment guarantees subject to later qualification on the fuU length BTB during boot camp. When the Armed Forces Qualification Test (AFQT) was discontinued in January 1973, the SBTB was also used to get an approximation of mental group. The short battery takes 60 minutes of testing time compared to 187 minutes for the full battery of six tests. SpecificaUy, it contains the General Classification (GCT), Arith- metic Reasoning (ARI), and Mechanical Comprehension (MECH) tests whose parent versions in the BTB take 105 minutes of testing time.
B-7

; - TABLE B-3
ASVAB FORM I DESCRIPTIVE STATISTICS FOR DEVELOPMENT AND NAVY RECRUIT SAMPLES
Devel, sample Navy recruit sample (N = 2, ,800) (N = = 47, 360)
No. of KR KR #21 items Mean S.D. . P* #21+ Mean S.D. _ r
WK 25 17.5 8.1 .70 .96 20.6 4.3 .87 .83
AR 25 14.7 7.6 .59 .93 17.9 4.7 .71 .80
TK 25 12.7 5.9 .51 .85 18.1 3.8 .73 .69
SP 25 12.7 6.3 .51 .88 17.5 4.1 .70 .72
MC 25 12.2 5.9 .49 .85 17.5 3.4 .70 .57
Cd SI 25 12,3 5.9 .49 .86 17.2 3.6 .69 .61
1 00 AI 25 11,5 7.4 .46 .92 16,6 5,0 .67 ,81
El 25 13.0 6.4 .52 .88 17.5 3.9 .69 .68
CS 100 45.1 17.9 .45 .95 — — — M'^
Avg. proportion correct = .53 Avg. proportion correct = .71 -
*Computed from m.ean -r number of items. +Assumes that the items in a test measure a single factor and have equal intercorrelations, standard deviations, and difficulties. To the extent that these assumptions are not met, the coefficient is an underestimation of the test's internal reliability.

To obtain samples for analysis of the SBTB tests, we reverted to the parent BTB tests which had been administered to a full-range recruit sample in FY 1966 when draft pressure was low (reference 55) and to Caucasian and non-Caucasian male accessions during FY 1973 for whom BTB data was available on the BuPers Enlisted Master Tape as of September 1973. About 25 percent of the BTB scores were missing from the tape for the FY 1973 accessions. The reasons for the missing data include a lag in reporting scores to BuPers and entering them on the master tape and the introduction of a new data proc- essing system. The kind of bias this introduces is open to speculation.
We factored the SBTB intercorrelation matrix and the results are shown in table B-4. An encouraging thing about these rfesults is the high degree of similarity among recruits in 1966 and 1973 and between Caucasian and non-Caucasian recruits. In all three samples, a single verbal-educational factor dominates the relationships among the three tests. The somewhat lower intercorrelations among the tests for the non-Caucasians are due mainly to their smaller test variabilities.
The total variance of each test was apportioned into its components as illustrated in figure B-2 (test reliability estimates were obtained from reference 56). Common variance due to the verbal-educational factor accounts for 80 percent of the variance of GCT, 75 percent of the variance for ARI, and 45 percent of the variance for MECH. MECH has another 46 percent specific variance related to mechanical comprehension and tool know- ledge. Thus, verbal-educational aptitude is important in taking the MECH test as well as mechanical and tool knowledge. Now we will turn to the full length Basic Test Battery, the mainstay of the Navy's enlisted classification program.
BASIC TEST BATTERY FORM 7
The Navy Basic Test Battery includes six tests which are combined into various com- posites for making school assignments. The Form 7 tests are:
General Classification (GCT), 60 verbal analogy and 40 sentence completion items with a 35 minute time limit.
Arithmetic Reasoning (ARI), 30 arithmetic reasoning items with a 35 minute time limit.
Mechanical (MECH), two separately timed 50 item subtests yielding a single score: the tool knowledge section has a 10 minute time limit and the mechanical comprehension section has a 25 minute time limit.
Clerical Test (CLER), 100 number matching items, a highly speeded test with a 5 minute time limit.
Shop Practices Test (SP), 30 items with a 17 minute time limit.
B-9
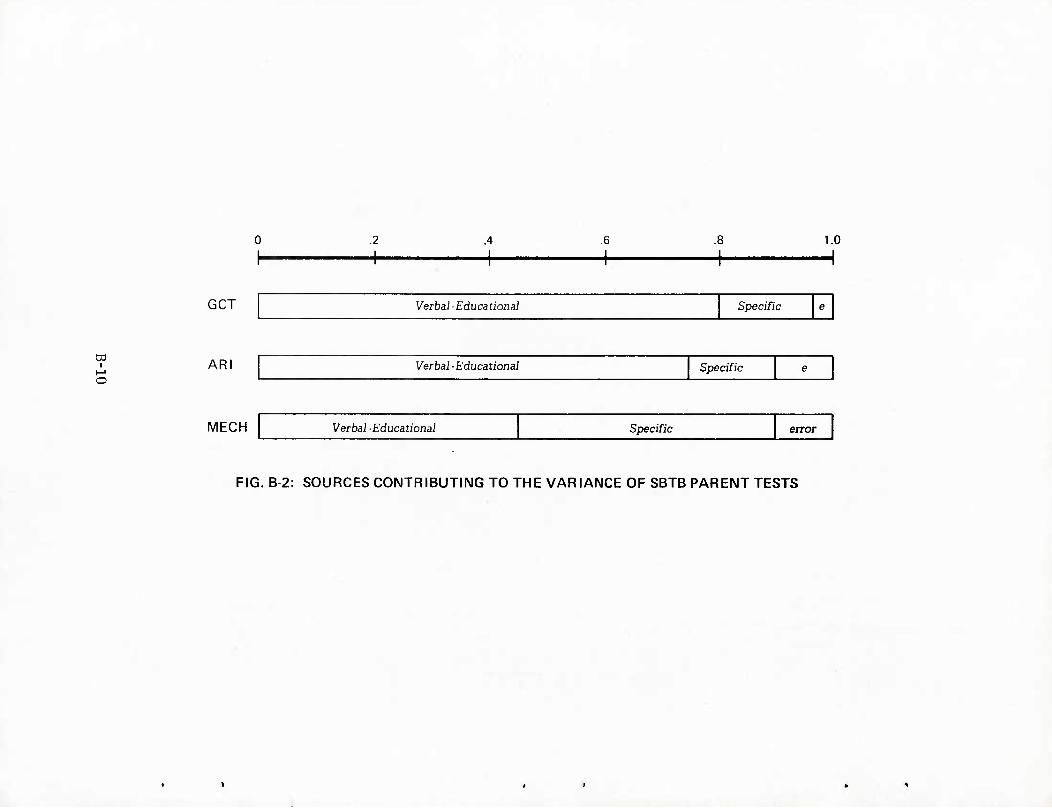
1.0
GCT Verbal-Educational Specific e
I
o ARI Verbal -Educational Specific e
MECH Verbal -Educational Specific error
FIG. B 2: SOURCES CONTRIBUTING TO THE VARIANCE OF SBTB PARENT TESTS

TABLE B-4
FACTOR STRUCTURE AND WEIGHTS OF THE PARENT SBTB TESTS IN 3 SAMPLES
FY 1966 Full Range Navy Recruit Sample (N = 1, 707)
Intercorrelations h^
KR G A M FPC* i3 20
G 1,00 .72 .35 .90 .44 .81 .97 A 1.00 .35 .87 .43 .75 .90 M 1.00 .68 .34 .46 .91
FY 1973 Male Caucasian Accession
..ft (N = 68, 337)
Intercorrelations h^
KR G A M FPC* i3 20
G 1.00 .71 .40 .89 .45 .80 .97 A 1.00 .33 .87 .44 .75 .90 M 1.00 .65 .33 .43 .91
FY 1973 Male Non-Caucasian Accessions (N = 9, 770)
Intercorrelations G
1.00
A
.58
M
.31
FPC*
.84 .47
h^
G .71 A 1.00 .29 .84 .46 .70 M 1.00 .63 .35 .39
'^First principal component of the intereorrelation matrix. Similar factor patterns also obtained with SMCs inserted in diagonal of the correlation matrix.
B-11

Electronics Technician Selection Test (ETST), three separately timed sections: mathematics (20 items in 25 minutes); science (20 items in 15 minutes); and electricity and radio (30 items in 20 minutes).
Total administration time is about four hours, which includes 187 minutes of testing time. Raw scores are converted to Navy Standard Scores based on a World War II norm with a mean of 50 and standard deviation of 10.
Scores on these tests are summed into various two- and three-test composites to determine eligibility for Class A Schools based on the correlations of the tests with Final School grades. Recruits may have up to six points waived on two-test composites or up to nine points waived on three-test composites when the supply is below the number required to meet school quotas or they have been enlisted under the direct procurement program for high school and junior college graduates. Fleet personnel may have a larger number of points waived. The test composites will be discussed later in conjunction with those used with the ASVAB and SBTB.
The BTB Form 7 tests were factored in four rather different samples:
1. A 1966 "full range" recruit sample of 1707 cases (reference 55).
2. A selected sample of 2, 389 out of 3, 115 first-term E-4 and E-5 men returning from sea duty aboard two carriers and several destroyers in late 1971 and early 1972 for whom BTB scores could be found on the Enlisted Master Tape. Most of these petty officers were tested in 1968. They had served an average of 3.3 years, 96 percent were at least high school graduates, and 80 percent had completed Class A School. All but five percent were Caucasian (reference 5).
3. FY 1973 male Caucasian accessions: 80 percent of the total or 68, 337 men for whom BTB scores were found on the master tape. 1
4. FY 1973 male non-Caucasian accessions: 68 percent of the total or 9, 770 men for whom BTB scores were found on the master tape.
Table B-5 shows the test means and standard deviations for these samples. The sample of petty officers had the highest average scores. The FY 1973 accessions had higher average scores than their counterparts in 1966, confirming a time trend observed since World War II when the test noirms were established. The FY 1973 Caucasian accessions also had substantially higher average scores in most cases than did their non- Caucasian counterparts. This also was expected based on past Navy testing experience.
T3TB scores of approximately 5000 female accessions in FY 1973 had not been entered on the master tape at the time the data was acquired in September 1973.
B-12

TABLE B-5
BTB FORM 7 STATISTICS FOR FY 1973 MALE ACCESSIONS BY RAGE
Caucasian Test Mean S.D.
GCT 54 9.6
ARI 52 8.3
MECH 50 7.7
CLER 53 9.5
ETST 54 9.8
SP 52 7.9
Max. N 68, 337 C*J
Non-Ca ucasian S.D.
Percent Overlap
1966 Recruit sample
1971 Petty Officer sample
Mean Mean S.D. Mean SX).
45 - 9.1 61 49 10.5 63 6.1
u 6.9 62 50 8.5 61 5.7
41 6.5 52 49 8.0 55 7.7
49 9.9 85 45 8.0 54 8.2
4f 9.0 70 51 9.9 65 6.5
43 6.7 56 SO 8.3 56 7.2
9, 770 1, 707 2, 389

Assuming that the Caucasian and non-Caucasian score distributions are random samples from normally distributed populations with the same standard deviations, the overlap in their score distributions is around 55 percent on the MECH and SP tests, 60 percent on the GCT and ARI, 70 percent on ETST, and 85 percent on CLER. Overlap values between 50 and 75 percent denote fairly good separation between groups, but the 85 percent value indicates little practical difference (reference 57).
The average intercorrelations of the six BTB tests are about .45 for the 1966 and FY 1973 Caucasian samples, and around .30 for the petty officer and FY 1973 non- Caucasian samples - both of which are restricted in their ranges of test scores. The intercorrelations for the FY 1973 accession samples are shown in table B-6,
When we factored the intercorrelation matrices of the six tests (see table B-7), three factors emerged with striking similarity across the four samples. In each case, the biggest factor is measured with roughly similar weights by ARI, ETST, and GCT. This is a verbal-educational factor. The second factor is defined by tool and shop practice knowledge and comprehension of mechanical principles. The smallest factor is repre- sented by CLER alone, a perceptual speed and accuracy test.
The BTB composition expressed in terms of the sources of variance in the tests is illustrated in figure B-3 for the FY 1973 Caucasian accessions. From 70 to 75 percent of the variance of ARI, ETST, and GCT is accounted for by verbal-educational aptitude. GCT and ARI have the largest amounts of specific variance in the battery, about 10 and 15 percent, respectively. Over 80 percent of the variance of MECH and 76 percent of the variance of SHOP are contributed by practical knowledge and comprehension of mechanical principles. Nearly all of the variance of CLER is attributable to perceptual speed and accuracy.1
In summary, BTB measures three things: verbal-educational aptitude, practical mechanical knowledge, and perceptual speed. If we are to use only those tests which best represent the three group factors in the BTB, we would retain ARI, MECH, and CLER. However, since specific and lesser group factors may be important in validating the tests against Final School Grades, it would be a mistake to reduce the BTB on the basis of factor
The KR 20 internal reliability estimate for CLER was less than its communality, prob- ably because it is an inappuopriate estimate of reliability for a highly speeded test of this nature. The case might also be m.ade that the factorization was overdetermined by extracting CLER as a separate factor unto itself. However, had this not been done, the specificity of CLER would have been greater than its communality, implying a separate factor unrelated to the rest of the battery - which is what we have shown by extracting it as a separate factor.
B-14

TABLE B-6
INTERCORRELATIONS OF BTB FORM 7 TESTS FOR FY 1973 MALE ACCESSIONS BY RACE
Caucas: ian ; Non-Caucasian GCT ART MECH CLER ETST SP GCT ARI MECH CLER ETST SP
GCT - .71 .40 .27 .70 .49 .58 .31 .23 .48 .43 ART - .33 .32 .68 .39 ~ .29 .23 .48 .34 MECH - .05 .39 .71 .05 .26 .49 CLER - .24 .08 - .13 .11 ETST - .45 ' - .32 SP _ - .
Cti:

TABLE B-7
BTB FORM 7 VARIMAX FACTORS FOR DIFFERENT SAMPLES*
FY 73 Caucasian Accessions FY 73 Non-Caucasian Accessions
Test I 13 II ^ III h^ Test I ^ II ^ III h^
ARI .87 .40 .81 ARI .80 .39 .70 ETST .85 .37 .79 ETST .82 .49 .69 GCT .85 .31 .81 GCT .76 .30 .69 MECH .91 .59 .87 MECH .87 .64 .78 SHOP .87 .45 .85 SHOP .80 .49 .72 CLER .98 .99 CLER .98 .98
% Trace 39 29 17 85 % Trace 28 26 20 74
1966 Recruit Sample 1971 Petty Officer Sample
7 1—■
I A II 13 III h^ I ^ II 13 III h^
ARI .85 .40 .81 ARI .87 .35 .77 ETST .82 .39 .74 ETST .84 .06 .78 GCT .83 .30 .80 GCT .85 .85 .75 MECH .91 .62 .88 MECH .92 .92 .86 SHOP .85 .41 .85 SHOP .90 .25 .85 CLER .f7 .99 CLER .99 .99
% Trace 38 29 17 84 % Trace 37 29 17 83
''Only loadings ^ . 30 shown.
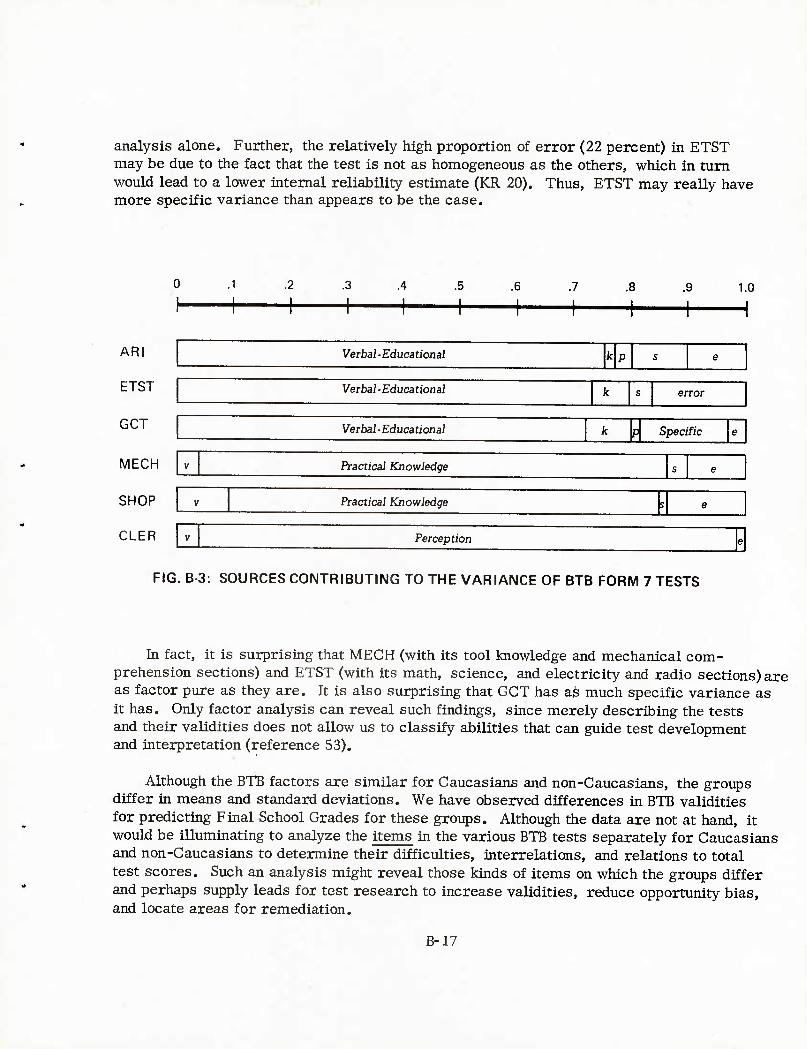
.i"«;?-.
analysis alone. Further, the relatively high proportion of error (22 percent) in ETST may be due to the fact that the test is not as homogeneous as the others, which in turn would lead to a lower internal reliability estimate (KR 20). Thus, ETST may really have more specific variance than appears to be the case. 5
.6 .8 .9 1.0
ARI
ETST
GCT
MECH
SHOP
CLER
Verbal-Educational
Verbal-Educational k s error
Verbal ■ Educational k p Specific
Practical Knowledge
Practical Knowledge
Perception
FIG. B 3: SOURCES CONTRIBUTING TO THE VARIANCE OF BTB FORM 7 TESTS
In fact, it is surprising that MECH (with its tool knowledge and mechanical com- prehension sections) and ETST (with its math, science, and electricity and radio sections) are as factor pure as they are. It is also surprising that GCT has as much specific variance as it has. Only factor analysis can reveal such findings, since merely describing the tests and their validities does not allow us to classify abilities that can guide test development and interpretation (reference 53).
Although the BTB factors are similar for Caucasians and non-Caucasians, the groups differ in means and standard deviations. We have observed differences in BTB validities for predicting Final School Grades for these groups. Although the data are not at hand, it would be illuminating to analyze the items in the various BTB tests separately for Caucasians and non-Caucasians to determine their difficulties, interrelations, and relations to total test scores. Such an analysis might reveal those kinds of items on which the groups differ and perhaps supply leads for test research to increase validities, reduce opportunity bias, and locate areas for remediation.
B-17

Another way of looking at the relations among the BTB tests makes use of correlation analysis. The best single and multiple predictors of each test from among the other tests are shown in table B-8 for the FY 1973 Caucasian and non-Caucasian accessions.
TABLE B-8
BEST PREDICTORS OF EACH BTB TEST FROM REMAINING BTB TESTS FOR FY 1973 MALE ACCESSIONS BY RACE
Single best predictor & r
Multipl e best predictors Test R ^
Caucasian
GCT ARI .71 .77 .44 ARI .40 ETST ARI GCT .71 .76 .44 GCT .35 ETST .12 CLER MECH SHOP .71 .71 .67 SHOP .09 ETST CLER ARI .32 .33 .26 ARI .09 GCT ETST GCT .70 .75 .39 GCT .36 ARI . 12 SHOP SHOP MECH .71 .74 .61 MECH .25 GCT
Median correlation* .71 .75
Non-Caucasian
GCT ARI .58 .66 .40 ARI .22 SHOP. 22 ETST ARI GCT .58 .63 .43 GCT .26 ETST, 10 CLER MECH SHOP .49 .51 .44 SHOP .14 ARI CLER GCT or
ARI .23 .26 .15 GCT .15 ARI ETST GCT or
ARI .48 .55 .29 ARI .27 GCT . 11 SHOP SHOP MECH .49 .58 .38 MECH .27 GCT .09 ETST
Median c :orrelation* .49 .58
* Excluding CLER
Excluding CLER, which is relatively unpredictable from the other BTB tests, the simple and multiple correlations of each test with its best predictor(s) are remarkably homogeneous within the two accession groups. For the Caucasians, the median simple correlation is .71 and the median multiple correlation is .75. Though the difference between these two coefficients is small, both values indicate that each test is predictable from another test(s) in the battery. The standard error of estimating a given test from another is about 5 to 6 standard score points, except for CLER at 9 points. A similar situation holds for the non-Caucasians although the relationships are lower. The median
B-18
simple correlation here is .49 and the median multiple correlation is .58, a greater difference in the case of the Caucasians. The standard errors of estimate are 6 or 7 standard score points, except for CLER at 10 points. Overall, knowing the GCT, ARl, and MECH scores enables one to fairly well predict the ETST and SHOP scores, but CLER cannot be predicted from any other tests.
BASIC TEST BATTERY 8
During FY 1975, the new BTB Form 8 will replace Form 7. It will probably be administered at the 130 or so Recruiting Stations by Navy Coimselors (Personnelmen with 2612 NEC codes) to all recruits except those who have taken the ASVAB. These recruits will later take Form 8 during recruit training. BTB Form 8 is shorter than its predecessor, requiring only 88 minutes of testing time and 2-1/4 hours to administer. Its composition is shown below:
Test
GCT ARI MECH SHOP
EST (Electronics Selection Test)
CST (Coding Speed Test)
Total
Testing time
13 24 15 8
24
88
No. of items
35 20 25 15,
14 math
30 6 science 10 elec. &
radio 80
205
The tests are being validated against Class A School and job performance criteria. They were developed from the full length tests in Form 7, using a computerized item selection program, with a negligible loss in reliability and no loss or even a slight gain in validity for predicting the Recruit Final Achievement Test (reference 56). The Coding Speed Test is a new clerical test obtained from the Army. ^
The readability of the printed directions for Form 8 were calculated using the Flesch method (reference 58). The reading ease scores were aU at the sixth grade reading level.
A short CLER was not developed because of its highly speeded nature. Item analysis techniques are not appropriate for speeded tests in which items are so easy that anyone can answer them correctly if given enough time.
B-19

COMPARATIVE COMPOSITES ON SBTB, ASVAB, AND BTB
A comparison of the SBTB, BTB-7 and ASVAB-IT test composites for school and rating qualification is contained in table B-9. Only those composites which are used for the largest numbers of ratings will be compared, and these are shown below:
SBTB No. of
Composite ratings
G+A 31 G+M 26
Total 57
BTE ! 7 ASVAB II No. of No. of
Composite ratings Composite ratings
G+A 26 +NF WK + AR 26 G-tM-fSP 26+NF WK+TK^MC^6I 26 A+2ETST 10 + NF
+ AEF WK+AR+EI 10
62 62
The seven composites above are the workhorses of the three batteries, and the individual tests involved in them are nominally alike, e.g., the short GCT was derived from the BTB GCT and both are measures of verbal ability like the WK or Work Knowledge test in the ASVAB. However, the actual relationships among them vary considerably. Table B-lO shows the correlations for a Navy sample corrected for selection on the AFQT (reference 52, table 7),
Although some of the tests are highly correlated, they are by no means perfectly substitutable. Consequently, some recruits who pass WK will fail GCT, and vice versa. Figure B-4 illustrates the situation for the .78 correlation between WK and GCT. The shaded area represents those who passed WK but failed GCT. The slashed area repre- sents those who failed WK but would have passed GCT. As the correlations between tests become lower, these two areas increase. A similar situation exists between the GCT in the short and long batteries. Since they are not perfectly correlated, some men who pass the short version during accession testing will fail the long version administered in recruit training. Conversely, some men who failed the short version and were turned away would have passed the long version. All of this points to the danger of using mul- tiple test batteries even when the tests are highly coinrelated. Since tests cannot be made error free, mistakes are bound to occur, and this indeed has been the Navy's experience with the short and long BTBs. The only way to avoid the problem is to administer only one battery.
B-20

26
TABLE B-9
SBTB, BTB, AND ASVAB II COMPOSITES FOR RATING AND SCHOOL QUALIFICATION
No. of Qualif. ratings SBTB BTB ASVAB II Score Rating or school 27 G+A G+A WK+AR 100
105*
110
CS,SD,SH; DT&RM (SBTB=105) AK,AZ,CTO,DK,EA,
PH,PT,QM,SK,SM; HM(SBTB=110)
AC,AG,AW,DP,OS,PC, PN,TM; EW(SBTB N.A.)
3 G+A G+C WJ+CS 110 CTA,JO,YN
1 G+A= 105 A+ETST= =105 WJ+AR+EI= =156 -- AO
1 G+A= 110 G+M+ETST=156 (WK+TK+MC+SI OT
G+M G+M+SP
=156) + (WK+AR+EI=156)
WK+TK+MC+SI
1 A+M=110 A+2ETST=160 WK+AR+EI=163
8 N.A. A+2ETST=171 with ETST min. of 55
WK+AR+EI=170
1 Field N.A. A+2ETST=171 with ETST min. of 55
N.A.
1 Field N.A. (G+A=115 + (A+2ETST=171 with ETST min. of 55) + (G+M+SP=147)
N.A.
100/150/150 BU,CM,SO,SW,UT 105/156/156 AB,AD,AM,AS,BT,
CE,EM,EN,GMT, HT,IC,ML,MM,MN, MR,PM,PR
110/163/163 GMG,GMM,IM,OM
AE
AV (for AQ,AT,AX, TD selection), ET, FTM.FTG; ST (Sonar = 55)
Advanced Electronics Field Program
Nuclear Field Program
Ref: COMNA VCRUITCOMINST 1130.8 CH-18 of 28 Feb 74 *ForBTB: G+A=100+RCAT=55 or GT=100for CTR/T; G+A+C=155 or GT=105+CL=105 for CTI + 77ie TKandMCscores
are halved in computing the composite score.
B-21

TABLE B-10
CORRELATIONS BETWEEN ASVAB I AND BTB FORM 7 TESTS
ASVAB test
WK
MC
AR
SI
TK
El
BTB test
GCT
MECH (MC)
ARI
Shop
MECH (TK)
ETST (Elex. & Radio)
Correlation
.78
.71
.65
.54
.42
GCT
50 /^^^
0 PASS BOTH TESTS
/
i /
(
/ / FAIL f BOTH
TESTS
y
I'ASSWX / BUT / FAIL / GET/
r = .78
_L 50 WK
FIG. B-4: DIAGRAM OF CORRELATION BETWEEN WK AND GCT
B-22

NAVY VOCATIONAL INTEREST INVENTORY
In early 1947, items were written for the Minnesota Vocational Interest Inventory to estimate the degree to which either a recently recruited enlisted man would like the tasks involved in each of many Navy ratings or a youth of high school age would like the work involved in each of a wide variety of occupations below the professional level. The joint purpose was established so that work with Navy men could be adapted for civilian groups and work with civilian groups could be related to that with Navy men. Thus, the inventory was prepared in two forms with identical items, the forms differing only in title and cover page. The Navy version was called the Navy Vocational Interest Inventory (NVII).
The items were written to minimize the effects of intelligence, special abilities, and technical competence derived from job experience. Later evidence showed this to be the case. The Inventory is intended to abstract from a wide variety of occupations the tasks involved to permit a person to express preferences for tasks rather than occupations. Thus it seeks to reduce the effects of ignorance about the true nature of an occupation, and differences in prestige, income and availability of jobs among occupations (reference 59).
Some 19, 000 Navy and 6000 civilian men took the inventory, including 10, 000 Navy rated men who passed through all Navy receiving stations during the fall of 1951. The Navy samples were weU drawn and representative of Navy occupations or ratings. The ratings were found to be reliably different from one another on the NVII, enough so that the differences could be used in classification and counseling.
In the past 20 years, the Navy has done much research with the NVn. The interest keys generally have been found not to correlate highly with Basic Test Battery scores, but rather to supplement them in predicting Final School Grades in Class A Schools. In addition, they relate to measures of job satisfaction and retention.
If the NVII was useful for classification, why has it not been used along with the BTB for this purpose? There are a variety of reasons, including the problems involved administering and scoring the 190 item inventory for up to 19 keys, and the fact that the Recruit Training Centers at which the NVII would have been given each have different test scoring machines. To alleviate the administrative burden of NVII testing, the Inventory might be completed by an applicant at home. Earlier work with the Strong Vocational hiterest Blank supports such a policy for NROTC applicants and might apply to enlisted applicants (reference 60).
NPRDC recently developed 15 keys from a revised NVII to reflect the extent to which a person's interests correspond to those of satisfied men in the ratings. The key reli- abilities are sufficiently high, as high as the reliabilities of the BTB tests (reference 61).
B-23

The intercorrelations of the 15 keys, shown in table B-11, are also very high for aU but the SK, HM, and CS ratings (reference 62). The average correlation including these three keys is .83, strongly suggesting that 15 different patterns of interest are not being measured. Indeed, the results of a principal components analysis of the correlation matrix (table B-12) reveals three factors: one for SKs, one for HMs, and one for the other 13 ratings where CS has the smallest loading. The conclusion that the 15 occupa- tional scales appear promising for use in guiding individuals in appropriate Navy ratings and will probably be recommended for operational use in the near future is optimistic, but supported by later NPRDC data showing that most men who would choose their rating over again would have been directed to that rating based on their NVII scores, while much smaller percentages of men who would not choose their rating again would have been directed to that rating.
REPORT OF ENLISTED PERFORMANCE EVALUATION (NAVPERS 792)
In early 1967, all naval commands were instructed to forward to the Naval Personnel Research Activity, San Diego, duplicate copies of the regular performance evaluations of enlisted men whose service numbers ended in "7, " yielding a 10 percent sample. Pay grades E-8 and 9 were oversampled because of their sparsity, and E-1 was not included because most men are advanced to E-2 before the minimum 90-day marking period elapses. The intercorrelations among the five traits on the form for 33, 918 men are shown in table B-13 (reference 63).
The high correlations, averaging .77, and the similarity of means, and standard deviations for all five traits are immediately apparent. This strongly suggests that five different traits are not being measured.
A principal component analysis was made of the intercorrelation matrix using unities as communality estimates.
The first principal component accounted for 82 percent of the trace of the matrix (eigenvalue 4.1, while those of the remaining factors were . 30 and below). Clearly, a general factor accounts for most of the variance among the traits. The factor loadings ranged narrowly from . 88 to .92, and their beta weights for predicting the general factor were all about .22. Therefore, most men who received high or low marks on one trait would tend to receive similar marks on the rest of them. This is probably attributable to the rater marking all traits based upon his general impression of the man rather than making a separate evaluation of each trait.
B-24

*
O
M
§
S
O
w
CO CO
o 00 as
m o CN CM <N <N CO ^ O
00 o CO o CO o •
in 00 •
•
ON ON •
•
00 ON •
•
in ON
•
•
ON
•
• 1
CO i-H
•
•
in NO
•
• 1
ON •
• 1
ON •
• 1
ON ON
•
•
NO ON
•
• 1
00 OS •
• •
00 •
OS
• 1—1
o\ • O Ov •
CNJ ON
• 00
• 00 o
• NO •
00
• ON
• CO 00
• i-H 00
• vO 00
•
in 00
• in as • ON
• o ON
00
• o • • ON ON •
ON ON
• 00 ON
• ON as
•
ON NO 00
CO ON o in ON ON
ON ON ON
CM r^ t^ CM 00 ON ON ON
r^ CO NO 00 ON NO ON ON
o w 2 O 1—(
Pi Pi o u oi m
ml
Z
CO U
Q
Pi
w
00
00 00
H' ^ 00
cy
CO CN ON ON
ON ON
00 00
CM NO CO "* ■*
00 ^ O --H 00 00 00 ON
^ in •* ON CT\ ON
00 ON NO ON
r~- CO ■-< NO cs csi o I> ON ON 00 1> i-l t^
NO CO O 00 NO ON NO \o NO in in o
iwHcclQcoOWcaH O Q t^ w w <: <l <l
CO i> ON 1—1
u
-8 o O
I
Pi H U D Pi
3 O *
B-25

TABLE B-12
NVII FACTORS''
Loading (s . 40) Rating I II III h^"
.99
.99
.99
.99
.97
.97
.97
.96
.94
.41 .96
.96
.54 .96
.53
.99 .99
.98 .97
9.8 9.7 94
EM .99
AO .99
AE .99
BT .98
EO .98
EN .98
ST .97
ET .96
RM .93
AC .87
QM .86
DP .79
CS .71
SK «
HM
% Trace 74.8
"Principal components with eigenvalues s l.O and Varimax rotation.
B-26

.84 .76 .81 3.62 .33
.74 .74 .79 3.62 .33
A .72 .80 3.70 .28
.77 3.63
3.65
.30
.28
.. TABLE B-13
INTERCORRELATIONS OF REPE TRAITS (N = 33, 918)
: MB LE_ MA AD Mean S.D.
Professional performance .76
Military behavior
Leadership/supervision
Military appearance
Adaptability
To find out what specific factors underlie the intercorrelations, the effect of the general factor must be removed. Since the factor loadings are correlations between the traits and the general factor, the effect of the general factor was partialled from the iatercorrelation of each pair of traits. The reduced correlations are shown in table B-14.
TABLE B-14
REPE TRAIT INTERCORRELATIONS WHEN GENERAL FACTOR REMOVED
MB LE MA AD'
Professional performance
Military behavior
Leadership/supervision
Military appearance
The average correlation of the reduced matrix is .25. Refactoring this matrix with squared multiple correlations in the diagonal produced two factors which accounted for 97 percent of the trace. After Varimax rotation, the loadings of the five traits on these two factors were as follows:
Professional performance Adaptability Military behavior Leadership/supervision Military appearance
B-27
.35 -.03 .29 .27
.35 .21 .18
.40 .22
.24
Specific factor I II
.06 .61
.25 .34
.36 .40
.65 .07
.46 .32
The first specific factor is defined by Leadership and supervisory ability and the second by Professional Performance.
What the REPE measures, then, is primarily a general impression of a man, in the eyes of his supervisor. Only secondarily does it assess leadership and professional performance as defined on the form. It is not surprising, then, that selection test scores and advancement exam grades generally do not correlate with REPE.
'»■
B-28

APPENDIX C
CLASS A SCHOOL REGRESSION LINES AND STATISTICS FOR BLACKS AND WHITES

TABLE C-1
DESCRIPTIVE STATISTICS AND REGRESSION TESTS FOR 8 A SCHOOLS
O
School
1. HM(GL)
2. HM(SD)
3. DTXSD)
4. AMM
5. AMS
6. AZ
7. AV
8. AVT
Race
Black White
Black White
Black White
Black White
Black White
Black White
Black White
Black White
BTB selector
Mean S.D.
104 113
103 114
103 113
154 169
154 169
105 114
175 187
148 167
8,4 12.9
6.7 12.4
6.4 12.0
20.0 13.5
8.9 13.4
7,2 12.5
24.0 16.7
9.0 13.5
FSG Mean S.D.
80 83
85 87
85 87
72 77
74 76
81 86
77 79
76 79
7.0 8.9
5.3 6.1
4.8 4.8
4.4 5.7
3.5 5.0
6,4 7,1
9.5 7.6
5.3 7.4
Correlation of selector Black-white significance tests'
and FSG Resideral variation Slope Intercept St p— "~F Uncorr, Corr. dt p -P- -3r
,47 .68
.37
.65
,23 ,53
,00 ,46
.12 ,36
,49 ,57
,36 .53
,32 ,39
1.082 93,823 NS 0.842 1,916 NS 6.971 1,917 <.01
1.151 37,762NS 0,044 1,799 NS 2,714 1,800 ,10
1.320 53,372<,05 0.211 1,425 NS 0.256 1,426 NS
.64
.78
,61 ,76
,43 ,66
.00 1.228 12,615NS 7,795 1,627 <,01 1,329 1,628 NS ,65
.24 1.587 9,723.10 0.269 1,732 NS 0 1,733 NS
.53
.80 1.162 27,444NS 2.075 1,471 NS 0.510 1,472 NS
.70
.21 1.934 38,703 <.01 4.645 1,741 <.0S 2.276 1.742 NS
.53
.39 1.029 63,909 NS 0.861 1,972 NS 2,766 1,973 <.10
.57
•A significant difference between balcks and white on any one of these tests Is sufficient to reject the hypothesis that thetr regression lines are the same.

TABLE C-2
UNFITTED DATA ON HM(GL) SCHOOL STUDENTS
Whltea Blacks BTB selector score Mean FSG Number Mean FSG Nuniber
83 76.0 1 88 6S.S 2 90 84.5 i 80.0 1 91 69.0 1 93 79.5 2 83.0 94 72.9 23 78.2 95 74.9 19 78.6 96 73.5 23 75.1 97 73.6 16 98 76.3 32 65.5 99 77.8 24 76.7
xoo 78.6 11 77.5 101 75.8 23 77,0 102 80.1 20 80.1 103 79.2 22 81.6 104 75^3 30 82.0 105 78.1 20 76.7 106 78.S 22 80.5 107 80.4 18 82.3 108 80.5 28 84.0 109 78.4 30 80.0 110 82.2 26 87.0 111 78.5 24 81.3 112 83.3 26 92.5 113 83.5 20 81.0 114 79.2 17 82.0 115 82.3 16 83.5 116 83.5 14 8S.7 117 83.0 13 91.0 3 118 84.5 23 119 85.9 16 120 ^ 86.9 17 "■ «1^- ■ 2 ■ 121 85.3 17 122 85.9 12 123 86.8 26 91.0 1 124 88.9 15 125 88.2 15 126 92.1 17 127 91.3 9 128 87.7 12 89.0 1 129 90.8 10 130 92.7 10 131 90.6 9 87.0 1 132 93.4 10 133 92.4 8 134 91.9 11 135 93^2 11 , 136 93.5 8 137 92.3 '15 138 94.3 8 139 95.2 5 140 94.8 5 141 95.0 6 142 96.0 2 143 97,3 3
C-2

a
95
93
91
89
87
85
83
81
79
77 LL
75
73
71
69
67
65
85 88 91 94 97 100 103 106 109 112 115 118 121124
BTB selector score
Note: Raw data is given in table C-2 on page C-2
0)
CO
O O
CD c
-
- •
9 ^ • ■ ■ • ■ • •■ • ■ ^ • ■ • ■ •• ■ • ■ ~~ • ■ • ■ • • ■
• ■ ■^ • ■ • ■ •• ■ • ■ ^ • ■■
• ■ • • ■ • ■ ^ • ■ • • ■ • ■ • ■ .^ • ■
••• __ ,■ "White
• Black ■ ■"
-
J 1 1 1 1 1 i 1 1 1 i 1 1
ct> ■o
CD
o o
CD c
95
93
91
89
87
85
83
81
79
77
75
73
71
69 -
67 -
65
• • ■
• • ■■ • • ■
• • ■■ • • ■
• • ■■ • ■
• • ■
• • ■ • • ■
J l_L I I I I I
85 88 91 94 97 100 103 106 109 112 115 118 121124
BTB selector score
FIG. C-1: HM SCHOOL (GREAT LAKES) FIG. C-2: HM SCHOOL (SAN DIEGO)

o I
03 T3
O O
c
95 p
93 -
91
89
87
85
83
81
79
77
75
73
71
69
67
65
• • • • •• ■
• ••■
■ ••• • •• ■ •••
■ White
• Black
± J I I L J I 85 88 91 94 97 100 103 106 109 112 115 118 121
BTB selector score
FIG. C-3: DT SCHOOL (SAN DIEGO)
0) ■a
o o
c
95 I-
93
91 -
89
87
85
83
81
79
77
75
73
71
69
67
65 _L _L _L _L _L i. 126 134 142 150 158 166 174 182 190
BTB selector score
FIG. C-4: AMH SCHOOL
■«

n en
O O u in
15 C
/a ■ ■■ ■
77 ^ ■ ■
■ 76
" ■
■■ ■ •••
■■ •••• 75 ■
■ ■■••• ••••
•••• ••••
•••• ••
74 — • ••• • •••■
•••• ■■ •••• ■ •••• ■■ 73 — ■
H ■
■■
72 ■
■ ■ White • Black
71
70 1 i 1 J L. 1 I,.. L.n..LJ
100 I-
96
92
88 0)
■o en 05 84
O O 80
76
72
68
64
60 135 140 145150 155 160 165 170 175 180 185
BTB selector score
• • ■■ • ■■■
■ ■ •
J L J L J L 90 94 98 102 106 110 114 118 122 126 130
BTB selector score
FIG. C-5: AMS SCHOOL FIG. C-6: AZ SCHOOL

o
85 I-
80
■o CO
o o
as C
75
70
65 I I
■ White
• Black
I L J.
85 r
J 141 149 157 165 173 181
BTB selector score
189 197
Qj 80 ■D CO \^
o o
c u. 75
70 _L J I L 120 130 140 150 160 170 180 190
BTB selector score
FIG. C-7: AV SCHOOL FIG. C-8: AVI SCHOOL
%>

Ulb/pZo FOR OFFICIAL USE ONLY
~A
\x
FOR OFFICIAL USE ONLY