SystemTap Beginners Guide - Introduction to SystemTap · SystemTap Beginners Guide Introduction to...
94
SystemTap 3.0 SystemTap Beginners Guide Introduction to SystemTap Don Domingo William Cohen
Transcript of SystemTap Beginners Guide - Introduction to SystemTap · SystemTap Beginners Guide Introduction to...
SystemTap 3.0
SystemTap Beginners Guide
Introduction to SystemTap
Don Domingo
William Cohen
SystemTap Beginners Guide
SystemTap 3.0 SystemTap Beginners GuideIntroduction to SystemTapEdition 3.0
Author Don Domingo [email protected] William Cohen [email protected] Hat, Inc.Copyright © 2013 Red Hat, Inc
This documentation is free software; you can redistribute it and/or modify it under the terms of the GNUGeneral Public License version 2 as published by the Free Software Foundation.
This program is distributed in the hope that it will be useful, but WITHOUT ANY WARRANTY; withouteven the implied warranty of MERCHANTABILITY or FITNESS FOR A PARTICULAR PURPOSE. See theGNU General Public License for more details.
You should have received a copy of the GNU General Public License along with this program; if not, writeto the Free Software Foundation, Inc., 51 Franklin Street, Fifth Floor, Boston, MA 02110-1301 USA.
For more details see the file COPYING in the source distribution of Linux.
This guide provides basic instructions on how to use SystemTap to monitor different subsystems of aLinux system in finer detail.

iii
Preface v1. Document Conventions .......................................................................................................... v
1.1. Typographic Conventions ............................................................................................ v1.2. Pull-quote Conventions .............................................................................................. vi1.3. Notes and Warnings .................................................................................................. vii
2. We Need Feedback! ........................................................................................................... viii
1. Introduction 11.1. Documentation Goals ......................................................................................................... 11.2. SystemTap Capabilities ...................................................................................................... 11.3. Limitations of SystemTap .................................................................................................... 1
2. Using SystemTap 32.1. Installation and Setup ......................................................................................................... 3
2.1.1. Installing SystemTap ................................................................................................ 32.1.2. Installing Required Kernel Information Packages Manually ......................................... 32.1.3. Initial Testing ........................................................................................................... 5
2.2. Generating Instrumentation for Other Computers ................................................................. 52.3. Running SystemTap Scripts ................................................................................................ 7
2.3.1. SystemTap Flight Recorder Mode ............................................................................ 92.3.1.1. In-memory Flight Recorder ............................................................................ 92.3.1.2. File Flight Recorder ..................................................................................... 10
3. Understanding How SystemTap Works 113.1. Architecture ...................................................................................................................... 113.2. SystemTap Scripts ............................................................................................................ 11
3.2.1. Event .................................................................................................................... 133.2.2. SystemTap Handler/Body ....................................................................................... 15
3.3. Basic SystemTap Handler Constructs ................................................................................ 193.3.1. Variables ............................................................................................................... 193.3.2. Target Variables .................................................................................................... 20
3.3.2.1. Pretty Printing Target Variables ................................................................... 223.3.2.2. Typecasting ................................................................................................ 233.3.2.3. Checking Target Variable Availability ............................................................ 23
3.3.3. Conditional Statements .......................................................................................... 243.3.4. Command-Line Arguments ..................................................................................... 25
3.4. Associative Arrays ............................................................................................................ 263.5. Array Operations in SystemTap ......................................................................................... 26
3.5.1. Assigning an Associated Value ............................................................................... 273.5.2. Reading Values From Arrays .................................................................................. 273.5.3. Incrementing Associated Values ............................................................................. 283.5.4. Processing Multiple Elements in an Array ............................................................... 283.5.5. Clearing/Deleting Arrays and Array Elements .......................................................... 293.5.6. Using Arrays in Conditional Statements .................................................................. 313.5.7. Computing for Statistical Aggregates ...................................................................... 32
3.6. Tapsets ............................................................................................................................ 34
4. User-space Probing 354.1. User-Space Events ........................................................................................................... 354.2. Accessing User-Space Target Variables ............................................................................ 364.3. User-Space Stack Backtraces ........................................................................................... 37

SystemTap Beginners Guide
iv
5. Useful SystemTap Scripts 395.1. Network ............................................................................................................................ 39
5.1.1. Network Profiling .................................................................................................... 395.1.2. Tracing Functions Called in Network Socket Code ................................................... 415.1.3. Monitoring Incoming TCP Connections ................................................................... 425.1.4. Monitoring TCP Packets ......................................................................................... 435.1.5. Monitoring Network Packets Drops in Kernel ........................................................... 44
5.2. Disk ................................................................................................................................. 455.2.1. Summarizing Disk Read/Write Traffic ...................................................................... 465.2.2. Tracking I/O Time For Each File Read or Write ....................................................... 485.2.3. Track Cumulative IO .............................................................................................. 505.2.4. I/O Monitoring (By Device) ..................................................................................... 525.2.5. Monitoring Reads and Writes to a File .................................................................... 535.2.6. Monitoring Changes to File Attributes ..................................................................... 545.2.7. Periodically Print I/O Block Time ............................................................................. 54
5.3. Profiling ............................................................................................................................ 565.3.1. Counting Function Calls Made ................................................................................ 565.3.2. Call Graph Tracing ................................................................................................ 575.3.3. Determining Time Spent in Kernel and User Space ................................................. 585.3.4. Monitoring Polling Applications ............................................................................... 595.3.5. Tracking Most Frequently Used System Calls .......................................................... 625.3.6. Tracking System Call Volume Per Process ............................................................. 63
5.4. Identifying Contended User-Space Locks ........................................................................... 65
6. Understanding SystemTap Errors 676.1. Parse and Semantic Errors ............................................................................................... 676.2. Runtime Errors and Warnings ........................................................................................... 69
7. References 71
A. Revision History 73
Index 75
v
Preface
1. Document ConventionsThis manual uses several conventions to highlight certain words and phrases and draw attention tospecific pieces of information.
In PDF and paper editions, this manual uses typefaces drawn from the Liberation Fonts1 set. TheLiberation Fonts set is also used in HTML editions if the set is installed on your system. If not, alternativebut equivalent typefaces are displayed. Note: Red Hat Enterprise Linux 5 and later include the LiberationFonts set by default.
1.1. Typographic ConventionsFour typographic conventions are used to call attention to specific words and phrases. These conventions,and the circumstances they apply to, are as follows.
Mono-spaced Bold
Used to highlight system input, including shell commands, file names and paths. Also used to highlightkeys and key combinations. For example:
To see the contents of the file my_next_bestselling_novel in your current workingdirectory, enter the cat my_next_bestselling_novel command at the shell promptand press Enter to execute the command.
The above includes a file name, a shell command and a key, all presented in mono-spaced bold and alldistinguishable thanks to context.
Key combinations can be distinguished from an individual key by the plus sign that connects each part ofa key combination. For example:
Press Enter to execute the command.
Press Ctrl+Alt+F2 to switch to a virtual terminal.
The first example highlights a particular key to press. The second example highlights a key combination: aset of three keys pressed simultaneously.
If source code is discussed, class names, methods, functions, variable names and returned valuesmentioned within a paragraph will be presented as above, in mono-spaced bold. For example:
File-related classes include filesystem for file systems, file for files, and dir fordirectories. Each class has its own associated set of permissions.
Proportional Bold
This denotes words or phrases encountered on a system, including application names; dialog-box text;labeled buttons; check-box and radio-button labels; menu titles and submenu titles. For example:
1 https://fedorahosted.org/liberation-fonts/
Preface
vi
Choose System → Preferences → Mouse from the main menu bar to launch MousePreferences. In the Buttons tab, select the Left-handed mouse check box and clickClose to switch the primary mouse button from the left to the right (making the mousesuitable for use in the left hand).
To insert a special character into a gedit file, choose Applications → Accessories
→ Character Map from the main menu bar. Next, choose Search → Find… from theCharacter Map menu bar, type the name of the character in the Search field and clickNext. The character you sought will be highlighted in the Character Table. Double-clickthis highlighted character to place it in the Text to copy field and then click the Copy
button. Now switch back to your document and choose Edit → Paste from the geditmenu bar.
The above text includes application names; system-wide menu names and items; application-specificmenu names; and buttons and text found within a GUI interface, all presented in proportional bold and alldistinguishable by context.
Mono-spaced Bold Italic or Proportional Bold Italic
Whether mono-spaced bold or proportional bold, the addition of italics indicates replaceable orvariable text. Italics denotes text you do not input literally or displayed text that changes depending oncircumstance. For example:
To connect to a remote machine using ssh, type ssh [email protected] ata shell prompt. If the remote machine is example.com and your username on thatmachine is john, type ssh [email protected].
The mount -o remount file-system command remounts the named file system.For example, to remount the /home file system, the command is mount -o remount /home.
To see the version of a currently installed package, use the rpm -q package command.It will return a result as follows: package-version-release.
Note the words in bold italics above: username, domain.name, file-system, package, version and release.Each word is a placeholder, either for text you enter when issuing a command or for text displayed by thesystem.
Aside from standard usage for presenting the title of a work, italics denotes the first use of a new andimportant term. For example:
Publican is a DocBook publishing system.
1.2. Pull-quote ConventionsTerminal output and source code listings are set off visually from the surrounding text.
Output sent to a terminal is set in mono-spaced roman and presented thus:
books Desktop documentation drafts mss photos stuff svn

Notes and Warnings
vii
books_tests Desktop1 downloads images notes scripts svgs
Source-code listings are also set in mono-spaced roman but add syntax highlighting as follows:
package org.jboss.book.jca.ex1;
import javax.naming.InitialContext;
public class ExClient{ public static void main(String args[]) throws Exception { InitialContext iniCtx = new InitialContext(); Object ref = iniCtx.lookup("EchoBean"); EchoHome home = (EchoHome) ref; Echo echo = home.create();
System.out.println("Created Echo");
System.out.println("Echo.echo('Hello') = " + echo.echo("Hello")); }}
1.3. Notes and WarningsFinally, we use three visual styles to draw attention to information that might otherwise be overlooked.
Note
Notes are tips, shortcuts or alternative approaches to the task at hand. Ignoring a note should haveno negative consequences, but you might miss out on a trick that makes your life easier.
Important
Important boxes detail things that are easily missed: configuration changes that only apply to thecurrent session, or services that need restarting before an update will apply. Ignoring a box labeled“Important” will not cause data loss but may cause irritation and frustration.
Warning
Warnings should not be ignored. Ignoring warnings will most likely cause data loss.

Preface
viii
2. We Need Feedback!
If you find a typographical error in this manual, or if you have thought of a way to make this manual better,we would love to hear from you! Please submit a report in Bugzilla: http://sourceware.org/bugzilla/ againstthe product systemtap.
When submitting a report, be sure to include the specific file or URL the report refers to and the manual'sidentifier: SystemTap_Beginners_Guide
If you have a suggestion for improving the documentation, try to be as specific as possible whendescribing it. If you have found an error, please include the section number and some of the surroundingtext so we can find it easily.
Chapter 1.
1
IntroductionSystemTap is a tracing and probing tool that allows users to study and monitor the activities of thecomputer system (particularly, the kernel) in fine detail. It provides information similar to the output of toolslike netstat, ps, top, and iostat, but is designed to provide more filtering and analysis options forcollected information.
1.1. Documentation Goals
SystemTap provides the infrastructure to monitor the running Linux kernel for detailed analysis. This canassist administrators and developers in identifying the underlying cause of a bug or performance problem.
Without SystemTap, monitoring the activity of a running kernel would require a tedious instrument,recompile, install, and reboot sequence. SystemTap is designed to eliminate this and allows users togather the same information by running user-written SystemTap scripts.
SystemTap was initially designed for users with intermediate to advanced knowledge of the kernel.As a consequence, it is less useful to administrators or developers with limited knowledge of andexperience with the Linux kernel. Moreover, much of the existing SystemTap documentation is aimed atknowledgeable and experienced users, which makes learning the tool similarly difficult.
To lower these barriers, the SystemTap Beginners Guide was written with the following goals:
• to introduce users to SystemTap, familiarize them with its architecture, and provide setup instructions;
• to provide pre-written SystemTap scripts for monitoring detailed activity in different components of thesystem, along with instructions on how to run them and analyze their output.
1.2. SystemTap Capabilities
• Flexibility: SystemTap's framework allows users to develop simple scripts for investigating andmonitoring a wide variety of kernel functions, system calls, and other events that occur in kernel space.As a result, SystemTap is not so much a tool as it is a system that allows you to develop your ownkernel-specific forensic and monitoring tools.
• Ease of use: as mentioned earlier, SystemTap allows users to probe kernel-space events withouthaving to resort to instrument, recompile, install, and reboot the kernel.
Most of the SystemTap scripts enumerated in Chapter 5, Useful SystemTap Scripts demonstratesystem forensics and monitoring capabilities not natively available with other similar tools (such as top,oprofile, or ps). These scripts are provided to give readers extensive examples of the applicationof SystemTap and to educate them further on the capabilities they can employ when writing their ownSystemTap scripts.
1.3. Limitations of SystemTap
The current iteration of SystemTap allows for a multitude of options when probing kernel-space eventsfor a wide range of kernels. However, SystemTap's ability to probe user-space events depends on kernel

Chapter 1. Introduction
2
support (the Utrace mechanism) that is not available in many kernels. As a consequence, only somekernel versions support user-space probing.
At present, the developmental efforts of the SystemTap community are geared towards improvingSystemTap's user-space probing capabilities.

Chapter 2.
3
Using SystemTapThis chapter documents how to install SystemTap in the system and explains how to use the stap utilityto run SystemTap scripts.
2.1. Installation and Setup
To deploy SystemTap, install the SystemTap packages along with the corresponding set of -devel, -debuginfo, and -debuginfo-common packages for your kernel. If your system has multiple kernels installedand you intend to use SystemTap on more than one of them, also install the -devel and -debuginfopackages for each of those kernel versions.
The following sections discuss the installation procedures in greater detail.
Important
Many users confuse -debuginfo with -debug. Remember that the deployment of SystemTap requiresthe installation of the -debuginfo package of the kernel, not the -debug version of the kernel.
2.1.1. Installing SystemTapTo deploy SystemTap, install the following RPM packages:
• systemtap
• systemtap-runtime
To do so, run the following command as root:
yum install systemtap systemtap-runtime
Note that before using SystemTap, you still need to install the required kernel information packages. Onmodern systems, run the following command as root to install these packages:
stap-prep
If this command does not work, try manual installation as described below.
2.1.2. Installing Required Kernel Information Packages Manually
SystemTap needs information about the kernel in order to place instrumentation in it (in other words,probe it). This information also allows SystemTap to generate the code for the instrumentation.
Chapter 2. Using SystemTap
4
The required information is contained in the matching -devel, -debuginfo, and -debuginfo-commonpackages for your kernel. The necessary -devel and -debuginfo packages for the ordinary "vanilla" kernelare as follows:
• kernel-debuginfo
• kernel-debuginfo-common
• kernel-devel
Likewise, the necessary packages for the PAE kernel are kernel-PAE-debuginfo, kernel-PAE-debuginfo-common, and kernel-PAE-devel.
To determine what kernel your system is currently using, use:
uname -r
For example, if you intend to use SystemTap on kernel version 2.6.18-53.el5 on an i686 machine,download and install the following RPM packages:
• kernel-debuginfo-2.6.18-53.1.13.el5.i686.rpm
• kernel-debuginfo-common-2.6.18-53.1.13.el5.i686.rpm
• kernel-devel-2.6.18-53.1.13.el5.i686.rpm
Important
The version, variant, and architecture of the -devel, -debuginfo and -debuginfo-common packagesmust match the kernel you wish to probe with SystemTap exactly.
The easiest way to install the required kernel information packages is through yum install anddebuginfo-install commands. The debuginfo-install command is included with later versionsof the yum-utils package (for example, version 1.1.10) and also requires an appropriate yum repositoryfrom which to download and install -debuginfo and -debuginfo-common packages. You can install therequired -devel, -debuginfo, and -debuginfo-common packages for your kernel.
When the appropriate software repositories are enabled, install the corresponding packages for a specifickernel with the following commands:
yum install kernelname-devel-versiondebuginfo-install kernelname-version
Replace kernelname with the appropriate kernel variant name (for example, kernel-PAE), and versionwith the target kernel's version. For example, to install the required kernel information packages for thekernel-PAE-2.6.18-53.1.13.el5 kernel, run:
yum install kernel-PAE-devel-2.6.18-53.1.13.el5
Initial Testing
5
debuginfo-install kernel-PAE-2.6.18-53.1.13.el5
Once you have manually downloaded the required packages to the machine, run the following commandas root to install them:
rpm --force -ivh package_names
2.1.3. Initial Testing
If you are currently using the kernel you intend to probe with SystemTap, you can immediately testwhether the deployment was successful. If not, you restart the system and load the appropriate kernel.
To start the test, run the following command:
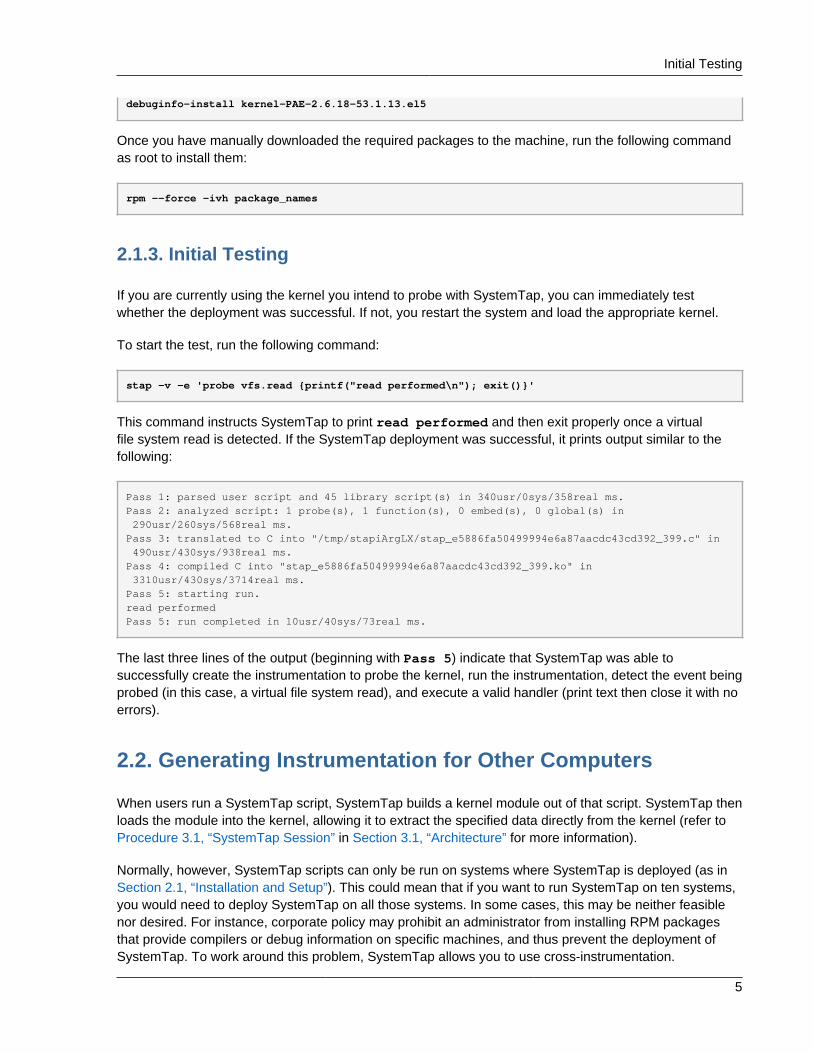
stap -v -e 'probe vfs.read {printf("read performed\n"); exit()}'
This command instructs SystemTap to print read performed and then exit properly once a virtualfile system read is detected. If the SystemTap deployment was successful, it prints output similar to thefollowing:
Pass 1: parsed user script and 45 library script(s) in 340usr/0sys/358real ms.Pass 2: analyzed script: 1 probe(s), 1 function(s), 0 embed(s), 0 global(s) in 290usr/260sys/568real ms.Pass 3: translated to C into "/tmp/stapiArgLX/stap_e5886fa50499994e6a87aacdc43cd392_399.c" in 490usr/430sys/938real ms.Pass 4: compiled C into "stap_e5886fa50499994e6a87aacdc43cd392_399.ko" in 3310usr/430sys/3714real ms.Pass 5: starting run.read performedPass 5: run completed in 10usr/40sys/73real ms.
The last three lines of the output (beginning with Pass 5) indicate that SystemTap was able tosuccessfully create the instrumentation to probe the kernel, run the instrumentation, detect the event beingprobed (in this case, a virtual file system read), and execute a valid handler (print text then close it with noerrors).
2.2. Generating Instrumentation for Other Computers
When users run a SystemTap script, SystemTap builds a kernel module out of that script. SystemTap thenloads the module into the kernel, allowing it to extract the specified data directly from the kernel (refer toProcedure 3.1, “SystemTap Session” in Section 3.1, “Architecture” for more information).
Normally, however, SystemTap scripts can only be run on systems where SystemTap is deployed (as inSection 2.1, “Installation and Setup”). This could mean that if you want to run SystemTap on ten systems,you would need to deploy SystemTap on all those systems. In some cases, this may be neither feasiblenor desired. For instance, corporate policy may prohibit an administrator from installing RPM packagesthat provide compilers or debug information on specific machines, and thus prevent the deployment ofSystemTap. To work around this problem, SystemTap allows you to use cross-instrumentation.
Chapter 2. Using SystemTap
6
Cross-instrumentation is the process of generating SystemTap instrumentation module from a SystemTapscript on one computer to be used on another computer. This process offers the following benefits:
• The kernel information packages for various machines can be installed on a single host machine.
• Each target machine only needs one RPM package to be installed in order to use the generatedSystemTap instrumentation module: the systemtap-runtime package.
For the sake of simplicity, the following terms are used throughout this section:
• Instrumentation module — the kernel module built from a SystemTap script. The SystemTap module isbuilt on the host system, and will be loaded on the target kernel of target system.
• Host system — the system on which you compile the instrumentation modules from SystemTap scriptsin order to load them on target systems.
• Target system — the system for which you are building the instrumentation modules from SystemTapscripts.
• Target kernel — the kernel of the target system. This is the kernel on which you intend to load or runthe instrumentation module.
To configure a host system and target systems, complete the following steps:
1. Install the systemtap-runtime package on each target system.
2. Determine the kernel running on each target system by running the uname -r command on each ofthese systems.
3. Install SystemTap on the host system. You will be building the instrumentation module for the targetsystems on the host system. For instructions on how to install SystemTap, refer to Section 2.1.1,“Installing SystemTap”.
4. Using the target kernel version determined earlier, install the target kernel and related RPM packageson the host system as described in Section 2.1.2, “Installing Required Kernel Information PackagesManually”. If multiple target systems use different target kernels, repeat this step for each differentkernel used on the target systems.
After completing these steps, you can now build the instrumentation module (for any target system) on thehost system.
To build the instrumentation module, run the following command on the host system (be sure to specifythe appropriate values):
stap -r kernel_version script -m module_name
Here, kernel_version refers to the version of the target kernel (the output of the uname -r commandon the target machine), script refers to the script to be converted into the instrumentation module, andmodule_name is the desired name of the instrumentation module.
Running SystemTap Scripts
7
Note
To determine the architecture notation of a running kernel, you can run the following command:
uname -m
Once the instrumentation module is compiled, copy it to the target system and then load it using:
staprun module_name.ko
For example, to create the instrumentation module simple.ko from a SystemTap script namedsimple.stp for the target kernel 2.6.18-92.1.10.el5 (on x86_64 architecture), use the followingcommand:
stap -r 2.6.18-92.1.10.el5 -e 'probe vfs.read {exit()}' -m simple
This creates a module named simple.ko. To use this instrumentation module, copy it to the targetsystem and run the following command (on the target system):
staprun simple.ko
Important
The host system must be the same architecture and running the same distribution of Linux as thetarget system in order for the built instrumentation module to work.
2.3. Running SystemTap Scripts
SystemTap is distributed with a number of command line tools that allow you to monitor the activities ofthe system. The stap command reads probing instructions from a SystemTap script, translates theseinstructions into C code, builds a kernel module, and loads it into the running Linux kernel. The stapruncommand runs SystemTap instrumentation, that is, a kernel module built from SystemTap scripts during across-instrumentation.
Running stap and staprun requires elevated privileges to the system. Because not all users canbe granted root access just to run SystemTap, you can allow a non-privileged user to run SystemTapinstrumentation on their machine by adding them to one of the following user groups:
stapdev

Chapter 2. Using SystemTap
8
Members of this group can use the stap command to run SystemTap scripts, or staprun to runSystemTap instrumentation modules.
Running the stap command involves compiling SystemTap scripts into kernel modules and loadingthem into the kernel. This operation requires elevated privileges to the system, which are grantedto stapdev members. Unfortunately, such privileges also grant effective root access to stapdevmembers. As a consequence, only grant stapdev group membership to users whom you can trustwith root access.
stapusr
Members of this group can only use the staprun command to run SystemTap instrumentationmodules. In addition, they can only run modules from the /lib/modules/kernel_version/systemtap/ directory. Note that this directory must be owned only by the root user, and must onlybe writable by the root user.
The stap command reads a SystemTap script either from a file, or from standard input. To tell stap toread a SystemTap script from a file, specify the file name on the command line:
stap file_name
To instruct stap to read a SystemTap script from standard input, use the - switch instead of the filename. Note that any command-line options you wish to use must be inserted before the - switch. Forexample, to make the output of the stap command more verbose, type:
echo "probe timer.s(1) {exit()}" | stap -v -
Below is a list of commonly used stap options:
-vMakes the output of the SystemTap session more verbose. You can repeat this option multiple timesto provide more details on the script's execution, for example:
stap -vvv script.stp
This option is particularly useful if you encounter any errors in running the script. For more informationabout common SystemTap script errors, refer to Chapter 6, Understanding SystemTap Errors.
-o file_nameSends the standard output to a file named file_name.
-S size,countLimits the maximum size of output files to size megabytes and the maximum number of stored files tocount. This option implements logrotate operations for SystemTap and the resulting file names have asequence number suffix.
-x process_idSets the SystemTap handler function target() to the specified process ID. For more informationabout target(), refer to SystemTap Functions.

SystemTap Flight Recorder Mode
9
-c 'command'Sets the SystemTap handler function target() to the specified command and runs the SystemTapinstrumentation for the duration of this command. For more information about target(), refer toSystemTap Functions.
-e 'script'Uses script rather than a file as input for the SystemTap translator.
-FUses SystemTap's flight recorder mode and makes the script a background process. For moreinformation about flight recorder mode, refer to Section 2.3.1, “SystemTap Flight Recorder Mode”.
For more information about the stap command, refer to the stap(1) man page. For more informationabout the staprun command and cross-instrumentation, refer to Section 2.2, “GeneratingInstrumentation for Other Computers” or the staprun(8) man page.
2.3.1. SystemTap Flight Recorder Mode
SystemTap's flight recorder mode allows you to run a SystemTap script for long periods of time and justfocus on recent output. The flight recorder mode limits the amount of output generated.
There are two variations of the flight recorder mode: in-memory and file mode. In both cases, theSystemTap script runs as a background process.
2.3.1.1. In-memory Flight Recorder
When flight recorder mode is used without a file name, SystemTap uses a buffer in kernel memory tostore the output of the script. Once the SystemTap instrumentation module is loaded and the probes startrunning, the instrumentation detaches and is put in the background. When the interesting event occurs,you can reattach to the instrumentation to see the recent output in the memory buffer and any continuingoutput.
To run a SystemTap script by using the flight recorder in-memory mode, run the stap command with the-F command line option:
stap -F iotime.stp
Once the script starts, stap prints a message similar to the following to provide you with the command toreconnect to the running script:
Disconnecting from systemtap module.To reconnect, type "staprun -A stap_5dd0073edcb1f13f7565d8c343063e68_19556"
When the interesting event occurs, run the following command to connect to the currently running script,output the recent data in the memory buffer, and get continuing output:
staprun -A stap_5dd0073edcb1f13f7565d8c343063e68_19556
Chapter 2. Using SystemTap
10
By default, the kernel buffer is 1MB in size. You can increase this value by using the -s option withthe size in megabytes (rounded up to the next power over 2) for the buffer. For example, -s2 on theSystemTap command line would specify 2MB for the buffer.
2.3.1.2. File Flight Recorder
The flight recorder mode can also store data to files. You can control the number and size of the files keptby using the -S option followed by two numerical arguments separated by a comma: the first argument isthe maximum size in megabytes for the each output file, the second argument is the number of recent filesto keep. To specify the file name, use the -o option followed by the name. SystemTap automatically addsa number suffix to the file name to indicate the order of the files.
The following command starts SystemTap in file flight recorder mode with the output going to files named/tmp/iotime.log.[0-9]+, each file 1MB or smaller, and keeping latest two files:
stap -F -o /tmp/pfaults.log -S 1,2 pfaults.stp
The command prints the process ID to standard output. Sending a SIGTERM to the process terminatesthe SystemTap script and stops the data collection. For example, if the previous command listed 7590 asthe process ID, the following command would stop the SystemTap script:
kill -s SIGTERM 7590
In this example, only the most recent two files generated by the script are kept: SystemTap automaticallyremoves older files. As a result, the ls -sh /tmp/pfaults.log.* command lists two files:
1020K /tmp/pfaults.log.5 44K /tmp/pfaults.log.6
To examine the latest data, read the file with the highest number, in this case /tmp/pfaults.log.6.
Chapter 3.
11
Understanding How SystemTap WorksSystemTap allows users to write and reuse simple scripts to deeply examine the activities of a runningLinux system. These scripts can be designed to extract data, filter it, and summarize it quickly (andsafely), enabling the diagnosis of complex performance (or even functional) problems.
The essential idea behind a SystemTap script is to name events, and to give them handlers. WhenSystemTap runs the script, SystemTap monitors for the event; once the event occurs, the Linux kernelthen runs the handler as a quick sub-routine, then resumes.
There are several kind of events; entering/exiting a function, timer expiration, session termination, etc.A handler is a series of script language statements that specify the work to be done whenever the eventoccurs. This work normally includes extracting data from the event context, storing them into internalvariables, and printing results.
3.1. Architecture
A SystemTap session begins when you run a SystemTap script. This session occurs in the followingfashion:
Procedure 3.1. SystemTap Session
1. First, SystemTap checks the script against the existing tapset library (normally in /usr/share/systemtap/tapset/ for any tapsets used. SystemTap will then substitute any located tapsets withtheir corresponding definitions in the tapset library.
2. SystemTap then translates the script to C, running the system C compiler to create a kernelmodule from it. The tools that perform this step are contained in the systemtap package (refer toSection 2.1.1, “Installing SystemTap” for more information).
3. SystemTap loads the module, then enables all the probes (events and handlers) in the script. Thestaprun in the systemtap-runtime package (refer to Section 2.1.1, “Installing SystemTap” formore information) provides this functionality.
4. As the events occur, their corresponding handlers are executed.
5. Once the SystemTap session is terminated, the probes are disabled, and the kernel module isunloaded.
This sequence is driven from a single command-line program: stap. This program is SystemTap's mainfront-end tool. For more information about stap, refer to man stap (once SystemTap is properly installedon your machine).
3.2. SystemTap Scripts
For the most part, SystemTap scripts are the foundation of each SystemTap session. SystemTapscripts instruct SystemTap on what type of information to collect, and what to do once that information iscollected.

Chapter 3. Understanding How SystemTap Works
12
As stated in Chapter 3, Understanding How SystemTap Works, SystemTap scripts are made up of twocomponents: events and handlers. Once a SystemTap session is underway, SystemTap monitors theoperating system for the specified events and executes the handlers as they occur.
Note
An event and its corresponding handler is collectively called a probe. A SystemTap script can havemultiple probes.
A probe's handler is commonly referred to as a probe body.
In terms of application development, using events and handlers is similar to instrumenting the code byinserting diagnostic print statements in a program's sequence of commands. These diagnostic printstatements allow you to view a history of commands executed once the program is run.
SystemTap scripts allow insertion of the instrumentation code without recompilation of the code andallows more flexibility with regard to handlers. Events serve as the triggers for handlers to run; handlerscan be specified to record specified data and print it in a certain manner.
Format
SystemTap scripts use the file extension .stp, and contains probes written in the following format:
probe event {statements}
SystemTap supports multiple events per probe; multiple events are delimited by a comma (,). If multipleevents are specified in a single probe, SystemTap will execute the handler when any of the specifiedevents occur.
Each probe has a corresponding statement block. This statement block is enclosed in braces ({ }) andcontains the statements to be executed per event. SystemTap executes these statements in sequence;special separators or terminators are generally not necessary between multiple statements.
Note
Statement blocks in SystemTap scripts follow the same syntax and semantics as the C programminglanguage. A statement block can be nested within another statement block.

Event
13
SystemTap allows you to write functions to factor out code to be used by a number of probes. Thus,rather than repeatedly writing the same series of statements in multiple probes, you can just place theinstructions in a function, as in:
function function_name(arguments) {statements}probe event {function_name(arguments)}
The statements in function_name are executed when the probe for event executes. The arguments areoptional values passed into the function.
Important
Section 3.2, “SystemTap Scripts” is designed to introduce readers to the basics of SystemTapscripts. To understand SystemTap scripts better, it is advisable that you refer to Chapter 5, UsefulSystemTap Scripts; each section therein provides a detailed explanation of the script, its events,handlers, and expected output.
3.2.1. Event
SystemTap events can be broadly classified into two types: synchronous and asynchronous.
Synchronous Events
A synchronous event occurs when any process executes an instruction at a particular location in kernelcode. This gives other events a reference point from which more contextual data may be available.
Examples of synchronous events include:
syscall.system_call
The entry to the system call system_call. If the exit from a syscall is desired, appending a .return tothe event monitor the exit of the system call instead. For example, to specify the entry and exit of thesystem call close, use syscall.close and syscall.close.return respectively.
vfs.file_operation
The entry to the file_operation event for Virtual File System (VFS). Similar to syscall event,appending a .return to the event monitors the exit of the file_operation operation.
kernel.function("function")
The entry to the kernel function function. For example, kernel.function("sys_open") refers tothe "event" that occurs when the kernel function sys_open is called by any thread in the system. Tospecify the return of the kernel function sys_open, append the return string to the event statement;that is, kernel.function("sys_open").return.
Chapter 3. Understanding How SystemTap Works
14
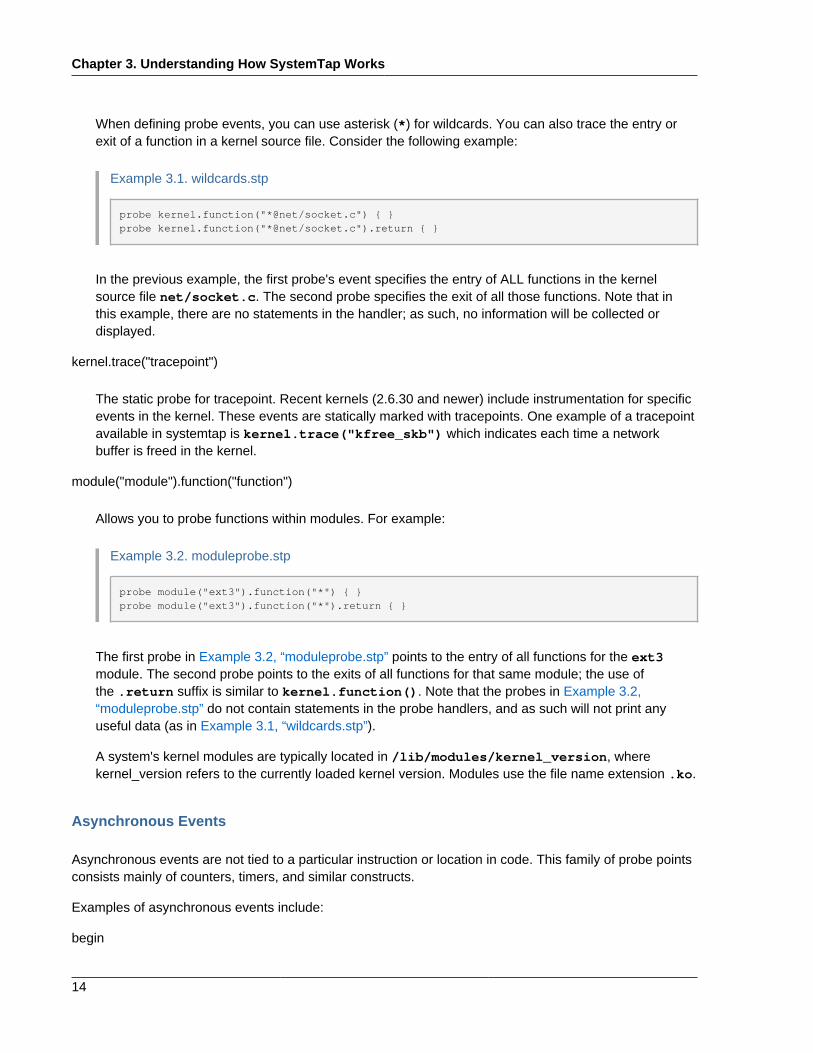
When defining probe events, you can use asterisk (*) for wildcards. You can also trace the entry orexit of a function in a kernel source file. Consider the following example:
Example 3.1. wildcards.stp
probe kernel.function("*@net/socket.c") { }probe kernel.function("*@net/socket.c").return { }
In the previous example, the first probe's event specifies the entry of ALL functions in the kernelsource file net/socket.c. The second probe specifies the exit of all those functions. Note that inthis example, there are no statements in the handler; as such, no information will be collected ordisplayed.
kernel.trace("tracepoint")
The static probe for tracepoint. Recent kernels (2.6.30 and newer) include instrumentation for specificevents in the kernel. These events are statically marked with tracepoints. One example of a tracepointavailable in systemtap is kernel.trace("kfree_skb") which indicates each time a networkbuffer is freed in the kernel.
module("module").function("function")
Allows you to probe functions within modules. For example:
Example 3.2. moduleprobe.stp
probe module("ext3").function("*") { }probe module("ext3").function("*").return { }
The first probe in Example 3.2, “moduleprobe.stp” points to the entry of all functions for the ext3module. The second probe points to the exits of all functions for that same module; the use ofthe .return suffix is similar to kernel.function(). Note that the probes in Example 3.2,“moduleprobe.stp” do not contain statements in the probe handlers, and as such will not print anyuseful data (as in Example 3.1, “wildcards.stp”).
A system's kernel modules are typically located in /lib/modules/kernel_version, wherekernel_version refers to the currently loaded kernel version. Modules use the file name extension .ko.
Asynchronous Events
Asynchronous events are not tied to a particular instruction or location in code. This family of probe pointsconsists mainly of counters, timers, and similar constructs.
Examples of asynchronous events include:
begin

SystemTap Handler/Body
15
The startup of a SystemTap session; that is, as soon as the SystemTap script is run.
end
The end of a SystemTap session.
timer events
An event that specifies a handler to be executed periodically. For example:
Example 3.3. timer-s.stp
probe timer.s(4){ printf("hello world\n")}
Example 3.3, “timer-s.stp” is an example of a probe that prints hello world every 4 seconds. It isalso possible to use the following timer events:
• timer.ms(milliseconds)
• timer.us(microseconds)
• timer.ns(nanoseconds)
• timer.hz(hertz)
• timer.jiffies(jiffies)
When used in conjunction with other probes that collect information, timer events allows you to printout get periodic updates and see how that information changes over time.
Important
SystemTap supports the use of a large collection of probe events. For more information aboutsupported events, refer to man stapprobes. The SEE ALSO section of man stapprobes alsocontains links to other man pages that discuss supported events for specific subsystems andcomponents.
3.2.2. SystemTap Handler/Body
Consider the following sample script:
Example 3.4. helloworld.stp
probe begin{

Chapter 3. Understanding How SystemTap Works
16
printf ("hello world\n") exit ()}
In Example 3.4, “helloworld.stp”, the event begin (that is, the start of the session) triggers the handlerenclosed in { }, which simply prints hello world followed by a new-line, then exits.
Note
SystemTap scripts continue to run until the exit() function executes. If the users wants to stop theexecution of the script, it can interrupted manually with Ctrl+C.
printf ( ) Statements
The printf () statement is one of the simplest functions for printing data. printf () can also beused to display data using a wide variety of SystemTap functions in the following format:
printf ("format string\n", arguments)
The format string specifies how arguments should be printed. The format string of Example 3.4,“helloworld.stp” instructs SystemTap to print hello world, and contains no format specifiers.
You can use the format specifiers %s (for strings) and %d (for numbers) in format strings, depending onyour list of arguments. Format strings can have multiple format specifiers, each matching a correspondingargument; multiple arguments are delimited by a comma (,).
Note
Semantically, the SystemTap printf function is very similar to its C language counterpart. Theaforementioned syntax and format for SystemTap's printf function is identical to that of the C-styleprintf.
To illustrate this, consider the following probe example:
Example 3.5. variables-in-printf-statements.stp
probe syscall.open{ printf ("%s(%d) open\n", execname(), pid())

SystemTap Handler/Body
17
}
Example 3.5, “variables-in-printf-statements.stp” instructs SystemTap to probe all entries to the systemcall open; for each event, it prints the current execname() (a string with the executable name) andpid() (the current process ID number), followed by the word open. A snippet of this probe's output wouldlook like:
vmware-guestd(2206) openhald(2360) openhald(2360) openhald(2360) opendf(3433) opendf(3433) opendf(3433) openhald(2360) open
SystemTap Functions
SystemTap supports a wide variety of functions that can be used as printf () arguments.Example 3.5, “variables-in-printf-statements.stp” uses the SystemTap functions execname() (name ofthe process that called a kernel function/performed a system call) and pid() (current process ID).
The following is a list of commonly-used SystemTap functions:
tid()
The ID of the current thread.
uid()
The ID of the current user.
cpu()
The current CPU number.
gettimeofday_s()
The number of seconds since UNIX epoch (January 1, 1970).
ctime()
Convert number of seconds since UNIX epoch to date.
pp()
A string describing the probe point currently being handled.
thread_indent()
Chapter 3. Understanding How SystemTap Works
18
This particular function is quite useful in providing you with a way to better organize your print results.The function takes one argument, an indentation delta, which indicates how many spaces to add orremove from a thread's "indentation counter". It then returns a string with some generic trace dataalong with an appropriate number of indentation spaces.
The generic data included in the returned string includes a timestamp (number of microseconds sincethe first call to thread_indent() by the thread), a process name, and the thread ID. This allowsyou to identify what functions were called, who called them, and the duration of each function call.
If call entries and exits immediately precede each other, it is easy to match them. However, in mostcases, after a first function call entry is made several other call entries and exits may be made beforethe first call exits. The indentation counter helps you match an entry with its corresponding exit byindenting the next function call if it is not the exit of the previous one.
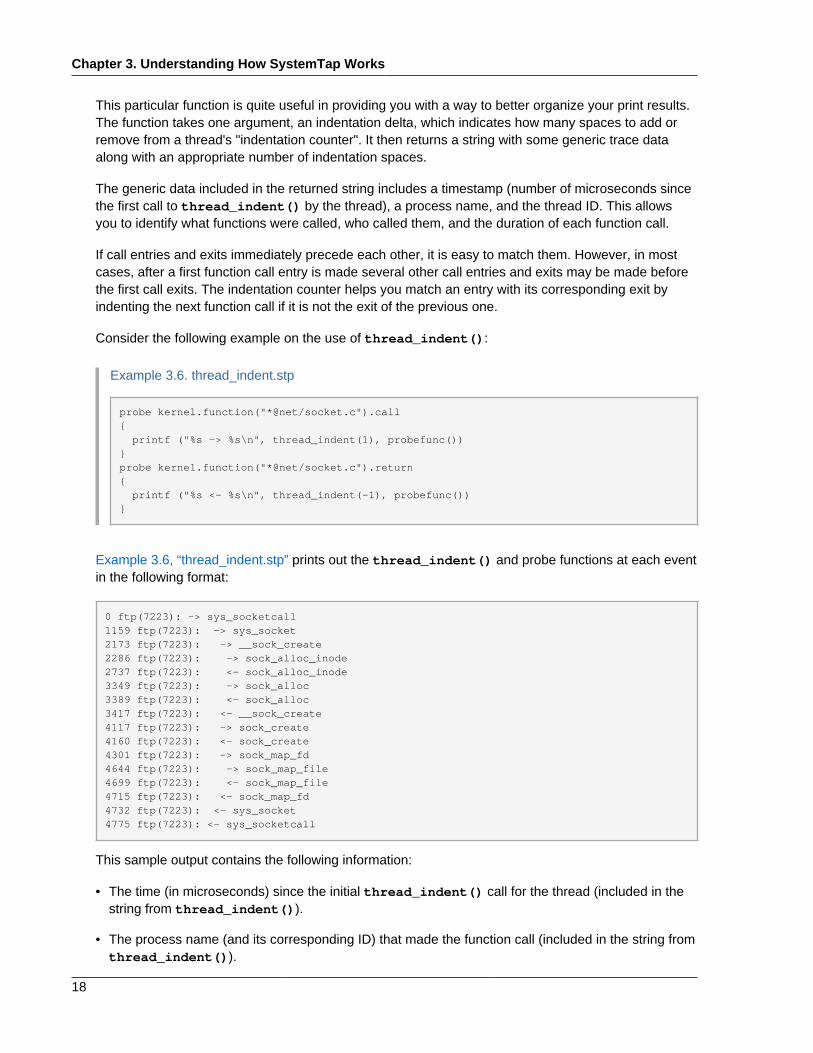
Consider the following example on the use of thread_indent():
Example 3.6. thread_indent.stp
probe kernel.function("*@net/socket.c").call{ printf ("%s -> %s\n", thread_indent(1), probefunc())}probe kernel.function("*@net/socket.c").return{ printf ("%s <- %s\n", thread_indent(-1), probefunc())}
Example 3.6, “thread_indent.stp” prints out the thread_indent() and probe functions at each eventin the following format:
0 ftp(7223): -> sys_socketcall1159 ftp(7223): -> sys_socket2173 ftp(7223): -> __sock_create2286 ftp(7223): -> sock_alloc_inode2737 ftp(7223): <- sock_alloc_inode3349 ftp(7223): -> sock_alloc3389 ftp(7223): <- sock_alloc3417 ftp(7223): <- __sock_create4117 ftp(7223): -> sock_create4160 ftp(7223): <- sock_create4301 ftp(7223): -> sock_map_fd4644 ftp(7223): -> sock_map_file4699 ftp(7223): <- sock_map_file4715 ftp(7223): <- sock_map_fd4732 ftp(7223): <- sys_socket4775 ftp(7223): <- sys_socketcall
This sample output contains the following information:
• The time (in microseconds) since the initial thread_indent() call for the thread (included in thestring from thread_indent()).
• The process name (and its corresponding ID) that made the function call (included in the string fromthread_indent()).
Basic SystemTap Handler Constructs
19
• An arrow signifying whether the call was an entry (<-) or an exit (->); the indentations help youmatch specific function call entries with their corresponding exits.
• The name of the function called by the process.
name
Identifies the name of a specific system call. This variable can only be used in probes that use theevent syscall.system_call.
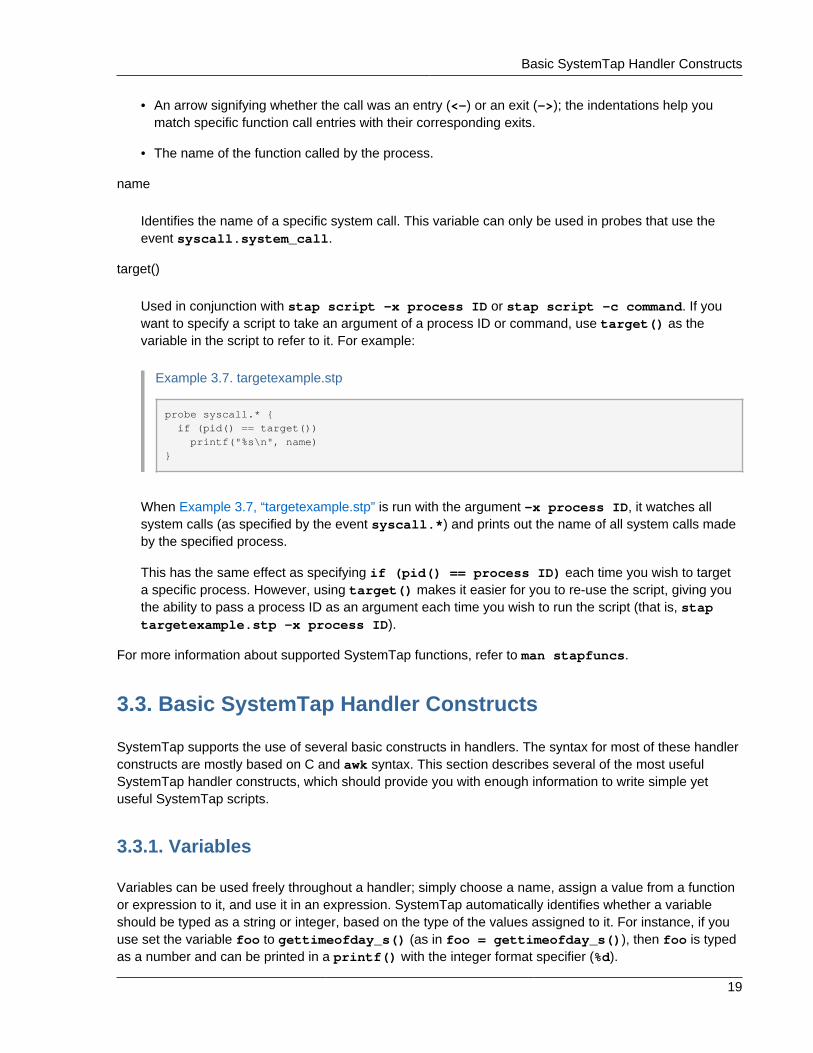
target()
Used in conjunction with stap script -x process ID or stap script -c command. If youwant to specify a script to take an argument of a process ID or command, use target() as thevariable in the script to refer to it. For example:
Example 3.7. targetexample.stp
probe syscall.* { if (pid() == target()) printf("%s\n", name)}
When Example 3.7, “targetexample.stp” is run with the argument -x process ID, it watches allsystem calls (as specified by the event syscall.*) and prints out the name of all system calls madeby the specified process.
This has the same effect as specifying if (pid() == process ID) each time you wish to targeta specific process. However, using target() makes it easier for you to re-use the script, giving youthe ability to pass a process ID as an argument each time you wish to run the script (that is, staptargetexample.stp -x process ID).
For more information about supported SystemTap functions, refer to man stapfuncs.
3.3. Basic SystemTap Handler Constructs
SystemTap supports the use of several basic constructs in handlers. The syntax for most of these handlerconstructs are mostly based on C and awk syntax. This section describes several of the most usefulSystemTap handler constructs, which should provide you with enough information to write simple yetuseful SystemTap scripts.
3.3.1. Variables
Variables can be used freely throughout a handler; simply choose a name, assign a value from a functionor expression to it, and use it in an expression. SystemTap automatically identifies whether a variableshould be typed as a string or integer, based on the type of the values assigned to it. For instance, if youuse set the variable foo to gettimeofday_s() (as in foo = gettimeofday_s()), then foo is typedas a number and can be printed in a printf() with the integer format specifier (%d).
Chapter 3. Understanding How SystemTap Works
20
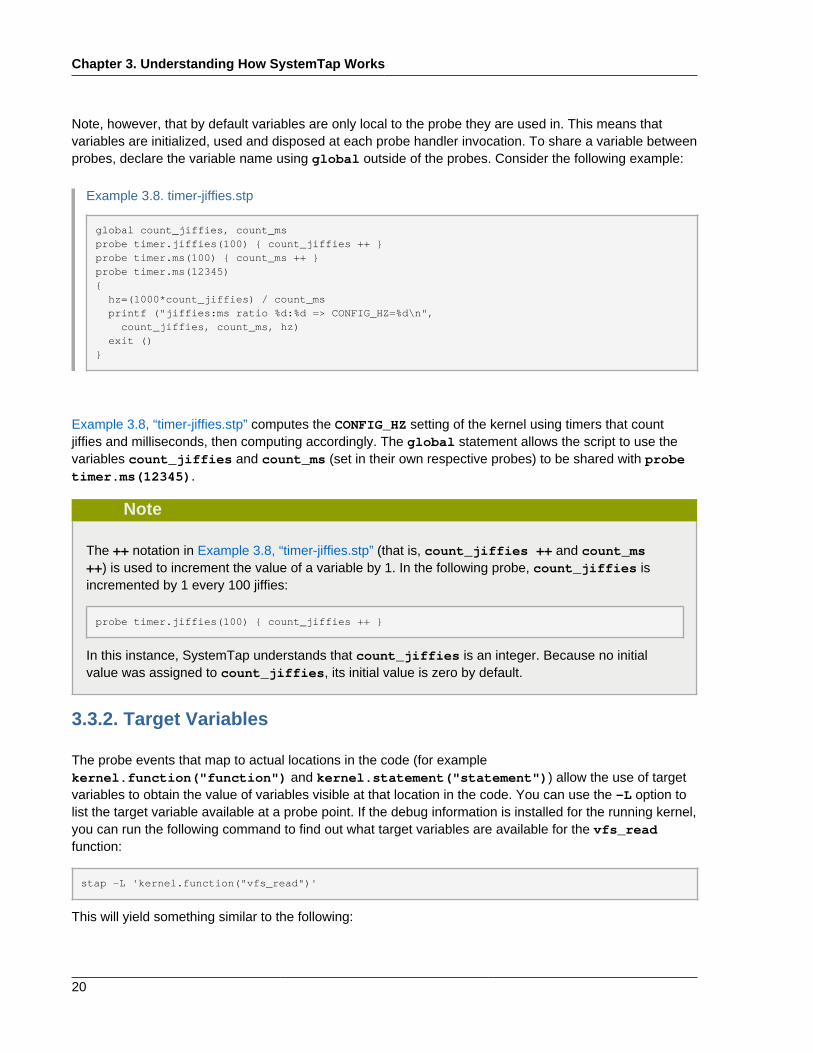
Note, however, that by default variables are only local to the probe they are used in. This means thatvariables are initialized, used and disposed at each probe handler invocation. To share a variable betweenprobes, declare the variable name using global outside of the probes. Consider the following example:
Example 3.8. timer-jiffies.stp
global count_jiffies, count_msprobe timer.jiffies(100) { count_jiffies ++ }probe timer.ms(100) { count_ms ++ }probe timer.ms(12345){ hz=(1000*count_jiffies) / count_ms printf ("jiffies:ms ratio %d:%d => CONFIG_HZ=%d\n", count_jiffies, count_ms, hz) exit ()}
Example 3.8, “timer-jiffies.stp” computes the CONFIG_HZ setting of the kernel using timers that countjiffies and milliseconds, then computing accordingly. The global statement allows the script to use thevariables count_jiffies and count_ms (set in their own respective probes) to be shared with probetimer.ms(12345).
Note
The ++ notation in Example 3.8, “timer-jiffies.stp” (that is, count_jiffies ++ and count_ms++) is used to increment the value of a variable by 1. In the following probe, count_jiffies isincremented by 1 every 100 jiffies:
probe timer.jiffies(100) { count_jiffies ++ }
In this instance, SystemTap understands that count_jiffies is an integer. Because no initialvalue was assigned to count_jiffies, its initial value is zero by default.
3.3.2. Target Variables
The probe events that map to actual locations in the code (for examplekernel.function("function") and kernel.statement("statement")) allow the use of targetvariables to obtain the value of variables visible at that location in the code. You can use the -L option tolist the target variable available at a probe point. If the debug information is installed for the running kernel,you can run the following command to find out what target variables are available for the vfs_readfunction:
stap -L 'kernel.function("vfs_read")'
This will yield something similar to the following:
Target Variables
21
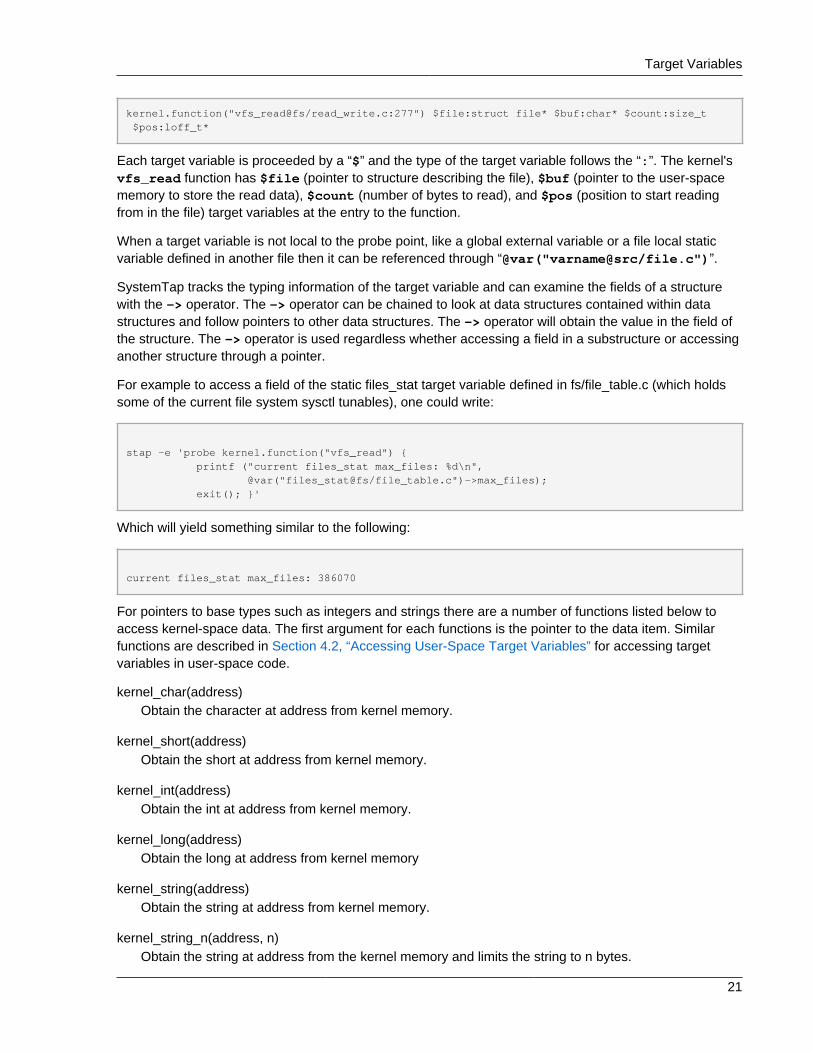
kernel.function("vfs_read@fs/read_write.c:277") $file:struct file* $buf:char* $count:size_t $pos:loff_t*
Each target variable is proceeded by a “$” and the type of the target variable follows the “:”. The kernel'svfs_read function has $file (pointer to structure describing the file), $buf (pointer to the user-spacememory to store the read data), $count (number of bytes to read), and $pos (position to start readingfrom in the file) target variables at the entry to the function.
When a target variable is not local to the probe point, like a global external variable or a file local staticvariable defined in another file then it can be referenced through “@var("varname@src/file.c")”.
SystemTap tracks the typing information of the target variable and can examine the fields of a structurewith the -> operator. The -> operator can be chained to look at data structures contained within datastructures and follow pointers to other data structures. The -> operator will obtain the value in the field ofthe structure. The -> operator is used regardless whether accessing a field in a substructure or accessinganother structure through a pointer.
For example to access a field of the static files_stat target variable defined in fs/file_table.c (which holdssome of the current file system sysctl tunables), one could write:
stap -e 'probe kernel.function("vfs_read") { printf ("current files_stat max_files: %d\n", @var("files_stat@fs/file_table.c")->max_files); exit(); }'
Which will yield something similar to the following:
current files_stat max_files: 386070
For pointers to base types such as integers and strings there are a number of functions listed below toaccess kernel-space data. The first argument for each functions is the pointer to the data item. Similarfunctions are described in Section 4.2, “Accessing User-Space Target Variables” for accessing targetvariables in user-space code.
kernel_char(address)Obtain the character at address from kernel memory.
kernel_short(address)Obtain the short at address from kernel memory.
kernel_int(address)Obtain the int at address from kernel memory.
kernel_long(address)Obtain the long at address from kernel memory
kernel_string(address)Obtain the string at address from kernel memory.
kernel_string_n(address, n)Obtain the string at address from the kernel memory and limits the string to n bytes.

Chapter 3. Understanding How SystemTap Works
22
3.3.2.1. Pretty Printing Target Variables
SystemTap scripts are often used to observe what is happening within the code. In many cases justprinting the values of the various context variables is sufficient. SystemTap makes a number operationsavailable that can generate printable strings for target variables:
$$varsExpands to a character string that is equivalent to sprintf("parm1=%x ... parmN=%x var1=%x ... varN=%x", parm1, ..., parmN, var1, ..., varN) for each variable in scope atthe probe point. Some values may be printed as “=?” if their run-time location cannot be found.
$$localsExpands to a subset of $$vars containing only the local variables.
$$parmsExpands to a subset of $$vars containing only the function parameters.
$$returnIs available in return probes only. It expands to a string that is equivalent to sprintf("return=%x", $return) if the probed function has a return value, or else an empty string.
Below is a command-line script that prints the values of the parameters passed into the functionvfs_read:
stap -e 'probe kernel.function("vfs_read") {printf("%s\n", $$parms); exit(); }'
There are four parameters passed into vfs_read: file, buf, count, and pos. The $$parms generatesa string for the parameters passed into the function. In this case all but the count parameter are pointers.The following is an example of the output from the previous command-line script:
file=0xffff8800b40d4c80 buf=0x7fff634403e0 count=0x2004 pos=0xffff8800af96df48
Having the address a pointer points to may not be useful. Instead the fields of the data structure thepointer points to may be of more use. Use the “$” suffix to pretty print the data structure. The followingcommand-line example uses the pretty printing suffix to print more details about the data structurespassed into the function vfs_read:
stap -e 'probe kernel.function("vfs_read") {printf("%s\n", $$parms$); exit(); }'
The previous command line will generate something similar to the following with the fields of the datastructure included in the output:
file={.f_u={...}, .f_path={...}, .f_op=0xffffffffa06e1d80, .f_lock={...}, .f_count={...}, .f_flags=34818, .f_mode=31, .f_pos=0, .f_owner={...}, .f_cred=0xffff88013148fc80, .f_ra={...}, .f_version=0, .f_security=0xffff8800b8dce560, .private_data=0x0, .f_ep_links={...}, .f_mapping=0xffff880037f8fdf8} buf="" count=8196 pos=-131938753921208
With the “$” suffix fields that are composed of data structures are not expanded. The “$$” suffix will printthe values contained within the nested data structures. Below is an example using the “$$” suffix:
stap -e 'probe kernel.function("vfs_read") {printf("%s\n", $$parms$$); exit(); }'
Target Variables
23
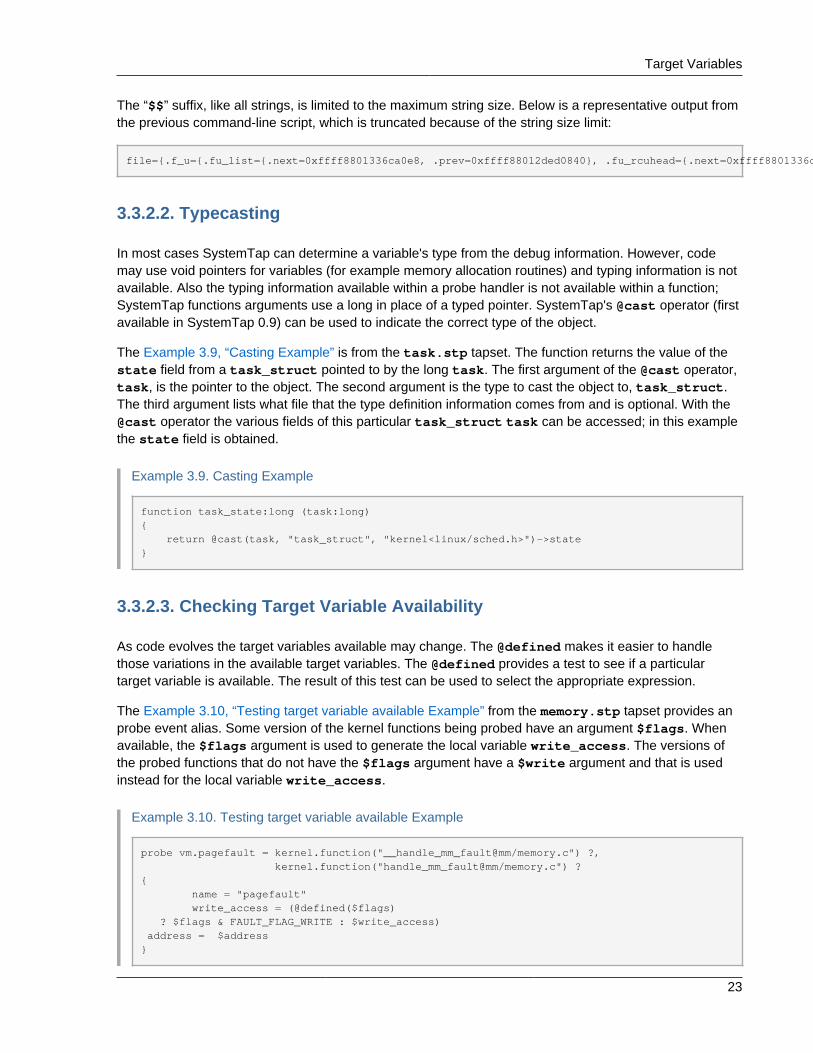
The “$$” suffix, like all strings, is limited to the maximum string size. Below is a representative output fromthe previous command-line script, which is truncated because of the string size limit:
file={.f_u={.fu_list={.next=0xffff8801336ca0e8, .prev=0xffff88012ded0840}, .fu_rcuhead={.next=0xffff8801336ca0e8, .func=0xffff88012ded0840}}, .f_path={.mnt=0xffff880132fc97c0, .dentry=0xffff88001a889cc0}, .f_op=0xffffffffa06f64c0, .f_lock={.raw_lock={.slock=196611}}, .f_count={.counter=2}, .f_flags=34818, .f_mode=31, .f_pos=0, .f_owner={.lock={.raw_lock={.lock=16777216}}, .pid=0x0, .pid_type=0, .uid=0, .euid=0, .signum=0}, .f_cred=0xffff880130129a80, .f_ra={.start=0, .size=0, .async_size=0, .ra_pages=32, .
3.3.2.2. Typecasting
In most cases SystemTap can determine a variable's type from the debug information. However, codemay use void pointers for variables (for example memory allocation routines) and typing information is notavailable. Also the typing information available within a probe handler is not available within a function;SystemTap functions arguments use a long in place of a typed pointer. SystemTap's @cast operator (firstavailable in SystemTap 0.9) can be used to indicate the correct type of the object.
The Example 3.9, “Casting Example” is from the task.stp tapset. The function returns the value of thestate field from a task_struct pointed to by the long task. The first argument of the @cast operator,task, is the pointer to the object. The second argument is the type to cast the object to, task_struct.The third argument lists what file that the type definition information comes from and is optional. With the@cast operator the various fields of this particular task_struct task can be accessed; in this examplethe state field is obtained.
Example 3.9. Casting Example
function task_state:long (task:long){ return @cast(task, "task_struct", "kernel<linux/sched.h>")->state}
3.3.2.3. Checking Target Variable Availability
As code evolves the target variables available may change. The @defined makes it easier to handlethose variations in the available target variables. The @defined provides a test to see if a particulartarget variable is available. The result of this test can be used to select the appropriate expression.
The Example 3.10, “Testing target variable available Example” from the memory.stp tapset provides anprobe event alias. Some version of the kernel functions being probed have an argument $flags. Whenavailable, the $flags argument is used to generate the local variable write_access. The versions ofthe probed functions that do not have the $flags argument have a $write argument and that is usedinstead for the local variable write_access.
Example 3.10. Testing target variable available Example
probe vm.pagefault = kernel.function("__handle_mm_fault@mm/memory.c") ?, kernel.function("handle_mm_fault@mm/memory.c") ?{ name = "pagefault" write_access = (@defined($flags) ? $flags & FAULT_FLAG_WRITE : $write_access) address = $address}

Chapter 3. Understanding How SystemTap Works
24
3.3.3. Conditional Statements
In some cases, the output of a SystemTap script may be too large. To address this, you need to furtherrefine the script's logic in order to delimit the output into something more relevant or useful to your probe.
Do this by using conditionals in handlers. SystemTap accepts the following types of conditionalstatements:
If/Else Statements
Format:
if (condition) statement1else statement2
The statement1 is executed if the condition expression is non-zero. The statement2 isexecuted if the condition expression is zero. The else clause (else statement2) is optional. Bothstatement1 and statement2 can be statement blocks.
Example 3.11. ifelse.stp
global countread, countnonreadprobe kernel.function("vfs_read"),kernel.function("vfs_write"){ if (probefunc()=="vfs_read") countread ++ else countnonread ++}probe timer.s(5) { exit() }probe end{ printf("VFS reads total %d\n VFS writes total %d\n", countread, countnonread)}
Example 3.11, “ifelse.stp” is a script that counts how many virtual file system reads (vfs_read)and writes (vfs_write) the system performs within a 5-second span. When run, the scriptincrements the value of the variable countread by 1 if the name of the function it probed matchesvfs_read (as noted by the condition if (probefunc()=="vfs_read")); otherwise, it incrementscountnonread (else {countnonread ++}).
While Loops
Format:
while (condition) statement
Command-Line Arguments
25
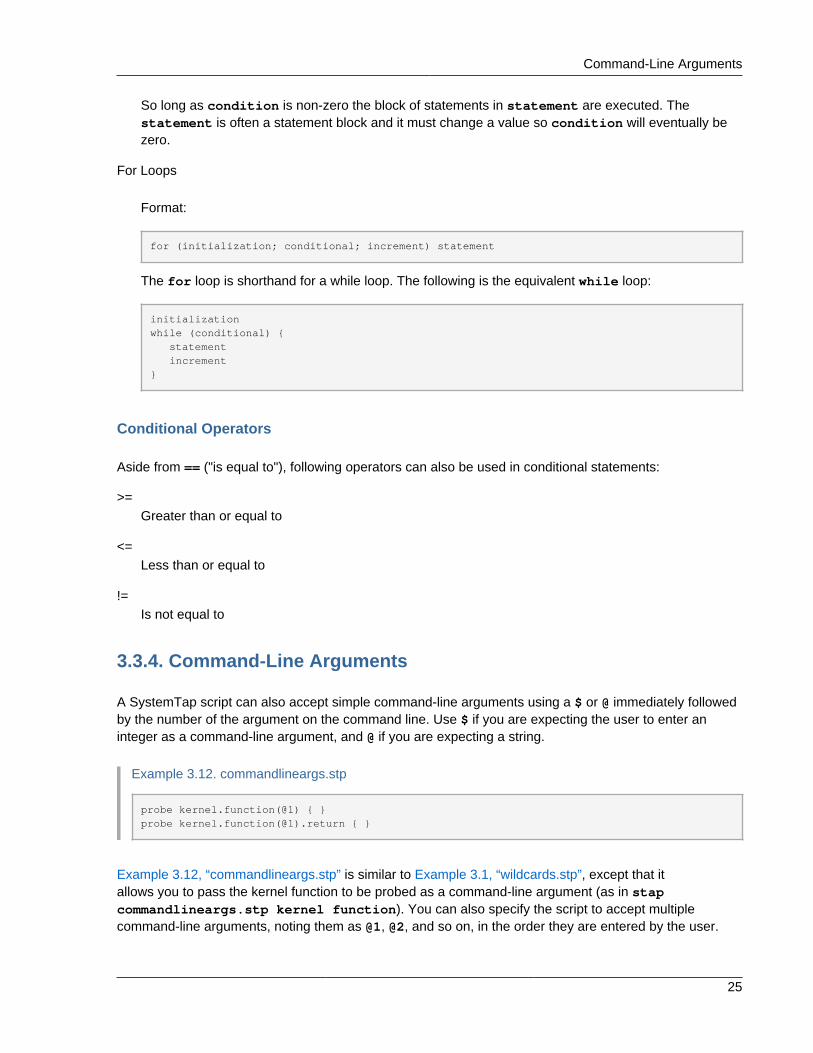
So long as condition is non-zero the block of statements in statement are executed. Thestatement is often a statement block and it must change a value so condition will eventually bezero.
For Loops
Format:
for (initialization; conditional; increment) statement
The for loop is shorthand for a while loop. The following is the equivalent while loop:
initializationwhile (conditional) { statement increment}
Conditional Operators
Aside from == ("is equal to"), following operators can also be used in conditional statements:
>=Greater than or equal to
<=Less than or equal to
!=Is not equal to
3.3.4. Command-Line Arguments
A SystemTap script can also accept simple command-line arguments using a $ or @ immediately followedby the number of the argument on the command line. Use $ if you are expecting the user to enter aninteger as a command-line argument, and @ if you are expecting a string.
Example 3.12. commandlineargs.stp
probe kernel.function(@1) { }probe kernel.function(@1).return { }
Example 3.12, “commandlineargs.stp” is similar to Example 3.1, “wildcards.stp”, except that itallows you to pass the kernel function to be probed as a command-line argument (as in stapcommandlineargs.stp kernel function). You can also specify the script to accept multiplecommand-line arguments, noting them as @1, @2, and so on, in the order they are entered by the user.

Chapter 3. Understanding How SystemTap Works
26
3.4. Associative Arrays
SystemTap also supports the use of associative arrays. While an ordinary variable represents a singlevalue, associative arrays can represent a collection of values. Simply put, an associative array is acollection of unique keys; each key in the array has a value associated with it.
Since associative arrays are normally processed in multiple probes (as we will demonstrate later), theyshould be declared as global variables in the SystemTap script. The syntax for accessing an element inan associative array is similar to that of awk, and is as follows:
array_name[index_expression]
Here, the array_name is any arbitrary name the array uses. The index_expression is used to referto a specific unique key in the array. To illustrate, let us try to build an array named foo that specifiesthe ages of three people tom, dick, and harry (which are unique keys). To assign them the ages(associated values) of 23, 24, and 25 respectively, we'd use the following array statements:
Example 3.13. Basic Array Statements
foo["tom"] = 23foo["dick"] = 24foo["harry"] = 25
You can specify up to nine index expressions in an array statement, each one delimited by a comma (,).This is useful if you wish to have a key that contains multiple pieces of information. The following line fromdisktop.stp uses 5 elements for the key: process ID, executable name, user ID, parent process ID, andstring "W". It associates the value of devname with that key.
device[pid(),execname(),uid(),ppid(),"W"] = devname
Important
All associate arrays must be declared as global, regardless of whether the associate array is usedin one or multiple probes.
3.5. Array Operations in SystemTap
This section enumerates some of the most commonly used array operations in SystemTap.

Assigning an Associated Value
27
3.5.1. Assigning an Associated Value
Use = to set an associated value to indexed unique pairs, as in:
array_name[index_expression] = value
Example 3.13, “Basic Array Statements” shows a very basic example of how to set an explicit associatedvalue to a unique key. You can also use a handler function as both your index_expression andvalue. For example, you can use arrays to set a timestamp as the associated value to a process name(which you wish to use as your unique key), as in:
Example 3.14. Associating Timestamps to Process Names
foo[tid()] = gettimeofday_s()
Whenever an event invokes the statement in Example 3.14, “Associating Timestamps to Process Names”,SystemTap returns the appropriate tid() value (that is, the ID of a thread, which is then used asthe unique key). At the same time, SystemTap also uses the function gettimeofday_s() to set thecorresponding timestamp as the associated value to the unique key defined by the function tid(). Thiscreates an array composed of key pairs containing thread IDs and timestamps.
In this same example, if tid() returns a value that is already defined in the array foo, the operatorwill discard the original associated value to it, and replace it with the current timestamp fromgettimeofday_s().
3.5.2. Reading Values From Arrays
You can also read values from an array the same way you would read the value of a variable. To do so,include the array_name[index_expression] statement as an element in a mathematical expression.For example:
Example 3.15. Using Array Values in Simple Computations
delta = gettimeofday_s() - foo[tid()]
This example assumes that the array foo was built using the construct in Example 3.14, “AssociatingTimestamps to Process Names” (from Section 3.5.1, “Assigning an Associated Value”). This sets atimestamp that will serve as a reference point, to be used in computing for delta.
The construct in Example 3.15, “Using Array Values in Simple Computations” computes a valuefor the variable delta by subtracting the associated value of the key tid() from the currentgettimeofday_s(). The construct does this by reading the value of tid() from the array. This

Chapter 3. Understanding How SystemTap Works
28
particular construct is useful for determining the time between two events, such as the start andcompletion of a read operation.
Note
If the index_expression cannot find the unique key, it returns a value of 0 (for numericaloperations, such as Example 3.15, “Using Array Values in Simple Computations”) or a null/emptystring value (for string operations) by default.
3.5.3. Incrementing Associated Values
Use ++ to increment the associated value of a unique key in an array, as in:
array_name[index_expression] ++
Again, you can also use a handler function for your index_expression. For example, if you wantedto tally how many times a specific process performed a read to the virtual file system (using the eventvfs.read), you can use the following probe:
Example 3.16. vfsreads.stp
probe vfs.read{ reads[execname()] ++}
In Example 3.16, “vfsreads.stp”, the first time that the probe returns the process name gnome-terminal(that is, the first time gnome-terminal performs a VFS read), that process name is set as the uniquekey gnome-terminal with an associated value of 1. The next time that the probe returns the processname gnome-terminal, SystemTap increments the associated value of gnome-terminal by 1.SystemTap performs this operation for all process names as the probe returns them.
3.5.4. Processing Multiple Elements in an Array
Once you've collected enough information in an array, you will need to retrieve and process all elementsin that array to make it useful. Consider Example 3.16, “vfsreads.stp”: the script collects information abouthow many VFS reads each process performs, but does not specify what to do with it. The obvious meansfor making Example 3.16, “vfsreads.stp” useful is to print the key pairs in the array reads, but how?
The best way to process all key pairs in an array (as an iteration) is to use the foreach statement.Consider the following example:

Clearing/Deleting Arrays and Array Elements
29
Example 3.17. cumulative-vfsreads.stp
global readsprobe vfs.read{ reads[execname()] ++}probe timer.s(3){ foreach (count in reads) printf("%s : %d \n", count, reads[count])}
In the second probe of Example 3.17, “cumulative-vfsreads.stp”, the foreach statement uses thevariable count to reference each iteration of a unique key in the array reads. The reads[count] arraystatement in the same probe retrieves the associated value of each unique key.
Given what we know about the first probe in Example 3.17, “cumulative-vfsreads.stp”, the script printsVFS-read statistics every 3 seconds, displaying names of processes that performed a VFS-read alongwith a corresponding VFS-read count.
Now, remember that the foreach statement in Example 3.17, “cumulative-vfsreads.stp” prints alliterations of process names in the array, and in no particular order. You can instruct the script to processthe iterations in a particular order by using + (ascending) or - (descending). In addition, you can also limitthe number of iterations the script needs to process with the limit value option.
For example, consider the following replacement probe:
probe timer.s(3){ foreach (count in reads- limit 10) printf("%s : %d \n", count, reads[count])}
This foreach statement instructs the script to process the elements in the array reads in descendingorder (of associated value). The limit 10 option instructs the foreach to only process the first teniterations (that is, print the first 10, starting with the highest value).
3.5.5. Clearing/Deleting Arrays and Array Elements
Sometimes, you may need to clear the associated values in array elements, or reset an entire array forre-use in another probe. Example 3.17, “cumulative-vfsreads.stp” in Section 3.5.4, “Processing MultipleElements in an Array” allows you to track how the number of VFS reads per process grows over time, butit does not show you the number of VFS reads each process makes per 3-second period.
To do that, you will need to clear the values accumulated by the array. You can accomplish this using thedelete operator to delete elements in an array, or an entire array. Consider the following example:

Chapter 3. Understanding How SystemTap Works
30
Example 3.18. noncumulative-vfsreads.stp
global readsprobe vfs.read{ reads[execname()] ++}probe timer.s(3){ foreach (count in reads) printf("%s : %d \n", count, reads[count]) delete reads}
In Example 3.18, “noncumulative-vfsreads.stp”, the second probe prints the number of VFS reads eachprocess made within the probed 3-second period only. The delete reads statement clears the readsarray within the probe.

Using Arrays in Conditional Statements
31
Note
You can have multiple array operations within the same probe. Using the examples fromSection 3.5.4, “Processing Multiple Elements in an Array” and Section 3.5.5, “Clearing/DeletingArrays and Array Elements” , you can track the number of VFS reads each process makes per 3-second period and tally the cumulative VFS reads of those same processes. Consider the followingexample:
global reads, totalreads
probe vfs.read{ reads[execname()] ++ totalreads[execname()] ++}
probe timer.s(3){ printf("=======\n") foreach (count in reads-) printf("%s : %d \n", count, reads[count]) delete reads}
probe end{ printf("TOTALS\n") foreach (total in totalreads-) printf("%s : %d \n", total, totalreads[total])}
In this example, the arrays reads and totalreads track the same information, and are printedout in a similar fashion. The only difference here is that reads is cleared every 3-second period,whereas totalreads keeps growing.
3.5.6. Using Arrays in Conditional Statements
You can also use associative arrays in if statements. This is useful if you want to execute a subroutineonce a value in the array matches a certain condition. Consider the following example:
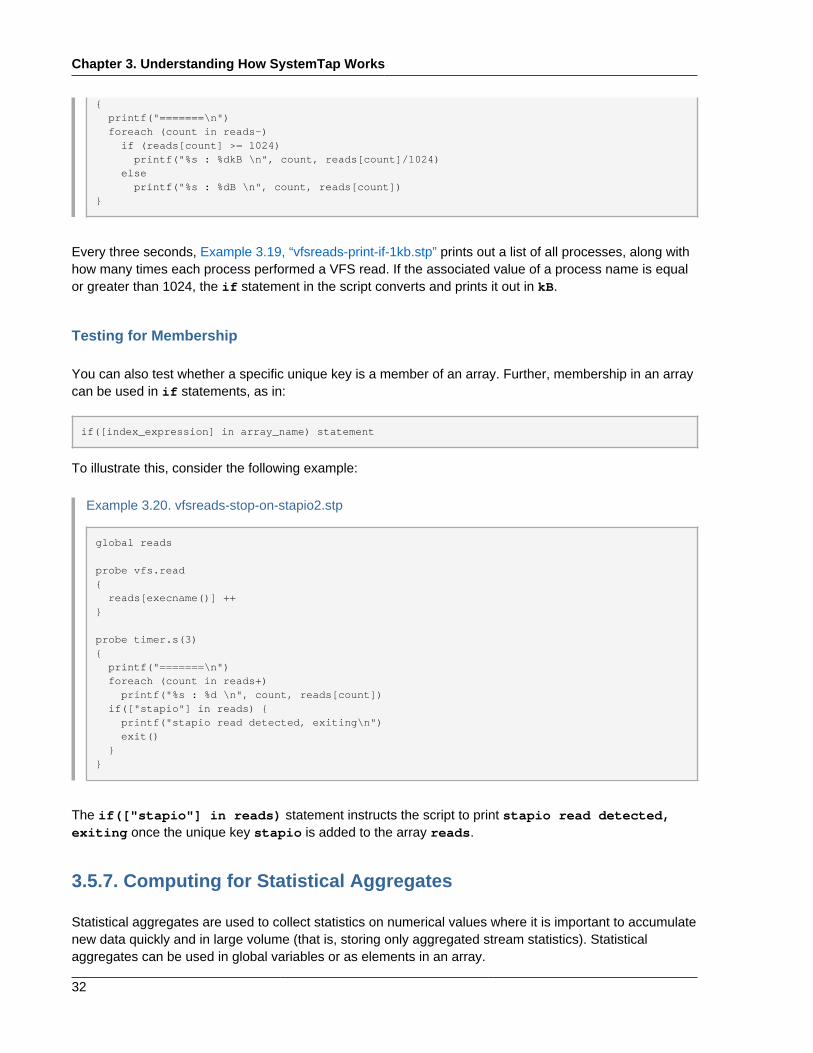
Example 3.19. vfsreads-print-if-1kb.stp
global readsprobe vfs.read{ reads[execname()] ++}
probe timer.s(3)
Chapter 3. Understanding How SystemTap Works
32
{ printf("=======\n") foreach (count in reads-) if (reads[count] >= 1024) printf("%s : %dkB \n", count, reads[count]/1024) else printf("%s : %dB \n", count, reads[count])}
Every three seconds, Example 3.19, “vfsreads-print-if-1kb.stp” prints out a list of all processes, along withhow many times each process performed a VFS read. If the associated value of a process name is equalor greater than 1024, the if statement in the script converts and prints it out in kB.
Testing for Membership
You can also test whether a specific unique key is a member of an array. Further, membership in an arraycan be used in if statements, as in:
if([index_expression] in array_name) statement
To illustrate this, consider the following example:
Example 3.20. vfsreads-stop-on-stapio2.stp
global reads
probe vfs.read{ reads[execname()] ++}
probe timer.s(3){ printf("=======\n") foreach (count in reads+) printf("%s : %d \n", count, reads[count]) if(["stapio"] in reads) { printf("stapio read detected, exiting\n") exit() }}
The if(["stapio"] in reads) statement instructs the script to print stapio read detected,exiting once the unique key stapio is added to the array reads.
3.5.7. Computing for Statistical Aggregates
Statistical aggregates are used to collect statistics on numerical values where it is important to accumulatenew data quickly and in large volume (that is, storing only aggregated stream statistics). Statisticalaggregates can be used in global variables or as elements in an array.

Computing for Statistical Aggregates
33
To add value to a statistical aggregate, use the operator <<< value.
Example 3.21. stat-aggregates.stp
global readsprobe vfs.read{ reads[execname()] <<< $count}
In Example 3.21, “stat-aggregates.stp”, the operator <<< $count stores the amount returned by $countto the associated value of the corresponding execname() in the reads array. Remember, thesevalues are stored; they are not added to the associated values of each unique key, nor are they usedto replace the current associated values. In a manner of speaking, think of it as having each unique key(execname()) having multiple associated values, accumulating with each probe handler run.
Note
In the context of Example 3.21, “stat-aggregates.stp”, count returns the amount of data read by thereturned execname() to the virtual file system.
To extract data collected by statistical aggregates, use the syntax format @extractor(variable/array index expression). extractor can be any of the following integer extractors:
count
Returns the number of all values stored into the variable/array index expression. Given the sampleprobe in Example 3.21, “stat-aggregates.stp”, the expression @count(reads[execname()]) willreturn how many values are stored in each unique key in array reads.
sum
Returns the sum of all values stored into the variable/array index expression. Again, given sampleprobe in Example 3.21, “stat-aggregates.stp”, the expression @sum(reads[execname()]) willreturn the total of all values stored in each unique key in array reads.
min
Returns the smallest among all the values stored in the variable/array index expression.
max
Returns the largest among all the values stored in the variable/array index expression.
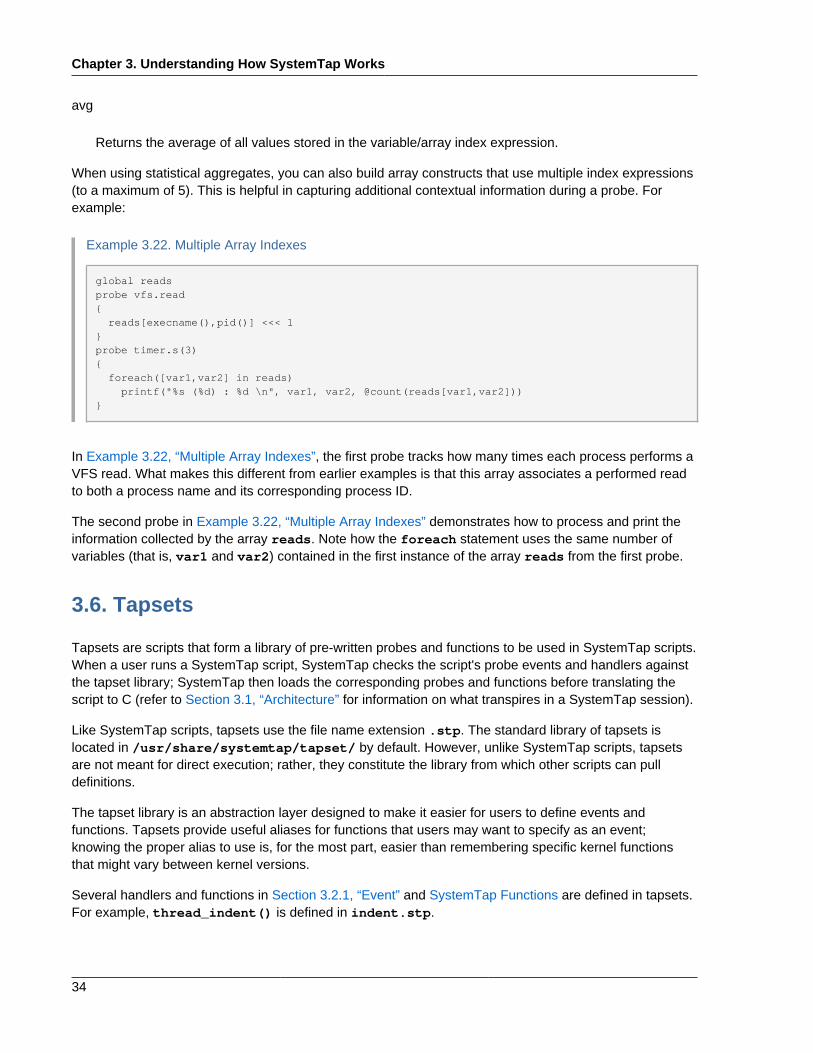
Chapter 3. Understanding How SystemTap Works
34
avg
Returns the average of all values stored in the variable/array index expression.
When using statistical aggregates, you can also build array constructs that use multiple index expressions(to a maximum of 5). This is helpful in capturing additional contextual information during a probe. Forexample:
Example 3.22. Multiple Array Indexes
global readsprobe vfs.read{ reads[execname(),pid()] <<< 1}probe timer.s(3){ foreach([var1,var2] in reads) printf("%s (%d) : %d \n", var1, var2, @count(reads[var1,var2]))}
In Example 3.22, “Multiple Array Indexes”, the first probe tracks how many times each process performs aVFS read. What makes this different from earlier examples is that this array associates a performed readto both a process name and its corresponding process ID.
The second probe in Example 3.22, “Multiple Array Indexes” demonstrates how to process and print theinformation collected by the array reads. Note how the foreach statement uses the same number ofvariables (that is, var1 and var2) contained in the first instance of the array reads from the first probe.
3.6. Tapsets
Tapsets are scripts that form a library of pre-written probes and functions to be used in SystemTap scripts.When a user runs a SystemTap script, SystemTap checks the script's probe events and handlers againstthe tapset library; SystemTap then loads the corresponding probes and functions before translating thescript to C (refer to Section 3.1, “Architecture” for information on what transpires in a SystemTap session).
Like SystemTap scripts, tapsets use the file name extension .stp. The standard library of tapsets islocated in /usr/share/systemtap/tapset/ by default. However, unlike SystemTap scripts, tapsetsare not meant for direct execution; rather, they constitute the library from which other scripts can pulldefinitions.
The tapset library is an abstraction layer designed to make it easier for users to define events andfunctions. Tapsets provide useful aliases for functions that users may want to specify as an event;knowing the proper alias to use is, for the most part, easier than remembering specific kernel functionsthat might vary between kernel versions.
Several handlers and functions in Section 3.2.1, “Event” and SystemTap Functions are defined in tapsets.For example, thread_indent() is defined in indent.stp.

Chapter 4.
35
User-space ProbingSystemTap initially focused on kernel-space probing. Because there are many instances where user-space probing can help diagnose a problem, SystemTap 0.6 added support to allow probing user-spaceprocesses. SystemTap can probe the entry into and return from a function in user-space processes, probepredefined markers in user-space code, and monitor user-process events.
SystemTap requires the uprobes module to perform user-space probing. If your Linux kernel is version 3.5or higher, it already includes uprobes. To verify that the current kernel supports uprobes natively, run thefollowing command:
grep CONFIG_UPROBES /boot/config-`uname -r`
If uprobes is integrated, the output of this command is as follows:
CONFIG_UPROBES=y
If you are running a kernel prior to version 3.5, SystemTap automatically builds the uprobes module.However, you also need the utrace kernel extensions required by the SystemTap user-space probingto track various user-space events. More details about the utrace infrastructure are available at http://sourceware.org/systemtap/wiki/utrace. To determine whether the currently running Linux kernel providesthe needed utrace support, type the following at a shell prompt:
grep CONFIG_UTRACE /boot/config-`uname -r`
If the Linux kernel supports user-space probing, the command produces the following output:
CONFIG_UTRACE=y
4.1. User-Space Events
All user-space event probes begin with process. You can limit the process events to a specific runningprocess by specifying the process ID. You can also limit the process events to monitor a particularexecutable by specifying the path to the executable (PATH). SystemTap makes use of the PATHenvironment variable, which allows you to use both the name used on the command-line to start theexecutable and the absolute path to the executable.
Several of the user-space probe events limit their scope to a particular executable name (PATH), becauseSystemTap must use debug information to statically analyze where to place the probes. But for manyuser-space probe events, the process ID and executable name are optional. Any process event inthe list below that include process ID or the path to the executable must include those arguments. Theprocess ID and path to the executable are optional for the process events that do not list them:
process("PATH").function("function")The entry to the user-space function function for the executable PATH. This event is the user-spaceanalogue of the kernel.function("function") event. It allows wildcards for the functionfunction and .return suffix.
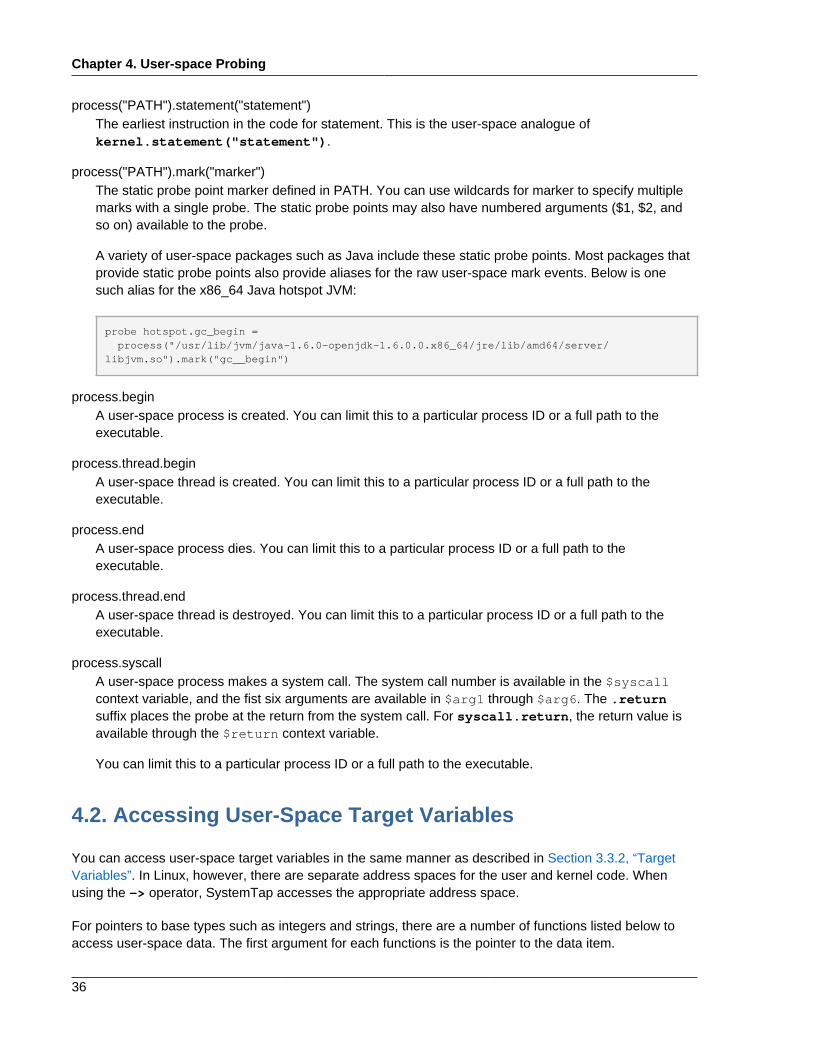
Chapter 4. User-space Probing
36
process("PATH").statement("statement")The earliest instruction in the code for statement. This is the user-space analogue ofkernel.statement("statement").
process("PATH").mark("marker")The static probe point marker defined in PATH. You can use wildcards for marker to specify multiplemarks with a single probe. The static probe points may also have numbered arguments ($1, $2, andso on) available to the probe.
A variety of user-space packages such as Java include these static probe points. Most packages thatprovide static probe points also provide aliases for the raw user-space mark events. Below is onesuch alias for the x86_64 Java hotspot JVM:
probe hotspot.gc_begin = process("/usr/lib/jvm/java-1.6.0-openjdk-1.6.0.0.x86_64/jre/lib/amd64/server/libjvm.so").mark("gc__begin")
process.beginA user-space process is created. You can limit this to a particular process ID or a full path to theexecutable.
process.thread.beginA user-space thread is created. You can limit this to a particular process ID or a full path to theexecutable.
process.endA user-space process dies. You can limit this to a particular process ID or a full path to theexecutable.
process.thread.endA user-space thread is destroyed. You can limit this to a particular process ID or a full path to theexecutable.
process.syscallA user-space process makes a system call. The system call number is available in the $syscallcontext variable, and the fist six arguments are available in $arg1 through $arg6. The .returnsuffix places the probe at the return from the system call. For syscall.return, the return value isavailable through the $return context variable.
You can limit this to a particular process ID or a full path to the executable.
4.2. Accessing User-Space Target Variables
You can access user-space target variables in the same manner as described in Section 3.3.2, “TargetVariables”. In Linux, however, there are separate address spaces for the user and kernel code. Whenusing the -> operator, SystemTap accesses the appropriate address space.
For pointers to base types such as integers and strings, there are a number of functions listed below toaccess user-space data. The first argument for each functions is the pointer to the data item.
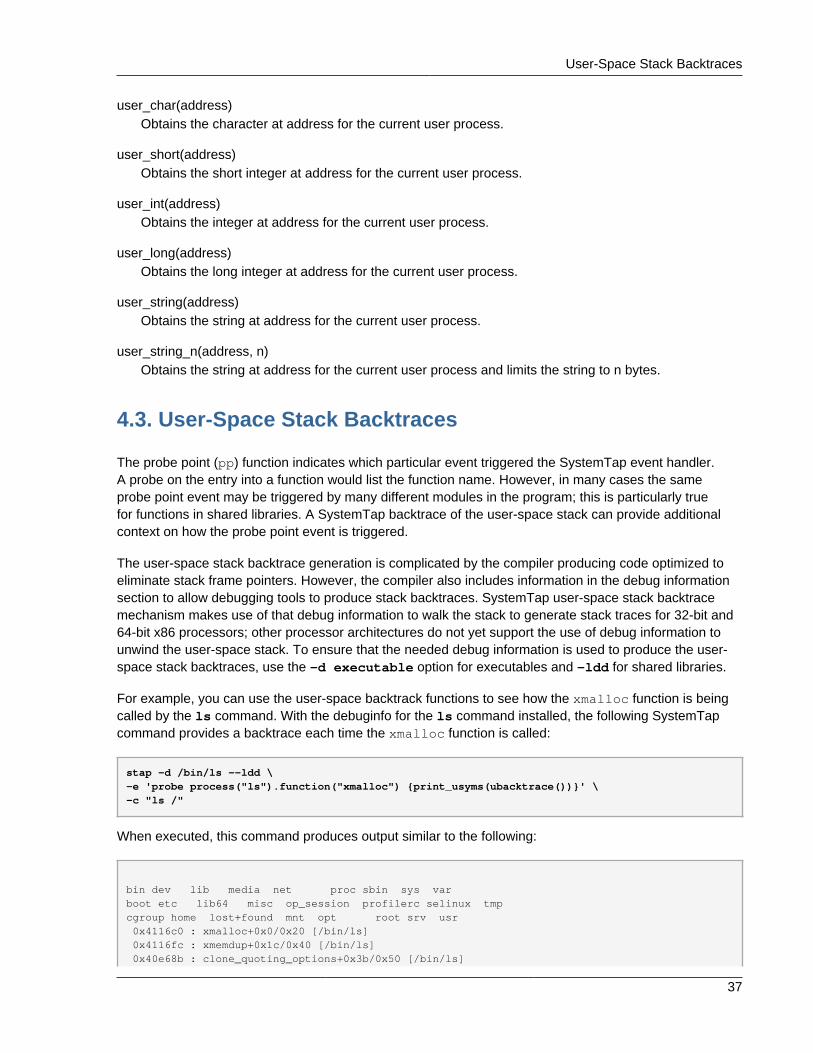
User-Space Stack Backtraces
37
user_char(address)Obtains the character at address for the current user process.
user_short(address)Obtains the short integer at address for the current user process.
user_int(address)Obtains the integer at address for the current user process.
user_long(address)Obtains the long integer at address for the current user process.
user_string(address)Obtains the string at address for the current user process.
user_string_n(address, n)Obtains the string at address for the current user process and limits the string to n bytes.
4.3. User-Space Stack Backtraces
The probe point (pp) function indicates which particular event triggered the SystemTap event handler.A probe on the entry into a function would list the function name. However, in many cases the sameprobe point event may be triggered by many different modules in the program; this is particularly truefor functions in shared libraries. A SystemTap backtrace of the user-space stack can provide additionalcontext on how the probe point event is triggered.
The user-space stack backtrace generation is complicated by the compiler producing code optimized toeliminate stack frame pointers. However, the compiler also includes information in the debug informationsection to allow debugging tools to produce stack backtraces. SystemTap user-space stack backtracemechanism makes use of that debug information to walk the stack to generate stack traces for 32-bit and64-bit x86 processors; other processor architectures do not yet support the use of debug information tounwind the user-space stack. To ensure that the needed debug information is used to produce the user-space stack backtraces, use the -d executable option for executables and -ldd for shared libraries.
For example, you can use the user-space backtrack functions to see how the xmalloc function is beingcalled by the ls command. With the debuginfo for the ls command installed, the following SystemTapcommand provides a backtrace each time the xmalloc function is called:
stap -d /bin/ls --ldd \-e 'probe process("ls").function("xmalloc") {print_usyms(ubacktrace())}' \-c "ls /"
When executed, this command produces output similar to the following:
bin dev lib media net proc sbin sys varboot etc lib64 misc op_session profilerc selinux tmpcgroup home lost+found mnt opt root srv usr 0x4116c0 : xmalloc+0x0/0x20 [/bin/ls] 0x4116fc : xmemdup+0x1c/0x40 [/bin/ls] 0x40e68b : clone_quoting_options+0x3b/0x50 [/bin/ls]

Chapter 4. User-space Probing
38
0x4087e4 : main+0x3b4/0x1900 [/bin/ls] 0x3fa441ec5d : __libc_start_main+0xfd/0x1d0 [/lib64/libc-2.12.so] 0x402799 : _start+0x29/0x2c [/bin/ls] 0x4116c0 : xmalloc+0x0/0x20 [/bin/ls] 0x4116fc : xmemdup+0x1c/0x40 [/bin/ls] 0x40e68b : clone_quoting_options+0x3b/0x50 [/bin/ls] 0x40884a : main+0x41a/0x1900 [/bin/ls] 0x3fa441ec5d : __libc_start_main+0xfd/0x1d0 [/lib64/libc-2.12.so] ...
For more details on the functions available for user-space stack backtraces, refer to ucontext-symbols.stp and ucontext-unwind.stp tapsets. You can also find the description of the functions inthe aforementioned tapsets in the SystemTap Tapset Reference Manual.
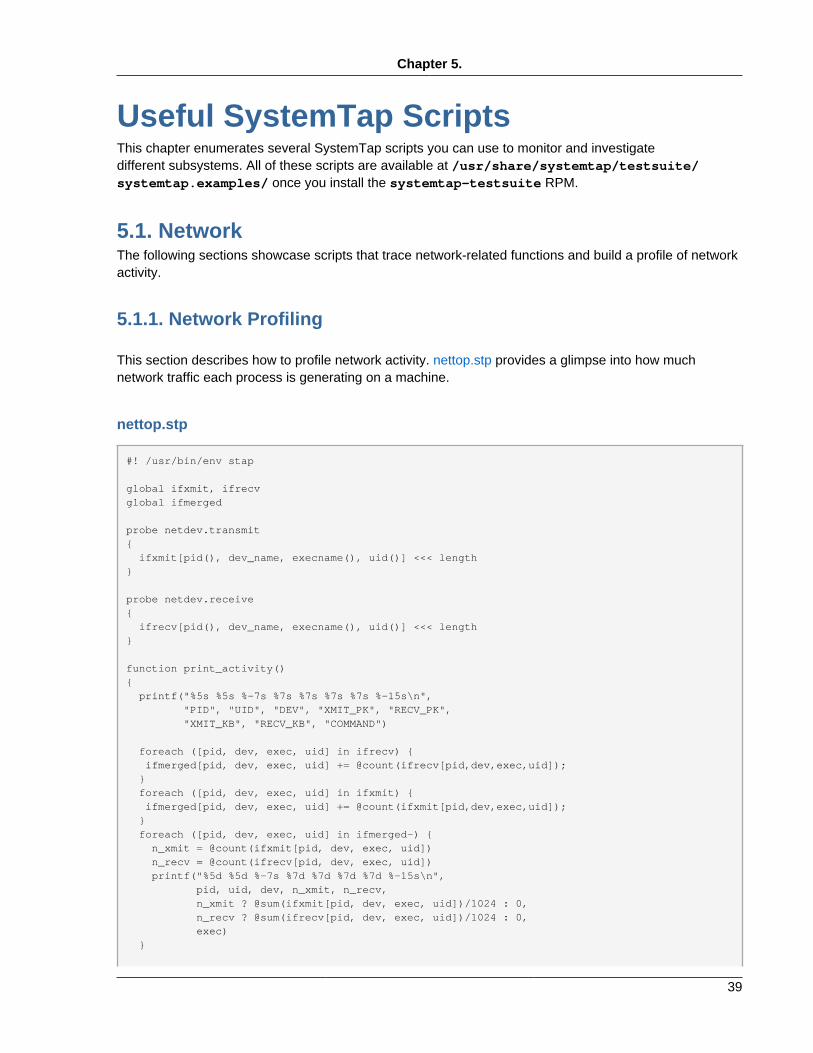
Chapter 5.
39
Useful SystemTap ScriptsThis chapter enumerates several SystemTap scripts you can use to monitor and investigatedifferent subsystems. All of these scripts are available at /usr/share/systemtap/testsuite/systemtap.examples/ once you install the systemtap-testsuite RPM.
5.1. NetworkThe following sections showcase scripts that trace network-related functions and build a profile of networkactivity.
5.1.1. Network Profiling
This section describes how to profile network activity. nettop.stp provides a glimpse into how muchnetwork traffic each process is generating on a machine.
nettop.stp
#! /usr/bin/env stap
global ifxmit, ifrecvglobal ifmerged
probe netdev.transmit{ ifxmit[pid(), dev_name, execname(), uid()] <<< length}
probe netdev.receive{ ifrecv[pid(), dev_name, execname(), uid()] <<< length}
function print_activity(){ printf("%5s %5s %-7s %7s %7s %7s %7s %-15s\n", "PID", "UID", "DEV", "XMIT_PK", "RECV_PK", "XMIT_KB", "RECV_KB", "COMMAND")
foreach ([pid, dev, exec, uid] in ifrecv) { ifmerged[pid, dev, exec, uid] += @count(ifrecv[pid,dev,exec,uid]); } foreach ([pid, dev, exec, uid] in ifxmit) { ifmerged[pid, dev, exec, uid] += @count(ifxmit[pid,dev,exec,uid]); } foreach ([pid, dev, exec, uid] in ifmerged-) { n_xmit = @count(ifxmit[pid, dev, exec, uid]) n_recv = @count(ifrecv[pid, dev, exec, uid]) printf("%5d %5d %-7s %7d %7d %7d %7d %-15s\n", pid, uid, dev, n_xmit, n_recv, n_xmit ? @sum(ifxmit[pid, dev, exec, uid])/1024 : 0, n_recv ? @sum(ifrecv[pid, dev, exec, uid])/1024 : 0, exec) }
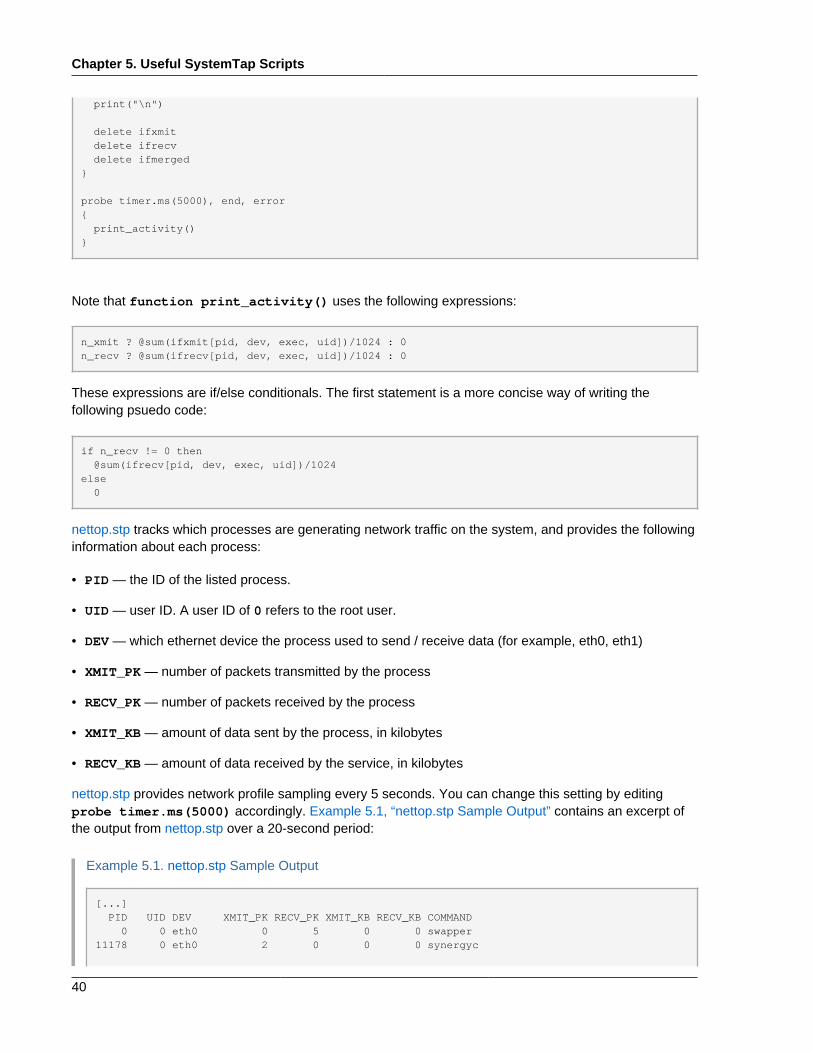
Chapter 5. Useful SystemTap Scripts
40
print("\n")
delete ifxmit delete ifrecv delete ifmerged}
probe timer.ms(5000), end, error{ print_activity()}
Note that function print_activity() uses the following expressions:
n_xmit ? @sum(ifxmit[pid, dev, exec, uid])/1024 : 0n_recv ? @sum(ifrecv[pid, dev, exec, uid])/1024 : 0
These expressions are if/else conditionals. The first statement is a more concise way of writing thefollowing psuedo code:
if n_recv != 0 then @sum(ifrecv[pid, dev, exec, uid])/1024else 0
nettop.stp tracks which processes are generating network traffic on the system, and provides the followinginformation about each process:
• PID — the ID of the listed process.
• UID — user ID. A user ID of 0 refers to the root user.
• DEV — which ethernet device the process used to send / receive data (for example, eth0, eth1)
• XMIT_PK — number of packets transmitted by the process
• RECV_PK — number of packets received by the process
• XMIT_KB — amount of data sent by the process, in kilobytes
• RECV_KB — amount of data received by the service, in kilobytes
nettop.stp provides network profile sampling every 5 seconds. You can change this setting by editingprobe timer.ms(5000) accordingly. Example 5.1, “nettop.stp Sample Output” contains an excerpt ofthe output from nettop.stp over a 20-second period:
Example 5.1. nettop.stp Sample Output
[...] PID UID DEV XMIT_PK RECV_PK XMIT_KB RECV_KB COMMAND 0 0 eth0 0 5 0 0 swapper11178 0 eth0 2 0 0 0 synergyc
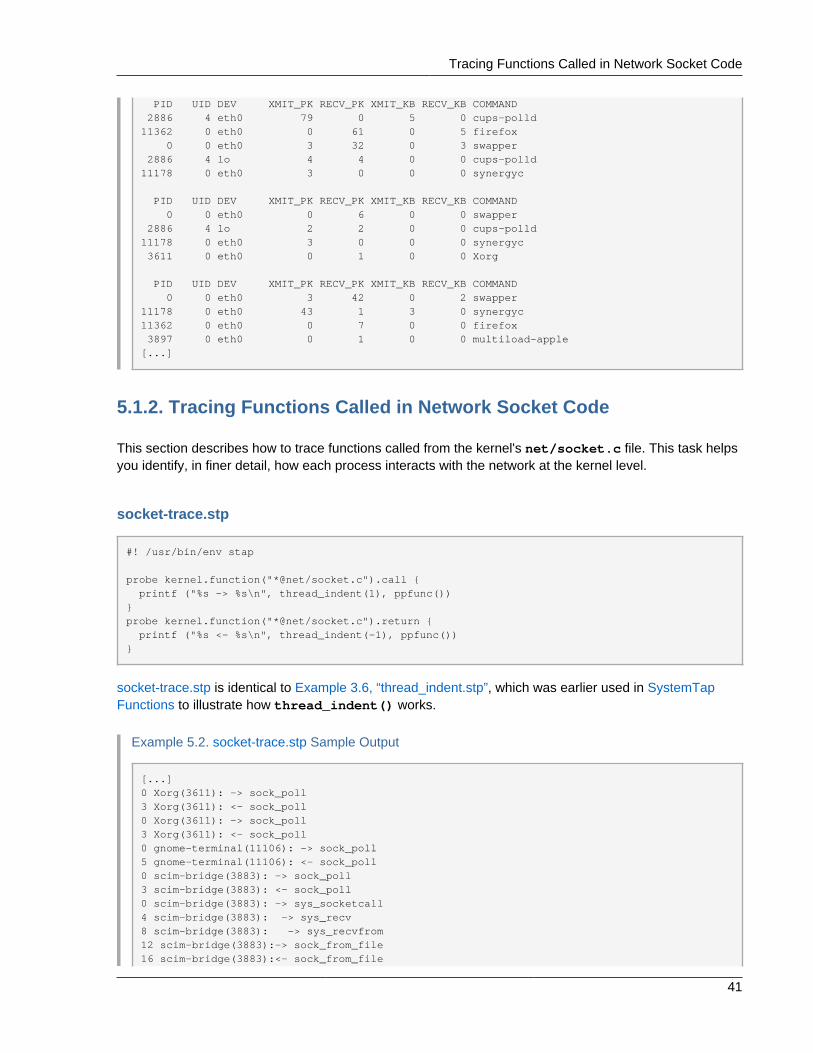
Tracing Functions Called in Network Socket Code
41
PID UID DEV XMIT_PK RECV_PK XMIT_KB RECV_KB COMMAND 2886 4 eth0 79 0 5 0 cups-polld11362 0 eth0 0 61 0 5 firefox 0 0 eth0 3 32 0 3 swapper 2886 4 lo 4 4 0 0 cups-polld11178 0 eth0 3 0 0 0 synergyc
PID UID DEV XMIT_PK RECV_PK XMIT_KB RECV_KB COMMAND 0 0 eth0 0 6 0 0 swapper 2886 4 lo 2 2 0 0 cups-polld11178 0 eth0 3 0 0 0 synergyc 3611 0 eth0 0 1 0 0 Xorg
PID UID DEV XMIT_PK RECV_PK XMIT_KB RECV_KB COMMAND 0 0 eth0 3 42 0 2 swapper11178 0 eth0 43 1 3 0 synergyc11362 0 eth0 0 7 0 0 firefox 3897 0 eth0 0 1 0 0 multiload-apple[...]
5.1.2. Tracing Functions Called in Network Socket Code
This section describes how to trace functions called from the kernel's net/socket.c file. This task helpsyou identify, in finer detail, how each process interacts with the network at the kernel level.
socket-trace.stp
#! /usr/bin/env stap
probe kernel.function("*@net/socket.c").call { printf ("%s -> %s\n", thread_indent(1), ppfunc())}probe kernel.function("*@net/socket.c").return { printf ("%s <- %s\n", thread_indent(-1), ppfunc())}
socket-trace.stp is identical to Example 3.6, “thread_indent.stp”, which was earlier used in SystemTapFunctions to illustrate how thread_indent() works.
Example 5.2. socket-trace.stp Sample Output
[...]0 Xorg(3611): -> sock_poll3 Xorg(3611): <- sock_poll0 Xorg(3611): -> sock_poll3 Xorg(3611): <- sock_poll0 gnome-terminal(11106): -> sock_poll5 gnome-terminal(11106): <- sock_poll0 scim-bridge(3883): -> sock_poll3 scim-bridge(3883): <- sock_poll0 scim-bridge(3883): -> sys_socketcall4 scim-bridge(3883): -> sys_recv8 scim-bridge(3883): -> sys_recvfrom12 scim-bridge(3883):-> sock_from_file16 scim-bridge(3883):<- sock_from_file

Chapter 5. Useful SystemTap Scripts
42
20 scim-bridge(3883):-> sock_recvmsg24 scim-bridge(3883):<- sock_recvmsg28 scim-bridge(3883): <- sys_recvfrom31 scim-bridge(3883): <- sys_recv35 scim-bridge(3883): <- sys_socketcall[...]
Example 5.2, “socket-trace.stp Sample Output” contains a 3-second excerpt of the output for socket-trace.stp. For more information about the output of this script as provided by thread_indent(), refer toSystemTap Functions Example 3.6, “thread_indent.stp”.
5.1.3. Monitoring Incoming TCP Connections
This section illustrates how to monitor incoming TCP connections. This task is useful in identifying anyunauthorized, suspicious, or otherwise unwanted network access requests in real time.
tcp_connections.stp
#! /usr/bin/env stap
probe begin { printf("%6s %16s %6s %6s %16s\n", "UID", "CMD", "PID", "PORT", "IP_SOURCE")}
probe kernel.function("tcp_accept").return?, kernel.function("inet_csk_accept").return? { sock = $return if (sock != 0) printf("%6d %16s %6d %6d %16s\n", uid(), execname(), pid(), inet_get_local_port(sock), inet_get_ip_source(sock))}
While tcp_connections.stp is running, it will print out the following information about any incoming TCPconnections accepted by the system in real time:
• Current UID
• CMD - the command accepting the connection
• PID of the command
• Port used by the connection
• IP address from which the TCP connection originated
Example 5.3. tcp_connections.stp Sample Output
UID CMD PID PORT IP_SOURCE0 sshd 3165 22 10.64.0.2270 sshd 3165 22 10.64.0.227

Monitoring TCP Packets
43
5.1.4. Monitoring TCP Packets
This section illustrates how to monitor TCP packets received by the system. This is useful in analyzingnetwork traffic generated by applications running on the system.
tcpdumplike.stp
#! /usr/bin/env stap
// A TCP dump like example
probe begin, timer.s(1) { printf("-----------------------------------------------------------------\n") printf(" Source IP Dest IP SPort DPort U A P R S F \n") printf("-----------------------------------------------------------------\n")}
probe udp.recvmsg /* ,udp.sendmsg */ { printf(" %15s %15s %5d %5d UDP\n", saddr, daddr, sport, dport)}
probe tcp.receive { printf(" %15s %15s %5d %5d %d %d %d %d %d %d\n", saddr, daddr, sport, dport, urg, ack, psh, rst, syn, fin)}
While tcpdumplike.stp is running, it will print out the following information about any received TCP packetsin real time:
• Source and destination IP address (saddr, daddr, respectively)
• Source and destination ports (sport, dport, respectively)
• Packet flags
To determine the flags used by the packet, tcpdumplike.stp uses the following functions:
• urg - urgent
• ack - acknowledgement
• psh - push
• rst - reset
• syn - synchronize
• fin - finished
The aforementioned functions return 1 or 0 to specify whether the packet uses the corresponding flag.
Example 5.4. tcpdumplike.stp Sample Output
-----------------------------------------------------------------
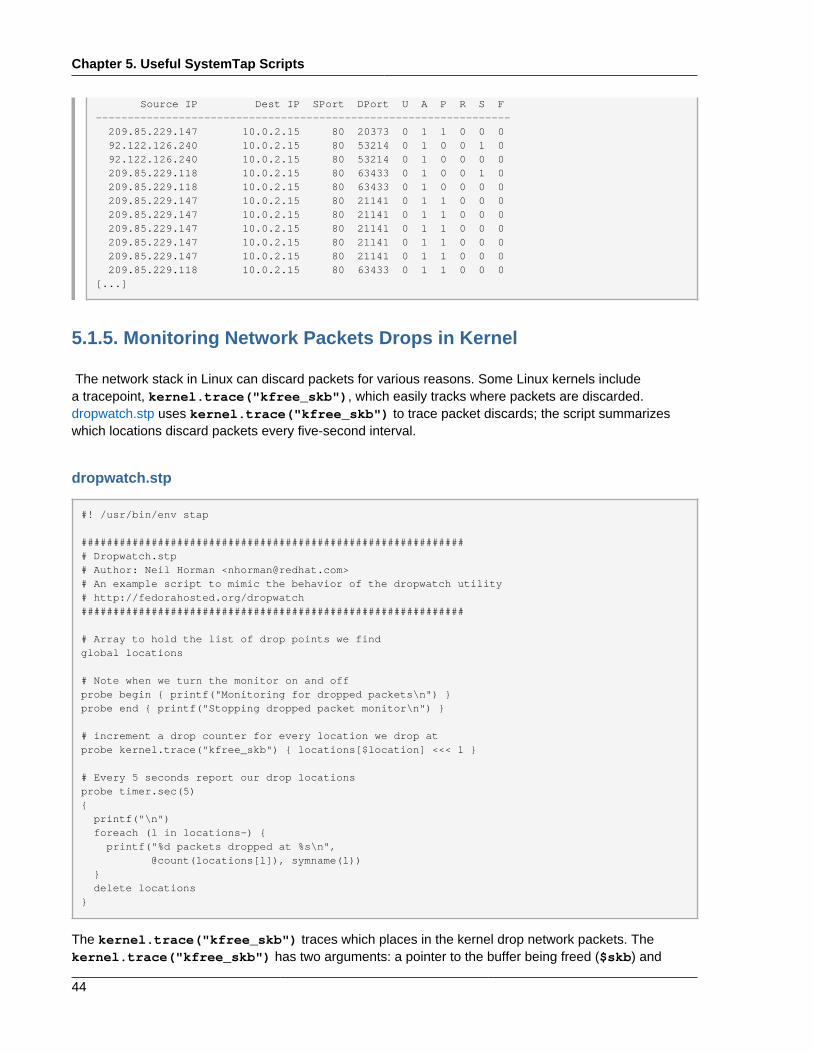
Chapter 5. Useful SystemTap Scripts
44
Source IP Dest IP SPort DPort U A P R S F----------------------------------------------------------------- 209.85.229.147 10.0.2.15 80 20373 0 1 1 0 0 0 92.122.126.240 10.0.2.15 80 53214 0 1 0 0 1 0 92.122.126.240 10.0.2.15 80 53214 0 1 0 0 0 0 209.85.229.118 10.0.2.15 80 63433 0 1 0 0 1 0 209.85.229.118 10.0.2.15 80 63433 0 1 0 0 0 0 209.85.229.147 10.0.2.15 80 21141 0 1 1 0 0 0 209.85.229.147 10.0.2.15 80 21141 0 1 1 0 0 0 209.85.229.147 10.0.2.15 80 21141 0 1 1 0 0 0 209.85.229.147 10.0.2.15 80 21141 0 1 1 0 0 0 209.85.229.147 10.0.2.15 80 21141 0 1 1 0 0 0 209.85.229.118 10.0.2.15 80 63433 0 1 1 0 0 0[...]
5.1.5. Monitoring Network Packets Drops in Kernel
The network stack in Linux can discard packets for various reasons. Some Linux kernels includea tracepoint, kernel.trace("kfree_skb"), which easily tracks where packets are discarded.dropwatch.stp uses kernel.trace("kfree_skb") to trace packet discards; the script summarizeswhich locations discard packets every five-second interval.
dropwatch.stp
#! /usr/bin/env stap
############################################################# Dropwatch.stp# Author: Neil Horman <[email protected]># An example script to mimic the behavior of the dropwatch utility# http://fedorahosted.org/dropwatch############################################################
# Array to hold the list of drop points we findglobal locations
# Note when we turn the monitor on and offprobe begin { printf("Monitoring for dropped packets\n") }probe end { printf("Stopping dropped packet monitor\n") }
# increment a drop counter for every location we drop atprobe kernel.trace("kfree_skb") { locations[$location] <<< 1 }
# Every 5 seconds report our drop locationsprobe timer.sec(5){ printf("\n") foreach (l in locations-) { printf("%d packets dropped at %s\n", @count(locations[l]), symname(l)) } delete locations}
The kernel.trace("kfree_skb") traces which places in the kernel drop network packets. Thekernel.trace("kfree_skb") has two arguments: a pointer to the buffer being freed ($skb) and
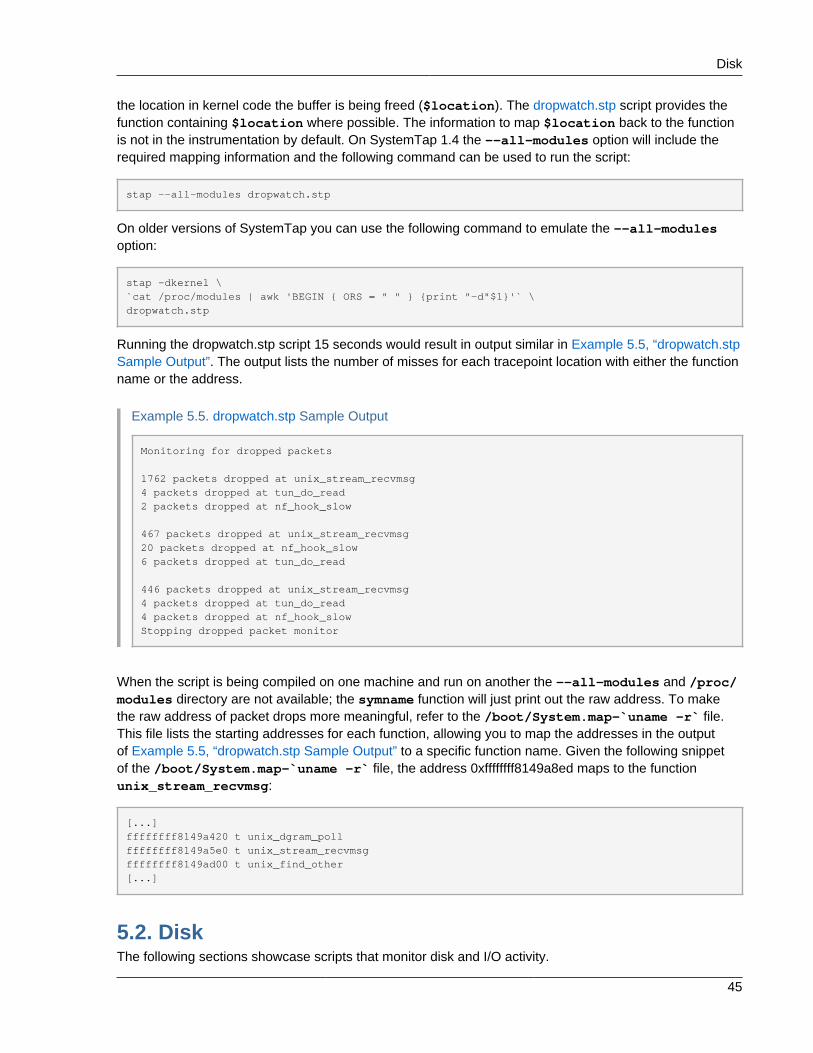
Disk
45
the location in kernel code the buffer is being freed ($location). The dropwatch.stp script provides thefunction containing $location where possible. The information to map $location back to the functionis not in the instrumentation by default. On SystemTap 1.4 the --all-modules option will include therequired mapping information and the following command can be used to run the script:
stap --all-modules dropwatch.stp
On older versions of SystemTap you can use the following command to emulate the --all-modulesoption:
stap -dkernel \`cat /proc/modules | awk 'BEGIN { ORS = " " } {print "-d"$1}'` \dropwatch.stp
Running the dropwatch.stp script 15 seconds would result in output similar in Example 5.5, “dropwatch.stpSample Output”. The output lists the number of misses for each tracepoint location with either the functionname or the address.
Example 5.5. dropwatch.stp Sample Output
Monitoring for dropped packets
1762 packets dropped at unix_stream_recvmsg4 packets dropped at tun_do_read2 packets dropped at nf_hook_slow
467 packets dropped at unix_stream_recvmsg20 packets dropped at nf_hook_slow6 packets dropped at tun_do_read
446 packets dropped at unix_stream_recvmsg4 packets dropped at tun_do_read4 packets dropped at nf_hook_slowStopping dropped packet monitor
When the script is being compiled on one machine and run on another the --all-modules and /proc/modules directory are not available; the symname function will just print out the raw address. To makethe raw address of packet drops more meaningful, refer to the /boot/System.map-`uname -r` file.This file lists the starting addresses for each function, allowing you to map the addresses in the outputof Example 5.5, “dropwatch.stp Sample Output” to a specific function name. Given the following snippetof the /boot/System.map-`uname -r` file, the address 0xffffffff8149a8ed maps to the functionunix_stream_recvmsg:
[...]ffffffff8149a420 t unix_dgram_pollffffffff8149a5e0 t unix_stream_recvmsgffffffff8149ad00 t unix_find_other[...]
5.2. DiskThe following sections showcase scripts that monitor disk and I/O activity.

Chapter 5. Useful SystemTap Scripts
46
5.2.1. Summarizing Disk Read/Write Traffic
This section describes how to identify which processes are performing the heaviest disk reads/writes tothe system.
disktop.stp
#!/usr/bin/env stap ## Copyright (C) 2007 Oracle Corp.## Get the status of reading/writing disk every 5 seconds,# output top ten entries ## This is free software,GNU General Public License (GPL);# either version 2, or (at your option) any later version.## Usage:# ./disktop.stp#
global io_stat,deviceglobal read_bytes,write_bytes
probe vfs.read.return { if ($return>0) { if (devname!="N/A") {/*skip read from cache*/ io_stat[pid(),execname(),uid(),ppid(),"R"] += $return device[pid(),execname(),uid(),ppid(),"R"] = devname read_bytes += $return } }}
probe vfs.write.return { if ($return>0) { if (devname!="N/A") { /*skip update cache*/ io_stat[pid(),execname(),uid(),ppid(),"W"] += $return device[pid(),execname(),uid(),ppid(),"W"] = devname write_bytes += $return } }}
probe timer.ms(5000) { /* skip non-read/write disk */ if (read_bytes+write_bytes) {
printf("\n%-25s, %-8s%4dKb/sec, %-7s%6dKb, %-7s%6dKb\n\n", ctime(gettimeofday_s()), "Average:", ((read_bytes+write_bytes)/1024)/5, "Read:",read_bytes/1024, "Write:",write_bytes/1024)
/* print header */ printf("%8s %8s %8s %25s %8s %4s %12s\n", "UID","PID","PPID","CMD","DEVICE","T","BYTES") } /* print top ten I/O */

Summarizing Disk Read/Write Traffic
47
foreach ([process,cmd,userid,parent,action] in io_stat- limit 10) printf("%8d %8d %8d %25s %8s %4s %12d\n", userid,process,parent,cmd, device[process,cmd,userid,parent,action], action,io_stat[process,cmd,userid,parent,action])
/* clear data */ delete io_stat delete device read_bytes = 0 write_bytes = 0 }
probe end{ delete io_stat delete device delete read_bytes delete write_bytes}
disktop.stp outputs the top ten processes responsible for the heaviest reads/writes to disk. Example 5.6,“disktop.stp Sample Output” displays a sample output for this script, and includes the following data perlisted process:
• UID — user ID. A user ID of 0 refers to the root user.
• PID — the ID of the listed process.
• PPID — the process ID of the listed process's parent process.
• CMD — the name of the listed process.
• DEVICE — which storage device the listed process is reading from or writing to.
• T — the type of action performed by the listed process; W refers to write, while R refers to read.
• BYTES — the amount of data read to or written from disk.
The time and date in the output of disktop.stp is returned by the functions ctime() andgettimeofday_s(). ctime() derives calendar time in terms of seconds passed since the Unix epoch(January 1, 1970). gettimeofday_s() counts the actual number of seconds since Unix epoch, whichgives a fairly accurate human-readable timestamp for the output.
In this script, the $return is a local variable that stores the actual number of bytes each processreads or writes from the virtual file system. $return can only be used in return probes (for example,vfs.read.return and vfs.read.return).
Example 5.6. disktop.stp Sample Output
[...]Mon Sep 29 03:38:28 2008 , Average: 19Kb/sec, Read: 7Kb, Write: 89Kb
UID PID PPID CMD DEVICE T BYTES0 26319 26294 firefox sda5 W 90229
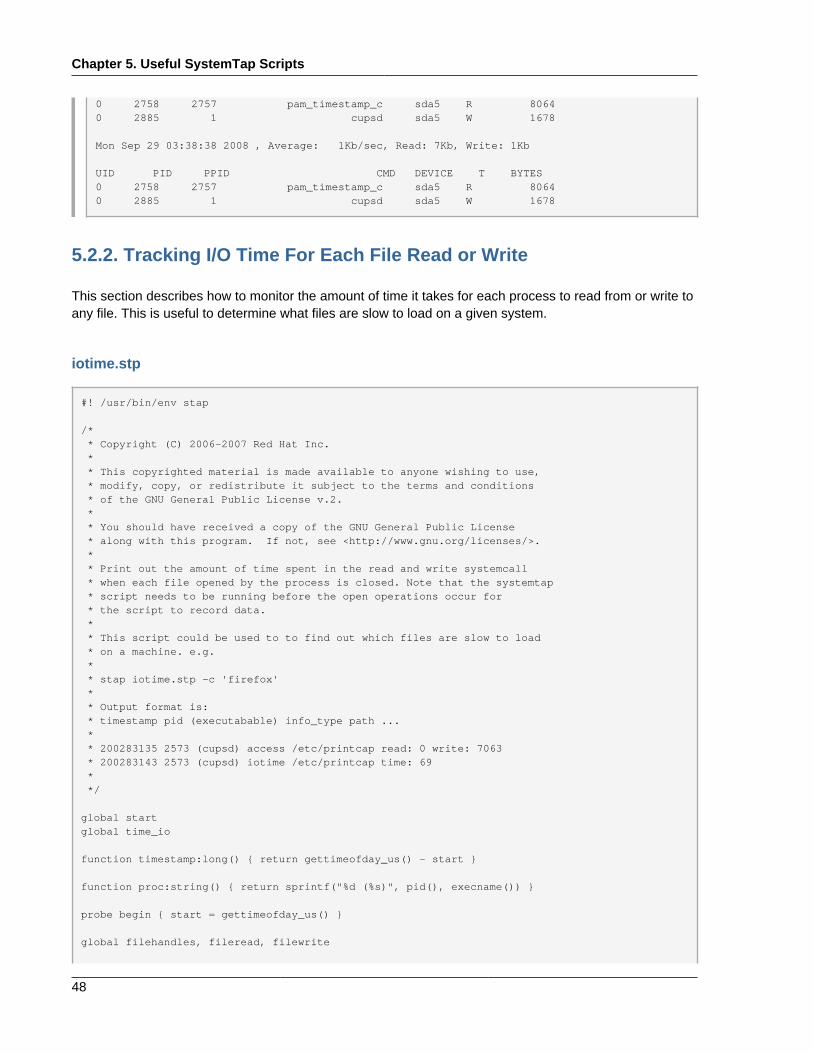
Chapter 5. Useful SystemTap Scripts
48
0 2758 2757 pam_timestamp_c sda5 R 80640 2885 1 cupsd sda5 W 1678
Mon Sep 29 03:38:38 2008 , Average: 1Kb/sec, Read: 7Kb, Write: 1Kb
UID PID PPID CMD DEVICE T BYTES0 2758 2757 pam_timestamp_c sda5 R 80640 2885 1 cupsd sda5 W 1678
5.2.2. Tracking I/O Time For Each File Read or Write
This section describes how to monitor the amount of time it takes for each process to read from or write toany file. This is useful to determine what files are slow to load on a given system.
iotime.stp
#! /usr/bin/env stap
/* * Copyright (C) 2006-2007 Red Hat Inc. * * This copyrighted material is made available to anyone wishing to use, * modify, copy, or redistribute it subject to the terms and conditions * of the GNU General Public License v.2. * * You should have received a copy of the GNU General Public License * along with this program. If not, see <http://www.gnu.org/licenses/>. * * Print out the amount of time spent in the read and write systemcall * when each file opened by the process is closed. Note that the systemtap * script needs to be running before the open operations occur for * the script to record data. * * This script could be used to to find out which files are slow to load * on a machine. e.g. * * stap iotime.stp -c 'firefox' * * Output format is: * timestamp pid (executabable) info_type path ... * * 200283135 2573 (cupsd) access /etc/printcap read: 0 write: 7063 * 200283143 2573 (cupsd) iotime /etc/printcap time: 69 * */
global startglobal time_io
function timestamp:long() { return gettimeofday_us() - start }
function proc:string() { return sprintf("%d (%s)", pid(), execname()) }
probe begin { start = gettimeofday_us() }
global filehandles, fileread, filewrite

Tracking I/O Time For Each File Read or Write
49
probe syscall.open.return { filename = user_string($filename) if ($return != -1) { filehandles[pid(), $return] = filename } else { printf("%d %s access %s fail\n", timestamp(), proc(), filename) }}
probe syscall.read.return { p = pid() fd = $fd bytes = $return time = gettimeofday_us() - @entry(gettimeofday_us()) if (bytes > 0) fileread[p, fd] += bytes time_io[p, fd] <<< time}
probe syscall.write.return { p = pid() fd = $fd bytes = $return time = gettimeofday_us() - @entry(gettimeofday_us()) if (bytes > 0) filewrite[p, fd] += bytes time_io[p, fd] <<< time}
probe syscall.close { if ([pid(), $fd] in filehandles) { printf("%d %s access %s read: %d write: %d\n", timestamp(), proc(), filehandles[pid(), $fd], fileread[pid(), $fd], filewrite[pid(), $fd]) if (@count(time_io[pid(), $fd])) printf("%d %s iotime %s time: %d\n", timestamp(), proc(), filehandles[pid(), $fd], @sum(time_io[pid(), $fd])) } delete fileread[pid(), $fd] delete filewrite[pid(), $fd] delete filehandles[pid(), $fd] delete time_io[pid(),$fd]}
iotime.stp tracks each time a system call opens, closes, reads from, and writes to a file. For each file anysystem call accesses, iotime.stp counts the number of microseconds it takes for any reads or writes tofinish and tracks the amount of data (in bytes) read from or written to the file.
iotime.stp also uses the local variable $count to track the amount of data (in bytes) that any system callattempts to read or write. Note that $return (as used in disktop.stp from Section 5.2.1, “SummarizingDisk Read/Write Traffic”) stores the actual amount of data read/written. $count can only be used onprobes that track data reads or writes (that is, syscall.read and syscall.write).
Example 5.7. iotime.stp Sample Output
[...]825946 3364 (NetworkManager) access /sys/class/net/eth0/carrier read: 8190 write: 0825955 3364 (NetworkManager) iotime /sys/class/net/eth0/carrier time: 9
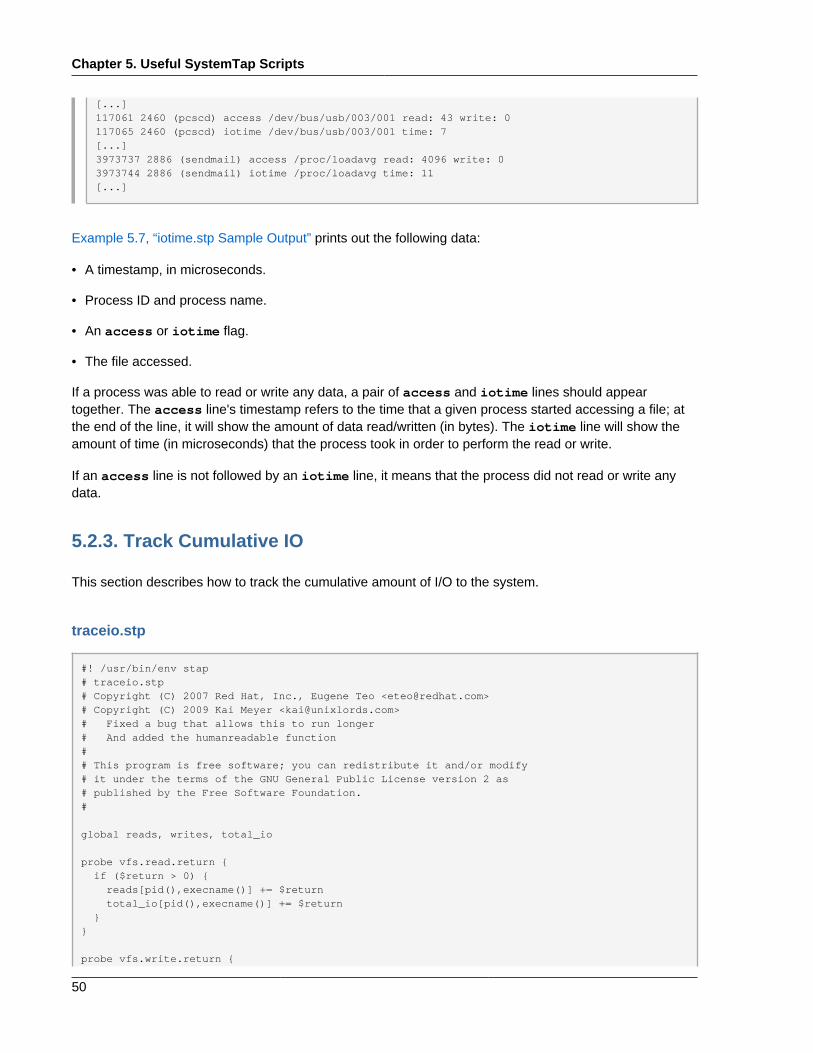
Chapter 5. Useful SystemTap Scripts
50
[...]117061 2460 (pcscd) access /dev/bus/usb/003/001 read: 43 write: 0117065 2460 (pcscd) iotime /dev/bus/usb/003/001 time: 7[...]3973737 2886 (sendmail) access /proc/loadavg read: 4096 write: 03973744 2886 (sendmail) iotime /proc/loadavg time: 11[...]
Example 5.7, “iotime.stp Sample Output” prints out the following data:
• A timestamp, in microseconds.
• Process ID and process name.
• An access or iotime flag.
• The file accessed.
If a process was able to read or write any data, a pair of access and iotime lines should appeartogether. The access line's timestamp refers to the time that a given process started accessing a file; atthe end of the line, it will show the amount of data read/written (in bytes). The iotime line will show theamount of time (in microseconds) that the process took in order to perform the read or write.
If an access line is not followed by an iotime line, it means that the process did not read or write anydata.
5.2.3. Track Cumulative IO
This section describes how to track the cumulative amount of I/O to the system.
traceio.stp
#! /usr/bin/env stap# traceio.stp# Copyright (C) 2007 Red Hat, Inc., Eugene Teo <[email protected]># Copyright (C) 2009 Kai Meyer <[email protected]># Fixed a bug that allows this to run longer# And added the humanreadable function## This program is free software; you can redistribute it and/or modify# it under the terms of the GNU General Public License version 2 as# published by the Free Software Foundation.#
global reads, writes, total_io
probe vfs.read.return { if ($return > 0) { reads[pid(),execname()] += $return total_io[pid(),execname()] += $return }}
probe vfs.write.return {
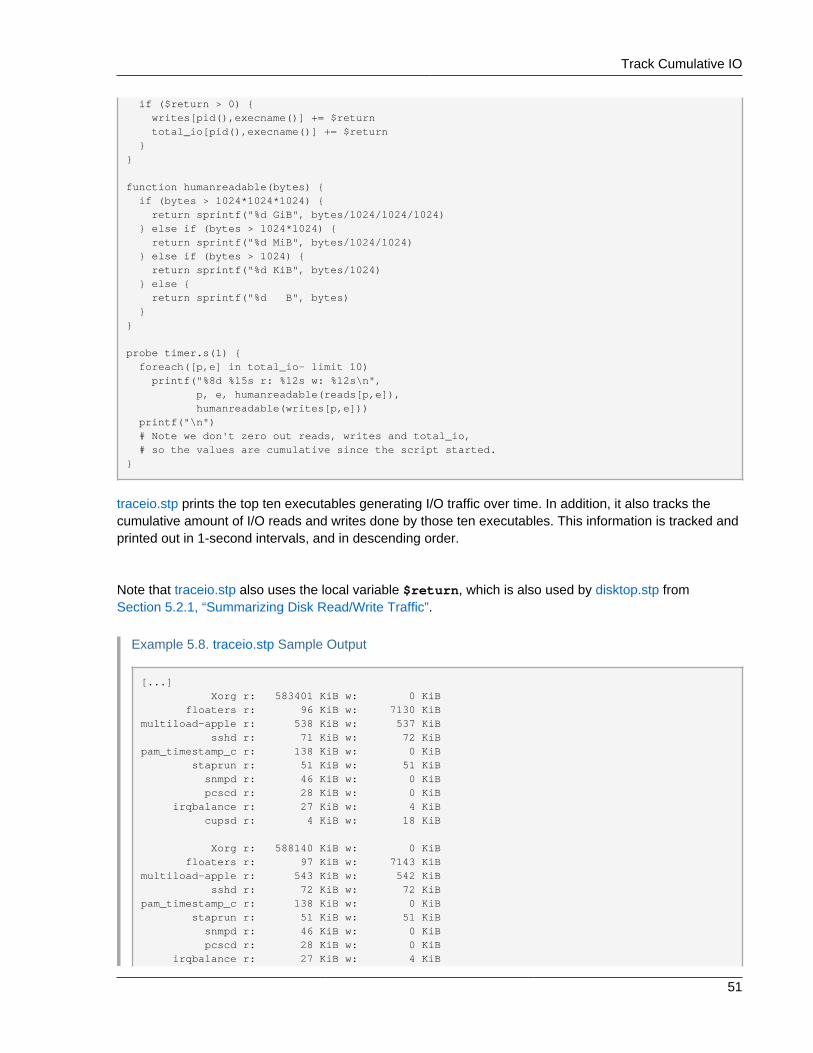
Track Cumulative IO
51
if ($return > 0) { writes[pid(),execname()] += $return total_io[pid(),execname()] += $return }}
function humanreadable(bytes) { if (bytes > 1024*1024*1024) { return sprintf("%d GiB", bytes/1024/1024/1024) } else if (bytes > 1024*1024) { return sprintf("%d MiB", bytes/1024/1024) } else if (bytes > 1024) { return sprintf("%d KiB", bytes/1024) } else { return sprintf("%d B", bytes) }}
probe timer.s(1) { foreach([p,e] in total_io- limit 10) printf("%8d %15s r: %12s w: %12s\n", p, e, humanreadable(reads[p,e]), humanreadable(writes[p,e])) printf("\n") # Note we don't zero out reads, writes and total_io, # so the values are cumulative since the script started.}
traceio.stp prints the top ten executables generating I/O traffic over time. In addition, it also tracks thecumulative amount of I/O reads and writes done by those ten executables. This information is tracked andprinted out in 1-second intervals, and in descending order.
Note that traceio.stp also uses the local variable $return, which is also used by disktop.stp fromSection 5.2.1, “Summarizing Disk Read/Write Traffic”.
Example 5.8. traceio.stp Sample Output
[...] Xorg r: 583401 KiB w: 0 KiB floaters r: 96 KiB w: 7130 KiBmultiload-apple r: 538 KiB w: 537 KiB sshd r: 71 KiB w: 72 KiBpam_timestamp_c r: 138 KiB w: 0 KiB staprun r: 51 KiB w: 51 KiB snmpd r: 46 KiB w: 0 KiB pcscd r: 28 KiB w: 0 KiB irqbalance r: 27 KiB w: 4 KiB cupsd r: 4 KiB w: 18 KiB
Xorg r: 588140 KiB w: 0 KiB floaters r: 97 KiB w: 7143 KiBmultiload-apple r: 543 KiB w: 542 KiB sshd r: 72 KiB w: 72 KiBpam_timestamp_c r: 138 KiB w: 0 KiB staprun r: 51 KiB w: 51 KiB snmpd r: 46 KiB w: 0 KiB pcscd r: 28 KiB w: 0 KiB irqbalance r: 27 KiB w: 4 KiB

Chapter 5. Useful SystemTap Scripts
52
cupsd r: 4 KiB w: 18 KiB
5.2.4. I/O Monitoring (By Device)
This section describes how to monitor I/O activity on a specific device.
traceio2.stp
#! /usr/bin/env stap
global device_of_interest
probe begin { /* The following is not the most efficient way to do this. One could directly put the result of usrdev2kerndev() into device_of_interest. However, want to test out the other device functions */ dev = usrdev2kerndev($1) device_of_interest = MKDEV(MAJOR(dev), MINOR(dev))}
probe vfs.write, vfs.read{ if (dev == device_of_interest) printf ("%s(%d) %s 0x%x\n", execname(), pid(), ppfunc(), dev)}
traceio2.stp takes 1 argument: the whole device number. To get this number, use stat -c "0x%D"directory, where directory is located in the device to be monitored.
The usrdev2kerndev() function converts the whole device number into the format understood by thekernel. The output produced by usrdev2kerndev() is used in conjunction with the MKDEV(), MINOR(),and MAJOR() functions to determine the major and minor numbers of a specific device.
The output of traceio2.stp includes the name and ID of any process performing a read/write, the function itis performing (that is, vfs_read or vfs_write), and the kernel device number.
The following example is an excerpt from the full output of stap traceio2.stp 0x805, where 0x805is the whole device number of /home. /home resides in /dev/sda5, which is the device we wish tomonitor.
Example 5.9. traceio2.stp Sample Output
[...]synergyc(3722) vfs_read 0x800005synergyc(3722) vfs_read 0x800005cupsd(2889) vfs_write 0x800005cupsd(2889) vfs_write 0x800005cupsd(2889) vfs_write 0x800005
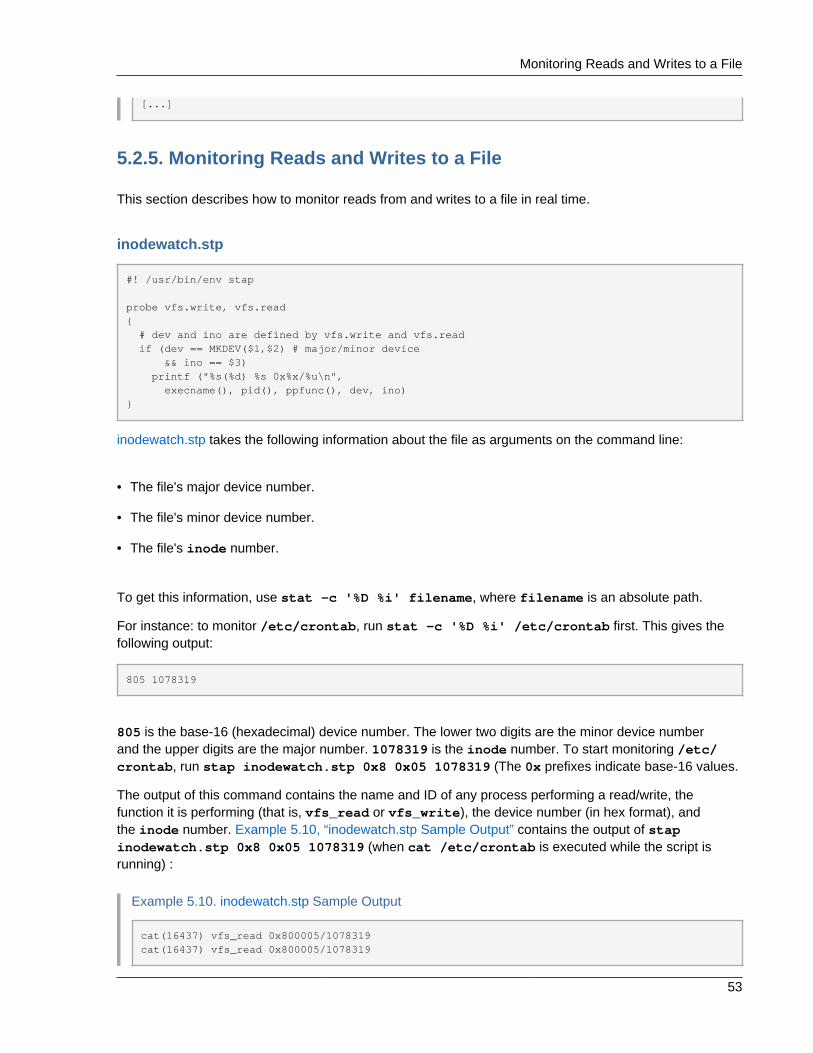
Monitoring Reads and Writes to a File
53
[...]
5.2.5. Monitoring Reads and Writes to a File
This section describes how to monitor reads from and writes to a file in real time.
inodewatch.stp
#! /usr/bin/env stap
probe vfs.write, vfs.read{ # dev and ino are defined by vfs.write and vfs.read if (dev == MKDEV($1,$2) # major/minor device && ino == $3) printf ("%s(%d) %s 0x%x/%u\n", execname(), pid(), ppfunc(), dev, ino)}
inodewatch.stp takes the following information about the file as arguments on the command line:
• The file's major device number.
• The file's minor device number.
• The file's inode number.
To get this information, use stat -c '%D %i' filename, where filename is an absolute path.
For instance: to monitor /etc/crontab, run stat -c '%D %i' /etc/crontab first. This gives thefollowing output:
805 1078319
805 is the base-16 (hexadecimal) device number. The lower two digits are the minor device numberand the upper digits are the major number. 1078319 is the inode number. To start monitoring /etc/crontab, run stap inodewatch.stp 0x8 0x05 1078319 (The 0x prefixes indicate base-16 values.
The output of this command contains the name and ID of any process performing a read/write, thefunction it is performing (that is, vfs_read or vfs_write), the device number (in hex format), andthe inode number. Example 5.10, “inodewatch.stp Sample Output” contains the output of stapinodewatch.stp 0x8 0x05 1078319 (when cat /etc/crontab is executed while the script isrunning) :
Example 5.10. inodewatch.stp Sample Output
cat(16437) vfs_read 0x800005/1078319cat(16437) vfs_read 0x800005/1078319
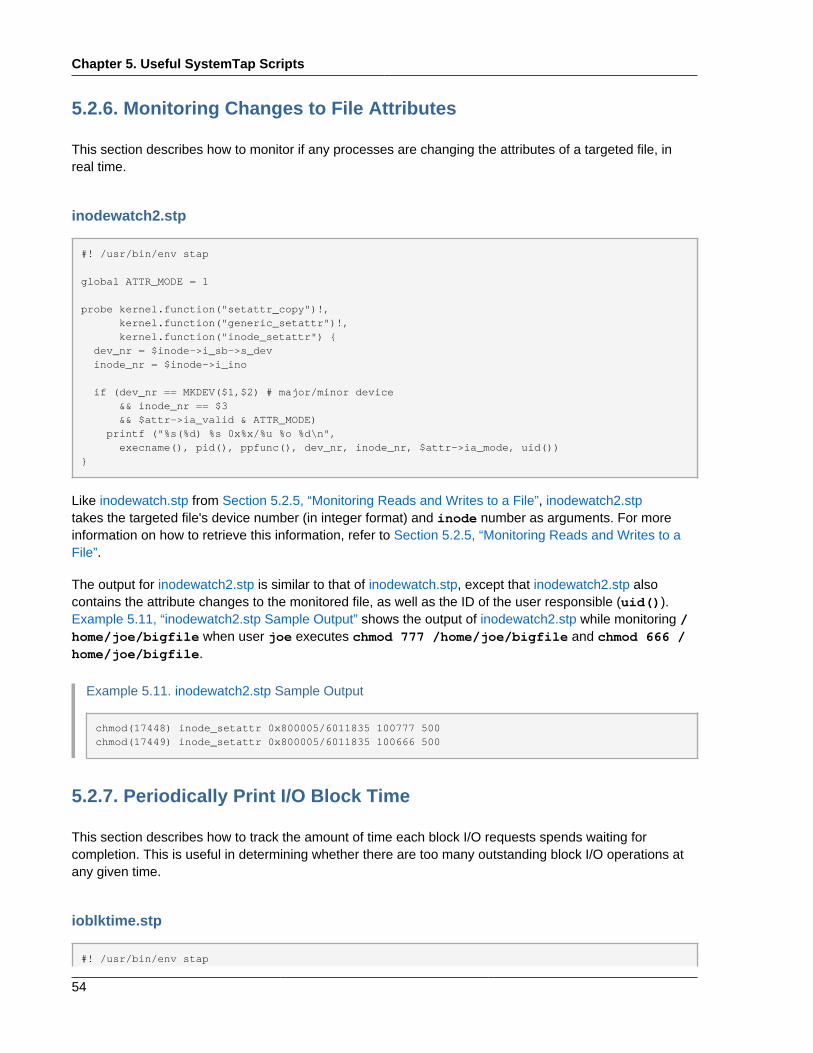
Chapter 5. Useful SystemTap Scripts
54
5.2.6. Monitoring Changes to File Attributes
This section describes how to monitor if any processes are changing the attributes of a targeted file, inreal time.
inodewatch2.stp
#! /usr/bin/env stap
global ATTR_MODE = 1
probe kernel.function("setattr_copy")!, kernel.function("generic_setattr")!, kernel.function("inode_setattr") { dev_nr = $inode->i_sb->s_dev inode_nr = $inode->i_ino
if (dev_nr == MKDEV($1,$2) # major/minor device && inode_nr == $3 && $attr->ia_valid & ATTR_MODE) printf ("%s(%d) %s 0x%x/%u %o %d\n", execname(), pid(), ppfunc(), dev_nr, inode_nr, $attr->ia_mode, uid())}
Like inodewatch.stp from Section 5.2.5, “Monitoring Reads and Writes to a File”, inodewatch2.stptakes the targeted file's device number (in integer format) and inode number as arguments. For moreinformation on how to retrieve this information, refer to Section 5.2.5, “Monitoring Reads and Writes to aFile”.
The output for inodewatch2.stp is similar to that of inodewatch.stp, except that inodewatch2.stp alsocontains the attribute changes to the monitored file, as well as the ID of the user responsible (uid()).Example 5.11, “inodewatch2.stp Sample Output” shows the output of inodewatch2.stp while monitoring /home/joe/bigfile when user joe executes chmod 777 /home/joe/bigfile and chmod 666 /home/joe/bigfile.
Example 5.11. inodewatch2.stp Sample Output
chmod(17448) inode_setattr 0x800005/6011835 100777 500chmod(17449) inode_setattr 0x800005/6011835 100666 500
5.2.7. Periodically Print I/O Block Time
This section describes how to track the amount of time each block I/O requests spends waiting forcompletion. This is useful in determining whether there are too many outstanding block I/O operations atany given time.
ioblktime.stp
#! /usr/bin/env stap

Periodically Print I/O Block Time
55
global req_time%[25000], etimes
probe ioblock.request{ req_time[$bio] = gettimeofday_us()}
probe ioblock.end{ t = gettimeofday_us() s = req_time[$bio] delete req_time[$bio] if (s) { etimes[devname, bio_rw_str(rw)] <<< t - s }}
/* for time being delete things that get merged with others */probe kernel.trace("block_bio_frontmerge"), kernel.trace("block_bio_backmerge"){ delete req_time[$bio]}
probe timer.s(10), end { ansi_clear_screen() printf("%10s %3s %10s %10s %10s\n", "device", "rw", "total (us)", "count", "avg (us)") foreach ([dev,rw] in etimes - limit 20) { printf("%10s %3s %10d %10d %10d\n", dev, rw, @sum(etimes[dev,rw]), @count(etimes[dev,rw]), @avg(etimes[dev,rw])) } delete etimes}
ioblktime.stp computes the average waiting time for block I/O per device, and prints a list every10 seconds. As always, you can revise this refresh rate by editing the specified value in probetimer.s(10), end {.
In some cases, there can be too many outstanding block I/O operations, at which point the script canexceed the default number of MAXMAPENTRIES. MAXMAPENTRIES is the maximum number of rowsin an array if the array size is not specified explicitly when declared. If the script exceeds the defaultMAXMAPENTRIES value of 2048, run the script again with the stap option -DMAXMAPENTRIES=10000.
Example 5.12. ioblktime.stp Sample Output
device rw total (us) count avg (us) sda W 9659 6 1609 dm-0 W 20278 6 3379 dm-0 R 20524 5 4104 sda R 19277 5 3855
Example 5.12, “ioblktime.stp Sample Output” displays the device name, operations performed (rw), totalwait time of all operations (total(us)), number of operations (count), and average wait time for allthose operations (avg (us)). The times tallied by the script are in microseconds.
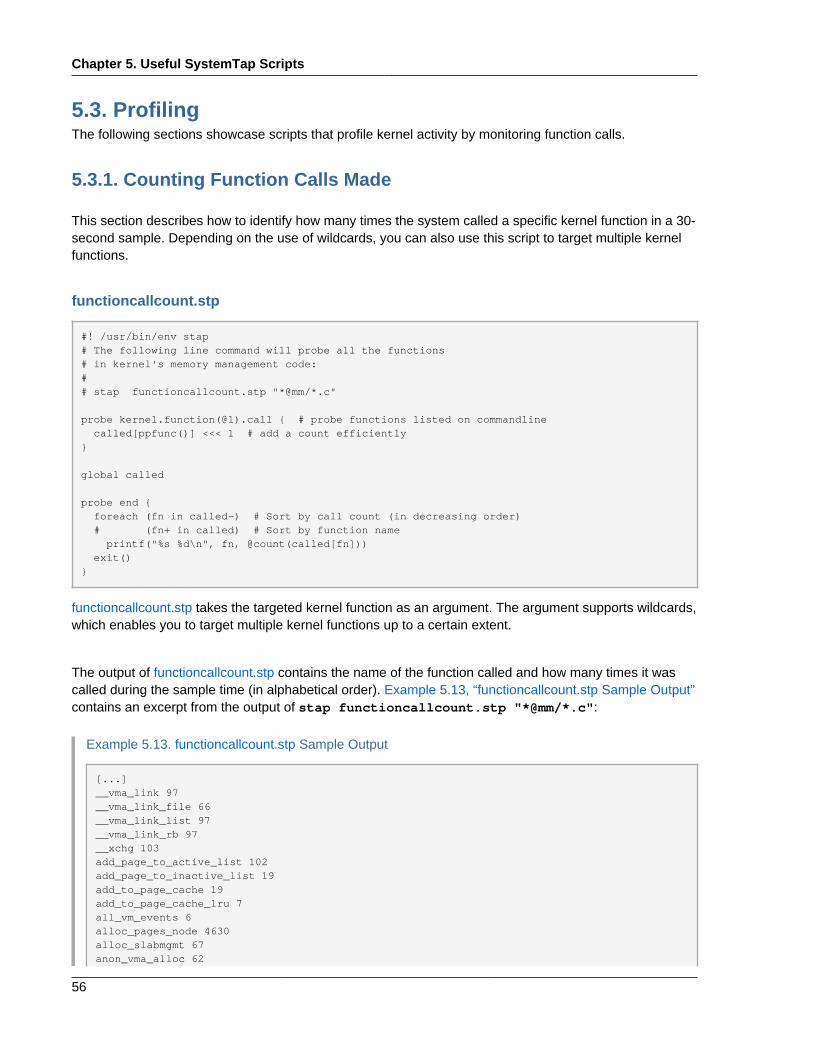
Chapter 5. Useful SystemTap Scripts
56
5.3. ProfilingThe following sections showcase scripts that profile kernel activity by monitoring function calls.
5.3.1. Counting Function Calls Made
This section describes how to identify how many times the system called a specific kernel function in a 30-second sample. Depending on the use of wildcards, you can also use this script to target multiple kernelfunctions.
functioncallcount.stp
#! /usr/bin/env stap# The following line command will probe all the functions# in kernel's memory management code:## stap functioncallcount.stp "*@mm/*.c"
probe kernel.function(@1).call { # probe functions listed on commandline called[ppfunc()] <<< 1 # add a count efficiently}
global called
probe end { foreach (fn in called-) # Sort by call count (in decreasing order) # (fn+ in called) # Sort by function name printf("%s %d\n", fn, @count(called[fn])) exit()}
functioncallcount.stp takes the targeted kernel function as an argument. The argument supports wildcards,which enables you to target multiple kernel functions up to a certain extent.
The output of functioncallcount.stp contains the name of the function called and how many times it wascalled during the sample time (in alphabetical order). Example 5.13, “functioncallcount.stp Sample Output”contains an excerpt from the output of stap functioncallcount.stp "*@mm/*.c":
Example 5.13. functioncallcount.stp Sample Output
[...]__vma_link 97__vma_link_file 66__vma_link_list 97__vma_link_rb 97__xchg 103add_page_to_active_list 102add_page_to_inactive_list 19add_to_page_cache 19add_to_page_cache_lru 7all_vm_events 6alloc_pages_node 4630alloc_slabmgmt 67anon_vma_alloc 62
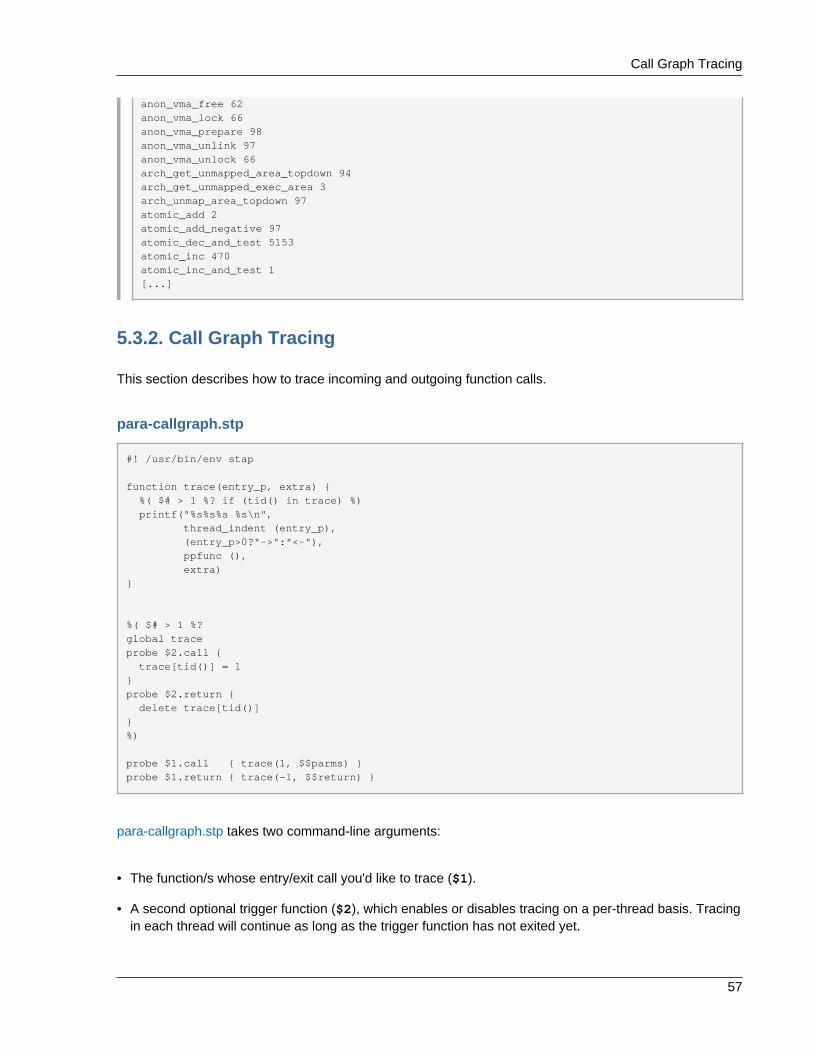
Call Graph Tracing
57
anon_vma_free 62anon_vma_lock 66anon_vma_prepare 98anon_vma_unlink 97anon_vma_unlock 66arch_get_unmapped_area_topdown 94arch_get_unmapped_exec_area 3arch_unmap_area_topdown 97atomic_add 2atomic_add_negative 97atomic_dec_and_test 5153atomic_inc 470atomic_inc_and_test 1[...]
5.3.2. Call Graph Tracing
This section describes how to trace incoming and outgoing function calls.
para-callgraph.stp
#! /usr/bin/env stap
function trace(entry_p, extra) { %( $# > 1 %? if (tid() in trace) %) printf("%s%s%s %s\n", thread_indent (entry_p), (entry_p>0?"->":"<-"), ppfunc (), extra)}
%( $# > 1 %?global traceprobe $2.call { trace[tid()] = 1}probe $2.return { delete trace[tid()]}%)
probe $1.call { trace(1, $$parms) }probe $1.return { trace(-1, $$return) }
para-callgraph.stp takes two command-line arguments:
• The function/s whose entry/exit call you'd like to trace ($1).
• A second optional trigger function ($2), which enables or disables tracing on a per-thread basis. Tracingin each thread will continue as long as the trigger function has not exited yet.

Chapter 5. Useful SystemTap Scripts
58
para-callgraph.stp uses thread_indent(); as such, its output contains the timestamp, processname, and thread ID of $1 (that is, the probe function you are tracing). For more information aboutthread_indent(), refer to its entry in SystemTap Functions.
The following example contains an excerpt from the output for stap para-callgraph.stp'kernel.function("*@fs/*.c")' 'kernel.function("sys_read")':
Example 5.14. para-callgraph.stp Sample Output
[...] 267 gnome-terminal(2921): <-do_sync_read return=0xfffffffffffffff5 269 gnome-terminal(2921):<-vfs_read return=0xfffffffffffffff5 0 gnome-terminal(2921):->fput file=0xffff880111eebbc0 2 gnome-terminal(2921):<-fput 0 gnome-terminal(2921):->fget_light fd=0x3 fput_needed=0xffff88010544df54 3 gnome-terminal(2921):<-fget_light return=0xffff8801116ce980 0 gnome-terminal(2921):->vfs_read file=0xffff8801116ce980 buf=0xc86504 count=0x1000 pos=0xffff88010544df48 4 gnome-terminal(2921): ->rw_verify_area read_write=0x0 file=0xffff8801116ce980 ppos=0xffff88010544df48 count=0x1000 7 gnome-terminal(2921): <-rw_verify_area return=0x1000 12 gnome-terminal(2921): ->do_sync_read filp=0xffff8801116ce980 buf=0xc86504 len=0x1000 ppos=0xffff88010544df48 15 gnome-terminal(2921): <-do_sync_read return=0xfffffffffffffff5 18 gnome-terminal(2921):<-vfs_read return=0xfffffffffffffff5 0 gnome-terminal(2921):->fput file=0xffff8801116ce980
5.3.3. Determining Time Spent in Kernel and User Space
This section illustrates how to determine the amount of time any given thread is spending in either kernelor user-space.
thread-times.stp
#! /usr/bin/env stap
probe perf.sw.cpu_clock!, timer.profile { // NB: To avoid contention on SMP machines, no global scalars/arrays used, // only contention-free statistics aggregates. tid=tid(); e=execname() if (!user_mode()) kticks[e,tid] <<< 1 else uticks[e,tid] <<< 1 ticks <<< 1 tids[e,tid] <<< 1}
global uticks%, kticks%, ticks
global tids%
probe timer.s(5), end { allticks = @count(ticks) printf ("%16s %5s %7s %7s (of %d ticks)\n",

Monitoring Polling Applications
59
"comm", "tid", "%user", "%kernel", allticks) foreach ([e,tid] in tids- limit 20) { uscaled = @count(uticks[e,tid])*10000/allticks kscaled = @count(kticks[e,tid])*10000/allticks printf ("%16s %5d %3d.%02d%% %3d.%02d%%\n", e, tid, uscaled/100, uscaled%100, kscaled/100, kscaled%100) } printf("\n")
delete uticks delete kticks delete ticks delete tids}
thread-times.stp lists the top 20 processes currently taking up CPU time within a 5-second sample,along with the total number of CPU ticks made during the sample. The output of this script also notes thepercentage of CPU time each process used, as well as whether that time was spent in kernel space oruser space.
Example 5.15, “thread-times.stp Sample Output” contains a 5-second sample of the output for thread-times.stp:
Example 5.15. thread-times.stp Sample Output
tid %user %kernel (of 20002 ticks) 0 0.00% 87.88%32169 5.24% 0.03% 9815 3.33% 0.36% 9859 0.95% 0.00% 3611 0.56% 0.12% 9861 0.62% 0.01%11106 0.37% 0.02%32167 0.08% 0.08% 3897 0.01% 0.08% 3800 0.03% 0.00% 2886 0.02% 0.00% 3243 0.00% 0.01% 3862 0.01% 0.00% 3782 0.00% 0.00%21767 0.00% 0.00% 2522 0.00% 0.00% 3883 0.00% 0.00% 3775 0.00% 0.00% 3943 0.00% 0.00% 3873 0.00% 0.00%
5.3.4. Monitoring Polling Applications
This section describes how to identify and monitor which applications are polling. Doing so allows you totrack unnecessary or excessive polling, which can help you pinpoint areas for improvement in terms ofCPU usage and power savings.

Chapter 5. Useful SystemTap Scripts
60
timeout.stp
#! /usr/bin/env stap# Copyright (C) 2009 Red Hat, Inc.# Written by Ulrich Drepper <[email protected]># Modified by William Cohen <[email protected]>
global process, timeout_count, toglobal poll_timeout, epoll_timeout, select_timeout, itimer_timeoutglobal nanosleep_timeout, futex_timeout, signal_timeout
probe syscall.poll, syscall.epoll_wait { if (timeout) to[pid()]=timeout}
probe syscall.poll.return { if ($return == 0 && to[pid()] > 0 ) { poll_timeout[pid()]++ timeout_count[pid()]++ process[pid()] = execname() delete to[pid()] }}
probe syscall.epoll_wait.return { if ($return == 0 && to[pid()] > 0 ) { epoll_timeout[pid()]++ timeout_count[pid()]++ process[p] = execname() delete to[pid()] }}
probe syscall.select.return { if ($return == 0) { select_timeout[pid()]++ timeout_count[pid()]++ process[pid()] = execname() }}
probe syscall.futex.return { if (errno_str($return) == "ETIMEDOUT") { futex_timeout[pid()]++ timeout_count[pid()]++ process[pid()] = execname() }}
probe syscall.nanosleep.return { if ($return == 0) { nanosleep_timeout[pid()]++ timeout_count[pid()]++ process[pid()] = execname() }}
probe kernel.function("it_real_fn") { itimer_timeout[pid()]++ timeout_count[pid()]++ process[pid()] = execname()}
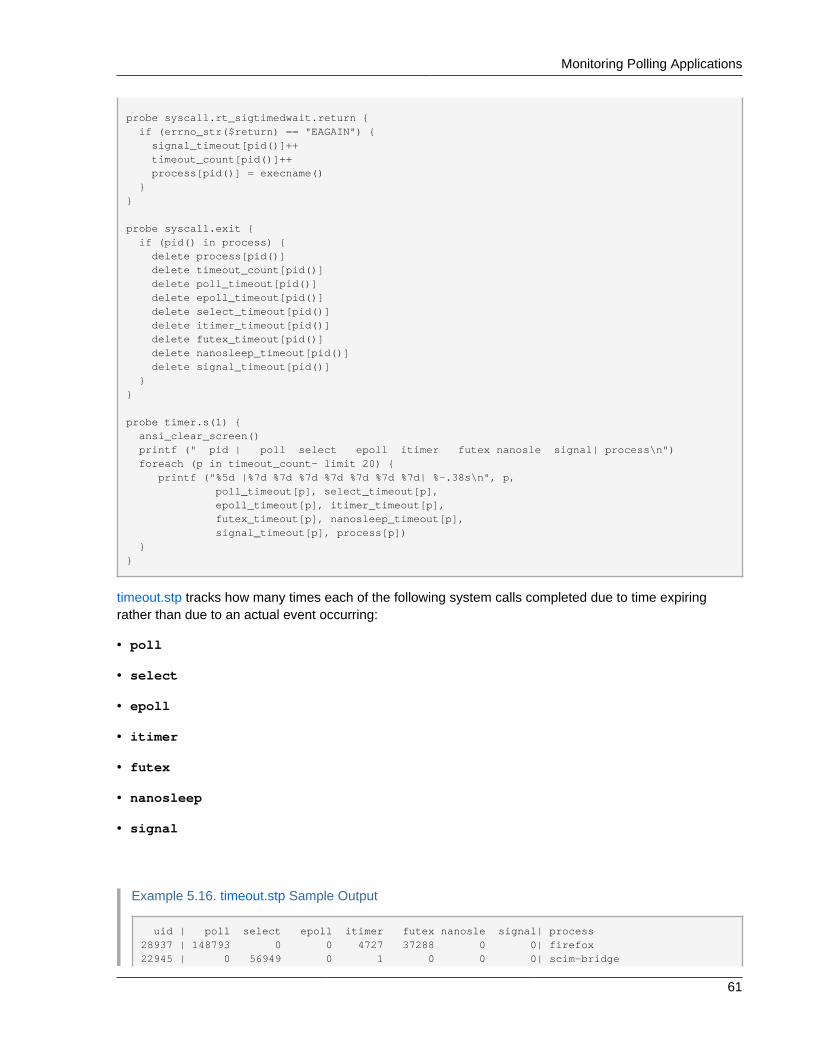
Monitoring Polling Applications
61
probe syscall.rt_sigtimedwait.return { if (errno_str($return) == "EAGAIN") { signal_timeout[pid()]++ timeout_count[pid()]++ process[pid()] = execname() }}
probe syscall.exit { if (pid() in process) { delete process[pid()] delete timeout_count[pid()] delete poll_timeout[pid()] delete epoll_timeout[pid()] delete select_timeout[pid()] delete itimer_timeout[pid()] delete futex_timeout[pid()] delete nanosleep_timeout[pid()] delete signal_timeout[pid()] }}
probe timer.s(1) { ansi_clear_screen() printf (" pid | poll select epoll itimer futex nanosle signal| process\n") foreach (p in timeout_count- limit 20) { printf ("%5d |%7d %7d %7d %7d %7d %7d %7d| %-.38s\n", p, poll_timeout[p], select_timeout[p], epoll_timeout[p], itimer_timeout[p], futex_timeout[p], nanosleep_timeout[p], signal_timeout[p], process[p]) }}
timeout.stp tracks how many times each of the following system calls completed due to time expiringrather than due to an actual event occurring:
• poll
• select
• epoll
• itimer
• futex
• nanosleep
• signal
Example 5.16. timeout.stp Sample Output
uid | poll select epoll itimer futex nanosle signal| process28937 | 148793 0 0 4727 37288 0 0| firefox22945 | 0 56949 0 1 0 0 0| scim-bridge
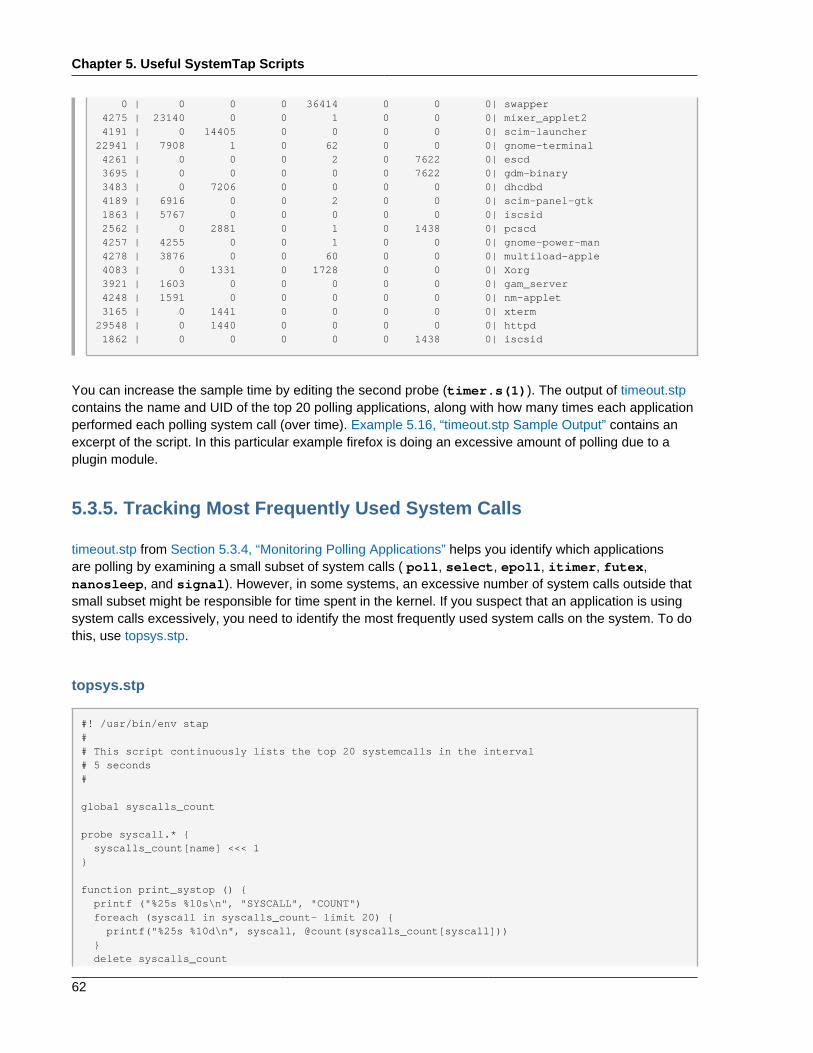
Chapter 5. Useful SystemTap Scripts
62
0 | 0 0 0 36414 0 0 0| swapper 4275 | 23140 0 0 1 0 0 0| mixer_applet2 4191 | 0 14405 0 0 0 0 0| scim-launcher22941 | 7908 1 0 62 0 0 0| gnome-terminal 4261 | 0 0 0 2 0 7622 0| escd 3695 | 0 0 0 0 0 7622 0| gdm-binary 3483 | 0 7206 0 0 0 0 0| dhcdbd 4189 | 6916 0 0 2 0 0 0| scim-panel-gtk 1863 | 5767 0 0 0 0 0 0| iscsid 2562 | 0 2881 0 1 0 1438 0| pcscd 4257 | 4255 0 0 1 0 0 0| gnome-power-man 4278 | 3876 0 0 60 0 0 0| multiload-apple 4083 | 0 1331 0 1728 0 0 0| Xorg 3921 | 1603 0 0 0 0 0 0| gam_server 4248 | 1591 0 0 0 0 0 0| nm-applet 3165 | 0 1441 0 0 0 0 0| xterm29548 | 0 1440 0 0 0 0 0| httpd 1862 | 0 0 0 0 0 1438 0| iscsid
You can increase the sample time by editing the second probe (timer.s(1)). The output of timeout.stpcontains the name and UID of the top 20 polling applications, along with how many times each applicationperformed each polling system call (over time). Example 5.16, “timeout.stp Sample Output” contains anexcerpt of the script. In this particular example firefox is doing an excessive amount of polling due to aplugin module.
5.3.5. Tracking Most Frequently Used System Calls
timeout.stp from Section 5.3.4, “Monitoring Polling Applications” helps you identify which applicationsare polling by examining a small subset of system calls ( poll, select, epoll, itimer, futex,nanosleep, and signal). However, in some systems, an excessive number of system calls outside thatsmall subset might be responsible for time spent in the kernel. If you suspect that an application is usingsystem calls excessively, you need to identify the most frequently used system calls on the system. To dothis, use topsys.stp.
topsys.stp
#! /usr/bin/env stap## This script continuously lists the top 20 systemcalls in the interval # 5 seconds#
global syscalls_count
probe syscall.* { syscalls_count[name] <<< 1}
function print_systop () { printf ("%25s %10s\n", "SYSCALL", "COUNT") foreach (syscall in syscalls_count- limit 20) { printf("%25s %10d\n", syscall, @count(syscalls_count[syscall])) } delete syscalls_count
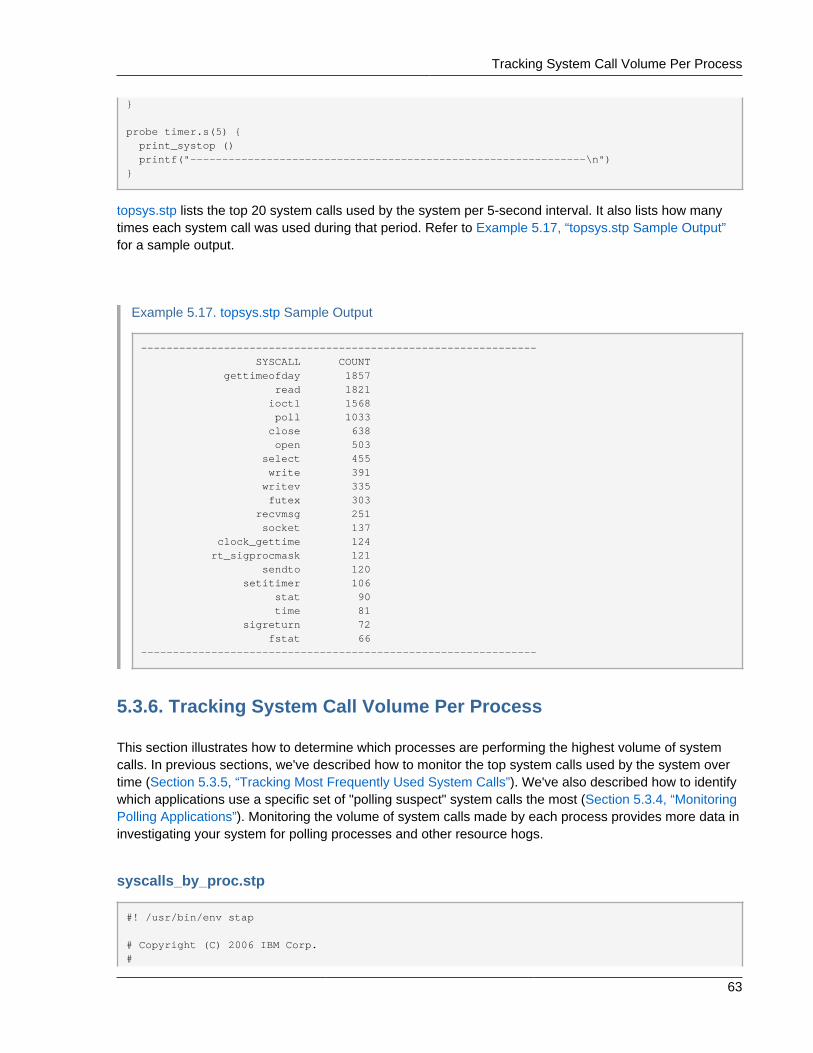
Tracking System Call Volume Per Process
63
}
probe timer.s(5) { print_systop () printf("--------------------------------------------------------------\n")}
topsys.stp lists the top 20 system calls used by the system per 5-second interval. It also lists how manytimes each system call was used during that period. Refer to Example 5.17, “topsys.stp Sample Output”for a sample output.
Example 5.17. topsys.stp Sample Output
-------------------------------------------------------------- SYSCALL COUNT gettimeofday 1857 read 1821 ioctl 1568 poll 1033 close 638 open 503 select 455 write 391 writev 335 futex 303 recvmsg 251 socket 137 clock_gettime 124 rt_sigprocmask 121 sendto 120 setitimer 106 stat 90 time 81 sigreturn 72 fstat 66--------------------------------------------------------------
5.3.6. Tracking System Call Volume Per Process
This section illustrates how to determine which processes are performing the highest volume of systemcalls. In previous sections, we've described how to monitor the top system calls used by the system overtime (Section 5.3.5, “Tracking Most Frequently Used System Calls”). We've also described how to identifywhich applications use a specific set of "polling suspect" system calls the most (Section 5.3.4, “MonitoringPolling Applications”). Monitoring the volume of system calls made by each process provides more data ininvestigating your system for polling processes and other resource hogs.
syscalls_by_proc.stp
#! /usr/bin/env stap
# Copyright (C) 2006 IBM Corp.#

Chapter 5. Useful SystemTap Scripts
64
# This file is part of systemtap, and is free software. You can# redistribute it and/or modify it under the terms of the GNU General# Public License (GPL); either version 2, or (at your option) any# later version.
## Print the system call count by process name in descending order.#
global syscalls
probe begin { print ("Collecting data... Type Ctrl-C to exit and display results\n")}
probe nd_syscall.* { syscalls[execname()]++}
probe end { printf ("%-10s %-s\n", "#SysCalls", "Process Name") foreach (proc in syscalls-) printf("%-10d %-s\n", syscalls[proc], proc)}
syscalls_by_proc.stp lists the top 20 processes performing the highest number of system calls. It alsolists how many system calls each process performed during the time period. Refer to Example 5.18,“topsys.stp Sample Output” for a sample output.
Example 5.18. topsys.stp Sample Output
Collecting data... Type Ctrl-C to exit and display results#SysCalls Process Name1577 multiload-apple692 synergyc408 pcscd376 mixer_applet2299 gnome-terminal293 Xorg206 scim-panel-gtk95 gnome-power-man90 artsd85 dhcdbd84 scim-bridge78 gnome-screensav66 scim-launcher[...]
To display the process IDs instead of the process names, use the following script instead.
syscalls_by_pid.stp
#! /usr/bin/env stap
# Copyright (C) 2006 IBM Corp.## This file is part of systemtap, and is free software. You can
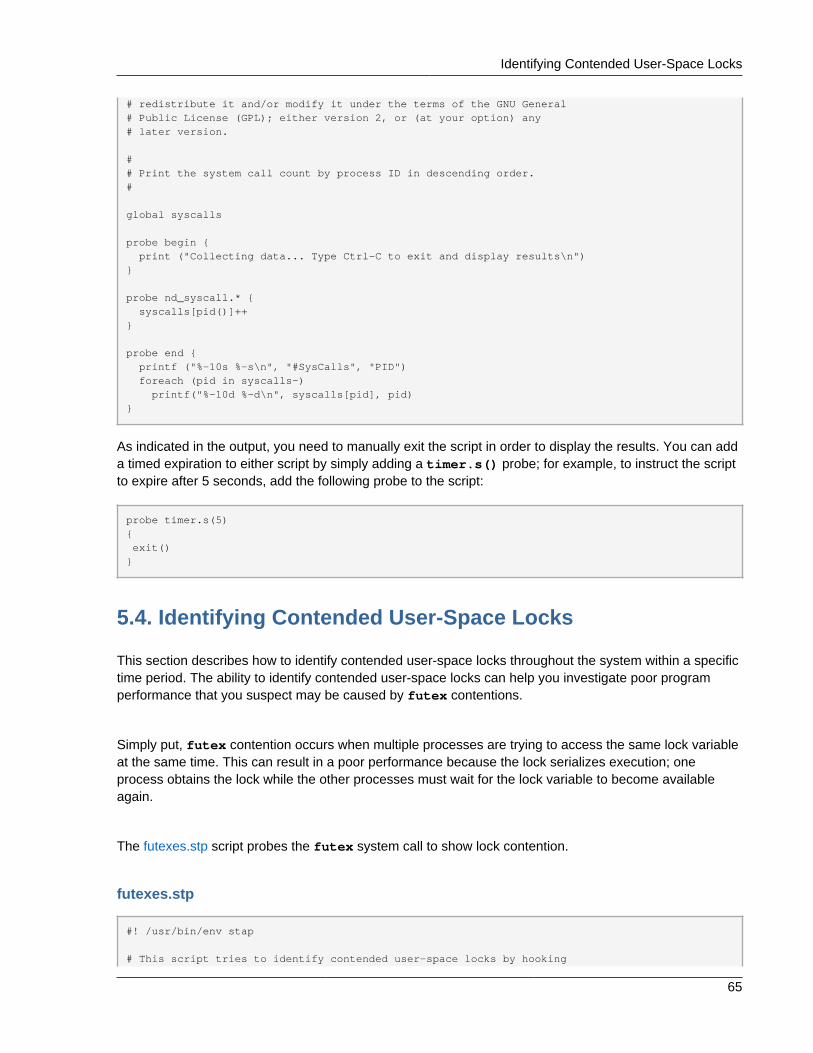
Identifying Contended User-Space Locks
65
# redistribute it and/or modify it under the terms of the GNU General# Public License (GPL); either version 2, or (at your option) any# later version.
## Print the system call count by process ID in descending order.#
global syscalls
probe begin { print ("Collecting data... Type Ctrl-C to exit and display results\n")}
probe nd_syscall.* { syscalls[pid()]++}
probe end { printf ("%-10s %-s\n", "#SysCalls", "PID") foreach (pid in syscalls-) printf("%-10d %-d\n", syscalls[pid], pid)}
As indicated in the output, you need to manually exit the script in order to display the results. You can adda timed expiration to either script by simply adding a timer.s() probe; for example, to instruct the scriptto expire after 5 seconds, add the following probe to the script:
probe timer.s(5){ exit()}
5.4. Identifying Contended User-Space Locks
This section describes how to identify contended user-space locks throughout the system within a specifictime period. The ability to identify contended user-space locks can help you investigate poor programperformance that you suspect may be caused by futex contentions.
Simply put, futex contention occurs when multiple processes are trying to access the same lock variableat the same time. This can result in a poor performance because the lock serializes execution; oneprocess obtains the lock while the other processes must wait for the lock variable to become availableagain.
The futexes.stp script probes the futex system call to show lock contention.
futexes.stp
#! /usr/bin/env stap
# This script tries to identify contended user-space locks by hooking
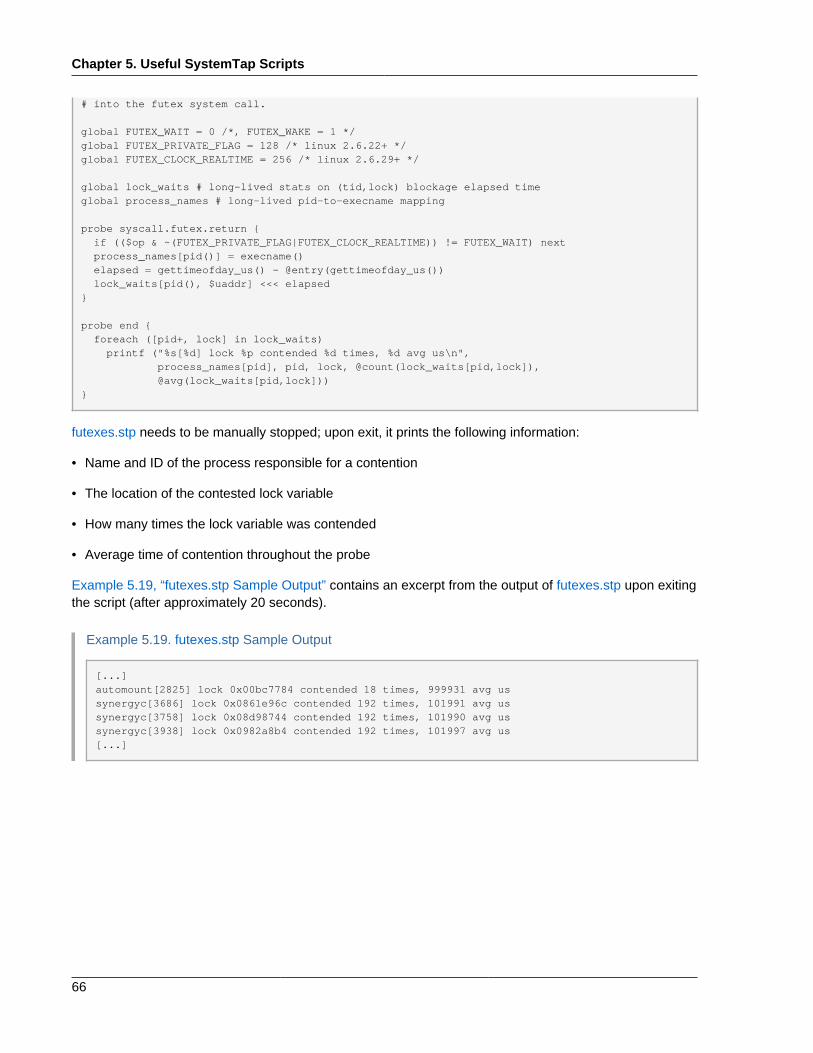
Chapter 5. Useful SystemTap Scripts
66
# into the futex system call.
global FUTEX_WAIT = 0 /*, FUTEX_WAKE = 1 */global FUTEX_PRIVATE_FLAG = 128 /* linux 2.6.22+ */global FUTEX_CLOCK_REALTIME = 256 /* linux 2.6.29+ */
global lock_waits # long-lived stats on (tid,lock) blockage elapsed timeglobal process_names # long-lived pid-to-execname mapping
probe syscall.futex.return { if (($op & ~(FUTEX_PRIVATE_FLAG|FUTEX_CLOCK_REALTIME)) != FUTEX_WAIT) next process_names[pid()] = execname() elapsed = gettimeofday_us() - @entry(gettimeofday_us()) lock_waits[pid(), $uaddr] <<< elapsed}
probe end { foreach ([pid+, lock] in lock_waits) printf ("%s[%d] lock %p contended %d times, %d avg us\n", process_names[pid], pid, lock, @count(lock_waits[pid,lock]), @avg(lock_waits[pid,lock]))}
futexes.stp needs to be manually stopped; upon exit, it prints the following information:
• Name and ID of the process responsible for a contention
• The location of the contested lock variable
• How many times the lock variable was contended
• Average time of contention throughout the probe
Example 5.19, “futexes.stp Sample Output” contains an excerpt from the output of futexes.stp upon exitingthe script (after approximately 20 seconds).
Example 5.19. futexes.stp Sample Output
[...]automount[2825] lock 0x00bc7784 contended 18 times, 999931 avg ussynergyc[3686] lock 0x0861e96c contended 192 times, 101991 avg ussynergyc[3758] lock 0x08d98744 contended 192 times, 101990 avg ussynergyc[3938] lock 0x0982a8b4 contended 192 times, 101997 avg us[...]

Chapter 6.
67
Understanding SystemTap ErrorsThis chapter explains the most common errors you may encounter while using SystemTap.
6.1. Parse and Semantic Errors
Parse and semantic errors occur while SystemTap attempts to parse and translate the script into C, beforeconverting it into a kernel module. For example, type errors result from operations that assign invalidvalues to variables or arrays.
parse error: expected foo, saw bar
The script contains a grammatical or typographical error. SystemTap detected the type of the constructthat is incorrect, given the context of the probe.
For example, the following invalid SystemTap script is missing its probe handlers:
probe vfs.readprobe vfs.write
An attempt to run this SystemTap script fails with the following error message showing that the parserexpects something other than the probe keyword in column 1 of line 2:
parse error: expected one of '. , ( ? ! { = +=' saw: keyword at perror.stp:2:11 parse error(s).
parse error: embedded code in unprivileged script
The script contains unsafe embedded C code, that is, blocks of code surrounded by %{ and %}.SystemTap allows you to embed C code in a script, which is useful if there are no tapsets to suit yourpurposes. However, embedded C constructs are not safe and SystemTap reports this error to warn you ifsuch constructs appear in the script.
If you are sure that any similar constructs in the script are safe and you are a member of the stapdevgroup (or have root privileges), run the script in "guru" mode by using the -g option:
stap -g script
semantic error: type mismatch for identifier 'foo' ... string vs. long
The function foo in the script used the wrong type (such as %s or %d). In the following example, the formatspecifier should be %s and not %d, because the execname() function returns a string:
probe syscall.open
Chapter 6. Understanding SystemTap Errors
68
{ printf ("%d(%d) open\n", execname(), pid())}
semantic error: unresolved type for identifier 'foo'
The identifier (variable) was used, but no type (integer or string) could be determined. This occurs,for instance, if you use a variable in a printf statement while the script never assigns a value to thevariable.
semantic error: Expecting symbol or array index expression
SystemTap could not assign a value to a variable or to a location in an array. The destination for theassignment is not a valid destination. The following example code would generate this error:
probe begin { printf("x") = 1 }
while searching for arity N function, semantic error: unresolvedfunction call
A function call or array index expression in the script used an invalid number of arguments or parameters.In SystemTap, arity can either refer to the number of indices for an array, or the number of parameters toa function.
semantic error: array locals not supported, missing globaldeclaration?
The script used an array operation without declaring the array as a global variable (global variables canbe declared after their use in SystemTap scripts). Similar messages appear if an array is used, but withinconsistent arities.
semantic error: variable 'foo' modified during 'foreach' iteration
The array foo is being modified (being assigned to or deleted from) within an active foreach loop. Thiserror also displays if an operation within the script performs a function call within the foreach loop.
semantic error: probe point mismatch at position N, while resolvingprobe point foo
SystemTap did not understand what the event or SystemTap function foo refers to. This usually meansthat SystemTap could not find a match for foo in the tapset library. N refers to the line and column of theerror.

semantic error: no match for probe point, while resolving probe point foo
69
semantic error: no match for probe point, while resolving probe pointfoo
SystemTap could not resolve the events or handler function foo for a variety of reasons. This error occurswhen the script contains the event kernel.function("something"), and something does not exist.In some cases, the error could also mean the script contains an invalid kernel file name or source linenumber.
semantic error: unresolved target-symbol expression
A handler in the script references a target variable, but the value of the variable could not be resolved.This error could also mean that a handler is referencing a target variable that is not valid in the contextwhen it was referenced. This may be a result of compiler optimization of the generated code.
semantic error: libdwfl failure
There was a problem processing the debugging information. In most cases, this error results from theinstallation of a kernel-debuginfo package whose version does not match the probed kernel exactly. Theinstalled kernel-debuginfo package itself may have some consistency or correctness problems.
semantic error: cannot find foo debuginfoSystemTap could not find a suitable kernel-debuginfo package.
6.2. Runtime Errors and Warnings
Runtime errors and warnings occur when the SystemTap instrumentation has been installed and iscollecting data on the system.
WARNING: Number of errors: N, skipped probes: M
Errors and/or skipped probes occurred during this run. Both N and M are the counts of the numberof probes that were not executed due to conditions such as too much time required to execute eventhandlers over an interval of time.
division by 0
The script code performed an invalid division.
aggregate element not found
A statistics extractor function other than @count was invoked on an aggregate that has not had anyvalues accumulated yet. This is similar to a division by zero.
Chapter 6. Understanding SystemTap Errors
70
aggregation overflow
An array containing aggregate values contains too many distinct key pairs at this time.
MAXNESTING exceeded
Too many levels of function call nesting were attempted. The default nesting of function calls allowed is10.
MAXACTION exceeded
The probe handler attempted to execute too many statements in the probe handler. The default number ofactions allowed in a probe handler is 1000.
kernel/user string copy fault at ADDR
The probe handler attempted to copy a string from kernel or user space at an invalid address (ADDR).
pointer dereference fault
There was a fault encountered during a pointer dereference operation such as a target variableevaluation.

Chapter 7.
71
ReferencesThis chapter enumerates other references for more information about SystemTap. Refer to these sourcesin the course of writing advanced probes and tapsets.
SystemTap WikiThe SystemTap Wiki is a collection of links and articles related to the deployment, usage, anddevelopment of SystemTap. You can find it at http://sourceware.org/systemtap/wiki/HomePage.
SystemTap TutorialMuch of the content in this book comes from the SystemTap Tutorial. The SystemTap Tutorial is amore appropriate reference for users with intermediate to advanced knowledge of C++ and kerneldevelopment, and you can find it at http://sourceware.org/systemtap/tutorial/.
man stapprobesThe stapprobes(3stap) man page enumerates a variety of probe points supported by SystemTap,along with additional aliases defined by the SystemTap tapset library. The bottom part of theman page includes a list of other man pages enumerating similar probe points for specific systemcomponents, such as tapset::scsi, tapset::kprocess, tapset::signal, and so on.
man stapfuncsThe stapfuncs(3stap) man page enumerates numerous functions supported by the SystemTap tapsetlibrary, along with the prescribed syntax for each of them. Note, however, that it does not provide acomplete list of all supported functions; there are more undocumented functions available.
SystemTap Tapset Reference ManualThe SystemTap Tapset Reference Manual describes the individual predefined functions and probepoints of the tapsets in greater detail. You can find it at http://sourceware.org/systemtap/tapsets/.
SystemTap Language ReferenceThe SystemTap Language Reference is a comprehensive reference of SystemTap's languageconstructs and syntax. It is recommended for users with a rudimentary to intermediate knowledge ofC++ and other similar programming languages, and is available to all users at http://sourceware.org/systemtap/langref/.
Tapset Developers GuideOnce you have sufficient proficiency in writing SystemTap scripts, you can try to write your owntapsets. The Tapset Developers Guide describes how to add functions to your tapset library.
Test SuiteThe systemtap-testsuite package allows you to test the entire SystemTap toolchain without havingto build it from source code. In addition, it also contains numerous examples of SystemTap scripts tostudy and test; some of these scripts are also documented in Chapter 5, Useful SystemTap Scripts.
By default, the example scripts included in systemtap-testsuite are located in the /usr/share/systemtap/testsuite/systemtap.examples/ directory.

72
73
Appendix A. Revision HistoryRevision 2.0-1 Mon Jul 20 2009 Don Domingo [email protected]
includes 5.4 minor updates and additional script "dropwatch.stp"
Revision 1.0-1 Wed Jun 17 2009 Don Domingo [email protected]
Building+pushing to RHEL

74

75
Index
Symbols$count
sample usagelocal variables, 49
$returnsample usage
local variables, 47, 51@avg (integer extractor)
computing for statistical aggregatesarray operations, 34
@count (integer extractor)computing for statistical aggregates
array operations, 33@max (integer extractor)
computing for statistical aggregatesarray operations, 33
@min (integer extractor)computing for statistical aggregates
array operations, 33@sum (integer extractor)
computing for statistical aggregatesarray operations, 33
Aadding values to statistical aggregates
computing for statistical aggregatesarray operations, 33
advantages of cross-instrumentation, 6aggregate element not found
runtime errors/warningsunderstainding SystemTap errors, 69
aggregates (statistical)array operations, 32
aggregation overflowruntime errors/warnings
understainding SystemTap errors, 70algebraic formulas using arrays
reading values from arraysarray operations, 27
architecture notation, determining, 7architecture of SystemTap, 11array locals not supported
parse/semantics errorunderstanding SystemTap errors, 68
array operationsassigning associated values, 27
associating timestamps to process names, 27
associative arrays, 26clearing arrays/array elements, 29
delete operator, 29multiple array operations within the sameprobe, 31virtual file system reads (non-cumulative),tallying, 30
computing for statistical aggregates, 32@avg (integer extractor), 34@count (integer extractor), 33@max (integer extractor), 33@min (integer extractor), 33@sum (integer extractor), 33adding values to statistical aggregates, 33count (operator), 33extracting data collected by statisticalaggregates, 33
conditional statements, using arrays in, 31testing for array membership, 32
deleting arrays and array elements, 29incrementing associated values, 28
tallying virtual file system reads (VFS reads),28
multiple elements in an array, 28processing multiple elements in an array, 28
cumulative virtual file system reads, tallying,29foreach, 28iterations, processing elements in an array as,28limiting the output of foreach, 29ordering the output of foreach, 29
reading values from arrays, 27computing for timestamp deltas, 27empty unique keys, 28using arrays in simple computations, 27
arrays, 26(see also associative arrays)
assigning associated valuesarray operations, 27
associating timestamps to process names, 27associating timestamps to process names
array operations, 27associated values
introductionarrays, 26
associating timestamps to process namesassigning associated values
array operations, 27associative arrays
Index
76
introduction, 26associated values, 26example, 26index expression, 26key pairs, 26syntax, 26unique keys, 26
asynchronous eventsEvents, 14
Bbegin
Events, 14building instrumentation modules from SystemTapscripts, 5building kernel modules from SystemTap scripts, 5
Ccall graph tracing
examples of SystemTap scripts, 57capabilities of SystemTap
Introduction, 1changes to file attributes, monitoring
examples of SystemTap scripts, 54clearing arrays/array elements
array operations, 29delete operator, 29multiple array operations within the sameprobe, 31virtual file system reads (non-cumulative),tallying, 30
command-line argumentsSystemTap handler constructs
handlers, 25compiling instrumentation/kernel modules fromSystemTap scripts, 5components
SystemTap scriptsintroduction, 12
computing for statistical aggregatesarray operations, 32
@avg (integer extractor), 34@count (integer extractor), 33@max (integer extractor), 33@min (integer extractor), 33@sum (integer extractor), 33adding values to statistical aggregates, 33count (operator), 33extracting data collected by statisticalaggregates, 33
computing for timestamp deltasreading values from arrays
array operations, 27conditional operators
conditional statementshandlers, 25
conditional statements, using arrays inarray operations, 31
testing for array membership, 32CONFIG_HZ, computing for, 20contended user-space locks (futex contentions),identifying
examples of SystemTap scripts, 65copy fault
runtime errors/warningsunderstainding SystemTap errors, 70
count operatorcomputing for statistical aggregates
array (operator), 33counting function calls
examples of SystemTap scripts, 56CPU ticks
examples of SystemTap scripts, 59cpu()
functions, 17cross-compiling, 5cross-instrumentation
advantages of, 6building kernel modules from SystemTap scripts,5configuration
host system and target system, 6generating instrumentation from SystemTapscripts, 5host system, 6instrumentation module, 6target kernel, 6target system, 6
ctime()functions, 17
ctime(), example of usagescript examples, 47
cumulative I/O, trackingexamples of SystemTap scripts, 50
cumulative virtual file system reads, tallyingprocessing multiple elements in an array
array operations, 29
Ddelete operator
77
clearing arrays/array elementsarray operations, 29
determining architecture notation, 7determining the kernel version, 4determining time spent in kernel and user space
examples of SystemTap scripts, 58device I/O, monitoring
examples of SystemTap scripts, 52device number of a file (integer format)
examples of SystemTap scripts, 53disk I/O traffic, summarizing
script examples, 46division by 0
runtime errors/warningsunderstainding SystemTap errors, 69
documentation goalsIntroduction, 1
Eembedded code in unprivileged script
parse/semantics errorunderstanding SystemTap errors, 67
empty unique keysreading values from arrays
array operations, 28end
Events, 15errors
parse/semantics error, 67embedded code in unprivileged script, 67expected symbol/array index expression, 68grammatical/typographical script error, 67guru mode, 67invalid values to variables/arrays, 67libdwfl failure, 69no match for probe point, 69non-global arrays, 68probe mismatch, 68type mismatch for identifier, 67unresolved function call, 68unresolved target-symbol expression, 69unresolved type for identifier, 68variable modified during 'foreach', 68
runtime errors/warnings, 69aggregate element not found, 69aggregation overflow, 70copy fault, 70division by 0, 69MAXACTION exceeded, 70MAXNESTING exceeded, 70
number of errors: N, skipped probes: M, 69pointer dereference fault, 70
event typesUnderstanding How SystemTap Works, 11
Eventsasynchronous events, 14begin, 14end, 15examples of synchronous and asynchronousevents, 13introduction, 13kernel.function("function"), 13kernel.trace("tracepoint"), 14module("module"), 14synchronous events, 13syscall.system_call, 13timer events, 15user-space, 35vfs.file_operation, 13wildcards, 14
events and handlers, 11events wildcards, 14example
introductionarrays, 26
example of multiple command-line argumentsexamples of SystemTap scripts, 57
examples of synchronous and asynchronousevents
Events, 13examples of SystemTap scripts, 39
call graph tracing, 57CPU ticks, 59ctime(), example of usage, 47determining time spent in kernel and user space,58file device number (integer format), 53futex (lock) contentions, 65futex system call, 65identifying contended user-space locks (futexcontentions), 65if/else conditionals, alternative syntax, 40inode number, 53monitoring changes to file attributes, 54monitoring device I/O, 52monitoring I/O block time, 54monitoring I/O time, 48monitoring incoming TCP connections, 42monitoring polling applications, 59monitoring reads and writes to a file, 53

Index
78
monitoring system calls, 62monitoring system calls (volume per process),63monitoring TCP packets, 43multiple command-line arguments, example of,57net/socket.c, tracing functions from, 41network profiling, 39, 44stat -c, determining file device number (integerformat), 53stat -c, determining whole device number, 52summarizing disk I/O traffic, 46tallying function calls, 56thread_indent(), sample usage, 57timer.ms(), sample usage, 56timer.s(), sample usage, 61, 63tracing functions called in network socket code,41tracking cumulative I/O, 50trigger function, 57usrdev2kerndev(), 52whole device number (usage as a command-lineargument), 52
exceeded MAXACTIONruntime errors/warnings
understainding SystemTap errors, 70exceeded MAXNESTING
runtime errors/warningsunderstainding SystemTap errors, 70
exit()functions, 16
expected symbol/array index expressionparse/semantics error
understanding SystemTap errors, 68extracting data collected by statistical aggregates
computing for statistical aggregatesarray operations, 33
Ffeedback
contact information for this manual, viiifile attributes, monitoring changes to
examples of SystemTap scripts, 54file device number (integer format)
examples of SystemTap scripts, 53file reads/writes, monitoring
examples of SystemTap scripts, 53flight recorder mode, 9
file mode, 10in-memory mode, 9
for loopsconditional statements
handlers, 25foreach
processing multiple elements in an arrayarray operations, 28
formatintroduction
arrays, 26format and syntax
printf(), 16SystemTap handler constructs
handlers, 19SystemTap scripts
introduction, 12format specifiers
printf(), 16format strings
printf(), 16function call (unresolved)
parse/semantics errorunderstanding SystemTap errors, 68
function calls (incoming/outgoing), tracingexamples of SystemTap scripts, 57
function calls, tallyingexamples of SystemTap scripts, 56
functions, 17cpu(), 17ctime(), 17gettimeofday_s(), 17pp(), 17SystemTap scripts
introduction, 12target(), 19thread_indent(), 17tid(), 17, 17uid(), 17
functions (used in handlers)exit(), 16
functions called in network socket code, tracingexamples of SystemTap scripts, 41
futex (lock) contentionsexamples of SystemTap scripts, 65
futex contention, definitionexamples of SystemTap scripts, 65
futex contentions, identifyingexamples of SystemTap scripts, 65
futex system callexamples of SystemTap scripts, 65
79
Ggettimeofday_s()
functions, 17global
SystemTap handler constructshandlers, 20
goals, documentationIntroduction, 1
grammatical/typographical script errorparse/semantics error
understanding SystemTap errors, 67guru mode
parse/semantics errorunderstanding SystemTap errors, 67
Hhandler functions, 17handlers
conditional statements, 24conditional operators, 25for loops, 25if/else, 24while loops, 24
introduction, 15SystemTap handler constructs, 19
command-line arguments, 25global, 20syntax and format, 19variable notations, 25variables, 19
target variables, 20handlers and events, 11
SystemTap scriptsintroduction, 12
heaviest disk reads/writes, identifyingscript examples, 46
host systemcross-instrumentation, 6
host system and target systemcross-instrumentation
configuration, 6
II/O block time, monitoring
examples of SystemTap scripts, 54I/O monitoring (by device)
examples of SystemTap scripts, 52I/O time, monitoring
examples of SystemTap scripts, 48
I/O traffic, summarizingscript examples, 46
identifier type mismatchparse/semantics error
understanding SystemTap errors, 67identifying contended user-space locks (futexcontentions)
examples of SystemTap scripts, 65identifying heaviest disk reads/writes
script examples, 46if/else
conditional statementshandlers, 24
if/else conditionals, alternative syntaxexamples of SystemTap scripts, 40
if/else statements, using arrays inarray operations, 31
incoming TCP connections, monitoringexamples of SystemTap scripts, 42
incoming/outgoing function calls, tracingexamples of SystemTap scripts, 57
incrementing associated valuesarray operations, 28
tallying virtual file system reads (VFS reads),28
index expressionintroduction
arrays, 26initial testing, 5inode number
examples of SystemTap scripts, 53Installation
initial testing, 5kernel information packages, 3kernel version, determining the, 4required packages, 3Setup and Installation, 3systemtap package, 3systemtap-runtime package, 3
instrumentation modulecross-instrumentation, 6
instrumentation modules from SystemTap scripts,building, 5integer extractors
computing for statistical aggregatesarray operations, 33
Introductioncapabilities of SystemTap, 1documentation goals, 1goals, documentation, 1

Index
80
limitations of SystemTap, 1performance monitoring, 1
invalid divisionruntime errors/warnings
understainding SystemTap errors, 69invalid values to variables/arrays
parse/semantics errorunderstanding SystemTap errors, 67
iterations, processing elements in an array asprocessing multiple elements in an array
array operations, 28
Kkernel and user space, determining time spent in
examples of SystemTap scripts, 58kernel information packages, 3kernel modules from SystemTap scripts, building, 5kernel version, determining the, 4kernel.function("function")
Events, 13kernel.trace("tracepoint")
Events, 14key pairs
introductionarrays, 26
Llibdwfl failure
parse/semantics errorunderstanding SystemTap errors, 69
limitations of SystemTapIntroduction, 1
limiting the output of foreachprocessing multiple elements in an array
array operations, 29local variables
name, 19sample usage
$count, 49$return, 47, 51
MMAXACTION exceeded
runtime errors/warningsunderstainding SystemTap errors, 70
MAXNESTING exceededruntime errors/warnings
understainding SystemTap errors, 70membership (in array), testing for
conditional statements, using arrays in
array operations, 32module("module")
Events, 14monitoring changes to file attributes
examples of SystemTap scripts, 54monitoring cumulative I/O
examples of SystemTap scripts, 50monitoring device I/O
examples of SystemTap scripts, 52monitoring I/O block time
examples of SystemTap scripts, 54monitoring I/O time
examples of SystemTap scripts, 48monitoring incoming TCP connections
examples of SystemTap scripts, 42monitoring polling applications
examples of SystemTap scripts, 59monitoring reads and writes to a file
examples of SystemTap scripts, 53monitoring system calls
examples of SystemTap scripts, 62monitoring system calls (volume per process)
examples of SystemTap scripts, 63monitoring TCP packets
examples of SystemTap scripts, 43multiple array operations within the same probe
clearing arrays/array elementsarray operations, 31
multiple command-line arguments, example ofexamples of SystemTap scripts, 57
multiple elements in an arrayarray operations, 28
Nname
local variables, 19net/socket.c, tracing functions from
examples of SystemTap scripts, 41network profiling
examples of SystemTap scripts, 39, 44network socket code, tracing functions called in
examples of SystemTap scripts, 41network traffic, monitoring
examples of SystemTap scripts, 39, 44no match for probe point
parse/semantics errorunderstanding SystemTap errors, 69
non-global arraysparse/semantics error
understanding SystemTap errors, 68

81
number of errors: N, skipped probes: Mruntime errors/warnings
understainding SystemTap errors, 69
Ooperations
assigning associated valuesassociating timestamps to process names, 27
associative arrays, 26clearing arrays/array elements, 29
delete operator, 29multiple array operations within the sameprobe, 31virtual file system reads (non-cumulative),tallying, 30
computing for statistical aggregates, 32@avg (integer extractor), 34@count (integer extractor), 33@max (integer extractor), 33@min (integer extractor), 33@sum (integer extractor), 33adding values to statistical aggregates, 33count (operator), 33extracting data collected by statisticalaggregates, 33
conditional statements, using arrays in, 31testing for array membership, 32
deleting arrays and array elements, 29incrementing associated values, 28
tallying virtual file system reads (VFS reads),28
multiple elements in an array, 28processing multiple elements in an array, 28
cumulative virtual file system reads, tallying,29foreach, 28iterations, processing elements in an array as,28limiting the output of foreach, 29ordering the output of foreach, 29
reading values from arrays, 27computing for timestamp deltas, 27empty unique keys, 28using arrays in simple computations, 27
options, stapUsage, 8
ordering the output of foreachprocessing multiple elements in an array
array operations, 29overflow of aggregation
runtime errors/warningsunderstainding SystemTap errors, 70
Ppackages required to run SystemTap, 3parse/semantics error
understanding SystemTap errors, 67embedded code in unprivileged script, 67expected symbol/array index expression, 68grammatical/typographical script error, 67guru mode, 67invalid values to variables/arrays, 67libdwfl failure, 69no match for probe point, 69non-global arrays, 68probe mismatch, 68type mismatch for identifier, 67unresolved function call, 68unresolved target-symbol expression, 69unresolved type for identifier, 68variable modified during 'foreach', 68
performance monitoringIntroduction, 1
pointer dereference faultruntime errors/warnings
understainding SystemTap errors, 70polling applications, monitoring
examples of SystemTap scripts, 59pp()
functions, 17printf()
format specifiers, 16format strings, 16, 16syntax and format, 16
printing I/O activity (cumulative)examples of SystemTap scripts, 50
printing I/O block time (periodically)examples of SystemTap scripts, 54
probe mismatchparse/semantics error
understanding SystemTap errors, 68probe point (no match for)
parse/semantics errorunderstanding SystemTap errors, 69
probesSystemTap scripts
introduction, 12processing multiple elements in an array
array operations, 28cumulative virtual file system reads, tallying

Index
82
array operations, 29foreach
array operations, 28limiting the output of foreach
array operations, 29ordering the output of foreach
array operations, 29profiling the network
examples of SystemTap scripts, 39, 44
Rreading values from arrays
array operations, 27empty unique keys, 28using arrays in simple computations, 27
computing for timestamp deltasarray operations, 27
reads/writes to a file, monitoringexamples of SystemTap scripts, 53
required packages, 3RPMs required to run SystemTap, 3running scripts from standard input, 8running SystemTap scripts
Usage, 7runtime errors/warnings
understainding SystemTap errors, 69aggregate element not found, 69aggregation overflow, 70copy fault, 70division by 0, 69MAXACTION exceeded, 70MAXNESTING exceeded, 70number of errors: N, skipped probes: M, 69pointer dereference fault, 70
Sscript examples
call graph tracing, 57CPU ticks, 59ctime(), example of usage, 47determining time spent in kernel and user space,58file device number (integer format), 53futex (lock) contentions, 65futex system call, 65identifying contended user-space locks (futexcontentions), 65if/else conditionals, alternative syntax, 40inode number, 53monitoring changes to file attributes, 54
monitoring device I/O, 52monitoring I/O block time, 54monitoring I/O time, 48monitoring incoming TCP connections, 42monitoring polling applications, 59monitoring reads and writes to a file, 53monitoring system calls, 62monitoring system calls (volume per process),63monitoring TCP packets, 43multiple command-line arguments, example of,57net/socket.c, tracing functions from, 41network profiling, 39, 44stat -c, determining file device number (integerformat), 53stat -c, determining whole device number, 52summarizing disk I/O traffic, 46tallying function calls, 56thread_indent(), sample usage, 57timer.ms(), sample usage, 56timer.s(), sample usage, 61, 63tracing functions called in network socket code,41tracking cumulative I/O, 50trigger function, 57usrdev2kerndev(), 52whole device number (usage as a command-lineargument), 52
scriptsintroduction, 11
components, 12events and handlers, 12format and syntax, 12functions, 12probes, 12statement blocks, 12
sessions, SystemTap, 11Setup and Installation, 3Stack backtrace
user-space, 37standard input, running scripts from
Usage, 8stap
Usage, 7stap options, 8stapdev
Usage, 7staprun
Usage, 7
83
stapusrUsage, 8
stat -c, determining file device number (integerformat)
examples of SystemTap scripts, 53stat -c, determining whole device number
examples of SystemTap scripts, 52statement blocks
SystemTap scriptsintroduction, 12
statistical aggregatesarray operations, 32
summarizing disk I/O trafficscript examples, 46, 46
synchronous eventsEvents, 13
syntaxintroduction
arrays, 26syntax and format
printf(), 16SystemTap handler constructs
handlers, 19SystemTap scripts
introduction, 12syscall.system_call
Events, 13system calls volume (per process), monitoring
examples of SystemTap scripts, 63system calls, monitoring
examples of SystemTap scripts, 62SystemTap architecture, 11SystemTap handlers
SystemTap handler constructs, 19syntax and format, 19
systemtap package, 3SystemTap script functions, 17SystemTap scripts
introduction, 11components, 12events and handlers, 12format and syntax, 12functions, 12probes, 12statement blocks, 12
useful examples, 39SystemTap scripts, how to run, 7SystemTap sessions, 11SystemTap statements
conditional statements, 24
conditional operators, 25for loops, 25if/else, 24while loops, 24
SystemTap handler constructscommand-line arguments, 25global, 20variable notations, 25variables, 19
systemtap-runtime package, 3systemtap-testsuite package
sample scripts, 39
Ttallying function calls
examples of SystemTap scripts, 56tallying virtual file system reads (VFS reads)
incrementing associated valuesarray operations, 28
Tapsetsdefinition of, 34
target kernelcross-instrumentation, 6
target systemcross-instrumentation, 6
target system and host systemconfiguration, 6
target variables, 20pretty printing, 22typecasting, 23user-space, 36variable availability, 23
target()functions, 19
target-symbol expression, unresolvedparse/semantics error
understanding SystemTap errors, 69TCP connections (incoming), monitoring
examples of SystemTap scripts, 42TCP packets, monitoring
examples of SystemTap scripts, 43, 43testing for array membership
conditional statements, using arrays inarray operations, 32
testing, initial, 5thread_indent()
functions, 17thread_indent(), sample usage
examples of SystemTap scripts, 57tid()

Index
84
functions, 17time of I/O
examples of SystemTap scripts, 48time spent in kernel/user space, determining
examples of SystemTap scripts, 58timer events
Events, 15timer.ms(), sample usage
examples of SystemTap scripts, 56timer.s(), sample usage
examples of SystemTap scripts, 61, 63timestamp deltas, computing for
reading values from arraysarray operations, 27
timestamps, association thereof to process namesassigning associated values
array operations, 27tracepoint, 14, 44tracing call graph
examples of SystemTap scripts, 57tracing functions called in network socket code
examples of SystemTap scripts, 41tracing incoming/outgoing function calls
examples of SystemTap scripts, 57tracking cumulative I/O
examples of SystemTap scripts, 50trigger function
examples of SystemTap scripts, 57type mismatch for identifier
parse/semantics errorunderstanding SystemTap errors, 67
typographical script errorparse/semantics error
understanding SystemTap errors, 67
Uuid()
functions, 17uname -m, 7uname -r, 4understainding SystemTap errors
runtime errors/warnings, 69aggregate element not found, 69aggregation overflow, 70copy fault, 70division by 0, 69MAXACTION exceeded, 70MAXNESTING exceeded, 70number of errors: N, skipped probes: M, 69pointer dereference fault, 70
Understanding How SystemTap Works, 11architecture, 11event types, 11events and handlers, 11SystemTap sessions, 11
understanding SystemTap errorsparse/semantics error, 67
embedded code in unprivileged script, 67expected symbol/array index expression, 68grammatical/typographical script error, 67guru mode, 67invalid values to variables/arrays, 67libdwfl failure, 69no match for probe point, 69non-global arrays, 68probe mismatch, 68type mismatch for identifier, 67unresolved function call, 68unresolved target-symbol expression, 69unresolved type for identifier, 68variable modified during 'foreach', 68
unique keysintroduction
arrays, 26unprivileged script, embedded code in
parse/semantics errorunderstanding SystemTap errors, 67
unresolved function callparse/semantics error
understanding SystemTap errors, 68unresolved target-symbol expression
parse/semantics errorunderstanding SystemTap errors, 69
unresolved type for identifierparse/semantics error
understanding SystemTap errors, 68unsafe embedded code in unprivileged script
parse/semantics errorunderstanding SystemTap errors, 67
Usageoptions, stap, 8running SystemTap scripts, 7standard input, running scripts from, 8stap, 7stapdev, 7staprun, 7stapusr, 8
useful examples of SystemTap scripts, 39user and kernel space, determining time spent in
examples of SystemTap scripts, 58
85
using arrays in simple computationsreading values from arrays
array operations, 27Using SystemTap, 3usrdev2kerndev()
examples of SystemTap scripts, 52
Vvalues, assignment of
array operations, 27variable modified during 'foreach'
parse/semantics errorunderstanding SystemTap errors, 68
variable notationsSystemTap handler constructs
handlers, 25variables
SystemTap handler constructshandlers, 19
variables (local)name, 19sample usage
$count, 49$return, 47, 51
VFS reads, tallying ofincrementing associated values
array operations, 28vfs.file_operation
Events, 13virtual file system reads (cumulative), tallying
processing multiple elements in an arrayarray operations, 29
virtual file system reads (non-cumulative), tallyingclearing arrays/array elements
array operations, 30
Wwhile loops
conditional statementshandlers, 24
whole device number (usage as a command-lineargument)
examples of SystemTap scripts, 52wildcards in events, 14writes/reads to a file, monitoring
examples of SystemTap scripts, 53

86