Systems Fe-O and Cu-O: Thermodynamic data for the ... · O'NEILL: THERMODYNAMIC ... The system Fe-O...
17
American Mineralogist, Volume 73, pages 470486, 1988 Systems Fe-O and Cu-O: Thermodynamicdata for the equilibria Fe-"FeO," Fe-FerOo, "FeO"-FerOo, FerOo-FerOr, Cu-CurO, and CurO-CuO from emf measurements Hucn Sr. C. O'Nnrr-r.r Research School of Earth Sciences, Australian National University, Canberra,A.C.T. 2601, Australia AssrRAcr The chemical potential of oxygen (ro,) defined by the reactions l.5Fe+Oz+0.5Fe:Oo, 2Fe*Or+2"FeO," 6"FeO"*Or=2FerOo, 4Fe,Oo*Or+6FerOr, 4Cu+Oz+2CuzO, and 2CuzO*Or+{QuQ hasbeen determined using an electrochemical method with calcia-stabilized zirconia solid electrolytes.The Fe + FerOo,Fe * "FeO," and Cu + CurO equilibria were measured using air as the reference, and theseresults are thus absolutedeterminations of por. Cu * CurO and Fe + "FeO" were then used as referenceelectrodesfor other measurements reported both here and elsewhere. The results for the po, values are [in J'mol-l, ?"in kelvins, with a reference pressure for O, of 1 bar (105 Pa)l for Cu * CurO (+62), -347705 +246.096i"- l2.9053TlnT (750 < r< 1330), for Fe * "FeO" (+ 100), -605812 + 1366.7187" - 182.7955T ln 7+ 0.103592'? (833 < T < 1042), -519357 + 59.4277+8.9276T\nT (1042< Z< ll84), -551159 +269.4047- l6.9484TlnT (1184 < ?< 1450). for "FeO" * FerOo (+306), -58r927 - 65.618r+38.74l0TlnT (833< T<12701. for Fe * FerOo (+ 197;, -607673 + 1060.9947- 1323909Tln ?"+ 0.066577] (750 < 7"< 833), and for CurO + CuO (+ 117;, -292245 + 377.0127 - 23.1976T1n T (800 < r < 1300). The standard enthalpyof formation of FerO. is -lll5.4 + 0.2 kJ.mol-', in excellent agreement with that deduced from the quartz-fayalite-iron and quartz-fayalite-magnetite equilibria at higher temperatures. The results for the FerOo + FerO, equilibrium are less certain and have therefore not been presentedin the form of a simple equation. For the other equilibria, the results represent a significant improvement in accuracyover existing measurements. ' Present address: Bayerisches Geoinstitut, Universitdt Bayreuth, Postfach 101251, 8580 Bayreuth, West Germany. 0003-o04x/88/05064470$02.00 470
Transcript of Systems Fe-O and Cu-O: Thermodynamic data for the ... · O'NEILL: THERMODYNAMIC ... The system Fe-O...

American Mineralogist, Volume 73, pages 470486, 1988
Systems Fe-O and Cu-O: Thermodynamic data for the equilibria Fe-"FeO," Fe-FerOo,"FeO"-FerOo, FerOo-FerOr, Cu-CurO, and CurO-CuO from emf measurements
Hucn Sr. C. O'Nnrr-r.rResearch School of Earth Sciences, Australian National University, Canberra, A.C.T. 2601, Australia
AssrRAcr
The chemical potential of oxygen (ro,) defined by the reactions
l . 5 F e + O z + 0 . 5 F e : O o ,
2 F e * O r + 2 " F e O , "
6 " F e O " * O r = 2 F e r O o ,
4 F e , O o * O r + 6 F e r O r ,
4 C u + O z + 2 C u z O ,and
2 C u z O * O r + { Q u Q
has been determined using an electrochemical method with calcia-stabilized zirconia solidelectrolytes. The Fe + FerOo, Fe * "FeO," and Cu + CurO equilibria were measuredusing air as the reference, and these results are thus absolute determinations of por. Cu *CurO and Fe + "FeO" were then used as reference electrodes for other measurementsreported both here and elsewhere.
The results for the po, values are [in J'mol-l, ?" in kelvins, with a reference pressure forO, of 1 bar (105 Pa)l
for Cu * CurO (+62),
-347705 +246.096i" - l2 .9053TlnT (750 < r< 1330),
for Fe * "FeO" (+ 100),
-605812 + 1366.7187" - 182.7955T ln 7+ 0.103592'? (833 < T < 1042),-519357 + 59 .4277+8 .9276T \nT (1042< Z< l l 84 ) ,-551159 +269 .4047 - l 6 .9484T lnT (1184 < ?< 1450 ) .
for "FeO" * FerOo (+306),
-58 r927 - 65 .618 r+38 .74 l0T lnT (833 < T<12701 .
for Fe * FerOo (+ 197;,
-607673 + 1060.9947- 1323909T ln ?"+ 0.066577] (750 < 7"< 833),
and for CurO + CuO (+ 117;,
-292245 + 377.0127 - 23.1976T1n T (800 < r < 1300).
The standard enthalpy of formation of FerO. is -lll5.4 + 0.2 kJ.mol-', in excellentagreement with that deduced from the quartz-fayalite-iron and quartz-fayalite-magnetiteequilibria at higher temperatures.
The results for the FerOo + FerO, equilibrium are less certain and have therefore notbeen presented in the form of a simple equation. For the other equilibria, the resultsrepresent a significant improvement in accuracy over existing measurements.
' Present address: Bayerisches Geoinstitut, Universitdt Bayreuth, Postfach 101251, 8580 Bayreuth, West Germany.
0003-o04x/88/05064470$02.00 470
O'NEILL: THERMODYNAMIC DATA FOR Fe-O AND Cu-O SYSTEMS 471
INrnorucrrox
The system Fe-O has been of interest for at least thepast three millennia, although it is only in the past onehundred years or so that a thermochemical descriptionhas become available. Both the accuracy and internalconsistency of the published thermodynamic data haveincreased over the years, so that there is now a firm con-sensus on most of the preferred values. Spencer andKubaschewski (1978) provided a thorough and criticalreview ofthe published work, covering both phase-equi-librium studies and calorimetric data up to and including1975. They gave selected values for most of the ther-modynamic quantities and presented a phase diagram. Toillustrate the amount of work that has gone into this sys-tem, it may be noted that Spencer and Kubaschewski(1978) listed no less than 35 experimental determinationsof the oxygen fugacity defined by the Fe-"FeO" (iron-wiistite) equilibrium, covering the years 1927 to 1975,and employing a number of diferent experimental tech-nlques.
There would therefore seem to be little point in furtherinvestigation of this system, unless a significant improve-ment in accuracy could be achieved. The present studywas motivated in the belief that this might well be pos-sible for the univariant equilibria in the system, by usingan electrochemical method with oxygen-specific calcia-stabilized zirconia (CSZ) solid electrolytes.
The four isobarically univariant equilibria in the Fe-Osystem at I atm and subsolidus temperatures are
iron-magnetite,
iron-wiistite,
l.5Fe + O, + 0.5FerOo, (1)
2Fe + O, + 2"FeO," (2)
wiistite-magnetite,
6"FeO" * O, = 2FerOo, (3)
and magnetite-hematite,
4FerOo * O, + 6FerOr. (4)
The f,rst three intersect aI an isobaric invariant pointat I atm near 833 K (Spencer and Kubaschewski, 1978),and "FeO" is only stable above this temperature. "FeO,"wtistite, is written in quotation marks, because it alwaysshows large deviations from the ideal FeO stoichiometryat atmospheric pressure. Considerable nonstoichiometryis also shown by FerOo in equilibrium with FerO. at hightemperatures.
Previous thermodynamic studies from this laboratory(e.g., Holmes ar al., 1986; O'Neill, 1987a, 1987b) haveshown that it is generally possible to achieve a precisionof the order of + 100 J.mol ' in the determination of thechemical potential ofoxygen (ror) defined by univariantequilibria, by using an electrochemical method with sim-ple metal * metal oxide mixtures as the reference elec-
trode. This level of precision means that the uncertainty
in the current values for the to, of the metal plus metal
oxide reference would provide overwhelmingly the larg-
est contribution to the total absolute accuracy of such
experiments. Therefore, in order to get the most out of
the method, it is necessary to calibrate at least one met-
al + metal oxide equilibrium against air, the absolute po,
of which is, of course, known almost exactly' In fact, two
such equilibria, Fe + "FeO" and also Cu + CurO (cop-
per-cuprite), were chosen for this primary calibrationpurpose, so that the results might be checked by measur-
ing one against the other. The other equilibria in the Fe-O
system were then measured using the above equilibria
and also Ni + NiO (previously measured against both
Fe * "FeO" and Cu + CurO) as the reference oxygen
buffers. For the sake of completeness, the CurO + CuO
(cuprite-tenorite) equilibrium was also determined.
The experimental method with the solid metal plus
metal oxide buffers as reference electrodes has been fully
described elsewhere (O'Neil l , 1987a). However, the
method using air as the reference is somewhat different;
this method presents a number of additional experimen-
tal problems and will therefore be described belo;r. Al-
though the precision of the measurements reported in thispaper can speak for themselves, that their accuracy is asgood as is claimed can only be judged if a thorough ap-praisal of a number of experimental points is presented
in some detail.
Expnnrn'mNTAL DETATLS
Design of electrochemical cells with air referenceelectrodes
High-temperature electrochemical cells using calcia-stabilizedzirconia (CSZ) as an oxygen-specific electrolyte, and with air, oranother gas, as the reference electrode, have often been used forthermodynamic measurements, e.g., Charette and Flengas (1968).
Some more recent studies that give details of experimental de-signs, which may be compared to the design used in the presentwork, include Berglund (1 976), Kemori et al. (1979), Jacobssonand Ros6n (1981), Schwab and Kiistner (1981), Comert and Pratt(1982), and Bannister (1984). Previous measurements from thislaboratory on a number of metal + metal oxide oxygen bufersusing air as the reference electrode have been reported by Holmeset al. (1986). The experimental design adopted in this studyevolved out ofthe latter work, but it also incorporates a numberof improvements aimed at increasing the already impressive ac-curacy achieved by Holmes et al. (1986). Therefore, in the de-scription that follows, particular attention will be paid to theseinnovations; for a more complete description of some details,the reader is referred to Holmes et al. (1986) and O'Neill (1987a).
The experimental design is shown schematically in Figure 1.It consists essentially of two identical CSZ tubes of dimensions8-mm outside diameter x 5-mm inside diameter x 300:mmlength, l1 molo/o CaO, which were supplied by the NipponChemical Ceramic Co. The upper CSZ tube contains the sample,and the arrangement of this half of the cell is exactly as previ-
ously described in O'Neill (1987a) for the analogous half of thecells \Mith M + MO reference electrodes. The top of this CSZtube is sealed with epoxy into a brass head attached to a shut-ofvalve followed by a three-way valve, which allows for thorough

472
two-way valvelo vacuum or
Pl lead wire
epory
sprlng
brass
retainlr€ Sctsw
alumlnagulde lube
top CSZ tube
sample eleclrode
(alr) eleclrode
botlom CSZ tube
brass
sPrlng
Pt lead wlre
thermocouple
Fig. l. Schematic diagram of the electrochemical cells withair as the reference electrode. The vertical scale is greatly com-pressed relative to the horizontal.
evacuation of the sample tube followed by filling with highlypurified Ar gas. The sample is thus kept under a static atmo-sphere ofAr. The bottom CSZ tube contains the air electrode.The two tubes are inserted into a thick-walled (3-mm) aluminaguide tube, which is carefully positioned along the vertical axisof a tube furnace (Deltech model DT-31-VT), the same one asused by Holmes et al. (1986). The bottom CSZ tube is supportedon a pair oftension springs, which, since the tube is free to slidewithin the alumina guide tube, ensures that it is pressed firmlyagainst the upper CSZ tube. The top tube is itself fixed in posi-tion with a screw. Two thermocouples are used, one sitting di-rectly over the sample electrode, the other directly underneaththe air reference electrode. The use of two thermocouples en-sures that the entire working part ofthe cell is exactly positionedwithin the constant-temperature zone (or "hot spot") ofthe fur-nace. The distance between the two thermocouple beads is 8mm, whereas the width of the constant-temperature zone [mea-sured by Holmes et al. (1986) and taken to be that region ofthefurnace along the vertical axis within 0.5 K of the peak temper-aturel is only about l0 mm long. With the present system, how-ever, the constant-temperature zone may be somewhat longer,since (l) the symmetrical arrangement of the two CSZ tubes
O'NEILL: THERMODYNAMIC DATA FOR Fe-O AND Cu-O SYSTEMS
top thgrmocouple ensures similar conductive heat losses both upward and down-ward and (2) the large thermal mass of the alumina guide tubeshould serve to smooth out the temperature gtadient, as well asdampening any short-term fluctuations in temperature.
Holmes et al. (1986) observed that the position of the zone ofconstant temperature moves upward in the furnace with increas-ing temperature. The present arrangement allows the position ofthe cell to be adjusted during the course of an experiment, simplyby loosening the screw holding the top CSZ tube and sliding bothtubes either upward or downward, as required, within the alu-mina guide tube. Any temperature gradient across the cell wouldproduce a thermoelectric emf, the magnitude of which dependson a number offactors-see Choudhary et al. (1980) for a de-tailed discussion and also an interesting paper by Alcock et al.(1977), who attempted to use this effect as an "entropy meter."From these references, a thermoelectric coefrcient of about 0.5mV'K-t would be expected for the types of cell studied here;therefore, errors that are larger that the internal precision ofthemeasurements would be introduced by a temperature gradientofonly I K across the cell.
In most previous investigations using high-temperature elec-trochemical cells with air (or other gases), the gas electrode hasconsisted of Pt, often applied as a colloidal suspension of "plat-inum black." Ft foil or wire pressed firmly against the electrolytealso works effectively at high temperatures, and other noble met-als or their alloys have sometimes been used. The purpose ofthe Pt, in addition to providing the electrical connection to thecell, is to catalyze the half-cell reaction:
O, (gas) + 4e (electrode) = 2o'z- (electrolyte).
However, below about 900 K, this process becomes increas-ingly inefrcient, particularly if the surface area of the Pt coatinghas been reduced by long sintering at high temperature. Thisresults in high electrode impedance and non-Nernstian behavior(Badwal, 1983) and sluggish response times. During the presentwork, it was indeed found that, with such electrodes at T < 900K, anomalous, unstable, and irreproducible emfs (typically <2mV) appeared in symmetric cells of the type air versus air, theemfs from which should, of course, always be zero in the ab-sence of a temperature gradient across the cell.
Such phenomena have led the Australian CSIRO Division ofMaterials Science to investigate the use of urania-scandia solidsolutions with the fluorite structure as gas electrodes (Badwal,1983, 1984). An electrode ofthis type was successfully used byBannister (1984) in his investigation ofthe Pb-PbO equilibriumagainst air at temperatures as low as 645 K. In the present study,this concept was adopted with the modification that, instead ofa coating ofurania-scandia, pellets ofyttria-doped thoria (YDT)were used. YDT has been extensively employed as an oxygen-specific electrolyte, especially at low oxygen fugacities, as it re-tains virtually 1000/o oxygen ion conductivity to much lower/o,values than the stabilized zirconias [e.g., Choudhary et al. (1980)].However, at higher oxygen fugacities, such as that ofair, YDTbecomes a p-type semiconductor, with electron holes and inter-stitial oxygen ions. A very noticeable property ofYDT is that isappears white after sintering in a reduced atmosphere, but turnsdark brown on heating in air, owing to the absorption of thisexcess oxygen. The change is perfectly reversible and occurs rea-sonably rapidly even at fairly low temperatures (e.g., -750 K).The YDT pellets thus provide a small reseryoir of oxygen in asuitable state at the air electrode. With air electrodes ofthis type,it proved possible to achieve emfs stable to +0.1 mV in the airversus air cells down to 750 K.
The procedure for measuring the emf s of the electrochemicalcells and of the thermocouples are given in O'Neill (1987a). Thethermocouples were of the Pt-PteoRhro type, and all the ther-mocouples used in this part of the study (i.e., with the air elec-trodes) were made from the same two spools of wire suppliedby Johnson Matthey. Al1 were calibrated against the meltingpoint of Au (1337.58 K, IPTS 68), using small sections (-3 mm)of 0.5-mm-diameter Au wire, 99.99+0/o purity, supplied byGoodfellow Metals with an analysis that showed 7 ppm Co, Ippm Ag, and I ppm Cu as the only impurities. The Au wirewas crimped over the thermocouple bead, and the thermocouplewas placed in a dummy cell made by withdrawing the top CSZtube shown in Figure I and replacing it with a CSZ tube plusalumina sheath tube, both with truncated ends. The thermocou-ples are thus calibrated in almost the exact configuration in whichthey are used. The calibrations were carried out by slowly heat-ing the thermocouple through the melting temperature of Auwhile recording its emf on a chart-recorder and observing theplateau in the resulting trace. This plateau is generally sharp to+0.001 mV, provided that the Au wire is fixed directly over thethermocouple bead and that neither the bead nor the wire comeinto contact with any ceramic part of the apparatus. After eachcalibration, the wires were pulled through the thermocouple tub-ing, the old bead plus Au cut off, and a new bead formed. Eigh-teen such calibrations carried out during the course of these ex-periments on eight diferent thermocouples (i.e., made fromdifferent sections of wire) gave a range in emfs at the Au pointfrorn 10.272 to 10.277 mV, with a single outlier at 10.281 mV,and a mean of 10.27 5 + 0.002 mV. Although this value is some-what lower than that used by IPTS 68 as the fixed point (10.3343mV, exactly) it is still well within the recommended range forPt-hnoRh,o thermocouples of I 0. 300 + 0.0 50 mV (Rossini, I 9 70).A fairly large number of similar calibrations on thermocouplesmade from wire from various different spools (all supplied byJohnson Matthey) have yielded results in the range 10.298 to10.336 mV, and therefore it would seem that the low calibrationemfis a characteristic ofthe particular batch ofwire used duringthis study. The constant of proportionality calculated from theratio of the ideal to the measured emf of the thermocouples atthe Au point was then used to correct the thermocouple emfsat all other temperatures. The assumptions inherent in this pro-cedure were checked for two thermocouples by measuring themelting point of NaCl, as described by O'Neill (1987a). Most ofthe experimental data reported in this study were obtained attemperatures lower than the melting point of Au and thus fallbetween this temperature and the ice point (actually the meltingpoint ofice at ambient pressure), which is used as the referencetemperature. This temperature calibration is felt to be accurateto +0.3 K.
The entire experimental arrangement was tested by measuringthe emf produced by the symmetrical cell
ft, YDT (air)ICSZIYDT (air), Pt.
For this cell, the sample pellet in the top CSZ tube (shown inFig. 1) was replaced with a YDT pellet similar to the one in thebottom halfofthe cell and identical in size to the sample pellets.The top CSZ tube, plus alumina sheath and thermocouple tube,was also not sealed in the brass head, but left open to the at-mosphere, so that the top half of the assembly became effectivelyidentical to the bottom half. The symmetrical cell was then heat-ed to a number ofdifferent temperatures in the range anticipatedfor the actual measurements ofthe oxygen buffers, i.e., 750-1400K. It was found that the resistance of the cell becomes large
473
2\ f ttop - bottom thormocouples)(mV xto)
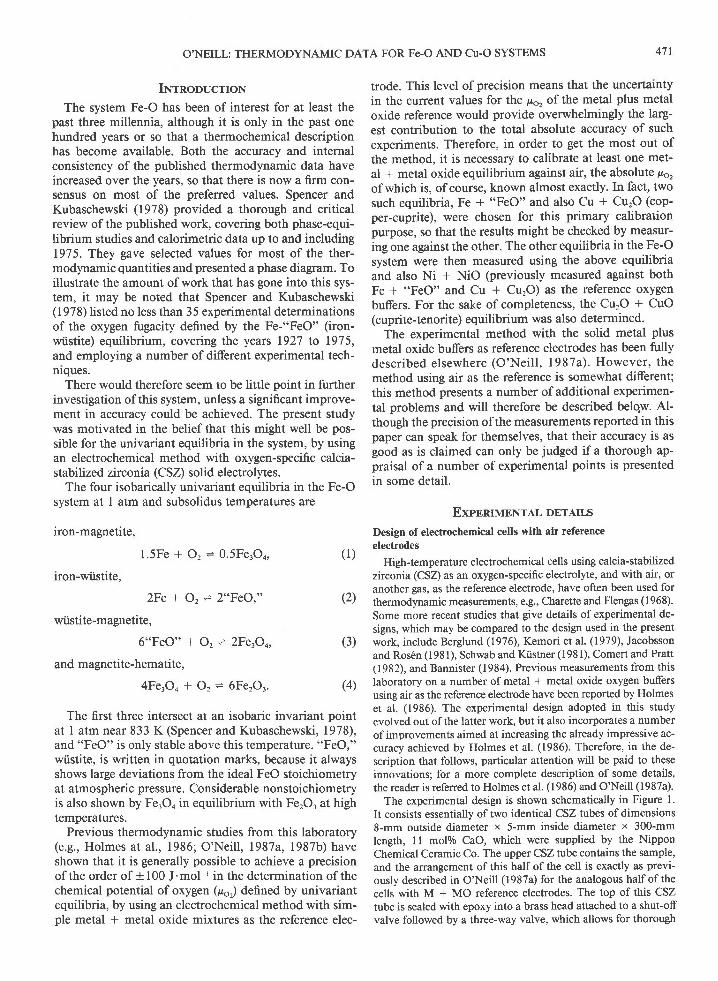
Fig.2. The emf of the symmetrical cell Pt, airlCSZlair,Ptas a function of the difference AZ between the top and bottomthermocouples of the cell (shown in Fig. 1) at the following ap-proximate temperatures: A, 1020 K; O, 1150 K O, 1350 K.
relative to the resistance of the emf-measurilg circuit below about750 K, and therefore measurements were not attempted belowthis temperature.
At each temperature, the cell assembly was moved through anumber ofdifferent positions up and down the region close tothe constant-temperature zone, and the emf of the cell was re-corded at these different positions together with the emf of boththe top and the bottom thermocouples, thus measuring the effectof the temperature gradient across the cell. Representative re-sults are shown in Figure 2, from which it will be seen that whenthe two thermocouples record the same temperature, the emf ofthe cell is, as it should be, efectively zero (+ <0.1 mV). Thisalso implies that any lateral temperature gradients are unimpor-tant. A similar symmetric cell (air vs. air) test was conducted byHolmes et al. (1986). In contrast with the present results, theyfound small (< 1.5 mV) excess emfs across the cell although thecell was thought to be positioned exactly in the constant-tem-perature zone of the furnace. However, the location of the con-stant-temperature zone was not determined in situ; therefore,despite all precautions, the positioning of the cell may not havebeen exactly right. Furthermore, these excess or residual emfschanged with temperature and also showed some scatter at lowertemperatures (< 1300 K), which might possibly reflect a problemwith the efrciency of the Pt coating used for the air electrodes,as discussed above.
For the actual measurements reported in this study, the po-sition ofthe cell was adjusted, ifnecessary, so that the observeddiference between the two thermocouples was less than +0.5 K.A correction to zero temperature gradient was then made froman empirical calibration of relative emf versus temperature gxa-dient, obtained at a couple of ditrerent temperatures during thecourse ofthe experiment. This procedure avoids the tediousnessof precisely adjusting the position of the cell for every measure-ment.
Chemical potential of oxygen in air
The oxygen content of dry air is remarkably constant world-wide at 20.9460/o. The chemical potential of oxygen in air is
O'NEILL: THERMODYNAMIC DATA FOR Fe-O AND Cu-O SYSTEMS
E
E= 0uJ
o
-4 -2 "l
@

4',14
therefore given by
ll8!: R71n[0.20946(P*ot - P",")] (5)
where P,.*r is the atmospheric pressure, and PH2o is the vaporpressure of water in the atmosphere. It is not unusual in mostclimates for P,.or to vary by + 15 mbar ( 1.5 x 10³ Pa), accordingto the local weather conditions. Were this factor to be ignored,it would cause a change in p6; of + 150 J'mol-' at, for example,1200 K. This variation is greater than the potential precision ofthe method. Therefore, for each datum, P,.- was measured witha Hg barometer. The readings were corrected for the absolutevalue of gravity as measured adjacent to the laboratory and arethought to be accurate to +2 mbar. As far as possible, takingdata during rapid changes in atmospheric pressure conditionswas avoided. P"ro was also measured, using a wet-and-dry-bulbpsychrometer kindly loaned by the Canberra Bureau of Mete-orology. Fortunately, Canberra enjoys a dry climate, and sincemost of this work was undertaken during the winter months, theabsolute value of PHro was fairly low. (During the course of theseexperiments it was observed to vary from 5 to 20 mbar, and wastypically about 8 mbar.) Thus, although the accuracy ofthe psy-chrometer is not known, it would seem unlikely that the errorin P"ro is greater than +2 mbar; therefore, the total error inp,gi will be less than +40 J mol-', excluding the contributionfrom any errors in temperature measurement.
Precision, accuracy, and demonstration of equilibrium
In what follows, "precision" is taken to mean the measure ofthe scatter expected in the data, whereas "accuracy" refers to theabsolute deviation of the measurements from the true value.Precision ofcourse contributes to accuracy.
Ternperatures were recorded to +0.1 K. Monitoring of thethermocouple emf over extended periods of time showed thatshort-term fluctuations, caused either by fluctuations in the ac-tual temperature of the furnace (which are nearly completelydamped in the cell by the large thermal mass of the aluminaguide tube; see Fig. l) or by fluctuations in the emf-measuringcircuit, are also about 0.1 K or at about the resolution oftheactual measurements. The temperature dependence of the cellemf and the dependence of the cell emf on thermal gradient areboth approximately 150 J.K-'.661-t, and therefore the preci-sion expected from the combined uncertainties in measuring boththermocouples is about +50 J mol-t. The precision in the mea-surements of the air reference electrode is equal to the accuracyand is about +40 J.mol-'. The emf of the cell was recorded to+0.05 mV and is precise to +0.1 mV, which is equivalent to+40 J'mol-'. Therefore, the total precision of the measurementsis +75 J.mol-', which corresponds to 10.003 log fo,at 1200 K.For an estimate of the total accuracy of the measurements, twoother factors must be taken into consideration. First, there is theaccuracy of the thermocouple calibration at the melting point ofAu, and its extrapolation to other (mainly lower) temperatures.This has been estimated earlier to be +0.3 K, which, for thetemperature dependence of the cell emf values in this study,contributes another +50 J.mol-' to the absolute uncertainty.
The second factor afecting the total accuracy is potentially offar greater magnitude and concerns the attainment of equilibri-um by the oxygen buffer. Particularly important is the possibilitythat oxygen may leak from the atmosphere into the electrode,either because ofthe finite physical permeability ofthe CSZ tubeor because the finite electronic conductivity causes a short circuitfrom the air reference electrode. An oxygen leak will result in adecrease of the emf of the cell, and consequently the po, of the
O'NEILL: THERMODYNAMIC DATA FOR Fe-O AND Cu-O SYSTEMS
bufler will appear erroneously high. At higher temperatures, oxy'gen leaks always occur with the type of CSZ tube used in thisstudy, not only in the experiments with air, but also in thosewith solid metal + metal oxide reference electrodes (see, forexample, O'Neill, 1987a). Since the amount of oxygen in the Argas above the latter is minute, it is probably the nonzero elec-tronic conductivity that is to blame, rather than the physicalpassage ofgas through the tube. Finite electronic conductivity isstill consistent with otherwise ideal behavior ofthe electrolyte,provided that such electronic conductivity remains a very smallfraction ofthe total (ionic + electronic) conductivity-less thanl0lo is usually considered the limit. The temperature above whichthe decrease of the cell emfbecomes evident varies from run tonrn, even with identical cells, but tends to be between 1200 and1350 K. At lower temperatures, at least with simple metal +metal oxide electrodes, the cell emf remains constant to within+0.2 mV over periods of days.
The Cu * CurO and Fe + "FeO" equilibria were in fact spe-cifically chosen for the primary measurements against air, be-cause empirical experience in this laboratory, backed up by thepolarization experiments of Worrell and Iskoe (1973), st'ggeststhat these two mixtures are the most reactive of the commonmetal + metal oxide oxygen bufers and hence will be least sub-ject to polarization. To minimize the problem at higher temper-atures (>1300 K), measurements were obtained as quickly aspossible (i.e., about 30-40 min after changing furnace tempera-ture). If any untoward decrease in cell emf occurred, the tem-perature was either lowered or the run abandoned. The timestypically allowed for equilibration at lower temperatures were,very approximately, 12 h at T < 900 K, 6 h at 900 < Z < 1050K, and 3 h at 1050 < Z < 1300 K. In all cases, the emf wasjudged to be constant (+0.05 mV) before the reading was taken.On increasing temperature, the emf values were usually observedto change to the new value almost instantly (i.e., as fast as thechange in temperature registered by the thermocouples) at 7 >
900 K, but took rather longer at lower temperatures. The timerequired to reach stable emf values on decreasing temperaturewas slightly longer.
Reversibility of the cells, and hence equilibrium, was dem-onstrated by (a) obtaining data after both increasing and decreas-ing temperature, (b) passing a small curent through the cell, or(c) evacuating the electrode compartment and filling it with anoxidizing or reducing gas such as air or Ar-CHo, before refillingwith purified Ar. Options O) and (c) were only used at highertemperatures (>1000 K), and only toward the end ofa run'
Materials
CurO and "FeO" were prepared from Cu and CuO and fromFe and FerOr, respectively, mixed in the appropriate proportions
but with a slight excess of metal and sintered at 1000 oC for -8
h under a flowing stream ofAr, which was purified by passing
successively over activated charcoal, phosphorus pentoxide, andTi chips at 800'C. Fe'O3 was sintered in air at 1000'C for -24
h; this treatment causes a change in color from brick red to deepmaroon, and the xno analysis of the sintered material gave apattern corresponding to well-crystallized a-FerOr. FerOo wasused either as supplied by the manufacturers or after sinteringin a flowing CO-CO, gas mixture corresponding to the quartz-
fayalite-magnetite butrer; no difference was observed in the per-
formance of the cells using either material. CuO, Cu, and Fewere used as supplied, without further treatment. All chemicalswere stated by the manufacturers to be of >99.9olo purity, withthe exception of Fe metal, which was of >99.50/o purity.
O'NEILL: THERMODYNAMIC DATA FOR Fe-O AND Cu-O SYSTEMS
TnaLe 1. Results from the cell Pt, Cu + CurO ICSZ lYDl"k), Pt
Note; The order is that in which the measurements were made. Thereference pressure is 1 bar (105 Pa).
The YDT pellets were made by precipitating solutions of tho-rium nitrate and yttrium nitrate (10 molo/o YrOr) with ammoniasolution. The precipitate was dried in stages to 1000 oC, and thepowder so obtained was pressed into pellets and sintered in airat 1550 qC for 3 d.
Rnsur,rsCu * CurO
The results of the measurements on the cell
Pt, Cu + CurO I CSZ I YDT("i,), Pt (D
are given in Table l. All such data, both here and sub-sequently, have been corrected to a standard referencepressure of I bar (l0s Pa). The range oftemperature cov-ered is from 750 K, the lowest possible with the presentapparatus, to 1330 K, just below the Cu * CurO meltingeutectic.
The available calorimetric data for Cu and CurO areof excellent quality and are also unusually accurate. Acomprehensive assessment is presented in the JANAFtables (Chase et al., 1982), which is largely based on thework of Mah et al. (1967). A thorough discussion of theCu-O system, including the phase diagram, has been giv-en by Santander and Kubaschewski (1975), who showedthat the solubility of oxygen in solid Cu is so small thatit would have a totally negligible effect on the thermo-dynamic properties of Cu. Unfortunately, these authorsreported that no data exist for the stoichiometric rangeof CurO, and therefore it will be assumed that the ther-modynamic data for this substance may be applied with-out correction to CurO in equilibrium with Cu.
475
800 900 1000 1100 1200 1300T (K)
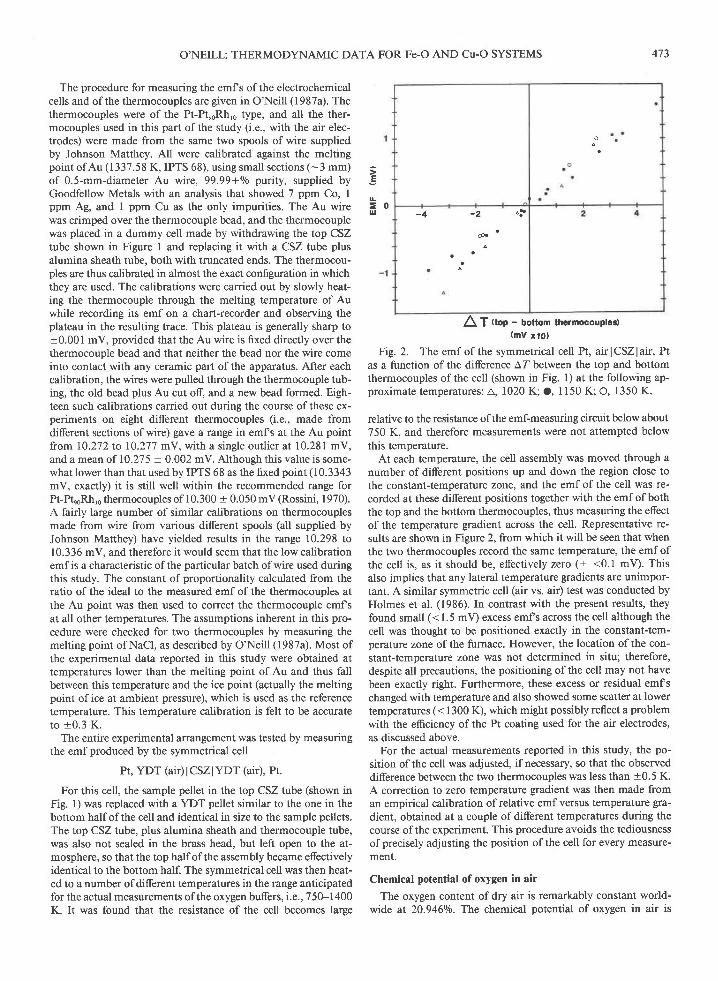
Fig. 3. Comparison of the results for the free energy of thereaction 4Cu * O, : 2CrtzO with those derived from calori-metric data as assessed in the JANAF tables (Chase et al., 1982).Also shown is the curve for the earlier results from this labora-tory by Holmes et al. (1986).
Values for the Gibbs free energy of the reaction
4Cu + O , :2Cu ,O
were taken from the values of A,GS tabulated at 100-Kintervals for CurO in the JANAF tables in the range 700to 1300 K inclusive and, after, correction from the ref-erence pressure of I atm to I bar, were fitted to an expres-s iono f t he fo rm l + BT+ CT InT tog i ve , i nJ 'mo l - ' ,
p6?_,ist?P, : -348 r95 + 246.3017 - l2.9053TlnT.(7)
The standard deviation of this fit is 12 J.mol-'. with amaximum deviation of 16 J'mol-'; therefore, the three-term expression perfectly describes the calorimetricdata in this temperature range. The deviations Apo, :
lro2,ors - lroz,re,Nnp wofe calculated for each datum in Tablel, and the results have been plotted as a function ofdatumtemperature in Figure 3. This procedure is equivalent toa third-law analysis of the experimental data.
The agreement between the present results and the ca-lorimetric data is exceptionally good. Regression of Apo,vs. ?"gives (in J.mol-')
Apo, (+38) : (490 + 26) - (0.205 + 0.025)7. (8)
Thus both the position and slope of the emf measure-ments are well within the very tight constraints imposedby the calorimetric data. The standard deviation of themeasurements is only +38 J'mol-' (<0.002 log fo, at1200 K). The absolute precision of the experimentalmethod has been estimated previously to be +75
J.mol-': therefore, if twice the standard deviation of themeasurements is taken to be the observed precision, theagreement between the observed and theoretical preci-sions is exact. This implies that there is no error due tolack of equilibration of the Cu * Cu'O assemblage.
There are a number of reasons why the results on Cu +CurO might be especially good. First, the polarization
- lro,
r (kJ.(K) mol-')
_ Iro"7 (kJ.
(K) mol-')
- Fo"
r (kJ.(K) mol-')
882.0 207.91846.7 213.03828.5 215.59809.6 218.37790.5 221.23770.5 224.26749.6 227.35760.2 225.84770.7 224.19780.8 222.61790.9 221.13800.6 219.70810.4 218.26819.6 21 6.90828.9 215.58838.1 214.23847.2 212.93856.2 211.64865.0 210.33873.3 209j4890.6 206.61898.5 205.43914.6 203.19906.9 204.25
1221.0 159.201233.1 157.491245.2 155.821256.9 154.151268.2 152.571279.2 151 .021290.6 149.471301 .1 147 .951312.0 146.401322.6 144.931257.4 154.071234.6 157.291 163.1 1 67.391322.8 144.881332.2 143.551301.4 147.881279.7 150.951211.9 160.451 187.6 1 63.921084.8 178.571058.5 182.321031.0 186.2410022 190.39
930.3945.7960.6975.4989.9
1004.01 018.01032.31045.41058.01071.21084.21097.21110.21 123.31 136.21148.71 161 .81 1 1 1 . 01174.01 186.01 198.41 210.51 136.2
200.8498.5996.4694.3192.2690.2188.2286.1584.2582.3880.50
178.64176.80174.92173.11171.26169.46167.60174.87165.871 64.17162.40160.70171.28
E
z
(:,<l
I
a5
(6)
t t la a a
a
476 O'NEILL:THERMODYNAMIC DATA FOR Fe-O AND Cu-O SYSTEMS
TnaLe 2. Results from the cells Pt, Fe + "FeO" I CSZ I YTD("d, Pt TneLe 3. Results from the cells Pt, Fe + Fe3O4 | CSZ I YTD("0, Pt
- Fo"
(kJ.mol ')
-Fo" -Fo"
r (kJ. r (kJ.(K) moF) (K) mol t)
_ rro, _ po,r (kJ. r (kJ
(K) mol 1) (K) mol 1)
- Fo"
r ( k J T(K) mol-r) (K)
850.1 417.09885 4 412.66918 7 408.85949.8 404.51979.9 400.70
1006.5 397.41947.0 405.02915.6 409.01882.6 413.21864.7 415.58899.0 411.25931.3 407.05962.1 403.03
1 163.9 376.831175.9 375.23
882.8 413.12899.8 410.88915.9 408.85947.3 404.87977.8 400.94
1033.9 393.98
Run 11046.8 392.13975.7 401.41
1 188.2 373.611200.0 372.081074.7 388.511 100.4 38s.101211.4 370.571223.8 368.921235.4 367.401 126.5 381 .6212465 365.931257.9 364.461269.7 362.931280.9 361.441292.0 359.97
Run 21061 .0 390.391087.5 386.861 1 13.4 383.461 138.9 380.091163.1 376.89
1302.7 358.601313.9 357.121324.3 355.751334.3 354.401153.7 377.901236.3 367.191314.0 357.141345.3 352.971355.7 351 .601366.1 350.211376.1 348.901385.9 347.591395.9 346.291405.7 345.00
1 187.9 373.561211.7 370.551236.4 367.071259.6 364.161060.7 390.39
measurements of Worrell and Iskoe (1973) show that theCu * CurO electrode is approximately an order of mag-nitude more reactive than Fe + "FeO" at the same tem-perature and two orders of magnitude more reactive thanNi + NiO. The latter two are oxygen bufers that arethemselves widely regarded as being highly reactive andeasy to use; therefore Cu * CurO might well be the mostreactive of all the common metal + metal oxide elec-trodes. Second, the Cu * CurO pellets are extremely softand deform easily at high temperature to provide an es-sentially perfect electrode-electrolyte interface in the cell.Indeed they are impossible to extract from the CSZ tubeafter a run, unlike virtually all other mixtures I have stud-ied. Third, no ternary phases are known to the Cu-CurO-ZrOr-CaO system; thus, there would seem to be little pos-sibility of any side reactions in the cell. Certainly, noevidence of any such reaction was noted (the Cu * CurOmixture may be cleaned out of the CSZ tubes very effec-tively with dilute acid, leaving an almost unmarked elec-trolyte surface). Fourth, the Cu * CurO equilibrium buff-ers the oxygen fugacity at quite high values. The cell emfis only approximately half of that for the Fe + "FeO"buffer, and consequently any oxygen leakage due to elec-tronic conduction should also be only halfthat for Fe +"FeO."
The slight difference between the emf measurementsand the calorimetric data calculated from the regressionanalysis has been used to amend the expression for thechemical potential of oxygen defined by the Cu + CurOequilibrium to (in J'mol-')
p6c;,+cu2o) (!62) : -347 705 + 246.0967- r2.9053T ln T (9)
where the uncertainty in the parenthesis is + I standard
811.4. 422 57820.9- 421.14830.61 41973837.6.. 418.67849.3" 416.96857.8 416.17
755.2 431.15764.2- 429.65774.9- 428.06784.2' 426.77793.5. 425.33803.1. 42394812.7' 422 53822.8' 420.94832.4' 419.49850.0. ' 417.138s9.0* 415.90
7507- 431.68759.9- 430.40770 9' 428.52780.7- 427.11
ivofe.' Molar ratio of Fe to Fe3O1 is 4 to 1 for runs 1 and 2, and 1 to 2for run 3.
- (Fe + Fe3O4) data; all others (Fe + "FeO"), except those marked withdouble asterisk.
." Status uncertain; possibility of reaction to "FeO" incomplete.
deviation and includes the observed experimental preci-sion in the results together with a contribution of +50
J.mol-' from the estimated possible error in the ther-mocouple calibration of +0.3 K. This latter factor wasomitted (by oversight) from earlier statements of theseresults in O'Neill (1987a, 1987b).
Also shown in Figure 3 is the curve reported in Holmeset al. (1986). The agreement with the present results isvery good and is within the combined experimental un-certainties of the two studies. However, the present re-sults are to be preferred, owing to the elimination of someof the potential errors in the experimental method re-ported in Holmes et al. (1986). A comprehensive com-parison with other experimental work is presented inHolmes et al. (1986) and will therefore not be repeatedhere.
Fe * ttFeOtt
Results from cells of the type
Pt, Fe * "FeO" I CSZ I YDT(ui,), Pt (ID
are given in Table 2, and those from the cells
Pt, Fe + Fe.O. I CSZ I YDT("i.), Pt (III)
are given in Table 3 for Fe * FerOo mixtures in the molarralio 4 to l. Fe + FerOo reacts rapidly to "FeO" at tem-peratures above the isobaric invariant point at which Fe,"FeO," and FerOo coexist, and therefore most of the datafrom these cells appertain to the Fe + "FeO" equilibri-
Run 1866.4 415.10875.0 413.87932.4 406.73
1021j 395.s11047 .8 392 071 126.8 381 .79
Run 2868 0-- 414.78885.0* 412.59901.7* 410.47917.8 408.66933.7 406.66949.0 404.68964.2 402.74979.0 400.87992.5 399.25
1006.6 397.431020.7 395.62
Run 3790.9. 425.57800.4. 424.17809.8- 422.67
1 151 .9 378.52' t176.1 375.411201 .6 371 .771224.9 368.691247.6 365.73
1034.1 393.881047.7 392.1 11060,9 390.401074,0 388.721086.4 387.16975.6 401.52
1099.1 385.461112.0 383.841125.0 382.091137.7 380.441150.6 378.73
819.6. 421.36829.1- 419.95846.5'- 417.33

O'NEILL: THERMODYNAMIC DATA FOR Fe-O AND Cu-O SYSTEMS
um. Each low-temperature datum representing the Fe *FerOo equilibrium is denoted by an asterisk and will bediscussed later. A few additional points, although beingin the Fe + "FeO" region, seem not to have fully equil-ibrated and were excluded from the following analysis.These data are marked by double asterisks. Two runswere done for each type of cell, and the temperature rangecovered is 840 to 1400 K.
Holmes et al. (1986) provided expressions for thechemical potential of oxygen defined by the Fe + "FeO"equilibrium as a function of temperature, based on theearlier electrochemical measurements in this laboratory.These expressions were also shown to be fully compatiblewith the best available calorimetric data for wiistite(JANAF, Stull and Prophet, 1971), although it may benoted that the application of such data is made somewhatuncertain owing to the large degree of nonstoichiometryshown by this phase. These expressions [there are threeof them, corresponding to the temperature regions belowthe Curie point in Fe (1042 K), between the Curie pointand the a - ,y transition (l184 K), and above the a - 7transition] have been used to illustrate the present results,by plotting the difference, A1ro, (Holmes et al., 1986), asa function of temperature in Figure 4. This procedure issimilar to that already used for the Cu * CurO equilib-num.
The agreement between the present results and the ear-lier ones is again very good. Regression analysis of thedifferences gives (in J.mol ')
Ap6, (+90) : (381 + 69) - (0.271 + 0.060)r . (10)
Thus the precision achieved is slightly less than for theCu * CurO equilibrium, which may reflect the somewhatless reactive nature of the Fe + "FeO" electrode. Theabove equation has been used to amend the expressionsfor the Fe + "FeO" equilibrium to (po" + 100 J.mol-';Z in kelvins)
-605812 + 1366.7187 - t82.7955T ln T + 0.103597'( 8 3 3 < 7 < 1 0 4 2 )
-519357 + 59.4277 + 8.9276TIn T( 1 0 4 2 < 7 < l l 8 4 )
-551 1s9 + 269.4047 - 16.9484T ln T.(1184 < z< 1450 )
( l l )
The agreement between the present results and the two-term expression given by Spencer and Kubaschewski(1978) is very good at temperatures above about 1200 K,but becomes increasingly less so at lower temperatures.This is mostly due to the inadequacy of a simple two-term expression, which implicitly neglects both the non-zero AC, of the reaction and the phase transitions in Femetal. A more detailed comparison with earlier studiesis given in Holmes et al. (1986). It is noteworthy that thepresent results are in good agreement with the classic workof Darken and Gurry 0945), who used the CO-CO, gas-mixing method. Unfortunately, the same cannot be said
2Fe + Ot=2"FeO"
T (K)
Fig. 4. Comparison of the present results for the reaction2Fe 1- Or: 2"FeO" with those of Holmes et al. (1986). O, datafrom runs starting with Fe + "FeO" (Table 2); o, starting withFe * Fe.Oo Oable 3).
for the recent work of Myers and Eugster (1983); theirresults are about 7000 J'mol-' more oxidized at 1200 K.
Cu * CurO vs. Fe * "FeO"-An experimental test
In order to test the results obtained for the Cu * CurOand Fe + "FeO" equilibria measured against air, the fol-Iowing two types of cell were constructed:
Pt, Fe * "FeO" I CSZ I Cu * CurO, Pt (IV)
Pt, Cu * Cu,O I CSZ I Fe + "FeO," Pt (V)
The difference between the two cells is purely geomet-rical. In the first, the Fe + "FeO" electrode occupied thesample position inside the CSZ tube with Cu * CurO inthe reference position, whereas in the second, these rel-ative positions were reversed. Three runs were performedwith the first type of cell and one with the second. Fullexperimental details are given in O'Neill (1987a), al-though the experiments with the first type of cell wereactually done using an earlier design, which, althoughbeing similar to that shown in Figure I of O'Neill ( I 987a),differed in minor details. These cells were also not per-fectly aligned relative to the "hot spot" of the furnace,necessitating small (< I mV) corrections to compensatefor the thermoelectric emf produced by the resulting tem-perature gradients, as described in O'Neill (1987a).
The results for the first type of cell are given in Table4. The mean difference between these emfs and thosethat may be calculated from Equations 9 and I I (i.e.,from the measurements vs. air) is -0.27 + 0.28 mV(note that I mV is equivalent to 386 J'mol-'). Thus theagreement between the two methods is excellent and isalmost within the combined precision of the air-referenceexperiments alone (+ 100 J'mol-'). The largest deviationof any of the 7l datum points is only 0.8 mV.
The results from the second type of cell (given in Table5) are in even better agreement. The average deviation is+0.06 + 0.1I mV, which is close to the maximum pre-cision that is possible to achieve with the method. Thesedata are plotted against temperature in Figure 5, from
= 200
i 0o
g( -roo
478 O'NEILL: THERMODYNAMIC DATA FOR Fe-O AND Cu-O SYSTEMS
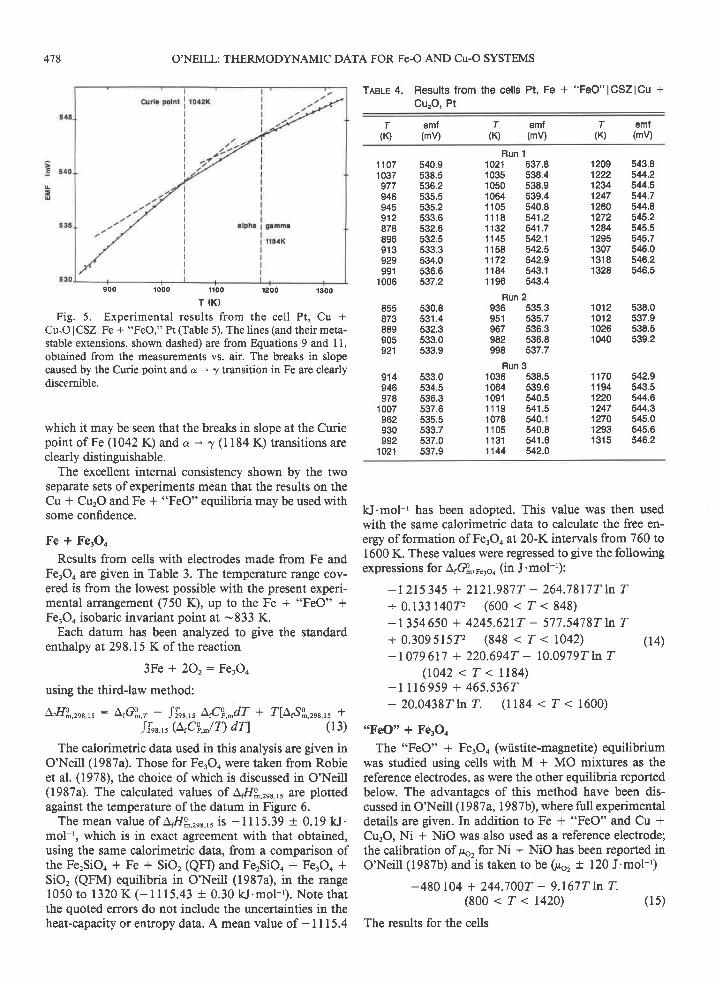
Tnac 4. Results from the cells Pt, Fe + "FeO"lCSZlCu +Cu,O, Pt
1107 540.91037 538.5977 536.2946 535.5945 535.2912 533.6878 532.6896 532.5913 533.3929 534.0991 536.6
1006 537.2
855 530.8873 531.4889 532.3905 533.0921 533.9
914 533.0946 534.5978 536.3
1007 537.6962 535.5930 533.7992 537.0
1021 537.9
Run 11021 537.81035 538.410s0 538.91064 539.41 105 540.81118 541.21132 541.71145 542.11 158 542.51172 542.91184 543.11 196 543.4
Run 2936 s3s.3951 535.7967 536.3982 s36.8998 537.7
Run 31036 538.s1064 539.61091 540.51 1 1 9 5 4 1 . 51078 540.11105 540.81131 541.61144 542.0
1209 s43.81222 544.21234 544.51247 544.71260 544.81272 545.21284 545.51295 545.71307 546.01318 546.21328 546.5
1012 538.01012 537.91026 538.51040 539.2
1170 542.91194 543.51220 544.61247 544.31270 545.01293 545.61315 546.2
kJ.mol-' has been adopted. This value was then usedwith the same calorimetric data to calculate the free en-ergy of formation of FerOo at 20-K intervals from 760 to1600 K. These values were regressed to give the followingexpressions for ArGg,r"roo (in J'mol-'):
- | 215 345 + 2121.9877 - 264.7817 T ln T+ 0.133 l40P (600 < 7" < 848)-l 354650 + 4245.6217 - 577.5478T ln T+ 0.309515? (848 < T < 1042) (14)-1079 617 + 220.6947" - 10.0979T ln T
( 1 0 4 2 < z < l l 8 4 )- l 116959 + 465 .5367^- 20.0438T1n T. (l184 < Z < 1600)
*FeO'* FerOo
The "FeO" * FerOo (wiistite-magnetite) equilibriumwas studied using cells with M + MO mixtures as thereference electrodes, as were the other equilibria reportedbelow. The advantages of this method have been dis-cussed in O'Neill (1987a, 1987b), where full experimentaldetails are given. In addition to Fe * "FeO" and Cu *CurO, Ni + NiO was also used as a reference electrode;the calibration of po, for Ni + NiO has been reported inO'Neill (1987b) and is taken to be ftio, + 120 J'mol-l)
-480104 + 244.7007 - 9.167Tln T.( 8 0 0 < T < 1 4 2 0 )
The results for the cells
f omf(K) (mv)
T. emt(K) (mv)
f emf(K) (mv)
T (K) lsoo
Fig. 5. Experimental results from the cell Pt, Cu +Cu,O I CSZ I Fe + "FeO," Pt (Table 5). The lines (and their meta-stable extensions, shown dashed) are from Equations 9 and 11,obtained from the measurements vs. air. The breaks in slopecaused by the Curie point and a - y transition in Fe are clearlydiscernible.
which it may be seen that the breaks in slope at the Curiepoint of Fe (1042 K) and a - 7 (1184 K) transitions areclearly distinguishable.
The excellent internal consistency shown by the twoseparate sets of experiments mean that the results on theCu * CurO and Fe + "FeO" equilibria may be used withsome confidence.
Fe * FerOn
Results from cells with electrodes made from Fe andFerOo are given in Table 3. The temperature range cov-ered is from the lowest possible with the present experi-mental arrangement (750 K), up to the Fe + "FeO" +FerOo isobaric invariant point at -833 K.
Each datum has been analyzed to give the standardenthalpy a|298.15 K ofthe reaction
3Fe + 2Or: FerO+
using the thirdlaw method:
AfIIA.2s8,s : ArG9,.r - ITnr$ AtCo4^dT + Z[AJg,reErs +ITrr.', (LrCo",^/n dn (13)
The calorimetric data used in this analysis are given inO'Neill (1987a). Those for FerOo were taken from Robieet al. (1978), the choice of which is discussed in O'Neill(1987a). The calculated values of Aflg,rr, 15 are plottedagainst the temperature of the datum in Figure 6.
The mean value of Arflg,rrr,, is -1115.39 + 0. 19 kJ.mol-', which is in exact agreement with that obtained,using the same calorimetric data, from a comparison ofthe FerSioo * Fe * sio, (QFD and FerSioo + Fe3o4 +SiO, (QFM) equilibria in O'Neill (1987a), in the range1050 to 1320 K (- I I15.43 + 0.30 kJ.mol-'). Note thatthe quoted errors do not include the uncertainties in theheat-capacity or entropy data. A mean value of - I I 15.4
( l5 )

O'NEILL: THERMODYNAMIC DATA FOR Fe-O AND Cu-O SYSTEMS 479
TneLe 5. Results from the cell Pt, Cu + CurOlCSZlFe +"FeO," Pt
7 emf(K) (mv)
f emf(K) (mv)
f emt(K) (mv)
877 532.0867 531.6859 531.2850 530.9858 531.5867 531.4876 531.9885 532.6893 s33.0910 533.7926 534.5942 535.1957 535.7971 536.3986 537.0901 533.3917 534.1987 537.0
1001 537.61015 538.21029 538.7
1042 539.21056 539.71069 540.11082 540.51096 540.91 109 541 .31082 540.51056 539.71029 538.71000 537.697'l 536.5
1035 s39.0'1121 541.71134 542.11147 542.51159 542.81171 543.21184 543.51109 541.41196 543.81207 544.1
1219 544.31231 544.71243 544.91255 545.21267 545.61279 545.81290 546.11301 546.31311 546.61322 s46.81300 546.31279 545.712't1 544.01188 543.51234 544.61267 545.61289 545.91311 546.31331 546.9
Pt, "FeO" + Fe3O4lCSZlFe + "FeO," Pt (VI)Pt, "FeO" + Fe3O4lCSZlNi + NiO, Pt (VII)
are given in Table 6. Since the Fe * "FeO" equilibriumoccrus at lower po' and the Ni + NiO at higher, the"FeO" * FerOo equilibrium is bracketed between the two,so that any errors resulting from the transfer of oxygento or from the reference electrode will not bias the results.
It was found that the "FeO" * FerOo electrodes ap-peared to react rapidly, with the emf of the cells comingquickly to the new equilibrium values on both raising andlowering temperature. However, the cells behaved in avery uncertain manner at higher temperatures (>1270K), and the decrease in emfof the cell, which is eventuallyobserved for all types of cell owing to the onset of oxygentransfer, was particqlarly marked. Hence no data are re-ported at temperatures higher than this. The emf s for thecell versus Ni + NiO below 920 K white appearing quitesteady, were obviously anomalous as they showed unusu-al fluctuations on changing temperature and were there-fore also discarded.
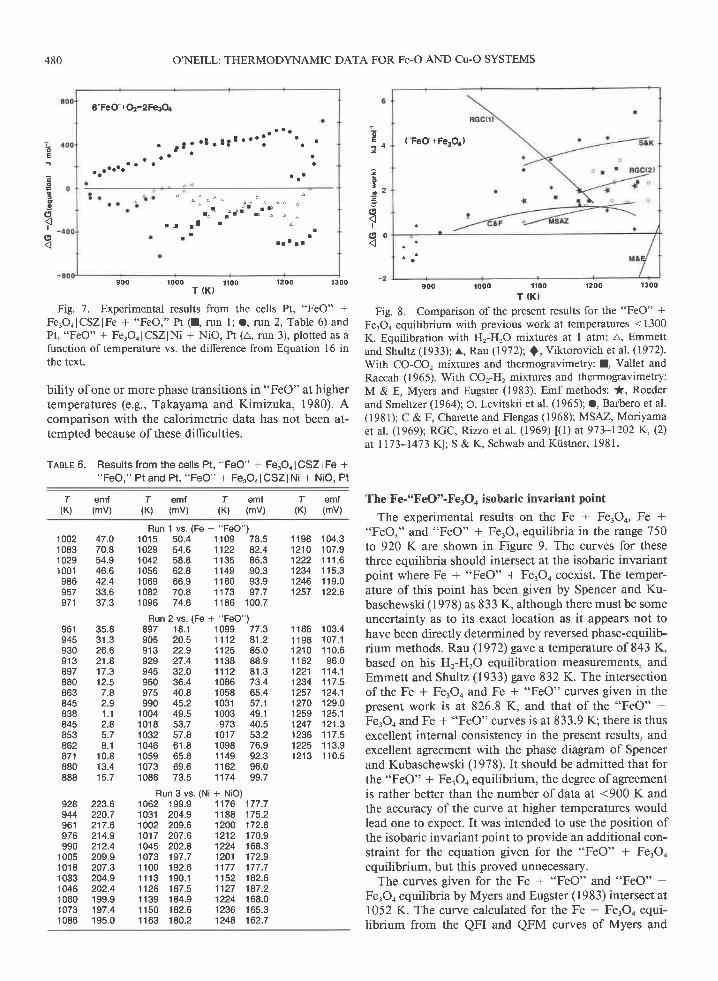
The remaining data were regressed to give po, for"FeO" + FerOo (io, t 306 J.mol-t):
-581 927 - 65.618r + 38.74r0T ln T.( 8 3 3 < T < 1 2 7 0 ) ( 1 6 )
The diflerence between each datum and the value givenby this equation is illustrated in Figure 7 .It may be seenthat there is a significant difference between these resid-uals for each of the three runs, which is reflected in therather larger than usual standard deviation ofthe equa-tion. Since both types of cell have a fairly large temper-ature dependence of the cell emf, this could be explainedby an error in the calibration of each thermocouple. (Theseruns were done over a period of some time and usedthermocouples from different spools of wire, each need-
790
T (K)
Fig. 6. The standard enthalpy of formation, AsFl$,rrr,r, ofFerOo, calculated from the experimental data from the cells Pt,Fe + FerOo I CSZ lair, Pt, given in Table 3. O, molar ratio of Feto FerOo is 4 to I (runs I and 2); l, molar ratio of Fe to FerO.is I to 2 (run 3). The two data annotated by question marks wereobtained at temperatures above the Fe + "FeO" + FerO. iso-baric invariant point at -833 K, where Fe + Fe3O4 is metasta-ble. Also shown are the mean values obtained for this equilib-rium by Rau (1972), using the reaction 3Fe + 4HrO : FerOc *4Hr, with a palladium H, membrane. The dashed line labeledRau (1) refers to his data in the pure Fe-O system; that labeledRau (2) refers to his data with Fe doped with 0.36 wo/o Sn.
ing a diferent calibration.) However, the problem wasrealized during the course of the latter two runs, and ad-ditional care was taken in calibrating the thermocouplesafter these runs. It is therefore felt that, at least in regardto these two runs, errors in temperature are not the causeofthe difference.
The composition of "FeO" in equilibrium with FerOochanges markedly with temperature, from FeororO at theisobaric invariant point at 833 K to FeorrrO at the"FeO" + FerOo melting temperature at 1697 K (Spencerand Kubaschewski, 1978). This change in stoichiometrymeans that the extent of the reaction needed to reachequilibrium on changing temperature is far larger thanfor most equilibria involving phases with nearly constantstoichiometry, where the only equilibrium necessary iswith the gas space above the electrode. The exceptionsare those equilibria with a very high 1lo' where a sub-stantial degree of reaction with the oxygen in the gas isrequired. An example is CoO + CorOr, which was earlierstudied in this laboratory (O'Neill, 1985) and which alsoshowed a slightly larger than usual dispersion of the data,despite being apparently, like "FeO" * FerOo, very re-active.
Nevertheless, the uncertainty in the present results isstill small compared to previous studies: +306 J'mol-'corresponds to only +0.013 in logf, at 1200 K. A com-parison with some previous studies is given in Figure 8.Most of these are at somewhat higber temperatures, andextrapolation ofthe three-term equation for the presentresults must be uncertain owing not only to the largechange in composition of "FeO," but also to the possi-
aoE-!
@og
t
810
6"FeO"+02=2Fe3q
^ a t t a
' r t l ' t ' t 3 1 " ' l t ' '
a o o -
o
o a o ' o ' o '
' '
t a '
- r - t ! t a
t - t f - -
r J r r Ir a
t a a t a a
480 O'NEILL: THERMODYNAMIC DATA FOR Fe-O AND Cu-O SYSTEMS
o
o
Iro
oI
eoo tooo T (*)
ttoo 12oo r30o
Fig. 7. Experimental results from the cells ft, "FeO" +Fe,OolCSZlFe + "FeO," Pt (I, run l; O, run 2, Table 6) andPt, "FeO" + Fe.Oo I CSZ lNi + NiO, Pt (4, run 3), plotted as afunction oftemperature vs. the difference from Equation 16 inthe text.
bility of one or more phase transitions in "FeO" at highertemperatures (e.9., Takayama and Kimizuka, 1980). Acomparison with the calorimetric data has not been at-tempted because of these difficulties.
Tnere 6. Results from the cells Pt, "FeO" + Fe3O4l CSZ l Fe +"FeO," Ptand Pt, "FeO" + Fe3O4lCSZlNi + NiO, Pt
('FeO"+FesOr)
Fig. 8. ;r"","';,r. ,L*i,,.,"',, ;.;. ".;: .FerOo equilibrium with prewious work at temperatures <1300K. Equilibration with H'-H'O mixtures at I atm: a, Emmettand Shultz (1933); r, Rau (1972); f , Viktorovich et al. (1972).With CO-CO, mixtures and thermogravimetry: I, Vallet andRaccah (1965). With COr-H, mixtures and thermogravimetry:M & E, Myers and Eugster (1983). Emf methods: *, Roederand Smeltzer 096D; O, Levitskii et al. (1965); O, Barbero et al.(1981); C & F, Charette and Flengas (1968); MSAZ, Moriyamaet al. (1969); RGC, Rizzo et al. (1969) lQ) at 973-1202 K, (2)ar 1l7 3-147 3 Kl; S & K, Schwab and Kiistner, 198 I .
The Fe-'6FeO"-FerO. isobaric invariant point
The experimental results on the Fe * FerOo, Fe *"FeO," and "FeO" * FerOo equilibria in the range 750to 920 K are shown in Figure 9. The curves for thesethree equilibria should intersect at the isobaric invariantpoint where Fe * "FeO" + FerOo coexist. The temper-ature of this point has been given by Spencer and Ku-baschewski (1978) as 833 K, although there must be someuncertainty as to its exact location as it appears not tohave been directly determined by reversed phase-equilib-rium methods. Rau (1972) gave a temperature of 843 K,based on his Hr-HrO equilibration measurements, andEmmett and Shultz (1933) gave 832 K. The intersectionof the Fe * FerOo and Fe + "FeO" curves given in thepresent work is at 826.8 K, and that of the "FeO" +FerOo and Fe + "FeO" curves is at 833.9 K; there is thusexcellent internal consistency in the present results, andexcellent agreement with the phase diagram of Spencerand Kubaschewski (1978). It should be admitted that forthe "FeO" * Fe.Oo equilibrium, the degree of agreementis rather better than the number of data at <900 K andthe accuracy of the curve at higher temperatures wouldlead one to expect. It was intended to use the position ofthe isobaric invariant point to provide an additional con-straint for the equation given for the "FeO" * FerOoequilibrium, but this proved unnecessary.
The curves given for the Fe + "FeO" and "FeO" +Fe,Oo equilibria by Myers and Eugster (1983) intersect at1052 K. The curve calculated for the Fe + Fe.Oo equi-librium from the QFI and QFM curves of Myers and
aoE- 4
!o
7 z!(t
I
o 0
f emf f emf I emf f emf(K) (mv) (K) (mv) (K) (mv) (K) (mv)
1002 47 .01083 70.81029 54.91001 46.6986 42.4957 33.6971 37.3
961 35.8945 31 3930 26.6913 21.8897 17.3880 12.5863 7.8845 2.9838 1.1845 2.8853 5.7862 8.1871 10.8880 13.4888 15.7
928 223.6944 220.7961 217.6976 214.9990 212.4
1005 209 91018 207.31033 204.91046 202.41060 199.91073 197 .41086 195.0
1 198 1 04.31210 107.91222 111 61234 1 15.31246 119 .01257 122.6
1 186 1 03.41 198 107 .11210 1 10 .61162 96.01221 114.11234 '117.5
1257 124.11270 129.01259 125.11247 121.31236 117.51225 1 13.91213 1 10 .5
Run 1 vs. (Fe + "FeO")101 5 50.4 1 109 78.51029 54.6 1122 82.41042 58.8 1135 86.31056 62.8 1149 90.31069 66.9 1 1 60 93.91082 70.8 1173 97 .71096 74.6 1186 100.7
Run 2 vs. (Fe + "FeO")897 18.1 1099 77 .3905 20.5 1112 81.2913 229 1125 85.0929 27 .4 1 138 88.9945 32.0 1112 81.3960 36.4 1086 73.4975 40.8 1058 65.4990 45.2 1031 57.1
1004 49.5 1003 49 11018 53.7 973 40.51032 57.8 1017 53.21046 61 .8 1098 76.91059 65.8 1 149 92.31073 69.6 1162 96.01086 73.5 1174 99.7
Run 3 vs. (Ni + NiO)1062 199.9 1176 177.71031 204.9 1188 175.21002 209.6 1200 172.81017 207.6 1212 170.91045 202.8 1224 168.31073 197.7 1201 172.91 100 192 .6 1177 177 . 71113 190.1 1152 182.61126 187.5 1127 187.21139 184.9 1224 168.01150 182.6 1236 165.31163 180.2 1248 162.7

O'NEILL: THERMODYNAMIC DATA FOR Fe-O AND Cu-O SYSTEMS 481
F e - O
TeerE 7. Results from the cells Pt, Fe3O4 + FerO3lCSZlCu +cu,o, Pt and Pt, Fe3O4 + Fe'O3lCSZlNi + NiO' Pt
f emf f emf f emf f emf(K) (mv) (K) (mv) (K) (mv) (K) (mv)
T (K)
Fig. 9. Free energy forreactions: (1), Fe + FerOo, circles; (2),Fe + "FeO," triangles; and (3), "FeO" + FerOo, squares, plottedrelative to Reaction 2, Fe + "FeO," in the range 750-920 K toshow the position of the isobaric invariant point at which Fe +"FeO" + FerOo coexist at I bar. Open symbols, Rau (1972);solid symbols, the present work.
Eugster intersects their Fe + "FeO" curye at -216 K (!)and their "FeO" * FerO. curve at 1106 K, which givessome indication of the poor internal consistency of theirresults.
Fe.Oo + FerO.
The FerOo * FerO. equilibrium (magnetite-hematite,Reaction 4) is a very important one in petrology, not leastbecause it is the basis of the Fe-Ti oxide geothermome-ter-oxygen barometer of Buddington and Lindsley Q96a;and later versions). Two types of cell were used to studythis equilibrium:
Pt, FerOo * FerO. lCSZlCu + CurO, Pt (VIII)Pt, Fe.Oo + FerO.lCSZlNi + NiO, Pt (IX)
Two successful runs were done with cell VIII and onewith cell IX. The results are given in Table 7. The po, ofthe FerOo + FerO, equilibrium intersects that of the Cu *CurO equilibrium at - I190 K. Below this temperature,FerOo + FerO. is stable at more reducing conditions thanCu * CurO and is therefore bracketed between the latterand the Ni + NiO equilibrium. Above - 1190 K, Fe.Oo* FerO, is more oxidizing than either of the referenceelectrodes, but is obviously closer to that of Cu * CurO.Hence any errors introduced at high temperature due tooxygen transfer across the cell should be less for cell VIIIthan for cell IX.
Unlike all the other oxygen bufers used in this study,FerOo + FerO. proved to be extremely sluggish in its
101 3 65.s1026 59.81040 54.41054 49.31068 44.21081 39.11094 33.91107 29.2
1142 17 11 155 12 .31 168 6 .11 180 0.81 193 - 4.4
1019 215.41034 22031048 224.91061 229.31075 233.41088 237 .1
Run 1 vs (Cu + Cu,O)1121 24.5 1197 -6.0
1134 19.7 1209 -10.8
1 146 14.7 1220 - 1 5.31158 10.0 1232 -19.9
1171 5.2 1244 -25.4
1183 -0.1 1256 -30.9
1159 9.3 1245 -26 41190 -3 .4 1256 -31 .0
Run 2 vs. (Cu + CurO)1205 -9.2 1264 -34.5
1217 -14.5 1276 -39.0
1229 -19.7 1287 -43.5
1241 -24.8 1298 -47.7
1253 -29.7 1309 -52.O
Run 3 vs. (Ni + NiO)1 101 240.6 1152 255.21074 231.5 1 164 259.11 100 239.8 1',t76 263.31 1 14 243.8 1 188 267 .51127 247 .6 1200 271 .51140 251.4 1212 275.4
1268 -35.51279 -39.91290 -44.41301 -48.51312 -53.01322 -57.11301 -48 I
1320 -5s.81310 -51 .71299 -47 .2
1224 279.31235 283.11247 286.51258 290.31268 293.6
approach to equilibrium. In this regard it is similar toquarlz-fayalite-magrretite (QFM) (O'Neill, 1 9 8 7a). In allthe runs attempted (which include some at temperaturesbelow 1000 K, see below, that were nct deemed success-ful and that are therefore not reported in detail), the ini-tial emf was 50-100 mV more reduced than the inferredequilibrium value and decayed very slowly toward thisvalue. This rate of decay decreased with decreasing tem-perature and was so slow that it would not be feasible toobtain measurements below about 1000 K, although theobserved emf values at these lower temperatures even-tually appeared constant and quite steady. These appar-ently stable emf values were, however, not reproduciblefrom run to run (varying by up to 6 mY at any one tem-perature), were inconsistent with the calorimetric datawhen analyzed by the "third-law" method, and, on in-creasing temperature, gave rise to further long periods ofslow decay.
The three successfirl nrns were all begun at a temper-ature greater than 1000 K. A week was allowed in orderto achieve equilibrium at the beginning of the run, bywhich time the emf had been observed to be constant to+0.2 mV for at least 48 h. Thereafter, readings were tak-en -48 h after increasing the temperature of the cell upto 1200 K, and thence at24-h intervals. The time neededto achieve a stable emf on decreasing temperature waseven longer; therefore, few such readings were attemptedand then only toward the higher end of the temperaturerange covered by these experiments. Reversing the cellseither by passing a small current across them or by flush-ing with a reducing or oxidizing gas was frustrated by theextremely long time needed to retum to equilibrium; hencethis procedure was not attempted in the runs reported inTable 7. Similarly sluggish behavior of Fe.Oo * FerO,
r - 2oE-
6 ofgo\l -2I
o

482 O'NEILL: THERMODYNAMIC DATA FOR Fe-O AND Cu-O SYSTEMS
toE - + g g . ot
@oSI( -rgq.o
a
4FqOa + 02 = 6Fe2O3 .ll.a a
t t l
a l
, 'a
l i
l o o
t .. y o -
l Oa
3t' o l o a o
---,!\-!--o--.*-
o ^ ^ G
a o-495.O
l ooo t too
, , * ,
t too l3oo
Fig. 10. Standard enthalpy, AJI o^.2e8,r, for the reaction4Fe3O4 + O, : 6Fe.O, calculated from the experimental data inTable 7, using the entropy and heat-capacity data for FerOo,Fe.Or, and O, in Robie et al. (1978).
has been remarked on by Charette and Flengas (1968). Itis emphasized, however, that all the data reported hereare from measurements in which the emf values changedsmoothly, if slowly, to the new value on changing tem-perature and thence remained perfectly constant (to with-in +0.2 mV) until the next temperature increment.
Each datum was analyzed by the thirdJaw method (Eq.13) using the entropy and heat-capacity data for FerOo,FerO,, and O, given in Robie et al. (1978). The data forFe.Oo have been previously shown to be consistent withthe Fe * FerOo (this work) and QFM (O'Neill, 1987a)emf measurements. The enthalpy of reaction at 298.15K (A.flg,rr8,r, Reaction 4) so obtained is plotted versusthe temperature of the datum in Figure 10. Below - I150K, this enthalpy appears independent of temperature(within experimental error), and thus the emf measure-ments would seem to be in good agreement with the ca-lorimetric data. However, the small temperature interval(-130 K) covered, coupled with the large coefficients ofstoichiometry of the reaction (i.e., 6 mol of FerO, and 4mol of FerOo per 1 mol of Or) make this agreement lessconvincing than for the other equilibria studied in thiswork. The mean value of Aflg,rr8 ,ris -494.46 + 0.2 kJ.mol ', which, with the previously deduced heat of for-mation of FerOo, gives Arfl$,rr,,, : 826.0 kJ.mol-1. Thiscompares satisfactorily with that measured by bomb cal-orimetry, 826.8 kJ.mol-' (Roth, 1929).
Above I173 K, the calculated A,Ho^..rr,rvalues tend tobe less negative. This is expected from the increasing solidsolution of FerOo toward 7-FerO3 above this temperature(e.g., Spencer and Kubaschewski, 1978). Dieckmann(1982) has measured the amount of nonstoichiometry inFerOo (expressed as d in Fer-rOo) as a function of oxygenfugacity from I173 to 1673 K. His data may be used tocalculate the change in the activity of FerOo in equilib-
rium with FerOr, relative to a standard state of stoichio-metric Fe3O4, from the Gibbs-Duhem relation.
The formula Fe, uOo may be rewritten as FerO, + [20l(3 - 6)10r. The Gibbs-Duhem equation gives
RTd(ln ae "pc)
: - (nor/ no"roo)d1ro,: l-26/(3 - 6)ldp", (17)
Dieckmann (1982) showed that 6 is in fact a rather com-plicated function of po, since besides the cation vacan-cies predominant at high po, values, Fe.Oo also possessescation interstitials, which dorninate at low trror. The over-all value of d is therefore a product of two independentdefect equilibria. However, at the high po, values of in-terest here, cation vacancies greatly outnumber intersti-tials; hence, to a good approximation, the latter may beignored. Dieckmann found that D in this region dependson/o" according to the relation
6 o (fo,)"' ( t 8 )
and hence
dpo,: -(3RT/26) d6. (19)
Substituting this into Equation l7 and integrating fromd : 0 t o 0 g i v e s
RI ln cr"roo : 3RT ln(3 - d)/3.
The values of D at the po, of the Fe.Oo + FerO, equi-librium were then calculated from Equation 13 in Dieck-mann (1982), at 1173, 1273, and 1373 K, to give thefollowing values of RZln er"roo at these temperatures (inJ.mol-'): 66,165, and 318. Since there are 4 mol of FerOoper I mol of O, for the FerOo * FerO, equilibrium, theexpected deviation from a horizontal line for AJYg,2e8 15in Figure 10 would then be 0.26 W at ll73 K, 0.66 kJ at1273 K, and 1.27 kJ at 1373 K. This deviation is onlyabout half that observed, which may indicate that thecalorimetric data for FerO, are in fact slightly in error,with the small temperature range covered by the emfmeasurements reported here at temperatures less thanI 150 K being insufficient for such errors to be noticeable.Note that since there are 6 mol of FerO, per I mol of O,in the Fe.Oo + FerO, equilibrium, quite small errors inthe entropy for FerO. may be multiplied to produce afairly substantial effect on the calculated A.11$,rrr,,
The results of some previous work on the FerOo +FerO, oxygen buffer are summarized in Figure ll. Theemf study of Blumenthal and Whitmore (1961) is in ex-cellent agreement with the present results, and that ofMoriyama et al. (1969) in good agreement. However, mostof the previous emf studies, including some in which theexperimental design has been shown to perform satisfac-torily in the determination of other, less kinetically slug-gish equilibria, are tightly clustered in a region -6 kJ'mol-rmore oxidized than these results. It is worth noting,though, that none of these studies show the change inslope of Aflg.rnr,, expected from the increasing departurefrom stoichiometry of FerOo above - I150 K. The results

of Rau (1972) at lower temperatures-which were ob-tained using the same Hr-HrO method as for the Fe *FerOo, Fe + "FeO," and "FeO" + FerOo equilibria andwhich were in excellent agreement with the emf mea-surements reported earlier in this paper-are even moreoxidized, by -10 kJ.mol-,. However, it might be ex-pected that, in this case, Rau's method would not be par-ticularly accurate, as the partial pressure of H, in Hr-HrOmixtures in equilibrium with FerOo + FerO, at atmo-spheric pressure is very low and consequently difficult tomeasure with the necessary precision. It is also worthnoting that the material used by Rau was very fine grainediron hydroxides dehydrated at 300 "C and may well be ina state metastable to true, well-crystallized a-FerOr. TheH,-sensor method of Chou (1978) is the only hydrother-mal study of this equilibrium that I have found in theliterature. Chou's results are in good ag.reement with thepresent ones above 973K, but tend toward more negativevalues of Afl*,,rr,,, at lower temperatures. Interestingly,this trend is similar to that shown by my attempted mea-surements at T < 1000 K, which were interpreted not tohave fully reached equilibrium (and which are thus notreported in detail); these actually gave, for example,Aflf l,,rnr,, between -497.5 and -499.5 kJ'mol-' at-820 K.
The discrepancy between this majority of previousemf studies and this work is too large to be explained bythe usual experimental uncertainties of the emf method,which mostly amount to <2 kJ.mol ' [see, for example,the comparisons illustrated in Fig. 6 of Holmes et al.(1986) for the Cu * Cu,O, Ni + NiO, Co * CoO, andFe * "FeO" buflersl. That the present results are "morereduced" is especially disconcerting when it is remem-bered that in all runs the emfs approached stable valuesslowly from the reducing side. It is therefore possible thatthe present results represent a metastable equilibrium; ifso, it is a highly persistent one, as, for example, the runsreported in Table 7 typically were held at temperaturesgreater than -1020 K for periods in excess of two months.Furthermore, the hydrothermal work of Chou should beless liable to such metastability because HrO at high pres-sures may promote equilibrium through dissolution andreprecipitation processes and, as pointed out above,Chou's results are in reasonably good agreement. Con-versely, if the present results are indeed accurate, thenthe majority of the previous emf work might equally wellbe recording a metastable equilibrium-perhaps involv-ing,y-FerOr. This is plausible since ̂ y-FerO, is less stablethan a-FerOr; therefore, the FerOo + -y-FerO, metastableequilibrium must occur at higher &o, than the stableFe.Oo + a-FerO, equilibrium. xno analysis of the samplepellets after each of the runs in Table 7 showed only theexpected pattern of well-crystallized FerOo and a-FerOr.Also, the solubility of Fe in Pt metal at the po, of theFerOo + FerO, equilibrium at the temperatures of thisstudy is negligible, and there was no evidence for any otherside reaction in the cell.
483
-500.0
- -495.0
E
R -4s0.0
- 4 8 5 . 0
Or = 6FezOr
Fig. r r. alrro"nr"" "ar* ,Jjli ,.rtr, ,", the Fe,oo *FerO, equilibrium with earlier work at temperatures < 1350 K.O, Rau (1972),Hz-}]rO equilibrium at I bar; C, Chou (1978),Hr-sensor at 2 and 4 kbar; M & E, Myers and Eugster (1983),COr-H, and thermogravimetry. The others all used an emfmethod: B & W, Blumenthal and Whitmore (1961); C & F,Charette and Flengas (1968); MSAZ, Moriyama et al. (1969); B& S, Bryant and Smeltzer (1969); F, Fitzner (1979); KMK, Ka-tayama et al. (1980); S & K, Schwab and Kiistner (1981); J,Jacobsson (1985).
Finally, the inconsistency between the different emf ex-periments on the FerOo + FerO. equilibrium seems toextend to similar experiments that seek to use this equi-librium to determine the activity of FerOo in spinel solidsolutions. Thus activity-composition relations inZnFerOo-Fe.Oo solutions in equilibrium with Fe'O, havenow been measured no less than four times. Two studies(Katayama et al., 1977; Schaefer and McCune, 1986) re-port very small positive deviations from ideality, but twoothers (Tretyakov, 1967; Fitzner, l9l9) report substan-tial negative deviations, the difference between the twoschools amounting to -30 mV in the cell emf for thecomposition Xp.toa : 0.5 at I 17 3 K, which is about twicethat between the present results and the majority for theunivariant equilibria. Earlier work with a gas-equilibra-tion method @enner and Kenworthy, 1966) sheds no lighton the problem, as these authors obtained a third kind ofresult, large positive deviations from ideality.
Cu,O + Cuo
The experimental results from the cell
Pt, CurO + CuOICSZf Cu + CurO, Pt (X)
are given in Table 8. No problems were encountered withthis cell, and stable emf values were achieved rapidly atall temperatures. The data were analyzed in the same wayas those for the Cu + CurO equilibrium. Values of po,for the reaction
2 C u ' O + O r = d Q u Q (20)
O'NEILL: THERMODYNAMIC DATA FOR Fe-O AND Cu-O SYSTEMS
were taken from the JANAF tables (Chase et al., 1982)
484 O'NEILL: THERMODYNAMIC DATA FOR Fe-O AND Cu-O SYSTEMS
TnaLe 8. Results for the cel l Pt, Cu,O + CUOICSZICU +Cu,O, Pt
f emf T emt f emf f emf(K) (mv) (K) (mv) (K) (mv) (K) (mv)
I
E
Gz3o
I
T (K)
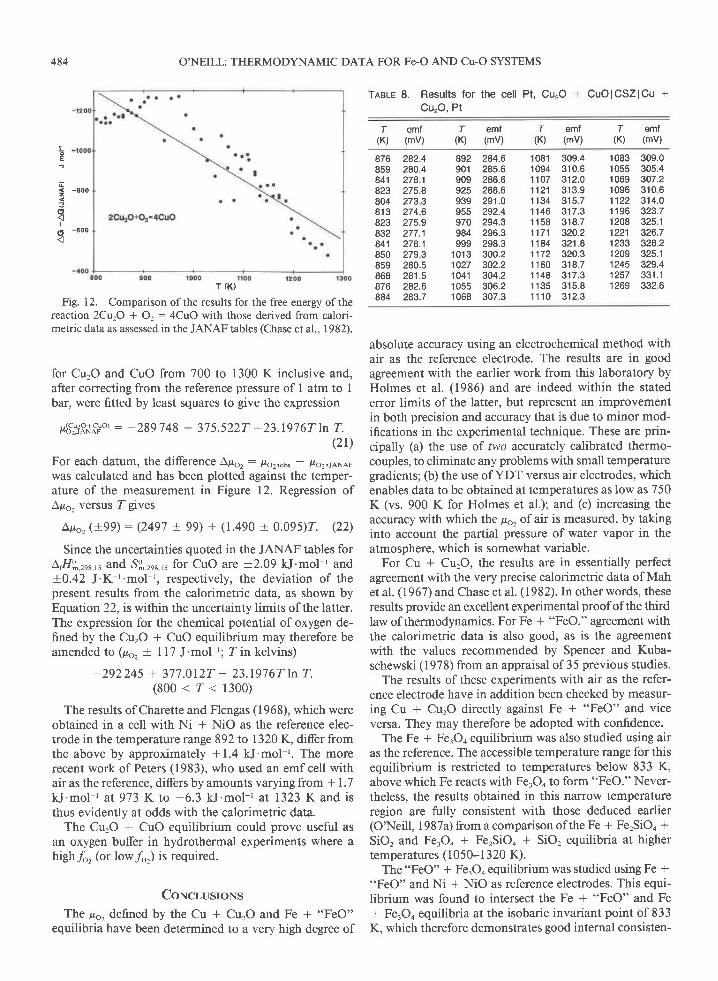
Fig. I 2. Comparison of the results for the free energy of thereaction 2CqO + O, : 4CuO with those derived from calori-metric data as assessed in the JANAF tables (Chase et al.. 1982).
for CurO and CuO from 700 to 1300 K inclusive and,after correcting from the reference pressure of I atm to Ibar, were fitted by least squares to give the expression
p6',:3R+o:,'o) : -289748 + 375.5227 -23.1976TLn T.(2r)
For each datum, the difference Apor: /ro2:ous - lro2,rANAFwas calculated and has been plotted against the temper-ature of the measurement in Figure 12. Regression ofApo2 versus ZgiveS
Ap6, (+99) : (2497 + 99) + (1.490 + 0.095)2. (22)
Since the uncertainties quoted in the JANAF tables forL,H?,.rr",, and S$.rnr,, for CuO are +2.09 kJ'mol-' and+0.42 J'K-t 'mol r, respectively, the deviation of thepresent results from the calorimetric data, as shown byEquation 22, is within the uncertainty limits of the latter.The expression for the chemical potential of oxygen de-fined by the CurO + CuO equilibrium may therefore beamended to (po, + I 17 J'mol '; Z in kelvins)
-292245 + 377.0127 - 23.197 6T lrr T.( 8 0 0 < z < 1 3 0 0 )
The results of Charette and Flengas (1968), which wereobtained in a cell with Ni + NiO as the reference elec-trode in the temperature range 892 to 1320 K, differ fromthe above by approximately +1.4 kJ'mol '. The morerecent work of Peters (1983), who used an emf cell withair as the reference, differs by amounts varying from * 1.7kJ.mol r at 973 K to -6.3 kJ.mol-' at 1323 K and isthus evidently at odds with the calorimetric data.
The CurO + CuO equilibrium could prove useful asan oxygen buffer in hydrothermal experiments where ahigh f", (or low/",) is required.
CoNcr,usroNs
The;16, deflned by the Cu * CurO and Fe + "FeO"equilibria have been determined to a very high degree of
876 2824859 280.4841 2781823 275.8804 2733813 2746823 275.9832 277.1841 278.18s0 2793859 280.5868 281.5876 282.6884 283.7
absolute accuracy using an electrochemical method withair as the reference electrode. The results are in goodagreement with the earlier work from this laboratory byHolmes et al. (1986) and are indeed within the statederror limits of the latter, but represent an improvementin both precision and accuracy that is due to minor mod-ifications in the experimental technique. These are prin-cipally (a) the use of two accvrately calibrated thermo-couples, to eliminate any problems with small temperaturegradients; (b) the use of YDT versus air electrodes, whichenables data to be obtained at temperatures as low as 750K (vs. 900 K for Holmes et al.); and (c) increasing theaccuracy with which the po, of air is measured, by takinginto account the partial pressure of water vapor in theatmosphere, which is somewhat variable.
For Cu * CurO, the results are in essentially perfectagreement with the very precise calorimetric data of Mahet al. (1967) and Chase et al. (1982). In other words, theseresults provide an excellent experimental proof of the thirdIaw of thermodynamics. For Fe * "FeO," ageement withthe calorimetric data is also good, as is the agreementwith the values recommended by Spencer and Kuba-schewski (1978) from an appraisal of35 previous studies.
The results of these experiments with air as the refer-ence electrode have in addition been checked by measur-ing Cu * CurO directly against Fe + "FeO" and viceversa. They may therefore be adopted with confidence.
The Fe * FerOo equilibrium was also studied using airas the reference. The accessible temperature range for thisequilibrium is restricted to temperatures below 833 K,above which Fe reacts with FerOo to form "FeO." Never-theless, the results obtained in this nalrow temperatureregion are fully consistent with those deduced earlier(O'Neill, I 987a) from a comparison of the Fe + Fe,SiOo +SiO, and FerOo + FerSiOo + SiO, equilibria at highertemperatures (1050-1 320 K).
The "FeO" * Fe.Oo equilibrium was studied using Fe +"FeO" and Ni + NiO as reference electrodes. This equi-librium was found to intersect the Fe * "FeO" and Fe* Fe,Oo equilibria at the isobaric invariant point of 833K, which therefore demonstrates good internal consisten-
-800
-600
892 284.6901 285.6909 286.6925 288.6939 291.0955 252.4970 294.3984 296.3999 298.3
1 013 300.21027 302.21041 304.21055 306.21068 307.3
1081 309.41094 31 0.61107 312.01121 313.91134 31571146 317.31 158 318.71171 320.21184 321 I1172 320.31 160 318.71148 317.31 135 315 .81 1 10 312 .3
1083 309.01055 305.41069 307 .21096 31061122 314.01196 323.71208 325 11221 326.71233 32821209 32s.11245 329.41257 331.11269 332 6

cy. Agreement with the results of Rau (1972), who useda Hr-HrO equilibration method, are excellent.
The results for FerOo * FerO, are less satisfactory. Theexceptionally sluggish approach to equilibrium shown bythis assemblage makes demonstration of equilibrium byreversal difficult and also limits the temperature range ofinvestigation that is practical with the present method toabove about 1000 K. Although the agreement of the re-sults with existing calorimetric data appears quite good,this test is rendered somewhat uncertain by the large coef-ficients of stoichiometry of the reaction (i.e., 6 mol ofFerO. and 4 mol of Fe.Oo to I mol of Or), by the Curiepoints of Fe.Oo at 850 K and FerO. at 950 K, and by theincreasingly large degree of nonstoichiometry in FerOoabove about I 150 K. Comparison with previous studiesreveals that most of these place the equilibrium at a po-sition more oxidizing by some 6 kJ'mol ' in por. Thismay be due to metastability of the crystalline form ofFerO., but, in order to ascertain this, further experimentswith a technique that increases the rate of equilibration(e.9., by using a flux) would be necessary at lower tem-peratures.
AcxNowr-BocMENTS
I would like to thank Professor A E. Ringwood for providing laboratoryfacilities, Herb Niessler for help with the electronics, Paul Willis and BillHibberson for technical assistance, and Stefan Seifert for taking some ofthe readings during my absences from the laboratory The Canbena Bu-reau of Meteorology kindly loaned a psychrometer. This work grew outof the earlier collaboration with Dick Arculus and Richard Holmes, whoseinsights into the techniques of solid electrolyte measurements are grate-
fully acknowledged Sue Kesson is thanked for reading and correcting anearlier version of this paper and Dick Arculus and Ricardo Aragon forhelpful reviews.
RnrnnoNcBs crrnlAlcock, C B., Fitzner, K., and Jacob, K.T. (1977) An entropy meter based
on the thermo-electric potential of a nonisothermal solid-electrolytecell Journal of Chemical Thermodynamics, 9, l0l l-i020.
Badwal, S.P.S (1983) New electrode materials for low temperature oxy-gen sensors Journal of Electroanalytical Chemistry, 146,425429.
-(1984) Kinetics of the oxygen transfer reaction at the (Uo5sco5)Ora"-YSZ interface b.v impedance spectroscopy. Journal of ElectroanalyticalChemistry, 161,75-91
Bannister, M J. (l 984) The standard molar Gibbs free energy offormationof PbO. Oxygen concentration-cell measurements. Journal of ChemicalThermodynamic s, 16 , 7 87 -7 92
Barbero, JA, Blesa, M.A., and Maroto, A.JG. (1981) The lower tem-perature range ofthe wiistite stability field. Zeitschrift fiir PhysikalischeChemie Neue Folge, 1 24, 139-147 .
Benner, R.L., and Kenworthy, H. (1966) The thermodynamic properties
of the ZnO-FerO3-Fe.On system at elevated temperatures. U.S. Bureauof Mines Report of Investigation 6769.
Berglund, S (1976) The free energy offormation ofnickel oxide. Berichteder Bunsen-Gesellschaft fiir Physikalische Chemie, 80, 862-866.
Blumenthal, R.N., and Whitmore, D.H. (1961) Electrochemical measure-ments of elevated-temperature thermodynamic properties of certainiron and manganese oxide mixtures Journal of the American CeramicSociety, 44, 508-512
Bryanr, P E.C., and Smeltzer, W.W. (1969) The dissociation pressure ofhematite. Journal ofthe Electrochernical Society, I 16, 1409-1410.
Buddington, A F., and Lindsley, D.H. (1964) Iron-titanium oxide min-erals and synthetic equivalents. Joumal ofPetrology, 5, 310-357.
Charette, G G., and Flengas, S N. (1968) Thermodynamic properties of
485
the oxides of Fe, Ni, Pb, Cu and Mn, by EMF measurements. Journal
of the Electrochemical Society, 1 15, 7 96-804.Chase, M.W., Jr, Curnutt, J.L., Downey, J.R., McDonald, R.A., Syverud,
A N., and Valenzuela, E A (19S2) JANAF thermochemical tables, 1982
supplement. Journal ofPhysical and Chemical Reference Data, ll,
69s-940.Chou, I-M. (1978) Calibration ofoxygen buffers at elevated P and Z using
the hydrogen fugacity sensor American Mineralogist, 63' 690-703
Choudhary, C.B., Maiti, H.S., and Subbarao, E.C. (1980) Defect struc-
tures and transport properties. In E.C. Subbarao, Ed', Solid electrolytes
and their applications, p. 1-80. Plenum Press, New York.
Comert. H.. and Pratt, J N. (1982) The thermodynamic propprties of solid
cobalt-zinc alloys. Thermochimica Acta, 59, 267 -285
Darken, LS., and Gurry, RW. (1945) The system iron-oxygen. I. The
wiistite field and related equilibria. Journal of the American Chemical
Society,67, 1398-1412Dieckmann, R. (1982) Defects and cation diffusion in magnetite (IV):
Nonstoichiometry and point defect structure of magnetite (Fer-uOJ.
Berichte der Bunsen-Gesellschaft fur Physikalische Chemie,86, 112-
I 1 8 .Emmett, P.H , and Shultz, J F. (1933) Gaseous thermal diffusion-The
principal cause ofdiscrepancies among equilibrium measurements on
the systems FerOo-Hr-Fe-HrO, FerOo-Hr-FeO-HrO and FeO-HrFe-H,O.
Journal ofthe American Chemical Society, 55, 1376-1389.
Fitzner, K. (1979) Thermodynamic properties and cation distribution of
the ZnFerOo-Fe,Oo spinel solid solution at 900qC. Thermochimica Acta,
5 l - z z t - 2 5 0 .
Holmes, R.D , O'Neill, H.SI.C, and Arculus, R J. (1986) Standard Gibbs
free energy of formation for CurO, NiO, CoO and Fe'O: High-resolu-
tion electrochemical measurements using zirconia solid electrolytes from
900-1400 K. Geochimica et Cosmochimica Acta, 50, 2439-2452.
Jacobsson, E (1985) Solid state EMF studies of the systems FeO-Fe,Ou
and Fe,Oo-FerO, in the temperature range I 000- I 600 K Scandinavian
Journal of Metallurgy, 14, 252-256.Jacobsson, E , and Ros6n, E. (l 98 l) Thermodynamic studies ofhigh tem-
perature equilibria. 25. Solid state EMF studies ofthe systems Fe-FeO,
Ni-NiO and Co-CoO in the temperature range 1000-1600 K. Scandi-
navian Journal ofMetallurgy, 10, 39-43.Katayama, I, Shibata, J., Aoki, M., and Kozuka, Z. (1977) Thermody-
namic study ofspinel type solid solutions ofthe Fe,Oa-ZnFe'Oo system
by E M.F. measurements using the solid electrolyte Transactions of
the Japanese Institute of Metals, 18,'7 44-7 49.Katayama, I , Matsuda, T., andKoz,tka,Z. (1980) Thermodynamic study
on FerOo-CuFerO4 system by E M.F. method. Technology Reports of
the osaka University, 30, 385-390.Kermori, N , Katayama, I., and Kozuka, Z' (1979) Measurement of stan-
dard molar Gibbs energies of formation of NiO, CurO, and CoO from
solid and liquid metals and oxygen gas by an emf method at high
temperatures. Journal ofChemical Thermodynamics, I 1, 215-228.
Levitskii, V.A, Rezukhina, T.N., and Dneprova, V.G. (1965) Measure-
ment of the EMF from galvanic cells with a solid electrolyte above
I 100'C Soviet Electrochemistry, 1, 833-839.Mah, A.D., Pankratz, L B., Weller, W.W., and King, E.G. (1967) Ther-
modynamic data for cuprous and cupric oxides U.S. Bureau of Mines
Report of Investigation 7 026Moriyama, J., Sato, N , Asao, H., and Kozuka, Z. (1969) Thermodynamrc
study on the systems of metals and their oxides by EMF measurements
using solid electrol)te Memoirs of the Faculty of Engineering, Kyoto
University, 31, 253-267.Myers, J., and Eugster, H P. (1983) The system Fe-Si-O: Oxygen buffer
calibrations to 1,500 K. Contributions to Mineralogy and Petroiogy,
82. 7 5-90.O'Neill, H.SI.C (1985) Thermodynamics of CorOo: A possible electron
spin unpairing transition in Co3*. Physics and Chemistry ofMinerals'
12, t49-154.- (1987a) Quartz-fayalite-iron and quartz-fayalire-magnetite equi-
libria and the free energy of formation of fayalite (FerSiOo) and mag-
netite (FejO4). American Mineralogist, 7 2, 67 -7 5.-(1987b) Free energies of formation of NiO, CoO, Ni'SiOn, and
CorSiOo. American Mineralogist, 7 2, 280'29 |
Peters, T (1983) Equilibrium fugacities ofthe Cu,O-CuO and Cu-CurO
O'NEILL: THERMODYNAMIC DATA FOR Fe-O AND Cu-O SYSTEMS

486
buffers. Schweizerische Mineralogische und Petrologische Mitteilun-gen,63,7- l l
Rau, H. (1972) Thermodynamics ofthe reduction ofiron oxide powderswith hydrogen. Journal of Chemical Thermodynamics, 4, 57-64.
Rizzo, F.E., Gordon, R.S, and Cutler, I B (1969) The determination ofphase boundaries and thermodynamic functions in the iron-oxygen sys-tem by EMF measurements. Joumal of the Electrochemical Society,r16, 266-2'1 4.
Robie, R A., Hemingway, B.S., and Fisher, J R (1978) Thermodynamicproperties of minerals and related substances at 298j5 K and 1 bar(105 pascals) and at higher temperatures. U.S Geological Survey Bul-let in 1452
Roeder, G.A., and Smeltzer, W.W (1964) The dissociation pressures ofiron-nickel oxides. Joumal ofthe Electrochemical Society, 111, 107+I 078
Rossini, F.D. (1970) Report on the Inremational Practical TemperatureScale of 1968. Journal of Chemical Thermodynamics, 2, 447459
Roth, W.A. (1929) Beitrage zur Thermochemie des Eisens, Mangans undNickels. Archiv fiir das Eisenhiittenwesen. 3.339-346.
Santander, N.H., and Kubaschewski, O (1975) The thermodynamics ofthe copper-oxygen system High Temperatures-High Pressures, 7, 573-582.
Schaefer, S.C., and McCune, R.A. (1986) Electrochemical determinationof thermodynamic properties and X-ray diffraction inyestigation of theFe,Oo-ZnFerOo system Metallurgical Transactions, l7B, 5 1 5-521.
Schwab, RG., and Kiistner, D (1981) Die Gleichgewichtsfugazidtentechnologisch und petrologisch wichtiger Sauerstoffpuffer. Neues Jahr-buch fiir Mineralogie Abhandlungen, 140, lll-142.
O'NEILL: THERMODYNAMIC DATA FOR Fe-O AND Cu-O SYSTEMS
Spencer, P.J , and Kubaschewski, O. (l 978) A thermodynamic assessmentof the iron-oxygen system. CALPHAD, 2, 141-167
Stull, D R., and Prophet, H (1971) JANAF thermochemical tables (2ndedition) U S National Bureau ofStandards, National Standard Ref-erence Data Series 37, I 141 p
Takayama, E., and Kimizuka, N. (1980) Thermodynamic properties andsubphases of wiistite field determined by means of thermogravimetricmethod in the temperature range of I 100-1300'C. Joumal ofthe Elec-trochemical Society, 127, 970-97 5.
Tretyakov, Y.D. (1967) "Thermodynamika Ferritov." Izdatel KhimiyaLeningradskoe Otdel. Leningrad, USSR
Vallet, P, and Raccah, P. (1965) Contribution e l'6tude des propri6tCsthermodynamiques du protoxyde de fer solide. M6moires Scientifiqueset Revue de Metallurgie, 62, l-29
Viktorovich, G.S., Lisovskii, D.I., and Zhaglov, V.S. (1972) Thermody-namics of the equilibrium between wiistite and metallic iron or mag-netite and the hydrogen-water gas phase. Russian Journal of PhysicalChemistry,46, 882
Worrell, W L., and Iskoe, J.L. (1973) Kinetics of oxygen transfer at theinterface between a zirconia-based electrolyte and a metal-metal oxideelectrode. In W. van Gool, Ed, Fast ion transport in solids, p. 513-521 North-Holland. Amsterdam.
MeNuscnrrr REcETvED Mev 7, 1987M,rrm;scnrsr AccEprED JeNuepv 8, 1988