Systems Analysis and Design
111
Systems Analysis Systems Analysis and Design and Design Rabie A. Ramadan Slides by Roberta M. Roth University of Northern Iowa
-
Upload
breanna-mccall -
Category
Documents
-
view
30 -
download
2
description
Systems Analysis and Design. Rabie A. Ramadan Slides by Roberta M. Roth University of Northern Iowa. Questionnaires. A set of written questions, often sent to a large number of people May be paper-based or electronic Select participants using samples of the population - PowerPoint PPT Presentation
Transcript of Systems Analysis and Design

Systems Analysis Systems Analysis and Designand Design
Rabie A. Ramadan
Slides by Roberta M. Roth University of Northern Iowa

Questionnaires
2

Questionnaires
A set of written questions, often sent to a large number of people
May be paper-based or electronic
Select participants using samples of the population
Design the questions for clarity and ease of analysis
Administer the questionnaire and take steps to get a good response rate
Questionnaire follow-up report

Good Questionnaire Design
•Begin with non-threatening and interesting questions•Group items into logically coherent sections•Do not put important items at the very end of the questionnaire•Do not crowd a page with too many items•Avoid abbreviations•Avoid biased or suggestive items or terms•Number questions to avoid confusion•Pretest the questionnaire to identify confusing questions•Provide anonymity to respondents
Document Analysis

Document Analysis
Study of existing material describing the current system
Forms, reports, policy manuals, organization charts describe the formal system
Look for the informal system in user additions to forms/report and unused form/report elements
User changes to existing forms/reports or non-use of existing forms/reports suggest the system needs modification

Observation

Observation
Watch processes being performed
Users/managers often don’t accurately recall everything they do
Checks validity of information gathered other ways
Be aware that behaviors change when people are watched
Be modest (seems to be shy)
Identify peak and lull (quite) periods

Selecting the Appropriate Requirements-Gathering Techniques
Type of informationDepth of informationBreadth of informationIntegration of informationUser involvementCostCombining techniques

Your turn
Design a Questionnaire for the project ?
Report your observations on the current projects and usabilities ?
Collect at least 5of them

The System is the Data
At the core: any system is defined by the data obtained, stored, and displayed
Data flow analysis is the center/core/key

Before we start
Evaluate the following questioner?

Context Diagram
Shows the context into which the system fits
Shows the overall business process as just one process
Shows all the outside entities that receive information from or contribute information to the system
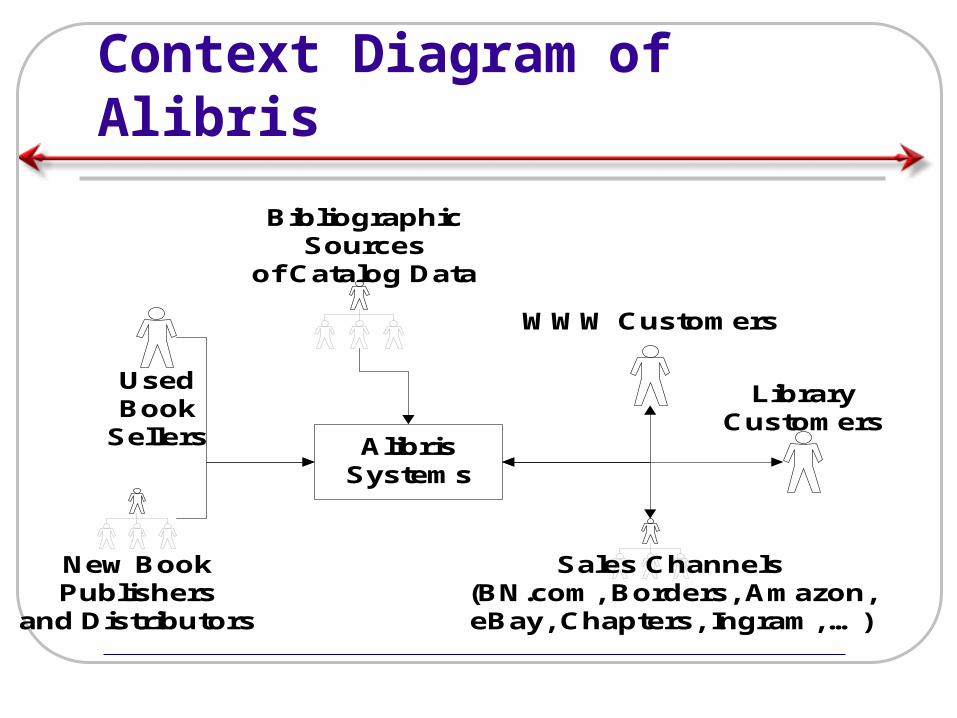
Context Diagram of Alibris
UsedBook
Sellers
BibliographicSources
of Catalog Data
WWW Customers
Sales Channels(BN.com, Borders, Amazon, eBay, Chapters, Ingram, …)
Alibris Systems
New BookPublishers
and Distributors
LibraryCustomers

Context of Quicken – 1995 (?)
Slide 15
QuickenUser
QuickenOn PC/Mac

Quicken - 2006
Slide 16
QuickenUser
QuickenOn PC/Mac
Banks
VISA/MC
BrokerageVendors
(check writing)
Your turn
Slide 17
Draw the context diagram for e-learning system ?

6 - 18
Key Definitions
Process model A formal way of representing how a business operatesIllustrates the activities that are performed and how data moves among them
Data flow diagrammingA popular technique for creating process models

6 - 19
Key Definitions
Logical process models describe processes without suggesting how they are conducted.
Physical process models include process implementation information.

6 - 20
DATA FLOW DATA FLOW DIAGRAMSDIAGRAMS

6 - 21
Reading a DFD

6 - 22
DFD Elements
ProcessAn activity or function performed for a specific business reasonManual or computerized
Data flowA single piece of data or a logical collection of dataAlways starts or ends at a process
6 - 23
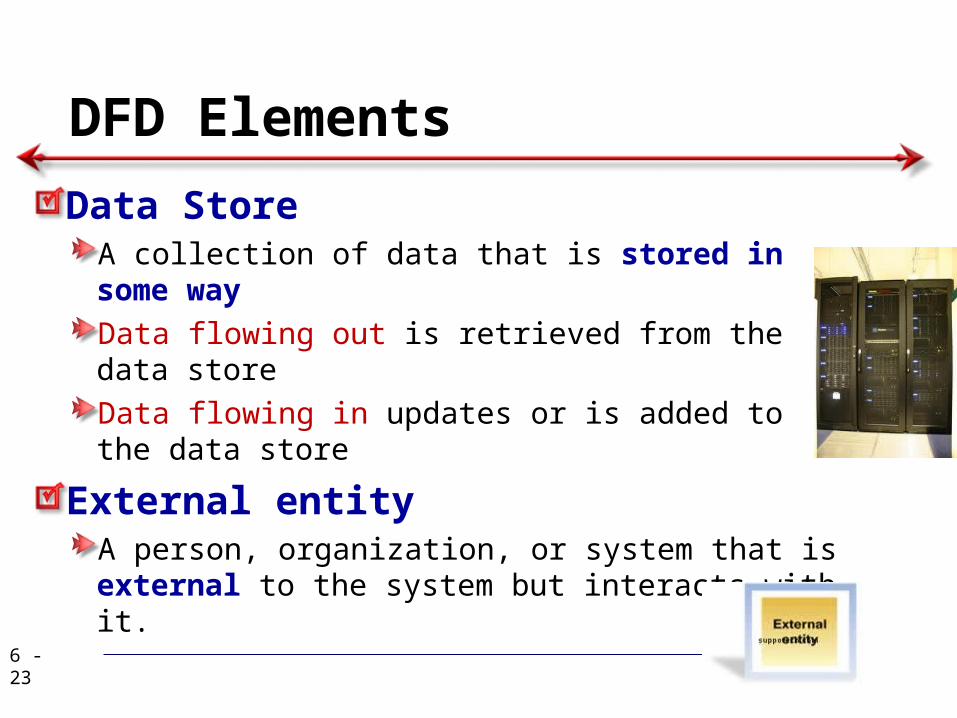
DFD Elements
Data StoreA collection of data that is stored in some wayData flowing out is retrieved from the data storeData flowing in updates or is added to the data store
External entityA person, organization, or system that is external to the system but interacts with it.

6 - 24
Naming and Drawing DFD Elements
Process
Data flow
Data store
Externalentity

6 - 25
Name the Entities of the DFD?

5 - 26
6 - 27
Depicting Business Processes with DFDs
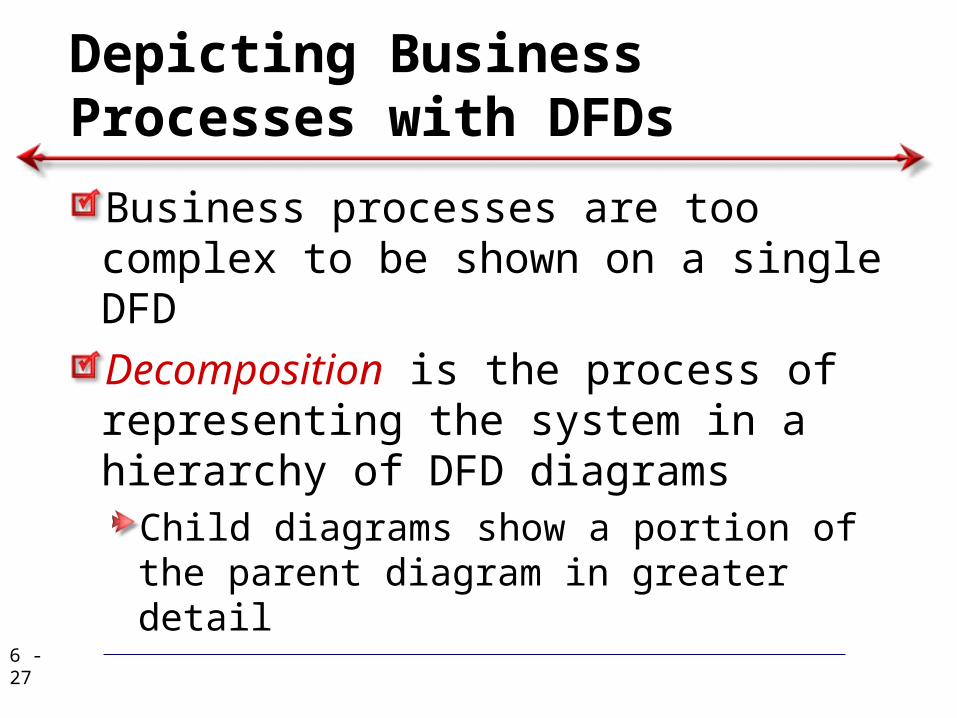
Business processes are too complex to be shown on a single DFDDecomposition is the process of representing the system in a hierarchy of DFD diagrams
Child diagrams show a portion of the parent diagram in greater detail

6 - 28
Key Definition
Balancing involves insuring that information presented at one level of a DFD is accurately represented in the next level DFD.

6 - 29
Relationship Among DFD levels
Context diagram
Level 0 diagram
Level 1 diagram
Level 2 diagram

6 - 30
Context Diagram
First DFD in every business processShows the context into which the business process fitsShows the overall business process as just one process (process 0)Shows all the external entities that receive information from or contribute information to the system
6 - 31
Level 0 Diagram
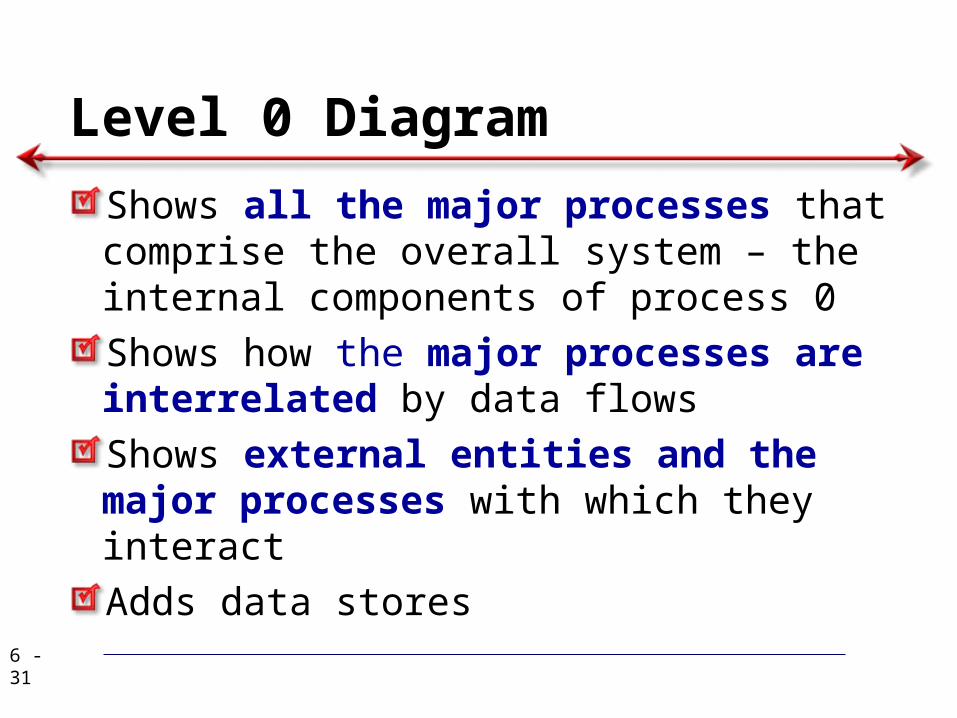
Shows all the major processes that comprise the overall system – the internal components of process 0Shows how the major processes are interrelated by data flowsShows external entities and the major processes with which they interactAdds data stores

6 - 32
Level 1 DiagramsGenerally, one level 1 diagram is created for every major process on the level 0 diagramShows all the internal processes that comprise a single process on the level 0 diagramShows how information moves from and to each of these processesIf a parent process is decomposed into, for example, three child processes, these three child processes wholly and completely make up the parent process

6 - 33
Level 2 Diagrams
Shows all processes that comprise a single process on the level 1 diagramShows how information moves from and to each of these processesLevel 2 diagrams may not be needed for all level 1 processesCorrectly numbering each process helps the user understand where the process fits into the overall system

6 - 34
Data Flow Splits and Joins
A data flow split shows where a flow is broken into its component parts for use in separate processesData flow splits need not be mutually exclusive nor use all the data from the parent flowAs we move to lower levels we become more precise about the data flowsA data flow join shows where components are merged to describe a more comprehensive flow

6 - 35
Alternative Data Flows
Where a process can produce different data flows given different conditions
We show both data flows and use the process description to explain why they are alternatives
Tip -- alternative data flows often accompany processes with IF statements

Your Turn
At this point in the process it is easy to lose track of the “big picture”.
Describe the difference between data flows, data stores, and processes.
Describe in your own words the relationship between the DFD and the ultimate new application being developed.

6 - 37
Process Descriptions
Text-based process descriptions provide more information about the process than the DFD alone
If the logic underlying the process is quite complex, more detail may be needed in the form of
Structured EnglishDecision treesDecision tables

6 - 38
Structured EnglishCommon Statements Example
Action Statement Profits = Revenues - Expenses Generate Inventory Report Add Product record to Product Data Store
If Statement IF Customer Not in Customer Data Store THEN Add Customer record to Customer Data Store ELSE Add Current Sale to Customer’s Total Sales Update Customer record in Customer Data Store
For Statement FOR all Customers in Customer Data Store, do Generate a new line in the Customer Report Add Customer’s Total Sales to Report Total
Case Statement CASEIf Income < 10,000: Marginal tax rate = 10%If Income < 20,000: Marginal tax rate = 20%If Income < 30,000: Marginal tax rate = 31%If Income < 40,000: Marginal tax rate = 35%ELSE Marginal tax rate = 38%
ENDCASE
6 - 39
Decision Trees
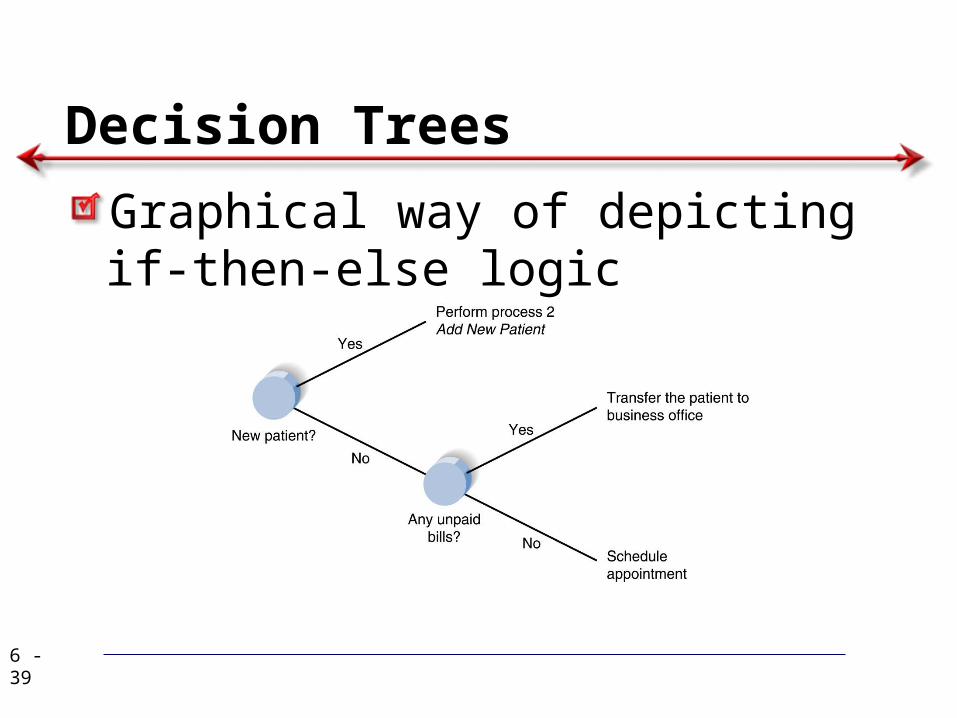
Graphical way of depicting if-then-else logic

6 - 40
Decision Tables
Represent very complex processes with multiple decision rules

Explain the following decision tree ? When should I take a decision not to buy?
5 - 41

6 - 42
CREATING DATA CREATING DATA FLOW DIAGRAMSFLOW DIAGRAMS

6 - 43
Integrating Scenario Descriptions
DFDs start with the use cases and requirements definitionGenerally, the DFDs integrate the use casesNames of use cases become processesInputs and outputs become data flows“Small” data inputs and outputs are combined into a single flow

5 - 44
Use Case AnalysisUse Case Analysis

5 - 45
Key IdeasUse cases are a text-based method of describing and documenting complex processesUse cases add detail to the requirements outlined in the requirement definitionSystems analysts work with users to develop use casesSystems analysts develop process and data models later based on the use cases
5 - 46
Role of Use Cases
A use case is a set of activities that produce some output resultDescribes how the system reacts to an event that triggers the systemTrigger -- event that causes the use case to be executedEvent-driven modeling – everything in the system is a response to some triggering event

5 - 47
Role of Use Cases
All possible responses to the event are documented
Use cases are helpful when the situation is complicated
5 - 48
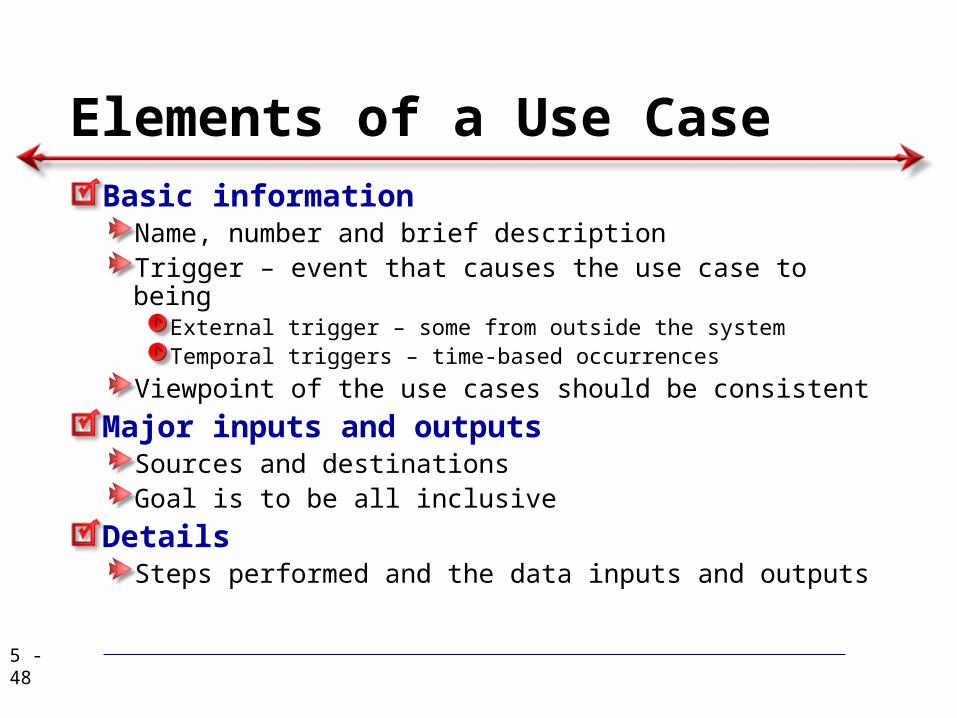
Elements of a Use CaseBasic information
Name, number and brief descriptionTrigger – event that causes the use case to being
External trigger – some from outside the systemTemporal triggers – time-based occurrences
Viewpoint of the use cases should be consistent
Major inputs and outputsSources and destinationsGoal is to be all inclusive
DetailsSteps performed and the data inputs and outputs

Sample Use Case

5 - 50
Building Use CasesBuilding Use Cases

5 - 51
Process of Developing Use Cases
Identify the major use casesIdentify the major steps within each use caseIdentify elements within stepsConfirm the use caseCycle through the above steps iteratively

5 - 52
Step 1 – Identify the major use cases
Activities Typical Questions Asked•Start a use case form for each use case
•If more than nine, group into packages
•Ask who, what, and where about the tasks and their inputs and outputs:
•What are the major tasks performed?
•What triggers this task? What tells you to perform this task?
•What information/forms/reports do you need to perform this task?
•Who gives you these information/forms/reports?
•What information/forms/reports does this produce and where do they go?

5 - 53
Step 2 - Identify the major steps within each use case
Activities Typical Questions Asked•For each use case, fill in the major steps needed to process the inputs and produce the outputs
•Ask how about each use case:
•How do you produce this report?
•How do you change the information on the report?
•How do you process forms?
•What tools do you use to do this step (e.g., on paper, by email, by phone)?

5 - 54
Step 3 – Identify elements within steps
Activities Typical Questions Asked•For each step, identify its triggers and its inputs and outputs
•Ask how about each step
•How does the person know when to perform this step?
•What forms/reports/data does this step produce?
•What forms/reports/data does this step need?
•What happens when this form/report/data is not available?
5 - 55
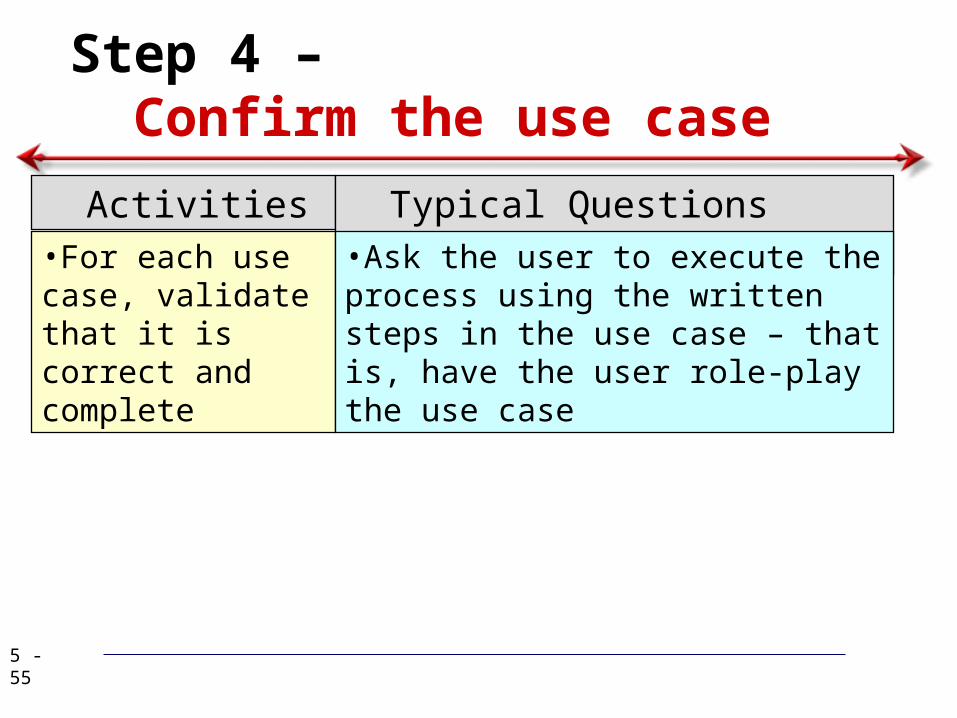
Step 4 – Confirm the use case
Activities Typical Questions Asked•For each use case, validate that it is correct and complete
•Ask the user to execute the process using the written steps in the use case – that is, have the user role-play the use case


5 - 60
Summary
Use cases contain all the information needed for process modeling, but are easier for users to comprehendUse cases are created in an iterative cycle of steps until they are considered accurate and complete

Some of the Use Cases to work on
Registration Use Cases
Grades recording Use Case
Uploading lectures Use Case
Exams Use Case5 - 61

6 - 62
Steps in Building DFDs
Build the context diagramCreate DFD fragments for each use caseOrganize DFD fragments into level 0 diagramDecompose level 0 processes into level 1 diagrams as needed; decompose level 1 processes into level 2 diagrams as needed; etc.Validate DFDs with user to ensure completeness and correctness

6 - 63
Build the Context Diagram
Draw one process representing the entire system (process 0)Find all inputs and outputs listed at the top of the use cases that come from or go to external entities; draw as data flowsDraw in external entities as the source or destination of the data flows

6 - 64
A Context Diagram Example

6 - 65
Creating DFD Fragments
Each use case is converted into one DFD fragmentNumber the process the same as the use case numberChange process name into verb phraseDesign the processes from the viewpoint of the organization running the system

6 - 66
Creating DFD Fragments
Add data flows to show use to data stores as sources and destinations of dataLayouts typically place
processes in the centerinputs from the leftoutputs to the rightstores beneath the processes

6 - 67
A DFD Fragment Example

6 - 68
Creating the Level 0 Diagram
Combine the set of DFD fragments into one diagramGenerally move from top to bottom, left to rightMinimize crossed linesIterate as needed
DFDs are often drawn many times before being finished, even with very experienced systems analysts

6 - 69
A Level 0 DFD Example

6 - 70
Creating Level 1 Diagrams (and Below)
Each use case is turned into its own DFDTake the steps listed on the use case and depict each as a process on the level 1 DFDInputs and outputs listed on use case become data flows on DFDInclude sources and destinations of data flows to processes and stores within the DFDMay also include external entities for clarity
6 - 71
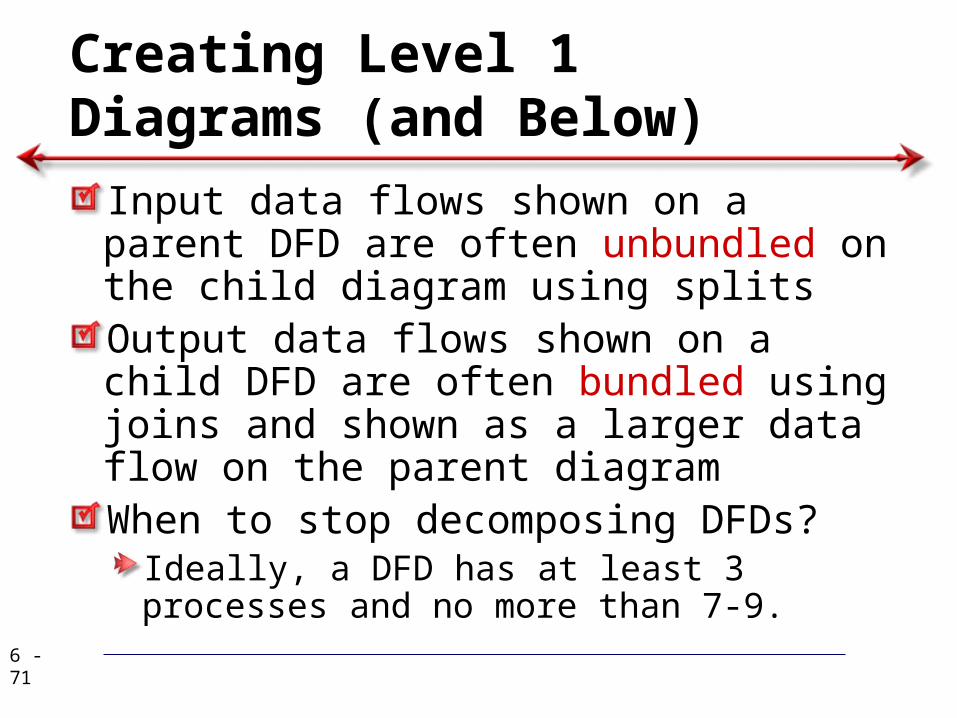
Creating Level 1 Diagrams (and Below)
Input data flows shown on a parent DFD are often unbundled on the child diagram using splitsOutput data flows shown on a child DFD are often bundled using joins and shown as a larger data flow on the parent diagramWhen to stop decomposing DFDs?
Ideally, a DFD has at least 3 processes and no more than 7-9.

6 - 72
Validating the DFD
Syntax errors – diagram follows the rulesAssure correct DFD structure
For each DFD:Check each process for:
A unique name: action verb phrase; number; descriptionAt least one input data flowAt least one output data flowOutput data flow names usually different than input data flow namesBetween 3 and 7 processes per DFD
6 - 73
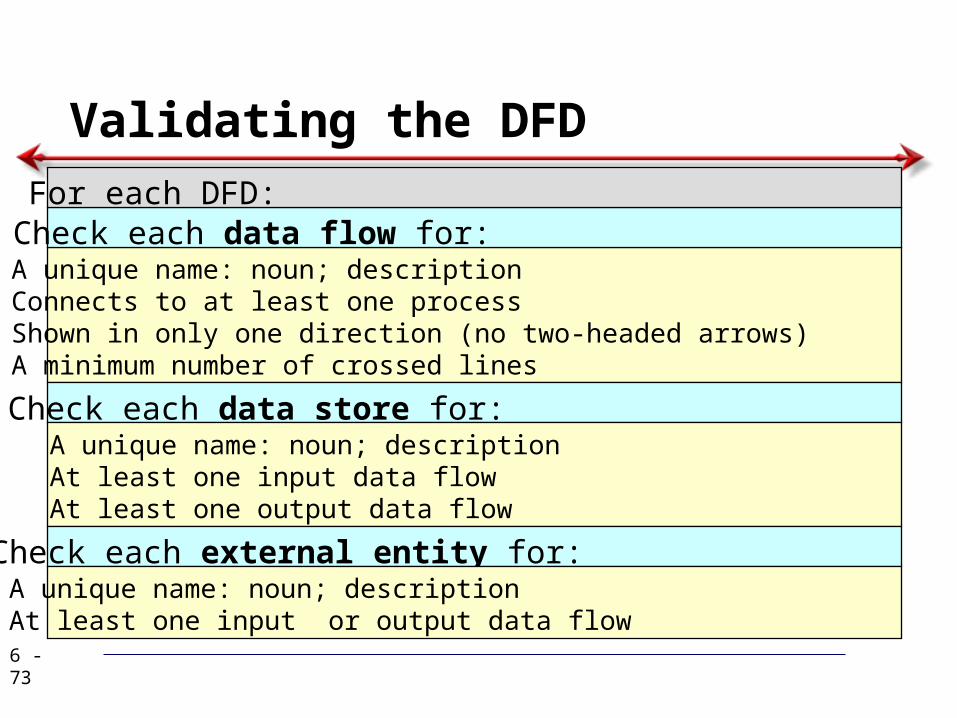
Validating the DFDFor each DFD:Check each data flow for:A unique name: noun; descriptionConnects to at least one processShown in only one direction (no two-headed arrows)A minimum number of crossed lines
Check each data store for:A unique name: noun; descriptionAt least one input data flowAt least one output data flow
Check each external entity for:A unique name: noun; descriptionAt least one input or output data flow

6 - 74
Validating the DFDAcross DFDs:Context Diagram:Every set of DFDs must have one Context DiagramViewpoint:
There is a consistent viewpoint for the entire set of DFDsDecomposition:
Every process is wholly and complete described by the processes onits children DFDsBalance:
Every data flow, data store, and external entity on a higher level DFD is shown on the lower level DFD that decomposes itNo data stores or data flows appear on lower-lever DFDs that do not appear on their parent DFD

6 - 75
Validating the DFD
Semantics errors – diagram conveys correct meaning
Assure accuracy of DFD relative to actual/desired business processes
To verify correct representation, useUser walkthroughsRole-play processes
Examine lowest level DFDs to ensure consistent decompositionExamine names carefully to ensure consistent use of terms

6 - 76
Summary
The Data Flow Diagram (DFD) is an essential tool for creating formal descriptions of business processes.Use cases record the input, transformation, and output of business processes and are the basis for process models.Eliciting use cases and modeling business processes are critically important skills for the systems analyst to master.

When databases are used , we need schema
translation ?
5 - 77

78
Schema Translation

79
Extended Entity Relationship(EER) Model
The ER model has been widely used but does not have some shortcomings.
It is difficult to represent cases where an entity may have varying attributes dependent upon some property.
ER model has been extended into Extended Entity Relationship model
It includes more semantics such as generalization, categorization and aggregation.
80
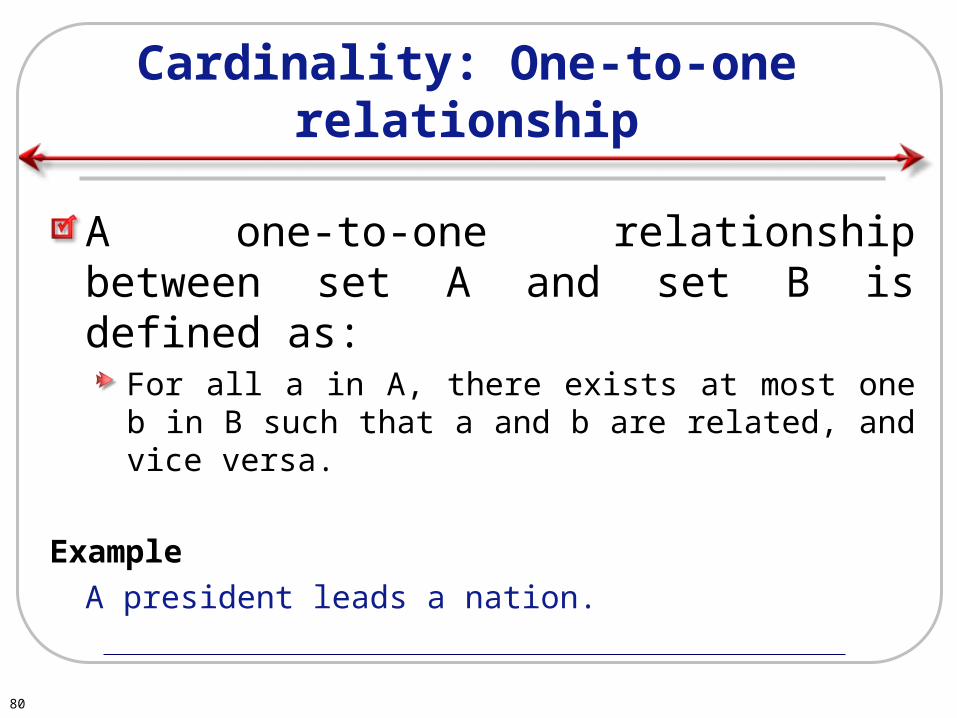
Cardinality: One-to-one relationship
A one-to-one relationship between set A and set B is defined as:
For all a in A, there exists at most one b in B such that a and b are related, and vice versa.
Example
• A president leads a nation.

81
Cardinality: One-to-one relationship
Relational Model:Relation President (President_name, Race, *Nation_name) Relation Nation (Nation_name, Nation_size) Where underlined are primary keys and "*" prefixed are foreign keys
Extended Entity Relationship model

82
In Election System : One-to-one relationship !!!!!
Person and ID
Persons’ and Vote
Judge and Box
Username and Person

83
Cardinality: Many-to-one relationship
A many-to-one relationship from set A to set B is defined as:
For all a in A, there exists at most one b in B such that a and b are related,
and for all b in B, there exists zero or more a in A such that a and b are related.
Example A director directs many movies.

84
Cardinality: Many-to-one relationship
Relational Model:Relation Director (Director_name, Age) Relation Movies (Movie_name, Sales_volume, *Director_name)
Extended entity relationship model:

85
In Election System : many to one relationship !!!!
Box and judge
President position and candidates
Candidate and votes
Candidate and position
86
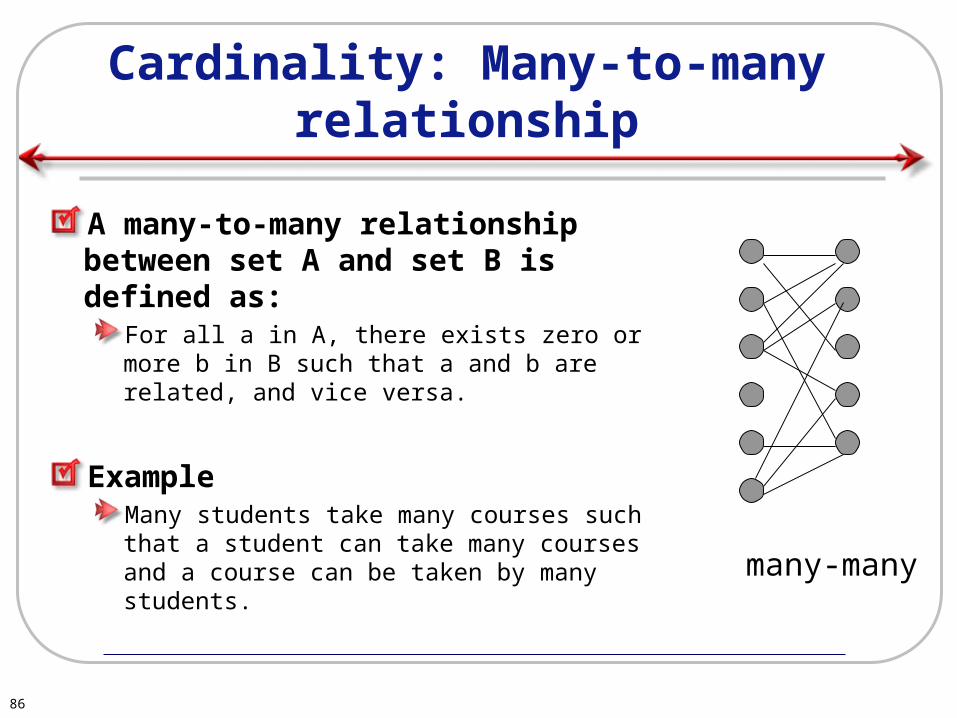
Cardinality: Many-to-many relationship
A many-to-many relationship between set A and set B is defined as:
For all a in A, there exists zero or more b in B such that a and b are related, and vice versa.
ExampleMany students take many courses such that a student can take many courses and a course can be taken by many students.
many-many

87
Cardinality: Many-to-many relationship
Relational Model:Relation Student (Student_id, Student_name) Relation Course (Course_id, Course_name) Relation take (*Student_id, *Course_id)
Extended entity relationship model:

88
In Election System : many to many relationship !!!!
Boxes and judges at the same place
Security table contains many user names and passwords for many persons

89
Data Semantic: Is-a (Subtype) relationship
The relationship A isa B is defined as: A is a special kind of B.
ExampleFather is Male.

90
Data Semantic: Is-a (Subtype) relationship
Relational Model:Relation Male (Name, Height) Relation Father (*Name, Birth_date)
Extended entity relationship model

91
Data Semantic: Disjoint Generalization
The process of generalization is to classify similar entities into a single entity.
More than one isa relationship can form data abstraction (i.e. superclass and subclasses) among entities.
A subclass entity is a subset of its superclass entity.
There are two kinds of generalization. The first is disjoint generalization such that subclass entities are mutually exclusive.
The second is overlap generalization such that subclass entities can overlap each other.
Example of Disjoint GeneralizationA refugee and a non-refugee can both be a boat person, but a refugee cannot be a non-refugee, and vice versa.

92
Data Semantic: Disjoint Generalization
Relational Model:Relation Boat_person (Name, Birth_date, Birth_place) Relation Refugee (*Name, Open_center) Relation Non-refugee (*Name, Detention_center)
Extended entity relationship model:

93
Data Semantic: Overlap Generalization
Example of Overlap Generalization
A computer programmer and a system analyst can both be a computer professional, and a computer programmer can also be a system analyst, and vice versa.

94
Data Semantic: Overlap Generalization
Relational Model:Relation Computer_professional (Employee_id, Salary) Relation Computer_programmer (*Employee_id, Language_skill) Relation System_analyst (*Employee_id, Application_system)
Extended entity relationship model:

95
Data Semantic: Categorization Relationship
In cases the need arises for modeling a single superclass/subclass relationship with more than one superclass(es), where the superclasses represent different entity types.
In this case, we call the subclass a category.

96
Data Semantic: Categorization Relationship
Relational Model:Relation Department (Borrower_card, Department_id) Relation Doctor (Borrower_card, Doctor_name) Relation Hospital (Borrower_card, Hospital_name) Relation Borrower (*Borrower_card, Return_date, File_id)
Extended Entity Relationship Model

97
Data Semantic: Aggregation Relationship
Aggregation is a method to form a composite object from its components.
It aggregates attribute values of an entity to form a whole entity.
Example The process of a student taking a course can form a composite entity (aggregation) that may be graded by an instructor if the student completes the course.

98
Data Semantic: Aggregation Relationship
Relational Model:Relation Student (Student_no, Student_name) Relation Course (Course_no, Course_name) Relation Takes (*Student_no, *Course_no, *Instructor_name) Relation Instructor (Instructor_name, Department)
Extended Entity Relationship Model

99
Data Semantic: Total Participation
An entity is in total participation with another entity provided that all data occurrences of the entity must participate in a relationship with the other entity.
Example An employee must be hired by a department.

100
Data Semantic: Total Participation
Relational Model:Relation Department (Department_id, Department_name) Relation Employee (Employee_id, Employee_name, *Department_id)
Extended entity relationship model:

101
Data Semantic: Partial Participation
An entity is in partial participation with another entity provided that the data occurrences of the entity are not totally participate in a relationship with the other entity.
Example
An employee may be hired by a department.

102
Data Semantic: Partial Participation
Relational Model:Relation Department (Department_id, Department_name) Relation Employee (Employee_no, Employee_name, &Department_id)
Where & means that null value is allowed
Extended entity relationship model:

103
Data Semantic: Weak Entity
The existence of a weak entity depends on its strong entity.
ExampleA hotel room must concatenate hotel name for identification.

104
Data Semantic: Weak Entity
Relational Model:Relation Hotel (Hotel_name, Ranking) Relation Room (*Hotel_name, Room_no, Room_size)
Extended entity relationship model

105
Cardinality: N-ary Relationship
Multiple entities relate to each other in an n-ary relationship.
Example Employees use a wide range of different skills on each project they are associated with.

106
Cardinality: N-ary Relationship
Relational Model:Relation Engineer (Employee_id, Employee_name) Relation Skill (Skill_name, Years_experience) Relation Project (Project_id, Start_date, End_date) Relation Skill_used (*Employee_id, *Skill_name, *Project_id)
Extended entity relationship model:

107
Example
Drinkers addrname
Beers
manfname
Bars
name
license
addr
Note:license =beer, full,none
Sells Bars sell somebeers.
LikesDrinkers likesome beers.Frequents
Drinkers frequentsome bars.
Example
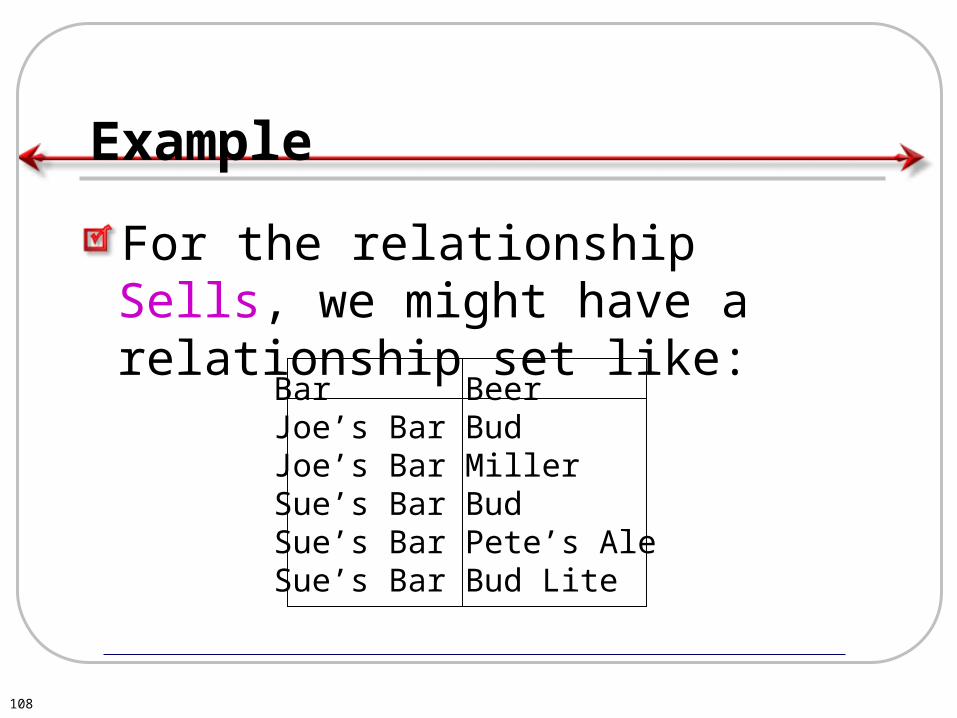
108
For the relationship Sells, we might have a relationship set like:
Bar BeerJoe’s Bar BudJoe’s Bar MillerSue’s Bar BudSue’s Bar Pete’s AleSue’s Bar Bud Lite

Example
109
Bars Beers
Drinkers
name nameaddr manf
name addr
license
Preferences

A Typical Relationship Set
110
Bar Drinker BeerJoe’s Bar Ann MillerSue’s Bar Ann BudSue’s Bar Ann Pete’s AleJoe’s Bar Bob BudJoe’s Bar Bob MillerJoe’s Bar Cal MillerSue’s Bar Cal Bud Lite

111
Your Assignment Build Entity-relationship model
Relation Order (Order_code, Order_type, Our_reference, Order_date, Approved_date, *Head, *Supplier_code)Relation Supplier (Supplier_code, Supplier_name)Relation Product (Product_code, Product_description)Relation Department (Department_code, Department_name)Relation Head (Head, *Department_code, Title)Relation Order_Product (*Order_code, *Product_code, Qty, Others, Amount)Relation Note (*Order_code, Sequence#, Note)
where underlined are primary keys and prefixed with ‘*’ are foreign keys.