
The Urinary System Chapter 18. Overview of Urinary Anatomy Play Urinary Anatomy movie.

Systematic Screening for AbnormalUrinary Constituents
D. S. Young
A scheme is described for the systematic screening for amino acids and sugars inurine. High-voltage electrophoresis is used to separate amino acids, and thin-layerchromatographyis used for sugar separation. In each case the separated constituentsare stained and scanned in a densitometer, and a profile is constructed for comparisonagainst normal profiles.
A SAMPLE OF URINE is usually obtained for analysis in the laboratorywhen a patient is admitted to the hospital.The conventional examina-
tion consists of measurement of specific gravity and pH; microscopicexamination for cells, casts, and other formed elements; and examina-tion for glucose, protein, ketones, and hemoglobin by a simple dipstickprocedure. In many instances, the urine is not collected with enough
care to prevent spurious findings, and consequently the value ofscreening may be lost. If it is performed carefully, routine urinalysisis of value in the detection of diabetes, diseases of the kidneys andurinary tract, certain diseases of the liver, and metabolic disorders.
Using the conventional procedures for urinalysis, we investigatedthe incidence of abnormal findings in urine samples obtained from 460patients within 3 days of each patient’s admission to the hospital. One-third of the urine samples showed some abnormality. Both chemicaland microscopic examinations are required to detect all abnormalsamples as depicted in Table 1. As none of the samples was obtainedunder controlled conditions, the specific gravity and pH values wereignored. Cell counts of less thaim 5 per high-power field (hpf) werenot considered as abnormal. Examination for urinary bile pigments
was included when this was specifically requested. The abnormal find-ings are illustrated in Table 2. The number and variety of abnormal
From the Clinical Chemistry Service, Clinical Pathology Department, Clinical Center, Na.tional Institutes of Health, Bethesda, Md. 20014.
Presented at the Symposium on Urinary Constituents of Low Molecular Weight, Oak RidgeNational Laboratory, Oak Ridge, Tenn., Nov. 30-Dec. 1, 1967.
The author thanks Mrs. Jean Epley and Mrs. Agathe Jackson for their skillful performanceof the experimental work.
418
Dow
nloaded from https://academ
ic.oup.com/clinchem
/article/14/5/418/5674695 by guest on 05 Decem
ber 2021
Vol. 14, No. 5, 1968 ABNORMAL URINARY CONSTITUENTS 419
Table 1. FREQUENCY OF AItNORMAL FINDINGS IN URINE
Re0u1t3 No.
No abnormal findings 307
Abnormal findings
Abnormal chemical; normal microscopic 73*Abnormal microscopic; normal chemical 37Abnormal chemical & microscopic 43
TOTAL 460
* Includes 18 on which no microscopic examination performed.
Table 2. FREQUENCY OF ABNORMAL FINDINGS IN 460 SAMPLES FOR ROUTINE URINALYSIS
Parameter No. Parameter No.
Protein Hemoglobin
Trace 2 Slight 15
+ 31 Moderate 7++ 10 Marked S
+ + + 6 Red blood cells++++ 2 6-l0/hpf 11
Glucose 11-20/hpf 6Trace 9 21-40/hpf 3
+ 11 Many 6++ 3 White blood cells
+++ 4 6-lO/hpf 28
2 ll-20/hpf 16
Ketones 21-40/hpf 2Trace 13 Many 5
Positive 9 Bacteria
Bile Few 4Trace 5 Moderate 8
Positive 4 Many 9
findings will differ from hospital to hospital. The number may begreater in the Clinical Center because the number of patients with minorillnesses seen here is small; on the other hand, the number of patientswith renal disease or diabetes mellitus is low. The incidence of ab-normal findings in a nonhospitalized population is less. For example,
Butterfield (1) in a survey for diabetes mellitus in an adult city popu-lation found glycosuria in 4% of the inhabitants, compared with 6.3%in our series.
The reaction of ferric chloride with urinary constituents has beenused as a screening test for several inborn errors of metabolism (2). In
this laboratory the test yielded abnormal colors in 102 of 700 successivespecimens for routine urinalysis (not necessarily obtained from recentlyadmitted patients). The reaction yielded a green color with 13 samples,but it was not possible to identify phenylpyruvic acid in these urinesby other procedures. In most samples the color produced varied from
Dow
nloaded from https://academ
ic.oup.com/clinchem
/article/14/5/418/5674695 by guest on 05 Decem
ber 2021

420 YOUNG Clinical Chemistry
red to brown and could be attributed to drug metabolites. The ferricchloride test lacks sensitivity and specificity, and could be replacedby more specific procedures in any screening program.
Most of the current screening tests have a disease-specific orienta-tion. It is logical to extend their scope to investigation of alteredmetabolism. Disorders of protein and carbohydrate metabolism fre-quently cause the excretion of abnormal quantities of amino acids andsugars in the urine. Methods now are available for the separation and
identification of these compounds. Because of the large number ofsamples to be investigated in the clinical laboratory, the proceduresshould be simple and rapid, requiring minimal preparation of theurine. The results should be reproducible and the methods sufficientlysensitive that no falsely negative results are produced. For optimumefficiency, the tests should have the potential for automation.
Quantitation of amino acids or sugars is not an essential require-ment of a screening procedure, but any screening program should becapable of producing a pattern or profile as a pernmanent record fromeach of the samples which may be received from newly admitted pa-tients each day. The profiles may be compared with those from normalurines. The screening procedure should reduce to a minimum thenumber of samples which require detailed examination with quantita-tion of the constituents present, e.g., by amino acid or carbohydratecolumn-chromatographic systems.
Investigation of Aminoaciduria
Dent (3) introduced paper chromatography for the investigation ofaminoaciduria. His procedure was slow, since unidimensional chroma-tography gave inadequate separation of spots, and bidimensional sep-aration required 3 days. Chromatography of amino acids on thin layersyields better separation because a smaller volume of urine may be
used, which causes less diffusion of spots; in addition, the time forseparation is much less (4). High-voltage electrophoresis on paper (5)
and on a thin layer of cellulose and silica gel (6) has been used toincrease the speed of separation and improve resolution of amino acids.Densitometry of ninhydrin-stained paper strips has been used to con-struct a profile of amino acids in the urine (7). We have used a methodin which 8 different samples may be applied to a single thin-layer
sheet, and the amino acids stained with ninhydrin following separationby high-voltage electrophoresis.
Pure amino acids (Sigma Chemical Company) were dissolved informic acid-acetic acid buffer to give 0.01 M standard solutions. Seven
Dow
nloaded from https://academ
ic.oup.com/clinchem
/article/14/5/418/5674695 by guest on 05 Decem
ber 2021

Vol. 14. No. 5, 1968 ABNORMAL URINARY CONSTITUENTS 421
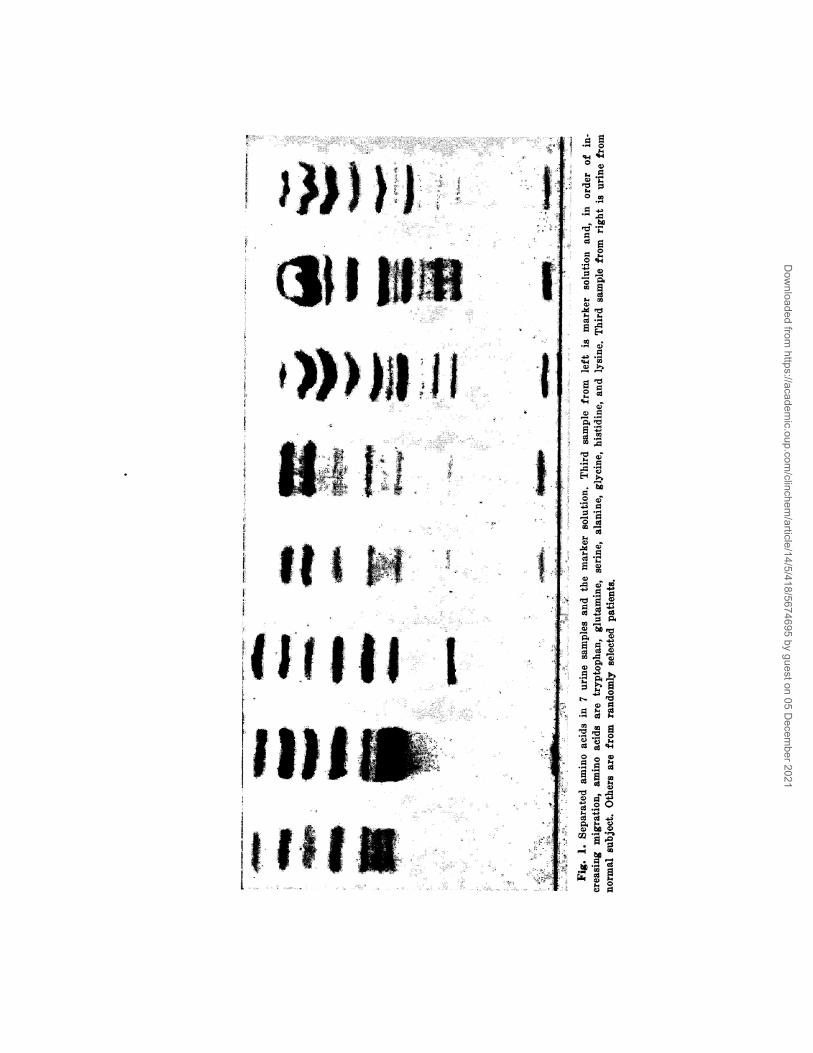
of the amino acids (tryptophan, glutamine, serine, alanine, lysine, gly-cine, and histidine) were combined into a single marker solution whichwas routinely used both as a reference for the migration of the aminoacids on electrophoresis and for quantitation by densitometry.
Electrophoresis was performed on a Camag high-voltage apparatuscooled to 15#{176}.Samples were applied to 20 X 20 cm. Polygram sheets ofcellulose MN 300 (Macherey, Nagel Co.) approximately 0.1 mm. thick.Of each urine sample, 1.25 was applied as a streak 1.0 cm. long and3.0 cm. from the anode end of the sheet. Eight samples, one of which
was the marker, were applied to each sheet. Electrophoresis wascarried out in 5.0% formic acid-acetic acid buffer (pH 2.0) for 10 mm.at 1500 v, which caused glycine to travel approximately 7 cm. Thesheets were moistened with the same buffer to which ninhydrin hadbeen added to a concentration of 0.2%. This permitted the color of theamino acid-ninhydrin complex to develop as the sheets were dried bya hot-air fan. Figure 1 illustrates the typical separation of amino acidsin 7 urine samples and the marker solution. Many of the amino acidbands show slight irregularities which were not eliminated by de-proteinization with picric acid, or deproteinization and desalting byextraction into acidified butanol.
Scanning of the stained sheets was performed on the plate-scanningattachment of the Aminco-Bowman spectrophotofluorometer linked toa Sargent SRL recorder with disc integrator. A typical profile from anormal urine sample is illustrated in Fig. 2, which also shows theprofile derived from the combined marker solution, as well as profilesfrom urine samples of patients with cystinuria and a neuromusculardisorder of unknown etiology. As amino acids do not react uniformlywith ninhydrin, it is not possible to obtain an absolute result for theexcretion of each amino acid from the integration count. There is alsoa background coloration in the profile, which masks many individualamino acids, caused by the more than 100 ninhydrin-reacting con-stituents known to be present in urine (8). The profile also shows somenoise produced by irregularities in the thin cellulose layer allowingvariable transmission of light.
The amino acid excretion throughout a day is almost constant (9).Therefore a random sample of urine may be used for determination of
the amino acid profile. When 1.25 4a1. of urine was spotted, as many as11 bands were seen in normal urine samples depending on their con-centration. When greater quantities of urine were applied, there wasloss of resolution between bands unless the urine sample was very dilute.In this pilot study no attempt was made to vary the volume of sampleapplied with its concentration. The identity of bands was established
Dow
nloaded from https://academ
ic.oup.com/clinchem
/article/14/5/418/5674695 by guest on 05 Decem
ber 2021
I0
ciii L111 t
II 111#{182}I
1111111;.2 #{176}
1iII
Dow
nloaded from https://academ
ic.oup.com/clinchem
/article/14/5/418/5674695 by guest on 05 Decem
ber 2021

B
C
D
Vol. 14. No. 5, 1968 ABNORMAL URINARY CONSTITUENTS 423
Fig. 2. Amino acid profiles.
A. Marker solution. B. Normal
urine. C. Urine from patient
with neuromuscular disorder.
D. Urine from patient with
cystinuria: first large peak is
cystine and the last is due to
arginine and ornithine.
Dow
nloaded from https://academ
ic.oup.com/clinchem
/article/14/5/418/5674695 by guest on 05 Decem
ber 2021

424 YOUNG Clinical Chemistry
by comparison with the migration of the known amino acids in themarker solution, with allowances made for the different migration ofamino acids in pure solution (10), and from the relative migrationdistances of the most prominent spots.
Investigation of Peptiduria
Acid hydrolysis of urine at 100#{176}causes breakdown of peptides intotheir constituent amino acids. Less than half the total amino acidexcretion is in the free form (11). Most of the urinary aspartic andglutamic acids, proline, valine, and leucine can be identified only afterhydrolysis. Hydrolysis also liberates glycine and glutamine from thebreakdown of hippuric acid and phenylacetic acid, respectively.
There is an increased excretion of peptides in the urine of patientswith burns, liver necrosis, and cirrhosis. Leukemia, malignant disease,muscular dystrophy, and nephrosis have also been associated withincreased excretion of peptides (12). While hydrolysis does not give any
indication of the structure of the peptides destroyed, high-voltageelectrophoresis following hydrolysis may be used to show which aminoacids were present as constituents of peptides or were bound to otherurinary constituents.
Investigation of Mellituria
Sugars may be separated by electrophoresis or chromatographywithout preliminary preparation of urine. Electrophoresis on paperhas been used for rapid separation of sugars (13) but has not beenwidely used on thin layers. Chromatographic separation of glucosefrom other sugars, normally present in urine at lower concentrations,is difficult. The different chemical properties of the sugars renderdensitometry difficult.
Two chromatographic procedures on thin layers were used for theseparation of urinary sugars. In one, commercially prepared plates ofsilica gel G with fluorescent indicator were used with isopropanol:butanol:water (140:20:40) as solvent, which produced a 6.0-cm. solventmigration in 2 hr. In the second procedure, sodium acetate-bufferedkieselguhr G or Celite (Johns-Manville Company) plates were pre-pared, and ethyl acetate :isopropanol :water (65 :23.5 :11.5) was used assolvent (14). This produced a 10-cm. migration in 1 hr. Nine urinesamples and a marker solution, containing sugars known to occur in
urine, were applied as streaks of 1.0 cm. length to each plate; asample was used.
When densitometry was performed, the location reagent consisted
Dow
nloaded from https://academ
ic.oup.com/clinchem
/article/14/5/418/5674695 by guest on 05 Decem
ber 2021

Vol. 14, No. 5, 1968 ABNORMAL URINARY CONSTITUENTS 425
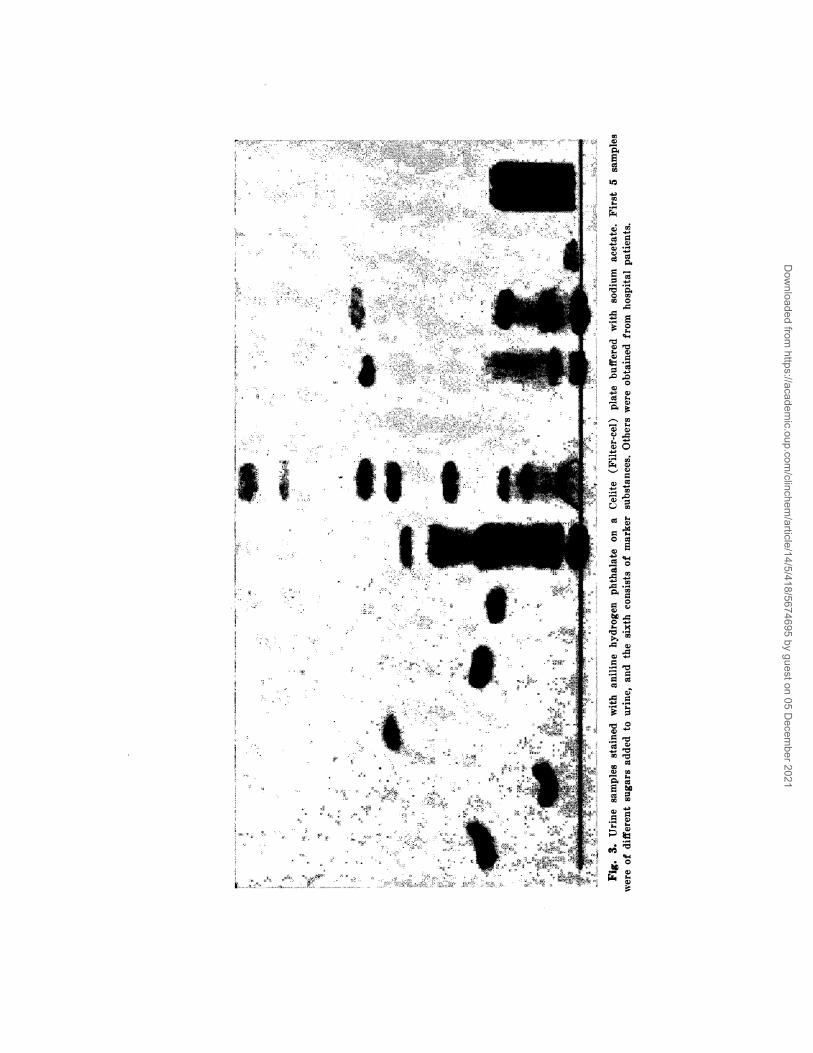
of resorcinol in concentrated HC1 and 5% (w/v) aniline hydrogenphthalate in glacial acetic acid. The quenching of the background
fluorescence was recorded. The extent of quenching was not the samefor all sugars. The characteristic colors given by anisaldehyde insulfuric acid on the Celite plates were used as aids in the confirmationof the identity of the sugars. Figure 3 shows the separation of sugars
in 9 different urine samples and the marker solution on a silica gel
plate when aniline hydrogen phthalate was used as the location reagent.
Application of Procedures
These procedures have been developed for routine screening of urine.
We believe that they are meaims of investigating abnormal metabolismon a routine basis which are not available with current blood- or urine-screening procedures. However, they will not replace chemical analysesof blood serum or the conventional urine-screening procedures. We aredeveloping additional methods for urine screening before commencinga study to assess the usefulness of comprehensive urine screening.
The purpose of the screening system is not to identify all the membersof any one class of chemicals in the urine, but to pinpoint those sampleswhich should be examined in detail. The screening procedures requireminimum sample preparation and are sufficiently simple and rapidthat all the samples received from patients on admission to the ClinicalCeimter (about 20 per day) can be processed by one technologist in halfa day. When it is felt necessary to identify abnormal constituents,bidimensional separation technics may be used. When quantitation isnecessary, specific column technics may be used, but these procedures
involve much more time and skill and could not be used as routine pro-cedures. The scheme we envisage for urine examination is shown inFig. 4.
All urine specimens obtained from newly admitted patients areprocessed through an apparatus which collects the formed elements forquantitative microscopy. Tile conventional dipstick tests are performedon the filtrate, which is also used for chromatography and electro-phoresis for detection of the constituents of specific chemical classes.
Bidimensional separation procedures-either 2-dimensional chroma-tography, or electrophoresis in one direction with chromatography ina second-may be used with different location reagents to confirm theidentity of abnormal constituents. Specific chemical or microbiologicprocedures may be used to measure the concentration of individualconstituents when appropriate methods are available. The column-chromatographic systems are used to quantitate many different con-
Dow
nloaded from https://academ
ic.oup.com/clinchem
/article/14/5/418/5674695 by guest on 05 Decem
ber 2021
4
I
I
SClU,
#{149}1U,
w-
U,- ,..C) C)
is.I 0Cl
0)
UI
0
C)
.0
0
00
A00
‘C) U)
U) W
.0
be0.- C)
Dow
nloaded from https://academ
ic.oup.com/clinchem
/article/14/5/418/5674695 by guest on 05 Decem
ber 2021

Vol. 14, No. 5, 1968 ABNORMAL URINARY CONSTITUENTS 427
stituents J)c]ongillg to the sonic ciass of clieniicals, e.g., earbohy(lrates,
amino acids, or organic acids.
The system is not specifically desigiied for the detection of inborn
errors of metabolism, though it serves this purpose. Some of the
ALL URINES
FILTRATION MICROSCOPYI DIPSTICK TESTS
UNIDIMENSIONAL SEPARATION
SPECIFIC CHEMICAL TESTS
(BIDIMENSIONAL SEPARATION)
COLUMN CHROMATOGRAPHYwith quanfitation
Fig. 4. Scheme for systematic examination of urine.
noninherited causes of aminoaciduria and melituria are shown belowand indicate the wide range of application of comprehensive urinescreening:
Amino Acids Sugars
Hepatic disease Hepatic disease
Renal disea.se Pancreatic diseaseThyroid & parathyroid disease Neuromuscular disorders
Neuromuscular disorders TraumaNutritional deficiencies 1)rugs
Poison or toxin ingestion Malignant disease
Burns and tissue destruction Gastrointestinal disorders
Gastrointestinal disease Renal disease
Many amino acids and sugars are present in normal urine, and differ-ences in concentrations of the samples must always be considered wheninterpretations of chromatograms are made. A random urine sampleis representative of the entire daily output as regards the concentrationof sugars (15), and food has little effect on amino acid excretion (9);thus, 24-hr. collections are not essential. It is unnecessary to concen-trate amino acids and sugars prior to separation, but concentration isnecessary for some other constituents. However, extraction into anorganic solvent is all that is required to permit thorough examinationof phenolic or indolic acids, amines, or other excretion products.
A scheme has been outlined whereby a much more exhaustive analysis
of urine could be performed as part of a screening program. The initial
Dow
nloaded from https://academ
ic.oup.com/clinchem
/article/14/5/418/5674695 by guest on 05 Decem
ber 2021

428 YOUNG Clinical Chemistry
requirements of speed and simplicity, with reproducible results, havebeen met for screening of amino acids and sugars. No initial samplepreparation is necessary, and the procedures have the potential ofautomation from the preparation of plates and application of sampleand location reagent, to densitometry and data acquisition with in-terpretation of results (16). Ultimately these procedures should leadto more rapid diagnosis and better patient care.
ReferencesL Butterfield, W. J. H., Summary of results of the Bedford diabetes survey. Proc. Roy.
Soc. Med. 57, 196 (1964).2. Henry, It. J.,Clinical Chemistry: Prieciples aiul Technics. Hoeber, New York, 1964, p. 336.3. Dent, C. E., A study of the behaviour of some sixty amino acids and other ninhydrin-
reacting substances on phenyl-collidine filter paper chromatograms. Biochem. J. 43,169 (1948).
4. Brenner, M., Niederwieser, A., and Pataki, G., Thin-layer Chromatography, Stahl, E., Ed.Acad. Press, New York, 1965, p. 391.
5. Visakarpi, J. K., and Puranen, A.-L., High voltage paper electroplioresis: A rapid methodfor determining urinary amino acids. Scand. J. Clin. Lab. Invest. 10, 196 (1958).
6. Troughton, W. 1)., Brown, R. St. C., and Turner, N. A., Separation of urinary aminoacids by thin-layer high voltage electrophoresis and chromatography. Am. J. Clin.Pathot. 46, 139 (1966).
7. Juul, P., Quantitative iiieasureinent of individual free amino acids in urine by means ofhigh voltage paper electrophoresis: Investigations of a group of mentally retardedpatients. Scand. J. Clin. Lab. Invest. 18, 629 (1966).
8. Hamilton, P. B., High resolution ion exchange chromatography of amino acids: Theanalysis of urine and other biological fluid. (abst.). Teciiriieon Corporation Symposium-Automation in Analytical Chemistry, 1967.
9. Smith, I., Chromalograiphic and Electrophoretic Techniqnes (Vol. 1, ed. 2). Interscience,New York, 1960, p. 122.
10. Hardy, S. M., Amino acid liberation from proteins by enzyme or “heat-catalyzed”hydrolysis. Nature 191, 1061 (1961).
11. Woodson, ii. w., Hier, S. W., and Salomoa, J. D., IJrinary excretion of amino acids byIiunian subjects on normal diets. J. Biol. Chem. 172, 613 (1948).
12. Skarzynski, B., and Sa,-necka-Keller, M., Peptides in human urine. Advan. Clin. Chein. 5,107 (1962).
13. Consden, R., and Stanier, W. M., lonophoresis of sugars on paper and some applicationsto the analysis of paper polysaccharide complexes. Nature 169, 783 (1952).
14. Stahl, E., and Kaltetibach, U., Thin-layer Chroniatography, Stahl, E., Ed. Acad. Press,New York, 1965, p. 461.
15. White, A. A., and Hess, W. C., Paper chromatographic detection of sugars in normaland dystropliie hinnan urines. Arch. Biochem. Biophy. 64, 57 (1956).
16. Tlush, 1. E., Automation of steroid analysis. Science 154, 77 (1966).
Session 111 of tile Symposium will appear in i/ic Jvne issue
Dow
nloaded from https://academ
ic.oup.com/clinchem
/article/14/5/418/5674695 by guest on 05 Decem
ber 2021


![7 Catheter-associated Urinary Tract Infection (CAUTI) · UTI Urinary Tract Infection (Catheter-Associated Urinary Tract Infection [CAUTI] and Non-Catheter-Associated Urinary Tract](https://static.fdocuments.in/doc/165x107/5c40b88393f3c338af353b7f/7-catheter-associated-urinary-tract-infection-cauti-uti-urinary-tract-infection.jpg)