
Systematic modeling study of channel waveguide fabrication by thermal silver ion exchange
13
Systematic modeling study of channel waveguide fabrication by thermal silver ion exchange Guangyu Li, Kim A. Winick, Henry C. Griffin, and Joseph S. Hayden A systematic study of thermal silver ion exchange used for the fabrication of optical channel waveguides is reported in a single-alkali glass. The diffusion equilibrium and diffusion dynamics are experimentally studied, and the concentration-dependent diffusion coefficients are determined. The relationship between the fabrication conditions, i.e., time, temperature, and melt concentration, and the induced waveguide refractive index profile is established. It is demonstrated that the diffusion equation can be solved, without use of any free parameters, to predict the refractive index profiles of both planar and channel waveguides. A 1.6 cm diameter integrated optic ring resonator, with a propagation loss of 0.1 dBcm, is fabricated in a glass by thermal silver ion exchange. The induced refractive index profile is related to the optical characteristics of the functional device. © 2006 Optical Society of America OCIS codes: 130.2790, 130.3130, 230.3120, 230.7380, 230.7390. 1. Introduction Ion exchange is a widely used technology for the fab- rication of both passive and active glass integrated optical devices. It has a number of advantages, includ- ing simplicity, low cost, and optical fiber compatibility. The first integrated optic waveguide was fabricated by ion exchange in 1972, 1 and a large number of studies and review articles on ion exchange in glass have been published in the intervening years. 2–5 These studies generally fall into one of two categories: (1) those that investigate the physical chemistry of the ion exchange process 6 –11 and (2) those that model waveguide fabri- cation for device applications. 12–35 The studies of the first kind investigate only the one-dimensional (1-D) indiffused ion concentrations and fail to connect these results with the induced refractive index profiles in channel waveguides. Studies of the second kind often invoke simplifying assumptions of questionable valid- ity. These assumptions include any or all of the follow- ing: (a) the concentration of the indiffused ion in the glass is very low, (b) the self-diffusion coefficients are concentration independent, and (c) only a single pair of alkali species is involved in the exchange process even when the virgin glass contains multialkali species. In addition, for studies of the second kind, the diffusion coefficients are often assumed to be free parameters of the model, and these coefficients are indirectly inferred from the measured effective indices of the resulting waveguide modes. Comparisons of the diffusion coeffi- cients obtained in this manner with those obtained by a more direct measurement are generally lacking. Fi- nally, the quantitative modeling results that have been reported to date, which do not invoke any of these simplifying assumptions, have been performed for pla- nar rather than the more important class of channel waveguides. 32 In this paper, these deficiencies are rectified for the thermal silver ion exchange process. In particular, in Section 2 the concentration-dependent self-diffusion and interdiffusion coefficients are directly measured in a single-alkali glass. The relationship between the induced refractive index change and the indiffused silver ion concentration is also established together with its wavelength dependence. Using this data, the Fickian diffusion equation is solved numerically in Section 3 to determine the indiffused silver ion con- centration. These data are applied for the first time, to the best of our knowledge, to predict the induced refractive index profiles of both planar and channel waveguides that are fabricated under a variety of conditions. These predictions are compared with the G. Li ([email protected]) and K. A. Winick are with the Depart- ment of Electrical Engineering and Computer Science, University of Michigan, 1301 Beal Avenue, Ann Arbor, Michigan 48109. H. C. Griffin is with the Department of Chemistry, University of Mich- igan, 930 North University Avenue, Ann Arbor, Michigan 48109. J. S. Hayden is with Schott North America, Incorporated, Regional Research and Development, 400 York Avenue, Duryea, Pennsylvania 18642. Received 8 August 2005; revised 26 September 2005; accepted 28 September 2005; posted 29 September 2005 (Doc. ID 63962). 0003-6935/06/081743-13$15.00/0 © 2006 Optical Society of America 10 March 2006 Vol. 45, No. 8 APPLIED OPTICS 1743
Transcript of Systematic modeling study of channel waveguide fabrication by thermal silver ion exchange
Systematic modeling study of channel waveguidefabrication by thermal silver ion exchange
Guangyu Li, Kim A. Winick, Henry C. Griffin, and Joseph S. Hayden
A systematic study of thermal silver ion exchange used for the fabrication of optical channel waveguidesis reported in a single-alkali glass. The diffusion equilibrium and diffusion dynamics are experimentallystudied, and the concentration-dependent diffusion coefficients are determined. The relationship betweenthe fabrication conditions, i.e., time, temperature, and melt concentration, and the induced waveguiderefractive index profile is established. It is demonstrated that the diffusion equation can be solved,without use of any free parameters, to predict the refractive index profiles of both planar and channelwaveguides. A 1.6 cm diameter integrated optic ring resonator, with a propagation loss of 0.1 dB�cm, isfabricated in a glass by thermal silver ion exchange. The induced refractive index profile is related to theoptical characteristics of the functional device. © 2006 Optical Society of America
OCIS codes: 130.2790, 130.3130, 230.3120, 230.7380, 230.7390.
1. Introduction
Ion exchange is a widely used technology for the fab-rication of both passive and active glass integratedoptical devices. It has a number of advantages, includ-ing simplicity, low cost, and optical fiber compatibility.The first integrated optic waveguide was fabricated byion exchange in 1972,1 and a large number of studiesand review articles on ion exchange in glass have beenpublished in the intervening years.2–5 These studiesgenerally fall into one of two categories: (1) those thatinvestigate the physical chemistry of the ion exchangeprocess6–11 and (2) those that model waveguide fabri-cation for device applications.12–35 The studies of thefirst kind investigate only the one-dimensional (1-D)indiffused ion concentrations and fail to connect theseresults with the induced refractive index profiles inchannel waveguides. Studies of the second kind ofteninvoke simplifying assumptions of questionable valid-ity. These assumptions include any or all of the follow-
ing: (a) the concentration of the indiffused ion in theglass is very low, (b) the self-diffusion coefficients areconcentration independent, and (c) only a single pair ofalkali species is involved in the exchange process evenwhen the virgin glass contains multialkali species. Inaddition, for studies of the second kind, the diffusioncoefficients are often assumed to be free parameters ofthe model, and these coefficients are indirectly inferredfrom the measured effective indices of the resultingwaveguide modes. Comparisons of the diffusion coeffi-cients obtained in this manner with those obtained bya more direct measurement are generally lacking. Fi-nally, the quantitative modeling results that havebeen reported to date, which do not invoke any of thesesimplifying assumptions, have been performed for pla-nar rather than the more important class of channelwaveguides.32
In this paper, these deficiencies are rectified for thethermal silver ion exchange process. In particular, inSection 2 the concentration-dependent self-diffusionand interdiffusion coefficients are directly measuredin a single-alkali glass. The relationship between theinduced refractive index change and the indiffusedsilver ion concentration is also established togetherwith its wavelength dependence. Using this data, theFickian diffusion equation is solved numerically inSection 3 to determine the indiffused silver ion con-centration. These data are applied for the first time,to the best of our knowledge, to predict the inducedrefractive index profiles of both planar and channelwaveguides that are fabricated under a variety ofconditions. These predictions are compared with the
G. Li ([email protected]) and K. A. Winick are with the Depart-ment of Electrical Engineering and Computer Science, Universityof Michigan, 1301 Beal Avenue, Ann Arbor, Michigan 48109. H. C.Griffin is with the Department of Chemistry, University of Mich-igan, 930 North University Avenue, Ann Arbor, Michigan48109. J. S. Hayden is with Schott North America, Incorporated,Regional Research and Development, 400 York Avenue, Duryea,Pennsylvania 18642.
Received 8 August 2005; revised 26 September 2005; accepted 28September 2005; posted 29 September 2005 (Doc. ID 63962).
0003-6935/06/081743-13$15.00/0© 2006 Optical Society of America
10 March 2006 � Vol. 45, No. 8 � APPLIED OPTICS 1743

measured profiles. The agreement is excellent for pla-nar waveguides and reasonably good for channels. InSection 4 we relate the induced refractive index pro-file, produced by thermal silver ion exchange, to theoptical characteristics of a functional device. A seriesof low-loss integrated optic ring resonators are fabri-cated, each of which contains a directional coupler.Using measured waveguide refractive index profiles,the crossover efficiencies of these couplers are calcu-lated by coupled-mode theory (CMT), and the resultsare shown to be in excellent agreement with mea-surements. Finally in Section 5 our results are sum-marized.
2. Ion Exchange Modeling
We consider only ion exchange from a liquid melt inthe absence of an externally applied electric field. Un-der such conditions, it is common to exchange sodiumcations �Na�� in the glass with either silver cations�Ag�� or potassium cations �K�� from the melt, al-though other ions have also been investigated.2–5 Inthe silver ion exchange process studied here, Ag� ionsare introduced into the glass at an elevated temper-ature by a AgNO3:NaNO3 molten salt bath that lies indiffusive contact with the glass surface. Na� cationsin the glass are replaced by Ag� cations from the meltas these cations pass through lithographically pat-terned mask openings on the glass surface. The ionexchange process locally modifies the Ag�and Na�
concentrations inside the glass, thus induc-ing local refractive index changes. The inducedchanges are a function of the ion exchange conditions,i.e., melt concentration, diffusion temperature, diffu-sion time, and the geometry of the mask openings.
Ag� ion exchange has several advantages relativeto K� ion exchange, including lower processing tem-peratures, shorter exchange times, larger achievablerefractive index changes, and the absence of stress-induced birefringence.2,36,37 Silver ion exchange, how-ever, requires proper glass selection to achieve a verylow propagation loss and mode compatibility withstandard optical fiber.
In the remainder of this section, glass selection andthe ion exchange modeling procedure will be de-scribed in detail.
A. Glass Selection
Glass substrates, such as BK7 and Corning 0211,which are often used for ion exchange, generally con-tain more than one alkali oxide component, withNa2O and K2O beingcommonconstituents.2 Inmixed-alkali glasses each of the alkali elements will simul-taneously participate in the ion exchange process.In most silver ion exchange waveguide modelingpapers, the effects of these nonsodium alkali glassconstituents are neglected without justification. Inaddition, when potassium is present, it will outdif-fuse into the melt-inducing stresses in the glass.These stresses, in turn, can produce microcracks onthe glass surface that are readily observable under amicroscope.36
For the specific purpose of ion exchange modeling, asmall batch of a single-alkali (Na2O) ion-exchangeablesilicate glass, hereafter referred to as IEG, was melted.A compositional analysis of IEG and a commerciallyavailable ion-exchangeable glass, Schott IOG10, wasobtained through an outside service. The analysis wasperformed using x-ray fluorescence, inductively cou-pled plasma, and atomic absorption spectroscopy. Theresults of this analysis are shown in Table 1.
The nonbridging oxygen (NBO) content of a glass isan important factor in the selection of a substrate forsilver ion exchange. It is known that the presence ofNBOs causes reduction of silver ions and the subse-quent formation of metallic silver clusters during sil-ver ion exchange.38 These metallic clusters discolorthe glass and increase propagation losses in wave-guide devices. The NBO content of both IEG andIOG10 were determined using x-ray photoelectronspectroscopy (XPS).39 The XPS signal consists of twoGaussian-shaped signal components centered at therespective binding energies (i.e., 532.5 and 531 eV) ofthe bridging oxygens (BOs) and NBOs. The numberof BOs and NBOs are directly proportional to theareas under the respective Gaussian-shaped compo-nent curves. The XPS signal along with the BO andNBO Gaussian component fits for IEG are shown inFig. 1, and the NBO content is tabulated in Table 2.The lower NBO content of IEG is consistent with our
Fig. 1. XPS-measured oxygen spectrum of IEG. Gaussian fits givethe BO and NBO contents.
Table 1. Glass Composition
OxideIOG10(wt. %)
IEG(wt. %)
SiO2 63.6 64.0Na2O 9.2 12.0K2O 6.8 —Al2O3 3.0 2.8MgO 2.8 2.8ZnO 12.5 15.6B2O3 1.0 1.0TiO2 0.6 0.6Traces 0.5 1.2
1744 APPLIED OPTICS � Vol. 45, No. 8 � 10 March 2006

observations that IOG10 suffers some yellow discol-oration following silver ion exchange, especially athigh silver melt concentrations, whereas IEG doesnot (even at AgNO3 concentrations approaching90 mol.%).
B. Ion Exchange Equilibrium at the Melt–Glass Interface
The ion concentrations at the interface between theglass sample and the melt were investigated at equi-librium. This investigation established the relation-ship between the silver ion concentration in the meltand the silver ion concentration immediately insidethe glass surface. Similar studies have been previ-ously reported in a variety of glasses.6 When thechemical reaction at the melt–glass interface reachesequilibrium, the ions are distributed between the twophases (i.e., melt and glass) in a fixed ratio as de-scribed by6
ln�mAg
mNa��
ERT �1 � 2mNa� � n ln�cAg
cNa�� ln K, (1)
where K and n are thermodynamic constants that de-pend on the glass composition; E is the net interac-tion energy that is equal to 3.5 kJ�mol for silvernitrate–sodium nitrate salt melts40; R is the gas con-stant; T is the absolute temperature; mAg and mNa arethe mole fractions of AgNO3 and NaNO3 in the melt;and cAg and cNa are the relative concentrations of Agand Na ions, respectively, in the glass, i.e., cAg�Na�� [number of Ag (Na) atoms in the glass]�(total num-ber of Ag and Na atoms in the glass). Once the valuesof n and K are established, the silver ion concentra-tion immediately inside the glass surface at equilib-rium may be computed from knowledge of the AgNO3concentration in the melt.
The experimental study of the melt–glass interfaceequilibrium for IEG was carried out by performingion exchanges at 320 °C using a AgNO3:NaNO3 meltmixture whose concentration was varied over a rangefrom 0.2 to 90 mol.% AgNO3. The exchange timeswere sufficiently long (i.e., 9 h) to ensure that a sur-face layer of the glass with a thickness of least severalmicrometers reached equilibrium with the melt. A0.5 �m thick surface layer of the glass sample waschemically removed using diluted hydrofluoric acid.The ratio of silver-to-sodium atom concentration inthe etchant, cAg�cNa, was determined using an atomicabsorption spectrophotometer. The unknown param-eters for n and K appearing in Eq. (1) were fit to thismeasured data, yielding values of 1.27 and 46 for nand K, respectively, as shown in Fig. 2.
Note that even melts having low AgNO3 concentra-tions can produce large relative Ag concentrationsinside IEG at equilibrium. For example, Fig. 2 indi-cates that a 1 mol.% AgNO3 and 99 mol.% NaNO3melt corresponds to cAg � 0.5 at 320 °C.
Next, the silver ion concentration was related tothe induced refractive index change. The surface re-fractive index change �nsurf of silver ion-exchangedIEG samples was measured at a wavelength of 658nm using a commercial refractive near-field (RNF)profilometer.41 The results of these measurements areplotted versus melt concentration in Fig. 3. Combiningthe data shown in Figs. 2 and 3, a linear dependencebetween the surface refractive index change �nsurf andthe surface silver concentration immediately insidethe glass surface cAg�0� was established. This linearrelationship is shown in Fig. 4. Two other indepen-dent methods, energy dispersive x-ray (EDX) andbackscattered electron (BSE), using a scanning elec-tron microscope were also used to compare the nor-malized silver concentration profile cAg�x��cAg�0� with
Fig. 2. Ion exchange equilibrium study at 320 °C in IEG.
Fig. 3. Surface index change in IEG at 658 nm versus mole frac-tion of AgNO3 in the melt at 320 °C.
Table 2. X-Ray Photoelectron Spectroscopy Results for NonbridgingOxygen Analysis
GlassSubstrate
NBO Fraction ofTotal Oxygens (%)
IOG10 10IEG 2
10 March 2006 � Vol. 45, No. 8 � APPLIED OPTICS 1745

the normalized refractive index change profile�n�x���nsurf measured by a RNF profilometer, wherex denotes the depth inside the glass surface. All threeof these measurement techniques yielded consistentresults as illustrated in Fig. 5 for a 9 h exchange at320 °C using a 10 mol.% silver nitrate melt.
C. Diffusion Dynamics
The kinetics of the thermal ion exchange process canbe described by Fickian diffusion theory,2–9 whichstates that the flux of ions crossing any plane will beproportional to the concentration gradient measuredacross that plane. Therefore the Ag� cation concentra-tion CAg in the glass is determined by Fick’s first law:
�CAg
�t � � · �D̃ � CAg�, (2)
along with the appropriate boundary conditions. CAg
is a function of both position and time, and D̃, theinterdiffusion coefficient, is generally concentration
dependent. Invoking the assumption oflocal charge neutrality, the concentration of the Na�
cation, CNa, in the glass is given by
CNa � C0 � CAg, (3)
where C0 is the Na concentration in the virgin glassbefore ion exchange. We will find it more convenientto work with the following relative concentrations:
cAg �CAg
C0, cNa �
CNa
C0. (4)
Once D̃ is known and the appropriate boundaryconditions are specified, Eq. (2) can be solved for therelative concentration profile cAg�x, y, z, t�. In the gen-eral case, closed-form solutions are not obtainableand numerical techniques must be invoked. Note thatapplication of Eq. (2) does not require that the diffu-sion process be understood at an atomic level. In fact,it is not yet possible to derive the interdiffusion coef-ficient from knowledge of the glass structure alone.Models for D̃ have been derived based on thermody-namic principles, but these models have not beentotally successful in predicting experimental results,as will be discussed in Subsection 2.D.
For the case of a 1-D thermal ion exchange of du-ration tf into a thick glass substrate from an unde-pleted melt, the boundary and initial conditionsbecome
�cAg � cAg�x � 0�, x � 0, t � 0cAg � 0, x � 0, t � 0 . (5)
cAg�x � 0� is given by Eq. (1), and evidence indicatesthat the equilibrium at the glass–melt interface isquickly established during the ion exchange process.By making the change of variables
�x
�t, (6)
Eqs. (2) and (5) can be rewritten as
�
2dcAg
d�
dd�D̃ dcAg
d �, (7)
�cAg � cAg �x � 0�, � 0cAg � 0, �
. (8)
Canceling the factor of d on both sides of Eq. (7),integrating this equation from cAg � 0 (at � ) tocAg � cAg��at � ��, and noting that dcAg�d � 0 at � , we obtain
D̃�cAg�� � �12tf
dx�cAg�dcAg
cAg � cAg�
0
cAg�
x�cAg�dcAg (9)
Fig. 4. Linear dependence of surface index change (�nsurf) at658 nm with the silver concentration at the glass surface [cAg(0)].
Fig. 5. Measured Ag� and �n diffusion profiles in IEG obtainedby the EDX, BSE, and RNF methods for a 9 h exchange at 320 °Cusing a 10 mol.% silver nitrate melt.
1746 APPLIED OPTICS � Vol. 45, No. 8 � 10 March 2006

for 0 � cAg� � cAg �x � 0� provided that cAg�x, tf�is a monotonic function of x. Equation (9) is knownas the Boltzmann–Matano relation.42 This relationhas been used extensively to recover concentration-dependent diffusion coefficients from measured con-centration profiles.32
The Boltzmann–Matano inversion relation was ap-plied to planar waveguides fabricated by a 9 h silverion exchange at 320 °C using 10 mol.% AgNO3:90mol.% NaNO3 and 90 mol.% AgNO3:10 mol.% NaNO3salt mixtures. The 1-D refractive index profiles �n�x�were measured at 658 nm using a RNF profilometer,and cAg�x� was computed from �n�x� using the linearrelation established in Fig. 4. D̃�cAg� was subsequentlycomputed using Eq. (9), and the results are displayedin Fig. 6 for cAg lying between 0.1 and 0.5 for both meltconcentrations. As to be expected, the results do notdepend on the melt concentration within the accuracyof our measurements.
The Boltzmann–Matano inversion method is sen-sitive to the shape of the concentration profile, es-pecially near the glass surface (i.e., x � 0) where cAgis slowly changing (hence dx�dcAg is very large) andnear the tail of the concentration profile where cAg issmall. The measured concentration profile needs tobe carefully curve fitted to reduce the effects ofnoisy experimental data before the Boltzmann–Matano inversion procedure is numerically imple-mented. The Ag concentration profile was fit usinga ninth-order polynomial except in the tail regionwhere exponential fitting was performed. Care hadto be taken to ensure that the transition from thepolynomial to the exponential fit regions occurredsmoothly. The interdiffusion coefficient was ob-tained for cAg lying between 0 and 0.9. The dataobtained by the Boltzmann–Matano procedure forcAg values greater than 0.5 or less than 0.1 are notshown in Fig. 6 because the flatness of the concen-tration profile near the glass surface and the low Agconcentration in the tails of the profile make the
inversion process quite sensitive to noisy data inthese ranges.
At cAg � 0, the interdiffusion coefficient equals thesilver self-diffusion coefficient, and this later valuewas measured and is reported in Subsection 2.D. Theself-diffusion coefficient is shown in Fig. 6 and wasused to extrapolate (dashed curve) the interdiffu-sion coefficient data obtained from the Boltzmann–Matano procedure down to cAg � 0.
D. Self-Diffusion Coefficients
By invoking a number of assumptions, the functionalform of the interdiffusion coefficient may be deter-mined.4 The chemical potential of cation species imay be written as8
�i � �i�0� � RT ln� iC0ciVi�, (10)
where �i�0� is a concentration-independent term, Vi is
the volume per cation i in the glass matrix, and i isthe activity of cation i. The average diffusion velocityof cation i, ��i, in a homogeneous and isotropic mediumdue to a gradient in the chemical potential is given by
��i � �ai ��i, (11)
where ai is a generalized mobility term. Thus the fluxof cation i, J� i, due to a gradient in the chemical po-tential becomes
J� i � C0ci��i � �ai RTC0��ci��i, (12)
where
�i � 1 �d ln i
d ln ci. (13)
In general, ��Ag � ��Na leads to the creation of a spacecharge and an internal electric field, E� int. Thus Eq.(12) must be modified to include a term for electric-field-induced drift as
J� i � �Di*�iC0 � ci � eE� intuiC0ci, (14)
where e is the charge on an electron, �i is the mobilityof cation i associated with electric-field-induced drift,and the self-diffusion coefficient is defined as
Di* � aiRT. (15)
Assuming that no net current flows in the glass andthat the Ag–Na exchange is a one-to-one exchange,i.e.,
J� Ag � J� Na � 0, (16)
cAg � cNa � 1, (17)
Fig. 6. Interdiffusion coefficient in IEG at 320 °C derived from acurve-fit RNF profile using the Boltzmann–Matano relation.
10 March 2006 � Vol. 45, No. 8 � APPLIED OPTICS 1747

respectively, Eqs. (14) and (16) may be combined toyield
E� int ��DAg*�Ag � DNa*�Na�e��AgcAg � �NacNa�
� cAg. (18)
Equations (14) and (18) can be used together with thecontinuity equation
d�C0ci�dt � � � · J� i (19)
to conclude
dcAg
dt � �·�DAg*�Ag�cAg�
� � ·��Ag cAg�DNa*�Na � DAg*�Ag
�Ag cAg � �NacNa��cAg�.
(20)
For interstitial diffusion, the self-diffusion coeffi-cient and the electric-field-induced mobility are re-lated by the Nernst–Einstein relationship8:
Di* �kTe �i. (21)
Ion exchange in glass, however, is not an intersti-tial process since it involves the exchange of ion spe-cies at fixed lattice sites. Thus Eq. (21) must bemodified and the following semiempirical relation-ship is generally used8,43:
Di* � Hi
kTe �i, (22)
where Hi is known as the Haven ratio, which is aglass-dependent constant. The value of Hi typicallylies between 0.3 and 1. From the Gibbs–Duhem equa-tion of thermodynamics,8
�Ag � �Na. (23)
Combining Eqs. (17), (20), (22), and (23) with theassumption that
HAg � HNa, (24)
we obtain
dcAg
dt � � · �D̃ � cAg�, (25)
where the concentration-dependent interdiffusion co-efficient D̃ is given by
D̃ �DAg*DNa*
DAg*cAg � DNa*cNa�1 �
d ln Ag
d ln cAg�. (26)
Although Eq. (26) is widely quoted and used, thepredictions of this equation have not always beenconsistent with observations.10,44–46 Fortunately, theaccurate modeling of the silver thermal ion exchangeprocess is not dependent on the validity of Eq. (26)since D̃ can be obtained experimentally using theBoltzmann–Mantano inversion procedure describedin Subsection 2.C.
In the limit of very low concentrations �i.e., cAg�� 1 or cNa �� 1� of the indiffused cation (Ag or Na,respectively), ideal solution theory predicts that thebracketed thermodynamic term in Eq. (26) should beone.8 Thus under such conditions the interdiffusioncoefficient reduces to a self-diffusion coefficient, ei-ther DAg* or DNa*. Furthermore these self-diffusion co-efficients can be measured using radiotracer studies.44
Because of the mixed alkali effect, the self-diffusioncoefficients are generally strongly concentration de-pendent.47
Device engineers often assume that cAg 0 or at thevery least that the self-diffusion coefficients are con-centration independent, although both of these as-sumptions are often untrue in practice. For example,a 1 mol.% AgNO3:99 mol.% NaNO3 melt at 320 °Ccorresponds to a normalized silver concentrationcAg�0� in IEG of approximately 50%. And as indicatedin Fig. 6, the interdiffusion coefficient of IEG variesby nearly a factor of 4 over the range 0 � cAg � 0.5.
We have investigated the concentration depen-dence of the self-diffusion coefficients in IEG glass.Long-duration silver ion exchanges were performedin IEG using AgNO3:NaNO3 melts of two differentconcentrations. By measuring the surface refractiveindices at 658 nm of these ion-exchanged sampleswith a RNF profilometer, we were able to deduce that35% of the Na in the virgin glass had been replaced(in a top glass layer of thickness exceeding 80 �m) byAg in the first sample and 85% in the second. A dropof radioactive tracers, drawn from liquid solutions ofeither Ag-108m or Na-22, was deposited on the glasssurface of a virgin piece of IEG and on the surfaces oftwo previously exchanged pieces and allowed to dry.Each sample was then covered by a second identicalpiece of glass, effectively sandwiching the radioactivetracer between the pair. The radioactive tracers werethermally indiffused into the glass pair at 320 °Cwith the durations varying from 30 min to 1 h. Layer-by-layer etching of the glass using diluted hydroflu-oric acid, followed by NaI well counting of the activityin the resultant etchant solution, allowed the indif-fused radiotracer profiles to be measured.10 Given thevery low quantities of radiotracers used, it may beassumed that the entire quantity of radiotracer en-ters the glass nearly instantaneously. Under this con-dition, Eq. (2) may be solved in closed form for the
1748 APPLIED OPTICS � Vol. 45, No. 8 � 10 March 2006
concentration profile ci�x, t� of the indiffused radioac-tive tracers. The solution is a Gaussian function ofdepth as given by Eq. (27):
ci�x, t� �c0
(i)
��Di*texp��
x2
4Di*t�, (27)
where t is the diffusion duration, c0�i� is a constant,
and i denotes either Ag or Na. Note that Eq. (27)satisfies the necessary boundary conditions:
ci → 0 as t → , for x � 0,
ci → as t → 0, for x � 0,
0ci�x, t�dx � c0
�i�, for all t. (28)
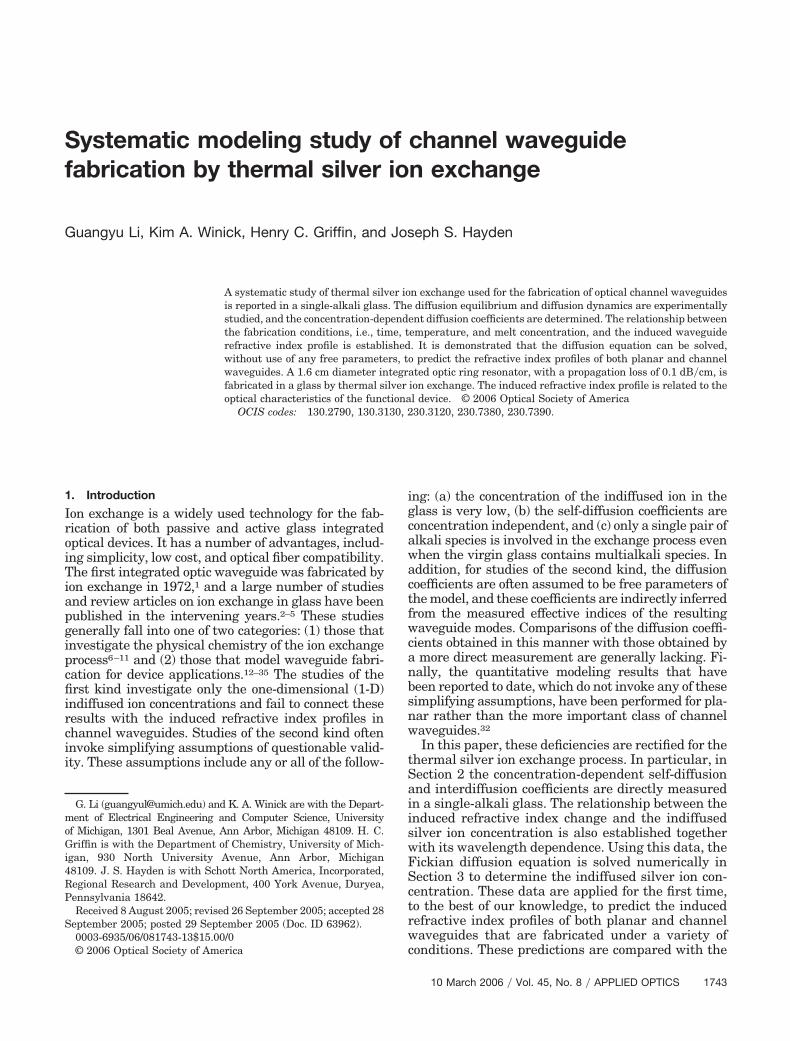
The Gaussian dependence predicted by Eq. (27)was experimentally confirmed in IEG, and a partic-ular result, for the case of Na-22 indiffusion, is shownin Fig. 7. The self-diffusion coefficients Di* for bothAg-108m and Na-22 were determined for three dif-ferent glass compositions (i.e., 1, 2, and 3) by fittingthe experimentally measured concentration profilesto the functional form given by Eq. (27), and theresults are shown in Table 3. These results demon-strate that the self-diffusion coefficients are concen-tration dependent in IEG. In particular, the Agself-diffusion coefficient DAg* varies by nearly a factor
of 5 as the relative Ag concentration in the glassincreases from 0% to 85%. Similar results have beenpreviously reported in other glasses.10
E. Dispersion
The refractive index of glass is known to be wavelengthdependent. The refractive index nsub of virgin IEG wasmeasured at four different wavelengths using a com-mercial prism coupling instrument. The wavelengthdependence of the refractive index change inducedby ion exchange was also determined as describedbelow.
The induced refractive index change is linearly pro-portional to the indiffused silver ion concentration asestablished in Figs. 4 and 5. This linear dependencecan be expressed as
�n�x� � ����cAg�x�, (29)
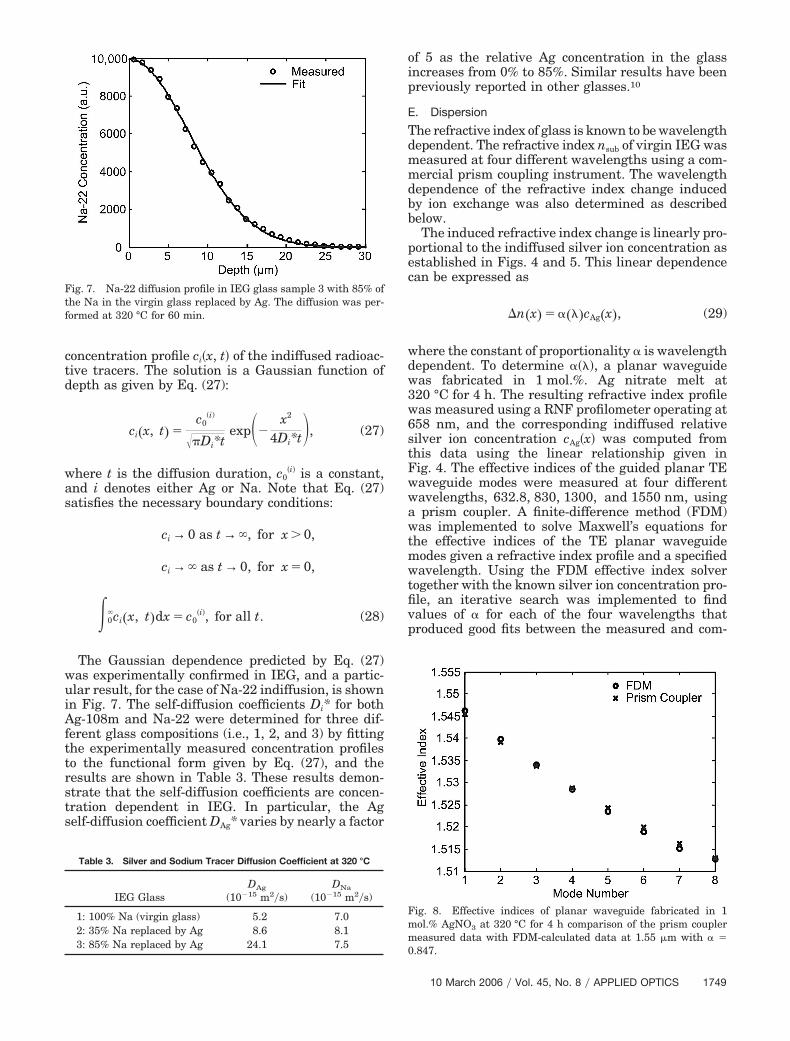
where the constant of proportionality � is wavelengthdependent. To determine ����, a planar waveguidewas fabricated in 1 mol.%. Ag nitrate melt at320 °C for 4 h. The resulting refractive index profilewas measured using a RNF profilometer operating at658 nm, and the corresponding indiffused relativesilver ion concentration cAg�x� was computed fromthis data using the linear relationship given inFig. 4. The effective indices of the guided planar TEwaveguide modes were measured at four differentwavelengths, 632.8, 830, 1300, and 1550 nm, usinga prism coupler. A finite-difference method (FDM)was implemented to solve Maxwell’s equations forthe effective indices of the TE planar waveguidemodes given a refractive index profile and a specifiedwavelength. Using the FDM effective index solvertogether with the known silver ion concentration pro-file, an iterative search was implemented to findvalues of � for each of the four wavelengths thatproduced good fits between the measured and com-
Fig. 7. Na-22 diffusion profile in IEG glass sample 3 with 85% ofthe Na in the virgin glass replaced by Ag. The diffusion was per-formed at 320 °C for 60 min.
Fig. 8. Effective indices of planar waveguide fabricated in 1mol.% AgNO3 at 320 °C for 4 h comparison of the prism couplermeasured data with FDM-calculated data at 1.55 �m with � �0.847.
Table 3. Silver and Sodium Tracer Diffusion Coefficient at 320 °C
IEG GlassDAg
(10�15 m2�s)DNa
(10�15 m2�s)
1: 100% Na (virgin glass) 5.2 7.02: 35% Na replaced by Ag 8.6 8.13: 85% Na replaced by Ag 24.1 7.5
10 March 2006 � Vol. 45, No. 8 � APPLIED OPTICS 1749
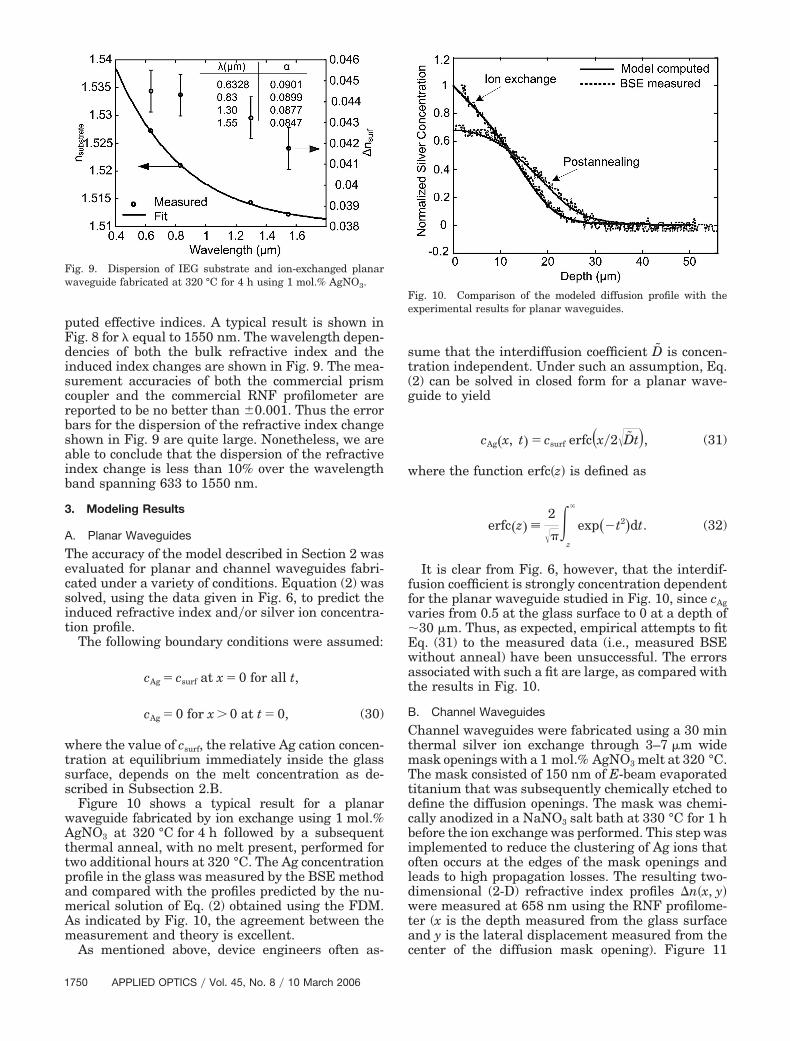
puted effective indices. A typical result is shown inFig. 8 for � equal to 1550 nm. The wavelength depen-dencies of both the bulk refractive index and theinduced index changes are shown in Fig. 9. The mea-surement accuracies of both the commercial prismcoupler and the commercial RNF profilometer arereported to be no better than �0.001. Thus the errorbars for the dispersion of the refractive index changeshown in Fig. 9 are quite large. Nonetheless, we areable to conclude that the dispersion of the refractiveindex change is less than 10% over the wavelengthband spanning 633 to 1550 nm.
3. Modeling Results
A. Planar Waveguides
The accuracy of the model described in Section 2 wasevaluated for planar and channel waveguides fabri-cated under a variety of conditions. Equation (2) wassolved, using the data given in Fig. 6, to predict theinduced refractive index and�or silver ion concentra-tion profile.
The following boundary conditions were assumed:
cAg � csurf at x � 0 for all t,
cAg � 0 for x � 0 at t � 0, (30)
where the value of csurf, the relative Ag cation concen-tration at equilibrium immediately inside the glasssurface, depends on the melt concentration as de-scribed in Subsection 2.B.
Figure 10 shows a typical result for a planarwaveguide fabricated by ion exchange using 1 mol.%AgNO3 at 320 °C for 4 h followed by a subsequentthermal anneal, with no melt present, performed fortwo additional hours at 320 °C. The Ag concentrationprofile in the glass was measured by the BSE methodand compared with the profiles predicted by the nu-merical solution of Eq. (2) obtained using the FDM.As indicated by Fig. 10, the agreement between themeasurement and theory is excellent.
As mentioned above, device engineers often as-
sume that the interdiffusion coefficient D̃ is concen-tration independent. Under such an assumption, Eq.(2) can be solved in closed form for a planar wave-guide to yield
cAg�x, t� � csurf erfc�x�2�D̃t�, (31)
where the function erfc�z� is defined as
erfc�z� �2
��
z
exp��t2�dt. (32)
It is clear from Fig. 6, however, that the interdif-fusion coefficient is strongly concentration dependentfor the planar waveguide studied in Fig. 10, since cAgvaries from 0.5 at the glass surface to 0 at a depth of�30 �m. Thus, as expected, empirical attempts to fitEq. (31) to the measured data (i.e., measured BSEwithout anneal) have been unsuccessful. The errorsassociated with such a fit are large, as compared withthe results in Fig. 10.
B. Channel Waveguides
Channel waveguides were fabricated using a 30 minthermal silver ion exchange through 3–7 �m widemask openings with a 1 mol.% AgNO3 melt at 320 °C.The mask consisted of 150 nm of E-beam evaporatedtitanium that was subsequently chemically etched todefine the diffusion openings. The mask was chemi-cally anodized in a NaNO3 salt bath at 330 °C for 1 hbefore the ion exchange was performed. This step wasimplemented to reduce the clustering of Ag ions thatoften occurs at the edges of the mask openings andleads to high propagation losses. The resulting two-dimensional (2-D) refractive index profiles �n�x, y�were measured at 658 nm using the RNF profilome-ter (x is the depth measured from the glass surfaceand y is the lateral displacement measured from thecenter of the diffusion mask opening). Figure 11
Fig. 9. Dispersion of IEG substrate and ion-exchanged planarwaveguide fabricated at 320 °C for 4 h using 1 mol.% AgNO3.
Fig. 10. Comparison of the modeled diffusion profile with theexperimental results for planar waveguides.
1750 APPLIED OPTICS � Vol. 45, No. 8 � 10 March 2006

shows the comparison of the RNF-measured �n�x, y�with the model predictions obtained by numericallysolving Eq. (2) using the measured interdiffusion co-efficient shown in Fig. 6 and the following boundaryconditions:
cAg � csurf at x � 0, �y� � w, t � 0,cAg � 0 for x � 0, t � 0, and all y,
�cAg
�x x�0
� 0 for �y� � w, t � 0, (33)
where w is the width of the mask opening. The agree-
ment between the measured profile and that pre-dicted by the model, with no free parameters, isreasonably good. As can be seen in Fig. 11, the largestdiscrepancies occur in the regions of low concentra-tion and close to the glass surface. It is possible thatthese discrepancies are due to the presence of theoxidized metal mask, which may introduce an electricfield generated by the electrochemical bias betweenthe melt and the mask.48 This field may alter thediffusion process in some small but subtle ways. Itwould be interesting to repeat these experiments us-ing dielectric rather than metal masks.
4. Optical Device Performance
The procedure described above for studying the ionexchange process in IEG glass is, in general, appli-cable to other single-alkali glasses. The n and K val-ues in the equilibrium relation, the self-diffusion andinterdiffusion coefficients, and ���� will depend, how-ever, on the glass composition. Once these parame-ters are measured and the fabrication conditionsspecified, the model described in the previous sec-tions can be used to determine the induced refractiveindex profile at a particular operating wavelength.Finally, standard techniques, such as the beam prop-agation method, FDM, CMT, finite-difference time-domain, etc., can be used to determine the opticalcharacteristics of a waveguide device from knowledgeof its refractive index profiles. In this section we il-lustrate this final optical modeling step.
A series of integrated optic ring resonators werefabricated in IOG10 by conventional photolithogra-phy and thermal silver ion exchange.49 A 150 nmthick layer of titanium was E-beam deposited on anIOG10 glass substrate. Using standard photolithog-raphy, a pattern of diffusion openings was created inthe titanium layer corresponding to a set of ring res-onators. The mask was anodized at 330 °C in a pureNaNO3 melt for 1 h to mitigate the effects of Ag clus-tering as described earlier. Next, ion exchange wasperformed in a mixed melt of 0.6 mol.% AgNO3 and99.4 mol.% NaNO3 at 320 °C for 20 min. Followingthe exchange, the wafer was removed from the ovenand allowed to cool to room temperature, and theindividual resonator chips were diced out of the fullwafer and polished.
Ideally, in terms of continuity with Sections 1–3,the ring resonators would have been fabricated inIEG substrates. Unfortunately, however, to obtaingood optical quality (i.e., no bubbles and very lowstriae), high-silica glasses must be melted at hightemperatures in large batches. The cost of meltingsuch a large batch of glass for scientific purposes isprohibitive. Mixed-alkali glasses are common andhave been developed for a host of unrelated applica-tions; thus most waveguide devices fabricated by ionexchange have been produced in these glasses solelybecause they are readily available. If commercial de-mand was sufficiently high, as it was during the tele-communications bubble, then single-alkali glasseswould be readily available too. In fact, Schott GlassTechnologies did at one time develop such a glass,
Fig. 11. Comparison of the computed diffusion profile with mea-sured results for channel waveguides fabricated under differentconditions. The inner contours in each of the two graphs corre-spond to �n � 0.9�nsurf, while each succeeding contour line rep-resents an additional change of the refractive index in decrementsof 0.1�nsurf.
10 March 2006 � Vol. 45, No. 8 � APPLIED OPTICS 1751
BGG31, that was used by IOT in Germany to makeglass-integrated optical devices.22,23 Our IEG glassmelt was of small volume, and consequently it hadlower optical quality than commercially availablemixed-alkali glasses like IOG10. IOG10 containsboth Na2O and K2O, and therefore we made no at-tempt to model the ion exchange diffusion process inthis mixed-alkali glass. For our immediate opticalmodeling purposes, however, the inability to performthis task does not present any difficulties. We havealready demonstrated in Sections 1–3 that refractiveindex profiles can be accurately predicted based onFickian diffusion theory in a single-alkali glass with-out invoking free parameters. Thus it only remains toshow that device operation can be predicted accu-rately in a glass (composition unimportant) once therefractive index profile is known. Although this typeof work is routinely reported for step-index wave-guides, such as those produced using silica-on-silicontechnology, similar results have not been presentedfor diffused waveguides with graded refractive indexprofiles. The lack of such results is primarily due tothe difficulties inherent in accurately measuring 2-Drefractive index profiles. Recently, however, RNFprofilometers have become commercially available,thus making such measurements possible. In thissection we demonstrate that we can accurately pre-dict the operation of an ion-exchanged ring resonatordevice once the refractive index profile is known. Weaccomplish this task in a commercially availablemixed-alkali glass, which is similar in composition toIEG. The refractive index profile, however, is directlymeasured using a RNF profilometer rather than com-puted using Fickian diffusion theory. We also notethat the devices reported in this section are, to thebest of our knowledge, as good as or better than (i.e.,in terms of low loss—0.1 dB�cm) anything previouslyreported by thermal silver ion exchange in glass.Thus these devices are of some interest in their ownright.
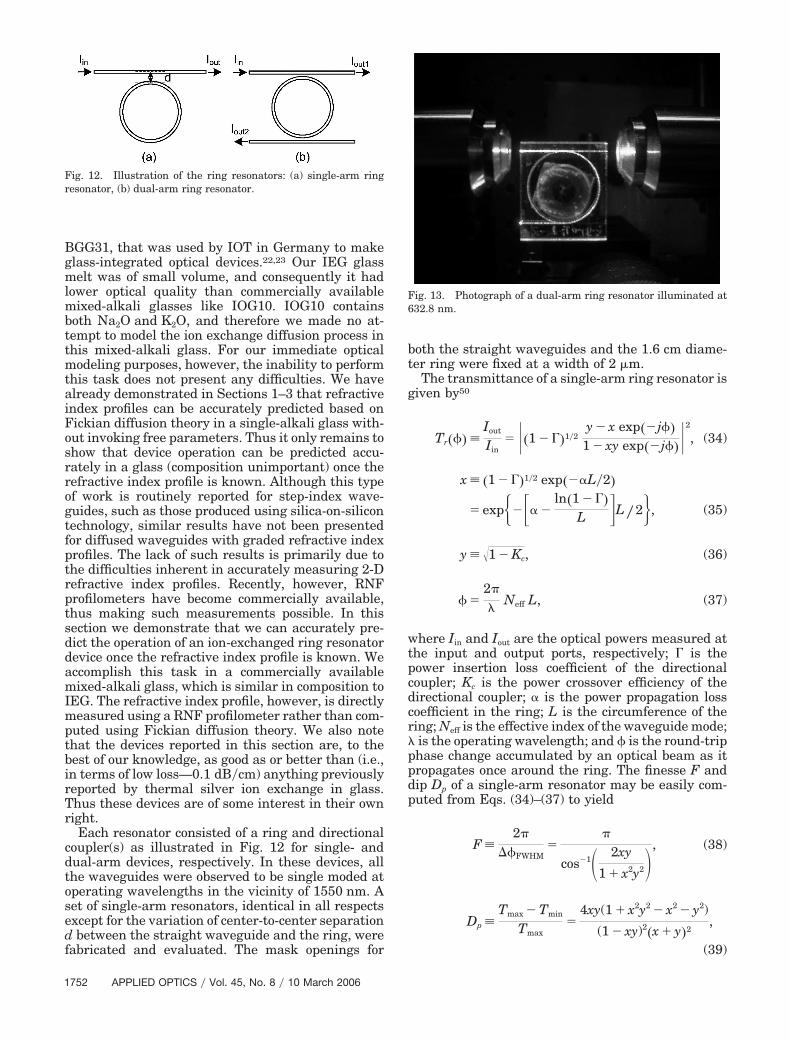
Each resonator consisted of a ring and directionalcoupler(s) as illustrated in Fig. 12 for single- anddual-arm devices, respectively. In these devices, allthe waveguides were observed to be single moded atoperating wavelengths in the vicinity of 1550 nm. Aset of single-arm resonators, identical in all respectsexcept for the variation of center-to-center separationd between the straight waveguide and the ring, werefabricated and evaluated. The mask openings for
both the straight waveguides and the 1.6 cm diame-ter ring were fixed at a width of 2 �m.
The transmittance of a single-arm ring resonator isgiven by50
Tr��� �Iout
Iin� �1 � ��1�2
y � x exp��j��1 � xy exp��j��
2
, (34)
x � �1 � ��1�2 exp���L�2�
� exp���� �ln�1 � ��
L �L � 2�, (35)
y � �1 � Kc, (36)
� �2�
�Neff L, (37)
where Iin and Iout are the optical powers measured atthe input and output ports, respectively; � is thepower insertion loss coefficient of the directionalcoupler; Kc is the power crossover efficiency of thedirectional coupler; � is the power propagation losscoefficient in the ring; L is the circumference of thering; Neff is the effective index of the waveguide mode; is the operating wavelength; and is the round-tripphase change accumulated by an optical beam as itpropagates once around the ring. The finesse F anddip Dp of a single-arm resonator may be easily com-puted from Eqs. (34)–(37) to yield
F �2�
��FWHM�
�
cos�1� 2xy
1 � x2y2�, (38)
Dp �Tmax � Tmin
Tmax�
4xy(1 � x2y2 � x2 � y2)
(1 � xy)2�x � y�2,
(39)
Fig. 12. Illustration of the ring resonators: (a) single-arm ringresonator, (b) dual-arm ring resonator.
Fig. 13. Photograph of a dual-arm ring resonator illuminated at632.8 nm.
1752 APPLIED OPTICS � Vol. 45, No. 8 � 10 March 2006

where ��FWHM is the full width at half-maximum ofthe spectral transmittance dip.
The spectral response of each resonator was char-acterized by using a narrow linewidth, external-cavity tunable diode laser source operating in thevicinity of 1550 nm. As illustrated in Fig. 13, thelaser beam was end-fired coupled into the input portof the ring resonator using a 20� micro-objectivelens. The fraction of incident light transmittedthrough to the output port was collected using a 20�objective lens and measured by a photodiode detectoras the laser wavelength was tuned over a small rangein the vicinity of 1550 nm. From the measured spec-tral response, the finesse and dip could be deter-mined, then the effective loss coefficient � � �ln�1� ����L and crossover efficiency Kc were derived us-ing Eqs. (35), (36), (38), and (39). The effective lossesof the resonators were originally �1 dB�cm, which isquite high.
To reduce the losses, the devices were thermallyannealed at 320 °C in 10 min steps. After each an-nealing step, the finesse and dip of the resonatorswere remeasured and the crossover efficiencies andeffective losses were recomputed. The losses initiallydecreased with each additional thermal anneal step,until the confinement of the waveguide mode wassufficiently weak so that bending losses began to be-come significant. Table 4 gives the coupler’s crossoverefficiency and the effective loss following each anneal-ing step corresponding to a directional coupler spac-ing of 10.5 �m. Note that the device achieved itsminimum loss after the sixth annealing step. Similardata were collected for the resonators with other cou-pler spacings. A new set of devices was fabricated; foreach device, thermal annealing was halted at thepreviously determined step (i.e., sixth) of minimumloss. The waveguide refractive index profiles of theseminimum loss devices were also measured using aRNF profilometer. Figures 14(a) and 15 show thespectral response and refractive index profile, respec-tively, obtained for a typical minimum loss device.The measured finesse and dip of this device were 37and 80%, respectively, corresponding to an effectiveloss of 0.1 dB�cm and a coupler crossover efficiency of4.6%. Similar results for a dual-arm ring resonator, asshown in Fig. 14(b), were obtained with a finesse of 40,and dip of 44%, corresponding to an effective loss of 0.1dB�cm and a coupler crossover efficiency of 1.7%.
Using the FDM, the mode profile of the minimumloss waveguides was computed from the measured
Fig. 14. Measured spectral response of ring resonators with a1.6 cm diameter: (a) single-arm ring resonator with center-to-center coupler spacing of 10.5 �m, (b) dual-arm ring resonator withcenter-to-center coupler spacing of 11.5 �m.
Fig. 15. RNF measurement of the channel waveguide index pro-file for a minimum loss device.
Table 4. Waveguide Annealing Results for 1.6 cm Diameter Ring with aCoupler Waveguide Spacing of 10.5 �m
IOG10 AnnealingStep Kc (%) � (dB�cm)
1 0.19 0.222 0.53 0.203 1.35 0.234 2.14 0.135 3.6 0.136 4.6 0.107 6.6 0.13
10 March 2006 � Vol. 45, No. 8 � APPLIED OPTICS 1753

refractive index profile. The spatial mode overlap in-tegral between the straight waveguide mode and theidentical ring waveguide mode was numerically eval-uated at a sequence of closely spaced points along thecoupler’s length. From this data, the spatially vary-
ing coupling coefficient was determined. CMT wasthen used to compute the crossover efficiency Kc of thedirectional coupler.51 The results were found to be inexcellent agreement with measured values as shownin Fig. 16.
Figure 17 shows the waveguide mode profile corre-sponding to Fig. 15. Also shown in this figure is themode profile of a standard SMF-28 optical fiber. Onthe basis of these two profiles, the fiber-to-waveguideinsertion loss was computed to be �1.5 dB based ona mode overlap integral.
5. Conclusions
In conclusion, we have demonstrated that the in-duced refractive index distribution in a channelwaveguide, fabricated by thermal silver ion exchangein a single-alkali glass, can be predicted from a modelbased on first principles. Furthermore, the parame-ters used in the model can be measured directly andneed not be inferred by making assumptions whosevalidity is questionable. Once the refractive indexprofile is known, we have also demonstrated thatstandard numerical techniques may also be used toaccurately determine the optical characteristics offunctional devices. The techniques described hereprovide a systematic methodology for the design andfabrication of glass integrated optic devices usingthermal silver ion exchange.
References1. T. Izawa and H. Nakagome, “Silver ion-exchanged glass
waveguides,” Appl. Phys. Lett. 21, 584–586 (1972).2. S. I. Najafi, ed., Introduction to Glass Integrated Optics
(Artech, 1992).3. T. Findakly, “Glass waveguides by ion exchange: a review,”
Opt. Eng. 24, 244–250 (1985).4. R. V. Ramaswamy and R. Srivastava, “Recent advances in
ion-exchanged optical waveguides and components,” J. Mod.Opt. 35, 1049–1067 (1988).
5. R. V. Ramaswamy and R. Srivastava, “Ion-exchanged glasswaveguides: a review,” J. Lightwave Technol. 6, 984–1001(1988).
6. H. M. Garfinkel, “Ion-exchange equilibria between glass andmolten salts,” J. Phys. Chem. 72, 4175–4181 (1968).
7. R. H. Doremus, “Exchange and diffusion of ions in glass,” J.Phys. Chem. 68, 2212–2218 (1964).
8. P. Shewmon, Diffusion in Solids, 2nd ed. (The Minerals,Metals and Materials Society, 1989).
9. R. H. Doremus, Glass Science, 2nd ed. (Wiley, 1994), Chap. 15.10. B. Messerschmidt, C. H. Hsieh, B. L. McIntyre, and S. N.
Houde-Walter, “Ionic mobility in an ion exchanged silver-sodium boroaluminosilicate glass for micro-optics applica-tions,” J. Non-Cryst. Solids 217, 264–271 (1997).
11. H. Wakabayashi, “The relationship between kinetic and ther-modynamic properties in mixed alkali glass,” J. Non-Cryst.Solids 203, 274–279 (1996).
12. G. Stewart, C. A. Millar, P. J. R. Laybourn, C. D. W. Wilkinson,and R. M. DelaRue, “Planar optical waveguides formed bysilver ion migration in glass,” IEEE J. Quantum Electron.QE-13, 192–200 (1977).
13. G. Stewart and P. J. R. Laybourn, “Fabrication of ion-exchanged optical waveguide from diluted silver nitratemelts,” IEEE J. Quantum Electron. QE-14, 930–934 (1978).
14. H.-J. Lilienhof, E. Voges, D. Ritter, and B. Pantschew, “Field-induced index profiles of multimode ion-exchanged strip
Fig. 16. Comparison of the measured and CMT-predicted cou-pling ratios.
Fig. 17. Comparison of mode field profiles for (a) the waveguideshown in Fig. 15 and (b) a standard SMF-28 optical fiber.
1754 APPLIED OPTICS � Vol. 45, No. 8 � 10 March 2006

waveguides,” IEEE J. Quantum Electron. QE-18, 1877–1883(1982).
15. R. G. Walker, C. D. W. Wilkinson, and J. A. H. Wilkinson,“Integrated optical waveguiding structures made by silver ion-exchange in glass. 1: The propagation characteristics of stripeion-exchanged waveguides: a theoretical and experimental in-vestigation,” Appl. Opt. 22, 1923–1928 (1983).
16. R. Lagu and R. Ramaswamy, “Process and waveguide pa-rameter relationships for planar silver ion-exchanged glasswaveguides,” J. Lightwave Technol. LT-4, 176–181 (1986).
17. R. V. Ramaswamy and S. I. Najafi, “Planar, buried, ion-exchanged glass waveguides: diffusion characteristics,” IEEEJ. Quantum Electron. QE-22, 883–891 (1986).
18. L. Ro�, N. Fabricius, and H. Öeste, “Single mode integratedoptical waveguides by ion-exchange in glass,” in Proceedings ofEFOC�LAN 87 (Information Gatekeepers, 1987), pp. 99–103.
19. R. V. Ramaswamy, R. Srivastava, P. Chludzinski, and J. T.Anderson, “Influence of Ag�-Na� ion-exchange equilibrium onwaveguide index profiles,” IEEE J. Quantum Electron. 24,780–785 (1988).
20. R. V. Ramaswamy, H. C. Cheng, and R. Srivastava, “Processoptimization of buried Ag�-Na� ion-exchange waveguides:theory and experiment,” Appl. Opt. 27, 1814–1819 (1988).
21. S. Honkanen and A. Tervonen, “Experimental analysis ofAg�-Na� exchange in glass with Ag film ion sources for planaroptical waveguide fabrication,” J. Appl. Phys. 63, 634–639(1988).
22. N. Fabricius, H. Öeste, H.-J. Guttmann, H. Quast, and L. Ross,“BGG 31: a new glass for multimode waveguide fabrication,” inProceedings of EFOC�LAN 88 (Information Gatekeepers,1988), pp. 59–62.
23. L. Ro�, “Integrated optical components in substrate glasses,”Glastech Ber. 62, 285–297 (1989).
24. H. C. Cheng and R. Ramaswamy, “Simulation of tapered tran-sitions in ion-exchanged channel waveguides,” Appl. Opt. 29,1150–1156 (1990).
25. J. Albert and J. W. Y. Lit, “Full modeling of field-assisted ionexchange for graded index buried channel optical waveguides,”Appl. Opt. 29, 2798–2804 (1990).
26. M. C. Page, R. Oven, and D. G. Ashworth, “Scaling rules forglass based planar optical waveguides made by field assistedion diffusion,” Electron. Lett. 27, 2073–2076 (1991).
27. T. Poszner, G. Schreiter, and R. Muller, “Stripe waveguideswith matched refractive index profiles fabricated by ion ex-change in glass,” J. Appl. Phys. 70, 1966–1974 (1991).
28. J. Johansson, G. Djanta, and J.-L. Coutaz, “Optical wave-guides fabricated by ion exchange in high-index commercialglasses,” Appl. Opt. 31, 2796–2799 (1992).
29. I. G. Voitrnko, V. P. Reko, L. I. Sotskaya, and A. V. Tomov,“Mode interference pattern in ion-exchanged channel wave-guides,” in Proc. SPIE 1932, 2–13 (1993).
30. B. Pantchev and Z. Nikolov, “Characterization of refractiveindex profiles in silver-sodium ion-exchanged glass wave-guides for homogeneous refracting waveguide structures,”IEEE J. Quantum Electron. 29, 2459–2465 (1993).
31. D. G. Ashworth, R. Oven, and M. C. Page, “The influence of thepseudo-mixed-alkali effect on the field-assisted diffusion of
silver ions into glass for optical waveguides,” J. Phys. D 28,657–664 (1995).
32. A. Lupascu, A. Kevorkian, T. Boudet, F. Saint-Andre, D.Persegol, and M. Levy, “Modeling ion exchange in glass withconcentration-dependent diffusion coefficients and mobilities,”Opt. Eng. 35, 1603–1610 (1996).
33. A. Lupascu, A. Kevorkian, C. P. Cristescu, and I. M. Popescu,“Local electric fields in optical glasses during field-assistedionic exchanges,” in Proc. SPIE 4068, 26–32 (2000).
34. J.-E. Broquin, “Ion exchanged integrated devices,” in Proc.SPIE 4277, 105–117 (2001).
35. P. Y. Choo, J. A. Frantz, J. T. A. Carriere, D. L. Mathine, R. K.Kostuk, and N. Peyghambarian, “Measurement and modelingof ion-exchange parameters for IOG-10 glass,” Opt. Eng. 42,2812–2816 (2003).
36. A. Bradenburg, “Stress in ion-exchanged glass waveguides,” J.Lightwave Technol. LT-4, 1580–1593 (1986).
37. C. De Bernardi, S. Morasca, D. Scarano, A. Camera, andM. Morra, “Compositional and stress-optical effects in glasswaveguides: comparison between K-Na and Ag-Na ion ex-change,” J. Non-Cryst. Solids 119, 195–204 (1990).
38. R. Araujo, “Colorless glasses containing, ion-exchanged sliver,”Appl. Opt. 31, 5221–5224 (1992).
39. C. Kaps and W. Fliegel, “Sodium�silver ion exchange betweena non-bridging oxygen-free boroaluminosilicate glass and ni-trate melts,” Glastech. Ber. 64, 199–204 (1991).
40. R. W. Laity, “Fused salt concentration cells with transference.Activity coefficients in the system silver nitrate-sodium ni-trate,” J. Am. Chem. Soc. 79, 1849–1851 (1957).
41. R. Goring and M. Rothhardt, “Application of the refractednear-field technique to multimode planar and channel wave-guides in glass,” J. Opt. Commun. 7, 82–85 (1986).
42. J. Crank, The Mathematics of Diffusion (Clarendon, 1976),Chap. 7.
43. W. Beier and G. H. Frischat, “Transport mechanisms in alkalisilicate glasses,” J. Non-Cryst. Solids 73, 113–133 (1985).
44. S. A. Poling and S. N. Houde-Walter, “Structural factors insilver-induced relaxation in aluminosilicate glasses,” J. Non-Cryst. Solids 293–295, 430–439 (2001).
45. R. Terai, H. Wakabayashi, and H. Yamanaka, “Haven ratio inmixed alkali glass,” J. Non-Cryst. Solids 103, 137–142 (1988).
46. H. Wakabayashi, “The relationship between kinetic and ther-modynamic properties in mixed alkali glass,” J. Non-Cryst.Solids 203, 274–279 (1996).
47. D. E. Day, “Mixed alkali glasses—their properties and uses,” J.Non-Cryst. Solids 21, 343–372 (1976).
48. G. Chartier, P. Collier, A. Guez, P. Jaussaud, and Y. Won,“Graded-index surface or buried waveguides by ion exchangein glass,” Appl. Opt. 19, 1092–1095 (1980).
49. G. Li and K. A. Winick, “Integrated optical ring resonatorsfabricated by silver ion exchange in glass,” in Conference onLasers & Electro-Optics (Optical Society of America, 2004),paper CWA63.
50. K. Okamoto, Fundamentals of Optical Waveguides (Academic,2000), Chap. 4.
51. T. Tamir, ed., Guided-Wave Optoelectronics (Springer-Verlag,1988), Chap. 2.
10 March 2006 � Vol. 45, No. 8 � APPLIED OPTICS 1755