
System Sciences Using a laser measurement system for ... · QuickSurf 5.1 extension for AutoCAD...
11
Natural Hazards and Earth System Sciences (2005) 5: 143–153 SRef-ID: 1684-9981/nhess/2005-5-143 European Geosciences Union © 2005 Author(s). This work is licensed under a Creative Commons License. Natural Hazards and Earth System Sciences Using a laser measurement system for monitoring morphological changes on the Strug rock fall, Slovenia M. Mikoˇ s, A. Vidmar, and M. Brilly Faculty of Civil and Geodetic Engineering, University of Ljubljana, Ljubljana, Slovenia Received: 14 September 2004 – Revised: 12 January 2005 – Accepted: 23 January 2005 – Published: 28 January 2005 Part of Special Issue “Landslides and debris flows: analysis, monitoring, modeling and hazard” Abstract. A medium-ranged high performance handheld re- flectorless laser measurement system, was used for a mor- phological survey on the Strug rock fall in W Slovenia in the period from August 2003 to August 2004. The purpose was to evaluate its potential for monitoring ground surface changes in rock fall source areas and to help evaluating mor- phological changes by measuring distance from fixed points. In the area, 21 fixed geodetic points have been established. Altogether, seven measurement sets with more than 5500 points have been gathered in the rock fall area. Choosing a point cloud with a density of less than 1 point per 10 m 2 on a very rough rock fall surface failed to be a good solu- tion. The changes on larger areas were shown by displace- ments of selected significantly large-sized rock blocks with a volume of several m 3 . Because only smaller changes were observed between the single field series, the rock fall sur- face generally remained unchanged. Local surface changes of the order of 1 m or more, were clearly shown by measure- ments in the selected referenced cross sections. The usage of these cross sections gave a possibility to evaluate volumetric changes on the surface. The laser measurement system pro- vided a good replacement for the classical terrestrial geodetic survey equipment, especially when performing remote mon- itoring of morphological changes in rock fall hazard zones, however, the case is different when fixed points are to be measured precisely. 1 Introduction There is a requirement for rapid and remote monitoring of rock faces especially rock fall source areas in order to evalu- ate their dynamics and potential hazard. The rapid develop- ment of various surveying approaches has opened wide pos- sibilities for advanced monitoring of different slope instabil- ity processes, such as landslides, rock falls, mudflows and de- Correspondence to: M. Mikoˇ s ([email protected]) bris flows. These methodologies can be divided on one hand into point-based (Total Station, GPS) and area-based tech- niques (Photogrammetry, Laser Scanning, and Remote Sens- ing) (Bitelli et al., 2004) and on the other hand to spaceborn, airborn or terrestrial techniques. The ground-based tech- niques are increasingly being combined with other classical research field techniques widely used, such as extensome- ters, inclinometers, video cameras (Angeli et al., 2000). All the measured field data can be put into a geodetic database (Jaboyedoff et al., 2004). For continuous observations on landslides and rock falls various ground-based techniques were successfully applied under real field conditions, such as digital photogramme- try combined with Global Positioning System (Mora et al., 2003), static and real kinematic GPS methods (Gili et al., 2000), ground-based SAR interferometry (Tarchi et al., 2003) or laser scanner (Scheikl et al., 2001). These techniques can be coupled with a warning system for landslide hazard management or used to develop multi- temporal Digital Terrain Models (DTMs) that provide in- formation on geometry, changes of volumes, and evolution of phenomena, such as its displacement or virtual velocity (Mora et al., 2003). Since each landslide is different and thus characterised by the way it has developed, it is necessary to choose an adequate monitoring system on the basis of the preliminary analysis of a phenomenon (Mora et al., 2003). For rock falls with high activity it is not wise to plan a monitoring system using Electronic Distance Meters (EDMs) or the Electronic Theodolite and fixed reflecting prisms that might be easily destroyed. Similarly, it is not advisable to perform regular measurements by walking with reflectors on the rock fall surface. For rock falls or simi- lar hazardous conditions as are prevailing in the case of vol- canoes a laser scanner system is often used for monitoring purposes (Scheikl et al., 2001; Hunter et al., 2003). Terres- trial Laser Scanners (TLS) are designed to digitise geome- try of real environments with high precision and high accu- racy. They enable non-contact measurements of thousands of single points in the form of point clouds in a rather short
Transcript of System Sciences Using a laser measurement system for ... · QuickSurf 5.1 extension for AutoCAD...

Natural Hazards and Earth System Sciences (2005) 5: 143–153SRef-ID: 1684-9981/nhess/2005-5-143European Geosciences Union© 2005 Author(s). This work is licensedunder a Creative Commons License.
Natural Hazardsand Earth
System Sciences
Using a laser measurement system for monitoring morphologicalchanges on the Strug rock fall, Slovenia
M. Miko s, A. Vidmar, and M. Brilly
Faculty of Civil and Geodetic Engineering, University of Ljubljana, Ljubljana, Slovenia
Received: 14 September 2004 – Revised: 12 January 2005 – Accepted: 23 January 2005 – Published: 28 January 2005
Part of Special Issue “Landslides and debris flows: analysis, monitoring, modeling and hazard”
Abstract. A medium-ranged high performance handheld re-flectorless laser measurement system, was used for a mor-phological survey on the Strug rock fall in W Slovenia inthe period from August 2003 to August 2004. The purposewas to evaluate its potential for monitoring ground surfacechanges in rock fall source areas and to help evaluating mor-phological changes by measuring distance from fixed points.In the area, 21 fixed geodetic points have been established.Altogether, seven measurement sets with more than 5500points have been gathered in the rock fall area. Choosinga point cloud with a density of less than 1 point per 10 m2
on a very rough rock fall surface failed to be a good solu-tion. The changes on larger areas were shown by displace-ments of selected significantly large-sized rock blocks witha volume of several m3. Because only smaller changes wereobserved between the single field series, the rock fall sur-face generally remained unchanged. Local surface changesof the order of 1 m or more, were clearly shown by measure-ments in the selected referenced cross sections. The usage ofthese cross sections gave a possibility to evaluate volumetricchanges on the surface. The laser measurement system pro-vided a good replacement for the classical terrestrial geodeticsurvey equipment, especially when performing remote mon-itoring of morphological changes in rock fall hazard zones,however, the case is different when fixed points are to bemeasured precisely.
1 Introduction
There is a requirement for rapid and remote monitoring ofrock faces especially rock fall source areas in order to evalu-ate their dynamics and potential hazard. The rapid develop-ment of various surveying approaches has opened wide pos-sibilities for advanced monitoring of different slope instabil-ity processes, such as landslides, rock falls, mudflows and de-
Correspondence to:M. Mikos([email protected])
bris flows. These methodologies can be divided on one handinto point-based (Total Station, GPS) and area-based tech-niques (Photogrammetry, Laser Scanning, and Remote Sens-ing) (Bitelli et al., 2004) and on the other hand to spaceborn,airborn or terrestrial techniques. The ground-based tech-niques are increasingly being combined with other classicalresearch field techniques widely used, such as extensome-ters, inclinometers, video cameras (Angeli et al., 2000). Allthe measured field data can be put into a geodetic database(Jaboyedoff et al., 2004).
For continuous observations on landslides and rock fallsvarious ground-based techniques were successfully appliedunder real field conditions, such as digital photogramme-try combined with Global Positioning System (Mora etal., 2003), static and real kinematic GPS methods (Gili etal., 2000), ground-based SAR interferometry (Tarchi et al.,2003) or laser scanner (Scheikl et al., 2001).
These techniques can be coupled with a warning systemfor landslide hazard management or used to develop multi-temporal Digital Terrain Models (DTMs) that provide in-formation on geometry, changes of volumes, and evolutionof phenomena, such as its displacement or virtual velocity(Mora et al., 2003). Since each landslide is different and thuscharacterised by the way it has developed, it is necessary tochoose an adequate monitoring system on the basis of thepreliminary analysis of a phenomenon (Mora et al., 2003).
For rock falls with high activity it is not wise to plana monitoring system using Electronic Distance Meters(EDMs) or the Electronic Theodolite and fixed reflectingprisms that might be easily destroyed. Similarly, it is notadvisable to perform regular measurements by walking withreflectors on the rock fall surface. For rock falls or simi-lar hazardous conditions as are prevailing in the case of vol-canoes a laser scanner system is often used for monitoringpurposes (Scheikl et al., 2001; Hunter et al., 2003). Terres-trial Laser Scanners (TLS) are designed to digitise geome-try of real environments with high precision and high accu-racy. They enable non-contact measurements of thousandsof single points in the form of point clouds in a rather short

144 M. Mikos et al.: Morphological changes on the Strug rock fall
Fig. 1. Upslope view of the Strug rock fall source area from thefixed geodetic point “STKOS1” towards the scar of the rock fall.
time. When choosing an adequate laser scanner measure-ment system (medium-range, long-range), it should also becost-effective.
For the Strug rock fall triggered on 22 December, 2001spreading over an area of 6.02 ha (Mikos et al., 2005) a hand-held laser measurement system used on a tripod rather than amore expensive laser scanner was selected in order to moni-tor morphological changes on its surface.
2 The Strug rock fall test area
The Strug rockslide above the Kosec village near Kobarid inthe Julian Alps, W Slovenia, was initiated in December 2001(Fig. 1). It had an estimated volume of 95 000 m3 and wastriggered on the contact between high permeable calcareousrocks (Cretaceous scaglia) thrusted over nearly impermeableclastic rocks (Cretaceous flysch) (Fig. 2). After a suddendrop of 15 m in December 2001, the rockslide average ve-locity exponentially slowed down to less than 10 m/year tillthe end of 2002, and came to a practical stillstand in 2003.
Soon after the rockslide initiation a rock fall with a vol-ume of 45 000 m3 was initiated on 22 December 2001 withinthe rockslide. The kinetic push of the rock fall caused amovement of a translational soil landslide with a volumeof 180 000 m3, which filled up the torrential ravine of theBrusnik Stream (Fig. 2). During the slip of the landslidefor some 50 vertical metres, an up to 8-m high scarp wasformed due to side relaxation on its right-hand side (look-ing downslide). This is how the side support of the un-stable masses to the right of the landslide decreased and anew smaller landslide commenced. This slide was called the“right-hand side relaxation landslide” and has a volume ofapproximately 35 000 m3.
After the rainfall in spring 2002, small debris flows of avolume of up to 1000 m3 started to flow from the rock falldeposits over the landslide to and along the channel of the
Brusnik Stream. This rather small debris-flow magnitudesare not often reported in literature, but may be very hazardous(Marchi and D’Agostino, 2004). Such small-magnitude de-bris flows were measured in the Eastern Italian Alps typicallyfor basin areas of less than 1 km2 (D’Agostino and Marchi,2001), quite comparable to the Strug rock fall case.
The main source for debris flows was a gully that formedin 2002 in the lower accumulation part of the rock fall. In2002, more than 20 debris flow events were registered. Lo-cally, the rainfall intensities were measured and a correlationwith the debris flow events was established. The analysisshowed that debris flows were initiated when the daily rain-fall reached more than 20 to 30 mm/day, depending on theantecedent precipitation (Mikos et al., 2005). In early 2003and later on, debris flows were no longer observed and thus aquestion was raised, whether the frequency of falling stoneswas much lower than in 2002 and so the debris flow eventswere mainly governed by the fresh supply of released mate-rial in the rock fall source area. With respect to the answer tothe raised question, a monitoring system of the rock fall ac-tivity and its morphological changes was established in 2003using laser technology.
3 Methods
The medium-ranged LaserAce® 300 measurement system(MDL, 2004) is a low-cost but high performance hand-heldreflectorless laser measurement system that incorporates aninclinometer and a solid state fluxgate compass (Fig. 1; Ta-ble 1).
For best performance, it operates from a tripod by view-ing through its viewfinder and by placing the laser beam onthe selected point (natural target, reflector) by hand. It is notmeant to operate automatically as a full laser scanner. There-fore its output given as the size of the measured point cloudsis rather limited. Raw data (distance in metres, horizontaland vertical angle in degrees) can be then transferred to pe-ripheral devices (handheld PC, data loggers) using a standardRS232 serial link.
A pocket computer was used for data collection from theserial port. A computer program was developed in Qbasic(Microsoft, 2004) for handling of raw data and for prepa-ration of a script file for further use in the AutoCAD® en-vironment (output in *.dwg files) (Autodesk, 2004). TheQuickSurf 5.1 extension for AutoCAD (Schreiber, 2004) wasused for plotting the 3D-georeferenced points and furtherdata analysis (3D TIN, Contour, and Grid models).
In the field, the terrain surface itself and additionally se-lected significant objects (i.e. large rocks, small ravines orgullies, cracks) were measured. Using these data a compos-ite 3-D Digital Terrain Model were formed. Using the sub-sequent field measurements, new 3-D models were formed.Together they form a 3-D space and time model. In changesof the model surface were tracking the displacements of sin-gle objects. Changes of erosional features locations likegullies were observed within the precision limits of the sys-

M. Mikos et al.: Morphological changes on the Strug rock fall 145
Fig. 2. The Strug rock fall and different slope instability phenomena.
Table 1. Specification of the LaserAce® 300 Measurement System (MDL, 2004), powered by 2 internal AA batteries (1.5 V) and weighingonly 600 g. The compass is powered by 6 external AA batteries (1.5 V) and weighs 50 g.
Measurement parameter Specification
Maximum range typically 300 m in passive mode and 5 km with reflectorsMinimum range 10 mAccuracy typically±10 cmResolution 1 cmTime 0.3 sBeam divergence approximately 3.1 mrad (i.e. 310 mm beam width per 100 m range)Scanning range −90◦ to +90◦ vertical angle (inclinometer) by 360◦ horizontal angle (compass)Inclinometer accuracy 0.3◦ at 0◦
Inclinometer resolution 0.1◦
Compass accuracy typically better than 1◦
Compass resolution 0.1◦
tem, which were±10 cm under ideal conditions. Fog or rainwill hinder the measurements by obscuring the targets or byscattering the laser beam on rain drops. Therefore, the lasermeasurement system was not used under such field condi-tions.
The Geodetic Institute of Slovenia prepared a comparisonbetween the topography of the Strug rock fall source areabefore and after its triggering in December 2001. For thetopography before the event, aerial photographs were usedfrom the cyclic campaign, which was performed in August2000. At that time vegetation was abundant and becausethe slope was under forest before the event, the topographywas rather approximate and thus defined in only some visiblepoints. Also older aerial photographs from 1975 were ratherobscured by forest and only some additional terrain points
were taken. A map with equidistances at 10 m was preparedusing the computer program QuickSurf® (Schreiber, 2004).Since no old reference geodetic points were available in thearea, the precision of this map was assessed as rather badwith no detailed numeric values for precision.
For the determination of 21 fixed geodetic points in theStrug rock fall area, a combined classical terrestrial geode-tic surveying and field GPS campaign was performed us-ing three geodetic GPS receivers, type 4000 Ssi from Trim-ble Navigation (Trimble, 2004), and an electronic Leicatachometer, type TC 603L (Leica, 2004). All computationsof raw geodetic data from this survey were done using thesoftware package LisCAD ver. 6.0 (Listech, 2004). Thetransformation of co-ordinates of the points measured by theGPS survey in the ETRS’89 co-ordinates was applied using

146 M. Mikos et al.: Morphological changes on the Strug rock fall
Table 2. Overview of 21 fixed geodetic points in the Strug rockfall source area (No. 1 through No. 13 are reinforcement iron barsdrilled to a rock or terrain with a supplement for a reflector, andNo. 14 through No. 21 are CDROMs attached to rocks and trees).
No. Point ID Remarks
1 ST KOS1 rock2 ST KOS2 reflector under large rock3 ST KOS3 large rock4 ST04 rock5 ST05 nailed into the ground outside the rock fall6 ST06 drilled into the ground in the middle of the rock fall7 ST VRH smaller rock above the scar8 SK I rock9 SK II rock10 SK III rock11 SK IV rock12 SK V rock13 SK VII rock14 CD 1 tree15 CD 2 stable rock in the forest16 CD 3 tree in the forest17 CD 4 fallen tree on the rock fall18 CD 5 tree on a crest on the rock fall19 CD 6 tree near the erosive channel20 CD I tree in the slump21 CD II wooden stake at the end of the slump
spatial 7-parametric Helmert’s transformation, so that the po-sitions of these points were afterwards given in the state co-ordinate system. These 21 fixed points served in 2003 and2004 as the basic network for geodetic measurements usingthe laser measurement system and will in future enable fur-ther combinations with other geodetic products (i.e. DEM,orthophoto from aerial photographs).
4 Field measurements
Parallel to geodetic measurements, rainfall intensities in theStrug rock fall area were measured, using two pluviometers(instruments for measuring the depth of water from precipi-tation at a point) with the tipping bucket technology and res-olution of 0.2 mm, and an event data logger. Raw data weretransformed into 10-min rainfall intensities for further anal-ysis.
4.1 Determination of fixed geodetic points in the area
The Strug rock fall area is a hard-to-access terrain, so a clas-sical geodetic survey using i.e. an electronic theodolite andreflecting prisms would demand hard fieldwork and might bedangerous. Thus, as part of the field preparation work, al-together 21 geodetic points were fixed in the Strug rock fallarea (Table 2). They were put into the state coordinate sys-
tem during a combined classical terrestrial geodetic survey-ing and field GPS campaign on 2 October 2003.
The fixed geodetic points (natural and artificial reflectors)on the Strug landslide (Fig. 3) can be split into the basepoint “ST KOS1”, the orientation point “STKOS3”, thestable points “STVRH”, “ST KOS2”, and “ST04” through“ST06”, and the additional points “CD1” through “CD II”using CDROMs on trees as reflectors. The CDROMs werequickly removed by wind and rainfall, and later replaced. Itcan be assumed that the base point “STKOS1” and the orien-tation point “STKOS3” were stable during the GPS and theclassical terrestrial geodetic survey on 2 October 2003. Thestable points “STVRH” and “ST KOS2” lay on the edge ofthe rock fall source area (Fig. 3).
The surface of the Strug rock fall source is very rough.On such a rough surface the laser device specification, weused, would need to measure roughly 1 point per 1 m2 in or-der to get a very precise Digital Terrain Model, which wasimposible considering the area of 6 ha of the rock fall. Thechoice was then to measure larger rock blocks with a volumeof the order of several m3 as indicators of the rock fall ac-tivity. Therefore, six fixed geodetic points “SKI” through“SK VI” were chosen on large rocks on the rock fall surface(Fig. 3). These geodetic points were stabilised using a 50–60 cm long steel reinforcement bars, drilled into the rocksand with a rust-resistant supplement for the reflector on itstop. The spatial co-ordinates of these fixed geodetic pointswere defined indirectly by measuring angles resp. directionsand lengths in the geodetic network. The planar co-ordinateswere given for the centre of the reinforcement bars and thealtitude was given for the contact between the bar and therust-resistant supplement.
4.2 Geodetic measurements using the laser measurementsystem
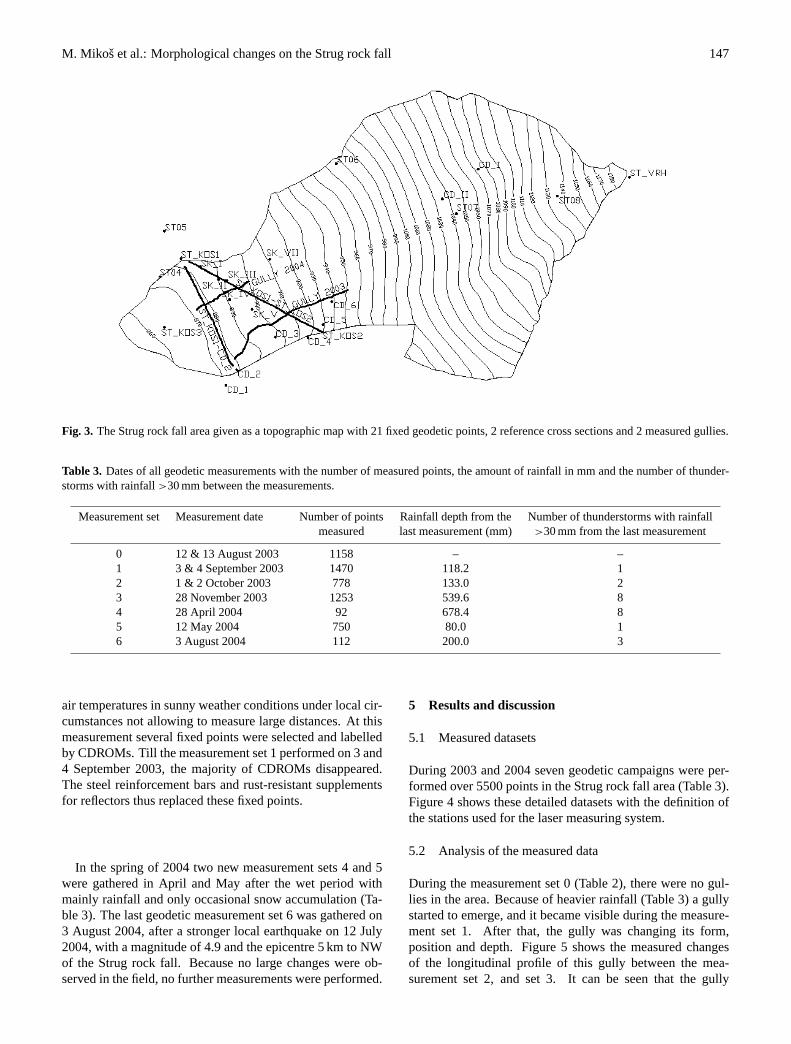
Each geodetic measurement was composed of distance mea-surements from and to the selected fixed geodetic points (Ta-ble 2, Fig. 3), and to selected points on the rock fall sur-face. Additionally, two cross sections were selected in theaccumulation area. The upper cross section “STKOS1–ST KOS2” was selected in a steeper terrain and a little bitoblique to the rock fall steepest descent. The lower crosssection “STKOS1–CD2” was selected in a more gentle ter-rain. In the upper cross section the lowering of the terraindue to gravity and in the lower cross section accumulationof the rock fall material and its occasional erosion by waterhave been expected. Also, at the subsequent measurementsa gully was observed and its dynamics should help interprettogether with the rainfall dynamics in the area the debris flowgeneration. Figure 3 shows the Strug rock fall area with theused fixed stations and other fixed geodetic points (steel re-inforcement bars on rocks and CDROMs on rocks and trees),as well as both measured cross sections and the gullies.
In 2003, four geodetic measurement sets were gathered inthe field (Table 3). The measurement set 0 (“zero measure-ment”) on 12 and 13 August 2003 was performed during high
M. Mikos et al.: Morphological changes on the Strug rock fall 147
Fig. 3. The Strug rock fall area given as a topographic map with 21 fixed geodetic points, 2 reference cross sections and 2 measured gullies.
Table 3. Dates of all geodetic measurements with the number of measured points, the amount of rainfall in mm and the number of thunder-storms with rainfall>30 mm between the measurements.
Measurement set Measurement date Number of points Rainfall depth from the Number of thunderstorms with rainfallmeasured last measurement (mm) >30 mm from the last measurement
0 12 & 13 August 2003 1158 – –1 3 & 4 September 2003 1470 118.2 12 1 & 2 October 2003 778 133.0 23 28 November 2003 1253 539.6 84 28 April 2004 92 678.4 85 12 May 2004 750 80.0 16 3 August 2004 112 200.0 3
air temperatures in sunny weather conditions under local cir-cumstances not allowing to measure large distances. At thismeasurement several fixed points were selected and labelledby CDROMs. Till the measurement set 1 performed on 3 and4 September 2003, the majority of CDROMs disappeared.The steel reinforcement bars and rust-resistant supplementsfor reflectors thus replaced these fixed points.
In the spring of 2004 two new measurement sets 4 and 5were gathered in April and May after the wet period withmainly rainfall and only occasional snow accumulation (Ta-ble 3). The last geodetic measurement set 6 was gathered on3 August 2004, after a stronger local earthquake on 12 July2004, with a magnitude of 4.9 and the epicentre 5 km to NWof the Strug rock fall. Because no large changes were ob-served in the field, no further measurements were performed.
5 Results and discussion
5.1 Measured datasets
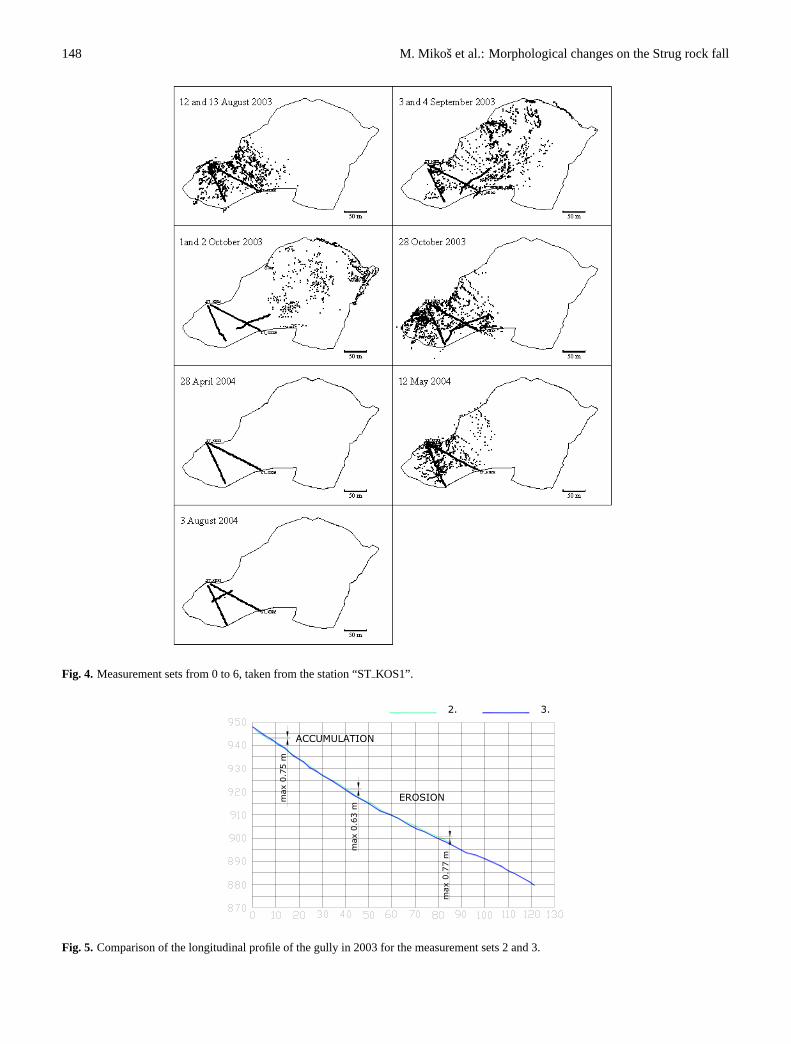
During 2003 and 2004 seven geodetic campaigns were per-formed over 5500 points in the Strug rock fall area (Table 3).Figure 4 shows these detailed datasets with the definition ofthe stations used for the laser measuring system.
5.2 Analysis of the measured data
During the measurement set 0 (Table 2), there were no gul-lies in the area. Because of heavier rainfall (Table 3) a gullystarted to emerge, and it became visible during the measure-ment set 1. After that, the gully was changing its form,position and depth. Figure 5 shows the measured changesof the longitudinal profile of this gully between the mea-surement set 2, and set 3. It can be seen that the gully
148 M. Mikos et al.: Morphological changes on the Strug rock fall
Fig. 4. Measurement sets from 0 to 6, taken from the station “STKOS1”.
2. 3.
max
0.6
3m
max
0.7
7m
EROSION
ACCUMULATION
max
0.7
5m
Fig. 5. Comparison of the longitudinal profile of the gully in 2003 for the measurement sets 2 and 3.

M. Mikos et al.: Morphological changes on the Strug rock fall 149
Table 4. Changes in position of the fixed geodetic points on rocks between selected measurements; rounded values to 1 cm should be seenwithin the accuracy of the laser measurement system of±10 cm (legend: positive axis x is oriented towards E, positive axis y is orientedtowards N, and the rock fall steepest gradient is oriented towards SWW, that is to the opposite direction).
Measurement set 1–set 3 Measurement set 1–set 5 Measurement set 3–set 5 Measurement set 5–set 6
Point ID 1x (cm) 1y (cm) 1z (cm) 1l (cm) 1x (cm) 1y (cm) 1z (cm) 1l (cm) 1x (cm) 1y (cm) 1z (cm) 1l (cm) 1x (cm) 1y (cm) 1z (cm) 1l (cm)
SK I 1 2 −17 18 −6 −37 −77 86 −5 −35 −95 101 8 17 −3 19SK II 7 −10 −25 28.7 −44 −90 −111 150 −36 −100 −137 173 4 −2 −32 32SK III −1 −4 −16 17 −5 −28 −103 107 −6 −32 −119 124 44 80 −7 91SK IV −2 −14 −27 30 −58 −57 −156 176 −60 −72 −183 206 45 48 −38 76SK V −2 −1 −1 3
SK VII −3 −2 1 4
changed its headcut location and considerably lengthenedby approximately 40 m towards the landslide. In its upperpart, at the headcut of the gully, material accumulation of ap-prox. 75 cm was measured. In its middle and lower parts thegully deepened by 63–77 cm. Later, due to large morpho-logical changes of the rock fall surface, which was betweenthe measurement sets 3 and 5, it disappeared (it was filled upwith the falling material). On the western part of the rockfall a new gully was initiated and it was noticed in May 2004(Fig. 6), but the channel was so deep that it could not be mea-sured using a 2.15-m long pole. In August 2004, this gullywas partially filled up and thus shallow enough to be mea-sured.
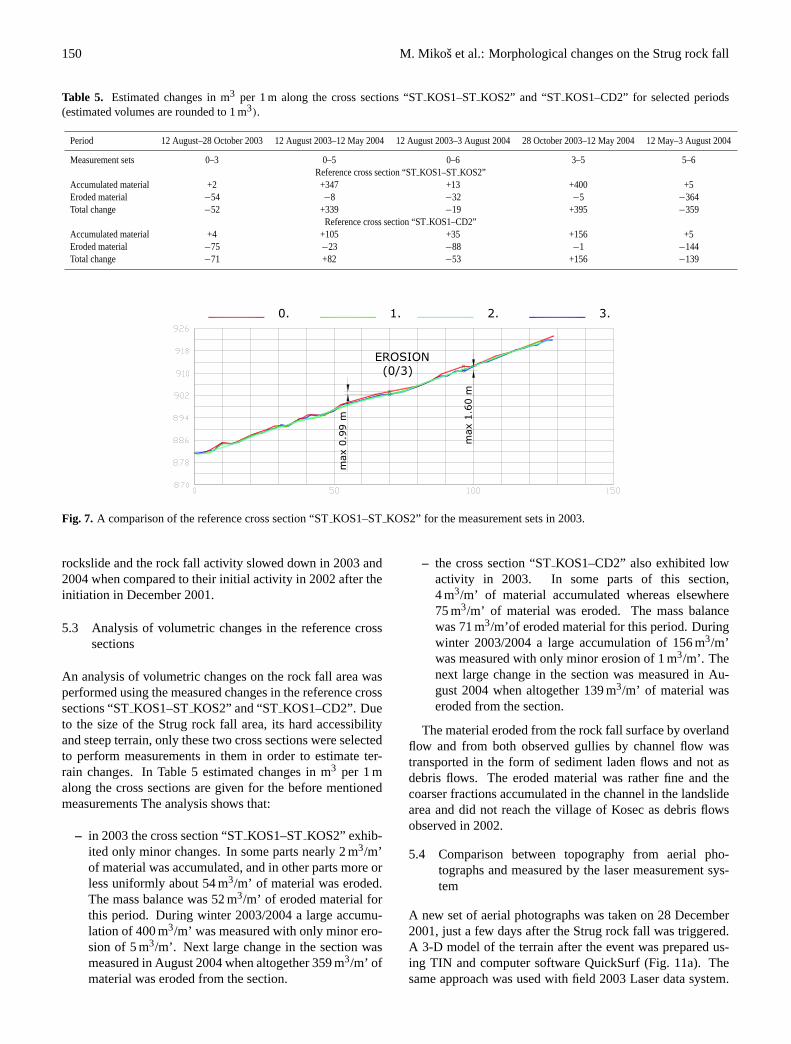
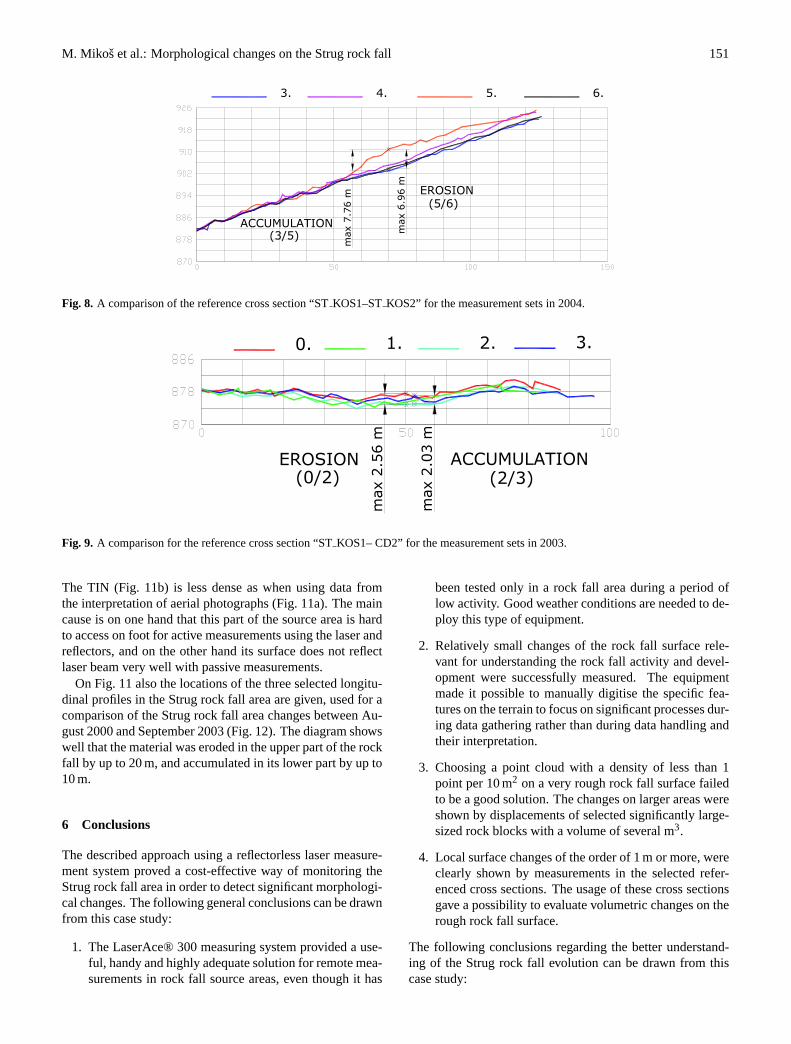
A comparison for the reference cross section “STKOS1–ST KOS2” (Figs. 7 and 8) indicates that the section deep-ened in 2003 due to erosion of the material from this part ofthe rock fall. In 2002 numerous debris flows from the areareached the village of Kosec (Mikos et al., 2005). It can beassumed that the debris material originated from this part ofthe Strug rock fall source area. In the upper part of the crosssection where it cut the gully, up to 1.6 m of material waseroded, in the middle of the cross section it was less, i.e.only up to 1.0 m. In 2004, the lower part of the cross sectionremained more or less unchanged. In the upper part of thesection, the material from higher parts of the rock fall wasfirstly accumulating, between the measurement sets 3 and 5for a maximum of 7.8 m. After that, this part was to a largeextent eroded again, between the measurement sets 5 and 6for a maximum of 7.0 m.
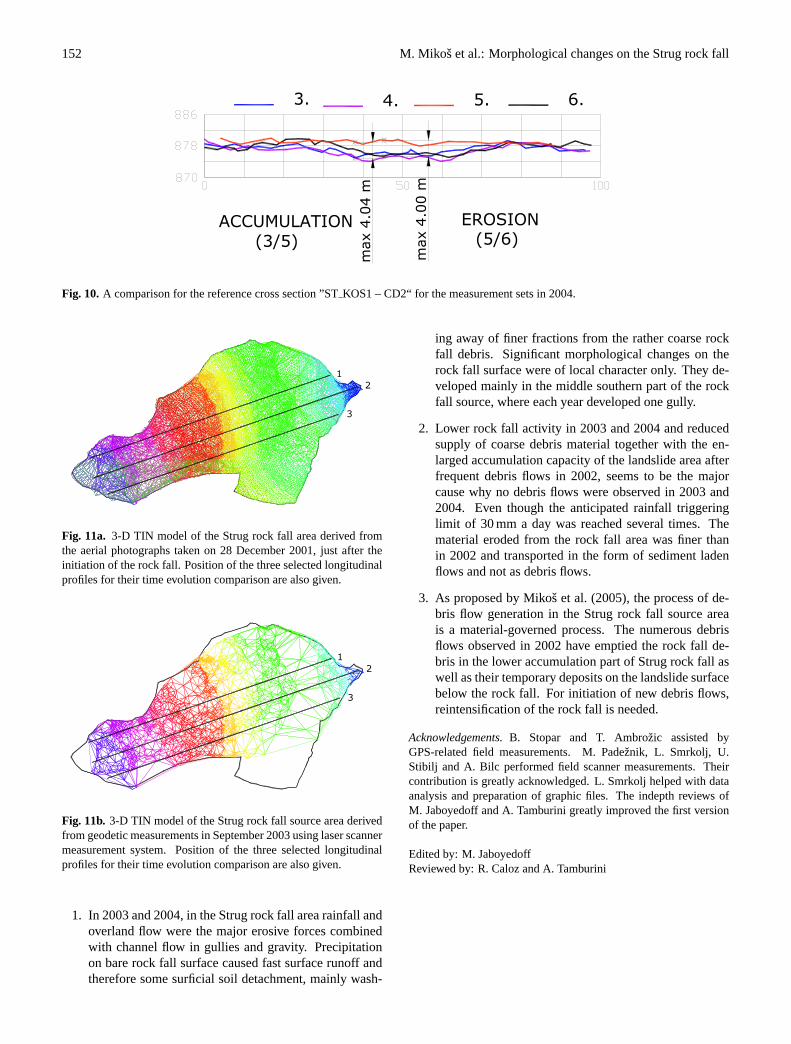
A comparison for the reference cross section “STKOS1–CD2” for the measurements in 2003 (Fig. 9) and in 2004(Fig. 10) is shown. It can be seen that the whole cross sec-tion deepened (material was eroded) between the measure-ment sets 0 and 2. The erosion depth was around 2 m, maxi-mum was 2.6 m. Between the measurement sets 2 and 3, thecross section was partially filled with new falling material,the maximum accumulation depth was 2.0 m. In 2004, theaccumulation between the measurement sets 3 and 5 was ad-ditional 4.0 m at its maximum. After that, the cross sectionwas eroded again, between the measurements 5 and 6 for amaximum of 4.0 m.
Fig. 6. New gully was part of the measurement set 5 on 12 May2004.
It should be mentioned that both cross sections were onlyfixed on both ends and not in-between. Thus smaller errorswere associated with the measurements due to the possibleshift of points on the rock fall surface when measured thenext time. Nevertheless, the interpretation of erosion and ac-cumulation process in this part of the rock fall source area isnot misjudged.
During the measurement set 5 two rocks (“SKV” and“SK VII”) were no more present (they eroded or were cov-ered by falling material). In Table 4, measured displacementsof these fixed geodetic points on rocks are given. The largestdisplacement observed in this period was 206 cm for the fixedgeodetic point on the rock “SKIV”. It can be seen that somemeasured displacements are close to the laser scanner’s ac-curacy of±10 cm and therefore they should be consideredwithin the accuracy limits and thus rather measurement er-rors. This conclusion is even more stressed by the fact thatthe vectors of such measured displacements exhibit move-ments up the slope. Nevertheless, the comparison betweenmeasurement sets 1 and 5, and 3 and 5 shows displacementsof the order of 1–2 m. If this value is compared to the aver-age virtual velocity of the rockslide of 1.2 m a month, mea-sured in 2002 (Mikos et al., 2005), it becomes clear that the
150 M. Mikos et al.: Morphological changes on the Strug rock fall
Table 5. Estimated changes in m3 per 1 m along the cross sections “STKOS1–STKOS2” and “STKOS1–CD2” for selected periods(estimated volumes are rounded to 1 m3).
Period 12 August–28 October 2003 12 August 2003–12 May 2004 12 August 2003–3 August 2004 28 October 2003–12 May 2004 12 May–3 August 2004
Measurement sets 0–3 0–5 0–6 3–5 5–6Reference cross section “STKOS1–STKOS2”
Accumulated material +2 +347 +13 +400 +5Eroded material −54 −8 −32 −5 −364Total change −52 +339 −19 +395 −359
Reference cross section “STKOS1–CD2”Accumulated material +4 +105 +35 +156 +5Eroded material −75 −23 −88 −1 −144Total change −71 +82 −53 +156 −139
0.
EROSION
max
0.9
9m
max
1.6
0m
1. 2. 3.
(0/3)
Fig. 7. A comparison of the reference cross section “STKOS1–STKOS2” for the measurement sets in 2003.
rockslide and the rock fall activity slowed down in 2003 and2004 when compared to their initial activity in 2002 after theinitiation in December 2001.
5.3 Analysis of volumetric changes in the reference crosssections
An analysis of volumetric changes on the rock fall area wasperformed using the measured changes in the reference crosssections “STKOS1–STKOS2” and “STKOS1–CD2”. Dueto the size of the Strug rock fall area, its hard accessibilityand steep terrain, only these two cross sections were selectedto perform measurements in them in order to estimate ter-rain changes. In Table 5 estimated changes in m3 per 1 malong the cross sections are given for the before mentionedmeasurements The analysis shows that:
– in 2003 the cross section “STKOS1–STKOS2” exhib-ited only minor changes. In some parts nearly 2 m3/m’of material was accumulated, and in other parts more orless uniformly about 54 m3/m’ of material was eroded.The mass balance was 52 m3/m’ of eroded material forthis period. During winter 2003/2004 a large accumu-lation of 400 m3/m’ was measured with only minor ero-sion of 5 m3/m’. Next large change in the section wasmeasured in August 2004 when altogether 359 m3/m’ ofmaterial was eroded from the section.
– the cross section “STKOS1–CD2” also exhibited lowactivity in 2003. In some parts of this section,4 m3/m’ of material accumulated whereas elsewhere75 m3/m’ of material was eroded. The mass balancewas 71 m3/m’of eroded material for this period. Duringwinter 2003/2004 a large accumulation of 156 m3/m’was measured with only minor erosion of 1 m3/m’. Thenext large change in the section was measured in Au-gust 2004 when altogether 139 m3/m’ of material waseroded from the section.
The material eroded from the rock fall surface by overlandflow and from both observed gullies by channel flow wastransported in the form of sediment laden flows and not asdebris flows. The eroded material was rather fine and thecoarser fractions accumulated in the channel in the landslidearea and did not reach the village of Kosec as debris flowsobserved in 2002.
5.4 Comparison between topography from aerial pho-tographs and measured by the laser measurement sys-tem
A new set of aerial photographs was taken on 28 December2001, just a few days after the Strug rock fall was triggered.A 3-D model of the terrain after the event was prepared us-ing TIN and computer software QuickSurf (Fig. 11a). Thesame approach was used with field 2003 Laser data system.
M. Mikos et al.: Morphological changes on the Strug rock fall 151
max
7.7
6m
ACCUMULATION
6.
EROSION
max
6.9
6m
3. 4. 5.
(3/5)
(5/6)
Fig. 8. A comparison of the reference cross section “STKOS1–STKOS2” for the measurement sets in 2004.
max
2.0
3m
max
2.5
6m
2.0. 3.1.
EROSION ACCUMULATION(0/2) (2/3)
Fig. 9. A comparison for the reference cross section “STKOS1– CD2” for the measurement sets in 2003.
The TIN (Fig. 11b) is less dense as when using data fromthe interpretation of aerial photographs (Fig. 11a). The maincause is on one hand that this part of the source area is hardto access on foot for active measurements using the laser andreflectors, and on the other hand its surface does not reflectlaser beam very well with passive measurements.
On Fig. 11 also the locations of the three selected longitu-dinal profiles in the Strug rock fall area are given, used for acomparison of the Strug rock fall area changes between Au-gust 2000 and September 2003 (Fig. 12). The diagram showswell that the material was eroded in the upper part of the rockfall by up to 20 m, and accumulated in its lower part by up to10 m.
6 Conclusions
The described approach using a reflectorless laser measure-ment system proved a cost-effective way of monitoring theStrug rock fall area in order to detect significant morphologi-cal changes. The following general conclusions can be drawnfrom this case study:
1. The LaserAce® 300 measuring system provided a use-ful, handy and highly adequate solution for remote mea-surements in rock fall source areas, even though it has
been tested only in a rock fall area during a period oflow activity. Good weather conditions are needed to de-ploy this type of equipment.
2. Relatively small changes of the rock fall surface rele-vant for understanding the rock fall activity and devel-opment were successfully measured. The equipmentmade it possible to manually digitise the specific fea-tures on the terrain to focus on significant processes dur-ing data gathering rather than during data handling andtheir interpretation.
3. Choosing a point cloud with a density of less than 1point per 10 m2 on a very rough rock fall surface failedto be a good solution. The changes on larger areas wereshown by displacements of selected significantly large-sized rock blocks with a volume of several m3.
4. Local surface changes of the order of 1 m or more, wereclearly shown by measurements in the selected refer-enced cross sections. The usage of these cross sectionsgave a possibility to evaluate volumetric changes on therough rock fall surface.
The following conclusions regarding the better understand-ing of the Strug rock fall evolution can be drawn from thiscase study:
152 M. Mikos et al.: Morphological changes on the Strug rock fall
3.
max
4.0
0m
4. 5. 6.
max
4.0
4m
ACCUMULATION EROSION(5/6)(3/5)
Fig. 10. A comparison for the reference cross section ”STKOS1 – CD2“ for the measurement sets in 2004.
Fig. 11a. 3-D TIN model of the Strug rock fall area derived fromthe aerial photographs taken on 28 December 2001, just after theinitiation of the rock fall. Position of the three selected longitudinalprofiles for their time evolution comparison are also given.
Fig. 11b. 3-D TIN model of the Strug rock fall source area derivedfrom geodetic measurements in September 2003 using laser scannermeasurement system. Position of the three selected longitudinalprofiles for their time evolution comparison are also given.
1. In 2003 and 2004, in the Strug rock fall area rainfall andoverland flow were the major erosive forces combinedwith channel flow in gullies and gravity. Precipitationon bare rock fall surface caused fast surface runoff andtherefore some surficial soil detachment, mainly wash-
ing away of finer fractions from the rather coarse rockfall debris. Significant morphological changes on therock fall surface were of local character only. They de-veloped mainly in the middle southern part of the rockfall source, where each year developed one gully.
2. Lower rock fall activity in 2003 and 2004 and reducedsupply of coarse debris material together with the en-larged accumulation capacity of the landslide area afterfrequent debris flows in 2002, seems to be the majorcause why no debris flows were observed in 2003 and2004. Even though the anticipated rainfall triggeringlimit of 30 mm a day was reached several times. Thematerial eroded from the rock fall area was finer thanin 2002 and transported in the form of sediment ladenflows and not as debris flows.
3. As proposed by Mikos et al. (2005), the process of de-bris flow generation in the Strug rock fall source areais a material-governed process. The numerous debrisflows observed in 2002 have emptied the rock fall de-bris in the lower accumulation part of Strug rock fall aswell as their temporary deposits on the landslide surfacebelow the rock fall. For initiation of new debris flows,reintensification of the rock fall is needed.
Acknowledgements.B. Stopar and T. Ambrozic assisted byGPS-related field measurements. M. Padeznik, L. Smrkolj, U.Stibilj and A. Bilc performed field scanner measurements. Theircontribution is greatly acknowledged. L. Smrkolj helped with dataanalysis and preparation of graphic files. The indepth reviews ofM. Jaboyedoff and A. Tamburini greatly improved the first versionof the paper.
Edited by: M. JaboyedoffReviewed by: R. Caloz and A. Tamburini

M. Mikos et al.: Morphological changes on the Strug rock fall 153
Fig. 12. Three longitudinal profiles of the Strug rock fall – comparison between 3-D TIN models of December 2001 (thin lines) andSeptember 2003 (thick lines).
References
Angeli, M-G., Pasuto, A., and Silvano, S.: A critical review of land-slide monitoring experiences, Eng. Geol., 55, 133–147, 2000.
Autodesk:http://www.autodesk.com/, 2004.Bitelli, G., Dubbini, M., and Zanutta, A.: Terrestrial laser scan-
ning and digital photogrammetry techniques to monitor landslidebodies, in: Proceedings of the XXth ISPRS Congress, Istanbul,Vol.XXXV, part B5, 246–251, 2004.
D’Agostino, V. and Marchi, L.: Debris flow magnitude in the East-ern Italian Alps: data collection and analysis, Physics and Chem-istry of the Earth, Part C, 26, 657–663, 2001.
Gili, J. A., Corominas, J., and Rius, J.: Using Global PositioningSystem techniques in landslide monitoring, Eng. Geol., 55, 167–192, 2000.
Hunter, G., Pinkerton, H., Airey, R., and Calvari, S.: The applica-tion of a long-range laser scanner for monitoring volcanic activ-ity on Mount Etna, J. Volc. Geoth. Res., 123, 203–210, 2003.
Jaboyedoff, M., Ornstein, P., and Rouiller, J.-D.: Design of ageodetic database and associated tools for monitoring rock-slopemovements: the example of the top of Randa rockfall scar, Nat.Haz. Earth Sys. Sci., 4, 187–196, 2004,SRef-ID: 1684-9981/nhess/2004-4-187.
Leica: http://www.leica.com/, 2004.Listech:http://www.liscad.com/liscad/, 2004.
Marchi, L. and D’Agostino, V.: Estimation of debris-flow mag-nitude in the Eastern Italian Alps, Earth Surface Processes andLandforms, 29, 207–220, 2004.
MDL: http://www.mdl.co.uk/, 2004.Microsoft: http://www.microsoft.com/, 2004.Mikos, M., Brilly, M., Fazarinc, R., and Ribicic, M.: Strug land-
slide in W Slovenia: a complex multi-process phenomenon, Eng.Geol., in print, 2005.
Mora, P., Baldi, P., Casula, G., Fabris, M., Ghirotti, M., Mazzini,E., and Pesci, A.: Global Positioning Systems and digital pho-togrammetry for the monitoring of mass movements: applicationto the Ca’ di Malta landlside (northern Appenines, Italy), Eng.Geol., 68, 103–121, 2003.
Scheikl, M., Grafinger, H., and Poscher, G.: Entwicklung und Ein-satz eines automatischen Fernuberwachungssystems basierendauf einem Laserscanner (ALARM), in: Proceedings of the 11.Internationale Geodatische Woche, Obergurgl, Austria, 18.–24.2.2001, 205–213, 2001.
Schreiber:http://www.schreiber.com/, 2004.Tarchi, D., Casagi, N., Fanti, R., Leva, D.D., Luzi, G., Pasuto, A.,
Pieraccini, M., and Silvano, S.: Landslide monitoring by usingground-based SAR interferometry: an example of application tothe Tessina landslide in Italy, Eng. Geol., 68, 15–30, 2003.
Trimble: http://www.trimble.com/, 2004.


