System Design and Architecture Online GISredd.gov.np/public/upload/office-id-2/file/9... · and...
25
Ministry of Forests and Soil Conservation REDD Implementation Centre Develop National Database of Basic Attributes of all Forest Management Regimes and Develop National REDD+ Information System or Registry Contract No: (FCPF/REDD/S/QCBS‐24) Technical Working Document n. 9 to Final Report System Design and Architecture Online GIS Platform April 2016 Authors: Ashwin Dhakal Gehendra Karki
Transcript of System Design and Architecture Online GISredd.gov.np/public/upload/office-id-2/file/9... · and...

Ministry of Forests and Soil Conservation REDD Implementation Centre
Develop National Database of Basic Attributes of all Forest Management Regimes and Develop National REDD+ Information System or Registry
Contract No: (FCPF/REDD/S/QCBS‐24)
Technical Working Document n. 9 to Final Report
System Design and Architecture
Online GIS Platform
April 2016
Authors:
Ashwin Dhakal
Gehendra Karki

i
The contents of this publication are the sole responsibility of
Agriconsulting S.p.A and Prompt Infosolutions and can in no way be taken to reflect the views of the
Nepal Ministry of Forests and Soil Conservation,
REDD Implementation Centre
This publication is a property of the Nepal REDD Implementation Centre and is part of the Nepal
REDD Readiness Preparation Program funded by the World Bank.
We would like to thank the whole staffs of Ministry of Forests and Soil Conservation, Department of
Forests, Department of Wildlife and National Parks, REDD Implementation Centre, Western
Regional Forest Directorate, District forest offices of Western Region and Members of REDD
Technical committee in particular:
Mr. Man Bahadur Khdaka, Joint Secretary REDD Implementation Centre
Mr. Rajendra Kafle, Under Secretary REDD Implementation Centre;
Mr. Mohan Prasad Poudel, Under Secretary REDD Implementation Centre;
Mr. Narendra Chand, Under Secretary REDD Implementation Centre;
Mr. Kiran Dangol, Under Secretary Ministry of Forests and Soil Conservation;
Mr. Gopal Prakash Bhattarai; Under Secretary, Department of Wildlife and National Parks;
Mr Shiva Khanal, Under Secretary Department of Forest Research and Survey
Mr. Yogendra Karna, Under Secretary Department of Forests;
who provided insight and expertise that greatly assisted the project

ii
Table of Contents
1.INTRODUCTION .................................................................................................................................... iv
1.1 Use-case Diagram ................................................................................................................................... 1
1.2 AN ARCHITECTURE NFDNFIS ONLINE-GIS SYSTEM ................................................................. 3
1.3 User Interface .......................................................................................................................................... 7
2. NFD NFIS Data Layer .......................................................................................................................... 9
2.1PostGIS ................................................................................................................................................ 9
2.2 Other Databases ................................................................................................................................ 11
2.3 Other Data Sources ........................................................................................................................... 11
2.4 WMS/KML Service on PostGIS ....................................................................................................... 11
3 NFD NFIS Application Server Layer ...................................................................................................... 13
3.1 GeoServer ......................................................................................................................................... 13
3.2 GeoWebCache .................................................................................................................................. 14
3.3 Other Application Servers ................................................................................................................. 15
4. Architecture Examples ........................................................................................................................ 16
4.1 User Interface Layer ............................................................................................................................. 17
4.1.1 OpenLayers .................................................................................................................................... 17
4.1.2 GeoExt ........................................................................................................................................... 18
4.1.3 Other User Interface Layers ........................................................................................................... 18
4.1.4 A Multi-Layer Data Viewer ........................................................................................................... 18

iii
List of Figures
Figure 1 Use Case Diagram 2
Figure 2 Architecture of NFDNFIS 4
Figure 3 User Interface 8
Figure 4 Cfug Database In Postgresql Both Spatial And Non Spatial Database Stored. 10
Figure 5 Wms Wfs Work Flow 12
Figure 6 Geoserver Input And Outputs Formats 13
Figure 7 Geowebcache Work Flow 15
Figure 8 Architecture Examples 16
Figure 9 A Multi-Layer Data Viewer 19

iv
Acronyms and Abbreviations
CF: Community Forest CFI Continuous Forest Inventory CFOP: Community Forest Operational Plan CFUGs: Community Forest User Groups CoFM: Collaborative Forest Management DBH Diameter at Breast Height DBMS Database Management System DDC: District Development Committee DFO: District Forest Office/Officer DFRS Department of Forests Research and Survey DOF Department of Forests ESMF Environmental and Social Management Framework DSCO: District Soil Conservation Officer FECOFUN: Federation of Community Forest Users Nepal FGD: Focus Group Discussion FRA Forest Resources Assessment of Nepal Project GHG Greenhouse Gas Emissions GIS Geographic Information System GLCN FAO/UNEP Global Land Cover Network GPG International Panel on Climate Change: Good Practice Guidance GPS: Geographic Positioning System ICIMOD: International Center for Integrated Mountain Development IPs: Indigenous Peoples IPCC Intergovernmental Panel on Climate Change LCCS Land Cover Classification System LhFUGs: Leasehold Forest User Groups M and MRV: Measurement and Monitoring, Reporting and Verification MIS Management Information System MRV Measuring, Reporting and Verifying NAFIMS National Forestry Information Management System NFCAG National Forest Carbon Action Group NEFIN: Nepal Federation of Indigenous Nationalities NGO: Non-Government Organization NORAD: Norwegian Agency for Development Cooperation PSP Permanent Sample Plots REDD Reducing emissions from deforestation and forest degradation RL/REL Reference Emission Level R-PP: Readiness Preparation Proposal SLMS Satellite Land Monitoring System UNFCC United Nations Framework Convention on Climate Change WISDOM Wood fuel Integrated Supply and Demand Overview Mapping

v
1
INTRODUCTION
Traditionally, Geographic Information Systems (GIS) were realized as monolithic and platform
dependentapplications (Wong et al., 2002). Recently withthe development of Internet and World
Wide Web, GISs haveevolved and adapted to this new environment (Shekhar et al., 2001). The
“Online Mapping” or “Online GIS” became asynonym for Web information systems that
provides a functionality of geographic informationsystems on the Web through HTTP and
HTML (Shanzhen et al., 2002).
Internet allows all levels of society to access geospatial information and provides a media for
processing geo-related information with no location restriction(Alesheikh et al,2005). Web GIS
should provide functions for displaying and navigation through maps, so asfunctions for
querying of geographic data using both spatial and non-spatialcriteria. It is obvious that these
functions can cover only some of a GIS functionality stated in(Soomro et al., 1999). Sharing of
geospatial data in forestry sector can bedone by updating of existing Desktop based
traditionalsystem with the use of “Web interfaces”. An Online GIS that can be connected with
wide range of databases with predefined standards Open Geospatial Consortium (OGC) has
WMSspecifications (Web Mapping Service for retrieval of maps (Map Service Implementation
Specification, 2002) and WFS (Web Feature Service for querying of geospatial data bases.
Forest Sector is one of the widely used sectors for GIS and Mapping purposed. Forest cover,
forest change, deforestation, degradation, different management regimes boundaries and other
custom maps are very important and useful for forest management and preservation.
1.1 Use-case Diagram OnlineGIS system that is being presented is used by three classes of users:
a. Simple Web Users b. Authorized GISUsers c. Portal Administrators
Simple Web Users are the most general class with the least functionality available. They access
the systemthrough a portal for viewing maps and querying geographic features. Online mapping

2
and Querying are not all possible functions, but it is the set of functions aremost suitable.
(Stoimenov et al., 2004).
Authorized GIS users have access to all functions of their local GIS applications. A minimum
functionality should enable creating of a GIS content that canbe accessed over the
portal.Features like viewing and querying, inserting, editing and deleting of some geographic
features.
The portal administrator(superadmin) is responsible for defining content that will be available to
WebUsers. For that purpose he can specify layer hierarchy depending on a layer type, modify
WMS and/or WFS services to the layer.An important feature of thisOnline GIS portal is it can
integrate of Geographic information from other servers and system.
.
Figure 1 Use case diagram

3
1.2 AN ARCHITECTURE NFDNFIS ONLINE-GIS SYSTEM1
To identify subsystems of all forest related GIS data we started from a forestry user requirement
analysis.There are several department and GIS data are generated from different sources and
organization. Most of the users doesn’t have background of GIS and software. Local level unit
have local maps which are more accurate(ie. DFOs, CFUGs) but those maps are not stored in
central database. If available they are in different projection, datum which may lead to
fragmented spatial information of forest maps.All the maps related GIS data cannot be acquired
processed, stored and maintained by one singleorganizational and most of time these mapping
data can have mutual and public importance, so itshould be shared and be accessible over Web.
This architecture based on client/server model where a subsystem that acts as a client and has
access to map portal, while the function of sharing (server) is functioning as expanded traditional
GISs with web enabled features of WMS and a WFS.
Internet maps appear like black-box and portalswith infinitely large and deep pools of data. But
they aren’t magicalnor mystic, they are built and developed on few standard bits of technology,
and these can be re-arranged and obtained from different places. Anyone with little knowledge of
interface of mapping and standards can build.
The architecture of NFD NFIS is a way of categorizing the technology pieces that make an
internet map work, and building on existing information infrastructures. The key to the
architecture is breaking internet mapping into functional layers.
1 System Environment is used from Open Source Mapping Software and Documentation is based on Open source environment.

4
Figure 2 Architecture of NFDNFIS
The functional block of NFDNFIS online mapping portal can be summarized as
• Storage: Raw data needs to be managed in a consistent read/write data store, a relational
database. NFD NFIS uses the PostGIS spatial database. Raster data of MRV, REL, FRA
and satellite image are stored Geocached enabled raster data storage.
• Application server: The raw data needs to be accessed using web services, and rendered
into cartographic products.2 NFD NFIS uses the GeoServer map/feature server.
2 Mapping architecture and document is used from Geoserver and its documents

5
• Application cache: Performance requires the caching of intermediate results, such as
map files. NFD NFIS uses the GeoWebCache tile cache.
• User interface framework: Targeted vertical applications serve one operational need
and serve it well. NFD NFIS uses GeoExt/ExtJS as a platform independent user interface
toolkit.
• User interface map component: Mapping applications need a map component that
understands spatial features and map layers. NFD NFIS uses OpenLayersJavaScript.
Other options include Google Maps API and Bing Maps API.
Using these mapping portal departments can utilize according to their requirement
• Departments with existing GIS systems:Forest departments which have their own GIS
system can build web applications by using their current storage (Spatial data eg.Shape
files layer) and put in NFD NFIS application and web interface layers on top.
• Departments with no GIS systems : Forest departments which has no their GIS
database can integrate mapping into existing enterprise applications by embedding NFD
NFIS web components in existing pages and serving maps from the NFD NFIS
application layers.
• Google/Bing map tools can deploy all the NFD NFIS storage and application layers to
integrate custom spatial information into the consumer-facing Google framework.
Putting maps on the web used to be very difficult. It required specialized software, and more
important, specialized knowledge about the kinds of data and processes used to create
cartographic products.
The difficulties arose in the gap between the general public understanding of “what is a map”
and the geographic specialist understanding of “what is a map”.
A map is made from a number of “layers”, topography, transportation, hydrography, land cover,
human construction and so on. The manipulation of these layers and the building of algorithms
to analyze them is a field unto itself: “geographic information systems” or “GIS”.
Because the specialists were the first market for web mapping tools, their tools tended to embed
the specialist understanding of what comprised a good mapping solution: it should expose
multiple layers, the combinations of layers should be quite flexible for the end user, and the end
user should provide the data to make the map. Specialists have access to lots of data, and they
like to be able to turn their layers on and off.

6
Members of the general public usually have very simple mapping problems. They have one piece
of data (a single “layer”, in the specialist terminology) and they want to see it on a map. Using
the specialist web mapping software to achieve their goals is tough, because in order to see their
data “on the map”, they first have to build “the map” – the collection of all the things that aren’t
their data, but that provide the locational context within which their data resides, generally called
a “base map”.
Building a “base map” involves finding all the relevant source data (topography, roads, water,
place names, etc) for the working area, and establishing rendering rules (colors, line widths,
labeling) for every scale of display. Even for specialists, tracking down data and establishing
attractive multi-scale rendering rules can take several days.
Google Maps, Bing Maps, and others, “solved” the general public mapping problem by
providing “the map” as a default feature of their technology. They provided the “base map” –
initially a simple street map, later augmented with imagery – and the user was expected to
provide the rest. The user needed to know a little standard web programming (JavaScript) but
needed no special knowledge of GIS data or techniques.
Once freed from the awkward initial step of building their own base map, non-specialists rapidly
colonized the online mapping space. As they did, two things happened:
• the clients of the specialists saw the new consumer tools, and wondered why the tools
their specialists were providing were so clunky; and,
• The non-specialist’s demands for functionality soon outstripped what Google and
Microsoft were willing to provide.
As time goes on, the demands for functionality on the part of non-specialists are moving
upwards and converging with the demands of simplicity from organizations formerly served
exclusively by specialist GIS staff.

7
1.3 User Interface The approach to address the two user’s experts and users should be address properly. Central
level has some experts to handle spatial database and can update but in district level the users
may only able view and but know the ground reality more precisely. In this fertile middle
ground, between complex solutions for experts and restricted solutions for the consumer, we can
define a web architecture that plugs into both the specialist and non-specialist use cases. The
NFD NFIS web mapping architecture can:
• serve data from specialist databases and files up into the consumer mapping portals; • store and manipulate data for non-specialists using algorithms formerly only available via
expensive GIS software; and, • Build desktop-like applications (including embedded maps and data capture features) that
can be accessed via any web browser. In all the ways that count, our web architecture is a “GIS”, but it is one that subordinates the “G”
to the “IS”. There is nothing extra-special about a “geographic” information system that
distinguishes it from an “information system”.
The architectural diagram for a generic web application usually looks like this:

8
Figure 3 user interface
There is a database or other data storage system at the bottom, some application logic in the
middle, and a user interface layer at the top. The database and application layers interact via SQL
over a network protocol (specific to the database vendor but usually abstracted away with JDBC
or ODBC). The application and the interface layers interact via encoded documents (usually
XML or JSON) transferred over HTTP.
Scratch any modern web application, and underneath you’ll find architecture like this one.
So, what does the NFD NFIS web mapping architecture look like? It makes use of a set of five
open source components, each fulfilling a particular functional role:
• Storage: PostGIS / PostgreSQL spatial database
• Application server: GeoServer map/feature server
• Application cache: GeoWebCache tile cache
• User interface framework: GeoExt / ExtJS
• User interface map component: OpenLayers

9
At the bottom of the NFD NFIS architecture there is a database (PostGIS) or file-based storage
system, there are application servers in the middle (GeoServer and GeoWebCache), and there’s a
user interface layer on the top (OpenLayers and GeoExt).
The database and application servers interact via SQL (with Open Geospatial Consortium
standard spatial extensions). The applications servers and user interface layers interact via
standard web encodings (XML, JSON, images) over an HTTP transport.
The web mapping architecture is distinguished from standard application architecture, not in the
arrangement or classification of the parts, but in what the parts do.
• The PostGIS database can answer spatial queries as well as standard attribute queries. • The GeoServer map/feature server can provide standardized web access to underlying
GIS data sources. • The GeoWebCache tile server can intelligently store and serve map tiles using standard
web protocols for requests and responses. • The GeoExt/ExtJS interface framework includes standard UI components and also
specific bindings for spatial features. • The OpenLayers map component can consume maps from multiple sources and provides
tools for data editing and capture.
A key feature of the NFD NFIS architecture is that, through the use of standards, any component
of the architecture can be replaced with other products. For organizations with existing software
infrastructure, this feature is a necessity.
• For storage, PostGIS can be swapped with Oracle Spatial, SQL Server Spatial, DB2 Spatial or ArcSDE.
• For web map access, GeoServer can be swapped with MapServer, ArcGIS Server, MapGuide or any other WMS-capable map renderer.
• For web feature access, GeoServer can be swapped with Ionic Red Spider, CubeWerx or any other fully featured Web Feature Server (WFS).
• For caching, GeoWebCache can be swapped with TileCache. • For user map components, OpenLayers can be swapped with Google Maps, Bing Maps,
and other components.
NFD NFIS Data Layer
2.1PostGIS NFD NFIS uses the PostGIS, a spatial extension of PostgreSQL which is based on open source
software architecture. PostgreSQL / PostGIS is a compliant with the Open Geospatial
Consortium “Simple Features for SQL” specification.
PostGIS is an extension to the PostgreSQL object-relational database system which allows GIS
(Geographic Information Systems) objects to be stored in the database. PostGIS includes support

10
for GiST-based R-Tree spatial indexes, and functions for analysis and processing of GIS
objects.(http://postgis.net/docs/manual-2.0/)
Some features of PostGIS2 are
• Supportsother standard query standards like SQL92 standards.
• HasTransactional integrity and also has disaster recovery. Data andfile corruption is less.
• Has Security and authentication infrastructure based on roles.
• Supports backups and replication.
• External access through standard protocols (JDBC, ODBC) and different standard
languages (C, C++, Python, C#, Java, PHP, QGIS, ARCGIS etc).
In addition, PostGIS adds types, functions and indexes to support the storage, management, and
analysis of geospatial objects: points, line strings, polygons, multipoint, multiline strings,
multipolygons and geometry collections.
As a spatial database, PostGIS can store very large contiguous areas of spatial data, and provide
read/write random access to that data. This is an improvement over old file-based management
structures that were restricted by file-size limitations and the need to lock the whole files during
write operations.
Figure 4 CFUG database in PostgreSQL both spatial and Non spatial database stored.
11
2.2 Other Databases There may be exist different files and data for spatial objects in different formats. This
application can store and integrate those like.
• Oracle Spatial
• Raster Maps of classified images
• StandardShapefile
• MSSQL Server( Spatial) and
• MySQL Spatial
For organizations with some existing database/ Mapping systems, deploying GeoServer on top of
their current database is the easiest way to get on the geospatial web without reorganizing their
infrastructure.
2.3 Other Data Sources While databases offer the strongest combination of data integrity, integrated analysis and support
for write operations, many organizations use GIS file formats to hold their data.
GeoServer can read from and write to (with some limitations on concurrency) GIS files:
• Image File Formats
• GeoTIFF
• ECW
• EsriShapefiles
• JPEG2000
• JPG/PNG/GIF
In addition, it can read data directly from standard protocol services e.g. Map published by
department of Survey, ICIMOD,USGS and Global Forest Watch layers using
• OGC Web Map Service (WMS) for imageryand maps.
• OGC Web Feature Service (WFS) for vector features.
2.4 WMS/KML Service on PostGIS Providing data for other users to integrate can be hard, if the data are constantly changing.
Dumping a file out to adatabase works fine, but what if the data are changing every minute as
new information streams in automatically? What about people who use Google Earth for
visualization? What will be the map of CFUGs when it is changed or updated?
12
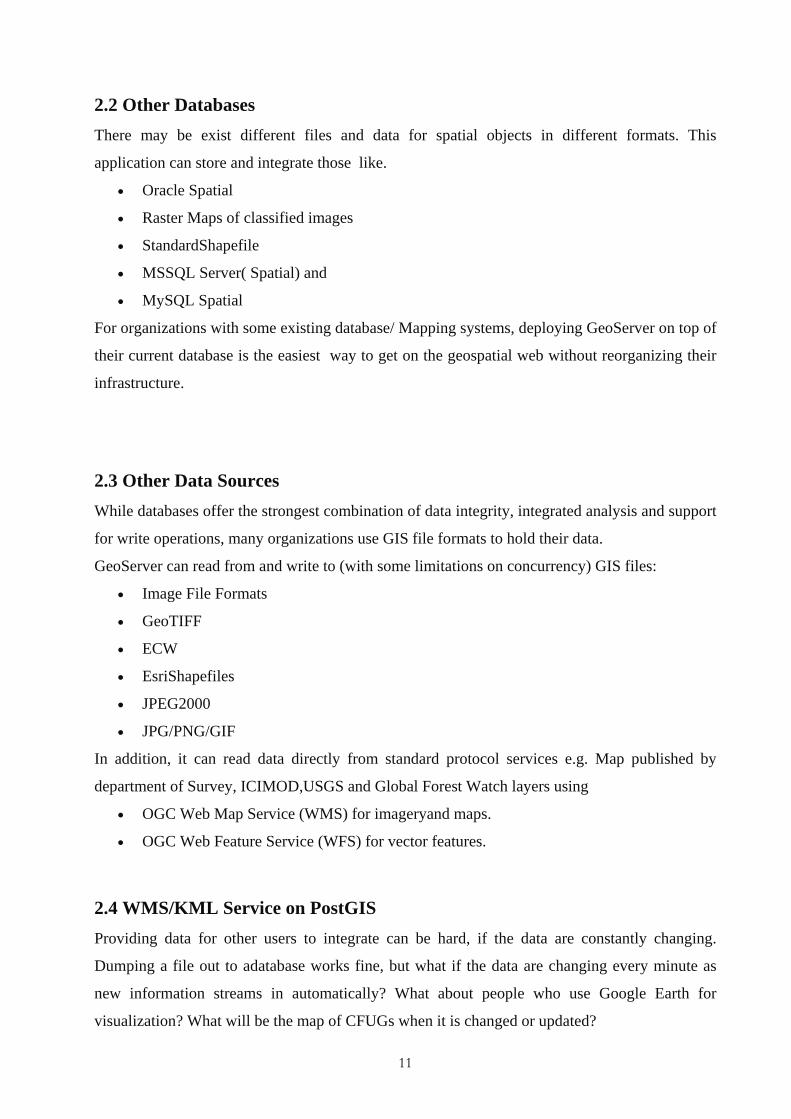
Thisarchitecturehas simplesystem that allows multiple tools for visualization, and maintains
information.
Figure 5 WMS WFS work flow
At the bottom of this architecture is the PostGIS spatial database. The data inputs are piped into
PostGIS by converting the data stream to SQL “update” statements that update an asset location
table in the database. To maintain a history of locations, a simple “on update” trigger copies the
location as an “insert” to an asset history table. (More advanced systems will also partition the
history table, to manage the size issues created by continuous data streams.)
On top of PostGIS, we add GeoServer. Configure the asset location table as a data source, and
add any styling we want for the location points (symbols, circles, pixmaps, etc).
That is it for configuration! Everything else is done by end-users.
End-users can view the asset locations in:
• ArcMap, by adding the GeoServer WMS service to their application as a “WMS layer”;
• Google Earth, by adding the GeoServer WMS service to their application using a KML
output type;
• Google Maps, by entering the URL of the GeoServer KML service into the Google Maps
search field; or,

13
• Any other client software (there are 100s) that support consuming WMS services as an
input data source.
3 NFD NFIS Application Server Layer The application server layer is responsible for mediating between the data layer and the user
interface layer (UI). It acts as a protocol gateway, turning standard web requests from the UI into
the specific calls necessary to talk to databases or read from GIS files. It also is a repository for
custom logic, like processing services, and other application-specific routines.
Boundless supports the GeoServer spatial application server as the best building block for spatial
web services, and the GeoWebCache tile server as an accelerator for custom map services.
3.1 GeoServer GeoServer can read from multiple data sources, generate multiple output formats, and
communicate using multiple standard protocols. As such, it fits easily into existing
infrastructures, providing a communication path between old and new software components.
Figure 6GeoServer input and outputs formats

14
Like the Apache web server, which provides an HTTP access method for files and services,
GeoServer provides an HTTP access method for geospatial objects and queries on those objects.
As such, it allows standard web technologies – Javascript, web browsers, scripting languages,
anything that speaks HTTP (and that is almost everything) – to work with spatial information in
an intelligent way.
GeoServer presents spatial data (tables in a database, files on a hard drive) as feature collections,
and allows HTTP clients to perform operations on those collections.
• Render them to an image, as an attractive cartography product.
• Apply a logical filter to them and retrieve a subset, or a summary.
• Retrieve them in multiple formats (KML, GML, GeoJSON).
Without GeoServer, when building a spatial web application, the developer would be required to
write all the code between the web server and the database/files. With GeoServer, the developer
can use a few standard access patterns to retrieve maps and information.
The access standards GeoServer implements include:
• OGC Web Map Server (WMS) for retrieving cartographic images;
• OGC Web Feature Server (WFS) for querying and retrieving vector feature collections;
• OGC Styled Layer Descriptors (SLD) for encoding cartographic styling rules;
• OGC Filter specification for encoding subset queries on feature collections;
• OGC KML for encoding feature collections for visualization in Google Earth;
• OGC Geographic Markup Language (GML) for encoding feature collections for general
purpose re-use.
All these standards are internationally recognized and approved.
3.2 GeoWebCache Like GeoServer, GeoWebCache is a protocol gateway. GeoWebCache sits between tiled
mapping components (like OpenLayers, Google Maps and Bing Maps) and rendering engine in
GeoServer.
Tiled map components generate a large number of parallel requests for map tiles, and the tiles
always have the same bounds, so they are prime candidates for caching. GeoWebCache receives
tile requests, checks its internal cache to see if it already has a copy of the response, returns it if
it does, or delegates to the rendering engine (GeoServer) if it does not.
15
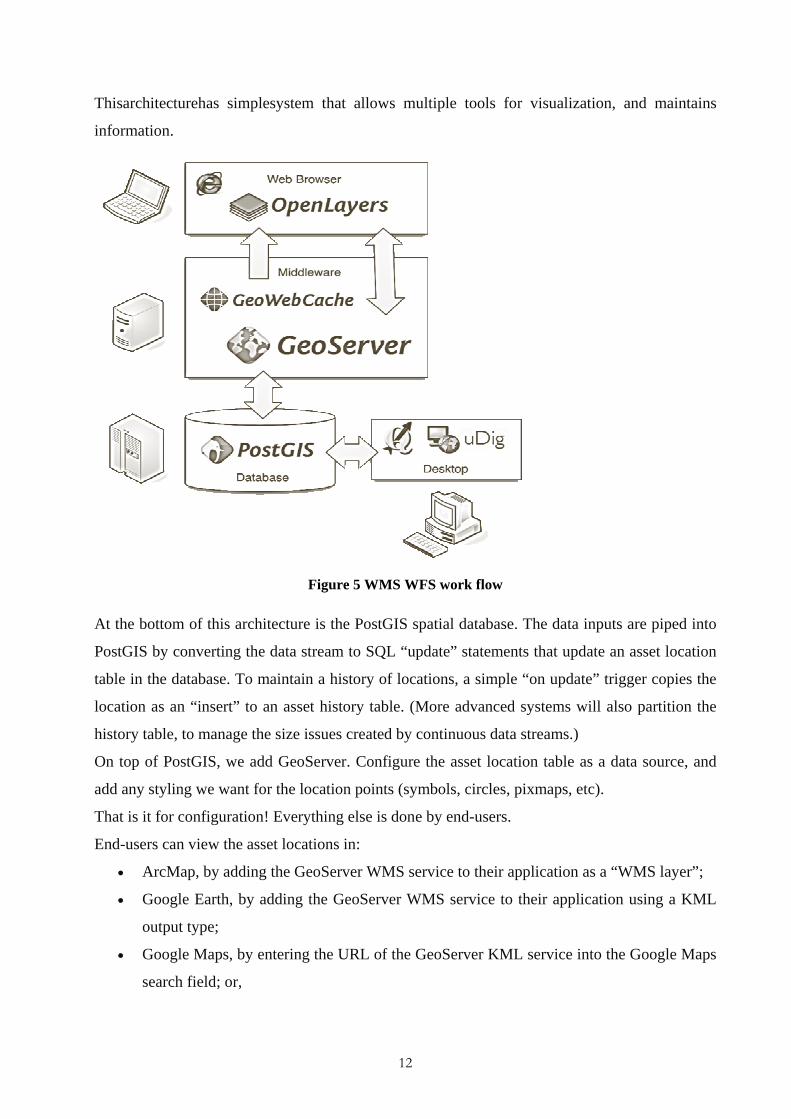
Figure 7Geowebcache work flow
When GeoWebCache delegates rendering requests to the rendering engine, it uses standard
WMS requests. As a result, it can be used with any engine that supports WMS (ArcServer,
MapServer, MapGuide, etc). GeoWebCache supports tile requests from all the common tiled
map components, so it can be used equally well under applications using OpenLayers, Google
Maps, Bing Maps or Google Earth.
3.3 Other Application Servers Because NFD NFIS is configured to use standard protocols for data access and delivery, it is
possible to substitute alternate components, or create architectures that use multiple components.
Map rendering from PostGIS data sources to a WMS interface can be done by GeoServer, but it
can also be done by MapServer, or by ArcServer (9.2 or greater). Using NFD NFIS, architectures
can mix and match different application servers depending on their relevant strengths.
16
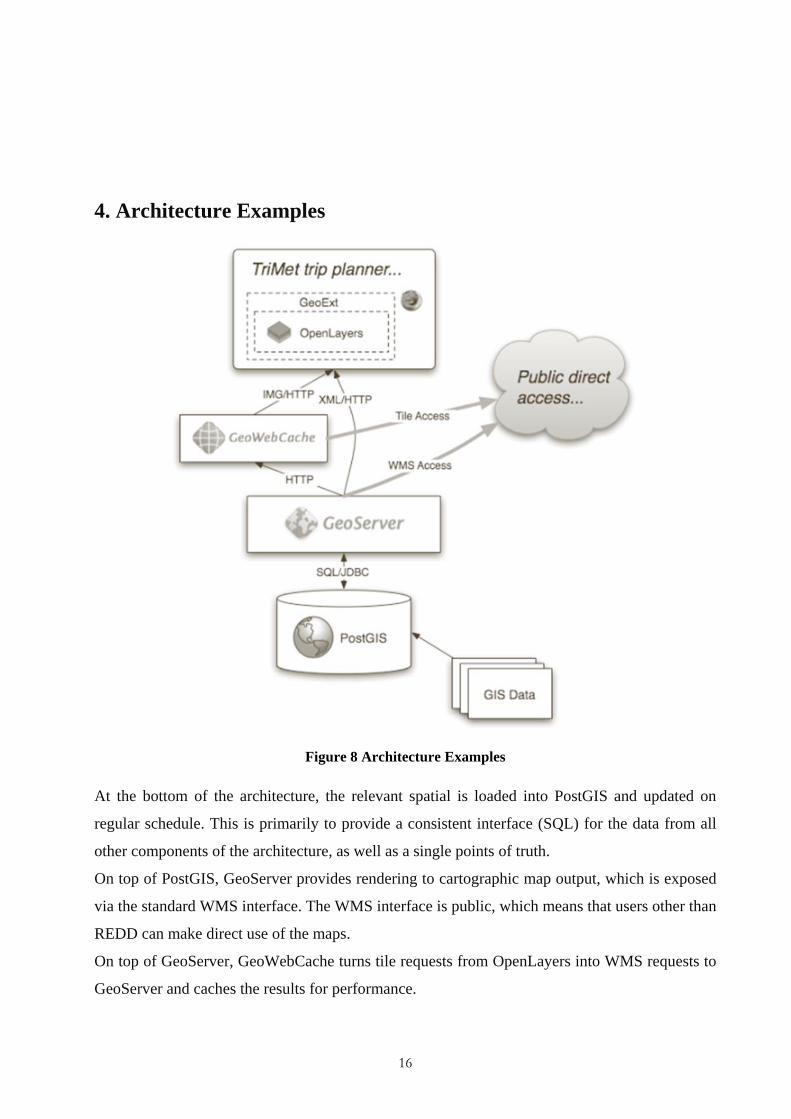
4. Architecture Examples
Figure 8 Architecture Examples
At the bottom of the architecture, the relevant spatial is loaded into PostGIS and updated on
regular schedule. This is primarily to provide a consistent interface (SQL) for the data from all
other components of the architecture, as well as a single points of truth.
On top of PostGIS, GeoServer provides rendering to cartographic map output, which is exposed
via the standard WMS interface. The WMS interface is public, which means that users other than
REDD can make direct use of the maps.
On top of GeoServer, GeoWebCache turns tile requests from OpenLayers into WMS requests to
GeoServer and caches the results for performance.

17
On top of GeoWebCache, OpenLayers is the mapping component, embedded within a GeoExt
framework providing user interface components like expandable trays, fold-out panels and more
standard user interface elements.
Because each element of the interface is standardized, it is possible for external organizations to
include components of the NFDNFIS system in their own applications. It is also easier for
NFDNFIS to roll out new applications, using the same architectural base of services.
4.1 User Interface Layer It uses the OpenLayers Javascript map library and the GeoExt Javascript user interface library.
Both libraries are 100% client-side implementations of user interface components: OpenLayers
providing a map component and associated infrastructure (map editing tools, spatial object
formats, and more); and, GeoExt, tying OpenLayers into the rich user interface structure of
ExtJS.
Highly interactive user interfaces have been the province of desktop software, or plug-in oriented
web clients (Flash, or Java applets). With the arrival of high-performance Javascript engines in
browsers, and complex user interface libraries like ExtJS, it is now possible to bring the
interactivity of desktop applications to the web. Old web applications required frequent slow
page refreshes and reloads, but applications build with 100% client-side Javascript do not.
The advantage of web applications is ease of deployment and update. Updating a desktop
application can take weeks of installs on many computers. Updating a web application requires
deploying the code to one server. Now that the finish quality of web applications equals that of
desktop applications, there is no reason not to use the web.
4.1.1 OpenLayers OpenLayers is a generic mapping component, designed to consume spatial data and maps from
numerous sources and display that data in a web browser. Unlike Google Maps or Bing Maps,
OpenLayers is not tied to a particular map source. It can display maps from Google, Microsoft or
Yahoo!, and also display custom maps generated by rendering engines like GeoServer,
MapGuide, MapServer or ArcServer.
In addition to map display, OpenLayers offers tools for working with spatial data directly in the
browser and tools for manipulating those features on the screen: digitizing, altering, and moving
features.

18
4.1.2 GeoExt ExtJS is a popular client-side Javascript library for building user interfaces. Like desktop
toolkits, it includes pre-built components for trees, lists, panels, tables, dialogues and so on.
GeoExt adds extensions to ExtJS that bind basic ExtJS components to the spatial features of
OpenLayers. For example, a GeoExt “selection manager” which looks like a table in the user
interface is bound to the set of selected features in OpenLayers.
The GeoExt set of components allows Boundless to rapidly develop custom spatial applications,
because we don’t have to constantly re-write the bindings between the map component and the
other user interface components – we just use (or enhance) the existing GeoExt work.
4.1.3 Other User Interface Layers The map components from Google, Microsoft, Yahoo and others can all be used in place of
OpenLayers in NFD NFIS. Because GeoServer and GeoWebCache speak standard web
protocols and formats, it is easy to build a site that uses Google Maps for visualization, but
GeoServer for map rendering and query processing.
4.1.4 A Multi-Layer Data Viewer It is common for an organization to want to validate older vector data against newer ground
truth. The public availability of image data at Google Maps and Bing Maps has made the
prospect even more tantalizing if only the organization’s data could be overlaid with the
corporate imagery to check it!
Our suggested architecture makes use of GeoServer to render the organization’s GIS data, from
files, or existing databases, or PostGIS, whichever makes the most sense.

19
Figure 9 A Multi-Layer Data Viewer
OpenLayers is then configured with three (or more) layers: base map layers from Microsoft and
Google, and an overlay layer provided by GeoServer.
Additionally, because OpenLayers reads from OGC standard WMS sources, any WMS-capable
rendering engine (MapServer, MapGuide, and ArcGIS Server) could be used in place of
GeoServer.
On the page where we want the map, we embed OpenLayers, by adding a named <div> tag to
the existing code. OpenLayers pulls a base map from Google, and renders an overlay map of
business features via GeoServer, which in turn pulls data directly from Oracle.
The OpenLayers map is controlled with a small amount of Javascript on the business application
page that takes in a record identifier from the business application converts it to a WFS query via
OpenLayers, which is passed to GeoServer that returns an extent to zoom the OpenLayers map .