System analysis and assessment of technological alternatives for Nordic H2 energy foresight
60
System Analysis and Assessment of Technological Alternatives for Nordic H 2 Energy Foresight Tiina Koljonen, Esa Pursiheimo, Kaare Gether, Kaj Jørgensen Nordic Hydrogen Energy Foresight www.h2foresight.info Risø National Laboratory December 2004
Transcript of System analysis and assessment of technological alternatives for Nordic H2 energy foresight

System Analysis and Assessment ofTechnological Alternatives for Nordic H2
Energy Foresight
Tiina Koljonen, Esa Pursiheimo, Kaare Gether, Kaj Jørgensen
Nordic Hydrogen Energy Foresightwww.h2foresight.info
Risø National LaboratoryDecember 2004

Authors: Tiina Koljonen, Esa Pursiheimo, Kaare Gether, Kaj Jørgensen Title: System Analysis and Assessment of Technological Alternatives for the Nordic H2 Energy Foresight Department: VTT (Finland), NTNU (Norway) and Risø National Laboratory (Denmark)
Publication date ex. December 2004
ISSN 0106-2840 ISBN 87-550-3438-1
Contract no.: P0127
Group's own reg. no.: 1220037
Sponsorship: Nordic Innovation Centre Nordic Energy Research Cover :
Pages: 60 Tables: References:
Abstract The hydrogen scenarios developed during the Nordic Hydrogen Foresight project were analysed using a hydrogen energy systems model, which was developed during the project. The aim of the systems analysis was to analyse the technical and economical potential of hydrogen society in the Nordic countries in quantitative terms as well as the competitiveness of the selected hydrogen based systems. Visions and scenarios of the future energy systems in the Nordic area were defined in the workshops of the project. As a result of these workshops three scenarios were selected to outline the future of Nordic energy. The scenarios included different energy policies; scenarios for fossil fuel prices; and hydrogen energy demands, which varied from 6% to 18% of the total energy demand in 2030 for transport sector, and from 3% to 9% in heat and power production. In the roadmap workshop, the most important hydrogen based systems were selected, which were also included in the model. These include steam reforming of natural gas, electrolysis with renewable electricity, and biomass gasification for hydrogen production. For stationary applications, fuel cells and gas engines were selected for power and heat production. In our scenario calculations, biomass gasification and steam reforming seem to be the most competitive technologies for hydrogen production. The competitiveness of biomass gasification is greatly affected by the biomass fuel price, which is a local energy source. Electrolysis seems to be most competitive in decentralized systems, if the electricity price is low enough. For stationary applications, CHP fuel cells seem to be the most competitive in the long term, if the technological development and the decrease in investment costs follow the assumed scenario. The approximated Nordic market sizes in 2030 for the base scenarios varied from 1000 M€ to 3000 M€ for hydrogen production, from 1000 to 4000 M€ for stationary applications and from 4000 M€ to 12 000 M€ for hydrogen transmission. In 2020, about 0.5-2 million hydrogen vehicles and in 2030 about 1-4 million hydrogen vehicles would be needed to fulfil the “big visions” for hydrogen energy in the Nordic transport sector. The number fuelling stations needed in 2020 was estimated to 500-2000 and in 2030 to 1000-4000 respectively.
Risø National Laboratory Information Service Department P.O.Box 49 DK-4000 Roskilde Denmark Telephone +45 46774004 [email protected] Fax +45 46774013 www.risoe.dk

Contents
1 Introduction ......................................................................................................................... 5
2 Existing energy systems models - The state of the art...................................................... 6
2.1 Hydrogen energy systems analysis work in Denmark................................................... 9 2.2 Hydrogen energy systems analysis work in Norway................................................... 10
3 Representation of the Nordic hydrogen energy system model ...................................... 12
4 Description of the Nordic energy system......................................................................... 14
4.1 The existing energy system ......................................................................................... 14 4.2 Nordic Energy Outlook 2030 ...................................................................................... 16
5 Development of hydrogen technologies and representation of input data used for the scenario calculations ................................................................................................................. 17
5.1 Production of hydrogen ............................................................................................... 17 Reforming with and without CO2 sequestration.................................................................. 18 Electrolysis .......................................................................................................................... 19 Biomass Gasification........................................................................................................... 21
5.2 Hydrogen storage ........................................................................................................ 22 Compression of hydrogen ................................................................................................... 22 Liquefaction of hydrogen .................................................................................................... 23
5.3 Delivery of hydrogen................................................................................................... 24 Road delivery by trucks....................................................................................................... 24 Pipeline delivery.................................................................................................................. 26
5.4 Transfer of hydrogen ................................................................................................... 27 5.5 Conversion................................................................................................................... 27
Stationary fuel cells ............................................................................................................. 27 Gas engines ......................................................................................................................... 28
5.6 Fuelling stations .......................................................................................................... 28
6 The model assumptions and the input data and for the scenario calculations with the Nordic hydrogen model............................................................................................................. 30
6.1 General assumptions and constraints........................................................................... 30 Duration curves ................................................................................................................... 30 Hydrogen demand ............................................................................................................... 30 Production and investment constraints................................................................................ 32 Cost calculations and discount ratio .................................................................................... 33
6.2 Input parameters for different technologies ................................................................ 34 Hydrogen production........................................................................................................... 34 Hydrogen compression, transmission and storage .............................................................. 35 Hydrogen conversion to electricity and heat ....................................................................... 37
3

Fuelling stations .................................................................................................................. 39 Emissions ............................................................................................................................ 39
6.3 Investment supports and taxation................................................................................ 40 6.4 Fuel and electricity prices ........................................................................................... 40
7 Scenario results of the Nordic hydrogen energy ............................................................ 42
7.1 Cost results for the base case ...................................................................................... 42 7.2 Sensitivity analysis for the scenario costs ................................................................... 45 7.3 Scenario results for different technologies and applications....................................... 49
Hydrogen production .......................................................................................................... 49 Energy production............................................................................................................... 51 The number of fuelling stations and cars ............................................................................ 52
8 Conclusions ........................................................................................................................ 54
References .................................................................................................................................. 56
4

1 Introduction
The aim of the Nordic Hydrogen Energy Foresight is to provide decision support for companies and research institutes in defining R&D priorities and to assist governmental decision-makers in making effective framework policies for the introduction of hydrogen energy. The overall intention is to find long-term and promising ways for Nordic stakeholders to exploit hydrogen in the drive to meet 3E’s: energy security, economic growth and environmental protection.
Interaction between research, industry and government and using a combination of judgemental and formal procedures are essential features of the Nordic H2 Energy Foresight. The foresight process includes a series of pre-structured interactive workshops (scenario workshop, vision workshop, technology roadmapping workshop, and action workshop). Based on these workshops, key technologies for the Nordic hydrogen system have been selected and roadmaps for the development of these technologies have been created. For envisioning the introduction of hydrogen in the Nordic energy systems, three external scenarios are set, which are analysed in quantitative terms with a hydrogen energy model that has been created during the project.
Technological alternatives for hydrogen supply as well as hydrogen pathways and scenarios can be analysed in quantitative terms using energy systems models. In the Nordic H2 Energy Foresight project, the technical and economical potential of a hydrogen society in the Nordic countries have been evaluated with respect to hydrogen demand, costs and emissions. For scenario analysis and assessment of technological alternatives, a model of relevant energy and resource flows has been constructed using a linear programming (LP) method.
This report aims at describing the work carried out in the working package of “Systems analysis and assessment of technological alternatives” (WP4). The report is broken down as follows: In chapter 2, a short description of the existing energy systems models and hydrogen related systems analysis work carried out in the Nordic countries is presented. The aim of this section is to provide both an overview of the work that has already been carried out and to list the projects that aim at supplying the relevant analysis as carried out by this project. In chapter 3, the Nordic hydrogen energy model and its structure are briefly described. A more detailed description of the model with the mathematical equations is given in a separate report (Pursiheimo, 2004). In chapter 4, the existing Nordic energy system is described. Scenarios of the future energy demands in the Nordic area are also outlined. Chapter 5 gives a state of the art description of the hydrogen related technologies as well as visions for the technical and economical development of these technologies. The information summarized in this chapter is based on the data found from public literature sources and information brought forward by project partners. The main part reports on the scenarios as well as implications for the future development in terms of hydrogen demands, costs and emissions. In chapter 6 the general model assumptions and constraints as well as all the input parameters for the scenario calculations are given. In chapter 7, the calculation results of the Nordic hydrogen energy scenarios as well as the sensitivity analysis for the most uncertain parameters are outlined. Finally, the main conclusions are made concerning the systems analysis and technological alternatives of hydrogen society in the Nordic environment.
5

2 Existing energy systems models - The state of the art
When analysing energy systems with the purpose of studying how one should go about transforming them in order to meet future requirements (including the possible introduction of hydrogen), there are two fundamental concepts that must form the framework to realistically carry out this study. These concepts are path dependence and achieving desired change in systems in equilibrium and are described below on a general basis.
Path dependence:
It is crucial to include the phenomenon of path dependence when considering the possible introduction of hydrogen related technology to the existing energy market, and when assessing how the existing energy system may be transformed in order to meet future needs. The main reason for this is that path dependence leads to solutions being selected in the real world that are not necessarily optimal. Thus, modelling tools that rely on optimisation alone may be misleading. Sterman (2000) describes path dependence in the following way:
“Path dependence is a common phenomenon in natural and human systems. Path dependence arises in systems dominated by positive feedback. Even when all paths are initially equally attractive, the symmetry is broken by microscopic noise and external perturbations. The positive feedbacks then amplify these small initial differences to macroscopic significance. Once a dominant design or standard has emerged, the costs of switching become prohibitive, so the equilibrium is self-enforcing: the system has locked in.”
J.D. Sterman, 2000:406
See also Arthur (2000) for a brilliant introduction to the interplay between competing technologies, positive feedback (increasing returns) and path dependence in the economy, together with the discussion of technological and institutional lock-in by Foxon (2002). Examples of path dependence suggest that path dependent systems rapidly lock in to stable equilibria, which then persist indefinitely in a given region or context (e.g. right/left hand driving, 110/220 voltage, metric/Imperial units etc.). One may then ask if all path dependent systems are perpetually trapped in equilibria to which chance events lead them? Is there no way to break out? There are many examples in which a dominant standard has been overthrown. Qualitative, large-scale change of systems that have locked in will take place when the system in which the standard is dominant becomes obsolete or is itself overthrown. Systems may become obsolete due to architectural shifts (e.g. modes of transport like ship/airplanes, mail/ email) from the process of ‘creative destruction’ (coined by the Austrian economist Joseph Schumpeter) through more competitive products and services. Economic depressions may also unfreeze an economy that has locked in to certain technologies. Sterman (2000) provides an excellent illustration:
“Every economy needs basic technologies for energy, transportation, and communications. An ensemble of technologies and infrastructure built around coal, steam, rail, and the telegraph dominated the industrialized world in the late 19th and early 20th centuries. Populations and industry were concentrated in large cities surrounded by farm and forest. These technologies and settlement patterns were self-reinforcing. Coal has a fairly low energy density and is difficult to handle, which favors centralized settlement patterns and transport modes like rail and steamship. Telegraph lines were often strung along the railroad right of way, lowering the cost of infrastructure and maintenance. The coal-steam-rail-telegraph ensemble remained dominant until the Great
6

Depression of the 1930s. The depression bankrupted many of the firms in these industries, their physical infrastructure deteriorated, and the power of their leaders waned.
When the economy began to recover from the depression in earnest after WWII, new investment did not recreate and refurbish the old networks and technologies but focused instead on a new ensemble of basic technologies. The new economy of the post-war era was built around oil, natural gas, and electricity for energy; internal combustion and electric motors for mechanical power; automobiles and aircraft for transportation; and telephone, radio and television for communication. The suburbs emerged and industrial location patterns became less centralized. These technologies were also mutually reinforcing: catalytic cracking enabled crude oil to be refined into gasoline at low cost; gasoline is an energy-dense, easily handled fuel suitable for a large fleet of small vehicles and decentralized settlement patterns; internal combustion engines are small and powerful enough to be use in aircraft; and so on. All these technologies were invented well before the 1930s, but the costs of switching were prohibitive because they were incompatible with the existing ensemble of technologies and social structures. Despite their great potential, the new inventions could not achieve widespread use until the old infrastructure – physical, social, and political – was swept away by the Great Depression and Second World War. The depression and war functioned as a mass extinction event that erased the basis for the old technologies and the firms that dominated them.”
Sterman, 2000:389-390
This period, with all its changes, is of course a complex story accompanied by many causal factors and connections in addition to what is included in the brief account from Sterman. Nevertheless, it is a weighty account that illustrates the importance of including path dependence, lock-in and the dynamics of changing a system within the analysis of the Nordic energy system.
Achieving desired change in systems in equilibrium:
Today’s energy system is currently in equilibrium. At the same time instability is developing. Policy making efforts aimed at transforming the existing energy system towards a desired outcome should follow some characteristics from fundamental dynamics. Some central points may be summarised:
1. It makes a difference when and where to push. As we know, timing can be crucial.
2. Stable systems, when disturbed, return to equilibrium
3. Instability develops with time
4. Unstable systems bifurcate (shift) into something new and more stable
5. Instability in the economy arises from disruptions from basic returns on investments, which may come about in many different ways.
Thus, in order to achieve the desired change, there appear to be two principal means for altering systems that have locked in on sub optimal solutions: the dominant negative feedback structure must be destabilised (through weakening the dominant negative feedback loops), or through creation or stimulation of ‘sleeping’ positive feedback loops in a system. Either of these will lead to the desired change.
Energy scenarios have been traditionally analysed using equilibrium models. The calculation tools are often technology based “bottom-up” linear optimisation (LP) models. Since the early 1990’s, long-term energy scenarios have been analysed at national and international level with different “bottom-up” energy systems models. Examples of the widely used energy systems models are
7

MARKAL and EFOM (Energy Flow Optimisation Model). The next generation model currently under development is the TIMES model (The Integrated Markal Efom System). The development work of the TIMES model has been carried out nationally and internationally in the IEA Energy Technology Systems Analysis Programme (ETSAP). All these “bottom up” models are based on large technology databases, which make long-term simulations of the energy system viable. However, the models can equally be used for local energy planning studies too. At both levels, the models can be used for a wide range of applications:
• Strategic planning of future energy supply options;
• Analysis of least-cost strategies for achieving energy and emission policy targets;
• Economic evaluation of environmental and energy policies and measures;
• Examination of the collective potential of key technologies and resources;
• Evaluation of different R&D strategies for energy technologies.
MARKAL has been used in Sweden and Norway, while Finland and Denmark have used the EFOM model in their climate-energy-economic analysis. In Denmark, energy systems model called Balmorel has also been used. In the Nordic countries, co-operation in systems analysis has been carried out in the Nordleden project, which comprised participants from Sweden, Norway, Denmark and Finland (Rydén 2003). In this project, the systems analysis of the existing Nordic energy system has been carried out using the MARKAL model. In 2004, the new TIMES systems model for energy systems analysis at the national level was successfully introduced for regular use in Finland.
The described “bottom up” energy systems models include detailed information on the whole energy system including the industrial, residential, service and transport sectors of the selected geographic area (national, EU-wide, etc.):
• Fuel supply and conversion (fuel production, imported energy, etc)
• Energy conversion (electricity and heat production)
• Energy distribution (fuel distribution, electricity grid, gas network, district heat network)
• Demand sectors and distributed generation (agriculture and forestry, industrial sectors, construction, space heating, transportation, services, households)
• Waste management and agricultural sectors.
The database usually includes technical information (efficiencies, availability, life times), economic data (investment and operating costs, discount ratio), and emissions (CO2 and other greenhouse gases). The database also includes different energy saving and emission reduction measures. The model searches for the solution that offers the least cost to fulfil the energy demand requirements and other constraints such as given emission limits.
Hydrogen energy systems have only recently been taken into account in the national and international energy scenarios, like in the US and EU. In the integrated EU project HyWays, the European hydrogen energy roadmap will be developed (see www.hyweb.info). In the HyWays project, regional hydrogen supply options and energy scenarios will be analysed using the MARKAL model including the E3 database (technical/micro-economic/emissions-data). A
8

comprehensive systems analysis is planned by the IEA Hydrogen Coordination Group to take place in 2005.
Hydrogen energy systems have already been studied in Denmark and Norway. Below, descriptions of this hydrogen related systems analysis is given. In Finland, systems analysis of energy systems has long traditions. However, the existing tools, like TIMES or EFOM do not include hydrogen related systems for energy production or for transportation sector.
2.1 Hydrogen energy systems analysis work in Denmark The leading R&D environment in Denmark focusing on systems analysis of hydrogen energy is the Systems Analysis Department of Risoe National Laboratory with a range of large and small projects having been carried out over, approximately, the last 15 years. In addition Roskilde University Centre (RUC) is carrying out systems analysis work specifically focusing on hydrogen energy. In the past, systems analysis with special emphasis on the transport sector has been carried out at the Technical University of Denmark but this work has been terminated.
An ongoing large-scale cross-institutional research project, “Towards a hydrogen-based society”, involves both basic and applied research (mainly physics and systems analysis). The participants in the project, to be completed in 2006, include the Technical University of Denmark (project co-ordinator), Århus University, Haldor Topsøe, Danfoss, IRD and Risoe’s Material Science and System Analysis Departments. The systems analysis activities of this project include assessments of the resource base for introducing hydrogen energy in Denmark; and an investigation of the scope for transferring technology gains related to fuel cells and/or hydrogen between different sectors of application - transportation, portable (consumer electronics etc.), UPS (Uninterruptible Power Supply), stationary cogeneration of power and heating etc. Some of the sectors driving the technological development of fuel cells (PEM), notably the transportation sector, have very severe cost targets and if these were met (even in part), this would make the technology very competitive in other sectors. On the other hand there are very different conditions, e.g. with respect to operational times, that would create greater, or at least different, demands on durability etc.
A focal point of Risoe’s - and RUC’s - work over the years has been the utilisation of hydrogen as an energy carrier for the integration of renewable energy systems into the electricity system. In this context hydrogen could perform a combined role as a distribution medium and storage option for fluctuating renewable energy power sources, notably wind power (given the very high share of wind in the Danish power supply system). The principal instruments of this work are power system modelling and scenario analysis, particularly investigating long-term scenarios (up to the years 2030 and 2050). Initially the main objective was to ensure a high utilisation of the renewable power sources within a national framework but increasingly the international context has been emphasised as well - aiming to achieve the best use of the power in environmental and economical terms.
In recent years, the focus has been extended to include analysis of the application of hydrogen/fuel cell units for decentralised generation of power and heating.
Moreover, investigations of the introduction and widespread use of hydrogen as a transportation fuel in Denmark have created a significant research field, again focusing on the issue of utilising hydrogen (and electricity) as an energy carrier – a distribution and storage medium - for renewable energy sources. In this connection too, scenario analysis has been applied, including a study of the potential for converting the major part of the transportation fuel in 2030 according to the most recent Danish national energy plan on renewable energy, based on hydrogen and methanol.
9
Hence, a generic theme of these two research fields has been the systems and technological analysis of the application of hydrogen technologies in support of renewable energy and the development of more energy efficient systems in the energy sector. There can be a strong synergy effect linked to the combined application of hydrogen in the two sectors. In the transportation sector in its own right, hydrogen and fuel cells can meet important objectives that may otherwise be difficult to meet. In conjunction with electricity generation, on the other hand, the overall conclusion of the studies is that the benefits of hydrogen can hardly, in itself, justify widespread application of hydrogen - when considering the problems in the international context, such as the already integrated nature of the present power supply system. However, this conclusion may be altered in the long-term if more countries have high renewable energy shares in the power supply system. In any case the best approach would be based on the exploitation of the synergy impact of a combined utilisation of hydrogen in both main sectors. Generally, the large-scale hydrogen application will only be perceivable in a very long-term perspective but the transition to will have to start now. The most likely long-term energy system - if hydrogen gets a breakthrough - would be some combination of electricity and hydrogen as energy carriers.
The main focus of the hydrogen systems analysis work in Denmark has not been on methodologies and modelling issues as such, but rather on the application of methods and models. Generally, models have not been developed specifically for hydrogen studies, apart from some adaptation of already existing models. Against this background, there is a need for model development for the introduction of hydrogen in the energy sector - both for the energy sector as such, for sub-sectors and for specific issues. The objective of this is not just to pursue quantitative results, though this is obviously a part of it, but also to illustrate qualitative developments, for instance inter-connections etc. Hence, both the modelling process and the results are of interest. Systems dynamics would be a very suitable tool for this.
In addition, detailed resource mapping with a view to evaluate the renewable energy potentials for available for the purposes has been carried out, covering in particular wind and biomass resources.
An overall conclusion from the assessments of the renewable resource potentials is that 100 per cent coverage of the Danish energy consumption is achievable in the very long term (beyond 2050). However, it is not entirely unproblematic to achieve this target and it can be facilitated by simply economising resources by control of demand and development of energy efficient systems. If based entirely on biomass resources, it is barely possible due to the nature of these resources (a low energy yield per land unit) - at least not with the present demand patterns and energy systems.
Further methodological focal points include: technology catalogues of hydrogen and fuel cell technologies; fuel cycle and life cycle analysis of renewable hydrogen; and inventories of energy and environmental impacts of energy, electricity and transport sectors with widespread hydrogen utilisation.
2.2 Hydrogen energy systems analysis work in Norway Energy systems analysis and modelling has had a long tradition in Norway. The main institutions involved in this work are the Institute for Energy Technology (IFE), located near Oslo, and the Foundation for Scientific and Industrial Research (SINTEF) at the Norwegian University of Science and Technology (NTNU), located in Trondheim. SINTEF Energy Research and NTNU work closely together. All three institutions have a strong basis in technology, and a substantial part of their focus has been oriented towards stationary energy systems analysis. Main tools have been MARKAL and Samkjøringsmodellen. Currently, work is being carried out at IFE, SINTEF and NTNU, to extend
10

existing modelling tools to also include hydrogen related technologies, similar to what is described in section 2.1.
As an alternative to the traditional bottom-up structured energy models, a PhD study undertaken by Kaare Gether from 2001 to 2004 (Gether 2004) resulted in an intrinsically dynamic model, the Energy Infrastructure Competition model (EICOMP), the main purpose of which has been to study the role hydrogen may play in future energy systems. A central part of the work has been discussion of the “meeting-point” between bottom-up and top-down approaches and their potential benefits and challenges, and also another, general, discussion of energy model boundaries, and the consequences from where the boundaries are set and how they are defined. From a national perspective, the main challenges in using the traditional modelling approaches listed above, are realistically representing causal relationships, positive feedback loops and their interface with macroeconomic aspects. From a Nordic perspective, some of the main challenges are how to capture and represent energy politics, and policies, that are still national tasks, and how one should relate the interaction to other systems that also have an effect (e.g. EU, WTO). There is also a challenge to represent and discuss how to transform the existing market based energy system that is divided into sectors, and where each sector operates more or less separately (e.g. electricity market, transport sector, heat market and agriculture market – that all have in common the need to attain profitability separately).
To unite the two challenges, to combine micro- and macro economic aspects that are relevant, and the influence from ‘bigger’ systems (i.e. model boundaries), the construction of the EICOMP model together with the PhD work itself was aimed at studying how the Nordic countries can lead a focused energy policy with liberalised energy markets towards sustainable development. Modelling and understanding qualitative, large-scale, change becomes important. A detailed description of the EICOMP model, and its framework, is available at Gether (2004).
11

3 Representation of the Nordic hydrogen energy system model In the Nordic H2 Energy Foresight project, a simplified technology based hydrogen energy model was created to analyse different hydrogen energy scenarios and pathways in the Nordic environment. The model includes hydrogen-based technologies only, which makes it easy to use. The required technology based data is restricted to the hydrogen specific technologies. The markets (i.e. H2 demand, market prices of fuels and electricity, CO2-tax, etc.) are specified by the user. Because the model is restricted to the hydrogen-based technologies only, the comparison of hydrogen and other sustainable future energy technologies is not possible.
For the project’s purposes, a hydrogen energy model was created with a linear programming method. The created model is a representation of the flows of energy (energy carriers) and technological alternatives in the hydrogen energy system (see Figure 1). With the model the analysis of least-cost strategies for achieving hydrogen energy and policy targets may be carried out. The flow model includes:
• A network of energy and material flows
• Primary energy sources (fossil fuels, renewable energy)
• H2 production technologies (electrolysis, reforming, biomass gasification) and H2 storage
• Distribution alternatives (pipeline, road transport) for H2 and natural gas
• H2 utilisation (heat, power, transportation fuel)
• Short and long term variations of the H2 production and demand
• Connections to the electricity market
• Costs (investment, operating)
• Technical details (efficiencies, life time, availability, etc.)
• Emissions (carbon dioxide)
• Policy measures (investment subsidy, CO2-tax).
A detailed description of the model is presented in the WP4’s report by Pursiheimo (2004). The report describes the mathematical representation of energy balances between production and demand as well as the basis for cost evaluations. The selection and verification of input parameters has been reported in this report as well as the results of the selected scenario calculations.
In the model, the mathematical representation of the cost calculation is based on EFOM (Energy Flow Optimisation Model). Annual costs are accumulated into the milestone years by linearisation and discounting, and the total cost is minimised in the model. The total cost includes all the investment and operating costs from the present to the final year of the scenario specified by the user. The energy and hydrogen balances of the model ensure that the demands of electricity, heat and transportation fuel will be covered. In the model, the required electricity and heat is produced with fuel cells and gas engines. The alternatives for hydrogen production are steam reforming of natural gas, electrolysis and biomass gasification. The necessary plant capacity to maintain these balances is obtained by investments in a new capacity.
12

• The input of the model for different milestone years includes:
• Hydrogen energy demand for electricity, heat and transportation energy (% of the total demand)
• Division of the hydrogen demand between centralized and decentralized demands
• Market prices for fuels and electricity
• Cost data (investment, operating)
• Technical data (efficiencies, loss factors, life times, availability)
• Economical data (discount rate)
• Policy measures (investment subsides, CO2-tax).
At VTT, Microsoft Excel with the What’s BestTM linear solver by Lindo Systems Inc. has been successfully used in simple systems analysis problems in the energy sector. This was also selected for the Nordic hydrogen energy systems model.
CentralizedSteam
Reforming
Decentralized
Electrolyzing
CompressorCompressor
CHP FuelCell
RenewableElectricityProduction
DecentralizedSteam
Reforming
Compressor
Centralized
E
lectrolyzing
Compressor
RenewableElectricityProduction
Dispenser
H2 Storage
H2 FuelStation
Dispenser
H2 Storage
CHP FuelCell
Dispenser
H2 Storage
CHP FuelCell
Dispenser
H2 Storage
H2 FuelStation
Dispenser
H2 Storage
H2 FuelStation
Dispenser
H2 Storage
LiquefactionPlant
CentralizedElectricityDemand
CentralizedHeat
Demand
CentralizedH2 FuelDemand
DecentralizedElectricityDemand
DecentralizedHeat
Demand
DecentralizedH2 FuelDemand
DecentralizedElectricityDemand
DecentralizedHeat
Demand
DecentralizedH2 FuelDemand
Market Electricity
Centralized DecentralizedH2 and Natural Gas Pipeline Connected Natural Gas Pipeline Connected
Large Scale H2 Pipeline
Large Scale Natural Gas Pipeline
H2 H2
H2 H2
H2 H2 H2 H2
H2 H2H2
H2H2
ELHE HE HE
EL
EL
EL
EL
LH2
NG
NG
LH2
Mobile LH2 Transmission
EL
DecentralizedBiomass
Gasification
Compressor
H2 H2
Biomass
BIO
H2 H2
CentralizedBiomass
Gasification
Compressor
H2
H2
Biomass
BIO
CentralizedSteam
Reforming
Decentralized
Electrolyzing
CompressorCompressor
CHP FuelCell
RenewableElectricityProduction
DecentralizedSteam
Reforming
Compressor
Centralized
lectrolyzingE
Compressor
RenewableElectricityProduction
Dispenser
H2 Storage
H2 FuelStation
Dispenser
H2 Storage
CHP FuelCell
Dispenser
H2 Storage
CHP FuelCell
Dispenser
H2 Storage
H2 FuelStation
Dispenser
H2 Storage
H2 FuelStation
Dispenser
H2 Storage
LiquefactionPlant
CentralizedElectricityDemand
CentralizedHeat
Demand
CentralizedH2 FuelDemand
DecentralizedElectricityDemand
DecentralizedHeat
Demand
DecentralizedH2 FuelDemand
DecentralizedElectricityDemand
DecentralizedHeat
Demand
DecentralizedH2 FuelDemand
Market Electricity
Centralized DecentralizedH2 and Natural Gas Pipeline Connected Natural Gas Pipeline Connected
Large Scale H2 Pipeline
Large Scale Natural Gas Pipeline
H2 H2
H2 H2
H2 H2 H2 H2
H2 H2H2
H2H2
ELHE HE HE
EL
EL
EL
EL
LH2
NG
NG
LH2
Mobile LH2 Transmission
EL
DecentralizedBiomass
Gasification
Compressor
H2 H2
Biomass
BIO
H2 H2
CentralizedBiomass
Gasification
Compressor
H2
H2
Biomass
BIO
Figure 1. Representation of the Nordic hydrogen energy systems model.
13

4 Description of the Nordic energy system Part of the work done by WP4 was focused on the evaluation of the existing Nordic energy systems. This information is needed as a starting point for developing technological pathways, markets, costs, etc. for hydrogen energy in the Nordic region. The more detailed description of the Nordic energy statistics is presented in the paper “Nordic Energy Basics” (Koljonen & Pursiheimo 2004).
4.1 The existing energy system The energy systems vary among Nordic countries as shown in Figure 2. Finland, Sweden and Denmark have a wide diversity of primary energy sources. In Finland and Sweden the primary energy sources include hydropower, nuclear power, oil, coal, biomass, peat and natural gas. The share of wood biomass is high because more than half of the wood used as raw material by pulp and paper mills ends up as on-site energy production. In Denmark, the primary energy sources are natural gas, coal, oil, biomass, and wind power. In Iceland and Norway renewable energy sources have the most significant role as a primary energy source because of the high proportion of hydropower, and also geothermal energy in Iceland. In the Nordic area, the share of renewable energy sources in electricity production is more than 55% due to the use of hydropower. However, the share of wind power has also increased rapidly, especially in Denmark.
In addition to renewable energy resources, Norway and Denmark have a considerable production and export capacity for oil and natural gas. In 2002, Norway produced about 160 million tons of oil and 74 billion m3 of natural gas. In Denmark, the corresponding figures were 18 million tons and 8 billion m3. These accounted for 4.9% and 2.9% share of the world’s total in oil and gas production in the Nordic area (BP 2004).
In the Nordic countries, the share of industry in overall energy consumption is large due to high energy intensity in industries such as pulp and paper and metal industries. Because of the cold climate, the share of space heating is high in overall energy consumption. However, the overall efficiency in energy production is high, since more than 80% of thermal power is produced in combined heat and power plants (CHP). More than half of these CHP plants are connected to the district heating systems of communities. Since 1990, total electricity consumption in the Nordic countries has risen by an average 1.2% annually (Swedish Energy Agency 2003). In 2002, the demand of electricity in the Nord Pool area was 389 TWh (Nordel 2004). The total energy consumption in the Nordic countries totalled 5700 PJ in 2002 (see Figure 2).
14

0
500
1000
1500
2000
2500
Denmark Finland Island Norway Sweden
Figure 2. The total energy consumption and primary energy sources in the Nordic area in 2002. In Finland, wind power is included in hydropower; and in Sweden, peat is included in biomass. (Danish Energy Authority 2003, Statistics Finland 2003, Orkustofun 2003, Statistics Norway, Swedish Energy Agency 2003)
International electricity grids are well developed in the Nordic countries and allow for the transmission of electricity over long distances. Denmark, Finland, Norway and Sweden form a common electricity market area within the Nord Pool power exchange. In addition to the interconnections of electricity in the Nord Pool area, connections also exist with Germany, Russia and Poland. As a consequence of deregulation, there has been a revolutionary restructuring of the whole energy sector in the Nord Pool countries. On the average, the prices of electricity have been decreasing following the closure of old production facilities up to 2002. Due to low electricity market prices, no new production capabilities (except wind power and small, decentralized CHP) have been built. An exceptionally dry period during 2002–2004 led to shortages of hydropower in the Nordic countries and the monthly average electricity prices rose by about 100%. The planned closure of Swedish nuclear stations and implementation of the Kyoto Protocol would force elec-tricity market prices even higher. To cover the increasing electricity demand Finland has already decided to build a new nuclear facility, which will be in operational use in 2010. However, further investments in new capacities with low greenhouse gas emissions would be required without considerable energy saving in the Nordic area. This would provide the Nordic countries with a window of opportunity for a new environmentally benign electricity production, like hydrogen power.
The existing natural gas network is well developed only in Denmark. In Finland and Sweden, the existing network only covers the southern parts of the countries. In Norway, the explored natural gas is mainly exported via offshore pipelines and the onshore natural gas grid practically doesn’t exist. However, new pipelines have been planned in both Norway and Finland. The world’s longest offshore pipeline ever planned is to deliver Russian gas to Continental Europe via Finland and the
Tota
l en
gyns
er c
oum
ptio
n, P
J
Oils total Natural gas Coal & coke Nuclear fuelPeat Biomass & wind Hydro power Geothermal
15

Baltic Sea. The pipeline would pass through the Baltic Sea from Vyborg to the German coast. However, no final investment decisions have been made for this North Transgas (NTG) project.
4.2 Nordic Energy Outlook 2030 The total energy demand in the Nordic region was estimated to grow about 7% from 2002 until 2030 (Eurelectric 2002, EU 2004) as shown in the Figure 2. The consumption of energy in 2002 corresponds to realized consumption (see Figure 2), which indicates that the scenarios for energy consumption by EU and Eurelectric might be underestimated (at least for the near future). The highest increases were assumed in consumption of electricity (18%) and transportation fuels (12%).
0
1000
2000
3000
4000
5000
6000
7000
2002 2005 2010 2015 2020 2025 2030
Tota
l ene
rgy
cons
umpt
ion,
PJ
OthersSpace heatingTransportElectricity
Figure 2. The estimated consumption of energy in the Nordic area until 2030 (Eurelectric 2002, EU 2004).
16

5 Development of hydrogen technologies and representation of input data used for the scenario calculations In this chapter, state of the art of hydrogen production, compression, transport, storage, and energy conversion technologies is presented. Visions for the future development of these technologies are also shown. Most of the information is based on publicly available sources. However, expert judgements by project partners are also used for certain technologies. The data presented here includes technical and economic data for selected hydrogen technologies. The key technologies were prioritised by Nordic and international experts.
There are several public literature sources, which report capital and/or total costs of hydrogen related technologies. Most of these costs are reported as cost per energy unit, like US$/GJ. However, capital costs are dependent on the discount rate, economic lifetime and other economic parameters. On the other hand, variable costs are highly dependent on raw material costs and also annual operating time and other parameters. Total costs are naturally dependent on both investment and variable costs. Usually these parameters are not reported, which makes data verification and judgement very difficult to establish. Technical parameters used in cost calculations, like efficiencies, are often not given either. If the energy efficiencies are reported, it is often unclear how energy efficiencies are defined, i.e. are the calculations based on the lower or higher heating value of hydrogen and raw materials. The report by Simbeck and Chang (2002) has a good description of the costs of hydrogen supply. However, in the report only small-scale hydrogen supply was considered, and the reported data are obviously not applicable in the large scale.
Below, the hydrogen technologies included in the Nordic hydrogen model and the publicly available cost information are presented.
5.1 Production of hydrogen Because hydrogen does not naturally exist in its elemental form on Earth, it must be produced from other compounds, such as water, biomass, or fossil fuels. Each method of production requires energy, such as heat, electricity, or light. Most hydrogen is currently produced via steam reforming of natural gas or light hydrocarbons. Partial oxidation (autothermal production) of fossil fuels is another method of thermal production. Any hydrocarbon feedstock that can be compressed or pumped may be used in this technology, e.g. residual oil. The CO2 sequestration process may be coupled to hydrogen production from natural gas to avoid CO2 emissions. Capturing of CO2 is a commercially available process but the long-term storage of CO2 is currently in the demonstration phase. Using electricity to extract hydrogen from water can also produce hydrogen. Renewable and nuclear resources may be used to produce electricity. Biomass can be thermally processed through gasification or pyrolysis to produce hydrogen (US DOE 2002, Padró & Putche 1999). The Nordic hydrogen energy system model includes the steam reforming process of natural gas, electrolysis with renewable electricity and biomass gasification. These were considered the most important hydrogen production technologies in the Nordic environment (see Dannemand Andersen et al. 2004).
17

Reforming with and without CO2 sequestration Steam methane reforming (SMR) is a fully developed, fully commercial process. The production cost of hydrogen is highly dependent on the scale of production, and also the cost of natural gas. The fuel cost is usually above 50% for large plants, and below 50% for small plants, of the total production costs. Steam reforming is the most energy efficient commercialized technology currently available for hydrogen production, and it is also the most cost-effective, especially when applied to large, constant loads. The efficiency for SMR is around 65-75%. Research is being conducted to lower the temperatures needed for the reformer, which would make the process even more efficient and economical (US DOE 2002, Padró & Putche 1999). Table 1 illustrates the capital costs and production costs of hydrogen with different plant sizes reviewed by Padró & Putche (1999).
Table 1. Summary of capital costs of steam reforming and hydrogen production for large plants. Mid 1998 price level, natural gas price 2.96 US$/GJ (Padró & Putche 1999).
Facility Size Reference Capital cost Production cost
Nm3/d kg/h US$/GJ (US$/GJ)
270 000 1013 Leiby 1994 27.46 11.22
1 340 000 5025 Leiby 1994 14.74 7.46
2 140 000 8025 Leiby 1994 12.61 6.90
2 800 000 10 500 Kirk-Othmer 1996 9.01 6.26
6 750 000 25 313 Foster-Wheeler 10.00 5.44
25 400 000 95 250 Block et.al 1997 10.82 5.97
Stoll and Linde (2000) report production costs of 9.3-37 US$/GJ (0.1-0.4 US$/Nm3, natural gas price 0.12 US$/Nm3, interest rate 6%) for the small steam reformers with capacities of 96 000-2 400 Nm3/d. The costs of hydrogen produced from a 13 500 Nm3/d (150 000 kg/d) plant by Simbeck and Chang (2002) were around 8.3-18.3 US$/GJ (1.0-2.2 $/kg). However, in these costs pressurization costs for pipeline, gas trailer or liquid tanker delivery were included.
The CO2 sequestration process may be coupled to SMR process to lower the CO2 emissions of hydrogen production. Currently available capture processes with chemical or physical solvent require energy, which lowers the overall efficiency of the SMR process coupled with CO2 capture. Also, the capital and operating costs are much higher than for SMR without CO2 capture. With today’s technologies, about 85% of total CO2 in product gas may be captured. At present much research work is being conducted in order to increase this percentage with the future processes, like CO2 capture processes with membranes. In the Nordic countries, suitable long-term storage sites for the captured CO2 are old oil and gas fields as well as saline aquifers, which are found under the sea belt of the North Sea. CO2 should be transported to the storage site, which increases the costs even more. The other possibility is to produce hydrogen near the storage site and transport hydrogen to the users. In this study, we have directed our attention towards centralized hydrogen production near the storage site and the transmission of hydrogen.
18

The studies that have attempted to quantify the additional costs of SMR hydrogen production with sequestration indicate that sequestration might add about 30-70% to the price of production. However, these figures may be considered very rough (AEA 2003). Several studies have examined the cost of electricity from a fossil-fuelled power plant with CO2 sequestration. These studies indicate that the investment costs might increase about 30-80% for coal power plants and about 60-110% for natural gas power plants. The corresponding deceases in power generation efficiencies were about 6-14 percentage units for coal and about 8-10 percentage units for natural gas. The increases in production costs of electricity were 50-120% for coal and 45-60% for natural gas. The reported costs of avoided CO2 emissions are typically in the range of 30-60 US$/ton of CO2 without the costs of CO2 transportation and storage. However, the capture costs with today’s technology are typically above 70-80% of the total sequestration costs, except for very long transportation distances, which may not be considered a feasible option (Spath & Mann 2004, IEA 2003). With the active research work carried out today, the capture costs are believed to decrease considerably by effi-ciency improvements and decreases in capital costs.
Electrolysis Making hydrogen from water by electrolysis is one of the more energy-intensive methods. However, the required electricity to separate water into hydrogen and oxygen may be produced from renewable energy sources, like wind or solar power. Also, electrolytic production of hydrogen offers one method of storing electricity from intermittent sources. Since electricity is generally more easily transportable than hydrogen, centralized hydrogen production through electrolysis would obviously be a niche application.
Under open circuit conditions, the standard electrochemical potential of the hydrogen-oxygen pair is 1.23 Volts (V) at NTP, which corresponds to the higher heating value (HHV) of hydrogen. The over-voltage is a measure of the electrical losses of the functioning electrolyzer and the losses relative to the heating value of hydrogen depend on the hydrogen production rate – i.e. the current density. With the standard potential of 1.23 V and corresponding voltage of operation of 1.76 V, the stage efficiency is 70% corresponding to the higher heating value (HHV). At higher specific hydrogen production rates, i.e. current densities, this efficiency is even lower (Bossel et al. 2003).
The energy efficiency of currently available electrolysis processes range from 56-73% based on HHV. Proton’s PEM (Proton Exchange Membrane) process has the lowest efficiency while Norsk Hydro’s and Stuart’s bipolar alkaline efficiencies are the highest. An efficiency goal for electrolyzers in the future has been reported to be in the 50 kWh/kg range, or a system efficiency of 78% HHV. This efficiency includes compression of hydrogen gas to 400 bar (Ivy 2004).
19

Table 2. Energy efficiencies of different electrolysis processes (Ivy 2004).
Energy required for system
HHV of H2 System efficiency (HHV)
Production pressure
kWh/kg kWh/kg % bar
Stuart: IMET 1000 53,4 39 73 25
Teledyne: EC-750 62,3 39 63 4-8
Proton: HOGEN 380 70,1 39 56 14
Norsk Hydro: Atm. Type No. 5040
53,5 39 73 30
Avalence: Hydrofiller 175
60,5 39 64 up to 680
Future N.N. ~50 39 ~78 400
IT Power (2004) reports that for all types of today’s electrolysers, electricity cost represents 70 to 80% of the produced H2 cost. The maintenance cost may be estimated to 5% per year of the investment cost. The existing investment cost for HOGEN 20 membrane electrolyser system would be as high as 30 000 €/kW and for an alkaline electrolyser from Hydrogen Systems 15 000 €/kW (7000 €/kW for the cells only). According to IT Power, the targeted costs for proton energy systems is 1000 €/kW in 2010. However, the long-term goal of US DOE for the cost of electrolysers is as low as 300 US$/kW. Myers et al. (2003) used this cost for a local dispensing station with a maximum hydrogen production of 900 kg/d. Figure 3 shows the prices of electrolysers based on manufacturers’ offers in 2000-2002. It should be noted that these units represent very small capacities. According to Simbeck and Chang (2002) a relatively large scale electrolysis unit with a capacity of 9000 kg H2/d (100 000 Nm3/d) would cost about 4.15 million US$.
0
100200
300
400500600
700
800900
1000
0 10 20 30 40 50 60 70 80 90 100 110 120
Capacity, Nm3/h H2
Pric
e, 1
000
€
Figure 3. Price based on manufacturers’ offers in 2000-2002 (IT Power 2004).
20

Biomass Gasification Hydrogen may be produced by biomass gasification using a variety of methods, primarily indirect and direct gasification. The technologies may be oxygen/air gasification, steam gasification, or a combination of the two. However, a large-scale biomass gasification process, which utilizes 100% biomass feedstock, has not been practiced commercially. The main development issues relate to biomass pre-conditioning, ash-removal, and synthesis gas cleanup (HyNet 2004, Myers et al. 2003).
It has been estimated that about 70 kg of hydrogen may be produced from one dry tonne of biomass. This yield is constrained primarily by thermodynamic limitations that are unlikely to be overcome by improvements in technology in the future. The thermal efficiencies based on LHV are about 70-80% (Iwasaki 2003, Myers et al. 2003, Simbeck & Chang 2002, Ohlström et al. 2000).
Figure 4 shows the capital costs of a biomass gasification plants for different plant scales reported by Iwasaki (2003). The reported total capital cost for the atmospheric pressure Battelle steam gasification process with a H2 production capacity of 115 000 kg/d would be about 117.3 million US$ (2001 dollars, Myers et al. 2003). The Shell gasification process (including H2 compressor) with a capacity of 100 000 kg/d H2 would cost 165.5 million US$ (Simbeck & Chang 2002). According to Padró & Putsche (2001), capital costs for a large (0.7-2.0 million Nm3) indirect gasification are estimated from 20.6 to 38.2 US$/GJ. Hydrogen produced via direct gasification is expected to cost about 5% more than that from the indirect method. The overall production cost of hydrogen with biomass gasification would be around 9-17 US$/GJ depending, for example, on the scale of the plant and feed stock cost, which could account for about 40% of the total cost of hydrogen production.
10
100
1000
10000
100 1000 10000 100000 1000000
Plant size, kW H2 output
Cap
ital c
osts
, US
$/kW
H2
Figure 4. Capital cost of biomass gasification plant with different hydrogen production capacities (Iwasaki 2003).
21

5.2 Hydrogen storage Hydrogen can be stored as a gas or liquid or in a chemical compound using a variety of technologies. Storage of high-pressure hydrogen gas in tanks is the most mature storage technology available. Liquid hydrogen can be stored in cryogenic containers, which requires less volume than gas storage. However, the liquefaction of hydrogen consumes large quantities of electric power, about one-third of the energy value of the hydrogen. The major focus in storage development is currently on hydrogen vehicle storage (US DOE 2002).
Compression of hydrogen Compressed hydrogen storage vessels are used for onboard vehicle storage, bulk transport or in stationary applications. Because of the very low density of gaseous hydrogen, compression to high pressure is required. The practical optimum is at 700 bar. However, 200-250 bar are the typical pressure levels for stationary hydrogen storage, for instance at a hydrogen refuelling station. In hydrogen vehicles, compressed hydrogen storages at 350 bar have recently emerged from the research stage and are now available commercially for fleet vehicles. The next technological development step is to develop 700 bar storage systems with qualified instrumentation (HyNet 2004).
Compressing gas requires energy, and the compression work depends on the thermodynamic compression process. The compression process may be isothermal or adiabatic. These two processes differ by the final temperature of the compressed medium. In the ideal isothermal case the temperature would remain constant, while under adiabatic conditions it raises considerably. Multi-stage compressors with intercoolers operate somewhere between the isothermal and adiabatic compression. Figure 5 illustrates the energy required for the compression of hydrogen. For a final pressure of 200 bar (20 MPa), the actual energy requirements for multistage compression would amount to at least 8% of the HHV energy content of hydrogen, and for 800 bar the energy requirement becomes at least 12% (Bossel et al. 2003).
The general short-term target is to reduce the storage costs from 700 €/GJH2 stored or 300 €/kgH2 (2005 at 30% maturity) to 105 €/kgH2 (2020 at 90% maturity) (HyNet 2004).
Final pressure, MPa
Ene
rgy
need
ed fo
r com
pres
sion
, % (H
HV
)
Final pressure, MPa
Ene
rgy
need
ed fo
r com
pres
sion
, % (H
HV
)
Figure 5. Energy required for the compression of hydrogen compared to its higher heating value (HHV) (Bossel et al. 2003).
22

Liquefaction of hydrogen Cryogenic hydrogen storage at about 20 K is the favored option, especially when transport distances involved are long. The drawbacks are complex technology, high specific vessel costs (especially for small tanks) and high operating costs of liquefaction due to the high energy usage of the liquefaction process, as well as losses due to evaporation and fuelling. These disadvantages limit the usage of LH2 tanks to hydrogen transport, larger storage volumes or regularly operated fleet vehicles, such as buses or service vehicles. (HyNet 2004).
Compared to the compression of gaseous hydrogen, even more energy is needed to compact hydrogen by liquefaction. Theoretically, only about 14.2 MJ/kgLH2 have to be removed in order to cool the gas from 298 K to 20.3 K and to condense the gas at 20.3 K and at atmospheric pressure. However, the theoretical value obtained by an exergetic analysis does not include any electrical, mechanical, thermal or flow-related losses of complex processes, which includes multi-stage compression and expansion processes. Today, the most efficient large plants in the US require 36 MJ/kgLH2 to liquefy hydrogen. The plant in the future has been suggested to reduce the energy consumption to about 25 MJ/kgLH2 (=7 kWh/kgLH2) for a plant producing 7 200 kgLH2 per hour. The required energy input for liquefaction relative to the HHV of hydrogen is shown in Figure 6. For very small liquefaction plants, the energy needed may exceed the HHV energy. Even the 10 000 kgLH2/plants (about four times larger than any existing facility) would consume 25% of the HHV energy. For the available technology, 40% would be a reasonable estimate (Bossel et al. 2003). Simbeck and Chang (2002) report that multistage compression consumes about 10-13 kWh/kg hydrogen.
Capacity of liquefaction plant, kg/hEne
rgy
need
ed fo
r liq
uefa
ctio
n, %
(HH
V)
Capacity of liquefaction plant, kg/hEne
rgy
need
ed fo
r liq
uefa
ctio
n, %
(HH
V)
Capacity of liquefaction plant, kg/hEne
rgy
need
ed fo
r liq
uefa
ctio
n, %
(HH
V)
Figure 6. Liquefaction energy relative to the HHV of hydrogen versus plant capacity (Bossel et al. 2003).
With gradual technological improvements, LH2 vehicle tank concepts target a production cost of 700 €/GJLH2 stored. Larger tanks can be commercially available technology if cost is reduced due to series production and technology is improved. According to Simbeck & Chang (2002), the battery limit investment is 700 US$/kg/d for a 100 000 kg/d hydrogen plant and the capital cost of a liquefier with a capacity of 27 t/d is about 41-44 million US$.
23

5.3 Delivery of hydrogen Similar to natural gas distribution, pipelines are used to supply hydrogen from its production site to an end-use device. Hydrogen is also distributed via cylinders and tube-trailers that are transported by trucks, trains, and barges. Nowadays, for long distance distribution of up to 1600 km, hydrogen is usually transported as a liquid (US DOE 2002). The Nordic hydrogen energy systems model includes both pipeline delivery and road delivery of hydrogen.
Road delivery by trucks Truck transport of hydrogen in its compressed stage is limited to small bulk quantities, infrequent user profiles and short transport distances (HyNet 2004). According to Bossel et al. (2003) compressed gases are normally delivered at a pressure of 20 MPa (200 bar), but the tanks are emptied only to about 4.2 MPa (42 bar) when discharging to a receiver at 4 MPa (40 bar), which represent the standard practices in use today. As a result, pressurized gas carriers deliver only 80% of their payload, while 20% of the load remains in the tanks and is returned to the gas plant. Today, a 40 metric ton tube-trailer can carry 3000 kg of methane at a pressure of 20 MPa and delivers 2400 kg to the user. Because of the low density of hydrogen gas, the same truck can only carry 320 kg of hydrogen at a pressure of 20 MPa, and deliver 288 kg to the customer. However, with future technical development, trucks may be able to carry 4000 kg methane or 500 kg of hydrogen, of which 80% (3200 kg and 400 kg) could be delivered to the consumer. According to HyNet (2004) the 30 ton truck can carry 200-530 kg of hydrogen.
Liquid hydrogen may be transported by a large-size truck-like vehicle with 60 m3 volume container. Because the density of cold liquid (70 kg/m3) is very low, and space is needed for the container, thermal insulation, safety equipment etc., there is room for only about 2100 kg of the cryogenic liquid.
If we consider a mid-size filling station, which might sell 26 tons of gasoline per day, one 40 ton gasoline truck delivery is needed per day. If we want to deliver the same amount of energy, 22 tube-trailer hydrogen trucks and four liquid hydrogen trucks would be needed for the same means. Taking into account the higher tank-to-wheel efficiency of fuel-cell cars, we would still need 15 tube-trailer trucks and tree liquid hydrogen trucks. Figure 7 shows the energy needed for the road transportation of different fuels relative to their HHV energy content for various distances. For a one-way delivery distance of 500 km, all the liquid fuels are within acceptable limits. However, delivering pressurized hydrogen for fuel cell vehicles, the associated relative energy consumption of the HHV energy content is more than 6% at a distance of 100 km (Bossel et al. 2003).
24

Transportation distance, km
Ene
rgy
cons
umed
for t
rans
porta
tion,
% (H
HV
)H2 gas (200 bar)H2 liquidGasoline
Transportation distance, km
Ene
rgy
cons
umed
for t
rans
porta
tion,
% (H
HV
)H2 gas (200 bar)H2 liquidGasoline
Figure 7. Energy needed for the road delivery of fuels relative to their HHV energy content (Bossel et al. 2003).
Based on the assumptions shown in Table 3, the cost of a liquid tanker truck delivery is about 10% that of tube trailer delivery, i.e. 0.18 US$/kg vs. 2.09 US$/kg. Unlike tanker trucks that discharge their load, the tube and undercarriage are disconnected from the cab and left at the fuelling station. Therefore, tube trailers are used not only as a transport container, but also as an on-site storage facility.
Table 3. Road delivery assumptions (Simbeck & Chang 2002).
Cryogenic truck Tube trailer
Load, kg 4 000 300
Net delivery, kg 4 000 250
Load/unload, hr/trip 4 2
Boil-off rate, %/d 0.3 na.
Truck utilization rate, % 80 80
Truck/tube, $/module 450 000 100 000
Undercarriage, $ 60 000 60 000
Cab, $ 90 000 90 000
25

Pipeline delivery Pipelines are most effective for short transport distances with high flow rates. Hydrogen is, however, expensive to transport over long distances by pipeline. Moving a certain energy flow of hydrogen through a pipeline requires about four times more energy than for natural gas, when we assume the same pipelines for both gases. In reality, hydrogen pipelines may have to be larger in diameter to reduce the energy requirement for pumping. Figure 8 shows the energy consumed for transport relative to the HHV of the delivered gases with different transport distances and through the same pipelines. For example, to deliver 3000 km hydrogen, at least 1.5 units of energy are needed to deliver one unit of hydrogen HHV. It should be noted that leakages from pipelines are not taken into account in these figures. Leakage of natural gas from pipelines is finite except for transportation over very long distances, for instance from Russia to Europe. However, due to its very small molecule size, leakage of hydrogen would be far greater. Therefore the energy required for pipeline delivery could be even higher, which would make hydrogen transportation over very long distances unfeasible (Bossel et al. 2003).
The capital costs of hydrogen pipelines depend on the length and the pipe diameter. The cost varies from 0.3 to 0.9 million US$/km (0.5 to 1.5 million US$/mile) (Simbeck & Chang 2002). The cost of a hydrogen pipeline would be 50-80% higher than that of a natural gas pipeline and it has been projected that transporting 0.5 GW pure hydrogen for a distance of 100 km would cost 0.89 US$/GJ and for 500 km up to 2.60 US$/GJ. The costs are also dependent on the delivery rate. For example, transmission of hydrogen for 100 km has been projected to cost 1.30 US$/GJ for 0.1 GW delivery rate and 0.83 US$/GJ for 1.0 GW delivery rate. The other reported estimate for the transmission with different delivery rates for 100 km was 0.50-0.58 US$/GJ for energy delivery rates of 1.5 and 0.15 GW, respectively (Padró & Putche 1999).
Figure 8. HHV hydrogen energy fed into the pipeline inlet compared to HHV hydrogen energy delivered at the pipeline outlet (Bossel et al. 2003).
26

5.4 Transfer of hydrogen Liquid hydrogen can be drained from a full to empty container by action or gravity unless the liquid is transferred from the lower to a higher elevation or at accelerated flow rates. This means that minor pumping work is needed for transferring liquid hydrogen. However, the situation is completely different for the transfer of pressurized gases. Automotive applications require large stationary supply containers in the filling stations, which cannot be subjected to high internal pressures. On the other hand, small high-pressure tanks in the vehicles are used to maximize the driving range. Transferring 1 unit of HHV hydrogen energy from a large 10 MPa storage tank to a 35 MPa vehicle tank would require at least 1.03 units (4.32 MJ/kg) of (electrical) energy. When transferring 1 HHV energy unit from a 10 MPa storage vessel to a 70 MPa storage tank of a hydrogen vehicle, about 1.12 units of energy would be needed (Bossel et al. 2003).
5.5 Conversion Hydrogen can be converted to electricity and/or heat via traditional combustion methods and through electrochemical processes in fuel cells. Hydrogen can be combusted in the same manner as gasoline or natural gas. The benefit of hydrogen combustion over fossil fuel combustion is that no carbon dioxide is emitted and other emissions can also be very low. The technology for hydrogen combustion is fairly well developed; because of its already applied usage such as on the main engines of a space shuttle or on unmanned rocket engines. New designs of combustion equipment specifically for hydrogen in turbines and gas engines are undergoing research too (US DOE 2002). However, development work for fuel cells is still needed in order to improve the technology and to lower the costs before their commercial use. In our hydrogen model, electricity and heat are produced with fuel cells and/or gas engines.
Stationary fuel cells In the 1990s, phosphoric acid fuel cell (PAFC) technology dominated the stationary fuel cell demonstrations. However, PAFC is beginning to be superseded by three other fuel cell types: molten carbonate fuel cells (MCFC), proton exchange fuel cells (PEMFC) and solid oxide fuel cells (SOFC). MCFC and SOFC are both high temperature fuel cells and can operate at very high efficiencies, especially if heat is used. Both technology types are being designed to generate from around 250 kWe to the several megawatt level. Where lower power is required, the commercialisation of PEMFC systems will benefit from investment in the transportation technology. Today’s PAFC systems cost in the region of 4 500 US$/kWe, and the first generation of MCFC systems are assumed to be around 10 000 US$/kWe. Efficiencies in the 40 to 50 percent range, with up to 80 percent when used in combined heat and power production, have been reported for the demonstration units (Cropper 2003, US DOE 2002).
Wärtsilä (Finland) has started a joint development programme on fuel cell technology with the Danish technology company Haldor Topsøe. The Wärtsilä fuel cell program is focused on planar SOFC technology, which is estimated to take a leading position in stationary power and marine fuel cell applications. According to Wärtsilä’s conceptual study of 250 kW SOFC system, the cost of a natural gas fuelled SOFC system would be 1500-2500 €/kWe in 2010 and 900-1500 €/kWe in 2015. The technological development schedules of SOFC planar technology in demonstration or pre-commercial units are shown in the Table 4.
27

Table 4. Estimated development of SOFC planar technology in demonstration or pre-commercial units (source: Wärtsilä)
2000-2005 2005-2010 2010-2015 2015-2020
Stack unit size, kWe 5 25 50 100
Max. unit size, kWe 20 250 1 000 5 000
Stack life time, h 2 000 16 000 40 000 50 000
Stack degradation / 1000 h, % 2 0,5 0,2 0,1
Electr. efficiency, % 43 48 52 55
Overall efficiency, % n.a1) n.a n.a 89 1) not available
The major cost items of SOFC systems include:
Stack 30% System control 17% Power electronics 15% Other BoP 30% Labour & overheads 15%
Gas engines The gas engine is a reciprocating four-stroke piston engine, which uses natural gas as the preferred fuel for heat and power generation. Gas engines can be set up to run a variety of other gaseous fuels, like hydrogen. Reciprocating internal combustion (IC) engines represent a well-known technology that is widely used. The type of these IC spark ignition engines may be either learn-burn or rich-burn. Learn-burn engines are more efficient, less maintenance intensive, and produce considerably fewer pollutants than rich-burn engines. However, if additional clean-up is needed, a more expensive SCR (Selective Catalytic Reduction) clean-up system is needed for lean-burn engines than for rich-burn engines, for which flue-gases may be treated with a passive 3-way catalyst similar to that used in automobiles (Energy Nexus Group 2002, Oland 2004).
Electrical efficiencies range from about 25-30% LHV for the small engines (10-100 kWe) up to 46% for the large engines. For example, the electrical efficiency of the largest gas engine of Wärtsilä (7.7 MWe) is 45.7% LHV. Total CHP efficiency is usually around 70-80%.
The capital costs of gas engines are typically in the range of 900-1500 US$/kWe. Engine systems above 800 kW can often be installed at costs of around 1000 US$/kWe or below (Oland 2004, GRI & NREL 2003, Energy Nexus Group 2002).
5.6 Fuelling stations The Hynet (2004) project has analysed the costs of hydrogen infrastructure for the EU until 2020. In the scenario calculations, fuelling stations were assumed to comprise 1 dispenser with 2 fuelling hoses. Two utilisation scenarios were taken into account: low and average utilisation rate of each fuelling station. For all the calculations an average of 72 refuelling processes per day and dispenser were assumed, which resulted in the total hydrogen fuel sales of 66-82 tons/year for the low utilised
28

fuelling stations and 144 tons/year for the average utilised fuelling stations respectively. Both compressed gaseous hydrogen (CGH2, 70 bar), and liquid hydrogen (LH2) were considered in the calculations.
The calculated average costs for the hydrogen fuelling stations after 5000 units built were 280 000 € for the CGH2 unit and 300 000 € for the LH2 unit. For 10 000 units built the average investments costs were reported to decrease to 260 000 € CGH2 and 280 000 € for LH2 respectively. The calculated investment costs of the fuelling stations are based on the typical learning curves:
bnaI −⋅= with
I investment costs for the nth unit
a investment costs for the 1st unit
n number of units
b learning rate parameter
Typical values of the learning rate parameter b vary between 0.1 and 0.3. In the HyNet scenarios, learning rate parameter b was chosen as 0.1. The following investment costs for the 1st units have been used:
LH2 fuelling station 630 000 €
CGH2 fuelling station 590 000 €
If we assume average utilised fuelling stations with 144 t/a (4,80 GWh) hydrogen sales, the total number of fuelling stations in 2030 would number from 3600 to 10 900, that is, if we assume that the hydrogen share of the total Nordic energy demand by 2030 varies from 6% to 18%.
29

6 The model assumptions and the input data and for the scenario calculations with the Nordic hydrogen model In this chapter, general assumptions, model constraints, as well as the technical and economical parameters for hydrogen production, transport, storage, and utilization are summarized. These input values are used for the ‘base case’ scenario calculations. Most of the technical and economical parameters are taken from public literature sources, and therefore may have significant uncertainty. Some parameters, for instance fixed and variable costs (excluding fuel costs), availability and annual operating time, are more or less based on the typical values used in the energy sector. All the data presented below as well as the calculated energy balances are based on the lower heating values (LHV). The value of a standard plant is an informative value and is not used for calculations, except for CHP plants. The parameter for “current hydrogen capacity” is set at zero because it is assumed that there are no existing hydrogen capacities or infrastructure for stationary or mobile applications.
6.1 General assumptions and constraints Duration curves In the model, the yearly energy consumption is divided into four seasonal sub-periods. This is done because the peak efficiency during the wintertime is usually higher than the yearly average consumption of power and heat. In the model, the energy balances are set to cover the peak demand. Below, the duration curves for electricity and heat are shown. These figures are modified from the average duration curves of power and heat in Finland, which might overestimate the average peak demand in the Nordic countries.
Sub-period times (1000 h):
1.080 1.944 2.688 3.048
Electricity energy share:
0.178 0.298 0.313 0.211
Heat energy share:
0.202 0.325 0.285 0.188
Hydrogen demand Hydrogen demand in the Nordic area is divided into the hydrogen demands for electricity production, space heating, and the transportation sector. The evolution of total demand for hydrogen from 2005 to 2030 was defined in the workshops of the project. The demands are given as a percentage of the total energy demands for power, heat and transportation. The scenarios for the sectoral energy consumptions in the Nordic area are presented in chapter 4.2. In the base case calculations, the demand of hydrogen energy for the transportation sector was set as defined for the three different scenarios. The demand percentages of hydrogen for stationary applications, i.e.
30

electricity and heat production, was assumed to be 50% lower that that for mobile applications. For stationary applications, it was assumed that hydrogen would compete with other sustainable energy systems, like renewable energy systems, for power and heat production. It was also assumed that hydrogen would probably not be very competitive with regard to electricity production within the industrial sector.
Figure 9 displays the evolution of the total hydrogen demands for the different scenarios B3, E1 and P2 for transportation sector, which are described in the report “Nordic H2 Energy Roadmaps”. The share of hydrogen in the total Nordic energy demand by 2030 defined in the Vision Workshop was as follows:
• Scenario B3: 6 - 7%
• Scenario E1: 14 - 16%
• Scenario P2: 16 - 19%
The evolution of hydrogen as an energy carrier is assumed to grow exponentially from 2005 to 2030 and after 2030 a transient period is assumed up to 2050. Without this transient period, the model would assume that the hydrogen demand is zero after 2030. This would have lead to unrealistic investments with short lifetime by 2030.
0,00 %
2,00 %
4,00 %
6,00 %
8,00 %
10,00 %
12,00 %
14,00 %
16,00 %
18,00 %
20,00 %
2000 2005 2010 2015 2020 2025 2030 2035 2040 2045 2050
B3 Transp.E1 Transp.P2 Transp.B3 Station..E1 Station.P2 Station.
Figure 9. Hydrogen demands for the transport sector and stationary applications of the base case scenarios B3, E1 and P2. (Period 2030-2050 is a transient period.)
In the model, the H2 demand was divided into separate demand categories: centralized hydrogen demand, decentralized demand along natural gas pipeline, and decentralized demand without con-
31
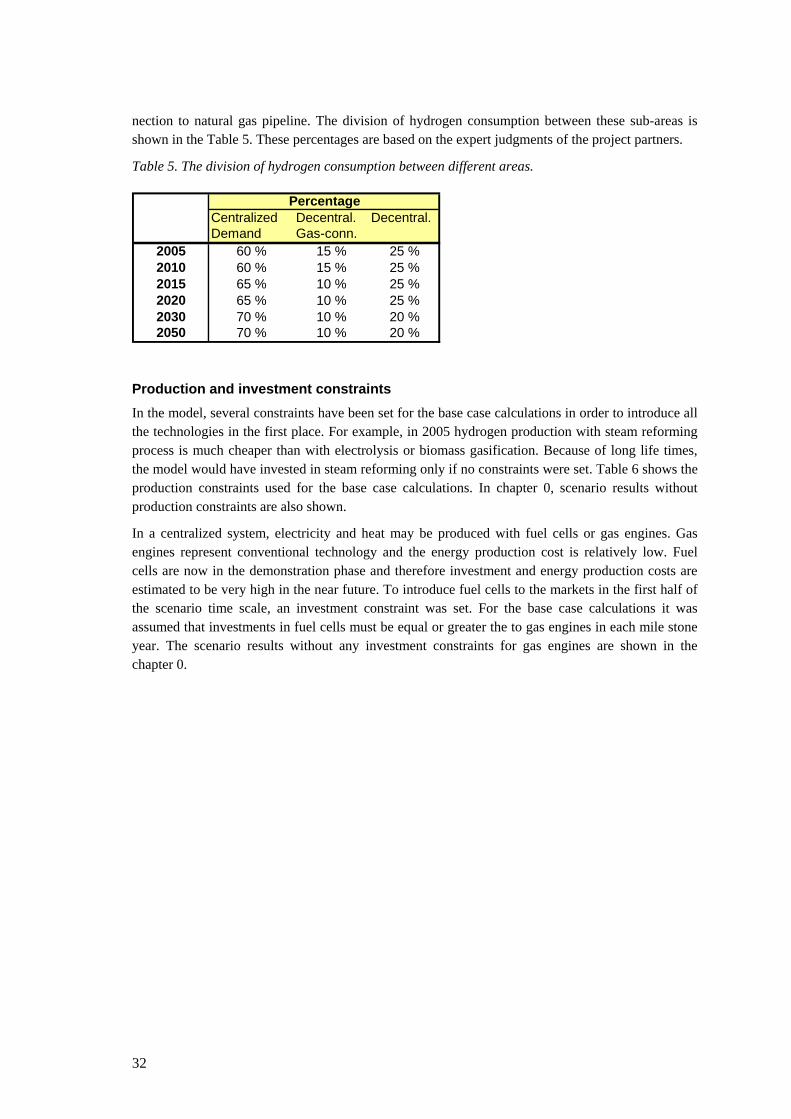
nection to natural gas pipeline. The division of hydrogen consumption between these sub-areas is shown in the Table 5. These percentages are based on the expert judgments of the project partners.
Table 5. The division of hydrogen consumption between different areas.
Centralized Decentral. Decentral.Demand Gas-conn.
2005 60 % 15 % 25 %2010 60 % 15 % 25 %2015 65 % 10 % 25 %2020 65 % 10 % 25 %2030 70 % 10 % 20 %2050 70 % 10 % 20 %
Percentage
Production and investment constraints In the model, several constraints have been set for the base case calculations in order to introduce all the technologies in the first place. For example, in 2005 hydrogen production with steam reforming process is much cheaper than with electrolysis or biomass gasification. Because of long life times, the model would have invested in steam reforming only if no constraints were set. Table 6 shows the production constraints used for the base case calculations. In chapter 0, scenario results without production constraints are also shown.
In a centralized system, electricity and heat may be produced with fuel cells or gas engines. Gas engines represent conventional technology and the energy production cost is relatively low. Fuel cells are now in the demonstration phase and therefore investment and energy production costs are estimated to be very high in the near future. To introduce fuel cells to the markets in the first half of the scenario time scale, an investment constraint was set. For the base case calculations it was assumed that investments in fuel cells must be equal or greater the to gas engines in each mile stone year. The scenario results without any investment constraints for gas engines are shown in the chapter 0.
32

Table 6. Production constraints given as the share of the total area production. SMR = Steam reformer, BMG = Biomass gasification, EL = Electrolyzer, SEQ = Reformer with sequestration, LIQ = Transport as liquid H2, C = centralized, DCGC = decentralized gas-connected, DC = decentralized, ≤ = Maximum constraint, ≥ = Minimum constraint
SCENARIO B3
SMR
C&DCGC
BMG
C&DC
ELC
C&DC
SEQ
C
LIQ
DC
2005 65%≤SMRC≤75% ≥10% ≥10% - ≥5%
2010 65%≤SMRC≤75% ≥10% ≥10% - ≥5%
2015 65%≤SMRC≤75% ≥10% ≥10% ≥10% ≥5%
2020 65%≤SMRC≤75% ≥10% ≥10% ≥10% ≥5%
2030 65%≤SMRC≤75% ≥10% ≥10% ≥10% ≥5%
2050 65%≤SMRC≤75% ≥10% ≥10% ≥10% ≥5%
SCENARIOS E1&P2
SMR
C&DCGC
BMG
C&DC
ELC
C&DC
SEQ
C
LIQ
DC
2005 45%≤SMRC≤55% ≥10% ≥10% - ≥5%
2010 45%≤SMRC≤55% ≥10% ≥10% - ≥5%
2015 45%≤SMRC≤55% ≥10% ≥10% ≥10% ≥5%
2020 45%≤SMRC≤55% ≥10% ≥10% ≥10% ≥5%
2030 45%≤SMRC≤55% ≥10% ≥10% ≥10% ≥5%
2050 45%≤SMRC≤55% ≥10% ≥10% ≥10% ≥5%
Cost calculations and discount ratio The cost calculations are the most complex part of the model. Energy and other variables are milestone year based and the parameters including cost information must be given for all these years. All the cost parameters are real costs and the discount factor discounts a given amount of the cost from 31st December of year t (2010, 2015, 2020, and 2030) to the 1st January of the ‘base year’ 2005. For the ‘base case’ calculations we have selected the discount ratio of 5%. All the cost data is based on 2003 euros. The influence of the discount ratio on the scenario results is presented with the sensitivity analysis in the chapter 7.2.
33

6.2 Input parameters for different technologies Hydrogen production The Nordic hydrogen model includes the below technologies:
• Steam reforming of natural gas with or without CO2 capture
• Electrolysis with renewable electricity
• Biomass gasification.
Technical and economical parameters have been defined for two plant scales, which could be considered as small, medium or large scale. In the model, steam reforming is used for large or medium scale hydrogen production and electrolysis and biomass gasification for medium or small-scale hydrogen production. CO2 sequestration is applied only for large scale SMR process that was assumed to be available in 2010 in the scenario calculations.
Table 7 shows the technical and economical parameters for steam reformers with and without CO2 capture. The expert judgements of project partners have been used for the steam reforming input data without CO2 sequestration. The input data for CO2 sequestration is based on the information reviewed in the chapter 0. As mentioned before, the technical and economical development of CO2 capture has significant uncertainty.
Table 7. The input parameters for steam reforming with and without CO2 capture.
Steam Reformers without CO2 Sequestration
Standard Current Lifetime Total Usability AnnualPlant Hydr.Cap Investment Fixed Variable Efficiency MaintenanceMW MW €/kW €/kW €/MWh Years 0 … 1 Weeks/a
Model 1 (Small) 2005 150 0 600 8 5 20 0,75 0,95 42010 150 0 600 8 5 20 0,75 0,95 42015 150 0 600 8 5 20 0,78 0,95 42020 150 0 560 7 5 20 0,8 0,95 32030 150 0 540 7 5 20 0,82 0,95 32050 150 0 540 7 5 20 0,82 0,95 3
Model 2 (Medium) 2005 460 0 140 5 5 15 0,82 0,99 42010 460 0 140 5 5 15 0,82 0,99 42015 460 0 140 5 5 15 0,82 0,99 42020 460 0 140 4 5 15 0,82 0,99 42030 460 0 140 4 5 15 0,82 0,99 42050 460 0 140 4 5 15 0,82 0,99 4
Steam Reformers with CO2 Sequestration
Standard Current Lifetime Total Usability Annual CO2 EmissionPlant Hydr.Cap Investment Fixed Variable Efficiency Maintenance ReductionMW MW €/kW €/kW €/MWh Years 0 … 1 Weeks/a %
Model 2 (Medium) 2005 460 0 250 5 10 15 0,72 0,99 4 85 %2010 460 0 250 5 10 15 0,72 0,99 4 85 %2015 460 0 250 5 10 15 0,72 0,99 4 85 %2020 460 0 220 4 9 15 0,72 0,99 4 90 %2030 460 0 200 4 9 15 0,75 0,99 4 90 %2050 460 0 200 4 9 15 0,75 0,99 4 90 %
Costs
Costs
Table 8 shows the technical and economical parameters for electrolysis, which are based on the literature values given in chapter 0. It should be noted that there is a high uncertainty in the development of investment costs of the electrolysis system. The investment costs found from the
34

literature vary a lot and have a tendency to be highly optimistic. The costs should include the investments to the whole electrolysis system and not for the electrolyzer only. The investment costs of the electrolysis system are further investigated with sensitivity analysis in chapter 7.2. The approximations for efficiencies are based on the data by Ivy (2004). However, here it is assumed that pressurisation of hydrogen is not included.
Table 8. The input parameters for electrolysis.
Electrolyzers
Standard Current Lifetime Total Usability AnnualPlant Hydr.Cap Investment Fixed Variable Efficiency MaintenanceMW MW €/kW €/kW €/MWh Years 0 … 1 Weeks/a
Model 1 (Small) 2005 1 0 2700 5 5 15 0,70 0,98 22010 1 0 2600 5 5 15 0,72 0,98 22015 1 0 2100 4 5 15 0,74 0,98 22020 1 0 1500 4 5 15 0,80 0,98 22030 1 0 1100 3 5 20 0,85 0,98 22050 1 0 1100 3 5 20 0,85 0,98 2
Model 2 (Medium) 2005 5 0 1170 3 4 20 0,80 0,95 42010 5 0 1070 3 4 20 0,85 0,95 42015 5 0 900 2 4 20 0,87 0,95 42020 5 0 600 2 4 20 0,90 0,95 42030 5 0 470 2 4 25 0,92 0,95 42050 5 0 470 2 4 25 0,92 0,95 4
Costs
The input parameters for biomass gasification are shown in Table 9. The data is based on the literature values presented in chapter 0. It should be noted that the investment costs for different gasification processes vary greatly and the below investment costs represent average values.
Table 9. The input parameters for biomass gasification.
Biomass Gasification
Standard Current Lifetime Total Usability AnnualPlant Hydr.Cap Investment Fixed Variable Efficiency MaintenanceMW MW €/kW €/kW €/MWh Years 0 … 1 Weeks/a
Model 1 (Small) 2005 10 010 010 010 010 010 0
50 050 050 050 050 050 0
1000 8 8 20 0,75 0,95 42010 1000 8 8 20 0,75 0,95 42015 1000 8 8 20 0,78 0,95 42020 900 7 8 20 0,8 0,95 32030 900 7 8 20 0,81 0,95 32050 900 7 8 20 0,82 0,95 3
Model 2 (Medium) 2005 800 5 8 20 0,8 0,99 42010 800 5 8 20 0,8 0,99 42015 700 5 8 20 0,82 0,99 42020 700 4 8 20 0,82 0,99 42030 600 4 8 20 0,82 0,99 42050 600 4 8 20 0,82 0,99 4
Costs
Hydrogen compression, transmission and storage The schematics of the hydrogen infrastructure including hydrogen compression or liquefaction, hydrogen transport via hydrogen pipeline and hydrogen storage is shown in Figure 10.
35

Steam reformer
Electro-lyzer
Biomass gasif.
Hydrogen pipeline
Fueling station
CHP Gas engine H2 demand
Transport H2 demand
CHP Fuel cell H2 demand
Storage loss
Pipeline loss
Decentralized reduction
Fueling loss
Fuel cell H2 demand
Figure 10. Representation of the hydrogen infrastructure.
The hydrogen infrastructure is the most uncertain part of the model calculations. There is a high uncertainty related to the costs of the infrastructure and the potentiality of the losses due to com-pression, liquefaction, storage and transmission. In the Nordic hydrogen model the following assumptions have been made:
• Hydrogen is transported via pipeline or as liquid hydrogen by a truck
• The investment cost of hydrogen compression unit is included in the investment costs of the hydrogen pipelines
• The investment costs of liquid hydrogen trucks are included in the investment costs of the liquefaction plant
• The investment costs of hydrogen storage are included in the hydrogen production cost, conversion cost and/or in the investments in fuelling stations
• Natural gas is transported via existing infrastructure.
Table 10 shows the input for hydrogen transmission via pipeline and mobile transmis-sion of liquid hydrogen. The investment costs are based on the information by Simbeck and Chang (2002), and the losses are estimated according to Bossel et al. (2003). The loss factor of hydrogen pipeline includes both compression and transmission losses.
36

Loss factor of mobile transmission includes the losses of liquefaction and the energy consumption of a hydrogen truck.
Table 10. Input data for hydrogen transmission.
H2 Pipeline Mobile Transmission
ElectricityCurrent Loss Life Liquefaction Mobile Current Loss Life to Liq. H2
Investment Variable Capacity Factor Time Investment Variable Capacity Factor Time Ratio€/kW €/MWh MW Years €/kW €/MWh MW Years
2005 2000 0,7 0 10 % 20 2005 1200 5,5 0 15 % 10 0,332010 2000 0,7 0 10 % 20 2010 1200 6 0 15 % 10 0,32015 2500 0,7 0 10 % 20 2015 1000 7 0 15 % 10 0,32020 2500 0,7 0 10 % 20 2020 900 9 0 13 % 15 0,282030 3000 0,7 0 10 % 20 2030 900 11 0 13 % 15 0,252050 3000 0,7 0 10 % 20 2050 900 11 0 13 % 15 0,25
CostsCosts
The storage losses are assumed to include all the losses from different storage sites and storage tanks, i.e. losses from hydrogen transfer (see chapter 5.4). Because the storage losses of the whole value chain of hydrogen are impossible to analyse without more detailed modelling of time dependence, the storage loss is assumed to be at a constant value of 20% for the period of 2005-2030. The influence of storage loss on the scenario results is investigated with sensitivity in chapter 7.2.
Hydrogen conversion to electricity and heat The model includes fuel cells and gas engines for combined heat and power (CHP) production. In addition, the model includes fuel cells for separate electricity production. The heat demand is met by CHP production. However, electricity may be produced not only to cover the demand but also to produce electricity for the markets. The input data of fuel cells (Table 11) is based on the information presented in chapter 0, which includes both the expert judgements of the project partners and the data found in the literature. The input data of gas engines (
Table 12) is presented in chapter 0. The model calculations assume that the economical and technical parameters presented for gas engines utilising natural gas are valid for hydrogen also.
37

Table 11. Input data for fuel cells.
CHP Fuel Cells
Current Lifetime Power UsabilityPower Heat Elec.Power Investment Fixed Variable EfficiencyMW MW MW €/kW €/kW €/MWh Years 0 … 1
Model 1 (Small) 2005 0,4 0,3 00,4 0,3 00,4 0,3 00,4 0,3 00,4 0,3 00,4 0,3 0
10000 7 12 5 0,42 0,982010 8000 7 12 5 0,44 0,982015 4000 7 11 6 0,46 0,982020 1500 6 10 7 0,48 0,982030 800 6 9 8 0,5 0,982050 800 6 8 10 0,5 0,98
Model 2 (Medium 2005 8000 5 7 12 0,52 0,982010 5000 5 7 12 0,54 0,982015 2700 5 7 13 0,56 0,982020 1200 4 7 13 0,58 0,982030 500 4 6 14 0,6 0,982050 500 4 6 15 0,6 0,98
Standard Plant Costs
1,2 0,7 01,2 0,7 01,2 0,7 01,2 0,7 01,2 0,7 01,2 0,7 0
Fuel Cells
Standard Current Lifetime Power UsabilityPlant Elec.Power Investment Fixed Variable EfficiencyMW MW €/kW €/kW €/MWh Years 0 … 1
Model 1 (Small) 2005 0,4 00,4 00,4 00,4 00,4 00,4 0
9000 7 12 5 0,42 0,982010 7500 7 12 5 0,44 0,982015 3500 7 11 6 0,46 0,982020 1500 6 10 7 0,48 0,982030 800 6 9 8 0,5 0,982050 800 6 8 10 0,5 0,98
Model 2 (Medium 2005 7500 5 7 12 0,52 0,982010 4500 5 7 12 0,54 0,982015 2300 5 7 13 0,56 0,982020 1000 4 7 13 0,58 0,982030 500 4 6 14 0,6 0,982050 500 4 6 15 0,6 0,98
Costs
1,2 01,2 01,2 01,2 01,2 01,2 0
38

Table 12. Input data for gas engines.
CHP Gas Engines
Current Lifetime Power UsabilityPower Heat Elec.Power Investment Fixed Variable EfficiencyMW MW MW €/kW €/kW €/MWh Years 0 … 1
Model 1 (Small) 2005 0,5 0,6 0 1200 7 10 15 0,35 0,982010 0,5 0,6 0 1200 7 10 15 0,35 0,982015 1200 7 10 15 0,35 0,982020 1200 6 10 15 0,35 0,982030 1200 6 10 15 0,35 0,982050 1200 6 10 15 0,35 0,98
Model 2 (Medium) 2005 800 5 8 15 0,42 0,982010 800 5 8 15 0,42 0,982015 800 5 8 15 0,42 0,982020 00 4 8 15 0,42 0,982030 00 4 8 15 0,42 0,982050 00 4 8 15 0,42 0,98
Standard Plant Costs
0,5 0,6 00,5 0,6 00,5 0,6 00,5 0,6 0
5 6 05 6 05 6 05 6 0 85 6 0 85 6 0 8
uelling stations ing stations is presented in Table 13. The investment costs are based on the
nted by HyNet (2004, see chapter 5.6). The loss factors are for the fuelling
FThe input data of fuelllearning curves preselosses taken from the report by Simbeck and Chang (2002).
Table 13. Input data for the fuelling stations.
CurreCosts nt Loss LifeInvestment Variable Capacity Factor Time
€/kW €/MWh MW Years2005 600 0,7 0 10 % 152010 600 0,7 0 10 % 152015 600 0,7 0 10 % 152020 550 0,7 0 9 % 152030 550 0,7 0 9 % 152050 550 0,7 0 8 % 15
missions culates the carbon dioxide (CO2) emissions for hydrogen production with fossil fuels, am reforming process. For the calculations, an emission factor of 0.2018 kt/GWh has
EThe model cali.e. for the stebeen used for natural gas. For steam reforming with CO2 sequestration, the CO2 emissions are reduced according to the reduction percentage given by the user (see Table 7).
39

6.3 Investment supports and taxation in investment supports according to Table 14.
ssumed subsidies for investments in B3, E1 and P2 scenarios, %.
The selected investment costs were assumed to obtaFor the base case calculations, the investment costs of fuel cells were reduced in the E1 and P2 scenarios.
Table 14. A
B3 E1 P2
2005 0 50 50
2010 0 50 50
2015 0 40 40
2020 0 30 30
2030 0 0 0
In the Nordic countries, neither energy nor environment taxes are harmonized. Therefore, the only
as in different scenarios
B3 E1 P2
tax we have used here is the ‘CO2 tax’ for fossils fuels. In Finland, the existing fuel tax for natural gas is 8 €/MWh, which corresponds to about 9 EUR per carbon dioxide tonne. As it is shown in the Table 15, this was also selected for the tax level in the reference year 2005.
Table 15. The assumed environmental taxes (i.e. fuel taxes) for natural g(€/MWh).
2005 8 8 8
2015 0 9 9
2030 0 10 10
6.4 Fuel and electricity prices in different scenarios (Table 16). The base scenario was The fuel prices of natural gas were varied
based on the IEA price forecasts for natural gas (IEA 2002). The fuel price of biomass was assumed to be the same in all the scenarios. However, it should be noted that biomass is a local energy source and the transportation costs of biomass vary greatly in the Nordic countries. The biomass prices are based on the estimated biomass prices for forest residues in Finland and they include transportation costs for 100 km. The biomass prices may be much higher in those Nordic countries, which have long transportation distances from a fuel production site to a gasification plant. In the scenarios E1 and P2, higher biomass demand can be assumed and therefore the increase in biomass prices may be higher than assumed here.
40
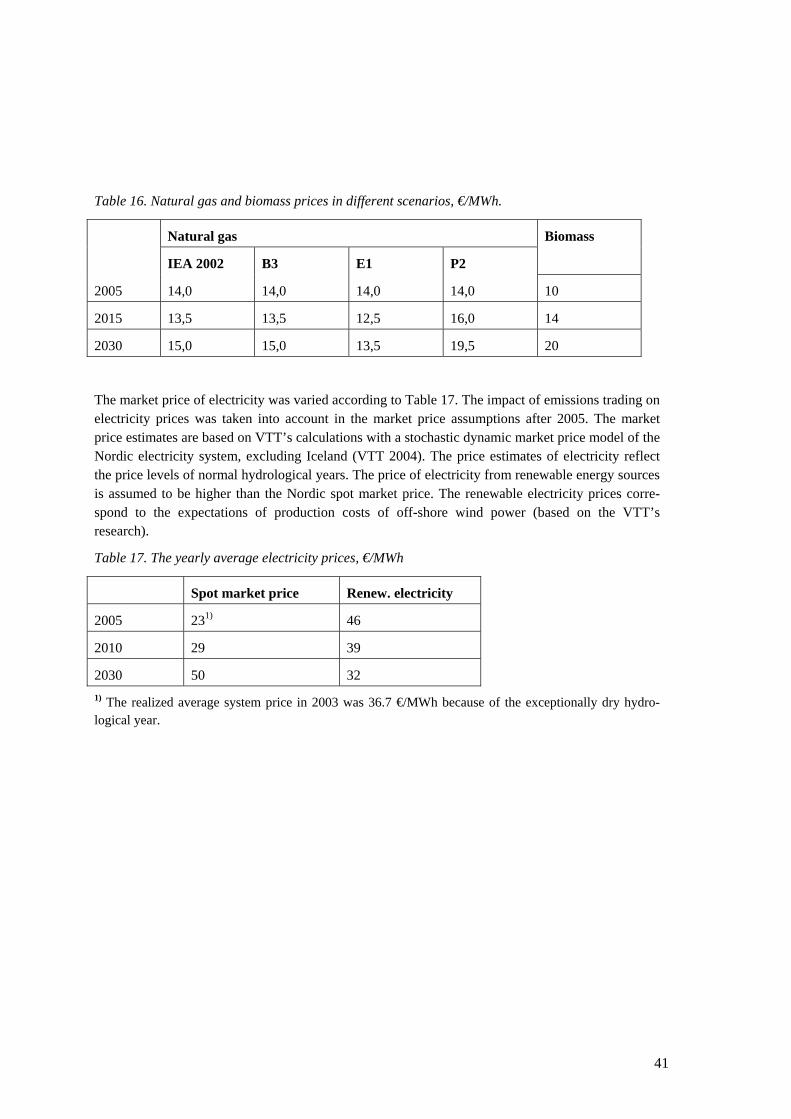
Table 16. Natural gas and biomass prices in different scenarios, €/MWh.
Natural gas
IEA 2002 B3 E1 P2
Biomass
2005 14,0 14,0 14,0 14,0 10
2015 13,5 13,5 12,5 16,0 14
2030 15,0 15,0 13,5 19,5 20
The market price of electricity was varied according to Table 17. The impact of emissions trading on
y average electricity prices, €/MWh
ctricity
electricity prices was taken into account in the market price assumptions after 2005. The market price estimates are based on VTT’s calculations with a stochastic dynamic market price model of the Nordic electricity system, excluding Iceland (VTT 2004). The price estimates of electricity reflect the price levels of normal hydrological years. The price of electricity from renewable energy sources is assumed to be higher than the Nordic spot market price. The renewable electricity prices corre-spond to the expectations of production costs of off-shore wind power (based on the VTT’s research).
Table 17. The yearl
Spot market price Renew. ele
2005 231) 46
2010 29 39
2030 50 32 1) The realized av e system price in 2003 36.7 €/MWh because of the exceptionally dry hydro-erag was logical year.
41

7 Scenario results of the Nordic hydrogen energy
The scenarios B3, E1 and P2 were analyzed using the Nordic hydrogen model. The input data is presented in chapter 6. In addition, the influences of the most uncertain parameters on the scenario results were studied with the sensitivity analysis.
7.1 Cost results for the base case Figure 11 shows the total costs for the tree scenarios and the hydrogen share assumed in these scenarios for the transportation sector. For stationary applications, the hydrogen share is 50% less than presented below. The highest costs are naturally observed with the highest hydrogen share. In Figure 12, the investment costs for hydrogen production, hydrogen infrastructure and energy conversion plants are shown. It can clearly be seen with the model assumptions that the investment cost for the hydrogen infrastructure is the highest cost. On the other hand, if we look at the total costs in Figure 13 and Figure 14, the cost of hydrogen production is also relatively high due to high operating costs. Figure 15 shows the assumed total hydrogen energy demand and total costs for different consumption areas.
0
5000
10000
15000
20000
25000
30000
35000
40000
45000
2005 2010 2015 2020 20300 %
2 %
4 %
6 %
8 %
10 %
12 %
14 %
16 %
18 %
20 %
Cost B3Cost E1Cost P2H2 Share B3H2 Share E1H2 Share P2
Figure 11. Total costs (million €) of milestone periods for transport sector and stationary as well as hydrogen shares of total energy demand in transportation sector for scenarios B3, E1 and P2.
42

0
2000
4000
6000
8000
10000
12000
14000
16000
180002005 2010 2015 2020 2030
B3 E1 P2 B3 E1 P2 B3 E1 P2 B3 E1 P2 B3 E1 P2
HydrogenDistribution
HydrogenProduction
EnergyProduction
Figure 12. Investment costs (in millions €) of milestone periods in energy production, hydrogen production and hydrogen distribution for scenarios B3, E1 and P2.
0
5000
10000
15000
20000
25000
30000
35000
40000
450002005 2010 2015 2020 2030
B3 E1 P2 B3 E1 P2 B3 E1 P2 B3 E1 P2 B3 E1 P2
HydrogenDistribution
HydrogenProduction
EnergyProduction
Figure 13. Total costs (million €) of milestone periods in energy production, hydrogen production and hydrogen distribution for scenarios B3, E1 and P2.
43

0 %
10 %
20 %
30 %
40 %
50 %
60 %
70 %
80 %
90 %
100 %2005 2010 2015 2020 2030
B3 E1 P2 B3 E1 P2 B3 E1 P2 B3 E1 P2 B3 E1 P2
Energy Production Hydrogen Production Hydrogen Distribution
Figure 14. Percentage shares of energy production, hydrogen production and hydrogen distribution of the total costs for scenarios B3, E1 and P2 in milestone periods.
0 %
10 %
20 %
30 %
40 %
50 %
60 %
70 %
80 %
90 %
100 %2005 2010 2015 2020 2030
Dem
and
B3 E1
P2
Dem
and
B3 E1
P2
Dem
and
B3 E1
P2
Dem
and
B3 E1
P2
Dem
and
B3 E1
P2
C DCGC DC
Figure 15. Total hydrogen energy demand and total costs of milestone periods for scenarios B3, E1 and P2 divided as percentages into consumption areas of centralized (C), decentralized with natural gas pipe line (DCGC), and decentralized without natural gas pipeline (DC).
44

7.2 Sensitivity analysis for the scenario costs Figure 16 shows the total costs with all the constraints shown in Table 6 and without the constraints for hydrogen production. It can be seen that the total costs are smaller without constraints. However, the difference is not very remarkable. In Figure 17, the sensitivity of the discount ratio for the total costs is shown. It is clearly confirmed that the selection of the discount ratio has a remarkable effect on the total costs.
Figure 18 shows the total costs of hydrogen production including investment and fuel costs for scenario B3 with four different price variation scenarios: natural gas price increases by 100%, biomass price by 50%, renewable electricity by 20% and CO2 tax increases by 100%. The effect of fuel or renewable electricity price seems to be minor except in 2030, when the hydrogen demand is at the highest level. The effect of the investment subsidies on the total costs is also minor as shown in the Figure 19.
0
5000
10000
15000
20000
25000
30000
35000
40000
45000
2005 2010 2015 2020 2030
B3B3 No Prod. ConstraintsE1E1 No Prod. ConstraintsP2P2 No Prod. Constraints
Figure 16. Total costs (in million €) of milestone periods for scenarios B3, E1 and P2 compared to the scenario cases with no constraints on hydrogen production.
45

0
5000
10000
15000
20000
250002005 2010 2015 2020 2030
B33%
B35%
B37%
B33%
B35%
B37%
B33%
B35%
B37%
B33%
B35%
B37%
B33%
B35%
B37%
HydrogenDistribution
HydrogenProduction
EnergyProduction
Figure 17. Sensitivity of the total costs of scenario B3 with discount rates 3%, 5% (base case) and 7%.
0,0
1000,0
2000,0
3000,0
4000,0
5000,0
6000,0
7000,0
8000,0
9000,0
10000,0
2005 2010 2015 2020 2030
B3NG +100%BM +50%RE +20%CO2 +100%
Figure 18. Total costs of hydrogen production including investment and fuel costs of scenario B3 with four different price variation scenarios: natural gas price increases by 100%, biomass price by 50%, renewable electricity by 20% and CO2 tax increases by 100%.
46

0
2000
4000
6000
8000
10000
120002005 2010 2015 2020 2030
B3
B3 +
50%
B3 +
100% B3
B3 +
50%
B3 +
100% B3
B3 +
50%
B3 +
100% B3
B3 +
50%
B3 +
100% B3
B3 +
50%
B3 +
100%
HydrogenDistribution
HydrogenProduction
EnergyProduction
Figure 19. Effect of investment subsidies on the total costs of the scenario B3. The subsidies in different cases are 50% and 100% of those subsidies used in scenarios E1 and P2.
The sensitivity of assumed investment costs for fuel cells, electrolyzers and hydrogen pipelines in the total costs are shown in Figure 20 for scenario B3. The cost assumptions of hydrogen pipelines appear to have the greatest effect on the total costs. Also, the investment costs of fuel cells seem to influence the total costs. It should be noted that both pipeline and fuel cell investment costs have relatively high uncertainty.
47

0
2000
4000
6000
8000
10000
12000
140002005 2010 2015 2020 2030
HydrogenDistribution
HydrogenProduction
EnergyProduction
1. Fuel cell low2. Fuel cell high3. Electrolyzer low4. Electrolyzer high5. Pipeline low6. Pipeline high
B3 1 2 3 4 5 6 B3 1 2 3 4 5 6 B3 1 2 3 4 5 6 B3 1 2 3 4 5 6 B3 1 2 3 4 5 60
2000
4000
6000
8000
10000
12000
140002005 2010 2015 2020 2030
HydrogenDistribution
HydrogenProduction
EnergyProduction
1. Fuel cell low2. Fuel cell high3. Electrolyzer low4. Electrolyzer high5. Pipeline low6. Pipeline high
B3 1 2 3 4 5 6 B3 1 2 3 4 5 6 B3 1 2 3 4 5 6 B3 1 2 3 4 5 6 B3 1 2 3 4 5 6
Figure 20. Total costs for scenario B3 with different investment costs for fuel cells, electrolyzers and hydrogen pipelines.
In Figure 21, the different loss factors of hydrogen storage have been analysed. As presented in chapter 0, the storage losses are assumed to include all the losses from different storage sites, storage tanks, and losses from the hydrogen transfer. The loss factor is time dependent, which means that more hydrogen is lost when the storage time is increased. It is obvious that the parameter for storage loss has a high uncertainty. The total costs of hydrogen production and hydrogen transfer are also affected by the assumed loss factor. The greater the storage losses are, the more hydrogen must be produced and transferred.
48

0
2000
4000
6000
8000
10000
12000
140002005 2010 2015 2020 2030
B3 1
0%
B3 2
0%
B3 3
0%
B3 1
0%
B3 2
0%
B3 3
0%
B3 1
0%
B3 2
0%
B3 3
0%
B3 1
0%
B3 2
0%
B3 3
0%
B3 1
0%
B3 2
0%
B3 3
0%
HydrogenDistribution
HydrogenProduction
EnergyProduction
Figure 21. The effect of storage losses on the total costs of scenario B3. Energy loss factors of hydrogen storage are 10%, 20% (base case) and 30%.
7.3 Scenario results for different technologies and applications Hydrogen production Figure 22 shows the shares of different hydrogen production technologies for different scenarios. Table 18 shows the investments expressed as total power (MW) of hydrogen with different technologies. For the base scenarios, the most feasible technologies with the selected input parameters seem to be steam reforming and biomass gasification. Without production constraints, electrolysis didn’t appear due assumed high investment and operating costs. In 2015, CO2 sequestration was added to the steam reforming process, which lowered its competitiveness relative to biomass gasification until 2030, when the assumed biomass price is relatively high.
49

0 %
10 %
20 %
30 %
40 %
50 %
60 %
70 %
80 %
90 %
100 %2005 2010 2015 2020 2030
Steam Reforming Electrolysis Biomass Gasification
B3
B3N
OC P2
P2N
OC P2
P2N
OC B3
B3N
OC P2
P2N
OC P2
P2N
OC B3
B3N
OC P2
P2N
OC P2
P2N
OC B3
B3N
OC P2
P2N
OC P2
P2N
OCB3
B3N
OC P2
P2N
OC P2
P2N
OC0 %
10 %
20 %
30 %
40 %
50 %
60 %
70 %
80 %
90 %
100 %2005 2010 2015 2020 2030
Steam Reforming Electrolysis Biomass Gasification
B3
B3N
OC P2
P2N
OC P2
P2N
OC B3
B3N
OC P2
P2N
OC P2
P2N
OC B3
B3N
OC P2
P2N
OC P2
P2N
OC B3
B3N
OC P2
P2N
OC P2
P2N
OCB3
B3N
OC P2
P2N
OC P2
P2N
OC
Figure 22. Shares of steam reforming, electrolysis and biomass gasification of the total hydrogen production (GWh) in scenarios B3, E1 and P2, with and without (NOC) production constraints.
Table 18. Hydrogen production with different technologies for the base scenarios.
B3 SMR SMR+Seq Electrolysis Biomass GasMW MW MW MW
2005 18 0 5 202010 52 0 16 582015 290 97 115 3962020 341 148 208 6932030 829 394 412 1272E1 SMR SMR+Seq Electrolysis Biomass Gas
MW MW MW MW2005 35 0 5 312010 378 0 74 1932015 465 931 199 13452020 384 3260 457 16702030 1947 7184 1130 4876P2 SMR SMR+Seq Electrolysis Biomass Gas
MW MW MW MW2005 35 0 5 312010 792 0 154 4182015 1753 316 287 20612020 521 3086 577 30542030 2227 9281 1288 4442
50

Energy production Figure 23 shows the shares of CHP fuel cells, fuel cells and gas engines in the centralized production of electricty. Table 19 shows the investments expressed as total power (MW) of energy with different technologies. The share of CHP fuel cells and fuel cells appears to increase through the whole calculation period in all the scenarios. The assumed decreases in investment costs and technological developments of fuel cells make them more competitive than conventional gas engine technology with lower energy efficiencies and higher operating costs. The calculations with pessimistic development of fuel cells and optimistic development of gas engines changed the situation, but not very drastically. In E1 and P2 scenarios, fuel cell investments are supported and therefore the share of the fuel cells is higher than in B3. In 2005 the demand of hydrogen energy is so small that it would be more economical to build small fuel cell units as opposed to large gas engine units. The low share of fuel cells for electricity production only indicates that the assumed investment costs for fuel cells might be too high relative to the CHP fuel cells. The figure for heat production looks like the same, i.e. the share of fuel cells is higher than the share of gas engines.
0 %
10 %
20 %
30 %
40 %
50 %
60 %
70 %
80 %
90 %
100 %2005 2010 2015 2020 2030
B3
E1
P2
P2
NO
C
P2
NO
C&
S B3
E1
P2
P2
NO
C
P2
NO
C&
S B3
E1
P2
P2
NO
C
P2
NO
C&
S B3
E1
P2
P2
NO
C
P2
NO
C&
S B3
E1
P2
P2
NO
C
P2
NO
C&
S
CHPFC E CHPFC H CHPGE E CHPGE H FC E
Figure 23. Shares (% MWh) of centralized electricity (E) and heat production (H) with CHP fuel cells, CHP gas engines and fuel cells for the base scenarios B3, E1 and P2 as well as for P2 without a capacity constraint for fuel cells (NOC) and without both capacity constraint and investment subsidies (NOC&S) for fuel cells.
The market share of CHP fuel cells seems to dominate in our scenario calculations. However, it should be noted that no technological development or decreases in investment costs were assumed for gas engines. In addition, the investments of fuel cells were subsided in the scenarios E1 and P2. In Figure 23, the shares of CHP fuel cells, fuel cells and CHP gas engines are shown for the base scenarios as well as for scenario
51

P2 without constraint for gas engines, and P2 without constraint for gas engines and without investment subsidies. In 2015, subsidies for fuel cells are still needed but in 2020 fuel cells seem to be more competitive than gas engines without any subsidies.
Table 19. Energy production with different technologies for the base scenarios.
B3 CHP FC CHP GE FCMW MW MW
2005 11 4 32010 39 12 112015 247 86 882020 558 180 1552030 2098 0 170E1 CHP FC CHP GE FC
MW MW MW2005 11 4 32010 103 37 302015 730 62 642020 1556 235 1752030 5133 173 500P2 CHP FC CHP GE FC
MW MW MW2005 11 4 32010 210 78 622015 1150 83 942020 2082 306 2432030 6131 188 599
The number of fuelling stations and cars Figure 24 shows the number of fuelling stations and hydrogen passenger vehicles for different scenarios. It was assumed that the total fuel sales amount to 144 tH2/year for one fuelling station (see chapter 5.6) and that one fuelling station can supply 890 passenger vehicles. The scenarios for hydrogen supply per station are based on the assumption, that 50% of the vehicles are ICE-powered and 50% are equipped with a fuel cell drive train (HyNet 2004). It should be noted that the energy consumption of busses and tracks could be about five times higher, which means that the number of vehicles supplied by one station might be assumed to be too high.
The number of passenger cars totalled 8.2 million in 2002 in the Nordic countries (Eurostat 2004). The corresponding number of buses and coaches was 75 000 and goods vehicles 1.4 million respectively. The number of registrations in the Nordic countries was about 600 000 in 2003. According to EU scenarios (EU 2004), the annual percentage change in passenger and freight transport activity could be approximately 1-2%. This means that in 2030 the number of passenger cars could exceed 10-13 millions and the total number of road vehicles 12-15 millions. If we compare these numbers to the Figure 24, it can be noticed that the values in the figure are relatively high, especially in 2030. In 2020, about 0.5-2 million hydrogen vehicles and in 2030 about 1-4 million hydrogen vehicles would be needed to fulfil the “big visions” for hydrogen energy in the Nordic transport sector. This would mean that 8-30% of passenger cars could be hydrogen fuelled in 2030, if the energy demand in transportation sector follows the assumed scenario.
52

0
500
1000
1500
2000
2500
3000
3500
4000
4500
2005 2010 2015 2020 2030
Num
ber o
f fue
lling
sta
tions
0
500000
1000000
1500000
2000000
2500000
3000000
3500000
4000000
Num
ber o
f vec
hicl
es B3E1P2B3E1P2
Figure 24. The number fuelling stations and hydrogen fuelled vehicles for different scenarios.
53

8 Conclusions The hydrogen scenarios developed during the Nordic Hydrogen Foresight project were analysed using a hydrogen energy systems model, which was developed during the project. The aim of the systems analysis was to analyse the technical and economical potential of hydrogen society in the Nordic countries in quantitative terms as well as the competitiveness of the selected hydrogen based systems.
Visions and scenarios of the future energy systems in the Nordic area were defined in the workshops of the project. As a result of these workshops three scenarios were selected to outline the future of Nordic energy. The scenarios included different energy policies; scenarios for fossil fuel prices; and hydrogen energy demands, which varied from 6% to 18% of the total energy demand in 2030 for transport sector, and from 3% to 9% in heat and power production. In the roadmap workshop, the most important hydrogen based systems were selected, which were also included in the model. These include steam reforming of natural gas, electrolysis with renewable electricity, and biomass gasification for hydrogen production. For stationary applications, fuel cells and gas engines were selected for power and heat production. The infrastructure includes hydrogen pipelines and mobile transportation as well as fuelling stations. The natural gas pipelines are expected to exist, so no investments for natural gas (or hytane) infrastructures are incorporated in the model. In the model calculations, the demand was divided into power demand, heat demand for the residential sector and demand for transportation fuel. Also, all of these sectors included centralized and decentralized demands.
The most challenging task in the modelling work was to develop the technical and economical input data for the selected hydrogen systems in the development phase. Despite the huge amount of information found in the literature, many of the inputs are surrounded by uncertainty, especially in the longer term. Also, the information found in literature seldom includes the basis for the calculations, like discount ratio, assumed fuel prices, etc. which makes the data judgement very difficult. Therefore the quantitative results may be considered more or less informative in defining the influence of different policy measures, scenarios of relative fuel prices, and the technological and economical development of different technologies.
The scenario calculations indicate that the highest uncertainty is related to the energy losses of compression, hydrogen storage, and distribution, i.e. the losses of the whole hydrogen energy system from the production site to the final use. The selection of discount ratio has a remarkable effect on the total costs as well. The discount ratio used in the base case calculations was 5%. The decrease in discount ratio to 3% increased the total costs by about 35% in 2020 and about 60% in 2030. Compared to the investments to the hydrogen production and stationary applications for energy production, the investments in the hydrogen infrastructure seem to be the highest. However, the investment costs of hydrogen infrastructure have high uncertainty also.
In our scenario calculations, biomass gasification and steam reforming seem to be the most competitive technologies for hydrogen production. The competitiveness of biomass gasification is greatly affected by the biomass fuel price, which is a local energy source. Electrolysis seems to be most competitive in decentralized systems, if the electricity price is low enough. For stationary applications, CHP fuel cells seem to be the most competitive in the long term, if the technological development and the decrease in investment costs follow the assumed scenario.
54

With the scenario assumptions, the necessary capacity (MW H2 out from production units) of steam reforming, biomass gasification and electrolysis units in 2030 were 1200-12 000 MW, 1300-4000 MW, and 400-1300 MW, respectively. The approximated Nordic market sizes in 2030 for the base scenarios varied from 1000 M€ to 3000 M€ for hydrogen production, from 1000 to 4000 M€ for stationary applications and from 4000 M€ to 12 000 M€ for hydrogen transmission. In 2020, about 0.5-2 million hydrogen vehicles and in 2030 about 1-4 million hydrogen vehicles would be needed to fulfil the “big visions” for hydrogen energy in the Nordic transport sector. The number fuelling stations needed in 2020 was estimated to 500-2000 and in 2030 to 1000-4000 respectively.
The analysis of the competitiveness of hydrogen systems in the Nordic environment against other sustainable energy applications would need more detailed and comprehensive systems analysis. This could be done with larger bottom-up systems models, like MARKAL or TIMES. However, these models need detailed regional information of the existing energy systems, which makes the input database very large. Also, the same kind of technical and economical data as used here for hydrogen-based technologies should be defined for the other competing future energy systems. Detailed technology roadmaps and systems analysis is a challenging task for a technological area that is undergoing rapid development, especially when there is an additional regulatory uncertainty caused by the unpredictability of future political decisions.
55

References
AEA Technology 2003. Platinum and hydrogen for fuel cell vehicles. http://www.dft.gov.uk/stellent/groups/dft_roads/documents/page/dft_roads_024056-01.hcsp
Arthur, W.B. 2000. Increasing Returns and Path Dependence in the Economy. The University of Michigan Press, Ann Arbor.
Dannemand Andersen, P., Greve, O. & Nielsen, S.K. 2004. Nordic H2 Energy Roadmaps. Working paper. www.h2foresight.info
Bossel, U., Eliasson, B. & Taylor, G. 2003. The Future of the Hydrogen Economy: Bright or Bleak ? Final Report. 15 April 2003. www.efcf.com/reports
BP 2003. BP Statistical Review of World Energy 2003. June 2003. www.bp.com
Cropper, M. 2003. Fuel Cell Market Survey: Large Stationary Applications. Fuel Cell Today, 17 September 2003. www.fuelcelltoday.com
Danish Energy Authority 2003. Energy Statistics 2002. www.ens.dk
Energy Nexus Group 2004. Performance and Cost Trajectories of Clean Distributed Generation Technologies. http://www.eea-inc.com/dgchp_reports/Cost_of_Clean_DG_Technologies.pdf
Eurelectric 2002. EURPROG Network of Experts. 2002. Statistics and prospects for the European Electricity sector (1980 – 1990, 2000 – 2020). 30th edition, Eurelectric, July 2002. Report n:o 2002-030-0354.
Foxon, T. J. 2002. Technological and institutional ‘lock-in’ as a barrier to sustainable innovation. ICCEPT Working Paper. http://www.iccept.ic.ac.uk/public.html
EU 2004. European energy and transport – Trends to 2030.
http://europa.eu.int/comm/energy/index_en.html
Gether, K. 2004. Transition to large scale use of hydrogen and sustainable energy services, Choices of technology and infrastructure under path dependence, feedback and nonlinearity. PhD Thesis, Norwegian University of Science and Technology, Trondheim, Norway.
GRI & NREL 2004. Gas Research Institute & National Renewable Energy Laboratory. Gas-Fired Distributed Energy Resource Technology Characterizations. US Department of Energy, Energy Efficiency and Renewable Energy. http://www.osti.gov/bridge
HyNet 2004. On the Way Towards a European Hydrogen Energy Roadmap. Data Source Book. . http://www.hynet.info/whyse/index.html
IEA 2002. International Energy Agency. World Energy Outlook 2002. OECD/IEA, Paris, France. ISBN 92-64-19835-0.
IEA 2003. International Energy Agency. World Energy Investment Outlook – 2003 Insights. ISBN 92-64-01906-5
IT Power 2004. Electrolyser. Different types.
http://www.itpower.co.uk/investire/pdfs/electrolyser.pdf
56

Ivy, J. 2004. Summary of Electrolytic Hydrogen production. Milestone Completion Report. National Renewable Energy Laboratory, U.S. Department of Energy. NREL/MP-560-367434.
Iwasaki, W. 2003. A consideration of the economic efficiency of hydrogen production from biomass. International Journal of Hydrogen Energy. Vol. 28, pp. 939-944.
Koljonen, T. & Pursiheimo, E. 2004. Nordic Energy Basics. Report of the Working package 4. January 2004. www.h2foresight.info
Myers, D.B., Ariff, G.D., James, B.D. & Kuhn, R.C. 2003. Hydrogen from Renewable Energy Sources: Pathway to 10 Quads For Transportation Uses in 2030 to 2050. Task 3 Final Report. Directed Technologies Inc. Prepared for U.S. Department of Energy.
Nordel 2004. www.nordel.org
Ohlström, M., Mäkinen, T., Laurikko, J., & Pipatti, R. 2000. New concepts for biofuels in transportation: Biomass-based methanol production and reduced emissions in advanced vehicles. Espoo, Technical Research Centre of Finland. VTT Research Notes XXXX.
Oland, C.B. 2004. Guide to Combined heat and power Systems for Boiler Owners and Operators. Oak Ridge National Laboratory. ORNL/TM-2004/144.
Orkustofun 2003. Energy use and energy resources. www.os.is
Padró,C.E.G. & Putche, V. 1999. Survey of the Economics of Hydrogen Technologies. National Renewable Energy Laboratory, U.S. Department of Energy Laboratory. NREL/TP-570-27079.
Pursiheimo, Esa 2004. Representation of the EFOM based Hydrogen Energy System Model. Report of the Working Package 4. November 2004. www.h2foresight.info
Rydén, B. (ed.) 2003. Nordleden, Slutrapport för etapp 2. Göteborg, Författarna. ISBN 91-631-4327-5.
Simbeck, D. R. & Chang, E. 2002. Hydrogen Supply: Cost Estimate for Hydrogen pathways – Scoping Analysis. National Renewable Energy Laboratory, U.S. Department of Energy. NREL/SR-540-32525.
Spath, P.L. & Mann, M.K. 2004. Biomass Power and Conventional Fossil Systems with and without CO2 Sequestration – Comparing the Energy Balance, Greenhouse Gas Emissions and Economics. National Renewable Energy Laboratory, U.S. Department of Energy. NREL/TP-510-32575.
Statistics Finland 2003. Energy Statistics 2003. CD-ROM.
Statistics Norway 2003. Statistical Yearbook of Norway 2003. www.ssb.no
Sterman, J. D. 2000. Business Dynamics: Systems Thinking and Modeling for a Complex World. Irwin/McGraw-Hill, New York.
Swedish Energy Agency (2003) The Electricity market 2003. www.stem.se
Swedish Energy Authority 2003. Energy in Sweden – Facts and Figures 2003. www.stem.se
US DOE 2002. United States Department of Energy. A National Vision of America’s Transition to a Hydrogen Economy – To 2030 and Beyond. Based on the results of the National Hydrogen Vision Meeting Washington, DC, November 15-16, 2001.
VTT 2004. Koljonen, T. & Savolainen, I. The impact of the EU emissions trading directive on energy and steel industries in Finland. In: E.S.Rubin, D.W.Keith and
57

C.F.Gilboy (Eds.), Proceedings of 7th International Conference on Greenhouse Gas Control Technologies. Volume 1: Peer-Reviewed Papers and Plenary Presentations, IEA Greenhouse Gas Programme, Cheltenham, UK, 2004. www.ghgt7.ca
References for scenario calculations
Reformer:
Hydrogen Supply: Cost Estimates for Hydrogen Pathways – Scoping Analysis, National Renewable Energy Laboratory, USA, 2002
Hydrogen Technical Analysis on Matters Being Considered by the International Energy Agency - Transportation Infrastructure, Proceedings of the 2002 U.S. DOE Hydrogen Program Review
The Feasibility, Costs and Markets for Hydrogen Production, British Energy, UK, 2002
Hydrogen Refueling System Based on Autothermal Cyclic Reforming, Proceedings of the 2002 U.S. DOE Hydrogen Program Review
Pipeline:
Hydrogen Technical Analysis on Matters Being Considered by the International Energy Agency - Transportation Infrastructure, Proceedings of the 2002 U.S. DOE Hydrogen Program Review
Hydrogen from Renewable Energy Sources: Pathway to 10 Quads For Transportation Uses in 2030 to 2050, US Department of Energy, USA, 2003
Hydrogen Supply: Cost Estimates for Hydrogen Pathways – Scoping Analysis, National Renewable Energy Laboratory, USA, 2002
CHP Fuel Cell:
Technology Characterization: Fuel Cells, Environmental Protection Agency, USA, 2002
Fueling Station:
Hydrogen Supply: Cost Estimates for Hydrogen Pathways – Scoping Analysis, National Renewable Energy Laboratory, USA, 2002
Electrolyser:
The Feasibility, Costs and Markets for Hydrogen Production, British Energy, UK, 2002
Hydrogen Supply: Cost Estimates for Hydrogen Pathways – Scoping Analysis, National Renewable Energy Laboratory, USA, 2002
Modeling the Feasibility of Using Fuel Cells and Hydrogen Internal Combustion Engines in Remote Renewable Energy Systems, , National Renewable Energy Laboratory, USA, 2003
Mobile transport:
Hydrogen Supply: Cost Estimates for Hydrogen Pathways – Scoping Analysis, National Renewable Energy Laboratory, USA, 2002.
58

59

Nordic Hydrogen Energy Foresight
The Nordic Hydrogen Energy Foresight is co-financed by the Nordic Energy Research and the Nordic Innovation Centre, which operate under the auspices of the
Nordic Council of Ministers. The Nordic Energy Research and Nordic Innovation Centre initiate and finance research and development projects and activities that
create synergy between the actors in the Nordic research and innovation system. The project aims to contribute to the competitiveness of the Nordic business sector and to
facilitate sustainable development through the creation of a Nordic knowledge market.
Nordic Hydrogen Energy Foresight is a strategic project, involving 16 organisations
from the five Nordic countries, focusing on the prospects for moving towards a hydrogen economy within the next 20-30 years. The overall intention is to find long-
term and promising ways for Nordic stakeholders of exploiting hydrogen technologies in the drive to meet the 3E’s: energy security, environmental protection
and economic growth.
Project partners Denmark: Risø, Energi E2, DGC, IRD Fuel Cells, IDA
Finland: VTT, Wärtsilä, ABB, Fortum Iceland: University of Iceland
Norway: NTNU, Norsk Hydro Sweden: FOI, AGA, Vattenfall, H2 Forum
www.h2foresight.info