Sysmex CS-5100 System
66
Sysmex CS-5100 System Quick Reference Guide Microsoft® Windows 10 Version 01-22
Transcript of Sysmex CS-5100 System

Sysmex CS-5100 SystemQuick Reference GuideMicrosoft® Windows 10 Version 01-22
2
Table of ContentsLogging onto the system ...........................................3
Hardware overview ...................................................4
Software overview ....................................................7
Daily maintenance ..................................................11
Loading reagents ....................................................13
Quality control ........................................................18
Sample processing ..................................................24
Factor assay MDA ....................................................27
Joblist information ..................................................29
Joblist printing/export .............................................33
Preanalytical sample integrity ..................................35
Enter reagent info ...................................................37
Calibration ..............................................................39
Enter ISI and Normal ...............................................42
Shutdown/Startup ...................................................43
Backup ....................................................................44
Weekly maintenance ...............................................46
Monthly maintenance .............................................47
As-needed maintenance ..........................................48
Error help ................................................................54
Troubleshooting results ...........................................55SMN: 11554035 | T05011.001 | Effective date: 05/28/21 © Siemens Healthcare Diagnostics Inc., 2021

3
Logging onto the system
Logging onto the system
1. Press Menu on toolbar.
2. Press Logoff icon.
3. Press OK to logoff system.
4. Select icon name.
5. Enter password.
6. Press OK.
4
Hardware overview
Hardware overview
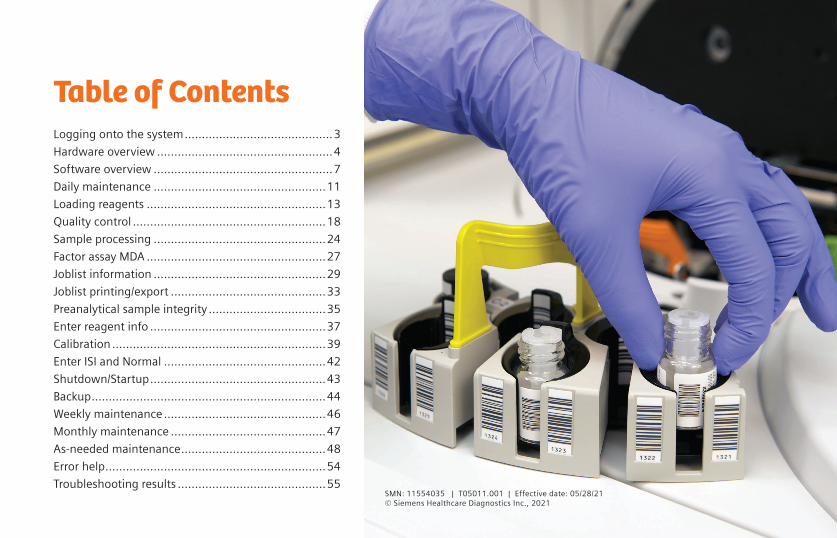
External hardware
1. Light shield lid LED flashing — Do not open!
2. Sampler Holds 10 racks
3. Cuvette Hopper
4. Computer Touch screen
5. 2D barcode reader
6. Computer (IPU) and keyboard

5
Hardware overview
Lower components
1. Left door – Pneumatic Unit – Pressure adjust 0.22MPa
2. Right door – Cuvette Trash – Trap chamber – Pressure adjust 0.10MPa – Vacuum adjust
3. IPU Cart- holds rinse, waste, detergent

6
Hardware overview
Components under light shield lid
1. Sample Probe A Cap piercing primary sample
2. Reagent table Stores reagents, calibrators, QC and cleaners Temperature: 10 ° C
3. Sample Probe B
4. Reagent Arm A Intermediate reagent
5. Incubator Warms sample cuvette to 37° C
6. Reagent table cover LED Green – open Flashing – do not open
7
Software overview
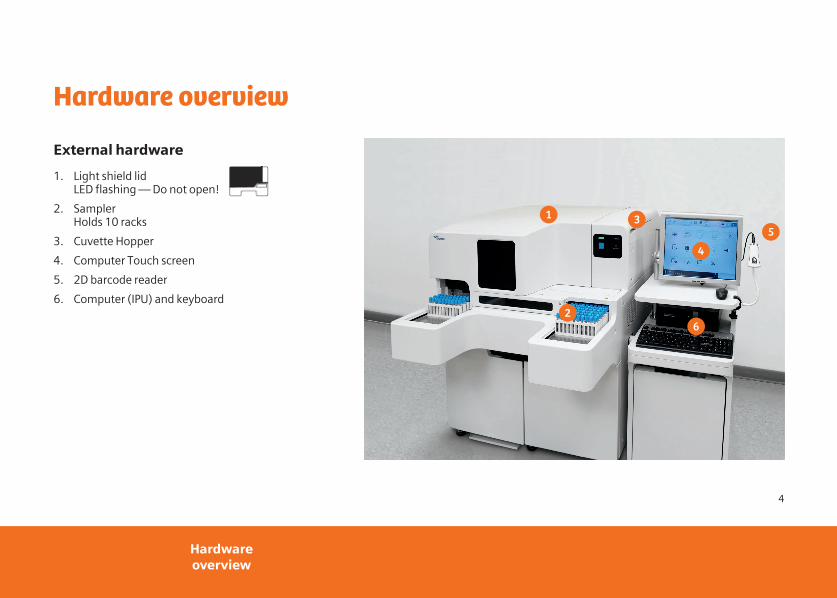
Software overview
1. Toolbar Contains shortcut icons for main functions
2. View Displays the operational functions of the instrument
3. Status bar Displays the status of the IPU and instrument

8
Software overview1. Reagent
Reagent, control, calibrator information Displays usable volume, number of tests, elapsed time, lot number and expiration date
2. Calib. Curve Displays calibration curves for each assay and Normal/ISI values
3. QC Chart QC Levey-Jennings
4. Order Order samples, QC, Calibration
5. Joblist Displays results, orders and status of samples
6. Status Displays instrument consumables and temperatures
7. Maint. Documents maintenance items
8. Shutdown Power down main unit
9. Start
10. Operation Log Records instrument activities with user name

9
Status bar
Status of instrument
Green: Ready
Orange: Analyzing
Red: Error
Grey: Instrument not connected
Error help
Displays error messages and corrective action
Status of host computer and LAS
Green: Connected
Red: Communication error
Icon not displayed: Disconnected in the System Settings

10
Status bar indicators
Temperature
Black: All temperatures are in normal range.
Red: Some temperatures are outside normal range.
Grey: The main unit is not connected.
Reagent Cuvette Rinse
Black: There is a sufficient amount.
Yellow: Low level
Red: Out. Needs replacement.
Grey: The main unit is not connected. Cannot detect level.
11
Daily maintenance
Daily maintenance
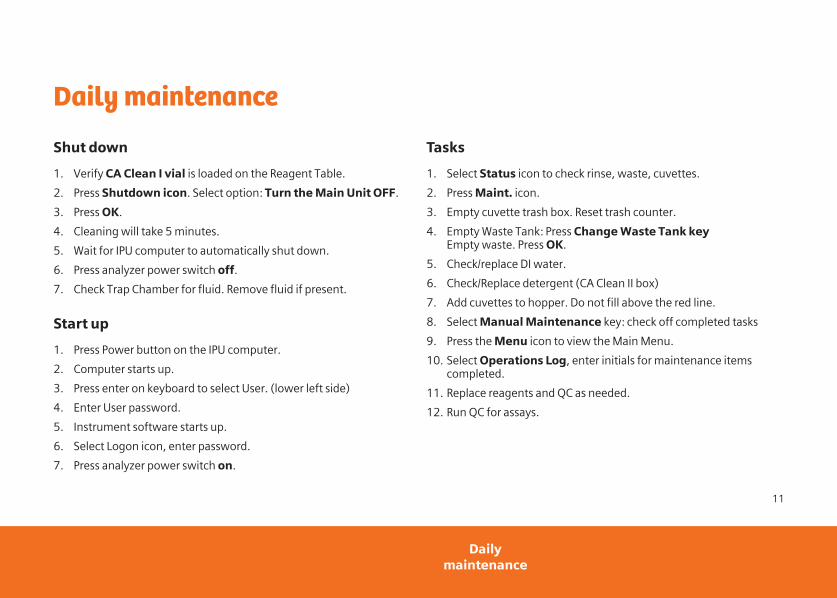
Shut down
1. Verify CA Clean I vial is loaded on the Reagent Table.
2. Press Shutdown icon. Select option: Turn the Main Unit OFF.
3. Press OK.
4. Cleaning will take 5 minutes.
5. Wait for IPU computer to automatically shut down.
6. Press analyzer power switch off.
7. Check Trap Chamber for fluid. Remove fluid if present.
Start up
1. Press Power button on the IPU computer.
2. Computer starts up.
3. Press enter on keyboard to select User. (lower left side)
4. Enter User password.
5. Instrument software starts up.
6. Select Logon icon, enter password.
7. Press analyzer power switch on.
Tasks
1. Select Status icon to check rinse, waste, cuvettes.
2. Press Maint. icon.
3. Empty cuvette trash box. Reset trash counter.
4. Empty Waste Tank: Press Change Waste Tank key Empty waste. Press OK.
5. Check/replace DI water.
6. Check/Replace detergent (CA Clean II box)
7. Add cuvettes to hopper. Do not fill above the red line.
8. Select Manual Maintenance key: check off completed tasks
9. Press the Menu icon to view the Main Menu.
10. Select Operations Log, enter initials for maintenance items completed.
11. Replace reagents and QC as needed.
12. Run QC for assays.
12
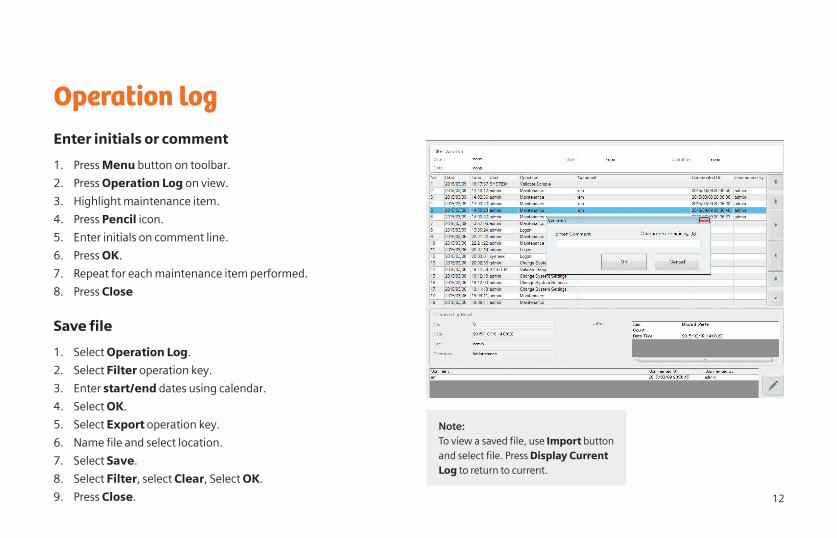
Operation logEnter initials or comment
1. Press Menu button on toolbar.
2. Press Operation Log on view.
3. Highlight maintenance item.
4. Press Pencil icon.
5. Enter initials on comment line.
6. Press OK.
7. Repeat for each maintenance item performed.
8. Press Close
Save file
1. Select Operation Log.
2. Select Filter operation key.
3. Enter start/end dates using calendar.
4. Select OK.
5. Select Export operation key.
6. Name file and select location.
7. Select Save.
8. Select Filter, select Clear, Select OK.
9. Press Close.
Note:To view a saved file, use Import button and select file. Press Display Current Log to return to current.
13
Loading reagents
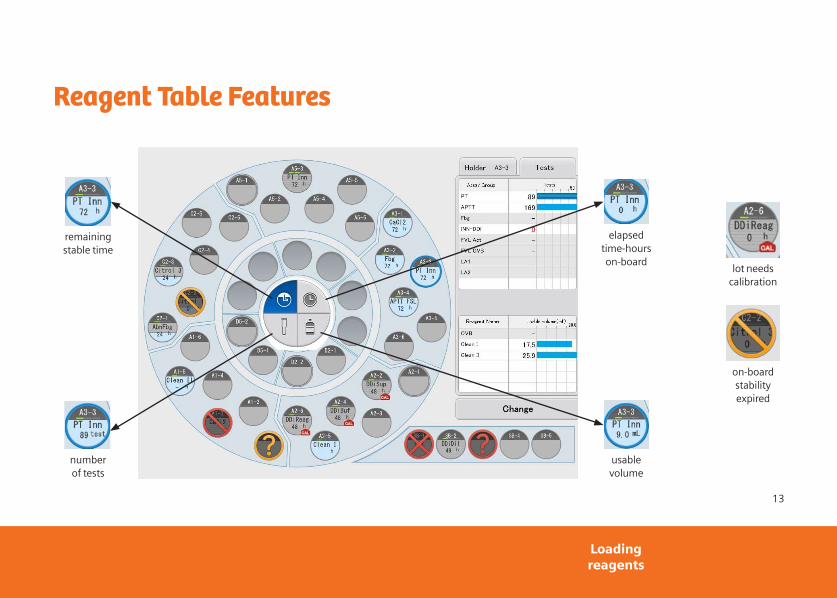
Reagent Table Features
elapsed time-hours on-board
lot needs calibration
on-board stability expired
remaining stable time
number of tests
usable volume
14
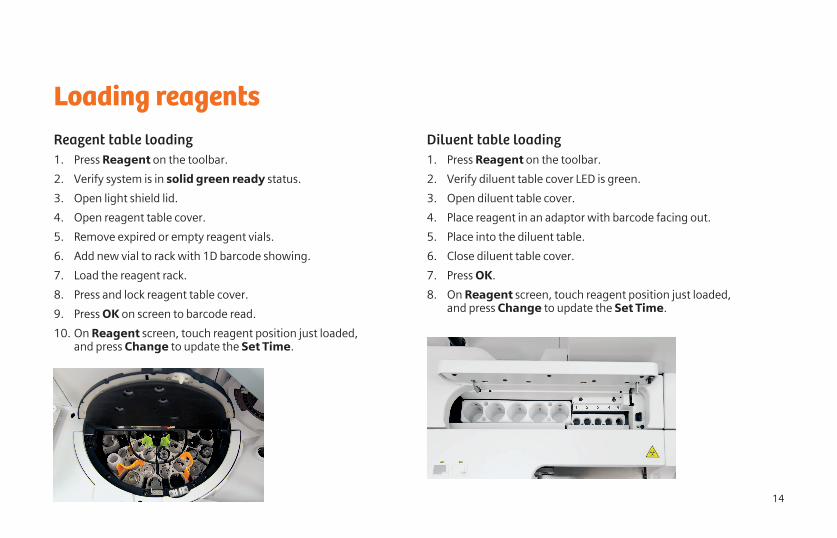
Loading reagentsReagent table loading1. Press Reagent on the toolbar.
2. Verify system is in solid green ready status.
3. Open light shield lid.
4. Open reagent table cover.
5. Remove expired or empty reagent vials.
6. Add new vial to rack with 1D barcode showing.
7. Load the reagent rack.
8. Press and lock reagent table cover.
9. Press OK on screen to barcode read.
10. On Reagent screen, touch reagent position just loaded, and press Change to update the Set Time.
Diluent table loading1. Press Reagent on the toolbar.
2. Verify diluent table cover LED is green.
3. Open diluent table cover.
4. Place reagent in an adaptor with barcode facing out.
5. Place into the diluent table.
6. Close diluent table cover.
7. Press OK.
8. On Reagent screen, touch reagent position just loaded, and press Change to update the Set Time.

15
Reagent messagesMessage Cause Corrective action
This symbol occurs if diluent is placed on the reagent table or if a mixed and cooled reagent is mistakenly placed in a wrong position in rack.
This status also occurs if the reagent barcode ID is not listed in the Reagent Master. Contact Siemens Healthineers Technical support.
Remove reagent and load into the correct location or enter the barcode ID into the Reagent Master screen.
This symbol occurs if the reagent lot has expired. Replace with new lot of reagent.
This symbol occurs if a barcode read error occurs or when loading a cup.
Readjust reagent vial in the reagent table or manually edit reagent information.
This symbol occurs when a new reagent lot is added.Remove and replace with current lot of reagent.
This state occurs if the reagent stability has expired. Replace with a new vial of reagent.
16
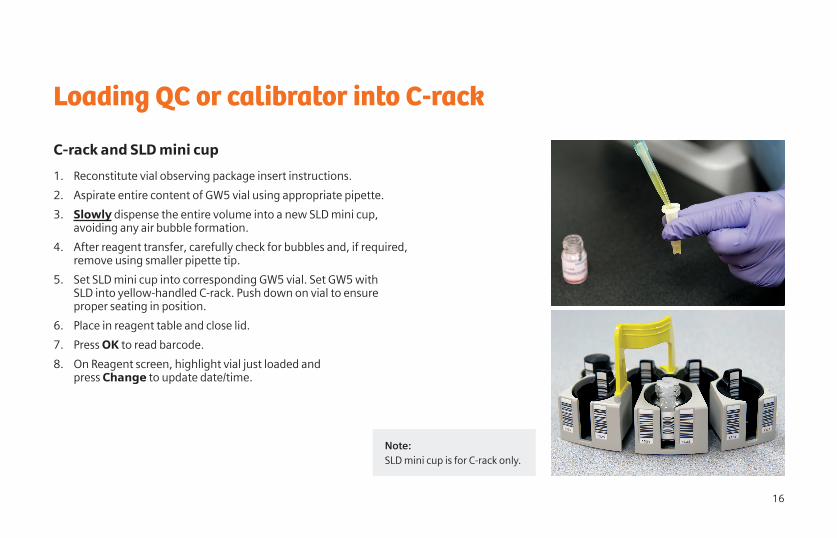
Loading QC or calibrator into C-rack
C-rack and SLD mini cup
1. Reconstitute vial observing package insert instructions.
2. Aspirate entire content of GW5 vial using appropriate pipette.
3. Slowly dispense the entire volume into a new SLD mini cup, avoiding any air bubble formation.
4. After reagent transfer, carefully check for bubbles and, if required, remove using smaller pipette tip.
5. Set SLD mini cup into corresponding GW5 vial. Set GW5 with SLD into yellow-handled C-rack. Push down on vial to ensure proper seating in position.
6. Place in reagent table and close lid.
7. Press OK to read barcode.
8. On Reagent screen, highlight vial just loaded and press Change to update date/time.
Note:SLD mini cup is for C-rack only.

17
Vial types
Letter NameDead volume
(reagent table)Dead volume
(STAT/Buffer table)
A. GW50/CA Clean 7.0ml 7.0ml
B. GW15 0.4ml 2.0ml
C. GW5 0.3ml 1.2ml
D. SLD mini cup in GW 5 0.1ml N/A
E. 4 ml cup 0.2ml 0.2ml
A B C D
E

18
Quality control
Processing from the reagent table: QC files
1. Load QC onto C-rack. Refer to the Loading Reagents tab to load QC material in a C-rack using a SLD mini cup.
2. Press Order.
3. Press Switch Order.
4. Press Holder QC Order.
5. Press Order Entry.
6. Select QC01-QC20.
7. Select QC file from the list on right.
8. Select the appropriate assay(s).
9. Press the down arrow to order the next control.
10. Select QC01–QC20 radio button to continue ordering controls.
11. Press OK.
12. Press Start.

19
QC Priority
It is possible to Quality control 2 or more vials of reagent by selecting QC Priority. This allows you to order QC on specific vials of reagent.
1. Load reagent vials onto the Reagent Table.
2. Highlight reagent position on Reagent screen.
3. Press Edit Reagent Info operational key.
4. Add checkmark to QC priority checkbox. Press OK. This will mark the reagent position with “QC”.
5. Order QC manually for the specific assay. QC will be performed on the reagent vial with QC priority.
6. Repeat for more vials of reagent as needed.
Note:QC Priority is not available for Auto QC analysis.
20
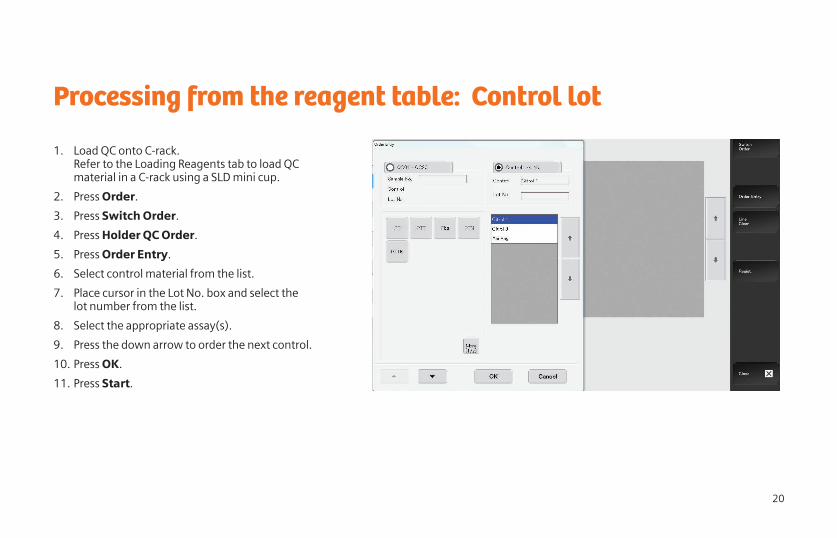
Processing from the reagent table: Control lot
1. Load QC onto C-rack. Refer to the Loading Reagents tab to load QC material in a C-rack using a SLD mini cup.
2. Press Order.
3. Press Switch Order.
4. Press Holder QC Order.
5. Press Order Entry.
6. Select control material from the list.
7. Place cursor in the Lot No. box and select the lot number from the list.
8. Select the appropriate assay(s).
9. Press the down arrow to order the next control.
10. Press OK.
11. Press Start.
21
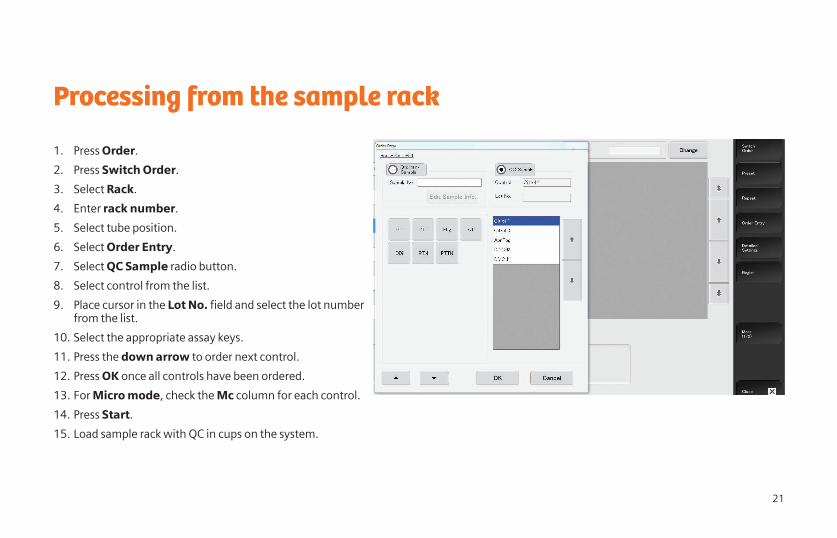
Processing from the sample rack
1. Press Order.
2. Press Switch Order.
3. Select Rack.
4. Enter rack number.
5. Select tube position.
6. Select Order Entry.
7. Select QC Sample radio button.
8. Select control from the list.
9. Place cursor in the Lot No. field and select the lot number from the list.
10. Select the appropriate assay keys.
11. Press the down arrow to order next control.
12. Press OK once all controls have been ordered.
13. For Micro mode, check the Mc column for each control.
14. Press Start.
15. Load sample rack with QC in cups on the system.
22
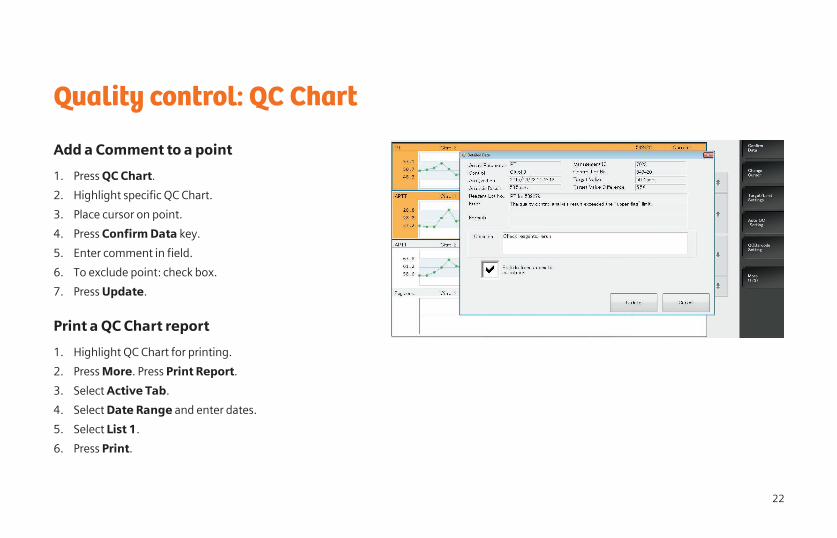
Quality control: QC Chart
Add a Comment to a point
1. Press QC Chart.
2. Highlight specific QC Chart.
3. Place cursor on point.
4. Press Confirm Data key.
5. Enter comment in field.
6. To exclude point: check box.
7. Press Update.
Print a QC Chart report
1. Highlight QC Chart for printing.
2. Press More. Press Print Report.
3. Select Active Tab.
4. Select Date Range and enter dates.
5. Select List 1.
6. Press Print.

23
Quality control: QC Chart
Export QC data to a file
1. Press QC Chart.
2. Highlight specific QC Chart.
3. Press More two times.
4. Press Export.
5. Select a location.
6. Name file: date.Assay.control.
7. Press Save.
Note:These files should be stored on a device separate from the instrument.

24
Sample processing
Sample processing
LIS order processing
1. Place rack with barcoded sample tubes on the sampler.
2. Check host connection status. HC status icon must be green or orange.
3. Press Start.
4. After barcode reading, confirm sample order status and progress on the Joblist screen.

25
Sample processing
Manual order processing
1. Press Order.
2. Press Switch Order.
3. Select Rack.
4. Enter rack number.
5. Select tube position.
6. Press Order Entry.
7. Place cursor in Sample No. and input sample ID if sample does not have a barcode.
8. Select assays to be analyzed.
9. Press the down arrow to order the next sample.
10. Press OK.
11. Press Start.
12. Place sample rack with tubes/cups on the sampler.
13. Confirm sample order status on the Joblist.
26
Sample processing
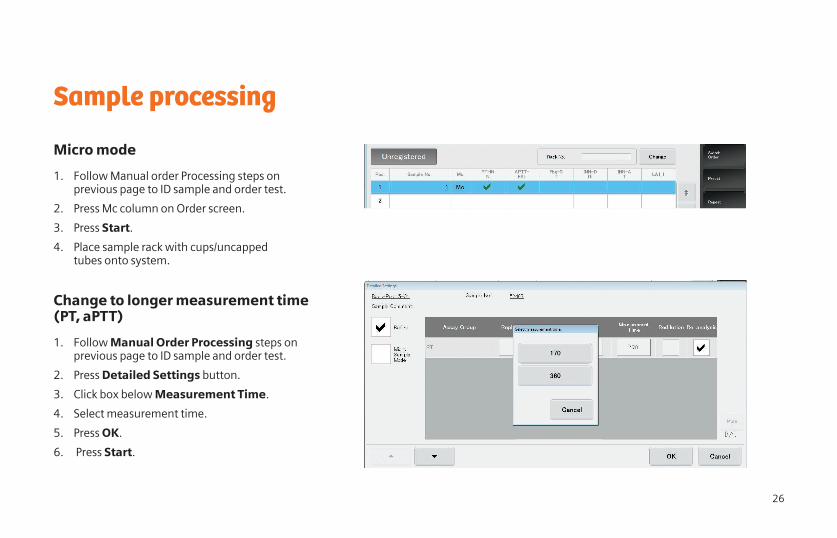
Micro mode
1. Follow Manual order Processing steps on previous page to ID sample and order test.
2. Press Mc column on Order screen.
3. Press Start.
4. Place sample rack with cups/uncapped tubes onto system.
Change to longer measurement time (PT, aPTT)
1. Follow Manual Order Processing steps on previous page to ID sample and order test.
2. Press Detailed Settings button.
3. Click box below Measurement Time.
4. Select measurement time.
5. Press OK.
6. Press Start.

27
Factor assay MDA
Factor assay: Multiple dilution analysis (MDA)
Order MDA
1. Press Order.
2. Order a factor assay on a specimen. Follow Manual Order Processing directions.
3. Press Detailed Settings operation key.
4. Select 1/1 key under Dilution Ratio.
5. Select MDA dilution.
6. Press OK.
7. Press Start.
MDA name Dilution ratio
MDA stand 1/1 1/2 1/4
MDA high 1/2 1/4 1/8
MDA low 1/1 3/2 2/1
28
Factor assay: Multiple dilution analysis
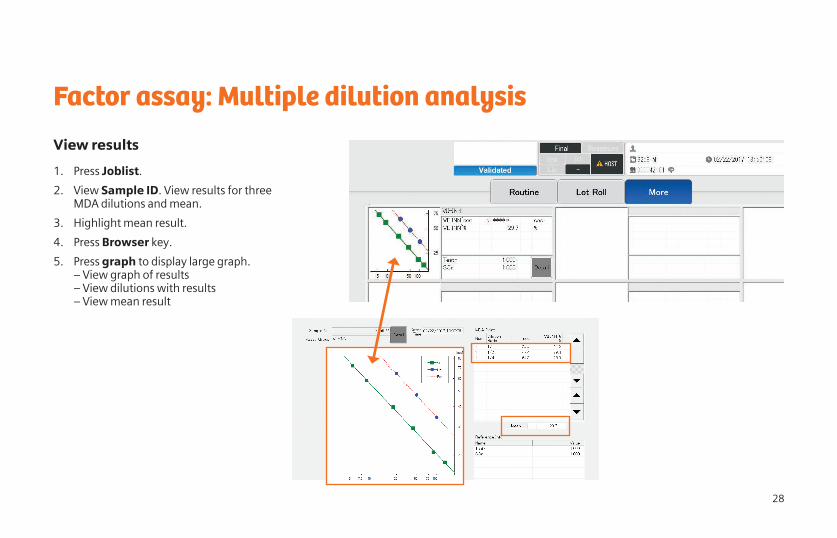
View results
1. Press Joblist.
2. View Sample ID. View results for three MDA dilutions and mean.
3. Highlight mean result.
4. Press Browser key.
5. Press graph to display large graph. – View graph of results – View dilutions with results – View mean result
29
Joblist information
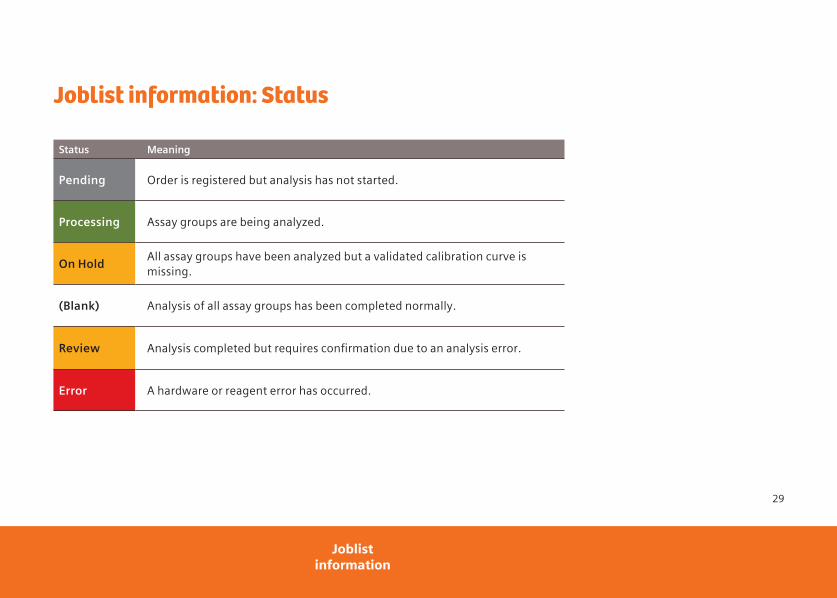
Joblist information: Status
Status Meaning
Pending Order is registered but analysis has not started.
Processing Assay groups are being analyzed.
On HoldAll assay groups have been analyzed but a validated calibration curve is missing.
(Blank) Analysis of all assay groups has been completed normally.
Review Analysis completed but requires confirmation due to an analysis error.
Error A hardware or reagent error has occurred.

30
Joblist information: Symbols
Result flags
* Low reliability flag
d Dilution analysis
< Below report limit
> Above report limit
R Reanalyzed
***.** No result due to error
XXX.XX No calibration curve
Analysis progress
Test ordered
Sample dispensed
Sample incubating
Sample measuring

31
Joblist information: Browser
1. Highlight sample on the Joblist.
2. Press Browser.
3. Press Detail key.
4. View Detail screen. – Displays sample volume error – Displays Analysis Result error – Displays Wave change – Displays hardware or reagent error
5. Press the graph for Reaction Curve info.
6. Proceed to next page for Reaction Curve.

32
Joblist information: Reaction curve
1. Press graph on Browser to view reaction curve.
2. View the reaction curve shape.
3. Press the tabs for more information.
• Evaluation Info tab displays: – bH: baseline – dH: reaction intensity – Coag %: where clot time is read – Wavelength: alternative wavelength used – Start and end time, slope for immuno/chromo
• Evaluation Data tab displays 1%–100% time for reaction curve
• Measurement Info tab displays: – Reagent lot used – Dilution ratio – Elapsed Time-hours onboard – Hem detection level – Lip detection level – Vol detection level – Calibration curve ID – QC performed date – Reagent table temperature
33
Joblist printing/export
Joblist printing
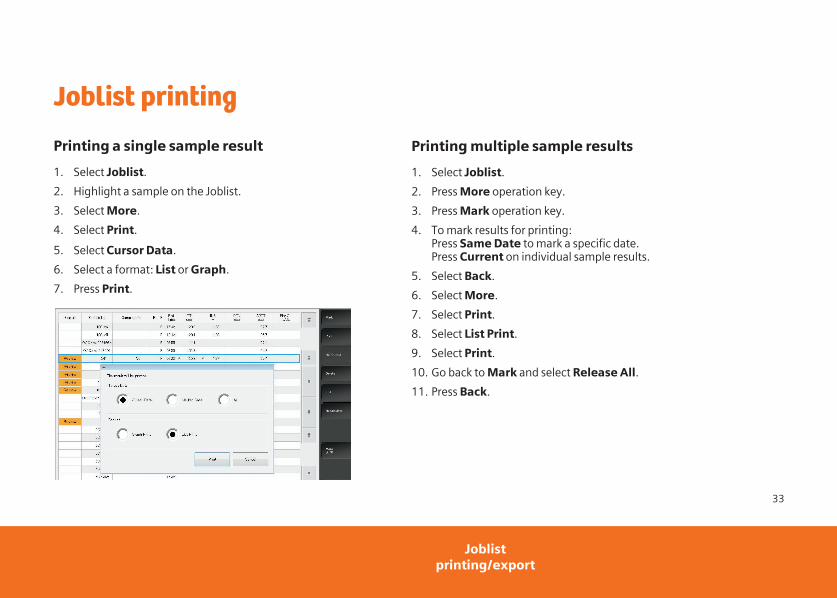
Printing a single sample result
1. Select Joblist.
2. Highlight a sample on the Joblist.
3. Select More.
4. Select Print.
5. Select Cursor Data.
6. Select a format: List or Graph.
7. Press Print.
Printing multiple sample results
1. Select Joblist.
2. Press More operation key.
3. Press Mark operation key.
4. To mark results for printing: Press Same Date to mark a specific date. Press Current on individual sample results.
5. Select Back.
6. Select More.
7. Select Print.
8. Select List Print.
9. Select Print.
10. Go back to Mark and select Release All.
11. Press Back.

34
Joblist export
Exporting daily joblist results
1. Press Joblist.
2. Select Display Condition.
3. Select Specify Date.
4. Select date using calendar.
5. Press Display.
6. Select More twice.
7. Select Export.
8. Select All.
9. Press Export.
10. Choose location for file.
11. Name file with the date.
12. Press Save.
13. Press Display Condition.
14. Select Today or Latest 50.

35
Preanalytical Sample Integrity
Preanalytical sample integrity
Hemolysis, lipemia, tube volume check
1. View Joblist .
2. View Sample Info column:
Hem Flag for hemolysis
Lip Flag for lipemia
H* Interference in hemolysis reading. Check tube manually
L* Interference in lipemia reading. Check tube manually
Vol Sample tube fill out of range

36
Preanalytical sample integrity
To view levels for a sample:
1. View Joblist. Highlight sample result.
2. Select Browser.
3. Press Reaction Curve.
4. Select Measurement Info tab.

37
Enter reagent information
Enter reagent information
Entering information manually
1. Press Menu from IPU toolbar.
2. Press Settings.
3. Press Reagent Lot Master.
4. Enter lot number in Lot No. field or scan barcode with 2D barcode reader.
5. Place cursor in Exp. Date. field.
6. Enter expiration date using calendar.
7. Press Add.
8. Press Save.
Note:CS-5100 application sheets list required reagents, reagent onboard stability and onboard position for each specific assay.
38
Enter reagent information
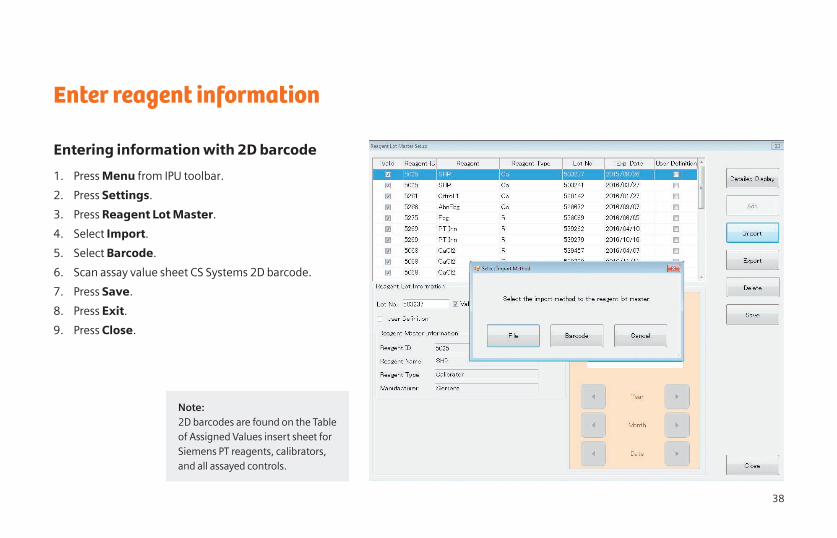
Entering information with 2D barcode
1. Press Menu from IPU toolbar.
2. Press Settings.
3. Press Reagent Lot Master.
4. Select Import.
5. Select Barcode.
6. Scan assay value sheet CS Systems 2D barcode.
7. Press Save.
8. Press Exit.
9. Press Close.
Note:2D barcodes are found on the Table of Assigned Values insert sheet for Siemens PT reagents, calibrators, and all assayed controls.

39
Calibration
Calibration
Load Reagents
1. Enter reagent and calibrator lot information in Reagent Lot Master. Refer to the Enter Reagent Information tab for instructions.
2. Load Reagents. Refer to the Loading Reagents tab for more details
Order the calibration
3. Press Order.
4. Press Switch Order.
5. Press Holder Calib Curve Order.
6. Select the desired assay to be calibrated.
7. Press Change and select the correct reagent lot number.
8. Press OK.
9. Select the correct calibrator lot from list on the right. Assay value automatically displays.
10. For manual entry of assay value: Place the cursor in the Assay Sheet Value field and enter value using keypad.
11. Press OK.
12. Press Start.
13. To view the calibration status and progress, press Joblist.
Note:Calibrator plasma should be transferred into a SLD mini cup. Refer to Loading Reagents tab, Loading with C-rack page for more details.
40
Calibration validation
View new calibration curve
1. Press Calib. Curve.
2. Press Change.
3. Select the assay key.
4. Select the lot number.
Compare new/current calibration curve
1. Press Detailed Display.
2. Press Select Compared Calib. Curve.
3. Select a calibration curve to compare and press Load.
4. Compare calibration curves.
5. Press Close.
Validate new calibration curve
1. Press Validate to validate the calibration curve.
2. Press OK.
3. Press Print.
Note:Validate calibration by performing QC.
41
Calibration: Restore
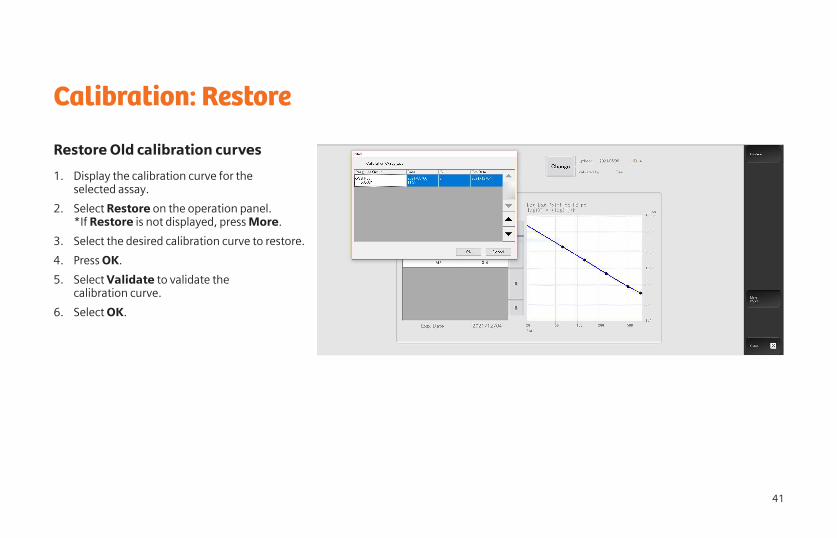
Restore Old calibration curves
1. Display the calibration curve for the selected assay.
2. Select Restore on the operation panel. *If Restore is not displayed, press More.
3. Select the desired calibration curve to restore.
4. Press OK.
5. Select Validate to validate the calibration curve.
6. Select OK.
42
Enter ISIand Normal
Enter ISI and Normal
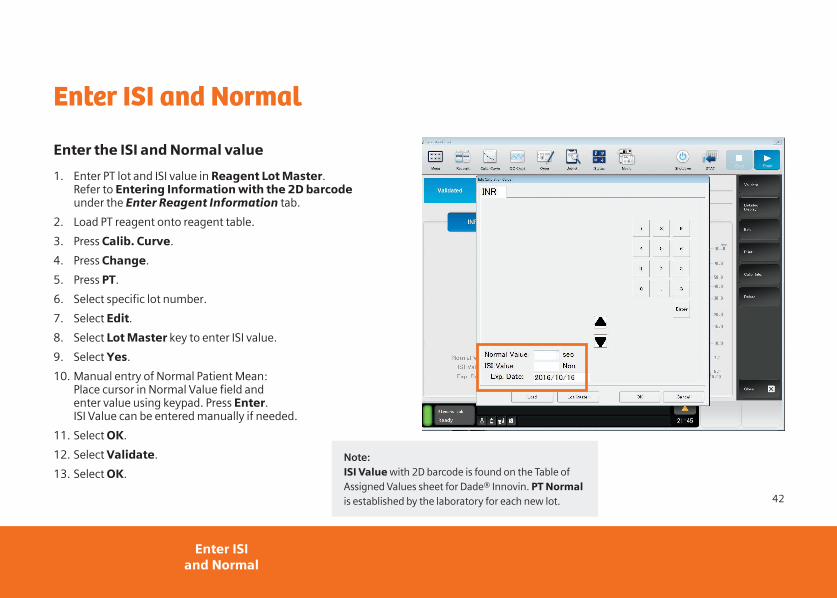
Enter the ISI and Normal value
1. Enter PT lot and ISI value in Reagent Lot Master. Refer to Entering Information with the 2D barcode under the Enter Reagent Information tab.
2. Load PT reagent onto reagent table.
3. Press Calib. Curve.
4. Press Change.
5. Press PT.
6. Select specific lot number.
7. Select Edit.
8. Select Lot Master key to enter ISI value.
9. Select Yes.
10. Manual entry of Normal Patient Mean: Place cursor in Normal Value field and enter value using keypad. Press Enter. ISI Value can be entered manually if needed.
11. Select OK.
12. Select Validate.
13. Select OK.
Note:ISI Value with 2D barcode is found on the Table of Assigned Values sheet for Dade® Innovin. PT Normal is established by the laboratory for each new lot.
43
Shutdown/ startup system
Shutdown and startup
Shutdown the system
1. Verify CA Clean I is set on the Reagent Table.
2. Press Shutdown icon. Select option: Turn the Main Unit OFF.
3. Press OK.
4. Cleaning will take 5 minutes. IPU computer will shut down.
5. Press analyzer power switch off.
Startup the system
1. Press Power button on IPU computer.
2. Computer starts up.
3. Press enter on keyboard to select User. (lower left side)
4. Enter User password.
5. Instrument software starts up.
6. Select Logon icon, enter password.
7. Press analyzer power switch on.

44
Backup
Backing up the database
Saving to IPU backup folder
1. Exit the IPU software by pressing X in upper right of screen.
2. Press OK.
3. Power OFF main unit.
4. Select Backup Icon on desktop.
5. Verify location as C:\IPU_Backup
6. Check box for Saved date is added to backup destination.
7. Select Option.
8. Select Specify Date. Enter date range from last backup.
9. Press OK to close dialog box.
10. Press OK to start backup.
11. Wait for “Backup is correctly completed” message.
12. Press OK.
13. Press Cancel to close screen.
14. Find file in IPU backup folder.
15. Save file to a flash drive. Go to next page for instructions. Note:The file created is identified with date and time.

45
Backing up the database
Saving to a flash drive
1. Place flash drive in computer.
2. Open IPU_backup folder on desktop.
3. Right-click the file, select Send to, and select Compressed (zipped) folder.
4. Right-click on Compressed backup file.
5. Select Send to and select the flash drive.
6. To delete files from IPU backup folder, highlight file, right click, select Delete.
Note:It is not recommended to keep all backup files in the IPU backup folder. This may slow down computer.

46
Weekly maintenance
Weekly maintenance
Cleaning the instrument
1. Shut down the main unit and unplug the power cord.
2. Wipe the instrument with a moistened paper towel with water and a neutral detergent.
Cleaning the rinse tank
1. Remove the cap of the rinse tank by turning counterclockwise.
2. Use 70% Isopropyl to wash the inside of the tank and float switch.
3. Rinse the tank and float switch with distilled water.
4. Attach the float switch and tighten cap clockwise.
Note:Document manual maintenance in the Maint. screen under Manual Maintenance in the operation panel.
47
Monthly maintenance
Monthly maintenance
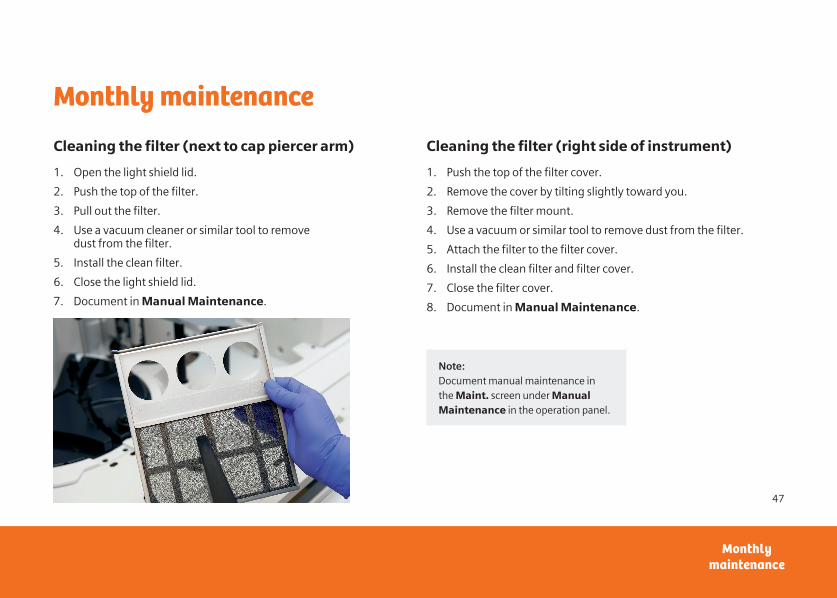
Cleaning the filter (next to cap piercer arm)
1. Open the light shield lid.
2. Push the top of the filter.
3. Pull out the filter.
4. Use a vacuum cleaner or similar tool to remove dust from the filter.
5. Install the clean filter.
6. Close the light shield lid.
7. Document in Manual Maintenance.
Cleaning the filter (right side of instrument)
1. Push the top of the filter cover.
2. Remove the cover by tilting slightly toward you.
3. Remove the filter mount.
4. Use a vacuum or similar tool to remove dust from the filter.
5. Attach the filter to the filter cover.
6. Install the clean filter and filter cover.
7. Close the filter cover.
8. Document in Manual Maintenance.
Note:Document manual maintenance in the Maint. screen under Manual Maintenance in the operation panel.

48
As-needed maintenance
Pressure and vacuum adjustment
Adjusting the vacuum (Range -0.057 to -0.053)
1. Press Maint.
2. Press Pressure Adjustment. (Press More if not visible)
3. Press Power ON Pressure. (If pneumatic unit does not automatically turn on).
4. Open the lower right door on the main unit.
5. Loosen the fixing nut of the bellows unit.
6. Turn knob clockwise to increase, counter clockwise to decrease.
7. Adjust the pressure between -0.057 and - 0.053.
8. Tighten the fixing nut.
9. Close right door.
10. Press OK.
0.10 pressure adjustment
Vacuum adjustment
49
Pressure and vacuum adjustment
Adjusting the 0.10 MPa pressure (range 0.10 to 0.11)
1. Press Maint.
2. Press Pressure Adjustment (press More if not visible).
3. Press Power ON Pressure (if pneumatic unit does not automatically turn on).
4. Open the lower right door on the main unit.
5. Pull the 0.10 MPa adjustment knob toward you to unlock.
6. Turn adjustment knob slowly.
7. Once adjustment is complete, press the adjustment knob in until it locks.
8. Press OK on the screen.
9. Date is automatically recorded on Maint. screen.
Adjusting the 0.22 MPa pressure (range 0.22 to 0.24)
1. Press Maint.
2. Press the Pressure Adjustment (press More if not visible).
3. Press Power ON Pressure (if pneumatic unit does not automatically turn on).
4. Open the lower left door on the main unit.
5. The 0.22 MPa adjustment knob is located on the pneumatic unit.
6. Loosen the fixing screw on the adjustment knob by turning the screwdriver counterclockwise.
7. Turn adjustment knob slowly.
8. Once adjustment is complete, tighten the fixing screw while taking care not to rotate the adjustment knob.
9. Press OK on the screen.
10. Date is automatically recorded on Maint. screen.

50
Lamp replacement
1. Turn OFF the power of the main unit and unplug the power cord. Wait 30 minutes for lamp to cool down.
2. Open the lamp cover located on the right side of the main unit.
3. Press the clamp of the connector and disconnect the connectors.
4. Loosen the thumb screw.
5. Remove lamp holder.
6. Squeeze and lift the lamp retainer to remove the lamp.
7. Install a new lamp in reverse order.
8. Reconnect the power and turn the main unit ON.
9. Allow lamp to burn in 30 minutes before calibration.
10. Go to next page for Lamp calibration.
Note:Perform QC on all assays after lamp replacement and calibration. Perform calibration on assays if needed.
51
Lamp calibration
1. Press Maint.
2. Press Lamp Calibration.
3. Press Execute.
4. Select an option when calibration is successful.
• Reset lamp counter when calibrating a new lamp.
• Do not reset the lamp counter when calibrating the same lamp.
5. Press OK.
6. Enter initials in Operation Log for calibrating new lamp.
7. Enter initials/date in Maint. Screen Remarks for calibrating same lamp.
8. Perform QC on all assays.
Note:Lamp calibration requires a 30-minute warming-up of the lamp to allow light intensity stabilization. Do not start calibration earlier; this will affect patient results.

52
Clean racks and piercer
Clean the Sysmex racks
1. Wipe racks with soft cloth with water or ethanol.
2. Document in Manual Maintenance.
Wipe the piercer clean
1. Verify light shield is closed
2. Press Maint. on the toolbar.
3. Press Wipe off Piercer operation key
4. Wait for piercer to move to position. Press OK.
5. Power off Main unit.
6. Open light shield.
7. Set the jig on the piercer.
8. Wipe piercer with gauze moistened with distilled water.
9. Remove the jig.
10. Close the light shield.
11. Power on the Main unit.
53
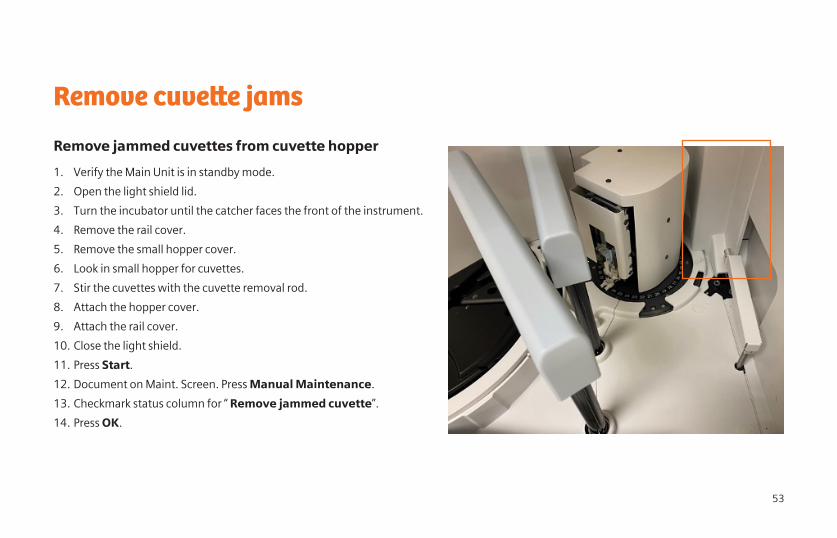
Remove cuvette jams
Remove jammed cuvettes from cuvette hopper
1. Verify the Main Unit is in standby mode.
2. Open the light shield lid.
3. Turn the incubator until the catcher faces the front of the instrument.
4. Remove the rail cover.
5. Remove the small hopper cover.
6. Look in small hopper for cuvettes.
7. Stir the cuvettes with the cuvette removal rod.
8. Attach the hopper cover.
9. Attach the rail cover.
10. Close the light shield.
11. Press Start.
12. Document on Maint. Screen. Press Manual Maintenance.
13. Checkmark status column for “ Remove jammed cuvette”.
14. Press OK.
54
Error help
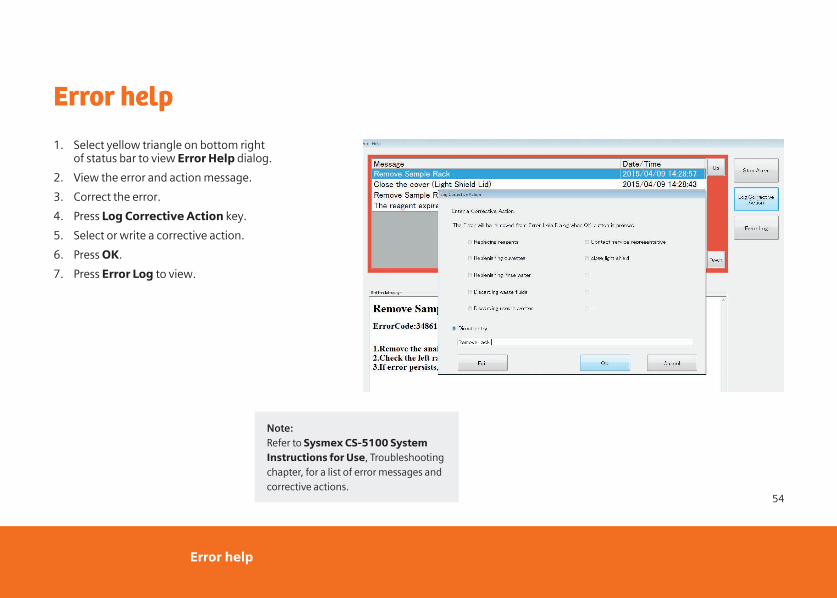
Error help
1. Select yellow triangle on bottom right of status bar to view Error Help dialog.
2. View the error and action message.
3. Correct the error.
4. Press Log Corrective Action key.
5. Select or write a corrective action.
6. Press OK.
7. Press Error Log to view.
Note:Refer to Sysmex CS-5100 System Instructions for Use, Troubleshooting chapter, for a list of error messages and corrective actions.

55
Troubleshooting results
Analysis Result error
Use the flowchart to locate information for the result.
Review the result on the Joblist.
No further action needed.
Report result per laboratory protocol.
Highlight the sample and select Browser.
Locate result with Detail key.
Use Sysmex CS-5100 Quick
Reference Guide to troubleshoot
Analysis Result Error.
Analysis Result Error occurred.
View Detail screen for Analysis Result
Error and Error Code number.
On Browser, select the Reaction Curve,
review Evaluation Info, Evaluation Data, and Measurement Info.
Mechanical error or reagent
problem occurred.
View Detail screen for message.
Troubleshoot problem.
Is the status Review or Error?NO
YES
RED YELLOW
56
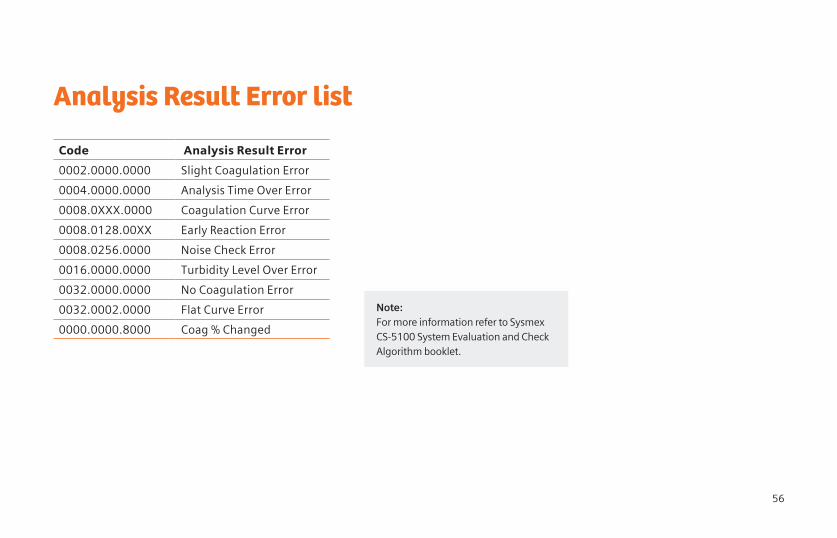
Code Analysis Result Error
0002.0000.0000 Slight Coagulation Error
0004.0000.0000 Analysis Time Over Error
0008.0XXX.0000 Coagulation Curve Error
0008.0128.00XX Early Reaction Error
0008.0256.0000 Noise Check Error
0016.0000.0000 Turbidity Level Over Error
0032.0000.0000 No Coagulation Error
0032.0002.0000 Flat Curve Error
0000.0000.8000 Coag % Changed
Analysis Result Error list
Note:For more information refer to Sysmex CS-5100 System Evaluation and Check Algorithm booklet.
57
Slight Coagulation Error
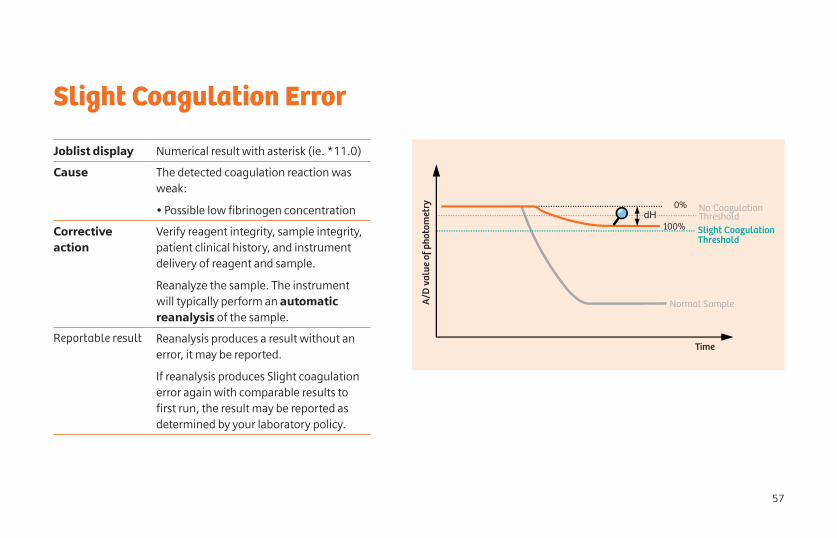
No Coagulation Threshold Slight Coagulation Threshold
Normal Sample
Time
A/D
val
ue o
f pho
tom
etry
0%
100%dH
Joblist display Numerical result with asterisk (ie. *11.0)
Cause The detected coagulation reaction was weak:
• Possible low fibrinogen concentration
Corrective action
Verify reagent integrity, sample integrity, patient clinical history, and instrument delivery of reagent and sample.
Reanalyze the sample. The instrument will typically perform an automatic reanalysis of the sample.
Reportable result Reanalysis produces a result without an error, it may be reported.
If reanalysis produces Slight coagulation error again with comparable results to first run, the result may be reported as determined by your laboratory policy.
58
Analysis Time Over Error
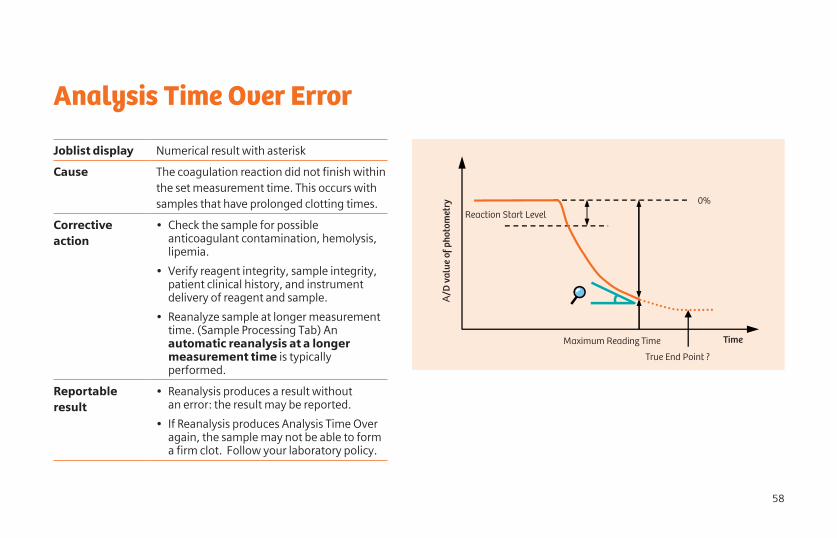
Joblist display Numerical result with asterisk
Cause The coagulation reaction did not finish within the set measurement time. This occurs with samples that have prolonged clotting times.
Corrective action
• Check the sample for possible anticoagulant contamination, hemolysis, lipemia.
• Verify reagent integrity, sample integrity, patient clinical history, and instrument delivery of reagent and sample.
• Reanalyze sample at longer measurement time. (Sample Processing Tab) An automatic reanalysis at a longer measurement time is typically performed.
Reportable result
• Reanalysis produces a result without an error: the result may be reported.
• If Reanalysis produces Analysis Time Over again, the sample may not be able to form a firm clot. Follow your laboratory policy.
Maximum Reading Time Time
A/D
val
ue o
f pho
tom
etry
0%
True End Point ?
Reaction Start Level

59
Coagulation Curve Error
Joblist display Numerical result with asterisk
Cause • This occurs when there is an unexpected fluctuation in the curve. The most common reason is a bubble in the cuvette.
• In Fibrinogen test: cold buffer or sample inhibitor.
Corrective action
• Verify sample and reagent delivery.
• Verify reagent and sample integrity.
• Review result reaction curve.
• Reanalyze the sample.
Reportable result
• Reanalysis produces a result without an error: report the result.
• If Reanalysis produces Coagulation Curve Error again, review acceptability of both curves, and if results are equivalent, the mean of the results may be reported as determined by your laboratory policy.
This error type includes the following sub-types
• Initial fluctuation drop
• Sharp drop
• Stepping curve
• Jump up
• Fbg curve error
• Terrace
• Step curve
Normal Sample
Time
A/D
val
ue o
f pho
tom
etry 0%
Check T[4 sec.]
delta
Mask Time
100%
dH
60
Turbidity Level Over Error
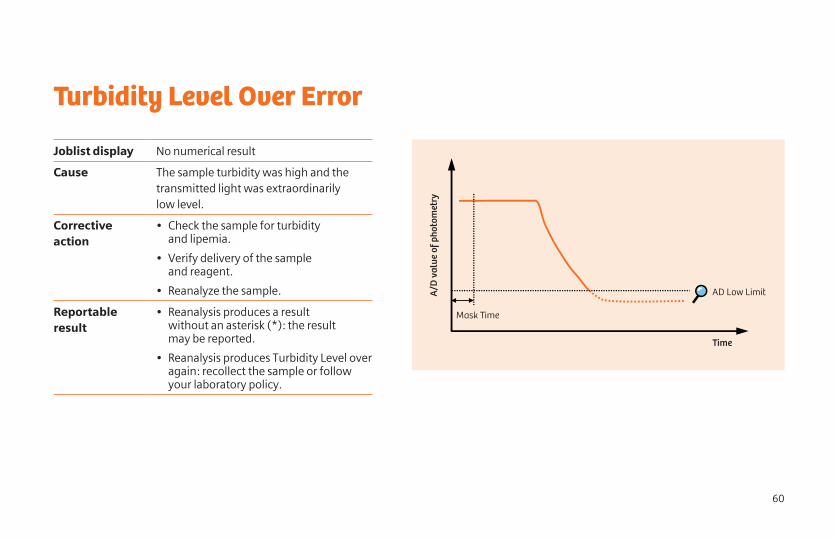
Joblist display No numerical result
Cause The sample turbidity was high and the transmitted light was extraordinarily low level.
Corrective action
• Check the sample for turbidity and lipemia.
• Verify delivery of the sample and reagent.
• Reanalyze the sample.
Reportable result
• Reanalysis produces a result without an asterisk (*): the result may be reported.
• Reanalysis produces Turbidity Level over again: recollect the sample or follow your laboratory policy.
AD Low Limit
Time
A/D
val
ue o
f pho
tom
etry
Mask Time
61
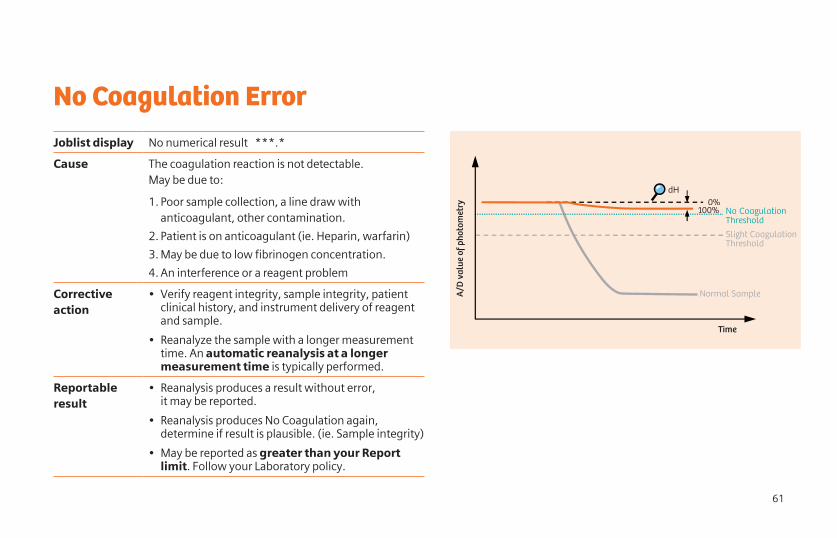
No Coagulation ErrorJoblist display No numerical result ***.*
Cause The coagulation reaction is not detectable. May be due to:
1. Poor sample collection, a line draw with anticoagulant, other contamination.
2. Patient is on anticoagulant (ie. Heparin, warfarin)
3. May be due to low fibrinogen concentration.
4. An interference or a reagent problem
Corrective action
• Verify reagent integrity, sample integrity, patient clinical history, and instrument delivery of reagent and sample.
• Reanalyze the sample with a longer measurement time. An automatic reanalysis at a longer measurement time is typically performed.
Reportable result
• Reanalysis produces a result without error, it may be reported.
• Reanalysis produces No Coagulation again, determine if result is plausible. (ie. Sample integrity)
• May be reported as greater than your Report limit. Follow your Laboratory policy.
Time
Slight Coagulation Threshold
No Coagulation Threshold
Normal SampleA/D
val
ue o
f pho
tom
etry
0%100%
dH

62
Flat Curve Error
Joblist display No numerical result (***.*)
Cause PT Test only. Due to Warfarin in high dose.
Corrective action
• Verify reagent integrity, sample integrity, patient clinical history, and instrument delivery of reagent and sample.
• Reanalyze the sample with a longer measurement time. An automatic reanalysis at a longer measurement time is typically performed.
• View reaction curve for normal baseline, clot phase, and endpoint.
• View Evaluation data results of first run and reanalysis.
Reportable result
• Reanalysis produces a result without error, it may be reported.
• If reanalysis at longer measurement time produces a Flat Curve again, follow your laboratory policy.
Normal Sample
Time
0%
100%
50%
Width
A/D
val
ue o
f pho
tom
etry
Slope

63
Early Reaction Error
Joblist display No numerical result ***.*
Cause For APTT results only
1. Patient is on anticoagulant drugs (ie. Heparin)
2. Poor sample collection, a line draw with anticoagulant, other contamination.
3. Unusual clinical situation.
Corrective action
1. Verify sample, reagent integrity, patient clinical history and delivery of reagent and sample.
2. Verify Error code type in the Detail screen. Follow guidance for that code.
3. View the reaction curve: Does it have clear baseline, clot phase, and endpoint?
4. View Evaluation data in Reaction curve screen for the numerical results.
5. If upon reanalysis, there is no error, it may be reported.
Error code types:
ERE: Slow Reaction- for a result 100 sec or more: Reanalyze the sample with a longer measurement time. Check the reaction curve for clear baseline, a clotting phase and endpoint. If curve is normal, it may be reported. Follow your laboratory policy.
ERE: Slow Reaction- for a result less than 100 sec: Reanalyze the sample. If the result is free from error, report. If repeated result has Slow Reaction, less than 100 sec, do not report. Follow your laboratory policy. (ie. Recollect sample)
ERE: Start Angle 1- Reanalyze the sample. If the result is free from error, report. If repeated result has Start Angle 1, do not report. Follow your laboratory policy. (ie. Recollect sample)
ERE: Start Angle 2- The result may be reported after inspecting the reaction curve for clear baseline, a clotting phase, and endpoint. If reaction curve is not normal, do not report. Follow your laboratory policy. (ie. Consider remix tube, re-centrifugation for a longer duration/ higher speed. Reanalyze).
ERE: Early %- Reanalyze the sample. If the result is free from error, report.
Check the Evaluation data- if the 8% value is less than 16.8 seconds Do not report.
If the 50% value is less than 20 seconds, do not report
If the 50% value is greater than 20 seconds, Follow your laboratory policy. (ie. Consider re-centrifugation at higher speed/longer duration and reanalyze. If reaction curve indicates, use longer measurement time for repeat analysis. Consider recollection unless patient history indicates otherwise.)
Do not report any result with an “Early Reaction Error” without reviewing the reaction curve.
An aPTT result <20 seconds should not be reported.
64
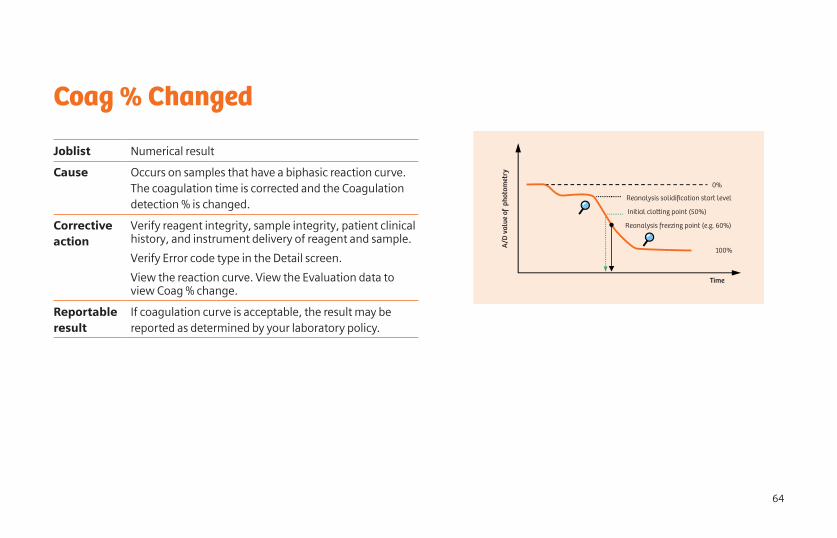
Coag % Changed
Joblist Numerical result
Cause Occurs on samples that have a biphasic reaction curve. The coagulation time is corrected and the Coagulation detection % is changed.
Corrective action
Verify reagent integrity, sample integrity, patient clinical history, and instrument delivery of reagent and sample.
Verify Error code type in the Detail screen.
View the reaction curve. View the Evaluation data to view Coag % change.
Reportable result
If coagulation curve is acceptable, the result may be reported as determined by your laboratory policy.
Time
A/D
val
ue o
f ph
otom
etry
0%
100%
Reanalysis solidification start level
Reanalysis freezing point (e.g. 60%)
Initial clo�ing point (50%)
65
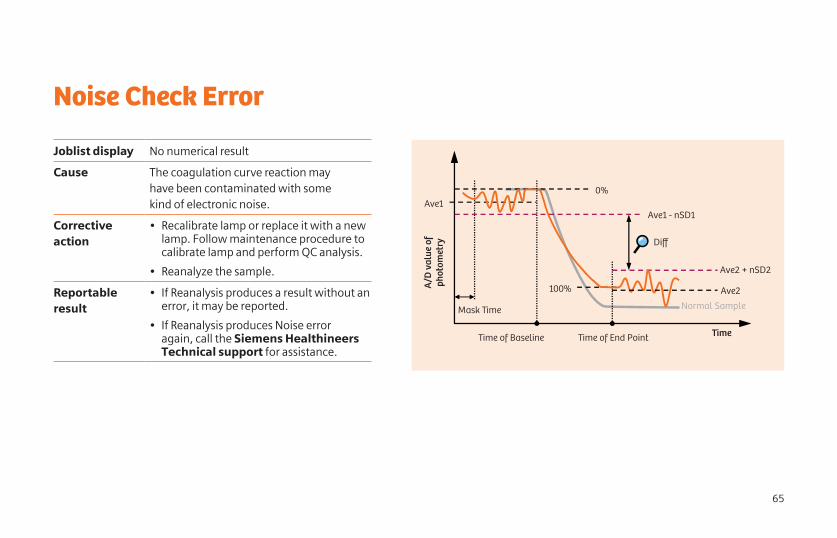
Noise Check Error
Joblist display No numerical result
Cause The coagulation curve reaction may have been contaminated with some kind of electronic noise.
Corrective action
• Recalibrate lamp or replace it with a new lamp. Follow maintenance procedure to calibrate lamp and perform QC analysis.
• Reanalyze the sample.
Reportable result
• If Reanalysis produces a result without an error, it may be reported.
• If Reanalysis produces Noise error again, call the Siemens Healthineers Technical support for assistance.
Diff
Time of End Point
Normal Sample
Time
A/D
val
ue o
fph
otom
etry
0%
100%
Ave1
Mask Time
Ave2 + nSD2
Ave2
Time of Baseline
Ave1 - nSD1
Siemens Healthcare Diagnostics, a global leader in clinical diagnostics, provides healthcare professionals in hospital, reference, and physician office laboratories and point-of-care settings with the vital information required to accurately diagnose, treat, and monitor patients. Our innovative portfolio of performance-driven solutions and personalized customer care combine to streamline workflow, enhance operational efficiency, and support improved patient outcomes.
Dade, Innovin, and all associated marks are trademarks of Siemens Healthcare Diagnostics Inc. or its affiliates. Sysmex is a registered trademark of Sysmex corporation of America.
All other trademarks are the property of their respective owners.
05-2021 | All rights reserved© 2021 Siemens Healthcare Diagnostics Inc.
T05011.001 Effective date 05/28/21
Note: This document is for supplemental use only, and not meant to be used in place of primary technical materials
This quick reference guide, and the software described within, are copyrighted. No part of this may be copied, reproduced, translated, or reduced to any electronic medium or machine-readable form without the prior written consent of Siemens Healthcare Diagnostics, Inc.
Global Siemens HeadquartersSiemens AGWittelsbacherplatz 280333 MuenchenGermany
Global Siemens Healthcare HeadquartersSiemens AGHealthcare SectorHenkestrasse 12791052 ErlangenGermany
Global DivisionSiemens Healthcare Diagnostics Inc.511 Benedict AvenueTarrytown, NY 10591-5005USAwww.siemens.com/diagnostics