SYRIA MARKET MONITORING EXERCISE Cash …...Bread 37 kg Bulgur 15 kg Chicken 6 kg Eggs 6 kg Fresh...
11
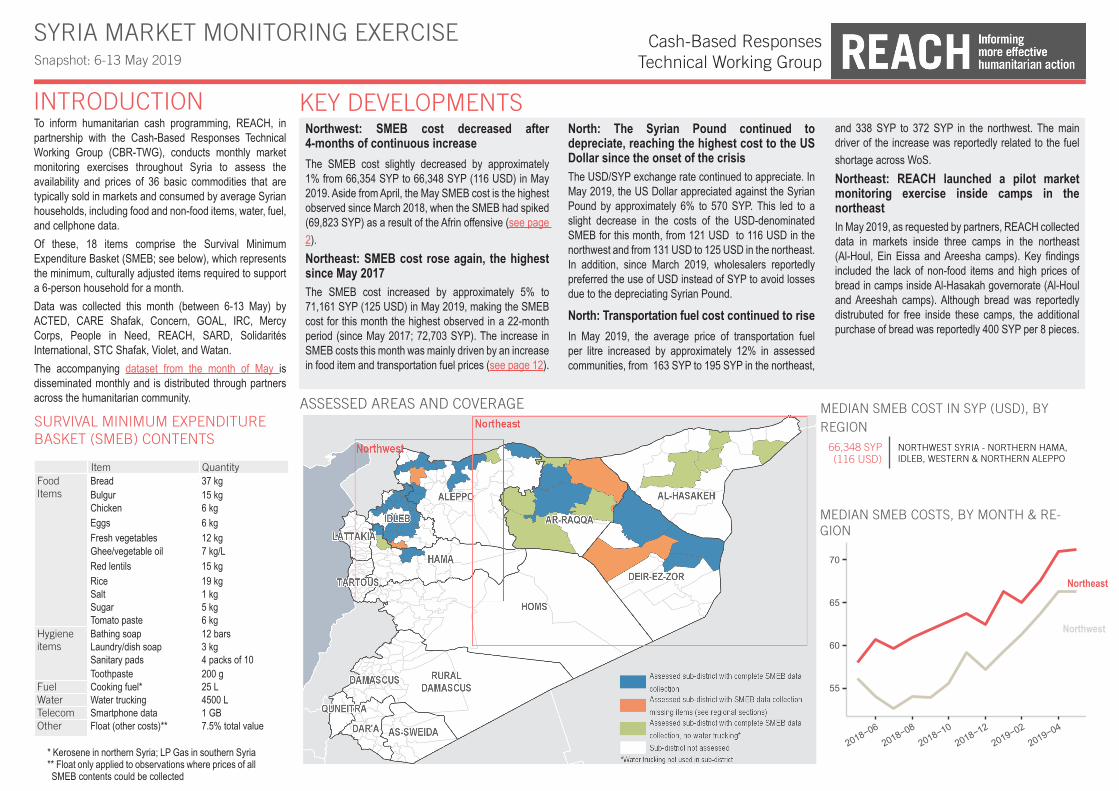
Cash-Based Responses Technical Working Group SYRIA MARKET MONITORING EXERCISE Item Quantity Food Items Bread 37 kg Bulgur 15 kg Chicken 6 kg Eggs 6 kg Fresh vegetables 12 kg Ghee/vegetable oil 7 kg/L Red lentils 15 kg Rice 19 kg Salt 1 kg Sugar 5 kg Tomato paste 6 kg Hygiene items Bathing soap 12 bars Laundry/dish soap 3 kg Sanitary pads 4 packs of 10 Toothpaste 200 g Fuel Cooking fuel* 25 L Water Water trucking 4500 L Telecom Smartphone data 1 GB Other Float (other costs)** 7.5% total value SURVIVAL MINIMUM EXPENDITURE BASKET (SMEB) CONTENTS * Kerosene in northern Syria; LP Gas in southern Syria ** Float only applied to observations where prices of all SMEB contents could be collected ASSESSED AREAS AND COVERAGE MEDIAN SMEB COST IN SYP (USD), BY REGION 66,348 SYP (116 USD) NORTHWEST SYRIA - NORTHERN HAMA, IDLEB, WESTERN & NORTHERN ALEPPO INTRODUCTION KEY DEVELOPMENTS COVERAGE 86 COMMUNITIES 48 SUB- 6 MEDIAN SMEB COSTS, BY MONTH & RE- GION 55 60 65 70 2018−06 2018−08 2018−10 2018−12 2019−02 2019−04 Northeast Snapshot: 6-13 May 2019 To inform humanitarian cash programming, REACH, in partnership with the Cash-Based Responses Technical Working Group (CBR-TWG), conducts monthly market monitoring exercises throughout Syria to assess the availability and prices of 36 basic commodities that are typically sold in markets and consumed by average Syrian households, including food and non-food items, water, fuel, and cellphone data. Of these, 18 items comprise the Survival Minimum Expenditure Basket (SMEB; see below), which represents the minimum, culturally adjusted items required to support a 6-person household for a month. Data was collected this month (between 6-13 May) by ACTED, CARE Shafak, Concern, GOAL, IRC, Mercy Corps, People in Need, REACH, SARD, Solidarités International, STC Shafak, Violet, and Watan. The accompanying dataset from the month of May is disseminated monthly and is distributed through partners across the humanitarian community. Northwest: SMEB cost decreased after 4-months of continuous increase The SMEB cost slightly decreased by approximately 1% from 66,354 SYP to 66,348 SYP (116 USD) in May 2019. Aside from April, the May SMEB cost is the highest observed since March 2018, when the SMEB had spiked (69,823 SYP) as a result of the Afrin offensive (see page 2). Northeast: SMEB cost rose again, the highest since May 2017 The SMEB cost increased by approximately 5% to 71,161 SYP (125 USD) in May 2019, making the SMEB cost for this month the highest observed in a 22-month period (since May 2017; 72,703 SYP). The increase in SMEB costs this month was mainly driven by an increase in food item and transportation fuel prices (see page 12). North: The Syrian Pound continued to depreciate, reaching the highest cost to the US Dollar since the onset of the crisis The USD/SYP exchange rate continued to appreciate. In May 2019, the US Dollar appreciated against the Syrian Pound by approximately 6% to 570 SYP. This led to a slight decrease in the costs of the USD-denominated SMEB for this month, from 121 USD to 116 USD in the northwest and from 131 USD to 125 USD in the northeast. In addition, since March 2019, wholesalers reportedly preferred the use of USD instead of SYP to avoid losses due to the depreciating Syrian Pound. North: Transportation fuel cost continued to rise In May 2019, the average price of transportation fuel per litre increased by approximately 12% in assessed communities, from 163 SYP to 195 SYP in the northeast, and 338 SYP to 372 SYP in the northwest. The main driver of the increase was reportedly related to the fuel shortage across WoS. Northeast: REACH launched a pilot market monitoring exercise inside camps in the northeast In May 2019, as requested by partners, REACH collected data in markets inside three camps in the northeast (Al-Houl, Ein Eissa and Areesha camps). Key findings included the lack of non-food items and high prices of bread in camps inside Al-Hasakah governorate (Al-Houl and Areeshah camps). Although bread was reportedly distrubuted for free inside these camps, the additional purchase of bread was reportedly 400 SYP per 8 pieces. Northwest
Transcript of SYRIA MARKET MONITORING EXERCISE Cash …...Bread 37 kg Bulgur 15 kg Chicken 6 kg Eggs 6 kg Fresh...
Cash-Based Responses Technical Working Group
SYRIA MARKET MONITORING EXERCISE
Item QuantityFood Items
Bread 37 kgBulgur 15 kgChicken 6 kgEggs 6 kgFresh vegetables 12 kgGhee/vegetable oil 7 kg/LRed lentils 15 kgRice 19 kgSalt 1 kgSugar 5 kgTomato paste 6 kg
Hygiene items
Bathing soap 12 barsLaundry/dish soap 3 kgSanitary pads 4 packs of 10Toothpaste 200 g
Fuel Cooking fuel* 25 LWater Water trucking 4500 LTelecom Smartphone data 1 GBOther Float (other costs)** 7.5% total value
SURVIVAL MINIMUM EXPENDITURE BASKET (SMEB) CONTENTS
* Kerosene in northern Syria; LP Gas in southern Syria** Float only applied to observations where prices of all SMEB contents could be collected
ASSESSED AREAS AND COVERAGE MEDIAN SMEB COST IN SYP (USD), BY REGION 66,348 SYP
(116 USD) NORTHWEST SYRIA - NORTHERN HAMA, IDLEB, WESTERN & NORTHERN ALEPPO
INTRODUCTION KEY DEVELOPMENTS
COVERAGE86 COMMUNITIES
48 SUB-
6
MEDIAN SMEB COSTS, BY MONTH & RE-GION
55
60
65
70
2018−0
6201
8−08201
8−10201
8−12201
9−02201
9−04
Northeast
Snapshot: 6-13 May 2019
To inform humanitarian cash programming, REACH, in partnership with the Cash-Based Responses Technical Working Group (CBR-TWG), conducts monthly market monitoring exercises throughout Syria to assess the availability and prices of 36 basic commodities that are typically sold in markets and consumed by average Syrian households, including food and non-food items, water, fuel, and cellphone data. Of these, 18 items comprise the Survival Minimum Expenditure Basket (SMEB; see below), which represents the minimum, culturally adjusted items required to support a 6-person household for a month. Data was collected this month (between 6-13 May) by ACTED, CARE Shafak, Concern, GOAL, IRC, Mercy Corps, People in Need, REACH, SARD, Solidarités International, STC Shafak, Violet, and Watan.The accompanying dataset from the month of May is disseminated monthly and is distributed through partners across the humanitarian community.
Northwest: SMEB cost decreased after 4-months of continuous increase The SMEB cost slightly decreased by approximately 1% from 66,354 SYP to 66,348 SYP (116 USD) in May 2019. Aside from April, the May SMEB cost is the highest observed since March 2018, when the SMEB had spiked (69,823 SYP) as a result of the Afrin offensive (see page 2). Northeast: SMEB cost rose again, the highest since May 2017The SMEB cost increased by approximately 5% to 71,161 SYP (125 USD) in May 2019, making the SMEB cost for this month the highest observed in a 22-month period (since May 2017; 72,703 SYP). The increase in SMEB costs this month was mainly driven by an increase in food item and transportation fuel prices (see page 12).
North: The Syrian Pound continued to depreciate, reaching the highest cost to the US Dollar since the onset of the crisis The USD/SYP exchange rate continued to appreciate. In May 2019, the US Dollar appreciated against the Syrian Pound by approximately 6% to 570 SYP. This led to a slight decrease in the costs of the USD-denominated SMEB for this month, from 121 USD to 116 USD in the northwest and from 131 USD to 125 USD in the northeast. In addition, since March 2019, wholesalers reportedly preferred the use of USD instead of SYP to avoid losses due to the depreciating Syrian Pound.
North: Transportation fuel cost continued to riseIn May 2019, the average price of transportation fuel per litre increased by approximately 12% in assessed communities, from 163 SYP to 195 SYP in the northeast,
and 338 SYP to 372 SYP in the northwest. The main driver of the increase was reportedly related to the fuel shortage across WoS.Northeast: REACH launched a pilot market monitoring exercise inside camps in the northeastIn May 2019, as requested by partners, REACH collected data in markets inside three camps in the northeast (Al-Houl, Ein Eissa and Areesha camps). Key findings included the lack of non-food items and high prices of bread in camps inside Al-Hasakah governorate (Al-Houl and Areeshah camps). Although bread was reportedly distrubuted for free inside these camps, the additional purchase of bread was reportedly 400 SYP per 8 pieces.
Northwest
2Syria Market Monitoring Monthly Snapshot: 6 - 13 May 2019 CASH-BASED RESPONSES TECHNICAL WORKING GROUP
MEDIAN SMEB COSTS, BY MONTHThousand Syrian Pounds
50
60
70
2018−0
6201
8−08201
8−10201
8−12201
9−02201
9−04
NORTHWEST SYRIA: KEY DEVELOPMENTS AND OVERVIEW
Sub-district SMEBOne
month change
Six month change
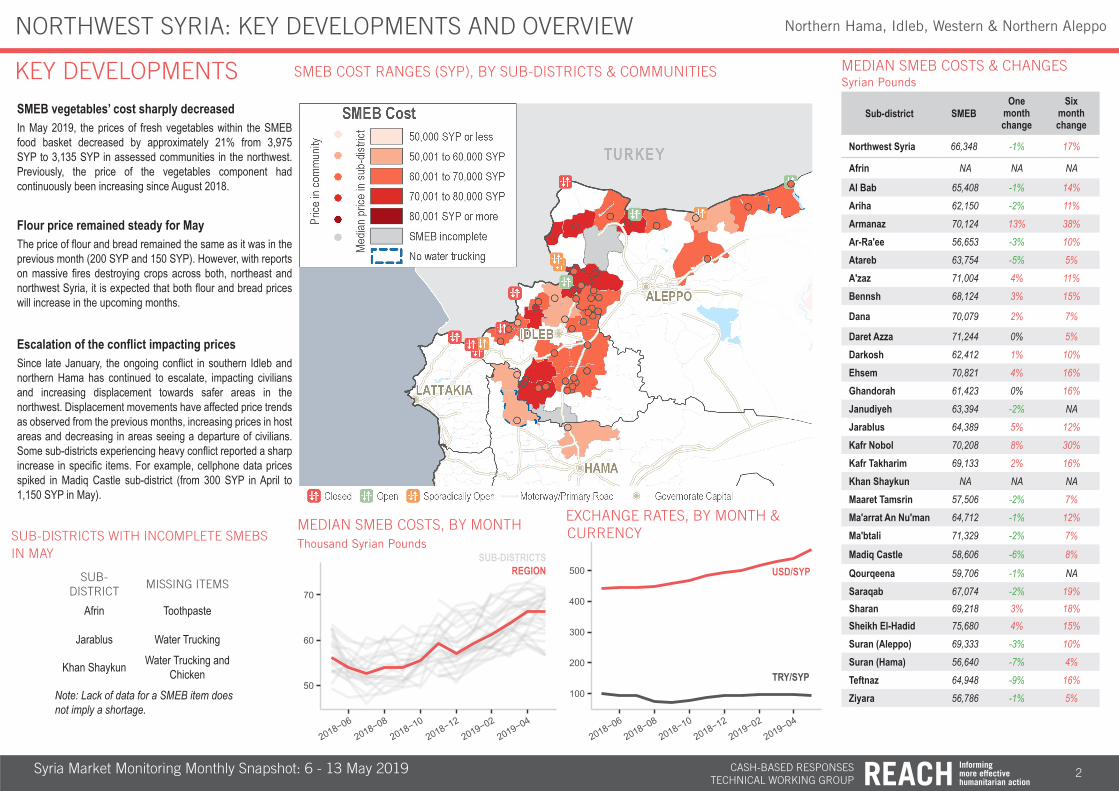
Northwest Syria 66,348 -1% 17%
Afrin NA NA NA
Al Bab 65,408 -1% 14%
Ariha 62,150 -2% 11%
Armanaz 70,124 13% 38%
Ar-Ra'ee 56,653 -3% 10%
Atareb 63,754 -5% 5%
A'zaz 71,004 4% 11%
Bennsh 68,124 3% 15%
Dana 70,079 2% 7%
Daret Azza 71,244 0% 5%
Darkosh 62,412 1% 10%
Ehsem 70,821 4% 16%
Ghandorah 61,423 0% 16%
Janudiyeh 63,394 -2% NA
Jarablus 64,389 5% 12%
Kafr Nobol 70,208 8% 30%
Kafr Takharim 69,133 2% 16%
Khan Shaykun NA NA NA
Maaret Tamsrin 57,506 -2% 7%
Ma'arrat An Nu'man 64,712 -1% 12%
Ma'btali 71,329 -2% 7%
Madiq Castle 58,606 -6% 8%
Qourqeena 59,706 -1% NA
Saraqab 67,074 -2% 19%Sharan 69,218 3% 18%Sheikh El-Hadid 75,680 4% 15%
Suran (Aleppo) 69,333 -3% 10%
Suran (Hama) 56,640 -7% 4%
Teftnaz 64,948 -9% 16%
Ziyara 56,786 -1% 5%
MEDIAN SMEB COSTS & CHANGESSyrian Pounds
KEY DEVELOPMENTS SMEB COST RANGES (SYP), BY SUB-DISTRICTS & COMMUNITIES
REGIONSUB-DISTRICTS
100
200
300
400
500
2018−0
6201
8−08201
8−10201
8−12201
9−02201
9−04
EXCHANGE RATES, BY MONTH & CURRENCY
USD/SYP
TRY/SYP
SMEB vegetables’ cost sharply decreasedIn May 2019, the prices of fresh vegetables within the SMEB food basket decreased by approximately 21% from 3,975 SYP to 3,135 SYP in assessed communities in the northwest. Previously, the price of the vegetables component had continuously been increasing since August 2018.
Flour price remained steady for MayThe price of flour and bread remained the same as it was in the previous month (200 SYP and 150 SYP). However, with reports on massive fires destroying crops across both, northeast and northwest Syria, it is expected that both flour and bread prices will increase in the upcoming months.
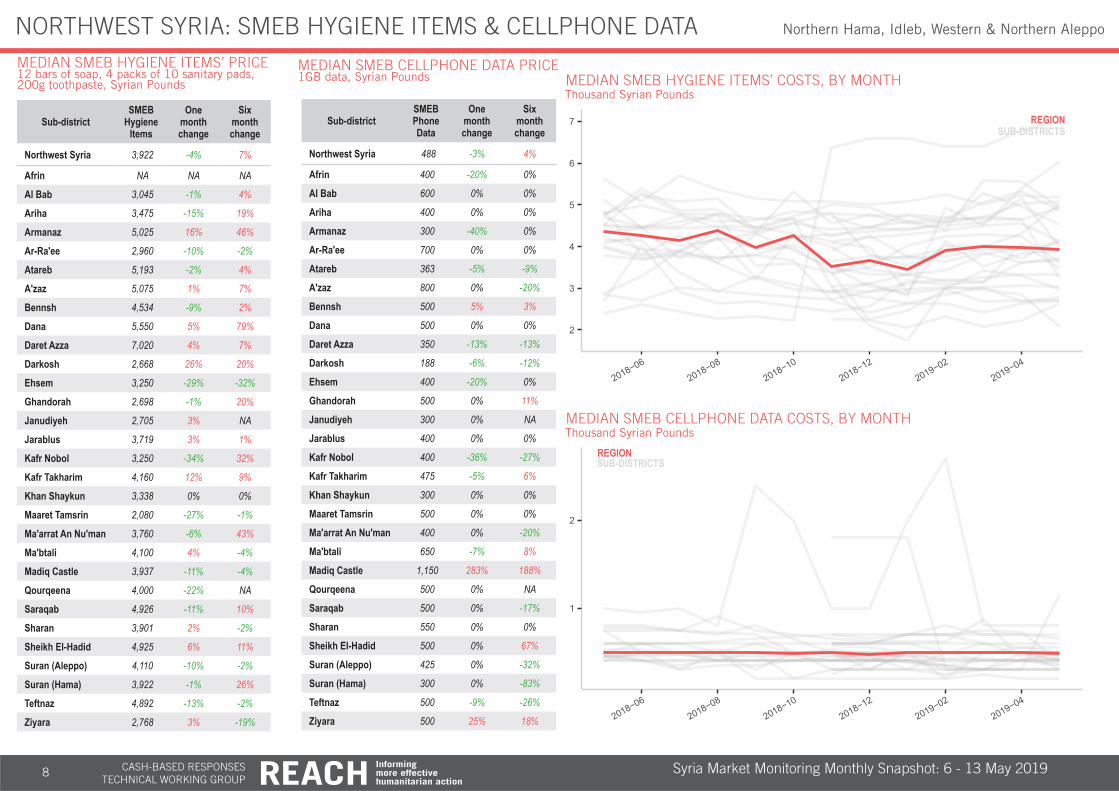
Escalation of the conflict impacting prices Since late January, the ongoing conflict in southern Idleb and northern Hama has continued to escalate, impacting civilians and increasing displacement towards safer areas in the northwest. Displacement movements have affected price trends as observed from the previous months, increasing prices in host areas and decreasing in areas seeing a departure of civilians. Some sub-districts experiencing heavy conflict reported a sharp increase in specific items. For example, cellphone data prices spiked in Madiq Castle sub-district (from 300 SYP in April to 1,150 SYP in May).
SUB-DISTRICTS WITH INCOMPLETE SMEBS IN MAY
SUB-DISTRICT
MISSING ITEMS
Afrin
Jarablus
Toothpaste
Water Trucking
Khan Shaykun Water Trucking and Chicken
Note: Lack of data for a SMEB item does not imply a shortage.
Northern Hama, Idleb, Western & Northern Aleppo

3Syria Market Monitoring Monthly Snapshot: 6 - 13 May 2019 CASH-BASED RESPONSES TECHNICAL WORKING GROUP
NORTHWEST SYRIA: SMEB TRENDS
SMEB COST: ONE MONTH & SIX MONTHS TREND
Northern Hama, Idleb, Western & Northern Aleppo

4 Syria Market Monitoring Monthly Snapshot: 6 - 13 May 2019CASH-BASED RESPONSES TECHNICAL WORKING GROUP
Sub-districtSMEB FoodItems
One month change
Six month change
Northwest Syria 46,846 0% 19%
Afrin 45,893 3% NA
Al Bab 46,325 -2% 20%
Ariha 43,879 -4% 11%
Armanaz 49,407 13% 43%
Ar-Ra'ee 40,960 -3% 13%
Atareb 44,694 -6% 7%
A'zaz 47,550 1% 9%
Bennsh 48,473 4% 18%
Dana 48,990 1% 6%
Daret Azza 48,866 -2% 4%
Darkosh 45,138 -1% 13%
Ehsem 48,520 2% 17%
Ghandorah 44,415 1% 21%
Janudiyeh 46,846 -1% NA
Jarablus 48,903 4% 15%
Kafr Nobol 49,075 9% 28%
Kafr Takharim 48,800 0% 20%
Khan Shaykun NA NA NA
Maaret Tamsrin 41,322 -1% 10%
Ma'arrat An Nu'man 45,213 0% 11%
Ma'btali 50,153 -2% 7%
Madiq Castle 42,555 -8% 10%
Qourqeena 42,370 3% NA
Saraqab 46,949 -1% 23%
Sharan 48,438 2% 25%
Sheikh El-Hadid 52,350 4% 11%
Suran (Aleppo) 49,536 -4% 12%
Suran (Hama) 40,186 -9% 6%
Teftnaz 45,545 -7% 20%
Ziyara 39,771 -2% 8%
MEDIAN SMEB FOOD ITEMS’ PRICESee Page 1, Syrian Pounds
Sub-districtSMEB
Cooking Fuel
One month change
Six month change
Northwest Syria 7,500 0% 8%
Afrin 8,750 17% 40%
Al Bab 7,500 0% 0%
Ariha 8,125 8% 8%
Armanaz 7,500 0% 9%
Ar-Ra'ee 7,000 2% 12%
Atareb 7,438 0% -1%
A'zaz 8,125 8% 18%
Bennsh 7,750 3% 3%
Dana 8,125 8% 8%
Daret Azza 8,125 8% 16%
Darkosh 7,500 0% 0%
Ehsem 7,500 1% 4%
Ghandorah 7,500 0% 0%
Janudiyeh 7,500 0% NA
Jarablus 6,875 10% 0%
Kafr Nobol 7,500 0% 12%
Kafr Takharim 7,500 0% 9%
Khan Shaykun 7,500 -8% 0%
Maaret Tamsrin 7,500 0% 0%
Ma'arrat An Nu'man 8,125 0% 18%
Ma'btali 8,750 0% 17%
Madiq Castle 6,875 -4% -8%
Qourqeena 7,500 0% NA
Saraqab 7,500 0% 9%
Sharan 8,125 8% 18%
Sheikh El-Hadid 8,125 8% 30%
Suran (Aleppo) 7,500 3% 7%
Suran (Hama) 6,750 -2% 8%
Teftnaz 7,500 -8% 9%
Ziyara 6,500 -6% -5%
MEDIAN SMEB COOKING FUEL PRICEKerosene 25L, Syrian Pounds
NORTHWEST SYRIA: SMEB FOOD ITEMS & SMEB COOKING FUEL
MEDIAN SMEB FOOD COSTS, BY MONTHRegion (red) and Sub-districts (grey),Thousand Syrian Pounds
MEDIAN SMEB COOKING FUEL COSTS, BY MONTHRegion (red) and Sub-districts (grey),Thousand Syrian Pounds
30
35
40
45
50
2018−0
6201
8−08
2018−1
0201
8−12
2019−0
2201
9−04
5
6
7
8
2018−0
6201
8−08
2018−1
0201
8−12
2019−0
2201
9−04
REGIONSUB-DISTRICTS
REGIONSUB-DISTRICTS
Northern Hama, Idleb, Western & Northern Aleppo

5Syria Market Monitoring Monthly Snapshot: 6 - 13 May 2019 CASH-BASED RESPONSES TECHNICAL WORKING GROUP
NORTHWEST SYRIA: SMEB FOOD ITEMS & SMEB COOKING FUEL
SMEB FOOD ITEMS’ COSTSub-districts & Communities, Syrian Pounds
SMEB COOKING FUEL COSTSub-districts & Communities, Syrian Pounds
Northern Hama, Idleb, Western & Northern Aleppo
6 Syria Market Monitoring Monthly Snapshot: 6 - 13 May 2019CASH-BASED RESPONSES TECHNICAL WORKING GROUP
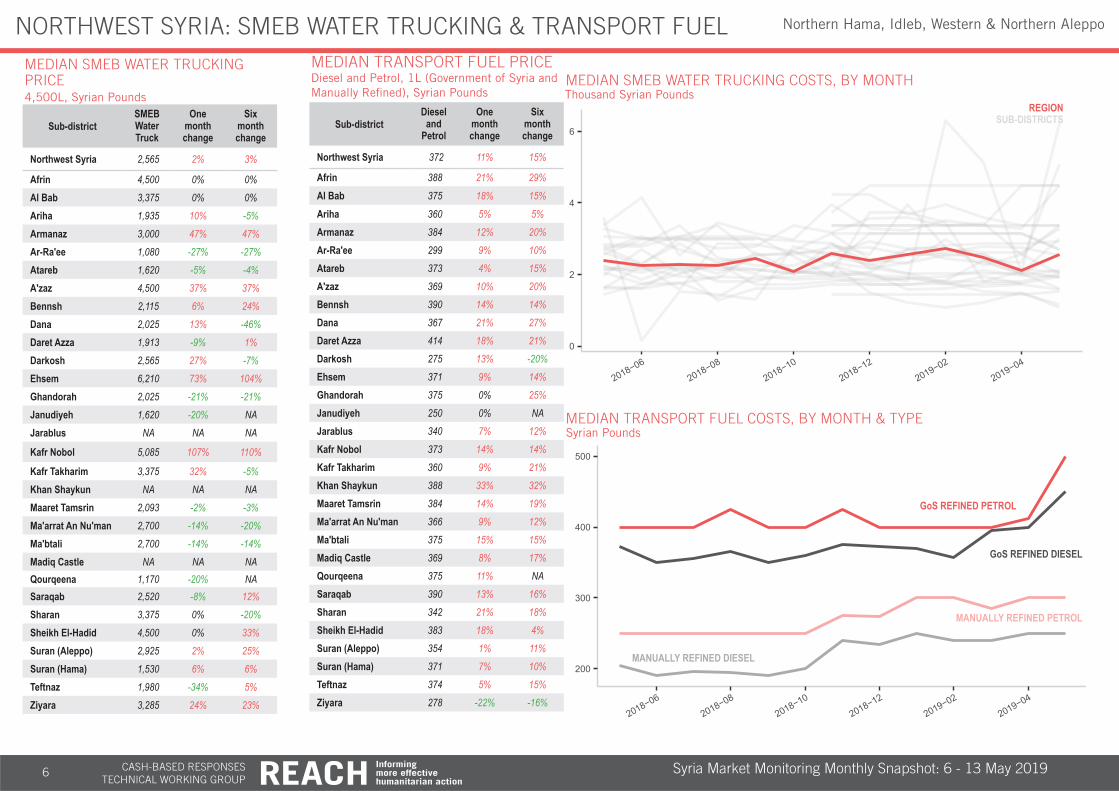
NORTHWEST SYRIA: SMEB WATER TRUCKING & TRANSPORT FUELMEDIAN TRANSPORT FUEL PRICEDiesel and Petrol, 1L (Government of Syria and Manually Refined), Syrian Pounds
Sub-districtDiesel
and Petrol
One month change
Six month change
Northwest Syria 372 11% 15%
Afrin 388 21% 29%
Al Bab 375 18% 15%
Ariha 360 5% 5%
Armanaz 384 12% 20%
Ar-Ra'ee 299 9% 10%
Atareb 373 4% 15%
A'zaz 369 10% 20%
Bennsh 390 14% 14%
Dana 367 21% 27%
Daret Azza 414 18% 21%
Darkosh 275 13% -20%
Ehsem 371 9% 14%
Ghandorah 375 0% 25%
Janudiyeh 250 0% NA
Jarablus 340 7% 12%
Kafr Nobol 373 14% 14%
Kafr Takharim 360 9% 21%
Khan Shaykun 388 33% 32%
Maaret Tamsrin 384 14% 19%
Ma'arrat An Nu'man 366 9% 12%
Ma'btali 375 15% 15%
Madiq Castle 369 8% 17%
Qourqeena 375 11% NA
Saraqab 390 13% 16%
Sharan 342 21% 18%
Sheikh El-Hadid 383 18% 4%
Suran (Aleppo) 354 1% 11%
Suran (Hama) 371 7% 10%
Teftnaz 374 5% 15%
Ziyara 278 -22% -16%
MEDIAN TRANSPORT FUEL COSTS, BY MONTH & TYPESyrian Pounds
Sub-districtSMEB Water Truck
One month change
Six month change
Northwest Syria 2,565 2% 3%
Afrin 4,500 0% 0%
Al Bab 3,375 0% 0%
Ariha 1,935 10% -5%
Armanaz 3,000 47% 47%
Ar-Ra'ee 1,080 -27% -27%
Atareb 1,620 -5% -4%
A'zaz 4,500 37% 37%
Bennsh 2,115 6% 24%
Dana 2,025 13% -46%
Daret Azza 1,913 -9% 1%
Darkosh 2,565 27% -7%
Ehsem 6,210 73% 104%
Ghandorah 2,025 -21% -21%
Janudiyeh 1,620 -20% NA
Jarablus NA NA NA
Kafr Nobol 5,085 107% 110%
Kafr Takharim 3,375 32% -5%
Khan Shaykun NA NA NA
Maaret Tamsrin 2,093 -2% -3%
Ma'arrat An Nu'man 2,700 -14% -20%
Ma'btali 2,700 -14% -14%
Madiq Castle NA NA NAQourqeena 1,170 -20% NASaraqab 2,520 -8% 12%
Sharan 3,375 0% -20%
Sheikh El-Hadid 4,500 0% 33%
Suran (Aleppo) 2,925 2% 25%
Suran (Hama) 1,530 6% 6%
Teftnaz 1,980 -34% 5%
Ziyara 3,285 24% 23%
MEDIAN SMEB WATER TRUCKING COSTS, BY MONTHThousand Syrian Pounds
0
2
4
6
2018−0
6201
8−08
2018−1
0201
8−12
2019−0
2201
9−04
200
300
400
500
2018−0
6201
8−08
2018−1
0201
8−12
2019−0
2201
9−04
GoS REFINED PETROL
GoS REFINED DIESEL
MANUALLY REFINED DIESEL
MANUALLY REFINED PETROL
REGIONSUB-DISTRICTS
Northern Hama, Idleb, Western & Northern Aleppo
MEDIAN SMEB WATER TRUCKING PRICE 4,500L, Syrian Pounds
7Syria Market Monitoring Monthly Snapshot: 6 - 13 May 2019 CASH-BASED RESPONSES TECHNICAL WORKING GROUP
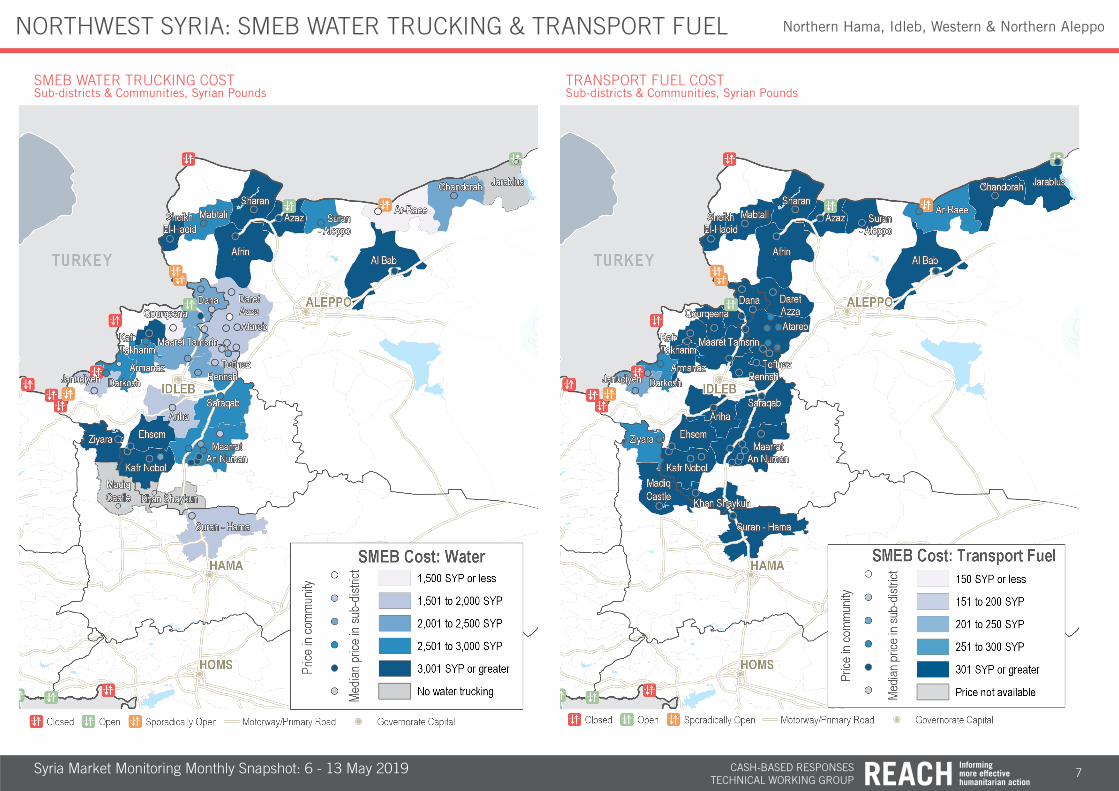
NORTHWEST SYRIA: SMEB WATER TRUCKING & TRANSPORT FUEL
SMEB WATER TRUCKING COSTSub-districts & Communities, Syrian Pounds
TRANSPORT FUEL COSTSub-districts & Communities, Syrian Pounds
Northern Hama, Idleb, Western & Northern Aleppo
8 Syria Market Monitoring Monthly Snapshot: 6 - 13 May 2019CASH-BASED RESPONSES TECHNICAL WORKING GROUP
NORTHWEST SYRIA: SMEB HYGIENE ITEMS & CELLPHONE DATA
MEDIAN SMEB CELLPHONE DATA COSTS, BY MONTHThousand Syrian Pounds
1
2
2018−0
6201
8−08
2018−1
0201
8−12
2019−0
2201
9−04
Sub-districtSMEB
HygieneItems
One month change
Six month change
Northwest Syria 3,922 -4% 7%
Afrin NA NA NA
Al Bab 3,045 -1% 4%
Ariha 3,475 -15% 19%
Armanaz 5,025 16% 46%
Ar-Ra'ee 2,960 -10% -2%
Atareb 5,193 -2% 4%
A'zaz 5,075 1% 7%
Bennsh 4,534 -9% 2%
Dana 5,550 5% 79%
Daret Azza 7,020 4% 7%
Darkosh 2,668 26% 20%
Ehsem 3,250 -29% -32%
Ghandorah 2,698 -1% 20%
Janudiyeh 2,705 3% NA
Jarablus 3,719 3% 1%
Kafr Nobol 3,250 -34% 32%
Kafr Takharim 4,160 12% 9%
Khan Shaykun 3,338 0% 0%
Maaret Tamsrin 2,080 -27% -1%
Ma'arrat An Nu'man 3,760 -6% 43%
Ma'btali 4,100 4% -4%
Madiq Castle 3,937 -11% -4%
Qourqeena 4,000 -22% NA
Saraqab 4,926 -11% 10%
Sharan 3,901 2% -2%
Sheikh El-Hadid 4,925 6% 11%
Suran (Aleppo) 4,110 -10% -2%
Suran (Hama) 3,922 -1% 26%
Teftnaz 4,892 -13% -2%
Ziyara 2,768 3% -19%
MEDIAN SMEB HYGIENE ITEMS’ PRICE12 bars of soap, 4 packs of 10 sanitary pads, 200g toothpaste, Syrian Pounds MEDIAN SMEB HYGIENE ITEMS’ COSTS, BY MONTH
Thousand Syrian Pounds
2
3
4
5
6
7
2018−0
6201
8−08
2018−1
0201
8−12
2019−0
2201
9−04
Sub-districtSMEB Phone Data
One month change
Six month change
Northwest Syria 488 -3% 4%
Afrin 400 -20% 0%
Al Bab 600 0% 0%
Ariha 400 0% 0%
Armanaz 300 -40% 0%
Ar-Ra'ee 700 0% 0%
Atareb 363 -5% -9%
A'zaz 800 0% -20%
Bennsh 500 5% 3%
Dana 500 0% 0%
Daret Azza 350 -13% -13%
Darkosh 188 -6% -12%
Ehsem 400 -20% 0%
Ghandorah 500 0% 11%
Janudiyeh 300 0% NA
Jarablus 400 0% 0%
Kafr Nobol 400 -36% -27%
Kafr Takharim 475 -5% 6%
Khan Shaykun 300 0% 0%
Maaret Tamsrin 500 0% 0%
Ma'arrat An Nu'man 400 0% -20%
Ma'btali 650 -7% 8%
Madiq Castle 1,150 283% 188%
Qourqeena 500 0% NA
Saraqab 500 0% -17%
Sharan 550 0% 0%
Sheikh El-Hadid 500 0% 67%
Suran (Aleppo) 425 0% -32%
Suran (Hama) 300 0% -83%
Teftnaz 500 -9% -26%
Ziyara 500 25% 18%
MEDIAN SMEB CELLPHONE DATA PRICE1GB data, Syrian Pounds
REGIONSUB-DISTRICTS
REGIONSUB-DISTRICTS
Northern Hama, Idleb, Western & Northern Aleppo

9Syria Market Monitoring Monthly Snapshot: 6 - 13 May 2019 CASH-BASED RESPONSES TECHNICAL WORKING GROUP
NORTHWEST SYRIA: SMEB HYGIENE ITEMS & CELLPHONE DATA
SMEB HYGIENE ITEMS’ COSTSub-districts & Communities, Syrian Pounds
SMEB CELLPHONE DATA COSTSub-districts & Communities, Syrian Pounds
Northern Hama, Idleb, Western & Northern Aleppo
10 Syria Market Monitoring Monthly Snapshot: 6 - 13 May 2019CASH-BASED RESPONSES TECHNICAL WORKING GROUP
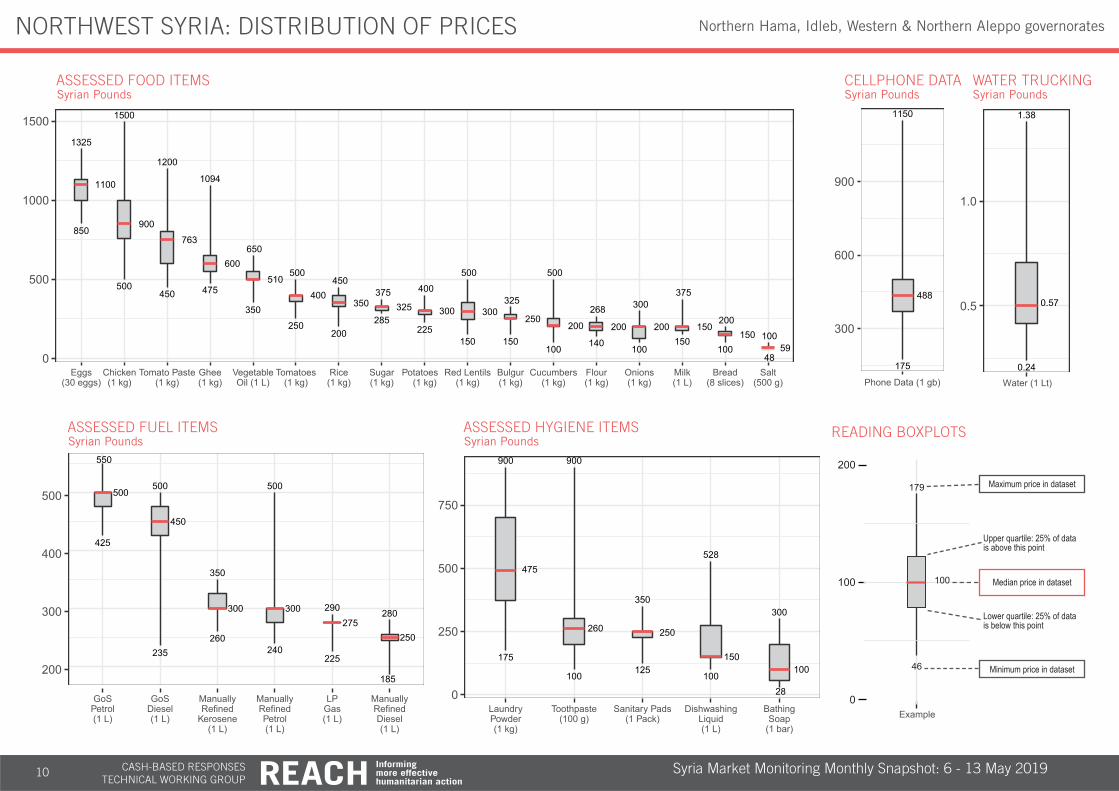
NORTHWEST SYRIA: DISTRIBUTION OF PRICES
WATER TRUCKINGSyrian Pounds
ASSESSED FOOD ITEMSSyrian Pounds
ASSESSED FUEL ITEMSSyrian Pounds
ASSESSED HYGIENE ITEMSSyrian Pounds
425
235260
240225
185
500
450
300 300275
250
550
500
350
500
290 280
200
300
400
500
GoSPetrol(1 L)
GoSDiesel(1 L)
ManuallyRefined
Kerosene(1 L)
ManuallyRefinedPetrol(1 L)
LPGas(1 L)
ManuallyRefinedDiesel(1 L)
175
100125
100 28
475
260 250
150100
900 900
350
528
300
0
250
500
750
LaundryPowder(1 kg)
Toothpaste(100 g)
Sanitary Pads(1 Pack)
DishwashingLiquid(1 L)
BathingSoap
(1 bar)
100
READING BOXPLOTS
0
200
46
179 Maximum price in dataset
Upper quartile: 25% of data is above this point
Minimum price in dataset
Lower quartile: 25% of data is below this point
Median price in dataset100
850
500450 475
350
250200
285225
150 150100
140100
150100
48
1100
900
763
600
510
400 350 325 300 300
250 200 200 200 150
150 59
1325
1500
1200
1094
650
500 450
375 400
500
325
500
268 300 375
200
100
0
500
1000
1500
Eggs(30 eggs)
Chicken(1 kg)
Tomato Paste(1 kg)
Ghee(1 kg)
VegetableOil (1 L)
Tomatoes(1 kg)
Rice(1 kg)
Sugar(1 kg)
Potatoes(1 kg)
Red Lentils(1 kg)
Bulgur(1 kg)
Cucumbers(1 kg)
Flour(1 kg)
Onions(1 kg)
Milk(1 L)
Bread(8 slices)
Salt(500 g)
175
488
1150
300
600
900
Phone Data (1 gb)0.24
0.57
1.38
0.5
1.0
Water (1 Lt)
Example
CELLPHONE DATA Syrian Pounds
Northern Hama, Idleb, Western & Northern Aleppo governorates
11Syria Market Monitoring Monthly Snapshot: 6 - 13 May 2019 CASH-BASED RESPONSES TECHNICAL WORKING GROUP
APPENDIX AND METHODOLOGY
CHALLENGES AND LIMITATIONSAs the Syria Market Monitoring Exercise currently includes 14 partners based in 2 hubs, achieving a consistent approach is inherently challenging. Participating organisations are therefore requested to adopt harmonised data collection methodologies and tools to ensure that the data uploaded is as accurate as possible.Confirming commodity shortages in certain communities was difficult due to a lack of information about general market availability. When follow-ups were unable to confirm these shortages, this is stated in the text.Because this exercise collects data directly from vendors and because it relies on partner organizations for its wide coverage, the exercise may lose coverage sporadically or for longer periods of time owing to challenges in accessing locations or due to loss in the shared data collection capacity of the project. This impacts the ability to report on trends, as can be seen in the line graphs and ‘NA’ values in the tables.
CHANGES TO COVERAGE Given security and access constraints in the south of Syria, data collection has been unable to take place since July 2018. Due to access issues and an escalation of conflict, coverage was lost in Eastern Ghouta in March 2018.
CALCULATING ‘MEDIAN CHEAPEST PRICE’This figure is calculated by taking the median of the minimum-reported prices of a region’s sub-districts. In turn, the minimum-reported prices for each sub-district were taken from the median of the minimum-reported prices of the constituent towns assessed.
CALCULATING SURVIVAL MINIMUM EXPENDITURE BASKET (SMEB) COSTSThe cost of a SMEB is calculated for each assessed sub-district by calculating the median cheapest price of each SMEB commodity in that sub-district, then multiplying these medians by the number of units that an average Syrian household requires to purchase in a month. The composition of the SMEB can be found on page 1. SMEB vegetables includes potatoes, tomatoes, onions and cucumbers.
WHAT IS THE CASH-BASED RESPONSES TECHNICAL WORKING GROUP?The Cash-Based Responses Technical Working Group (CBR–TWG) was established in May 2014 to analyse the impact of the ongoing conflict on markets in Syria and guide the implementation of humanitarian cash and voucher programmes within those markets. REACH and the CBR–TWG have been partners on the Syria Market Monitoring Exercise since early 2015. Since February 2017, the exercise expanded coverage into the south, bringing monthly market assessments to communities in Damascus, Rural Damascus, Dar’a and Quneitra governorates. However, we have since lost coverage in the south of Syria.
ABOUT REACH REACH is a joint initiative of two international non-governmental organizations — ACTED and IMPACT Initiatives — and the UN Operational Satellite Applications Programme (UNOSAT). REACH facilitates the development of information tools and products that enhance the capacity of aid actors to make evidence-based decisions in emergency, recovery and development contexts. The methodologies used by REACH include primary data collection and in-depth analysis, and all activities are conducted through inter-agency aid coordination mechanisms. REACH is a joint initiative of IMPACT Initiatives, ACTED and the United Nations Institute for Training and Research - Operational Satellite Applications Programme (UNITAR-UNOSAT). For more information please visit our website: www.reach-initiative.org. You can contact us directly at: [email protected] and follow us on Twitter @REACH_info
To be included in the Syria Market Monitoring Exercise, markets must be permanent in nature, large enough to support at least two wholesalers, and diverse enough to provide a sufficient variety of goods and commodities. The shops surveyed within each market must be housed in permanent structures and must sell certain items to be eligible for inclusion. Participating organisations train their enumerators on the Market Monitoring methodology and data collection tools using standard training materials developed by REACH. Each enumerator aims to assess three to five shops of each type in the main market in their assigned sub-district, using surveys to collect information about prices, current product inventory and the time needed to replace current stocks. In sub-districts where direct
surveying by enumerators is not possible, such as Deir-ez-Zor, data collection is conducted remotely through key informants such as shop owners, suppliers and consumers.A survey form is deployed on KoBo each month to capture price and stock information from different types of establishments, including grocery stores, fuel traders, currency exchange shops, water trucking services and mobile phone shops, among others. Nearly all participating partners submit their data to these KoBo forms, using the KoBoCollect Android app to upload data. A small number of partners, by prior permission, collect data using fully harmonised data collection tools deployed on other platforms, then
submit their raw data to REACH for standardisation, compilation and cleaning.Following data collection, REACH compiles and cleans all partners’ data, normalising prices and cross-checking outliers. The cleaned data is then analysed by SMEB costs, components of the SMEB, and by commodities. These trends are observed at the sub-district-level and, when possible, at the community-level. Prices are divided into quartiles and boxplots are created to help CBR–TWG members understand the distribution of prices. To illustrate local variations in prices and availability, REACH uses the collected data to map the price of the SMEB in each sub-district and adds illustrations of surrounding border crossings, with data sourced from OCHA. In addition,
each SMEB component costs and transport fuel prices are graphed to visualize trends over time. The cleaned datasets are available on the REACH Resource Centre and are distributed to all participating partners, as well as to interested clusters and the broader humanitarian community.
METHODOLOGY