Synthesis, structural and optical properties of gold ...
11
ORIGINAL ARTICLE Synthesis, structural and optical properties of gold nanoparticle-graphene-selenocysteine composite bismuth ultrathin film electrode and its application to Pb(II) and Cd(II) determination Ahmed Farouk Al-Hossainy a, * , A.A.I. Abd-Elmageed b , Ahmed Th.A. Ibrahim c a Chemistry Department, Faculty of Science – New Valley, Assiut University, 71516 Assiut, Egypt b Physics Department, Faculty of Science – New Valley, Assiut University, 71516 Assiut, Egypt c Zoology Department, Faculty of Science – New Valley, Assiut University, 71516 Assiut, Egypt Received 17 April 2015; accepted 13 June 2015 KEYWORDS Gold nanoparticle-graphene- selenocysteine; Bismuth ultrathin film glassy carbon electrode; Optical properties; Stripping voltammetry and environmental samples Abstract The transparency of the gold nanoparticle-graphene-selenocysteine composite is 90–98% in the visible range. The optical and transport energy gaps were estimated as 1.15 eV and 2.25 eV respectively. A new electrochemical method using gold nanoparticle-graphene-selenocysteine mod- ified bismuth film glassy carbon electrode, was applied to improve the performance of the simulta- neous determining trace cadmium and lead in square wave anodic stripping voltammetry with a detection limit of 0.08, and 0.05 ppb for metal ions, with a high correlation coefficient of 0.9811 and 0.99, respectively. Finally, the gold nanoparticle-graphene-selenocysteine modified bismuth film glassy carbon electrode was successfully applied for the determination of cadmium, and lead in environmental samples and the results were successful. ª 2015 The Authors. Production and hosting by Elsevier B.V. on behalf of King Saud University. This is an open access article under the CC BY-NC-ND license (http://creativecommons.org/licenses/by-nc-nd/4.0/). 1. Introduction Recently, graphene/graphene oxide has been considered as ‘‘ris- ing star’’ carbon material because of superior mechanical strength (Freitag et al., 2009 and Vinod et al., 2015) and high heat conductance. Graphene used in electrochemistry is pro- duced by a chemical exfoliation method from the reduction of graphene oxide that is formed by using a Hummers method. However, because of van der Waals and p–p stacking interac- tions among individual graphene sheets, the as-reduced graphene sheets from graphene oxide tend to form irreversible * Corresponding author at: Chemistry Department, Northern Border University, Faculty of Science, Arar, Saudi Arabia. Tel.: +20 (88)2294980 (home), +20 1004688146, +966 563935228 (mobile). E-mail address: [email protected] (A.F. Al-Hossainy). Peer review under responsibility of King Saud University. Production and hosting by Elsevier Arabian Journal of Chemistry (2015) xxx, xxx–xxx King Saud University Arabian Journal of Chemistry www.ksu.edu.sa www.sciencedirect.com http://dx.doi.org/10.1016/j.arabjc.2015.06.020 1878-5352 ª 2015 The Authors. Production and hosting by Elsevier B.V. on behalf of King Saud University. This is an open access article under the CC BY-NC-ND license (http://creativecommons.org/licenses/by-nc-nd/4.0/). Please cite this article in press as: Al-Hossainy, A.F. et al., Synthesis, structural and optical properties of gold nanoparticle-graphene-selenocysteine composite bis- muth ultrathin film electrode and its application to Pb(II) and Cd(II) determination. Arabian Journal of Chemistry (2015), http://dx.doi.org/10.1016/ j.arabjc.2015.06.020
Transcript of Synthesis, structural and optical properties of gold ...
Arabian Journal of Chemistry (2015) xxx, xxx–xxx
King Saud University
Arabian Journal of Chemistry
www.ksu.edu.sawww.sciencedirect.com
ORIGINAL ARTICLE
Synthesis, structural and optical properties of gold
nanoparticle-graphene-selenocysteine composite
bismuth ultrathin film electrode and its application
to Pb(II) and Cd(II) determination
* Corresponding author at: Chemistry Department, Northern
Border University, Faculty of Science, Arar, Saudi Arabia. Tel.:
+20 (88)2294980 (home), +20 1004688146, +966 563935228
(mobile).
E-mail address: [email protected] (A.F. Al-Hossainy).
Peer review under responsibility of King Saud University.
Production and hosting by Elsevier
http://dx.doi.org/10.1016/j.arabjc.2015.06.0201878-5352 ª 2015 The Authors. Production and hosting by Elsevier B.V. on behalf of King Saud University.This is an open access article under the CC BY-NC-ND license (http://creativecommons.org/licenses/by-nc-nd/4.0/).
Please cite this article in press as: Al-Hossainy, A.F. et al., Synthesis, structural and optical properties of gold nanoparticle-graphene-selenocysteine compomuth ultrathin film electrode and its application to Pb(II) and Cd(II) determination. Arabian Journal of Chemistry (2015), http://dx.doi.org/j.arabjc.2015.06.020
Ahmed Farouk Al-Hossainy a,*, A.A.I. Abd-Elmageed b, Ahmed Th.A. Ibrahim c
a Chemistry Department, Faculty of Science – New Valley, Assiut University, 71516 Assiut, Egyptb Physics Department, Faculty of Science – New Valley, Assiut University, 71516 Assiut, Egyptc Zoology Department, Faculty of Science – New Valley, Assiut University, 71516 Assiut, Egypt
Received 17 April 2015; accepted 13 June 2015
KEYWORDS
Gold nanoparticle-graphene-
selenocysteine;
Bismuth ultrathin film glassy
carbon electrode;
Optical properties;
Stripping voltammetry and
environmental samples
Abstract The transparency of the gold nanoparticle-graphene-selenocysteine composite is 90–98%
in the visible range. The optical and transport energy gaps were estimated as 1.15 eV and 2.25 eV
respectively. A new electrochemical method using gold nanoparticle-graphene-selenocysteine mod-
ified bismuth film glassy carbon electrode, was applied to improve the performance of the simulta-
neous determining trace cadmium and lead in square wave anodic stripping voltammetry with a
detection limit of 0.08, and 0.05 ppb for metal ions, with a high correlation coefficient of 0.9811
and 0.99, respectively. Finally, the gold nanoparticle-graphene-selenocysteine modified bismuth film
glassy carbon electrode was successfully applied for the determination of cadmium, and lead in
environmental samples and the results were successful.ª 2015 The Authors. Production and hosting by Elsevier B.V. on behalf of King Saud University. This is an
open access article under the CC BY-NC-ND license (http://creativecommons.org/licenses/by-nc-nd/4.0/).
1. Introduction
Recently, graphene/graphene oxide has been considered as ‘‘ris-
ing star’’ carbon material because of superior mechanicalstrength (Freitag et al., 2009 and Vinod et al., 2015) and highheat conductance. Graphene used in electrochemistry is pro-
duced by a chemical exfoliation method from the reduction ofgraphene oxide that is formed by using a Hummers method.However, because of van der Waals and p–p stacking interac-tions among individual graphene sheets, the as-reduced
graphene sheets from graphene oxide tend to form irreversible
site bis-10.1016/

2 A.F. Al-Hossainy et al.
agglomerates and even restack to form graphite when graphenedispersion solutions are dried (Veerapandian et al., 2012).
In addition, gold-graphene nanoparticles (AuNPs) have
gained considerable attention as labels in electroanalyticalmethods based on affinity reactions, such as immunosensorsand immunoassays. In particular, inorganic semiconductor
sensors and electrodes, which combine square wave anodicstripping voltammetry with porous bismuth thin film electrode(Yasemin et al., 2011 and Mehmet et al., 2014), offer wide
applications in environmental and biological samples. Gold-graphene nanoparticles (AuNPs) have been the most exten-sively studied due to their unique optical, chemical, electrical,and catalytic properties. In addition, AuNPs can provide good
affinity for covalent bonds with biological samples (Mehmetet al., 2014, 2015; Sensors and Actuators B 2014).
On the other hand, bismuth film (BiFE) electrode for the
determination of toxic metals in environmental samples is anenvironmentally friendly electrode with negligible toxicity. Itwas introduced in SWASV method, exhibiting an impressive
electroanalytical performance, which was compared favorablyto its mercury analogue (Sandra et al., 2015). The ability ofBiFE to form intermetallic alloys with different trace heavy
metals, as well as its insensitivity toward dissolved oxygen isjust some of remarkable electrochemical features of bismuth-based electrodes that stay behind their widespread use(Economou, 2005). There were numerous efforts to improve
the sensitivity of the glassy carbon electrode (GCE) workingelectrodes, including the expansion of the sensor surface viathe synthesis of mesoporous bismuth-based materials (Chen
et al., 2013), the enlargement of the substrate electrode surfacebefore modification with bismuth (Zhaomeng et al., 2013) andthe incorporation of micro/nanoparticles of Au-GN-SeCys
nanoparticles (Dandan et al., 2014). Under the optimumexperimental conditions, the SWASV technique was appliedto solid GCE, and on the working electrode surface the intro-
duced Bi(III) ions and target trace heavy elements have beendeposited together via electrochemical reduction to formcoordinate-component alloys of low-temperature melting.The sensitivity of the modified GCE can improve significantly
with strong adsorptive ability toward the metal ions in envi-ronmental samples and facilitate the nucleation of toxic heavyelements during the optimum experimental conditions of
SWASV, without, removal of dissolved oxygen in the mediumfor analysis (Xu et al., 2013). SWASV using chemically modi-fied electrode has been proved to show significant selectivity
toward some amino acids such as, aspartic acid (Jinfen et al.,2012) and cysteine (Wenrong et al., 2001), which have eitherelectrostatic interaction or complexation with metal ions andpromote the preconcentration of the latter on the electrode
surface. The interaction of amino acid with cadmium and leadions in groundwater was investigated by square wave strippingvoltammetry (SWSV) technique, and the adsorption of amino
acids on modifying porous gold electrodes was studied by elec-trochemical reductive desorption in 0.5 M potassium hydrox-ide (Tribidasari et al., 2015). Detection limit of toxic metals’
concentrations (i.e., the ratio of amino acids to bound cad-mium and lead ions are 2:1) represent an attractive featuresof the developed electrochemical sensor. At higher concentra-
tions cadmium or lead metals have been bonding withadsorbed amino acid forming cadmium or lead sulfide on theelectrode surface (Meijiao et al., 2013; Lian et al., 2014 andMetters et al., 2014).
Please cite this article in press as: Al-Hossainy, A.F. et al., Synthesis, structural andmuth ultrathin film electrode and its application to Pb(II) and Cd(II) deterj.arabjc.2015.06.020
The objective of this work was to propose a new nanocom-
posite containing gold-graphene nanoparticles (AuNPs) and
selenocysteine was prepared and characterized by UV–vis
spectrophotometry, Fourier transform infrared (FT-IR) spec-
troscopy spectra, X-ray diffraction (XRD), and scanning elec-
tron microscopy (SEM). Modified graphene and porous
bismuth film glassy carbon electrodes were induced to a lower
charge-transfer resistance than GCE. The surface area of GCE
was enlarged resulting in comparatively wide electrochemical
potential window and increases the loading amount of com-
plex with amino acids. The formation complexes between the
carboxyl group in selenocysteine amino acid and porous bis-
muth gold nanoparticles (AuNPs) have been used as the selec-
tive ligand for cadmium and lead ions. In addition, the porous
thin film bismuth has been widely recognized as a powerful
technique for the determination of Cd(II) and Pb(II) ions,
and due to the formation of complex Au-GN-SeCys, the sen-
sitivity of the microsensor has been increasing the sensitive
area of the working electrode. In other words, the bismuth
film-modified Au-GN-SeCys presented an advantageous and
high-performance platform for the sensing of Cd(II) and
Pb(II) in groundwater, soil and Alhagi maurorum plants.
2. Experimental methods
2.1. Preparation of gold nanoparticle-graphene-selenocysteine
composite (Au-GN-SeCys) suspension
Se-(Methyl) selenocysteine hydrochloride (PN M6680) (95%
(TCL) was purchased from Sigma–Aldrich (USA).Monolayer Graphene Powder Chemical method (CAS NO.7440-44-0) was obtained from Nanjing CJNANO Tech Co.,
Ltd. (China). HAuCl4 was obtained from Shanghai ArkinChemical Technology Co., Ltd. (China).
Graphene suspension was prepared by adding 2 mL deion-
ized water to 1.4 mg graphene. A solution of HAuCl4 (0.2 ml,
1%) was added to graphene suspension, and heated to boiling.
Then 0.4 mL, 0.1 mol L�1 trisodium citrate (Na3C6H5O7) was
added to this solution drop by drop under vigorous stirring
for 20 min. The suspension Au-GN composites were separated
by centrifugation and washed with deionized water. 2 mL of
Se-(Methyl) selenocysteine hydrochloride solution was added
to 2 ml of suspension precipitate with stirring for 15 h at room
temperature under nitrogen. Next, the nano-composites were
centrifuged at 1 · 104 rpm for 20 min and washed with deion-
ized water. Next, the Au-GN-SeCys composites were re-
dispersed in 1 mL deionized water and the suspension was
stored in a brown glass bottle at 4 �C for further use. Finally,
the Au-GN-SeCys suspension (3 (L) was dropped on the glassy
carbon electrode surface and allowed to dry at room tempera-
ture. The prepared electrode was marked as an Au-GN-
SeCys/GCE and preserved in a refrigerator at 4 �C before use.
2.2. Experimental procedure
Infrared spectra were recorded on a Perkin–Elmer FT-IR type
1650 spectrophotometer in wavenumber region 4000–400 cm�1. The spectra were recorded as KBr pellets. The absor-bance, the transmittance and reflectance spectra were recorded
by using SHIMADZUUV-3600 UV–vis NIR spectrophotome-ter at room temperature.
optical properties of gold nanoparticle-graphene-selenocysteine composite bis-mination. Arabian Journal of Chemistry (2015), http://dx.doi.org/10.1016/

Synthesis, structural and optical properties of gold nanoparticle-graphene-selenocysteine composite and its application 3
Thin film of Au-GN-SeCys composites was prepared bythermal evaporation technique using a high vacuum coatingunit (Edwards E 306 A, England). The vacuum during the
deposition process is about 1 · 10�4 Pa. The films weredeposited onto clean optical flat glass and quartz substratesfor structural and optical measurements, respectively. These
substrates were carefully cleaned by chromic acid for15 min and then rinsed by deionized water. The Au-GN-SeCys composite was sublimated from quartz crucible heated
gradually by molybdenum boat shaped filament. The deposi-tion rate and the film thickness were measured during theevaporation using a quartz crystal thickness monitor(Model TM-350 MAXTEK, Inc., USA) attached to the coat-
ing system. The grown film thickness of Au-GN-SeCys com-posites is 100 nm.
The square wave anodic stripping voltammetry (SWASV)
measurements (EG&G PAR Model 273A potentiostat with250/270 research electrochemistry software version 4.0, manu-factured by Princeton Applied Research Corporation by using
a glassy carbon electrode (GCE), 3 mm in diameter) were per-formed in a 10 mL electrochemical cell, containing(0.12 mol L�1, pH = 4.8) sodium acetate–acetic acid buffer
solutions (SAB), 275 ppb, Bi(NO3)3. 5H2O, 20 ppb of Cd(II)and Pb(II). Then, the cleaned Au-GN-SeCys/GCE wasimmersed in the 275 ppb of Bi(III) at �1.0 V for 14 min understirring where Bi(III) and the target metals were simultane-
ously deposited on the surface of the electrode. The voltammo-gram was recorded between �1.0 V and �0.4 V by applyingSWASV with a frequency of 15 Hz, an amplitude of 25 mV.
All measurements were performed at room temperature(25 ± 2 �C) in air atmosphere.
2.3. Samples and quality assurance
One gram of each soil sample from S2 and S3 was prepareddirectly in deionized water for one hour. The final filtrate of soil
samples S2 and S3 was transferred into a 100 mL measuringflask. The second filtrate samples S4 and S5 were digested with5 mL of mixed concentrated acid and evaporated to dryness(Benjamin et al., 2013). Also, one gramof eachAlhagi maurorum
plant sample of S6, S7 and S8 after drying and grinding wasdissolved in 5 mL mixed concentrated acid and evaporated todryness. All analytical tools were soaked in 2 M nitric acid,
washed three times with deionized water and finally soaked in0.1 M hydrochloric acid until being ready for use.
Under optimum experimental condition of SWASV
(0.12 mol L�1, pH 4.8 SAB containing 275 ppb Bi(III), deposi-tion potential: �1.00 V, deposition time: 14 min, amplitude:0.025 V, increment potential: 0.004 V) Au-GN-SeCys compos-ites for determining ultra-trace Cd(II) and Pb(II) ions in refer-
ence material (Whole Milk Powder 8435 WMP8435) have beenstudied. The Whole Milk Powder 8435 (WMP8435) from theNational Institute of Standard and Technology in Canada
was analyzed for cadmium (0.46 ppm) and lead (0.46 ppm)metals.
3. Results and discussion
3.1. Characterization of Au-GN-SeCys composites
FT-IR spectra of selenocysteine, have a structure similar tothose of cysteine, but with an atom of selenium taking the
Please cite this article in press as: Al-Hossainy, A.F. et al., Synthesis, structural andmuth ultrathin film electrode and its application to Pb(II) and Cd(II) determj.arabjc.2015.06.020
place of the usual sulfur, forming a selenol group whichis deprotonated at physiological pH. Fig. 1a shows the FT-IR spectra of the cysteine, selenocysteine, Au-GN-SeCys com-
posite and their thin film of Au-GN-SeCys from 400 to4000 cm�1, respectively. The characteristic peaks of cysteinehad a very broad band at 3025–3000 cm�1 corresponding to
the amino group stretching vibration, and the bands at1635–1620 and 1401–1385 cm�1 due to the asymmetric andsymmetric stretching vibration of carboxylic group, respec-
tively. Besides, the stretching bands of the C–N at 1055–1030 cm�1, the stretching band of S–H at 2550 cm�1 was veryweak and the stretching band of Se–H at 2517 cm�1 was verybroad. The above absorption bands could also be found in the
spectrum of Au-GN-SeCys, indicating that the preparednanocomposite was composed of selenocysteine.
The carboxylic groups at the graphene surface were respon-
sible for a previous attachment of Au(III) (HAuCl4) in solu-tion owing to electrostatic interactions. The addition of thereducing agent, citrate ion, to the precursor solution could pro-
mote the subsequent reduction of Au(III), enabling the growthof gold nanoparticles at the graphene surface (Goncalves et al.,2009). It is known that the Se–Au interaction could result in
the disappearance of the band of Se–H at 2517 cm�1 in thespectra of selenocysteine–Au-NPs aggregates (Wang et al.,2008). This band was still observed in the spectra of Au-GN-SeCys, suggesting that most selenocysteine molecules might
be directly immobilized on graphene due to electrostatic inter-action and hydrogen bond.
The thin film X-ray diffraction studies were employed using
an X-ray diffraction (XRD, Philips X’ Pert Pro MRD)advance diffractometer with Cu Ka (k = 1.5418 A) radiation.The thin film Au-GN-SeCys was scanned in the 2 angles from
4� to 80� at a scan rate of 1�/min. Fig. 1b shows the XRD pro-file of the Au-GN-SeCys thin film. The positions of the peakswere found to be in good agreement with the literature data
available of amino acid in JCPDS file no.: 06-230 (OrganicIndex, 2002).
The characteristic peak at 25.285� (2h) corresponds toamino acid. This study confirms the c-phase of amino acid.
The reflection peaks corresponding to different crystal (hk l)planes in the recorded XRD profile were indexed and the dataobtained from the XRD spectrum, such as angle 2h, d value,
hk l, peak intensity, full width half maximum value (FWHM)and size (nm) of every prominent peak in the spectrum aretabulated in Table 1. The sharp and strong peaks in the
XRD profile confirm the good crystallinity of the Au-GN-SeCys thin film. From the XRD data, the lattice parametersof the Au-GN-SeCys thin film have a monoclinic crystalsystem and space group P21/c with lattice parameters:
a=11.705 A, b=14.927 A, c=9.89 A, a=90.00�, b=105.65�and c=90.00� respectively.
The broadening of the X-ray diffraction peak can be attrib-
uted to the contribution of different effects such as broadeningdue to smaller crystallite size (D) and lattice microstrain (e)present in the material. The average crystallite size, D, and e
were calculated using the Scherrer and Williamson-Hall equa-tions as follows:
D ¼ jkb cos h
and � ¼ bcos h4 sin h
� jk4D sin h
ð1Þ
where k is the X-ray wavelength, j is a constant of nearly 0.94,b is the full width at half maximum intensity, FWHM, of the
optical properties of gold nanoparticle-graphene-selenocysteine composite bis-ination. Arabian Journal of Chemistry (2015), http://dx.doi.org/10.1016/

Table 1 XRD data: d-spacing, crystallite size D, FWHM, e-microstrain and d dislocation density.
Data/(hk l) Selenocysteine Au GN
(101) (110) (200) (102) (201) (111) (200) (220) (311) (110)
d-spacing (A) 2.8472 3.4797 1.5367 1.5786 1.4380 1.6276 1.3458 1.6581 1.2547 1.4258
2h 21.965 25.285 29.448 36.125 39.437 38.484 44.485 65.363 78.851 47.765
Intensity 1438.0 2007.0 842.00 942.00 823.00 1542.0 796.00 823.00 391.00 796.00
FWHM 0.1247 0.1687 0.1548 0.1483 0.1469 0.1378 0.1158 0.1592 0.1115 0.1119
D (nm) 65.319 48.362 53.105 56.395 57.489 61.111 74.178 59.335 92.613 77.705
e microstrain 0.1307 0.1536 0.1205 0.0929 0.0839 0.0807 0.0579 0.0507 0.0277 0.0517
d · 10�4 (nm)�2 2.3441 4.2762 3.5459 3.1446 3.0257 2.6776 1.8174 2.8404 1.1659 1.6562
Figure 1 FT-IR spectrum (a), XRD (b), and (c) SEM image of thin film Au-GN-SeCys composite.
4 A.F. Al-Hossainy et al.
broadening peaks of Au-GN-SeCys thin film and h is the angu-lar position peak. From Eq. (1), it is clear that, as b increasesthe crystallite size D decreases. It is observed that, the meancrystallite size can be calculated to be 64.56 nm. The values
of interplanar distance (d), microstrain (e), and the crystallitesize (D), were calculated using Eq. (1) for the main ten peaksobserved in the XRD pattern for the Au-GN-SeCys thin film
which are listed in Table 1. Also, the dislocation density, d,of the synthesis films is given by Williamson and Smallman’sequation: d = f/D2, where f is a factor equals unity giving a
minimum dislocation density. The calculated values of d aregiven in Table 1.
The morphology and chemical composition of the film Au-
GN-SeCys composite surface were investigated and verified byscanning electron microscopy (SEM) image, as shown inFig. 1c. From Fig. 1c, it can be observed that large amounts
Please cite this article in press as: Al-Hossainy, A.F. et al., Synthesis, structural andmuth ultrathin film electrode and its application to Pb(II) and Cd(II) deterj.arabjc.2015.06.020
of gold nanoparticles were well-dispersed on the surface of theGCE.
The spectral distribution of A(k), T(k) and R(k) of Au-GN-SeCys nanostructure thin film measured at the normal inci-dence in the wavelength range 250–1200 nm for a thickness
of 100 nm is illustrated in Fig. 2 at room temperature. Theabsorption coefficient (a), absorption index (k), and the refrac-tive index (n), were calculated by the following relationships
(El-Nahass et al., 2003, 2012):
a ¼ 1
dlnð1� RÞ2
2Tþ
ffiffiffiffiffiffiffiffiffiffiffiffiffiffiffiffiffiffiffiffiffiffiffiffiffiffiffiffiffiR2 þ ð1� RÞ2
4T2
s24
35
ffi 2:3026:A
t
� �where t is the thickness of thin film ð2Þ
optical properties of gold nanoparticle-graphene-selenocysteine composite bis-mination. Arabian Journal of Chemistry (2015), http://dx.doi.org/10.1016/
400 600 800 1000 12000.0
0.2
0.4
0.6
0.8
1.0
1.2
1.4
Inte
nsity
(T
and
R)/1
00
Reflactance
Transmittance
Absorbanc
Inte
nsity
(ab
srob
ance
)
Wavelenght (λ nm)
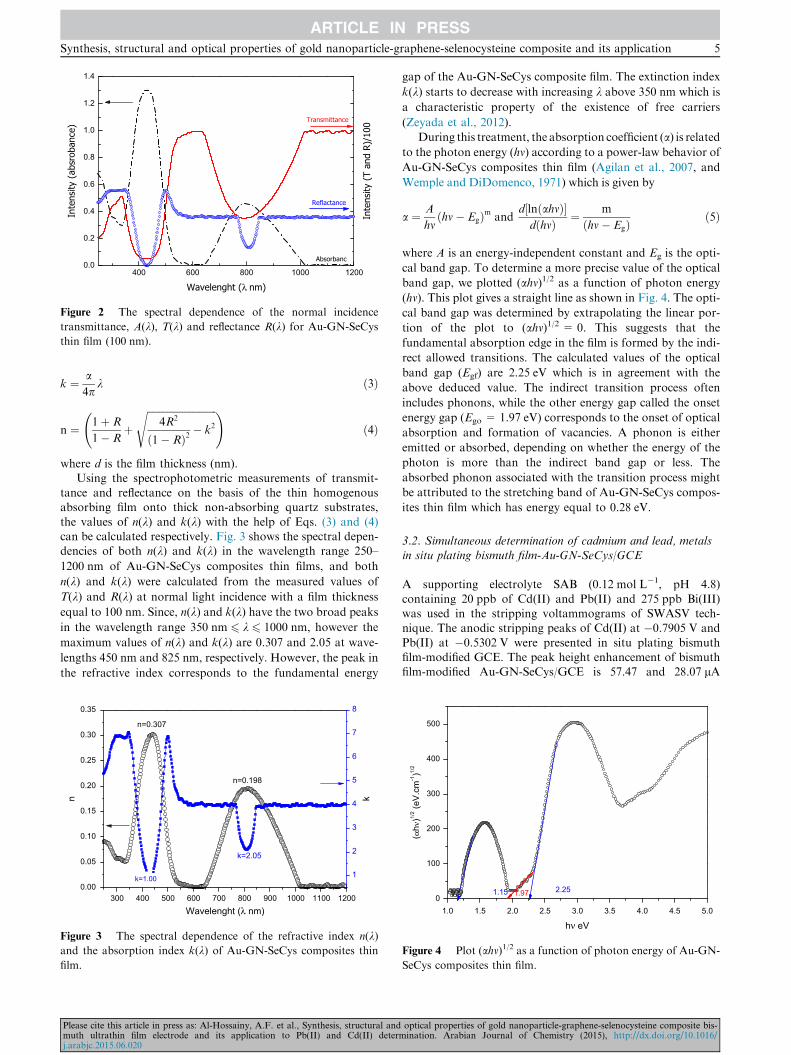
Figure 2 The spectral dependence of the normal incidence
transmittance, A(k), T(k) and reflectance R(k) for Au-GN-SeCys
thin film (100 nm).
Synthesis, structural and optical properties of gold nanoparticle-graphene-selenocysteine composite and its application 5
k ¼ a4p
k ð3Þ
n ¼ 1þ R
1� Rþ
ffiffiffiffiffiffiffiffiffiffiffiffiffiffiffiffiffiffiffiffiffiffiffiffiffiffiffiffi4R2
ð1� RÞ2� k2
s !ð4Þ
where d is the film thickness (nm).Using the spectrophotometric measurements of transmit-
tance and reflectance on the basis of the thin homogenousabsorbing film onto thick non-absorbing quartz substrates,
the values of n(k) and k(k) with the help of Eqs. (3) and (4)can be calculated respectively. Fig. 3 shows the spectral depen-dencies of both n(k) and k(k) in the wavelength range 250–
1200 nm of Au-GN-SeCys composites thin films, and both
n(k) and k(k) were calculated from the measured values of
T(k) and R(k) at normal light incidence with a film thickness
equal to 100 nm. Since, n(k) and k(k) have the two broad peaks
in the wavelength range 350 nm 6 k 6 1000 nm, however the
maximum values of n(k) and k(k) are 0.307 and 2.05 at wave-
lengths 450 nm and 825 nm, respectively. However, the peak in
the refractive index corresponds to the fundamental energy
300 400 500 600 700 800 900 1000 1100 12000.00
0.05
0.10
0.15
0.20
0.25
0.30
0.35
k=2.05
k=1.00
n=0.198
n
n=0.307
1
2
3
4
5
6
7
8
k
Wavelenght (λ nm)
Figure 3 The spectral dependence of the refractive index n(k)and the absorption index k(k) of Au-GN-SeCys composites thin
film.
Please cite this article in press as: Al-Hossainy, A.F. et al., Synthesis, structural andmuth ultrathin film electrode and its application to Pb(II) and Cd(II) determj.arabjc.2015.06.020
gap of the Au-GN-SeCys composite film. The extinction index
k(k) starts to decrease with increasing k above 350 nm which is
a characteristic property of the existence of free carriers
(Zeyada et al., 2012).
During this treatment, the absorption coefficient (a) is relatedto the photon energy (hm) according to a power-law behavior of
Au-GN-SeCys composites thin film (Agilan et al., 2007, and
Wemple and DiDomenco, 1971) which is given by
a ¼ A
hmðhm� EgÞm and
d½lnðahmÞ�dðhmÞ ¼ m
ðhm� EgÞð5Þ
where A is an energy-independent constant and Eg is the opti-
cal band gap. To determine a more precise value of the optical
band gap, we plotted (ahm)1/2 as a function of photon energy
(hv). This plot gives a straight line as shown in Fig. 4. The opti-
cal band gap was determined by extrapolating the linear por-
tion of the plot to (ahv)1/2 = 0. This suggests that the
fundamental absorption edge in the film is formed by the indi-
rect allowed transitions. The calculated values of the optical
band gap (Egf) are 2.25 eV which is in agreement with the
above deduced value. The indirect transition process often
includes phonons, while the other energy gap called the onset
energy gap (Ego = 1.97 eV) corresponds to the onset of optical
absorption and formation of vacancies. A phonon is either
emitted or absorbed, depending on whether the energy of the
photon is more than the indirect band gap or less. The
absorbed phonon associated with the transition process might
be attributed to the stretching band of Au-GN-SeCys compos-
ites thin film which has energy equal to 0.28 eV.
3.2. Simultaneous determination of cadmium and lead, metalsin situ plating bismuth film-Au-GN-SeCys/GCE
A supporting electrolyte SAB (0.12 mol L�1, pH 4.8)
containing 20 ppb of Cd(II) and Pb(II) and 275 ppb Bi(III)was used in the stripping voltammograms of SWASV tech-nique. The anodic stripping peaks of Cd(II) at �0.7905 V and
Pb(II) at �0.5302 V were presented in situ plating bismuthfilm-modified GCE. The peak height enhancement of bismuthfilm-modified Au-GN-SeCys/GCE is 57.47 and 28.07 lA
1.0 1.5 2.0 2.5 3.0 3.5 4.0 4.5 5.00
100
200
300
400
500
1.97
(αh ν
)1/2 (e
V.c
m-1)1/
2
hν eV
2.251.15
Figure 4 Plot (ahm)1/2 as a function of photon energy of Au-GN-
SeCys composites thin film.
optical properties of gold nanoparticle-graphene-selenocysteine composite bis-ination. Arabian Journal of Chemistry (2015), http://dx.doi.org/10.1016/

E (V) vs. Ag/AgCl
Figure 5 SWASV curves at GCE, Au-GN/GCE, Au-GN-Cys/
GCE and Au-GN-SeCys/GCE in 0.12 mol L�1, pH 4.8 SAB
containing 20 ppb Cd(II), Pb(II) ions and 275 ppb Bi(III).
Deposition potential: �1.00 V, deposition time: 14 min, ampli-
tude: 0.025 V, increment potential: 0.004 V.
0.00 0.05 0.10 0.15 0.200
5
10
15
20
25
30
35
40
45
50
Conc. selenocysteine/ mol L-1
Cur
rent
i p/ μΑ
Cd(II)
Pb(II)
Figure 6 The plot of cysteine concentration vs. the stripping
peak current of 20 ppb Cd(II) and Pb(II) at Au-GN-SeCys/GCE
in 0.12 mol L�1 pH 4.8 SAB containing 275 ppb Bi(III).
3.6 3.8 4.0 4.2 4.4 4.6 4.8 5.0 5.2 5.4 5.6 5.8
5
10
15
20
25
30
35
40
45
Cd(II)
pH value
Cur
rent
i p/μΑ
Pb(II)
Figure 7 The effect of pH on the stripping peak current of
20 ppb Cd(II) and Pb(II) at Au-GN-SeCys/GCE in 0.12 mol L�1,
pH 4.8 SAB containing 275 ppb Bi(III).
6 A.F. Al-Hossainy et al.
for Cd(II) and Pb(II) six times higher than that of thebismuth film-modified GCE, respectively. Fig. 5 shows theSWASV analytical characteristics of GCE, Au-GN/GCE,
Au-GN-Cys/GCE and Au-GN-SeCys/GCE for Cd(II) andPb(II) determination in reference material (WMP8435).
In the meantime, the peak potentials of Cd(II) and Pb(II)ions on the nanocomposite-modified Au-GN-SeCys/GCE elec-
trode were positively shifted. The improvement in strippingpeak signals of Cd(II) and Pb(II) on Au-GN-SeCys/GCEcan be attributed to three aspects. First, a selenium element
in amino acid is used in biosensor, electronics, semiconductorand stable complexes, which was beneficial to the deposition ofCd(II) and Pb(II) on surface of modified electrode and high-
performance platform of current peak. Second, the specialcharacteristics of graphene on GCE had great role of surfacearea and electric conductivity. Finally, [C6H5O7]
�3 ions
around Au NPs had a high deposition of Cd(II) and Pb(II)on the electrode surface. Our experimental results indicate thatselenocysteine and Au-GN could provide an obvious synergis-tic effect for the deposition of metals since selenocysteine
played an important role in the metal binding.
3.3. Optimization of experimental conditions at the porous thinfilm of Bi(III)/Au-GN-SeCys/GCE
In order to obtain the best voltammetric behavior of the situplating bismuth film-modified Au-GN-SeCys toward Cd(II)
and Pb(II), many parameters including selenocysteineconcentration, pH of SAB solution, concentration of bismuth,preconcentration time, preconcentration potential, and opera-tional parameters of SWASV, which could have an influence
on Cd(II) and Pb(II) deposition and reduction on modifiedelectrode surface, were examined in detail.
Fig. 6 illustrates the effect of selenocysteine concentration
on anodic stripping voltammograms (SWASV) of a solutioncontaining 20 ppb Cd(II) and Pb(II) in pH 4.8 SAB containing
Please cite this article in press as: Al-Hossainy, A.F. et al., Synthesis, structural andmuth ultrathin film electrode and its application to Pb(II) and Cd(II) deterj.arabjc.2015.06.020
275 ppb Bi(III) at the Au-GN-SeCys using SWASV, with typ-ical instrumental settings for each mode. It is obvious that
both the peak currents of Cd(II) and Pb(II) ions increasedup to 0.12 mol L�1 selenocysteine. At higher concentrationsof selenocysteine, the Cd(II) and Pb(II) peak current continued
to decrease but at a slower rate. Thus, 0.12 mol L�1 selenocys-teine was used in the preparation process of Au-GN-SeCys.
The supporting electrolyte and pH can greatly affect thevoltammetric response of the sensor. The influence of pH by
using an SAB buffer solution (0.12 mol/L) on the anodic strip-ping peak current of Cd(II) and Pb(II) was studied in the pHrange of 3.7–5.6. The value 4.8 6 optimum pH P 4.8, the ano-
dic stripping peak current for Cd(II) and Pb(II) was decreased.Fig. 7 shows the effect of pH of SAB on the electrochemical
responses of Cd(II) and Pb(II). The stripping peak currents of
Cd(II) and Pb(II) increased by increasing pH in the range3.80–4.80 (maximum point), due to competition between theprotons and the metal ions from binding to Au-GN-SeCysand also the isoelectric point of selenocysteine is 5.47
(Bettelheim et al., 2010), while, the current at 4.80–5.60 pH
optical properties of gold nanoparticle-graphene-selenocysteine composite bis-mination. Arabian Journal of Chemistry (2015), http://dx.doi.org/10.1016/

0.90 0.95 1.00 1.05 1.10 1.15 1.200
10
20
30
40
50
60
70
80
90
100
Cur
rent
i p/μΑ
Cur
rent
i p/μΑ
E (V) vs. Ag/AgCl
Cd(II)
Pb(II)
0
5
10
15
20
25
30
35
40
45
Figure 9 The effect of preconcentration potential on the
stripping peak current of 20 ppb Cd(II) and Pb(II) at Au-GN-
SeCys/GCE in 0.12 mol L�1, pH 4.8 SAB containing 275 ppb
Bi(III).
Synthesis, structural and optical properties of gold nanoparticle-graphene-selenocysteine composite and its application 7
decreased in the anodic peak currents due to the hydrolysis ofcations. From the above results, the 4.8 value of pH wasemployed in all the subsequent experiments.
The concentration of bismuth (25–500 ppp) was playing animportant role in thickness of alloy film and film topography,when, the stripping peak of Cd(II) and Pb(II) was the highest
at the Bi/Au-GN-SeCys/GCE in 0.12 mol L�1 pH 4.8 SAB,with a deposition potential of �1.00 V, deposition time of14 min, amplitude of 0.025 V, and increment potential of
0.004 V. As shown in Fig. 8, the concentration of Bi(III) from25 to 275 ppb increased with the increasing stripping peak cur-rents of (10.07–42.48 lA) Cd(II) and (7.00–33.08 lA) Pb(II)ions, indicating that the electrode sensitivity is obviously
improved by increasing the Bi(III) film thickness of the elec-trode. However, the Bi(III) concentration increases (275–500 ppb) with gradually decreasing the stripping peak currents
of both metal ions, which is probably due to a layer of bismuthmetals partially prevented the conductive surface of the modi-fying porous electrode (Cao et al., 2008). Therefore, the results
indicated that the highest peak current responses were obtainedat concentration of bismuth 275 ppb for cadmium(II) andlead(II) ion, which was chosen for the following experiments.
Fig. 9 shows the influence of the variation of the accumula-tion potential on the stripping peak current, examined over therange �0.90 to �1.20 V with a 20 ppb Cd(II) and Pb(II) withrespect to varied Bi(III) concentrations, measured by Au-GN-
SeCys/GCE in 0.12 mol L�1, pH 4.8 SAB. Obviously, thestripping peak current signals of Cd(II) and Pb(II) were a nota-ble increasing trend with the negative shift of deposition poten-
tial in the potential range of �0.90 to �1.00 V (the maximalpeak height). However, the peak current decreases uponchanging the potential over �1.20 V (Krolicka et al., 2006
and Liu et al., 2008). An optimum Eacc of �1.00 V was selectedfor further experiments.
The influence of accumulation time on the sensitivity of the
stripping peak current of 20 ppb Cd(II) and Pb(II) in the rangeof 5–18 min is shown in Fig. 10. It was found that the strippingpeak current of the Cd(II) and Pb(II) at Au-GN-SeCys/GCEincreases linearly with increasing accumulation time from 5
to 18 min. In this study an accumulated time of 14 min was
0 100 200 300 400 500 6000
5
10
15
20
25
30
35
40
45
Strip
ping
pea
k cu
rrent
i p/μΑ
Conc. Bi(III) /ppb
Pb(II)
Cd(II)
Figure 8 SWASV peak currents of 20 ppb Cd(II) and Pb(II)
with respect to varied Bi(III) concentrations, measured by Au-
GN-SeCys/GCE in 0.12 mol L�1, pH 4.8 SAB.
Please cite this article in press as: Al-Hossainy, A.F. et al., Synthesis, structural andmuth ultrathin film electrode and its application to Pb(II) and Cd(II) determj.arabjc.2015.06.020
chosen, because it gave an adequate sensitivity to determine
Cd(II) and Pb(II) in these samples.
3.4. Analytical performance of the electrochemical sensor
The analytical performances of the prepared Au-GN-SeCys/GCE microsensors were explored by quantifying thestandard solutions (WMP8435) with the metal ion concentra-
tions, and the corresponding SWASV waves are presented inFig. 11 under the optimum conditions. The peak currents ofSWASV were proportional to the concentrations of Cd(II)and Pb(II) from 0.5 to 100 ppb, and the detection limit
(S/N = 6) was 0.08, and 0.05 ppb for metal ions, respectively.The linear regression equations were ICd(ppb) = 1.2439CCd(ppb) + 13.073 and Ipb(ppb) = 0.5049CPb(ppb) + 11.185,
with correlation coefficients of 0.9848 and 0.98, respectively.The features demonstrate that the Au-GN-SeCys/GCE
microsensors with an excellent analytical performance toward
4 6 8 10 12 14 16 18 200
5
10
15
20
25
30
35
40
45
50
Cur
rent
i p/μΑ
Pb(II)
Cd(II)
Time / min
Figure 10 The effect of deposition time on the stripping peak
current of 20 ppb Cd(II) and Pb(II) at Au-GN-SeCys/GCE in
0.12 mol L�1 pH 4.8 SAB containing 275 ppb Bi(III).
optical properties of gold nanoparticle-graphene-selenocysteine composite bis-ination. Arabian Journal of Chemistry (2015), http://dx.doi.org/10.1016/
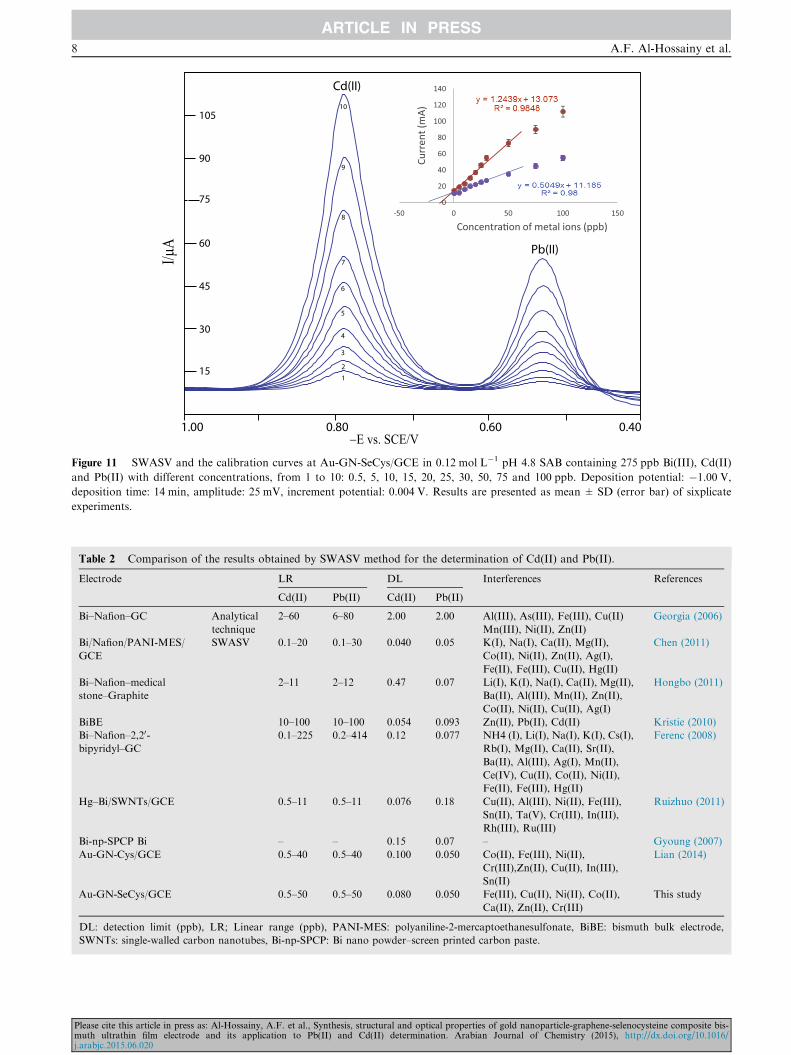
Figure 11 SWASV and the calibration curves at Au-GN-SeCys/GCE in 0.12 mol L�1 pH 4.8 SAB containing 275 ppb Bi(III), Cd(II)
and Pb(II) with different concentrations, from 1 to 10: 0.5, 5, 10, 15, 20, 25, 30, 50, 75 and 100 ppb. Deposition potential: �1.00 V,
deposition time: 14 min, amplitude: 25 mV, increment potential: 0.004 V. Results are presented as mean ± SD (error bar) of sixplicate
experiments.
Table 2 Comparison of the results obtained by SWASV method for the determination of Cd(II) and Pb(II).
Electrode LR DL Interferences References
Cd(II) Pb(II) Cd(II) Pb(II)
Bi–Nafion–GC Analytical
technique
SWASV
2–60 6–80 2.00 2.00 Al(III), As(III), Fe(III), Cu(II)
Mn(III), Ni(II), Zn(II)
Georgia (2006)
Bi/Nafion/PANI-MES/
GCE
0.1–20 0.1–30 0.040 0.05 K(I), Na(I), Ca(II), Mg(II),
Co(II), Ni(II), Zn(II), Ag(I),
Fe(II), Fe(III), Cu(II), Hg(II)
Chen (2011)
Bi–Nafion–medical
stone–Graphite
2–11 2–12 0.47 0.07 Li(I), K(I), Na(I), Ca(II), Mg(II),
Ba(II), Al(III), Mn(II), Zn(II),
Co(II), Ni(II), Cu(II), Ag(I)
Hongbo (2011)
BiBE 10–100 10–100 0.054 0.093 Zn(II), Pb(II), Cd(II) Kristie (2010)
Bi–Nafion–2,20-bipyridyl–GC
0.1–225 0.2–414 0.12 0.077 NH4 (I), Li(I), Na(I), K(I), Cs(I),
Rb(I), Mg(II), Ca(II), Sr(II),
Ba(II), Al(III), Ag(I), Mn(II),
Ce(IV), Cu(II), Co(II), Ni(II),
Fe(II), Fe(III), Hg(II)
Ferenc (2008)
Hg–Bi/SWNTs/GCE 0.5–11 0.5–11 0.076 0.18 Cu(II), Al(III), Ni(II), Fe(III),
Sn(II), Ta(V), Cr(III), In(III),
Rh(III), Ru(III)
Ruizhuo (2011)
Bi-np-SPCP Bi – – 0.15 0.07 – Gyoung (2007)
Au-GN-Cys/GCE 0.5–40 0.5–40 0.100 0.050 Co(II), Fe(III), Ni(II),
Cr(III),Zn(II), Cu(II), In(III),
Sn(II)
Lian (2014)
Au-GN-SeCys/GCE 0.5–50 0.5–50 0.080 0.050 Fe(III), Cu(II), Ni(II), Co(II),
Ca(II), Zn(II), Cr(III)
This study
DL: detection limit (ppb), LR; Linear range (ppb), PANI-MES: polyaniline-2-mercaptoethanesulfonate, BiBE: bismuth bulk electrode,
SWNTs: single-walled carbon nanotubes, Bi-np-SPCP: Bi nano powder–screen printed carbon paste.
8 A.F. Al-Hossainy et al.
Please cite this article in press as: Al-Hossainy, A.F. et al., Synthesis, structural and optical properties of gold nanoparticle-graphene-selenocysteine composite bis-muth ultrathin film electrode and its application to Pb(II) and Cd(II) determination. Arabian Journal of Chemistry (2015), http://dx.doi.org/10.1016/j.arabjc.2015.06.020
Synthesis, structural and optical properties of gold nanoparticle-graphene-selenocysteine composite and its application 9
Cd(II) and Pb(II) could be used for efficient determination oftwo metal ions in WMP8435 and environmental samples. Thedetection limits for Cd(II) and Pb(II) were calculated to be
0.08 ppb, and 0.05 ppb, respectively, based on a signal-to-noise ratio equal to 6 (S/N = 6). The Cd(II) and Pb(II) detec-tion performance of the proposed sensor was compared with
other previously reported bismuth film-modified electrodesand the results are listed in Table 2. In addition, the developedelectrochemical sensor had low determination limits and wide
linear ranges, which may be attributed to the synergistic effectof graphene, Au NPs and Se-(Methyl) selenocysteinehydrochloride on the deposition of the Cd(II) and Pb(II) ions.
3.5. Interferences
The main interferences of iron(III), copper(II), nickel(II),cobalt(II) calcium(II), zinc(II) and chromium(III) solution
had been studied on a standard solution containing 20 ppbCd(II) and Pb(II). Thus, these seven ions were chosen as inter-fering ions for investigation of the sensor selectivity. The selec-
tivity of the Au-GN-SeCys/GCE was evaluated by SWASVmeasurements in 20 ppb Cd(II) and Pb(II) solution spiked with
Table 3 Effect of interference ions on the detection of 20 ppb
Cd(II) and Pb(II).
Interference ions Peak current
(lA)
Relative signal change
(%)
Cd(II) Pb(II) Cd(II) Pb(II)
No interference ions 37.59 22.06
Fe(III) 35.11 20.3 6.597499 7.978241
Cu(II) 36.54 20.97 2.793296 4.94107
Ni(II) 37.04 21.21 1.463155 3.853128
Co(II) 36.85 21.39 1.968609 3.037171
Ca(II) 35.14 20.58 6.517691 6.708976
Zn(II) 35.79 21.58 4.788508 2.175884
Cr(III) 36.23 20.88 3.617984 5.349048
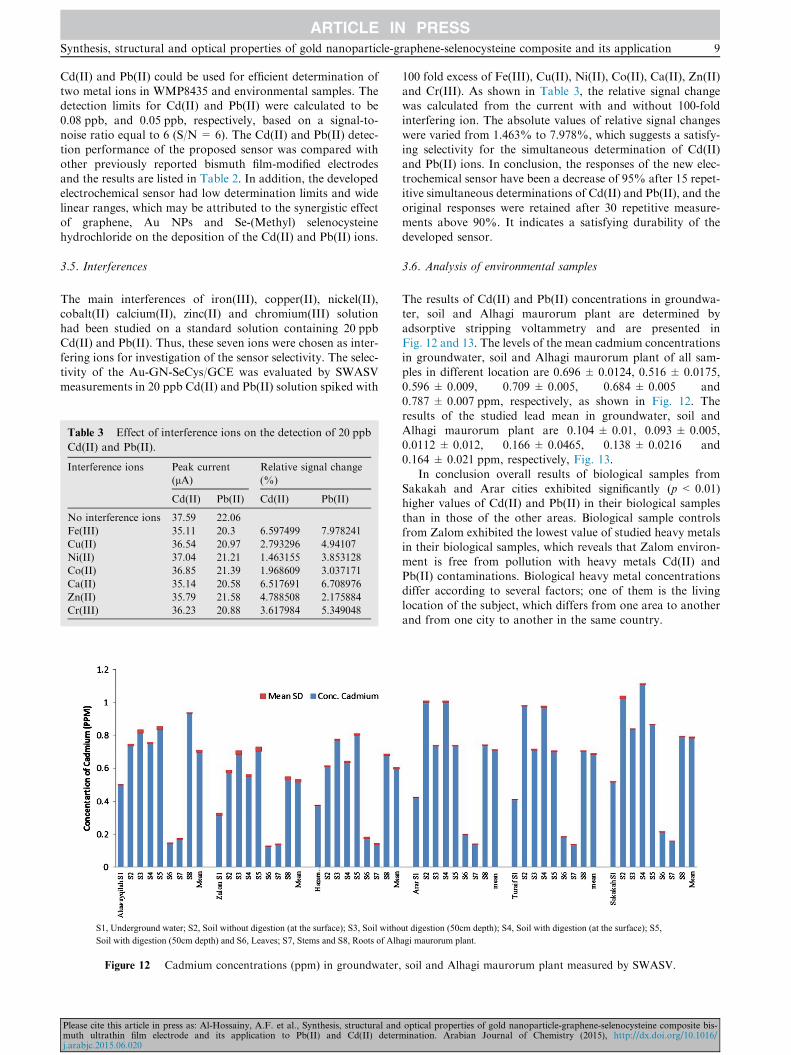
S1, Underground water; S2, Soil without digestion (at the surface); S3, Soil withoSoil with digestion (50cm depth) and S6, Leaves; S7, Stems and S8, Roots of Alh
Figure 12 Cadmium concentrations (ppm) in groundwater,
Please cite this article in press as: Al-Hossainy, A.F. et al., Synthesis, structural andmuth ultrathin film electrode and its application to Pb(II) and Cd(II) determj.arabjc.2015.06.020
100 fold excess of Fe(III), Cu(II), Ni(II), Co(II), Ca(II), Zn(II)and Cr(III). As shown in Table 3, the relative signal changewas calculated from the current with and without 100-fold
interfering ion. The absolute values of relative signal changeswere varied from 1.463% to 7.978%, which suggests a satisfy-ing selectivity for the simultaneous determination of Cd(II)
and Pb(II) ions. In conclusion, the responses of the new elec-trochemical sensor have been a decrease of 95% after 15 repet-itive simultaneous determinations of Cd(II) and Pb(II), and the
original responses were retained after 30 repetitive measure-ments above 90%. It indicates a satisfying durability of thedeveloped sensor.
3.6. Analysis of environmental samples
The results of Cd(II) and Pb(II) concentrations in groundwa-ter, soil and Alhagi maurorum plant are determined by
adsorptive stripping voltammetry and are presented inFig. 12 and 13. The levels of the mean cadmium concentrationsin groundwater, soil and Alhagi maurorum plant of all sam-
ples in different location are 0.696 ± 0.0124, 0.516 ± 0.0175,0.596 ± 0.009, 0.709 ± 0.005, 0.684 ± 0.005 and0.787 ± 0.007 ppm, respectively, as shown in Fig. 12. The
results of the studied lead mean in groundwater, soil andAlhagi maurorum plant are 0.104 ± 0.01, 0.093 ± 0.005,0.0112 ± 0.012, 0.166 ± 0.0465, 0.138 ± 0.0216 and0.164 ± 0.021 ppm, respectively, Fig. 13.
In conclusion overall results of biological samples fromSakakah and Arar cities exhibited significantly (p < 0.01)higher values of Cd(II) and Pb(II) in their biological samples
than in those of the other areas. Biological sample controlsfrom Zalom exhibited the lowest value of studied heavy metalsin their biological samples, which reveals that Zalom environ-
ment is free from pollution with heavy metals Cd(II) andPb(II) contaminations. Biological heavy metal concentrationsdiffer according to several factors; one of them is the living
location of the subject, which differs from one area to anotherand from one city to another in the same country.
ut digestion (50cm depth); S4, Soil with digestion (at the surface); S5, agi maurorum plant.
soil and Alhagi maurorum plant measured by SWASV.
optical properties of gold nanoparticle-graphene-selenocysteine composite bis-ination. Arabian Journal of Chemistry (2015), http://dx.doi.org/10.1016/

S1, Underground water; S2, Soil without digestion (at the surface); S3, Soil without digestion (50cm depth); S4, Soil with digestion (at the surface); S5, Soil with digestion (50cm depth) and S6, Leaves; S7, Stems and S8, Roots of Alhagi maurorum plant.
0
0.05
0.1
0.15
0.2
0.25
0.3
0.35
Aluw
ayqi
lah
S1 S2 S3 S4 S5 S6 S7 S8M
ean
Zalo
m S
1 S2 S3 S4 S5 S6 S7 S8M
ean
Haze
m A
lgal
amid
…S2 S3 S4 S5 S6 S7 S8
Mea
n
Arar
S1 S2 S3 S4 S5 S6 S7 S8
mea
n
Tura
if S1 S2 S3 S4 S5 S6 S7 S8
mea
n
Saka
kah
S1 S2 S3 S4 S5 S6 S7 S8M
ean
Conc
entr
a�on
of
Lead
(PP
M)
Figure 13 Lead concentrations (ppm) in groundwater, soil and Alhagi maurorum plant measured by SWASV.
10 A.F. Al-Hossainy et al.
The data obtained are well correlated with those obtainedby parallel tests using (AAS), and (ICP-AES) for Cd(II)
(0.729 ± 0.0079, and 0.714 ± 0.0042 ppm) and Pb(II)(0.09502 ± 0.0217, and 0.09431 ± 0.0204, respectively) inroots of Alhagi maurorum plant samples and are nearly in
agreement with those obtained using SWASV of the same ele-ments (0.722 ± 0.004 ppm) for Cd(II) and (0.09473 ± 0.0193 ppm), for Pb(II), respectively. It confirms the applicationpotential of the developed sensor for real water samples.
4. Conclusion
In this work, a novel Au-GN-SeCys nanostructure thin film
has been synthesized by using conventional thermal evapora-tion and the prepared films are characterized as well adherentand nearly a homogeneous film. The Ft-IR spectra obtained
for Au-GN-SeCys nanostructure thin film confirm that thematerials are nanocrystalline average crystallite size of 50 nmby using Scherrer’s formula. The absorption bands in the
UV–vis region are generally interpreted in terms of p to p*
transitions between bonding and antibonding molecular orbi-tal. The optical constants of Au-GN-SeCys were calculated.
The allowed transitions were found to be indirect transitions.Carbon-based nanocomposite composed of Au-GN-SeCys
nanostructure thin film has been successfully synthesized forthe simultaneous determination of Cd(II) and Pb(II) in biolog-
ical samples. The applicability and suitability of Bi/Au-GN-SeCys/GCE for the determination of Cd(II) and Pb(II) weredemonstrated. Modifying electrode Bi/Au-GN-SeCys/GCE
had played an important role in electrochemical activity, highsensitivity and low detection limit for the determination oftrace Cd(II) and Pb(II) in reference material (WMP8435),
when, compared with GCE and Au-GN/GCE, Au-GN-Cys/GCE in aqueous solution based on SWASV technique.In addition, the materials involved in this experiment such as
Please cite this article in press as: Al-Hossainy, A.F. et al., Synthesis, structural andmuth ultrathin film electrode and its application to Pb(II) and Cd(II) deterj.arabjc.2015.06.020
gold nanoparticle, graphene and selenocysteine were nontoxicor bio-compatible, which may provide an environment friendly
sensor. A novel thin film Bi/ Au-GN-SeCys/GCE techniqueindicates that Au-GN-SeCys may find its wide application inthe determination of trace and heavy elements due to its char-
acteristics such as excellent electric conductivity and obvioussynergistic effect for the metal cation deposition.
References
Agilan, S., Mangalaraj, D., Narayandass, S.K., Velumani, S., Ignatiev,
A., 2007. Structural and optical characterization of CuInSe2 films
deposited by hot wall vacuum evaporation method. Vacuum 81,
813.
Benjamin, W., Samuel, B.A., 2013. Evaluation of some wet digestions
methods for reliable determination of total phosphorus in
Australian soils. Microchem. J. 111, 47.
Bettelheim, F.A., Brow, W.H., Campbell, M.K., Farrell, S.O., 2010.
Introduction to General, Organic and Biochemistry, nineth ed.
Brooks/Cole, Belmont, California.
Cao, L., Jia, J., Wang, Z., 2008. Sensitive determination of Cd and Pb
by differential pulse stripping voltammetry with in situ bismuth-
modified zeolite doped carbon paste electrodes. Electrochim. Acta
53, 2177.
Chen, Li., Su, Z., He, X., Liu, Y., Qin, C., Zhou, Y., et al, 2011.
Square wave anodic stripping voltammetric determination of Cd
and Pb ions ata Bi/Nafion/thiolated polyaniline/glassy carbon
electrode. Electrochem. Commun. 15, 34.
Chen, C., Xiangheng, N., Yan, C., Hongli, Z., Minbo, L., 2013.
Bismuth-based porous screen-printed carbon electrode with
enhanced sensitivity for trace heavy metal detection by stripping
voltammetry. Sens. Actuat. B: Chem. 178, 339.
Dandan, K., Yongmei, C., Pingyu, W., Shuangyan, L., Zia, U.H.K.,
Bao, M., 2014. Preplating of bismuth film electrode with coexisted
Sn2+ in electrolyte. Electrochim. Acta 125, 573.
Economou, A., 2005. Bismuth-film electrodes: recent developments
and potentialities for electroanalysis. TrAC, Trends Anal. Chem.
24 (4), 334.
optical properties of gold nanoparticle-graphene-selenocysteine composite bis-mination. Arabian Journal of Chemistry (2015), http://dx.doi.org/10.1016/

Synthesis, structural and optical properties of gold nanoparticle-graphene-selenocysteine composite and its application 11
El-Nahass, M.M., El-Gohary, Z., Soliman, H.S., 2003. Structural and
optical studies of thermally evaporated CoPc thin films. Opt. Laser
Technol. 35, 523.
El-Nahass, M.M., Abd El-Khalek, H.M., Nawar, A.M., 2012.
Structural and optical characterizations of Ni(II) tetraphenyl
porphyrin thin films. Eur. Phys. J.: Appl. Phys. 57, 30201.
Ferenc, T., Mihaly, K., Klara, T., Enik}o, T., 2008. Nafion�/2,2-
bipyridyl-modified bismuth film electrode for anodic stripping
voltammetry. Anal. Chim. Acta 619, 173.
Freitag, M., Steiner, M., Martin, Y., Perebeinos, V., Chen, Z.H.,
Tsang, et al, 2009. Energy dissipation in graphene field-effect
transistors. Nano Lett. 9, 1883.
Georgia, K., Anastasios, E., 2006. Polymer-coated bismuth film
electrodes for the determination of trace metals by sequential-
injection analysis/anodic stripping voltammetry. Anal. Chim. Acta
576, 283.
Goncalves, G., Marques, P.A.A.P., Granadeiro, C.M., Nogueira,
H.I.S., Singh, M.K., Gracio, 2009. Surface modification of
graphene nanosheets with gold nanoparticles: the role of oxygen
moieties at graphene surface on gold nucleation and growth. J.
Chem. Mater. 21, 4796.
Gyoung-Ja, L., Hi-Min, L., Chang-Kyu, R., 2007. Bismuth nano-
powder electrode for trace analysis of heavy metals using anodic
stripping voltammetry. Electrochem. Commun. 9, 2514.
Hongbo, L., Jing, L., Zhanjun, Y., Qin, X., Chuantao, H., Jinyun, P.,
Xiaoya, H., 2011. Simultaneous determination of ultratrace lead
and cadmium by square wave stripping voltammetry with in situ
depositing bismuth at Nafion-medical stone doped disposable
electrode. J. Hazard. Mater. 191, 26.
Jinfen, W., Chao, B., Jianhua, T., Jizhou, S., Shanhong, X., 2012. L-
Aspartic acid/L-cysteine/gold nanoparticle modified microelectrode
for simultaneous detection of copper and lead. Thin Solid Films
520 (21), 6658.
Kristie, C., Armstrong, C.E., Tatum, R.N., Dansby-Sparks, J.Q.,
Chambers, Z.X., 2010. Individual and simultaneous determination
of lead, cadmium, and zinc by anodic stripping voltammetry at a
bismuth bulk electrode. Talanta 82, 675.
Krolicka, A., Bobrowski, A., Kowal, A., 2006. Effects of electroplating
variables on the voltammetric properties of bismuth deposits plated
potentiostatically. Electroanalysis 18 (17), 1649.
Lian, Z., Lili, X., Baozhen, H., Ningming, J., Liang, T., Shouzhuo, Y.,
2014. Simultaneous determination of Cd(II) and Pb(II) using
square wave anodic stripping voltammetry at a gold nanoparticle-
graphene-cysteine composite modified bismuth film electrode.
Electrochim. Acta 115, 471.
Liu, B.Z., Lu, L.Y., Wang, M., Zi, Y.Q., 2008. A study of Nafion-
coated bismuth-film electrode for the determination of zinc, lead,
and cadmium in blood samples. Electroanalysis 20, 2363.
Mehmet, L.Y., Tanju, Eren., Halil, _I., Necip, A., Cengiz, Y., 2014a. A
sensitive voltammetric sensor for determination of Cd(II) in human
plasma. J. Mol. Liq. 197, 58.
Mehmet, L.Y., Tanju, E., Necip, A., 2014b. Molecularly imprinted
electrochemical biosensor based on Fe@Au nanoparticles involved
in 2-aminoethanethiol functionalized multi-walled carbon nan-
otubes for sensitive determination of cefexime in human plasma.
Biosens. Bioelectron. 60, 277.
Mehmet, L.Y., Necip, A., Tanju, E., 2014c. Determination of
amikacin in human plasma by molecular imprinted SPR nanosen-
sor. Sens. Actuat. B 198, 70.
Mehmet, L.Y., Tanju, E., Necip, A., 2015. A sensitive molecular
imprinted electrochemical sensor based on gold nanoparticles
Please cite this article in press as: Al-Hossainy, A.F. et al., Synthesis, structural andmuth ultrathin film electrode and its application to Pb(II) and Cd(II) determj.arabjc.2015.06.020
decorated graphene oxide: application to selective determination
of tyrosine in milk. Sens. Actuat. B 210, 149.
Meijiao, L.v., Xianbao, W., Jing, L., Xuyu, Y., Changan, Z., Jia, Y.,
Hao, H., 2013. Cyclodextrin-reduced graphene oxide hybrid
nanosheets for the simultaneous determination of lead(II) and
cadmium(II) using squarewave anodic stripping voltammetry.
Electrochim. Acta 108, 412.
Metters, J.P., Banks, C.E., 2014. 3 – Nanoparticle modified electrodes
for trace metal ion analysis nanosensors for chemical and biological
applications sensing with nanotubes. Nanowires Nanoparticles 79.
Organic Index to the Powder Diffraction File, Joint Committee of
Powder Diffraction Standards, 2002.
Ruizhuo, O., Zhenqian, Z., Clarissa, E., Tatum, J.Q., Chambers,
Z.Xue, 2011. Simultaneous stripping detection of Zn(II), Cd(II)
and Pb(II) using a bimetallic Hg–Bi/single-walled carbon nan-
otubes composite electrode. J. Electroanal. Chem. 656, 78.
Sandra, C., Valeria, G., Zoltan, K., Amir, M.A., Ivan, S., Srd-an, R.,
Akos, K., Bozo, D., Karel, V., 2015. Trace level voltammetric
determination of lead and cadmium in sediment pore water by a
bismuth-oxychloride particle-multiwalled carbon nanotube com-
posite modified glassy carbon electrode. Talanta 134, 640.
Tribidasari, A.I., Wiyogo, P.W., Endang, S., Bakhadir, R., Yasuaki,
E., 2015. Anodic stripping voltammetry of gold nanoparticles at
boron-doped diamond electrodes and its application in
immunochromatographic strip tests. Talanta 134, 136.
Veerapandian, M., Lee, M.H., Krishnamoorthy, K., Yun, K., 2012.
Synthesis, characterization and electrochemical properties of func-
tionalized graphene oxide. Carbon 50, 4228.
Vinod, K.G., Tanju, E., Necip, A., Mehmet, L.Y., Cemal, P., Hassan,
K., 2015. CoFe2O4@TiO2 decorated reduced graphene oxide
nanocomposite for photocatalytic degradation of chlorpyrifos. J.
Mol. Liq. 208, 122.
Wang, J., Li, Y., Huang, C., Wu, T., 2008. Rapid and selective
detection of cysteine based on its induced aggregates of cetyl
trimethyl ammonium bromide capped gold nanoparticles. Anal.
Chim. Acta 26, 37.
Wemple, S.H., DiDomenco, M., 1971. Behavior of the electronic
dielectric constant in covalent and ionic materials. Phys. Rev. B 3,
1338.
Wenrong, Y.J., Justin, G.D., Brynn, H., 2001. Characterisation of gold
electrodes modified with self-assembled monolayers of L-cysteine
for the adsorptive stripping analysis of copper. J. Electroanal.
Chem. 516 (1–2), 10.
Xu-Cheng, F., Ju, W., Jun, L., Cheng-Gen, X., Yi-Shu, L., Yu, Z., Jin-
Huai, L., 2013. Electrochemical determination of trace copper(II)
with enhanced sensitivity and selectivity by gold nanoparticle/
single-wall carbon nanotube hybrids containing three-dimensional
l-cysteine molecular adapters. Sens. Actuat. B 182,
382.
Yasemin, O., Almira, R., Natalija, R., Zafer, Y., Zafe, Ali, O.S.,
Arunas, R., 2011. 1,10-Phenanthroline modified glassy carbon
electrode for voltammetric determination of cadmium(II) ions.
Sensors Actuat. B 157, 146.
Zeyada, H.M., El-Nahass, M.M., Elashmawi, I.S., Habashi, A.A.,
2012. Annealing temperatures induced optical constant variations
of methyl violet 2B thin films manufactured by the spin coating
technique. J. Non-Cryst. Solids 358, 625.
Zhaomeng, W., Lin, L., Erjia, L., 2013. Graphene ultrathin film
electrodes modified with bismuth nanoparticles and polyaniline
porous layers for detection of lead and cadmium ions in acetate
buffer solutions. Thin Solid Films 544, 362.
optical properties of gold nanoparticle-graphene-selenocysteine composite bis-ination. Arabian Journal of Chemistry (2015), http://dx.doi.org/10.1016/