Synthesis Report - Cubango-Okavango River Basin Water ... · Synthesis Report Cubango-Okavango...
130
Synthesis Report Cubango-Okavango River Basin Water Audit (CORBWA) Project
Transcript of Synthesis Report - Cubango-Okavango River Basin Water ... · Synthesis Report Cubango-Okavango...
Synthesis ReportCubango-Okavango River Basin Water Audit (CORBWA) Project

Synthesis Report
Cubango-Okavango River Basin Water Audit (CORBWA) Project
FOOD AND AGRICULTURE ORGANIZATION OF THE UNITED NATIONS
Rome, 2014
The designations employed and the presentation of material in this information product do not imply the expression of any opinion whatsoever on the part of the Food and Agriculture Organization of the United Nations (FAO) concerning the legal or development status of any country, territory, city or area or of its authorities, or concerning the delimitation of its frontiers or boundaries. The mention of specific companies or products of manufacturers, whether or not these have been patented, does not imply that these have been endorsed or recommended by FAO in preference to others of a similar nature that are not mentioned.
The views expressed in this information product are those of the author(s) and do not necessarily reflect the views or policies of FAO.
E-ISBN 978-92-5-108298-0 (PDF)
© FAO, 2014
FAO encourages the use, reproduction and dissemination of material in this information product. Except where otherwise indicated, material may be copied, downloaded and printed for private study, research and teaching purposes, or for use in non-commercial products or services, provided that appropriate acknowledgement of FAO as the source and copyright holder is given and that FAO’s endorsement of users’ views, products or services is not implied in any way.
All requests for translation and adaptation rights, and for resale and other commercial use rights should be made via www.fao.org/contact-us/licence-request or addressed to [email protected].
FAO information products are available on the FAO website (www.fao.org/publications) and can be purchased through [email protected].
iii
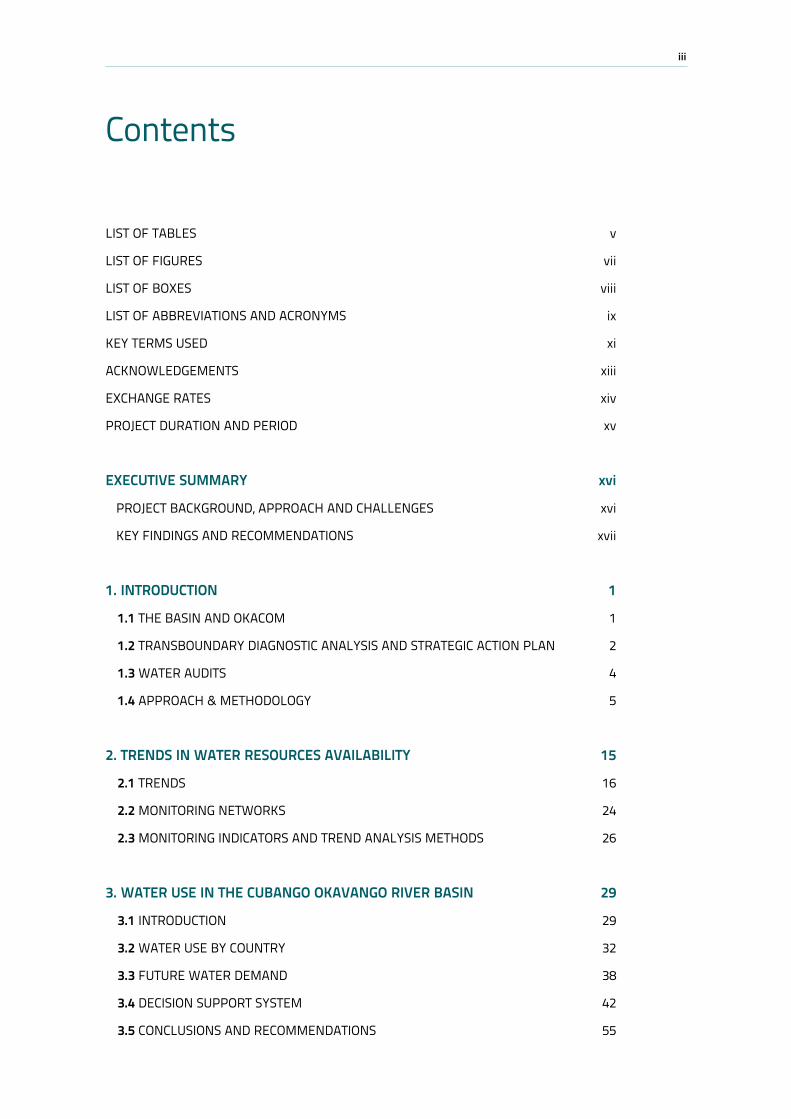
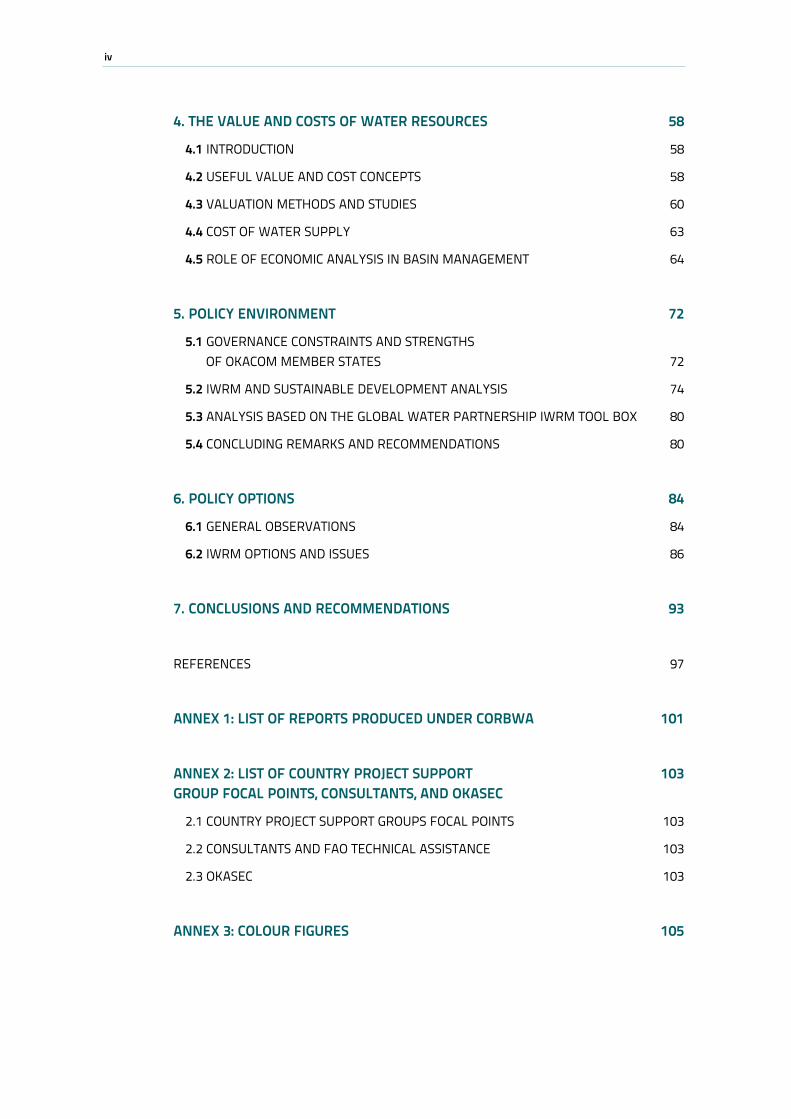
Contents
LIST OF TABLES v
LIST OF FIGURES vii
LIST OF BOXES viii
LIST OF ABBREVIATIONS AND ACRONYMS ix
KEY TERMS USED xi
ACKNOWLEDGEMENTS xiii
EXCHANGE RATES xiv
PROJECT DURATION AND PERIOD xv
EXECUTIVE SUMMARY xvi
PROJECT BACKGROUND, APPROACH AND CHALLENGES xvi
KEY FINDINGS AND RECOMMENDATIONS xvii
1. INTRODUCTION 1
1.1 THE BASIN AND OKACOM 1
1.2 TRANSBOUNDARY DIAGNOSTIC ANALYSIS AND STRATEGIC ACTION PLAN 2
1.3 WATER AUDITS 4
1.4 APPROACH & METHODOLOGY 5
2. TRENDS IN WATER RESOURCES AVAILABILITY 15
2.1 TRENDS 16
2.2 MONITORING NETWORKS 24
2.3 MONITORING INDICATORS AND TREND ANALYSIS METHODS 26
3. WATER USE IN THE CUBANGO OKAVANGO RIVER BASIN 29
3.1 INTRODUCTION 29
3.2 WATER USE BY COUNTRY 32
3.3 FUTURE WATER DEMAND 38
3.4 DECISION SUPPORT SYSTEM 42
3.5 CONCLUSIONS AND RECOMMENDATIONS 55
iv
4. THE VALUE AND COSTS OF WATER RESOURCES 58
4.1 INTRODUCTION 58
4.2 USEFUL VALUE AND COST CONCEPTS 58
4.3 VALUATION METHODS AND STUDIES 60
4.4 COST OF WATER SUPPLY 63
4.5 ROLE OF ECONOMIC ANALYSIS IN BASIN MANAGEMENT 64
5. POLICY ENVIRONMENT 72
5.1 GOVERNANCE CONSTRAINTS AND STRENGTHS OF OKACOM MEMBER STATES 72
5.2 IWRM AND SUSTAINABLE DEVELOPMENT ANALYSIS 74
5.3 ANALYSIS BASED ON THE GLOBAL WATER PARTNERSHIP IWRM TOOL BOX 80
5.4 CONCLUDING REMARKS AND RECOMMENDATIONS 80
6. POLICY OPTIONS 84
6.1 GENERAL OBSERVATIONS 84
6.2 IWRM OPTIONS AND ISSUES 86
7. CONCLUSIONS AND RECOMMENDATIONS 93
REFERENCES 97
ANNEX 1: LIST OF REPORTS PRODUCED UNDER CORBWA 101
ANNEX 2: LIST OF COUNTRY PROJECT SUPPORT 103 GROUP FOCAL POINTS, CONSULTANTS, AND OKASEC
2.1 COUNTRY PROJECT SUPPORT GROUPS FOCAL POINTS 103
2.2 CONSULTANTS AND FAO TECHNICAL ASSISTANCE 103
2.3 OKASEC 103
ANNEX 3: COLOUR FIGURES 105
v
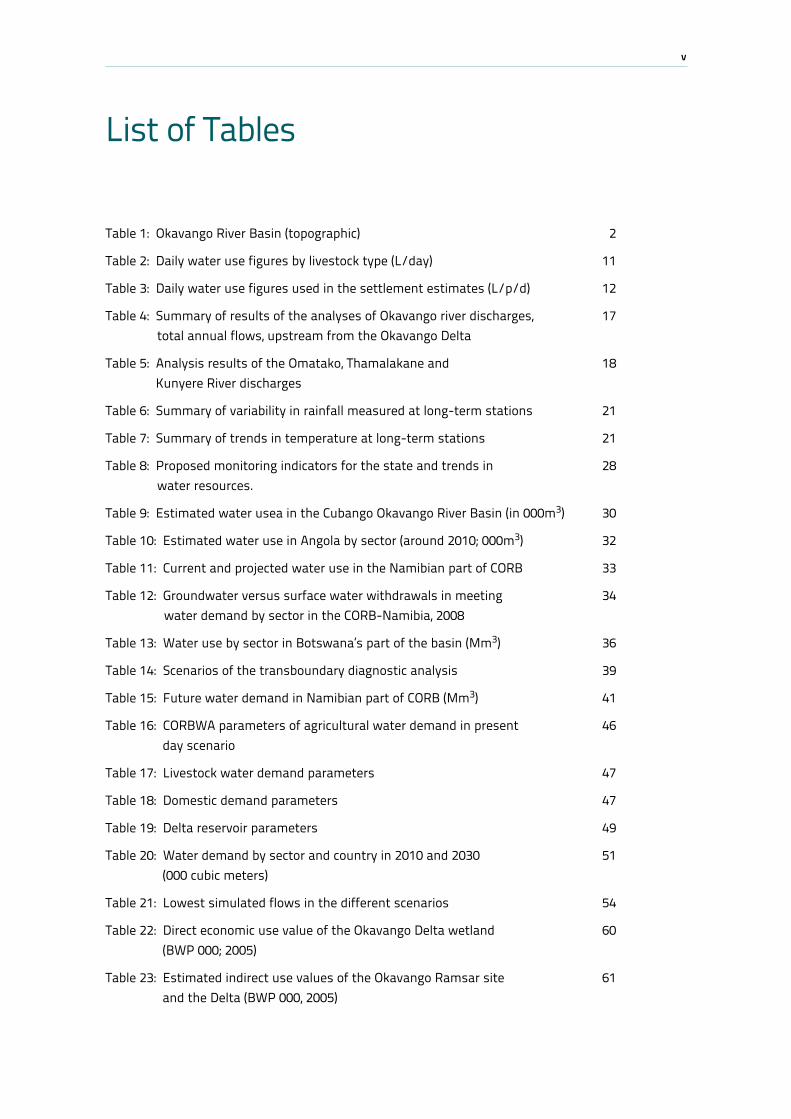
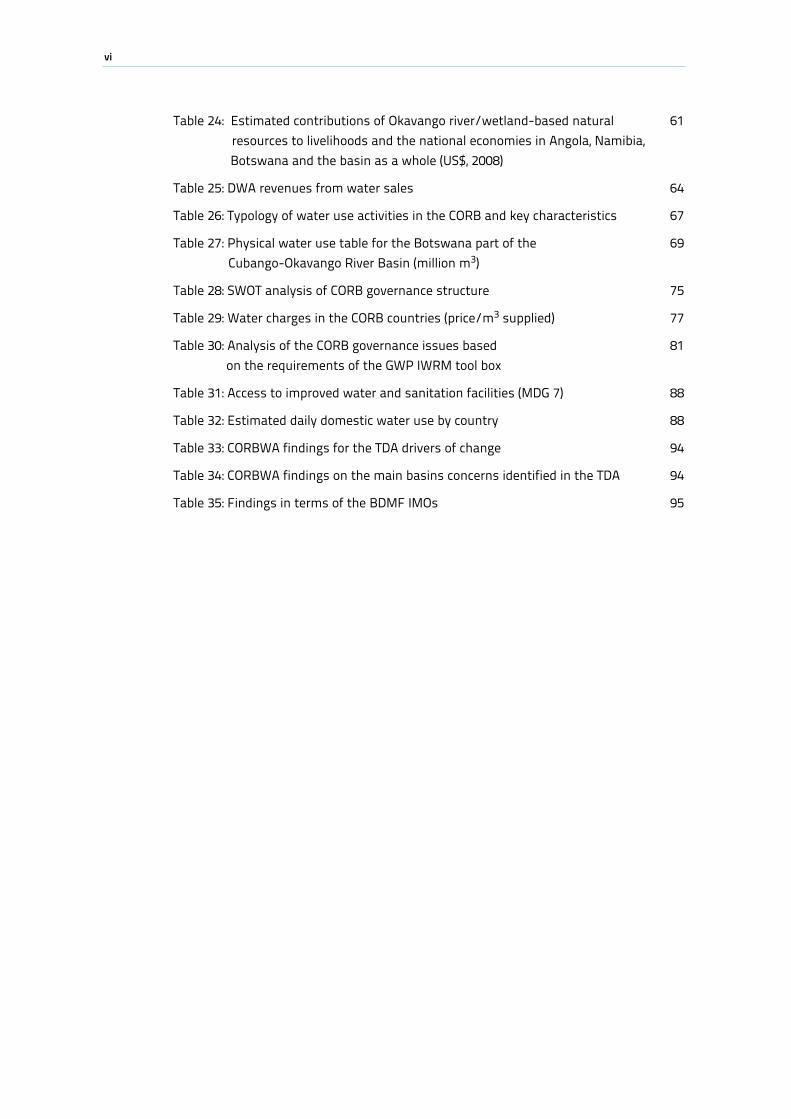
List of Tables
Table 1: Okavango River Basin (topographic) 2
Table 2: Daily water use figures by livestock type (L/day) 11
Table 3: Daily water use figures used in the settlement estimates (L/p/d) 12
Table 4: Summary of results of the analyses of Okavango river discharges, 17 total annual flows, upstream from the Okavango Delta
Table 5: Analysis results of the Omatako, Thamalakane and 18 Kunyere River discharges
Table 6: Summary of variability in rainfall measured at long-term stations 21
Table 7: Summary of trends in temperature at long-term stations 21
Table 8: Proposed monitoring indicators for the state and trends in 28 water resources.
Table 9: Estimated water usea in the Cubango Okavango River Basin (in 000m3) 30
Table 10: Estimated water use in Angola by sector (around 2010; 000m3) 32
Table 11: Current and projected water use in the Namibian part of CORB 33
Table 12: Groundwater versus surface water withdrawals in meeting 34 water demand by sector in the CORB-Namibia, 2008
Table 13: Water use by sector in Botswana’s part of the basin (Mm3) 36
Table 14: Scenarios of the transboundary diagnostic analysis 39
Table 15: Future water demand in Namibian part of CORB (Mm3) 41
Table 16: CORBWA parameters of agricultural water demand in present 46 day scenario
Table 17: Livestock water demand parameters 47
Table 18: Domestic demand parameters 47
Table 19: Delta reservoir parameters 49
Table 20: Water demand by sector and country in 2010 and 2030 51 (000 cubic meters)
Table 21: Lowest simulated flows in the different scenarios 54
Table 22: Direct economic use value of the Okavango Delta wetland 60 (BWP 000; 2005)
Table 23: Estimated indirect use values of the Okavango Ramsar site 61 and the Delta (BWP 000, 2005)
vi
Table 24: Estimated contributions of Okavango river/wetland-based natural 61 resources to livelihoods and the national economies in Angola, Namibia, Botswana and the basin as a whole (US$, 2008)
Table 25: DWA revenues from water sales 64
Table 26: Typology of water use activities in the CORB and key characteristics 67
Table 27: Physical water use table for the Botswana part of the 69 Cubango-Okavango River Basin (million m3)
Table 28: SWOT analysis of CORB governance structure 75
Table 29: Water charges in the CORB countries (price/m3 supplied) 77
Table 30: Analysis of the CORB governance issues based 81 on the requirements of the GWP IWRM tool box
Table 31: Access to improved water and sanitation facilities (MDG 7) 88
Table 32: Estimated daily domestic water use by country 88
Table 33: CORBWA findings for the TDA drivers of change 94
Table 34: CORBWA findings on the main basins concerns identified in the TDA 94
Table 35: Findings in terms of the BDMF IMOs 95
vii
List of Figures
Figure 1: CORBWA project components and their interactions 6
Figure 2: Estimated amounts of surface and ground water withdrawals by country and in the basin (Mm3). 31
Figure 3: River water withdrawals by economic sector (000 m3) 31
Figure 6: Possible future water demand pathways (000m3) 41
Figure 7: EPSMO hydrological modeling overview (EPSMO, 2009) 44
Figure 8: Example of results of EPSMO WEAP application (m3/second; % of time) 45
Figure 9: Proposed monthly variation of irrigation requirement 46
Figure 10: Maximum annual extent of flooded area. 49
Figure 11a: Water demand in CORBWA and EPSMO Reference scenario, 50 monthly average
Figure 11b: Stream flow in CORBWA and EPSMO Reference scenarios, 51 monthly average at Mohembo
Figure 12: Comparison of total water demand in selected scenarios 53
Figure 13: Total Economic Value 59
Figure 14: Estimated annual contributions of Okavango-based natural 63 resources to household livelihoods, direct gross national income and direct + indirect gross national income (US$, 2008)
Figure 15: Location of the water audit project and linkages with 93 OKACOM documents.

viii
List of Boxes
Box 1: Objectives of water audits 4
Box 2: Expanded IWRM principles 76
Box 3: International experiences with irrigation water charges 91
ix
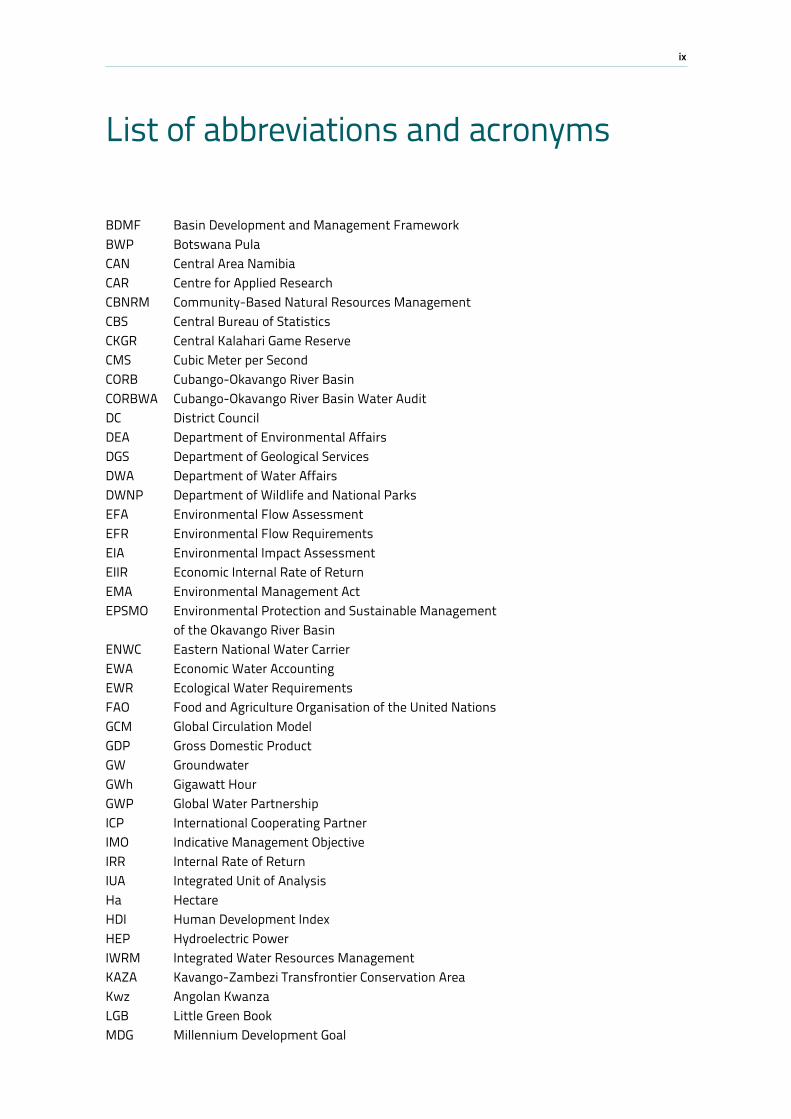
List of abbreviations and acronyms
BDMF Basin Development and Management FrameworkBWP Botswana PulaCAN Central Area NamibiaCAR Centre for Applied ResearchCBNRM Community-Based Natural Resources ManagementCBS Central Bureau of StatisticsCKGR Central Kalahari Game ReserveCMS Cubic Meter per SecondCORB Cubango-Okavango River BasinCORBWA Cubango-Okavango River Basin Water AuditDC District CouncilDEA Department of Environmental AffairsDGS Department of Geological ServicesDWA Department of Water AffairsDWNP Department of Wildlife and National ParksEFA Environmental Flow AssessmentEFR Environmental Flow RequirementsEIA Environmental Impact AssessmentEIIR Economic Internal Rate of ReturnEMA Environmental Management ActEPSMO Environmental Protection and Sustainable Management
of the Okavango River BasinENWC Eastern National Water CarrierEWA Economic Water AccountingEWR Ecological Water RequirementsFAO Food and Agriculture Organisation of the United NationsGCM Global Circulation ModelGDP Gross Domestic ProductGW GroundwaterGWh Gigawatt Hour GWP Global Water PartnershipICP International Cooperating PartnerIMO Indicative Management ObjectiveIRR Internal Rate of ReturnIUA Integrated Unit of AnalysisHa HectareHDI Human Development IndexHEP Hydroelectric Power IWRM Integrated Water Resources ManagementKAZA Kavango-Zambezi Transfrontier Conservation AreaKwz Angolan KwanzaLGB Little Green BookMDG Millennium Development Goal
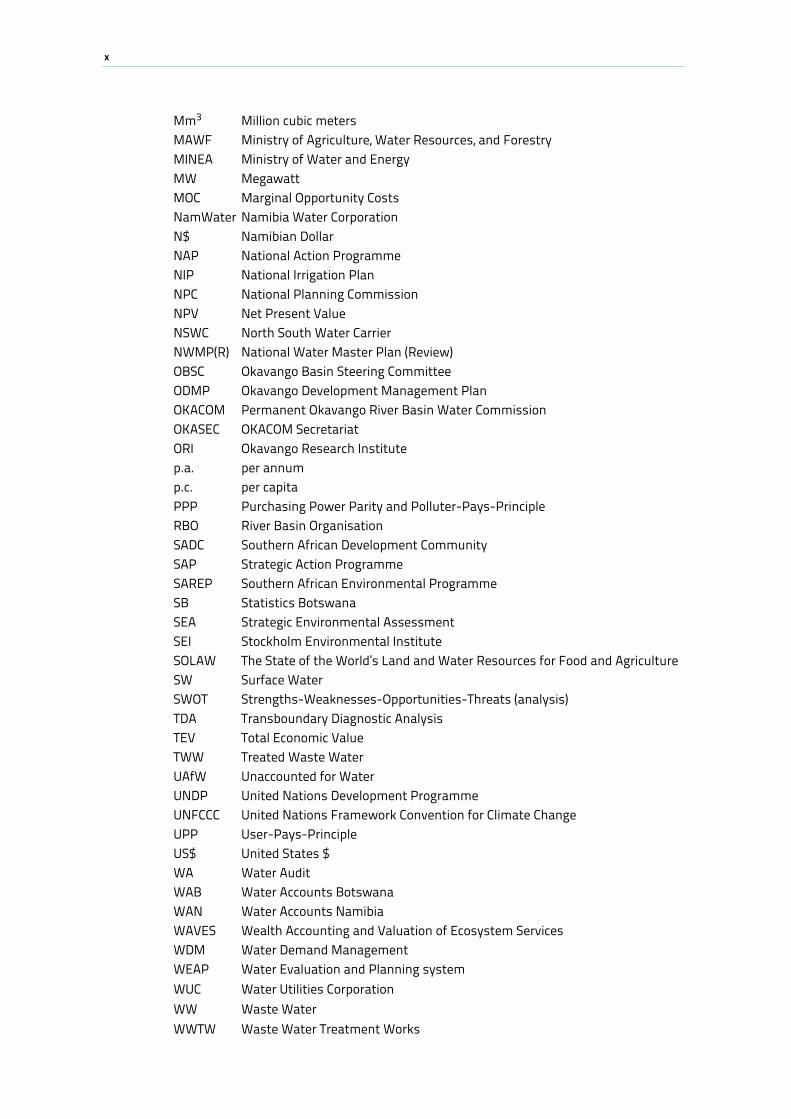
x
Mm3 Million cubic metersMAWF Ministry of Agriculture, Water Resources, and ForestryMINEA Ministry of Water and EnergyMW MegawattMOC Marginal Opportunity CostsNamWater Namibia Water Corporation N$ Namibian DollarNAP National Action ProgrammeNIP National Irrigation PlanNPC National Planning CommissionNPV Net Present ValueNSWC North South Water CarrierNWMP(R) National Water Master Plan (Review)OBSC Okavango Basin Steering Committee ODMP Okavango Development Management PlanOKACOM Permanent Okavango River Basin Water Commission OKASEC OKACOM SecretariatORI Okavango Research Institutep.a. per annump.c. per capitaPPP Purchasing Power Parity and Polluter-Pays-PrincipleRBO River Basin OrganisationSADC Southern African Development CommunitySAP Strategic Action ProgrammeSAREP Southern African Environmental ProgrammeSB Statistics BotswanaSEA Strategic Environmental AssessmentSEI Stockholm Environmental InstituteSOLAW The State of the World’s Land and Water Resources for Food and AgricultureSW Surface WaterSWOT Strengths-Weaknesses-Opportunities-Threats (analysis)TDA Transboundary Diagnostic AnalysisTEV Total Economic ValueTWW Treated Waste WaterUAfW Unaccounted for WaterUNDP United Nations Development ProgrammeUNFCCC United Nations Framework Convention for Climate Change UPP User-Pays-PrincipleUS$ United States $WA Water AuditWAB Water Accounts BotswanaWAN Water Accounts NamibiaWAVES Wealth Accounting and Valuation of Ecosystem ServicesWDM Water Demand ManagementWEAP Water Evaluation and Planning systemWUC Water Utilities CorporationWW Waste WaterWWTW Waste Water Treatment Works
xi
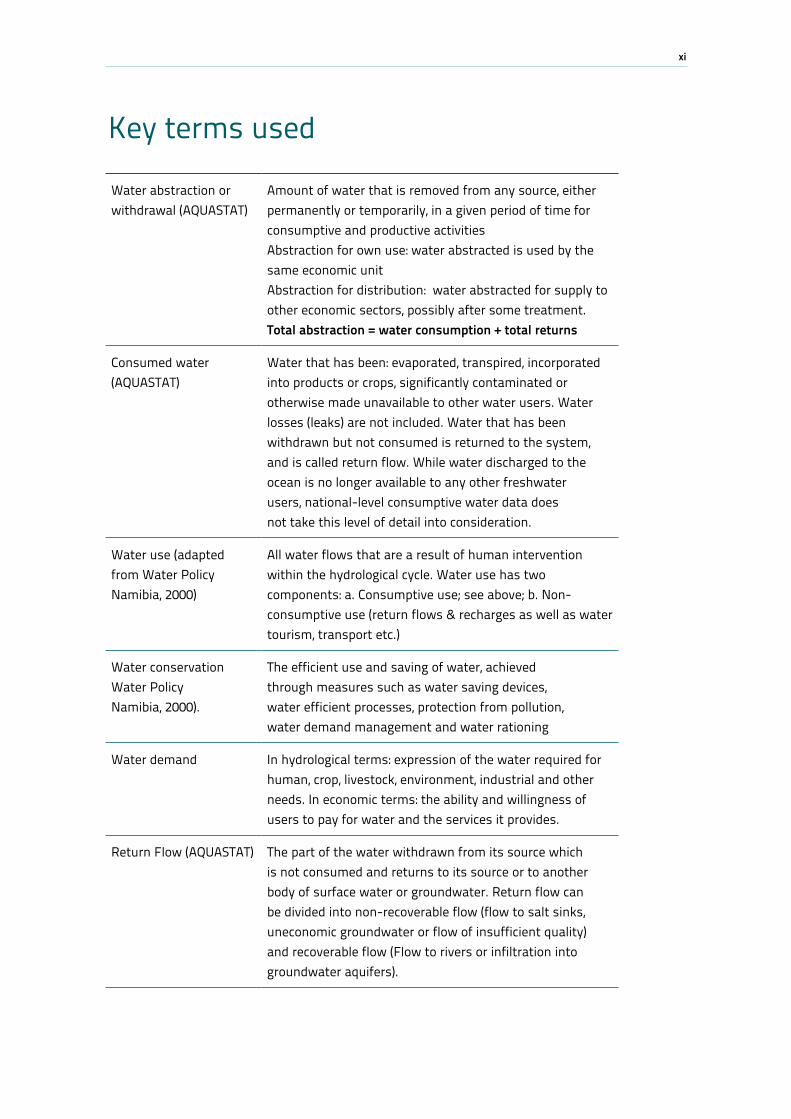
Key terms used
Water abstraction or withdrawal (AQUASTAT)
Amount of water that is removed from any source, either permanently or temporarily, in a given period of time for consumptive and productive activities Abstraction for own use: water abstracted is used by the same economic unit Abstraction for distribution: water abstracted for supply to other economic sectors, possibly after some treatment. Total abstraction = water consumption + total returns
Consumed water (AQUASTAT)
Water that has been: evaporated, transpired, incorporated into products or crops, significantly contaminated or otherwise made unavailable to other water users. Water losses (leaks) are not included. Water that has been withdrawn but not consumed is returned to the system, and is called return flow. While water discharged to the ocean is no longer available to any other freshwater users, national-level consumptive water data does not take this level of detail into consideration.
Water use (adapted from Water Policy Namibia, 2000)
All water flows that are a result of human intervention within the hydrological cycle. Water use has two components: a. Consumptive use; see above; b. Non-consumptive use (return flows & recharges as well as water tourism, transport etc.)
Water conservation Water Policy Namibia, 2000).
The efficient use and saving of water, achieved through measures such as water saving devices, water efficient processes, protection from pollution, water demand management and water rationing
Water demand In hydrological terms: expression of the water required for human, crop, livestock, environment, industrial and other needs. In economic terms: the ability and willingness of users to pay for water and the services it provides.
Return Flow (AQUASTAT) The part of the water withdrawn from its source which is not consumed and returns to its source or to another body of surface water or groundwater. Return flow can be divided into non-recoverable flow (flow to salt sinks, uneconomic groundwater or flow of insufficient quality) and recoverable flow (Flow to rivers or infiltration into groundwater aquifers).
xii
Water costs (FAO) The direct expenses incurred in providing the service of water supply. Full supply cost includes operation and maintenance costs, and capital depreciation and replacement costs. An assessment of the full cost of water to society should include, in addition to supply cost, its opportunity cost (i.e. the benefits foregone when water is not applied to its most beneficial use), and both economic and environmental externalities associated with water supply (indirect consequences that are not directly captured in the accounting system) (FAO, 2004; GWP, 2000).
Water charge A charge levied on the beneficiaries for supplying water. It may be based on or cover one or more of the following: (i) O&M expenses; (ii) depreciation charges for the whole or part of the project and O&M expenses; (iii) other criteria which may cover, exceed or not cover the working expenses and interest on investment.
Water accounting (FAO) A systematic method of organizing and presenting information relating to the physical volumes and flows of water in the environment as well as the economic values of water through cost-benefit analysis.
Water audit (FAO) A systematic study of the current status and future trends in both water supply and demand, with a particular focus on issues relating to governance, institutions, finance, accessibility, and uncertainty in a given spatial domain.
xiii
Acknowledgements
This report brings together the findings of a large number of reports at the basin and country level produced over the period 2011-12. These reports and their authors are acknowledged in footnotes and the appendices. This report has been written by Jaap Arntzen (Centre for Applied Research), Livia Peiser and Jippe Hoogeveen (both Food and Agriculture Organization of the United Nations (FAO). Comments from the Ebenizário Chonguiça, Executive Secretary of OKACOM have been helpful in the preparation of this report.
xiv
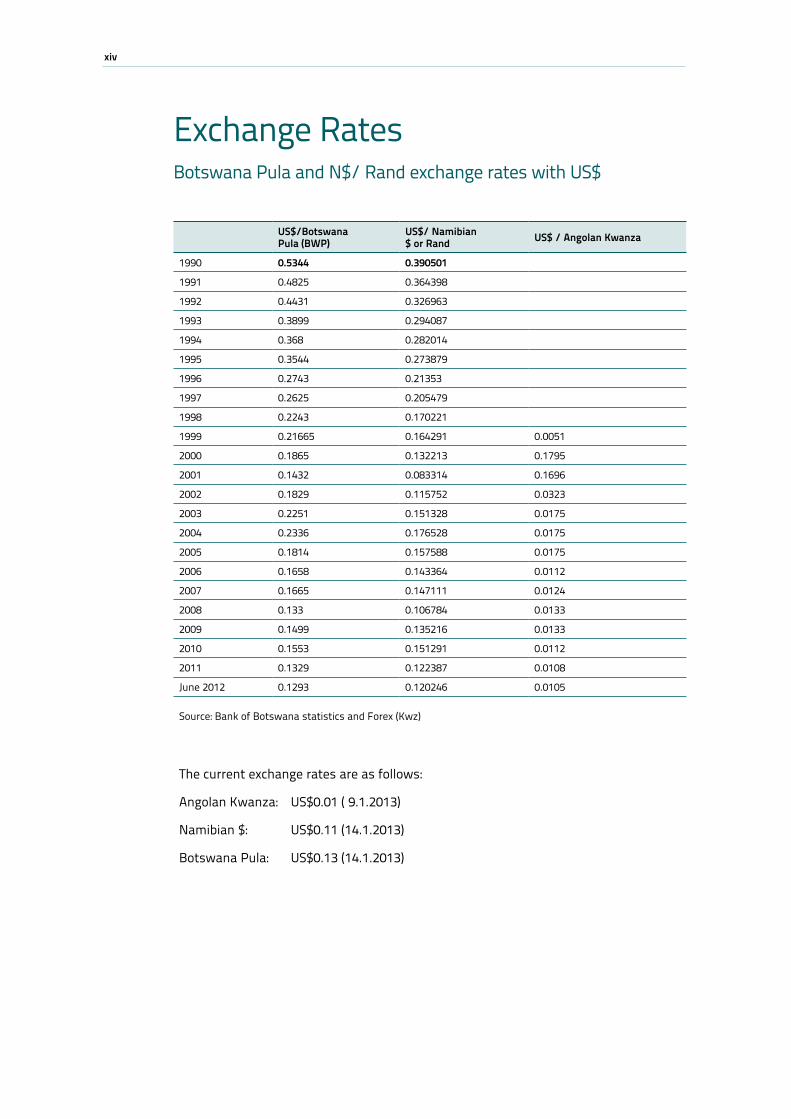
US$/Botswana Pula (BWP)
US$/ Namibian $ or Rand US$ / Angolan Kwanza
1990 0.5344 0.390501
1991 0.4825 0.364398
1992 0.4431 0.326963
1993 0.3899 0.294087
1994 0.368 0.282014
1995 0.3544 0.273879
1996 0.2743 0.21353
1997 0.2625 0.205479
1998 0.2243 0.170221
1999 0.21665 0.164291 0.0051
2000 0.1865 0.132213 0.1795
2001 0.1432 0.083314 0.1696
2002 0.1829 0.115752 0.0323
2003 0.2251 0.151328 0.0175
2004 0.2336 0.176528 0.0175
2005 0.1814 0.157588 0.0175
2006 0.1658 0.143364 0.0112
2007 0.1665 0.147111 0.0124
2008 0.133 0.106784 0.0133
2009 0.1499 0.135216 0.0133
2010 0.1553 0.151291 0.0112
2011 0.1329 0.122387 0.0108
June 2012 0.1293 0.120246 0.0105
Source: Bank of Botswana statistics and Forex (Kwz)
The current exchange rates are as follows:
Angolan Kwanza: US$0.01 ( 9.1.2013)
Namibian $: US$0.11 (14.1.2013)
Botswana Pula: US$0.13 (14.1.2013)
Exchange RatesBotswana Pula and N$/ Rand exchange rates with US$
xv
Project duration and period
The study was carried out during November 2010 and December 2012. Country studies were done in 2011 and most basin wide studies in the first half of 2012. The draft synthesis report was developed during the second half of 2012 and presented to the OKACOM task forces and OBSC in June 2013. While efforts have been made to up-date the report findings with recent developments, it is possible that some recent develop-ments, especially at the country level have not been fully incorporated.
xvi
Executive Summary
Project background, approach and challenges This report presents a synthesis of studies conducted in the framework of the Cubango-Okavango River Basin Water Audit (CORBWA). This water audit is part of a larger project “Coping with water scarcity: the role of agriculture- Developing national water audits in Africa”, which aims at providing countries with a comprehensive methodology for assessing, analysing and reporting of the use of scarce water resources. On the supply side, the audit provides information about the water availability. On the demand side, it gives a detailed picture, on how the water is used, for which purpose, and with which value. Africa uses around 85% of its withdrawn freshwater resources for agriculture. Therefore, a detailed assessment of agricultural water use, including its productivity, its value-in-use, and its efficiency during the water use process, gives the countries a better insight in how to adapt their water policy and how to improve their water management in future through strategic interventions to increase their capacity to cope with water scarcity. The CORBWA project, has taken advantage of the long-term involvement of the Food and Agriculture Organization of the United Nations (FAO) in support of the Perma-nent Okavango River Basin Water Commission (OKACOM) through the Environmental Protection and Sustainable Management of the Okavango River Basin (EPSMO) Project. The CORBWA project, which started in November 2010 and ended in December 2012, was funded by the Italian Cooperation with a budget of US$475 000, and has been developed, since the initial phases of project proposals, in consultation with OKACOM. Besides supporting the Commission, CORBWA project has also been instrumental in testing and further developing FAO methodology on water accounting and auditing at national level. The Centre for Applied Research (CAR), based in Botswana, has been responsible for project coordination, with technical support and overall guidance of FAO and OKACOM Secretariat (OKASEC). Regular briefings and updates have been provided at five different OKACOM and Okavango Basin Steering Committee (OBSC) meetings between December 2010 and June 2013, while specific meetings have been organised with each country’s Project Support Group (PSG), which provided guidance in identifying consultants and experts for the national studies.
The main objectives of the Water Audit are to:
• Assessthestatusandtrendsofwaterresources
• Evaluatewaterdemandtrends(withfocusonagriculturalwateruse),andaccesstowater
• Assess the functionality of water related policies and institutions at differentadministrative levels
• Providedecisionmakerswithacomprehensivesetofpolicyoptionstoincreasethecapacity to cope with increasing pressure on water resources
xvii
The project, in consultation with countries’ PSGs, appointed multidisciplinary teams of experts to carry out national level studies, which fed into basin-level thematic studies and were, ultimately, summarised in this synthesis report.
The main challenge for completion of these studies has been maintaining a good standard quality of information despite serious gaps in data, particularly with regard to updated rainfall and streamflow sequences in the upstream part of the basin, water quality and groundwater data.
Key findings and recommendationsThe project highlighted that, albeit a significant amount of land and water resources data have been collected within the EPSMO project and the Transboundary Diagnostic Assess-ment (TDA), still a lot needs to be done in facilitating access to information produced. To that extent, the project made the EPSMO land and water database available on FAO geospatial data catalogue (FAO GeoNetwok) and commissioned specific studies on data availability (and gaps) review and on how to best structure a shared database system.
The analysis of water resources availability shows that long term- trends are generally weak and their significance very much depends on the length of the analysed time-series. Discharge to the delta shows a weak negative trend in the period 1976-1996, followed by a positive trend from 1997 onwards, whereas rainfall pattern analysis shows a weak negative trend in annual rainfall with significant increase in extended wet and dry periods. The impact of climate change is uncertain, with considerable divergences in impact predictions. The monitoring network performance assessment indicates that priority should be given to re-establishing rainfall monitoring network in the upper catch-ments, and in developing groundwater and water quality monitoring systems.
Since water withdrawals are not recorded in the basin, current water use and trends had to be estimated on the basis of per unit requirement for each water use typology. Results confirm that, while current level of water withdrawals in the basin is very low compared to annual flow (less than 1%), future development plans, particularly in the agricultural sector, might have a significant impact on the quantity and timing of flow reaching the delta. This, in turn, could have negative implications for the tourism sector and, as a consequence, on the basin livelihoods. That is why it is recommended that further efforts are made to better define the “development space” of the basin, and future development plans are assessed against benefits for the basin as a whole.
The project has addressed the need to evaluate development options with a basin approach by supporting capacity development and providing technical support in the update of the decision support tool developed during the EPSMO project. It is recom-mended that this (or equivalent) instrument is regularly updated and maintained within the relevant institutions.
Along these lines, the project’s review of water resources policy recommends the estab-lishment of fair and transparent allocation and benefit sharing mechanisms which
xviii
could be achieved, among others, through transboundary projects for water resources infrastructures and development. OKACOM’s role in negotiating these mechanisms and criteria based on Southern African Development Community (SADC) Protocol and member states’ need is also highlighted.
Finally, a number of options for improved water resources management are discussed. These include: the promotion of demand management, particularly in the middle and lower parts of the basin, the use of marginal quality water for mining and irrigation when possible, reduction of losses in water service distribution networks. The agricultural sector, the largest water user, offers some scope for demand management, particularly by increasing water productivity (amount or value of product per unit of water supplied). Water productivity increase could be achieved through improved agricultural practices and through reduction of non-beneficial consumption of water supplied.
11. Introduction
1. Introduction
1.1 The basin and OKACOM Figure A (Annex 3) presents the OKACOM adopted basin boundary as well as those parts of the non-active basin that are not included within the official basin area (marked as cross-hatched areas). The complete, topographically defined river basin covers around 690 000 km2 of which 151 406 km2 is located in Angola, 168 274 km2 in Namibia, 345 704 km2 in Botswana and 25 670 km2 in Zimbabwe1. The active basin, which consists of the catchments of all contributing perennial and regularly flooded rivers and river wetlands, is considerably smaller.
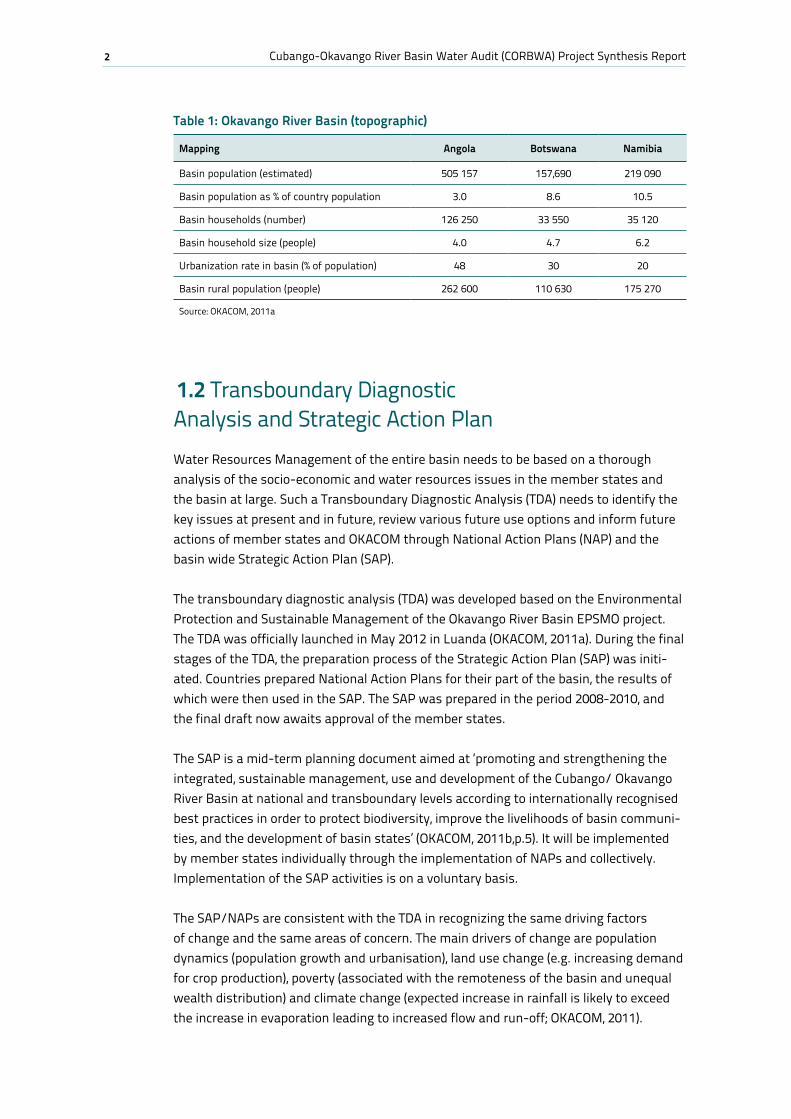
The total basin population is estimated to be just under 900 000 (Table 1), of which almost two third live in rural areas (62.2 percent) and one third in urban areas (e.g. Menongue, Rundu and Maun). More than of the basin’s population lives in Angola (57.3 percent) followed by Namibia (24.8 percent) and Botswana (17.9 percent). The average household size is 4.5 with the lowest size in Angola (4.0) and the highest in Namibia (6.2).
For Botswana, most of the Makgadikgadi area and the Central Kalahari Game Reserve (CKGR) were left out of for this project, mostly because there is no active link (in the case of the CKGR) while the Makgadikgadi wetland system has stronger links with another transboundary river (Nata), which originates in Zimbabwe. The part covers four admin-istrative districts (most of Ngamiland and Chobe and small parts of Central and Ghanzi Districts) and seven agricultural districts (Ngamiland west and east, Okavango, Chobe, Tutume, Boteti and Ghanzi). The commercial Pandamatenga farms were left out because of their orientation towards the Zambezi/Chobe River Basin.
The Cubango-Okavango River Basin (CORB) areas is far away from the countries capitals. In terms of poverty, defined through analysis of expenditures and costs of basin needs, the basin areas are much poorer than the national average. In Botswana, the Botswana Core Welfare Indicator Survey 2009/10 shows that the incidence of poverty is well above the national average (headcount 20.7 percent and households 14.7 percent in 2009/10) with the highest poverty levels west of the Okavango Delta, where 47.1 percent of the people and 34.1 percent of the households are poor (SB, 2011). Poverty is lower but still above average in Ngamiland East (headcount of 27.9 percent and households 21.6 percent) and almost average in the Boteti area (headcount 20.9 percent and households 17.3 percent). In Namibia, poverty in the CORB area is also much higher than the national average. The rural and urban poverty rates for households in 2003/4 are 38.2 percent and 12 percent respectively (CBS-NPC, 2008). In the Kavango region, 56.5 percent of the households lived in poverty.
1 Zimbabwe is currently not a member state of OKACOM. However, it is possible to seek membership.
2 Cubango-Okavango River Basin Water Audit (CORBWA) Project Synthesis Report
Table 1: Okavango River Basin (topographic)
Mapping Angola Botswana Namibia
Basin population (estimated) 505 157 157,690 219 090
Basin population as % of country population 3.0 8.6 10.5
Basin households (number) 126 250 33 550 35 120
Basin household size (people) 4.0 4.7 6.2
Urbanization rate in basin (% of population) 48 30 20
Basin rural population (people) 262 600 110 630 175 270
Source: OKACOM, 2011a
1.2 Transboundary Diagnostic Analysis and Strategic Action Plan Water Resources Management of the entire basin needs to be based on a thorough analysis of the socio-economic and water resources issues in the member states and the basin at large. Such a Transboundary Diagnostic Analysis (TDA) needs to identify the key issues at present and in future, review various future use options and inform future actions of member states and OKACOM through National Action Plans (NAP) and the basin wide Strategic Action Plan (SAP).
The transboundary diagnostic analysis (TDA) was developed based on the Environmental Protection and Sustainable Management of the Okavango River Basin EPSMO project. The TDA was officially launched in May 2012 in Luanda (OKACOM, 2011a). During the final stages of the TDA, the preparation process of the Strategic Action Plan (SAP) was initi-ated. Countries prepared National Action Plans for their part of the basin, the results of which were then used in the SAP. The SAP was prepared in the period 2008-2010, and the final draft now awaits approval of the member states. The SAP is a mid-term planning document aimed at ‘promoting and strengthening the integrated, sustainable management, use and development of the Cubango/ Okavango River Basin at national and transboundary levels according to internationally recognised best practices in order to protect biodiversity, improve the livelihoods of basin communi-ties, and the development of basin states’ (OKACOM, 2011b,p.5). It will be implemented by member states individually through the implementation of NAPs and collectively. Implementation of the SAP activities is on a voluntary basis.
The SAP/NAPs are consistent with the TDA in recognizing the same driving factors of change and the same areas of concern. The main drivers of change are population dynamics (population growth and urbanisation), land use change (e.g. increasing demand for crop production), poverty (associated with the remoteness of the basin and unequal wealth distribution) and climate change (expected increase in rainfall is likely to exceed the increase in evaporation leading to increased flow and run-off; OKACOM, 2011).
31. Introduction
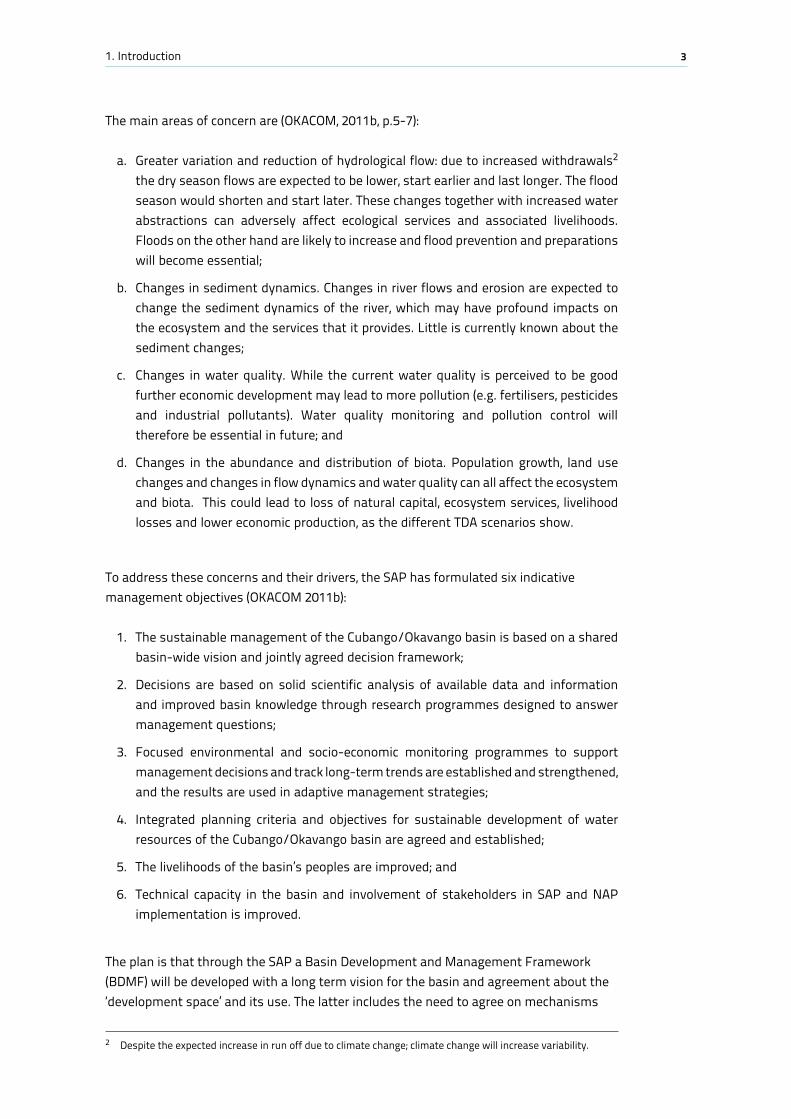
The main areas of concern are (OKACOM, 2011b, p.5-7):
a. Greater variation and reduction of hydrological flow: due to increased withdrawals2 the dry season flows are expected to be lower, start earlier and last longer. The flood season would shorten and start later. These changes together with increased water abstractions can adversely affect ecological services and associated livelihoods. Floods on the other hand are likely to increase and flood prevention and preparations will become essential;
b. Changes in sediment dynamics. Changes in river flows and erosion are expected to change the sediment dynamics of the river, which may have profound impacts on the ecosystem and the services that it provides. Little is currently known about the sediment changes;
c. Changes in water quality. While the current water quality is perceived to be good further economic development may lead to more pollution (e.g. fertilisers, pesticides and industrial pollutants). Water quality monitoring and pollution control will therefore be essential in future; and
d. Changes in the abundance and distribution of biota. Population growth, land use changes and changes in flow dynamics and water quality can all affect the ecosystem and biota. This could lead to loss of natural capital, ecosystem services, livelihood losses and lower economic production, as the different TDA scenarios show.
To address these concerns and their drivers, the SAP has formulated six indicative management objectives (OKACOM 2011b):
1. The sustainable management of the Cubango/Okavango basin is based on a shared basin-wide vision and jointly agreed decision framework;
2. Decisions are based on solid scientific analysis of available data and information and improved basin knowledge through research programmes designed to answer management questions;
3. Focused environmental and socio-economic monitoring programmes to support management decisions and track long-term trends are established and strengthened, and the results are used in adaptive management strategies;
4. Integrated planning criteria and objectives for sustainable development of water resources of the Cubango/Okavango basin are agreed and established;
5. The livelihoods of the basin’s peoples are improved; and
6. Technical capacity in the basin and involvement of stakeholders in SAP and NAP implementation is improved.
The plan is that through the SAP a Basin Development and Management Framework (BDMF) will be developed with a long term vision for the basin and agreement about the ‘development space’ and its use. The latter includes the need to agree on mechanisms
2 Despite the expected increase in run off due to climate change; climate change will increase variability.
4 Cubango-Okavango River Basin Water Audit (CORBWA) Project Synthesis Report
and guidelines for water allocations and benefit sharing. The BDMF will be built around four, interrelated, thematic areas:
i. Livelihoods and socio-economic development;
ii. Water resources management;
iii. Land management; and
iv. Environment and biodiversity.
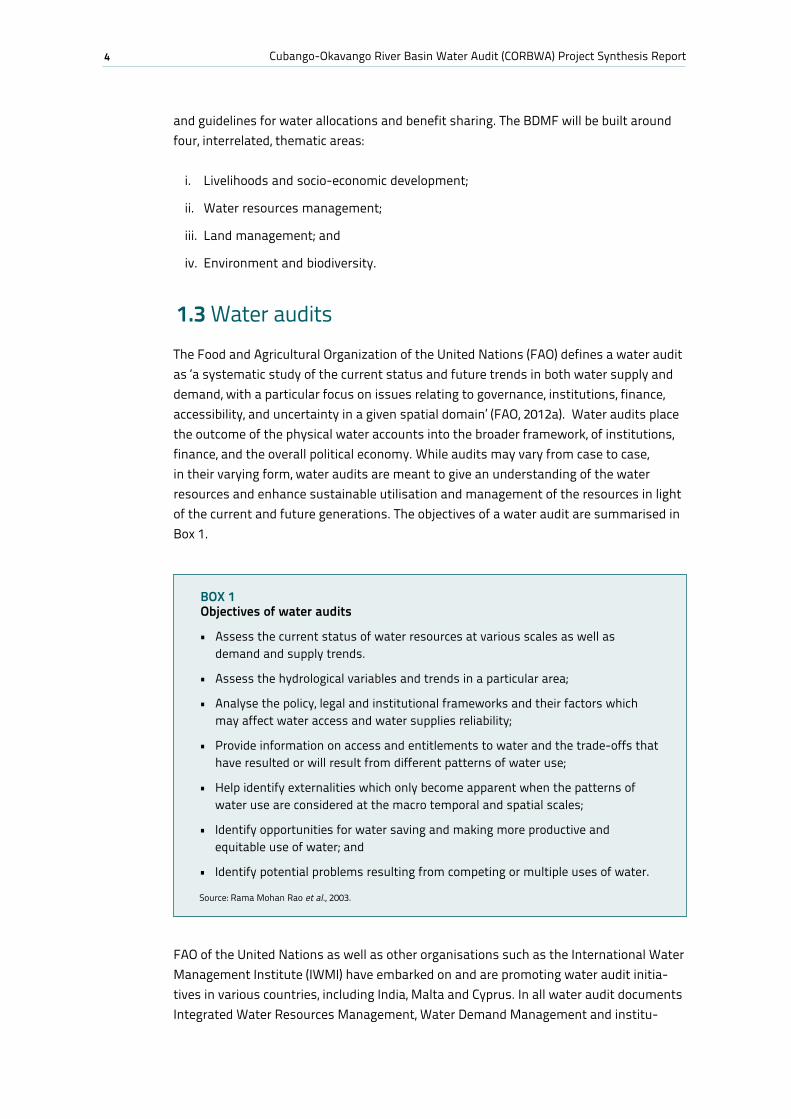
1.3 Water audits The Food and Agricultural Organization of the United Nations (FAO) defines a water audit as ‘a systematic study of the current status and future trends in both water supply and demand, with a particular focus on issues relating to governance, institutions, finance, accessibility, and uncertainty in a given spatial domain’ (FAO, 2012a). Water audits place the outcome of the physical water accounts into the broader framework, of institutions, finance, and the overall political economy. While audits may vary from case to case, in their varying form, water audits are meant to give an understanding of the water resources and enhance sustainable utilisation and management of the resources in light of the current and future generations. The objectives of a water audit are summarised in Box 1.
FAO of the United Nations as well as other organisations such as the International Water Management Institute (IWMI) have embarked on and are promoting water audit initia-tives in various countries, including India, Malta and Cyprus. In all water audit documents Integrated Water Resources Management, Water Demand Management and institu-
BOx 1 Objectives of water audits • Assessthecurrentstatusofwaterresourcesatvariousscalesaswellas
demand and supply trends.
• Assessthehydrologicalvariablesandtrendsinaparticulararea;
• Analysethepolicy,legalandinstitutionalframeworksandtheirfactorswhichmay affect water access and water supplies reliability;
• Provideinformationonaccessandentitlementstowaterandthetrade-offsthathave resulted or will result from different patterns of water use;
• Helpidentifyexternalitieswhichonlybecomeapparentwhenthepatternsofwater use are considered at the macro temporal and spatial scales;
• Identifyopportunitiesforwatersavingandmakingmoreproductiveandequitable use of water; and
• Identifypotentialproblemsresultingfromcompetingormultipleusesofwater.
Source: Rama Mohan Rao et al., 2003.
51. Introduction
tional aspects of water management were prominent. Moreover, although a water audit specifically targets water resources, it also needs to consider use and management of related natural resources such as land as they have a huge implication on water avail-ability and use.
1.4 Approach & methodology
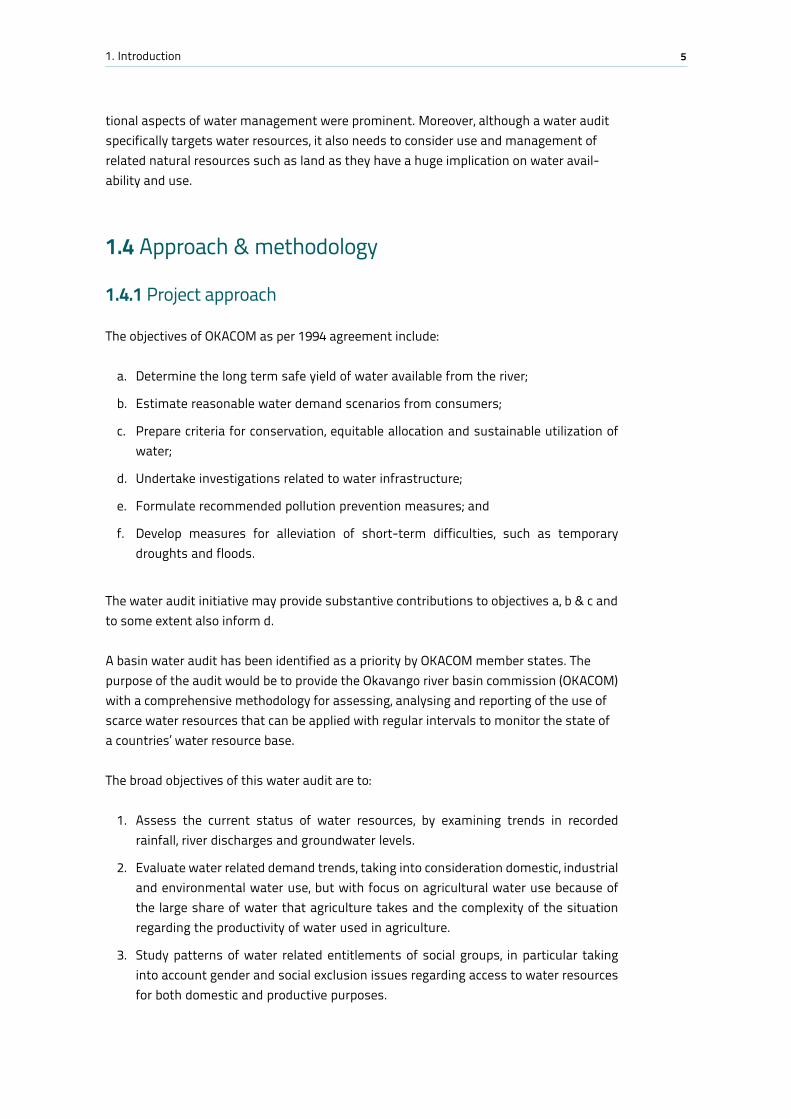
1.4.1 Project approach The objectives of OKACOM as per 1994 agreement include:
a. Determine the long term safe yield of water available from the river;
b. Estimate reasonable water demand scenarios from consumers;
c. Prepare criteria for conservation, equitable allocation and sustainable utilization of water;
d. Undertake investigations related to water infrastructure;
e. Formulate recommended pollution prevention measures; and
f. Develop measures for alleviation of short-term difficulties, such as temporary droughts and floods.
The water audit initiative may provide substantive contributions to objectives a, b & c and to some extent also inform d.
A basin water audit has been identified as a priority by OKACOM member states. The purpose of the audit would be to provide the Okavango river basin commission (OKACOM) with a comprehensive methodology for assessing, analysing and reporting of the use of scarce water resources that can be applied with regular intervals to monitor the state of a countries’ water resource base.
The broad objectives of this water audit are to:
1. Assess the current status of water resources, by examining trends in recorded rainfall, river discharges and groundwater levels.
2. Evaluate water related demand trends, taking into consideration domestic, industrial and environmental water use, but with focus on agricultural water use because of the large share of water that agriculture takes and the complexity of the situation regarding the productivity of water used in agriculture.
3. Study patterns of water related entitlements of social groups, in particular taking into account gender and social exclusion issues regarding access to water resources for both domestic and productive purposes.
6 Cubango-Okavango River Basin Water Audit (CORBWA) Project Synthesis Report
4. Assess the functionality of water related policies and institutions at different administrative levels including reviewing of water legislation and mapping of existing government institutions dealing with water.
5. Provide decision makers with a comprehensive set of policy options to increase the capacity to cope with water scarcity and improve their water management in general and water productivity of agricultural production in particular.
The project builds on the work of the GEF funded Transboundary Diagnostic Assessment of the Okavango basin (OKACOM, 2011a).
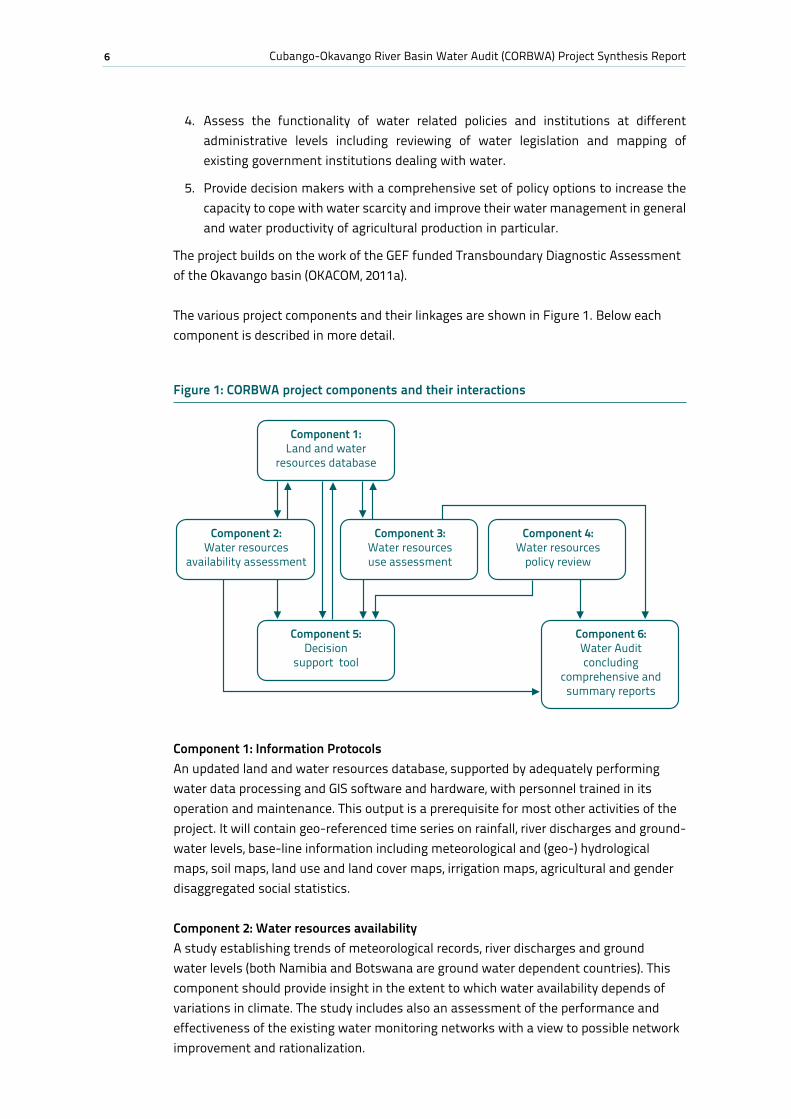
The various project components and their linkages are shown in Figure 1. Below each component is described in more detail.
Figure 1: CORBWA project components and their interactions
Component 1: Information ProtocolsAn updated land and water resources database, supported by adequately performing water data processing and GIS software and hardware, with personnel trained in its operation and maintenance. This output is a prerequisite for most other activities of the project. It will contain geo-referenced time series on rainfall, river discharges and ground-water levels, base-line information including meteorological and (geo-) hydrological maps, soil maps, land use and land cover maps, irrigation maps, agricultural and gender disaggregated social statistics.
Component 2: Water resources availabilityA study establishing trends of meteorological records, river discharges and ground water levels (both Namibia and Botswana are ground water dependent countries). This component should provide insight in the extent to which water availability depends of variations in climate. The study includes also an assessment of the performance and effectiveness of the existing water monitoring networks with a view to possible network improvement and rationalization.
Component 1:Land and water
resources database
Component 5:Decision
support tool
Component 6:Water Audit concluding
comprehensive and summary reports
Component 2:Water resources
availability assessment
Component 3:Water resources use assessment
Component 4:Water resources
policy review
71. Introduction
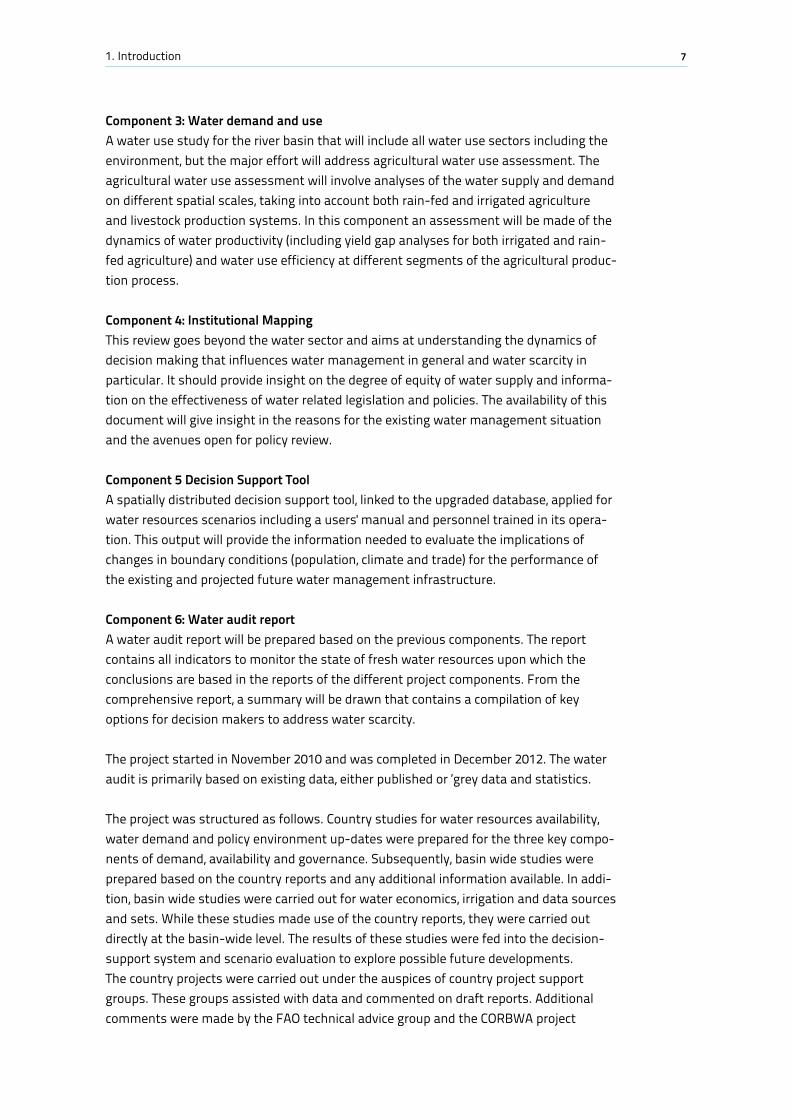
Component 3: Water demand and use A water use study for the river basin that will include all water use sectors including the environment, but the major effort will address agricultural water use assessment. The agricultural water use assessment will involve analyses of the water supply and demand on different spatial scales, taking into account both rain-fed and irrigated agriculture and livestock production systems. In this component an assessment will be made of the dynamics of water productivity (including yield gap analyses for both irrigated and rain-fed agriculture) and water use efficiency at different segments of the agricultural produc-tion process.
Component 4: Institutional MappingThis review goes beyond the water sector and aims at understanding the dynamics of decision making that influences water management in general and water scarcity in particular. It should provide insight on the degree of equity of water supply and informa-tion on the effectiveness of water related legislation and policies. The availability of this document will give insight in the reasons for the existing water management situation and the avenues open for policy review.
Component 5 Decision Support ToolA spatially distributed decision support tool, linked to the upgraded database, applied for water resources scenarios including a users' manual and personnel trained in its opera-tion. This output will provide the information needed to evaluate the implications of changes in boundary conditions (population, climate and trade) for the performance of the existing and projected future water management infrastructure.
Component 6: Water audit reportA water audit report will be prepared based on the previous components. The report contains all indicators to monitor the state of fresh water resources upon which the conclusions are based in the reports of the different project components. From the comprehensive report, a summary will be drawn that contains a compilation of key options for decision makers to address water scarcity.
The project started in November 2010 and was completed in December 2012. The water audit is primarily based on existing data, either published or ‘grey data and statistics.
The project was structured as follows. Country studies for water resources availability, water demand and policy environment up-dates were prepared for the three key compo-nents of demand, availability and governance. Subsequently, basin wide studies were prepared based on the country reports and any additional information available. In addi-tion, basin wide studies were carried out for water economics, irrigation and data sources and sets. While these studies made use of the country reports, they were carried out directly at the basin-wide level. The results of these studies were fed into the decision-support system and scenario evaluation to explore possible future developments. The country projects were carried out under the auspices of country project support groups. These groups assisted with data and commented on draft reports. Additional comments were made by the FAO technical advice group and the CORBWA project
8 Cubango-Okavango River Basin Water Audit (CORBWA) Project Synthesis Report
coordinator. For each component, a wide range of methods was used, including desk top analysis, statistical analysis and modelling (hydrology) and key informant interviews.
A number of challenges were encountered that influenced progress and the project outputs: These include:
a. Data gaps and shortages as well as limited access to EPSMO data;
b. Delays in identification and selection of consultants for the project’s studies;
c. Communication difficulties, particularly with respect to Angola;
d. Delayed report submissions by consultants; and
e. Limited feed-back and support from the country project support groups.
In the next sub section, the methodologies used for each component are discussed. More details can be found in the country reports for each component and in the basin wide reports.
1.4.2 Methodology for the assessment of land and water database CORBWA has built, for this component, on the land and water database developed and compiled for the EPSMO project, while trying to enhance its documentation, distribution and data sharing options.
EPSMO spatial database has been made available on the internet, although not fully downloadable, through the Okavango Delta Information System (ODIS, http://odis.orc.ub.bw/odis/), which is unfortunately often unavailable, and through the Okavango Basin Information System of the Future Okavango research project (http://leutra.geogr.uni-jena.de/obis/metadata//start.php). In order to support availability and access to EPSMO data CORBWA has produced a DVD with the full spatial database including docu-mentation, it distributed it to project members, and made it available for download on FAO GeoNetwork open data catalogue (http://www.fao.org/geonetwork). Furthermore specific studies have been commissioned to Okavango Research Institute (ORI) focusing on i) technical specifications and options for the organization and maintenance of a distributed database, and ii) review of available supporting materials for the database (CORBWA report: VanderPost et al., 2012).
1.4.3 Methodology for water resources availability assessment
This component comprises two main analyses:
a. Status and extent of water resources-related observation networks; and
b. Current conditions and recent trends in water resources related variables.
91. Introduction
The first is done by looking at spatial coverage, temporal resolution and variables collected through ground observation networks in the member countries but also consid-ering alternative data sources such as gridded rainfall products and remote sensing derived products. In addition, the project explored use of alternative data sources to estimate actual evapotranspiration in the different land use classes by commissioning a rapid Remote Sensing water accounting study (CORBWA report: Droogers et al., 2010)
The second one reviews current conditions and recent trends in stream flow, rainfall and other climatic variables as described in the reports submitted by the member countries. In the case of Angola, where data from 1974 onwards are not available, an estimate is made on the basis of gridded rainfall products. An assessment of different methods for time series analysis is also provided in the basin wide synthesis report (Wolski, 2012).
1.4.4 Methodology for water use assessment
There is no comprehensive record of water abstraction and use of the water from the Cubango-Okavango River. Therefore, water use was estimated based on the best avail-able data and methods (as done for EPSMO and the TDA).
Estimate of water use were made for the following sectors: irrigation, livestock produc-tion, settlement use, tourism, mining and other uses. It should be noted that environ-mental water use and requirements are vital for the sustainability of the basin’s ecosys-tems but it is ‘use without abstraction’. Arguably, all water not abstracted for human activities is used for the environment. Unfortunately, previous research and studies have not yielded figures for ecological water requirements (EWR); although sometimes (e.g. Namibia) 25 percent of the minimum flow is used as for a reference EWR (Krugmann et al., 2012). Further investigation of EWR figures is needed to determine the development space.
Terms
Irrigation water useIn the Namibian country study, Krugmann & Alberts (2012) explain that water abstraction for irrigation can be determined in three ways:
• Measurement of actual water abstraction volumes, by means of water meters inareas where water charges are levied and/or water permits are required;
• Based crop water requirements calculated on the basis of information on cropsgrown; and
• Basedontheareasirrigatedandtypicalwaterallocationsperunitarea.
The first method is more accurate, but the lack of irrigation water metering/reporting, necessitated the use of the second and third method.
10 Cubango-Okavango River Basin Water Audit (CORBWA) Project Synthesis Report
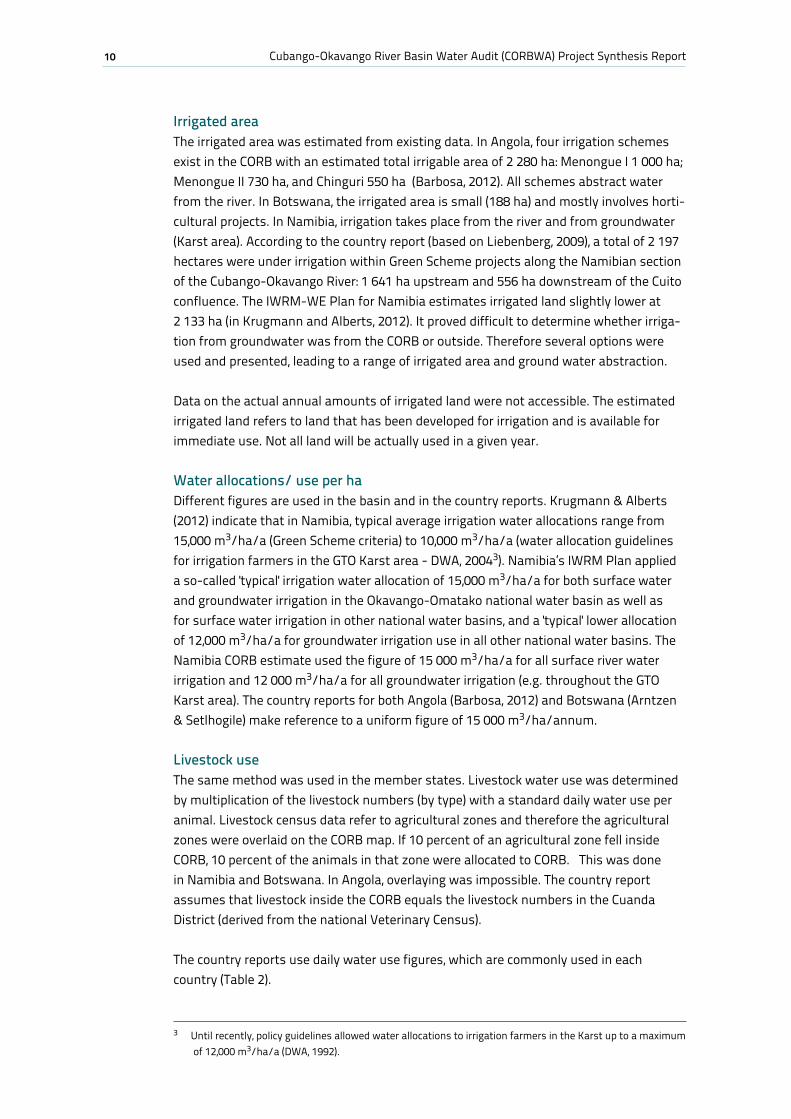
Irrigated areaThe irrigated area was estimated from existing data. In Angola, four irrigation schemes exist in the CORB with an estimated total irrigable area of 2 280 ha: Menongue I 1 000 ha; Menongue II 730 ha, and Chinguri 550 ha (Barbosa, 2012). All schemes abstract water from the river. In Botswana, the irrigated area is small (188 ha) and mostly involves horti-cultural projects. In Namibia, irrigation takes place from the river and from groundwater (Karst area). According to the country report (based on Liebenberg, 2009), a total of 2 197 hectares were under irrigation within Green Scheme projects along the Namibian section of the Cubango-Okavango River: 1 641 ha upstream and 556 ha downstream of the Cuito confluence. The IWRM-WE Plan for Namibia estimates irrigated land slightly lower at 2 133 ha (in Krugmann and Alberts, 2012). It proved difficult to determine whether irriga-tion from groundwater was from the CORB or outside. Therefore several options were used and presented, leading to a range of irrigated area and ground water abstraction.
Data on the actual annual amounts of irrigated land were not accessible. The estimated irrigated land refers to land that has been developed for irrigation and is available for immediate use. Not all land will be actually used in a given year.
Water allocations/ use per haDifferent figures are used in the basin and in the country reports. Krugmann & Alberts (2012) indicate that in Namibia, typical average irrigation water allocations range from 15,000 m3/ha/a (Green Scheme criteria) to 10,000 m3/ha/a (water allocation guidelines for irrigation farmers in the GTO Karst area - DWA, 20043). Namibia’s IWRM Plan applied a so-called 'typical' irrigation water allocation of 15,000 m3/ha/a for both surface water and groundwater irrigation in the Okavango-Omatako national water basin as well as for surface water irrigation in other national water basins, and a 'typical' lower allocation of 12,000 m3/ha/a for groundwater irrigation use in all other national water basins. The Namibia CORB estimate used the figure of 15 000 m3/ha/a for all surface river water irrigation and 12 000 m3/ha/a for all groundwater irrigation (e.g. throughout the GTO Karst area). The country reports for both Angola (Barbosa, 2012) and Botswana (Arntzen & Setlhogile) make reference to a uniform figure of 15 000 m3/ha/annum.
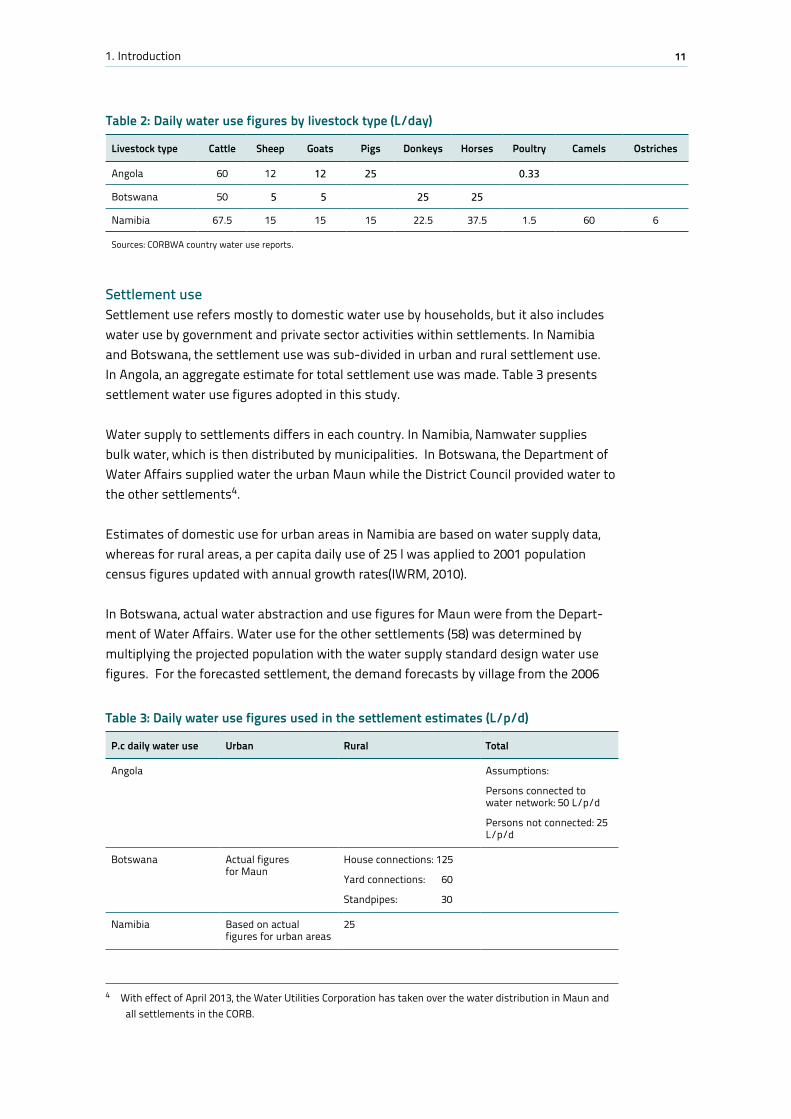
Livestock useThe same method was used in the member states. Livestock water use was determined by multiplication of the livestock numbers (by type) with a standard daily water use per animal. Livestock census data refer to agricultural zones and therefore the agricultural zones were overlaid on the CORB map. If 10 percent of an agricultural zone fell inside CORB, 10 percent of the animals in that zone were allocated to CORB. This was done in Namibia and Botswana. In Angola, overlaying was impossible. The country report assumes that livestock inside the CORB equals the livestock numbers in the Cuanda District (derived from the national Veterinary Census).
The country reports use daily water use figures, which are commonly used in each country (Table 2).
3 Until recently, policy guidelines allowed water allocations to irrigation farmers in the Karst up to a maximum of 12,000 m3/ha/a (DWA, 1992).
111. Introduction
Settlement useSettlement use refers mostly to domestic water use by households, but it also includes water use by government and private sector activities within settlements. In Namibia and Botswana, the settlement use was sub-divided in urban and rural settlement use. In Angola, an aggregate estimate for total settlement use was made. Table 3 presents settlement water use figures adopted in this study.
Water supply to settlements differs in each country. In Namibia, Namwater supplies bulk water, which is then distributed by municipalities. In Botswana, the Department of Water Affairs supplied water the urban Maun while the District Council provided water to the other settlements4.
Estimates of domestic use for urban areas in Namibia are based on water supply data, whereas for rural areas, a per capita daily use of 25 l was applied to 2001 population census figures updated with annual growth rates(IWRM, 2010).
In Botswana, actual water abstraction and use figures for Maun were from the Depart-ment of Water Affairs. Water use for the other settlements (58) was determined by multiplying the projected population with the water supply standard design water use figures. For the forecasted settlement, the demand forecasts by village from the 2006
4 With effect of April 2013, the Water Utilities Corporation has taken over the water distribution in Maun and all settlements in the CORB.
Table 2: Daily water use figures by livestock type (L/day)
Livestock type Cattle Sheep Goats Pigs Donkeys Horses Poultry Camels Ostriches
Angola 60 12 12 25 0.33
Botswana 50 5 5 25 25
Namibia 67.5 15 15 15 22.5 37.5 1.5 60 6
Sources: CORBWA country water use reports.
Table 3: Daily water use figures used in the settlement estimates (L/p/d)
P.c daily water use Urban Rural Total
Angola Assumptions:
Persons connected to water network: 50 L/p/d
Persons not connected: 25 L/p/d
Botswana Actual figures for Maun
House connections: 125
Yard connections: 60
Standpipes: 30
Namibia Based on actual figures for urban areas
25
12 Cubango-Okavango River Basin Water Audit (CORBWA) Project Synthesis Report
review of the BNWMP (SMEC et al., 2006), which distinguished household, institutional and commercial use. The water source of each village (either surface or groundwater) was determined and subsequently estimates were developed for settlement abstraction and use of groundwater and surface water.
No actual water use data for settlements are available for Angola. Water distribution networks are limited and need repair. Consequently, many households are not connected to a distribution network. Barbosa (2012) estimated water use in area/settlements5 by determining the estimated population size, the number of people connected to water distribution network and daily water use figures for those connected (50 L/p/d) and not connected (25 L/p/d). Tourism outside settlementsBotswana and Namibia have significant tourism facilities outside settlements, which have to abstract and supply their own water sources.
In Botswana, a stepwise methodology was followed. First, a comprehensive list of tourist facilities outside formal settlements was compiled based on a variety of sources and statistics. Second, tourist numbers and tourist days were determined based on the number of beds and occupancy rate. The number of employees was determined by the number of rooms multiplied by 1.57 (employees/room). The third step was to estimate the water consumption of different types of tourists and of employees. For tourists, empirical data from Aqualogic (2008) were used showing an average water usage of 205 L/d/tourist for lodges and camps. It was assumed that employees use the same amount of water.
Water use by tourists per year=total number of tourist in year*daily water use/ tourist *average length of stay (nights)
Use by employees per year = total number of employees*daily water use/employee day*number of days in a year.
Aqualogic (2008) has found that 60 percent of these facilities abstract water directly from the Delta while 30 percent use hand dug wells and 10 percent utilise boreholes. In Namibia, water demand by tourism was estimated from the water demand as calcu-lated in the IWRM Plan for national basins sharing the CORB-Namibia (with adjustment for the location of tourism facilities inside and outside CORB). Two key assumptions made by the IWRM Plan were therefore implicitly used:
• Average water demand of 100 litres per available bed per day (without explicitly factoring in the actual bed occupancy rate)
• Averagewaterdemandof15,000m3 per tourism establishment per annum (assuming that on average 1 hectare per establishment is irrigated for landscaping irrigation).
5 Calai, Cuangar, Cuchi, Cuito Cuanavale, Dirico, Longa, Mavinga, Menongue & Rivungo.
131. Introduction
Mining sectorThe mining sector is a small, but emerging sector in the basin. No mines are reported to exist in the Angolan part of CORB. In Botswana, most mining activities are at explora-tion and prospecting stages. At the time of the country study, there were no operational mines but a copper-silver mine (Bosetu) was expected to start operations in 2012. The estimated water withdrawal and use for the Boseto Copper mine were derived from the Environmental Impact Assessment report (SRK Consulting, 2010). In Namibia, the Otjo-zondu Holdings Ltd. (Manganese Project) was at a feasibility study phase during the time of the country study, and it was considered likely that Kombat (led, zinc and vanadium) and Berg Aukas (copper) mines would be re-activated in the near future. Water abstrac-tion estimates for the Otjozndu mine were taken from the IWRM Plan, but it is unclear whether the estimated 5 000 m3/annum water demand refers to the preparatory drilling operations or referring to the mine operation after completion of the feasibility study. Other usesThere is presently no known industrial sector presence outside settlements in any of the member states. Other uses refer to aquaculture (Angola). No other use was documented in Botswana and Namibia.
It must be pointed out once more that the use estimates refer to water that has been abstracted from the river or from aquifers for human activities. It excludes environmental use and requirements. The Botswana country study estimated direct water use by wild-life as determined by the number of wildlife by species (taken from aerial survey results) multiplied by standard figures for daily water use (ranging from 1 to 300 L/animal/day depending on the species). The water use was substantial in the order of 7 to 10 Mm3 per annum, mostly for elephants.
1.4.5 Methodology for policy analysis
During the inception phase, it was agreed that the CORBWA policy analysis would be based on the existing EPSMO report and desk top up-dates of policies and legislation for each member state. First, the EPSMO report was reviewed and gaps and needs for up-dates were identified. Next, country studies were undertaken in 2011 to fill the gaps and up-date the policy and legislative review. The country reports were reviewed by the country support groups. Finally, country studies were integrated into a basin wide policy analysis based on IWRM and the SADC Protocol Framework.
1.4.6 Methodology for decision support modelling & scenario evaluation
Discussions on decision support tools needs for OKACOM have been on-going during project duration and, when a specific tool had to be indicated to carry out this component, it was decided together with OKASEC and countries Project Support Groups (PSG) to build
14 Cubango-Okavango River Basin Water Audit (CORBWA) Project Synthesis Report
again on EPSMO project outputs and make use of the Water Evaluation and Planning System (WEAP) application developed in that framework. The CORBWA project has then undergone a review of model set-up and assumptions with specific focus on the irriga-tion water use, has updated water use figures on the basis of outputs of Component 3, and has drawn examples of 'development options' which could be used as a starting point for scenario building process in OKACOM. Documentation of all assumptions and param-eterization of variables used in the WEAP application is given in section 3.4.3 to 3.4.6 of this document.
In addition, a rapid Remote Sensing water accounting (WA+) study has been commis-sioned to complement the ground based information and compare approaches and results. Methodological details and results of WA+ study are available in the CORBWA report 'Water Accounting Plus (CORBWA report: Droogers, P. et al., 2010)'.
152. Trends in water resources availability
2. Trends in water resources availability6
There is little evidence for overall long-term trend in surface water resources and factors affecting them in the Okavango basin. The only significant long-term trends were the negative trends in total annual discharges of the Cuito and in the minimum monthly discharges of the Okavango at Mohembo. There is, however, evidence of periodic depar-tures from long-term mean conditions. Differences between means of 30-year non-overlapping periods are statistically significant in station rainfall, gridded rainfall and in river discharges. The effect is generally stronger in the downstream locations, particularly downstream of the Okavango Delta, but is not evident in the ephemeral part of the basin in Namibia.
The presence of high and low (or wet and dry) phases in the long-term takes the form of oscillatory-like pattern, with a low phase in 1920-1930s, a high in 1950-1970, a low in 1980-1990s, and an onset of high phase in the 2000s. It is unclear whether the pattern is random or periodic. The statistical analyses of time series of the Okavango, Kunyere and Thamalakane confirm recent trends in total, maximum and minimum annual values consistent with the multi-decadal variability pattern described above. There is a break point around 1996 where trend towards drier conditions changes into a trend towards wetter conditions. Both pre-1996 downward trend and post-1996 upward trend in river discharges are statistically significant at 0.05 confidence level. Similar, although weaker trends are present in rainfall, but do not attain statistical significance. Also, the generic results of groundwater storage analysis based on GRACE data show increase since 2003.
Trends in air temperature are difficult to generalize. At Maun, there is a clear trend towards higher values in minimum monthly temperature, for each month. There seems not to be any clear trends in Shakawe and Rundu, and actually reduction in wintertime temperatures in Kasane. The trends are statistically significant only in the long-term (>50 years), while no statistical significance is attained by the recent 30-year trends. For Maun and Shakawe, the long-term temperature patterns seem to be consistent with the increase in temperatures expected from anthropogenic climate change. The pattern of reduction of temperatures in Kasane should be studied more extensively to reveal its causal factors.
With the current understanding of drivers of the multidecadal variability in the Okavango region it is impossible to unconditionally extrapolate the post-1996 trend into the future. Around 2009 the system has entered a wet phase, and it is likely, but not certain, that it will remain there in the next decades.
6 This chapter is adapted from the basin wide water resources availability report by Wolski (2012).
16 Cubango-Okavango River Basin Water Audit (CORBWA) Project Synthesis Report
2.1 Trends
2.1.1 River discharges
The following generalisations can be made about the analyses of variability of river discharges.
There is a weak negative trend in Okavango River discharges downstream of Cuito confluence (in Cuito, Mukwe and Mohembo) in the period of record (1940s-present). However, the trend in the Cubango (at Rundu) appears to be weakly positive. A note of caution: the nature of interannual variability in the Okavango causes that the significance of long-term trends depends on the length of the analysed time series. For example, the Mukwe record in Namibia shows that inclusion of just three years at the end of the time series has changed the trend from statistically significant to not significant. Thus, the long-term trends presented above have to be treated with caution, as their significance may change within the next years;
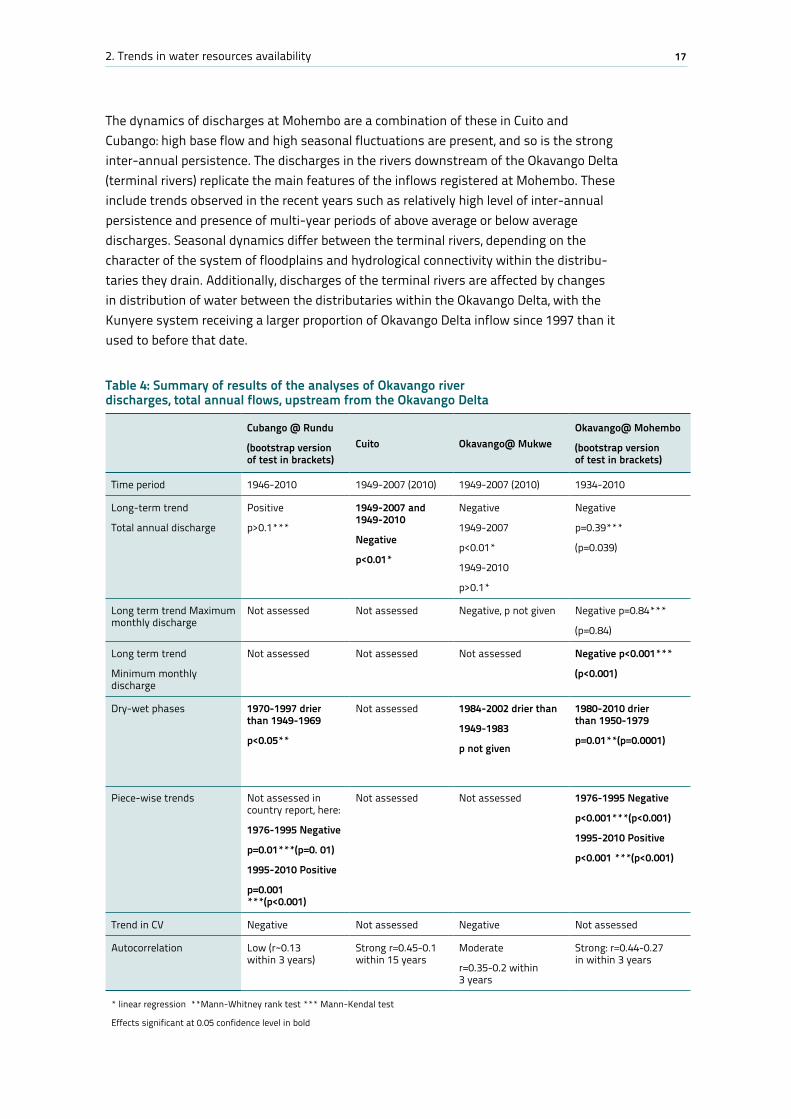
Multi-year periods could be identified which significantly differ in mean discharges. No consistent method has been used to assess the beginning and end of such periods, thus the assessments differ between locations. In general, however, the period around 1980-1990 appears to be drier than the preceding and following years. Longer-term data from Mohembo as well as the gridded rainfall data indicate that another dry period occurred in 1920-1930s. Piecewise trend analysis indicates a strong and significant decadal-scale negative trend in the Okavango river discharges at Mohembo in the period of 1976-1996, and a significant positive trend since 1997. Although not explicitly analysed, similar patterns are present (assessed visually) in Mukwe and Rundu records (Table 4)
There is an indication that interannual variability of river discharges has reduced throughout time, but the method used in the analysis (trend on highly auto correlated time series of moving window average coefficient of variation, CV) does not allow for determination of statistical significance of this finding.
The Okavango River discharges at the analysed stations (all of which are located in the mid and lower reaches of the Okavango Delta) are poorly correlated with local rainfall. Correlation is better with rainfall in headwaters of the system.
The two main tributaries (Cubango and Cuito) differ strongly in the character of seasonal and inter-annual variability of discharges. The Cuito River has a strong base flow compo-nent with lower seasonal fluctuations. Cubango is characterized by high seasonal fluctu-ations and lower base flow. Autocorrelation on the inter-annual basis is stronger in Cuito and weaker in Cubango. As the significant autocorrelation is not present in rainfall, the observed autocorrelation in river discharges must result from meteorological processes within the headwaters – most likely the combination of groundwater and wetland carry-over storage effects.
172. Trends in water resources availability
The dynamics of discharges at Mohembo are a combination of these in Cuito and Cubango: high base flow and high seasonal fluctuations are present, and so is the strong inter-annual persistence. The discharges in the rivers downstream of the Okavango Delta (terminal rivers) replicate the main features of the inflows registered at Mohembo. These include trends observed in the recent years such as relatively high level of inter-annual persistence and presence of multi-year periods of above average or below average discharges. Seasonal dynamics differ between the terminal rivers, depending on the character of the system of floodplains and hydrological connectivity within the distribu-taries they drain. Additionally, discharges of the terminal rivers are affected by changes in distribution of water between the distributaries within the Okavango Delta, with the Kunyere system receiving a larger proportion of Okavango Delta inflow since 1997 than it used to before that date.
Table 4: Summary of results of the analyses of Okavango river discharges, total annual flows, upstream from the Okavango Delta
Cubango @ Rundu
(bootstrap version of test in brackets)
Cuito Okavango@ MukweOkavango@ Mohembo
(bootstrap version of test in brackets)
Time period 1946-2010 1949-2007 (2010) 1949-2007 (2010) 1934-2010
Long-term trend
Total annual discharge
Positive
p>0.1***
1949-2007 and 1949-2010
Negative
p<0.01*
Negative
1949-2007
p<0.01*
1949-2010
p>0.1*
Negative
p=0.39***
(p=0.039)
Long term trend Maximum monthly discharge
Not assessed Not assessed Negative, p not given Negative p=0.84***
(p=0.84)
Long term trend
Minimum monthly discharge
Not assessed Not assessed Not assessed Negative p<0.001***
(p<0.001)
Dry-wet phases 1970-1997 drier than 1949-1969
p<0.05**
Not assessed 1984-2002 drier than
1949-1983
p not given
1980-2010 drier than 1950-1979
p=0.01**(p=0.0001)
Piece-wise trends Not assessed in country report, here:
1976-1995 Negative
p=0.01***(p=0. 01)
1995-2010 Positive
p=0.001 ***(p<0.001)
Not assessed Not assessed 1976-1995 Negative
p<0.001***(p<0.001)
1995-2010 Positive
p<0.001 ***(p<0.001)
Trend in CV Negative Not assessed Negative Not assessed
Autocorrelation Low (r~0.13 within 3 years)
Strong r=0.45-0.1 within 15 years
Moderate
r=0.35-0.2 within 3 years
Strong: r=0.44-0.27 in within 3 years
* linear regression **Mann-Whitney rank test *** Mann-Kendal test
Effects significant at 0.05 confidence level in bold
18 Cubango-Okavango River Basin Water Audit (CORBWA) Project Synthesis Report
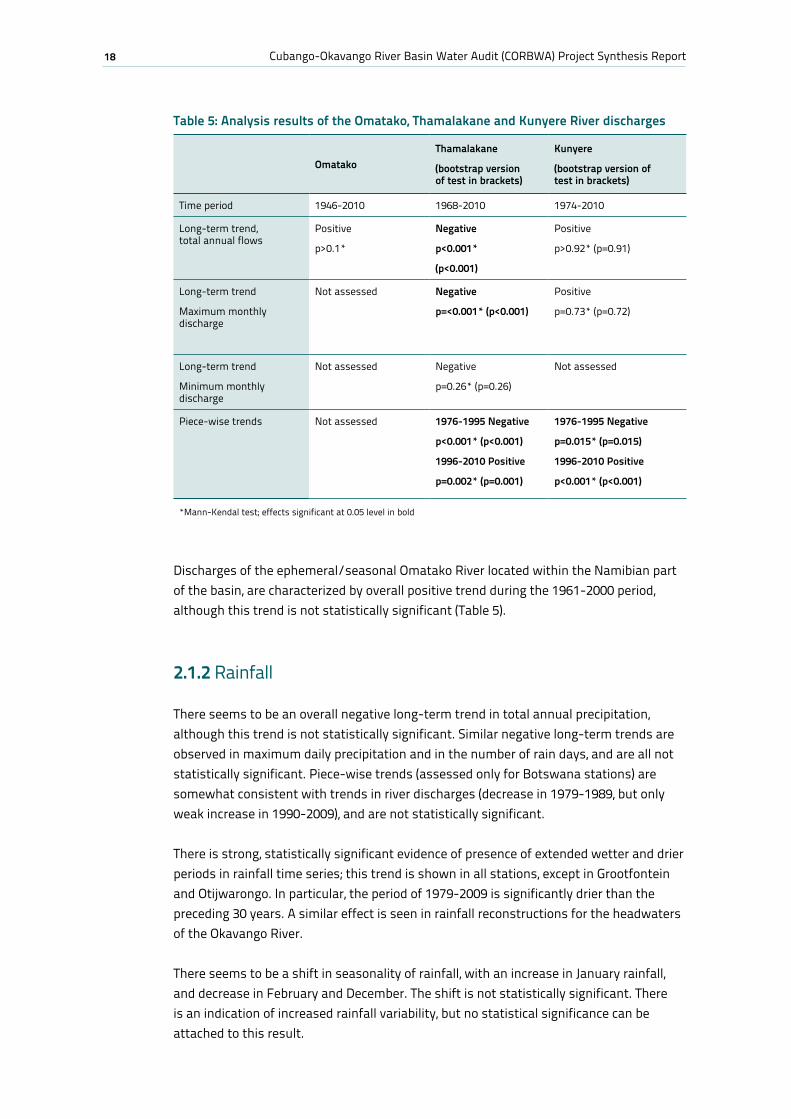
Discharges of the ephemeral/seasonal Omatako River located within the Namibian part of the basin, are characterized by overall positive trend during the 1961-2000 period, although this trend is not statistically significant (Table 5).
2.1.2 Rainfall
There seems to be an overall negative long-term trend in total annual precipitation, although this trend is not statistically significant. Similar negative long-term trends are observed in maximum daily precipitation and in the number of rain days, and are all not statistically significant. Piece-wise trends (assessed only for Botswana stations) are somewhat consistent with trends in river discharges (decrease in 1979-1989, but only weak increase in 1990-2009), and are not statistically significant.
There is strong, statistically significant evidence of presence of extended wetter and drier periods in rainfall time series; this trend is shown in all stations, except in Grootfontein and Otijwarongo. In particular, the period of 1979-2009 is significantly drier than the preceding 30 years. A similar effect is seen in rainfall reconstructions for the headwaters of the Okavango River.
There seems to be a shift in seasonality of rainfall, with an increase in January rainfall, and decrease in February and December. The shift is not statistically significant. There is an indication of increased rainfall variability, but no statistical significance can be attached to this result.
Table 5: Analysis results of the Omatako, Thamalakane and Kunyere River discharges
OmatakoThamalakane
(bootstrap version of test in brackets)
Kunyere
(bootstrap version of test in brackets)
Time period 1946-2010 1968-2010 1974-2010
Long-term trend, total annual flows
Positive
p>0.1*
Negative
p<0.001*
(p<0.001)
Positive
p>0.92* (p=0.91)
Long-term trend
Maximum monthly discharge
Not assessed Negative
p=<0.001* (p<0.001)
Positive
p=0.73* (p=0.72)
Long-term trend
Minimum monthly discharge
Not assessed Negative
p=0.26* (p=0.26)
Not assessed
Piece-wise trends Not assessed 1976-1995 Negative
p<0.001* (p<0.001)
1996-2010 Positive
p=0.002* (p=0.001)
1976-1995 Negative
p=0.015* (p=0.015)
1996-2010 Positive
p<0.001* (p<0.001)
*Mann-Kendal test; effects significant at 0.05 level in bold
192. Trends in water resources availability
2.1.3 Other climatic variables
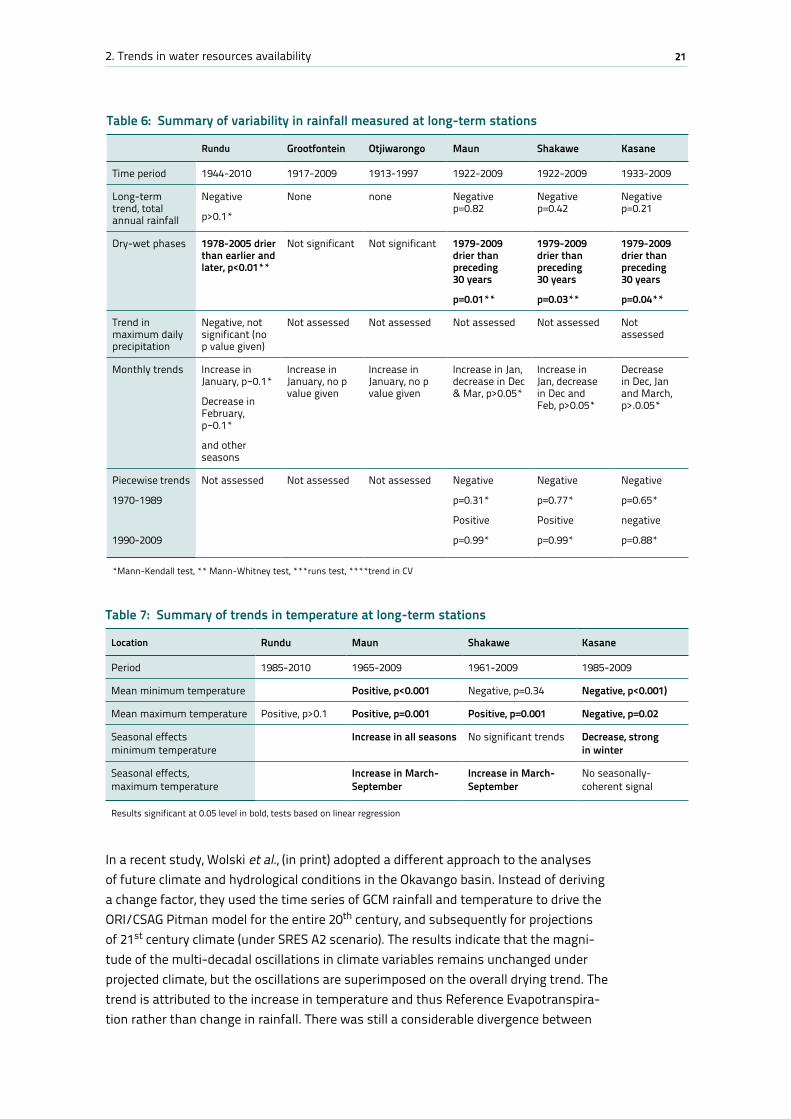
Few other climatic data were available in the country reports for further analysis. The Namibian report only includes 1984-2010 maximum temperature (most probably annual mean of monthly average maximum daily temperature) at Rundu. In Botswana report, minimum and maximum temperatures (monthly average minimum and maximum daily temperatures) for 1961-2009 for Maun and Shakawe and 1984-2009 for Kasane were analysed. The overall observations are summarised below.
There is relatively little coherency between stations in terms of longer-term trends for annual mean temperatures (Table 7 later). A positive, statistically not significant trend is present in the Rundu mean maximum temperature. The same (but significant) trend is found for Maun and Shakawe mean maximum temperatures; however, a negative trend is present in Kasane (to the north east of CORB).
For the annual mean minimum temperatures, a significant positive trend is observed in Maun, a non-significant negative trend is present in Shakawe and a significant negative trend in Kasane.
Seasonal trends are also not consistent between stations. Minimum temperature shows increase in all seasons at Maun, but no significant trend is present in Shakawe, while a significant decrease is observed in winter months in Kasane. Maximum temperature shows increase in March-September at Maun and Shakawe, but no coherent signal at Kasane. The above results are to be treated with care, as these were obtained using data provided by countries’ meteorological services without much quality control. In particular, Kasane data seem suspect, and it is possible that they contain non-homogeneity (moving of the station), but no information could be obtained to confirm/deny this.
Gridded dataset, CRU3.07, analysed for zones show a statistically significant increase in mean maximum temperatures and mean minimum temperatures in the period between mid-1940s till 2006 (in all zones), with p < 0.001. There is a decrease in temperatures observed in the preceding period.
2.1.4 Climate change and the Cubango Okavango River Basin
To explore the impacts of possible climate change on water resources of the basin, modelling activities carried with Pitman models in the Okavango basin were reviewed together with a description of datasets used in hydrological modelling of the Okavango basin. Both Pitman and WEAP have been repeatedly used in the basin (Pitman: Hughes et al., 2002, 2006 and 2010; Murray-Hudson et al., (2006); Milzow et al., (2010); Wolski, 2009; King et al., 2009; WEAP used in EPSMO and TDA; King et al., 2009 and OKACOM,
7 Climate Research Unit (CRU) rainfall and temperature datasets (http://ncas.nerc.ac.uk.)
20 Cubango-Okavango River Basin Water Audit (CORBWA) Project Synthesis Report
2011a). Furthermore, general approaches to analyses of climate change in the basin’s water resources context were reviewed together with earlier work carried out in the Okavango in the context of climate change impacts on water resources.
The study found that the available datasets, when used with the Pitman model, do not provide convincing simulations of the Okavango system’s hydrological responses. The tested satellite rainfall products are not able to replicate the pattern of inter-annual variability in river discharges. The gridded datasets are somewhat better, but these are not up-to-date: CRU dataset extends only till 2009, and UDEL8 till 2006. The combined GPCP9 dataset seems to provide the most accurate simulation. In particular, it replicates well the 1990s and 2000s, with only significant deviations during the high-flood years of 2010 and 2011. It is the most promising dataset for the operational use, and it is recom-mended that its use in the Okavango basin should be further explored. The disadvantage of this dataset is that it is not a near-real-time product. At the time of writing this report, only data till December 2011 were available. A logical step to bridge the gap between the GPCP data and needs for 'real-time' data would be to used satellite rainfall products. These are available with several hours to two days delay. Unfortunately, these data do not seem to adequately reflect rainfall conditions in the Okavango basin. It has to be noted, however, that the simulations with satellite rainfall products presented here are very simple.
The review of climate change approaches for the basin suggests that there is no single, unique answer to the question of climate change signal for a particular location or region. Many methods and datasets are available, but there seems not to be a scientific consensus as to which are better, more robust and universally applicable in the basin. Consequently, the assessment of climate change signal requires working with multiple models and ensemble simulations instead of relying on one particular method.
Regarding the climate change predictions, the study found considerable divergence between the different GCMs used in the analyses. These differences are larger in magni-tude than the change signal obtained from the individual GCMs. Consequently, no firm statements about the extent of climate change can be made at this stage. In the TDA (OKACOM, 2011a), the statistical downscaling was applied to the output of 10 GCMs, and RFE 2.0 satellite rainfall product was used as a basis for the procedure. There was still a large discrepancy between the GCMs, and importantly, the results indicated overall signal of rainfall change being positive (i.e. increase in the future), which was the opposite of the signal obtained from straight GCM data (which was on average negative, i.e. a decrease in the future.) The TDA approach (OKACOM, 2011a) suffers from the same deficiencies as earlier approaches, i.e. that the temporal structure of the future rainfall and tempera-ture time series remains identical to that of the past observations. Importantly, the TDA approach considered three scenarios: wet, moderate and dry, and derived indices for each of these conditions separately.
8 University of Delaware global rainfall dataset.9 Global Precipitation Climatology Project v2.2.
212. Trends in water resources availability
Table 6: Summary of variability in rainfall measured at long-term stations
Rundu Grootfontein Otjiwarongo Maun Shakawe Kasane
Time period 1944-2010 1917-2009 1913-1997 1922-2009 1922-2009 1933-2009
Long-term trend, total annual rainfall
Negative
p>0.1*
None none Negative p=0.82
Negative p=0.42
Negative p=0.21
Dry-wet phases 1978-2005 drier than earlier and later, p<0.01**
Not significant Not significant 1979-2009 drier than preceding 30 years
p=0.01**
1979-2009 drier than preceding 30 years
p=0.03**
1979-2009 drier than preceding 30 years
p=0.04**
Trend in maximum daily precipitation
Negative, not significant (no p value given)
Not assessed Not assessed Not assessed Not assessed Not assessed
Monthly trends Increase in January, p~0.1*
Decrease in February, p~0.1*
and other seasons
Increase in January, no p value given
Increase in January, no p value given
Increase in Jan, decrease in Dec & Mar, p>0.05*
Increase in Jan, decrease in Dec and Feb, p>0.05*
Decrease in Dec, Jan and March, p>.0.05*
Piecewise trends
1970-1989
1990-2009
Not assessed Not assessed Not assessed Negative
p=0.31*
Positive
p=0.99*
Negative
p=0.77*
Positive
p=0.99*
Negative
p=0.65*
negative
p=0.88*
*Mann-Kendall test, ** Mann-Whitney test, ***runs test, ****trend in CV
Table 7: Summary of trends in temperature at long-term stations
Location Rundu Maun Shakawe Kasane
Period 1985-2010 1965-2009 1961-2009 1985-2009
Mean minimum temperature Positive, p<0.001 Negative, p=0.34 Negative, p<0.001)
Mean maximum temperature Positive, p>0.1 Positive, p=0.001 Positive, p=0.001 Negative, p=0.02
Seasonal effects minimum temperature
Increase in all seasons No significant trends Decrease, strong in winter
Seasonal effects, maximum temperature
Increase in March-September
Increase in March-September
No seasonally-coherent signal
Results significant at 0.05 level in bold, tests based on linear regression
In a recent study, Wolski et al., (in print) adopted a different approach to the analyses of future climate and hydrological conditions in the Okavango basin. Instead of deriving a change factor, they used the time series of GCM rainfall and temperature to drive the ORI/CSAG Pitman model for the entire 20th century, and subsequently for projections of 21st century climate (under SRES A2 scenario). The results indicate that the magni-tude of the multi-decadal oscillations in climate variables remains unchanged under projected climate, but the oscillations are superimposed on the overall drying trend. The trend is attributed to the increase in temperature and thus Reference Evapotranspira-tion rather than change in rainfall. There was still a considerable divergence between
22 Cubango-Okavango River Basin Water Audit (CORBWA) Project Synthesis Report
the various GCMs, with some indicating overall increase in rainfall, and overall wetness of the system. The majority of the models, however, indicated the drying trend over 21st century.
The main findings can be summarised as follows:a. Significant divergence between various GCMs projections of future climate, making
it impossible to draw firm conclusions about climate change impacts on the basin and possible trends;
b. The overall median direction of change from multi-model ensembles differs in raw GCM data as compared to when the GCM data are statistically downscaled; and
c. The analyses indicate presence of multi-decadal scale oscillations in projected climate and hydrology in the basin.
In view of the above the following suggestions are made for future work:i. Work should focus on multi-model ensembles, with possible inclusion of as wide
number of models as possible. This is facilitated by the on-going populating of the CMIP5 collection of coordinated GCM output. This approach is consistent with the current understanding of various GCMs sampling the so-called model space uncertainty, i.e. uncertainty associated with the particular characteristics of GCM models such as grid resolution, included physical processes and their parameterization. Also, the approach is consistent with the general understanding that selection of a particular 'best' model or a set of models on the basis of agreement between observed and GMC-simulated metrics (e.g. mean annual rainfall) is not justified in view of differences in best-worst model ranking depending on the choice of metrics.
ii. Work should focus on 'multiple lines of evidence' approach. In this approach, robust elements are sought after of projections generated a range of methods. In this context, a comparison should be done of multi-model ensemble results generated by:
• AnalysesofrawGCMoutput
• Statisticaldownscaling,possiblewithmultiplemethods(e.g.SOM-based,SDSM, other methods)
• Dynamicaldownscaling(runningofregionalclimatemodelsnestedinGCMfields, possible multiple RCM nested within multiple GCMs)
• ThepossibilityofsuchanalysesisprovidedbytheCORDEXdatasetscurrentlyunder preparation, to be released in the near future.
iii. In view of the importance of the oscillations in the system, analyses should focus on the time series of climate and hydrological responses actually derived from GCM projections rather than on the use of the perturbation method.
iv. Use of 'projection-independent' analysis methods should be initiated. In these methods, sensitivity of the system is explored in response to a wide set of conditions, and system responses are split into classes that have different management/adaptation consequences. Since many possible projection scenarios can fall into a single class, the complexity of multiple scenarios is reduced.
232. Trends in water resources availability
v. In view of a wide range uncertainty present in the results of future climate assessment, the focus on adaptation/management efforts should be redirected towards climate-robust approaches, i.e. determination of such adaptation measures and management decisions that provide 'safe' results under variety of future climates.
The following data are readily available (either as text files or raster) for future climate change work: gridded datasets (CRU, UDEL, GPCP), satellite rainfall products (TRMM, RFE) and CMIP5 monthly data for rainfall and air temperature for 11 GCM for three scenarios (historical: broadly 20th century and until 2000-2006, depending on model), RCP4.5 and RCP8.5.
2.1.5 Groundwater
The country reports contain inadequate data to assess the conditions of and trends in CORB groundwater resources. The Botswana country report contains an extensive description of the network, but does not provide any data, because these are not very illustrative due to short duration. The groundwater hydrographs presented in Namibian report show patterns of (possibly, as no information on that is contained in the report) groundwater abstraction and episodic recharge. There is some coherency between the three hydrographs, e.g. a strong increase in groundwater levels in 2006. However, there are also major differences between the hydrographs; for example, the high recharge event in 2000 is observed only in one of the hydrographs, while in the other ones, there is no similar response. This illustrates that no generalisations can be made based on groundwater conditions from a limited number of observations.
The alternative data set, GRACE satellite, indicates a consistent increase in groundwater storage in the Okavango region since 2003. However, the spatial resolution of GRACE data does not allow for a spatially explicit assessment at lower spatial resolutions.
An important aspect of groundwater occurrence in the Okavango Basis is its possible role in generation of river run-off in the headwaters of Cubango, and Cuito. Base flow anal-yses indicate that groundwater contributes 70 percent of peak month’s run-off. It is also likely that groundwater storage and flows in that region are responsible for amplification of the multi-decadal variability seen in the river discharges in the downstream locations. Unfortunately, the lack of groundwater data from that region prevents confirmation of that model, which bears consequence to the level of understanding of both groundwater and surface water resource dynamics at the scale of the entire basin.
24 Cubango-Okavango River Basin Water Audit (CORBWA) Project Synthesis Report
2.2 Monitoring networks
2.2.1 Hydrometric stations
The lack of recent hydrometric data from Angola is a serious hindrance in the process of quantification of water resources in the basin and understanding of their interannual variability and spatial heterogeneity. Fortunately, the hydrometric observation network was re-established a couple of years ago within the framework of IRBM/EPSMO project, but the results could not be assessed in the absence of the Angolan country report. It is imperative that hydro-climatic monitoring is improved in the Angolan part of the basin and that data flow/data distribution pathways are established. Critical assessment of locations of hydrometric stations in Angola could be done with the knowledge of the extent of the re-established network, but unfortunately, this information was not avail-able for this study.
In the context of analyses carried on Namibian and Botswana data, only one specific recommendation with respect to Angolan hydrometric network can be made: that a discharge monitoring station is established on the lower reaches of the Cuito River. In Namibia there are two reported hydrometric stations with long observation periods, and they have data of good quality. This network and data coming from it provide basis for a basic assessment of current conditions and recent trends in surface water resources and their controlling factors, but it does not allow for detailed assessment in the spatial heterogeneity context. In particular, the network does not capture the discharges of the Cuito River. This river is particularly important as it is characterized by a different seasonal and interannual dynamics to the gauged Cubango River, effects of which are visible in the downstream Okavango Delta. With respect to the existing hydrometric observation network in Namibia, two recommendations are made:
a. Continued measuring at the two stations and ensure good data quality; and
b. An investigation is carried out of the transmission loses between Rundu and Mukwe and the stability of rating curves at these stations is undertaken in order to assess errors associated with using these stations to calculate discharges of the Cuito River.
In Botswana, the Department of Water Affairs (DWA) maintains a network of 48 hydro-metric stations in the Okavango Delta, 23 of which are discharge stations. Data from most of them covers period since 1970-1974 to date, and are of reasonable quality considering that at most of the stations measurements are carried out only several times a year. Stations are located along the main channel systems: Okavango, Jao, Boro, Maunachira, Khwai, Santantadibe, Boteti and Kunyere. Additionally, observations are carried out by ORI and several private individuals.
Due to specificity of hydraulic linkages between channels and floodplains, most of the hydrometric stations within the Okavango Delta reflect local conditions only, and the dynamics and trends observed there are not representative of conditions downstream. Data from these stations plays a significant role in assessing dynamics of channel
252. Trends in water resources availability
morphology and progress of aggradation/blockage, and should be processed and inter-preted in such a context. Stations for which measurements are directly interpretable in terms of water resources include Mohembo and stations located within valleys of outflow channels, i.e. Maun, stations on Boteti and at Toteng. Distribution of water in the Okavango Delta is affected by geomorphological processes such as development of channel system, and possibly tectonically-driven changes in topography. The current monitoring network fails to anticipate the possibility of large-scale shift of distribution of water, as measurements are carried out along 4 distributaries (Maunachira-Kwai, Santantadibe,Jao-BoroanddistalXudum/Kunyere),whileanother4remainungauged(Makgwekgwana,Mogogelo/Gomoti,XeneandKarongana/Thaoge).Inviewoftheabove,it is recommended for the Delta that:
i. The hydrological observation network in the Okavango Delta is expanded to cover the ungauged distributaries;
ii. Remote-sensing-based monitoring of inundation extents is initiated; and
iii. Data such as flow velocities, channel depth and width recorded during gauging are included into electronic database and used for assessment of channel conditions.
2.2.2 Groundwater monitoring
The information about the groundwater observation network is generally poor. Country reports have focused on surface water. No information on groundwater monitoring in Angola was available for this study. In Namibia, the extent of the network is most likely much larger than the three sites included in the country report. In Botswana, the network maintained by Department of Geological Surveys (DGS) covers only the area of Western Ngamiland, and comprises 16 observation wells, with measurements carried out since 2006. ORI maintains a network of 23 piezometers located in the western part of Chief’s Island in the Okavango Delta.
Data coming from these networks are inadequate to assess current status and spatio-temporal trends in groundwater resources at the scale of the Okavango region, or even at the scale of an individual aquifer/wellfield. It is because groundwater occurrence in the typical aquifers of the region is localized, groundwater recharge has an episodic character and is controlled by local conditions, and because the access to metadata describing context of monitoring sites is not available. Shallow groundwater plays an important role in generation of runoff in the Cubango and Cuito headwaters, and in transmission losses in the mid reaches of the Okavango River. Knowledge of groundwater dynamics would therefore facilitate a better understanding of inter-annual dynamics of river discharges.
The following recommendations can be made with respect to groundwater monitoring in the Okavango region:
a. Groundwater monitoring network is initiated in the headwaters of the Cubango and Cuito Rivers, in the context of surface water-groundwater interactions;
26 Cubango-Okavango River Basin Water Audit (CORBWA) Project Synthesis Report
b. Monitoring of deep aquifers important from water supply point of view is initiated/revived in Angola;
c. Databases in each of the countries are organised in such a way that groundwater observations are accessible together with metadata allowing for interpretation of observed groundwater level trends;
d. The groundwater monitoring network in Botswana is expanded into areas to the south, east and north-east of the Okavango Delta and that water level monitoring is initiated in the main well fields supplying Maun.
2.2.3 Rainfall and weather monitoring
Information on the extent of rainfall and weather monitoring in Angola was not avail-able for this study. The rainfall monitoring network reported on in the Namibian country report comprises stations in Rundu, Grootfontein and Otjiwarongo with data extending since 1920s. In terms of weather stations, Namibian report notes two stations, Rundu and Grootfontein, with long-term air temperature monitoring, but only data for 1985-2010 from Rundu were presented. In Botswana, there is a number of rain gauges run by DMS, ORI and private sector but only Kasane, Maun and Shakawe Dep. Of Meteorological Services DMS stations have records long and consistent (since 1960s to 1980s) enough to allow analyses in the context of long-term variability in water resources. Other initia-tives (ORI and private sector) do not provide long-term, coherent data sets. This rainfall/weather network provides only a very general overview of conditions in the southern part of the CORB. Local and medium-scale heterogeneities in climate cannot be resolved. In particular, the role of the Okavango wetlands in regional scale climate (and thus water resources) is not understood. On the basis of the understanding of the variability of rain-fall and weather in the Okavango region, it is recommended that:
a. Weather and rainfall monitoring network should be expanded to achieve a relatively uniform coverage of the entire basin, with station densities of at least one per 60 000 km2 10;
b. The priority should be to establish rainfall monitoring in the headwaters of the Cubango and Cuito; and
c. Permanent rainfall and weather stations within the Okavango Delta should be established.
2.3 Monitoring indicators and trend analysis methods
The choice of methods and data series to be used for assessment of surface water and groundwater resources in a spatio-temporal context has to take into consideration several factors:
10 One a station every 250 km, as per WMO recommendations on density of synoptic weather stations (WMO, 2011).
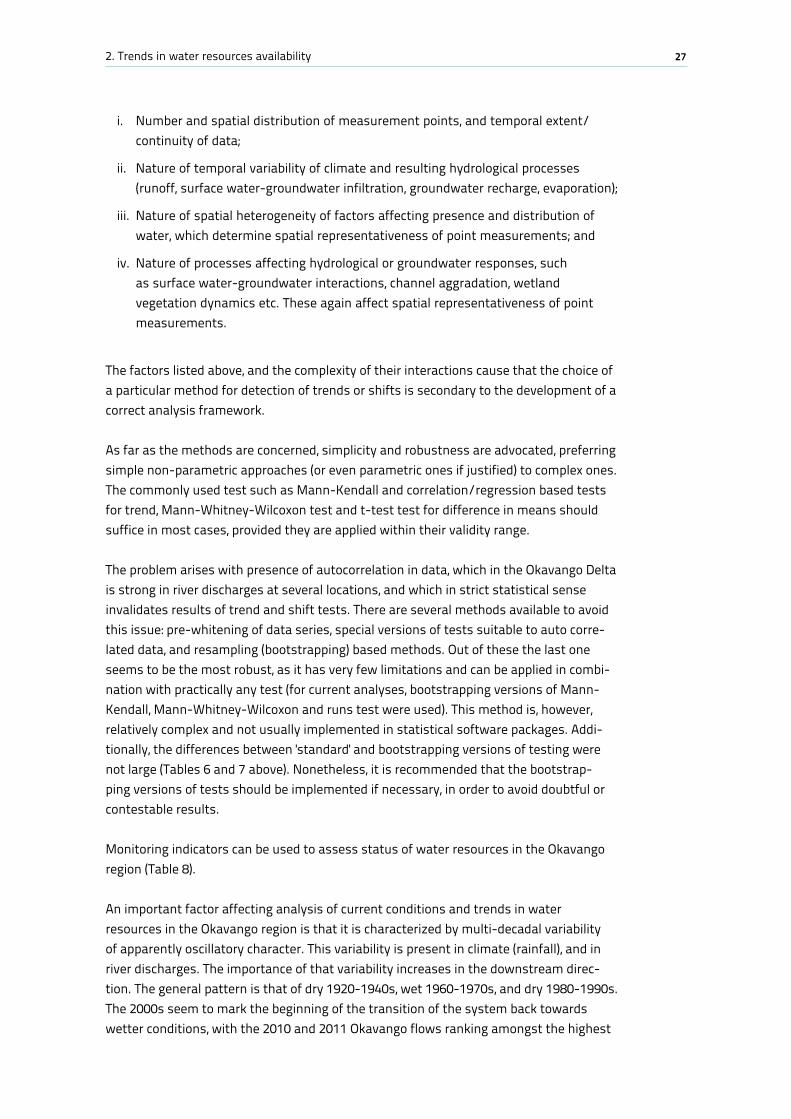
272. Trends in water resources availability
i. Number and spatial distribution of measurement points, and temporal extent/continuity of data;
ii. Nature of temporal variability of climate and resulting hydrological processes (runoff, surface water-groundwater infiltration, groundwater recharge, evaporation);
iii. Nature of spatial heterogeneity of factors affecting presence and distribution of water, which determine spatial representativeness of point measurements; and
iv. Nature of processes affecting hydrological or groundwater responses, such as surface water-groundwater interactions, channel aggradation, wetland vegetation dynamics etc. These again affect spatial representativeness of point measurements.
The factors listed above, and the complexity of their interactions cause that the choice of a particular method for detection of trends or shifts is secondary to the development of a correct analysis framework.
As far as the methods are concerned, simplicity and robustness are advocated, preferring simple non-parametric approaches (or even parametric ones if justified) to complex ones. The commonly used test such as Mann-Kendall and correlation/regression based tests for trend, Mann-Whitney-Wilcoxon test and t-test test for difference in means should suffice in most cases, provided they are applied within their validity range.
The problem arises with presence of autocorrelation in data, which in the Okavango Delta is strong in river discharges at several locations, and which in strict statistical sense invalidates results of trend and shift tests. There are several methods available to avoid this issue: pre-whitening of data series, special versions of tests suitable to auto corre-lated data, and resampling (bootstrapping) based methods. Out of these the last one seems to be the most robust, as it has very few limitations and can be applied in combi-nation with practically any test (for current analyses, bootstrapping versions of Mann-Kendall, Mann-Whitney-Wilcoxon and runs test were used). This method is, however, relatively complex and not usually implemented in statistical software packages. Addi-tionally, the differences between 'standard' and bootstrapping versions of testing were not large (Tables 6 and 7 above). Nonetheless, it is recommended that the bootstrap-ping versions of tests should be implemented if necessary, in order to avoid doubtful or contestable results.
Monitoring indicators can be used to assess status of water resources in the Okavango region (Table 8).
An important factor affecting analysis of current conditions and trends in water resources in the Okavango region is that it is characterized by multi-decadal variability of apparently oscillatory character. This variability is present in climate (rainfall), and in river discharges. The importance of that variability increases in the downstream direc-tion. The general pattern is that of dry 1920-1940s, wet 1960-1970s, and dry 1980-1990s. The 2000s seem to mark the beginning of the transition of the system back towards wetter conditions, with the 2010 and 2011 Okavango flows ranking amongst the highest
28 Cubango-Okavango River Basin Water Audit (CORBWA) Project Synthesis Report
Table 8: Proposed monitoring indicators for the state and trends in water resources
Indicator for Indicator Details
Groundwater Piezometric levels in shallow groundwater aquifers in the headwaters of the Cubango and Cuito, and in the middle reaches of the Okavango/Kavango.
These are prerequisite to understand surface water-groundwater interactions and thus surface water dynamics
Piezometric water levels in selected aquifers throughout the region
direct index of trends and changes in local groundwater resources
Piezometric water levels in the flood-recharged well fields
supplying Maun, and in the other intensively exploited aquifers
Surface water Total annual flow volume, minimum and maximum annual discharge
In the main tributaries of the Cubango and Cuito, in addition to these at the existing stations in the mid-reaches of the Okavango/Kavango River.
Total annual flow volume and minimum annual discharge
At Mohembo, and in out flowing channels of the Okavango Delta (Thamalakane, Boteti, Kunyere, but also in the so far ungauged Makgwekgwana,Gomoti,Xene,Karongana)
Monthly inundation extents in individual distributaries of the Okavango Delta
relevant to the assessment of changes in inundation distribution)
Flow velocity, discharge, channel depth and width at discharge gauging stations within the Okavango Delta
(relevant to assessment of channel dynamics and presence/progress of channel aggradation processes, with implications for changes in distribution of inundation)
Hydro climatic Mean monthly minimum and maximum temperatures
(relevant to groundwater recharge and flood dynamics)
Mean annual rainfall Relevant to groundwater recharge and to assessment of rainy season flooding in the Okavango Delta
Daily rainfall indices: maximum daily rainfall, median daily rainfall, duration of dry spells
(relevant to groundwater recharge)
on record. The patterns observed in the shorter record of the out flowing Thamalakane and Kunyere rivers correspond to that in the flows of the Okavango River. The pattern of long-term variability prevents defensible analyses directed towards detection of long-term trend. The exact nature of these oscillations is unknown at the moment, but it is possible that these are related to large-scale oscillations of sea surface temperatures naturally occurring in a coupled atmosphere-ocean dynamic system. Analyses of vari-ability in water resources and affecting climatic variables have to be performed in the context of and against this multi-decadal variability pattern. For analysis of trends and tendencies, we recommend piecewise trending within periods not exceeding 30 years or bound to naturally occurring breaks in trend direction.
293. Water use in the Cubango Okavango River Basin
3. Water use in the Cubango Okavango River Basin11
3.1 Introduction
Three country studies were carried out to estimate water use in the three member states (Barbosa, 2012; Krugmann & Alberts, 2012 and Arntzen & Setlhogile, 2012). The results were combined in the basin-wide water use report (Arntzen, 2012).
The terms water use, consumption, demand and withdrawal are often used loosely, causing confusion. In this report, water withdrawal or abstraction refers to the amount of water taken out of the natural system (i.e. river, lake, or aquifer). Water consump-tion refers to the actual amount of water taken up by a certain activity. It excludes water losses into the environment and return flows. Water use refers to water consumption, returns flows, losses and water used for recreation and leisure, transport etc. Water demand refers to the amount of water required for a certain activity, consumptive and non-consumptive use. It may be an actual demand (or use) or refer to an unmet demand. Water use and withdrawal/ abstraction are similar, but water consumption is lower than use and withdrawals. Below, we mostly use the terms water withdrawals, use and consumption. Detailed descriptions of terms are shown at the beginning of this report.
3.1.1 Overall water use
Based on the estimates contained in the three OKACOM countries, an overall picture of water use was constructed. Table 11 shows that total water use in the basin is estimated to be around 132.9 Mm3, in Namibia (68.4 Mm3), Angola (51.9 Mm3) and Botswana (12.7 Mm3). Angola accounts for 51.4 percent of water abstractions, followed by Namibia (39.1 percent); Botswana only abstracts 9.5 percent, but the Delta and tourism sector depend entirely on the water resources in the Delta. The estimated water abstraction from the Cubango-Okavango River is 90.1 Mm3.
Several observations are necessary for a proper interpretation of Table 9. Firstly, it describes an ‘average’ annual use picture for the period 2008 - 2011, based on the country reports. Some recent events (e.g. Bosetu mine started in 2012) have not been incorporated. The Bosetu mine would increase Botswana’s water use to 14 Mm3. Secondly, the use figures for irrigation are based on the area with fully developed irri-gation infrastructure. In any given year, only part of this may be actually irrigated (e.g. depending on market conditions and costs), leading to a lower use for irrigation than
11 This chapter is adapted from the basin water demand report (Arntzen, 2012) and the country water demand reports (Arntzen et al., 2012; Krugmann & Alberts, 2012 and Chipilika, 2012)
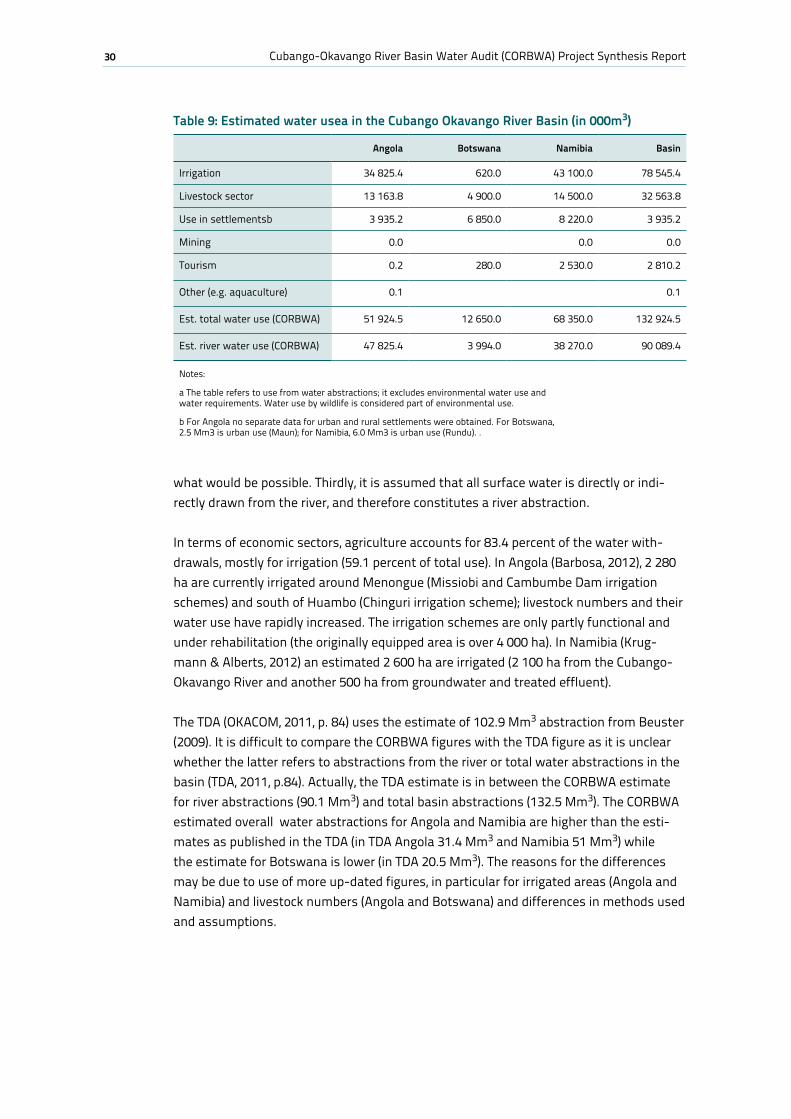
30 Cubango-Okavango River Basin Water Audit (CORBWA) Project Synthesis Report
Table 9: Estimated water usea in the Cubango Okavango River Basin (in 000m3)
Angola Botswana Namibia Basin
Irrigation 34 825.4 620.0 43 100.0 78 545.4
Livestock sector 13 163.8 4 900.0 14 500.0 32 563.8
Use in settlementsb 3 935.2 6 850.0 8 220.0 3 935.2
Mining 0.0 0.0 0.0
Tourism 0.2 280.0 2 530.0 2 810.2
Other (e.g. aquaculture) 0.1 0.1
Est. total water use (CORBWA) 51 924.5 12 650.0 68 350.0 132 924.5
Est. river water use (CORBWA) 47 825.4 3 994.0 38 270.0 90 089.4
Notes:
a The table refers to use from water abstractions; it excludes environmental water use and water requirements. Water use by wildlife is considered part of environmental use.
b For Angola no separate data for urban and rural settlements were obtained. For Botswana, 2.5 Mm3 is urban use (Maun); for Namibia, 6.0 Mm3 is urban use (Rundu). .
what would be possible. Thirdly, it is assumed that all surface water is directly or indi-rectly drawn from the river, and therefore constitutes a river abstraction.
In terms of economic sectors, agriculture accounts for 83.4 percent of the water with-drawals, mostly for irrigation (59.1 percent of total use). In Angola (Barbosa, 2012), 2 280 ha are currently irrigated around Menongue (Missiobi and Cambumbe Dam irrigation schemes) and south of Huambo (Chinguri irrigation scheme); livestock numbers and their water use have rapidly increased. The irrigation schemes are only partly functional and under rehabilitation (the originally equipped area is over 4 000 ha). In Namibia (Krug-mann & Alberts, 2012) an estimated 2 600 ha are irrigated (2 100 ha from the Cubango-Okavango River and another 500 ha from groundwater and treated effluent).
The TDA (OKACOM, 2011, p. 84) uses the estimate of 102.9 Mm3 abstraction from Beuster (2009). It is difficult to compare the CORBWA figures with the TDA figure as it is unclear whether the latter refers to abstractions from the river or total water abstractions in the basin (TDA, 2011, p.84). Actually, the TDA estimate is in between the CORBWA estimate for river abstractions (90.1 Mm3) and total basin abstractions (132.5 Mm3). The CORBWA estimated overall water abstractions for Angola and Namibia are higher than the esti-mates as published in the TDA (in TDA Angola 31.4 Mm3 and Namibia 51 Mm3) while the estimate for Botswana is lower (in TDA 20.5 Mm3). The reasons for the differences may be due to use of more up-dated figures, in particular for irrigated areas (Angola and Namibia) and livestock numbers (Angola and Botswana) and differences in methods used and assumptions.
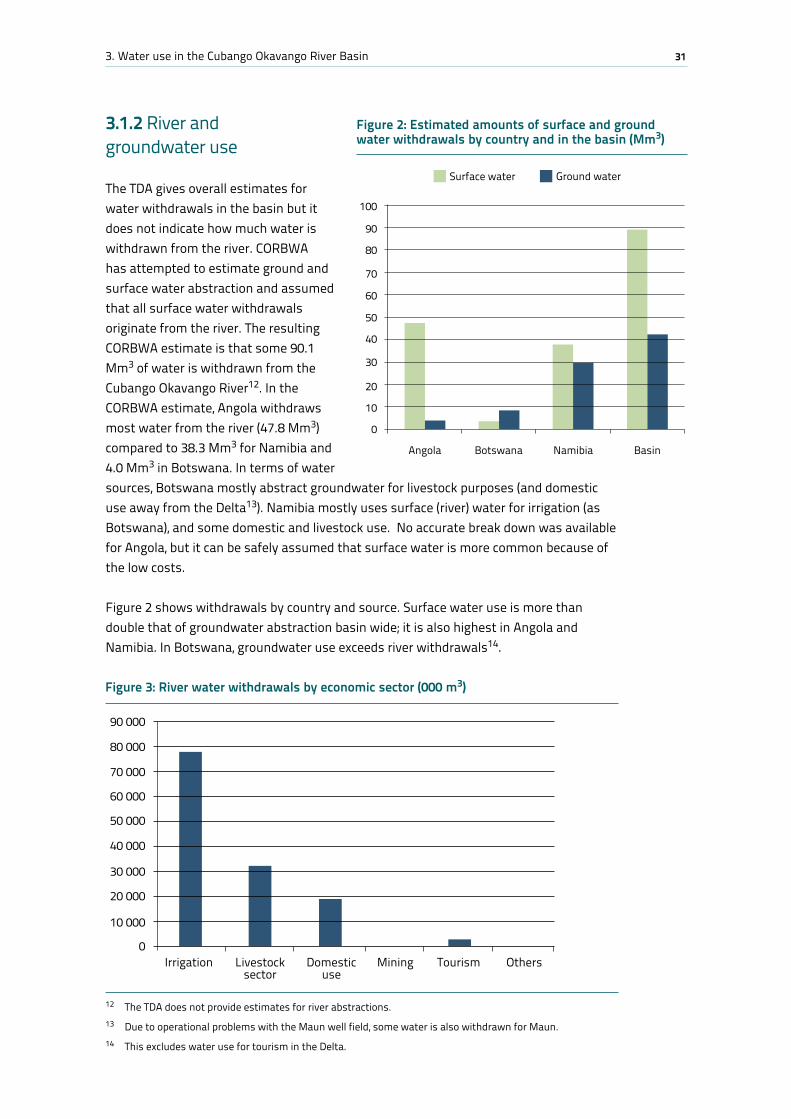
313. Water use in the Cubango Okavango River Basin
3.1.2 River and groundwater use
The TDA gives overall estimates for water withdrawals in the basin but it does not indicate how much water is withdrawn from the river. CORBWA has attempted to estimate ground and surface water abstraction and assumed that all surface water withdrawals originate from the river. The resulting CORBWA estimate is that some 90.1 Mm3 of water is withdrawn from the Cubango Okavango River12. In the CORBWA estimate, Angola withdraws most water from the river (47.8 Mm3) compared to 38.3 Mm3 for Namibia and 4.0 Mm3 in Botswana. In terms of water sources, Botswana mostly abstract groundwater for livestock purposes (and domestic use away from the Delta13). Namibia mostly uses surface (river) water for irrigation (as Botswana), and some domestic and livestock use. No accurate break down was available for Angola, but it can be safely assumed that surface water is more common because of the low costs.
Figure 2 shows withdrawals by country and source. Surface water use is more than double that of groundwater abstraction basin wide; it is also highest in Angola and Namibia. In Botswana, groundwater use exceeds river withdrawals14.
12 The TDA does not provide estimates for river abstractions.13 Due to operational problems with the Maun well field, some water is also withdrawn for Maun.14 This excludes water use for tourism in the Delta.
0
Angola Botswana Namibia Basin
Surface water Ground water
10
20
30
40
50
60
70
80
90
100
0Irrigation Livestock
sectorDomestic
useMining Tourism Others
10 000
20 000
30 000
40 000
50 000
60 000
70 000
80 000
90 000
Figure 2: Estimated amounts of surface and ground water withdrawals by country and in the basin (Mm3)
Figure 3: River water withdrawals by economic sector (000 m3)
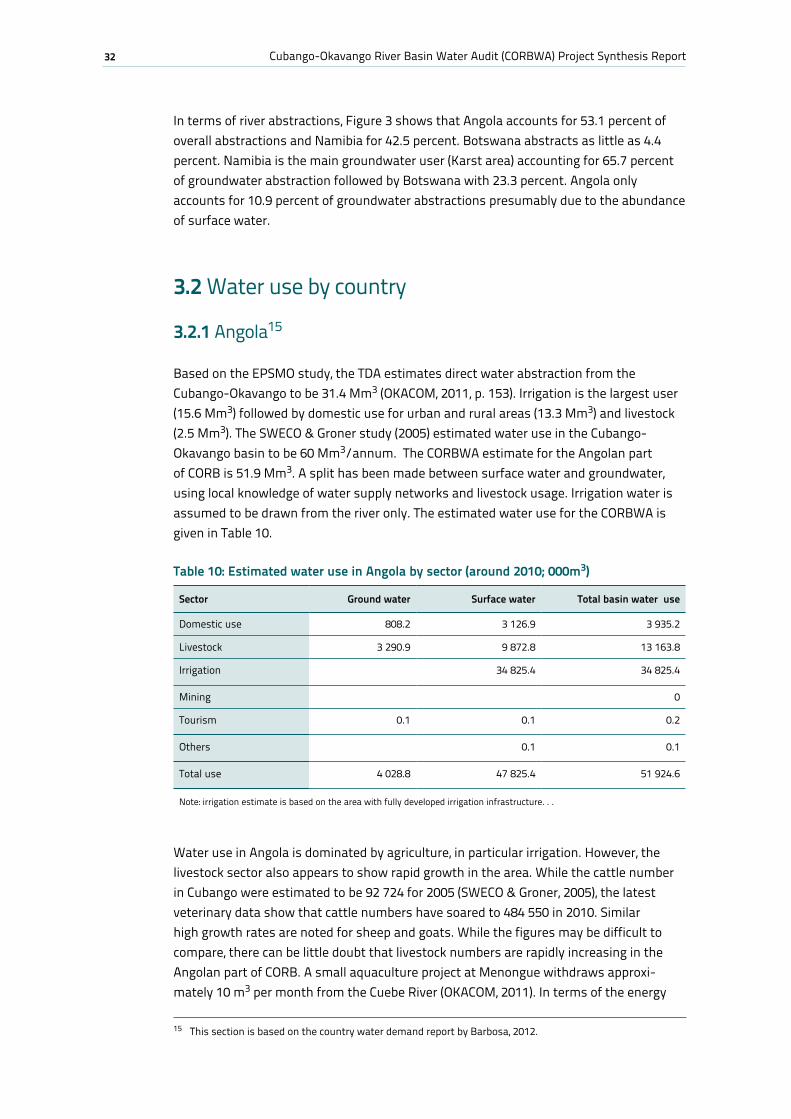
32 Cubango-Okavango River Basin Water Audit (CORBWA) Project Synthesis Report
Table 10: Estimated water use in Angola by sector (around 2010; 000m3)
Sector Ground water Surface water Total basin water use
Domestic use 808.2 3 126.9 3 935.2
Livestock 3 290.9 9 872.8 13 163.8
Irrigation 34 825.4 34 825.4
Mining 0
Tourism 0.1 0.1 0.2
Others 0.1 0.1
Total use 4 028.8 47 825.4 51 924.6
Note: irrigation estimate is based on the area with fully developed irrigation infrastructure. . .
In terms of river abstractions, Figure 3 shows that Angola accounts for 53.1 percent of overall abstractions and Namibia for 42.5 percent. Botswana abstracts as little as 4.4 percent. Namibia is the main groundwater user (Karst area) accounting for 65.7 percent of groundwater abstraction followed by Botswana with 23.3 percent. Angola only accounts for 10.9 percent of groundwater abstractions presumably due to the abundance of surface water.
3.2 Water use by country
3.2.1 Angola15
Based on the EPSMO study, the TDA estimates direct water abstraction from the Cubango-Okavango to be 31.4 Mm3 (OKACOM, 2011, p. 153). Irrigation is the largest user (15.6 Mm3) followed by domestic use for urban and rural areas (13.3 Mm3) and livestock (2.5 Mm3). The SWECO & Groner study (2005) estimated water use in the Cubango-Okavango basin to be 60 Mm3/annum. The CORBWA estimate for the Angolan part of CORB is 51.9 Mm3. A split has been made between surface water and groundwater, using local knowledge of water supply networks and livestock usage. Irrigation water is assumed to be drawn from the river only. The estimated water use for the CORBWA is given in Table 10.
Water use in Angola is dominated by agriculture, in particular irrigation. However, the livestock sector also appears to show rapid growth in the area. While the cattle number in Cubango were estimated to be 92 724 for 2005 (SWECO & Groner, 2005), the latest veterinary data show that cattle numbers have soared to 484 550 in 2010. Similar high growth rates are noted for sheep and goats. While the figures may be difficult to compare, there can be little doubt that livestock numbers are rapidly increasing in the Angolan part of CORB. A small aquaculture project at Menongue withdraws approxi-mately 10 m3 per month from the Cuebe River (OKACOM, 2011). In terms of the energy
15 This section is based on the country water demand report by Barbosa, 2012.
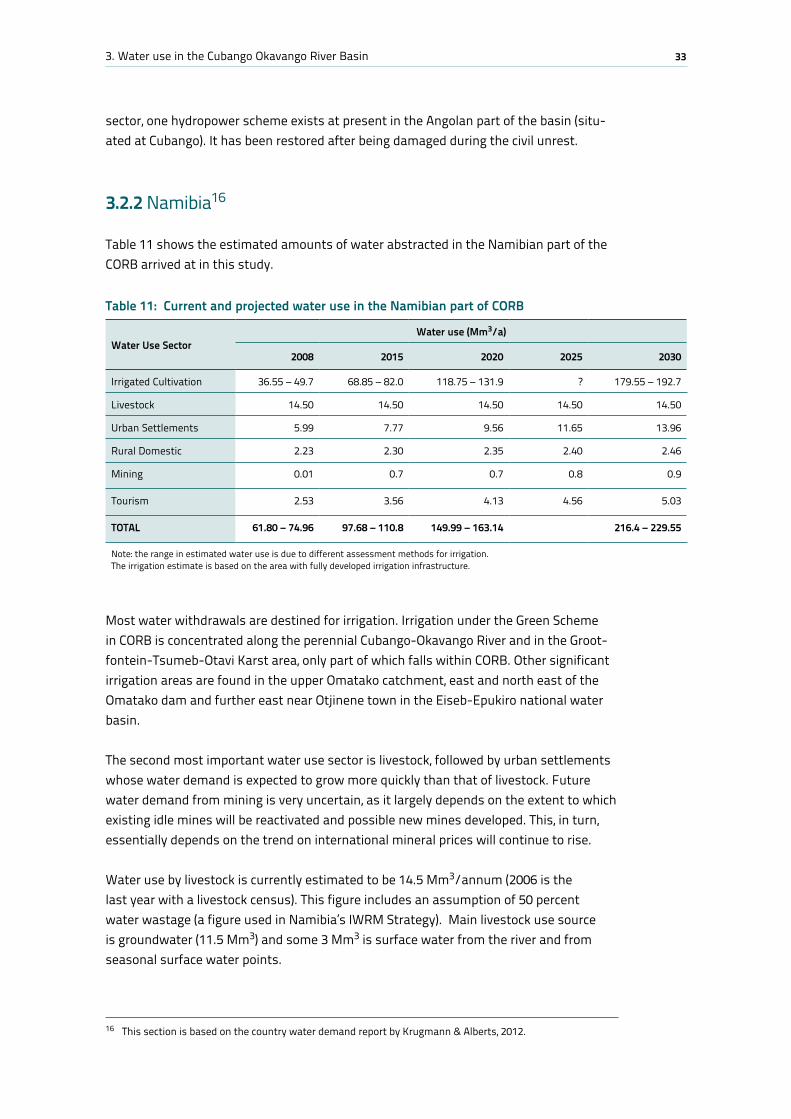
333. Water use in the Cubango Okavango River Basin
sector, one hydropower scheme exists at present in the Angolan part of the basin (situ-ated at Cubango). It has been restored after being damaged during the civil unrest.
3.2.2 Namibia16
Table 11 shows the estimated amounts of water abstracted in the Namibian part of the CORB arrived at in this study.
Most water withdrawals are destined for irrigation. Irrigation under the Green Scheme in CORB is concentrated along the perennial Cubango-Okavango River and in the Groot-fontein-Tsumeb-Otavi Karst area, only part of which falls within CORB. Other significant irrigation areas are found in the upper Omatako catchment, east and north east of the Omatako dam and further east near Otjinene town in the Eiseb-Epukiro national water basin.
The second most important water use sector is livestock, followed by urban settlements whose water demand is expected to grow more quickly than that of livestock. Future water demand from mining is very uncertain, as it largely depends on the extent to which existing idle mines will be reactivated and possible new mines developed. This, in turn, essentially depends on the trend on international mineral prices will continue to rise.
Water use by livestock is currently estimated to be 14.5 Mm3/annum (2006 is the last year with a livestock census). This figure includes an assumption of 50 percent water wastage (a figure used in Namibia’s IWRM Strategy). Main livestock use source is groundwater (11.5 Mm3) and some 3 Mm3 is surface water from the river and from seasonal surface water points.
16 This section is based on the country water demand report by Krugmann & Alberts, 2012.
Table 11: Current and projected water use in the Namibian part of CORB
Water Use SectorWater use (Mm3/a)
2008 2015 2020 2025 2030
Irrigated Cultivation 36.55 – 49.7 68.85 – 82.0 118.75 – 131.9 ? 179.55 – 192.7
Livestock 14.50 14.50 14.50 14.50 14.50
Urban Settlements 5.99 7.77 9.56 11.65 13.96
Rural Domestic 2.23 2.30 2.35 2.40 2.46
Mining 0.01 0.7 0.7 0.8 0.9
Tourism 2.53 3.56 4.13 4.56 5.03
TOTAL 61.80 – 74.96 97.68 – 110.8 149.99 – 163.14 216.4 – 229.55
Note: the range in estimated water use is due to different assessment methods for irrigation. The irrigation estimate is based on the area with fully developed irrigation infrastructure.
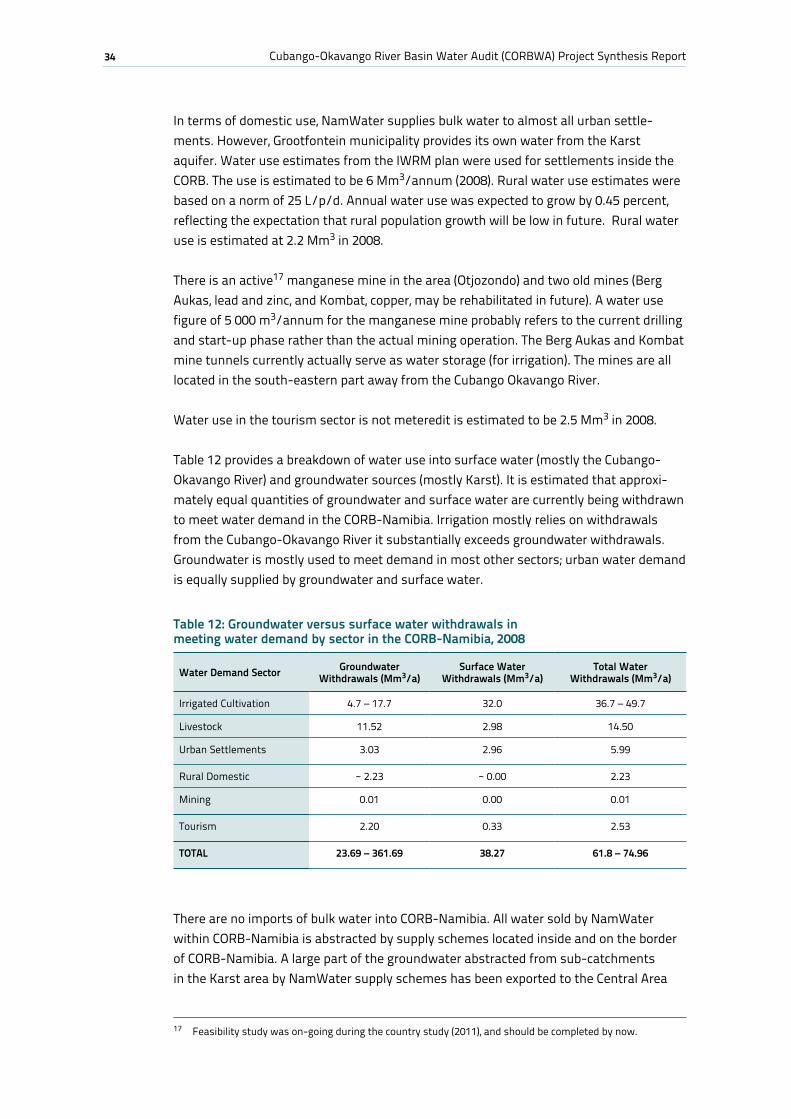
34 Cubango-Okavango River Basin Water Audit (CORBWA) Project Synthesis Report
In terms of domestic use, NamWater supplies bulk water to almost all urban settle-ments. However, Grootfontein municipality provides its own water from the Karst aquifer. Water use estimates from the IWRM plan were used for settlements inside the CORB. The use is estimated to be 6 Mm3/annum (2008). Rural water use estimates were based on a norm of 25 L/p/d. Annual water use was expected to grow by 0.45 percent, reflecting the expectation that rural population growth will be low in future. Rural water use is estimated at 2.2 Mm3 in 2008.
There is an active17 manganese mine in the area (Otjozondo) and two old mines (Berg Aukas, lead and zinc, and Kombat, copper, may be rehabilitated in future). A water use figure of 5 000 m3/annum for the manganese mine probably refers to the current drilling and start-up phase rather than the actual mining operation. The Berg Aukas and Kombat mine tunnels currently actually serve as water storage (for irrigation). The mines are all located in the south-eastern part away from the Cubango Okavango River.
Water use in the tourism sector is not meteredit is estimated to be 2.5 Mm3 in 2008.
Table 12 provides a breakdown of water use into surface water (mostly the Cubango-Okavango River) and groundwater sources (mostly Karst). It is estimated that approxi-mately equal quantities of groundwater and surface water are currently being withdrawn to meet water demand in the CORB-Namibia. Irrigation mostly relies on withdrawals from the Cubango-Okavango River it substantially exceeds groundwater withdrawals. Groundwater is mostly used to meet demand in most other sectors; urban water demand is equally supplied by groundwater and surface water.
There are no imports of bulk water into CORB-Namibia. All water sold by NamWater within CORB-Namibia is abstracted by supply schemes located inside and on the border of CORB-Namibia. A large part of the groundwater abstracted from sub-catchments in the Karst area by NamWater supply schemes has been exported to the Central Area
17 Feasibility study was on-going during the country study (2011), and should be completed by now.
Table 12: Groundwater versus surface water withdrawals in meeting water demand by sector in the CORB-Namibia, 2008
Water Demand Sector Groundwater Withdrawals (Mm3/a)
Surface Water Withdrawals (Mm3/a)
Total Water Withdrawals (Mm3/a)
Irrigated Cultivation 4.7 – 17.7 32.0 36.7 – 49.7
Livestock 11.52 2.98 14.50
Urban Settlements 3.03 2.96 5.99
Rural Domestic ~ 2.23 ~ 0.00 2.23
Mining 0.01 0.00 0.01
Tourism 2.20 0.33 2.53
TOTAL 23.69 – 361.69 38.27 61.8 – 74.96
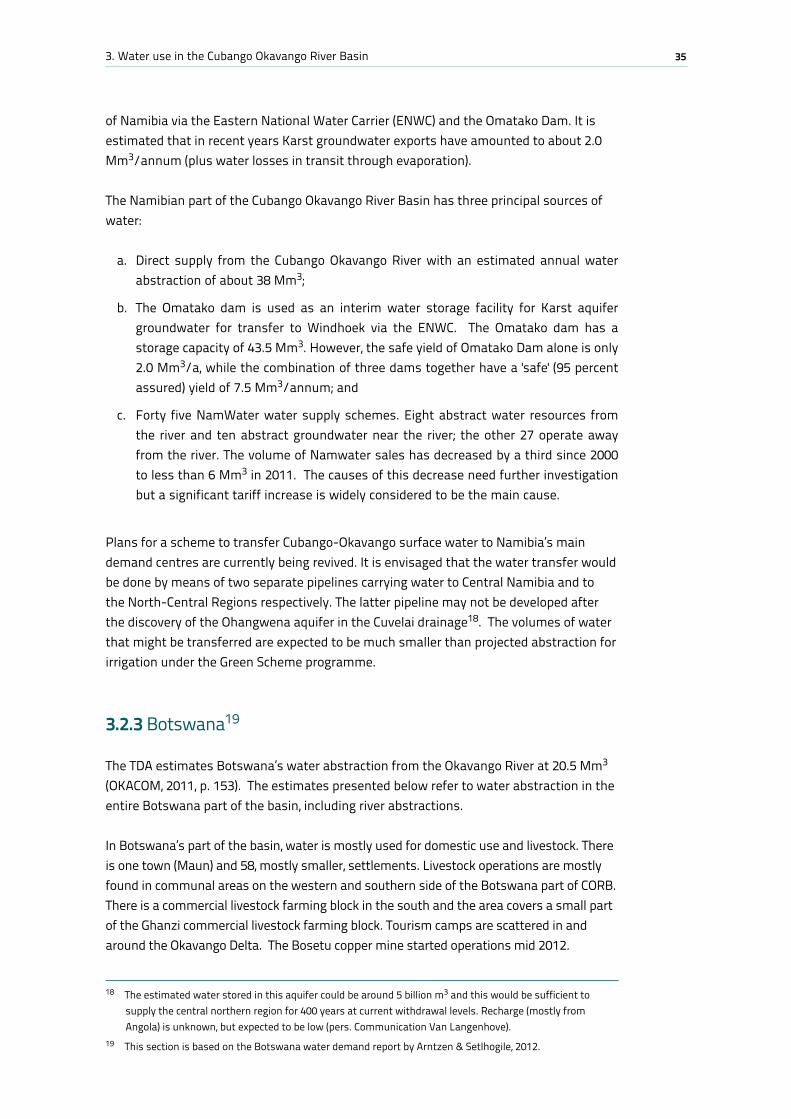
353. Water use in the Cubango Okavango River Basin
of Namibia via the Eastern National Water Carrier (ENWC) and the Omatako Dam. It is estimated that in recent years Karst groundwater exports have amounted to about 2.0 Mm3/annum (plus water losses in transit through evaporation).
The Namibian part of the Cubango Okavango River Basin has three principal sources of water:
a. Direct supply from the Cubango Okavango River with an estimated annual water abstraction of about 38 Mm3;
b. The Omatako dam is used as an interim water storage facility for Karst aquifer groundwater for transfer to Windhoek via the ENWC. The Omatako dam has a storage capacity of 43.5 Mm3. However, the safe yield of Omatako Dam alone is only 2.0 Mm3/a, while the combination of three dams together have a 'safe' (95 percent assured) yield of 7.5 Mm3/annum; and
c. Forty five NamWater water supply schemes. Eight abstract water resources from the river and ten abstract groundwater near the river; the other 27 operate away from the river. The volume of Namwater sales has decreased by a third since 2000 to less than 6 Mm3 in 2011. The causes of this decrease need further investigation but a significant tariff increase is widely considered to be the main cause.
Plans for a scheme to transfer Cubango-Okavango surface water to Namibia’s main demand centres are currently being revived. It is envisaged that the water transfer would be done by means of two separate pipelines carrying water to Central Namibia and to the North-Central Regions respectively. The latter pipeline may not be developed after the discovery of the Ohangwena aquifer in the Cuvelai drainage18. The volumes of water that might be transferred are expected to be much smaller than projected abstraction for irrigation under the Green Scheme programme.
3.2.3 Botswana19
The TDA estimates Botswana’s water abstraction from the Okavango River at 20.5 Mm3 (OKACOM, 2011, p. 153). The estimates presented below refer to water abstraction in the entire Botswana part of the basin, including river abstractions.
In Botswana’s part of the basin, water is mostly used for domestic use and livestock. There is one town (Maun) and 58, mostly smaller, settlements. Livestock operations are mostly found in communal areas on the western and southern side of the Botswana part of CORB. There is a commercial livestock farming block in the south and the area covers a small part of the Ghanzi commercial livestock farming block. Tourism camps are scattered in and around the Okavango Delta. The Bosetu copper mine started operations mid 2012.
18 The estimated water stored in this aquifer could be around 5 billion m3 and this would be sufficient to supply the central northern region for 400 years at current withdrawal levels. Recharge (mostly from Angola) is unknown, but expected to be low (pers. Communication Van Langenhove).
19 This section is based on the Botswana water demand report by Arntzen & Setlhogile, 2012.
36 Cubango-Okavango River Basin Water Audit (CORBWA) Project Synthesis Report
A detailed assessment of water use was made for domestic use, livestock use, tourism and other sectors. DWA figures were used for urban water use (mostly domestic plus Maun based industries and services). For rural settlements, NWMPR estimates were used for the settlements inside CORB based on CSO population forecasts and DWA water supply design criteria: standpipes 30L/d/p; yard connections 60L/d/p and house connections 125 L/d/p (SMEC et al., 2006).
Livestock water use was estimated based on daily water in-take multiplied by the number of animals in the area (taken from Agricultural Statistics). Four agricul-tural districts ‘contributed’ to CORB livestock numbers: Ngamiland West 100 percent, Ngamiland East 91.2 percent, Chobe and Boteti 10.7 percent each and Ghanzi 7.1 percent. The following livestock drinking figures were assumed: cattle 45 L/day/animal; goats and sheep 5 L/day/animal; donkeys & horses: 20 L/day/animal. Tourism water use was esti-mated for tourists and employees. The estimate for tourists was based on the number of tourist days and the average daily water use per tourist. Based on empirical studies daily water use of tourists was assumed to be 205L/d/tourist. The bed occupancy rate in the area is 46.1 percent. Water use by employees of tourism enterprises is estimated based on an employee/ bed ration of 1.54 and daily water use of 205 L/employee. Water use for irrigation is very small due to the fact that only 188 ha are equipped for irrigation. Total water use is estimated to be 12.7 Mm3 (Table 13); roughly two third is groundwater (8.7 Mm3) and one third surface water (4 Mm3), mainly from the Cubango-Okavango River and Delta. The livestock sector (4.9 Mm3) and settlements (6.9 Mm3) are currently the main water users.
The local livestock sector has been decimated by cattle lung disease. In order to eradi-cate the cattle lung disease, all cattle in a large part of the CORB area were killed (1996 and 1997). As cattle are vaccinated against Foot and Mouth Disease, livestock cannot be exported overseas. Livestock water use has declined from almost 7 Mm3 in 1980 to 3.8 Mm3 in 2006.
Table 13: Water use by sector in Botswana’s part of the basin (Mm3)
Surface water Groundwater Treated waste water Total
Irrigation 0.465 0.155 - 0.620
Livestock 1.225 3.675 - 4.900
Forestry - - - -
Fisheries - - - -
Mining - - - -
Maun 0.184 2.266 - 2.450
Other settlements 1.980 2.420 - 4.400
Tourism camps 0.140 140 - 0.280
Total use 3.994 8.656 - 12.650
Source: Arntzen & Setlhogile, 2012.:
373. Water use in the Cubango Okavango River Basin
In terms of domestic use, the water demand in Maun is estimated to be 2.4 Mm3 and that of other settlements to be 4.4 Mm3. The Maun use (two third is for domestic use; one third for government, industry and service sector) has been suppressed by water distribution problems and the use is likely to sharply increase once water supply prob-lems are resolved and the re-opened BMC abattoir is operating at full capacity. The average unaccounted for water (UAfW) figure20 is 25.3 percent for the period 2001/2011 and has remained stable during the period. The water use of a new copper silver mine, which started operating mid 2012, has not yet been included in Table 13. The new Bosetu mine with an estimated annual (ground) water use of 1.3 Mm3 would increase water demand in the CORB to 14 Mm3. Future water use from the mining sector will increase if current exploration activities would lead to new mining operations.
The water demand of the industry and tertiary sector outside settlements is minimal other than for tourism. Tourism camps in and around the Delta are estimated to use 0.3 Mm3 of water annually, equally divided over surface water (in the Delta) and groundwater (away from the Delta).
An analysis of water right records of the Water Apportionment Board (WAB) was carried out to estimate the existing water rights and the amounts involved. It was a challenge to identify the water rights inside the CORB area in the absence of systematic spatial refer-ences in the data base. Bearing this note of caution in mind, the analysis of the water rights data base shows that water rights are higher than the estimated water use of 12.7 Mm3. Leaving out one large water irrigation right (30 500 m3/day21), the total water withdrawal rights are estimated to be 18.5 Mm3 per annum of which 11.8 Mm3 refers to surface water, mostly from the Cubango-Okavango River, while 6.7 Mm3 refers to groundwater abstraction. The water withdrawal rights are almost 50 percent higher than the estimated current withdrawals.
The CORBWA water use estimate is lower than the EPSMO and TDA estimates for Botswana. The EPSMO figures for water use vary. The OKACOM TDA report uses esti-mates from Beuster (2009), which puts the water use in Botswana at 20.5 Mm3. Aylward (2009) uses an estimate of 25 Mm3. Masamba (2009) estimates water use at 28.7 Mm3. The CORBWA estimate of 12.65 Mm3 includes an in-depth analysis of livestock numbers in the CORB area and uses estimates from the 2006 Review of the National Water Master Plan (SMEC et al., 2006).
20 Unaccounted for water includes water losses, illegal and non-billed connections. Water losses are expected to be most important of the three components.
21 This right could not be explained and was treated as a data error.
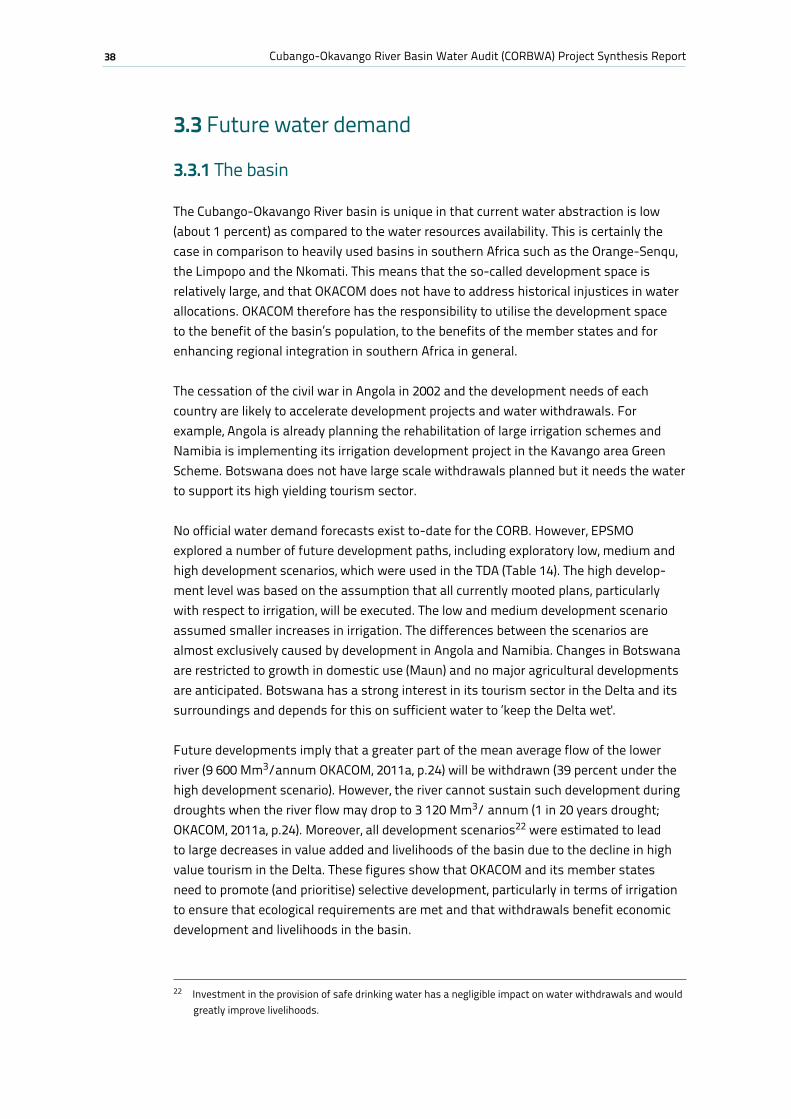
38 Cubango-Okavango River Basin Water Audit (CORBWA) Project Synthesis Report
3.3 Future water demand
3.3.1 The basin
The Cubango-Okavango River basin is unique in that current water abstraction is low (about 1 percent) as compared to the water resources availability. This is certainly the case in comparison to heavily used basins in southern Africa such as the Orange-Senqu, the Limpopo and the Nkomati. This means that the so-called development space is relatively large, and that OKACOM does not have to address historical injustices in water allocations. OKACOM therefore has the responsibility to utilise the development space to the benefit of the basin’s population, to the benefits of the member states and for enhancing regional integration in southern Africa in general.
The cessation of the civil war in Angola in 2002 and the development needs of each country are likely to accelerate development projects and water withdrawals. For example, Angola is already planning the rehabilitation of large irrigation schemes and Namibia is implementing its irrigation development project in the Kavango area Green Scheme. Botswana does not have large scale withdrawals planned but it needs the water to support its high yielding tourism sector.
No official water demand forecasts exist to-date for the CORB. However, EPSMO explored a number of future development paths, including exploratory low, medium and high development scenarios, which were used in the TDA (Table 14). The high develop-ment level was based on the assumption that all currently mooted plans, particularly with respect to irrigation, will be executed. The low and medium development scenario assumed smaller increases in irrigation. The differences between the scenarios are almost exclusively caused by development in Angola and Namibia. Changes in Botswana are restricted to growth in domestic use (Maun) and no major agricultural developments are anticipated. Botswana has a strong interest in its tourism sector in the Delta and its surroundings and depends for this on sufficient water to ‘keep the Delta wet'.
Future developments imply that a greater part of the mean average flow of the lower river (9 600 Mm3/annum OKACOM, 2011a, p.24) will be withdrawn (39 percent under the high development scenario). However, the river cannot sustain such development during droughts when the river flow may drop to 3 120 Mm3/ annum (1 in 20 years drought; OKACOM, 2011a, p.24). Moreover, all development scenarios22 were estimated to lead to large decreases in value added and livelihoods of the basin due to the decline in high value tourism in the Delta. These figures show that OKACOM and its member states need to promote (and prioritise) selective development, particularly in terms of irrigation to ensure that ecological requirements are met and that withdrawals benefit economic development and livelihoods in the basin.
22 Investment in the provision of safe drinking water has a negligible impact on water withdrawals and would greatly improve livelihoods.
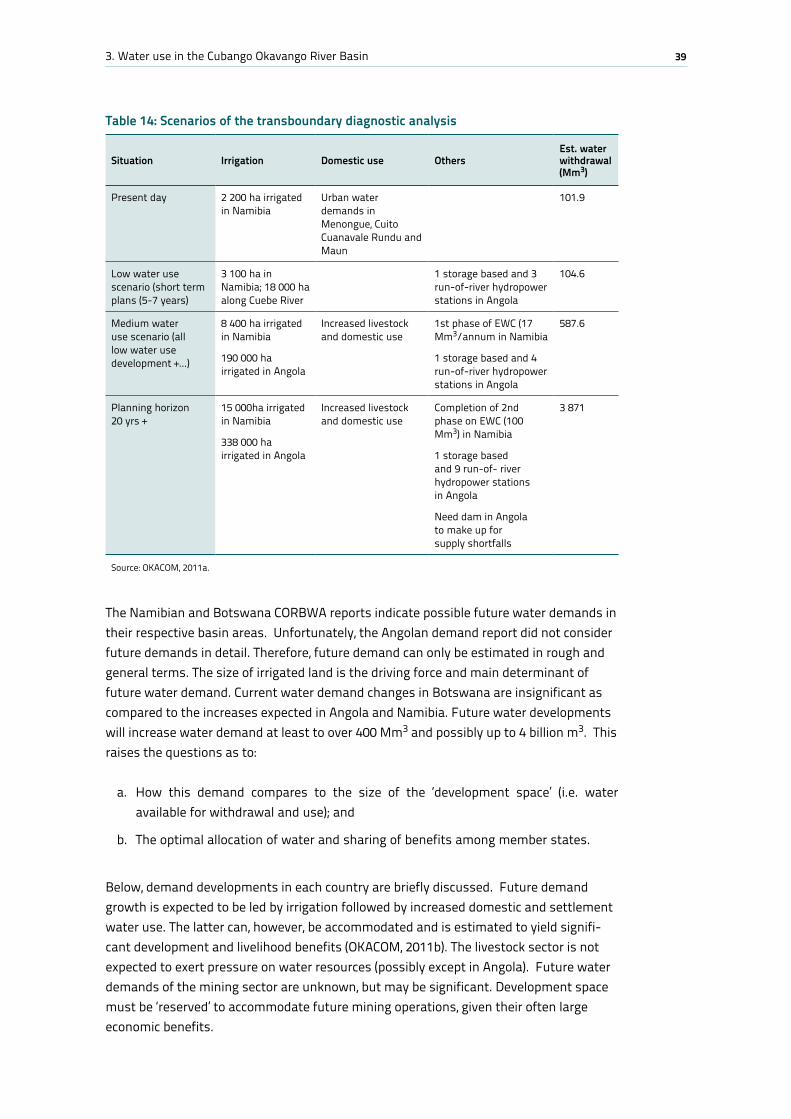
393. Water use in the Cubango Okavango River Basin
Table 14: Scenarios of the transboundary diagnostic analysis
Situation Irrigation Domestic use OthersEst. water withdrawal (Mm3)
Present day 2 200 ha irrigated in Namibia
Urban water demands in Menongue, Cuito Cuanavale Rundu and Maun
101.9
Low water use scenario (short term plans (5-7 years)
3 100 ha in Namibia; 18 000 ha along Cuebe River
1 storage based and 3 run-of-river hydropower stations in Angola
104.6
Medium water use scenario (all low water use development +...)
8 400 ha irrigated in Namibia
190 000 ha irrigated in Angola
Increased livestock and domestic use
1st phase of EWC (17 Mm3/annum in Namibia
1 storage based and 4 run-of-river hydropower stations in Angola
587.6
Planning horizon 20 yrs +
15 000ha irrigated in Namibia
338 000 ha irrigated in Angola
Increased livestock and domestic use
Completion of 2nd phase on EWC (100 Mm3) in Namibia
1 storage based and 9 run-of- river hydropower stations in Angola
Need dam in Angola to make up for supply shortfalls
3 871
Source: OKACOM, 2011a.
The Namibian and Botswana CORBWA reports indicate possible future water demands in their respective basin areas. Unfortunately, the Angolan demand report did not consider future demands in detail. Therefore, future demand can only be estimated in rough and general terms. The size of irrigated land is the driving force and main determinant of future water demand. Current water demand changes in Botswana are insignificant as compared to the increases expected in Angola and Namibia. Future water developments will increase water demand at least to over 400 Mm3 and possibly up to 4 billion m3. This raises the questions as to:
a. How this demand compares to the size of the ‘development space’ (i.e. water available for withdrawal and use); and
b. The optimal allocation of water and sharing of benefits among member states.
Below, demand developments in each country are briefly discussed. Future demand growth is expected to be led by irrigation followed by increased domestic and settlement water use. The latter can, however, be accommodated and is estimated to yield signifi-cant development and livelihood benefits (OKACOM, 2011b). The livestock sector is not expected to exert pressure on water resources (possibly except in Angola). Future water demands of the mining sector are unknown, but may be significant. Development space must be ‘reserved’ to accommodate future mining operations, given their often large economic benefits.
40 Cubango-Okavango River Basin Water Audit (CORBWA) Project Synthesis Report
3.3.2 Member states
AngolaThe Angolan country report does not include yet a comprehensive water use forecast. Assuming that the Cubango catchment and Cuando Cubango province are similar to CORB Angola, SWECO & Groner (2005) forecasts a doubling of water use by 2025 to 128.9 Mm3, mostly because of irrigation, but also strong increase in domestic use. Unlike in Botswana and Namibia, the livestock sector is expected to grow and double its water use. The recent National Irrigation Plan (NIP) earmarks 484 000 ha for longer term irrigation development in Cubango District (scenario 1). The financial coverage plan sets a target of 60 percent to be achieved in the next 25 years; this amounts to 290 000 ha for Cubango District. Irrigation in the basin has the second highest priority (2 out 4; 1 being the highest). These figures are well above the TDA medium use scenario.
During the June 2013 OKACOM meeting in Maun, information was provided by the Angolan team that a total of 347 000 ha was identified as potentially irrigable land in the Angolan part of CORB.
NamibiaAccording to the Namibia water use study, the groundwater resources in CORB are used almost to their full sustainable yield and significant further expansion of large scale groundwater withdrawals are not sustainable. Consequently, future additional water demands will put most pressure on river water resources. This switch is already observed for NamWater bulk supply with an increased share of river water. Major water use increases are expected to originate from irrigation expansion and from new water transfer schemes. There are plans to abstract perennial river water for transfer to two water demand centres:
a. Users in the central Namibia via a pipeline running from the Cubango-Okavango river to the Karst area, from there via the Eastern National Water Carrier (ENWC) to the Omatako Dam, and from there to central Namibia; and
b. To the North-Central Regions via a separate pipeline running from the Cubango-Okavango River to Oshakati and from there onwards to other centres in the North-Central Regions.
Details about the amounts of river water to be abstracted, the period during abstraction will take place, and the locations of the abstraction point(s) – upstream or downstream of the Cuito confluence – are being discussed and not yet available. During a meeting of the Namibia Project Support Group, it was mentioned that the withdrawals will be much smaller than the volumes mentioned in Table 15 and that withdrawals will not take place during low-flow periods.23 If the irrigation plans materialise and water transfers will take place, the contemplated scheme would substantially increase the quantities of river surface water exported out of the CORB-Namibia.
23 Piet Liebenberg, personal communication, 18 August 2011. Quoted in the Namibia water demand report.
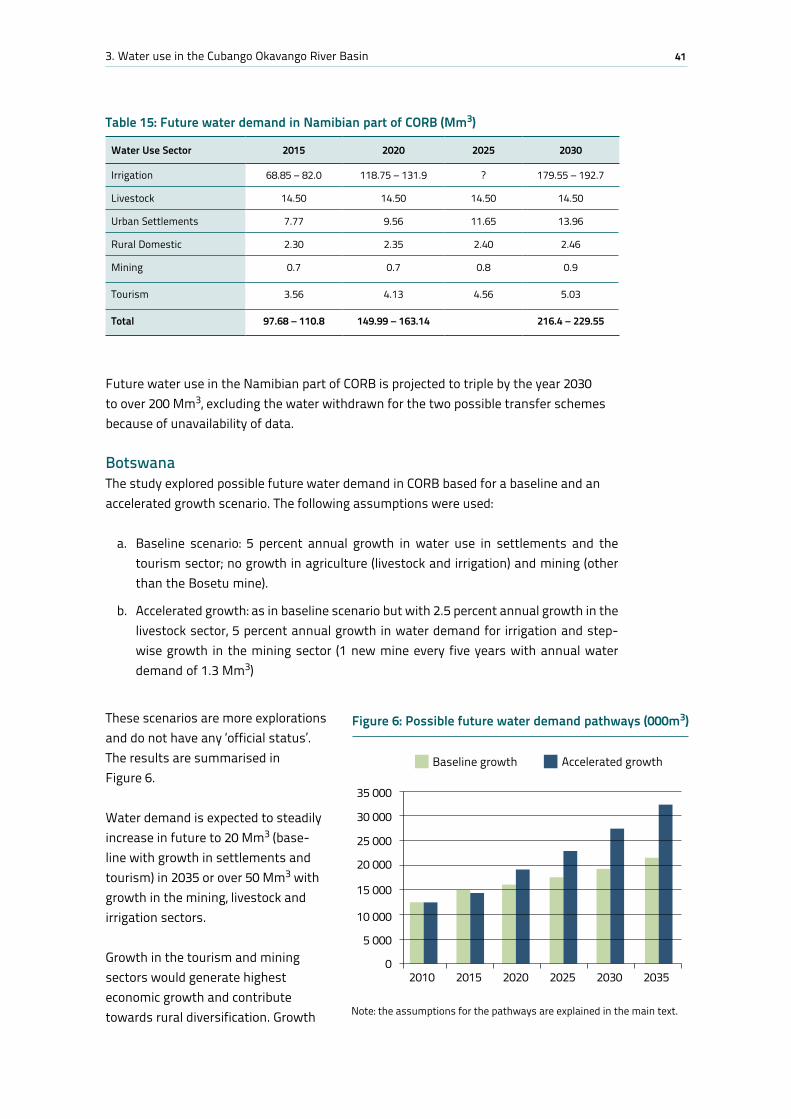
413. Water use in the Cubango Okavango River Basin
Future water use in the Namibian part of CORB is projected to triple by the year 2030 to over 200 Mm3, excluding the water withdrawn for the two possible transfer schemes because of unavailability of data. BotswanaThe study explored possible future water demand in CORB based for a baseline and an accelerated growth scenario. The following assumptions were used:
a. Baseline scenario: 5 percent annual growth in water use in settlements and the tourism sector; no growth in agriculture (livestock and irrigation) and mining (other than the Bosetu mine).
b. Accelerated growth: as in baseline scenario but with 2.5 percent annual growth in the livestock sector, 5 percent annual growth in water demand for irrigation and step-wise growth in the mining sector (1 new mine every five years with annual water demand of 1.3 Mm3)
These scenarios are more explorations and do not have any ‘official status’. The results are summarised in Figure 6.
Water demand is expected to steadily increase in future to 20 Mm3 (base-line with growth in settlements and tourism) in 2035 or over 50 Mm3 with growth in the mining, livestock and irrigation sectors. Growth in the tourism and mining sectors would generate highest economic growth and contribute towards rural diversification. Growth
Table 15: Future water demand in Namibian part of CORB (Mm3)
Water Use Sector 2015 2020 2025 2030
Irrigation 68.85 – 82.0 118.75 – 131.9 ? 179.55 – 192.7
Livestock 14.50 14.50 14.50 14.50
Urban Settlements 7.77 9.56 11.65 13.96
Rural Domestic 2.30 2.35 2.40 2.46
Mining 0.7 0.7 0.8 0.9
Tourism 3.56 4.13 4.56 5.03
Total 97.68 – 110.8 149.99 – 163.14 216.4 – 229.55
02010 2015 2020 2025 2030 2035
Baseline growth Accelerated growth
5 000
10 000
15 000
20 000
25 000
30 000
35 000
Figure 6: Possible future water demand pathways (000m3)
Note: the assumptions for the pathways are explained in the main text.
42 Cubango-Okavango River Basin Water Audit (CORBWA) Project Synthesis Report
of horticulture is likely to generate most water efficient agricultural growth. Re-use and recycling of treated effluent will be and essential source for future agricultural expansion. Agricultural water abstraction should be promoted in areas with no or low opportunity costs. Where there is competition for water resources, agriculture will have to use water efficiently and may not receive the desired amount.
Some growth in water use is forecasted for settlements. No new irrigation plans exist at present and the livestock sector is not expected to grow much. A recovery to the pre-culling levels is likely, but the current livestock rangelands cannot sustain much higher livestock numbers. Major changes in water use could result from the mining sector, but the level of water use depends on the nature of the minerals and local processing as well as on the location of the mines. Prospecting is on-going in large parts of Ngamiland District, including on the edges of the Delta, possibly leading to future exploitations.
3.4 Decision Support System24
3.4.1 Decision support tool
As illustrated in section 1.4, the fifth component of the water audit approach includes a decision support tool to evaluate water demand and resources management scenarios. The selection of the appropriate tool has been guided by the following criteria:
a. Tool outputs should provide management options under different scenarios;
b. Multi-sector approach to take into account all water uses;
c. Adaptable to available data and information gaps;
d. Ensures continuity with former OKACOM - EPSMO project and consistency with current and future OKACOM projects; and
e. Strengthens existing capacities.
Based on the above, the use of the Water Evaluation and Planning system (WEAP) application developed by the EPSMO project has been proposed and discussed with OKACOM task force members and OKASEC Executive Secretary. The project team and technical advisors have identified the WEAP as the appropriate software because of its policy orientation, flexibility and user-friendly interface, of its adoption during a previous FAO-led project in the basin (EPSMO project), and because its license is provided for free to public and research institutions in developing countries. A rapid survey on the use of the WEAP application developed during the EPSMO project, revealed a lack of capacity within the three riparian countries institutions, especially in Namibia, where nobody from the Ministry of Agriculture, Water and Forestry, had been trained on its use. At the same time, a demand for a stronger institutional involvement at
24 This section is based on FAO, 2012d (CORBWA report: Water Audit decision support tool)
433. Water use in the Cubango Okavango River Basin
ministerial level in the decision support tool development was raised by OKASEC. It was then agreed to address these issues through capacity building for Angolan, Botswana and Namibian governmental institutions on the use of the Okavango WEAP application, with emphasis on methodologies for model update and scenario formulation. During a training workshop held in Windhoek in October 2012, the EPSMO application and proposed updates have been thoroughly discussed with national experts from the three riparian countries (workshop report available in Appendix of CORBWA report 'Water Audit decision support tool').
3.4.2 WEAP background and the EPSMO Okavango application
WEAP is short for Water Evaluation and Planning System and is originally developed by the Stockholm Environment Institute at Boston, USA (SEI, 2005). WEAP is distinguished by its integrated approach to simulating water systems and by its policy orientation. As a database, WEAP provides a system for maintaining water demand and supply informa-tion. As a forecasting tool, WEAP simulates water demand, supply, flows, and storage, and pollution generation, treatment and discharge. As a policy analysis tool, WEAP evalu-ates a full range of water development and management options, and takes account of multiple and competing uses of water systems. WEAP is a laboratory for examining alternative water development and management strategies (SEI, 2005).
WEAP represents the system in terms of its various supply sources (e.g. rivers, ground-water and reservoirs); withdrawal, transmission and wastewater treatment facilities; ecosystem requirements, water demands and pollution generation. The data structure and level of detail may be easily customized to meet the requirements of a particular analysis, and to reflect the limits imposed by restricted data.
WEAP applications generally include several steps. The study definition sets up the time frame, spatial boundary, system components and configuration of the problem. The Current Accounts, which can be viewed as a calibration step in the development of an application, provide a snapshot of the actual water demand, resources and supplies for the system. Key assumptions may be built into the Current Accounts to represent policies, costs and factors that affect demand, pollution, supply and hydrology. Scenarios build on the Current Accounts and allow exploration of the impacts of alternative assumptions or policies on future water availability and use. Finally, the scenarios are evaluated with regard to water sufficiency, costs and benefits, compatibility with envi-ronmental targets, and sensitivity to uncertainty in key variables (SEI, 2005).
The Okavango WEAP application was developed for the Transboundary Diagnostic Assessment (TDA) of the Okavango basin to derive scenarios of impacts on environ-mental flow. Estimates of naturalised (undeveloped) long-term runoff were obtained from an existing Pitman-based rainfall-runoff model developed as part of the EU funded WERRD project. The model was configured to provide runoff sequences at the outlets of 24 distinct sub-catchments upstream of the Delta for the period 1959-2002. (EPSMO Hydrology report, 2009). The sequences were then analyzed through the 'System model' (WEAP) to estimate impact of different scenarios on stream flows at eight different
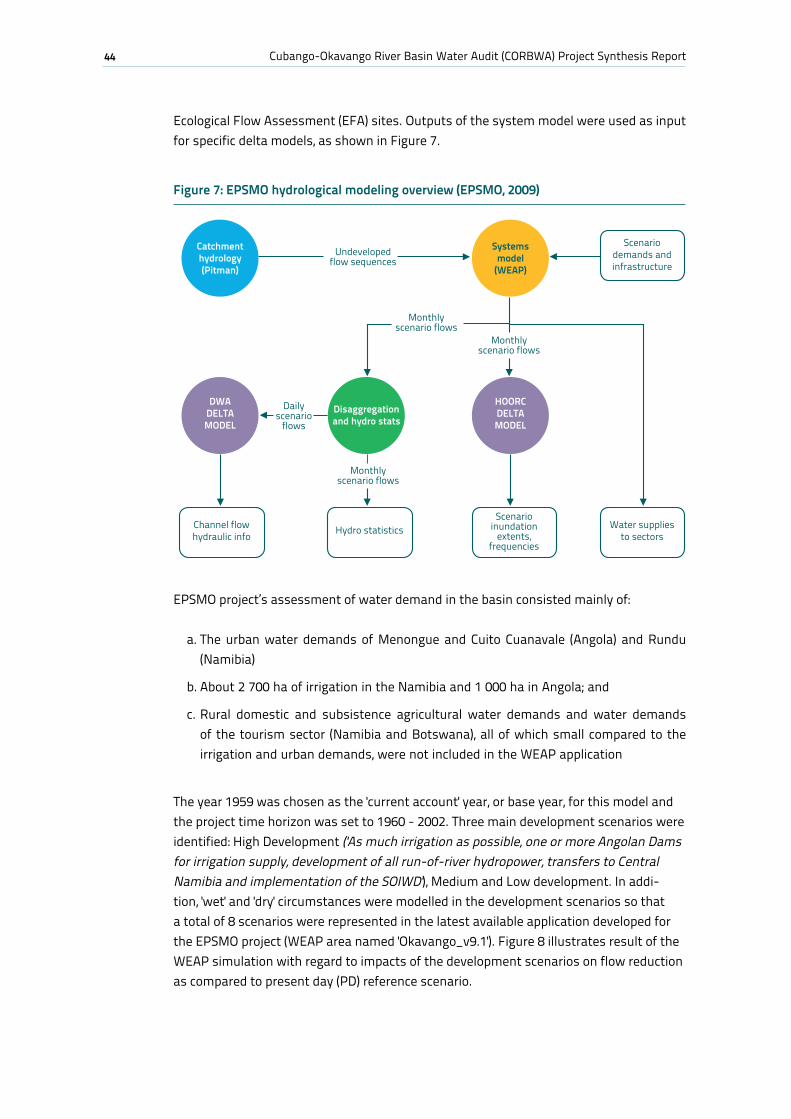
44 Cubango-Okavango River Basin Water Audit (CORBWA) Project Synthesis Report
Ecological Flow Assessment (EFA) sites. Outputs of the system model were used as input for specific delta models, as shown in Figure 7.
EPSMO project’s assessment of water demand in the basin consisted mainly of:
a. The urban water demands of Menongue and Cuito Cuanavale (Angola) and Rundu (Namibia)
b. About 2 700 ha of irrigation in the Namibia and 1 000 ha in Angola; and
c. Rural domestic and subsistence agricultural water demands and water demands of the tourism sector (Namibia and Botswana), all of which small compared to the irrigation and urban demands, were not included in the WEAP application
The year 1959 was chosen as the 'current account' year, or base year, for this model and the project time horizon was set to 1960 - 2002. Three main development scenarios were identified: High Development ('As much irrigation as possible, one or more Angolan Dams for irrigation supply, development of all run-of-river hydropower, transfers to Central Namibia and implementation of the SOIWD'), Medium and Low development. In addi-tion, 'wet' and 'dry' circumstances were modelled in the development scenarios so that a total of 8 scenarios were represented in the latest available application developed for the EPSMO project (WEAP area named 'Okavango_v9.1'). Figure 8 illustrates result of the WEAP simulation with regard to impacts of the development scenarios on flow reduction as compared to present day (PD) reference scenario.
Scenario demands and infrastructure
Water suppliesto sectors
Channel flowhydraulic info Hydro statistics
Scenario inundation
extents, frequencies
Catchmenthydrology(Pitman)
Systemsmodel
(WEAP)
DWADELTAMODEL
Disaggregationand hydro stats
Monthly scenario flows
Monthly scenario flows
Dailyscenario
flows
Monthly scenario flows
HOORCDELTAMODEL
Undeveloped flow sequences
Figure 7: EPSMO hydrological modeling overview (EPSMO, 2009)
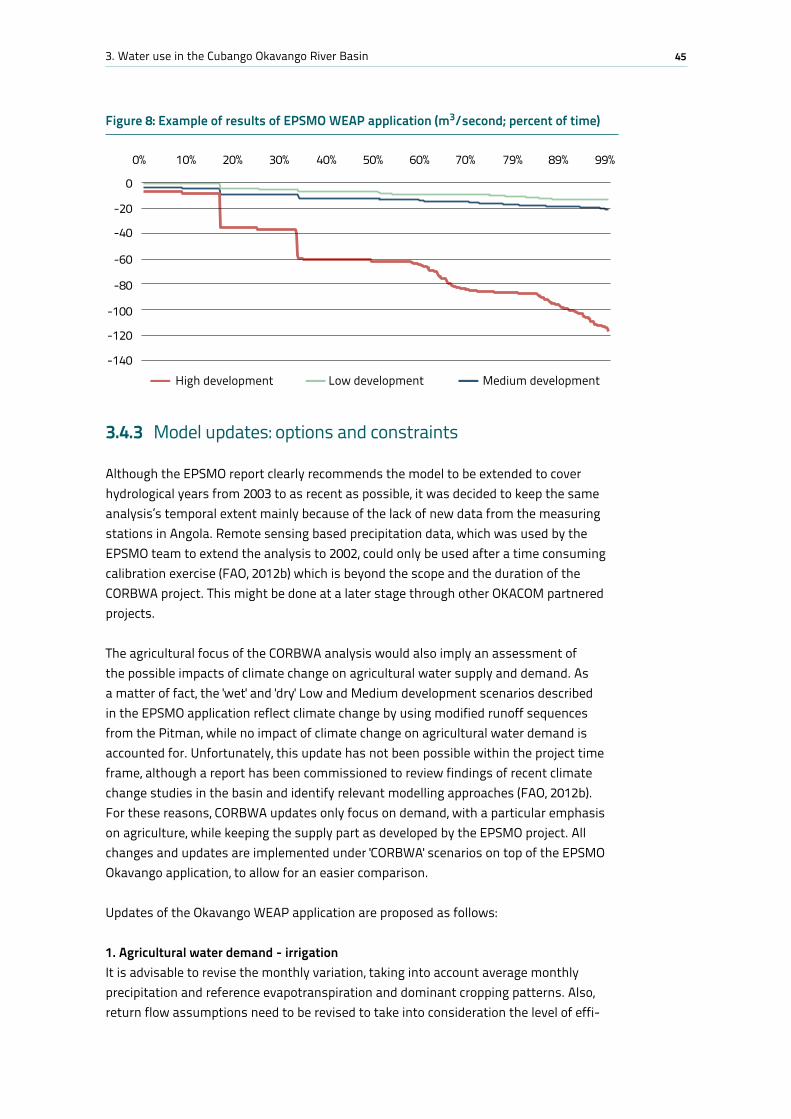
453. Water use in the Cubango Okavango River Basin
3.4.3 Model updates: options and constraints
Although the EPSMO report clearly recommends the model to be extended to cover hydrological years from 2003 to as recent as possible, it was decided to keep the same analysis’s temporal extent mainly because of the lack of new data from the measuring stations in Angola. Remote sensing based precipitation data, which was used by the EPSMO team to extend the analysis to 2002, could only be used after a time consuming calibration exercise (FAO, 2012b) which is beyond the scope and the duration of the CORBWA project. This might be done at a later stage through other OKACOM partnered projects.
The agricultural focus of the CORBWA analysis would also imply an assessment of the possible impacts of climate change on agricultural water supply and demand. As a matter of fact, the 'wet' and 'dry' Low and Medium development scenarios described in the EPSMO application reflect climate change by using modified runoff sequences from the Pitman, while no impact of climate change on agricultural water demand is accounted for. Unfortunately, this update has not been possible within the project time frame, although a report has been commissioned to review findings of recent climate change studies in the basin and identify relevant modelling approaches (FAO, 2012b). For these reasons, CORBWA updates only focus on demand, with a particular emphasis on agriculture, while keeping the supply part as developed by the EPSMO project. All changes and updates are implemented under 'CORBWA' scenarios on top of the EPSMO Okavango application, to allow for an easier comparison.
Updates of the Okavango WEAP application are proposed as follows:
1. Agricultural water demand - irrigation It is advisable to revise the monthly variation, taking into account average monthly precipitation and reference evapotranspiration and dominant cropping patterns. Also, return flow assumptions need to be revised to take into consideration the level of effi-
0% 10% 20% 30% 40% 50% 60% 70% 79% 89% 99%
High development Low development-140
-120
-100
-80
-60
-40
-20
0
Medium development
Figure 8: Example of results of EPSMO WEAP application (m3/second; percent of time)
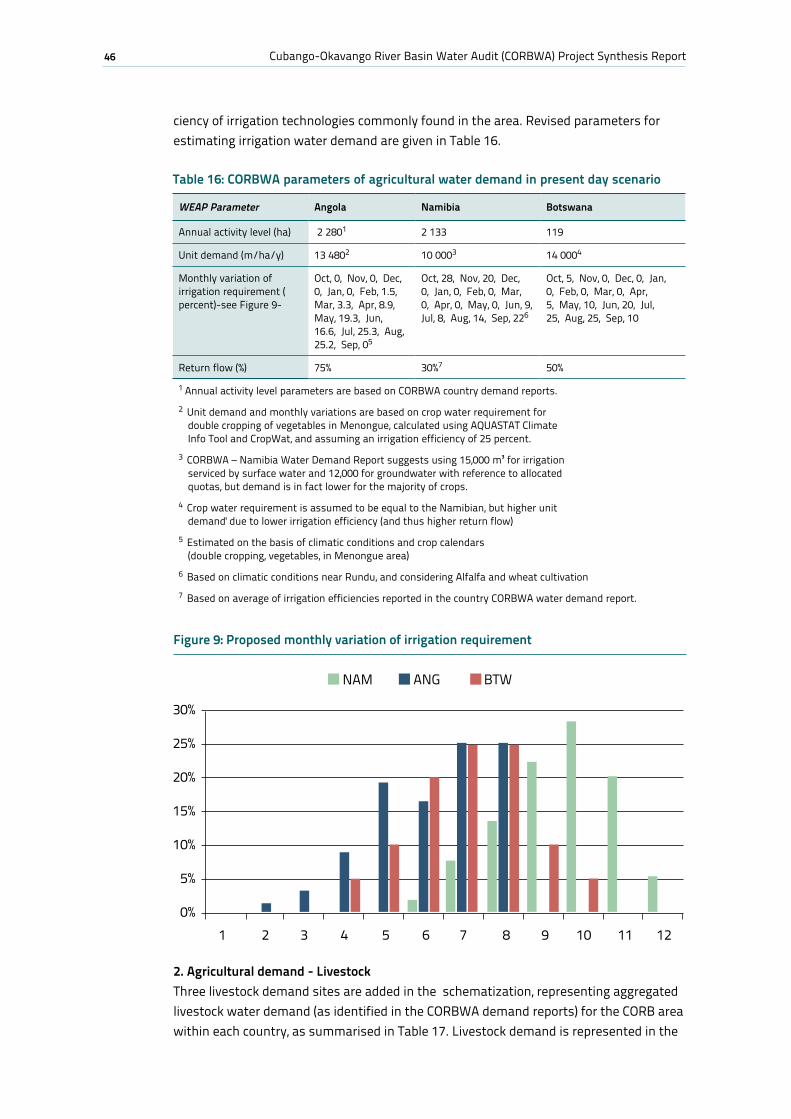
46 Cubango-Okavango River Basin Water Audit (CORBWA) Project Synthesis Report
Figure 9: Proposed monthly variation of irrigation requirement
Table 16: CORBWA parameters of agricultural water demand in present day scenario
WEAP Parameter Angola Namibia Botswana
Annual activity level (ha) 2 2801 2 133 119
Unit demand (m/ha/y) 13 4802 10 0003 14 0004
Monthly variation of irrigation requirement ( percent)-see Figure 9-
Oct, 0, Nov, 0, Dec, 0, Jan, 0, Feb, 1.5, Mar, 3.3, Apr, 8.9, May, 19.3, Jun, 16.6, Jul, 25.3, Aug, 25.2, Sep, 05
Oct, 28, Nov, 20, Dec, 0, Jan, 0, Feb, 0, Mar, 0, Apr, 0, May, 0, Jun, 9, Jul, 8, Aug, 14, Sep, 226
Oct, 5, Nov, 0, Dec, 0, Jan, 0, Feb, 0, Mar, 0, Apr, 5, May, 10, Jun, 20, Jul, 25, Aug, 25, Sep, 10
Return flow (%) 75% 30%7 50%
1 Annual activity level parameters are based on CORBWA country demand reports.2 Unit demand and monthly variations are based on crop water requirement for
double cropping of vegetables in Menongue, calculated using AQUASTAT Climate Info Tool and CropWat, and assuming an irrigation efficiency of 25 percent.
3 CORBWA – Namibia Water Demand Report suggests using 15,000 m³ for irrigation serviced by surface water and 12,000 for groundwater with reference to allocated quotas, but demand is in fact lower for the majority of crops.
4 Crop water requirement is assumed to be equal to the Namibian, but higher unit demand' due to lower irrigation efficiency (and thus higher return flow)
5 Estimated on the basis of climatic conditions and crop calendars (double cropping, vegetables, in Menongue area)
6 Based on climatic conditions near Rundu, and considering Alfalfa and wheat cultivation 7 Based on average of irrigation efficiencies reported in the country CORBWA water demand report.
0%1 2 3 4 5 6 7 8 9 10 11 12
NAM ANG BTW
5%
10%
15%
20%
25%
30%
ciency of irrigation technologies commonly found in the area. Revised parameters for estimating irrigation water demand are given in Table 16.
2. Agricultural demand - LivestockThree livestock demand sites are added in the schematization, representing aggregated livestock water demand (as identified in the CORBWA demand reports) for the CORB area within each country, as summarised in Table 17. Livestock demand is represented in the
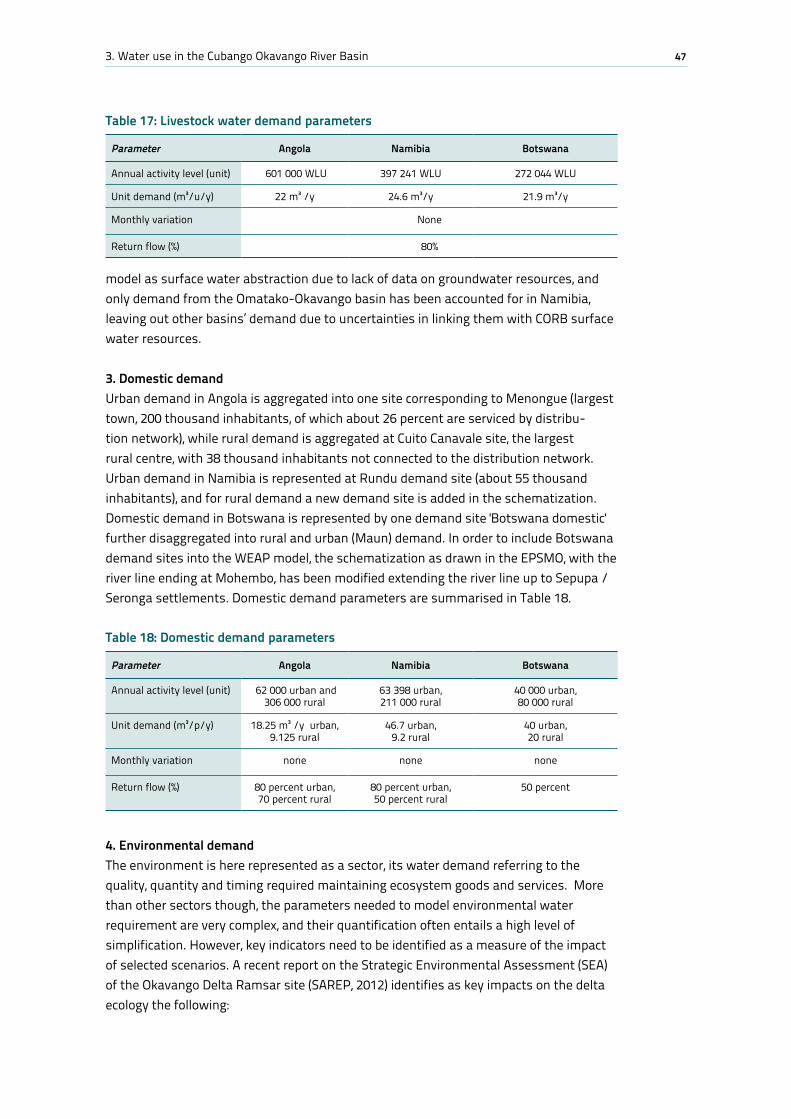
473. Water use in the Cubango Okavango River Basin
model as surface water abstraction due to lack of data on groundwater resources, and only demand from the Omatako-Okavango basin has been accounted for in Namibia, leaving out other basins’ demand due to uncertainties in linking them with CORB surface water resources.
3. Domestic demandUrban demand in Angola is aggregated into one site corresponding to Menongue (largest town, 200 thousand inhabitants, of which about 26 percent are serviced by distribu-tion network), while rural demand is aggregated at Cuito Canavale site, the largest rural centre, with 38 thousand inhabitants not connected to the distribution network. Urban demand in Namibia is represented at Rundu demand site (about 55 thousand inhabitants), and for rural demand a new demand site is added in the schematization. Domestic demand in Botswana is represented by one demand site 'Botswana domestic' further disaggregated into rural and urban (Maun) demand. In order to include Botswana demand sites into the WEAP model, the schematization as drawn in the EPSMO, with the river line ending at Mohembo, has been modified extending the river line up to Sepupa / Seronga settlements. Domestic demand parameters are summarised in Table 18.
4. Environmental demandThe environment is here represented as a sector, its water demand referring to the quality, quantity and timing required maintaining ecosystem goods and services. More than other sectors though, the parameters needed to model environmental water requirement are very complex, and their quantification often entails a high level of simplification. However, key indicators need to be identified as a measure of the impact of selected scenarios. A recent report on the Strategic Environmental Assessment (SEA) of the Okavango Delta Ramsar site (SAREP, 2012) identifies as key impacts on the delta ecology the following:
Table 17: Livestock water demand parameters
Parameter Angola Namibia Botswana
Annual activity level (unit) 601 000 WLU 397 241 WLU 272 044 WLU
Unit demand (m³/u/y) 22 m³ /y 24.6 m³/y 21.9 m³/y
Monthly variation None
Return flow (%) 80%
Table 18: Domestic demand parameters
Parameter Angola Namibia Botswana
Annual activity level (unit) 62 000 urban and 306 000 rural
63 398 urban, 211 000 rural
40 000 urban, 80 000 rural
Unit demand (m³/p/y) 18.25 m³ /y urban, 9.125 rural
46.7 urban, 9.2 rural
40 urban, 20 rural
Monthly variation none none none
Return flow (%) 80 percent urban, 70 percent rural
80 percent urban, 50 percent rural
50 percent
48 Cubango-Okavango River Basin Water Audit (CORBWA) Project Synthesis Report
a. Reduction of low flow;
b. Modification of flood pulse; and
c. Regulation of the river flows.
The reduction of low flow has been taken into account by this CORBWA update by comparing the various scenarios’ low flow to the modelled natural flow in October -in accordance to what suggested by the SEA report- and, in particular, by setting a Flow Requirement at Mohembo of 122 m3/second (corresponding to the average of October flows in the Pitman sequence used for the Reference scenario). Impact on flood pulse is difficult to assess by using a monthly time-step model, and regulation of the river flows by large reservoirs is not foreseen in the water management trends identified by CORBWA reports. However, in an attempt to estimate the impact of future scenarios on the basin environment, an effort has been made to include a very simplified repre-sentation of the delta in the current application. Hydrological modelling approach of the EPSMO project included specific delta models, simulating impact of flow variations on the delta system, but updating such a model was beyond the scope of this water audit project. It was then decided to represent the delta in a simplified way as a reservoir, serving livestock and domestic demand in Botswana. Parameterization of the reservoir has been improved during the WEAP workshop in Windhoek in October 2012 with the help of national experts and SEI researchers. In particular, during the workshop a new variable originally developed by SEI researchers was added to the application, esti-mating the spatial extent of maximum annual flooding by using the algorithm found in Gumbricht et al., 2004. The spatial extent of the flooded area is an indication of the impact of changes of annual flows to the delta ecology, as reported in the Strategic Environmental Assessment for the Okavango Delta Ramsar site (SAREP, 2012). This algorithm was developed to predict flood extent with a few months in advance to its August peak and is therefore focused on the maximum flooded area, without modelling minimum extent.
In order to assess also the impact of management scenarios on the minimum flooded area, CORBWA project team made an effort to model the monthly flooded area as a function of the discharge towards the floodplains at Popa. This has been achieved by assuming that profile of the floodplain is triangular with very slight slopes, and that the volume of the flood plain can be considered as a pyramid with the top downwards. Following these assumptions, the area of the flood plain can be described as:
A = 2 h * l / a
Where A is the flooded area; l = length of floodplain; a = angle of the profile (in percentage); and h = water depth which equals the height of the pyramid.Being a pyramid, the volume of the reservoir below the floodplain is described as:
V = 1/3 * A * h
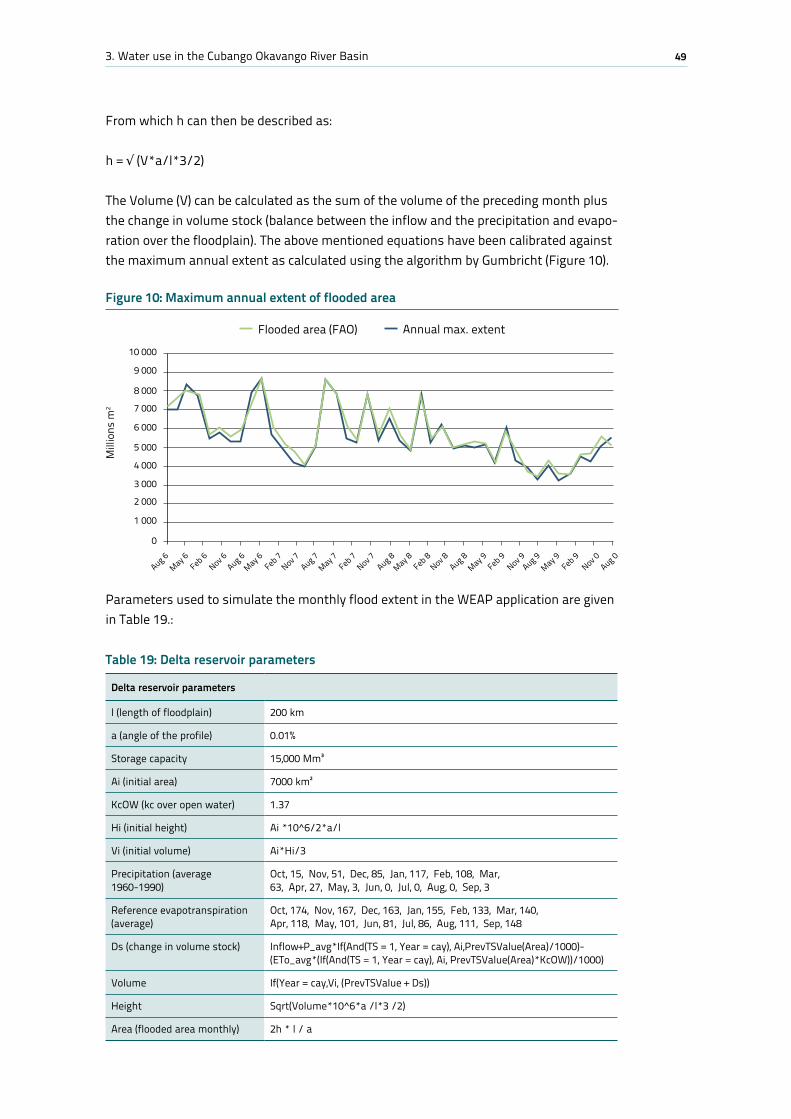
493. Water use in the Cubango Okavango River Basin
From which h can then be described as:
h = √ (V*a/l*3/2)
The Volume (V) can be calculated as the sum of the volume of the preceding month plus the change in volume stock (balance between the inflow and the precipitation and evapo-ration over the floodplain). The above mentioned equations have been calibrated against the maximum annual extent as calculated using the algorithm by Gumbricht (Figure 10).
Parameters used to simulate the monthly flood extent in the WEAP application are given in Table 19.:
Figure 10: Maximum annual extent of flooded area
0
Aug 6May 6
Feb 6Nov 6
Aug 6May 6
Feb 7Nov 7
Aug 7Aug 0
May 7Feb 7
Nov 7Aug 8
May 8Feb 8
Nov 8Aug 8
May 9Feb 9
Nov 9Aug 9
May 9Feb 9
Nov 0
Flooded area (FAO)
Mill
ions
m2
1 000
2 000
3 000
4 000
5 000
6 000
7 000
8 000
9 000
10 000
Annual max. extent
Table 19: Delta reservoir parameters
Delta reservoir parameters
l (length of floodplain) 200 km
a (angle of the profile) 0.01%
Storage capacity 15,000 Mm³
Ai (initial area) 7000 km²
KcOW (kc over open water) 1.37
Hi (initial height) Ai *10^6/2*a/l
Vi (initial volume) Ai*Hi/3
Precipitation (average 1960-1990)
Oct, 15, Nov, 51, Dec, 85, Jan, 117, Feb, 108, Mar, 63, Apr, 27, May, 3, Jun, 0, Jul, 0, Aug, 0, Sep, 3
Reference evapotranspiration (average)
Oct, 174, Nov, 167, Dec, 163, Jan, 155, Feb, 133, Mar, 140, Apr, 118, May, 101, Jun, 81, Jul, 86, Aug, 111, Sep, 148
Ds (change in volume stock) Inflow+P_avg*If(And(TS = 1, Year = cay), Ai,PrevTSValue(Area)/1000)-(ETo_avg*(If(And(TS = 1, Year = cay), Ai, PrevTSValue(Area)*KcOW))/1000)
Volume If(Year = cay,Vi, (PrevTSValue + Ds))
Height Sqrt(Volume*10^6*a /l*3 /2)
Area (flooded area monthly) 2h * l / a
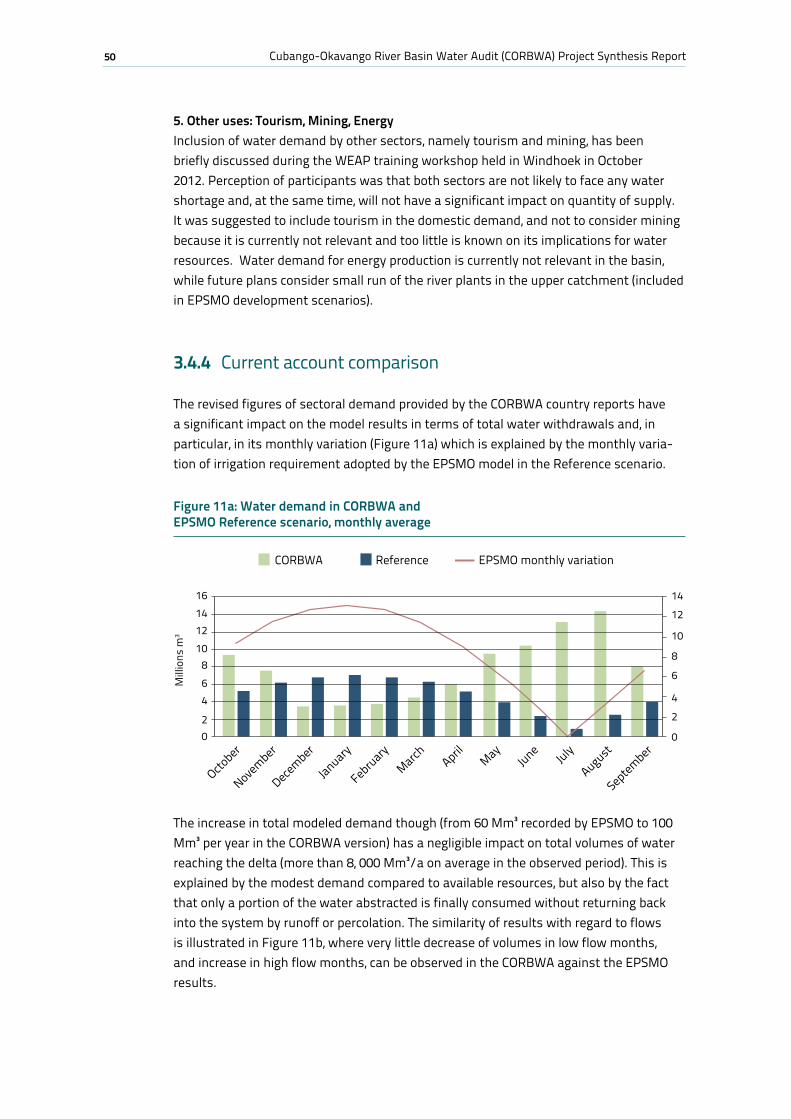
50 Cubango-Okavango River Basin Water Audit (CORBWA) Project Synthesis Report
5. Other uses: Tourism, Mining, EnergyInclusion of water demand by other sectors, namely tourism and mining, has been briefly discussed during the WEAP training workshop held in Windhoek in October 2012. Perception of participants was that both sectors are not likely to face any water shortage and, at the same time, will not have a significant impact on quantity of supply. It was suggested to include tourism in the domestic demand, and not to consider mining because it is currently not relevant and too little is known on its implications for water resources. Water demand for energy production is currently not relevant in the basin, while future plans consider small run of the river plants in the upper catchment (included in EPSMO development scenarios).
3.4.4 Current account comparison
The revised figures of sectoral demand provided by the CORBWA country reports have a significant impact on the model results in terms of total water withdrawals and, in particular, in its monthly variation (Figure 11a) which is explained by the monthly varia-tion of irrigation requirement adopted by the EPSMO model in the Reference scenario.
The increase in total modeled demand though (from 60 Mm³ recorded by EPSMO to 100 Mm³ per year in the CORBWA version) has a negligible impact on total volumes of water reaching the delta (more than 8, 000 Mm³/a on average in the observed period). This is explained by the modest demand compared to available resources, but also by the fact that only a portion of the water abstracted is finally consumed without returning back into the system by runoff or percolation. The similarity of results with regard to flows is illustrated in Figure 11b, where very little decrease of volumes in low flow months, and increase in high flow months, can be observed in the CORBWA against the EPSMO results.
Figure 11a: Water demand in CORBWA and EPSMO Reference scenario, monthly average
October
November
December
January
FebruaryMarch April
MayJune
July
August
September
CORBWA Reference
02
468
101214
0
2
4
6
8
10
12
1416
EPSMO monthly variation
Mill
ions
m3
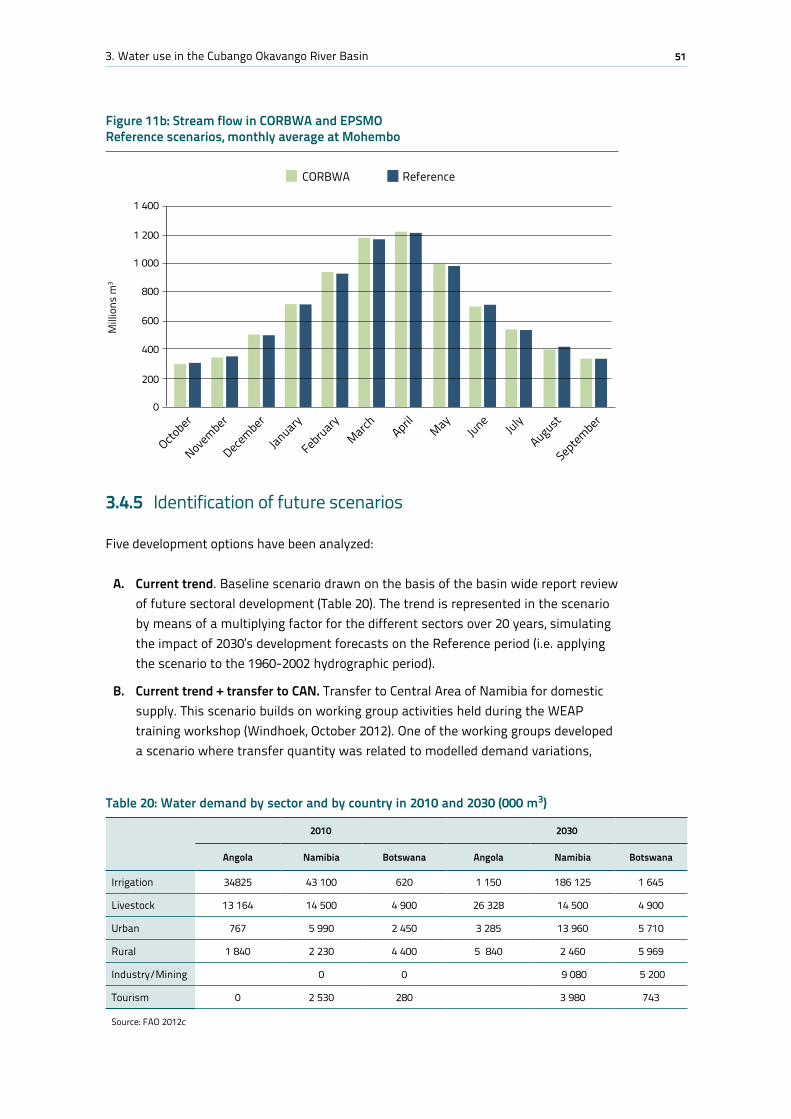
513. Water use in the Cubango Okavango River Basin
Figure 11b: Stream flow in CORBWA and EPSMO Reference scenarios, monthly average at Mohembo
CORBWA Reference
Mill
ions
m3
October
November
December
January
FebruaryMarch April
MayJune
July
August
September0
200
400
600
800
1 000
1 200
1 400
3.4.5 Identification of future scenarios
Five development options have been analyzed:
A. Current trend. Baseline scenario drawn on the basis of the basin wide report review of future sectoral development (Table 20). The trend is represented in the scenario by means of a multiplying factor for the different sectors over 20 years, simulating the impact of 2030’s development forecasts on the Reference period (i.e. applying the scenario to the 1960-2002 hydrographic period).
B. Current trend + transfer to CAN. Transfer to Central Area of Namibia for domestic supply. This scenario builds on working group activities held during the WEAP training workshop (Windhoek, October 2012). One of the working groups developed a scenario where transfer quantity was related to modelled demand variations,
Table 20: Water demand by sector and by country in 2010 and 2030 (000 m3)
2010 2030
Angola Namibia Botswana Angola Namibia Botswana
Irrigation 34825 43 100 620 1 150 186 125 1 645
Livestock 13 164 14 500 4 900 26 328 14 500 4 900
Urban 767 5 990 2 450 3 285 13 960 5 710
Rural 1 840 2 230 4 400 5 840 2 460 5 969
Industry/Mining 0 0 9 080 5 200
Tourism 0 2 530 280 3 980 743
Source: FAO 2012c
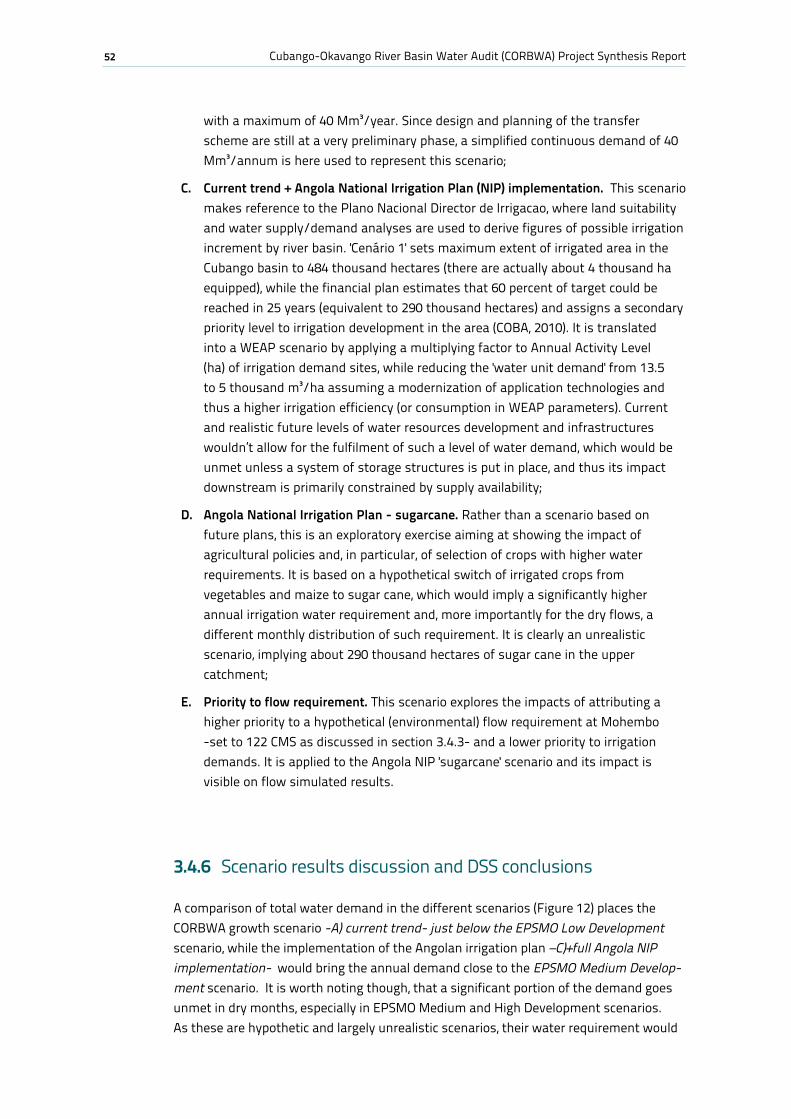
52 Cubango-Okavango River Basin Water Audit (CORBWA) Project Synthesis Report
with a maximum of 40 Mm³/year. Since design and planning of the transfer scheme are still at a very preliminary phase, a simplified continuous demand of 40 Mm³/annum is here used to represent this scenario;
C. Current trend + Angola National Irrigation Plan (NIP) implementation. This scenario makes reference to the Plano Nacional Director de Irrigacao, where land suitability and water supply/demand analyses are used to derive figures of possible irrigation increment by river basin. 'Cenário 1' sets maximum extent of irrigated area in the Cubango basin to 484 thousand hectares (there are actually about 4 thousand ha equipped), while the financial plan estimates that 60 percent of target could be reached in 25 years (equivalent to 290 thousand hectares) and assigns a secondary priority level to irrigation development in the area (COBA, 2010). It is translated into a WEAP scenario by applying a multiplying factor to Annual Activity Level (ha) of irrigation demand sites, while reducing the 'water unit demand' from 13.5 to 5 thousand m³/ha assuming a modernization of application technologies and thus a higher irrigation efficiency (or consumption in WEAP parameters). Current and realistic future levels of water resources development and infrastructures wouldn’t allow for the fulfilment of such a level of water demand, which would be unmet unless a system of storage structures is put in place, and thus its impact downstream is primarily constrained by supply availability;
D. Angola National Irrigation Plan - sugarcane. Rather than a scenario based on future plans, this is an exploratory exercise aiming at showing the impact of agricultural policies and, in particular, of selection of crops with higher water requirements. It is based on a hypothetical switch of irrigated crops from vegetables and maize to sugar cane, which would imply a significantly higher annual irrigation water requirement and, more importantly for the dry flows, a different monthly distribution of such requirement. It is clearly an unrealistic scenario, implying about 290 thousand hectares of sugar cane in the upper catchment;
E. Priority to flow requirement. This scenario explores the impacts of attributing a higher priority to a hypothetical (environmental) flow requirement at Mohembo -set to 122 CMS as discussed in section 3.4.3- and a lower priority to irrigation demands. It is applied to the Angola NIP 'sugarcane' scenario and its impact is visible on flow simulated results.
3.4.6 Scenario results discussion and DSS conclusions
A comparison of total water demand in the different scenarios (Figure 12) places the CORBWA growth scenario -A) current trend- just below the EPSMO Low Development scenario, while the implementation of the Angolan irrigation plan –C)+full Angola NIP implementation- would bring the annual demand close to the EPSMO Medium Develop-ment scenario. It is worth noting though, that a significant portion of the demand goes unmet in dry months, especially in EPSMO Medium and High Development scenarios. As these are hypothetic and largely unrealistic scenarios, their water requirement would
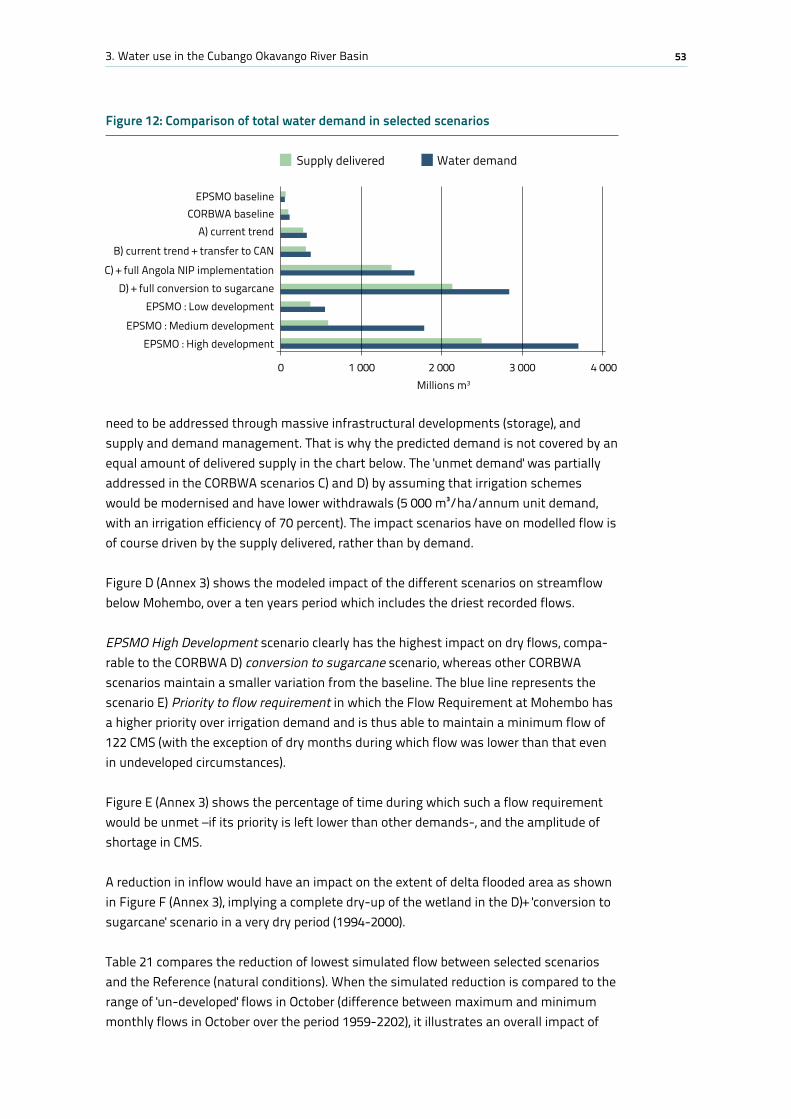
533. Water use in the Cubango Okavango River Basin
need to be addressed through massive infrastructural developments (storage), and supply and demand management. That is why the predicted demand is not covered by an equal amount of delivered supply in the chart below. The 'unmet demand' was partially addressed in the CORBWA scenarios C) and D) by assuming that irrigation schemes would be modernised and have lower withdrawals (5 000 m³/ha/annum unit demand, with an irrigation efficiency of 70 percent). The impact scenarios have on modelled flow is of course driven by the supply delivered, rather than by demand.
Figure D (Annex 3) shows the modeled impact of the different scenarios on streamflow below Mohembo, over a ten years period which includes the driest recorded flows.
EPSMO High Development scenario clearly has the highest impact on dry flows, compa-rable to the CORBWA D) conversion to sugarcane scenario, whereas other CORBWA scenarios maintain a smaller variation from the baseline. The blue line represents the scenario E) Priority to flow requirement in which the Flow Requirement at Mohembo has a higher priority over irrigation demand and is thus able to maintain a minimum flow of 122 CMS (with the exception of dry months during which flow was lower than that even in undeveloped circumstances).
Figure E (Annex 3) shows the percentage of time during which such a flow requirement would be unmet –if its priority is left lower than other demands-, and the amplitude of shortage in CMS.
A reduction in inflow would have an impact on the extent of delta flooded area as shown in Figure F (Annex 3), implying a complete dry-up of the wetland in the D)+ 'conversion to sugarcane' scenario in a very dry period (1994-2000).
Table 21 compares the reduction of lowest simulated flow between selected scenarios and the Reference (natural conditions). When the simulated reduction is compared to the range of 'un-developed' flows in October (difference between maximum and minimum monthly flows in October over the period 1959-2202), it illustrates an overall impact of
Figure 12: Comparison of total water demand in selected scenarios
Supply delivered
0 1 000 2 000 3 000 4 000
Water demand
Millions m3
EPSMO baselineCORBWA baseline
A) current trend
B) current trend + transfer to CAN
C) + full Angola NIP implementationD) + full conversion to sugarcane
EPSMO : Low development
EPSMO : Medium developmentEPSMO : High development
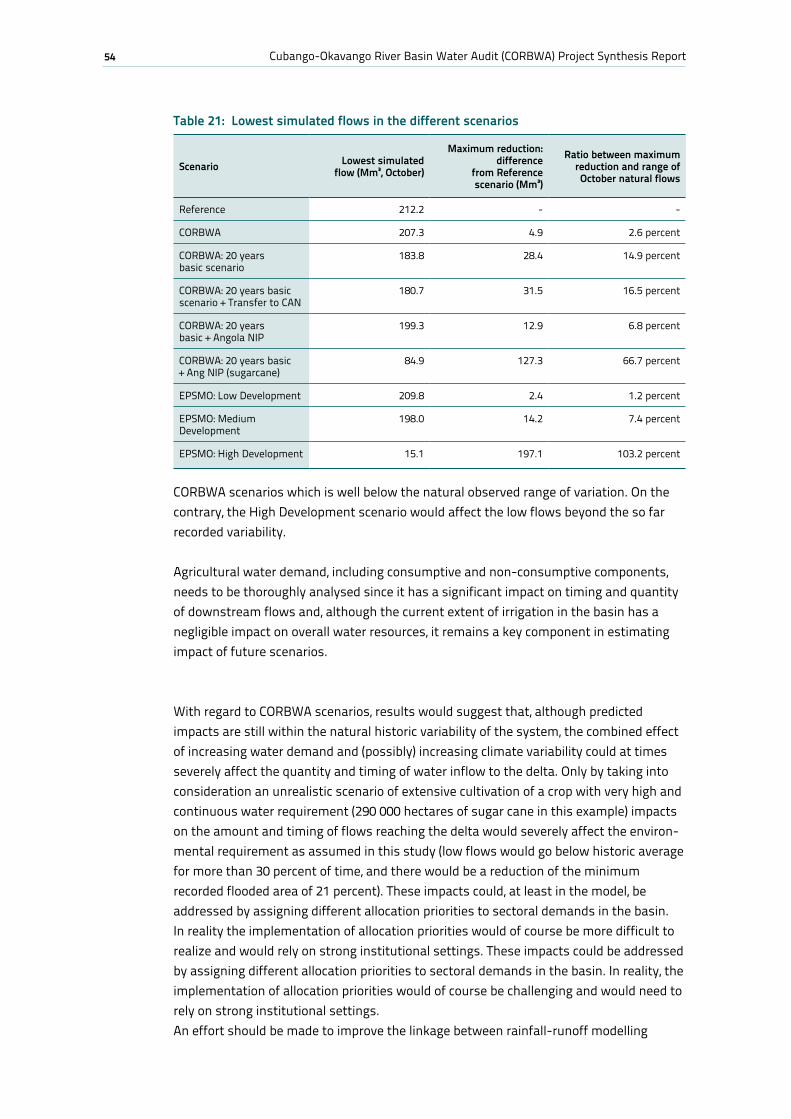
54 Cubango-Okavango River Basin Water Audit (CORBWA) Project Synthesis Report
CORBWA scenarios which is well below the natural observed range of variation. On the contrary, the High Development scenario would affect the low flows beyond the so far recorded variability.
Agricultural water demand, including consumptive and non-consumptive components, needs to be thoroughly analysed since it has a significant impact on timing and quantity of downstream flows and, although the current extent of irrigation in the basin has a negligible impact on overall water resources, it remains a key component in estimating impact of future scenarios.
With regard to CORBWA scenarios, results would suggest that, although predicted impacts are still within the natural historic variability of the system, the combined effect of increasing water demand and (possibly) increasing climate variability could at times severely affect the quantity and timing of water inflow to the delta. Only by taking into consideration an unrealistic scenario of extensive cultivation of a crop with very high and continuous water requirement (290 000 hectares of sugar cane in this example) impacts on the amount and timing of flows reaching the delta would severely affect the environ-mental requirement as assumed in this study (low flows would go below historic average for more than 30 percent of time, and there would be a reduction of the minimum recorded flooded area of 21 percent). These impacts could, at least in the model, be addressed by assigning different allocation priorities to sectoral demands in the basin. In reality the implementation of allocation priorities would of course be more difficult to realize and would rely on strong institutional settings. These impacts could be addressed by assigning different allocation priorities to sectoral demands in the basin. In reality, the implementation of allocation priorities would of course be challenging and would need to rely on strong institutional settings.An effort should be made to improve the linkage between rainfall-runoff modelling
Table 21: Lowest simulated flows in the different scenarios
Scenario Lowest simulated flow (Mm³, October)
Maximum reduction: difference
from Reference scenario (Mm³)
Ratio between maximum reduction and range of October natural flows
Reference 212.2 - -
CORBWA 207.3 4.9 2.6 percent
CORBWA: 20 years basic scenario
183.8 28.4 14.9 percent
CORBWA: 20 years basic scenario + Transfer to CAN
180.7 31.5 16.5 percent
CORBWA: 20 years basic + Angola NIP
199.3 12.9 6.8 percent
CORBWA: 20 years basic + Ang NIP (sugarcane)
84.9 127.3 66.7 percent
EPSMO: Low Development 209.8 2.4 1.2 percent
EPSMO: Medium Development
198.0 14.2 7.4 percent
EPSMO: High Development 15.1 197.1 103.2 percent
553. Water use in the Cubango Okavango River Basin
component of the CORB to supply/demand analysis, currently addressed by separate models (Pitman and WEAP). Having the climatic data better embedded in the decision support tool would allow for:
a. Improved assessment of agricultural water requirement, which depends on climatic conditions;
b. Extension of hydrological period beyond 2002 either by –preferably- using more recent monitoring stations data, or by performing a stochastic simulation of precipitation in future years, or by using other ad-hoc techniques;
c. Climate change impact analysis; and
d. Land use change impact analysis.
This could be achieved by using the rainfall-runoff soil moisture module available in WEAP or by customizing WEAP to easily change parameters in the Pitman and retrieving its output (being Pitman a locally calibrated rainfall-runoff model, this option would prob-ably allow for a more robust hydrological analysis).
3.5 Conclusions and recommendations
The current water withdrawals from the Cubango Okavango River are low (90.0 Mm3) as compared to its mean annual run-off upstream of the Delta (10900 M m3; OKACOM, 2011, p.55) and there is scope for increased withdrawals and use. Withdrawals are expected to increase manifold (to somewhere in the range of 0.6 – 3 billion m3 over the next two decades), mostly due to more irrigation but also because of increased domestic use. Water withdrawals for the mining are minimal at present, but could increase if new mines are opened in the basin. Given the high returns of the mining sectors, it is impor-tant that this possibility is fully incorporated in water resource management of the basin. The primary issues are how much ‘extra’ can be used (i.e. what is the ‘development space’) and how do we ensure that extra withdrawals benefit the basin as a whole and member states in terms of improved livelihoods of the local population (thematic area 1 of the Basin Development and Management Framework of OKACOM), economic growth and development, employment generation, enhanced food security and poverty reduction. In addition, the utilisation of the development space should benefit regional economic integration through the implementation of shared projects and/or increased trade between member states. For example, irrigation projects in Angola could be used to enhance food supply in Namibia and Botswana through trade. Therefore, OKACOM should reach agreement on a ‘Water and Food Security Strategy’ for the basin and its member states. This strategy would indicate the share of the development space to be used for food production, where this is best done and how intra member states’ trade can enhance food security.
The development space has not been assessed in quantitative terms, and there is need for further scientific research (SAP’s Indicative management objective 2) on this, taking into account the estimated ecological water requirements and the basic human needs.
56 Cubango-Okavango River Basin Water Audit (CORBWA) Project Synthesis Report
Even without quantitative assessment, it becomes clear that OKACOM has major advan-tages over other basins such as Orange-Senqu and the Limpopo, which are already heavily used and have a very small and possibly negative development space. Gener-ating economic and livelihoods benefits to the basin and member states should be the overall guiding principle for water allocations along with sustaining the ecosystems in the basin. This requires the evaluation of trade-offs between different water demands (e.g. agriculture, mining, tourism and others). Allocation of water withdrawal rights could be made conditional. For example, the Protocol stipulates that alternative water sources of comparable value must first be exploited and that adverse impacts on other member states must be identified and mitigated/ compensated. While there has been no request for water allocations from the river to-date, such requests are likely to happen in the (near) future and OKACOM needs to be prepared with agreed, transparent, fair and equi-table water allocation (and benefit sharing) mechanisms (this also refers to SAPs’ IMO 4). Agriculture is currently the main water using sector (83.6 percent of water withdrawals in the basin), and irrigation plans in Angola and Namibia could lead to an over 95 percent agricultural share in water use in future. EPSMO and the TDA have, however, shown that this may have negative consequences for livelihoods, biodiversity and economic development in the basin (key concerns of the BDMF). Increase in irrigation water use up to a level in which such consequences would materialize is therefore not desirable. The reason is that the irrigation sector’s extra contribution to livelihoods and GDP are smaller than the losses in GDP and livelihoods due to a decrease in tourism sector. While it is important to also consider other indicators such as the impact on food security and poverty, the clear message is that member states and OKACOM need to plan and manage future activities in the basin to ensure that they generate optimal benefits to liveli-hoods and countries’ economies. Moreover, within each sector livelihood improvements and socio-economic development need to be prioritised (e.g. small scale irrigation could benefit more farmers and livelihoods than large scale irrigation schemes). This requires transparent water distribution and allocation mechanisms based on (socio-) economic analysis of the costs and benefits and possible mechanisms for sharing of benefits of water allocations. While accurate quantification of environmental flow require-ment has not yet been produced, it is clear that biodiversity and ecosystems could be adversely affected by uncontrolled and uncoordinated river water withdrawals. Planning and management is necessary to avoid this from happening. There is need to consider optimal use of groundwater resources, water supply measures as well as water demand management measures, including re-use of treated wastewater, rainwater and storm water harvesting, water efficient production and use technologies and practices. Particu-larly, water conservation practices could be adopted in the irrigation sector to reduce the opportunity costs of irrigation water use and increase the value added/m3. While the need to conserve water may not be evident in a water abundant country like Angola, basin wide management requires water efficient irrigation to ensure economic growth and livelihood improvements in the entire basin. OKACOM member states should develop water use standards for irrigation in the basin, and could as part of water allocation mechanisms agree on quota of irrigation water use for each member state. Future water allocations also need to be based on shared water norms (e.g. for basic

573. Water use in the Cubango Okavango River Basin
needs). For example, at present the water supply norms for human being as well as live-stock differ between member states, with Angola having lower supply norms and a large hidden demand due to the poor state of water service delivery systems.
58 Cubango-Okavango River Basin Water Audit (CORBWA) Project Synthesis Report
4. The value and costs25 of water resources
4.1 Introduction
Member states have recognised the importance of understanding the value of water resources, as is shown by the valuation exercises of the Delta (Turpie et al., 2006) and the Basin (Barnes et al., 2009). The project reviewed information about the value and cost of water resources in the basin, in particular related to irrigation. In addition, opportunities for water accounting and the links with water audits were explored. The UN and SADC promote economic water accounting (EWA) at the national and basin level (UN, 2012 and SADC, 2011). In the basin, Namibia and Botswana have national water accounts, but EWA for basins are still at the pilot phase (e.g. Orange Senque and Nkomati).
Water scarcity often leads to competition for water among different economic sector (e.g. irrigation, livestock, domestic use, mining, industries etc.). In practice, water is often still allocated on a first-come, first-served basis without due regards for the livelihood and development benefits and the opportunity costs. While water withdrawals are still low in the Okavango basin, future demands could lead to inefficient water allocations and development losses without due consideration of the value of water. The TDA (OKACOM, 2011) has shown that large-scale expansion of irrigation could lead to lower livelihood and development levels. The opportunity costs (in this case the high water value in tourism) need to be considered to avoid adverse future economic impacts.
4.2 Useful value and cost concepts
The study reviewed several key valuation and costs concepts that should guide decision making. These are the Total Economic Value, the Marginal Opportunity Costs and the concept of economic rent.
Total Economic ValueThe TEV (Figure 13) shows that the value of water exceeds the direct use value created through water withdrawals (direct use value). The TEV must be taken into account in the determination of the size of the development space, i.e. the amount of water that is available for allocation. Value is also derived from non-productive ecosystem services indirect use values such regulation, absorption and scientific and education) as well as from possible future use (option value) and the existence of water resources (exist-ence value). Valuation exercises are often restricted to the direct use values, but valu-ation studies in the basin have shown the quantitative importance of the indirect use
25 This chapter is adapted from the basin wide report on water resource economics and irrigation (Arntzen et al., 2012).
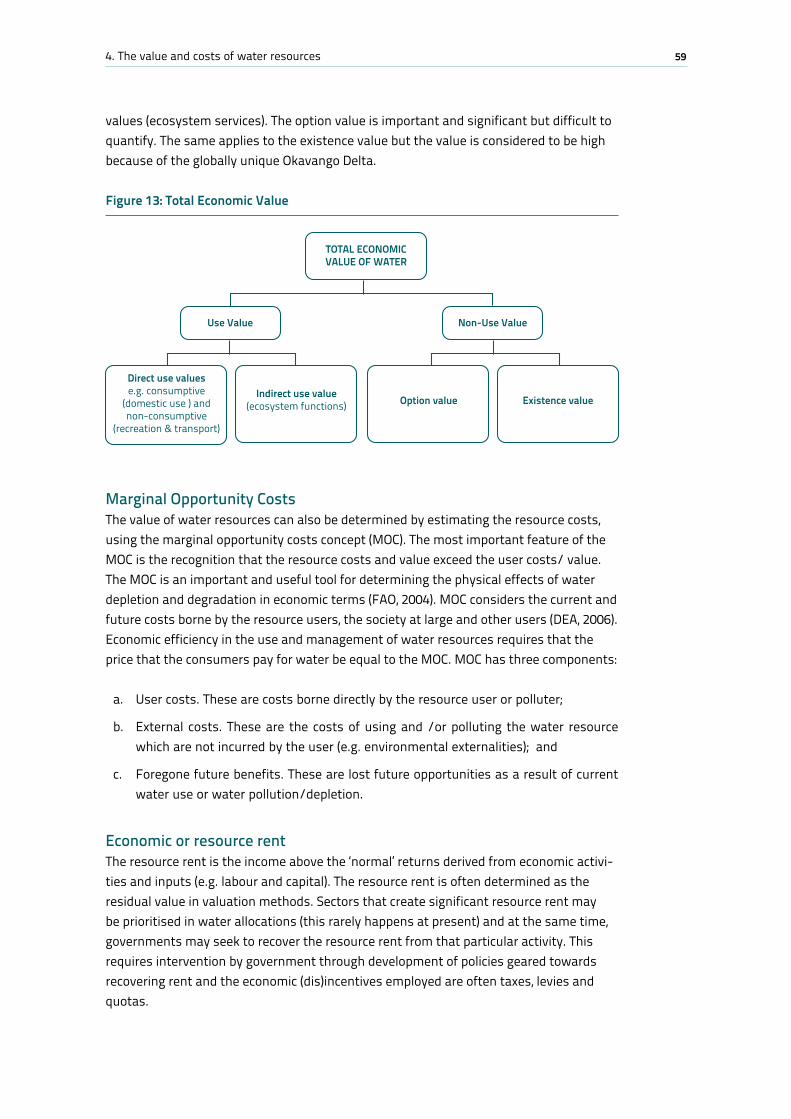
594. The value and costs of water resources
values (ecosystem services). The option value is important and significant but difficult to quantify. The same applies to the existence value but the value is considered to be high because of the globally unique Okavango Delta.
Marginal Opportunity CostsThe value of water resources can also be determined by estimating the resource costs, using the marginal opportunity costs concept (MOC). The most important feature of the MOC is the recognition that the resource costs and value exceed the user costs/ value. The MOC is an important and useful tool for determining the physical effects of water depletion and degradation in economic terms (FAO, 2004). MOC considers the current and future costs borne by the resource users, the society at large and other users (DEA, 2006). Economic efficiency in the use and management of water resources requires that the price that the consumers pay for water be equal to the MOC. MOC has three components:
a. User costs. These are costs borne directly by the resource user or polluter;
b. External costs. These are the costs of using and /or polluting the water resource which are not incurred by the user (e.g. environmental externalities); and
c. Foregone future benefits. These are lost future opportunities as a result of current water use or water pollution/depletion.
Economic or resource rentThe resource rent is the income above the ‘normal’ returns derived from economic activi-ties and inputs (e.g. labour and capital). The resource rent is often determined as the residual value in valuation methods. Sectors that create significant resource rent may be prioritised in water allocations (this rarely happens at present) and at the same time, governments may seek to recover the resource rent from that particular activity. This requires intervention by government through development of policies geared towards recovering rent and the economic (dis)incentives employed are often taxes, levies and quotas.
Figure 13: Total Economic Value
TOTAL ECONOMIC VALUE OF WATER
Use Value Non-Use Value
Direct use valuese.g. consumptive
(domestic use ) and non-consumptive
(recreation & transport)
Indirect use value (ecosystem functions) Option value Existence value
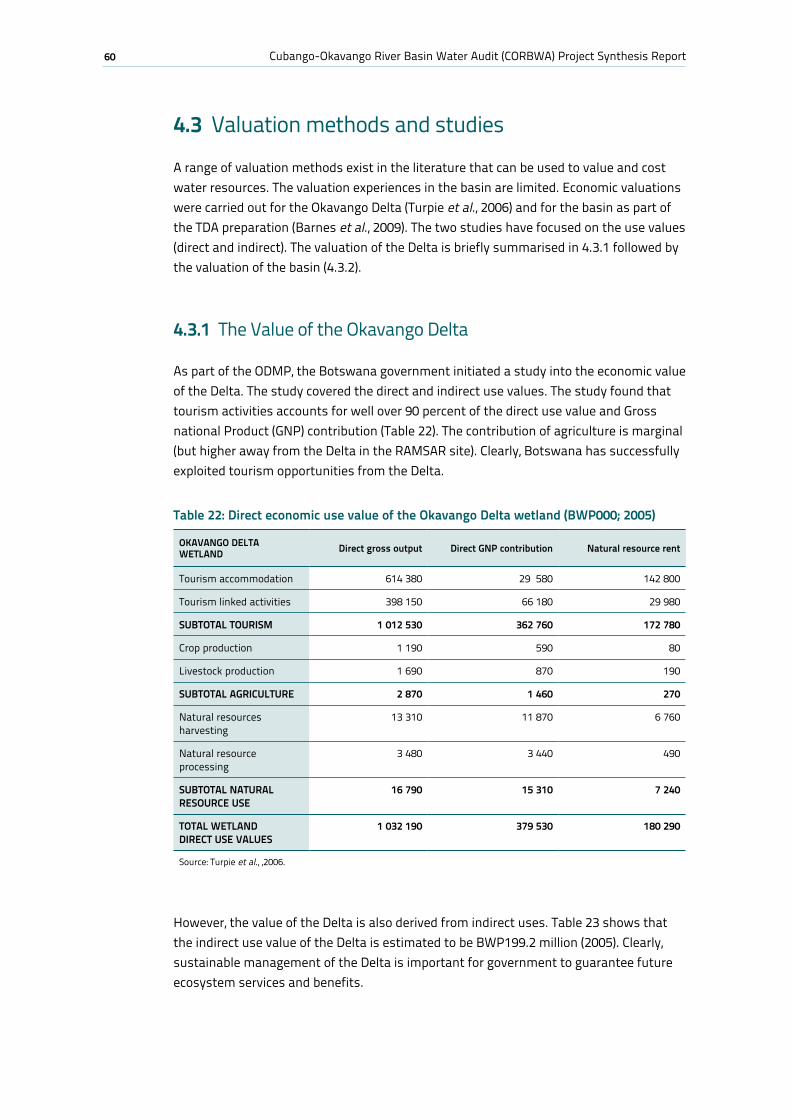
60 Cubango-Okavango River Basin Water Audit (CORBWA) Project Synthesis Report
4.3 Valuation methods and studies
A range of valuation methods exist in the literature that can be used to value and cost water resources. The valuation experiences in the basin are limited. Economic valuations were carried out for the Okavango Delta (Turpie et al., 2006) and for the basin as part of the TDA preparation (Barnes et al., 2009). The two studies have focused on the use values (direct and indirect). The valuation of the Delta is briefly summarised in 4.3.1 followed by the valuation of the basin (4.3.2).
4.3.1 The Value of the Okavango Delta
As part of the ODMP, the Botswana government initiated a study into the economic value of the Delta. The study covered the direct and indirect use values. The study found that tourism activities accounts for well over 90 percent of the direct use value and Gross national Product (GNP) contribution (Table 22). The contribution of agriculture is marginal (but higher away from the Delta in the RAMSAR site). Clearly, Botswana has successfully exploited tourism opportunities from the Delta.
However, the value of the Delta is also derived from indirect uses. Table 23 shows that the indirect use value of the Delta is estimated to be BWP199.2 million (2005). Clearly, sustainable management of the Delta is important for government to guarantee future ecosystem services and benefits.
Table 22: Direct economic use value of the Okavango Delta wetland (BWP000; 2005)
OKAVANGO DELTA WETLAND Direct gross output Direct GNP contribution Natural resource rent
Tourism accommodation 614 380 29 580 142 800
Tourism linked activities 398 150 66 180 29 980
SUBTOTAL TOURISM 1 012 530 362 760 172 780
Crop production 1 190 590 80
Livestock production 1 690 870 190
SUBTOTAL AGRICULTURE 2 870 1 460 270
Natural resources harvesting
13 310 11 870 6 760
Natural resource processing
3 480 3 440 490
SUBTOTAL NATURAL RESOURCE USE
16 790 15 310 7 240
TOTAL WETLAND DIRECT USE VALUES
1 032 190 379 530 180 290
Source: Turpie et al., ,2006.
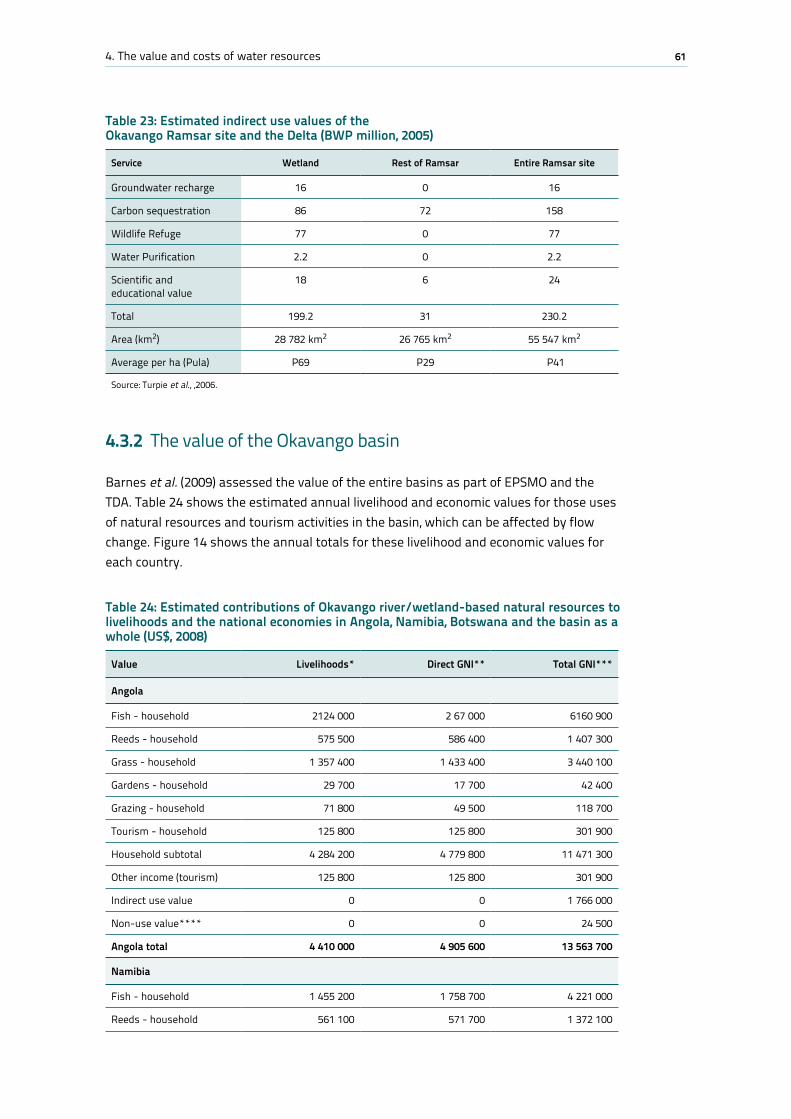
614. The value and costs of water resources
4.3.2 The value of the Okavango basin
Barnes et al. (2009) assessed the value of the entire basins as part of EPSMO and the TDA. Table 24 shows the estimated annual livelihood and economic values for those uses of natural resources and tourism activities in the basin, which can be affected by flow change. Figure 14 shows the annual totals for these livelihood and economic values for each country.
Table 23: Estimated indirect use values of the Okavango Ramsar site and the Delta (BWP million, 2005)
Service Wetland Rest of Ramsar Entire Ramsar site
Groundwater recharge 16 0 16
Carbon sequestration 86 72 158
Wildlife Refuge 77 0 77
Water Purification 2.2 0 2.2
Scientific and educational value
18 6 24
Total 199.2 31 230.2
Area (km2) 28 782 km2 26 765 km2 55 547 km2
Average per ha (Pula) P69 P29 P41
Source: Turpie et al., ,2006.
Table 24: Estimated contributions of Okavango river/wetland-based natural resources to livelihoods and the national economies in Angola, Namibia, Botswana and the basin as a whole (US$, 2008)
Value Livelihoods* Direct GNI** Total GNI***
Angola
Fish - household 2124 000 2 67 000 6160 900
Reeds - household 575 500 586 400 1 407 300
Grass - household 1 357 400 1 433 400 3 440 100
Gardens - household 29 700 17 700 42 400
Grazing - household 71 800 49 500 118 700
Tourism - household 125 800 125 800 301 900
Household subtotal 4 284 200 4 779 800 11 471 300
Other income (tourism) 125 800 125 800 301 900
Indirect use value 0 0 1 766 000
Non-use value**** 0 0 24 500
Angola total 4 410 000 4 905 600 13 563 700
Namibia
Fish - household 1 455 200 1 758 700 4 221 000
Reeds - household 561 100 571 700 1 372 100
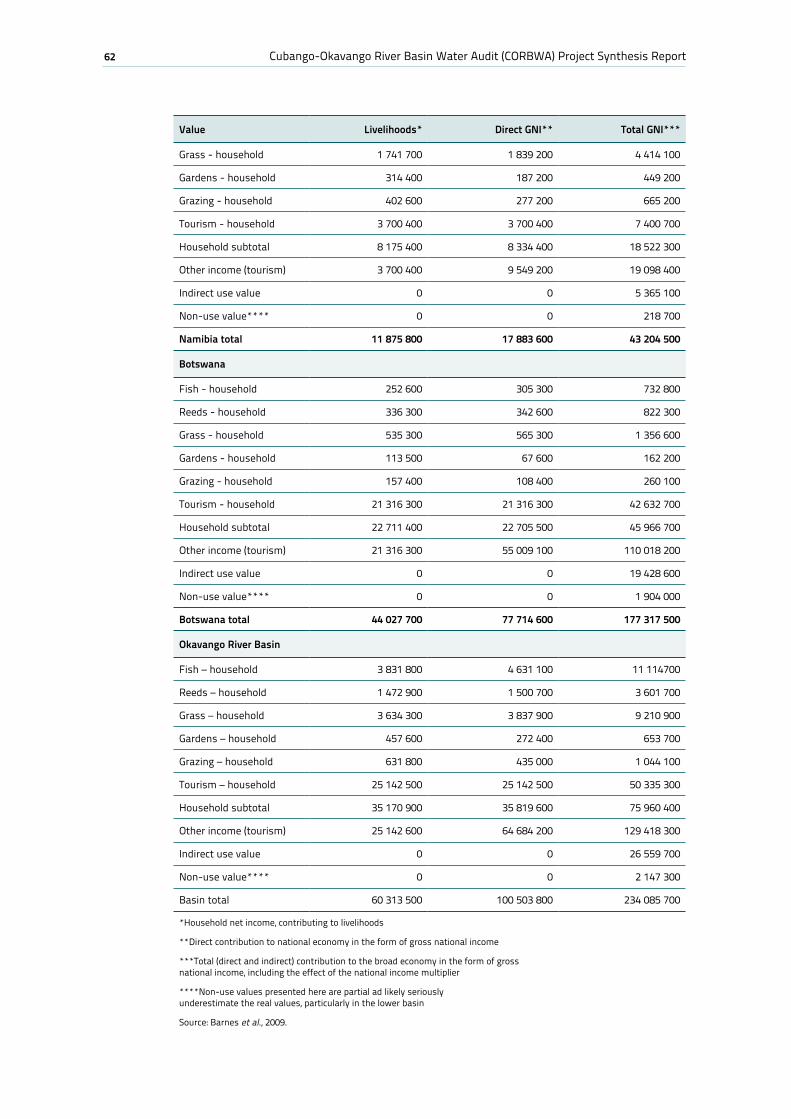
62 Cubango-Okavango River Basin Water Audit (CORBWA) Project Synthesis Report
Value Livelihoods* Direct GNI** Total GNI***
Grass - household 1 741 700 1 839 200 4 414 100
Gardens - household 314 400 187 200 449 200
Grazing - household 402 600 277 200 665 200
Tourism - household 3 700 400 3 700 400 7 400 700
Household subtotal 8 175 400 8 334 400 18 522 300
Other income (tourism) 3 700 400 9 549 200 19 098 400
Indirect use value 0 0 5 365 100
Non-use value**** 0 0 218 700
Namibia total 11 875 800 17 883 600 43 204 500
Botswana
Fish - household 252 600 305 300 732 800
Reeds - household 336 300 342 600 822 300
Grass - household 535 300 565 300 1 356 600
Gardens - household 113 500 67 600 162 200
Grazing - household 157 400 108 400 260 100
Tourism - household 21 316 300 21 316 300 42 632 700
Household subtotal 22 711 400 22 705 500 45 966 700
Other income (tourism) 21 316 300 55 009 100 110 018 200
Indirect use value 0 0 19 428 600
Non-use value**** 0 0 1 904 000
Botswana total 44 027 700 77 714 600 177 317 500
Okavango River Basin
Fish – household 3 831 800 4 631 100 11 114700
Reeds – household 1 472 900 1 500 700 3 601 700
Grass – household 3 634 300 3 837 900 9 210 900
Gardens – household 457 600 272 400 653 700
Grazing – household 631 800 435 000 1 044 100
Tourism – household 25 142 500 25 142 500 50 335 300
Household subtotal 35 170 900 35 819 600 75 960 400
Other income (tourism) 25 142 600 64 684 200 129 418 300
Indirect use value 0 0 26 559 700
Non-use value**** 0 0 2 147 300
Basin total 60 313 500 100 503 800 234 085 700
*Household net income, contributing to livelihoods
**Direct contribution to national economy in the form of gross national income
***Total (direct and indirect) contribution to the broad economy in the form of gross national income, including the effect of the national income multiplier
****Non-use values presented here are partial ad likely seriously underestimate the real values, particularly in the lower basin
Source: Barnes et al., 2009.
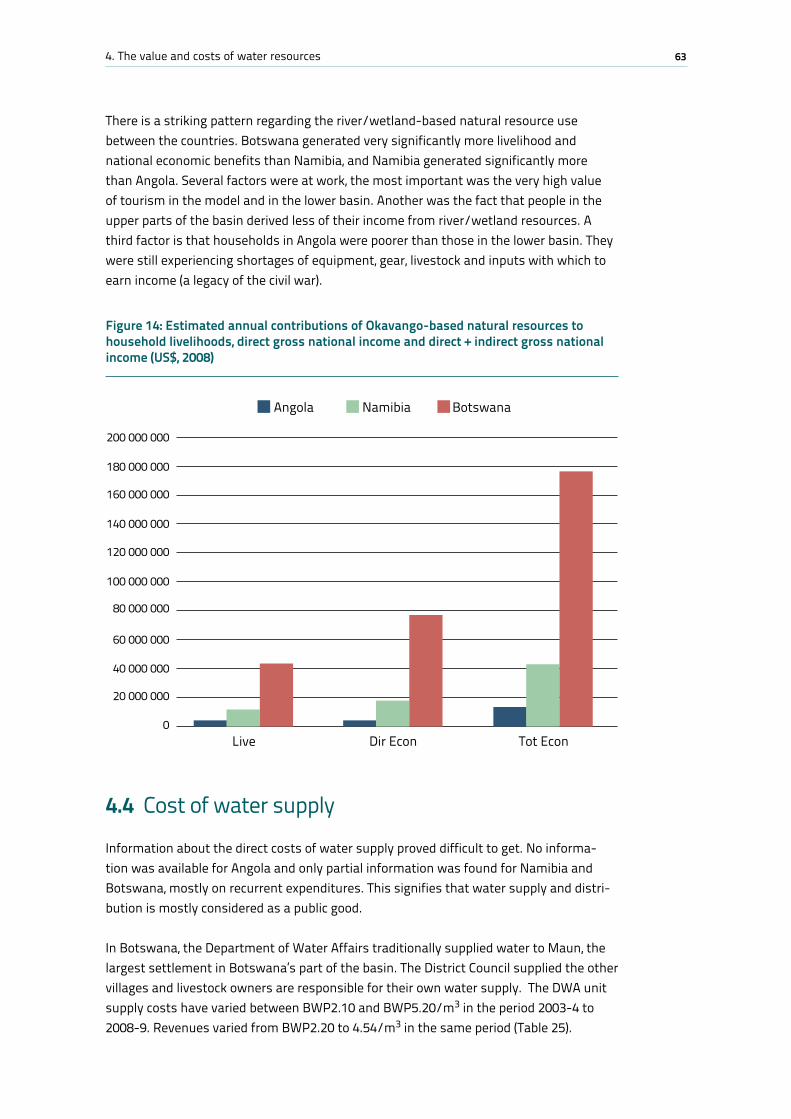
634. The value and costs of water resources
There is a striking pattern regarding the river/wetland-based natural resource use between the countries. Botswana generated very significantly more livelihood and national economic benefits than Namibia, and Namibia generated significantly more than Angola. Several factors were at work, the most important was the very high value of tourism in the model and in the lower basin. Another was the fact that people in the upper parts of the basin derived less of their income from river/wetland resources. A third factor is that households in Angola were poorer than those in the lower basin. They were still experiencing shortages of equipment, gear, livestock and inputs with which to earn income (a legacy of the civil war).
4.4 Cost of water supply
Information about the direct costs of water supply proved difficult to get. No informa-tion was available for Angola and only partial information was found for Namibia and Botswana, mostly on recurrent expenditures. This signifies that water supply and distri-bution is mostly considered as a public good.
In Botswana, the Department of Water Affairs traditionally supplied water to Maun, the largest settlement in Botswana’s part of the basin. The District Council supplied the other villages and livestock owners are responsible for their own water supply. The DWA unit supply costs have varied between BWP2.10 and BWP5.20/m3 in the period 2003-4 to 2008-9. Revenues varied from BWP2.20 to 4.54/m3 in the same period (Table 25).
Figure 14: Estimated annual contributions of Okavango-based natural resources to household livelihoods, direct gross national income and direct + indirect gross national income (US$, 2008)
Angola
Live Dir Econ Tot Econ
BotswanaNamibia
0
20 000 000
40 000 000
60 000 000
80 000 000
100 000 000
120 000 000
140 000 000
160 000 000
180 000 000
200 000 000
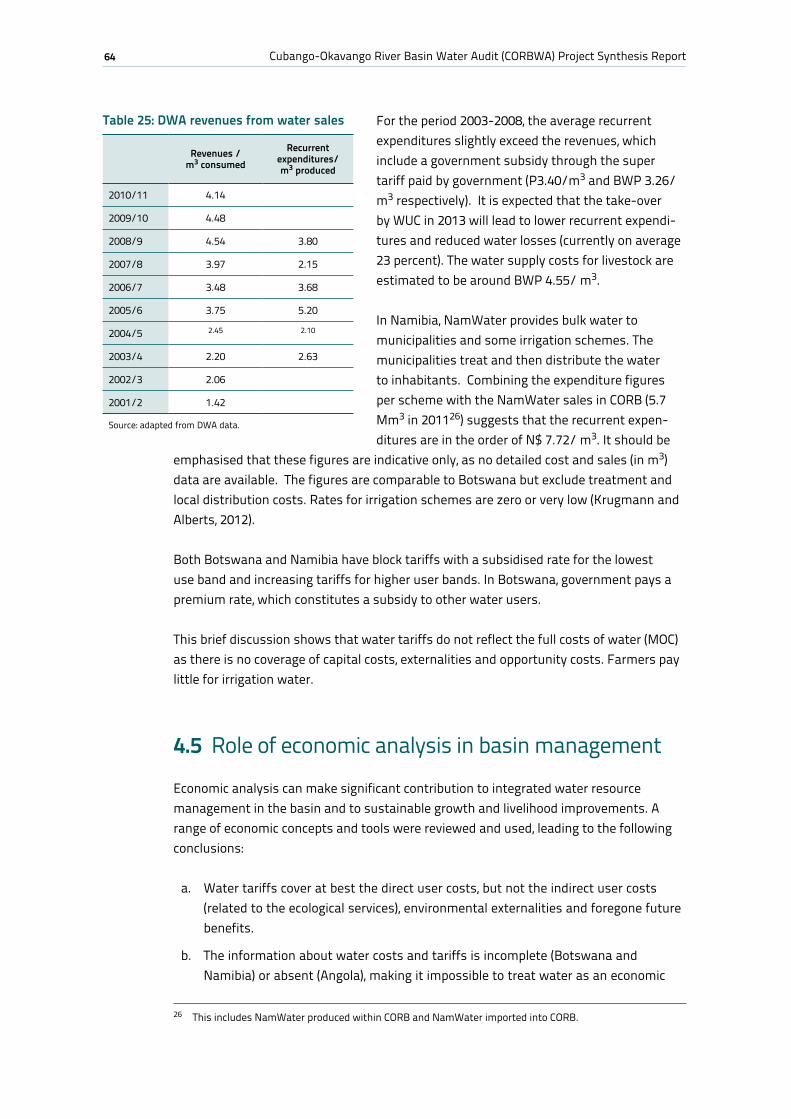
64 Cubango-Okavango River Basin Water Audit (CORBWA) Project Synthesis Report
For the period 2003-2008, the average recurrent expenditures slightly exceed the revenues, which include a government subsidy through the super tariff paid by government (P3.40/m3 and BWP 3.26/m3 respectively). It is expected that the take-over by WUC in 2013 will lead to lower recurrent expendi-tures and reduced water losses (currently on average 23 percent). The water supply costs for livestock are estimated to be around BWP 4.55/ m3.
In Namibia, NamWater provides bulk water to municipalities and some irrigation schemes. The municipalities treat and then distribute the water to inhabitants. Combining the expenditure figures per scheme with the NamWater sales in CORB (5.7 Mm3 in 201126) suggests that the recurrent expen-ditures are in the order of N$ 7.72/ m3. It should be
emphasised that these figures are indicative only, as no detailed cost and sales (in m3) data are available. The figures are comparable to Botswana but exclude treatment and local distribution costs. Rates for irrigation schemes are zero or very low (Krugmann and Alberts, 2012).
Both Botswana and Namibia have block tariffs with a subsidised rate for the lowest use band and increasing tariffs for higher user bands. In Botswana, government pays a premium rate, which constitutes a subsidy to other water users.
This brief discussion shows that water tariffs do not reflect the full costs of water (MOC) as there is no coverage of capital costs, externalities and opportunity costs. Farmers pay little for irrigation water.
4.5 Role of economic analysis in basin management
Economic analysis can make significant contribution to integrated water resource management in the basin and to sustainable growth and livelihood improvements. A range of economic concepts and tools were reviewed and used, leading to the following conclusions:
a. Water tariffs cover at best the direct user costs, but not the indirect user costs (related to the ecological services), environmental externalities and foregone future benefits.
b. The information about water costs and tariffs is incomplete (Botswana and Namibia) or absent (Angola), making it impossible to treat water as an economic
26 This includes NamWater produced within CORB and NamWater imported into CORB.
Table 25: DWA revenues from water sales
Revenues /m3 consumed
Recurrent expenditures/ m3 produced
2010/11 4.14
2009/10 4.48
2008/9 4.54 3.80
2007/8 3.97 2.15
2006/7 3.48 3.68
2005/6 3.75 5.20
2004/5 2.45 2.10
2003/4 2.20 2.63
2002/3 2.06
2001/2 1.42
Source: adapted from DWA data.
654. The value and costs of water resources
good. Governments cannot assess the extent of water subsidies and the situation may be unsustainable in future;
c. Standard irrigation figures such as US$15 000 investment/ ha and water use of 15 000 m3/ha/annum hide significant cost and water savings that can be achieved through rehabilitation of old infrastructure (e.g. Angola) and selection of water efficient irrigation methods. Future irrigation development in the basin needs to focus on rehabilitation of old infrastructure (e.g. dams) and water efficient technologies. These aspects have not been included in EPSMO and the TDA;
d. The economic valuation studies show the importance of ecological services (indirect use values) and the high value of tourism. Combined with scenario analysis, they show that in future the livelihoods and development of the basin can be adversely affected if future developments focus on large scale irrigation. The largely irrigation driven TDA scenarios yield negative results for livelihoods and economic development in the basin. There is therefore a need for a more diverse development path with improved water and sanitation, irrigation, tourism, hydro power and possibly mining. The scale and choice of technologies are also important determinants of environmental and economic impacts;
e. The above is supported by financial models that show that staple food irrigation is financially and economically inefficient27 (and do not deserve subsidies); that high value crop irrigation is financially inefficient but economically efficient (which can be justification for subsidies); (eco-) tourism lodges are financially and economically efficient and do not require subsidies. Water resource considerations are not the only determinant of projects’ viability and returns. Remoteness to markets (for inputs and outputs) is probably the most important determinant;
f. The economic models also yield different results, showing the importance of the careful use of data and assumption, validation of the results (with sensitivity analyses) and the need to develop basin empirical specific data, for example for irrigation and tourism. Such data could improve the quality of future models; and
g. Currently, Botswana realises most use value out of the basin, particularly from tourism. In contrast, Angola realises very limited use values as it is recovering from civil war. Namibia has an intermediate position.
Future basin projects and water allocations from the basin’s development space need to fully incorporate economic analysis to ensure sustainable economic and livelihood gains in the basin. The merits of joint infrastructure projects and sharing of benefits of water based projects in the basin need to be considered. In addition, the scale of projects and targeting (e.g. small scale community based projects) needs attention in the analyses and OKACOM member states’ decision making.
27 Financial feasibility refers to the feasibility to the investor; economic feasibility refers to feasibility to the country. If a project is not feasible to the investor but feasible for the country at large, government may
consider financial support for such a project to make it happen.
66 Cubango-Okavango River Basin Water Audit (CORBWA) Project Synthesis Report
4.5.1 Water valuation
By far the most frequently used approach in studies reviewed for southern Africa and the CORB has involved the value added approach. The value added to the national income derived from the national accounts formed the basis. In other studies empirically based natural resource use enterprise models have been developed, again to determine the contribution of the resource use to the national income. In a few instances demand curve approaches have been used to determine willingness to pay for water, but these have generally focused on specific water sectors such as domestic and urban water supply where water markets are best developed.
The value added approach has several advantages in the southern African water sector:
a. It uses data-bases, commonly available through multipurpose surveys on land and natural resource uses or project feasibility studies, and it does not normally require specific and expensive survey work to be done;
b. It can be applied in situations, common in southern Africa, where markets for land and water, and property rights are poorly developed;
c. Its results can be integrated into the national accounts framework allowing comparison of results with those for the economy as a whole and other natural resource sectors;
d. It can be specifically applied in a natural resource accounting context as it allows the estimation of resource rent, and value added to national income, as well as integration into broader land or ecosystem, accounts;
e. It has as its basic measure the returns to water and other natural resource uses in terms of livelihoods as well as economic growth, both important measures in project appraisal and development planning;
f. It can be used to determine actual water values where water is a measurable input to an income generation activity such as with irrigation, using the residual or net back method, but at the same time it can be used to simply measure the value of water influenced income generation activities, such as for example fishing where water input cannot be measured.
Table 26 provides a typology of water-related direct use values and indirect use values typical of the CORB and other southern African basins. Here, the first column shows activities where water as a measurable input can be valued. The case of irrigated produc-tion is typical. The third column shows activities where water is an important input, which affects production value but where the input is not measurable. Here a fishery is dependent on water but this generally cannot be valued specifically. The middle column shows activities where both conditions apply. For example, in a tourism lodge and a live-stock enterprise, water can be a measurable input in terms of drinking/domestic water, but it can also influence production by contributing as wetland to the tourism product or the enhanced effect of floodplain/wetland grazing.
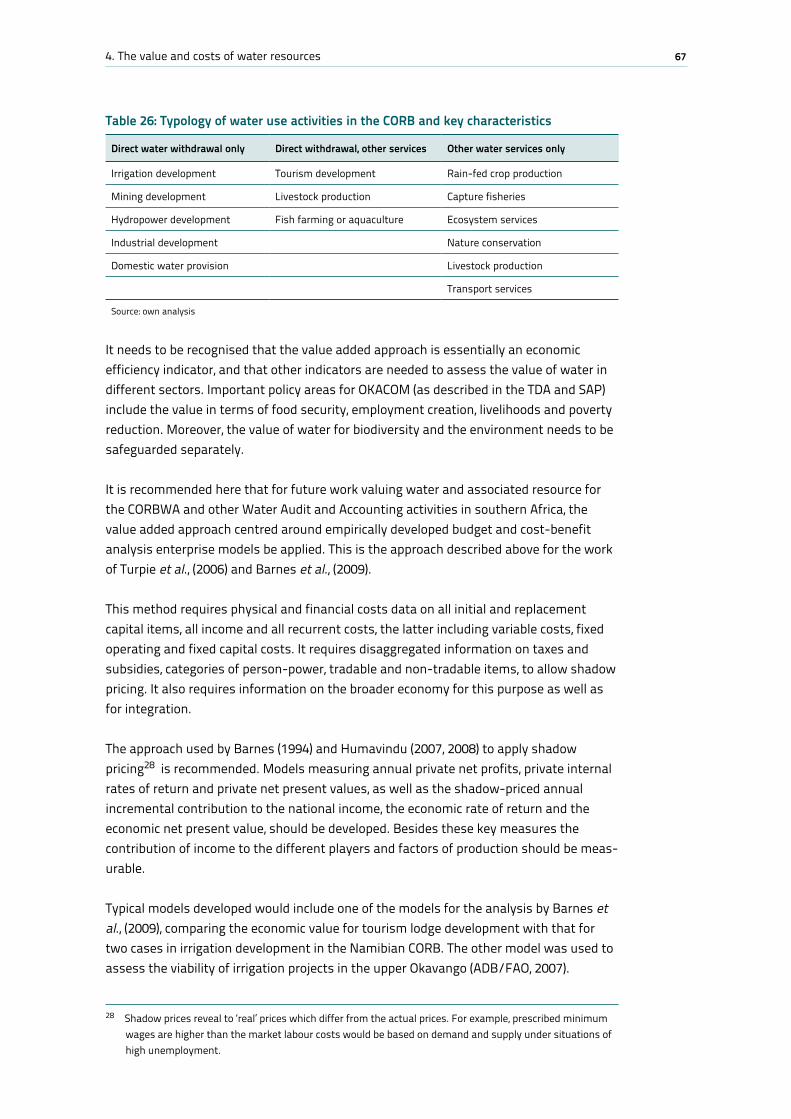
674. The value and costs of water resources
Table 26: Typology of water use activities in the CORB and key characteristics
Direct water withdrawal only Direct withdrawal, other services Other water services only
Irrigation development Tourism development Rain-fed crop production
Mining development Livestock production Capture fisheries
Hydropower development Fish farming or aquaculture Ecosystem services
Industrial development Nature conservation
Domestic water provision Livestock production
Transport services
Source: own analysis
It needs to be recognised that the value added approach is essentially an economic efficiency indicator, and that other indicators are needed to assess the value of water in different sectors. Important policy areas for OKACOM (as described in the TDA and SAP) include the value in terms of food security, employment creation, livelihoods and poverty reduction. Moreover, the value of water for biodiversity and the environment needs to be safeguarded separately.
It is recommended here that for future work valuing water and associated resource for the CORBWA and other Water Audit and Accounting activities in southern Africa, the value added approach centred around empirically developed budget and cost-benefit analysis enterprise models be applied. This is the approach described above for the work of Turpie et al., (2006) and Barnes et al., (2009).
This method requires physical and financial costs data on all initial and replacement capital items, all income and all recurrent costs, the latter including variable costs, fixed operating and fixed capital costs. It requires disaggregated information on taxes and subsidies, categories of person-power, tradable and non-tradable items, to allow shadow pricing. It also requires information on the broader economy for this purpose as well as for integration.
The approach used by Barnes (1994) and Humavindu (2007, 2008) to apply shadow pricing28 is recommended. Models measuring annual private net profits, private internal rates of return and private net present values, as well as the shadow-priced annual incremental contribution to the national income, the economic rate of return and the economic net present value, should be developed. Besides these key measures the contribution of income to the different players and factors of production should be meas-urable.
Typical models developed would include one of the models for the analysis by Barnes et al., (2009), comparing the economic value for tourism lodge development with that for two cases in irrigation development in the Namibian CORB. The other model was used to assess the viability of irrigation projects in the upper Okavango (ADB/FAO, 2007).
28 Shadow prices reveal to ‘real’ prices which differ from the actual prices. For example, prescribed minimum wages are higher than the market labour costs would be based on demand and supply under situations of high unemployment.
68 Cubango-Okavango River Basin Water Audit (CORBWA) Project Synthesis Report
4.5.2 Water costs and pricing
It has proven to be difficult to determine the costs of water supply, presumably because water supply is considered as a public good that has to be supplied. No data are available for Angola and Botswana and Namibia have incomplete recurrent expenditure figures. Capital expenditures figures are not systematically collected. Clearly, water is not yet treated as an economic good as it is either free or supplied below cost price. While this can be understood for meeting basic human needs and environmental requirements, the justification is less clear for competing, productive water uses and for luxury domestic use. It increases the risk of sub optimal water allocation across productive sectors, resource wastage and poses long term sustainability concerns.
Water tariffs for irrigation were only available for Namibia. In 2001/2002 the national average cost of supplying water for commercial and communal irrigation was US$0.10/m3 (DWAF 2006). The user charges levied by NamWater were US$0.17/m3 for commer-cial irrigation and US$0.06/m3 for communal irrigation. Water pricing needs to take into account the environmental externalities, opportunity costs and foregone future benefits (in case of depletion or pollution).
Water tariffs in Botswana and Namibia are staggered and contain incentive to conserve water. The same tariff applies to domestic users and the private sector. Government subsidies are provided in Botswana through a separate rate for government, which is considerably higher than what households and the private sector are charged.
4.5.3 Economic accounting of water
Economic accounting of water (EAW) is detailed and standardised making it a critical tool in assessing whether a country or river basin is using its water resources in an efficient and sustainable manner. It is also used to calculate indicators of water use efficiency and productivity. EAW requires significant amounts of quantitative data e and some of the data required may not be available in the required format. EAW focuses on economic aspects and is relatively weak WA when it comes to analysing social (equity) as well as governance (institutional) issues. Qualitative information cannot easily be incorporated into the analysis (e.g. access to water).
SADC has developed an EAW methodology for countries and shared water courses such as the Cubango-Okavango River Basin. Therefore, an attempt has been made to fit the CORBWA data into the EAW format. The basin wide and country water demand report contain sufficient data to prepare an initial flow account of water for the basin. Gaps refer to hydropower demand and industry (included in settlements), but these demand are currently small. As an example, Table 27 provides a physical water use table for the Botswana part of the basin. This could not be done for Angola and Namibia.
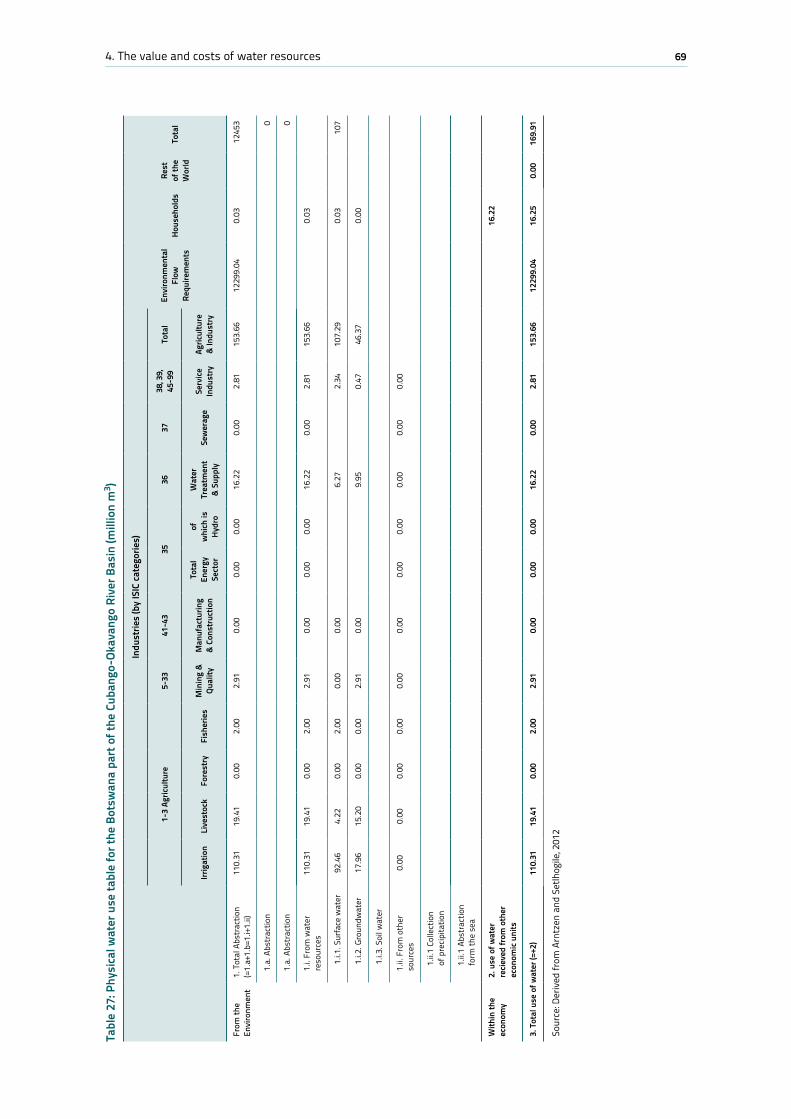
694. The value and costs of water resources
Tabl
e 27
: Phy
sica
l wat
er u
se ta
ble
for t
he B
otsw
ana
part
of t
he C
uban
go-O
kava
ngo
Rive
r Bas
in (m
illio
n m
3 )
Indu
strie
s (b
y IS
IC ca
tego
ries)
Envi
ronm
enta
l Fl
ow
Requ
irem
ents
Hous
ehol
dsRe
st
of th
e W
orld
Tota
l1-
3 Ag
ricul
ture
5-33
41-4
335
3637
38, 3
9, 45
-99
Tota
l
Irrig
atio
nLi
vest
ock
Fore
stry
Fish
erie
sM
inin
g &
Qual
ityM
anuf
actu
ring
& Co
nstr
uctio
n
Tota
l En
ergy
Se
ctor
of
whi
ch is
Hy
dro
Wat
er
Trea
tmen
t &
Supp
lySe
wer
age
Serv
ice
Indu
stry
Agric
ultu
re
& In
dust
ry
From
the
Envi
ronm
ent
1. T
otal
Abs
trac
tion
(=1.
a+1.
b=1.
i+1.
ii)11
0.31
19.4
10.
002.
002.
910.
000.
000.
0016
.22
0.00
2.81
153.
6612
299.
040.
0312
453
1.a.
Abs
trac
tion
0
1.a.
Abs
trac
tion
0
1.i.
From
wat
er
reso
urce
s11
0.31
19.4
10.
002.
002.
910.
000.
000.
0016
.22
0.00
2.81
153.
660.
03
1.i.1
. Sur
face
wat
er92
.46
4.22
0.00
2.00
0.00
0.00
6.27
2.34
107.
290.
0310
7
1.i.2
. Gro
undw
ater
17.9
615
.20
0.00
0.00
2.91
0.00
9.95
0.47
46.3
70.
00
1.i.3
. Soi
l wat
er
1.ii.
Fro
m o
ther
so
urce
s0.
000.
000.
000.
000.
000.
000.
000.
000.
000.
000.
00
1.ii.
1 Co
llect
ion
of p
recip
itatio
n
1.ii.
1 Ab
stra
ctio
n fo
rm th
e se
a
With
in th
e ec
onom
y2.
use
of w
ater
re
cieve
d fro
m o
ther
ec
onom
ic un
its
16.2
2
3. T
otal
use
of w
ater
(=+2
)11
0.31
19.4
10.
002.
002.
910.
000.
000.
0016
.22
0.00
2.81
153.
6612
299.
0416
.25
0.00
169.
91
Sour
ce: D
eriv
ed fr
om A
rntz
en a
nd S
etlh
ogile
, 201
2
70 Cubango-Okavango River Basin Water Audit (CORBWA) Project Synthesis Report
4.5.4 The value of economic analysis for water audits and shared river basin management
Water resource economics should play a major role in IWRM efforts by OKACOM. Economic analysis needs to be a key component of the OKACOM deliberations about the future development path for the basin and the associated use of the basin’s develop-ment space. It is central to the implementation of the Strategic Action Plan as well as the implementation of National Action Plans of member states.
The Total Economic Value (TEV), the Marginal Opportunity Costs (MOC) and the resource rent are valuable concepts that show water resource planners and decision makers that:
a. The value of water exceeds the value of water for the direct users. It includes the value of ecosystem services, possible future use values and the existence value (particularly important for the delta);
b. The resource costs exceed the costs of water withdrawal for and/or by users. It includes the costs of externalities (i.e. to other users downstream and to the environment) and lost future uses (the opportunity costs);
c. The resource rent indicates the premium value of water, generated in different uses such as irrigation, tourism etc.
A range of valuation and costing methods is available from the literature. The choice of method depends on the specific issue to be addressed and the available time and finan-cial means; some methods (e.g. CVM) require extensive data collection, while others can be easier applied (e.g. data transfer method).
The analysis showed that data on water revenues and costs proved difficult to collect, reflecting the primary perception of water as a public good and less as an economic good. The costs of water provision still appear less important than the provision itself (e.g. meeting the MDG). The direct user costs are (partly) quantified in Namibia and Botswana and are generally covered by water revenues (with subsidies for small users by large users and/or government), but external costs and opportunity costs are not yet consid-ered. Both Namibia and Botswana have increasing block tariff to support basic needs and discourage excessive water use). The literature shows that ecosystems and river basins can be economically valued (even though it is often a partial under valuation). Earlier studies have assessed (part of) the economic value of the Okavango Delta and of the entire Cubango-Okavango River basin. The valuation of the Delta (Turpie et al., 2006) showed the importance of the indirect use value (i.e. non-productive ecosystem services) and the discrepancies between resource values for local livelihoods and for the economy at large. Furthermore, the high use value associated with the tourism sector, compared to agriculture and irrigation became evident to the extent that development in the basin based solely on irrigation is likely to decrease livelihoods and the economy of the basin. The valuation study also showed the
714. The value and costs of water resources
importance of the Delta and the RAMSAR for the national economy (2.1 percent and 2.6 percent of GNP respectively). The valuation study for the entire basin (Barnes et al., 2009) revealed a striking difference with respect to river/wetland-based natural resource use between the countries. Botswana generated significantly more livelihood and national economic benefits than Namibia, and Namibia generated significantly more than Angola. It was shown that ppeople in the Angolan basin derived relatively little income from the river/wetland system, while those in the countries downstream, and most notably Botswana, were deriving considerably more from it.
The basin is relatively underdeveloped compared with other river basins in southern Africa. The natural systems are reasonably intact, leaving a number of options open for future economic development (high option value). The nature of the developments is crit-ical to ensuring that they contribute maximally to the development of the basin countries while alleviating poverty, particularly in the basin itself. For example, water use develop-ments along the lines of the medium and high use scenarios in the TDA, would signifi-cantly reduce the income that people in the basin and its associated economies could derive from natural river/wetland resources, in particular because of losses in the high value tourism sector. It is therefore important that irrigation and other forms of devel-opment in the basin (e.g. mining, hydropower, and transfers to areas outside the basin) are planned and designed in such a way that adverse impacts on tourism are minimized. The planned water withdrawals together with the ecological requirements of the Delta show that competition between different uses especially between agriculture in Angola and Namibia and tourism in Botswana is increasing. The economic analysis presented in this report shows that economic tools can be used to ensure that developments in the Upper Okavango, including irrigation for food security and hydropower are (and should be) designed and implemented in a manner that does not compromise environmental integrity and tourism downstream in Botswana. In addition, tools such as economic accounting for water can be used to inform benefit sharing mechanisms which will allow riparian countries to cooperate and manage the river basin in an integrated manner.
In terms of viability of different types of activities, careful analysis is required and the results presented in this report differ with respect to irrigation. Previous studies have shown that small-scale household uses of natural resources are generally economically efficient (Turpie et al., 2001 and 2006). They have appropriate technologies, are labour intensiveness and capital extensiveness, minimize risks, and depends less on external markets, which make them suitable for contributing livelihoods and earning income in remote parts, such as the Okavango basin. The very high private and economic values associated with tourism in the basin suggest that tourism developments making use of the natural river/wetland environment are comparatively advantageous. Indeed, the empirical private and economic budget/cost-benefit models of tourism developments used in the analysis above and derived from Turpie et al., (2006) showed significant economic viability. As medium to large-scale commercial investments, they were less dependent on proximity to markets than many, and they offered a unique product not attainable anywhere else. Barnes et al. (2009) found that tourism lodge development is financially viable and efficient economically. The high value crop irrigation system, as formulated, was not financially profitable, but it was economically efficient, indicating

72 Cubango-Okavango River Basin Water Audit (CORBWA) Project Synthesis Report
that it might be economically appropriate for it to be supported through subsidies. In contrast, results from ADB & FAO (2007) study show that irrigation (100ha) can be finan-cially and economically viable in the upper part of the basin provided the capital costs are kept down (e.g. rehabilitation of irrigation schemes in Angola) and water is used effi-ciently (ADB & FAO, 2007). One has to be aware, however, that actual returns for irrigation are typically much lower than projected at appraisal (Aylward, 2009).
735. Policy environment
5. Policy environment29
The analysis of the governance environment shows a strong framework of natural-resource management policies and legislation in the OKACOM member states. All countries are driving towards adaptation of IWRM based legislations and policies water legislation that emphasizes the need for integrated management and provides the legal tools for implementing integrated management in practice. However, this process needs to be accelerated to ensure integrate planning, development, management and sustain-able utilisation of the basin’s water and related resources. Angola seems to be the least developed in terms of governance framework as it recovers from the civil war period.
There are several shared gaps in the governance structures of the basin countries and these challenges are analysed in this section. Additionally, the gaps have also been mirrored at transboundary level to reflect the overall situation at basin level. A Strengths-Weaknesses-Opportunities-Threats (SWOT) analysis of the basin’s govern-ance structure is presented in Table 28. This chapter’s analysis conforms to the IWRM and sustainable development frameworks and to the SADC Protocol on Shared Water Courses.
5.1 Governance constraints and strengths of OKACOM member states
5.1.1 Angola
Angola is still recovering from the long civil war and a new constitution, policies and laws are now being developed. The current policy and legislative framework is limited, relatively weak and fragmented. Many of the economic and resource sectors lack coor-dinated policies. For instance, wildlife, mining, pollution and agriculture policies could not be reviewed because they were not available or do not yet exist. Although Angola has an updated Water Act (2002) it misses important elements of IWRM such as water quality, pollution and wastewater utilisation. However commendably, it provides for the development of local level institutions such as basin committees for the management of transboundary waters. The country does not have a dedicated water tariff policy in place that should address criteria for water charges as an economic good. For its portion of the basin, Angola is preparing a Master Plan, which will guide the management and sustain-able utilisation of resources within the basin.
Sustainable land utilisation and management is hampered by shortcomings in the land allocation and tenure system. All land that is not privately owned belongs to the State.
29 This chapter is adapted from the basin wide policy environment report (Setlhogile & Arntzen, 2012) and country reports (Setlhogile et al., 2012; Alberts & Barnes, 2012 and Chipilika, 2012).
74 Cubango-Okavango River Basin Water Audit (CORBWA) Project Synthesis Report
Therefore communities do not have an incentive to manage land resources. EIA and SEA requirements are not effectively enforced or implemented. For biodiversity management, there is no tourism policy that specifically addresses biodiversity protection through red lists and hunting control. Finally, there is no Climate Change Policy in place and Angola has also not submitted its UN Framework Convention on Climate Change (UNFCCC) communication. Climate change issues are, however, integrated in several environmental related strategies from other sectors.
With regards to the institutional framework, Angola is establishing the Cubango-Okavango River Basin Authority to coordinate and manage development and manage-ment initiatives in its part of the basin. This is an important aspect of IWRM as it enhances management of resources within the basin not necessarily based on adminis-trative borders. At national level, the country’s institutional framework for environmental resources is poor. There is poor coordination between ministries and overlapping respon-sibilities coupled with lack of information sharing. Institutional capacity to develop, enforce and implement policies and legislation is limited. Local community involvement in resource management is lacking despite decentralisation being highly supported in the policy framework.
5.1.2 Botswana
In Botswana, water resources management is guided by National Water Master Plans (1991 and 2006) as the Water Policy has not yet been approved by Parliament. The Water Act (1968), which provides the legislative framework, is outdated and needs revision. A national IWRM-WE plan is also being developed in parallel to the water reform process. The plan will assist in meeting the country’s development goals, such as reducing poverty, increasing food security, enhancing economic growth, and protection of vital ecosystems. Importantly, it will also address specific water challenges such as increasing access to safe and adequate water and sanitation facilities as well as accelerating the use of alternative water sources so as to reduce pressure on existing sources.
Specific to the Okavango Delta, the country has developed a comprehensive, integrated Okavango Delta Management Plan (ODMP) that now requires implementation and harmonisation with the country’s National Action Plan and similar plans from Angola and Namibia. In terms of the legal structures, the 1968 Water Act is still operational although through the water reform process, a new Water Act and Policy will be developed. The country needs to accelerate this process to guide the sustainable use of water resources in an integrated manner.
The institutional reforms of the water sector provides better separation of different water sector tasks such as water delivery, water resources planning and construction of water infrastructure, water sector regulations. Another IWRM advantage of the water sector reforms is the integration of fresh water delivery and wastewater treatment30.
30 WUC assumed the responsibility for water service provision in Ngamiland in April 2013.
755. Policy environment
The Okavango Wetlands Management Committee has been established to coordinate district level management initiatives for the delta. Botswana has not yet adopted the catchment area management approach, and there is no dedicated river basin authority, as is the case in Angola and Namibia where local communities participate in the manage-ment of the basin.
5.1.3 Namibia
Similar to Botswana, Namibia has multiple natural resources management policies that are largely sectoral. There are inconsistencies and overlap in the implementation of these policies. There is inadequate integration and coordination of policies. Water related policies are in place, a National IWRM-WE plan has been developed as well as an interim water policy that provides for acceptable water abstraction from the CORB. The legisla-tive framework is poor and where available, the laws are not enforced and implemented. The Water Resources Management Act (2004) has not been approved and hence the outdated 1956 Water Act is still in force.
Management of water and related resources is embedded within the portfolio of several ministries and institutions. There is poor coordination between these institutions and limited capacity to implement policies and enforce laws. Local involvement in water management is minimal despite the existence of water user associations. For the CORB, Namibia has a basin management committee comprising of diverse stakeholders and is currently in the process of developing a management plan for its part of the basin.
Several challenges, strengths, threats and opportunities are identified largely based on the findings of the EPSMO governance review study as well as this project (Table 28). These factors have been mostly described above for each country.
5.2 IWRM and sustainable development analysis
IWRM and sustainable development provide for efficient, equitable and environmentally sustainable provision of water resources. Based on these frameworks, the CORB govern-ance framework is analysed.
Box 2 shows the expanded IWRM principles, which are based on Dublin Conference and, in addition, make explicit reference to the principle of transparent water management.
Below, the main IWRM issues are discussed in terms of the four pillars of sustainable development (economic, social, ecological and institutional).
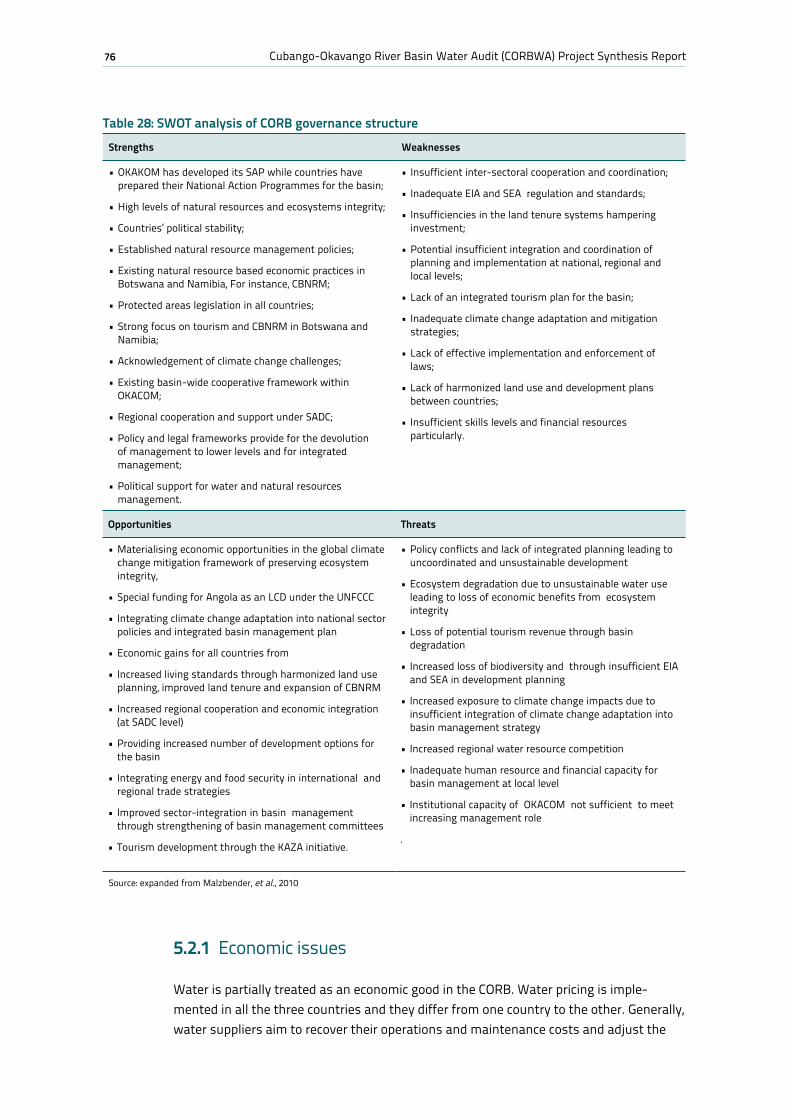
76 Cubango-Okavango River Basin Water Audit (CORBWA) Project Synthesis Report
5.2.1 Economic issues
Water is partially treated as an economic good in the CORB. Water pricing is imple-mented in all the three countries and they differ from one country to the other. Generally, water suppliers aim to recover their operations and maintenance costs and adjust the
Table 28: SWOT analysis of CORB governance structureStrengths Weaknesses
•OKAKOMhasdevelopeditsSAPwhilecountrieshaveprepared their National Action Programmes for the basin;
•Highlevelsofnaturalresourcesandecosystemsintegrity;
•Countries’politicalstability;
•Establishednaturalresourcemanagementpolicies;
•ExistingnaturalresourcebasedeconomicpracticesinBotswana and Namibia, For instance, CBNRM;
•Protectedareaslegislationinallcountries;
•StrongfocusontourismandCBNRMinBotswanaandNamibia;
•Acknowledgementofclimatechangechallenges;
•Existingbasin-widecooperativeframeworkwithinOKACOM;
•RegionalcooperationandsupportunderSADC;
•Policyandlegalframeworksprovideforthedevolutionof management to lower levels and for integrated management;
•Politicalsupportforwaterandnaturalresourcesmanagement.
• Insufficientinter-sectoralcooperationandcoordination;
• InadequateEIAandSEAregulationandstandards;
• Insufficienciesinthelandtenuresystemshamperinginvestment;
•Potentialinsufficientintegrationandcoordinationofplanning and implementation at national, regional and local levels;
•Lackofanintegratedtourismplanforthebasin;
• Inadequateclimatechangeadaptationandmitigationstrategies;
•Lackofeffectiveimplementationandenforcementoflaws;
•Lackofharmonizedlanduseanddevelopmentplansbetween countries;
• Insufficientskillslevelsandfinancialresourcesparticularly.
Opportunities Threats
•Materialisingeconomicopportunitiesintheglobalclimatechange mitigation framework of preserving ecosystem integrity,
•SpecialfundingforAngolaasanLCDundertheUNFCCC
• Integratingclimatechangeadaptationintonationalsectorpolicies and integrated basin management plan
•Economicgainsforallcountriesfrom
• Increasedlivingstandardsthroughharmonizedlanduseplanning, improved land tenure and expansion of CBNRM
• Increasedregionalcooperationandeconomicintegration(at SADC level)
•Providingincreasednumberofdevelopmentoptionsforthe basin
• Integratingenergyandfoodsecurityininternationalandregional trade strategies
• Improvedsector-integrationinbasinmanagementthrough strengthening of basin management committees
•TourismdevelopmentthroughtheKAZAinitiative.
•Policyconflictsandlackofintegratedplanningleadingtouncoordinated and unsustainable development
•Ecosystemdegradationduetounsustainablewateruseleading to loss of economic benefits from ecosystem integrity
•Lossofpotentialtourismrevenuethroughbasindegradation
• IncreasedlossofbiodiversityandthroughinsufficientEIAand SEA in development planning
• Increasedexposuretoclimatechangeimpactsduetoinsufficient integration of climate change adaptation into basin management strategy
• Increasedregionalwaterresourcecompetition
• Inadequatehumanresourceandfinancialcapacityforbasin management at local level
• InstitutionalcapacityofOKACOMnotsufficienttomeetincreasing management role
.
Source: expanded from Malzbender, et al., 2010
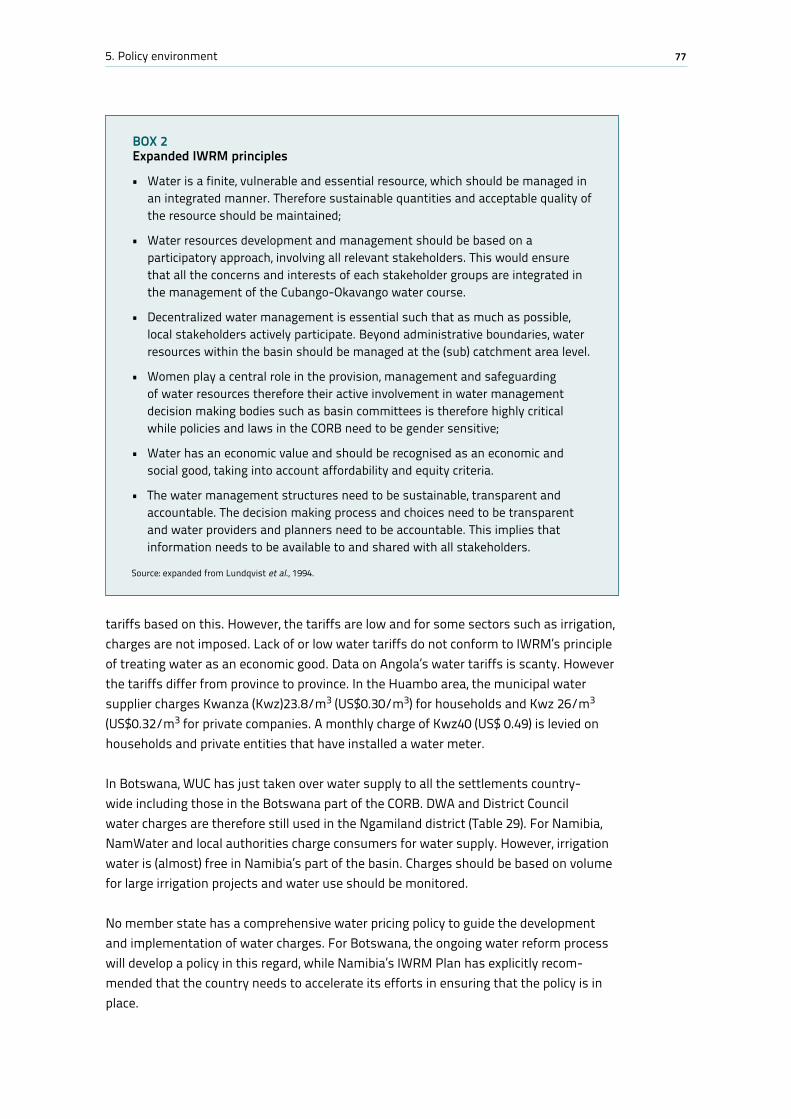
775. Policy environment
BOx 2 Expanded IWRM principles • Waterisafinite,vulnerableandessentialresource,whichshouldbemanagedin
an integrated manner. Therefore sustainable quantities and acceptable quality of the resource should be maintained;
• Waterresourcesdevelopmentandmanagementshouldbebasedonaparticipatory approach, involving all relevant stakeholders. This would ensure that all the concerns and interests of each stakeholder groups are integrated in the management of the Cubango-Okavango water course.
• Decentralizedwatermanagementisessentialsuchthatasmuchaspossible,local stakeholders actively participate. Beyond administrative boundaries, water resources within the basin should be managed at the (sub) catchment area level.
• Womenplayacentralroleintheprovision,managementandsafeguardingof water resources therefore their active involvement in water management decision making bodies such as basin committees is therefore highly critical while policies and laws in the CORB need to be gender sensitive;
• Waterhasaneconomicvalueandshouldberecognisedasaneconomicandsocial good, taking into account affordability and equity criteria.
• Thewatermanagementstructuresneedtobesustainable,transparentandaccountable. The decision making process and choices need to be transparent and water providers and planners need to be accountable. This implies that information needs to be available to and shared with all stakeholders.
Source: expanded from Lundqvist et al., 1994.
tariffs based on this. However, the tariffs are low and for some sectors such as irrigation, charges are not imposed. Lack of or low water tariffs do not conform to IWRM’s principle of treating water as an economic good. Data on Angola’s water tariffs is scanty. However the tariffs differ from province to province. In the Huambo area, the municipal water supplier charges Kwanza (Kwz)23.8/m3 (US$0.30/m3) for households and Kwz 26/m3 (US$0.32/m3 for private companies. A monthly charge of Kwz40 (US$ 0.49) is levied on households and private entities that have installed a water meter.
In Botswana, WUC has just taken over water supply to all the settlements country-wide including those in the Botswana part of the CORB. DWA and District Council water charges are therefore still used in the Ngamiland district (Table 29). For Namibia, NamWater and local authorities charge consumers for water supply. However, irrigation water is (almost) free in Namibia’s part of the basin. Charges should be based on volume for large irrigation projects and water use should be monitored.
No member state has a comprehensive water pricing policy to guide the development and implementation of water charges. For Botswana, the ongoing water reform process will develop a policy in this regard, while Namibia’s IWRM Plan has explicitly recom-mended that the country needs to accelerate its efforts in ensuring that the policy is in place.
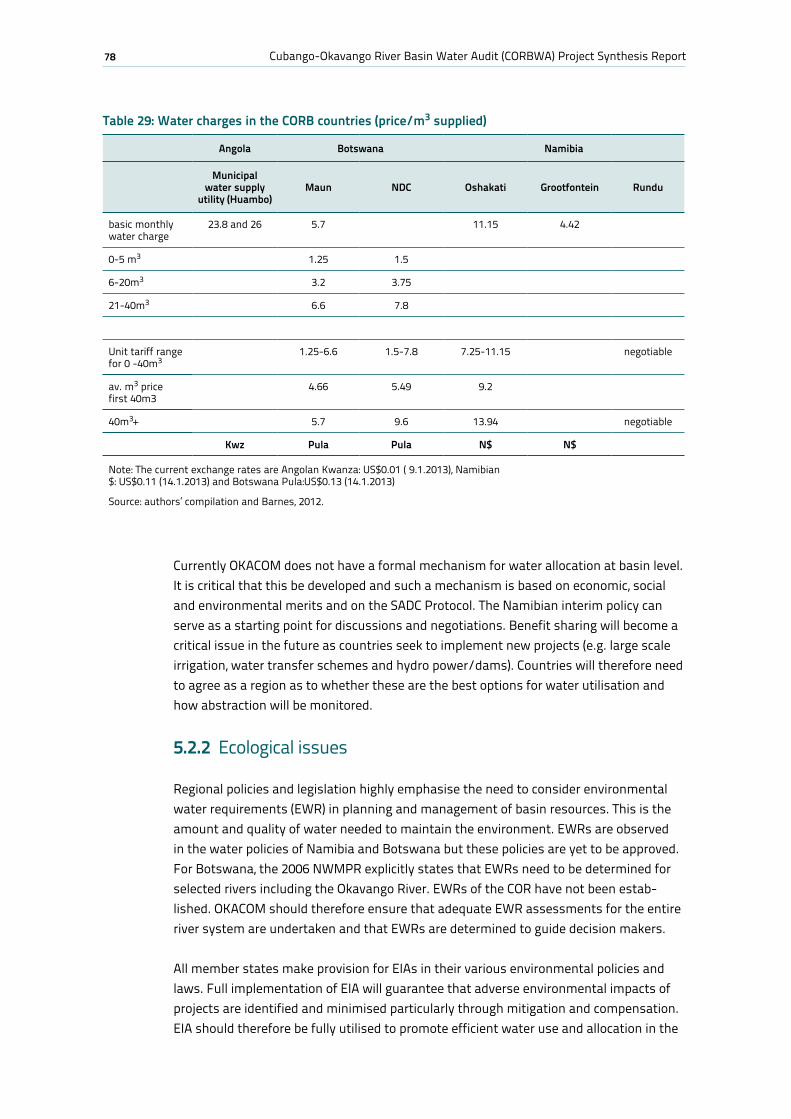
78 Cubango-Okavango River Basin Water Audit (CORBWA) Project Synthesis Report
Currently OKACOM does not have a formal mechanism for water allocation at basin level. It is critical that this be developed and such a mechanism is based on economic, social and environmental merits and on the SADC Protocol. The Namibian interim policy can serve as a starting point for discussions and negotiations. Benefit sharing will become a critical issue in the future as countries seek to implement new projects (e.g. large scale irrigation, water transfer schemes and hydro power/dams). Countries will therefore need to agree as a region as to whether these are the best options for water utilisation and how abstraction will be monitored.
5.2.2 Ecological issues
Regional policies and legislation highly emphasise the need to consider environmental water requirements (EWR) in planning and management of basin resources. This is the amount and quality of water needed to maintain the environment. EWRs are observed in the water policies of Namibia and Botswana but these policies are yet to be approved. For Botswana, the 2006 NWMPR explicitly states that EWRs need to be determined for selected rivers including the Okavango River. EWRs of the COR have not been estab-lished. OKACOM should therefore ensure that adequate EWR assessments for the entire river system are undertaken and that EWRs are determined to guide decision makers.
All member states make provision for EIAs in their various environmental policies and laws. Full implementation of EIA will guarantee that adverse environmental impacts of projects are identified and minimised particularly through mitigation and compensation. EIA should therefore be fully utilised to promote efficient water use and allocation in the
Table 29: Water charges in the CORB countries (price/m3 supplied)
Angola Botswana Namibia
Municipal water supply
utility (Huambo)Maun NDC Oshakati Grootfontein Rundu
basic monthly water charge
23.8 and 26 5.7 11.15 4.42
0-5 m3 1.25 1.5
6-20m3 3.2 3.75
21-40m3 6.6 7.8
Unit tariff range for 0 -40m3
1.25-6.6 1.5-7.8 7.25-11.15 negotiable
av. m3 price first 40m3
4.66 5.49 9.2
40m3+ 5.7 9.6 13.94 negotiable
Kwz Pula Pula N$ N$
Note: The current exchange rates are Angolan Kwanza: US$0.01 ( 9.1.2013), Namibian $: US$0.11 (14.1.2013) and Botswana Pula:US$0.13 (14.1.2013)
Source: authors’ compilation and Barnes, 2012.
795. Policy environment
basin countries. Currently Namibia is the only country with an Environmental Manage-ment Act (EMA)31 therefore other countries should also prepare their EMAs to guide the overall management of environmental resources. An EMA should strengthen main-streaming of environmental issues and coordinated environmental planning.
At basin level, there are no joint water quality standards as provided for by SADC Regional Water Policy and Protocol. OKACOM countries should therefore develop joint standards and guidelines to enhance good quality of the available water and effluent. Discharges into the river and surrounding environment should not in any way impede the integrity of COR. OKACOM member states should monitor all the activities that may have a bearing on the quality of the river water. Water quality issues should be integrated in basin planning. Law enforcement is also necessary and this could be done through appli-cation of instruments such as polluter pays and persuasion, for instance, to ensure that resource polluters take full responsibility for their actions.
5.2.3 Social issues
The SADC water policies and those of basin countries promote the notion of treating water as a social good. Currently basic human needs are given priority in Namibia and Botswana through policy and legislation. However Botswana’s policy is still a draft and therefore its finalisation and enactment should be accelerated. Additionally, new legisla-tion is not in place yet but will be developed through the on-going reform process. Water tariffs are applied cross all groups and if the charges increase, this could in some cases impede the needs of vulnerable groups by reducing access to water resources and their ability to pay for water. Specific and clear water tariff policies are therefore necessary.
All the riparian countries have decentralisation policies, but decentralised water resources management is very limited. Only Namibia has developed a decentralised basin committee for the CORB in line with IWRM. This offers a platform for local stake-holder participation in decisions regarding the utilisation of water resources within their part of the basin. It is important for Botswana and Angola to establish similar platforms to enhance local level participation in water resources management. At the moment, water resources management in Botswana and Angola is highly centralised.
With regard to gender, the water sector is still a male dominated sector with limited participation of women, youth and vulnerable groups in the decision making process. There is no clear indication of integration of gender issues in water resources manage-ment both at national and basin level. Relevant government departments, for instance, Department of Women’s Affairs in Botswana, should explore water resources manage-ment and gender issues. Currently focus is on domestic issues such as violence and health issues. OKACOM should therefore strive to mainstream gender issues in planning for the basin.
31 Botswana’s EMA is yet to be finalised and approved.
80 Cubango-Okavango River Basin Water Audit (CORBWA) Project Synthesis Report
5.2.4 Institutional issues
In all the three countries, a number of institutions are involved in natural resources management while overall water resources management lies primarily with the Minis-tries of Water. Institutions exist at different levels: national, district, local and catchment levels. For Angola, water supply, sanitation and management are mostly the responsi-bility of government while utility parastatals and local level institutions are hardly active. However, there are plans to develop local institutions such as water user associations where stakeholder groups such as farmers are given the responsibility for their water supply and maintenance of supply infrastructure. Angola is also establishing a river basin authority that will ensure that relevant stakeholders are involved in planning, develop-ment and management of its part of the river basin.
Botswana is undergoing a reform process where institutional roles will gradually change. WUC is the overall water supply agency while DWA remains with planning, development and overall water resources management responsibilities. A water regulator and a water resources council are yet to be established. In the CORB however, the reform process has not been implemented yet and therefore DWA and the District Council still play a major role in water supply and sanitation. There are also self providers who are responsible for their own water supply upon attaining water rights from the water authority. These self providers include mining companies and livestock farmers. There are no water user asso-ciations in the CORB as well as basin committees. However, a Wetlands Committee for the Okavango delta was established as a recommendation of the wetland’s strategy. This committee is meant to coordinate the development and management of the Okavango delta.
Namibia’s set-up is almost similar to Botswana but local authorities have responsibility to supply local stakeholders with water and maintain water and sanitation facilities. To facilitate the implementation of catchment management, the Okavango Basin Manage-ment Committee has been established to ensure the protection, sustainable use, devel-opment, conservation, management and control of water resources within the catch-ment. Community Based Water Resources Management is also undertaken in Namibia through water user associations. These are responsible for water supply and mainte-nance within their areas of jurisdiction and also enhance water resources management.
Significant constraints regarding the institutional set up within the basin are that coordi-nation and cohesion among the different institutions are not strong and integrated plan-ning and management is limited. In most cases, this is hampered by conflicting natural resource management policies especially in Botswana and Namibia where sectoral poli-cies are numerous and overlap. Integration is highlighted in Botswana’s ODMP where all relevant institutions were involved in the plan development process and its implementa-tion also requires action by various stakeholders. These are required for other parts of the basin in Angola and Namibia.
Institutional capacity, skilled personnel and resources for inter-sectoral planning, moni-toring, implementation and enforcement of laws and policies also hampers sustainable
815. Policy environment
management of the basin. Local level institutions for water management are lacking and where available, they have limited capacity and financial resources to fully imple-ment IWRM. Local government entities are also incapacitated and continue to be under resourced. Furthermore, these departments tend to rely more on central government hence their decision making powers are often overshadowed by central government. They require institutional strengthening and capacity building.
5.3 Analysis based on the Global Water Partnership IWRM tool box
The Global Water Partnership (GWP) has developed a framework that guides IWRM implementation and its main mission is to support the water community to recognize the characteristics of tools suited to improve water governance and to facilitate capturing and exchanging experiences derived from IWRM processes. The tool box focuses on three core components and these are briefly summarised below (adopted from www.gwptoolbox.org):
a. Enabling environment. It focuses on three sub-categories of policies, legislative framework and financing and incentive structures. The importance of a legislative framework that embraces the principles of IWRM is highlighted as well as the need for funding the implementation of IWRM;
b. Institutional roles. The tools emphasise on creating an organisational framework and building institutional capacity for IWRM implementation. This requires a shift towards decentralised management of water resources and strengthening of institutions to deal with required changes; and
c. Management instruments. The instruments comprise of several sub-areas which include water resources assessment, plans for IWRM, demand management, social change instruments, conflict resolution, regulatory instruments, economic instruments as well as information exchange and management. Water resources assessment provides a basis for institutions to understand the country’s resources and needs while IWRM plans provide a more holistic and dynamic approach to planning the development and management of water resources.
Based on this toolbox, Table 30 captures the governance issues for the basin countries and the overall COR basin.
5.4 Concluding remarks and recommendations
OKACOM needs to promote joint basin planning and water resource management, both through OKACOM and through coordinated implementation of the National Action Plans and country specific basin management and development plans (ODMP in Botswana and a plan is in preparation in Angola). As long as OKACOM has limited direct responsibili-
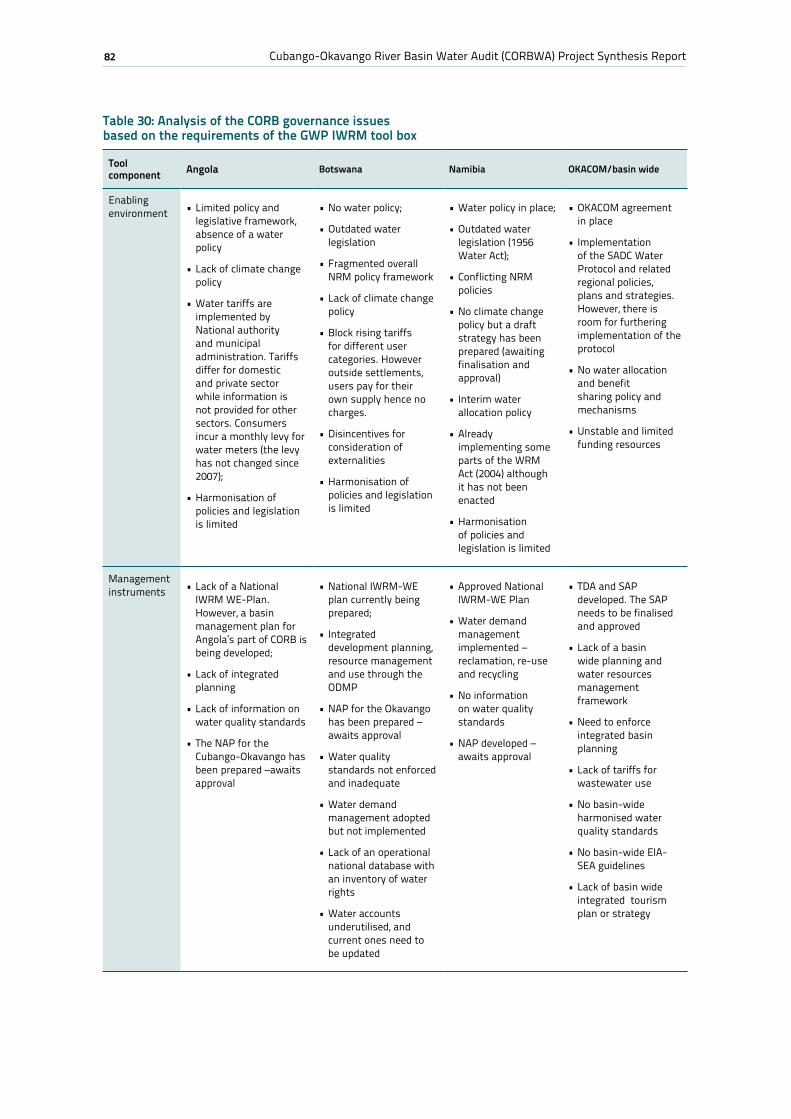
82 Cubango-Okavango River Basin Water Audit (CORBWA) Project Synthesis Report
Table 30: Analysis of the CORB governance issues based on the requirements of the GWP IWRM tool box
Tool component Angola Botswana Namibia OKACOM/basin wide
Enabling environment •Limitedpolicyand
legislative framework, absence of a water policy
•Lackofclimatechangepolicy
•Watertariffsareimplemented by National authority and municipal administration. Tariffs differ for domestic and private sector while information is not provided for other sectors. Consumers incur a monthly levy for water meters (the levy has not changed since 2007);
•Harmonisationofpolicies and legislation is limited
•Nowaterpolicy;
•Outdatedwaterlegislation
•FragmentedoverallNRM policy framework
•Lackofclimatechangepolicy
•Blockrisingtariffsfor different user categories. However outside settlements, users pay for their own supply hence no charges.
•Disincentivesforconsideration of externalities
•Harmonisationofpolicies and legislation is limited
•Waterpolicyinplace;
•Outdatedwaterlegislation (1956 Water Act);
•ConflictingNRMpolicies
•Noclimatechangepolicy but a draft strategy has been prepared (awaiting finalisation and approval)
• Interimwaterallocation policy
•Alreadyimplementing some parts of the WRM Act (2004) although it has not been enacted
•Harmonisationof policies and legislation is limited
•OKACOMagreementin place
• Implementationof the SADC Water Protocol and related regional policies, plans and strategies. However, there is room for furthering implementation of the protocol
•Nowaterallocationand benefit sharing policy and mechanisms
•Unstableandlimitedfunding resources
Management instruments •LackofaNational
IWRM WE-Plan. However, a basin management plan for Angola’s part of CORB is being developed;
•Lackofintegratedplanning
•Lackofinformationonwater quality standards
•TheNAPfortheCubango-Okavango has been prepared –awaits approval
•NationalIWRM-WEplan currently being prepared;
• Integrateddevelopment planning, resource management and use through the ODMP
•NAPfortheOkavangohas been prepared –awaits approval
•Waterqualitystandards not enforced and inadequate
•Waterdemandmanagement adopted but not implemented
•Lackofanoperationalnational database with an inventory of water rights
•Wateraccountsunderutilised, and current ones need to be updated
•ApprovedNationalIWRM-WE Plan
•Waterdemandmanagement implemented – reclamation, re-use and recycling
•Noinformationon water quality standards
•NAPdeveloped–awaits approval
•TDAandSAPdeveloped. The SAP needs to be finalised and approved
•Lackofabasinwide planning and water resources management framework
•Needtoenforceintegrated basin planning
•Lackoftariffsforwastewater use
•Nobasin-wideharmonised water quality standards
•Nobasin-wideEIA-SEA guidelines
•Lackofbasinwideintegrated tourism plan or strategy
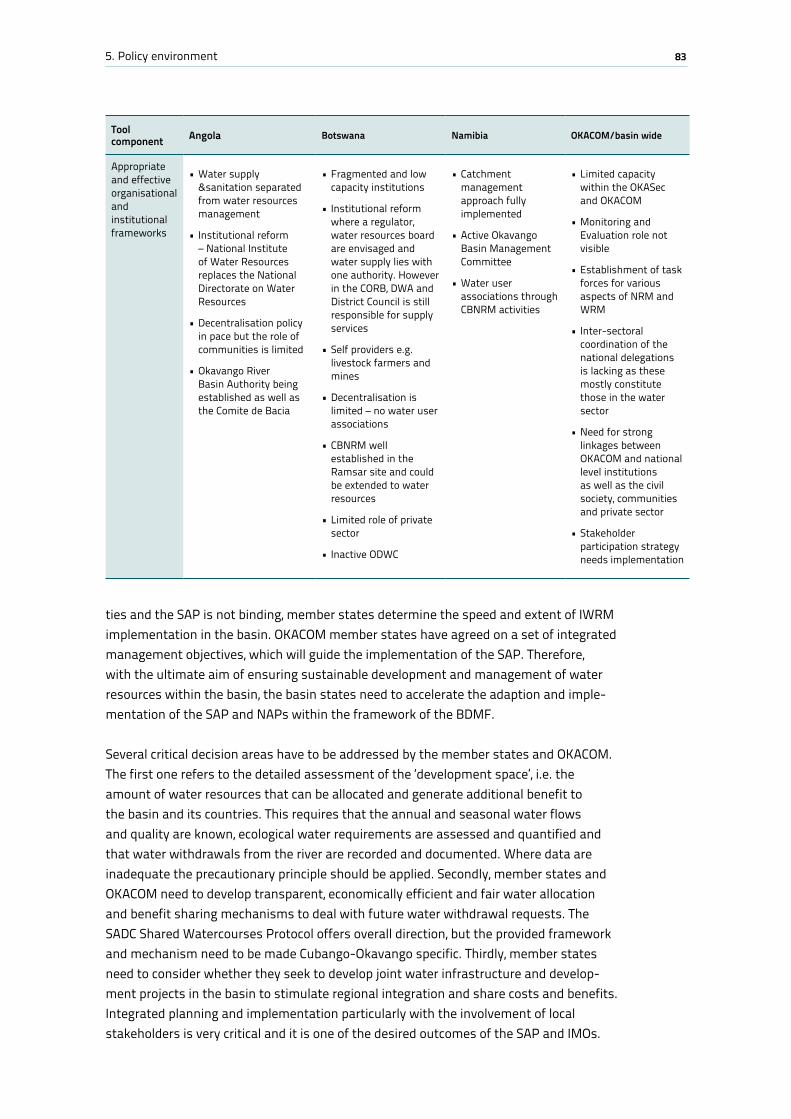
835. Policy environment
Tool component Angola Botswana Namibia OKACOM/basin wide
Appropriate and effective organisational and institutional frameworks
•Watersupply&sanitation separated from water resources management
• Institutionalreform– National Institute of Water Resources replaces the National Directorate on Water Resources
•Decentralisationpolicyin pace but the role of communities is limited
•OkavangoRiverBasin Authority being established as well as the Comite de Bacia
•Fragmentedandlowcapacity institutions
• Institutionalreformwhere a regulator, water resources board are envisaged and water supply lies with one authority. However in the CORB, DWA and District Council is still responsible for supply services
•Selfproviderse.g.livestock farmers and mines
•Decentralisationislimited – no water user associations
•CBNRMwellestablished in the Ramsar site and could be extended to water resources
•Limitedroleofprivatesector
• InactiveODWC
•Catchmentmanagement approach fully implemented
•ActiveOkavangoBasin Management Committee
•Wateruserassociations through CBNRM activities
•Limitedcapacitywithin the OKASec and OKACOM
•MonitoringandEvaluation role not visible
•Establishmentoftaskforces for various aspects of NRM and WRM
• Inter-sectoralcoordination of the national delegations is lacking as these mostly constitute those in the water sector
•Needforstronglinkages between OKACOM and national level institutions as well as the civil society, communities and private sector
•Stakeholderparticipation strategy needs implementation
ties and the SAP is not binding, member states determine the speed and extent of IWRM implementation in the basin. OKACOM member states have agreed on a set of integrated management objectives, which will guide the implementation of the SAP. Therefore, with the ultimate aim of ensuring sustainable development and management of water resources within the basin, the basin states need to accelerate the adaption and imple-mentation of the SAP and NAPs within the framework of the BDMF.
Several critical decision areas have to be addressed by the member states and OKACOM. The first one refers to the detailed assessment of the ‘development space’, i.e. the amount of water resources that can be allocated and generate additional benefit to the basin and its countries. This requires that the annual and seasonal water flows and quality are known, ecological water requirements are assessed and quantified and that water withdrawals from the river are recorded and documented. Where data are inadequate the precautionary principle should be applied. Secondly, member states and OKACOM need to develop transparent, economically efficient and fair water allocation and benefit sharing mechanisms to deal with future water withdrawal requests. The SADC Shared Watercourses Protocol offers overall direction, but the provided framework and mechanism need to be made Cubango-Okavango specific. Thirdly, member states need to consider whether they seek to develop joint water infrastructure and develop-ment projects in the basin to stimulate regional integration and share costs and benefits. Integrated planning and implementation particularly with the involvement of local stakeholders is very critical and it is one of the desired outcomes of the SAP and IMOs.
84 Cubango-Okavango River Basin Water Audit (CORBWA) Project Synthesis Report
OKACOM countries should therefore be encouraged to develop and operationalise catch-ment area management and basin management committees (Botswana and Angola) for improved inter-sect oral planning and implementation; such institutions should be linked to international water divisions of member states, national OKACOM committees and to OKACOM.
With regard to climate change, the review notes that climate change policies at both national and basin level do not yet exist. Countries are encouraged to develop policies and legislation to guard against and mitigate impacts of climate change. Furthermore, OKACOM should develop a basin-wide climate change adaptation strategy and action plan and integrate it into the SAP and NAPs. Other policy gaps that need to be filled refer to the development of basin wide water standards (e.g. water quality, effluent, daily water supply etc.) and to approve Environmental Management Acts, based on the princi-ples of the (water) user-pays and the (water) polluter-pays. Relevant national legislation needs to be harmonised for use in the Cubango-Okavango River Basin.
Monitoring of large scale water abstractions is imperative for achieving optimal use of the water resource and development space. Water demand is likely to increase in the future and countries will require large water abstraction for various projects. Benefit sharing and allocation mechanisms are therefore critical and should be developed as soon as possible. OKACOM should establish links with the Kavango-Zambezi Transfron-tier Conservation Initiative (KAZA) and initiate projects which could be jointly supported with KAZA for the benefit of basin populations, environment and the economy at large. There is tourism potential in all the three riparian countries. Specifically, the expansion of Community-Based Natural Resources Management (CBNRM) in the basin is critical as it could enhance transboundary natural resources management and improve livelihoods and food security situation of local communities. However, the CBNRM resource base needs to expand and diversify so as to benefit from other resources other than wildlife which is the case in Botswana and Namibia.
Water quality and pollution control regimes within the basin are required. As a require-ment of the Protocol and to safeguard the integrity of the river and its ecosystem, water quality standards and guidelines are needed. Countries need to agree on these and ensure that they are supported by legislation and policy frameworks. There should be a basin-wide monitoring system for water quality and pollution control. It is also impera-tive that EIAs are undertaken and fully implemented to protect the water resource.
OKASEC is currently small and face financial constraints. Member states have to decide on the future role and responsibilities of the OKASEC, but it is clear that the current tech-nical and facilitation capacity of OKASEC is very limited. Human and financial resources should be commensurate to the OKASEC responsibilities. Member states need to cover the core tasks of OKACOM and OKASEC from their national budgets or a small levy on large scale water abstractions and tourism activities. International Coopering Partners (ICPs) could support specific projects to augment the capacity and role of OKACOM and OKASEC.
856. Policy options
6. Policy options
6.1 General observations
Both SADC and OKACOM have embraced the concept of integrated water resources management (IWRM). Therefore, the basin’s management has to be based on the ‘Dublin / Rio Principles’:
i. Water is an economic and social good. It needs to be used to meet basic human needs and for productive purposes in support of livelihoods and poverty reduction. Water resources are a key component of natural capital, have a price and their use needs be accounted for through water auditing and/or water accounting. At the same it needs to be affordable to ensure access for basic human needs;
ii. Water resources (groundwater, surface water and wastewater) are finite, should not be exhausted and the quality should be maintained;
iii. Water management needs to be decentralised to a low and feasible level. In the CORBWA case, this implies that water management needs to be done at the catchment and sub catchment area levels, while interacting with national (i.e. member countries) and regional (SADC) levels;
iv. Stakeholders, especially women, should be actively involved in water management. This is necessary to ensure that their concerns and interests are incorporated in the management of shared water resources, for example through improving access to water and land (e.g. physical and affordability).
v. Water management needs to be transparent and accountable, thus promoting water integrity. This will enhance development benefits and reduce the risks of corruption and misappropriation of funds.
Comparing these principles with the Basin Development and Management Framework (BDMF) objectives shows that the BDMF has embraced the IWRM principles. The frame-work also emphasises the need for scientific data and information to guide member states and decision makers. The pursuit of transparent and accountable water manage-ment is implicit in the BDMF. Hitherto water withdrawal from the Cubango Okavango River has been low (102 Mm3 according to the TDA, and around 90 Mm3 according to this study), but the TDA and SAP expect this to change in future due to increased water use for domestic use (all coun-tries), irrigation (Angola and Namibia) and livestock (Angola). Future demand could rise to over 500 Mm3 (medium development scenario of the TDA) or even the high development scenario (3 871 Mm3) if all irrigation plans materialise. While the basin still has more ‘development space’ than basins such as the Orange-Senque and the Maputo-Nkomati, it
86 Cubango-Okavango River Basin Water Audit (CORBWA) Project Synthesis Report
is critical that this space is properly defined, agreed upon and used. Therefore it is impor-tant to indicate how much water is available for development (annually and season-ally) and how it should be distributed, allocated and utilised. This implies that different demand categories need to be prioritised (e.g. basic needs, environmental use and strategic use) and that mechanisms are agreed upon for the allocation of the remaining water resources and the distribution of their benefits. For example, how much water can be made available for irrigation, mining, industries etc. and which criteria should be used to decide on this and on specific water abstraction requests (in line with the SADC Protocol32). Currently, irrigation plans are expected to be the largest determinant of future water abstractions but the impacts of new water transfer schemes could also be significant. While the TDA report (OKACOM, 2011a) states a possible abstraction for water transfer schemes in Namibia in the order of 100 Mm3 for phase 233 of the EWC (phase 1 is 17 Mm3), more detailed estimates of the planned water abstractions need to be made and assessed.
Some groundwater abstraction data are available for Namibia and Botswana, but knowl-edge about the recharge and sustainable use is generally poor; no reliable data are avail-able for Angola as yet. In the Namibian part of the basin groundwater is used for irriga-tion, livestock and bulk water supply by NamWater. In Botswana, groundwater is used for settlements, a new mine and livestock. Groundwater abstraction for livestock is spread over large areas with little risk of resource depletion34 and it often has low opportunity costs as there are no or few competing uses. Abstraction for irrigation and domestic use is more likely to lead to water depletion. The Namibian country study (Krugmann & Alberts, 2012) suggests that the sustainable abstraction ceiling from the Karst ground-water aquifer has been reached. This means that future water demand increases are likely to contribute to groundwater mining and/or put more pressure on surface water resources, including the Cubango-Okavango River. The same could happen in Angola. This poses a risk to the environment as the ecological water requirements are not quantified (see EPSMO and TDA). As argued in Chapter 8, wildlife water demand, which constitutes only part of the Ecological Water Requirements (EWR), are high in Botswana (9.7 Mm3) in comparison to total water demand of 12.7 Mm3, excluding wildlife.
The three country studies clearly showed that the basin’s water abstractions, including those from the river, are not or poorly recorded and documented. The actual withdrawals and water use from the river are not known. There is no data base of water abstractions (river and ground water), making it difficult to assess the actual resource use situation. The Namibian and Botswana country studies show that issued water rights are higher than the estimated water use. This means that the development space available for new allocation is smaller than based on the space based on the estimated use. Water is not consistently and fully treated as an economic good. The Namibian country study states that farmers do not pay for irrigation water or pay very little. This does not encourage efficient water use in irrigation. The studies also reveal that irrigation plans in Angola
32 No requests have been made to OKACOM as yet.33 Discussions in Namibia during this project indicated that these figure is too high.34 Due to the foraging constraints of land resources.
876. Policy options
and Namibia have not yet been economically assessed, and may prove not viable without subsidies. The long distance from the basin to export markets (both in Angola and Namibia) and poor soil conditions pose major economic viability challenges. Moreover, the huge scale of all irrigation plans combined will challenge the countries’ implementa-tion capacities and full implementation is unlikely. It is important to analyse the oppor-tunity costs of different –competing- water uses. This is important to ensure economic growth and livelihoods improvements in the river basin. Demand prioritisation is neces-sary to guide the water allocation and benefit sharing process. Namibia and Botswana (in its draft water policy) have prioritised basic needs and ecological water requirements.
South Africa uses a more detailed demand prioritisation adding water needs of stra-tegic sectors (e.g. power generation) as the third priority after basic human needs and ecological water requirements. In line with good international practice and the South African and Namibia’s Water Policy, it is recommended that basic human needs are given the highest priority followed by EWR and water needs of dedicated strategic sectors. OKACOM states need to agree on priorities of other productive and consumptive water uses and the associated allocation criteria in line with the SADC Protocol.
6.2 IWRM options and issues
Optimal use of river waterIn line with the BDMF objectives, water allocations from the river should benefit the basin’s economic development and the livelihoods of the people living in the basin, while sustaining the ecosystem services. Effectively, these water allocations refer to the distri-bution of the ‘development space’, mentioned in the TDA and SAP. The Protocol clearly states that water allocations and withdrawals should be ‘reasonable’ and ‘equitable’, but the task of operationalising these terms is left to member states and river basin organi-sations. The challenge to OKACOM member states is to operationalise these terms in the context of generating economic growth, improving livelihoods, reducing poverty and enhancing food security.
Perhaps the most important questions for any RBO are how water resources from the river’s development space should be allocated, which benefits are generated and how these should be distributed in a reasonable and equitable way. The EPSMO and CORBWA results show that most water is currently used for agriculture (irrigation and livestock). Furthermore, the EPSMO and TDA scenarios show that irrigation is likely to account for the largest share of increases in future water withdrawals from the river and the study further shows that as a result of the high development scenario the basin’s value added and livelihoods will contract. This is economically sub- optimal and requires 1. careful design and planning of irrigation projects; 2. a better balance between irrigation and tourism development and possibly other emerging economic growth sectors.
88 Cubango-Okavango River Basin Water Audit (CORBWA) Project Synthesis Report
OKACOM states have to develop criteria for water allocation35 and sharing of the associ-ated benefits such that the allocation is reasonable and equitable. However, the Revised Protocol has not been operationalised in terms of specific quota or allocations. Pending OKACOM agreement, the Namibian Government has adopted an interim policy for water abstraction from the Cubango-Okavango River. The interim policy is based on the lowest month flow over the last twenty years and calculates maximum permissible abstrac-tions as follows. 1. The ecological water requirements are 25 percent of this minimum flows and should be met first; 2. The remaining water is equally divided between riparian countries (i.e. Angola and Namibia upstream and Angola, Namibia and Botswana down-stream). As a result, Namibia (and Angola) would be entitled to 851.5 Mm3 per annum and Botswana to 678 Mm3 per annum (p.a.). Total permissible abstraction would thus be 2.4 billion m3 p.a. with EWR of 115.7 Mm3 upstream and 851 Mm3 downstream. In terms of current and future demand, the interim policy would constrain the TDA high develop-ment scenario (3.9 billion m3) but it could accommodate the medium development (1.9 billion m3) scenario. The interim policy effectively concludes that there is a large un-used development space for water resources (around 2.8 billion m3 or more than 25 times the current use level). The interim policy was designed to estimate the maximum irriga-tion potential in Namibia from a water perspective. It can be a starting point for member states’ discussions about the development space and possible water quota allocations. It is clear, however, that the policy should refer to all abstractions by member states (and not just irrigation) and that the ecological water requirements must be properly assessed (the 25 percent figure needs to be validated or a better figure needs to scientifically generated)36. Therefore the optimal water use within countries is not addressed by this policy. For example, policy makers need to decide whether water is allocated for irriga-tion, mining and/or for export to other water scarce parts of the country. All OKACOM countries need to agree on the principles and criteria for water allocation. In line with the BDMF objective of using scientific knowledge, the scientific base of the interim policy and the agreed water allocation and benefit sharing principles need to be worked out and agreed upon. Another aspect of optimal use is to ensure that water competition and the opportunity costs are minimised. The Botswana country study showed that the Bosetu mine intends to mostly use saline water, which does not meet drinking water and livestock water standards. Without desalination, the opportunity costs of water use of the mine are therefore minimal. Livestock water consumption is spread out over large areas (e.g. bore-holes) and in many cases, alternative uses for borehole water are very limited. Therefore, competition for (and the opportunity costs of) that water is low.
It is recommended that OKACOM countries limit water competition by encouraging mines to –where possible- withdraw water unsuited for human and livestock use.
35 The Protocol lists a range of determinants (art 8a) but does not attach weights to them: natural character-istics, social, economic and environmental needs, population dependent on the share water course; impacts from use in one country on another country, existing and potential uses, conservation, protection, devel-opment and economy of use of water, available alternative and comparable water sources. The weights should be determined by the countries based on the relative importance of each factor.
36 The reasons for splitting the basin into two parts need to be clarified and agreed upon.
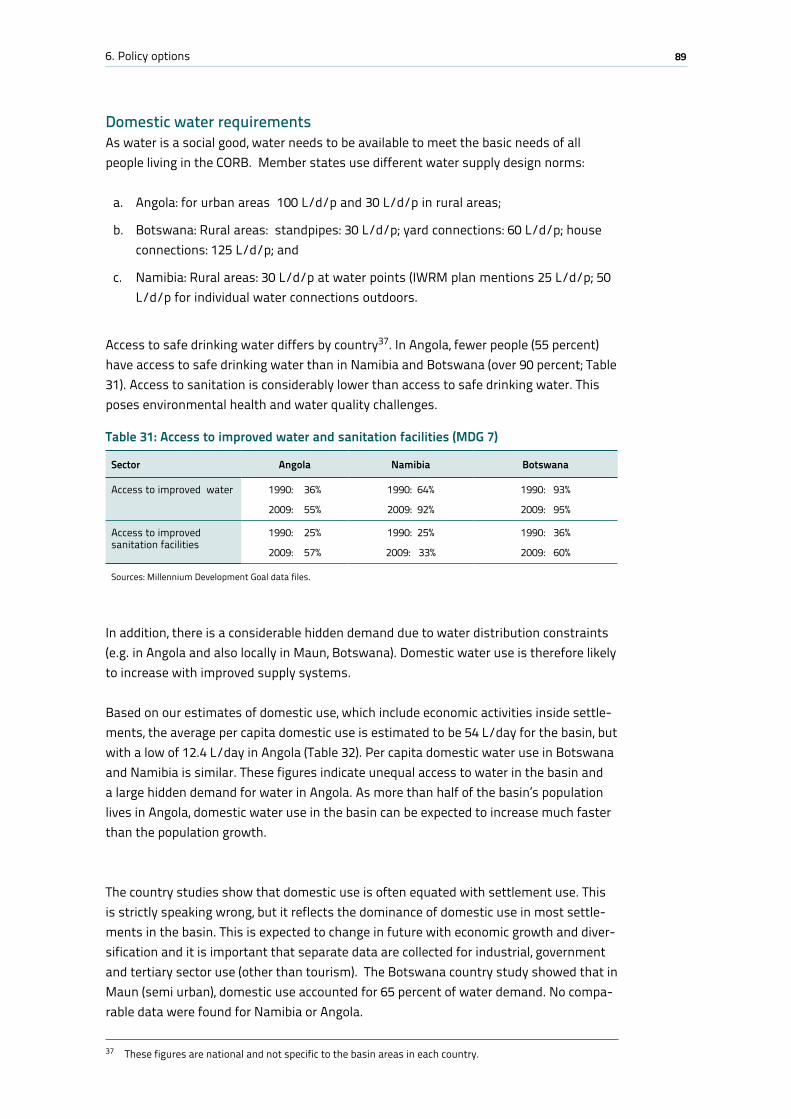
896. Policy options
Table 31: Access to improved water and sanitation facilities (MDG 7)
Sector Angola Namibia Botswana
Access to improved water 1990: 36%
2009: 55%
1990: 64%
2009: 92%
1990: 93%
2009: 95%
Access to improved sanitation facilities
1990: 25%
2009: 57%
1990: 25%
2009: 33%
1990: 36%
2009: 60%
Sources: Millennium Development Goal data files.
Domestic water requirementsAs water is a social good, water needs to be available to meet the basic needs of all people living in the CORB. Member states use different water supply design norms:
a. Angola: for urban areas 100 L/d/p and 30 L/d/p in rural areas;
b. Botswana: Rural areas: standpipes: 30 L/d/p; yard connections: 60 L/d/p; house connections: 125 L/d/p; and
c. Namibia: Rural areas: 30 L/d/p at water points (IWRM plan mentions 25 L/d/p; 50 L/d/p for individual water connections outdoors.
Access to safe drinking water differs by country37. In Angola, fewer people (55 percent) have access to safe drinking water than in Namibia and Botswana (over 90 percent; Table 31). Access to sanitation is considerably lower than access to safe drinking water. This poses environmental health and water quality challenges.
In addition, there is a considerable hidden demand due to water distribution constraints (e.g. in Angola and also locally in Maun, Botswana). Domestic water use is therefore likely to increase with improved supply systems.
Based on our estimates of domestic use, which include economic activities inside settle-ments, the average per capita domestic use is estimated to be 54 L/day for the basin, but with a low of 12.4 L/day in Angola (Table 32). Per capita domestic water use in Botswana and Namibia is similar. These figures indicate unequal access to water in the basin and a large hidden demand for water in Angola. As more than half of the basin’s population lives in Angola, domestic water use in the basin can be expected to increase much faster than the population growth.
The country studies show that domestic use is often equated with settlement use. This is strictly speaking wrong, but it reflects the dominance of domestic use in most settle-ments in the basin. This is expected to change in future with economic growth and diver-sification and it is important that separate data are collected for industrial, government and tertiary sector use (other than tourism). The Botswana country study showed that in Maun (semi urban), domestic use accounted for 65 percent of water demand. No compa-rable data were found for Namibia or Angola.
37 These figures are national and not specific to the basin areas in each country.
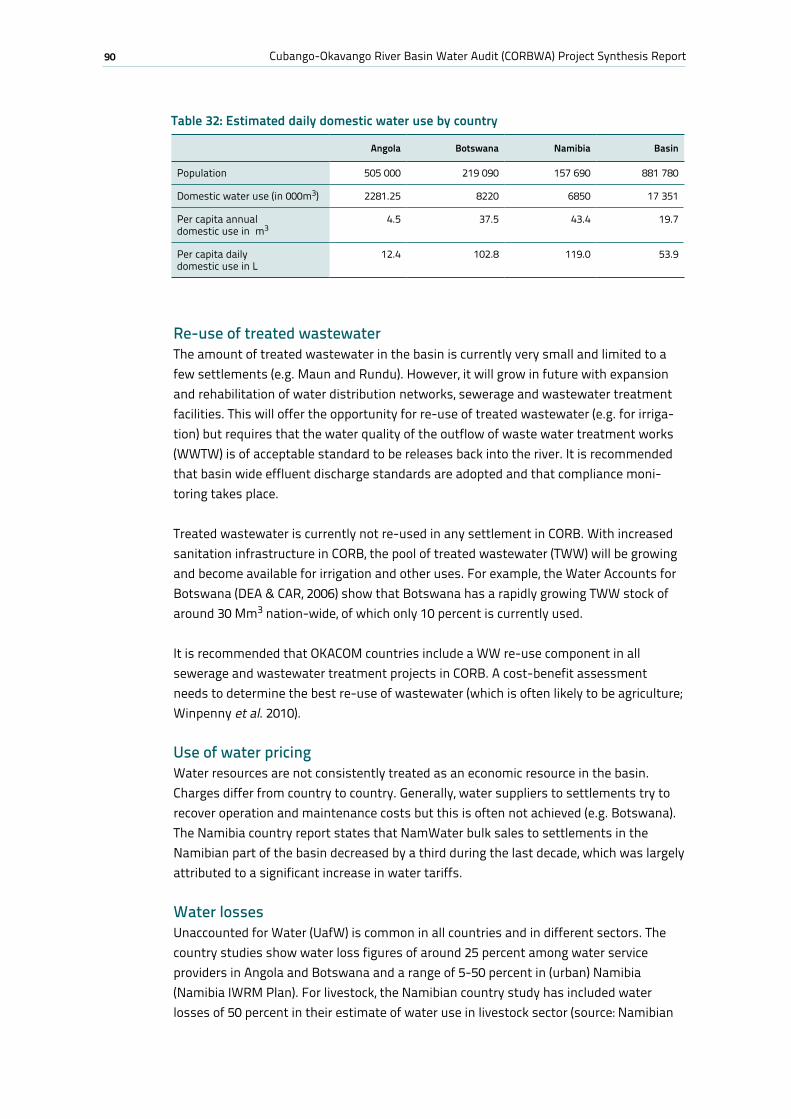
90 Cubango-Okavango River Basin Water Audit (CORBWA) Project Synthesis Report
Re-use of treated wastewaterThe amount of treated wastewater in the basin is currently very small and limited to a few settlements (e.g. Maun and Rundu). However, it will grow in future with expansion and rehabilitation of water distribution networks, sewerage and wastewater treatment facilities. This will offer the opportunity for re-use of treated wastewater (e.g. for irriga-tion) but requires that the water quality of the outflow of waste water treatment works (WWTW) is of acceptable standard to be releases back into the river. It is recommended that basin wide effluent discharge standards are adopted and that compliance moni-toring takes place. Treated wastewater is currently not re-used in any settlement in CORB. With increased sanitation infrastructure in CORB, the pool of treated wastewater (TWW) will be growing and become available for irrigation and other uses. For example, the Water Accounts for Botswana (DEA & CAR, 2006) show that Botswana has a rapidly growing TWW stock of around 30 Mm3 nation-wide, of which only 10 percent is currently used.
It is recommended that OKACOM countries include a WW re-use component in all sewerage and wastewater treatment projects in CORB. A cost-benefit assessment needs to determine the best re-use of wastewater (which is often likely to be agriculture; Winpenny et al. 2010).
Use of water pricingWater resources are not consistently treated as an economic resource in the basin. Charges differ from country to country. Generally, water suppliers to settlements try to recover operation and maintenance costs but this is often not achieved (e.g. Botswana). The Namibia country report states that NamWater bulk sales to settlements in the Namibian part of the basin decreased by a third during the last decade, which was largely attributed to a significant increase in water tariffs.
Water lossesUnaccounted for Water (UafW) is common in all countries and in different sectors. The country studies show water loss figures of around 25 percent among water service providers in Angola and Botswana and a range of 5-50 percent in (urban) Namibia (Namibia IWRM Plan). For livestock, the Namibian country study has included water losses of 50 percent in their estimate of water use in livestock sector (source: Namibian
Table 32: Estimated daily domestic water use by country
Angola Botswana Namibia Basin
Population 505 000 219 090 157 690 881 780
Domestic water use (in 000m3) 2281.25 8220 6850 17 351
Per capita annual domestic use in m3
4.5 37.5 43.4 19.7
Per capita daily domestic use in L
12.4 102.8 119.0 53.9
916. Policy options
IWRM-WE Plan). Using the same 50 percent loss figure for the livestock sector in the other countries Angola would increase water use by 4.1 Mm3 or around 4-5 percent. In contrast, the application of a basin wide 15 percent loss rate for the livestock sector would save 2.3 Mm3 on the current estimate of 21.8 Mm3. Reducing domestic use losses to 15 percent instead of 25 percent would save 1.4 Mm3 per annum.
The above calculations and figures show: 1. the potential to reduce water withdrawals through UafW reduction38; 2. the need for regular monitoring of water losses and the performance of water suppliers and users/sectors; 3. the need to agree on basin wide water loss norms.
Water requirements of the mining sector Currently, few mines operate in the CORB: one in Botswana with estimated water requirement of 1.3 Mm3 p.a., one in Namibia and none in Angola. This is likely to change in future due to the expected high global mineral demand, on-going exploration activities (e.g. Botswana) and mine rehabilitation (two in Namibia). Water use in the mining sector generates high value added, and similar to the tourism sector, creates high opportunity costs for the irrigation sector. Water use of mines depends on the nature and the scale of mining, but it is usually high in comparison to other sectors and projects. It is possible that future mines will abstract water directly from the river and return water to it. This raises concerns about water quality, return flows etc. The Namibian country study shows that old mine shafts are used for water storage and that the water is re-used for irrigation and feeding into the bulk water system. There is a need to further explore the potential of water storage in old mines and re-use opportunities.
Water and energy While there is currently only one small hydropower plant, which has been recently restored, near Cubango (Angola), several additional ones are expected to be constructed in Angola. Their expected water use is currently unknown but it is important that the impacts of hydropower schemes on water resources are taken into account. This refers to the amount of water consumed, used and later released, possible changes in flow regime of the river and sedimentation trapping. The schemes could have an important impact on sediment dynamics and the ecosystem services downstream.
Water and irrigationAgricultural water use and allocations need to be discussed within the broader IWRM framework and the BDMF for the basin, and many aspects dealt with above have rele-vance to agriculture. It is however, good to recap these observations:
a. Agricultural water needs should be considered after the basic domestic needs, EWR and needs of strategic sectors (e.g. energy) have been met. This requires that basic domestic needs are determined (e.g. population multiplied with a basic needs
38 While this may not always be economically feasible for existing distribution networks, it certainly becomes attractive when expansion of networks (usually at higher costs) are considered;
92 Cubango-Okavango River Basin Water Audit (CORBWA) Project Synthesis Report
norm). Furthermore, it requires that the EWR are determined by scientific data but pending the availability of such data by an agreed standard indicator (e.g. percent of min and max flows);
b. The agricultural sector is currently the largest water user in the basin, particularly through irrigation. Furthermore, expected future increased demand is mostly driven by irrigation. Therefore, the agricultural sector has water resource management responsibilities towards the basin:
i. Use non-potable water (e.g. TWW and brackish water), where this is available and feasible;
ii. Use water with limited or no alternative uses (e.g. livestock boreholes);
iii. Where there is competition for water, use water efficiently. This can be encouraged by water tariffs, tradable water rights and water saving technologies;
iv. Minimise water wastages and losses, particularly where there is resource competition.
c. The agricultural sector has to increasingly compete for water with other productive sector, for example through the introduction of tradable water rights
Currently, agricultural water abstraction and use is largely unmetered and irrigation charges are minimal (e.g. Namibia). It is important that agricultural water use is accu-rately assessed and that water charges provide incentives for efficient water use. The Namibian study and international literature show that irrigation efficiencies can be significantly increased39. Moreover, area or better water volume ceilings for water with-drawals from the river can be set to complement water charges.
It is recommended that OKACOM agrees on overall and country specific ceilings for irriga-tion within the basin’s ‘development space’ and that it sets water efficient norms for water abstractions for irrigation.
Water and the livestock sectorThe livestock is a major water user in the basin after irrigation. However, the actual with-drawals are not metered and thus had to be estimated by multiplication of the number of animals by a norm or standard water daily requirement. The standards differ by country (Table 2 in chapter 2). For example, water demand by cattle in Angola is assumed to be significantly higher than in Namibia and Botswana. This could be due to different breeds or more abundant water availability, or less efficient technologies. To improve the estimates, it is recommended that pilots are conducted in each country to assess the daily water demand (sub-divided into ground and surface water), taking into account the hot and winter seasons, drought conditions and breed. In dry countries (Botswana and Namibia), water efficient livestock has a comparative advantage. Moreover, it is impor-
39 According the IWRM-WE plan for Israel, the irrigation target is 5 750m3/ha of which 2 650 is fresh water (rainfall and desalinated seawater); the balance is re-used treated effluent and brackish water (Rejwan, 2011).
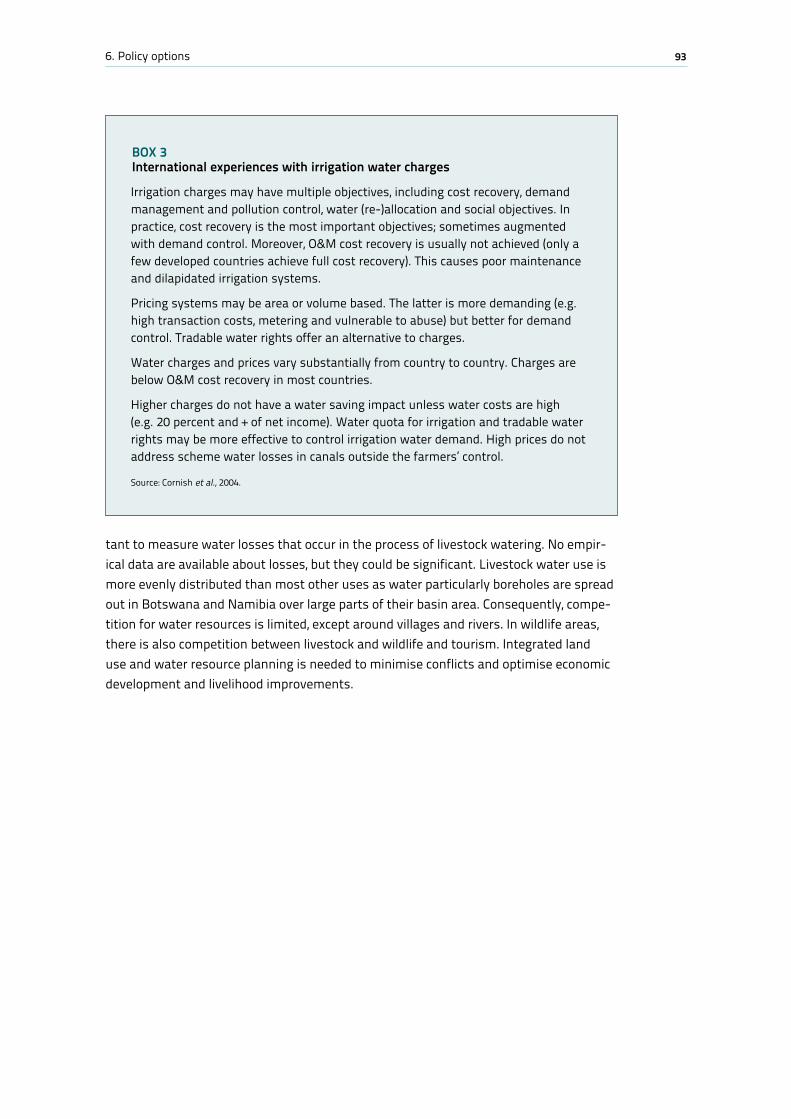
936. Policy options
tant to measure water losses that occur in the process of livestock watering. No empir-ical data are available about losses, but they could be significant. Livestock water use is more evenly distributed than most other uses as water particularly boreholes are spread out in Botswana and Namibia over large parts of their basin area. Consequently, compe-tition for water resources is limited, except around villages and rivers. In wildlife areas, there is also competition between livestock and wildlife and tourism. Integrated land use and water resource planning is needed to minimise conflicts and optimise economic development and livelihood improvements.
BOx 3 International experiences with irrigation water charges Irrigation charges may have multiple objectives, including cost recovery, demand management and pollution control, water (re-)allocation and social objectives. In practice, cost recovery is the most important objectives; sometimes augmented with demand control. Moreover, O&M cost recovery is usually not achieved (only a few developed countries achieve full cost recovery). This causes poor maintenance and dilapidated irrigation systems.
Pricing systems may be area or volume based. The latter is more demanding (e.g. high transaction costs, metering and vulnerable to abuse) but better for demand control. Tradable water rights offer an alternative to charges.
Water charges and prices vary substantially from country to country. Charges are below O&M cost recovery in most countries.
Higher charges do not have a water saving impact unless water costs are high (e.g. 20 percent and + of net income). Water quota for irrigation and tradable water rights may be more effective to control irrigation water demand. High prices do not address scheme water losses in canals outside the farmers’ control.
Source: Cornish et al., 2004.
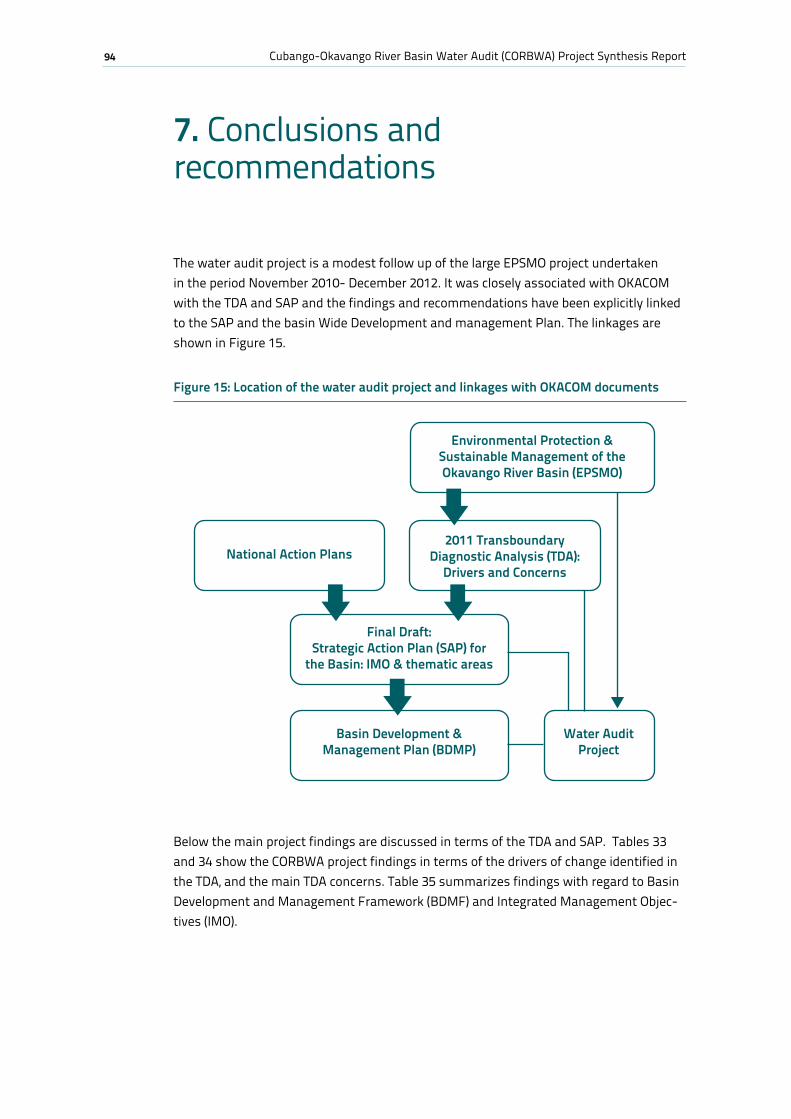
94 Cubango-Okavango River Basin Water Audit (CORBWA) Project Synthesis Report
7. Conclusions and recommendations
The water audit project is a modest follow up of the large EPSMO project undertaken in the period November 2010- December 2012. It was closely associated with OKACOM with the TDA and SAP and the findings and recommendations have been explicitly linked to the SAP and the basin Wide Development and management Plan. The linkages are shown in Figure 15.
Below the main project findings are discussed in terms of the TDA and SAP. Tables 33 and 34 show the CORBWA project findings in terms of the drivers of change identified in the TDA, and the main TDA concerns. Table 35 summarizes findings with regard to Basin Development and Management Framework (BDMF) and Integrated Management Objec-tives (IMO).
Environmental Protection & Sustainable Management of the Okavango River Basin (EPSMO)
Final Draft:Strategic Action Plan (SAP) for
the Basin: IMO & thematic areas
Basin Development & Management Plan (BDMP)
Water Audit Project
National Action Plans2011 Transboundary
Diagnostic Analysis (TDA): Drivers and Concerns
Figure 15: Location of the water audit project and linkages with OKACOM documents
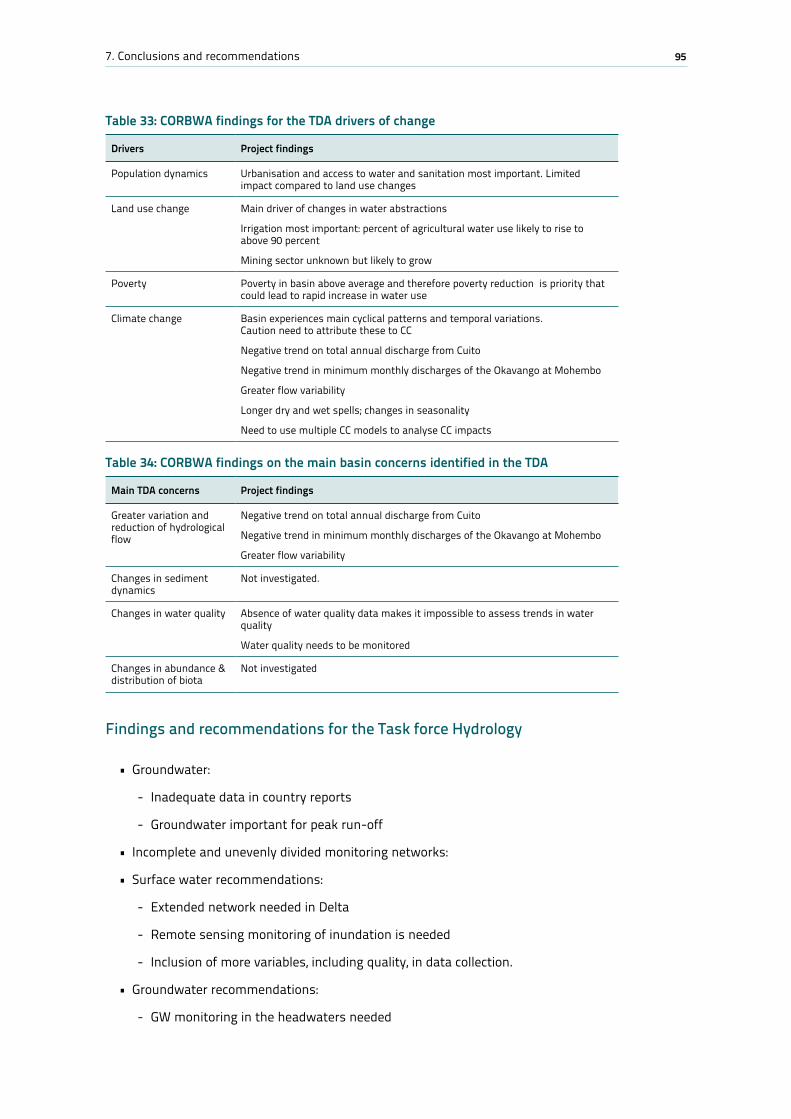
957. Conclusions and recommendations
Table 33: CORBWA findings for the TDA drivers of change
Drivers Project findings
Population dynamics Urbanisation and access to water and sanitation most important. Limited impact compared to land use changes
Land use change Main driver of changes in water abstractions
Irrigation most important: percent of agricultural water use likely to rise to above 90 percent
Mining sector unknown but likely to grow
Poverty Poverty in basin above average and therefore poverty reduction is priority that could lead to rapid increase in water use
Climate change Basin experiences main cyclical patterns and temporal variations. Caution need to attribute these to CC
Negative trend on total annual discharge from Cuito
Negative trend in minimum monthly discharges of the Okavango at Mohembo
Greater flow variability
Longer dry and wet spells; changes in seasonality
Need to use multiple CC models to analyse CC impacts
Table 34: CORBWA findings on the main basin concerns identified in the TDA
Main TDA concerns Project findings
Greater variation and reduction of hydrological flow
Negative trend on total annual discharge from Cuito
Negative trend in minimum monthly discharges of the Okavango at Mohembo
Greater flow variability
Changes in sediment dynamics
Not investigated.
Changes in water quality Absence of water quality data makes it impossible to assess trends in water quality
Water quality needs to be monitored
Changes in abundance & distribution of biota
Not investigated
Findings and recommendations for the Task force Hydrology
• Groundwater:
- Inadequate data in country reports
- Groundwater important for peak run-off
• Incompleteandunevenlydividedmonitoringnetworks:
• Surfacewaterrecommendations:
- Extended network needed in Delta
- Remote sensing monitoring of inundation is needed
- Inclusion of more variables, including quality, in data collection.
• Groundwaterrecommendations:
- GW monitoring in the headwaters needed
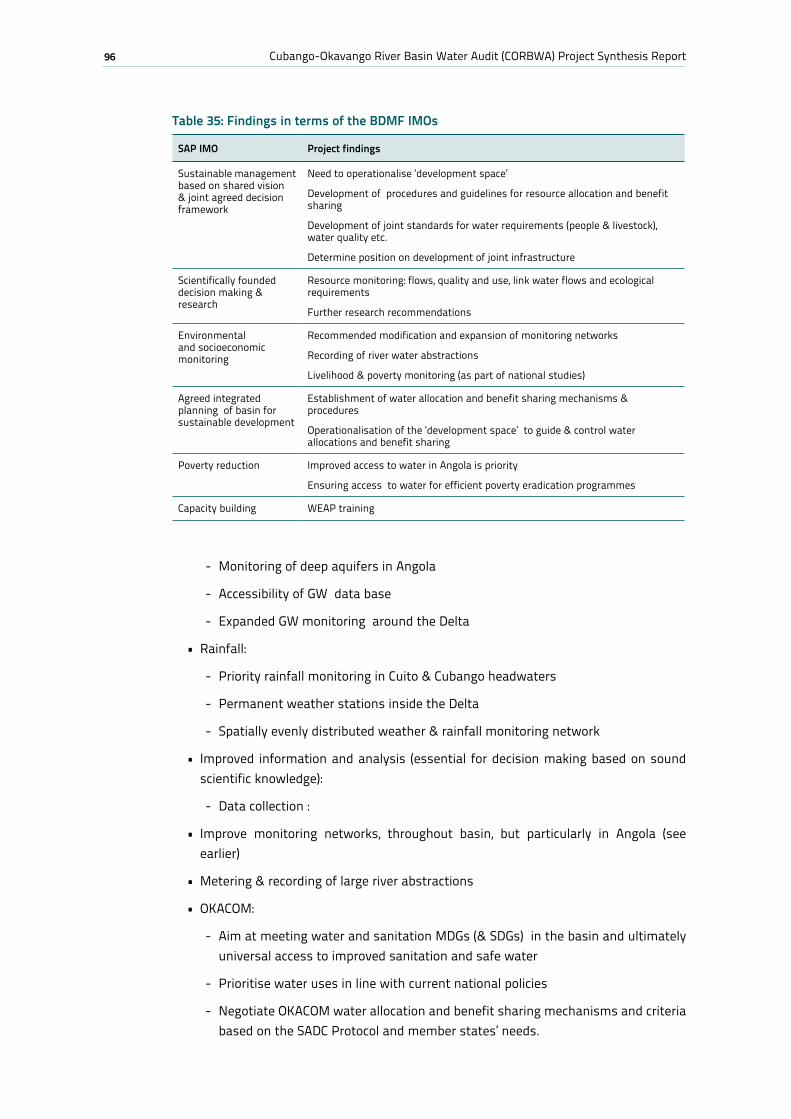
96 Cubango-Okavango River Basin Water Audit (CORBWA) Project Synthesis Report
- Monitoring of deep aquifers in Angola
- Accessibility of GW data base
- Expanded GW monitoring around the Delta
• Rainfall:
- Priority rainfall monitoring in Cuito & Cubango headwaters
- Permanent weather stations inside the Delta
- Spatially evenly distributed weather & rainfall monitoring network
• Improved information and analysis (essential for decision making based on soundscientific knowledge):
- Data collection :
• Improve monitoring networks, throughout basin, but particularly in Angola (seeearlier)
• Metering&recordingoflargeriverabstractions
• OKACOM:
- Aim at meeting water and sanitation MDGs (& SDGs) in the basin and ultimately universal access to improved sanitation and safe water
- Prioritise water uses in line with current national policies
- Negotiate OKACOM water allocation and benefit sharing mechanisms and criteria based on the SADC Protocol and member states’ needs.
Table 35: Findings in terms of the BDMF IMOs
SAP IMO Project findings
Sustainable management based on shared vision & joint agreed decision framework
Need to operationalise ‘development space’
Development of procedures and guidelines for resource allocation and benefit sharing
Development of joint standards for water requirements (people & livestock), water quality etc.
Determine position on development of joint infrastructure
Scientifically founded decision making & research
Resource monitoring: flows, quality and use, link water flows and ecological requirements
Further research recommendations
Environmental and socioeconomic monitoring
Recommended modification and expansion of monitoring networks
Recording of river water abstractions
Livelihood & poverty monitoring (as part of national studies)
Agreed integrated planning of basin for sustainable development
Establishment of water allocation and benefit sharing mechanisms & procedures
Operationalisation of the ‘development space’ to guide & control water allocations and benefit sharing
Poverty reduction Improved access to water in Angola is priority
Ensuring access to water for efficient poverty eradication programmes
Capacity building WEAP training
977. Conclusions and recommendations
Development of basin wide water standards for domestic and livestock use as well as water quality standards.
Findings and recommendations for consideration by the institutional task force
• Needtooperationalisethe‘developmentspace’basedonestimatedwaterabstractionsand legal rights (higher than abstractions)
• Identification&evaluationofofficialOKACOMscenariosforbasindevelopmentandwater abstraction/ benefit sharing
• BDMF seeks IWRM implementation in the basin based on scientific data andinformation
• Aim at meeting water and sanitation MDGs (& SDGs) in the basin and ultimatelyuniversal access to improved sanitation and safe water
• Prioritisewaterusesinlinewithcurrentnationalpolicies
• Negotiate OKACOM water allocation and benefit sharing mechanisms and criteriabased on the SADC Protocol and member states’ needs.
• Developmentofbasinwidewaterstandardsfordomesticandlivestockuseaswellas water quality standards.
• Promote water conservation and demand management, particularly in the middleand lower river sections
• Encourageuseofnon-potablewaterformining&irrigation
• Irrigation:
- Maximise irrigation water efficiency in the basin, particularly in the mid and lower sections
- Maximise re-use of treated effluent
• Reductionofwaterlossesinwaterservicedistributionnetworks
• Applycommercialuser-paysandpolluterpaysprincipleinallmemberstatesbearingin mind affordability
Findings and recommendations for consideration by the biodiversity task force
• Operationaliseandestimateecologicalwaterrequirements
• EnsurethatthedevelopmentspacedoesnotencroachintotheEWR
• EnsurehighpriorityofEWRinwaterdemandrankingandwaterallocations.
98 Cubango-Okavango River Basin Water Audit (CORBWA) Project Synthesis Report
References
Alberts, M. and J.Barnes (2012). Policy & Legislative Addendum Namibia. Report prepared for FAO & OKACOM.
Arntzen, J., T. Setlhogile & P. Ruthenberg (2011). Water Use in the Botswana Part of the Cubango Okavango River Basin. Centre for Applied Research.
Arntzen, J. & T.Setlhogile (2012). Water Use in the Cubango Okavango River Basin. Centre for Applied Research. Report prepared for FAO and OKACOM.
Arntzen, J. J.Barnes, T. Setlhogile & G.Manase (2012). Water Resources Economics and Irrigation in applied to the Cubango Okavango River Basin. Report prepared for FAO and OKACOM.
Aylward, B. (2009). Economic valuation of basin resources (final draft). OKACOM-EPSMO report.
Barbosa, C. (2012). Water demand and use in the Angolan part of the Cubango Okavango River basin. Report prepared for FAO and OKACOM.
Barnes, J.I. (1994). Suggested criteria for shadow pricing in cost-benefit analysis of projects in Namibia. Unpublished Paper, Directorate of Environmental Affairs, Ministry of Environment and Tourism, Windhoek, Namibia.
Barnes, J., et al., (2009), Okavango River Basin Transboundary Diagnostic Analysis: socio-economic assessment. OKACOM-EPSMO.
Beuster, H., 2009. Okavango River Basin Environmental Flow Assessment Scenario report: hydrology (report 06/2009). OKACOM.
Central Bureau of Statistics (2008). A review of poverty and inequality in Namibia. National Planning Commission.
COBA (2010). Plano Nacional Director de Irrigação de Angola, Resume Executivo.
Cornish, G., B.Boworth, C.Perry and J.Burke (2004). Water charges in irrigated agriculture: an analysis of international experiences. FAO Water Reports No.28. Rome.
Department of Environmental Affairs and Centre for Applied Research (2006). Botswana water Accounts.
EPSMO (2006 and 2009). Okavango River Basin, Environmental Flow Assessment. Reports 06/2009 and 05/2009.
99References
FAO (2004). Economic Valuation of Water Resources in Agriculture: from the sectoral to a functional perspective of natural resource management. FAO water Reports No. 27. Rome.
FAO (2006). Stakeholder Oriented Valuation to Support Water resources Management Processes. FAO Land and water Division, Rome.
FAO (2011). The State of the World’s Land and Water Resources for Food and Agriculture: Managing the Risks. FAO and Earthscan.
FAO, 2012a. Coping with water scarcity. An action framework for agriculture and food security. FAO Water Reports n. 38
FAO. 2012b. Hydrological modeling of the Okavango basin in the context of monitoring and climate change impacts Prepared by P.Wolski. CORBWA project reports.
FAO, 2012c. CORBWA: Water use report for the Basin. Prepared by Centre for Applied Research
FAO, 2012d. CORBWA reports: Water Audit decision support tool.
Global Water Partnership, (2000). Integrated Water Resources Management‘. GWP Technical Advisory Technical Paper No. 4. Stockholm, Sweden.
Gumbricht et al., (2003). Forecasting the spatial extent of the annual flood in the Okavango delta, Botswana. Journal of Hydrology 290 (2004) 178–191.
Humavindu, M.N. (2007). Estimating shadow pricing in the Namibian economy. Unpublished Paper, Development Bank of Namibia, Windhoek, Namibia.
Humavindu, N.M. (2008). Essays on the Namibian economy. Umeå Economic Studies No 745, Department of Economics, Umeå University, Umeå, Sweden.
IWRMPJVN (2010). Integrated water resources management plan for Namibia. Funded by the African Water Facility, report prepared for the Ministry of Agriculture, Water and Forestry. IWRM Plan Joint Venture Namibia (WCE, ENVES, IMLT and HIWAC). Windhoek. Namibia.
Krugmann, H. and M.Alberts (2012). Water demand and use study for the Namibian part of the Cubango Okavango River basin. Report prepared for FAO and OKACOM.
Lundqvist, J., T.Jonch-Clausen (eds.) (1994). Putting Dublin/Agenda 21 in Practice: Lessons and New Approaches in Water and Land Management. Special Session at 8th IWRA World Congress, Cairo.
Malzbender, D., P. Mokorosi, D. Jooste, D. and H. Tweedy (2010). Environmental Protection and Sustainable Management of the Okavango River Bas in (EPSMO): Governance Review.
100 Cubango-Okavango River Basin Water Audit (CORBWA) Project Synthesis Report
Masamba, W.R. (2009). TDA of the Botswana portion of the Okavango River basin: water supply and sanitation.
MAWF (2005). The Allocation of Water from the Okavango River. Policy Document No. 7/2/10/3, June 2005. Ministry of Fisheries and Marine Resources. Windhoek. Namibia.
MAWF (2004). Draft Technical Summary of Water Accounts for Namibia. Ministry of Agriculture, Water and Rural Development, Department of Water Affairs & Forestry. Windhoek. Namibia.
MAWF (2012). Trends in water resources availability in the Cubango Okavango River Basin, Namibian part. Hydrology section.
Merrey, D.J., R. Meinzen-Dick, P.P. Mollinga and E.Karar (2007). Policy and institutional reform process for sustainable agricultural water management; the art of the possible. In Molden (ed) (2007). Water for food, water for life: A comprehensive assessment of water management in agriculture. Earth scan.
OKACOM (2011a). Okavango River Basin Transboundary Diagnostic Analysis.
OKACOM (2011b). Draft Strategic Action Programme; sustainable management of the Cubango-Okavango River Basin.
Rama Mohan Rao, MS, Batchelor, CH, James, AJ, Nagaraja, R, Seeley, and Butterworth, JA (2003). Andhra Pradesh Rural Livelihoods Programme Water Audit Report. APRLP, Hyderabad, India.
Rejwan (2011). The State of Israel: National Water Efficiency Report.
SAREP (2012). Strategic Environmental Assessment of the Okavango Delta Ramsar site.
SADC (2001). Revised Protocol on Shared Water Courses.
SADC (2006). Regional Water Policy.
SADC (2007). Regional Water Strategy.
SADC, 2010a-c. a. Standardised Methodologies. b. Training Manual; c. Project report
SADC (2011a). Regional Strategic Action Plan III on IWRM in SADC (2011-15).
SADC (2011b). Climate change adaptation in SADC: A Strategy for the water sector.
Setlhogile,T and J.Arntzen (2012). The regulatory environment of water management in the Cubango Okavango River Basin. Centre for Applied Research. Report prepared for FAO and OKACOM.
SMEC and EHES (2006). Review of the 1991 Botswana National Water Master Plan. Report prepared for Government of Botswana.
101References
SRK Consulting (2010). Environmental Impact Assessment and Environmental management Plan for Bosetu Copper mine.
Stockholm Environmental Institute (2005). WEAP Tutorial.
Statistics Botswana (2011). Preliminary results of the Botswana core welfare indicator (poverty) survey 2009/10.
SWECO & GRONER (2005). A Rapid Water Resources and Water Use Assessment in Angola
WAN (2006). Technical Summary of Water Accounts for Namibia. Department of Water Affairs. Ministry of Agriculture, Water and Rural Development. Windhoek. Namibia.
Winpenny,J., I.Heinz, S.Koo-Oshima, M.Salgot, J.Collado, F.Hernandez and R.Toricelli (2010). The wealth of waste: the economics of wastewater use in agriculture. FAO Water Reports No.35. Rome.
Turpie, J.K. and Barnes, J.I. (2003). Balancing Ecology and Economics in the Multiple Use of Wetlands on Communal lands‘. Proceedings of the 7th International Rangelands Congress, Durban, South Africa, 26 July – 1 August 2003. 1932-1941.
Turpie, J.K., Barnes, J.I., Arntzen, J.A., Nherera, B., Lange, G.M. and Buzwani, B., (2006). Economic Valuation of the Okavango Delta and Implications for Management‘. IUCN. Gaborone, Botswana.
UN, 2012. System of Environmental Economic Accounting for Water. Department of Economic & Social Affairs, Statistics Division.
University of Botswana, Harry Oppenheimer Okavango Research Centre: Water in the Okavango Delta Fact Sheet 4/2007, compiled by P. Wolski. http://www.orc.ub.bw/downloads/FS4_wbalance.pdf
WAN (2006). Technical Summary of Water Accounts for Namibia. Department of Water Affairs. Ministry of Agriculture, Water and Rural Development. Windhoek. Namibia
Pitman: Hughes et al., 2002, 2006 and 2010; Murray-Hudson et al., (2006); Milzow et al., (2010); Wolski, 2009; King et al., 2009; WEAP used in EPSMO and TDA; King et al., 2009 and OKACOM, 2011a).
Wolski, P. (2012). Time series analysis of water resources availability in Botswana’s part of the Cubango-Okavango River Basin. Okavango Research Institute.
Wolski,P. (2012). Trends in water resources base in the Cubango Okavango River Basin.
Wolski P. Todd M. Murray-Hudson M.A and Tadross M. submitted. Multidecadal variability in hydro-climate of Okavango river system, southwest Africa, in the past and under changing climate. Journal of Hydrology
102 Cubango-Okavango River Basin Water Audit (CORBWA) Project Synthesis Report
Annex 1: List of reports produced under CORBWA
Basin wide reportsArntzen,J. J.Barnes, T. Setlhogile & G.Manase (2012). Water Resources Economics and
Irrigation in applied to the Cubango Okavango River Basin.
Arntzen,J. & T.Setlhogile (2012). Water Use in the Cubango Okavango River Basin. Centre for Applied Research.
Droogers, P., Simons, G., Bastiaanssen, W. (2010). Water accounting Plus (WA+) in the Okavango River Basin.
FAO, 2012d. CORBWA reports: Water Audit decision support tool.
Sethogile,T. & J.Arntzen (2012). Institutional Mapping of the Cubango- Okavango River Basin. Centre for Applied Research.
VanderPost, C., M. Dhiwayo & A. Makati (2012). Review of availability of supporting material (maps, databases, satellite imagery, etc.). Okavango Research Institute.
VanderPost, C., M. Dhiwayo & A. Makati (2012). Summary report with recommendations on technical specifications and selection of hardware and software for the requirements of the project. Okavango Research Institute.
Wolski,P. (2012). Trends in water resources base in the Cubango Okavango River Basin.
AngolaBarbosa, C. (2012). Water use and demand report for Angola’s part of the Cubango
Okavango River Basin. This report includes a policy review.
BotswanaArntzen,J., T. Setlhogile & P. Ruthenberg (2011). Water Use in the Botswana Part of the
Cubango Okavango River Basin. Centre for Applied Research.
Setlhogile,T. (2011). Institutional Mapping: Review of Policies and Legislation for the Botswana Part of the Okavango River Basin. Centre for Applied Research
Wolski, P. (2012). Time series analysis of water resources availability in Botswana’s part of the Cubango-Okavango River Basin. Okavango Research Institute.

103Annex 1: List of reports produced under CORBWA
NamibiaAlberts,M. And J.Barnes (2012). Policy & Legislative Addendum Namibia.
Krugmann,H. & M.Alberts (2012). Water demand in the Namibia section of the Cubango Okavango River Basin.
Ministry of Agriculture, Water & Forestry, DWAF (2012). Trends in water resources availability in the Cubango Okavango River Basin, Namibian part. Hydrology section.
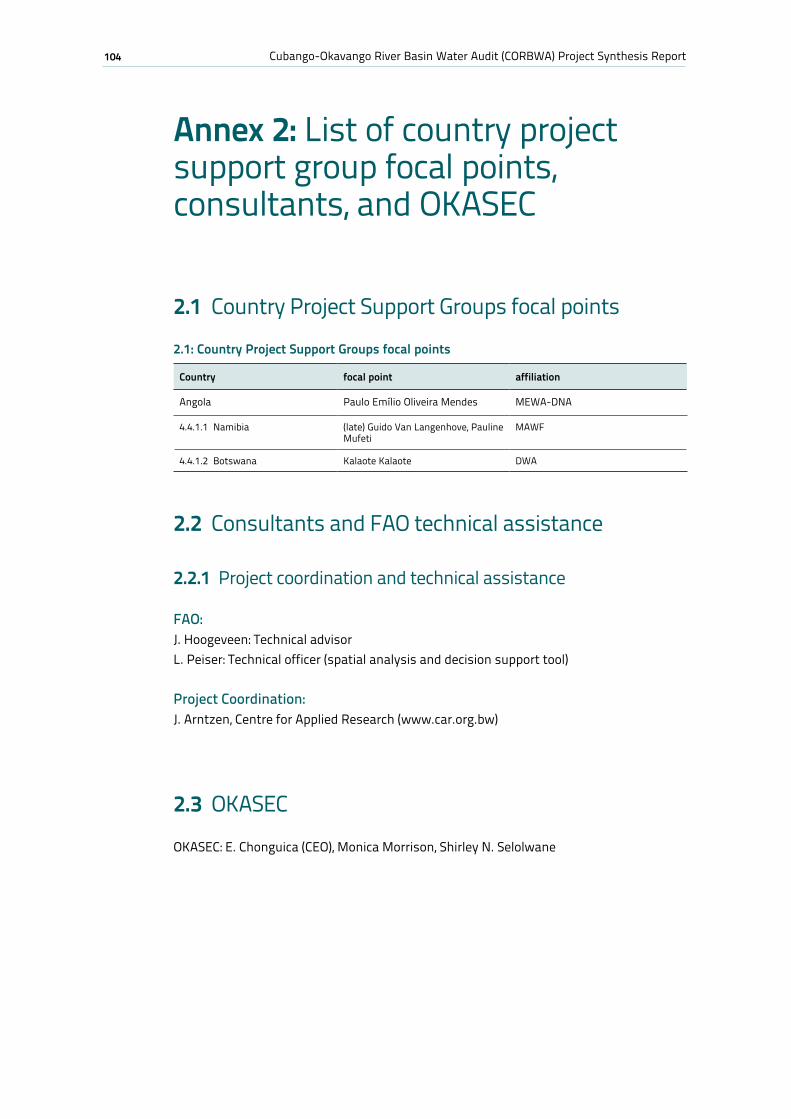
104 Cubango-Okavango River Basin Water Audit (CORBWA) Project Synthesis Report
Annex 2: List of country project support group focal points, consultants, and OKASEC
2.1 Country Project Support Groups focal points
2.2 Consultants and FAO technical assistance
2.2.1 Project coordination and technical assistance
FAO:J. Hoogeveen: Technical advisorL. Peiser: Technical officer (spatial analysis and decision support tool)
Project Coordination:J. Arntzen, Centre for Applied Research (www.car.org.bw)
2.3 OKASEC
OKASEC: E. Chonguica (CEO), Monica Morrison, Shirley N. Selolwane
2.1: Country Project Support Groups focal points
Country focal point affiliation
Angola Paulo Emílio Oliveira Mendes MEWA-DNA
4.4.1.1 Namibia (late) Guido Van Langenhove, Pauline Mufeti
MAWF
4.4.1.2 Botswana Kalaote Kalaote DWA
105Annex 2: List of country project support group focal points, consultants, and OKASEC
2.2.2: CORBWA Consultants
Nature of studies
1 Country studies
Angola
Mr.P. Emilio Angola resource availability trends
Mr.C. Barbosa Angola water resource demand and policy environment up-date
Namibia
H. Krugmann, M. Alberts and J. Barnes Namibia water resources demand study
MWAF group, chaired by G. van Langenhove Namibia resource availability trends
M. Alberts and J. Barnes Namibia policy environment up-date
Botswana
P. Wolski Botswana resource availability trends
J. Arntzen & T. Setlhogile Botswana water resources demand study
T. Setlhogile & J. Arntzen Namibia policy environment up-date
2 Basin-wide studies
C. Van der Post Data sources and base for the CORB
C. Van der Post Soft and hard ware requirements for a CORB data base.
P. Wolski Basin wide resource availability trends
J. Arntzen Basin wide resource demand trends
T. Setlhogile & J. Arntzen Basin wide resource policy environment up-date
J. Arntzen, J. Barnes, & T. Setlhogile Water valuation and costing
G. Manase Water resources, irrigation costs and water accounting
L. Peiser WEAP and scenarios
3 Water audit synthesis
J. Arntzen Water audit synthesis compilation
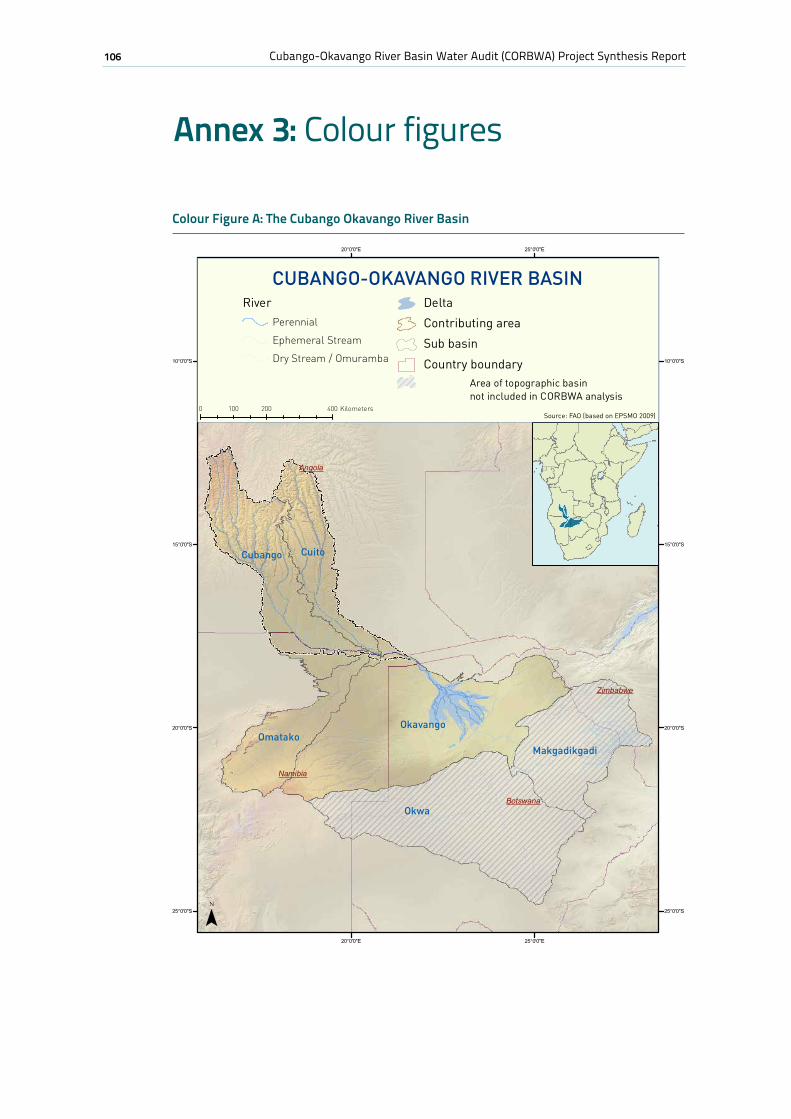
106 Cubango-Okavango River Basin Water Audit (CORBWA) Project Synthesis Report
Annex 3: Colour figures
Colour Figure A: The Cubango Okavango River Basin
Angola
Botswana
Namibia
Zimbabwe
Okwa
Okavango
Cubango Cuito
OmatakoMakgadikgadi
25°0'0"E
25°0'0"E
20°0'0"E
20°0'0"E
10°0'0"S 10°0'0"S
15°0'0"S 15°0'0"S
20°0'0"S 20°0'0"S
25°0'0"S 25°0'0"S
CUBANGO-OKAVANGO RIVER BASIN
0 200 400100 Kilometers
RiverPerennial
Ephemeral Stream
Dry Stream / Omuramba
Delta
Contributing area
Sub basin
Country boundaryArea of topographic basin not included in CORBWA analysis
Source: FAO (based on EPSMO 2009)
¯
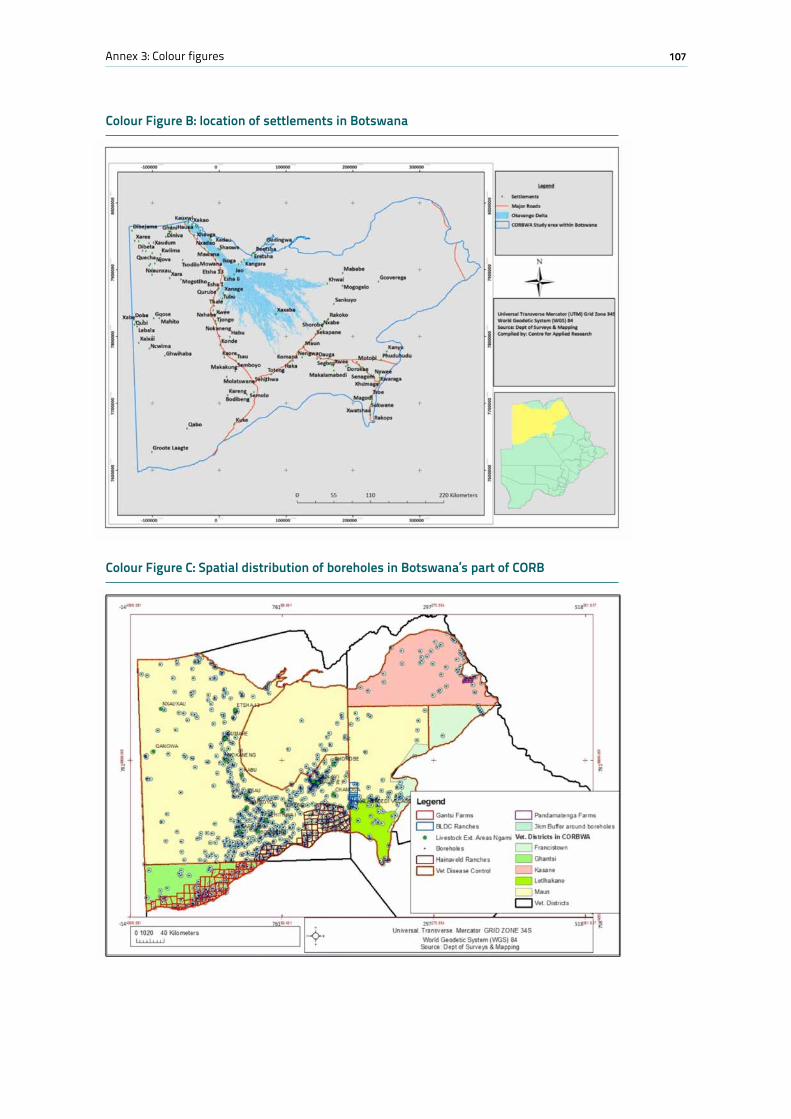
107Annex 3: Colour figures
Colour Figure B: location of settlements in Botswana
Colour Figure C: Spatial distribution of boreholes in Botswana’s part of CORB
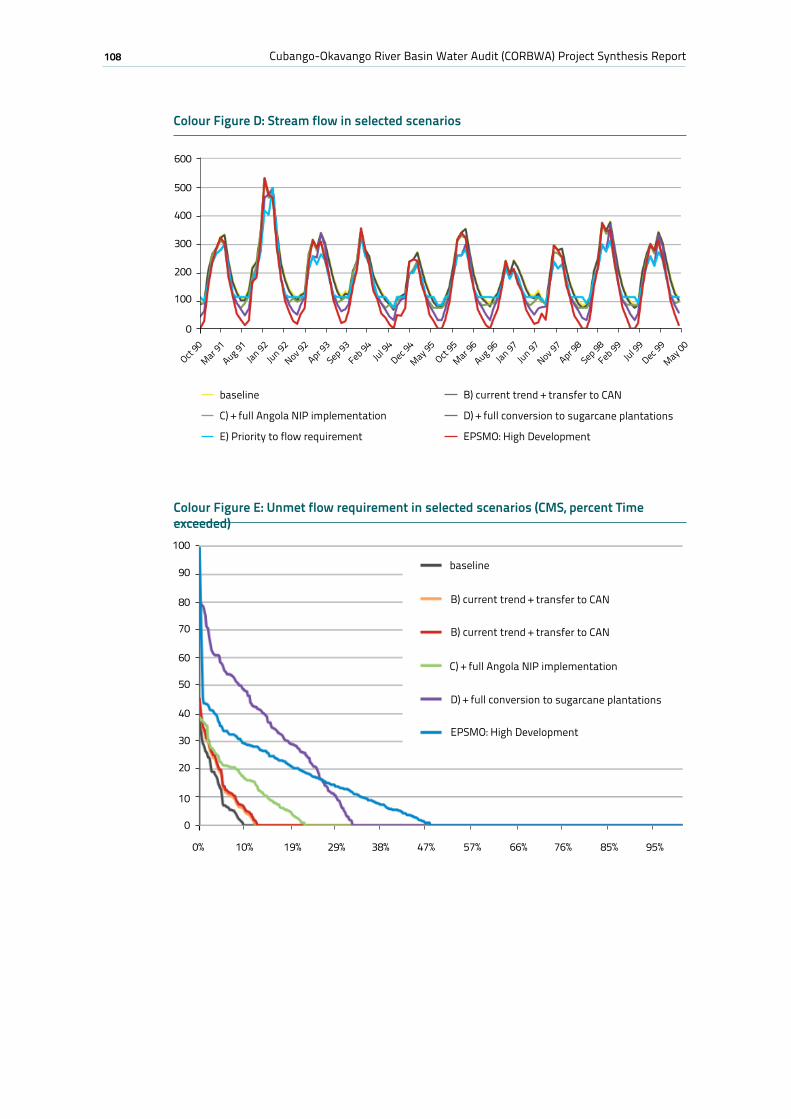
108 Cubango-Okavango River Basin Water Audit (CORBWA) Project Synthesis Report
E) Priority to flow requirement EPSMO: High Development
C) + full Angola NIP implementation D) + full conversion to sugarcane plantations
baseline B) current trend + transfer to CAN
0
Oct 90
Mar 91
Aug 91Jan 92
Jun 92
Nov 92
Apr 93Sep 93
Feb 94Jul 9
4Dec 9
4
May 95
Oct 95
Mar 96
Aug 96Jan 97
Jun 97
Nov 97
Apr 98
Sep 98Feb 99
Jul 99
Dec 99
May 00
100
200
300
400
500
600
0
10
20
30
40
50
60
70
80
90
100
0% 10% 19% 29% 38% 47% 57% 66% 76% 85% 95%
EPSMO: High Development
D) + full conversion to sugarcane plantations
B) current trend + transfer to CAN
B) current trend + transfer to CAN
C) + full Angola NIP implementation
baseline
Colour Figure D: Stream flow in selected scenarios
Colour Figure E: Unmet flow requirement in selected scenarios (CMS, percent Time exceeded)
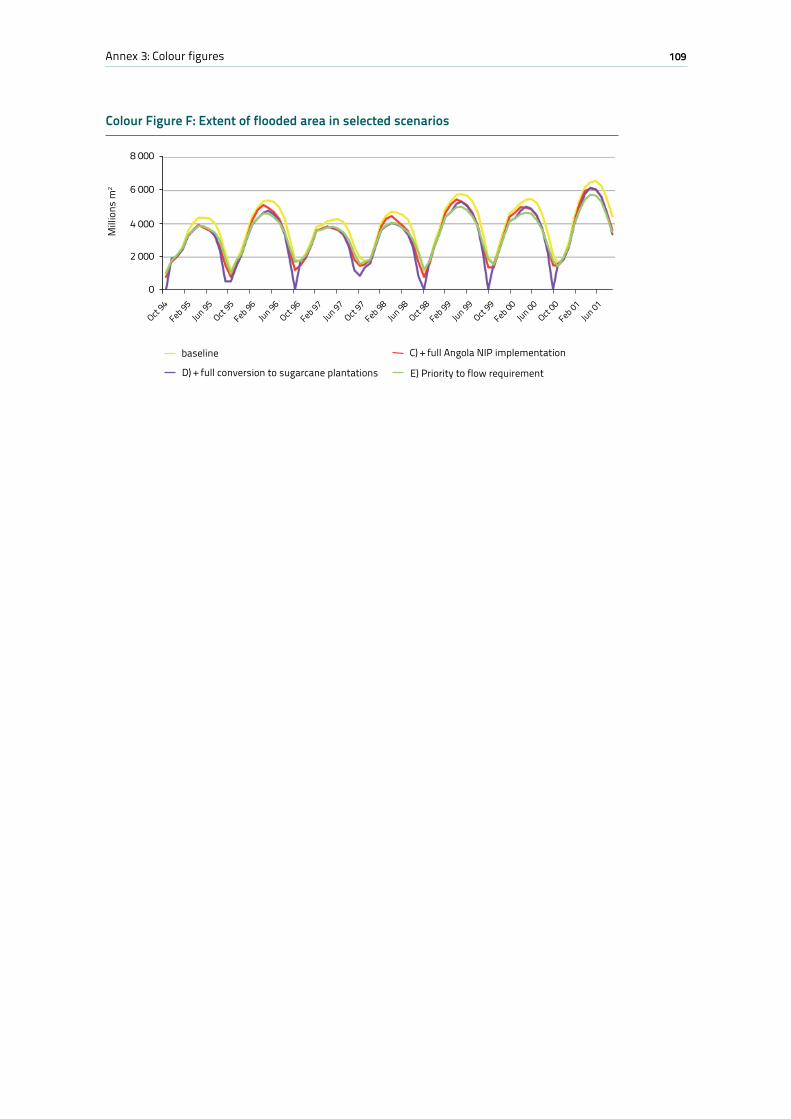
109Annex 3: Colour figures
E) Priority to flow requirement
C) + full Angola NIP implementation
D) + full conversion to sugarcane plantations
baseline
0
Oct 94
Feb 95Jun 95
Oct 95
Feb 96Jun 96
Oct 96
Feb 97Jun 97
Oct 97
Feb 98Jun 98
Oct 98
Feb 99Jun 99
Oct 99
Feb 00Jun 00
Oct 00
Feb 01Jun 01
2 000
4 000
6 000
8 000
Mill
ions
m2
Colour Figure F: Extent of flooded area in selected scenarios
Synthesis ReportCubango-Okavango River Basin Water Audit (CORBWA) Project
Home to one of the last near-pristine aquatic system of the world, the Cubango-Okavango river basin faces the challenge of sustaining the livelihoods of nearly 900 000 people in three countries (Angola, Namibia and Botswana) while preserving its unique ecosystem.
FAO has been providing support to the Permanent Okavango River Basin Commission (OKACOM) since the year 2000 through the implementation of the Environmental Protection and Sustainable Management of the Okavango (EPSMO) project, on which this Cubango-Okavango River Basin Water Audit (CORBWA) builds.
A Water Audit provides a country administration or a river basin organization with a comprehensive methodology for assessing, analysing and reporting of the use of increasingly scarce water resources. On the supply side, the audit provides information about the water availability. On the demand side, it gives a detailed picture, on how the water is used, for which purpose, and with which value. A detailed assessment of agricultural water use, including its productivity, its value-in-use, and its efficiency during the water use process, gives countries handles to adapt water policies and improve water management plans for the future through strategic and integrated interventions to increase their capacity to cope with water scarcity.
This report presents a synthesis of sixteen thematic reports which describe the different components of the CORBWA in the three riparian countries and at basin level.
I374
3E/1
/04.
14