Tungsten carbide nanotubes supported platinum nanoparticles as a

S1
Supporting Information
for
Synthesis of metal-fluoride nanoparticles supported on
thermally reduced graphite oxide
Alexa Schmitz1, Kai Schütte1, Vesko Ilievski1, Juri Barthel2, Laura Burk3,
Rolf Mülhaupt3, Junpei Yue4, Bernd Smarsly4 and Christoph Janiak*,§,1
Address: 1Institut für Anorganische Chemie und Strukturchemie, Heinrich-Heine-
Universität Düsseldorf, 40204 Düsseldorf, Germany; 2Gemeinschaftslabor für
Elektronenmikroskopie RWTH-Aachen, Ernst Ruska-Centrum für Mikroskopie und
Spektroskopie mit Elektronen, D-52425 Jülich, Germany; 3Freiburg Materials
Research Center and Institute for Macromolecular Chemistry, Albert-Ludwigs-
University Freiburg, 79104 Freiburg, Germany and 4Physikalisch-Chemisches
Institut, Justus-Liebig-Universität Gießen, 35392 Gießen, Germany
Email: Christoph Janiak* - [email protected]
* Corresponding author
§Fax: +49-211-81-12287; Tel: +49-211-81-12286
Additional experimental data
S2
Synthesis of TRGO and TRGO-SH
Scheme S1: Synthesis of chemically derived graphene (CDG)/ thermally reduced
graphite oxide (TRGO) from natural graphite over graphite oxide (adapted from [1]).
Scheme S2: Synthesis of TRGO-SH. Three different routes for the synthesis of
TRGO-SH from TRGO-400 (adapted from [2]).

S3
Analysis of TRGO-300, -400, -750 and –SH
TRGO-300
Figure S1: Photoelectron spectrum of TRGO-300. The red bars are a guide to the
eye on the binding energy axis.
Table S1: XPS quantification of TRGO-300.
name position area atom % R.S.F.
O 1s 532 111030 14 2.93
C 1s 283 223791 86 1
In the XP spectra a clear oxygen and carbon signal was seen. Quantification of
oxygen against carbon showed that TRGO-300 contains 14 atom % oxygen.
Table S2: CHN analysis of TRGO-300.
Sample C [wt %] H [wt %] S [wt %]
TRGO-300 79.86 0.77 0.55
The sulfur impurity is believed to be derived from graphite.
The BET surface of TRGO-300 was 430 m2/g.

S4
TRGO-400
Figure S2: Photoelectron spectrum of TRGO-400. The red bars are a guide to the
eye on the binding energy axis.
Table S3: XPS quantification of TRGO-400.
name position area atom % R.S.F.
O 1s 533 127192 15 2.93
C 1s 284 248465 85 1
In the XP spectra a clear oxygen and carbon signal was seen. Quantification of
oxygen against carbon showed that TRGO-300 contains 15 atom % oxygen.
Table S4: CHN analysis of TRGO-400.
sample C [wt %] H [wt %] S [wt %]
TRGO-400 80.93 0.8 0.73
The S impurity is believed to be derived from graphite.
The BET surface of TRGO-400 was 450 m2/g.

S5
TRGO-750
Figure S3: Photoelectron spectrum of TRGO-400. The red bars are a guide to the
eye on the binding energy axis.
Table S5: XPS quantification of TRGO-750.
name position area atom % R.S.F.
O 1s 533 41954 9 2.93
C 1s 284 150049 91 1
In the XP spectra a clear oxygen and carbon signal was seen. Quantification of
oxygen against carbon showed that TRGO-300 contains 9 atom % oxygen.
Table S6: CHN analysis of TRGO-750.
sample C [wt %] H [wt %]
TRGO-750 82.39 0.81
The BET surface of TRGO-750 was 520 m2/g.

S6
TRGO-SH
Table S7: CHN analysis of TRGO-SH.
sample C [wt %] H [wt %] S [wt %]
TRGO-SH 54.77 1.48 0.96
The BET surface of TRGO-SH was 189 m2/g.

S7
Overview of all samples
MFx@TRGO-300:
FeF2@TRGO-300
Figure S4: TEM and size distribution (top), PXRD and SAED (bottom, FeF2–
reference reflections in red from COD 9009074) of 0.5 wt % FeF2-NPs in [BMIm][BF4]
@TRGO–300 from Fe(AMD)2.
S8
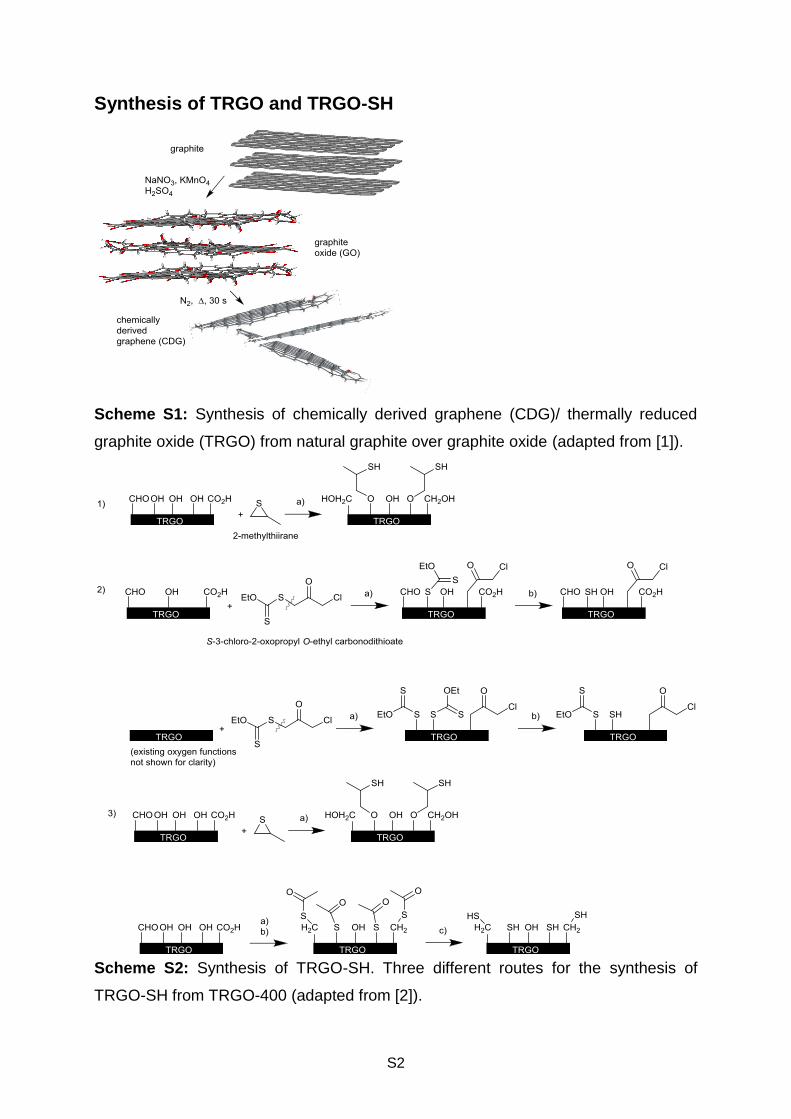
CoF2@TRGO-300
Figure S5: PXRD (CoF2 – reference reflections in red from COD 9009073) of 0.5 wt
% CoF2–NPs in [BMIm][BF4] @TRGO–300 from Co(AMD)2.
PrF3@TRGO-300
S9
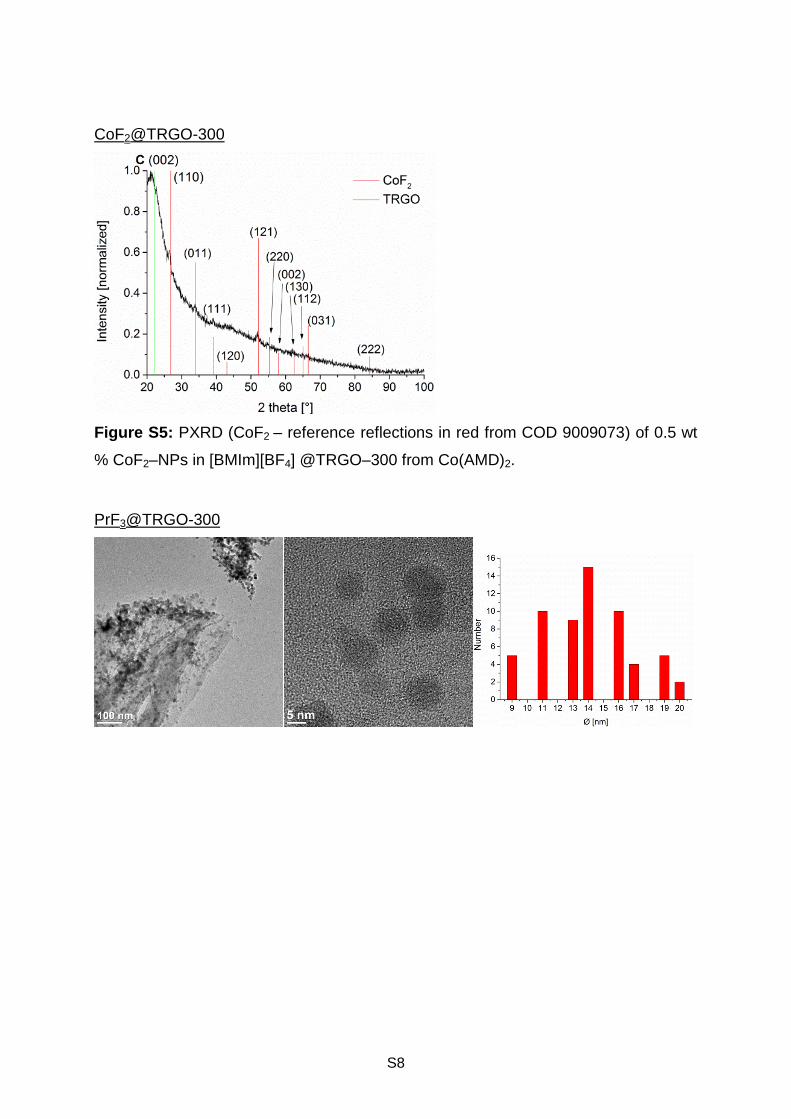
Figure S6: TEM and size distribution (top), PXRD and XPS (middle, PrF3- reference
reflections in red from COD 1010984) and SAED (bottom) of 0.5 wt % PrF3-NPs in
[BMIm][BF4] @TRGO–300 from Pr(AMD)3. XPS: The red bars are a guide to the eye
on the binding energy axis.
EuF3@TRGO-300

S10
Figure S7: TEM and size distribution (top), PXRD and XPS (bottom, EuF3- reference
reflections in red from ICDD 33–0373) of 0.5 wt % EuF3-NPs in [BMIm][BF4]
@TRGO–300 from Eu(dpm)3. XPS: The red bars are a guide to the eye on the
binding energy axis.
Table S8: d-spacing references for FeF2 and PrF3 from the literature compared with
the measured d-spacing.
d-spacing reference
(hkl) [FeF2 COD: 9009074]
d-spacing measured
d-spacing reference
(hkl) [PrF3 COD: 1010984]
d-spacing measured
3.32 (110) 3.30 3.61 (002) 3.63
2.70 (011) 2.71 3.17 (111/–121) 3.14
2.34 (111) 2.38 1.99 (–123/113) 1.99
1.77 (121) 1.78 1.71 (–241) 1.70
1.41 (031) 1.42 1.42 (–243) 1.44
1.16 (–153/ –444/
143) 1.14
S11
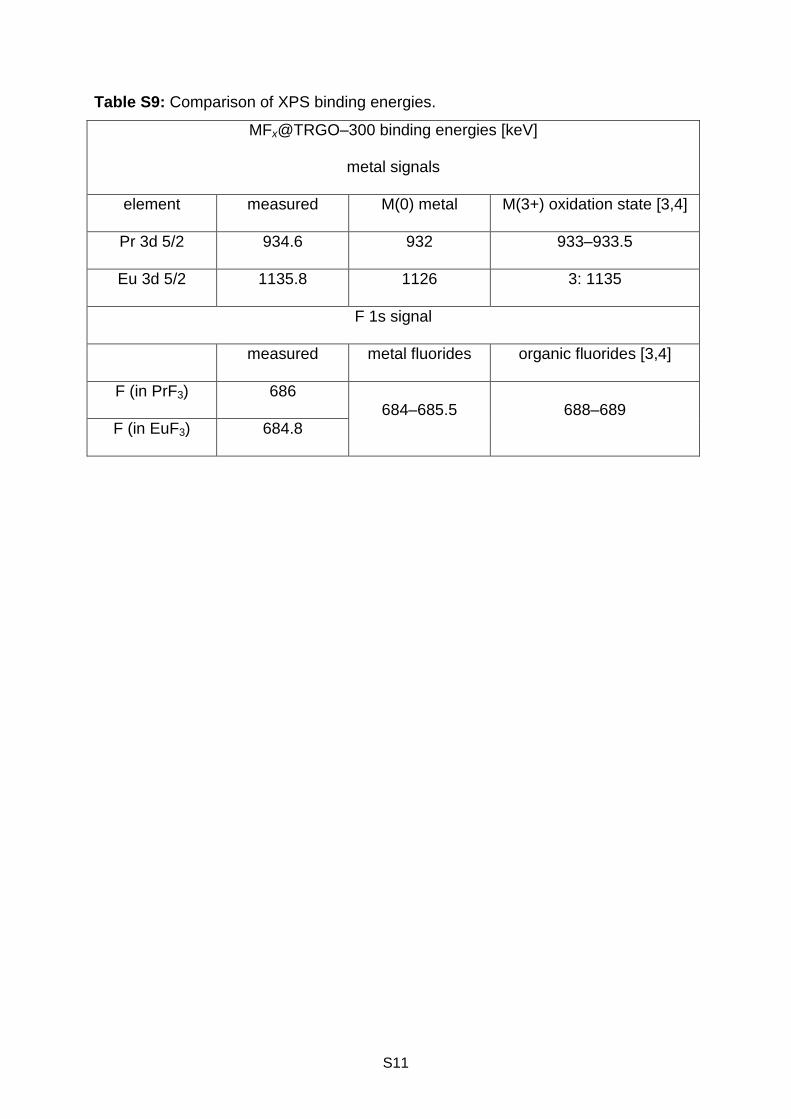
Table S9: Comparison of XPS binding energies.
MFx@TRGO–300 binding energies [keV]
metal signals
element measured M(0) metal M(3+) oxidation state [3,4]
Pr 3d 5/2 934.6 932 933–933.5
Eu 3d 5/2 1135.8 1126 3: 1135
F 1s signal
measured metal fluorides organic fluorides [3,4]
F (in PrF3) 686 684–685.5 688–689
F (in EuF3) 684.8
S12
TRGO-400:
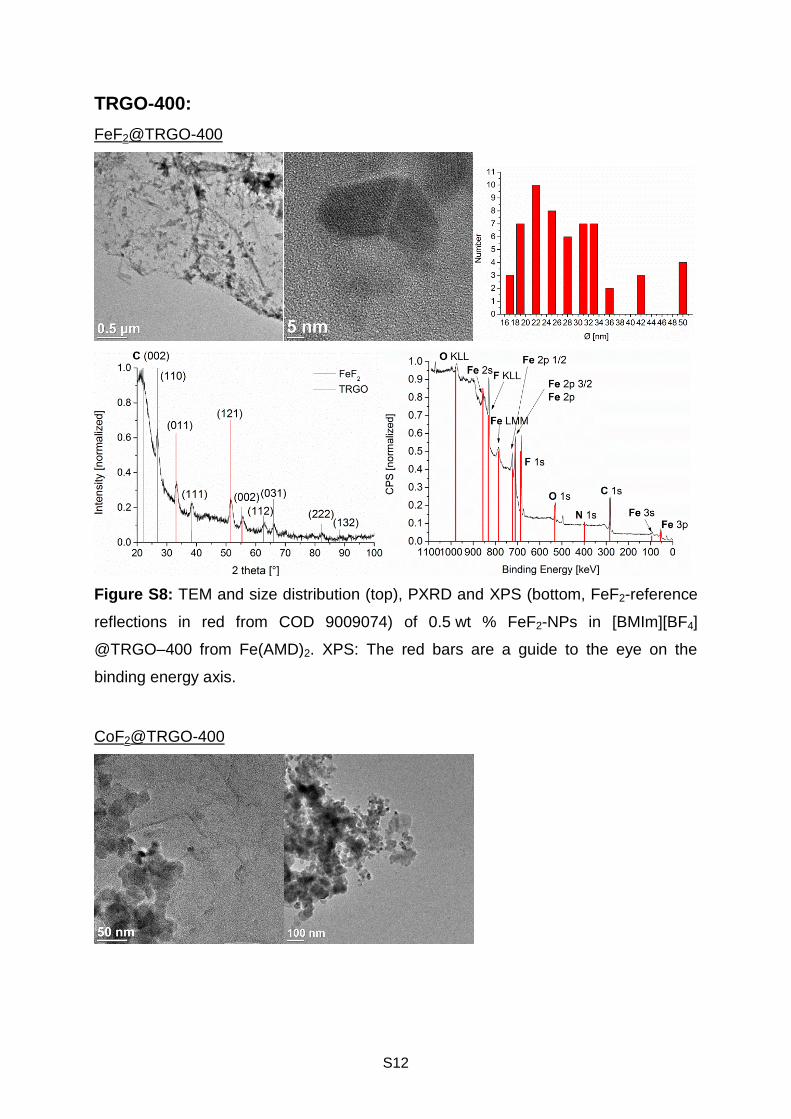
FeF2@TRGO-400
Figure S8: TEM and size distribution (top), PXRD and XPS (bottom, FeF2-reference
reflections in red from COD 9009074) of 0.5 wt % FeF2-NPs in [BMIm][BF4]
@TRGO–400 from Fe(AMD)2. XPS: The red bars are a guide to the eye on the
binding energy axis.
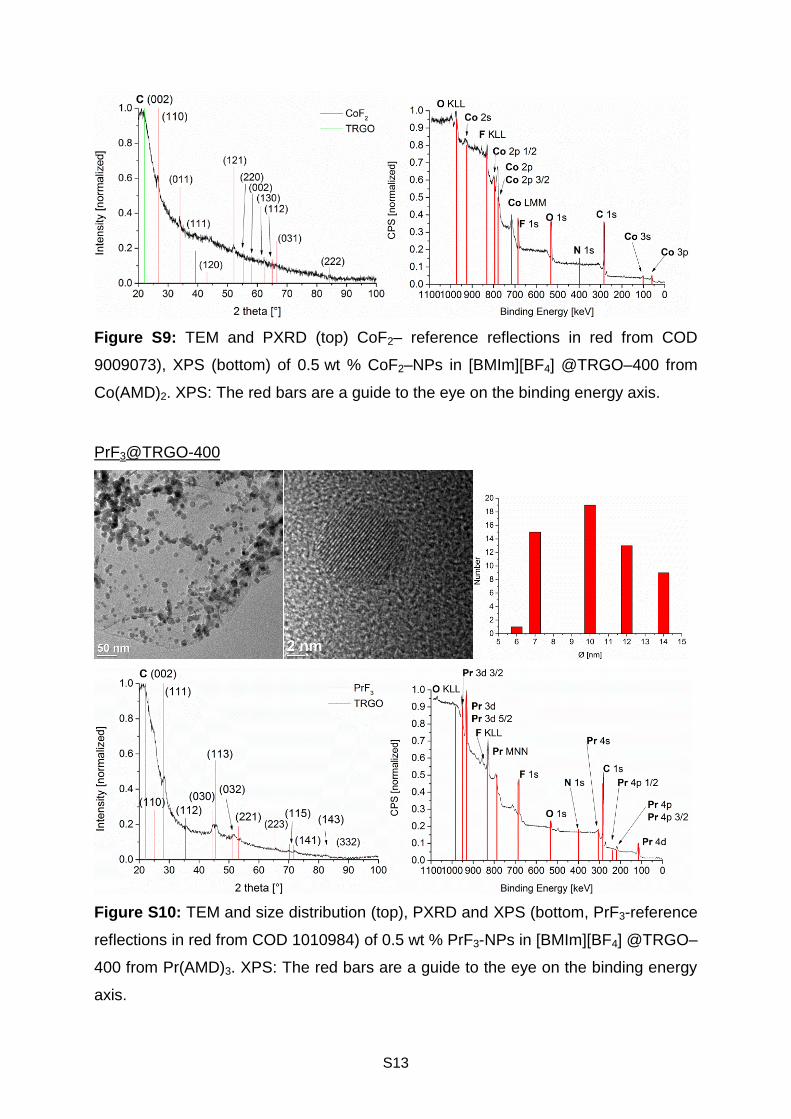
CoF2@TRGO-400
S13
Figure S9: TEM and PXRD (top) CoF2– reference reflections in red from COD
9009073), XPS (bottom) of 0.5 wt % CoF2–NPs in [BMIm][BF4] @TRGO–400 from
Co(AMD)2. XPS: The red bars are a guide to the eye on the binding energy axis.
PrF3@TRGO-400
Figure S10: TEM and size distribution (top), PXRD and XPS (bottom, PrF3-reference
reflections in red from COD 1010984) of 0.5 wt % PrF3-NPs in [BMIm][BF4] @TRGO–
400 from Pr(AMD)3. XPS: The red bars are a guide to the eye on the binding energy
axis.
S14
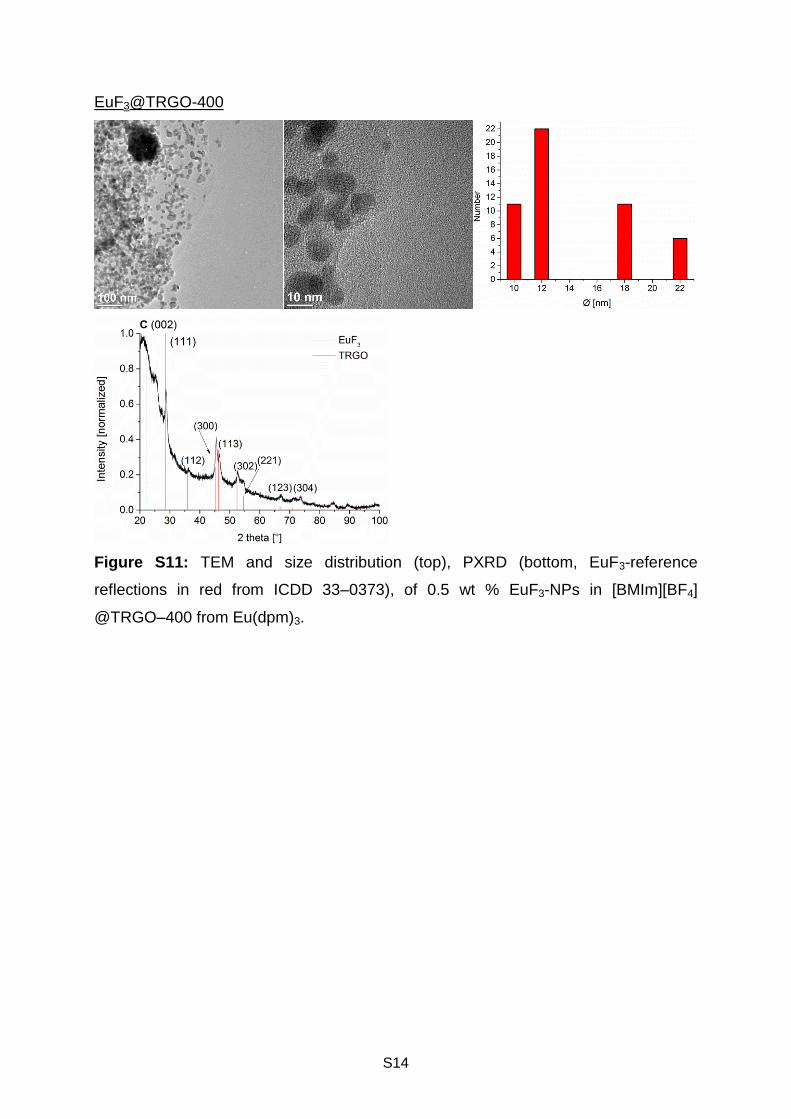
EuF3@TRGO-400
Figure S11: TEM and size distribution (top), PXRD (bottom, EuF3-reference
reflections in red from ICDD 33–0373), of 0.5 wt % EuF3-NPs in [BMIm][BF4]
@TRGO–400 from Eu(dpm)3.
S15
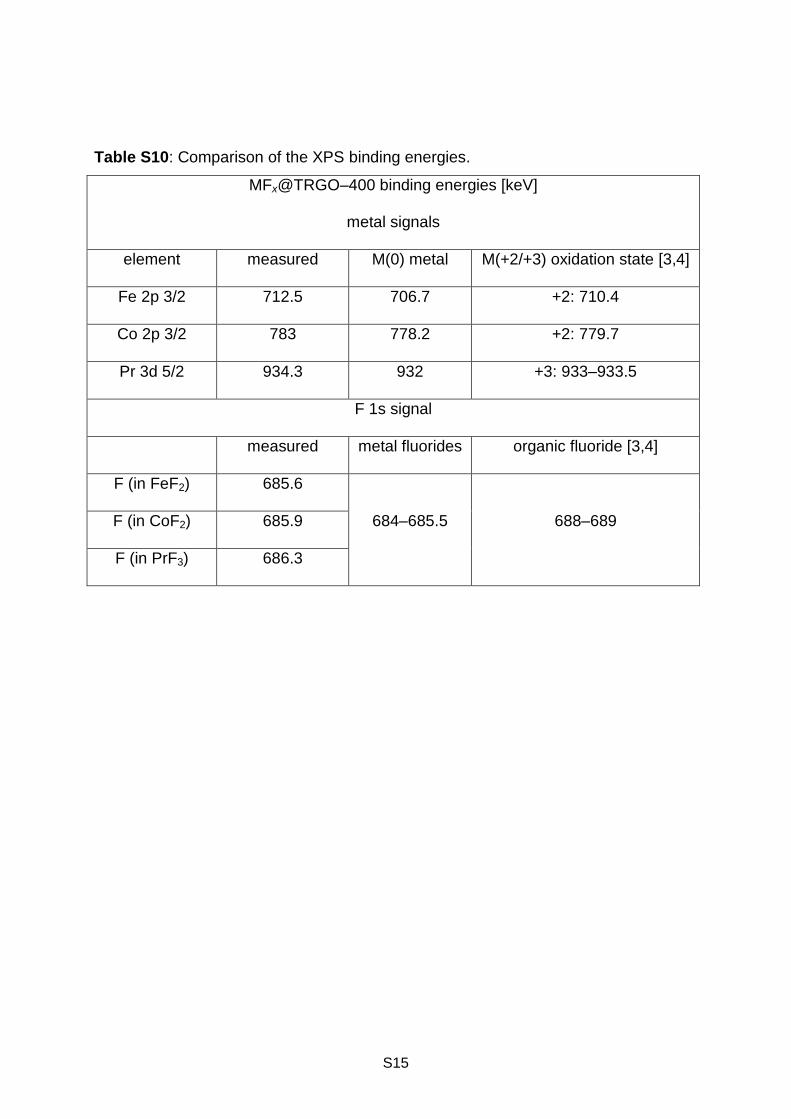
Table S10: Comparison of the XPS binding energies.
MFx@TRGO–400 binding energies [keV]
metal signals
element measured M(0) metal M(+2/+3) oxidation state [3,4]
Fe 2p 3/2 712.5 706.7 +2: 710.4
Co 2p 3/2 783 778.2 +2: 779.7
Pr 3d 5/2 934.3 932 +3: 933–933.5
F 1s signal
measured metal fluorides organic fluoride [3,4]
F (in FeF2) 685.6
684–685.5 688–689 F (in CoF2) 685.9
F (in PrF3) 686.3
S16
TRGO-750:
FeF2@TRGO-750
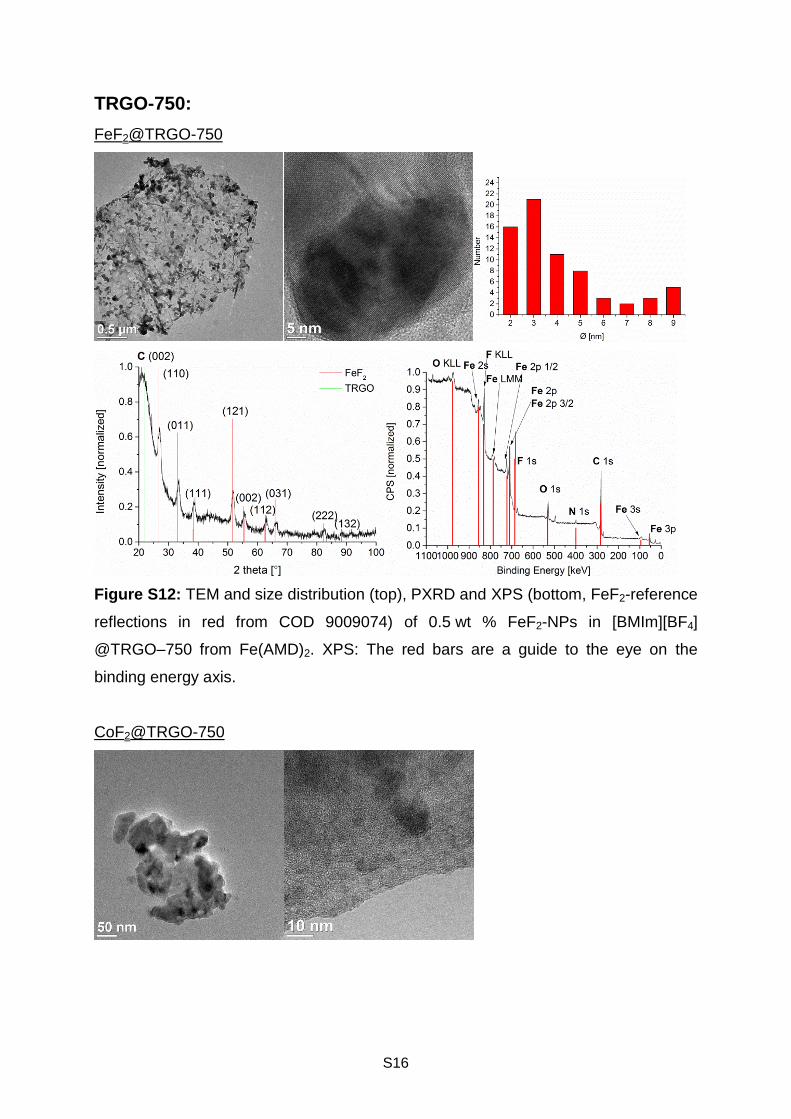
Figure S12: TEM and size distribution (top), PXRD and XPS (bottom, FeF2-reference
reflections in red from COD 9009074) of 0.5 wt % FeF2-NPs in [BMIm][BF4]
@TRGO–750 from Fe(AMD)2. XPS: The red bars are a guide to the eye on the
binding energy axis.
CoF2@TRGO-750
S17
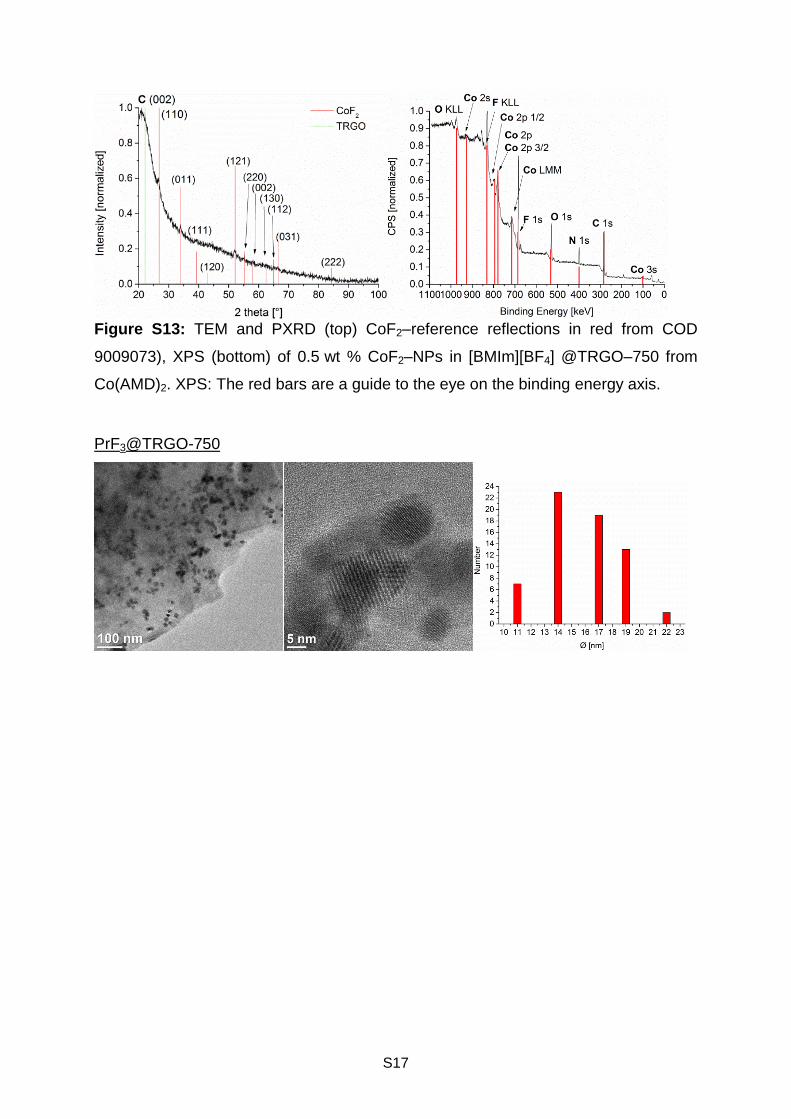
Figure S13: TEM and PXRD (top) CoF2–reference reflections in red from COD
9009073), XPS (bottom) of 0.5 wt % CoF2–NPs in [BMIm][BF4] @TRGO–750 from
Co(AMD)2. XPS: The red bars are a guide to the eye on the binding energy axis.
PrF3@TRGO-750
S18
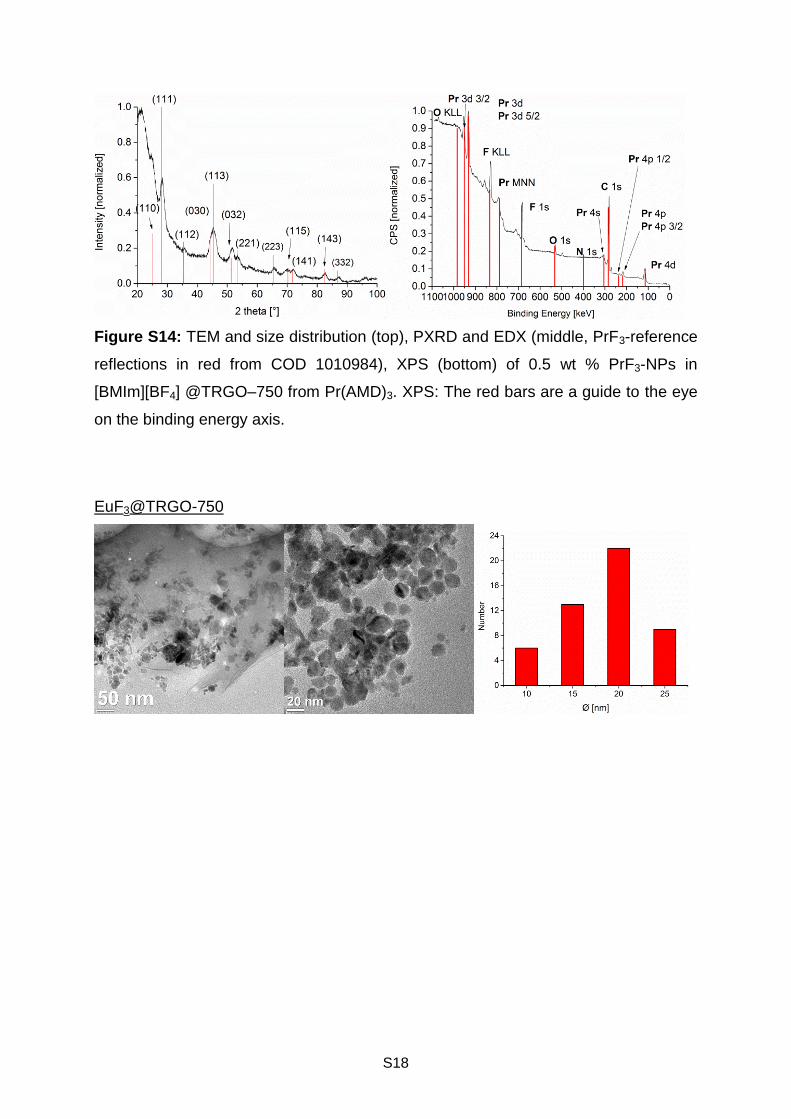
Figure S14: TEM and size distribution (top), PXRD and EDX (middle, PrF3-reference
reflections in red from COD 1010984), XPS (bottom) of 0.5 wt % PrF3-NPs in
[BMIm][BF4] @TRGO–750 from Pr(AMD)3. XPS: The red bars are a guide to the eye
on the binding energy axis.
EuF3@TRGO-750

S19
Figure S15: TEM and size distribution (top), PXRD and XPS (bottom, EuF3-
reference reflections in red from ICDD 33–0373) of 0.5 wt % EuF3-NPs in
[BMIm][BF4] @TRGO–750 from Eu(dpm)3. XPS: The red bars are a guide to the eye
on the binding energy axis.
Table S11: Comparison of the XPS binding energies.
MFx@TRGO–750 binding energies [keV]
metal signals
element measured M(0) metal M(+2/+3) oxidation state [3,4]
Fe 2p 3/2 712.6 706.7 +2: 710.4
Co 2p 3/2 781.7 778.2 +2: 779.7
Pr 3d 5/2 935.5 932 +3: 933–933.5
Eu 3d 5/2 1136.2 1126 +3: 1135
F 1s signal
measured metal fluorides organic fluorides [3,4]
F (in FeF2) 685.5
684–685.5 688–689 F (in CoF2) 685.2
F (in PrF3) 686
F (in EuF3) 685.5
S20
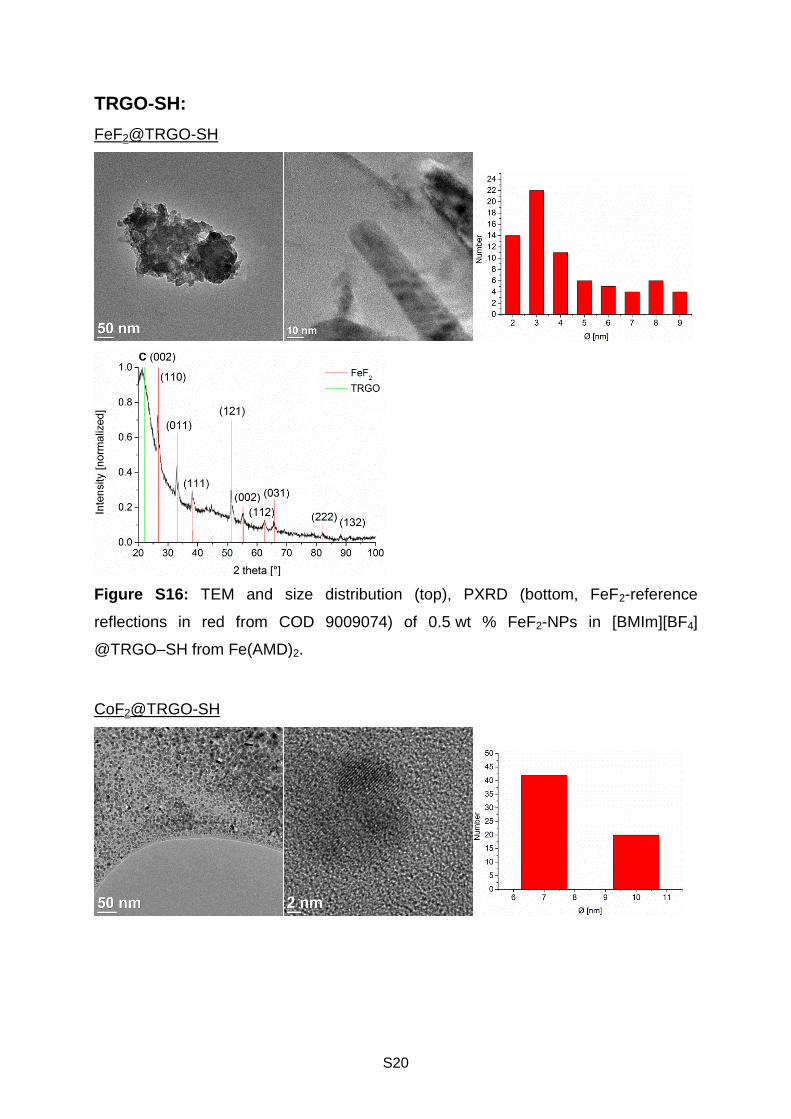
TRGO-SH:
FeF2@TRGO-SH
Figure S16: TEM and size distribution (top), PXRD (bottom, FeF2-reference
reflections in red from COD 9009074) of 0.5 wt % FeF2-NPs in [BMIm][BF4]
@TRGO–SH from Fe(AMD)2.
CoF2@TRGO-SH
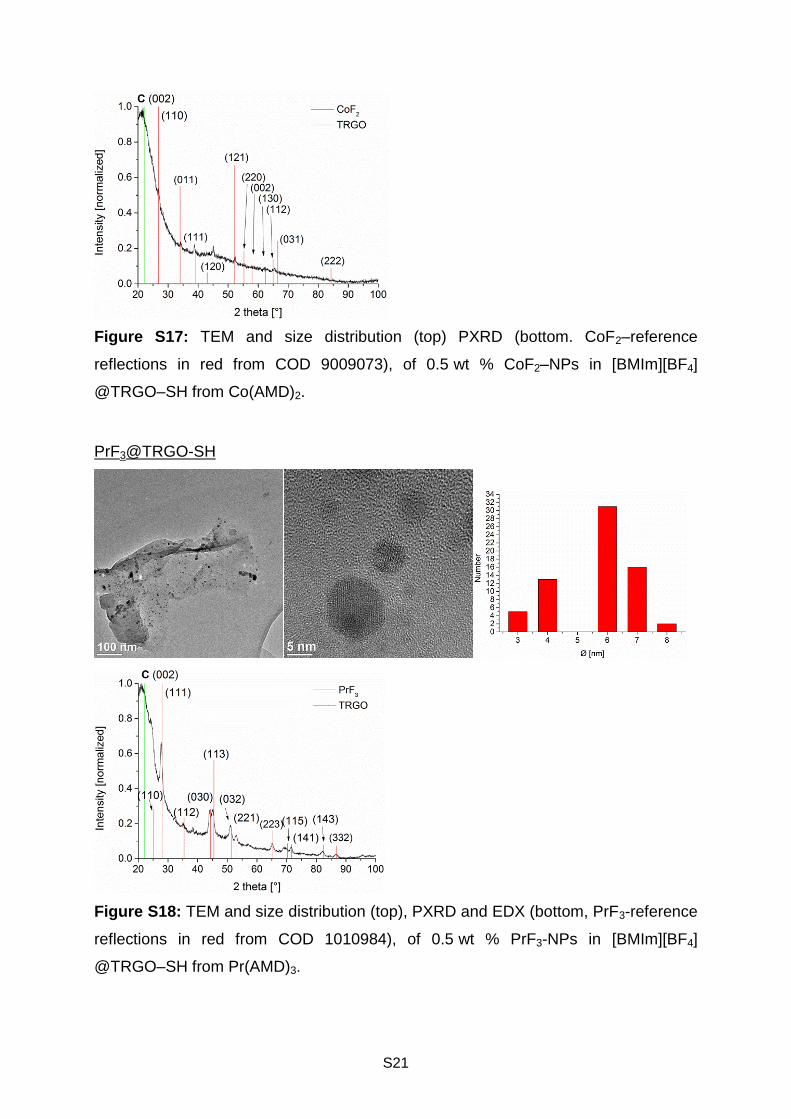
S21
Figure S17: TEM and size distribution (top) PXRD (bottom. CoF2–reference
reflections in red from COD 9009073), of 0.5 wt % CoF2–NPs in [BMIm][BF4]
@TRGO–SH from Co(AMD)2.
PrF3@TRGO-SH
Figure S18: TEM and size distribution (top), PXRD and EDX (bottom, PrF3-reference
reflections in red from COD 1010984), of 0.5 wt % PrF3-NPs in [BMIm][BF4]
@TRGO–SH from Pr(AMD)3.
S22
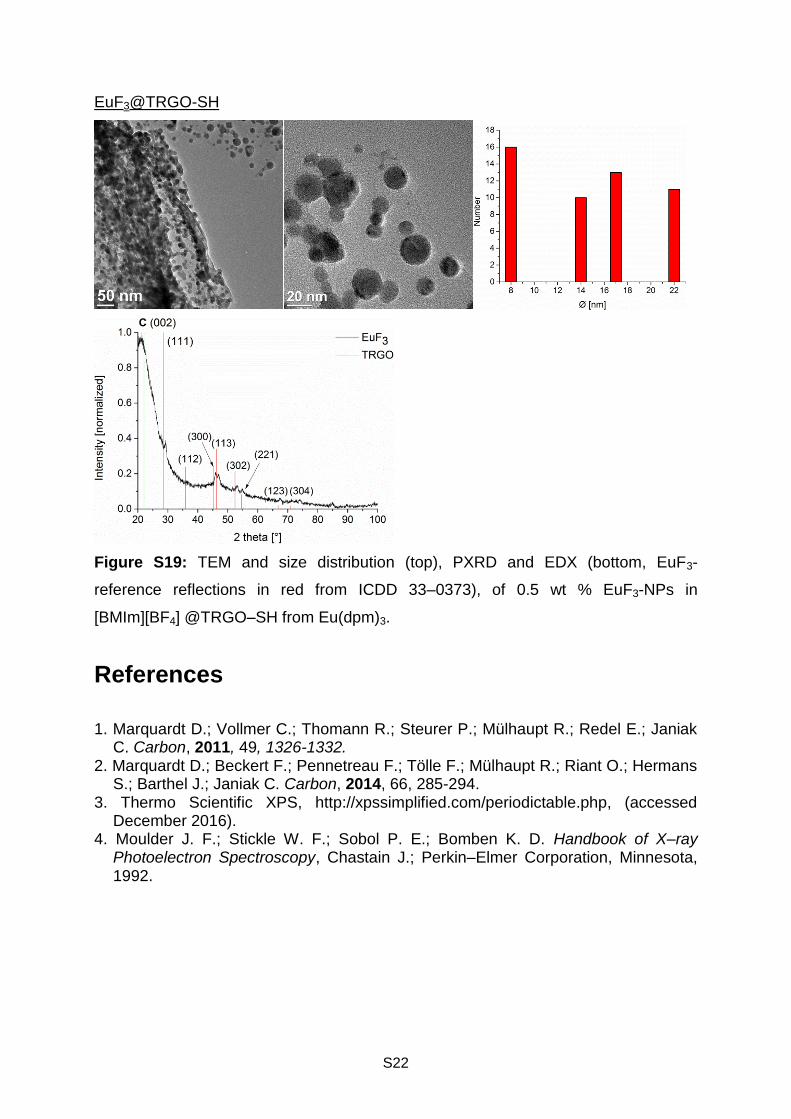
EuF3@TRGO-SH
Figure S19: TEM and size distribution (top), PXRD and EDX (bottom, EuF3-
reference reflections in red from ICDD 33–0373), of 0.5 wt % EuF3-NPs in
[BMIm][BF4] @TRGO–SH from Eu(dpm)3.
References
1. Marquardt D.; Vollmer C.; Thomann R.; Steurer P.; Mülhaupt R.; Redel E.; Janiak C. Carbon, 2011, 49, 1326-1332.
2. Marquardt D.; Beckert F.; Pennetreau F.; Tölle F.; Mülhaupt R.; Riant O.; Hermans S.; Barthel J.; Janiak C. Carbon, 2014, 66, 285-294.
3. Thermo Scientific XPS, http://xpssimplified.com/periodictable.php, (accessed December 2016).
4. Moulder J. F.; Stickle W. F.; Sobol P. E.; Bomben K. D. Handbook of X–ray Photoelectron Spectroscopy, Chastain J.; Perkin–Elmer Corporation, Minnesota, 1992.


![Magnetic nanoparticles supported ionic liquids for lipase ...sourcedb.ipe.cas.cn/zw/lwlb/200908/P020090901287922534554.pdf · nanoparticles [3–5]. The magnetite-loaded enzymes are](https://static.fdocuments.in/doc/165x107/5f36f13cb95d7d6ff46da159/magnetic-nanoparticles-supported-ionic-liquids-for-lipase-nanoparticles-3a5.jpg)