
Synthesis, characterization, photophysical studies and ... · DNA of a new family Ru (II ......
40
Synthesis, characterization, photophysical studies and interaction with DNA of a new family Ru(II) Furyl- and Thienyl-imidazo-phenanthroline polypyridyl complexes. Bruno Pedras, 1,2* Rosa M. F. Batista, 3 Laura Tormo, 4 Susana P. G. Costa, 3 M. Manuela M. Raposo, 3 * Guillermo Orellana, 4 * José Luís Capelo, 1,2 Carlos Lodeiro. 1 * 1 Grupo BIOSCOPE, Departamento de Química-Física, Facultad de Ciencias de Ourense, Universidad de Vigo, Campus de Ourense, E32004, Spain. 2 REQUIMTE, Departamento de Química, FCT-UNL, 2829-516 Caparica, Portugal. 3 Centro de Química, Universidade do Minho, Campus de Gualtar, 4710-057, Portugal 4 Departamento de Química Orgánica I, Facultad de Química, Universidad Complutense de Madrid, E-28040 Madrid, Spain *Authors to whom correspondence should be addressed. E-mail: [email protected] Fax: +351 212 948 385 (B.P.); E-mail: [email protected] Fax: +351 253 604382 (M.M.M.R.); E-mail: [email protected] Fax: +34 91 394 4103 (GO); E-mail: [email protected] Fax: + 34 988 387001 (C. L.)
-
Upload
truongtuyen -
Category
Documents
-
view
215 -
download
0
Transcript of Synthesis, characterization, photophysical studies and ... · DNA of a new family Ru (II ......

Synthesis, characterization, photophysical studies and interaction with
DNA of a new family Ru(II) Furyl- and Thienyl-imidazo-phenanthroline
polypyridyl complexes.
Bruno Pedras,1,2* Rosa M. F. Batista,3 Laura Tormo,4 Susana P. G. Costa,3
M. Manuela M. Raposo,3* Guillermo Orellana, 4* José Luís Capelo,1,2
Carlos Lodeiro.1*
1 Grupo BIOSCOPE, Departamento de Química-Física, Facultad de Ciencias de
Ourense, Universidad de Vigo, Campus de Ourense, E32004, Spain.
2REQUIMTE, Departamento de Química, FCT-UNL, 2829-516 Caparica,
Portugal.
3Centro de Química, Universidade do Minho, Campus de Gualtar, 4710-057,
Portugal
4 Departamento de Química Orgánica I, Facultad de Química, Universidad
Complutense de Madrid, E-28040 Madrid, Spain
*Authors to whom correspondence should be addressed. E-mail:
[email protected] Fax: +351 212 948 385 (B.P.); E-mail:
[email protected] Fax: +351 253 604382 (M.M.M.R.); E-mail:
[email protected] Fax: +34 91 394 4103 (GO); E-mail:
[email protected] Fax: + 34 988 387001 (C. L.)

2
Abstract
A new family of Ru(II) polypyridyl complexes (C1 to C6) containing furyl- or
thienyl-imidazo-phenanthroline ligands (4-6) were synthesized using microwave
irradiation and characterized by elemental analysis, 1H-NMR, UV-vis absorption
and fluorescence spectroscopy, FAB, EI-MS and MALDI-TOF-MS spectrometry.
On the other hand, the novel furyl- or thienyl-imidazo-phenanthroline derivatives
(5-6) were synthesized through the Radziszewski reaction and completely
characterized by the usual spectroscopic techniques. The interaction of the
complexes with calf thymus DNA in the absence and in the presence of different
quenchers (ethidium bromide, potassium hexacyanoferrate(II) and
methylviologen) has been studied by absorption spectroscopy, steady-state and
single-photon timing luminescence measurements. Their electronic spectra
show visible absorption peaks at 457-463 nm, with red luminescence at 603-
613 nm. The emission quantum yields of these complexes are between 0.006–
0.016 in air-equilibrated DMSO solution. Luminescence lifetimes in water lie
within the 0.4 to 1.0 µs range, with a non-exponential behavior due to
aggregation of the probe. Ru(II) complexes C3, C4, C5 and C6 show intrinsic
dsDNA-binding constants of 2.74 x 10⁵, 3.02 x 10⁵, 1.32 x 10⁵ and 1.63 x 10⁵ M-
1, respectively. The planar extended structure of the imidazo-phenanthroline
ligands and the collected spectroscopic data suggest a partial intercalative
binding mode of the novel metal probes to double-stranded DNA.
Keywords: Ru(II) complexes , DNA, Phenanthroline, Thiophene, Furan.

3
Introduction
Among the multiple application fields of ruthenium(II) polypyridyl complexes,1 its
interaction with nucleic acids has been one of the most thoroughly studied over
more than two decades.2 Featuring a unique set of chemical properties such as
stability, excited-state reactivity, redox potentials,3 luminescence and excited
state lifetimes, these complexes have attracted considerable attention from a
great number of researchers, finding applications in areas such as
photophysics, photochemistry, supramolecular chemistry, bioinorganic
chemistry and catalysis.
Concerning their interaction with biological structures, Ru(II)
polyazaheteroaromatic compounds have been used as probes of the
biopolymer tertiary structure, photocleavage agents and, in recent times, as
inhibitors of biological functions.4,1a One of the most extensively studied metal
complexes used as luminescent probe is [Ru(bpy)2(dppz)]2+ (bpy = 2,2’-
bipyridine, dppz = dipyrido[3,2-a:2’,3’-c]phenazine).5 This complex functions as
a molecular “light switch” for DNA because of the dramatic emission
enhancement experienced by this probe and related phenazine complexes in
the presence of double-stranded nucleic acids, being otherwise weakly
emissive in aqueous solution. The reason for this behaviour is the peculiar
electronic nature of the phenazine ligand and the lowest-lying excited state
swap that occurs in protic solvents,6 together with the intercalative binding
mode to double-stranded DNA of Ru(II)-dppz and related complexes.7 For all
ruthenium(II) polypyridyl complexes, non-radiative vibrational deactivation with
the water molecules can be minimized by a close interaction with a hydrophobic
negatively charged surface,8 and the intimate contact (e.g. DNA intercalation)

4
with the biopolymer protects the triplet excited state of the probe from the O2
quenching,9 overall leading to a substantial increase in the 3MLCT excited state
lifetime.
Very recently these complexes have been applied as multifunctional biological
agents for direct imaging of DNA in living cells.10 By varying the ligands that
constitute the complexes, it is possible to modify the nature and strength of their
binding to nucleic acids. As mentioned above, all positively charged complexes
are expected to be attracted to the anionic DNA, and those containing at least
one extended heteroaromatic ligand in the coordination sphere may insert such
ligand between adjacent base-pairs of double-stranded DNA (i.e. binding by
intercalation).2a,7,9a,11 Indeed, it has been observed that while [Ru(bpy)3]2+ binds
in a relatively weak manner to DNA (mostly through electrostatic interaction in
one of the grooves), the interaction of [Ru(phen)3]2+ is stronger.12
Therefore, in order to study the factors that influence the DNA-binding mode of
Ru(II) complexes with extended and ancillary ligands, the structural diversity of
the metal chelating structures must be taken into account. Moreover, a further
tuning of the probe photophysical and DNA binding properties might be
achieved when new extended conjugation systems are composed by different
heterocyclic nuclei (molecular meccano concept).
Following our ongoing projects on fluorescent reporters and their sensing
applications,13 we have tackled the synthesis and characterization of novel
(oligo)thienyl-14 and arylthienyl-imidazo-phenanthrolines15 due to their
interesting emissive properties (see below). Taking also into account that furans
exhibit high fluorescence quantum yields16 and the recent studies concerning
the DNA binding and photocleavage of Ru(II) complexes of a 2-(5-methyl-furan-

5
2-yl)imidazo[4,5-f][1,10]phenanthroline ligand,17 suggesting that these
complexes bind to DNA through intercalation and, when irradiated at 400 nm,
promote the photocleavage of the DNA, we set out to synthesize Ru(II) furyl-
imidazo-phenanthroline complexes that were hitherto unknown.
In this way, four new ligands and six Ru(II) polypyridyl complexes, C1 to C6, are
photophysically characterized in this work, and the interaction of the latter with
calf-thymus DNA has been followed by steady-state and single-photon timing
luminescence measurements. The effect of three different quenchers on the
emission properties of the DNA-bound complexes has also been studied, in an
attempt to reveal the possible binding modes of the complexes to the nucleic
acid.18
Experimental Section
Materials. All reagents used in the present work were commercially available
and used without further purification, unless otherwise stated. Progress of the
reactions was monitored by thin layer chromatography (0.25 mm thick pre-
coated Merck Fertigplatten Kieselgel 60F254 silica plates), while purification was
carried out by silica gel column chromatography (Merck Kieselgel 60; 230-400
mesh). Calf thymus DNA was obtained from Pharmacia GE Healthcare and
purified by extensive dialysis against TRIS buffer. The concentration of stock
solutions was determined spectrophotometrically using the molar absorption
coefficient per base pair (12800 M-1 cm-1) at 258 nm9a and found to be 2.82 mM
(for the stock solution used with C1 to C3) and 2.02 mM (for the stock solution
used with C4 to C6) in base pairs. All the experiments with DNA were carried
out in pH-7.0 3-mM Tris buffer.

6
Instrumentation. NMR spectra of the ligands were obtained on a Varian Unity
Plus spectrometer at 300 MHz for 1H NMR and 75.4 MHz for 13C NMR or a
Bruker Avance III 400 at 400 MHz for 1H NMR and 100 MHz for 13C NMR, using
the solvent residual peak as internal reference. The solvents are indicated in
parenthesis before the chemical shift values (δ in ppm relative to TMS). NMR
spectra of the complexes were recorded on a Bruker AVANCE II at 400 MHz for
1H NMR, and processed with the TOPSPIN 2.0 software (Bruker). Melting
points were determined on a Gallenkamp apparatus and are uncorrected.
Infrared spectra were recorded on a BOMEM MB 104 spectrophotometer. UV-
vis absorption spectra of the ligands (200–800 nm) were measured with a
Shimadzu UV/2501PC apparatus and those of the complexes on a Varian Cary
3Bio spectrophotometer.
Mass spectrometry analyses of the ligands were performed at the C.A.C.T.I. -
Unidad de Espectrometria de Masas of the University of Vigo, Spain. MALDI-
TOF-MS spectra have been performed in a MALDI-TOF-MS model Voyager
DE-PRO Biospectrometry Workstation equipped with a nitrogen laser radiating
at 337 nm from Applied Biosystems (Foster City, United States) from the
MALDI-TOF-MS Service of the REQUIMTE, Chemistry Department,
Universidade Nova de Lisboa and in the MALDI-TOF-MS-MS model 4700
Applied Biosystems at the Faculty of Science of Ourense, University of Vigo.
The acceleration voltage was 2.0 x 10⁴ kV with a delayed extraction (DE) time
of 200 ns. The spectra represent accumulations of 5 x 100 laser shots. The
reflection mode was used. The ion source and flight tube pressures were less
than 1.80 x 10⁻⁷ and 5.60 x 10⁻⁸ Torr, respectively.

7
The MALDI mass spectra of the soluble compounds (1 or 2 µg/µL) were
recorded using the conventional sample preparation method for MALDI-MS
without other MALDI matrix.
Elemental analyses were performed at the Analytical Services of the Laboratory
of REQUIMTE-Departamento de Química, Universidade Nova de Lisboa, on a
Thermo Finnigan-CE Flash-EA 1112-CHNS Instrument.
The steady-state luminescence measurements were carried out with a Perkin-
Elmer LS-5 spectrofluorometer. Luminescence lifetimes were determined at 25
± 1 ºC using ca. 10-5 M solutions of the Ru(II) complexes by the single-photon
timing (SPT) technique with an Edinburgh Analytical Instruments LP900 kinetic
spectrometer. Excitation of the samples was carried out with a Horiba
NanoLED-07N 405-nm pulsed laser diode (<700 ps). A wide band-pass 405-nm
interference filter (Edmund Scientific) was placed in front of the laser source
and cut-off filters (590 nm, Lambda Research Optics) were used in the emission
path to avoid distortions from the laser light scattering. The luminescence decay
profiles were fit either to a single exponential function or to a sum of 2-3
exponential functions with the original Marquardt algorithm-based EAI decay
analysis software. Satisfactory fits were obtained in all cases, as judged from
the weighted residuals, the goodness-of-the-fit 2 parameter and the
autocorrelation function. No oxygen outgassing was performed. The accuracy in
the measured lifetimes for the multi-exponential decay fits is estimated to be
±3% (1% for the single-exponential decays) and 10% for the relative weights.
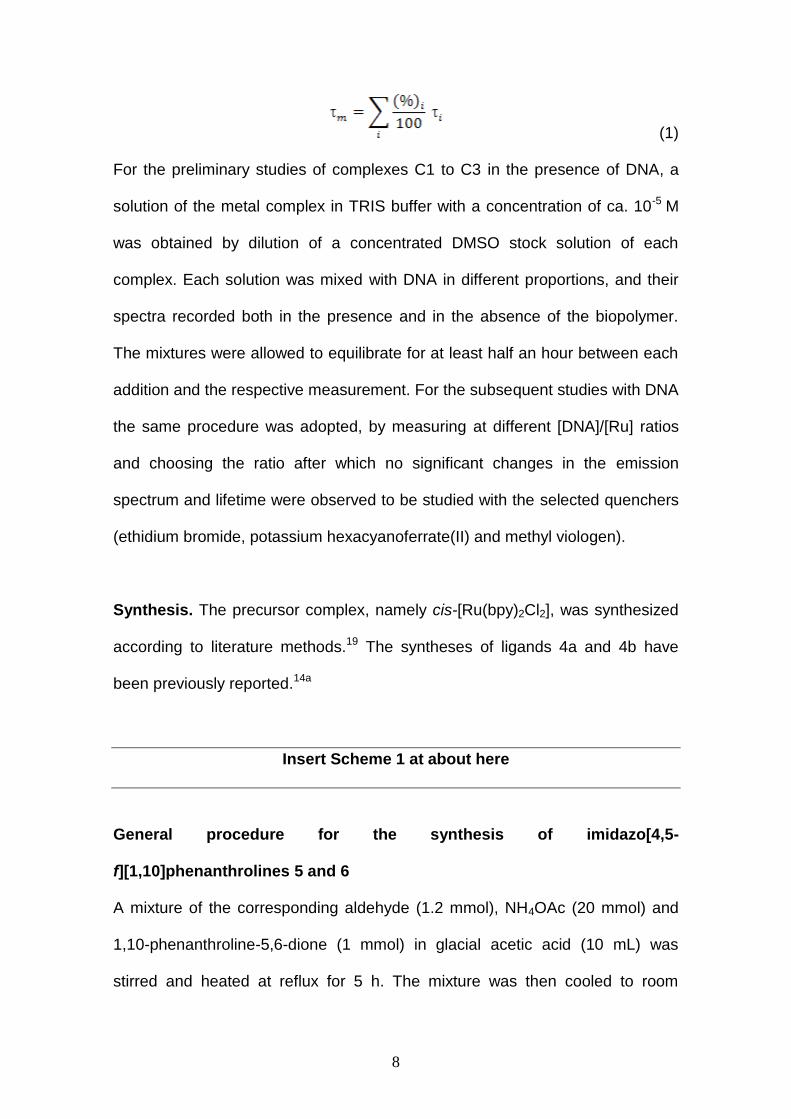
The pre-exponential weighted emission lifetime (m) is defined according to Eq.
1, where i is the emission lifetime for each component of the multi-exponential
fit whose relative weight is (%)i.
8
(1)
For the preliminary studies of complexes C1 to C3 in the presence of DNA, a
solution of the metal complex in TRIS buffer with a concentration of ca. 10-5 M
was obtained by dilution of a concentrated DMSO stock solution of each
complex. Each solution was mixed with DNA in different proportions, and their
spectra recorded both in the presence and in the absence of the biopolymer.
The mixtures were allowed to equilibrate for at least half an hour between each
addition and the respective measurement. For the subsequent studies with DNA
the same procedure was adopted, by measuring at different [DNA]/[Ru] ratios
and choosing the ratio after which no significant changes in the emission
spectrum and lifetime were observed to be studied with the selected quenchers
(ethidium bromide, potassium hexacyanoferrate(II) and methyl viologen).
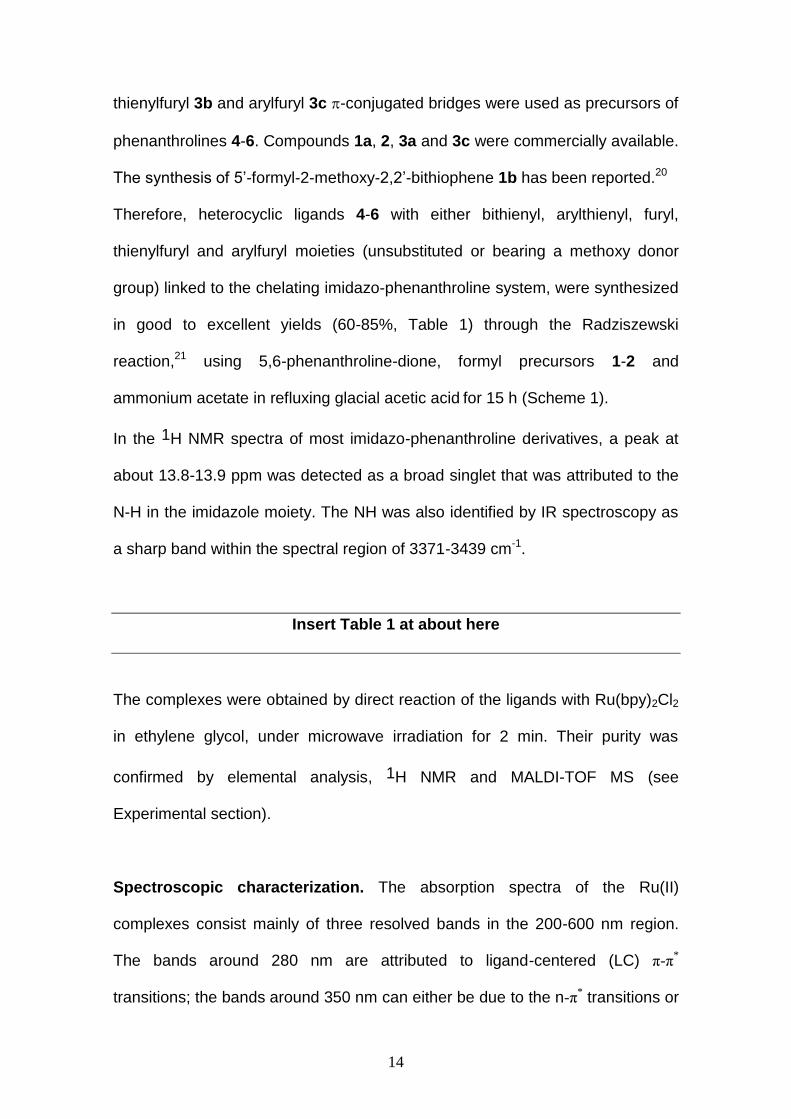
Synthesis. The precursor complex, namely cis-[Ru(bpy)2Cl2], was synthesized
according to literature methods.19 The syntheses of ligands 4a and 4b have
been previously reported.14a
Insert Scheme 1 at about here
General procedure for the synthesis of imidazo[4,5-
f][1,10]phenanthrolines 5 and 6
A mixture of the corresponding aldehyde (1.2 mmol), NH4OAc (20 mmol) and
1,10-phenanthroline-5,6-dione (1 mmol) in glacial acetic acid (10 mL) was
stirred and heated at reflux for 5 h. The mixture was then cooled to room

9
temperature and the product precipitated during neutralization with NH4OH 5 M.
The precipitate was filtered out, washed with water and diethyl ether,
recrystallized from absolute ethanol and dried under vacuum to give the
expected product.
2-(4’-(thien-2’’-yl)phen-2’-yl)-1H-imidazo[4,5-f][1,10]phenanthroline (5).
Yellow solid (0.139 g, 82%). 1H NMR (300 MHz, DMSO-d6): 7.18-7.21 (m, 1H,
4´´-H), 7.62 (d, 1H, J= 5.1 Hz, 3´´-H), 7.66 (d, 1H, J= 3.6 Hz, 5´´-H), 7.81-7.85
(m, 2H, 5-H and 10-H), 7.90 (d, 2H, J= 8.7 Hz, 2´-H and 6´-H), 8.31 (d, 2H, J=
8.4 Hz, 3´-H and 5´-H), 8.92 (dd, 2H, J= 8.1 and 1.5 Hz, 4-H and 11-H), 9.03
(dd, 2H, J= 4.5 and 1.8 Hz, 6-H and 9-H), 13.79 (s, 1H, NH) ppm. 13C NMR
(75.4 MHz, DMSO-d6): 123.4, 124.5, 125.8, 126.5, 126.9, 128.7, 128.8, 129.8,
134.7, 135.9, 142.6, 146.4, 147.8, 150.1 ppm. MS (FAB): m/z (%) 379 ([M+H]+,
100). HRMS (FAB): m/z calcd. for C23H15N4S 379.1017; found 379.1015. IR
(KBr, /cm-1): 3439, 2950, 1605, 1562, 1531, 1479, 1451, 1429, 1395, 1351,
1312, 1296, 1259, 1212, 1190, 1119, 1069, 1029, 957, 844, 803, 740.
Decomposition at T > 320 ºC. UV (ethanol, nm): λmax (log ) = 345 (4.16).
2-(furan-2’-yl)-1H-imidazo[4,5-f][1,10]phenanthroline (6a). The compound
was isolated as an orange solid (0.114 g, 85%). 1H NMR (300 MHz, DMSO-d6):
δ 6.76-6.79 (m, 1H, 4’-H), 7.25 (d, 1H, J = 3.0 Hz, 3’-H), 7.78-7.82 (m, 2H, 5-H
+ 10-H), 7.99 (d, 1H, J = 1.2 Hz, 5’-H), 8.90 (d, 2H, J = 7.8 Hz, 4-H + 11-H),
9.02 (d, 2H, J = 1.8 Hz, 6-H + 9-H), 13.93 (br s, 1H, NH) ppm. 13C NMR (75.4
MHz, DMSO-d6): 109.9, 112.5, 123.3, 129.6, 143.0, 143.6, 144.4, 145.4,
147.9 ppm. MS (FAB): m/z (%) 287 ([M+H]+, 100), 226 (5). HRMS (FAB): m/z

10
calcd. for C17H11N4O 287.09389; found 287.09274. IR (Nujol, /cm-1): 3396,
2923, 2853, 1644, 1565, 1538, 1507, 1463, 1397, 1377, 1350, 1228, 1191,
1116, 1073, 1017, 976, 897, 885, 807, 739. Mp = 122.3–124.5 ºC. UV/Vis
(ethanol, nm): λmax (log ) = 318 (4.14).
2-(5’-(thien-2’’-yl)furan-2’-yl)-1H-imidazo[4,5-f][1,10]phenanthroline (6b).
The compound was isolated as a dark yellow solid (0.110 g, 79 %). 1H NMR
(400 MHz, DMSO-d6): δ 7.03 (d, 1H, J = 3.6 Hz, 3’-H), 7.20-7.22 (m, 1H, 4’’-H),
7.33 (d, 1H, J = 4.0 Hz, 4’-H), 7.60 (dd, 1H, J = 3.6 and 1.2 Hz, 3’’-H), 7.66 (dd,
1H, J = 5.2 and 0.8 Hz, 5’’-H), 7.79-7.86 (m, 2H, 5-H + 10-H), 8.89-8.94 (m, 2H,
4-H + 11-H), 9.03 (dd, 2H, J = 4.0 and 2.0 Hz, 6-H + 9-H), 13.89 (s, 1H, NH)
ppm. 13C NMR (100.6 MHz, DMSO-d6): 108.0, 112.3, 119.2, 123.1, 123.4,
123.5, 124.4, 125.9, 126.4, 128.3, 129.7, 131.9, 135.8, 142.5, 143.6, 143.7,
144.3, 147.9, 147.9, 149.8 ppm. MS (FAB): m/z (%) 369 ([M+H]+, 100), 226 (4).
HRMS (FAB): m/z calcd. for C21H12N4OS 369.08048; found 369.08046. IR
(Liquid film, /cm-1): 3436, 1567, 1498, 1444, 1421, 1265, 1072, 1017, 896,
738, 704. Mp = 241.0-242.2 ºC. UV/Vis (ethanol, nm): λmax (log ) = 364 (4.20).
2-(5’-phenylfuran-2’-yl)-1H-imidazo[4,5-f][1,10]phenanthroline (6c). The
compound was isolated as a yellow solid (0.061 g, 60 %). 1H NMR (400 MHz,
DMSO-d6): δ 7.23 (d, 1H, J = 3.6 Hz, 3’-H), 7.34-7.38 (m, 2H, 4’’-H + 4’-H), 7.49
(t, 2H, J = 8.0 and 7.6 Hz, 3’’-H + 5’’-H), 7.80-7.83 (m, 2H, 5-H + 10-H), 7.91 (d,
2H, J = 7.6 Hz, 2’’-H + 6’’-H), 8.93 (dd, 2H, J = 8.4 and 1.6 Hz, 4-H + 11-H),
9.02 (dd, 2H, J = 6.0 and 1.6 Hz, 6-H + 9-H) ppm. 13C NMR (100.6 MHz,
DMSO-d6): 108.4, 111.9, 121.6, 123.3, 123.9, 128.1, 128.9, 131.3, 131.3,

11
143.2, 143.6, 145.3, 147.8, 153.9 ppm. MS (FAB): m/z (%) 363 ([M+H]+, 100).
HRMS (FAB): m/z calcd. for C23H15N4O 363.12380; found 363.12404. IR (Nujol,
/cm-1): 3371, 2911, 2853, 1619, 1565, 1490, 1397, 1299, 1277, 1190, 1150,
1124, 1073, 1027, 924, 803, 758, 688. Mp = 243.4-244.9. UV/Vis (ethanol, nm):
λmax (log ) = 353 (4.48).
Synthesis of the Ru(II) Complexes. In 5 mL of ethylene glycol, the
corresponding quantity of imidazo-phenanthroline ligand and the Ru(bpy)2Cl2
complex were dissolved. The mixture was heated in a Milestone microwave
oven (450 W) for 30 s, which led to a color change from violet to deep orange,
and then allowed to cool for a while. The mixture was heated for three more
periods of 30 s. The solvent was removed by distillation at low pressure, the
residue was dissolved in 2 mL of water, and a saturated NH4PF6 aqueous
solution was added. The precipitate formed was then filtered through a frit,
washed with water (3 x 10 mL) and diethyl ether (3 x 10 mL), and dried under
vacuum.
C1: 30.2 mg (7.85 x 10⁻⁵ mol) of 4a and 42.7 mg (8.2 x 10⁻⁵ mol) of Ru(bpy)2Cl2
were used. Colour: Deep orange. Yield: 73.9 mg (87%). Anal. Calcd for
C41H28F12N8P2RuS2: C, 45.30; H, 2.60; N, 10.30; S, 5.90. Found: C, 45.40; H,
2.80; N, 10.05; S, 5.85. 1H NMR (CD3CN): δ = 8.69 (s, 1H); 8.56 (t, 4H); 8.36 (d,
2H); 8.11 (m, 4H); 7.85 (m, 7H); 7.47 (m, 7H); 7.13 (m, 3H) ppm. FD-MS: m/z
943.06 ([M-PF6]+), 797.08 ([M-2PF6-H]+), 399.04 ([M-2PF6]
2+). ESI-MS: m/z
943.2 ([M-PF6]+), 797.2 ([M-2PF6-H]+), 399.1 ([M-2PF6]
2+). MALDI-TOF MS: m/z
797.6 ([M-2PF6-H]+), 641.6 ([M-2PF6-bpy-H]+).

12
C2: 24.3 mg (5.85 x 10⁻⁵ mol) of 4b and 32.0 mg (6.15 x 10⁻⁵ mol) of
Ru(bpy)2Cl2 were used. A few drops of ethanol were added in order to increase
solubilization of the ligand. Colour: Deep orange. Yield: 29.3 mg (45%). Anal.
Calcd for C42H30F12N8OP2RuS2·1.5C2H5OH: C, 45.55; H, 3.30; N, 9.45; S, 5.40.
Found: C, 45.88; H, 3.40; N, 9.70; S, 5.85. 1H NMR (CD3CN): δ = 8.80 (d, 2H);
8.53 (m, 4H); 8.10 (t, 2H); 7.99 (t, 2H); 7.87 (m, 4H); 7.66 (d, 3H); 7.56 (m, 2H);
7.44 (t, 2H); 7.25 (t, 2H); 7.02 (d, 1H); 6.91 (d, 1H); 6.24 (d, 1H); 3.92 (s, 3H)
ppm. FD-MS: m/z 973.03 ([M-PF6]+), 827.07 ([M-2PF6-H]+). ESI-MS: m/z 973.2
([M-PF6]+), 827.2 ([M-2PF6-H]+), 414.1 ([M-Ru(bpy)2(PF6)2]˙. MALDI-TOF MS:
m/z 827.6 ([M-2PF6-H]+).
C3: 30.5 mg (8.06 x 10⁻⁵ mol) of 5 and 44.1 mg (8.47 x10⁻⁵ mol) of Ru(bpy)2Cl2
were used. Colour: Deep orange. Yield: 26.3 mg (30%). Anal. Calcd for
C43H30F12N8P2RuS·6H2O: C, 43.40; H, 3.55; N, 9.40; S, 2.70. Found: C, 43.35;
H, 3.25; N, 9.40; S, 2.55. 1H NMR ((CD3)2CO): δ = 9.21 (d, 2H); 8.89 (dd, 4H);
8.50 (d, 2H); 8.31 (m, 4H); 8.20 (m, 4H); 7.99 (d, 2H); 7.91 (dd, 2H); 7.83 (d,
2H); 7.66 (m, 3H); 7.55 (d, 1H); 7.42 (t, 2H); 7.20 (m, 1H) ppm. FD-MS: m/z
790.82 ([M-2PF6-H]+). ESI-MS: m/z 937.3 ([M-PF6]+), 791.3 ([M-2PF6-H]+),
396.1 ([M-Ru(bpy)2(PF6)2]˙). MALDI-TOF-MS: m/z 791.28 ([M-2PF6-H]+).
C4: 27.2 mg (7.99 x 10⁻⁵ mol) of 6a and 44 mg (8.39 x 10⁻⁵ mol) of Ru(bpy)2Cl2
were used. An orange solid was obtained. Yield: 72.2 mg (91%). Anal. Calcd for
C37H26F12N8OP2Ru: C, 44.90; H, 2.65; N, 11.30. Found: C, 44.35; H, 2.85; N,
11.30. 1H NMR ((CD3)2CO): δ = 9.07 (d, 2H); 8.86 (dd, 4H); 8.35 (m, 2H); 8.25

13
(t, 3H); 8.16 (m, 4H); 7.91 (m, 4H); 7.64 (m, 2H); 7.40 (m, 2H); 7.33 (s, 1H);
6.76 (s, 1H) ppm. MALDI-TOF-MS: m/z 699.73 ([M-2PF6-H]+), 543.71 ([M-2PF6-
bpy-H]+)
C5: 25 mg (6.18 x 10⁻⁵ mol) of 6b and 33.8 mg (6.49 x 10⁻⁵ mol) of Ru(bpy)2Cl2
were used. An orange solid was obtained. Yield: 60.0 mg (91%). Anal. Calcd for
C41H28F12N8OP2RuS: C, 45.95; H, 2.65; N, 10.45; S, 3.00. Found: C, 45.90; H,
2.65; N, 10.60; S, 2.60. 1H NMR ((CD3)2CO): δ = 8.82 (m, 5H); 8.40 (m, 1H);
8.23-8.16 (m, 8H); 7.96 (m, 2H); 7.64-7.40 (m, 8H); 7.15 (s, 1H); 6.95 (s, 1H)
ppm. MALDI-TOF-MS: m/z 781.79 ([M-2PF6-H]+), 625.73 ([M-2PF6-bpy-H]+),
368.73 ([M-Ru(bpy)2(PF6)2]˙
C6: 23.5 mg (5.64E-05 mol) of 6c and 30.8 mg (5.93E-05 mol) of Ru(bpy)2Cl2
were used. An orange solid was obtained. Yield: 57.8 mg (96%). Anal. Calcd for
C43H30F12N8OP2Ru: C, 48.45; H, 2.85; N, 10.50. Found: C, 48.35; H, 3.00; N,
9.90. 1H NMR ((CD3)2CO): δ = 8.83 (m, 5H); 8.40 (m, 1H); 8.25-8.16 (m, 8H);
8.02 (m, 3H); 7.79 (s, 3H); 7.72 (s, 2H); 7.45-7.38 (m, 5H); 7.12 (s, 1H) ppm.
MALDI-TOF-MS: m/z 775.65 ([M-2PF6-H]+), 619.62 ([M-2PF6-bpy-H]+), 463.57
([M-(bpy)2-2PF6-H]+), 362.67 ([M-Ru(bpy)2(PF6)2]˙)
Insert Scheme 2 at about here
Results and Discussion
Synthesis. In order to compare the effect of the electronic nature of aryl and
heteroaryl moieties on the optical properties of linear imidazo-phenanthrolines
4-6, formyl- derivatives containing bithienyl 1a-b, arylthienyl 2, furyl 3a,
14
thienylfuryl 3b and arylfuryl 3c -conjugated bridges were used as precursors of
phenanthrolines 4-6. Compounds 1a, 2, 3a and 3c were commercially available.
The synthesis of 5’-formyl-2-methoxy-2,2’-bithiophene 1b has been reported.20
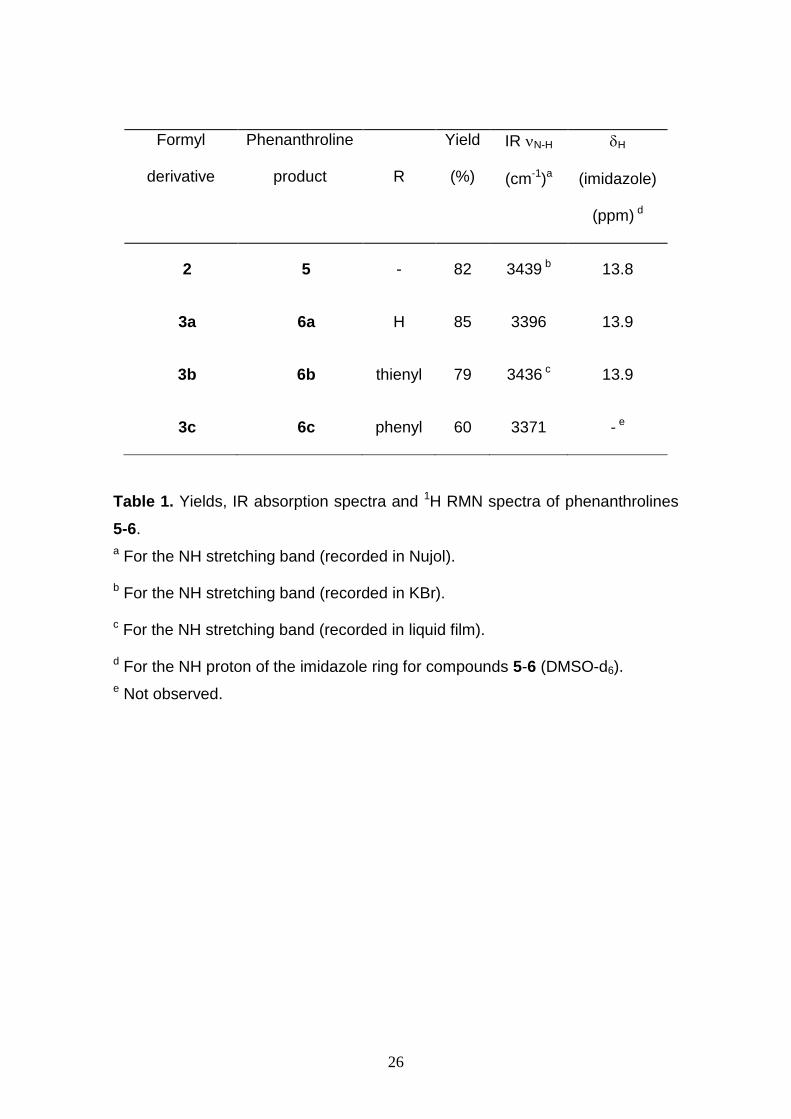
Therefore, heterocyclic ligands 4-6 with either bithienyl, arylthienyl, furyl,
thienylfuryl and arylfuryl moieties (unsubstituted or bearing a methoxy donor
group) linked to the chelating imidazo-phenanthroline system, were synthesized
in good to excellent yields (60-85%, Table 1) through the Radziszewski
reaction,21 using 5,6-phenanthroline-dione, formyl precursors 1-2 and
ammonium acetate in refluxing glacial acetic acid for 15 h (Scheme 1).
In the 1H NMR spectra of most imidazo-phenanthroline derivatives, a peak at
about 13.8-13.9 ppm was detected as a broad singlet that was attributed to the
N-H in the imidazole moiety. The NH was also identified by IR spectroscopy as
a sharp band within the spectral region of 3371-3439 cm-1.
Insert Table 1 at about here
The complexes were obtained by direct reaction of the ligands with Ru(bpy)2Cl2
in ethylene glycol, under microwave irradiation for 2 min. Their purity was
confirmed by elemental analysis, 1H NMR and MALDI-TOF MS (see
Experimental section).
Spectroscopic characterization. The absorption spectra of the Ru(II)
complexes consist mainly of three resolved bands in the 200-600 nm region.
The bands around 280 nm are attributed to ligand-centered (LC) π-π*
transitions; the bands around 350 nm can either be due to the n-π* transitions or

15
inter-ligand π-π* transitions, and the lowest energy bands at around 460 nm are
assigned to the metal-to-ligand charge transfer (MLCT) transitions. The
emission spectra are all centered above 600 nm according to what is expected
for Ru(II) polypyridyl complexes (see Figures S1 and S2, Supplementary
material). Table 2 summarizes all the spectroscopic data.
Insert Table 2 at about here
Interaction of Ru(II) complexes with DNA. Electronic absorption spectroscopy
is a very useful technique in DNA-binding studies, since binding to double
stranded (ds) DNA through intercalation normally results in hypochromism and
bathochromism of the MLCT visible absorption band of the complex.22 The
extent of the hypochromism usually parallels the intercalative binding strength.22
On the other hand, luminescence studies usually show the enhancement of
both the luminescence intensity and lifetime of the Ru(II) complexes upon
binding to the DNA. This indicates that the complexes can interact with DNA
and are protected by this polynucleotide to some extent from quenching by
molecular oxygen and the solvent molecules. Emission quenching experiments
may provide further information, since the Stern-Volmer quenching constants
can be used as a measure of the binding affinity.
In this way, preliminary studies were performed with complexes C1, C2 and C3
to compare the interaction of these complexes with DNA in a qualitative way. All
the preliminary results obtained with C1 to C3 in the presence of DNA are
reported in the Supplementary material.

16
The interaction of the stronger emissive C3 to C6 complexes was studied
quantitatively; Figure 1 shows in more detail the spectroscopic study of complex
C3 bearing a thienyl-aryl substituent in the presence of increasing amounts of
DNA. Figure 1A indicates that there is a hypochromicity in the MLCT band upon
addition of DNA, suggesting the intercalation of C3 into the double DNA helix.
At the same time the emission intensity (Figure 1B) and lifetime (Table T1 in
Supplementary Material) of the bound luminophore are enhanced due to a
combination of a more hydrophobic microenvironment around the metal
complex after binding (the O-H oscillators help to deactivate the emissive
3MLCT state)8 and the protection from quenching by dissolved molecular
oxygen imparted by the polynucleotide strand. Inset in Figure 1B shows the
increases observed both in the steady state spectra and in the luminescence
lifetime in the presence of DNA.
Insert Figure 1 at about here
A similar behavior was found for the other imidazo-phenanthroline complexes,
as can be seen for complex C5 in Figure 2 and Table T2 in Supplementary
Material. All the results for the remaining complexes are reported in Figures S3
to S6, and Tables T3 and T4, Supplementary Material.
Insert Figure 2 at about here
The intrinsic DNA binding constants (Kb), which provide a measure of the
interaction strength, were obtained by monitoring the changes in absorbance at
460 nm with increasing concentrations of DNA. The experimental data were fit

17
to the simple Scatchard eq (2),23 that is only valid for low binder-to-DNA ratios
(i.e., far from the DNA saturation) and assumes no binding cooperativity:
[DNA]/(εa- εf) = [DNA]/(εb- εf) + 1/[Kb(εb- εf)] (2)
where [DNA] is the concentration of the nucleic acid in base pairs, εa is the
apparent absorption coefficient obtained by calculating Aobs/[Ru], and εf and εb
are the absorption coefficients for the free and the fully bound ruthenium
complex, respectively.
In the [DNA]/(εa- εf) vs. [DNA] plot, Kb is given by the ratio of the slope to the
intercept. The binding constants obtained thereof for complexes C3, C4, C5 and
C6 were, respectively, 2.7 x 10⁵, 3.0 x 10⁵, 1.3 x 10⁵ and 1.6 x 10⁵ M-1 (see
Figures S7 to S10, Supplementary Material). These values are larger than
those of the DNA (minor) groove binding Ru(II) complexes such as tris(1,10-
phenanthroline)ruthenium(II) and related structures (1.1 x 10⁴ – 4.8 x 10⁴ M-
1),23,24,25 but smaller than those observed for the [Ru(bpy)2(dppz)]2+ DNA
intercalator and other complexes containing an extended phenazine ligand (107
to 109 M-1).4c This result would indicate a more intimate binding of the imidazo-
phenanthroline complex to the polynucleotide double strand than that of the
simple tris-phenanthroline complex although not as efficient as those bearing a
fused polycyclic (hetero)aromatic system that can be inserted between adjacent
base pairs of the DNA ladder.
It is interesting to note that the MLCT absorption band of complexes C4-C6
centered at ca. 455 nm undergoes a more pronounced hypochromic effect upon
binding to ds-DNA than the MLCT band at ca. 430 nm. This observation would
indicate that the former corresponds to the electronic transition involving the
chelating ligand that interacts more closely with the polynucleotide base-pair

18
strand, presumably the intercalated 6a-c imidazo-phenanthrolines (the small
bpy ligands are unable to intercalate into the double helix26). Surprisingly
enough, the same difference is not observed for the Ru(II) complex C3 that
contains the imidazo-phenanthroline 5. In the absence of molecular modeling
studies, we can hypothesize that the crescent-shaped ligands 6a-c intercalate
more efficiently than the long, linear, twisted phenyl-substituted imidazo-
phenanthroline 5.
Except for C3, the emission profile of the luminophoric complexes in buffer
solution can only be fit to a double exponential function (Tables T1 to T4,
Supplementary Material). This fact may be attributed to aggregation of the
hydrophobic dyes; the observation of just two components is a consequence of
the strong fitting power of the bi-exponential function which does not require
introduction of additional components. However, a variety of self-aggregates
displaying different stoichiometries is to be expected, the emission lifetime of
which cannot be fully resolved. In the presence of just a 5-fold (molar)
concentration of DNA the luminescence decay slows down for the same
reasons outlined above for the emission intensity and, although the individual
lifetimes of the observed components remain almost the same for higher DNA
concentrations, m increases as a consequence of the rise of the contribution of
the long lifetime component to the overall decay (except for C3 where the
individual components remain unchanged). These results indicate that the
Ru(II) complexes in buffer solution are already fully bound to the DNA under the
used experimental conditions even at a [DNA]bp/Ru ratio as low as 5. Further
addition of the polynucleotide would just make the luminescent probes shift their
binding mode, e.g. from aggregated on the double helix to individually bound,

19
as they become “diluted” with larger amounts of DNA. The longest emission
lifetime would correspond to the isolated Ru(II) complexes while the shortest
one is the signature of the aggregates. The lack of change in the relative
contribution of the short and long lifetimes in the case of the DNA-bound
complex C3, and the preeminence of the fast component of the decay even at
large [DNA]bp/Ru ratios might be a consequence of its different interaction mode
with the polynucleotide (see above) and a more difficult self-aggregation (unlike
the other imidazo-phenanthroline complexes, a single-exponential decay is
observed for the photoexcited C3 in the absence of DNA).
Emission quenching studies. After having studied the interaction of all the
complexes with DNA, it was observed that in all cases no significant changes
occurred, neither in the emission spectra nor in the luminescence lifetimes, for
DNA/Ru ratios in excess of 30. Therefore, this ratio was chosen for subsequent
studies with selected excited state quenchers (ethidium bromide, potassium
hexacyanoferrate(II) and methyl viologen).27 It is well established that those
quenchers deactivate the excited state of most Ru(II) polypyridyls by
photoinduced electron transfer with rate constants in excess of 109 L mol–1 s–1.
Starting with C3, it was found out that the addition of increasing amounts of
ethidium bromide to a mixture of C3+DNA (ratio 1:30) promoted an
enhancement of the absorption values in the region corresponding to the MLCT
absorption band (Figure S11, Supplementary Material). However, since the
intrinsic absorption of ethidium takes place in the same wavelength range, this
absorption increase had to be discarded. A similar effect occurred with the
emission spectra (Figure S11, Supplementary Material) and luminescence

20
lifetime measurements (Table T5, Supplementary Material), since both
compounds emit in the same region, and the lifetime values for ethidium are
significantly shorter, thus masking the true m values.
In the case of potassium hexacyanoferrate(II) quencher, no changes in the
luminescence lifetime were observed for the photoexcited C3 bound to DNA
(See Figure S12 and Table T6, Supplementary Material). These results suggest
that the complex is fully bound to DNA as the positively charged complex
should be easily quenched by this highly anionic quencher if both species were
free in solution,27 while the negative DNA phosphate backbone hinders
quenching of the bound complex emission. However, total luminescence
quenching is observed for the DNA-bound C3 complex, both in steady-state and
time-resolved emission, in the presence of methyl viologen (MV2+) (Figure 3 and
Table 3).
Insert Figure 3 and Table 3 at about here
Emission quenching experiments for complexes C4, C5 and C6 have also been
performed using methyl viologen as a quencher, and the results are comparable
to those obtained for C3. Steady-state emission spectra and luminescence
lifetime decays for C5 are represented on Figure 4 and Table 4, respectively
(See absorption spectra in Figure S13, Supplementary Material). All the results
for the remaining complexes are reported in Figures S14 and S15 and Tables
T7 and T8, Supplementary Material. The slight enhancement of the lifetime
values for the last methyl viologen additions (Tables T7 and T8) suggest a
partial displacement of the DNA bound Ru(II) complexes to the bulk solution
under these conditions.

21
Insert Figure 4 and Table 4 at about here
From the complexes C3-C6 emission quenching studies with methyl viologen
the Stern-Volmer constants, KSV, and the corresponding quenching rate
constants, kq, were determined. Whenever non-linear Stern-Volmer plots were
obtained, the rate constant data refer to the initial slope. The kq values obtained
from each lifetime component (fast and slow, respectively) of each complex,
were: 1.7 x 10¹¹ and 1.0 x 10¹¹ M-1s-1 (C3); 9.4 x 10⁹ and 1.9 x 10¹⁰ M-1s-1 (C4);
3.9 x 10⁹ and 7.6 x 10⁹ M-1s-1 (C5); 2.0 x 10¹⁰ and 2.1 x 10¹⁰ M-1s-1 (C6). These
values exceed by one or two orders of magnitude those commonly obtained for
Ru(II) complexes with MV2+ (ca. 109 M-1s-1 ).27 Such acceleration of the
photoinduced electron transfer might be due to several factors, one of them
being the increase of the local concentration (closer average distance) of donor
and acceptor species on the nucleic acid (since both the ruthenium (II) complex
and the quencher are bound to the DNA). Considering this effect, the calculated
values for the quenching rate constants represent only apparent values, since
the quencher concentration values on the abscissa correspond to different local
quencher concentrations on the polynucleotide.
The results for C3+DNA in the presence of methyl viologen are represented in
Figure 5. All the other results, including the data for C3 with ethidium bromide,
are represented in Figures S16 to S19, Supplementary Material).
Insert Figure 5 at about here

22
Conclusions
Four new ligands and six Ru(II) polypyridyl complexes have been synthesized,
the latter through microwave-assisted reactions, which considerably reduces
the reaction times from hours to minutes, with satisfactory yields. Studies of
their interaction with calf thymus DNA have suggested a partial intercalation of
the probes into the nucleic acid double strand. According to the structural
features of the complexes and the obtained values for the binding constants, it
is possible that the crescent-shaped complexes C4, C5 and C6 have a more
intimate binding to the polynucleotide double strand than the phenyl-substituted
C3. Luminescence quenching studies further support this hypothesis, since in
the case of potassium hexacyanoferrate(II) no quenching was observed (which
indicates that all the complex was bound to the DNA) and with methyl viologen
the quenching was accompanied by partial displacement of the complexes to
the bulk solution at high quencher concentrations. All these results illustrate the
feasibility of fine tuning the DNA interaction mode of luminescent Ru(II)
complexes containing extended imidazo-phenanthroline ligands by molecular
engineering of their aryl substituents. Such feature might be used in the future
to design tailored molecular probes of the polynucleotide features.
Acknowledgment We are indebted to InOU Uvigo by project K914 122P 64702 (Spain), Xunta de
Galicia (Spain) by project 09CSA043383PR and FCT-Portugal by project
PTDC/QUI/66250/2006 (FCOMP-01-0124-FEDER-007428), for financial
support. The NMR spectrometers are part of the National NMR Network

23
and were purchased in the framework of the National Programme for
Scientific Re-equipment, contract REDE/1517/RMN/2005, with funds from
POCI 2010 (FEDER) and FCT-Portugal.
J. L. C. and C. L. thank Xunta de Galicia, Spain, for the Isidro Parga Pondal
Research Program. B. P. and R. B. thank FC-MCTES (Portugal) for their PhD
grants SFRH/BD/27786/2006 and SFRH/BD/36396/2007, respectively.
We are grateful to Dr. A. Jorge Parola from the REQUIMTE, Universidade
NOVA de Lisboa, Portugal for his help with the synthesis of the Ru(bpy)2Cl2
precursor.
Supporting Information Available
Absorption spectra of C1 to C6 complexes; luminescence lifetimes for C3 to C6
at different ratios Ru:DNA; Absorption and emission spectra of C4 and C6 with
CT-DNA; Ethidium bromide, methyl viologen and potassium ferrocyanide
experiments and Stern-Volmer experiments with DNA. This material is
available free of charge via the Internet at http://pubs.acs.org.

24
Schemes, Tables and Figures
Scheme 1. Synthesis of imidazo-furyl and imidazo-thienyl-phenanthroline
derivatives.

25
Scheme 2. Synthesis of Ruthenium(II) Complexes.
26
Formyl
derivative
Phenanthroline
product
R
Yield
(%)
IR N-H
(cm-1)a
H
(imidazole)
(ppm) d
2 5 - 82 3439 b 13.8
3a 6a H 85 3396 13.9
3b 6b thienyl 79 3436 c 13.9
3c 6c phenyl 60 3371 - e
Table 1. Yields, IR absorption spectra and 1H RMN spectra of phenanthrolines
5-6.
a For the NH stretching band (recorded in Nujol).
b For the NH stretching band (recorded in KBr).
c For the NH stretching band (recorded in liquid film).
d For the NH proton of the imidazole ring for compounds 5-6 (DMSO-d6).
e Not observed.

27
Complex λmax
abs/ nm εmax / M
-1cm-1 λmax
em/ nm ΦF
C1 463 12700 608 0.006
C2 459 17800 607 0.015
C3 460 11900 603 0.016
C4 459 15900 613 0.009
C5 458 14300 613 0.008
C6 457 12000 611 0.008
Table 2 – MLCT (d-π*) absorption and emission maxima, molar absorption
coefficients (in Tris buffer) and fluorescence quantum yields (in air-equilibrated
DMSO) of complexes C1 to C6.

28
Table 3 – Luminescence lifetimes of 1:30 C3:DNA at different MV2+
concentrations. [C3] = 4.90 μM. λexc = 405 nm. λem = 610 nm. [DNA]stock = 2.82
mM. [MV2+]stock = 5 mM.
[MV2+] / M 1/μs (%) 2/μs (%) 3/μs (%) m / μs 2
0 - 0.74 67 1.34 33 0.94 1.10
5 0.14 21 0.43 60 0.84 19 0.45 1.04
15 0.08 37 0.22 50 0.54 13 0.21 1.03
25 0.08 56 0.21 37 0.55 10 0.17 1.10
50 0.04 54 0.13 41 0.40 5 0.10 1.04
75 0.03 62 0.10 35 0.38 3 0.07 1.05
100 0.03 69 0.09 30 0.44 1 0.05 0.91
125 0.02 66 0.08 32 0.40 2 0.05 1.04
150 0.02 70 0.07 29 0.40 1 0.04 0.95
175 0.02 73 0.07 25 0.41 2 0.04 0.98
200 0.02 77 0.07 22 0.47 1 0.04 0.98

29
[MV2+] / M 1/μs (%) 2/μs (%) 3/μs (%) m / μs 2
0 - 0.50 47 1.51 53 1.04 1.03
25 0.18 32 0.49 61 1.09 7 0.43 1.12
50 0.13 32 0.31 55 0.67 13 0.30 1.19
75 0.12 57 0.36 40 0.85 3 0.24 1.11
100 0.07 40 0.21 43 0.55 17 0.21 1.12
150 0.07 57 0.31 34 0.65 9 0.20 1.09
200 0.05 55 0.28 27 0.57 18 0.21 1.06
Table 4 – Luminescence lifetimes of 1:30 C5:DNA at different MV2+
concentrations. [C5] = 10.5 μM. λexc = 405 nm. λem = 613 nm. [DNA]stock = 2.02
mM. [MV2+]stock = 5 mM.

30
0
0.025
0.05
0.075
0.1
400 450 500 550
A
Wavelength / nm
A
0
0.2
0.4
0.6
0.8
1
500 550 600 650 700 750 800
I / a.u
.
Wavelength / nm
0.8
1
1.2
1.4
1.6
1.8
2
2.2
2.4
0 20 40 60 80 100
I/I 0
or / 0
DNA/Ru ratio
B
Figure 1 – (A) Absorption spectra of C3, 4.9 μM in TRIS buffer, in the absence
(···), and in the presence of CT-DNA in ratios of 5 (---) and 10 to 30 (—).
(B) Emission spectra of C3, 4.9 μM in TRIS buffer, in the presence of increasing
amounts of CT-DNA (DNA/Ru ratio of 0 – 80, in base pairs). λexc = 465 nm.
Inset: changes in the emission intensity, I/I0 (●), and emission lifetime, τ/ τ0 (○),
of C3 as a function of DNA/Ru ratio.

31
0
0.05
0.1
0.15
0.2
320 360 400 440 480 520 560 600
A
Wavelength / nm
A
0
0.2
0.4
0.6
0.8
1
500 550 600 650 700 750 800
I / a.u
.
Wavelength / nm
0.5
1
1.5
2
2.5
3
3.5
4
0 20 40 60 80 100
I/I 0
or / 0
DNA/Ru ratio
B
Figure 2 – (A) Absorption spectra of C5, 10.5 μM in TRIS buffer, in the
presence of increasing amounts of CT-DNA (DNA/Ru ratio of 0 – 80, in base
pairs). (B) Emission spectra of C5, 10.5 μM in TRIS buffer, in the presence of
increasing amounts of CT-DNA (DNA/Ru ratio of 0 – 80, in base pairs). λexc =
460 nm. Inset: changes in the emission intensity, I/I0 (●), and emission lifetime,
τ/ τ0 (○), of C5 as a function of DNA/Ru ratio.

32
0
0.2
0.4
0.6
0.8
1
500 550 600 650 700 750 800
I / a.u
.
Wavelength / nm
Figure 3 – Emission spectra of CT-DNA + C3 (Ratio 30/1) in the presence of
increasing amounts of methyl viologen (0 – 200 μM). [C3] = 4.90 μM. [DNA]stock
= 2.82 mM. [MV2+]stock = 5 mM. λexc = 465 nm.

33
0
0.2
0.4
0.6
0.8
1
500 550 600 650 700 750 800
I / a.u
.
Wavelength / nm
Figure 4 – Emission spectra of CT-DNA + C5 (Ratio 30/1) in the presence of
increasing amounts of methyl viologen (0 – 200 μM). λexc = 465 nm. [C5] = 10.5
μM. [DNA]stock = 2.02 mM. [MV2+]stock = 5 mM.

34
0
5
10
15
20
25
30
35
40
0 50 100 150 200 250
Io/I
to/t fastto/t slow
I0/I or
0/
[MV2+
] (M)
Figure 5 – Stern-Volmer emission intensity (●) and lifetime quenching plot for
C3+DNA (ratio 1:30) in the presence of increasing amounts of methyl viologen
(MV2+). Both fast (short) (▲) and slow (long) (○) components of the emission
decay are represented. λexc = 405 nm. Emission collected at 610 nm.

35
References
(1) (a) J.G. Vos, J.M. Kelly, Dalton Trans. 41 (2006) 4869; (b) D.A. Jose, P. Kar,
D. Koley, B. Ganguly, W. Thiel, H. N. Ghosh, A. Das, Inorg. Chem. 46 (2007)
5576; (c) V. Balzani, G. Bergamini, F. Marchioni, P. Ceroni, Coord. Chem. Rev.
250 (2006) 1254; (d) A. Ghosh, P. Das, S. Saha, T. Banerjee, H. B. Bhatt, A.
Das, Inorg. Chim. Acta 372 (2011) 115.
(2) (a) B. Norden, P. Lincoln, B. Akerman, E. Tuite, Met. Ions Biol. Syst. 33
(1996) 177; (b) E.D.A. Stemp, J.K. Barton, Met. Ions Biol. Syst. 33 (1996) 325;
(c) C. Moucheron, A. Kirsch-De Mesmaeker, J.M. Kelly, Struct. Bonding 92
(1998) 163; (d) K.E. Erkkila, D.T. Odom, J.K. Barton, Chem. Rev. 99 (1999)
2777; (e) L.N. Ji, X.H. Zou, J.G. Liu, Coord. Chem. Rev. 216 (2001) 513; (f) C.
Metcalfe, J.A. Thomas, Chem. Soc. Rev. 32 (2003) 215; (g) M.J. Clarke, Coord.
Chem. Rev. 232 (2002) 69; (h) H. Chao, L.N. Ji, Bioinorg. Chem. Appl. 3 (2005)
15; (i) A. Ghosh, P. Das, M. R. Gill, P. Kar, M. G. Walker, J. A. Thomas, A. Das,
Chem. Eur. J. 17 (2011) 2089.
(3) B.T. Farrer, H.H. Thorp, Inorg. Chem. 39 (2000) 44.
(4) (a) A. Kirsch-De Mesmaeker, J.P. Lecomte, J.M. Kelly, Top. Curr. Chem.
177 (1996) 25; (b) Y. Jenkins, A.E. Friedman, N.J. Turro, J.K. Barton,
Biochemistry 31 (1992) 10809; (c) A.E. Friedman, J.C. Chambron, J.P.
Sauvage, N.J. Turro, J.K. Barton, J. Am. Chem. Soc. 112 (1990) 4960; (d) A.B.
Tossi, J.M. Kelly, Photochem. Photobiol. 49 (1989) 545; (e) I. Ortmans, C.
Moucheron, A. Kirsch-De Mesmaeker, Coord. Chem. Rev. 168 (1998) 233; (f)

36
J.M. Kelly, M. Feeney, L. Jacquet, A. Kirsch-De Mesmaeker, J.P. Lecomte,
Pure Appl. Chem. 69 (1997) 767; (g) F. Piérard, A. Del Guerzo, A. Kirsch-De
Mesmaeker, M. Demeunynck, J. Lhomme, Phys. Chem. Chem. Phys. 3 (2001)
2911.
(5) (a) E. Amouyal, A. Homsi, J.C. Chambron, J.P. Sauvage, J. Chem. Soc.
Dalton Trans. (1990) 1841; (b) R.B. Nair, B.M. Cullum, C.J. Murphy, Inorg.
Chem. 36 (1997) 962; (c) L. Ujj, C.G. Coates, J.M. Kelly, P. Kruger, J.J.
McGarvey, G.H. Atkinson, J. Phys. Chem. B. 106 (2002) 4854; (d) C.G.
Coates, P.L. Callaghan, J.J. McGarvey, J.M. Kelly, P. Kruger, M.E. Higgins, J.
Raman Spectrosc. 31 (2000) 283; (e) C. Turro, S.H. Bossman, Y. Jenkins, J.K.
Barton, N.J. Turro, J. Am. Chem. Soc. 117 (1995) 9026; (f) E. Sabatini, H.D.
Nikol, H.B. Gray, F.C. Anson, J. Am. Chem. Soc. 118 (1996) 1158; (g) X. Q.
Guo, F.N. Castellano, L. Li, J.R. Lakowicz, Biophys. Chem. 71 (1998) 51; (h)
M.K. Brennaman, J.H. Alstrum-Acevedo, C.N. Fleming, P. Jang, T.J. Meyer,
J.M. Papanikolas, J. Am. Chem. Soc. 124 (2002) 15094; (i) G. Pourtois, D.
Beljonne, C. Moucheron, S. Schumm, A. Kirsch-De Mesmaeker, R. Lazzaroni,
J.L. Brédas, J. Am. Chem. Soc. 126 (2004) 683.
(6) E.J.C. Olson, D. Hu, A. Hormann, A.M. Jonkman, M.R. Arkin, E.D.A. Stemp,
J.K. Barton, P.F. Barbara, J. Am. Chem. Soc. 119 (1997) 11458.
(7) (a) E. Tuite, P. Lincoln, B. Nordén, J. Am. Chem. Soc. 119 (1997) 239; (b)
C. Hiort, P. Lincoln, B. Nordén, J. Am. Chem. Soc. 115 (1993) 3448; (c) P.
Lincoln, A. Broo, B. Nordén, J. Am. Chem. Soc. 118 (1996) 2644; (d) P. Nordell,
37
F. Westerlund, M. Wilhelmsson, B. Nordén, P. Lincoln, Angew. Chem. Int. Ed.
46 (2007) 2203; (e) P. Nordell, P. Lincoln, J. Am. Chem. Soc. 127 (2005) 9670;
(f) B. Önfelt, J. Olofsson, P. Lincoln, B. Nordén, J. Phys. Chem. A 107 (2003)
1000; (g) J. Olofsson, B. Önfelt, P. Lincoln, J. Phys. Chem. A 108 (2004) 4391;
(h) F. Westerlund, F. Pierard, M.P. Eng, P. Nordén, P. Lincoln, J. Phys. Chem.
B 109 (2005) 17327; (i) F. Westerlund, M.P. Eng, M.U. Winters, P. Lincoln, J.
Phys. Chem. B 111 (2007) 310; (j) F. Westerlund, P. Nordell, J. Blechinger,
T.M. Santos, B. Nordén, P. Lincoln, J. Phys. Chem. B 112 (2008) 6688; (k) C.G.
Coates, J. Olofsson, M. Coletti, J.J. McGarvey, B. Önfelt, P. Lincoln, B. Norden,
E. Tuite, P. Matousek, A.W. Parker, J. Phys. Chem. B 105 (2001) 12653; (l) M.
Li, P. Lincoln, J. Inorg. Biochem. 103 (2009) 963; (m) A. Ghosh, A. Mandoli, D.
K. Kumar, N. S. Yadav, T. Ghosh, B. Jha, J. A. Thomas, A. Das, Dalton Trans.
(2009) 9312.
(8) (a) D. García-Fresnadillo, G. Orellana, Helv. Chim. Acta 84 (2001) 2708; (b)
S.W. Snyder, S.L. Buell, J.N. Demas, B.A. DeGraff, J. Phys. Chem. 93 (1989)
5265.
(9) (a) A. Hergueta-Bravo, M.E. Jiménez-Hernández, F. Montero, E. Oliveros,
G. Orellana, J. Phys. Chem. B 106 (2002) 4010; (b) M.F. Ottaviani, N.D.
Ghatlia, S.H. Bossmann, J.K. Barton, H. Durr, N.J. Turro, J. Am. Chem. Soc.
114 (1992) 8946.
(10) M.R. Gill, J. Garcia-Lara, S.J. Foster, C. Smythe, G. Battaglia, J.A.
Thomas, Nature Chemistry 1 (2009) 662.

38
(11) A. Kirsch-De Mesmaeker, G. Orellana, J.K. Barton, N.J. Turro, Photochem.
Photobiol. 52 (1990) 461.
(12) J.M. Kelly, A.B. Tossi, D.J. McConnell, C. OhUigin, Nucl. Acids Res. 13
(1985) 6017.
(13) (a) C. Lodeiro, J.L. Capelo, J.C. Mejuto, E. Oliveira, H.M. Santos, B.
Pedras, C. Nuñez, Chem. Soc. Rev. 39 (2010) 2948; (b) C. Lodeiro, F. Pina,
Coord. Chem. Rev. 253 (2009) 1353; (c) B. Pedras, H.M. Santos, L. Fernandes,
B. Covelo, A. Tamayo, E. Bértolo, J.L. Capelo, T. Avilés, C. Lodeiro, Inorg.
Chem. Comm. 10 (2007) 925; (d) J. Lopez-Gejo, A. Arranz, A. Navarro, C.
Palácio, E. Munoz, G. Orellana, J. Am. Chem. Soc. 132 (2010) 1746; (e) J.
Lopez-Gejo, D. Haigh, G. Orellana, Langmuir 26 (2010) 2144.
(14) (a) R.M.F. Batista, S.P.G. Costa, C. Lodeiro, M. Belsley, M.M.M. Raposo,
Tetrahedron 64 (2008) 9230. (b) R.M.F. Batista, S.P.G. Costa, C. Lodeiro, M.
Belsley, E. de Matos Gomes, M.M.M. Raposo, Adv. Mat. Forum IV 263 (2008)
587.
(15) R.M.F. Batista, S.P.G. Costa, M. Belsley, M.M.M. Raposo, Dyes Pigments
80 (2009) 329.
(16) A. Kobori, J. Morita, M. Ikeda, A. Yamayoshi, A. Murakami, Biorg. Med.
Chem. Lett. 19 (2009) 3657.

39
(17) L.F. Tan, S. Zhang, X.H. Liu, Y.Xiao, Australian J. Chem. 9 (2008) 725.
(18) G. Orellana, A. Kirsch-De Mesmaeker, J.K. Barton, N.J. Turro,
Photochemistry and Photobiology 54 (1991) 499.
(19) B.P. Sullivan, D.J. Salmon, T.J. Meyer, Inorg. Chem. 17 (1978) 3334.
(20) M.M.M. Raposo, G. Kirsch, Tetrahedron 59 (2003) 4891.
(21) D. Davidson, M. Weiss, M.J. Jelling, J. Org. Chem. 2 (1937) 319.
(22) E.C. Long, J.K. Barton, Acc. Chem. Res. 23 (1990) 271.
(23) A. Wolf, G.H. Shimer Jr., T. Meehan, Biochemistry 26 (1987) 6392.
(24) A.M. Pyle, J.P. Rehmann, R. Meshoyrer, C.V. Kumar, N.J. Turro, J.K.
Barton, J. Am. Chem. Soc. 111 (1989) 3051.
(25) J.L. Morgan, D.P. Buck, A.G. Turley, J.G. Collins, F.R. Keene, Inorg. Chim.
Acta 359 (2006) 888.
(26) I.D. Vladescu, M.J. McCauley, M.E. Nuñez, I. Rouzina, M.C. Williams,
Nature Methods 4 (2007) 517.

40
(27) M.Z. Hoffman, F. Bolletta, L. Moggi, G.L. Hug, J. Phys. Chem. Ref. Data 18
(1989) 219.


![A Chemical and Photophysical Analysis of a Push …photophysical properties [3]. Carbazole compounds have also exhibited good charge transfer A Chemical and Photophysical Analyse of](https://static.fdocuments.in/doc/165x107/5f0e7d077e708231d43f7d64/a-chemical-and-photophysical-analysis-of-a-push-photophysical-properties-3-carbazole.jpg)