Synthesis, Characterization, and Application of Water...
111
SYNTHESIS, CHARACTERIZATION, AND APPLICATION OF WATER-SOLUBLE AND EASILY REMOVABLE CATIONIC PRESSURE SENSITIVE ADHESIVES Final Report to DOE Program/Project Identification No. DE-FC36-99GO10379 February 2003 PI: Prof. Yulin Deng, Institute of Paper Science and Technology 404 894 5759, [email protected] Co-PI: Prof. F. Joseph Schork, School of Chemical Engineering, Georgia Institute of Technology 404 894 2866, [email protected] Co-PI: Prof. Charles Q. Yang, School of Textile and Fiber Science, University of Georgia 706 542 4912, [email protected] Industry Partner: Dr. Ian McLennan, Ecosynthetix Inc. 5173364657, [email protected]
Transcript of Synthesis, Characterization, and Application of Water...

SYNTHESIS, CHARACTERIZATION, AND APPLICATION OF
WATER-SOLUBLE AND EASILY REMOVABLE CATIONIC
PRESSURE SENSITIVE ADHESIVES
Final Report to DOE
Program/Project Identification No. DE-FC36-99GO10379
February 2003
PI: Prof. Yulin Deng, Institute of Paper Science and Technology
404 894 5759, [email protected]
Co-PI: Prof. F. Joseph Schork, School of Chemical Engineering, Georgia Institute of
Technology
404 894 2866, [email protected]
Co-PI: Prof. Charles Q. Yang, School of Textile and Fiber Science, University of Georgia
706 542 4912, [email protected]
Industry Partner: Dr. Ian McLennan, Ecosynthetix Inc. 5173364657,

TABLE OF CONTENTS
Executive Summary ..………………………………………………………………….. 2
General Introduction ………………………………………..………………………….. 4
References ……………………………………………………………………… 9
Part 1. Water-Soluble/Dispersible Cationic Pressure-Sensitive Adhesive (PSA)
from solvent polymerization ………………………………………………….. 11
1.1. Summary …………………………………………………………………. 11
1.2. Synthesis and Characterization of Cationic Copolymers ……………........ 12
1.3. PSA Properties and Recyclability ………………………………………... 26
References ……………………………………………………………………… 39
Part 2. Water-Soluble/Dispersible Cationic Pressure-Sensitive Adhesive (PSA)
from Emulsion Polymerization ……………………………………………….. 40
2.1. Summary …………………………………………………………………. 40
2.2. Emulsion Polymerization of Butyl Acrylate with the Cumene
Hydroperoxide/Tetraethylenepentamine Redox Initiator ………………… 41
2.3. Emulsion Copolymerization of Butyl Acrylate with Cationic Monomer
Using an Interfacial Redox Initiator System …………………………….... 57
2.4. Water-Based Cationic PSA ..……………………………………………… 82
References ……………………………………………………………………… 91
Part 3. Removal of Contaminants from Papermaking System ………………………... 93
3.1. Removal of Contaminants through Fixation ……………………………... 94
3.2. Removal of Contaminants through Flotation …………………………...... 98
3.3. Conclusions ……………………………………………………………….101
References ……………………………………………………………………...111
1

EXECUTIVE SUMMARY
This program is a joint effort of Institute of Paper science and Technology, Georgia
Institute of Technology and University of Georgia at Athens to develop water-soluble and
removable pressure sensitive adhesives.
The project started on October 1, 1998 and finished on December 30th, 2002 after non-
cost extension.
The objectives of the original proposal are:
1. Synthesize water-soluble and easily removable cationic polymer resins for PSAs.
2. Optimize the PSA formulation for labels and tapes, and examine the end-use
properties.
3. Study the colloidal properties of PSAs in water.
4. Study the repulpability of novel PSAs.
5. Examine the effect of adsorbed PSA (in a molecular or colloidal form) on
papermaking operation and final paper properties.
After 4 years study, we accomplished all proposed objectives. One patent application,
“Water-Soluble/Dispersible and Easy Removable Cationic Adhesives and Coating For
Paper Recycling” was filed on July 2, 2000 (Application number: 09/621,695). Another
5 papers were published or submitted to different scientific journals.
The main conclusions from this study are summarized as the following:
1. The cationic monomers can be copolymerized into polyacrylate that is one of the
most important polymers for pressure sensitive adhesive (PSA) using different
technologies, including solvent polymerization and miniemulsion polymerization.
2. The copolymers of cationic acrylate can be formulated to pressure sensitive
adhesives with excellent end-use properties.
3. The cationic PSA is water-soluble or dispersible if the cationic content is higher
than 10 mol%. However, if the cationic content is too high (>20%), the glass
2

transition temperature of the PSA increases resulting in the decrease of the
tackiness and the peel strength of the PSA.
4. The water-soluble or dispersible cationic PSAs will adsorb to fibers and be
removed from pulp furnish in papermaking process. Therefore, they will not
cause stickies problem on a paper machine.
5. 95% of dispersed/water-soluble PSAs will adsorb on fiber surfaces even for the
white water that are reused for more than 15 cycles.
6. The adsorption of soluble/dispersible PSAs on wood fibers will not affect fiber
properties.
7. In average, the cost of novel PSA is about 3% higher than current commercially
available PSA. However, the PSA developed in this study is recyclable.
3

GENERAL INTRODUCTION
In recent years, the world has expressed an increasing interest in the recycling of waste
paper to supplement the use of virgin fiber as a way to protect the environment. Statistics
show that major countries are increasing their use of recycled paper. For example, in
1991 to 1996, the U.S. increased its recovered paper utilization rate from 31% to 39%,
Germany went from 50% to 60%, the UK went from 60% to 70%, France increased from
46% to 49%, and China went from 32% to 35% [1]. As recycled fiber levels and water
system closures both increase, recycled product quality will need to improve in order for
recycled products to compete with products made from virgin fiber [2]. The use of
recycled fiber has introduced an increasing level of metal, plastic, and adhesive
contamination into the papermaking process which has added to the complexity of the
already overwhelming task of providing a uniform and clean recycle furnish. The most
harmful of these contaminates is a mixture of adhesives and polymeric substances that
are commonly known as stickies.
Stickies, which enter the mill with the pulp furnish, are not easily removed from the
repulper and become more difficult the further down the system they get. This can be
detrimental to the final product quality. Stickies are hydrophobic, tacky, polymeric
materials that are introduced into the papermaking system from a mixture of recycled
fiber sources. Properties of stickies are very similar to the fibers used in papermaking,
viz. size, density, hydrophobicity, and electrokinetic charge. This reduces the probability
of their removal by conventional separation processes, such as screening and cleaning,
which are based on such properties. Also, their physical and chemical structure allows
for them to extrude through screens, attach to fibers, process equipment, wires and felts.
Stickies can break down and then reagglomerate and appear at seemingly any place in the
mill. When subjected to a number of factors including changes in pH, temperature,
concentration, charge, and shear forces, stickies can deposit [3]. These deposits can lead
to decreased runnability, productivity and expensive downtime. If the stickie remains in
the stock, then machine breaks can be common. Finally, if the stickie is not removed or
4

deposited, it will either leave in the final product causing converting and printing
problems or recirculate within the mill.
It has been estimated that stickies cost the paper industry between $600 and $700 million
a year due to the cost of control methods and lost production attributed to stickies [3].
Also, of the seven recycling mills opened in the United States between 1994 and1997,
four have closed citing stickies as the main reason responsible for the closure [4].
Adhesives are widely used throughout the paper and paperboard industry and are
subsequently found in the recycled pulp furnish. Hodgson stated that even the best stock
preparation process can only remove 99% of the contaminants, of which the remaining
1% is usually adhesives of various types which are usually10-150 microns in effective
diameter [5]. The large particles are removed by mechanical means such as cleaners and
screens, and the smaller, colloidal particles can be removed with washing. The stickies
that pass through the cleaning and screening processes cause 95% of the problems
associated with recycling [6]. The cleaners will remove most of the stickies that have a
density varying from the pulp slurry (~1.0 g/cm3) and will accept stickies with densities
ranging from 0.95 – 1.05 g/cm3 [2]. The hydrophobicity of the material is also an
important characteristic of the stickie [7]. The hydrophobicity causes the stickies to
agglomerate with other hydrophobic materials such as other stickies, lignin, and even
pitch. The tacky and viscous nature of stickies contributes to many product and process
problems, negatively affecting the practicality of recycled fiber use.
The source of stickies that evade conventional removal techniques are usually synthetic
polymers, including acrylates, styrene butadiene rubber, vinyl acetates, and
polypropylene [5,6,8-12]. Sources of these adhesives are usually broken down into
categories based on application. These categories include contact and pressure sensitive
adhesives, PSAs, and binders as illustrated [13]:
5

Pressure sensitive adhesives are primarily made up of a polymer, such as polyacrylate,
styrene butadiene rubber (SBR) and a tackifying agent. PSAs are commonly used in self-
sealing envelopes, tapes and labels and the tackiness of PSAs is not temperature
sensitive. PSAs commonly contain ethyl vinyl acetate (EVA) or polyvinyl acetate (PVA)
as a backbone and a tackifying resin. They are mainly used in book and magazine
bindings, boxes, envelopes, bags, and tubes. PSAs are sensitive to temperature. Several
studies have collected deposits from mills and have showed the composition of these
tacky deposits to commonly be acrylates and polyvinyl acetates [14-20].
The first step to controlling stickies would be to prevent them from entering the mill in
the first place. However, this is not an easy task. Problems of stickies can be prevented
by careful inspection of the wastepaper entering the mill [21]. Many recycle mills employ
people to remove some of the waste paper that has visible stickie contaminants, to avoid
process problems [22]. Contaminated waste paper that is removed is sent to the landfill,
unused, at the expense of the mill.
Screening and cleaning currently remove the majority of stickies. Macro stickies are
effectively screened out with fine screens, however, as the slots in screens are made
smaller, fiber loss occurs. Cleaners separate based on the difference in stickie density
and pulp density [6]. After cleaning and screening, stickies are as small as 0.15 mm and
6

can still be seen in the final product, even if they do not reagglomerate. Dispersion may
break up the stickies further, but that is very dependent on consistency, pressure and
temperature.
By taking advantage of stickies chemical properties that allow for stickies to elude
cleaners and screens, several control strategies have been employed. Talc is a common
chemical additive that is used to pacify stickies by covering stickie surfaces, causing
them to be less tacky, increasing the specific gravity and allowing for easier removal by
cleaners [23.] Talc’s surface energy is lower than most adhesives, increasing its
attraction to stickies. Other chemicals used for stickies control include dispersants,
solvents, cationic polymers, synthetic fibers, zirconium compounds and alum
sequestering agent [6]. However, additives are usually very expensive and do not solve
the problem, they only temporarily fix it. Talc, zirconium compounds, and synthetic
fibers only stabilize stickies by detackifying them, they do not reduce the particle size.
These complexes are also shear sensitive, which can cause additional stickie surfaces to
be exposed. Dispersants will reduce the particle size and prevent reagllomeration but are
temperature and pH sensitive, which will cause compatibility problems with the existing
mill chemistry and raised environmental issues. Anionic stickies are usually countered
with low molecular weight, highly charged cationic polymers.
Bruyns et al. have studied problematic stickie deposits at a recycle mill [22]. The mill
initially used caustic to clean the wires, which then caused an increase in the use of other
chemicals, such as defoamer, sizing and anti-skid agent. It is also known that defoamer is
sometimes a component of stickie deposits, thus aiding in stickie deposition on
equipment. Other chemical usages were also altered in the mill. Ultimately, the mill
returned to manual removal of most contaminated waste paper before pulping to save on
further chemical usage.
Hawes [24] has studied a number of machine clothing types to minimize the deposition of
stickies. Optimal shower placement and fabric resistance to chemicals that are used to
clean off contaminants is where most of this work has been done. However, fabric
7

coating that is resistant to stickie build up frequently wears off within a few days due to
usage. Low molecular weight, high cationic charge density polymers are also applied to
the machine wire as a barrier to prevent deposition. Cleaning solvents can also be used
on machine clothing but cannot be returned to the process due to the high contamination
and favorable stickie interaction.
In summary, after twenty years of paper recycling experience, stickies remain one of the
major issues in recycled paper. Most of the stickie removal techniques are concentrated
on physical properties of the stickie. Most stickie control strategies concentrated on
passivation, by addition of chemicals such as talc, and coagulation and dispersion, by
polymers. Stickie-surface interactions have concentrated on felts, fabrics, and rolls.
None of these techniques are 100% efficient at removing stickies from the recycle
system. Therefore, there is need to develop new technology to solve the stickies
problem. Many researchers have focused on the understanding and resolution of the
stickies problems in waste-paper recycling and papermaking. Two approaches have been
made to solve stickies associated problems, i.e. sticky control and repulpable sticky
development. Although sticky problems can been reduced by one or more of the
techniques listed above, the techniques that work well in one paper mill may not work for
others because of the differences in the adhesives, pulps, and papermaking conditions.
Obviously, to control the deposition of stickies on the paper machine and paper sheets is
a passive rather than an initiative method because it can only reduce but cannot totally
solve the sticky problems. Therefore, the development repulpable PSAs is of high
interest to the paper industry.
The technologies currently being evaluated by adhesive manufacturers in an effort to
make repulpable. The recoverable PSAs commonly have a high glass transition or
melting temperature, and will not soften and breakdown under repulping conditions.
Although this is a good approach, only limited thermoplastic raw materials can be used as
a PSA. Cross-linked thermoset PSAs have been developed using polyurethane-based
polymers. These PSAs have shown significant advantages over thermoplastic PSAs, but
the energy required for repulping is higher, and the crosslinking of the PSAs during the
8

storage and operation is a problem. Another approach for recoverable PSA is to use
polymers with a density significantly lower than or higher than the fibers. However, the
deformation of these soft particles and their tacky property lead to a low separation
efficiency. In contrast to the recoverable PSAs, PSAs that can be dissolved or dispersed
in water have been developed. These PSAs include vinyl polymers modified with
hydrophilic components such as starch, carboxylic acids, polyglycols, maleic acid,
polyethylene oxide, etc. The disadvantages of these water-soluble/dispersible PSAs
include poor heat stability and water resistance, and low bonding strength. An
anionically charged water-soluble PSA was developed by Eastman Chemical Co.
recently. Although the anionic PSA has good heat stability and high bonding strength, the
accumulation of water-soluble anionic PSA in the process water is a serious problem.
Therefore, a water-soluble PSA that has a good bonding strength, high stability, and will
not accumulate in water was focused in this program. Because these novel PSAs are
water soluble, they will not form stickies in pulp. Furthermore, because the PSAs are
cationically charged, they can be easily removed from the system by adsorbing onto fiber
and fines surfaces. As a result, the “stickies” will no longer be a problem in recycled
paper mills. Because paper made up 40% of the municipal solid waster, and the annual
cost of stickies to the paper industry is estimated to be about $600 millions, a full solution
of stickies problems will significantly improve our environment and save $600 millions
per year.
References
1. H. Sasaki, T. Shibano and M. Yamakage, Packaging Technology and Science, 11,
205 (1998).
2. O. Heise, M. Kemper, H. Wiese, E. Krauthauf, Tappi J., 83(3), 73 (2000).
3. T. Friberg, Progress in Paper Recycling, Nov, 70 (1996)
4. D. Cauchon, USA Today, Oct. 7, 1997. P.3A.
5. K. Hodgson, Paper Recycling Challenge- Stickies Vol. 1, 71 (1997).
6. T. Fogarty, Pulping Conference Proceedings, Book 2, Boston, MA, 429 (1992).
7. P. Alison, Paper South Africa. 12(5), 47 (1992).
9

8. R. Diaz, IPST Master’s Thesis. Atlanta, GA, June (1995).
9. W. Scholz, Pulping Conference Proceedings, Atlanta. Book 2, 501 (1993).
10. N. Hsu, J. Schroeck and L. Errigo, Recycling Symposium Proceedings. Chicago, IL,
331 (1997).
11. M. Douek, Paper Recycling Challenge- Stickies Vol. 1, 15 (1997).
12. T. Ling, TAPPI Pulping Conference Proceedings. TAPPI Press, Atlanta, GA, 1039
(1991).
13. R.D. Moreland, TAPPI Pulping Conference Proceedings. TAPPI Press, Atlanta,
GA.,193 (1986).
14. C.R. Olsen, and M.K. Letscher, Appita Journal, 45(2), 125 (1992).
15. N. Hsu, Paper Recycling Challenge- Stickies Vol. 1, 256 (1997).
16. L. Latimer, Tappi J., 62(5), 29 (1979).
17. D. Wilhelm, S. Makris and S. Banerjee, Tappi J., 82(12), 63 (1999).
18. S. Patel and S. Banerjee, Tappi J. 82(11), 99 (1999).
19. R. Venditti, H. Chang and H. Jameel, Paper Age, Nov, 18 (1999).
20. K. Cathie, R. Haydock and I. Dias, Pulp and Paper Canada. 93(12), 157 (1992).
21. M.R. Doshi, Progress in Paper Recycling, Nov, 54 (1991).
22. M. Bryuns, K. Rajan, R. Dayliss, and S Van Doren, Paper Recycling Challenge-
Stickies, Vol. 1, 292 (1997).
23. J. Yordan and G. Williams, Paper Recycling Challenge-Stickies, Vol. 1, 76 (1997).
24. J. Hawes, Paper Recycling Challenge-Stickies, Vol. 1, 259 (1997).
10

PART 1. WATER-SOLUBLE/DISPERSIBLE CATIONIC PRESSURE-
SENSITIVE ADHESIVES FROM SOLVENT POLYMERIZATION
1.1 Summary
In order to solve stickies problems, a series cationic copolymers of butyl acrylate (BA)
and [3-(methacryloylamino)-propyl]trimethylammonium chloride (MAPTAC) were
synthesized by free radical solution polymerization in methanol or ethanol. FT-Raman
and nuclear magnetic resonance (NMR) were applied to monitor the polymerization
process. The copolymers were characterized by light scattering, NMR, differential
scanning calorimetry (DSC), and thermogravimetric analysis (TGA). It was found that
random copolymers could be prepared, and the molar fractions of butyl acrylate and
cationic monomers in the copolymers were close to the feed ratios. The copolymer
prepared in methanol has higher molecular weight than that prepared in ethanol. With
increased cationic monomer content, the glass transition temperature (Tg) of the
copolymer increases, while the thermal stability decreases. The reactivity ratios for the
monomers were evaluated. Copolymerization of BA (M1) with MAPTAC (M2) gave
reactivity ratios as r1=0.92 and r2=2.61 in ethanol, and r1=0.79 and r2=0.90 in methanol.
The cationic butyl acrylate (BA) and [3-(methacryloylamino)propyl] trimethylammonium
chloride (MAPTAC) copolymers synthesized in ethanol were used as PSAs. The PSA
water-solubility, end-use properties, repulpability in paper recycling, and its effect on the
properties of recycled paper product were studied. It was found that the cationic PSAs
can be dissolved or dispersed in water by controlling the cationic charge density in the
backbone of PSAs; therefore, they will not deposit as stickies during recycling and
papermaking processes. Because the PSAs are cationic charged, they can be easily
removed from the papermaking system by adsorbing onto the negatively charged fiber
and fine surfaces. Furthermore, the adsorbed colloidal or dissolved PSAs have little
effect on final paper properties.
11

1.2 Synthesis and Characterization of Cationic Copolymers
Synthesis of copolymers containing both hydrophobic and cationic hydrophilic units has
been studied intensively. Emulsion polymerization techniques have been applied to
synthesize cationic polymeric latexes, which have shown potential applications as
catalysts [1,2], papermaking aids [3-6], and coating agents [7]. However, there are
several problems in using emulsion polymerization techniques for preparation of this type
of copolymer. First, because cationic monomers are strongly hydrophilic and are not
miscible with the hydrophobic monomers in water, the incorporation rate of cationic
monomers to the polymer through direct emulsion polymerization has been low.
Brouwer [8] studied the emulsion polymerization of styrene (80-100 wt%) and [2-
methacryloxy)ethyl]trimethylammonium chloride (MAETAC, 0-20 wt%), and found that
the maximum incorporation of MAETAC to the latex was less than 4 wt%. Second,
because the solubility of cationic monomers in water is significantly different from that
of hydrophobic monomers, the emulsion copolymerization of these two different
monomers usually results in two polymeric fractions, i.e., a high-cationic-monomer-
containing copolymer and a high-hydrophobic-monomer-containing copolymer [9].
Third, emulsion polymerization cannot be used to prepare a high-cationic-containing
copolymer because the copolymer will be water soluble and it cannot exist in a latex form
in water if the cationic content is high.
Copolymers containing both hydrophobic and cationic hydrophilic units with a high
cationic content have been synthesized by cationization of the copolymer that contained a
functional monomer [2,10-13]. The copolymerization of the hydrophobic monomer and
cationic monomer in an organic solvent has also been used to synthesize these types of
copolymers [12-15]. These copolymers have potential application as adhesive curing
agents [12], controlled drug release agents [14], and ion-exchange membranes [15].
Although copolymers with a high cationic content have already been made for various
applications, the synthesis of these types of copolymers by solution polymerization has
not been well addressed. In addition, it is our intention to develop a new class of
cationically charged water soluble/removable pressure-sensitive adhesives. In current
12

paper recycling industry, one of the serious problems is the stickies formed by pressure
sensitive adhesives, which increases paper breaks and machine downtime. The cost of
stickies for paper recycling industry is over $600 million/year. The potential advantage
of using cationically charged pressure sensitive adhesive is that the adhesive can be made
to be water-soluble by controlling the charge density on the polymer backbone, and these
water-soluble molecules can adsorb to wood fiber surface and be removed with paper
web during paper making process. In this study, a series of poly(BA-co-MAPTAC)
copolymers with different cationic content was synthesized by solvent polymerization
and characterized. The effect of reaction conditions on the properties of the copolymers
was studied, and the reaction kinetics was reported. The properties of these polymers as
pressure-sensitive adhesives and their effect on paper recycling will be reported later.
When solution polymerization is used to prepare a homogeneous poly(BA-co-
MAPTAC), the choice of the right solvent is critical. First, both BA (hydrophobic) and
MAPTAC (cationic and hydrophilic) should be soluble in the solvent used. Second, the
solvent should also be a good solvent for the copolymer to prevent the precipitation of the
copolymers. Third, both monomers should have reasonable monomer reactivity ratios in
the solvent. Because both ethanol and methanol are strong polar organic solvents, it is
expected that they can fit these requirements.
Experimental
Materials
All chemicals were purchased from Aldrich Chemical Company. Butyl acrylate (BA,
99+%) and ethylene glycol dimethylacrylate (EGMA) were washed with 5% sodium
hydroxide aqueous solution three times and then with deionized water three times to
remove inhibitors. [3-(Methacryloylamino)propyl]trimethylammonium chloride
(MAPTAC, 50 wt% in water) was extracted with ethyl ether five times to remove
inhibitors, and the residual ethyl ether was removed by a rotary evaporator at room
13
temperature under reduced pressure. 2,2'-Azobisisobutyronitrile (AIBN), methanol, and
ethanol were used as received. Solvents used were all HPLC grades.
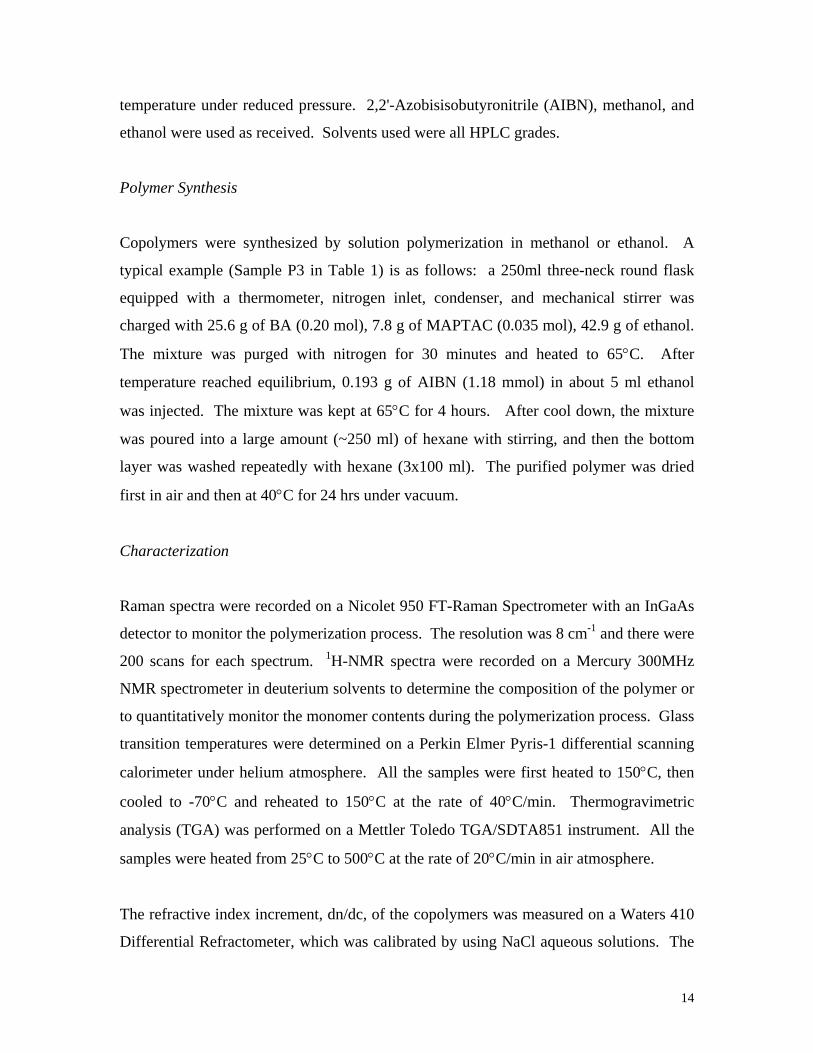
Polymer Synthesis
Copolymers were synthesized by solution polymerization in methanol or ethanol. A
typical example (Sample P3 in Table 1) is as follows: a 250ml three-neck round flask
equipped with a thermometer, nitrogen inlet, condenser, and mechanical stirrer was
charged with 25.6 g of BA (0.20 mol), 7.8 g of MAPTAC (0.035 mol), 42.9 g of ethanol.
The mixture was purged with nitrogen for 30 minutes and heated to 65°C. After
temperature reached equilibrium, 0.193 g of AIBN (1.18 mmol) in about 5 ml ethanol
was injected. The mixture was kept at 65°C for 4 hours. After cool down, the mixture
was poured into a large amount (~250 ml) of hexane with stirring, and then the bottom
layer was washed repeatedly with hexane (3x100 ml). The purified polymer was dried
first in air and then at 40°C for 24 hrs under vacuum.
Characterization
Raman spectra were recorded on a Nicolet 950 FT-Raman Spectrometer with an InGaAs
detector to monitor the polymerization process. The resolution was 8 cm-1 and there were
200 scans for each spectrum. 1H-NMR spectra were recorded on a Mercury 300MHz
NMR spectrometer in deuterium solvents to determine the composition of the polymer or
to quantitatively monitor the monomer contents during the polymerization process. Glass
transition temperatures were determined on a Perkin Elmer Pyris-1 differential scanning
calorimeter under helium atmosphere. All the samples were first heated to 150°C, then
cooled to -70°C and reheated to 150°C at the rate of 40°C/min. Thermogravimetric
analysis (TGA) was performed on a Mettler Toledo TGA/SDTA851 instrument. All the
samples were heated from 25°C to 500°C at the rate of 20°C/min in air atmosphere.
The refractive index increment, dn/dc, of the copolymers was measured on a Waters 410
Differential Refractometer, which was calibrated by using NaCl aqueous solutions. The
14

molecular weight of the polymer was determined on a GPC-MALLS light scattering
system with a Waters GLC/GPC 244 apparatus in combination with a Dawn DSP
MALLS light scattering photometer (Wyatt Technology Co.). Dimethylformamide
(DMF) with a flow rate of 0.8 ml/min was used as mobile phase at room temperature.
Results and Discussion
Polymerization
Copolymers synthesized from solution polymerization are listed in Table 1. The
polymerization process could be monitored by Raman spectroscopy. Figure 1 shows the
Raman spectra collected in the polymerization process of synthesizing copolymer P10.
Figure 1a was the spectrum of the reaction mixture at the beginning of the
polymerization. The bands at 3108 and 3040 cm-1 are the stretching modes of
unsaturated =C-H of the monomers. The strong band at 1638 cm-1 and the band at 1412
cm-1 are due to the stretching mode and in-plane bending of the alkene C=C of the
monomers, respectively. The band at 1714 cm-1 is the carboxylate carbonyl stretching
mode. The wide bands at 2942, 2877, 2835, 1453, and 1299 cm-1 are the symmetric or
asymmetric stretching or bending modes of CH3 or CH2 of the monomers and methanol.
When the polymerization mixture was kept at 65°C for 30 min, all the bands of the
alkene C=C at 3108, 3040, 1638, and 1413 cm-1 have diminished as shown in Figure 1b.
After the polymerization was kept for four hours, all the bands of the alkene C=C
disappeared (see Figure 1c). During the polymerization process, the frequency of the
carbonyl band shifted from 1714 cm-1 (monomers) to 1728 cm-1 (polymers). When
monomers polymerized to form polymers, the unsaturated C=C bonds of monomers were
converted to saturated C-C bonds, and the carboxylate carbonyl was no longer conjugated
with C=C, thus the band shift to a higher frequency. With the aid of the FT-Raman
spectrum, the progress of the polymerization can be conveniently monitored. However, it
was also found that the sensitivity of FT-Raman is not high enough to quantitatively
monitor the polymerization process. It was also difficult to distinguish the BA and
15

MAPTAC with FT-Raman. Therefore, the copolymerization kinetics of this reaction was
studied using NMR, as described later.
Molecular Weight
The molecular weights of the copolymers were determined with a GPC-MALLS light
scattering system and are listed in Table 1. Comparing the molecular weights of
copolymers synthesized in different solvents, it is obvious that the molecular weights of
the copolymers synthesized in methanol were much higher than those synthesized in
ethanol. This can be ascribed to the chain transfer constant for ethanol being much larger
than that for methanol. Nandi16 has reported that, in the radical polymerization of butyl
acrylate at 80 oC, the chain transfer constant for methanol was 4.7 x 10⁻⁵ and for ethanol
was 4.28 x 10⁻⁴. The chain transfer constant for ethanol and methanol from MAPTAC
radicals has not been reported, but the same trend as that from butyl acrylate radicals
would be expected. It is also possible that the difference in solubility of the copolymer in
the two solvents may affect the molecular weight. Since homogeneous copolymerization
was observed in the synthesis of all the copolymers, this effect may be less important.
Introducing a small amount of crosslinker EGDM significantly increased the molecular
weight of the copolymer, but gelation occurred when crosslinker content was high.
Compositions
The composition of the resulting copolymer was determined from 1H-NMR. A typical 1H-NMR spectrum of BA/MAPTAC copolymer in CDCl3 is shown in Figure 2.
Chemical shifts of 4.0 ppm and 3.40 ppm were assigned to the OCH2 of BA and N+(CH3)
of MAPTAC, respectively. The composition of the copolymer was calculated from the
integration ratio of the two peaks. The feed ratios of various monomer mixtures, as well
as the composition of the resulting copolymers, were summarized in Table 1. It can be
seen that the molar fractions of butyl acylate and cationic comonomer in the copolymer
were all close to the feed ratios.
16

The GPC chromatogram indicated that there was only one major peak for every
copolymer. In an emulsion copolymerization of styrene and MAPTAC, van Streun and
his coworkers [9] found that two fractions of copolymers (a high MAPTAC containing
and a high styrene containing fractions) were formed when the cationic monomer feeding
ratio is high. They indicated that the formation of two fractions was due to the significant
difference in the solubility of two monomers. However, because the solvents used in this
study are good solvents for both monomers of BA and MAPTAC and the copolymers,
homogeneous copolymers are expected. The single peak of GPC supports that no
homopolymers were presented in these systems. In order to further verify that the
resulting polymers were uniform copolymers, some polymers were dissolved in
chloroform and extracted with water. The compositions of the two fractions in water (a
good solvent for polyMAPTAC) and chloroform (a good solvent for polybutyl acrylate)
were measured by 1H-NMR, and no apparent composition difference was found from the
copolymers obtained from these two fractions. Therefore, it was concluded that the
resulting copolymers are homogeneous copolymers.
Copolymerizability
The polymerization process was monitored quantitatively by NMR in CD3OD, in which
both the monomers and the resulting polymers were soluble. Figure 3a shows the NMR
spectrum of a BA and MAPTAC mixture in methanol before initiator was added. Figure
3b shows the NMR spectrum of the above mixture after 10 minutes of polymerization.
Conversion of BA was determined by change of the signal integration ratio of OCH2
protons (from δ 4.16 ppm for monomer to 4.08 ppm for polymer), and conversion of
MAPTAC was determined by change of the signal integration ratio of N+(CH3)3 protons
(from δ 3.14 ppm for monomer to 3.22 ppm for polymer). The copolymer composition
was calculated from the signal integration ratio of OCH2 protons and N+(CH3)3 protons in
polymer.
Figure 4 shows the time-conversion curves for the copolymerization of BA with
MAPTAC in ethanol (Sample P3). It shows that the reactivity rate of MAPTAC is much
17

higher than that of BA. To further understand the copolymerizability of BA and
MAPTAC, their reactivity ratios were measured. Monomer reactivity ratios were
evaluated by the graphical method according to the Fineman and Ross equation [16]:
2
2
1)1( r
fFr
ffF
−=−
(1)
where r1 and r2 are the reactivity ratios relating to BA (M1) and MAPTAC (M2),
respectively; F = d[M1]/d[M2] is the ratio of the numbers of each kind of repeat unit in
the polymer; and f = [M1]/[M2] is the monomer molar feed ratio. Monomer reactivity
ratios were also obtained by using the Kelen-Tudos method [17], which is a refined
linearization method from the Fineman and Ross method.
Details of the copolymerization of BA with MAPTAC in ethanol and methanol are listed
in Tables 2 and 3, respectively. The monomer reactivity ratios calculated from both the
Fineman-Ross method and the Kelen-Tudos method are shown in Table 4. It is
interesting to note that the solvents (ethanol and methanol) did not have a big effect on
the relative copolymerizability of BA, but had a significant effect on that of MAPTAC.
The high MAPTAC reactivity ratio in ethanol may be due to a "microphase separation
effect" [18]. It is known that MAPTAC is more soluble in methanol than in ethanol [19].
The tendency for MAPTAC monomers to form aggregates in ethanol would be higher,
and thus it would be more favorable for MAPTAC to have homopolymerization in
ethanol than in methanol. To further understand the blockiness of the copolymer, the
statistical distribution of monomer sequences M1-M1, M2-M2, and M1-M2 in the
BA/MAPTAC copolymers was calculated by the method of Igarashi [20]. Table 5 lists
the structural data for the copolymers. The calculated mol% of M1-M2 linkages is much
higher than that of M2-M2 linkages for all the copolymers, indicating that the blockiness
of the MAPTAC is low even for copolymers prepared in ethanol. The low blockiness of
MAPTAC is further indicated by the low mean sequence length value for MAPTAC in
the copolymer. The reasons for this are the low MAPTAC feed ratio in the
copolymerization and BA's preference for copolymerization. The results indicate that the
difference of the monomer sequence distribution for the copolymers prepared in ethanol
and methanol with a low MAPTAC content is not significant.
18

Thermal Analysis
The glass transition temperatures (Tg) of the PSA samples were determined by DSC, and
the results are shown in Figure 5. It is obvious that with increased cationic content, the
Tg of the copolymer increases. Copolymers synthesized in methanol showed slightly
higher Tg, which may be due to the higher molecular weight of the copolymer.
Generally, copolymers from different solvents with similar cationic content showed very
similar Tg.
Thermogravimetric analyses (TGA) of the copolymers were also conducted. Figure 6
shows the TGA curves of copolymers P1-P4. It clearly indicates that all copolymers
begin to decompose at 230°C with three stages of weight loss. With increased cationic
MAPTAC content, the first stage of weight loss increases correspondingly. This stage of
weight loss may be attributed to the thermal instability of the MAPTAC units in the
copolymer. Copolymers synthesized in methanol showed similar TGA curves. Figure 7
shows the temperature at 10% weight loss of the copolymer as a function of the
MAPTAC content in the copolymer. No obvious difference of thermal stability was
found for copolymers with the same MAPTAC content but synthesized in different
solvents.
Conclusions
Homogeneous copolymers of hydrophobic BA and hydrophilic cationic MAPTAC can be
synthesized by solution copolymerization in ethanol or methanol. The polymerization
process was monitored by FT-Raman and NMR. The molecular weights of the
copolymers were measured by GPC and light scattering. It was found that the copolymer
prepared in methanol has much higher molecular weight than that prepared in ethanol,
and the molecular weight of the copolymer could also be effectively increased by
incorporating a small amount of crosslinker.
19

Copolymerization of BA with MAPTAC in ethanol and methanol yields very different
values of reactivity ratio for MAPTAC. The high reactivity ratio of MAPTAC in ethanol
may be due to the microphase separation effect.
Thermal analyses of the copolymers indicate that with increased cationic monomer
content, the Tg of the copolymer increases, and the thermal stability decreases. Thermal
analysis results further showed that copolymers from different solvents with the same
MAPTAC content had very similar glass transition temperatures (Tg) and thermal
stability.
Table 1. Characteristics of Copolymers
Cationic unit fraction (mol%) Sample Solvent EGDM
(mol%) in feed in polymer
dn/dc Mw/105
(g/mol)
Mw/Mn
P1 ethanol 0 5.0 5.7 0.045 2.3 1.5
P2 ethanol 0 10.0 10.6 .051 1.8 1.3
P3 ethanol 0 15.0 15.2 0.063 1.4 1.3
P4 ethanol 0 20.0 20.9 0.066 2.3 1.3
P5 ethanol 0.2 15.0 17.6 0.063 8.6 4.9
P6 ethanol 0.5 15.0 17.3 0.063 13 2.0
P7* ethanol 0.8 15.0 - - - -
P8 methanol 0 5.0 5.7 0.045 6.3 3.0
P9 methanol 0 10.0 10.8 0.051 7.8 4.1
P10 methanol 0 15.0 16.2 0.063 8.3 3.5
P11 methanol 0 20.0 21.9 0.066 9.7 4.2
P12 methanol 0.1 15.0 17.4 0.057 19 1.6
P13* methanol 0.2 15.0 - - - -
* Gel was formed during copolymerization.
20

Table 2. Copolymerization of BA (M1) with MAPTAC (M2) in Ethanol
Conversion (%) ][][
2
1
MM
f =
Time
(min) M1 M2 ][][
2
1
MdMd
F =
7.71 4 9.8 12.7 5.96
4.87 4 9.2 12.2 3.69
3.52 5 8.1 11.7 2.44
2.53 5 7.0 11.2 1.59
1.52 5 5.2 8.9 0.89
Table 3. Copolymerization of BA (M1) with MAPTAC (M2) in Methanol
Conversion (%) ][][
2
1
MM
f =
Time
(min) M1 M2 ][][
2
1
MdMd
F =
7.44 4 9.1 11.9 6.13
4.68 4 7.8 9.3 3.92
3.58 5 7.9 9.2 3.08
2.52 5 7.0 8.3 2.13
1.52 5 5.2 5.7 1.39
Table 4. Monomer reactivity ratios.
Fineman-Ross Method Kelen-Tudos Method M1 M2 Solvent
r1 r2 r1 r2
BA MAPTAC Ethanol 0.91 2.56 0.92 2.61
BA MAPTAC Methanol 0.79 0.93 0.79 0.90
21

Table 5. Structural data for the copolymers of BA (M1) with MAPTAC (M2)
Blockiness (mol%) Alteration
(mol%)
Mean seq. length Copolymer M1 in
copolymer
(mol%) M1-M1 M2-M2 M1-M2 M1 M2
P1 94.3 89.3 0.70 0.10 18.9 1.14
P2 89.4 81.0 2.18 16.8 10.6 1.26
P3 84.8 73.7 4.23 22.1 7.66 1.37
P4 79.1 65.4 7.17 27.4 5.76 1.52
P8 94.3 88.8 2.34 10.9 17.3 1.04
P9 89.2 79.3 8.82 19.8 8.99 1.09
P10 83.8 69.6 2.05 28.3 5.92 1.14
P11 78.1 60.1 3.86 36.1 4.33 1.21
(a) t = 0 min
(b) t = 30 min
(c) t = 4 hr
Figure 1. FT-Raman of the reaction mixtures at different times in the synthesis of
BA/MAPTAC copolymer (P10): (a) 0 minute; (b) 30 minutes; (c) 4 hours.
22

Cl-
CH2 CH
C O
O
CH2CH2CH2CH3
CH2 C
C
CH3
O
NH
CH2CH2CH2N+Me3
m n
a b b c
ppm
Figure 2. 1H-NMR spectrum of BA/MAPTAC copolymer (P3) in CDCl3.
d e
Cl-
C CC OOCH2CH2CH2CH3
H
H
HC C
C
CH3
ONHCH2CH2CH2N
+Me3
H
Ha1
a2
c1
c2b
e'd'
Cl-
CH2 CHC OOCH2CH2CH2CH3
CH2 CC
CH3
ONHCH2CH2CH2N
+Me3
m n
(b) t = 10 min
(a) t = 0 min
ppm
Figure 3. Typical 1H-NMR spectra (in CD3OD) of the reaction mixtures at different
times in the synthesis of BA/MAPTAC copolymer in methanol: (a) 0 minute; (b) 10
minutes.
23

igure 4. Time-conversion curves for the copolymerization of BA with MAPTAC in
igure 5. Glass transition temperature (Tg) of BA/MAPTAC copolymers as a function of
the MAPTAC content in the copolymer.
0102030405060708090
100
0 50 100 150 200 250Time (min)
Con
vers
ion
(%)
MAPTACBA
F
ethanol (P3).
-40
-35
-30
-25
-20
-15
-10
-5
0 5 10 15 20 25MAPTAC Content (mol%)
Tem
pera
ture
( o C)
in ethanolin methanol
0
F
24

Figure 6. Thermogravimetric analysis (TGA) of BA/MAPTAC copolymers.
Figure 7. Thermogravimetric analysis of BA/MAPTAC copolymers: Temperature at
10% weight loss as a function of the MAPTAC content in the copolymer.
Temperature
Wei
ght
P1P2P3P4
200
220240
260
280300
320
340
360380
400
0 5 10 15 20 25MAPTAC Content (mol%)
Tem
pera
ture
( o C)
in ethanolin methanol
25

1.3 PSA Properties and Recyclability
range of cationic copolymers have already been synthesized from solvent
olymerization as PSAs. We then studied their PSA properties and effect on paper
cycling.
xperimental
A
p
re
E
olubility
olubility of the PSA in water was measur the following procedure: 0.4 g
f dried PSA was added to 100 mL of water at pH 8.0. The mixture was stirred at 50°C
With the water-dispersible sample, the particle size of the dispersed particle was measure
by Malvern Zeta-sizer.
PSA Properties
The 180o peel strength was measured according to the Pressure Sensitive Tape Council
standard method PSTC-1 (1994). The shear strength was measured according to the
standard method PSTC-7 (1994).
The Repulpability of PSA
50 µm thickness of PSA was applied on a silicon release liner, dried at 90°C for 3 min,
nd then transferred to commercial copy paper. The final PSA content was adjusted to
isintegrated for
0,000 revolutions in the standard disintegrator with the propeller operating at 3000 rpm
the stock. A handsheet was made according to the Technical Association of Pulp and
S
S ed according to
o
for half an hour. The solubility was identified from the visual appearance of the solution.
a
1% of the copy paper. The paper was torn to small pieces and soaked in water (pH 8.0)
with 1% consistency for 16 hours. The mixture was heated to 50°C and d
2
in
26

Paper Industry (TAPPI) standard method T 261 and dyed. The stickies particles on the
andsheet were identified by image analysis.
he adsorption isotherm of the cationic PSA on wood fibers was measured as follows.
ith various PSA content amounts (range from 0.5% to 8% based on oven-
ried paper) was repulped. After standing for 4 hours, the pulp stock was centrifuged at
for half an hour. The content of PSA in the supernatant clear solution was
easured by colloidal titration or UV spectroscopy.
and the rest of the filtrate was used for the next pulping
xperiment. In every step, about 20 percent of fresh water is needed to compensate the
e last step. Water from another pulping process without PSA was
ollected as reference. Then the PSA content in the filtrate was measured.
andsheet paper was made according to Tappi Method T 261. The tensile strength of the
stron. The sizing effect (paper hydrophobicity) was evaluated
y the Hercules Sizing Test (HST) method. For the sizing test, the handsheet paper was
h
PSA Adsorption on Wood Fibers and Accumulation in Process Water
T
Copy paper w
d
3000 rpm
m
To determine the PSA accumulation in papermaking process water, pulp stock of 1%
consistency with 0.25% PSA based on oven-dried paper was made. After standing for
one hour, the stock was filtered through a 200-mesh screen. 50 mL of filtrate was
collected for analysis,
e
water lost in th
c
The Effect of PSA on Paper Properties
H
paper was measured by In
b
dried on a drum drier at 115-120oC for 4 min. The HST test was conducted using 1%
formic acid ink solution, 80% reflectance.
Results and Discussion
PSA Polymer Characteristics
27

The break energy of the polymer depends on the polymer T and molecular weight (Mw).
It has been demonstrated that the T , moleculag
g r weight, and their distribution as well as
rface energy are important properties for PSAs [21,22]. Commercial solvent-based
nd Mw distribution
etween 1.4-1.8. Sometimes, a small amount of crosslinker is introduced to the PSA
e cationic comonomer in the PSA
opolymer were all close to the feed ratios. The molecular weight of the polymer is
ontent, the Tg
f the copolymer increases. With cationic content less than 20%, the Tg of the PSA
for normal PSA applications. Because the
olymerization kinetics and polymer characterization of these cationic polymers have
problem in paper recycling. Therefore, the
lubility or dispersibility of these cationic PSAs must be studied. Table 1 shows the
tionic content and PSA solubility in water. PSA with cationic
onomer content at about 5% was not soluble in water. With increased cationic
polymer became water dispersible. PSA polymer became
ater soluble when the cationic monomer content was more than 15%. Cationic
su
acrylic PSA normally has molecular weight (Mw) at 100,000 [23], a
b
polymer to increase the polymer internal strength, and thus the Mw of the polymer will be
significantly increased.
Table 1 shows the characteristics of the cationic PSA polymers prepared in this study. It
can be seen that the molar fractions of BA and th
c
slightly higher than the commercial PSA. In the polymerization, ethanol as the solvent
also acted as a chain transfer agent. No other transfer agent has been added to optimize
the molecular weight in this study. Introducing a small amount of crosslinker EGDM
significantly increased the molecular weight of the copolymer, but gelation occurred
when crosslinker content was high. The molecular weight distribution of the cationic
PSAs is in the optimized range. The glass transition temperatures (Tg) of the PSA
samples are shown in Figure 1. It is obvious that with increased cationic c
o
polymer is in the reasonable range
p
been reported previously, only the adhesive properties and recycling ability of these new
cationic PSAs will be the focus of this paper.
As indicated before, this study is to synthesize cationically charged and water-
soluble/dispersible PSA to solve the stickies
so
relationship between ca
m
monomer in the polymer, the
w
28

monomer MAPTAC is hydrophilic, while butyl acrylate is hydrophobic. When the
cationic monomer content in the polymer increases, the polymer becomes more
hydrophilic. Thus the water solubility increases.
Adhesive Properties
The function of PSAs is to ensure instantaneous adhesion upon application of light
ressure. PSAs must possess viscous properties in order to flow and to be able to
on the PSA properties. When
ationic monomer content increases, 180o peel strength decreases, and shear strength
p
dissipate energy during the adhesive bonding process and must also be elastic and be able
to store bond rupture energy to provide strong bonding. The end-use properties, which
are essential in characterizing the nature of PSAs, include tack, peel adhesion, and shear.
Tack measures the adhesive’s ability to adhere quickly, peel adhesion measures its ability
to resist removal through peeling, and shear measures its ability to hold in position when
shear force is applied. These PSA end-use properties depend on the nature and
composition of the PSA polymer. The adhesive properties of cationic PSAs on polyester
films were measured in this study and compared with those of commercial products. The
results are shown in Table 2. From Table 2, it can be seen that different commercial
products showed significantly different adhesive properties. The peel and shear strengths
can vary widely depending on the PSA applications. Generally, peelable PSA has weak
shear and peel strengths, while nonpeelable PSA has very strong peel strength. Cationic
PSAs have different PSA properties depending on the PSA composition.
Figure 2 shows the effect of cationic monomer (MAPTAC)
c
generally increases. Peel adhesion is the force required to remove a PSA-coated film
from a specific test surface under standard conditions (specific angle and rate). The
measurement of peel adhesion involves a bonding step and a debonding or peeling step.
The efficiency of the bonding process is related to the adhesive's ability to exhibit viscous
flow. In order to achieve peel adhesion, the bonding stage involves some dwell time.
The debonding process involves a rapid deformation of the adhesive mass. Thus, the
higher the peel strength, the higher the PSA's ability to resist bond deformation at high
29

strain rates. Peel strength gives a measure of adhesive or cohesive strength, depending on
the mode of failure [24]. Shear resistance is measured as a force to pull the PSA material
parallel to the surface to which it was affixed with a definite pressure [25]. It measures
e cohesion strength of the PSA. For PSA with low cationic monomer content, the Tg is
viscous and more easily forms a continuous layer on substrate for
rong bonding. On the other hand, because the molecules can flow easily, the cohesive
ear, and tacky
rengths can be prepared depending on the requirements of the end-use properties. By
th
low; thus, it is more
st
bonding would be easier to break. PSA1-3 all have cohesion failures in peel and shear.
The results indicate they have stronger bonding strength on substrate than cohesion
strength. With increased cationic monomer content, the cohesion strength increases, but
the molecule flow ability reduces. Thus the shear strength increases, and peel strength
decreases.
Introducing a small amount of crosslinker into the polymer can increase the polymer
cohesion strength. Figure 3 shows the effect of crosslinker on the PSA properties. It can
be seen that with increased crosslinker content, the shear strength increases. The effect of
crosslinker on peel strength is not significant. Too much crosslinker can significantly
limit the ability of polymer diffusion on a substrate and thus may reduce the peel
strength.
Summarizing the data in Figures 1 to 3 and Tables 1 to 2, it can be concluded that
cationically charged pressure-sensitive adhesives with different peel, sh
st
introducing cationic components into the polyacrylate backbone, the PSAs can be water
soluble or dispersible depending on the cationic comonomer content, molecular weight,
and crosslinking degree.
PSA Repulpability
Figure 4 shows the repulpability of the cationic PSAs during the paper recycling process.
It can be seen that PSA formed large stickies particles when the cationic content was low.
When the cationic content was high, no stickies particles were observed. The
30

repulpability of PSA is obviously dependent on the PSA’s water solubility/dispersibility.
PSA1 is not water soluble. PSA3 could disperse in water and form colloidal particles.
PSA4 to 7 are water soluble. Although PSA2 as a bulky polymer can only swell in water,
when it formed a very thin PSA layer (less than 25 µm) on paper and then was recycled,
the shear at repulping broke the PSA film to invisible microparticles.
PSA Adsorption Isotherm on Wood Fiber
When cationic PSA on recycled paper dissolved or dispersed during repulping, it became
either cationic charged molecules or microparticles. Because fibers are negatively
charged, cationic charged materials would be able to adsorb on fibers. The adsorption
apability would be dependent on both the cationic PSA and the fiber. Figure 5 shows
should be able to be removed from the papermaking system.
e/dispersible PSAs are all negatively charged. They cannot
sorb on negatively charged fibers and be removed from the water system. Thus they
the papermaking water system. When there are sudden changes of
mperature, pH, or electrolyte in the water, the soluble PSA at high concentration may
c
the adsorption isotherm of PSA4 on the pulp of copy paper. It can be seen that when the
total amount of cationic PSA in the copy paper is less than 4%, more than 90% of PSA
will be adsorbed on the fiber. Adsorption equilibrium could not be reached even when
the PSA content in the copy paper reached 8%. In the paper recycling plant, the recycled
paper normally contains more anionic materials than pure copy paper. Thus more
cationic PSA
Accumulation of PSA in Pulping Water
Due to environmental concerns and the desire to save costs, papermaking mills are totally
or significantly closing the water loops. When water loops are closed and the
papermaking process water is reused, the contaminants in water increase. Currently,
commercial water-solubl
ad
will accumulate in
te
precipitate and cause stickies problems. In order to avoid the problems, the process water
would have to be treated frequently to remove the PSA.
31

It is known that cationic PSA can adsorb on fiber. But it is worthwhile to see if the
cationic water-soluble PSA will accumulate in a closed papermaking system. The
accumulation of cationic PSA in the closed pulping water system was studied, and the
results are shown in Figure 6. In the study, copy paper with 0.25% of cationic PSA4 was
repulped at 1% consistency. In 15 pulping cycles, the PSA concentration in the pulping
ater was almost constant at about 0.6 mg/L. The PSA concentration in the pulping
PSA adsorption on fiber. This suggests that
ver 97% of PSAs were adsorbed on fiber, and the accumulation of cationic PSA in the
d that both the
ater-dispersible and water-soluble PSAs did not have obvious effects on paper tensile
paper sizing was also studied. It was found that
ith 1% of PSA in paper, the HST value of the paper increased from 0 second to a few
w
water would be 25 mg/L if there were no
o
pulping water is negligible.
The Effect of PSA on Paper Properties
Cationic PSA can adsorb on fiber and be removed with the fiber during papermaking.
Since the fiber surface would be partially modified by the adsorbed cationic PSA, it is
necessary to know if the adsorbed PSAs have any effect on final paper properties. Figure
7 shows the effect of PSA2, which formed water-dispersible microparticles during
repulping, on the paper tensile strength. Figure 8 shows the effect of PSA4, which
formed water-soluble molecules, on the paper tensile strength. It was foun
w
strength. The effect of cationic PSAs on
w
seconds for PSA2 and PSA4. This slight increase of HST should be negligible.
Conclusions
Cationically charged PSAs with various end-use properties were developed. These PSAs
could be water dispersible or soluble in paper recycling depending on the charge densities
of the PSAs and would not form stickies problems in pulping and papermaking processes.
The dispersed/dissolved PSA could adsorb on negatively charged fibers and be removed
from the papermaking system. They would not accumulate in the process water. The
sorbed PSAs on the fibers did not have obvious effects on final paper properties. ad
32

Results indicate that the new cationic PSA is a possible solution for the stickies problems
in paper recycling.
Table 1. Characteristics of PSA copolymers
Cationic unit fraction (mol%) Sample
in feed in p
EGDM M
olymer (mol%) (g/mol) (H2O, 50oC) w/105 Mw/Mn Solubility
PSA1 5.0 5.7 0 2.3 1.5 No
PSA2 8.0 8.6 0 2.0 1.3 Swollen
PSA3 10.0 10.6 0 1.8 1.3 <1.5 µm
PSA4 15.0 15.2 0 1.4 1.3 Soluble
PSA5 20.0 20.9 0 2.3 1.6 Soluble
PSA6 15.0 17.6 0.2 8.6 1.6 Soluble
PSA7 15.0 17.3 0.5 13 2.0 Soluble
PSA8 15.0 - 0.8 Gel formed in polymerization
33

Table 2. Adhesive properties of cationic PSAs and commercial PSAs
180o Peel Adhesion
(10 min Dwell) (PSTC-1)
Shear Strength (PTSC-7) Sample
g/in Failure Type(e) Hour Failure Type
PSA1 653.7 C 0.2 C
PSA2 586.3 C 0.3 C
PSA3 532.0 C 0.4 C
PSA4 155.6 A 1.0 A
PSA5 70.8 A 2.8 A
PSA6 249.0 A 5.7 A
PSA7 110.4 A >40 ilure h No fa
Com1(a) 266.0 C 3.9 C
Com2(b) 509.4 A > 40 ilure No fa
Com3(c) 7.9 A Insta ilurent fa A
Com4(d) 939.6 A 3.7 A a ry sed PSA from Company Poly ny 2. c
eelable note. d Nonpeelable general postal label. e A: adhesion failure; C: cohesion
ilure.
cheme 1. Polymer synthesis.
Polyac lic-ba 1. b acrylic-based PSA from Compa
P
fa
nmInitiator
+CH2 CH
C O
OR
CH2 C
Me
C O
NH
CH2)3
N+(Me)3Cl-( (
CH2 CH CH2 C
Me
C O
NH
C O
OR
CH2)3
N+(Me)3Cl-
m nnmInitiator
+CH2 CH
C O
OR
CH2 C
Me
C O
NH
CH2)3
N+(Me)3Cl-( (
CH2 CH CH2 C
Me
C O
NH
C O
OR
CH2)3
N+(Me)3Cl-
m n
S
34

0
-40
-35
-30
-25
-20Te
mpe
ratu
re (
oC)
-15
0 5 10 15 25M AC Content (m )
-10
-5
20ol%APT
F lass perature (Tg) of BA/MAPTAC copolymers as a function of
t AC con in the copolym .
C content in the PSA copolymer on the PSA properties.
igure 1. G transition tem
he MAPT tent er
0
0.5
1
1.5
2
2.5
0 5 10 15 20 25
MAPTAC Content (mol%)
Shea
r (hr
)
0
100
200
300
400
500
600Pe
el (g
/in)
3 700
Figure 2. The effect of MAPTA
35

05
101520
0 0.2 0.4 0.6
Crosslinker Content (mol%)
She
ar (h
r)
0
50
100
Pee
l (g/
in)25
30354045
150
200
250
300
Figure 3. The effect of crosslinker content in the PSA copolymer on the PSA properties
(A) (B) (C)
igure 4. Repulpability of cationic PSAs. Cationic monomer content: (A) 5.7 mol%; (B)
(PSA contains 15 mol% MAPTAC).
F
10.6 mol%; (C) 15.2 mol%.
36

010203040506070
0 20 40 60 80 100
PSA concentration (mg/g paper)
Ads
orpt
ion
(mg/
g pa
per)
of PSA4 in the closed pulping water system
Figure 5. Adsorption isotherms of PSA4 on the wood fiber of office copy paper.
00.10.20.30.40.50.60.70.80.9
1
0 2 4 6 8 10 12 14 16
Pulping cycle
PSA
con
cent
ratio
n (m
g/L)
Figure 6. The accumulation
37

0
0.5
1
1.5
2
2.5
3
Tens
ile (N
/mm
)
Blank0.3% PSA20.5% PSA21% PSA2
Figure 7. T
Figure 8. The effect of PSA4 on paper tensile strength
he effect of PSA2 on paper tensile strength.
0
0.5
1
1.5
2
2.5
3
3.5
Tens
ile (N
/mm
)
fiber only
+0.3% Lignin
+0.3% Lignin+0.3% PSA4
+0.3% Liginin+0.5%
38

References
1. M. Bernard, W.T. Ford and T.W. Taylor, Macromolecules, 17, 1812 (1984).
2. W.T. Ford and H. Yu, Langmuir, 9, 1999 (1999)..
3. B. Alince, Tappi J., 60(12), 133 (1977).
4. M. Inoue, B. Alince, Y. Shao and T.G.M. van de Ven, International Paper and
Coating Chemistry Symposium, Ottawa, Canada, June 1996, pp 119.
5. H. Ono and Y. Deng, J. Colloid Interface Sci., 188, 183 (1997).
6. H. Ono and Y. Deng, Engineering and Papermakers Conference, Nashville, TN,
1997, pp 837.
. O. Ishikawa, Y. Sasagawa, A. Tsuji and T. Yamashita, Jpn. Tappi J., 47, 334 (1993).
ur. Polym. J., 26(1), 35 (1990).
. K.H. van Streun, W.J. Belt, P. Piet and A.L. German, Eur. Polym. J., 27(9), 931
(1991).
0. D. Upson, J. Polym. Sci. Polym. Symp., 72, 45 (1985).
11. S. Bon, H. van Beek, P. Piet and A.L. German, J. Appl. Polym. Sci., 58, 19 (1995).
12. J. Otaigbe, R.E. Banks and S. Smith, Br. Polym. J., 20, 53 (1988).
13. Y. Deng, Z. Yan and N. Yang, Colloid. Polym. Sci., 277, 227 (1999).
14. N. Konar and C.J. Kim, J. Appl. Polym. Sci., 69, 263 (1998).
15. T. Nonaka, K. Fujita, J. Membr. Sci., 144 (1-2), 187 (1998).
16. M. Fineman and S.D. Ross, J. Polym. Sci., 5, 259 (1950).
17. T. Kelen and F. Tudos, J. Macromol. Sci. Chem., A9, 1 (1975).
18. A. Ledwith, G. Galli, E. Chiellini and R. Solaro, Polym. Bull., 1, 491 (1979).
19. W.-F. Lee and C.-C. Tsai, Polymer, 35, 2210 (1994).
0. S. Igarashi, J. Polym. Sci. Polym. Lett., 1, 359 (1963).
1. J. Kendall, F. Foley and S.G. Chu, Adhesive Age, 29(9), 26 (1986).
2. A. Midgley, Adhesive Age, 29(9), 17 (1986).
24. P. Caton, European Adhesives and Sealants, 12, 18 (1990).
25. I. Benedek and L.J. Heymans, Pressure Sensitive Adhesive Technology, Marcel
Dekker, Inc, New York, 214 (1997).
7
8. W.M. Brouwer, M. van Haeren and P. van Haeren, E
9
1
2
2
2
23. F.T. Sanderson, Adhesive Age, 26(12), 26 (1983).
39

PART 2. WATER-SOLUBLE/DISPERSIBLE CATIONIC PRESSURE
ENSITIVE ADHESIVES FROM EMULSION POLYMERIZATION
cati ed water based
- and miniemulsion
(CHP/TEPA) as a redox initiator system was investigated. It was found that the rate of
h
an increase in initiator concentration. For miniemulsion polymerization, the
also found that the average
th
rticle decreased in
d that aqueous
lymerization take place
olymerization; it is both
in transfer agent. All the
unction of TEPA and
ethacryloyoxy)ethyl]trimethyl
opolymerization
nvestigated. The postulate of interfacial
tor system (one hydrophobic and
a complex effect on the
mec MAETAC, and the polymerization method
S
2.1 Summary
As reported in Part 1, solvent based water soluble/dispersible and easily removable
onic PSAs have been successfully developed. We then develop
cationic PSAs from emulsion polymerization. First, the macro
polymerization of butyl acrylate (BA) with cumene hydroperoxide/tetraethlenepentamine
polymerization was monotonically decreasing rather than going through a maximum as is
common in emulsion polymerization. Furthermore, the polymerization rate at hig
monomer conversion of macroemulsion polymerization was unexpectedly decreased with
polymerization stopped at rather low conversion. It was
number of free radicals per particle dropped very quickly with polymerization time. Wi
increased initiator concentration, the average number of radicals per pa
the macroemulsion polymerization. Molecular weight analysis indicate
phase polymerization, interfacial polymerization and particle po
simultaneously. It is proposed that TEPA plays two roles in the p
a reducing agent in the redox initiator system, and a cha
unexpected results are well explained by postulating this multiple f
taking the heterogeneous nature of emulsion polymerization into account.
Then the polymerization kinetics of butyl acrylate/[2-(m
ammonium chloride (BA/MAETAC) macroemulsion and miniemulsion c
with CHP/TEPA as a redox initiator system was i
copolymerization with the two-component redox initia
the other hydrophilic), was confirmed. Adding MAETAC had
polymerization kinetics of BA. The influence was ascribed to variations in the nucleation
hanism dependent on the level of
40

(macroemulsion versus miniemulsion). It is proposed that at the beginning of
macroemulsion copolymerization with high MAETAC composition, micellar
opolymerization occurs, which controls the nucleation process. Hydration properties of
ed to characterize the copolymer composition. The composition of the
opolymer from the interfacial polymerization is very heterogeneous. With an increase in
and TEPA is
ydrophilic, and hence the free radicals are formed at the particle-water interface, and
c
the latex were us
c
BA conversion or of the particle size, the copolymer composition is lower in BA. Adding
salt increases MAETAC content and decreases BA content in the copolymer.
Finally, the end use properties of the PSAs were evaluated, and the reulpability of the
PSAs in paper recycling was studied. It was found that the cationic PSA from
miniemulsion polymerization itself was insoluble or non-dispersible in water during the
paper recycling process. However, if this water-insoluble cationic PSA from
miniemulsion was formulated with a water-soluble cationic PSA made from ethanol, the
solubility or dispersibility of the former PSA in water was improved. The molecular
weight and crosslinking degree of the PSA polymer have significant effects on the PSA
properties and dispersability.
2.2 Emulsion Polymerization of Butyl Acrylate with the Cumene Hydroperoxide/
Tetraethylenepentamine Redox Initiator
Very recently, Gilbert [1] showed that the cumene hydroperoxide/tetraethlenepentamine
(CHP/TEPA) redox initiator system is very useful in promoting grafting of acetate
monomer onto the surface of natural rubber particles. CHP is hydrophobic
h
this promotes surface grafting. Siadat [2] reported that, by the use of a nonionic surfactant
and a two-component redox initiator (a water-soluble reductant and a hydrophobic
peroxide), a copolymer with moderate ionic monomer content could be prepared. Turner
[3] found, for a similar system, that the sulfonate content of the copolymer of a sodium
styrene sulfonate/styrene emulsion copolymerization was dependent upon the initial
sodium styrene sulfonate charge, but was always lower than the recipe amount. This
behavior appeared not to be dependent on the type of initiator (water-soluble persulfate or
41

a redox initiator with one component present in the hydrocarbon phase and the other in
the aqueous phase). Their results contrast sharply with those of Siadat.
It is clear that kinetic studies of redox initiator systems such as CHP/TEPA, in which one
component is water-soluble and the other is hydrophobic, are needed. As a preliminary to
studies of emulsion copolymerization of butyl acrylate (BA) with cationic (strongly
hydrophilic) monomers, the present work was undertaken to investigate the kinetics and
echanism of the emulsion polymerization of BA with the redox initiator CHP/TEPA. m
Experimental
Materials and Experimental Procedure
All reagents were purchased from Aldrich Chemical. BA was purified by washing three
times with a 10% NaOH solution, followed by three washes with deionized water. Others
reagents were used as received. Triton X-405 was used as surfactant. Hexadecane (HD)
as used as cosurfactant in the miniemulsion polymerization. Table 1 shows the basic
solution of de-ionized water and Triton X-405 was emulsified with a solution of BA
w
polymerization recipe.
A
and CHP (and HD in the cases of miniemulsion). To make a miniemulsion, sonication
was then performed for 15 min with a 300W sonic dismembrator at 70% power while a
magnetic stirrer provided bulk mixing. For the macroemulsion (conventional emulsion)
polymerizations no sonication was done. The macroemulsion or miniemulsion was added
to the reactor and purged with nitrogen for at least 30 minutes to remove dissolved and
vapor space oxygen. The reactor temperature was then raised from room temperature to
40 °C using a thermostated water bath. The polymerization was begun by injecting the
recipe amount of TEPA solution. Samples were taken at intervals for analysis and
stabilized with inhibitor. BA conversion was determined gravimetrically.
42

The molecular weight distribution (MWD) of samples was determined by gel permeation
chromatography (GPC) using a Waters 410 GPC with two columns: 5 x 10⁵ and 5 x 10²
The solvent was tetrahydrofuran (THF) and the flowrate was 1 ml/min. Samples were
esults and Discussion
Å
inhibited, dried, then dissolved in THF for analysis. Particle size analysis was
accomplished using a Protein Solution LSR-TC dynamic light scattering instrument. The
latex was diluted with a Triton X-405 solution and kept in an oven at 80 °C for 12 hours
to drive off the unreacted BA prior to analysis.
R
onomer Conversion
he macroemulsion and miniemulsion polymerizations were carried out at various
cays so much faster at higher initiator concentrations that the
olymerization rate late in the reaction decreases with an increase of initiator
t equal rates. It
ould appear that some side reaction is consuming TEPA.
M
T
initiator concentrations. The conversion-time curves are shown in Figures 1 and 2. The
polymerization rate is highest at the beginning of the reaction, and decays monotonically
thereafter. For the macroemulsion polymerizations, the polymerization rate in the
beginning increases with increase of initiator concentration. However, unexpectedly, the
polymerization rate de
p
concentration, even at the same conversion.
By contrast, the miniemulsion polymerizations kinetics look something like
homogeneous polymerizations with a highly active initiator. At the beginning, the
polymerization takes place rapidly. However, it decays very quickly so that the
conversion-time curves level off at rather low conversions. It was found that if more
TEPA was added to the system after the conversion-time curve has leveled off, the
polymerization could be restarted, and proceeded quickly. It is clear from this that in
miniemulsion polymerization, TEPA is consumed more rapidly than CHP, although the
initiation mechanism indicates that CHP and TEPA should be consumed a
w
43

For miniemulsion polymerization, the conversion-times curves have the same shape for
both initiator concentrations, whereas the macroemulsion polymerization rate decays
faster the higher the initiator concentration. In order to gain a better understanding, the
average number of free radicals per particle was determined.
Average Number of Free Radicals Per Particle
The evolution of the number of particles with time is presented in Figures 3 and 4. It can
r of particles is high for macroemulsion polymerization, which
dicates a high efficiency of nucleation. It is also found that limited aggregation takes
stages of macroemulsion polymerization, and a distinct second
ucleation occurred around a conversion of 40%, which can be ascribed (per Ozdeger et
, it ended at approximately the same time,
egardless of initiator concentration (Figure 5).
be seen that the numbe
in
place during the early
n
al., 1997 in the comparable styrene system) to the partition behavior of Triton X-405 into
the monomer droplets. In the late stage of macroemulsion polymerization, limited
aggregation occurs once more, indicating a deficit of surfactant for colloidal stability. For
miniemulsion polymerization, no limited aggregation and second nucleation are seen at
the given monomer conversion. The lack of secondary nucleation in miniemulsion
polymerization with nonionic surfactant is also reported by Schork [4]. It is interesting to
note that, for miniemulsion polymerization, although nucleation ended earlier in terms of
conversion, at lower initiator concentration
r
From the particle number and conversion-time curves, the average number of free radical
number per particle can be calculated as [5]:
ppp
Mavp
NCknNR
n 0,=
Here Rp is the overall polymerization rate calculated as the slope of the conversion time
curve in mol/s; kp is the propagation rate constant, [kp=1.874e11*exp(-7026.7/T), L/mol-
s] [6]. (Other values of kp might have been used; this value was used because the citation
also gives a reference for the average radical number. For the present argument, the trend
in n is more important than its absolute value.) Cp is the monomer concentration in a
44

particle. (For macroemulsion polymerization, the value at saturation [droplets present]
was taken as 4.54 mol/L. After 40% conversion, the values were calculated as a function
of conversion. For miniemulsion polymerization, the values were calculated as a function
of conversion.) Np is the number of particles, calculated from the volume average particle
ze measured by dynamic light scattering. Nav is Avogadro's constant. Finally, nM,0 is
volume of water.
si
the initial number of moles of monomer per unit
Figures 6 and 7 show n as a function of time. It has been reported that for BA
macroemulsion polymerization, the average free radical number per particle ( n ) may be
up to 30 [6,7]. Here, it was found that n is much less than that of BA macroemulsion
polymerization using more common initiators, and decreases with increase in initiator
concentration. Clearly, exit of free radicals from the particles plays a significant role in
the present system; this then implies significant chain transfer [5]. It has been reported
that alkyl amine can function as a chain transfer agent in the macroemulsion
polymerization [8], so it is plausible that TEPA should be a transfer agent in the present
system. The assumption is in good agreement with the previous evidence that TEPA is
being consumed by a side reaction, and will be supported by molecular weight
distribution (MWD) data below. Thus, it is postulated that TEPA plays two roles in the
system: reducing agent in the redox initiator system, and chain transfer agent. With
increasing initiator concentration, the size of particles (inferred from the particle number
data in Figure 3), decreases. Because the rate coefficient for escape of free radicals from
e particle is proportional to the square of the radius of the particle, the exit rate of free
gent, the exit rate of free radicals would be
increased. It is proposed that the enhancement in the exit rate by chain transfer to TEPA
causes a decrease in
th
radicals would be much increased with an increase of TEPA concentration. Additionally,
because TEPA is an efficient chain transfer a
n with increase an in initiator concentration.
Because of the difference in hydrophilicity between TEPA and CHP and monomer, it is
proposed that most of the TEPA is consumed at the interface between the water phase
and the particle by reaction with CHP or by chain transfer from a live polymer chain. The
change in the size of the particle would exert a significant influence on TEPA reaction
45

kinetics. With a decrease in particle size (increase in the total surface area), more TEPA
would be reacted. That means that the TEPA concentration would decay more quickly.
This is proposed as an explanation for why the polymerization rate in macroemulsion
polymerization decays faster with the higher initiator concentration, as shown in Figure 1.
For miniemulsion polymerization, the particle size is more determined by the droplet
ize, so initiator concentration has little influence on the particle size. This is why,
e
he multiple peaks could result from: (i) a time-cumulative effect, because the GPC
s
contrary to the effect seen in macroemulsions, the decay of the miniemulsion
polymerization rate has little dependence on initiator concentration. Additionally,
because most of the CHP is located in th particle phase, the decay of the miniemulsion
polymerization rate is more like that of a homogeneous polymerization system. In
macroemulsion polymerization, most of the CHP resides in the monomer droplets in the
early stages of polymerization. CHP must continuously transfer from the droplets to the
particles to react with TEPA, which would retard the TEPA consumption and prevent the
TEPA exhausting seen in miniemulsion polymerization.
Molecular Weight and Its Distribution
The MWD development with conversion was monitored at two different initiator
concentrations. The GPC spectra at low conversion are shown in Figures 8 and 9. For all
GPC spectra shown, the contributions from the surfactant and initiator have been
subtracted out. From Figures 8 and 9, it is clear that the spectra of polymer formed at the
low conversion with the higher initiator level show three distinct peaks. The peak with
highest retention volume is separate from the other two that partially overlap. The peak
with highest retention volume has a molecular weight of approximately 1,000.
T
sample represents an accumulation of product formed since the beginning of the reaction,
or (ii) a space-cumulative effect, since, because of the multi-phase nature of macro- and
miniemulsion polymerization, the GPC sample represents material formed in all phases.
With a time-cumulative effect, the multi-peak effect should not be present at various
46

monomer conversions. Since Figures 10 and 11 show that the multi-peak effect is
persistent through changes in conversion, it is postulated that the multi-peak
chromatograms represent a space-cumulative effect. As a matter of fact, macroemulsion
polymerization is a heterogeneous system in which water-insoluble monomer and latex
particles are dispersed in a continuous aqueous phase. It is assumed that the three peaks
f total monomer conversion. A
mber of observations can be made: (i) At the beginning of polymerization, a great deal
fter that, the amount of oligomer formed increases
eadily with conversion. (ii) With increase in initiator concentration, the amount of
are derived from three different polymerization loci: the aqueous phase, the particle-water
interface, and the particle interior.
The lowest molecular weight polymer is postulated to have been formed as oligomers in
the aqueous phase. The highest molecular weight material is postulated to have been
formed in the particle interior, and the intermediate molecular weight material formed as
the interface. With these assumptions, from the peak area ratio and the monomer
conversion, it is possible to determine the fraction of poly(butyl acrylate), which exists as
oligomers formed in the aqueous phase. Figure 12 shows the oligomers concentration
(expressed as total monomer conversion) as a function o
nu
of oligomeric material is formed, and a
st
oligomer increases; at higher initiator concentration, the slope of the curve increases. (iii)
The amount of oligomer formed at the beginning of miniemulsion polymerization is
much less than that of macroemulsion polymerization; the slopes of the curves are lower
in miniemulsion polymerization than in the macroemulsion polymerization; (iv) The
intercept at zero conversion linearly increases with increase in initiator concentration (as
shown in Figure 13). This can be well explained by the aqueous-phase polymerization
kinetics, as shown in Appendix.
It is unexpected that much of the product at the beginning of polymerization results from
the aqueous polymerization in that the ratio of kp/kt is so high that even with a water-
soluble inititator like potassium persulfate (KPS), initiation efficiency can be up to 99%
(Gilbert, 1995). This suggests the existence of other chain-stopping mechanisms (other
than termination) such as chain transfer. This indication is in good agreement with the
47

assumption that TEPA acts as a chain transfer agent in the present system. Because
TEPA is hydrophilic, TEPA concentration would be high in the water phase, low in the
particle interior, and intermediate at the interface. Because the TEPA concentration is
high, and the BA concentration is very low in the water phase, some oligomers would
form there, corresponding to the peak with highest elution time. Additionally, it is
reasonable to assign the peak with middle elution time to polymer formed in the
interface, and the peak with lowest elution time (highest molecular weight) to polymer
rmed in the interior of the particles. It is postulated that, at the beginning of
e seen that the MWD data at higher conversion all show
n unexpected behavior: an excess of low molecular weight species. A similar effect has
fo
polymerization, there are a large number of free radicals formed in the aqueous phase by
reaction of TEPA with CHP (present at low levels in the aqueous phase) leading to high
levels of oligomer formation. In addition, due to the large number of micelles present
early in a macroemulsion, polymer will be formed in the precursor particles, then the
radicals will be quickly desorbed due to chain transfer and desorption from the very small
(high surface area) particles. The free radical concentration in the aqueous phase should
be higher at the beginning of macroemulsion polymerization than at the beginning of
miniemulsion polymerization due to the relative size of the initial particles. That is why
the amount of oligomer formed early in miniemulsion polymerization is much less than
in macroemulsion polymerization. In the middle and late stages of polymerization, the
oligomers are much less likely to form because: (i) The free radical concentration is much
reduced due to TEPA consumption. (ii) The TEPA concentration decays quickly so that
oligomer formation by chain transfer is much less. (iii) Most free radicals can propagate
into surface-active free radicals, and hence adsorb into particles. (iv) There are enough
particles to capture the surface-active free radicals.
From Figures 10 and 11, it may b
a
been reported in methyl methacrylate and butyl methacrylate macroemulsion
polymerization [9,10]. It has been suggested that this phenomenon may be due to a
spatial inhomogeneity arising from surface anchoring. At relatively high conversion,
monomer concentration in the particles is much lower, and so the radical cannot grow as
quickly away from the surface. This causes a larger radical concentration in the outer
48

portion of the particle compared to that deep within the particle. Clearly, this would lead
to an increased rate of transfer to TEPA and an increase in the amount of low molecular
weight species.
Conclusions
From the present studies, it would seem that TEPA plays a double role: reducing agent in
the redox initiator system and chain transfer agent. The unexpected data on monomer
conversion and molecular weight is well explained if one postulates chain transfer via
TEPA and considers the multi-phase nature of mini- and macroemulsion polymerization.
Results for mini- and macroemulsion polymerization differ in ways which are
explainable in terms of differences in particle size and number, particularly early in the
reaction. It was suggested that the aqueous phase polymerization, interfacial
polymerization and particle polymerization co-exist. Appendix
At zero conversion, no particles exist. It is assumed that free radicals will form and
terminate in the aqueous phase. A population balance of free radicals in the aqueous
phase (neglecting, at early times, radical entry into micelles or droplets) gives
2][]][[][ ••
−= MkCHPTEPAkdtMd
td (1)
Making the pseudo-steady state assumption, we have
tk (2)
and
]][[ •= MMkR pp (3)
Substituting Eqn. (2) into Eqn. (3) gives
d CHPTEPAkM
]][[][ =•
t
dpp k
CHPTEPAkMkR
]][[][=
(4)
49

Assuming a distribution coefficient (k) relating aqueous and oil-phase concentrations for
CHP gives:
[CHP]=k[CHP]o=k’[TEPA] (5)
here the subscript "o" refers to the oil phase. Here, [TEPA] is linearly related to [CHP]o
nce, CHP and TEPA are added at a stoichiometric ratio of one, and, at early
mes, the effects of chain transfer have not substantially depleted TEPA. Combining
able 1. Basic Recipe
Formula Amount (g)
w
(though k'), si
ti
Equations (4) and (5) gives
Rp=K[TEPA] (6)
where K is a proportionality constant. From Equation (6), it is clear that the
polymerization rate in the aqueous phase is linearly proportional to the initiator
concentration, and in good agreement with the experimental data.
T
Name Acronym
Butyl acrylate BA H2C=CH2CO2(CH2)3CH3 75
Triton X-405 4-(C8H17)C6H4-(OCH2CH2)nOH n=40 6.43
Cumene
hydroperoxide
CHP C6H5C(CH3)2OOH variable
Tetraethlene-
pentamine
TEPA HN(CH2CH2NHCH2CH2NH2)2 Molar
equivalent
t
er H2O 115
(80%)
o CHP
wat
50

0.8
Figure 1.
igure 2. Conversion-Time Curves for Miniemulsion Polymerization with Varying
itiator Levels
Conversion-Time Curves for Macroemulsion Polymerization with Varying
Initiator Levels
F
In
0
0.1
0.2
0 20 40 60 80 100 120
0.3
0.4
0.5
0.6
0.7
Con
vers
ion
0.9
140 160
Time (min)
2.8wt%4.0wt%1.3wt%
0
0.1
0.2
0.3
0.4
0.
0.
0 20 40 60 80 100 120
Time (min)
Cer
5
6
onv
sion
1.3wt%4wt%
51

1E+17
1E+18
1E+19
0 0.2 0.4 0.6 0.8 1
Conversion
Part
icle
Num
ber
1.30%2.80%4.00%
Figure ulsion
Figure 4. The Evolution of Particle Number with Conversion for Miniemulsion
Polymerization with Varying Initiator Levels
3. The Evolution of Particle Number with Conversion for Macroem
Polymerization with Varying Initiator Levels
1E+16
1E+17
1E+18
0 0.1 0.2 0.3 0.4 0.5 0.6
Conversion
Num
ber o
f Par
ticle
s
4.00%1.30%
52

1E+16
1E+17
1E+18
0 10 20 30 40 50 60 70 80
Time (min.)
Part
icle
Num
ber
4.00%1.30%
Figure 5. Particle Number Development with Time for Miniemulsion Polymerization
with Varying Initiator Levels
0
0 .1
0 .2
0 .3
0 .4
0 .5
0 .6
0 .7
0 .8
0 .9
0 2 0 4 0 6 0 8 0 1 0 0
T im e (m in .)
Num
ber o
f Fre
e R
adic
als
per P
artic
le
1 .3 %2 .8 %4 .0 %
Figure 6. Number of Free Radicals Per Particle Development for Macroemulsion
Polymerization with Varying Initiator Levels.
53

0.01
0.1
1
10
0 10 20 30
Time (min)
Num
ber o
f Fre
e R
adic
als
per
Part
icle 4.0%
1.3%
Figure 7. Number of Free Radicals per Particle for Miniemulsion Polymerization with
Varying Initiator Levels.
0
0.05
0.1
0.15
0.2
0.25
0.3
0.35
0.4
0.45
0.5
0 10 20 30
R etention vo lum e (m l)
Wei
ght F
ract
ion
Den
sity
em uls ion, x=0.173m in iem uls ion , x=0.087m in iem uls ion , x=0.267
Figure 8 Molecular Weight Distribution of the Polymer from Macroemulsion and
Miniemulsion Polymerization, Initiator = 1.33 wt%
54

0
0.05
0.1
0.15
0.2
0.25
0.3
0.35
0.4
0.45
0.5
0 5 10 15 20 25 30 35
Retention Volume (ml)
Wei
ght F
ract
ion
Den
sity
miniemulsion, x=0.226
emulsion, x=0.188
Figure 9 Molecular Weecular Weight Distribution of the Polymer from Macroemulsion and
MMiniemulsion Polymerization, Initiator = 4.0 wt%
igure 10. Molecular Weight Distribution Development with Conversion, Miniemulsion
olymerization, Initiator = 1.33 wt%
ight Distribution of the Polymer from Macroemulsion and
iniemulsion Polymerization, Initiator = 4.0 wt%
igure 10. Molecular Weight Distribution Development with Conversion, Miniemulsion
olymerization, Initiator = 1.33 wt%
0
0.05
0.1
0.15
0.2
0.25
0.3
0.35
0.4
0.45
0.5
0 5 10 15 20 25
Wei
ght F
ract
ion
Den
sity
x=0-0.173x=0.173-0.626x=0.626-0.742
Retention Volume (ml)
FF
PP
55

0
0.05
0.1
0.15
0.2
0.25
0.3
0.35
0.4
0.45
0.5
0 5 10 15 20 25
Retention Volume (ml)
Wei
ght F
ract
ion
Den
sity
x=0-0.087x=0.087-0.267x=0.267-0.412
Figure 11. Molecular Weight Distribution Development with Conversion,
Macroemulsion Polymerization, Initiator = 1.33 wt%.
lymerized in the Aqueous Phase Versus Total
onversion
0
0.02
0.04
0.06
0.08
0.1
0.12
0.14
0.16
0 0.5 1
Total BA Conversion
Con
vers
ion
emulsion, 1.3%[I]emulsion, 2.8%[I]emulsion, 4.0%[I]miniemulsion, 1.3%[I]minemulsion, 4.0%[I]
Figure 12. Conversion of BA Po
C
56

0
0.02
0.04
0.06
0.08
0.1
0.12
0 2 4 6
In itiator C oncentration (w t% )
Con
vers
ion
em uls ion m in iem uls ion
2.3 Emulsion Copolymerization of Butyl Acrylate with Cationic Monomer Using
an Interfacial Redox Initiator System
To copolymerize hydrophobic and cationic hydrophilic monomers by emulsion
polymerization is a challenge, since the cationic monomer (in this study, [2-
(methacryloyoxy)ethyl]trimethyl ammonium chloride, MAETAC) will reside almost
exclusively in the aqueous phase, while the hydrophobic monomer (in this study, butyl
acrylate, BA) will reside almost exclusively in the organic (droplet or polymer particle)
phase. Copolymerization of monomers with very different water-solubilities by emulsion
technology has long been an active field of research, with the goal of synthesizing
surface-functional polymer particles or increasing latex stability and mechanic properties
of the polymer [1,3,11-17]. However, most of the studies so far are limited to a very low
ydrophilic monomer level (less than 5 wt%). In all cases, the incorporation of water-
e monomer loaded into the system. Kim [18] used a shot process to obtain a
Figure 13. Correlation of Conversion of BA Polymerized in the Aqueous Phase with
Initiator Concentration
h
soluble monomer into the copolymer was very limited, regardless of the initial amount of
water-solubl
57

copolymer of styrene and sodium styrene sulphonate with a 6 wt% overall composition in
a soap-free emulsion polymerization. Recently, Gilbert [1] proposed that by selecting an
appropriate initiator system such as cumene hydroperoxide/tetraethylenepentamine
(CHP/TEPA), it is possible to graft hydrophilic monomer onto a hydrophobic polymer in
an emulsion process. For the current work, it was hoped that by using CHP/TEPA, the
hydrophobic CHP would meet the hydrophilic TEPA at the particle/water interface where
radicals would be produced at just the location where hydrophobic and hydrophilic
monomer are both present. Siadat [2] reported that by the use of a two-component redox
initiator, which was based on a water-soluble reducing agent and hydrophobic peroxide, a
copolymer with moderate ionic monomer content could be prepared by an emulsion
polymerization. However, Turner and co-workers [3] found that the redox initiator
system did not increase the incorporation of sodium styrene sulfonate into polystyrene
t obtained with a typical water-soluble initiator. Siadat based his conclusion on
e composition of the product at very low conversion (less than 2%). Turner and co-
ore careful and extensive studies should be
ied out to determine the role of two-component redox initiator system (one water-
an emulsion copolymerization of
MAETAC is inves insight on the mechanism of this complex
olymerization system.
over tha
th
workers drew their conclusion from the composition of the final product at high
conversion (greater than 58%). Clearly, m
carr
soluble, the other oil soluble), in
hydrophobic/hydrophilic monomer. In this part, polymerization kinetics of BA and
tigated in order to add
p
Experimental
Reagents
All agents were obtained from Aldrich Chemical. BA was purified by three washes with
a 10% NaOH solution followed by three washes with DI water. MAETAC was purified
by three washes with anhydrous ether. All other reagents were used as received. Triton
X-405 was used as surfactant. Hexadecane (HD) was used as cosurfactant in the
miniemulsion polymerization
58

Polymer Process and Recipe
The basic recipe is shown in Table 1. A solution of the recipe amounts of MAETAC, DI
water, Triton X-405, and NaCl was mixed with a solution of the recipe amounts of BA
and CHP (and HD in the cases of miniemulsion) under moderate shear. In the case of
miniemulsions, the coarse emulsion was subjected to sonication for 15 minutes with a
300 W sonic dismembrator at 70% power. Bulk mixing during sonication was provided
by a magnetic stirrer. The macroemulsion (conventional emulsion without HD or
sonication) or miniemulsion was added to the reactor and purged with nitrogen for a
minimum of 45 minutes while the reactor temperature was raised from room temperature
to 40 C. The polymerization was started by injecting the recipe amount of TEPA
solution. Samples were drawn from the reactor at intervals and inhibited at intervals for
subsequent analysis. Monomer conversion was determined gravimetrically. The pH
remained at about 12 during the course of the polymerization.
NMR Analysis
The latex samples from the reactor were directly injected into a NMR tube filled with d4-
methyl alcohol after quenching with a hydroquinone solution. The samples were then
analyzed in a 300 MHz Varian NMR.
ο
Particle Size Analysis
he latex was diluted with a Triton X-405 solution and held at 80 οC for more than 12
drive off the unreacted BA. No evidence of polymerization or limited
oagulation on heating was found. The apparent particle size was measured by dynamic
particle size.
T
hours to
c
light scattering with samples diluted with deionized water. A second measurement was
made for each sample where the diluent was filtered 1 M NaBr solution. The later was
used to collapse the layer of poly(MAETAC-BA) around the particles to get the true
59

Results and Discussion
The two monomers in the BA/MAETAC copolymerization are totally incompatible: BA
very hydrophobic and will reside primarily in the droplet/particle phase; MAETAC,
acially active free radical
ligomers. These oligomers can be captured by particles or micelles and continue
to high molecular weight in the organic phase. It has been stated that even
ith an oil-soluble initiator such as AIBN, most free radicals which generate polymer are
stem in question, it is important to determine if the
olymerization is initiated by free radicals formed in the aqueous phase or those formed
s interface, because free radicals formed in the aqueous phase
ould promote the formation of homopoly(MAETAC).
is
being an ionic monomer, is very hydrophilic and will reside almost exclusively in the
aqueous phase. The redox initiator system is composed of a hydrophobic oxidant (CHP),
residing primarily in the droplet/particle phase, and a hydrophilic reductant (TEPA),
residing primarily in the aqueous phase. These features make the emulsion
polymerization rather complex because the multi-phase nature of the system. This part
focuses on interfacial nature of the polymerization, and its effects on the kinetics of
polymerization and properties of the latex.
Evidence for Interfacial Initiation
In a typical emulsion polymerization, initiator dissociates in the aqueous phase and then
reacts with monomer dissolved in the water to form interf
o
polymerization
w
actually formed in the aqueous phase from the decomposition of the small amount of
AIBN dissolved in the water [19]; other researchers assert that the free radicals are
formed in the particles [20]. For the sy
p
in the organic/aqueou
w
In order to investigate this question, a water-soluble initiator (VA-044) was used in the
emulsion polymerization of BA/MAETAC (13.5 wt% MAETAC based on MAETAC
plus BA) with the nonionic surfactant Triton X-405. It was found that only
homopoly(MAETAC) formed, and BA did not polymerize at all. Similar phenomena
60

have been reported by Antonova [12] in studies of emulsion copolymerization of
methacrylic acid and styrene with another nonionic surfactant OP-10. From these results,
would appear that no free radicals could enter a micelle to initiate organic-phase
urfactant with a long hydrophilic tail was used. It is well known
at only surface active free radicals in the water phase will be absorbed into the organic
ic emulsifier. However, Colombie et al. [22]
und that no significant effect was noted on the radical entry rate coefficients within
urfactant sodium lauryl sulfate and Triton X-405. In
oth the above studies, the exit or entry species were small radicals. However, it has been
A-044 replaced by CHP/TEPA.
t would seem that initiation in the CHP/TEPA system occurs in the interface
it
polymerization when a s
th
phase.15 Furthermore, it has been shown that the formation of the interfacially-active free
radicals is a rate-determining step for the system with ionic surfactant such as SLS.
However, for the system with a nonionic surfactant with a long hydrophilic tail such as
Triton X-405 or OP-10, the particles or micelles would have a viscous corona, as shown
in the Figure 1a, through which a surface active free radical must penetrate through
before initiating organic phase polymerization. Kusters et al. [21] studied the effect of the
corona consisting of PEO tail of degree of polymerization of 60 on the monomer radical
exit. The exit coefficient was found to be an order magnitude lower in the case of
nonionic surfactant as compared to an anion
fo
experimental error as compared s
b
reported that, in the presence of a highly water-soluble comonomer, the critical degree of
polymerization for absorption into the organic phase is quite high [16]. With increase of
degree of polymerization, the radical diffusion coefficient would be much lower. Based
on the reptation model, the diffusion coefficient would decreases with the –2.0 power of
degree of polymerization in semidilute and concentrated polymer solutions [23]. It is
proposed that surface active free radicals formed in the aqueous phase (i) contain too low
a BA content to become surface active, and (ii) have too high a degree of polymerization
to successfully penetrate the viscous corona before termination in the aqueous phase.
By contrast, it was found that the BA in the BA/MAETAC copolymerization could be
rapidly polymerized under the same conditions with the V
I
aqueous/organic interface so that a free radical need not penetrate through the surfactant
layer before initiating BA, as shown in the Figure 1b.
61

According to the reaction mechanism [18],
once CHP and TEPA meet at the aqueous/organic interface, two free radicals are formed,
one hydrophilic and the other hydrophobic. It is reasonable to assume that two free
radicals would separate from each other quickly because of their different nature so that
the mutual termination often found with oil soluble initiators could be avoided.
MAETAC Polymerization Kinetics
Because of its highly heterogeneous nature, the product was difficult to separate and
purify to get reliable data. Some authors have noted this problem and proposed
procedures for doing so [13,16], but for this study, instead of being separated, the latex
sample from the reactor was directly injected into an NMR tube filled with d4-methyl
alcohol after polymerization was quenched by an inhibitor solution. It is believed that 1H
NMR analysis should detect all MAETAC units, based on the following considerations:
(i) a good dispersion was obtained; (ii) copolymer made by solution polymerization with
13.5 wt% MAETAC (based on total monomer) is soluble in methanol; (iii) with increased
MAETAC composition in the copolymer, solubility in methanol is increased; (iv)
copolymer macromolecules made by emulsion polymerization should be richer in
MAETAC than those by solution polymerization because of the heterogeneous nature in
the emulsion polymerization; (v) all copolymer should be near the surface of particles
because of the high water solubility of MAETAC.
The resonance signals from protons of methyl groups connected to nitrogen (as shown in
Figure 2) were used to determine MAETAC concentrations. MAETAC mono
OHNHRRONHRROOH 22 +′+→′+ ••
mer
xhibits a peak at d = 3.23. Once the MAETAC is polymerized, two new resonance e
signals at d = 3.21 ppm and d = 3.36 ppm were observed in the NMR. The signal from
(CH3)3N+ from homopoly(MAETAC) appears at d = 3.21 ppm and that of copolymer of
BA/MAETAC appears at d = 3.36 ppm. The peak at d = 3.21 ppm is narrow, indicating a
62

short relaxation time, typically from a low molecular weight component, whereas the
peak at d = 3.36 ppm is much broader, showing a longer relaxation time, typical of from
uclei on a polymer chain. Peak separation indicates that the nuclei are located in two
view of its solubility in the aqueous phase, there are two potential polymerization loci
TEPA is
nificant transfer agent [25]. The product of interfacial polymerization should have a
and higher molecular weight. BA incorporation into
oly(MAETAC), and higher molecular weight could significantly change the
n
different environments.
In
for MAETAC: the aqueous phase or the interface between the aqueous and organic
phases. As might be expected, the product from aqueous phase polymerization where the
BA concentration is as low as 8.96 mM/L (50oC) [5] should be almost
homopoly(MAETAC), and lower molecular weight as indicated by the fact that
a sig
higher level of BA incorporation
p
environment of MAETAC on the poly(MAETAC) because of changes in solubility and
reduced salt dissociation. Based on these arguments, the peak at d = 3.21 ppm is assigned
to oligomers of MAETAC formed in the aqueous phase and the peak at d = 3.36 ppm is
assigned to polymer formed in the interface. These assignments will be further supported
by the following kinetic study.
The MAETAC total conversion was calculated by:
132
322 AAA
AAx
+++
=
and the MAETAC conversion in the polymerization of aqueous phase was calculated by:
132
22 AAA
Ax++
=′
where A1 is the area of the peak at d = 3.23 ppm, A2 is the area of the peak at d = 3.21
m, and A3 is the area of the peak at d = 3.36 ppm. The conversion/time curves for pp
macro- and miniemulsion polymerization are plotted in Figures 3 and 4. For both
polymerizations, there is an initial burst of MAETAC polymerization. Somewhat more
MAETAC is consumed at the very beginning of the macroemulsion polymerization than
in the miniemulsion polymerization. The product believed to be formed in the aqueous
63

phase [homo(MAETAC)] is mostly formed at the beginning of polymerization. For both
the macro- and miniemulsion polymerization, the conversion of MAETAC in the aqueous
phase remains constant at about 18 % throughout the polymerization. The total
MAETAC conversion increases steadily.
Before injecting TEPA to start polymerization, there is a small amount of CHP in the
queous phase, since CHP has some water solubility. Once the TEPA is injected, a large
omopoly(MAETAC) is almost equal for the macro- and
iniemulsion polymerization. Once the CHP in a micelle reacts with TEPA, the local BA
formed, as was reported by Candau
[26] in the micelle copolymerization of a water-soluble monomer and a water-insoluble
monomer. The idea of micelle polymerization could also well explain the BA
From Figures 3 and 4, it can be seen that after the initiation burst, the MAETAC
a
number of free radicals form quickly in the aqueous phase. These free radicals will
initiate MAETAC water-phase polymerization to produce almost homopoly(MAETAC).
Because of the viscous surfactant layer and the increasingly swollen copoly(MAETAC)
hydration layer, diffusion of additional CHP into the aqueous phase is retarded, and the
CHP concentration in the aqueous phase fall rapidly. As a result, little
homopoly(MAETAC) forms later in the polymerization. Early in a macroemulsion
polymerization, a large number of micelles are present, each containing some BA. It is
reasonable to assume that there should be some CHP dissolved in the micelles. The CHP
contained in the micelles should be the first to react with TEPA, so that more MAETAC
would be consumed at the very beginning of a macroemulsion polymerization than in a
miniemulsion polymerization where no micelles exist. It is interesting to notice that
although more MAETAC is consumed at the very beginning in the macroemulsion
polymerization, the amount of h
m
concentration is high, so that a copolymer will be
polymerization kinetics and will described in the following section.
polymerization rate is almost constant in the macroemulsion polymerization while the
MAETAC polymerization rate decreases with time in the miniemulsion polymerization.
Theoretically, MAETAC polymerization rate in terms of conversion is a function of
64

monomer concentration, free radical concentration at the polymerization locus,
propagation rate constant, and the volume of the polymerization locus:
]][[ 22 •= MMVk
dtdx
p
Where x2 is the MAETAC conversion, kp is the propagation rate constant, [M2] is the
MAETAC concentration at the interface, is thefree radical concentration at the
terface, and V is the interface volume.
on of polymerized
AETAC. According to the results shown in Figures 3 and 4, the detected MAETAC
][ •M
in
During Interval II of a macroemulsion polymerization, monomer concentration at the
locus of polymerization is relatively constant. During miniemulsion polymerization, the
monomer concentration at the locus of polymerization decreases continuously. Though it
is difficult to determine the free radical concentration in the MAETAC polymerization
zone, it is reasonable to assume that the evolution of the free radical concentration should
be similar to that in a particle, which decreases with time. Since kp is not likely to change
significantly, it is an increase of polymerization volume that should be responsible for the
constant polymerization rate in the macroemulsion polymerization. This can be taken as
evidence for interfacial polymerization since the particle surface area continuously
increases in the macroemulsion polymerization whereas the volume of water phase
cannot change at all. By contrast, for miniemulsion polymerization, the particle surface
area changes much less so that the polymerization rate will continuously decrease, in
good agreement with the model prediction.
From Figures 3 and 4, we can roughly estimate the error by NMR analysis. In the NMR
analysis, the main errors should come from those MAETAC units which could not be
detected by NMR, i.e. those buried in the particles. We have found that little of the
MAETAC resides in organic phase, i.e. particles. Based on this, unreacted MAETAC
peak area should be correct. The only error could be reduced detecti
M
conversion could be as high as 80%. Based on the conversion trend, we should detect
higher conversion at longer polymerization time. This means that the error should be
much less than 20%.
65

BA Polymerization Kinetics
The BA polymerization kinetics were studied at various MAETAC levels. The results are
presented in Figures 5 and 6. The effect of MAETAC on the BA polymerization kinetics
eriza
when the MAETAC level is increased further,
e polymerization rate begins to decrease. At higher MAETAC levels, the effect of
with a Triton X-405 solution and kept in an
ven at 80 °C for 12 hours to drive off the unreacted BA prior to analysis. It is postulated
larger when measured in pure water, indicating a thick layer of polyelectrolyte interfacial
is rather complicated. In comparison with homopolymerization of BA, adding 5 wt%
MAETAC greatly increases the BA polym tion rate for both macroemulsion and
miniemulsion polymerization. However,
th
MAETAC is different for macroemulsion and miniemulsion polymerizations. For
macroemulsion polymerization at high MAETAC level, there seems to be an induction
period before polymerization begins. At higher MAETAC levels, the length of the
induction period increases. For miniemulsion polymerization, there is no induction
period. Instead, BA polymerization rate decreases to zero at less than full conversion.
BA homopolymerization with CHP/TEPA levels off at approximately 30% conversion.
At higher MAETAC levels, the BA conversions levels off at substantially higher
conversion.
Particle Number
Particle size analysis was accomplished using a Protein Solution LSR-TC dynamic light
scattering instrument. The latex was diluted
o
that copolymer formed at the interface will remain at the surface of the particle. To study
the swelling of this interfacial layer, particle size measurements were carried out in pure
water and 1 M NaBr aqueous solution. The interfacial layer should collapse in the
presence a concentrated strong electrolyte aqueous solution. The results are listed in the
Tables 2 and 3. It may be seen that at low MAETAC level or low monomer conversion,
the apparent radius measured in pure water is the same as that in 1 M NaBr solution. At
high MAETAC level and/or at high monomer conversion, the particle diameter is much
66

polymer, which can be collapsed by a electrolyte solution. It will be assumed that the
radius measured in NaBr solution is the correct radius, and this was used to calculate
article number from the particle radius data. If the swollen radius used to calculate
le number decreases with conversion, indicating particle
ggregation. It is believed that for this system the particles should be sufficiently stable
AETAC). Contrary to El Aasser’s observation [13] that homopoly(sodium
yrene sulphonate) could initiate a homogeneous nucleation, for the present system, it
h BA is incorporated into the poly(MAETAC) so that the copolymer
ndergoes homogeneous nucleation. For the macroemulsion copolymerization with 13.5
p
particle number, the partic
a
so that little coagulation is expected.
For comparison, Np for copolymerization as well as for BA homopolymerization is
plotted versus BA conversion in Figures 7 and 8. It is evident that adding 5.0 wt%
MAETAC led to more particles being formed both in the macroemulsion and
miniemulsion polymerizations. This phenomenon has been ascribed to homogeneous
nucleation.5 However, when the recipe MAETAC level is increased to 13.5 wt% the
results are quite different from macroemulsion versus miniemulsion polymerization. For
miniemulsion polymerization, the homogeneous nucleation effect disappears, as indicated
by the fact that Np in the miniemulsion polymerization develops in exactly the same way
as that of the miniemulsion homopolymerization, which leads to a polymerization rate of
BA is not substantially affected by MAETAC level at higher MEATAC concentrations. It
is evident that homogeneous nucleation is sensitive to the composition of
homopoly(M
st
seems that enoug
u
wt% MAETAC, Np is even less than its homopolymerization counterpart. It is believed
that Np is closely related to the induction period previously described. In fact, the
induction period is not really a period of no polymerization, but rather a period of little
BA polymerization. As shown in the previous section, a great deal of MAETAC was
polymerized during the induction period and BA was also slowly polymerized up to
approximately 10%. This excludes the possibility that the induction period was brought
about by some inhibitor impurity. Instead, because its miniemulsion polymerization
counterpart showed no the “induction period”, it is clear that at the very beginning of
macroemulsion polymerization, micelles play a key role in the induction period.
67

It is well accepted that hydrophobic molecules such as BA and CHP will be present in the
micelles at the beginning of the polymerization. As described before, many of free
radicals will be formed in the surface of a micelle and the two free radicals formed at the
same time could separate each other quickly so that the so-called cage effect could be
eliminated. In a micelle, the local BA concentration may be quite high. Once a micelle is
initiated, a number of BA molecules may be added quickly. As a result, some short BA
blocks would be incorporated into a poly(MAETAC) chain to form something like multi-
lock copoly(MAETAC-BA), as shown in Figure 9. Surfactant should stabilize the BA b
blocks so that the block copolymer would remain in the aqueous phase. This idea is
further supported by the observances that most of the product at the very beginning of
polymerization is water soluble, and that the strong resonance signals of 1H- NMR from
polymerized BA can be detected in D2O. The BA blocks in the copolymer, which is
surrounded by surfactant, would swell with BA monomer, which would polymerize there
until particles form. In the meanwhile, micellar nucleation would be diminished or even
eliminated. As a result, micellar nucleation would be retarded, and Np decreased.
Average Number of Free Radical Per Particle
By combining conversion versus particle versus time data, the average number of free
radicals in a particle was calculated as [5]:
Where kp is the propagation rate constant of BA, calculated by kp = 1.874e11*exp(-
7026.7/T), L/mol-s [6]; Cp is the BA concentration in a particle, 4.57 mol/L in the
Intervals I and II in the macroemulsion polymerization, otherwise a function of BA
conversion; Np is the particle number in the system per unit volume of aqueous phase;
Nav is Avogadro's Number; NM,0 is the initial number of moles of monomer per unit
volume of water
ppp
Mavp
NCknNR
n 0,=
68

Figures 10 and 11 show the evolution of the average number of free radicals per particle
( n ). From these figures, it is clear that in the copolymerization system, n is greater than
homopolymerization, and with increasing MAETAC level, nin increases. In the
literature, the effect has been ascribed to a gel effect caused by ionic crosslinking [3].
Once MAETAC ionic monomer is incorporated into the BA polymer chains, some ionic
clusters are formed and function as crosslinks. These crosslinking points would hinder
termination of free radicals so as to increase n . However, because of the extensive exit
of free radicals (due to the chain transfer effect of TEPA) [25], the controlling mechanism
in the determination of n is the exit rather than the termination of free radicals. It is
proposed that the increase in n should be ascribed to the hindrance of radical exit due to
the hydration layer.
The effect of the hindrance can also been seen in the decay of n with conversion. From
Figures 10 and 11, the decay of n is slower in the copolymerization systems than that of
the homopolymerization systems. Furthermore, the rate of decay decreases with increase
in MAETAC level. Because the decay rate is determined by the consumption of TEPA
[25], it may be inferred that the TEPA consumption rate is slower during the
copolymerization. It may be concluded that the hydration layer hinders TEPA transfer
om the aqueous phase to the particle surface where it is consumed. It is this hindrance
for a longer time (before being totally
onsumed) in the copolymerization than the equivalent homopolymerization.
the Hydration Layer
Because of the heterogeneous nature of the system, the composition of copolymer formed
the interface is very difficult to determine. Instead, the hydration properties of the
fr
that allows the BA polymerization to proceed
c
Copolymer Composition and Properties of
in
interfacial layer will be used to infer copolymer composition at the interface. As shown in
the Tables 2 and 3, the apparent radii of the copolymer latex measured in DI water and 1
M NaBr solution are substantially different. This difference has been to use to derive a
new parameter defined as the degree of swelling Q. The hydration properties of the
69

interfacial layer are determined by balancing the chemical potential of water in and out of
swollen layer [27], i.e.
. Copolymer composition will influence the hydration properties in
e following ways:
e
us of a dry
article should represent the hydration efficiency of the copolymerized MAETAC. For
0=∆+∆+∆=∆ ionpolela µµµµ
where elaµ∆ , polµ∆ , and ionµ∆ are elastic, polymer/water-mixing, and ion/water-mixing
contribution to the chemical potential, respectively. When the sum of polµ and ionµ∆
are offset by elaµ∆ , an equilibrium is establishjed. elaµ∆ is detemined primarily by the
effective crosslink density. In the present case, crosslinking points come from anchoring
of hydrophobic segments in copolymer chains or hydrophobic aggregation between
copolymer chains. With increased salt concentration, the contribution from ionµ∆
decrease sharply. In a high salt concentration solution, the driving force for swelling is
mainly from polµ∆ . In a salt-free medium, the driving force for swelling is mainly from ionµ∆ . In a salt-free medium, far more water will be adsobed into the hydration layer than
in a high salt medium
∆
th
• With an increase in BA content, the copolymer has mor hydrophobic units as a
crosslinking point which affects elaµ so that degree of swelling will decrease
• With an increase of BA content, the copolymer/water interation parameter will
change so that polµ∆ and consequesntly the degree of swelling will decrease.
Clearly, the hydration properties in a salt-free enviroment is highly sensitive to BA
composition.
The difference of apparent radius between a salt-free medium and the true radi
∆
p
convenience, a new parameter degree of swelling is defined as
)( '220,2 xxW −
Where r
)(75.0 03
13
2 dNrrQ p ××−
=π
2 is the apparent radius from a salt-free medium; r1 is the apparent radius in a 1
M NaBr solution (as an approximation, the radius of a dry particle is replaced by the
apparent radius of a particle in 1 M NaBr solution because they are very close.); Np is the
70

particle number in the systems; d0 is the density of H2O; W2,0 is the recipe weight of
MAETAC; x2 is the total conversion of the MAETAC; x2’ is the conversion of MAETAC
from reaction in the water, which is not considered to contribute to the hydration layer.
It is clear from the equation that Q represents the hydration capacity of polymerized
rface
. The degree of
he In
identi
ed onto the surface of the particle to form a hydration layer under
polymerization.
om F
er is lower
in macroemulsion polymerization. In Intervals I and II, the fact that the
articles are saturated with BA (because of the presence of droplets in macroemulsion
ote that the critical point
where the Q value begins to dramatically increase is different for miniemulsion and
macroemulsion polymerization. There are two possible reasons for this: (i) Equilibrium
measurements [6] indicate that Interval III should begin at a BA conversion of 40%,
MAETAC fixed on the su of the particle in a pure water environment. It is also clear
that the larger Q, the lower the BA composition in the interfacial layer
swelling as a function of BA conversion is plotted in Figure 12 for macro- and
miniemulsion polymerization. It is seen that during t tervals I and II, the Q value is
close to zero. However, once the polymerization proceeds into Interval III, the Q value
increases rapidly. The large change in Q value should be ascribed to crosslinking density
development, i.e. BA content development. In contrast, homopoly(MAETAC) prepared
by aqueous solution polymerization in the presence of a small amount of BA was mixed
with homopoly(BA) latex. It is found that the particle size distribution was nearly
cal for homopoly(BA) latex before and after mixing with homopoly(MAETAC).
This experiment indicates that homopoly(MAETAC) formed in the water phase cannot
effectively be adsorb
the condition of the measurement. The hydration layer only comes from the interfacial
Fr igure 12, it may be inferred that the copolymer formed during Intervals I and II
has a higher BA content, while during Interval III the newly formed copolym
in BA content. This inference is in good agreement with BA monomer concentration
development
p
polymerization) keeps a relatively high concentration on the surface of the particles
whereas in Interval III the particles are no longer saturated with BA, and the BA
concentration in the interfacial layer falls. It is interesting to n
71

while kinetic data on macroemulsion polymerization indicate that Interval III should
begin at 56% [7]. In contrast, there is no Interval II in miniemulsion polymerization,
since the monomer concentration in the particles decreases monotonically from the
beginning of polymerization. (ii) Because the particles formed in macroemulsion
polymerization are smaller than those in miniemulsion polymerization, there is much
more interfacial area to provide more crosslinking points. If the copolymer had the same
omposition, the Q value of the macroemulsion polymerization latex would be lower than
uld occur for particles in this study, which explains why polymer with a
wer BA content is formed in the presence of salt.
c
that of the miniemulsion polymerization.
When compared with those of macroemulsion polymerization, the Q values of
miniemulsion polymerization are higher, indicating a lower BA content in the copolymer
formed during Interval III. This can be explained by the difference in particle size. In
miniemulsion polymerization, the particles are larger than those in macroemulsion
polymerization, so that BA monomer in the bulk of particle is less likely to be at the
surface; this lead to a lower BA content in the copolymer formed.
When salt is added to the emulsion prior to polymerization, the Q value increases and the
critical point appears at lower BA conversion, indicating that a lower BA copolymer
formed has been formed at the interface (Figure 12, miniemulsion, 13.5%, with salt). It
has been reported that when the ionic strength of the aqueous phase is increased, the
concentration of hydrophobic monomer at the surface of a micelle decreases [28]. A
similar effect sho
lo
Conclusions
The copolymerization of BA and MAETAC can be accomplished using the interfacial
redox initiator system CHP/TEPA. The following conclusions can be drawn from this
work:
1. The nucleation process is very strongly dependant on MAETAC concentration
and polymerization method. For miniemulsion polymerization, homogeneous
72

nucleation occurs at low MAETAC concentration but disappears at higher
MAETAC concentration. For macroemulsion polymerization, the nucleation is
complicated because of the depletion of micelles to form temporarily water-
soluble polymer.
2. Interfacial polymerization kinetics is dependent on polymerization method and
the level of salt addition.
3. For both miniemulsion and macroemulsions, approximately 18% of the total
MAETAC is polymerized in the water phase early in the reaction.
4. The copolymer produced from these polymerizations is of a very heterogeneous
in composition
5. The copolymer composition is significantly influenced by particle size,
conversion, and salt addition.
Table 1. Basic Recipe
Name Acronym Amount (g)
Butyl acrylate BA 75
[2-(Methacryloxy)ethyl] MAETAC Variable
trimethyl ammonium chloride
Triton x-405 6.43
Cumene hydroperoxide 80%) CHP 1.0
Tetraethylenepentamine TEPA 1.0
De-ionic water 115
Sodium Chloride (when used) NaCl 3.66
73

Table 2. Particle Number Development in Miniemulsion Copolymerization
5.0wt% MAETAC 13.5wt% MAETAC
x1 r1(nm) r2(nm Np x1 r1(nm r2(nm) Np
) )
0.120 57.11 55.43 1.08E16 0.133 60.62 61.99 1.32E16
0.265 53.12 54.72 2.96E16 0.214 66.4 68.31 1.51E16
0.511 63.63 61.28 3.32E16 0.329 71.77 80.26 1.75E16
0.684 67.09 68.23 3.81E16 0.464 85.58 136.9 1.42E16
0.80 .67 3.84E16 0.584 88.00 202.32 1.63E16 2 70.42 71
0.856 74.30 73.23 3.49E16 0.654 93.22 225.20 1.54E16
0.87 6E16 0.715 91.54 257.97 1.77E16 8 73.07 77.77 3.7
0.883 72.88 74.38 3.82E16 0.778 92.95 298.31 1.83E16
.80E16 0.815 95 283.89 1
Note: sion; r1 is the apparent particle radius in salt solution, r2 is the
app
able 3. Particle Number Development in Macroemulsion Copolymerization
5.0wt% MAETAC 13.5wt% MAETAC
x1 is BA conver
arent particle radius in DI water
T
x r (nm) r1 1 2 ) Np x1 r1(nm) r2(nm) Np(nm
0.225 27.34 32.76 1.07E1 43.46 35E16 7 0.079 44.54 3.
0.375 34.38 35 1.40E17 0.150 45.16 45.26 4.35E16
0.620 41.00 43.87 1.23E1 53.1 4.83E16 7 0.335 53.26
0.796 44.09 50.42 1.04E14 0.532 63.1 87.59 4.23E16
0.881 51.82 60.15 6.78E16 0.689 70 .3 3.94E16 137
0.929 54.42 61.8 6.59E16 0.763 78.85 172.91 3.04E16
0.958 52.71 81.77 2.94E1 1.73E16 6 0.831 97.93 210.04
886 101.5 6.00 1.65E16 0. 24
N is the ent particle radius in salt solution, r2 is the
pparent particle radius in DI water
ote: x1 is BA conversion; r1 appar
a
74

Fi
Fig. 1b
Figure1. In actant
BAFree radicals
Viscous surfactant layer
Mic
elle
g. 1a
itiation with a Polymeric Surf
Mice
B
Vi s nscous urfacta t layer
AFree
75

igure 2. 1H-NMR Spectra of Emulsion Copolymerized BA/MAETAC,
omopoly(MAETAC) and Solution Copolymerized BA/MAETAC
F
H
H o m o p o ly M A E T A C
Emulsioncopolymerization
76

0
0.1
0.2
0.3
0.4
0.5
0.6
0.7
0.8
0.9
0 50 100 150
Time(min.)
Con
vers
ion
Total PolyMAETAC,without salt
PolyMAETAC fromaqueous phase,without saltTotal PolyMAETAC,0.5 M NaCl
PolyMAETAC fromaqueous phase, 0.5 MNaCl
Figure 3. MAETAC Monomer Conversion, Miniemulsion Copolymerization with 13.5
t% MAETAC (based on total monomer) in the presence of Salt
Figure 4. MAETAC Monomer Conversion, Macroemulsion Copolymerization with 13.5
wt% MAETAC (based on total monomer)
3. MAETAC Monomer Conversion, Miniemulsion Copolymerization with 13.5
t% MAETAC (based on total monomer) in the presence of Salt
Figure 4. MAETAC Monomer Conversion, Macroemulsion Copolymerization with 13.5
wt% MAETAC (based on total monomer)
ww
0
0.1
0.2
0.3
0.4
0.5
0.6
0.7
0.8
0 20 40 60 80 100
Time (min.)
Con
vers
ion
Total conversion
Conversion formedin the water
77

00.10.20.30.40.50.60.70.80.9
1
0 50 100 150
Time (min)
Con
vers
ion
5.0wt% MAETAC0.0wt% MAETAC13.5% MAETAC16.7wt% MAETAC20wt% MAETAC
Figure 5. BA Monomer Conversion, Macroemulsion Copolymerization with Varying
Levels of MAETAC (based on total monomer)
Figure 6. BA Monomer Conversion, Miniemulsion Copolymerization with Varying
Levels of MAETAC (based on total monomer)
00.10.20.30.40.50.60.70.80.9
1
0 20 40 60 80 100
Time (min)
Con
vers
ion
13.5wt% MAETAC5.0wt% MAETAC0.0%MAETAC20.0 wt% MAETAC
78

05E+151E+16
1.5E+162E+16
2.5E+163E+16
3.5E+164E+16
4.5E+16
0 0.5 1
BA conversion
Np 13.5 wt%
5.0 wt%0%
Figure 7. Particle Number Development, Miniemulsion Copolymerization with Varying
Figure 8. Particle Number Development, Macroemulsion C
Levels of MAETAC (based on total monomer)
opolymerization with
arying Levels of MAETAC (based on total monomer)
1E+16
1E+17
1E+18
0 0.5 1
BA Conversion
Np
0.0% MAETAC5.0% MAETAC
13.5% MAETAC
V
79

Figure 9. Schematic of the Formation of Multi-block Poly(MAETAC-BA)
Figure 10. Number of Free Radicals per Particle, Miniemulsion Copolymerization with
Varying Levels of MAETAC (based on total monomer)
BACHP MAETACTEPATriton x-405
0
20
40
60
80
100
120
0 50 100
Time
n
5.0wt%0%13.5wt%
80

02468
101214161820
0 50 100 150
Time
n
5 wt%0.0wt%13.5wt%
Figure 11. Number of Free Radicals per Particle, Macroemulsion Copolymerization with
Varying Levels of MAETAC (based on total monomer)
0
2000
4000
6000
8000
10000
0 0.5 1
BA conversion
Deg
ree
of s
wel
ling
(g H
2O/g
Mae
tac)
12000
miniemulsion, 13.5%,with saltminiemulsion, 13.5%without saltemulsion, 13.5%
Figure 12. Degree of Swelling of the Hydration Layer as a Function of BA Conversion;
13.5 wt% MAETAC; Macroemulsion, Miniemulsion, and Miniemulsion Polymerized
81

2.3 Water-Based Cationic PSA
Experimental
Synthesis and Characterization
Miniemulsion technique was used to synthesize water-based cationic PSA as reported
above. Hexanethiol (HT) was used as chain transfer agent and ethylene glycol
dimethacrylate (EGDM) was used as crosslinker to control the polymer molecular
weight. The basic recipe is shown in Table 1. Gel fraction of the polymer with
crosslinker was determined by solvent extraction with Soxhlet Extractor. The dried
sample was extracted by ethanol and then THF for 24 hours, respectively. Glass
transition temperatures were determined on a Perkin Elmer Pyris-1 differential scanning
calorimeter (DSC) under helium atmosphere. The sample was heated to 200 oC, cooled
e of 40 oC/min. PSA end use properties,
s repulpability and effect on paper properties were studied as described in Part 1.
to -100 oC, and then heated to 200 oC at the rat
it
Results and Discussion
Polymer characterization
he glass transition temperature of polymer was measured from DSC, and the results are
own in Figure 1. Apparently all of the copolymers with different cationic monomer
eding ratios have glass transition temperatures around -48 oC. By contrast, Tg for BA
ompolymer is around -56 oC. The results may indicate that the polymers in the latex
om high MAETAC feeding ratio were heterogeneous.
SA properties and repulpability
his study was intended to develop water-based water soluble/dispersible cationic PSAs,
hich may not cause stick problems in paper recycling. For ionic polyacrylate
T
sh
fe
h
fr
P
T
w
82

copolymer to be water soluble or dispersible, the copolymer must contain enough
lar bonding.
owever, the high cationic content may affect the end use properties of the copolymers
as a pressure sensitive adhesive. The peel adhesion and shear strength of the polymers
synthesized from miniemulsion polymerization are shown in Table 2. Peel adhesion is
the force required to remove a PSA-coated film from a specific test surface under
standard conditions (specific angle and rate). The measurement of peel adhesion
involves a bonding step and a debonding or peeling step. The efficiency of the bonding
process is related to the adhesive's ability to exhibit viscous flow. The debonding process
involves a rapid deformation of the adhesive mass. Thus, the higher the peel strength, the
higher the PSA's ability to resist bond deformation at high strain rates is. Peel strength
gives a measure of adhesive or cohesive strength, depending on the mode of failure [29].
Shear resistance is measured as a force to pull the PSA material parallel to the surface to
which it was affixed with a definite pressure [30] and it measures the cohesion strength of
the PSA. All the copolymers (PSA1 to 3) without transfer agent showed very weak shear
and peel strength. The reason may be because the molecular weight (Mw) of the polymer
as too high. Satas [31] reported that shear is roughly proportional to molecular weight
us behavior, increasing with Mw
p to moderate Mw and then decreasing as the Mw further increases. The molecular
weight for water based polyacrylic PSA polymer is normally in the range of 300,000 to 1
million [32]. Generally, the molecular weight for polymer synthesized from emulsion
polymerization would be about 1 million. Furthermore, because the copolymer of BA
and MAETAC is heterogeneous, the MAETAC-rich portion as well as the MAETAC
homopolymer in water may crystallize during drying. The crystals may restrict the
molecule flow of the PSA on a substrate surface, thus significantly reduce the adhesion.
The addition of chain transfer agent (CTA) in polymerization increased the peel strength
of the PSA (PSA4 and 5) significantly, but the shear adhesion was still poor. It should be
noted that failure of the two PSAs with transfer agent added was cohesion failure. The
results indicated the PSAs had stronger bonding with the substrate than the inter-
hydrophilic units to interact with water and then break the intermolecu
H
w
up to relatively high Mw at which the shear resistance drops off dramatically in some
polymers. Peel adhesion typically exhibits a discontinuo
u
83

molecular bonding. The reason is that the molecular weight of the PSA polymer is low.
The molecular weight of the polymers with chain transfer agent can be estimated based
on the Mayo equation [33]:
][][11
0,M
CTACPDP nn
+=
where DPn and DPn,0 are the number average degree of polymerization with or without
chain transfer agent respectively, C is the chain transfer constant of the CTA, [CTA] is
the concentration of the chain transfer agent, and [M] is the concentration of the
monomer. Because 1-hexanethiol as transfer agent would stay in the oil phase with butyl
acrylate, the chain transfer would mostly occur with butyl acrylate. From various
references [34,35], it is estimated that the chain transfer constant of 1-hexanethiol for
butyl acrylate is 0.50. For PSA4, the concentration ratio of 1-hexanethiol and BA is
t can flow easily and wet out the
substrate better. The result is better bonding between the PSA and the substrate. But
with viscous flow ability increases, the cohesion strength of the polymer decreases.
Introducing a small amount of crosslinker into the polymer can increase the polymer
cohesion strength, thus increase the shear strength. The failure of the shear became
adhesion failure for the crosslinked polymers. The effect of crosslinker on peel strength
is not significant. However, too high crosslinker content can significantly limit the
ability of polymer diffusion on a substrate, thus may reduce the peel strength.
Although from previous discussion we know the polymer latex from high MAETAC
feeding ratio has core-shell structure, we had expected the water soluble shell may help
the PSA film to disperse in water again. But solubility test indicated that all the polymers
synthesized from miniemulsion polymerization could not re-disperse to water once they
rge
icky particles can clearly be seen from the handsheets made from the recycled pulp.
he results indicated that when dry PSA film was formed from the latex emulsion, the
0.11%. Thus the molecular weight of the polymer with chain transfer agent would be
about 189,000. PSA polymer with low molecular weigh
are dried. Repulping test showed that all the cationic PSAs were not repulpable, even
after they formed very thin (less than 25 µm thickness) PSA film on copy paper. La
st
T
84

water insoluble MAETAC-poor core of the latex particles coalesced together. During
pulping process, the coalescent film could not be redispersed into colloidal particles.
order to increase the redispersability of the cationic PSA, three water-soluble cationic
ulsion. These water-soluble cationic chemicals include
rfactant cetyltrimethylammonium bromide (CTAB), starch, and water-soluble The
in the
SA latex could make it repulpable. For PSA latex without crosslinker, the molecules in
ly to form an evenly coalescent layer during drying. The addition
f poly(BA-co-MAPTAC) would be difficult to allow the dried PSA film to dissociate in
he paper recycling process. While for PSA latex with
rosslinker, the crosslinker can hold the molecules in the latex together. The coalescence
cling process under high shear,
e PSA would be easy to re-disperse to microparticles. The addition of a small amount
improve the PSA dispersability, but rather to improve
e properties of paper made from the recycled paper.
re
In
chemicals were added to the em
su
poly(BA-co-MAPTAC) with MAPTAC content of 15.2 mol%. This poly(BA-co-
MAPTAC) polymer was made from bulk polymerization in ethanol and itself can be used
as a water-soluble cationic PSA as reported in Part 1. The repulpability of the newly
formulated PSA was then studied. It was found the both the CTAB and starch could not
make the cationic PSAs redisperable with 4 wt% addition level. Furthermore, the CTAB
reduced the tackiness of the PSA significantly, and the starch increased the viscosity of
the PSA emulsion too much and their repulpability is reported in Table 3. However, the
results indicated that water-insoluble PSA from miniemulsion polymerization became
water dispersible when it was blended with a cationic PSA made from ethanol
polymerization. It is also interesting that addition of certain amount of crosslinker
P
the latex may move easi
o
repulping water during t
c
of the latexes during drying would not be even. With poly(BA-co-MAPTAC) added, the
BA units, which are hydrophobic, would attach to the hydrophobic units in the PSA latex;
and the MAPTAC units, which are hydrophobic, would stay outward to the aqueous
phase on the latex surface. During drying, poly(BA-co-MAPTAC) would form a barrier
around the latex particles as a lubricant. In the paper recy
th
of starch in some was not aimed to
th
85

To further understand the crosslinking in the polymer latex, the gel content was
measured. Ethanol was used extraction solvent to remove polymers with high MAETAC
content. Tetrahydrofuran (THF) was used to remove polymers with low MAETAC
content. From Table 4, it can be seen that most non-crosslinked polymer was removed
by ethanol. This is not surprising because the crosslinker EDGM is hydrophobic, and
thus would mainly crosslink inside the latex with butyl acrylate. The crosslinked
hydrophobic core of the polymer latex would retard the coalescent during drying.
The PSA properties of the repulpable (dispersible) PSAs were tested and results are
shown in Table 5. It was found that the addition of poly(BA-co-MAPTAC) have no
significant effect on PSA properties.
PSA adsorption and effect on paper properties
In Part 1, we have reported that the cationic PSA from solution polymerization could
adsorb on fiber surfaces in paper recycling and papermaking. Here the adsorption of
water based cationic PSAs made from miniemulsion polymerization is reported. Copy
papers with and without 0.5 wt% of cationic PSA12 were repulped with copy paper.
Pulping water was collected. After half an hour, the turbidity and charge of the
supernatant of the pulping water were measured. No detectable PSA12 was found in the
pulping water, which means almost all of the cationic PSA microparticles adsorbed on
the fibers.
Because the cationic PSA microparticles would adsorb on fibers, and be brought into the
final paper products during the papermaking process, the effect of the PSA on paper
properties should be examined. Figure 2 shows the effect of cationic PSA12-15 on th
e
aper tensile strength. It was found that the cationic PSA could slightly increase the p
paper strength. With starch added to the PSA, the increase of the paper strength was
larger. Starch is widely used as strength agent in papermaking. The small amount of
starch in the PSA should contribute to the strength improvement. Sizing is a measure of
the hydrophobicity of the paper. Because the cationic PSA is partly hydrophobic, it may
86

have some effect on the paper sizing properties. The sizing effect of PSA was measure
by Hercules Sizing Test (HST). It was found that with 0.5% addition level of cationic
PSA in the paper, the HST increased from to second to a few seconds. This effect is
tionic
ispersible PSAs, which are friendly for paper recycling, were successfully developed.
negligible.
2.4.3 Conclusions
Water based cationic PSAs with various compositions were synthesized from
miniemulsion polymerization. It was found the PSA latex with high cationic monomer
MAETAC feeding ratio was very heterogeneous. The cationic PSA itself could not be
dispersed in paper recycling process. However, when the cationic PSA was formulated
with another cationic hydrophobic water-soluble polymer, the PSA was fully dispersible,
and would not form stickies during repulping and papermaking processes. The dispersed
PSA could be easily removed from the papermaking water system by adsorbing onto
negatively charged fiber surfaces. Furthermore, the adsorbed colloidal PSA could
improve the paper strength of the final paper product. Thus, water based ca
d
87

Table 1. Basic Recipe
Name Formula Amount (g)
Butyl acrylate H2C=CHCO2(CH2)3CH3 75
MAETAC H2C=C(CH3)CO2(CH2)2N(CH3)3Cl Variable
Triton X-405 4-(C8H17)C6H4-(OCH2CH2)nOH, n=40 6.43
CHP C6H5C(CH3)2OOH 1.0
TEPA HN(CH2CH2NHCH2CH2NH2)2 1.0
water H2O 115
EGDM [H2C=C(CH3)CO2CH2]2 Variable
1-Hexanethiol CH3(CH2)5SH Variable
Hexadecane CH3(CH2)14CH3 1.5
Table 2. Adhesive properties of cationic PSAs.
Feeding composition for
variables (mol%)
180o Peel Adhesion
(10 min Dwell) (PSTC-1)
Shear Strength
(PTSC-7)
Sample
MAETAC HT EGDM g/in Failure
Type*
hour Failure
Type
PSA1 8.4 0 0 40.8 A 0 A
PSA2 10.9 0 0 25.3 A 0 A
PSA3 16.0 0 0 10.6 A 0 A
PSA4 10.9 0.1 0 560.5 C 0.1 C
PSA5 10.9 0.14 0 425.3 C 0.1 C
PSA6 10.9 0.1 0.18 339.7 A 6.8 A
PSA7 10.9 0.14 0.18 456.8 A 11.7 A
PSA8 10.9 0.14 0.36 234.2 A 6.0 A
PSA9 16.0 0.13 0.34 180.3 A 0.3 A
* A: Adhesion failure; C: Cohesion failure.
88

Table 3. The repulpability of formulated cationic PSAs.
PSA composition (wt%) PSA
Emulsion BAM Starch
Repulpability
PSA10 96 (PSA4) 4 0 No
PSA11 96 (PSA5) 4 0 No
PSA12 96 (PSA6) 4 0 Repulpable
PSA13 96 (PSA6) 3 1 Repulpable
PSA14 96 (PSA7) 4 0 Repulpable
PSA15 96 (PSA7) 3 1 Repulpable
Table 4. Gel content in the crosslinked polymers.
content after solvent extraction GelSample HT EGDM
(mol %) (mol%) Ethanol Ethanol and THF
PSA6 0.11 0.2 0.736 0.671
PSA7 0.16 0.2 0.708 0.648
PSA8 0.16 0.4 0.769 0.702
Table 5. Adhesive properties of water dispersible cationic PSAs.
180o Peel Adhesion Shear Strength (PTSC-7)
(10 min Dwell) (PSTC-1)
Sample
g/in Failure Type hour Failure Type
PSA6 339.7 A 6.8 A
PSA12 376.8 A 10.3 A
PSA13 3542 A 7.7 A
PSA7 456.8 A 11.7 A
PSA14 480.3 A 15.3 A
PSA15 463.5 A 12.6 A
89

-30
Figure 1. The glass transition temperature (Tg) for polymers with varying level of
MAETAC (in feeding).
Figure 2. The effect of cationic PSAs on the paper tensile strength. PSA content in the
aper handsheet is 0.5%. p
0
0.5
1
1.5
2
2.5
Control PSA12 PSA13 PSA14 PSA15
Handsheet
Tens
ile (N
/mm
)
-60
-55
-50
0 5 10 15 20
MAETAC feeding ratio (mol%)
-45
-40
-35
Tg (o C
)
90

References
1 , J.F m and M.J. Monteiro, Polymer Preprints,
7 (1999)
2 .D. T achuse 79.
3 . Turner, R.A g, J. Polym. Sci., Polym. Chem. Ed. 37,
4. X.Q. Wu and F. J. Schork, Kinetics of Miniemulsion Polymerization of Vinyl Acetate
Appl. Polym. Sci., 81(7), 1691 (2001).
5. anistic Approach", Academic Press,
995.
6 , E.D. Aasser and A.J. Klein, J. Po
3827 (1997)..
. P. Mallya and S.S. Plamthottam, Termination Rate Constant in Butyl Acrylate Batch
) 21 (5), 497 (1989).
8 C d C. P
Chem. Phys., 195, 2141 (1994).
9. H.Y. Parker, D.G. W ore H ang, M ., 29, 5 99
10. D. Kukulji and R.G. Gilbert, Polymerization at H nversion. In P
ers Princip and Applications; J. M. Asua (Eds.)., Kluwer Academic,
rec 97 (19 ).
1 um nlunas, .I. Rh on, S. C -Galvan, J. E. Puig., and E.W aler,
me etin, 30, 207 (1993).
1 . A va, G. pl in, Ye. yev, a S. R. Rafik Poly r Sci.
S.R 778 (19
1 K . Chain . S asser . Va rHoff, J. Po Sci. lym.
. Ed., 30, 535 (1992).
1 me Pichot u . Ma Chem 89, 1879 (1 .
6. D. Charmot, J. F. D’Allest and F. Dobler, Polymer, 37, 5237 (1996).
. R.G. Gilbert . Anstey, N. Subramania
40(2), 29 .
. B. Siadat, Ph hesis, Dept. Chem. Eng., Univ. of Mass tts, 19
. S.R . Weiss and R.D. Lundber
535 (1985).
with Nonionic and Anionic Surfactants, J.
R.G. Gilbert, "Emulsion Polymerization: A Mech
New York, 1
. E. Ozdeger Sudol, M.S. El- lym Sci. Part A, 35,
7
Emulsion Polymerization. Polym Bull (Berlin
. M.T. harreyre, V. Razafindrakoto, L. Veron, T. Delair, an ichot, Macromol.
estm land and .R. Ch acromol
igh Co
119 (1 6).
olymeric
Disp ions. les
Dord ht, pp 97
1. S. N o-Do A ot orona . K
Poly r Bull
2. L.F ntono V. Le yan Ye. Za nd ov, me
U.S. ., 20, 78).
3. J. H. im, M ey, M . El A and J. W nde lym. , Po
Chem
4. B. E lie, D. , and G illot, J kromo. ., 1 988)
15. G. L. Shoaf and G. W. Poehlein, Polymer Reaction Eng., 93, 1 (1992).
1
91

17. F. Ganachaud, F. Sauzedde, A. Elaissari, C. Pichot, J. Appl. Polym. Sci., 65, 2315
997).
18. J. H. Kim, M. Chainey, M. S. El Aasser and J. W. VanderHoff, J. Polym. Sci., Polym.
. Ed., 28, 3188 (1990).
omura, J I . Fujit in Polymer Latex, E.S. Daniels, E. D. Sudol, and
. El-Aasse ashington DC 1992.
Alduncin, M. J. B andiaran, and J . Asua, J. Poly ,
265 (1991
. H. Kuster per, R . Gilbert, A. L erman, Macrom
(1992).
2. D. Colombie, E. D. Sudol, and M. S. El-Aasser, Macromol., 33, 4347 (2000)
(1981).
. Blac , Emulsion Polymerizatio d
Toronto, 1975, p. 244.
Luo, F. ork, Y g, and Z. Yan, Polymer Rect. Eng., 9(3), 183 (2001).
andau Colloi erface Sci., ), 149 (1999)
S. Harl d R. K d’homme, P olyte Gels, A , Washington DC
1992.
8. S. Corona-Galvan, J. Castaneda-Perez, A. Martines-Gomez, J. E. Puig and P. C.
2 on, nd Sealants, 1
30. I. Benede ssure Sensitive Adhesive Technology, Marcel
Dekker, In w York, 21
3 atas, H ok of Pre re Sensitive Te logy, Van strand-Rheinhold Co.,
32. Sen e Adhesive Technology, Marcel
33. . Chem. Soc., 65, 2324 (1943).
34. E.H. Riddle, "Monomeric Acrylic Esters", Reinhold Publishing Corp., New York, 57
(1954).
J.L. Fuente and E.L. Madruga, J. Polym. Sci. Polym. Chem., 36, 2913 (1998).
(1
Chem
19. N. N koma, and K a,
M. S r (Eds). ACS 492, 55, W
20. J. A. J. Forcada, ar . M m. Sci. Part A
29, 1 ).
21. J. M s, D. H. Nap . G . G ol., 25, 7043
2
23. T. J. Tulig and M. Tirrell, Macromol., 14, 1501
24. D. C kley n, John Wiley & Sons, New York an
25. Y. J. Sch . Den
26. F. C , Adv. d Int 79 (2-3 .
27. R. and an . Pru olyelctr CS 480
2
Schulz, Colloid Polym. Sci., 268, 778 (1990)
9. P. Cat European Adhesives a 2, 18 (1990).
k and L.J. Heymans, Pre
c, Ne 4 (1997).
1. D. S andbo ssu chno No
New York, 1982.
I. Benedek and L.J. Heymans, Pressure sitiv
Dekker, Inc, New York, 80 (1997).
F.R. Mayo, J. Am
35.
92

PART 3. REMOVAL OF CONTAMINANTS FROM PAPERMAKING SYSTEM
Pulps, especially recycled pulps contain large amount of negatively charged dissolved
and colloidal contaminants. These contaminants are often negatively charged, and are
commonly referred as "anionic trash". Some contaminants are tacky in nature, and they
are referred as microstickies. Although much research about dissolved and colloidal
contaminants has been done in the past 20 years, some questions remain unanswered and
many conflicting results have been reported. Application of suitable cationic
polyelectrolytes that could precipitate detrimental substances, including microstickies,
onto fines or fiber in an early stage of the papermaking process has been reported [1,2].
On the other hand, Wagberg and Odberg indicated there is no fixation of anionic
substances by addition of cationic charge neutralizer in their early study [3], but they
ointed out that the anionic trash can be fixed to fiber surface if the concentration of
inants can be effectively removed by the fixation process.
Since fixation has the benefit to avoid buidup of stickies in the whitewater system, it is
worth to investigate its effectiveness under various papermaking conditions. We have
conducted studies to answer to following questions:
1) Can the anionic trash be fixed to fiber surfaces?
2) What is the effect of papermaking conditions, including pH, shear force,
fixative agents, flocculants, etc, on fixation?
3) Is the fixation a good method for controlling anionic trash?
4) How does the "fixed" anionic trash affect the paper properties?
The most effective method to control microstickies in current paper recycling mills is to
tackiness of the microstickies. These methods are commonly
alled "sticky control". However, it is obvious that “sticky control” can only temporally
lve stickies deposition problem, but not remove them. Thus it may be still desirable to
p
anionic substances or the consistency of fibers is high. Fundamentally, people still don’t
understand if the contam
use chemicals, such as cationic polymer, talc, surfactant etc. to modify the surface
chemistry and reduce the
c
so
93

remove the microstickies from the papermaking system. We have explored several
ethods in removing microstickies. One method is to use flotation to remove
flot ickies, those works were aim at total stickies and the removal
conducted
PSAs are introduced into papermaking system, they may affect the charge balance in
con sed
instead of cationic PSA.
3.1 Removal of Contaminants through Fixation
Exp
m
microstickies from the recycling pulp. Although past works have been done in using
ation to remove st
efficiency were all found to be less than 60-70% [4-6]. No study has been
specifically for the removal of microstickies. When cationic water soluble/dispersible
papermaking. Thus it would be interest to know how cationic polymers would affect the
trol of contaminants in papermaking system. In this study, we u
poly(diallyldimethylammonium chloride) (polyDADMAC) as model cationic polymer
erimental
terials Ma
wat
was er classifier with 150-mesh screen to remove the fines and
con
Lig alt (Aldrich) was used as model water-soluble anionic
was stickies. Poly(diallyldimethylammonium chloride)
00K, and
ts. Cationic
lamide (APAM)
Bleached kraft pulp was used in the experiments. The kraft pulp lap was first soaked in
er overnight and then refined in a Valley beater to a freeness of 450 ml. The pulp was
hed in a Bauer-McNett fib
contaminants. The retained fibers were collected and stored in a cool room at about 10%
sistency for later use.
nosulfonic acid sodium s
contaminants. Polyacrylate based pressure-sensitive adhesive emulsion (B.F. Goodrich)
used as model micro
(polyDADMAC, Aldrich) with Mw of 100K-200k and 400K-5
polyethyleneimine (PEI, BASF Corp) were used as cationic coagulan
polyacrylamide (CPAM) Percol 175 (Ciba Specialty), anionic polyacry
94

N7520 (Nalco), and polyethylene oxide (PEO, Mw 8 million, Aldrich) / Pheno
aldehyd
lic
form e Resin (PFR, Boredon Co.) were used as flocculants.
Fix in
Sam m microstickies and 100
.
A p f polyDADMAC or PEI was added and agitated for another 10
30
seconds. The mixture was then dewatered. The first 20 ml of filtrate was discarded and
yzed by
filtrate was determined by
meter.
Bef t, the sample was first treated using concentrated sulfuric acid
ers.
C analyzer in order to
used.
The ing office white papers, which contain
nd roller) and 1% coated
con ached kraft pulp lap. The process water was
and left in a cool room for 2 days. The small fines and filler materials passed through the
sup lloidal contaminants, was collected for test.
ation of microstickies and lign
ples of pulp suspension at a consistency of 0.6% with 200 pp
ppm lignin were placed in a DDJ Jar with 200 mess screen and agitated at certain speed
rescribed amount o
minutes. If flocculant was added afterwards, the mixture was agitated for further
the following 100 ml was collected. The zeta potential of the filtrate was anal
Malvern 3000 zeta sizer. Lignin concentration in the
measuring the absorbance at 280 nm using a HP8453A UV-VIS Spectrophoto
ore the UV measuremen
to dissolve the complex particles that were formed by two opposite charged polym
Total organic carbon was determined with a Shimadzu 5050 TO
determine the microsticky concentration.
For the Scanning Electronic Microscopy (SEM0 analysis, model process water was
model process water was prepared from pulp
1% of PSA (PSA was coated on office white paper with Ha
materials (coating broke from Mead Corp with 15% coated material). The pulping
ditions are the same as that for ble
collected by screening the pulp through a 200 mess screen. The filtrate was then collected
screen and settled to the bottom of the container during this setting period. The
ernatant, containing dissolved and co
Effect of microsticky and lignin fixation on paper physical properties
95

Bleached kraft pulp at the fiber consistency of 0.3% with certain amount of microstickies
nd lignin was used for making the hand sheets. A prescribed amount of polyDADMAC a
was then added. Paper sheets were then made on a British Handsheet Mold according to
TAPPI 205 om-88. The sheets made were conditioned for 48 hours and physical
properties were measured according to TAPPI standards.
Results and discussion
The effect of fixation agents in the presence of flocculant
Currently in the paper industry, polyDADMAC and PEI are the most widely used
cationic polymeric neutralizers to control charge in papermaking. It would e interest to
know their effect on the fixation of microstickies and water-soluble contaminants. Figure
1 shows the lignin and microsticky concentrations, the zeta potential of the residue in
filtrate as a function of the fixation agent polyDADMAC with 4 ppm flocculant CPAM
dded. The CPAM was added in order to improve the fixation and simulate the mill
o charge point. Up to 90% of
icrostickies and 70% of lignin could be fixed. But the polyDADMAC was only
effectiv 0 ppm. When the dose of
polyDA
amount of o decrease. This is because
microst ationic charged
microp
a
conditions. Figure 2 shows the same results but used PEI as fixation agent instead of
polyDADMAC. When polyDADMAC was used as fixation agent with flocculant
CPAM, maximum fixation occurred at near zer
m
e in a narrow concentration range from 25 to 4
DMAC was increased further to reverse the surface charge of the residue, the
fixed microstickies and lignin began t
ickies and aggregated lignin were restabilized to form c
articles.
PEI also fixed over 90% of microstickies and 70% of lignin in the presence of cationic
flocculant CPAM. It was effective even when the surface charge of the residue was
reversed. PEI could be effective in a very broad concentration range from 60 ppm to
over 120 ppm. This may be mainly due to the weaker charge of PEI at high pH (pH8).
Even when the microparticles absorbed cationic PEI and changed to cationic charge, the
96

repulsion force between particles and fibers was still weak, and thus flocculation of
CPAM could still be very effective.
The effect of polyDADMAC molecular weight on fixation
Mills use cationic charge neutralizes from different sources with different molecular
weights. It is worth to know if the molecular weight will have any significant effect on
fixation. Figure 3 shows the effect of polyDADMAC molecular weight on fixation when
used with cationic flocculant CPAM. It was found that the molecular weight has no
obvious effect on fixation. The maximum fixation efficiency was the same. The reason
may be that polyDADMA
C with Mw 100,000 - 200,000 and Mw 400,000-500,000 still
ave similar charge neutralization effect. With molecular weight in that range, the
on fixation
ills operate in different pH. Obviously the pH effect on fixation efficiency for
ifferent fixation agents should be evaluated. Figures 4 and 5 show the fixation
strongly depends on the pH. At lower pH, PEI has higher
harge density. Thus less PEI is needed for best fixation at low pH. Generally the
effect of shear force on the fixation with different flocculants. Apparently higher shear
h
flocculant effect would be insignificant.
The effect of pH
Different m
d
efficiency with polyDADMAC and PEI as fixative agents respectively and with CPAM
as flocculant at pH 5. Comparing them with the results obtained at pH 8 which are
shown in Figures 1 and 2, it was found that pH does not have effect on the effectiveness
of polyDADMAC, but has significant effect on the effectiveness of PEI. It is known that
the charge density of PEI
c
fixation efficiency is lower for PEI at pH 5 than that at pH 8. Further research is needed
to understand this.
The effect of shear force on fixation
During papermaking, pulps are constantly subjected to high shear. Figure 6 shows the
97

force reduces the fixation efficiency. Flocculant has significant effect on fixation.
PEO/PFR has more shear tolerance than CPAM. The results may indicate that retention
lay an important role in fixation.
he effect of flocculant on fixation
oluble lignin could be retented. CPAM could
etent less than 5% of the microstickies, while PEO/PFR could retent 40% of the
mill, the salt concentration in the whitewater is normally high. Thus we
ation efficiency of
icrostickies and lignin with polyDADMAC as fixative agent used with different
flocculants at high salt concentrations. It can be seen that when CPAM was used as
p
T
Previous results have shown that although the right dose of fixative agent is needed for
better fixation, flocculant may have also played a critical role. Figure 7 shows the
effective of fixation with or without flocculants at zero charge point for filtrate. It can be
seen that when no fixative agent or flocculant was added, there is no fixation of
microstickies and lignin. When only fixative agent polyDADMAC agent was added to
neutralize the colloidal materials to zero charge point, the fixation of both the
microstickies and lignin were just about 10%. Only when flocculant was added, the
fixation efficiency was significantly increased.
Figure 8 shows the retention efficiency of different flocculants without adding fixative
agent. Results indicated that no water s
r
microstickies.
The results indicate the fixation of water-soluble anionic materials and microstickies
needs the combination of fixative agent and flocculant. The fixative agent first
neutralizes and destabilizes the water-soluble and colloidal contaminants, then the
flocculant flocculates and rentents them on fiber web.
The effect of inorganic salts on fixation
In a closed
studied the effect of salts on fixation. Figures 9 and 10 show the fix
m
98

flocculant, the fixation efficiency of both microstickies and lignin was significantly
reduced in high salt concentration. The maximum fixation rate for mirostickies was 60%
and for lignin for 30%. With PEO/PFR as flocculant, the fixation efficiency of
microstickies was not effected by the salts, but the efficiency efficeincy for lignin was
reduced to 50%. Apparently salts affected not only the collision of microstickies, lignins,
nd also affected the conformation of flocculants. CPAM is more sensitive to high salt
etention efficiency is severely affected.
ffect of microstickies and lignin fixation on paper properties
a
concentration, thus the r
Scanning Electronic Microscopy (SEM) results
The fixation of colloidal contaminant was further studied by SEM. Lab made whitewater
with colloidal particle size of 1.25 micron was used for the study. In 0.6% BSK pulp
with 50 ppm (TOC) colloidal material was added various ammount of polyDADMAC,
and stirred for 5 minutes. Fibers were taken out from the mixture and rinsed once in
clean water, and then SEM samples were prepared. Figure 11 shows the SEM results.
When no fixative agent is added, no colloidal materials were found on the fiber surface.
When fixative agents were added, the colloidal particles gradually coagulated, part of
them fixed on to fibers. Larger coagulates were formed near the zero charge point.
When the fixative agent was overdosed, colloidal particles became cationic charged, and
less coagulation happened. Some of the cationic charged particles fixed to fibers.
The results further indicated that the fixation process is actually happened after the
coagulation process, and from previous results, retention agent is needed for effective
fixation.
E
It has been demonstrated that both lignin and microstickies can be effectively fixed to
fibers with the combination of fixative agents and retention aids. We then investigated
the effect of fixation on the possible effect of fixation on the paper physical properties.
The results are shown in Figures 12-15. It was found that the fixation of microstickies
99

has very small effect on the paper strength (tensile, burst and tear), and has no effect on
optical property. The fixation of lignin increases the paper strength, and reduces the
.2 Removal of microstickies through flotation
optical property.
3
Experimental
Voith E-18 flotation cell was used for flotation study. Polyacrylate based pressure-
sensitive adhesive (B.F. Goodrich) was used as model sticky. The pulp furnish was 1%
BSK pulp with 100 ppm PSA. PolyDADMAC is used as a charge neutralizer. Vinings A
(a neutral surfactant, Vinings Industries) was used as surfactant. The experiment was
conducted at 43 C. The content of the o PSA was measured according to the following
ethod: We assume all the materials in the pulp which can pass Whatmen 4 (size 25
an not pass Mw 3000 cut-off membrane are microstickies.
irst the consistency of the pulp containing microstickies is determined through passing
ion
m
microns) filter paper, but c
F
Whatmen 4 filter paper. Then certain amount of pulp is filtered. Part of the filtrate is
filtered again through the Mw 3000 cut-off membrane. The Total Organic Carbon (TOC)
in the two filtrates is measured, and thus the microstiky content in the filtrate is
determined. The pulp cake is then dissolved with 0.5M cupric ethylenediamine
according to the standard TAPPI Method T254 cm-85. The solution is then centrifuged
and the residue is washed 3 times with DI water followed by centrifugation. The residue
is dried and weighed, which is the microstickies in the cake. Added the microstickies in
cak and in filtrate gives the total microsticky content.
Results and Discuss
otation removal of microstickies. The flotation time
as 10 minutes. When only Vinings A, a commercial nonionic flotation deinking
Figure 16 shows the results for the fl
w
chemical for ONP deinking, was used for the flotation, the removal efficiency of the
microstickies is about 66%. The result is very similar to those obtained from previous
100

flotation studies [4-6] for total stickies. If the microstickies were first neutralized by
polyDADMAC (8 ppm in pulp furnish) before added Vinings A for flotation, the removal
efficiency increased to 96%. The PSA emulsion used has an average particle size of 190
m. It is know that flotation is less efficient to remove microparticles with size less than
C was added, the microstickies coagulated to form
rger particles, and thus the removal efficiency increased significantly. PolyDaDMAC
fiber surface properties should be
egligible.
and colloidal contaminants including microstickies can be fixed to fibers
y flocculants in the presence of fixative agents around the iso-electrical point. Very
rst and tear), and has no effect on
ptical property. Fixation of lignin increases the paper strength, and reduces the optical
ely removed by flotation through charge control.
he removal efficiency can be 96%. Thus, cationic PSA may have extra benefit as a
n
10 microns. When polyDADMA
la
might have also changed the surface chemistry of the microstickies, and made the
microstickies easier to attach to air bubbles. The results show that if the chemistry in de-
inking process is well controlled, most microstickies may be removed in flotation.
Previous work [7] has indicated that charge neutralizer first reacted with the water
soluble and colloidal anionic trash before reacted with fiber. But when the anionic
materials are neutralized to near zero charge point, the competition between fiber and
colloidal materials to react with the charge neutralizer will start. So if the charge is well
controlled, the effect of charge neutralizer on
n
3.3 Conclusions
Water-soluble
b
high turbulence reduces the fixation efficiency. At high salt concentration, neutral
flocculant is more effective than charged polymers for fixation. The fixation process is a
process of neutralization, coagulation, fixation and retention. Fixation of microstickies
has very small effect on the paper strength (tensile, bu
o
property. Microstickies can be effectiv
T
cationic fixation agent or neutralizer in paper recycling.
101

0
Figure 1. Fixation of stickies and lignin with polyDADMAC at pH 8.0. CPAM: 4ppm;
stir rate 1000 rpm.
Figure 2. Fixation of stickies and lignin with PEI at pH 8.0. CPAM: 4ppm; stir rate
1000 rpm.
20
40
60
80
100
Res
idue
in fi
ltrat
e (%
)5
15
25
Zeta
pot
entia
l (m
V)
-25
-15
-5
0 10 20 30 40 50 60PolyDADMAC amount (ppm)
LigninStickies
0140
PEI amount (ppm)
Res
idue
in fi
ltrat
e (%
)
-25
Zeta
pot
entia
l (m
V)
60
80
100
5
15
25LigninStickies
20
40
-15
-5
0 20 40 60 80 100 120
102

100Lignin, CPAMLignin, PEO/PFRStickies, CPAM
Figure 3. The effect of polyDADMAC molecular weight on fixation at pH 8.0. CPAM:
4ppm; stir rate 1000 rpm.
Figure 4. Fixation of stickies and lignin with polyDADMAC at pH 5.0. CPAM: 4ppm;
stir rate 1000 rpm.
0800 1000 1200 1400 1600 1800 2000
Stirring rate (rpm)
20
40
60
80
Res
idue
in fi
ltrat
e (%
)Stickies, PEO/PFR
00 5 10 15 20 25 30 35 40
PolyDADMAC amount (ppm)
-30
40
80
120
160
200
Res
idue
in fi
ltrat
e (p
pm)
-20
-10
0
10
20
30
Zeta
pot
entia
l (m
V)
LigninStickies
103

0
20
40
60
80
100
0 5 10 15 20 25 30 35 40
PEI amount (ppm)
Res
idue
in fi
ltrat
e (%
)
-25
-15
-5
5
15
25
Zeta
pot
entia
l (m
V)
LigninStickies
Figure 5. Fixation of stickies and lignin with PEI at pH 5.0. CPAM: 4ppm; stir rate
1000 rpm.
0
20
40
800 1000 1200 1400 1600 1800 2000
Stirring rate (rpm)
Res
idue
in fi
ltrat
e (%
)
60
80
100Lignin, CPAMLignin, PEO/PFRStickies, CPAMStickies, PEO/PFR
Figure 6. The effect of shear force on fixation with different flocculants at pH 8.0.
CPAM: 4 ppm; PEO/PFR: 2 ppm/ 4 ppm.
104

0
20
40
60
80
100
120
Lignin Stickies
Res
idue
in fi
ltrat
e (%
) no additivesPD alonePD + CPAMPD + PEO/PFRPD + APAM
Figure 7
Figure 8. The effect of flocculant on fixation without fixative agent at pH 8.0. Stir rate
000 rpm.
. The effect of flocculant on fixation with fixative agent at pH 8.0.
PolyDADMAC: 25 ppm; stir rate 1000 rpm.
0
20
40
60
80
100
Lignin Stickies
Res
idue
in fi
ltrat
e (%
)
no additivesCPAM onlyPEO/PFR only
1
105

0
20
40
60
80
100
0 10 20 30 40 50
PolyDADMAC amount (ppm)
Res
idue
in fi
ltrat
e (%
)
-25
-15
-5
5
15
25
Zeta
pot
entia
l (m
V)
LigninStickies
Figure 9 ; stir
Figure 10. The effect of inorganic salts on fixation at pH 8.0. With PEO/PFR: 2 ppm/4
. The effect of inorganic salts on fixation at pH 8.0. With CPAM: 4 ppm
rate 1000 rpm.
0
20
40
60
80
100
0 10 20 30 40 50
PolyDADMAC amount (ppm)
Res
idue
in fi
ltrat
e (%
)
-25
-15
-5
5
15
25
Zeta
pot
entia
l (m
V)LigninStickies
ppm; stir rate 1000 rpm.
106

(b) PolyDADMAC: 2.5 ppm; zeta: -7.5 mV
(c) PolyDADMAC: 5.0 ppm; zeta: +0.5 mV
(d) PolyDADMAC: 7.5 ppm; zeta: +13.1 mV
(e)
igure 11. Scanning Electron Microscopy (SEM) of microstickies on fibers with
ifferent amount of fixative agent polyDADMAC.
(a) PolyDADMAC: 0 ppm; zeta: -21.4 mV
PolyDADMAC: 10 ppm; zeta: +17.0 mV
F
d
107

0
1
2Te
nsile
(N/m
m)
Stickies + lignin,no fixation
Stickies + lignin,fixation
Stickies, nofixation
Stickies, fixation3
4
Figure 12. The effect of stickies and lignin fixation on paper tensile strength.
0
100
200
300
400
Fold
ing
Stickies, nofixationStickies, fixation
Stickies + lignin,no fixationStickies + lignin,fixation
Figure 13. The effect of stickies and lignin fixation on paper folding strength.
108

0
100
200
300
400
500
Tear
(mN
)
Stickies, nofixationStickies, fixation
Stickies + lignin,no fixationStickies + lignin,fixation
Figure 15. The effect of stickies and lignin fixation on paper optical property.
Figure 14. The effect of stickies and lignin fixation on paper tear strength.
0
20
40
60
80
0
Brig
htne
ss (I
SO)
Stickies, nofixationStickies, fixation
Stickies + lignin,no fixationStickies + lignin,fixation
10
109

0
20
40
60
80
100
Stic
kies
con
tent
(%) Original
Vinings A
PolyDADMAC +Vinings A
Figure 16. Removal of microstickies through flotation.
References
1. T. Woodward, Proc. Waste Paper VII, 4, Chicago, IL, June (1996).
2. D.J.H. Wenzl, Proc. 1981 TAPPI Annual Meeting, TAPPI Press, P95.
3. F.J.S. Amand, B. Perrin and P. de Luca, Prog. Paper Recy., 39, August (1998).
Atlanta, GA, March (1996).
5. L. Warberg and L. Odberg, Nordic Pulp Paper Res. J., 6(3), 127(1991).
6. M. Geistbeck and H. Wiese, Twogether Pap. Technol. J., 4, 30 (1997).
7. Y. Deng and Y. Xu, "Wet-End Chemistry in Highly Contaminated Systems", Status
Report for IPST Project F043, February (2001).
4. N.N.-C. Hsu and D.L. Dauplaise, Proc. TAPPI Recycling Symp., 249, TAPPI Press,
110