Synthesis, Characterization, and Application of Metal ... · Synthesis, Characterization, and...
220
Synthesis, Characterization, and Application of Metal- Chelating Polymers for Mass Cytometric Bioassays by Daniel Majonis A thesis submitted in conformity with the requirements for the degree of Doctor of Philosophy Graduate Department of Chemistry University of Toronto © Copyright by Daniel Majonis, 2012
Transcript of Synthesis, Characterization, and Application of Metal ... · Synthesis, Characterization, and...
Synthesis, Characterization, and Application of Metal-Chelating Polymers for Mass Cytometric Bioassays
by
Daniel Majonis
A thesis submitted in conformity with the requirements for the degree of Doctor of Philosophy
Graduate Department of Chemistry University of Toronto
© Copyright by Daniel Majonis, 2012

ii
Synthesis, Characterization, and Application of Metal-Chelating
Polymers for Mass Cytometric Bioassays
Daniel Majonis, Ph.D. Thesis (2012)
Department of Chemistry, University of Toronto
Abstract
This thesis describes the synthesis, characterization, and application of metal-chelating
polymers for mass-cytometric bioassays. Mass cytometry is a cell characterization technique in
which cells are injected individually into an ICP-MS detector. Signal is provided by staining
cell-surface or intracellular antigens with metal-labeled antibodies (Abs). These Abs are labeled
through the covalent attachment of metal-chelating polymers which carry multiple copies of a
lanthanide isotope.
In this work, my first goal was to develop a facile, straightforward synthesis of a new
generation of metal-chelating polymers. The synthesis began with reversible addition-
fragmentation chain transfer polymerization, and was followed by numerous post-polymerization
pendant group transformations to introduce DTPA lanthanide chelators to every repeat unit, and
a maleimide at the end of the chain.
The second goal was to apply these metal-chelating polymers in bioassay experiments. The
DTPA groups were loaded with lanthanide ions, and the maleimide group was used to covalently
attach the polymer to an Ab. This goat anti-mouse conjugate was found to carry an average of
2.4 ± 0.3 polymer chains. Then, primary Ab conjugates were prepared and used in an 11-plex
mass cytometry assay in the characterization of umbilical cord blood cells.
iii
The third goal was to expand the multiplexity of the assay. In current technology, the
number of Abs that can be monitored simultaneously is limited to the 31 commercially available,
stable lanthanide isotopes. Thus, I had an interest in preparing metal-chelating polymers that
could carry other metals in the 100-220 amu range. I synthesized polymers with four different
polyaminocarboxylate ligands, and investigated the loading of palladium and platinum ions into
these polymers. Polymer-Ab conjugates prepared with palladium- and platinum-loaded
polymers gave curious results, in that only dead cells were recognized.
The fourth goal was to create dual-purpose Ab tags. My approach was to synthesize
polymers similar to those described above, but which also carried two to six fluorescent dyes.
Polymer-Ab conjugates prepared with four different dye-labeled polymers gave mixed results.
Two of the four conjugates performed well in FACS and mass cytometric assays, but the other
two did not. Further experiments are needed to overcome this problem.

iv
Acknowledgments
I would like express my deep gratitude to my supervisor Professor Mitchell A. Winnik for
the opportunity to work on a genuinely interesting and challenging Ph.D. project, and for the
guidance and training he gave me in scientific writing and research. I would like to thank
Professor Mark Nitz, Dr. Olga Ornatsky, and Dr. Gerald Guerin for the mentoring, guidance, and
collaborations they have provided me over the course of my graduate student career.
I owe a debt of gratitude to all my past and present coworkers in the Winnik group. I would
like to thank Dr. Xudong Lou for the guidance he gave me during the start of my research. I owe
a debt of gratitude to Isaac Herrera, Binxin Li, Mohsen Soleimani, Dr. Ahmed Abdelrahman, Dr.
Sebastian Berger, Yijie Lu, Dr. Dirk Weinrich, Dr. Nicolas Illy, Nicole Zgodzaj, Peng Liu, Grace
Ng, Dr. Michael Leipold, Pengpeng Cao, Dr. Adrienne Halupa, Robert Kinach, and Leslie Fung
for all the discussions and collaborations we shared. I am grateful to Maren Schulze, Markus
Bannwarth, and Jan Oliver Morsbach for the enthusiasm and hard work they put into our
collaborations during their time here in Toronto.
I am grateful to my family for the support they have given me in completing this work. I am
appreciative of how my parents raised me to value hard work and education. I am grateful to my
siblings Josh, Judith and Carol for their support and company. I am especially thankful to my
darling Lily for her love and companionship.
Last but not least, I am deeply indebted and thankful to my deity, the Flying Spaghetti
Monster. The success of this work was surely guaranteed by the wise and gentle touch of His
Noodly Appendage upon my experiments. Ramen.

v
What a piece of work is man! How noble in reason, how infinite in faculty, in form, in
moving how express and admirable, in action how like an angel, in apprehension how like a
god!
-Hamlet II.ii.304-308, quoted by Captain Jean-Luc Picard in Star Trek TNG, “Hide and Q”

vi
Table of Contents
Acknowledgments.......................................................................................................................... iv
Table of Contents........................................................................................................................... vi
List of Tables ............................................................................................................................... xiii
List of Schemes............................................................................................................................. xv
List of Figures ............................................................................................................................. xvii
List of Abbreviations ................................................................................................................. xxvi
1 Chapter 1: Introduction ...............................................................................................................1
1.1 Overview..............................................................................................................................1
1.2 Literature Review.................................................................................................................2
1.2.1 The Enablement of Mass Cytometry by Polymeric Reagents .................................2
1.2.2 Synthesis of Metal-Chelating Polymers for Biological Applications......................4
1.2.2.1 Backbone, Ligand Attachment ..................................................................4
1.2.2.2 Bioconjugation ..........................................................................................6
1.2.2.3 Winnik Group Metal-Chelating Polymer ..................................................6
1.2.3 Recovering End-Functionality of RAFT Polymers .................................................8
1.2.3.1 R2 α-End Strategy......................................................................................8
1.2.3.2 R3 ω-End Strategy ...................................................................................10
1.2.3.3 R4 ω-End Strategy ...................................................................................11
1.2.3.4 End-Functionality without End-Group Manipulation .............................14
1.2.4 Characterization of Antibody Conjugates for Quantitative Bioassays ..................15
1.2.4.1 ABC by FACS.........................................................................................15
1.2.4.2 ABC by Mass Cytometry ........................................................................17
1.2.5 Dual-Purpose Labels for Bioassays .......................................................................18
1.3 Research Gaps and Intended Goals....................................................................................20
vii
1.4 Thesis Plan .........................................................................................................................22
2 Chapter 2: General Experimental Details .................................................................................23
2.1 Overview............................................................................................................................23
2.2 Experimental ......................................................................................................................23
2.2.1 Instrumentation and Characterization ....................................................................23
2.2.1.1 Gel Permeation Chromatography ............................................................23
2.2.1.2 1H NMR...................................................................................................24
2.2.1.3 Thermogravimetric Analysis (TGA) .......................................................26
2.2.2 Standard Error Calculation ....................................................................................26
2.2.3 Biological Experiments..........................................................................................26
2.2.3.1 Antibody Labeling with Metal-Chelating Polymers ...............................26
2.2.3.2 Mass Cytometry.......................................................................................27
3 Chapter 3: Synthesis of a Functional Metal-Chelating Polymer and Steps towards Quantitative Mass Cytometry Bioassays ..................................................................................29
3.1 Introduction........................................................................................................................29
3.2 Experimental ......................................................................................................................30
3.2.1 Polymer Synthesis..................................................................................................30
3.2.1.1 Materials ..................................................................................................30
3.2.1.2 Polymer Series.........................................................................................31
3.2.2 Instrumentation and Characterization ....................................................................36
3.2.2.1 Spectroscopic Determination of Thiol End-Groups ................................36
3.2.2.2 Isothermal Titration Calorimetry (ITC)...................................................37
3.2.3 Biological Experiments..........................................................................................37
3.2.3.1 Antibody Labeling with Metal-Chelating Polymers ...............................37
3.2.3.2 Metal Atoms per Antibody......................................................................37
3.2.3.3 11 Antibody Whole Cord Blood Analysis...............................................38
viii
3.3 Results and Discussion ......................................................................................................39
3.3.1 Polymer Synthesis..................................................................................................39
3.3.1.1 Introducing the Ligand ............................................................................46
3.3.1.2 Disulfide Reduction and End-Group Functionality.................................48
3.3.2 Metal Binding Capacity and Metal Atoms per Antibody ......................................54
3.3.2.1 Thermal Gravimetric Analysis ................................................................55
3.3.2.2 Isothermal Titration Calorimetry.............................................................58
3.3.2.3 Covalent Attachment of Metal-Chelating Polymers to Antibodies.........61
3.3.3 Simultaneous 11-plex Antibody Staining and Analysis of Whole Cord Blood.....61
3.4 Summary............................................................................................................................66
3.5 Contents of Appendix to Chapter 3 ...................................................................................67
4 Chapter 4: Metal-Chelating Polymer Synthesis: Recovering End-Group-Functionality at the Late Stage............................................................................................................................69
4.1 Introduction........................................................................................................................69
4.2 Experimental ......................................................................................................................70
4.2.1 Polymer Synthesis..................................................................................................70
4.2.1.1 Materials ..................................................................................................70
4.2.1.2 Polymer Synthesis ...................................................................................72
4.2.2 Instrumentation and Characterization ....................................................................77
4.2.2.1 UV/VIS Spectroscopy .............................................................................77
4.3 Results and Discussion ......................................................................................................78
4.3.1 Amino Polymer Synthesis......................................................................................78
4.3.2 DTPA Reactions ....................................................................................................81
4.3.3 Quantification of the C12 Trithiocarbonate End-Group at the P6 Stage ...............84
4.3.4 Thiol End-Group Functionality and Conversion to a Terminal Maleimide ..........85
4.4 Summary............................................................................................................................92
ix
4.5 Contents of Appendix to Chapter 4 ...................................................................................94
5 Chapter 5: Curious Results with Palladium- and Platinum-Carrying Polymers in Mass Cytometry Bioassays and an Unexpected Application as a Dead Cell Stain............................95
5.1 Introduction........................................................................................................................95
5.2 Experimental ......................................................................................................................96
5.2.1 Polymer Synthesis..................................................................................................96
5.2.1.1 Materials ..................................................................................................96
5.2.1.2 Polymer Synthesis ...................................................................................97
5.2.2 Metal-Loading Reactions.....................................................................................101
5.2.2.1 Lanthanides............................................................................................101
5.2.2.2 Palladium...............................................................................................102
5.2.2.3 Platinum.................................................................................................103
5.2.3 Instrumentation and Characterization ..................................................................103
5.2.3.1 UV/VIS Spectroscopy ...........................................................................103
5.2.3.2 Inductively Coupled Plasma-Mass Spectroscopy .................................103
5.2.3.3 Polymer Metal Content..........................................................................104
5.2.4 Biological Experiments........................................................................................105
5.2.4.1 Antibody Labeling with Metal-Chelating Polymers .............................105
5.2.4.2 Mass Cytometry Bioassays....................................................................105
5.3 Results and Discussion ....................................................................................................106
5.3.1 Polymer Synthesis................................................................................................106
5.3.2 Polymer Chain Extinction Coefficients ...............................................................108
5.3.2.1 Thermal Gravimetric Analysis ..............................................................108
5.3.2.2 Polymer Chain Extinction Coefficients.................................................112
5.3.3 Metal-Loading Experiments ................................................................................113
5.3.3.1 Lanthanides............................................................................................114
x
5.3.3.2 Palladium...............................................................................................117
5.3.3.3 Platinum.................................................................................................119
5.3.4 Mass Cytometry Experiments..............................................................................120
5.3.4.1 Palladium...............................................................................................120
5.3.4.2 Platinum.................................................................................................122
5.3.4.3 The Effect of Soft Metal Atoms ............................................................123
5.3.4.4 Palladium Polymers as a Dead Cell Stain .............................................124
5.4 Summary..........................................................................................................................126
5.5 Contents of Appendix to Chapter 5 .................................................................................127
6 Chapter 6: Dual-Purpose Polymer Labels for Fluorescent and Mass Cytometric Bioassays .129
6.1 Introduction......................................................................................................................129
6.2 Experimental ....................................................................................................................131
6.2.1 Polymer Synthesis................................................................................................131
6.2.1.1 Materials ................................................................................................131
6.2.1.2 Polymer Synthesis .................................................................................131
6.2.2 Instrumentation and Characterization ..................................................................136
6.2.2.1 UV/VIS Spectroscopy ...........................................................................136
6.2.2.2 Polymer Metal Content..........................................................................137
6.2.2.3 Fluorescence Spectroscopy ...................................................................137
6.2.3 Biological Experiments........................................................................................137
6.2.3.1 Antibody Labeling with Metal-Chelating Polymers .............................137
6.2.3.2 Metal Atoms per Antibody....................................................................137
6.2.3.3 Fluorescent and Mass Cytometric Assays .............................................138
6.3 Results and Discussion ....................................................................................................138
6.3.1 Polymer Synthesis................................................................................................138
6.3.1.1 Precursor Polymer Synthesis.................................................................138
xi
6.3.1.2 Optimizing the Attachment of Fluorescent Dyes ..................................142
6.3.1.3 Attachment of the Bismaleimide Linker ...............................................144
6.3.1.4 Fluorescence Spectra .............................................................................145
6.3.2 Mass Cytometry and FACS Bioassays ................................................................147
6.3.2.1 Proof of Concept Bioassays...................................................................147
6.3.2.2 Preparation of Primary Antibody Tags..................................................148
6.3.2.3 Mass Cytometry Antibody Dilution Series and Tetraplex Assay .........150
6.3.2.4 FACS Tetraplex Assay ..........................................................................155
6.4 Summary..........................................................................................................................158
6.5 Contents of Appendix to Chapter 6 .................................................................................159
7 Chapter 7: Future Work ..........................................................................................................161
7.1 Overview..........................................................................................................................161
7.2 Chapter 3..........................................................................................................................161
7.2.1 Influence of Metal-Chelating Polymer on Antibody Binding Affinity ...............161
7.3 Chapter 4..........................................................................................................................163
7.3.1 Do Dodecyl-Terminated Amino or DTPA Polymers form Micelles in Water? ..163
7.4 Chapter 5..........................................................................................................................164
7.4.1 Indium-Loaded Metal-Chelating Polymers .........................................................164
7.4.2 Soft Ligands for Palladium and Platinum............................................................164
7.5 Chapter 6..........................................................................................................................165
7.5.1 Improved Dual-Purpose Fluorescent Polymers ...................................................165
8 References ...............................................................................................................................167
9 Appendices..............................................................................................................................177
9.1 Appendix to Chapter 3 .....................................................................................................177
9.1.1 Thermal Gravimetric Analysis of Disodium EDTA.2H2O ..................................177
9.1.2 Isothermal Titration Calorimetry (ITC) ...............................................................177
xii
9.1.3 Antibody Dilution Series .....................................................................................179
9.1.4 Clusters of Differentiation (CD) ..........................................................................180
9.2 Appendix to Chapter 4 .....................................................................................................181
9.2.1 Figures..................................................................................................................181
9.3 Appendix to Chapter 5 .....................................................................................................184
9.3.1 Control Experiments for TGA Step-Scan Approach ...........................................184
9.3.2 Aqueous SEC Characterization of Metal-Loaded Polymers ...............................186
9.3.3 Tables...................................................................................................................187
9.3.4 Figures..................................................................................................................187
9.4 Appendix to Chapter 6 .....................................................................................................189
9.4.1 Tables...................................................................................................................189
9.4.2 Figures..................................................................................................................189
xiii
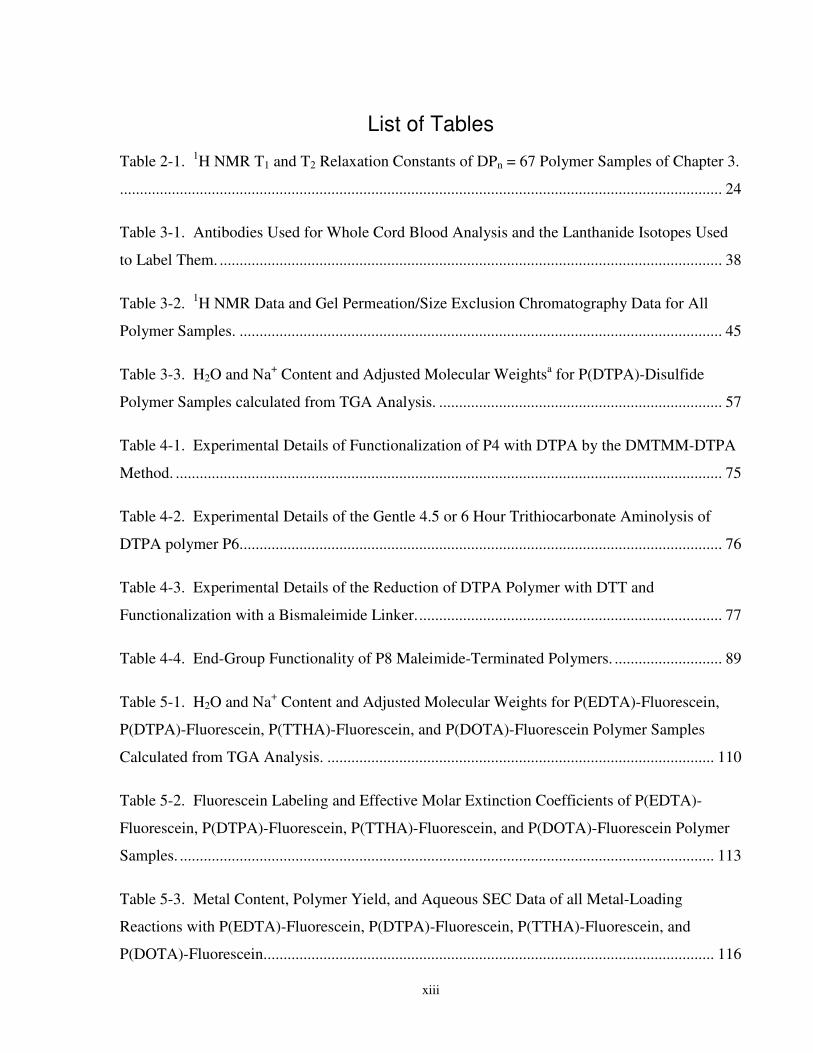
List of Tables
Table 2-1. 1H NMR T1 and T2 Relaxation Constants of DPn = 67 Polymer Samples of Chapter 3.
....................................................................................................................................................... 24
Table 3-1. Antibodies Used for Whole Cord Blood Analysis and the Lanthanide Isotopes Used
to Label Them. .............................................................................................................................. 38
Table 3-2. 1H NMR Data and Gel Permeation/Size Exclusion Chromatography Data for All
Polymer Samples. ......................................................................................................................... 45
Table 3-3. H2O and Na+ Content and Adjusted Molecular Weightsa for P(DTPA)-Disulfide
Polymer Samples calculated from TGA Analysis. ....................................................................... 57
Table 4-1. Experimental Details of Functionalization of P4 with DTPA by the DMTMM-DTPA
Method. ......................................................................................................................................... 75
Table 4-2. Experimental Details of the Gentle 4.5 or 6 Hour Trithiocarbonate Aminolysis of
DTPA polymer P6......................................................................................................................... 76
Table 4-3. Experimental Details of the Reduction of DTPA Polymer with DTT and
Functionalization with a Bismaleimide Linker............................................................................. 77
Table 4-4. End-Group Functionality of P8 Maleimide-Terminated Polymers. ........................... 89
Table 5-1. H2O and Na+ Content and Adjusted Molecular Weights for P(EDTA)-Fluorescein,
P(DTPA)-Fluorescein, P(TTHA)-Fluorescein, and P(DOTA)-Fluorescein Polymer Samples
Calculated from TGA Analysis. ................................................................................................. 110
Table 5-2. Fluorescein Labeling and Effective Molar Extinction Coefficients of P(EDTA)-
Fluorescein, P(DTPA)-Fluorescein, P(TTHA)-Fluorescein, and P(DOTA)-Fluorescein Polymer
Samples. ...................................................................................................................................... 113
Table 5-3. Metal Content, Polymer Yield, and Aqueous SEC Data of all Metal-Loading
Reactions with P(EDTA)-Fluorescein, P(DTPA)-Fluorescein, P(TTHA)-Fluorescein, and
P(DOTA)-Fluorescein................................................................................................................. 116
xiv
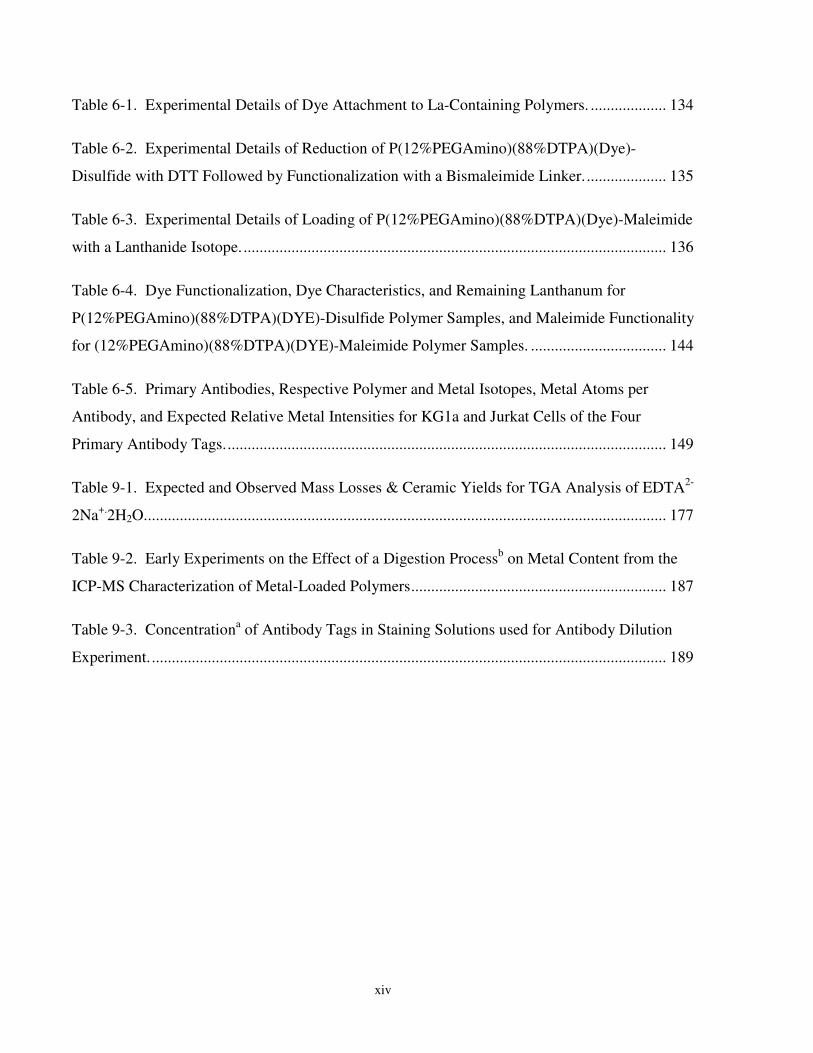
Table 6-1. Experimental Details of Dye Attachment to La-Containing Polymers. ................... 134
Table 6-2. Experimental Details of Reduction of P(12%PEGAmino)(88%DTPA)(Dye)-
Disulfide with DTT Followed by Functionalization with a Bismaleimide Linker..................... 135
Table 6-3. Experimental Details of Loading of P(12%PEGAmino)(88%DTPA)(Dye)-Maleimide
with a Lanthanide Isotope. .......................................................................................................... 136
Table 6-4. Dye Functionalization, Dye Characteristics, and Remaining Lanthanum for
P(12%PEGAmino)(88%DTPA)(DYE)-Disulfide Polymer Samples, and Maleimide Functionality
for (12%PEGAmino)(88%DTPA)(DYE)-Maleimide Polymer Samples. .................................. 144
Table 6-5. Primary Antibodies, Respective Polymer and Metal Isotopes, Metal Atoms per
Antibody, and Expected Relative Metal Intensities for KG1a and Jurkat Cells of the Four
Primary Antibody Tags............................................................................................................... 149
Table 9-1. Expected and Observed Mass Losses & Ceramic Yields for TGA Analysis of EDTA2-
2Na+.2H2O................................................................................................................................... 177
Table 9-2. Early Experiments on the Effect of a Digestion Processb on Metal Content from the
ICP-MS Characterization of Metal-Loaded Polymers................................................................ 187
Table 9-3. Concentrationa of Antibody Tags in Staining Solutions used for Antibody Dilution
Experiment.................................................................................................................................. 189
xv
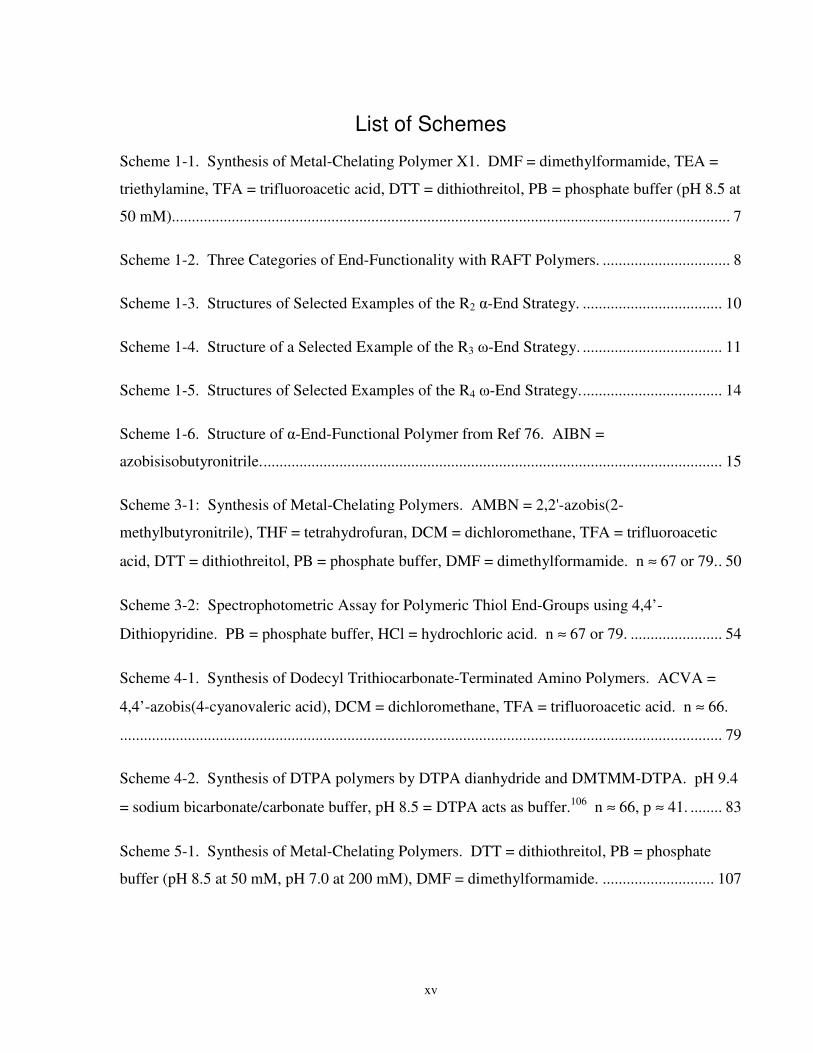
List of Schemes
Scheme 1-1. Synthesis of Metal-Chelating Polymer X1. DMF = dimethylformamide, TEA =
triethylamine, TFA = trifluoroacetic acid, DTT = dithiothreitol, PB = phosphate buffer (pH 8.5 at
50 mM)............................................................................................................................................ 7
Scheme 1-2. Three Categories of End-Functionality with RAFT Polymers. ................................ 8
Scheme 1-3. Structures of Selected Examples of the R2 α-End Strategy. ................................... 10
Scheme 1-4. Structure of a Selected Example of the R3 ω-End Strategy. ................................... 11
Scheme 1-5. Structures of Selected Examples of the R4 ω-End Strategy.................................... 14
Scheme 1-6. Structure of α-End-Functional Polymer from Ref 76. AIBN =
azobisisobutyronitrile.................................................................................................................... 15
Scheme 3-1: Synthesis of Metal-Chelating Polymers. AMBN = 2,2'-azobis(2-
methylbutyronitrile), THF = tetrahydrofuran, DCM = dichloromethane, TFA = trifluoroacetic
acid, DTT = dithiothreitol, PB = phosphate buffer, DMF = dimethylformamide. n ≈ 67 or 79.. 50
Scheme 3-2: Spectrophotometric Assay for Polymeric Thiol End-Groups using 4,4’-
Dithiopyridine. PB = phosphate buffer, HCl = hydrochloric acid. n ≈ 67 or 79. ....................... 54
Scheme 4-1. Synthesis of Dodecyl Trithiocarbonate-Terminated Amino Polymers. ACVA =
4,4’-azobis(4-cyanovaleric acid), DCM = dichloromethane, TFA = trifluoroacetic acid. n ≈ 66.
....................................................................................................................................................... 79
Scheme 4-2. Synthesis of DTPA polymers by DTPA dianhydride and DMTMM-DTPA. pH 9.4
= sodium bicarbonate/carbonate buffer, pH 8.5 = DTPA acts as buffer.106 n ≈ 66, p ≈ 41. ........ 83
Scheme 5-1. Synthesis of Metal-Chelating Polymers. DTT = dithiothreitol, PB = phosphate
buffer (pH 8.5 at 50 mM, pH 7.0 at 200 mM), DMF = dimethylformamide. ............................ 107
xvi
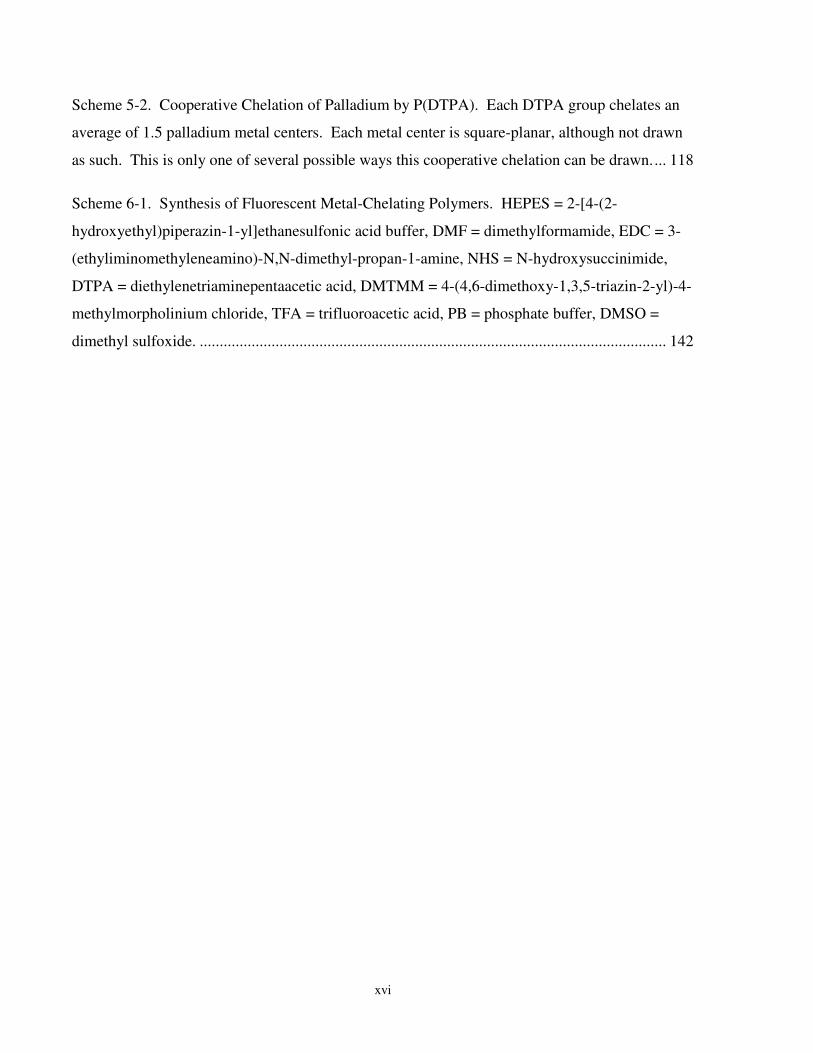
Scheme 5-2. Cooperative Chelation of Palladium by P(DTPA). Each DTPA group chelates an
average of 1.5 palladium metal centers. Each metal center is square-planar, although not drawn
as such. This is only one of several possible ways this cooperative chelation can be drawn.... 118
Scheme 6-1. Synthesis of Fluorescent Metal-Chelating Polymers. HEPES = 2-[4-(2-
hydroxyethyl)piperazin-1-yl]ethanesulfonic acid buffer, DMF = dimethylformamide, EDC = 3-
(ethyliminomethyleneamino)-N,N-dimethyl-propan-1-amine, NHS = N-hydroxysuccinimide,
DTPA = diethylenetriaminepentaacetic acid, DMTMM = 4-(4,6-dimethoxy-1,3,5-triazin-2-yl)-4-
methylmorpholinium chloride, TFA = trifluoroacetic acid, PB = phosphate buffer, DMSO =
dimethyl sulfoxide. ..................................................................................................................... 142

xvii
List of Figures
Figure 3-1. 1H NMR Spectrum (CD2Cl2) of PtBA-Trithiocarbonate (DPn = 67). End-group
analysis shows the degree of polymerization to be 67.................................................................. 40
Figure 3-2. Top: THF SEC Chromatographs as Monitored by Refractive Index (RI) Detector of
PtBA-Trithiocarbonate and PtBA-Disulfide (DPn = 67). The PtBA-Trithiocarbonate is in the
form of a dimer, linked through the trithiocarbonate moiety. After aminolysis, the majority of
the chains have reformed as dimers linked through a disulfide bond. Bottom: THF SEC
Chromatographs as Monitored by UV/VIS Detector at 310 nm of PtBA-Trithiocarbonate and
PtBA-Disulfide. UV/VIS signal is normalized against mass concentration via dividing by the RI
detector signal. .............................................................................................................................. 41
Figure 3-3. 1H NMR Spectrum (D2O) of PAA-Disulfide (DPn = 67). The degree of
polymerization has not changed relative to the PtBA sample, remaining at 67. T-butyl ester
deprotection is largely complete; the peak at 1.46 ppm has an integration of 3, representing
~0.5% of initial t-butyl groups present before deprotection. ........................................................ 42
Figure 3-4. 1H NMR Spectrum (D2O) of Amino Polymer-Disulfide (DPn = 67). In this
spectrum, DPn is calculated by comparing the 5H Phenyl end-group to the a and b backbone
signals, yielding DPn = (194.4/3) = 65. Furthermore, within NMR error, the polymer is fully
functionalized with ethylenediamine groups. This is calculated by comparing the a and b
backbone signals to the c and d ethylenediamine signals, where acrylamide functionality = 100%
* (260.8/194.4) / (4/3) = 100%. Finally, also of note is that no sharp t-butyl signal is present
around 1.4 ppm, which shows that the deprotection of the Boc groups was quantitative. ........... 43
Figure 3-5. 1H NMR Spectrum (D2O) of P(DTPA)-Disulfide (DPn = 67). In this spectrum, DPn
is calculated by comparing the 5H Phenyl end-group to the a and b backbone signals, yielding
DPn = (187.2/3) = 62. Note, however, that this analysis is less reliable due to difficulty in
assigning a baseline to the broadened polymer backbone peaks. Within NMR error, the polymer
is fully functionalized with DTPA groups. This is calculated by comparing the backbone signals
to the ethylenediamine and DTPA signals, where DTPA functionality = 100% * (1399.9/187.2) /
(22/3) = 100%. .............................................................................................................................. 47
xviii
Figure 3-6. Percent of Amino Groups Functionalized with DTPA (1H NMR D2O) by Varying
the Equivalents of DMTMM. DMTMM equivalents were varied from 0.4 to 4. DTPA
functionality was monitored by 1H NMR in D2O. A line of best fit is included to guide the eye.
....................................................................................................................................................... 48
Figure 3-7. Aqueous SEC Chromatographs of P(DTPA)-Disulfide and P(DTPA)-Maleimide
(DPn = 67). The initial DTPA polymer is in the form of a polymeric disulfide. After reduction
with DTT and reaction with the bismaleimide linker, the polymers are in their final unimeric
form with a maleimide end group. Before reaction Mn = 36,800 Da (PDI = 1.18), and after
reaction Mn = 22,500 Da (PDI = 1.15).......................................................................................... 49
Figure 3-8. Partial 1H NMR Spectrum (D2O) of P(DTPA)-Maleimide (DPn = 67). Comparing
the 5H phenyl end-group with the 2H vinylic protons of the maleimide linker shows end-
functionalization = (1.84/2) × 100% = 92%. ................................................................................ 50
Figure 3-9. TGA Traces of EDTA2-2Na+.H2O, P(DTPA)-Disulfide Polymers (67 and 79), and
P(42%DTPA)-Disulfide (67). These TGA traces were collected in the presence of air at a
heating rate of 1 0C/min. ............................................................................................................... 56
Figure 3-10. Top: Isothermal Titration Calorimetric Thermogram of P(DTPA)-Disulfide
Polymer (sample 79, 0.27 mg of polymer per mL) with Gd3+ (5.0 mM) in Citrate Buffer (100
mM, pH 5.5) at 25 ºC. Endothermic signals correspond to the dissociation of Gd3+-citrate and
binding to a DTPA pendant group. Bottom: Binding Isotherm Calculated from the Titration
Above. The solid line was obtained from nonlinear least squares regression of a two binding site
model and used to extract the equivalence points for each binding site (n1, n2). The total
equivalence point (ntot) corresponds to the sum of the individual equivalence points and
represents the mmol of Gd3+ required to saturate the DTPA pendant groups in one gram of
polymer. This value is situated at the inflection point of the titration curve (ntot = 1.48 ± 0.3
mmol of Gd3+ per gram of polymer)............................................................................................. 59
Figure 3-11. Cell Population Gating Strategy for Umbilical Cord Blood Stained with a Mixture
of 11 Metal-Tagged Antibodies. Whole heparinized umbilical cord blood was treated with RBC
lysis buffer. The leukocytes were washed once with 1% BSA/PBS and stained with a mixture of
11 antibodies conjugated to MCP preloaded with different lanthanide isotopes. Optimal
xix
antibody concentrations for each metal-tagged Ab were determined from the dilution series
(Appendix, Figure 9-2 and Figure 9-3). Washed cells were fixed in 3.7% formaldehyde and
counter-stained with the Ir-intercalator for nuclear cell identification. Samples were analyzed by
mass cytometry, and the data in FCS 3.0 format were processed by FlowJoTM software. The
axes reflect dual-counting (D), which is the combination of counting and analog modes of ion
detection, and allows simultaneous detection of very small and very large signals. The major cell
types (Lymphocytes, Granulocytes, Monocytes and subsets of CD3 T-cells and B-cells) are
shown on two dimensional smoothed dot-plots............................................................................ 64
Figure 3-12. Biomarker Analysis of Whole Umbilical Cord Blood Cells Stained with a Mixture
of 11 Metal-Tagged Antibodies. Optimal antibody concentrations for each metal-tagged Ab
were determined from the dilution series (Appendix, Figure 9-2 and Figure 9-3). Samples were
analyzed by mass cytometry and data in FCS 3.0 format were processed by FlowJoTM software.
Cell population gating strategy is presented in Figure 3-11. Mean values for gated populations
are presented on the logarithmic radial diagram. Six main cell types are shown as individual
color lines...................................................................................................................................... 66
Figure 4-1. 1H NMR Spectrum (D2O) of Amino Polymer P4. This spectrum indicates that ca.
90% to 95% of the dodecyl groups are still present...................................................................... 80
Figure 4-2. 1H NMR Spectrum (D2O) of Amino Polymer P4’. This spectrum lacks a dodecyl
methyl signal, and shows that 68% of the chains are bound to a triazine group through a stable
thioether bond. .............................................................................................................................. 80
Figure 4-3. Comparison of Aqueous SEC Chromatographs of Polymer P5, Formed by Reaction
of P4 with DTPA Dianhydride, and B1-P6, From the Reaction of P4 with DMTMM-DTPA.
Calibration of the column with poly(methacrylic acid) standards leads to values of Mn = 80,000
Da (PDI = 1.07) and 11,100 Da (PDI = 1.25) for the two components of P5, and Mn = 22,100 Da
(PDI = 1.24) for B1-P6. ................................................................................................................ 82
Figure 4-4. UV/VIS Spectra of the Aminolysis of B1-P6 to B1-P7 Taken Over the Course of the
Reaction. Over time, the trithiocarbonate peak at 308 nm decreases, and a new peak at 275 nm
forms. ............................................................................................................................................ 86
xx
Figure 4-5. Partial 1H NMR Spectra (D2O) of B3-P6 and B3-P7. (A) By the dodecyl methyl
signal (a), P6 appears to have retained all of the trithiocarbonate chain ends. The integration of
the polymer backbone protons (66x3 = 198) are used as the reference integration. The total is
220 due to the overlapping, additional 22 protons of the dodecyl group. (B) By the dodecyl
signal, P7 appears to have retained most of the dodecanethiol groups as a mixed disulfide with
the polymeric thiol. Similarly to (A), the integration of the backbone protons is used as a
reference. However, since there are only 0.923 dodecyl per chain, the total = 198 + 22*(0.923) =
218.3.............................................................................................................................................. 88
Figure 4-6. 1H NMR Spectrum (D2O) of B3-P8b. As in Figure 4-5, the integration of the
polymer backbone protons (66x3 = 198) plus remaining overlapping dodecyl integration are used
as the reference integration. The integration of the dodecyl methyl signal at 0.88 ppm shows
there are an average of 0.24 dodecyl groups per chain remaining. The integration of the
maleimide signal at 6.88 ppm shows that there is an average of 0.50 maleimide groups per chain.
....................................................................................................................................................... 90
Figure 4-7. Aqueous SEC Chromatographs of B3-P6, Aminolyzed P7, and Maleimide End-
Labeled P8b. B3-P6 has a proportion of polymer-polymer disulfides. This proportion increases
in the aminolyzed sample, and is finally removed in the maleimide sample. The maleimide
sample B3-P8b shows a small degree of chemical chain cross-linking. Calibration of the column
with poly(methacrylic acid) standards leads to values of of Mn = 22,500 Da (PDI = 1.35) for B3-
P6, Mn = 24,100 Da (PDI = 1.42) for B3-P7, and Mn = 20,700 Da (PDI = 1.28) for B3-P8b. .... 92
Figure 5-1. Step-scan TGA Traces of P(EDTA)-Fluorescein, P(DTPA)-Fluorescein, P(TTHA)-
Fluorescein, and P(DOTA)-Fluorescein. Temperature is displayed on the right-hand y-axis. All
four polymer samples display similar traces, with essentially flat baselines at the end of both
isothermal (100 0C and 600 0C) periods. .................................................................................... 109
Figure 5-2. Step-Scan TGA trace of Fully Protonated P(DTPA)-Disulfide. Temperature is
displayed on the right-hand y-axis. Percent mass was zero after the polymer degradation step,
which shows that this sample contained no sodium counter-ions. ............................................. 112
Figure 5-3. Performance of GAM-Pd in a Bioassay. (A) 191Ir vs. 193Ir signal from the iridium
DNA intercalator is plotted to select for cell events. (B) Selected cell events from (A) are
xxi
identified as live or dead by plotting 103Rh vs. 193Ir. High 103Rh signal shows a cell was dead, and
low 103Rh signal shows the cell was live. (C) Cells with high 103Rh signal also have high
palladium signal. (D) Cells with low 103Rh signal also have low palladium signal. .................. 122
Figure 5-4. Performance of GAM-Pt in a Bioassay. (A) and (C) 191Ir vs. 193Ir is plotted to select
cell events for fixed and live cells, respectively. (B) Selected cell events from (A) are plotted for
platinum signal (195Pt) against 193Ir. A large proportion have high platinum signal, and a smaller
proportion do not. (D) Selected cell events from (C) are plotted for platinum signal. The live
cells show low platinum signal. .................................................................................................. 123
Figure 5-5. P(EDTA)-Fluorescein-Pd Dead Cell Staining Experiment on 50% Live Cell Mix.
(A) 191Ir vs. 193Ir is plotted to select for cell events. (B) Selected cell events from (A) are plotted
for palladium signal (106Pd) against 193Ir to show two populations: dead cells with high palladium
signal and live cells with low palladium signal. (C) Selected cell events from (A) are plotted for
rhodium signal (103Rh) to identify dead and live cells. The populations of live and dead cells
from (B) and (C) are in good agreement. (D) Rh-identified dead cells from (C) have
correspondingly high palladium (106Pd vs. 108Pd) signal. (E) Rh-identified live cells from (C)
have correspondingly low palladium (106Pd vs. 108Pd) signal, except for a small proportion of
false positives.............................................................................................................................. 125
Figure 5-6. Summary of the Performance of GAM-Pd and P(EDTA)-Fluorescein-Pd as Dead
Cell Stains. Live KG1a cells were mixed with dead KG1a cells at the % values shown on the X-
axis. GAM-Pd was used at 0.001 mg/mL, and P(EDTA)-Fluorescein-Pd was used at 0.1 mg/mL.
..................................................................................................................................................... 126
Figure 6-1. 1H NMR Spectrum of P(12%PEGAminoBoc)-Disulfide (D2O). By comparing the
aromatic end-group signals (5H, signals 1-3) with PEG spacer signals (8H, signals10-13), we
find that the number of PEG spacers = (73.0/8)/(5/5) = 9. I assume that this is a random
copolymer. .................................................................................................................................. 140
Figure 6-2. gCOSY NMR spectrum of P(12%PEGAminoBoc)-Disulfide (D2O). This spectrum
was used to aid in peak assignments presented in Figure 6-1..................................................... 141
Figure 6-3. Normalized Fluorescence Spectra of P(12%PEGAmino)(88%DTPA)(Yb)(DYE)-
Maleimide Polymer Samples. Fluorescence spectra were collected in phosphate buffer (200
xxii
mM, pH 8.00). Top: Fluorescence excitation spectra. Emission was monitored at wavelengths
of 450/550/600/690 nm for DyL450/FITC/DyL549/DyL649, respectively. Bottom:
Fluorescence emission spectra. The dyes were excited at wavelengths of 370/450/510/620 nm
for DyL450/FITC/DyL549/DyL649, respectively...................................................................... 146
Figure 6-4. Mass Cytometry Results for Proof of Concept Bioassay using the Secondary
Antibody GAM Conjugate of P(12%PEGAmino)(88%DTPA)(172Yb)(FITC)-Maleimide to Stain
CD45-Stained Ramos Cells. (A) 191Ir vs 193Ir is plotted to select for cell events. This is shown
for the experiment with GAM-tag at a concentration of 2.5 µg/mL. (B) A histogram of 172Yb
signal is plotted for the cell events from (A). High signal was obtained when the cells were
stained with a 2.5 µg/mL solution of GAM-tag.......................................................................... 147
Figure 6-5. FACS Results for Proof of Concept Bioassay using the GAM Conjugate of
P(12%PEGAmino)(88%DTPA)(172Yb)(FITC)-Maleimide to Stain CD45-Stained Ramos Cells.
(A) Side-scatter vs forward-scatter is plotted to gate for lymphocytes in the stained cell sample.
(B) A histogram of fluorescent signal due to fluorescein is plotted for the previously gated
lymphocyte populations. The unstained cells show a level of signal comparable to background,
whereas the stained cells show positive response....................................................................... 148
Figure 6-6. Mass Cytometry Antibody Dilution Series with Four Dual-Purpose Antibody Tags
and KG1a and Jurkat Cells. (Top) Analysis of KG1a cells. (Bottom) Analysis of Jurkat Cells.
..................................................................................................................................................... 151
Figure 6-7. Comparison of Mass Cytometry Relative Metal Intensities for KG1a and Jurkat
Cells to Published Data.21 Relative intensities were calculated by dividing the metal counts
obtained for each tag with the highest concentration antibody staining solution by the metal
counts for the CD45-tag, and multiplying by 1000. The relative metal intensities were plotted
next to published data for relative metal intensities.21 ................................................................ 153
Figure 6-8. Mass Cytometry Tetraplex Assay with Four Dual-Purpose Antibody Tags and KG1a
and Jurkat Cells. (A and B) 191Ir vs 193Ir is plotted to select for cell events. (C-F) Histograms
of lanthanide signal are plotted for the cell events from the first row. These histograms are
suitable for a comparison with FACS assay results.................................................................... 155
xxiii
Figure 6-9. FACS Tetraplex Assay with Four Dual-Purpose Antibody Tags and KG1a and
Jurkat Cells. (A-C) Side-scatter is plotted against forward-scatter to select for cell events. (D-
G) Histograms of (fluorescent) FACS signal are plotted for the cell events from the first row.
The CD13 and CD38 tags fail to show any signal above a background level, the CD3 tag
identifies CD3+ and CD3- populations in the Jurkat cells, and the CD45 tag shows positive
signal for both cell samples......................................................................................................... 157
Figure 9-1. Top: Isothermal Titration Calorimetric Thermogram of Gd3+ (5.0 mM) in Citrate
Buffer at pH 5.5 Into Citrate Buffer (Blank) and Into a Solution of DTPA (0.5 mM) in the Same
Buffer at 25 ºC. The enthalpy of dilution for Gd-Citrate is represented by the small exothermic
signals observed for the titration of blank sample. Endothermic signals correspond to the
exchange of Gd3+ between citrate and DTPA complex. Bottom: Binding Isotherms Ialculated
from the Titration of Citrate Buffer (Blank) and DTPA (0.5 mM) with Gd3+ (5.0 mM) at 25 ºC.
The equivalence point (n) for the fitted curve shows that one DTPA ligand binds one Gd3+ ion (n
= 1.04 ± 0.03).............................................................................................................................. 178
Figure 9-2. Antibody Titration of a Mixture of 11 Metal-Tagged Antibodies on Whole
Umbilical Cord Blood. Titration curves are shown for Granulocytes, Monocytes and CD3 T
lymphocytes. The gating strategy is presented in Figure 11 of Chapter 3.................................. 179
Figure 9-3. Antibody Titration of a Mixture of 11 Metal-Tagged Antibodies on Whole
Umbilical Cord Blood. Titration curves are shown for CD4 T and CD8 T lymphocytes, and
CD20 B-cells. The gating strategy is presented in Figure 11 of Chapter 3. .............................. 180
Figure 9-4. Comparison of Aqueous SEC Chromatographs of the Three Batches of P(DTPA)
Polymer P6. Calibration of the column with poly(methacrylic acid) standards leads to values of
Mn = 22,100 Da (PDI = 1.24) for B1-P6, Mn = 23,600 Da (PDI = 1.41) for B2-P6, and Mn =
22,500 Da (PDI = 1.35) for B3-P6.............................................................................................. 181
Figure 9-5. UV/VIS Spectra of CTA (4-cyano-4-(dodecylsulfanylthiocarbonyl)sulfanyl
pentanoic acid) in MeOH at Concentrations Ranging from 20 to 85 µM. ................................. 181
Figure 9-6. UV/VIS Extinction Coefficient Determination of CTA
(4-cyano-4-(dodecylsulfanylthiocarbonyl)-sulfanyl pentanoic acid) in MeOH. At 298 nm, ε =
10,000 ± 200 M-1cm-1. At 308 nm, ε = 9,700 ± 160 M-1cm-1. ................................................... 182
xxiv
Figure 9-7. Step-Scan TGA Trace of DTPA Polymer B3-P6. Temperature is displayed on the
right-hand y-axis. From this analysis I find that each DTPA group carries 3.0 H2O and 2.6 Na+.
..................................................................................................................................................... 182
Figure 9-8. UV/VIS Spectrum of DTPA Polymer B3-P6 in Phosphate Buffer (50 mM, pH 7.00).
Peak maximum is at 308 nm, which differs slightly from the peak shape observed in the model
CTA found in Figure 9-5. ........................................................................................................... 183
Figure 9-9. Plot of ln(A) vs. Time for the 308 nm UV/VIS Absorption Peak During the
Aminolysis of B1-P6 to B1-P7. This plot is a straight line, which demonstrates that the reaction
follows pseudo-first-order kinetics. ............................................................................................ 183
Figure 9-10. TGA Control for Na2CO3 Stability. Na2CO3 was held for one hour each at 500,
600, 700, 800, and 900 0C. The sample only shows significant degradation at 800 0C and higher.
Therefore, a temperature of 600 0C was chosen for the polymer degradation step. ................... 185
Figure 9-11. TGA Analysis of EDTA2-2Na+.2H2O. The sample was held at 100 0C for 4 hours
to remove water, then at 600 0C for only 4 hours to degrade the organic component. At the
completion of each isothermal period the percent mass has essentially reached a flat baseline. A
water mass loss of 10.2% and a ceramic yield of 27.3% are found............................................ 185
Figure 9-12. TGA Analysis of DTPA (Protonated Form). At the end of the 100 0C isothermal
period only 0.4% percent mass had been lost. This corresponds to 0.1 equivalents of water.
Upon heating to higher temperatures, the sample violently decomposed, upsetting the sample pan
and ruining the initial tare. This phenomenon was reproducible............................................... 186
Figure 9-13. UV/VIS Analysis of P(DTPA)-Fluorescein-Terbium at Different pH. All spectra
had a normalized absorption. At lower pH, fluorescein was mixture of anionic and dianionic
forms. At pH of 8.0 and greater, fluorescein was fully dianionic.............................................. 187
Figure 9-14. Partial 1H NMR (D2O) Spectra of a P(DTPA)-Maleimide Sample Before and After
a 2 Hour Incubation in 47 mM HCl. TOP: Prior to incubation in 47 mM HCl, this sample of
polymer had 0.59 maleimide groups per chain. This sample was prepared with wash procedure
(c), as described in Chapter 3. BOTTOM: After incubation in 47 mM HCl, the sample retains
the same number of maleimide groups. The integration of the hydrolyzed maleimide signal
xxv
appears to have increased. However, the signal to noise of those peaks is poor, and should not be
relied upon for quantification...................................................................................................... 188
Figure 9-15. 1H NMR Spectrum of P(12%PEGAmino)(88%DTPA)-Disulfide (D2O). BOC
deprotection is complete as evidenced by the lack of a tert-butyl BOC signal at 1.42 ppm. ..... 189
Figure 9-16. Normalized UV/VIS Absorption Spectra of P(12%PEGAmino)(88%DTPA)(DYE)-
Disulfide Polymers...................................................................................................................... 190
Figure 9-17. Partial 1H NMR Spectrum of P(12%PEGAmino)(88%DTPA)(FITC)-Maleimide
(D2O). Both the maleimide and polymer end-group signals are overlapped by the FITC signals,
making it impossible to quantify maleimide content.................................................................. 190
Figure 9-18. Partial 1H NMR Spectrum of P(12%PEGAmino)(88%DTPA)(DyL405)-Maleimide
(D2O). Comparing the 5H phenyl end-group with the 2H vinylic protons of the maleimide linker
shows end-functionalization = (0.42/2) × 100% = 21% ............................................................. 191
Figure 9-19. Partial 1H NMR Spectrum of P(12%PEGAmino)(88%DTPA)(DyL549)-Maleimide
(D2O). Comparing the 5H phenyl end-group with the 2H vinylic protons of the maleimide linker
shows end-functionalization = (0.92/2) × 100% = 46% ............................................................. 191
Figure 9-20. Partial 1H NMR Spectrum of P(12%PEGAmino)(88%DTPA)(DyL649)-Maleimide
(D2O). Comparing 3H of the phenyl end-group with the 2H vinylic protons of the maleimide
linker shows end-functionalization = (0.80/2) × 100% = 40%................................................... 192
xxvi
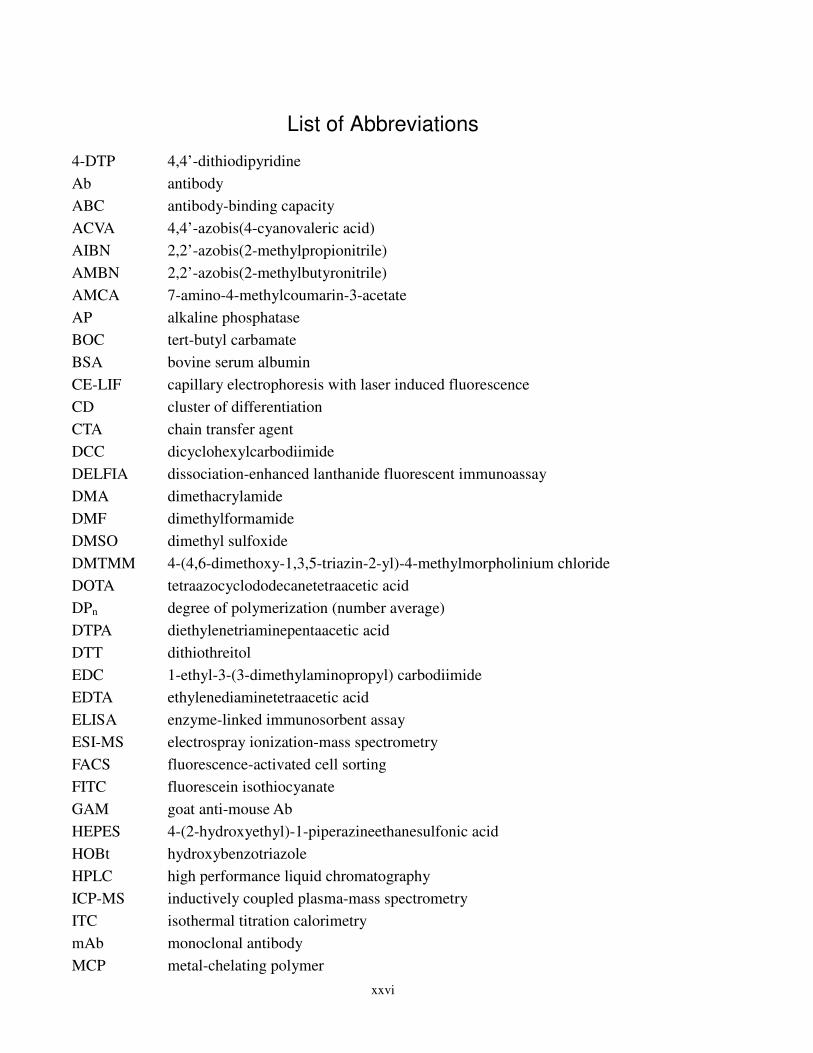
List of Abbreviations
4-DTP 4,4’-dithiodipyridine
Ab antibody
ABC antibody-binding capacity
ACVA 4,4’-azobis(4-cyanovaleric acid)
AIBN 2,2’-azobis(2-methylpropionitrile)
AMBN 2,2’-azobis(2-methylbutyronitrile)
AMCA 7-amino-4-methylcoumarin-3-acetate
AP alkaline phosphatase
BOC tert-butyl carbamate
BSA bovine serum albumin
CE-LIF capillary electrophoresis with laser induced fluorescence
CD cluster of differentiation
CTA chain transfer agent
DCC dicyclohexylcarbodiimide
DELFIA dissociation-enhanced lanthanide fluorescent immunoassay
DMA dimethacrylamide
DMF dimethylformamide
DMSO dimethyl sulfoxide
DMTMM 4-(4,6-dimethoxy-1,3,5-triazin-2-yl)-4-methylmorpholinium chloride
DOTA tetraazocyclododecanetetraacetic acid
DPn degree of polymerization (number average)
DTPA diethylenetriaminepentaacetic acid
DTT dithiothreitol
EDC 1-ethyl-3-(3-dimethylaminopropyl) carbodiimide
EDTA ethylenediaminetetraacetic acid
ELISA enzyme-linked immunosorbent assay
ESI-MS electrospray ionization-mass spectrometry
FACS fluorescence-activated cell sorting
FITC fluorescein isothiocyanate
GAM goat anti-mouse Ab
HEPES 4-(2-hydroxyethyl)-1-piperazineethanesulfonic acid
HOBt hydroxybenzotriazole
HPLC high performance liquid chromatography
ICP-MS inductively coupled plasma-mass spectrometry
ITC isothermal titration calorimetry
mAb monoclonal antibody
MCP metal-chelating polymer
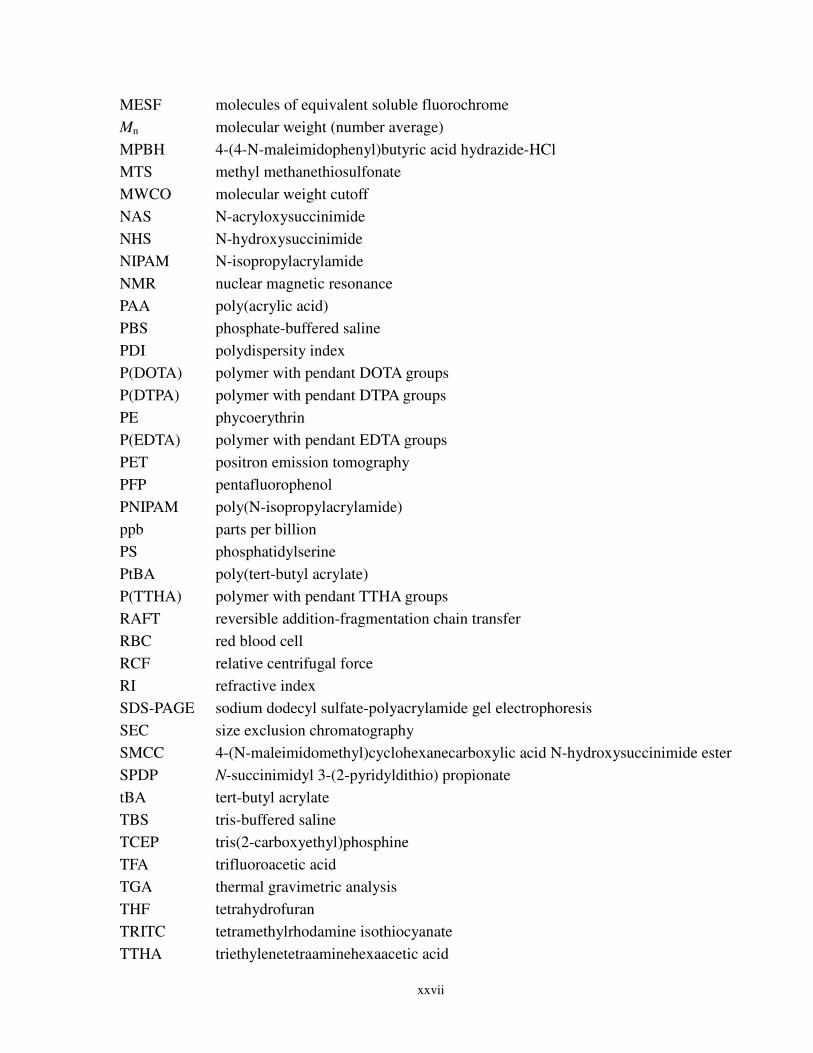
xxvii
MESF molecules of equivalent soluble fluorochrome
Mn molecular weight (number average)
MPBH 4-(4-N-maleimidophenyl)butyric acid hydrazide-HCl
MTS methyl methanethiosulfonate
MWCO molecular weight cutoff
NAS N-acryloxysuccinimide
NHS N-hydroxysuccinimide
NIPAM N-isopropylacrylamide
NMR nuclear magnetic resonance
PAA poly(acrylic acid)
PBS phosphate-buffered saline
PDI polydispersity index
P(DOTA) polymer with pendant DOTA groups
P(DTPA) polymer with pendant DTPA groups
PE phycoerythrin
P(EDTA) polymer with pendant EDTA groups
PET positron emission tomography
PFP pentafluorophenol
PNIPAM poly(N-isopropylacrylamide)
ppb parts per billion
PS phosphatidylserine
PtBA poly(tert-butyl acrylate)
P(TTHA) polymer with pendant TTHA groups
RAFT reversible addition-fragmentation chain transfer
RBC red blood cell
RCF relative centrifugal force
RI refractive index
SDS-PAGE sodium dodecyl sulfate-polyacrylamide gel electrophoresis
SEC size exclusion chromatography
SMCC 4-(N-maleimidomethyl)cyclohexanecarboxylic acid N-hydroxysuccinimide ester
SPDP N-succinimidyl 3-(2-pyridyldithio) propionate
tBA tert-butyl acrylate
TBS tris-buffered saline
TCEP tris(2-carboxyethyl)phosphine
TFA trifluoroacetic acid
TGA thermal gravimetric analysis
THF tetrahydrofuran
TRITC tetramethylrhodamine isothiocyanate
TTHA triethylenetetraaminehexaacetic acid

xxviii
UV/VIS ultraviolet/visible

1
1 Chapter 1: Introduction
1.1 Overview
One of the goals of modern bioanalytical chemistry is the simultaneous (multiplexed)
detection of multiple biomarkers in individual cells. A biomarker can be broadly defined as a
characteristic protein, gene, or small molecule that can be objectively measured and evaluated as
an indicator of normal biological or pathogenic processes.1 For example, tumor biomarkers
contribute greatly to the selection of appropriate personalized cancer therapy in clinical trials.
Immunophenotyping of blood biomarkers using flow cytometry has played an important role in
the diagnosis of leukemia subtypes and selection of therapy. It is well documented that tumor
progression in breast, prostate, bladder, and blood cancers, to name a few, is accompanied by
changes in the types and numbers of biomarkers expressed at each stage of carcinogenesis.2,3,4
Moreover, it is now widely accepted that no single biomarker will have the sensitivity and
specificity necessary for diagnosis and disease prognosis when measured on its own. One needs
a robust analytical technology capable of providing a simultaneous assay for a broad
constellation of proteins, small molecules and gene transcripts.
One approach that lends itself to multiplexed analysis is based on the use of antibodies
labeled with metal ions as bioaffinity agents in conjunction with inductively coupled plasma-
mass spectrometry (ICP-MS) detection.5,6,7 In ICP-MS, a sample is burned in a plasma torch at
7000 K, which atomizes the sample and then ionizes all metals with quantitative efficiency. This
technique is widely used for elemental analysis because of its large dynamic range and its ability
to resolve individual masses. For immunoassays with metal-tagged antibodies, the lanthanide
isotopes are particularly useful. These ions have similar chemistry, low natural abundance, and
masses in a useful range (m/z from 100 to 200) for mass cytometry detection. The sensitivity of
the method can be enhanced through attachment of metal-chelating polymers to antibodies. For
example, in 2007 our group reported the preparation of antibodies labeled with a polymer that
carried on the order of 30 Ln ions per polymer chain. These antibodies were used in a 5-plex
bulk (i.e. solution) immunoassay of three human leukemia cell lines by ICP-MS.5
Much more powerful single cell analysis, with a high degree of multiplexing, is possible with
the new technique of mass cytometry.8 In this technique, cells are injected individually but
stochastically into the argon plasma, where they are vaporized, atomized, and ionized. The ion
2
cloud generated is analyzed by time-of-flight mass spectrometry, and the intensities of each ion
are determined by averaging the 20 to 30 mass spectra taken during the 200 µs that the ion cloud
is sampled by the instrument. On the order of 1000 cells per second can be analyzed in this way.
Prior to analysis, live cells are stained with a cocktail of antibodies, each type carrying a different
lanthanide isotope intended to identify biomarkers on the cell surface. Since each cell is
individually analyzed, different subsets of a cell population can be identified by their
characteristic “cell fingerprint” (immunophenotype).9 One can also examine intracellular
antigens in cells that are fixed and permeabilized prior to treatment with the antibody cocktail,
which, for example, has application in monitoring intracellular signaling states.10
The development and implementation of mass cytometry is necessarily a multidisciplinary
project, where engineers and analytical chemists develop the instruments, biologists and
biochemists devise immunoassays, and polymer and materials chemists prepare the required
polymeric reagents. As a polymer chemist, my research focus has been the synthesis,
characterization, and application of metal-chelating polymers for mass cytometric bioassays.
The balance of this chapter contains a literature review of pertinent topics, a discussion on the
research gaps and my intended goals, and finally a thesis plan.
1.2 Literature Review
This literature review will examine five areas, namely (a) the enablement of mass cytometry
by polymeric reagents, (b) synthesis of metal-chelating polymers for biological applications, (c)
recovering end-functionality of RAFT (reversible addition-fragmentation chain transfer)
polymers, (d) characterization of antibody conjugates for quantitative bioassays, and (e) dual-
purpose labels for bioassays. Each of these topics is relevant to the original research presented in
the subsequent chapters of this thesis.
1.2.1 The Enablement of Mass Cytometry by Polymeric Reagents
The earliest elemental immunoassays were reported by two groups, one led by Professor
Xinrong Zhang of Tsinghua University, and one led by Professor Scott Tanner of the University
of Toronto. In the Zhang group’s first work,6 a europium complex with an isothiocyanate group
was covalently reacted with streptavidin to create a europium-labeled streptavidin tag. In
forming this tag, they found that a high excess of the europium complex led to poor conjugate
stability; a conjugate with 9.4 europium atoms per streptavidin proved ideal. This tag was
3
employed in a solution ICP-MS sandwich assay for the quantification of thyroid-stimulating
hormone in human serum, and was found to perform well and show good correlation with the
standard radioimmunoassay method. In the Zhang group’s second work,7 the authors
synthesized colloidal gold of approximately 10-20 nm in diameter, and then used these colloids
to form a conjugate with goat anti-rabbit antibody. They found this reagent performed well in a
solution ICP-MS sandwich immunoassay, with only ca. 5% non-specific binding in a number of
control experiments.
In the work from the Tanner group, Baranov et al.11 published a paper describing the use of
commercially available lanthanide complexes and colloidal gold reagents. The colloidal gold
reagent, named NANOGOLD, consisted of a 1.4 nm gold nanocluster of ca. 70-80 atoms with
covalently bound goat anti-human Fab’ fragments. In a solution ICP-MS bioassay, this type of
reagent was able to detect specific antigens over a wide range of concentrations, although there
was some difficulty encountered with high blank signals. The lanthanide reagent consisted of
europium- and holmium-loaded DELFIA (dissociation-enhanced lanthanide fluorescent
immunoassay) labeled antibodies. DELFIA-labeled antibodies are covalently functionalized
with lanthanide-loaded ligands, and are thought to contain 6-10 metals per antibody. At the end
of the assay, an enhancement solution containing a lanthanide ligand with an antenna to enhance
fluorescence12 is added, and fluorescence intensity is recorded. The authors used the DELFIA
tags as both sources of fluorescent signal (as intended by the manufacturer) as well as sources of
solution ICP-MS signal. They concluded that the two methods of analysis provided comparable
accuracy and precision, and that there was room for improvement in ICP-MS signal if the
lanthanide-labeling strategy was expanded to carry more lanthanide atoms.
Subsequently, the Tanner group published a number of immunoassay studies using the
NANOGOLD and DELFIA reagents.13,14,15 In the 2007 paper by Tanner et. al,15 the authors used
a first generation tag designed to universally link to primary affinity reagents (such as
monoclonal antibodies) and carry multiple lanthanide ions. Equivalent masses of the
commercial CD33-DELFIA-europium reagent and CD33-first-generation-tag-europium were
used to label goat anti-mouse microtiter plates. They found that the tag prepared in-house
showed 80 times higher signal than the commercial DELFIA reagent. Details of the first
generation tag were published by the Winnik group shortly thereafter.5 This tag was a water-
soluble polymer with ca. 30 DOTA (tetraazocyclododecanetetraacetic acid) ligands per chain and
a maleimide end-group designed to attach to antibodies. Attachment to an antibody was
4
achieved by partially reducing hinge region disulfides, followed by Michael addition to the
polymeric maleimide to form a stable thioether.16 Since each polymer chain carried multiple
lanthanide ions, sensitivity was greatly enhanced, which in turn allowed the authors to
simultaneously monitor two different cell surface markers that differed by a factor of ca. 500 in
their abundance.5 After this, the Tanner group ceased to use the DELFIA reagents, and their
group8,17,18,19,20,21 and others10 published a number of further studies using polymeric tagging
reagents for bulk and mass cytometric assays. However, no further work was published on the
optimization and continuing development of the polymeric reagents themselves.
1.2.2 Synthesis of Metal-Chelating Polymers for Biological Applications
The synthesis of metal-chelating polymers for biological applications is not new. There have
been many publications on the topic since at least the late 1980s.22,23,24,25,26,27,28,29,30,31,32 These
polymers share in common multiple metal-chelating sites along the backbone as well as an
orthogonal functional group for conjugation to the antibody. Many of these polymers were
designed to carry Gd3+ ions as contrast enhancement agents intended for magnetic resonance
imaging applications, while others were intended to chelate radioactive metals for biomedical
applications. A useful ligand in these applications is diethylenetriaminepentaacetic acid (DTPA).
One synthesis strategy used by the Torchilin group24 was to start with a Z-protected polylysine
backbone, functionalize the N-terminus with an asymmetric pyridyl disulfide through reaction
with SPDP (N-succinimidyl 3-(2-pyridyldithio) propionate), deprotect the amino groups, and
then react these amino groups with DTPA dianhydride to form an amide bond. The resultant
polymer was then treated with DTT (dithiothreitol) to remove the pyridyl disulfide. Separately,
the antibody of interest was reacted with SPDP to functionalize lysine amino side-chains with an
asymmetric pyridyl disulfide. Finally, the liberated polymeric thiol end-group was reacted with
the pyridyl disulfide of the antibody to yield a disulfide linked conjugate.
1.2.2.1 Backbone, Ligand Attachment
In addition to poly(peptide)s, RAFT polymers,5,9,33 as well as polysaccharides such as
dextran,26 sodium hyaluronan,27 and chitosan32 have also served as polymeric backbones for
metal-chelating polymers. Also, the DTPA dianhydride method22,24,26,29,31 is only one way of
adding DTPA groups to a polyamino polymer, with other options including activating DTPA with
isobutyl chloroformate,23,25,26,30 or preparing the succinimidic ester activated form of
DTPA.26,27,32 While these methods of adding DTPA do work, they are ill-defined, with some or
5
all of the activated species having difunctional reactivity. This difunctionally has the possibility
of introducing intra- and inter-chain chemical cross-links.22 The above reports do not go into
detail about the polydispersity of the synthesized DTPA polymers, or they report polydispersity
indexes (PDI) of over 2.26
Other reports include better-defined methods of mono-activating ligands for reaction. For
example, Arano and coworkers34 reported a DTPA derivative with four of the five carboxylic
acid groups protected as tert-butyl esters. This molecule was coupled to a resin-supported
peptide using HOBt (hydroxybenzotriazole) and a carbodiimide as a coupling agent, after which
the peptide was cleaved from the resin and the tert-butyl protecting groups were removed. Lou
et al.5 synthesized and Fukukawa et al.33 purchased DOTA derivatives where one of the acid
groups was modified with a diamine in order to carry an amine group, and the other three acid
groups were protected as tert-butyl esters. In both cases, the reagent was reacted with a
polymeric NHS-ester (N-hydroxysuccinimide) unit, and then the tert-butyl esters were removed
to yield the water-soluble chelating group. Similarly, Wangler et al.35 utilized a DOTA derivative
with a single thiol group to react with a dendrimer carrying numerous maleimide groups. The
one disadvantage to these strategies lies in the time-consuming and often expensive syntheses of
the well-defined ligands. Happily, there is a commercial source (Macrocyclics Inc.) that
specializes in the synthesis of ligand derivatives that have (a) all but one acid as the tert-butyl
ester, (b) a single amino group, (c) a single amino-reactive group such as an NHS-ester or
isothiocyanate, or (d) a single maleimide group. Unfortunately, these derivatives are quite
expensive.
One final strategy that bears mentioning on the preparation of mono-activated DTPA is the
partial hydrolysis of DTPA dianhydride.36 The basic idea is that adding one equivalent of water
to a solution of DTPA dianhydride in DMF will yield mono-activated DTPA. However, the
authors do not show any characterization to prove that this species is actually formed. On the
other hand, this technique is useful for preparing mono-activated EDTA.37,38 For EDTA
(ethylenediaminetetraacetic acid), the dianhydride has high solubility in DMF, while in turn the
two carboxylic acids of the hydrolyzed monoanhydride impart poor solubility to the molecule.
Conveniently, this leads to the precipitation of the product monoanhydride. This is not, however,
a useful strategy for DTPA, because the single acid group of DTPA dianhydride minimizes the
DMF solubility difference between the dianhydride and monoanhydride species.
6
1.2.2.2 Bioconjugation
There are a number of strategies for the covalent attachment of the metal-chelating polymers
to an antibody. For instance, instead of using SPDP as reported by the Torchilin group, one can
functionalize the lysine amino groups of the antibody with SMCC (4-(N-
maleimidomethyl)cyclohexanecarboxylic acid N-hydroxysuccinimide ester), and then
subsequently treat the antibody with the polymeric thiol.28 Alternatively, one can functionalize
the polymer with a maleimide group through SMCC29 or through a bismaleimide such as 2,2'-
(ethylenedioxy)bis(ethylmaleimide).5 Separately, an antibody is treated with DTT or TCEP
(tris(2-carboxyethyl)phosphine) to partially reduce hinge region disulfides, which in turn are
reacted with the polymeric maleimide. Such strategies yield a stable thioether bond.
Another approach was demonstrated by the Shoichet group, who utilized aqueous Diels
Alder chemistry.39 In their work, they prepared polymeric particles with furan groups on the
surface. Separately, the oligosaccharides of the central Fc region of herceptin antibody were
oxidized with sodium periodate. The resultant aldehyde groups were conjugated with the
maleimide-containing MPBH (4-(4-N-Maleimidophenyl)butyric acid hydrazide-HCl) to form a
hydrazone linkage, which was further stabilized by reduction with sodium cyanoborohydride.16
The resultant maleimide-functionalized antibody was incubated with the furan-carrying polymer
particle at 37 0C for 24 hours to yield the [4+2] cycloadduct.
There are many strategies available for bioconjugation, and different strategies can be
combined based on one’s particular needs. The review by Torchilin covers a number of the
different strategies used in these syntheses,28 and the book Bioconjugate Techniques is a valuable
resource on available chemistries used for bioconjugation.16
1.2.2.3 Winnik Group Metal-Chelating Polymer
The 2007 publication5 by Lou et al. bears special mention in this section because it represents
the state of metal-chelating polymer synthesis in the Winnik group prior to my joining the
project. In this report, the authors described the synthesis of a metal-chelating polymer by RAFT
copolymerization of N-acryloxysuccinimide (NAS) and dimethacrylamide (DMA). The
subsequent transformation of the polymer is shown in Scheme 1-1. It involved reaction of the
activated-ester NAS groups with an amino-containing DOTA derivative to functionalize the
polymer with metal-chelating groups and at the same time release the terminal –SH group. This
thiol was stable to deprotection of the t-butyl ester groups of the DOTA, but was susceptible to
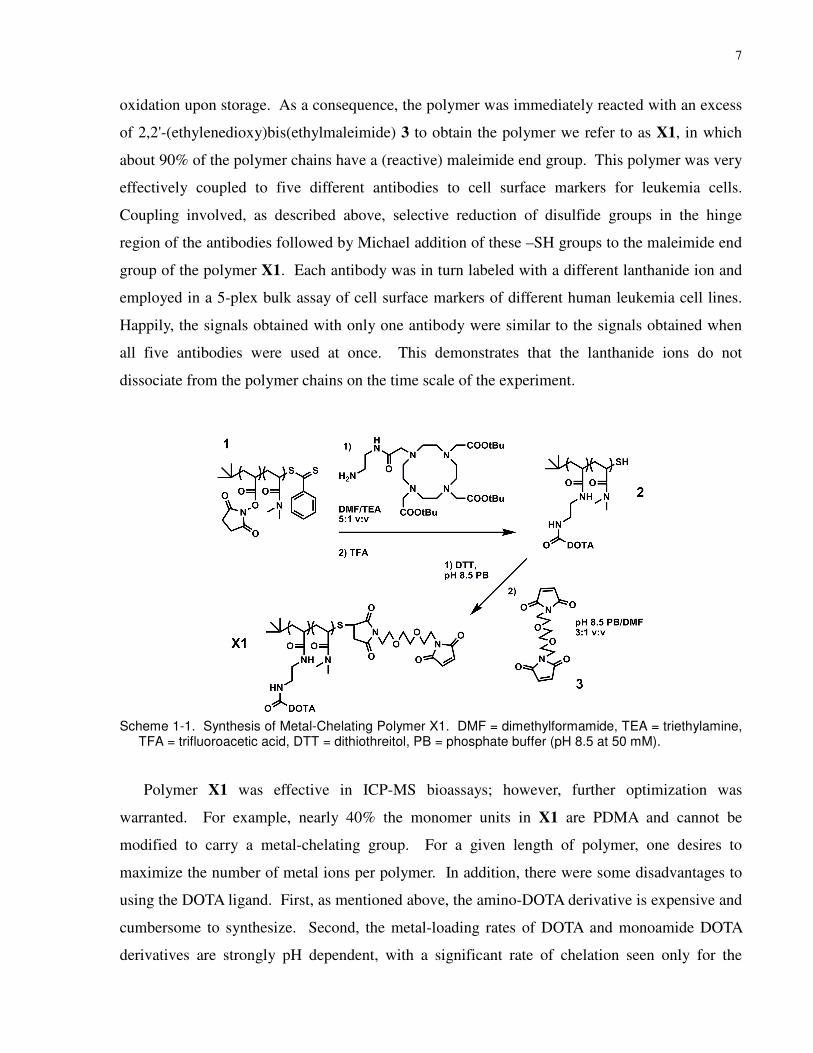
7
oxidation upon storage. As a consequence, the polymer was immediately reacted with an excess
of 2,2'-(ethylenedioxy)bis(ethylmaleimide) 3 to obtain the polymer we refer to as X1, in which
about 90% of the polymer chains have a (reactive) maleimide end group. This polymer was very
effectively coupled to five different antibodies to cell surface markers for leukemia cells.
Coupling involved, as described above, selective reduction of disulfide groups in the hinge
region of the antibodies followed by Michael addition of these –SH groups to the maleimide end
group of the polymer X1. Each antibody was in turn labeled with a different lanthanide ion and
employed in a 5-plex bulk assay of cell surface markers of different human leukemia cell lines.
Happily, the signals obtained with only one antibody were similar to the signals obtained when
all five antibodies were used at once. This demonstrates that the lanthanide ions do not
dissociate from the polymer chains on the time scale of the experiment.
Scheme 1-1. Synthesis of Metal-Chelating Polymer X1. DMF = dimethylformamide, TEA = triethylamine, TFA = trifluoroacetic acid, DTT = dithiothreitol, PB = phosphate buffer (pH 8.5 at 50 mM).
Polymer X1 was effective in ICP-MS bioassays; however, further optimization was
warranted. For example, nearly 40% the monomer units in X1 are PDMA and cannot be
modified to carry a metal-chelating group. For a given length of polymer, one desires to
maximize the number of metal ions per polymer. In addition, there were some disadvantages to
using the DOTA ligand. First, as mentioned above, the amino-DOTA derivative is expensive and
cumbersome to synthesize. Second, the metal-loading rates of DOTA and monoamide DOTA
derivatives are strongly pH dependent, with a significant rate of chelation seen only for the
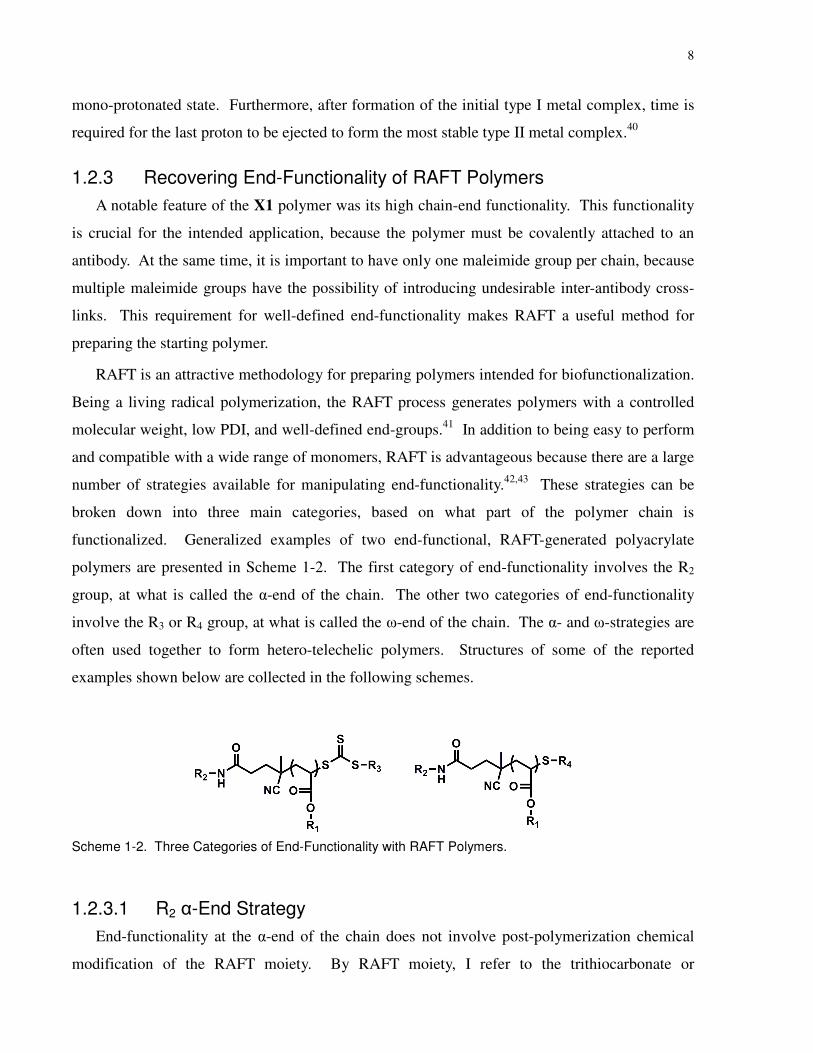
8
mono-protonated state. Furthermore, after formation of the initial type I metal complex, time is
required for the last proton to be ejected to form the most stable type II metal complex.40
1.2.3 Recovering End-Functionality of RAFT Polymers
A notable feature of the X1 polymer was its high chain-end functionality. This functionality
is crucial for the intended application, because the polymer must be covalently attached to an
antibody. At the same time, it is important to have only one maleimide group per chain, because
multiple maleimide groups have the possibility of introducing undesirable inter-antibody cross-
links. This requirement for well-defined end-functionality makes RAFT a useful method for
preparing the starting polymer.
RAFT is an attractive methodology for preparing polymers intended for biofunctionalization.
Being a living radical polymerization, the RAFT process generates polymers with a controlled
molecular weight, low PDI, and well-defined end-groups.41 In addition to being easy to perform
and compatible with a wide range of monomers, RAFT is advantageous because there are a large
number of strategies available for manipulating end-functionality.42,43 These strategies can be
broken down into three main categories, based on what part of the polymer chain is
functionalized. Generalized examples of two end-functional, RAFT-generated polyacrylate
polymers are presented in Scheme 1-2. The first category of end-functionality involves the R2
group, at what is called the α-end of the chain. The other two categories of end-functionality
involve the R3 or R4 group, at what is called the ω-end of the chain. The α- and ω-strategies are
often used together to form hetero-telechelic polymers. Structures of some of the reported
examples shown below are collected in the following schemes.
Scheme 1-2. Three Categories of End-Functionality with RAFT Polymers.
1.2.3.1 R2 α-End Strategy
End-functionality at the α-end of the chain does not involve post-polymerization chemical
modification of the RAFT moiety. By RAFT moiety, I refer to the trithiocarbonate or
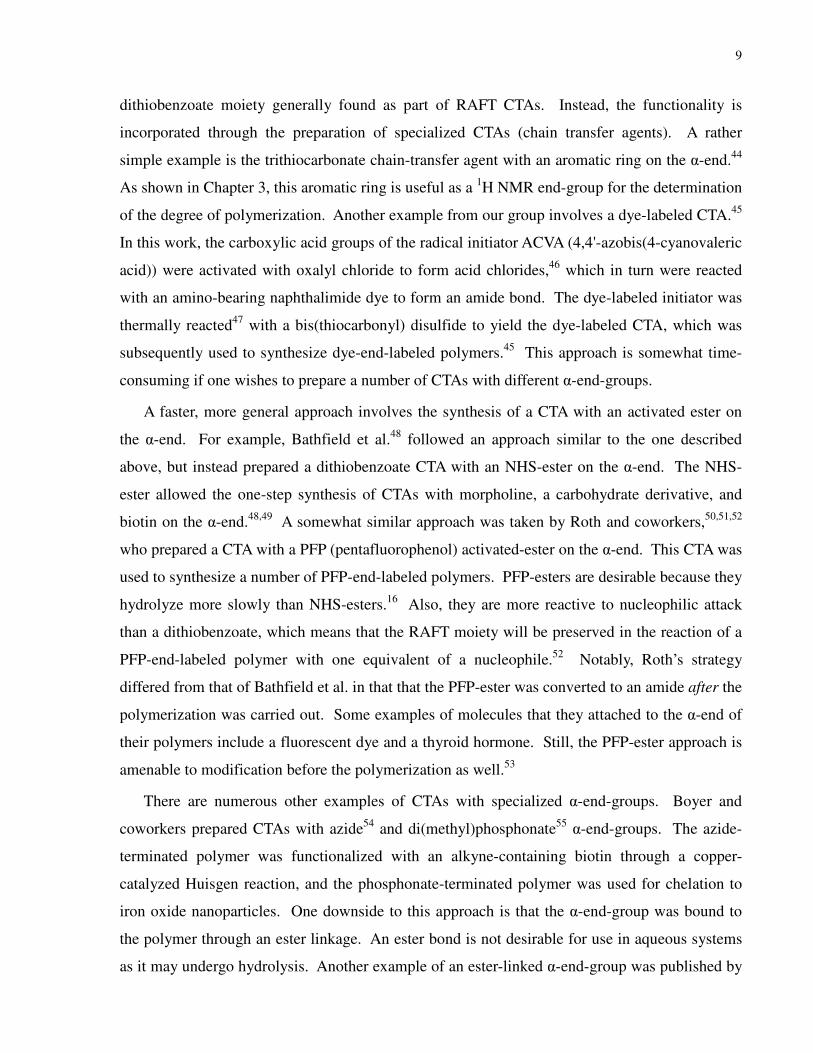
9
dithiobenzoate moiety generally found as part of RAFT CTAs. Instead, the functionality is
incorporated through the preparation of specialized CTAs (chain transfer agents). A rather
simple example is the trithiocarbonate chain-transfer agent with an aromatic ring on the α-end.44
As shown in Chapter 3, this aromatic ring is useful as a 1H NMR end-group for the determination
of the degree of polymerization. Another example from our group involves a dye-labeled CTA.45
In this work, the carboxylic acid groups of the radical initiator ACVA (4,4'-azobis(4-cyanovaleric
acid)) were activated with oxalyl chloride to form acid chlorides,46 which in turn were reacted
with an amino-bearing naphthalimide dye to form an amide bond. The dye-labeled initiator was
thermally reacted47 with a bis(thiocarbonyl) disulfide to yield the dye-labeled CTA, which was
subsequently used to synthesize dye-end-labeled polymers.45 This approach is somewhat time-
consuming if one wishes to prepare a number of CTAs with different α-end-groups.
A faster, more general approach involves the synthesis of a CTA with an activated ester on
the α-end. For example, Bathfield et al.48 followed an approach similar to the one described
above, but instead prepared a dithiobenzoate CTA with an NHS-ester on the α-end. The NHS-
ester allowed the one-step synthesis of CTAs with morpholine, a carbohydrate derivative, and
biotin on the α-end.48,49 A somewhat similar approach was taken by Roth and coworkers,50,51,52
who prepared a CTA with a PFP (pentafluorophenol) activated-ester on the α-end. This CTA was
used to synthesize a number of PFP-end-labeled polymers. PFP-esters are desirable because they
hydrolyze more slowly than NHS-esters.16 Also, they are more reactive to nucleophilic attack
than a dithiobenzoate, which means that the RAFT moiety will be preserved in the reaction of a
PFP-end-labeled polymer with one equivalent of a nucleophile.52 Notably, Roth’s strategy
differed from that of Bathfield et al. in that that the PFP-ester was converted to an amide after the
polymerization was carried out. Some examples of molecules that they attached to the α-end of
their polymers include a fluorescent dye and a thyroid hormone. Still, the PFP-ester approach is
amenable to modification before the polymerization as well.53
There are numerous other examples of CTAs with specialized α-end-groups. Boyer and
coworkers prepared CTAs with azide54 and di(methyl)phosphonate55 α-end-groups. The azide-
terminated polymer was functionalized with an alkyne-containing biotin through a copper-
catalyzed Huisgen reaction, and the phosphonate-terminated polymer was used for chelation to
iron oxide nanoparticles. One downside to this approach is that the α-end-group was bound to
the polymer through an ester linkage. An ester bond is not desirable for use in aqueous systems
as it may undergo hydrolysis. Another example of an ester-linked α-end-group was published by
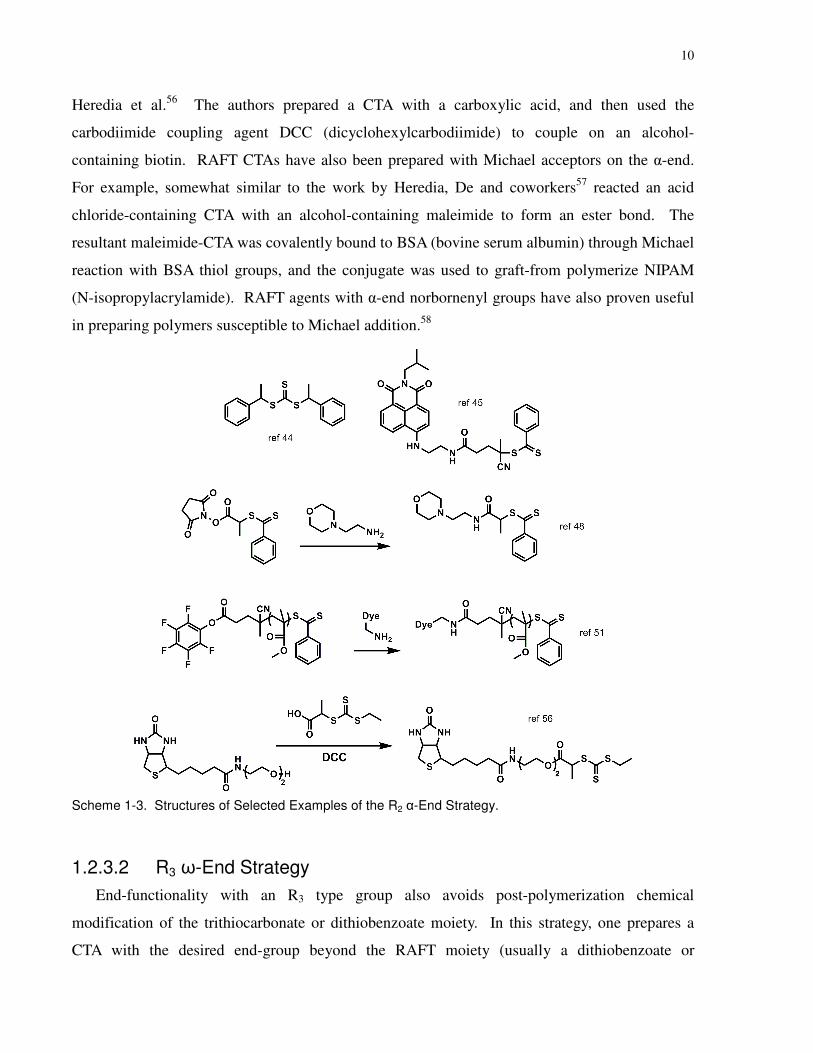
10
Heredia et al.56 The authors prepared a CTA with a carboxylic acid, and then used the
carbodiimide coupling agent DCC (dicyclohexylcarbodiimide) to couple on an alcohol-
containing biotin. RAFT CTAs have also been prepared with Michael acceptors on the α-end.
For example, somewhat similar to the work by Heredia, De and coworkers57 reacted an acid
chloride-containing CTA with an alcohol-containing maleimide to form an ester bond. The
resultant maleimide-CTA was covalently bound to BSA (bovine serum albumin) through Michael
reaction with BSA thiol groups, and the conjugate was used to graft-from polymerize NIPAM
(N-isopropylacrylamide). RAFT agents with α-end norbornenyl groups have also proven useful
in preparing polymers susceptible to Michael addition.58
Scheme 1-3. Structures of Selected Examples of the R2 α-End Strategy.
1.2.3.2 R3 ω-End Strategy
End-functionality with an R3 type group also avoids post-polymerization chemical
modification of the trithiocarbonate or dithiobenzoate moiety. In this strategy, one prepares a
CTA with the desired end-group beyond the RAFT moiety (usually a dithiobenzoate or
11
trithiocarbonate). Polymerization yields a polymer with the group on the ω-end of the chain.
For example, Liu et al.59 prepared a CTA with a pyridyl disulfide group located beyond the
trithiocarbonate. After the polymerization, the pyridyl disulfide can be reacted with a thiol of a
biomolecule to form a disulfide-linked bioconjugate. In another example, this R3 strategy, in
combination with the α-end strategies described above, is useful in preparing hetero-telechelic
polymers. In the Boyer paper with the azide-containing CTA,54 the ω-end of the CTA beyond the
trithiocarbonate was functionalized with a pyridyl disulfide. After polymerization, the azide
group was functionalized as described above, and the pyridyl disulfide was used to form a
disulfide bond with glutathione. The major disadvantage to these strategies, however, lies in the
sensitivity of the trithiocarbonate or dithiobenzoate. This moiety is readily attacked by
nucleophiles,42 at which point any group beyond the moiety will consequently be cleaved from
the polymer.
Scheme 1-4. Structure of a Selected Example of the R3 ω-End Strategy.
1.2.3.3 R4 ω-End Strategy
The more robust and popular method of achieving ω-end-functionality lies in chemically
modifying the RAFT moiety. Since this strategy involves the chemical modification of the
RAFT moiety, it can only be performed after the polymerization. As in the R3 strategy, the R4
strategy can be combined with the R2 α-end strategy to synthesize hetero-telechelic polymers.
The three most common methods of modification include radical reaction, reduction, and
aminolysis. After reduction or aminolysis, the resultant polymeric thiol is usually reacted with a
disulfide, Michael acceptor (maleimide), or some other specialized reagent.
When a RAFT-generated polymer is subjected to radical-induced reduction, the end-group
can be converted to a proton.60 This is useful when one wishes to remove the RAFT
functionality prior to a further reaction in which it could interfere. Alternatively, the thermally-
initiated radical reaction between a polymeric RAFT moiety and an azobis-type radical initiator
will yield a carbon-carbon bond between the polymer and the radical molecule produced from
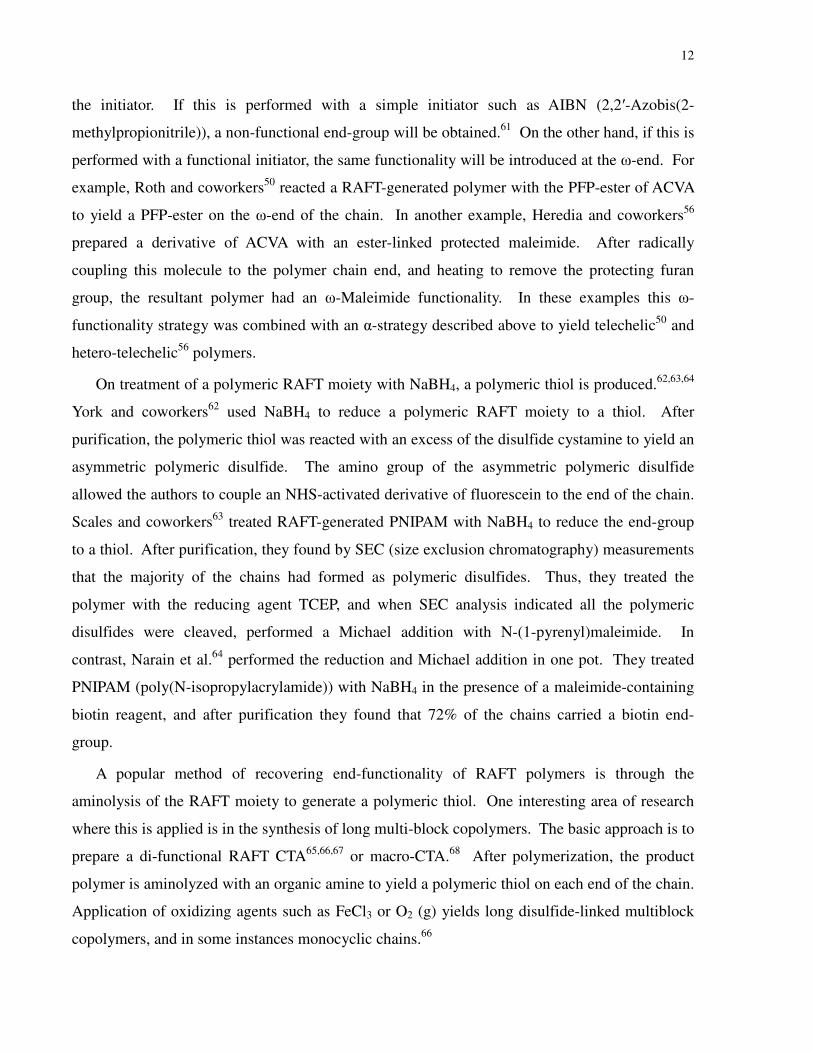
12
the initiator. If this is performed with a simple initiator such as AIBN (2,2′-Azobis(2-
methylpropionitrile)), a non-functional end-group will be obtained.61 On the other hand, if this is
performed with a functional initiator, the same functionality will be introduced at the ω-end. For
example, Roth and coworkers50 reacted a RAFT-generated polymer with the PFP-ester of ACVA
to yield a PFP-ester on the ω-end of the chain. In another example, Heredia and coworkers56
prepared a derivative of ACVA with an ester-linked protected maleimide. After radically
coupling this molecule to the polymer chain end, and heating to remove the protecting furan
group, the resultant polymer had an ω-Maleimide functionality. In these examples this ω-
functionality strategy was combined with an α-strategy described above to yield telechelic50 and
hetero-telechelic56 polymers.
On treatment of a polymeric RAFT moiety with NaBH4, a polymeric thiol is produced.62,63,64
York and coworkers62 used NaBH4 to reduce a polymeric RAFT moiety to a thiol. After
purification, the polymeric thiol was reacted with an excess of the disulfide cystamine to yield an
asymmetric polymeric disulfide. The amino group of the asymmetric polymeric disulfide
allowed the authors to couple an NHS-activated derivative of fluorescein to the end of the chain.
Scales and coworkers63 treated RAFT-generated PNIPAM with NaBH4 to reduce the end-group
to a thiol. After purification, they found by SEC (size exclusion chromatography) measurements
that the majority of the chains had formed as polymeric disulfides. Thus, they treated the
polymer with the reducing agent TCEP, and when SEC analysis indicated all the polymeric
disulfides were cleaved, performed a Michael addition with N-(1-pyrenyl)maleimide. In
contrast, Narain et al.64 performed the reduction and Michael addition in one pot. They treated
PNIPAM (poly(N-isopropylacrylamide)) with NaBH4 in the presence of a maleimide-containing
biotin reagent, and after purification they found that 72% of the chains carried a biotin end-
group.
A popular method of recovering end-functionality of RAFT polymers is through the
aminolysis of the RAFT moiety to generate a polymeric thiol. One interesting area of research
where this is applied is in the synthesis of long multi-block copolymers. The basic approach is to
prepare a di-functional RAFT CTA65,66,67 or macro-CTA.68 After polymerization, the product
polymer is aminolyzed with an organic amine to yield a polymeric thiol on each end of the chain.
Application of oxidizing agents such as FeCl3 or O2 (g) yields long disulfide-linked multiblock
copolymers, and in some instances monocyclic chains.66

13
Aminolysis of the RAFT moiety is also used in the preparation of polymeric pyridyl
disulfides. In three different publications,55,69,70 Boyer and coworkers give examples of a one-pot
reaction for the aminolysis of RAFT-generated polymers followed by reaction of the resultant
polymeric thiol with a dithiopyridine (disulfide). This yields an asymmetric polymeric pyridyl
disulfide, which, as discussed above, is useful for forming disulfide bonds with biomolecules or
other thiol-bearing reagents.
Another application of the aminolysis of the RAFT moiety is in the preparation of Michael
adducts. In this approach, the polymeric thiol is liberated by aminolysis, after which it is reacted
with a Michael acceptor, such as a maleimide or an acrylate, to form a stable thioether bond. For
example, Qiu and F.M. Winnik71 treated a RAFT-generated polymer with five equivalents of
organic amine. After an hour of aminolysis, a tenfold excess of butyl or hydroxyethyl acrylate
was added. They found complete conversion to the thioether derivative. Boyer and coworkers
have also presented a number of thiol-ene modifications of the ω-end of RAFT chains.72,69,73
These reports include one-pot aminolysis followed by reaction with a biotin-maleimide or 6-O-
methacryloyl mannose. They found close to 95% end-functionality with these reactions. Finally,
as presented above, Lou and coworkers utilized a Michael addition with a bismaleimide reagent
in order to prepare a polymer with a maleimide group for antibody attachment.5
Polymeric thiols generated by aminolysis have been reacted with reagents other than
disulfides, maleimides, and acrylates. For example, Roth and coworkers74,51 have used methyl
methanethiosulfonate (MTS) as a reagent. When methyl MTS is included during the aminolysis
of the RAFT moiety, it traps the polymeric thiol as an asymmetric methyl disulfide. This
disulfide is useful as a ligand for the formation of a self-assembled monolayer on gold,74 or as a
ligand for attachment to a gold nanoparticle.51 In a later publication, instead of using methyl
MTS, the authors used an MTS derivative with a biotin group.52 They found quantitative
conversion of the ω-end-group to the disulfide-linked biotin. Two of these studies combined the
MTS approach with α-end strategies in the preparation of di-end-functional polymers.51,52
Another reagent used to trap the polymeric thiol is divinyl sulfone. Grover and coworkers75
performed an aminolysis with organic amine under air-free conditions. Ten minutes after the
addition of the amine, divinyl sulfone was added and the reaction was stirred for half an hour,
and then purified by dialysis. They found by 1H NMR that 85% to 99% of the polymer chains
carried the sulfone linker, and by SDS-PAGE (sodium dodecyl sulfate polyacrylamide gel

14
electrophoresis) measurements they demonstrated the ability of divinyl sulfone-modified
polymers to form polymer-BSA conjugates.
Scheme 1-5. Structures of Selected Examples of the R4 ω-End Strategy.
1.2.3.4 End-Functionality without End-Group Manipulation
There is a way of adding mono-functionality to a RAFT polymer without any manipulation
of the end-groups. Chen and coworkers76 report a strategy for adding one dye-molecule to the α-
end of a polymer chain. Instead of preparing a specialized CTA, the authors prepared a dye-
labeled styrenic monomer. This monomer was used in a one-to-one radical reaction (analogous
to a polymerization) with a simple CTA. The resultant product CTA was purified by column
chromatography, and contained exactly one repeat unit of the styrenic monomer. This CTA was
subsequently used in the polymerization of acenaphthylene.
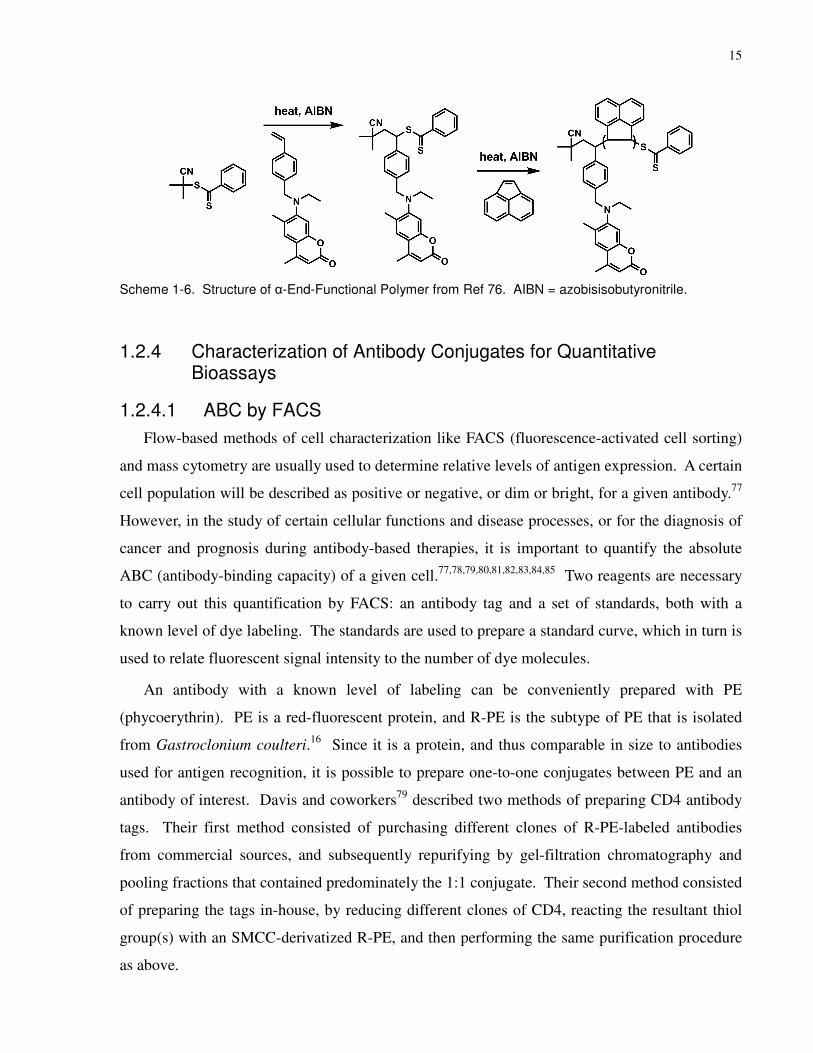
15
Scheme 1-6. Structure of α-End-Functional Polymer from Ref 76. AIBN = azobisisobutyronitrile.
1.2.4 Characterization of Antibody Conjugates for Quantitative Bioassays
1.2.4.1 ABC by FACS
Flow-based methods of cell characterization like FACS (fluorescence-activated cell sorting)
and mass cytometry are usually used to determine relative levels of antigen expression. A certain
cell population will be described as positive or negative, or dim or bright, for a given antibody.77
However, in the study of certain cellular functions and disease processes, or for the diagnosis of
cancer and prognosis during antibody-based therapies, it is important to quantify the absolute
ABC (antibody-binding capacity) of a given cell.77,78,79,80,81,82,83,84,85 Two reagents are necessary
to carry out this quantification by FACS: an antibody tag and a set of standards, both with a
known level of dye labeling. The standards are used to prepare a standard curve, which in turn is
used to relate fluorescent signal intensity to the number of dye molecules.
An antibody with a known level of labeling can be conveniently prepared with PE
(phycoerythrin). PE is a red-fluorescent protein, and R-PE is the subtype of PE that is isolated
from Gastroclonium coulteri.16 Since it is a protein, and thus comparable in size to antibodies
used for antigen recognition, it is possible to prepare one-to-one conjugates between PE and an
antibody of interest. Davis and coworkers79 described two methods of preparing CD4 antibody
tags. Their first method consisted of purchasing different clones of R-PE-labeled antibodies
from commercial sources, and subsequently repurifying by gel-filtration chromatography and
pooling fractions that contained predominately the 1:1 conjugate. Their second method consisted
of preparing the tags in-house, by reducing different clones of CD4, reacting the resultant thiol
group(s) with an SMCC-derivatized R-PE, and then performing the same purification procedure
as above.
16
The authors also had two methods for the preparation of standards. Their first type of
standard was a commercial set of four (samples of) QuantiBRITE beads. Each bead carried a
different number of R-PE molecules on its surface. Beads were counted by mixing an aliquot
with a known number of reference beads and then counting beads by flow cytometry. The
number of R-PE molecules per bead was then quantified by comparing solution fluorescence
intensity to an R-PE standard. Their second set of standards utilized a covalently-bound tandem
molecule of R-PE and an AP (alkaline phosphatase). Using biotin-streptavidin chemistry, they
conjugated different levels of this tandem R-PE-AP to streptavidin-carrying beads. The specific
phosphatase activity of each bead (sample) was compared to R-PE solution fluorescence
intensity in order to relate the fluorescence intensity to molecules of PE per bead. In comparing
the two sets of standards, they found that the plots of fluorescence intensity vs. molecules of R-
PE per bead were in excellent agreement.
Finally, PE-labeled CD4 tags, QuantiBRITE beads, and FACS measurement were used to
quantify the number of CD4 antigens on T-helper cells of healthy donors. The values they found
showed good agreement with values found by solution fluorescence as well as another
independent method. The authors then went on to perform a number of further experiments to
determine how the valency (Fab or F(ab’)2 fragment) and clone of the antibody effected the
measurement results.
Other studies have compared the use of 1:1 PE-conjugates and FITC (fluorescein
isothiocyanate)-conjugates in this application.82,83 Since FITC is a small molecule, it is not
possible to isolate an antibody tag with a well-defined number of FITC molecules per antibody.
To account for the uncertainty in the degree of FITC labeling, Wang and coworkers83 used the
concept of MESF (molecules of equivalent soluble fluorochrome). MESFab represents how
many dye molecules are bound to an antibody, and MESFcell represents how many dye molecules
are tagged to a cell. The ABC (antibody-binding capacity) is found by dividing MESFcell by
MESFab. In the case of the 1:1 PE-conjugates described above, MESFab is equal to 1, and
MESFcell is found by comparison to the QuantiBRITE standard beads. In contrast, one must
characterize the MESFab of a FITC-conjugate.
The authors determined the MESFab of FITC-labeled CD4 by two separate methods.83 In the
first method, a NIST fluorescein standard was used to construct a calibration plot of solution
fluorescence intensity vs. concentration. Next, this plot was used to find the concentration of
17
fluorescein molecules present in the as-purchased FITC-labeled CD4 antibody solution. The as-
purchased antibody solution came with a manufacturer-determined concentration. Thus, the
fluorescein concentration was divided by the antibody concentration to arrive at an MESFab,FITC
value of 1.16. The authors do note that this MESF value will inherit any uncertainty present in
the provided value of antibody concentration.
The second method of determining MESFab,FITC was by comparison to an established result.
First, they began by assuming that each FITC-labeled CD4 carried one FITC molecule. Then,
they performed a FACS assay of blood cells using the FITC-labeled CD4, with NIST-traceable
FITC-labeled microspheres as standards. This data was used to calculate a value of
MESFcell,FITC,apparent. Finally, using a known value of ABC (antibody-binding capacity, from the
literature or from analysis with a PE-labeled antibody), MESFab,FITC was found by dividing
MESFcell,FITC,apparent by ABC. With this method they found an MESFab,FITC value of 0.54. They
conclude that this second method is more accurate, because it is more appropriate to measure the
fluorescence of a conjugate bound to a biological calibrator than to measure the solution
fluorescence of only the conjugate.
1.2.4.2 ABC by Mass Cytometry
It is also possible to determine the ABC of a cell sample using the technique of mass
cytometry. Since mass cytometry is based on mass spectrometry, a different approach to
standardization is required. As discussed above, an antibody tag consists of an antibody with
covalently bound, lanthanide-carrying metal-chelating polymers. Analogous to the
determination of MESFab above, it is necessary to determine the number of metal atoms per
antibody. This was determined by combining two measurements of the polymer-antibody
conjugate. For the first measurement, Ornatsky and coworkers21 diluted the antibody tag
solution and used standard solution ICP-MS to determine the metal concentration. For the
second measurement, the authors used a Nanodrop UV/VIS spectrometer to measure protein
absorbance at 280 nm to quantify the antibody concentration. Dividing the metal concentration
by the antibody concentration showed that the tags carried on average 120-160 metal atoms per
antibody.
Standardization did not require a set of bead standards. Instead, quantification of the metal
atoms per cells was done as follows. Raw signal from the mass spectrometer was termed mean
analog intensity. This mean analog intensity was multiplied by an intensity-to-count conversion

18
factor (which represents the detector-data response) and divided by the transmission coefficient
for the given lanthanide ion. The transmission coefficient is the fraction of ions injected into the
plasma that actually reaches the detector, and is determined prior to analysis by calibrating the
instrument with a lanthanide tuning solution. This calculation yields the number of lanthanide
atoms per cell.
Finally, the number of lanthanide atoms per cell was divided by the number of lanthanide
atoms per antibody to yield the number of antibodies per cell, or ABC. The authors’ results were
within the range of published values determined with dye-labeled antibodies and FACS analysis.
To an outside reader, it may appear that arriving at this result required a great deal of work. In
actuality, it is a routine and non-time-intensive quality control practice to characterize the
number of metal atoms per antibody. In addition, the intensity-to-count conversion factors and
transmission coefficients for each lanthanide isotope are also routinely characterized as part of
machine operation. Thus, the technique of mass cytometry is amenable to routine multiplexed
determination of antibody-binding capacities. However, there has yet to be a study on whether
the binding of metal-chelating polymers to an antibody will change the antibody affinity for its
target antigen.
1.2.5 Dual-Purpose Labels for Bioassays
Mass cytometry can be considered the spiritual successor to FACS. Both techniques are used
to characterize cell-surface and internal antigens of cells, utilize labeled affinity reagents to stain
these antigens, and analyze cells individually. There has been interest within the Tanner group to
contrast14 and combine86 ICP-MS and FACS measurements. For example, in 2006 Ornatsky and
coworkers14 performed a tetraplex cellular surface and intracellular assay by both solution ICP-
MS and by FACS. In both experiments, the affinity reagents consisted of primary antibodies
raised in mouse or rabbit, or biotinylated antibodies. After the staining and permeabilization of
the cells was completed, the primary antibodies were stained with secondary anti-mouse, anti-
rabbit, and streptavidin antibodies labeled with either metal or fluorescent moieties. The
elemental and FACS methods gave comparable but not identical results. The discrepancy in
results may have been due to overcompensation in the setup of the FACS experiment.
In 2010, the Tanner group and Nodality, Inc.86 presented a conference poster comparing the
techniques of FACS and mass cytometry for the quantitative determination of antibody-binding
capacity. In this study, CD4 and CD45 antibodies were purchased labeled with PE
19
(phycoerythrin), or were labeled with amine-reactive Alexa Fluor 647 and 700 dyes. Antibodies
with and without dye-labels were then labeled with lanthanide atoms by the covalent attachment
of metal-chelating polymers. Metal-per-antibody was characterized by the method described in
the ABC by mass cytometry section, or by using antibody capture beads and analysis with mass
cytometry. The number of fluorescent dye molecules per antibody was characterized by UV/VIS
spectroscopy, quantitative solution fluorometry, or antibody capture beads with FACS analysis.
The authors found that solution fluorometry determination of antibody labeling was preferable to
the antibody capture beads because the beads showed varied capture efficiency across different
labeled antibodies. Finally, their ABC results (for CD4 and CD45) independently determined by
FACS and mass cytometry were in agreement with literature ABC values. While the concept of
a dual-purpose label is not new,87 this work was the first to describe the preparation of an affinity
reagent for ICP-MS and fluorescent assays.
In 2011, Zhang and coworkers88 reported the synthesis and application of a peptide labeled
with europium ions and FITC. The authors began with the peptide vasopressin, which contained
one disulfide and one terminal amine. After complete reduction of the disulfide with TCEP, they
used 5 equivalents of a maleimide-DOTA derivative to label each thiol with one ligand. ESI-MS
(electrospray ionization mass spectrometry) showed complete functionalization. Each DOTA
ligand was loaded with a europium atom afterwards. Next, they optimized FITC labeling
conditions to attach one dye molecule on every terminal amine. This reaction product was also
characterized by ESI-MS. They also examined the dual-labeling of two other proteins, in which
they found complete labeling, except in the case where a lysine amino group adjacent to a
DOTA-labeled cysteine group failed to react with FITC. They attribute this to steric hindrance,
but my hypothesis is that there was an electrostatic interaction, similar to results presented in
Chapter 6 of this thesis. Subsequently, the authors performed HPLC (high performance liquid
chromatography)-ICPMS and CE-LIF (capillary electrophoresis with laser induced fluorescence)
measurements to quantify dual-labeled peptides present in a biological sample, and found
comparable results between the two methods. Of note, they found that the detection limit was
two orders of magnitude lower with the ICP-MS assay. The authors conclude the
communication with the thought that a dual-purpose label is a desirable goal to work towards.
20
1.3 Research Gaps and Intended Goals
There are five requirements for a metal-chelating polymer intended to be attached to a library
of antibodies for bioassays based upon ICP-MS. First, the polymer must not be so long that it
interferes with antibody-antigen recognition. Second, it must have a narrow distribution of chain
lengths, so that each labeled antibody will carry a similar number of metal ions. Third, it must
contain the maximum number of metal-chelating sites for a given degree of polymerization in
order to maximize the sensitivity of the technique. Fourth, the polymer must contain high end-
functionality for covalent attachment to antibodies. Fifth, the polymer should be easy to
synthesize.
The metal-chelating polymer synthesis published by Lou and coworkers5 in 2007 was
problematic for three reasons. As discussed above, not every polymeric repeat unit carried a
ligand, and the ligand itself was difficult and expensive to synthesize, and in use possibly slow to
load lanthanide atoms. In addition, this polymerization utilized the monomer N-
acryloxysuccinimide, which had to be synthesized separately.
To overcome these deficiencies, the first goal of my thesis work was to develop an improved
synthesis of metal-chelating polymers. This synthesis was designed to use commercially
available, relatively inexpensive reagents throughout, and to involve easy purification steps such
as precipitation and dialysis. The synthesis should yield polymers with a low PDI and a ligand
along every repeat unit, and be flexible in the attachment of different ligands such as EDTA,
DTPA, and DOTA. Finally, the product polymer should have high end-functionality for antibody
attachment. While the above section on RAFT end-functionality contains many examples of
highly end-functional polymers, these reports do not involve any pendant group transformations
of the polymer. Synthetic methodologies for preparing metal-chelating polymers involve
numerous chemical transformations of the pendant groups, throughout which the end-group
functionality must be preserved. This was an added challenge in the planning and execution of
my polymer synthesis.
Once I developed a suitable metal-chelating polymer synthesis, my next goal was to make a
contribution to the topic of carefully characterized polymer-antibody conjugates for mass
cytometry. As discussed above, the Tanner group had already determined how to characterize a
metal-chelating polymer-antibody conjugate to find the number of metal atoms per antibody.
This is the information needed for characterizing the antibody-binding capacity of a cell.
21
However, I was still interested in developing a better understanding of the polymer-antibody
conjugate itself. In particular, I wanted to combine the measurements of metal ions per antibody
with careful polymer characterization to learn the average number of polymer chains bound to
each antibody. This polymer characterization involved 1H NMR (nuclear magnetic resonance),
TGA (thermal gravimetric analysis), and ITC (isothermal titration calorimetry, performed by
Isaac Herrera) to determine the lanthanide binding capacity of the metal-chelating polymer
chain.
The third goal of my thesis involved expanding the multiplexity of the mass cytometry assay.
As it stood, the multiplexity of the assay was limited to the 31 commercially available purified
lanthanide isotopes. Higher multiplexity is always in demand, because it will allow the biologist
to monitor more surface and intracellular cell markers at once, and thus have a better
understanding of the biological system of interest. For example, in a recent study, Bendall and
coworkers10 used two panels of 31 antibodies. The first panel consisted of antibodies directed at
13 core surface markers and 18 subset specific cell-surface markers, while the second panel
consisted of antibodies directed at the same 13 core surface markers, along with 18 intracellular
epitopes to characterize intracellular signaling states. Using two panels is extra work, and one
will not have data on both the 18 subset specific cell-surface markers and the 18 intracellular
epitopes for individual cells. Thus, I was interested in expanding the assay to use other metals
with atomic masses of 100 to 220 amu. In particular, I synthesized metal-chelating polymers
with EDTA, DTPA, TTHA (triethylenetetraaminehexaacetic acid), and DOTA ligands for the
complexation of palladium and platinum ions, and then investigated how these palladium- and
platinum-loaded polymers performed in mass cytometric assays (carried out by Dr. Olga
Ornatsky).
The final goal of my thesis was to prepare dual-purpose, fluorescent metal-chelating
polymers. This polymer was designed similarly to the regular metal-chelating polymer I had
already developed, but it also incorporated two to six fluorescent dye molecules. The synthesis
was designed to add the fluorescent dye at a late stage, so that the same precursor polymer could
be used for different dyes, and because the fluorescent dyes themselves were quite expensive.
Finally, polymer-antibody conjugates prepared with these polymers were tested in model mass
cytometric and FACS assays (Dr. Olga Ornatsky) to determine their suitability as dual-purpose
labels.
22
1.4 Thesis Plan
This thesis contains seven chapters, including this one. Chapter 2 contains general
experimental details. Chapter 3 details the synthesis of a functional metal-chelating polymer, the
preparation of polymer-antibody conjugates, the determination of the number of metal-chelating
polymers per polymer-antibody conjugate, and the use of these conjugates in a multiplexed mass
cytometric assay. Chapter 4 describes a metal-chelating polymer synthesis in which a different
strategy was used for the recovery of polymer end-functionality. Chapter 5 reports the
preparation of palladium- and platinum-loaded metal-chelating polymers and the performance of
their polymer-antibody conjugates in model mass cytometric assays. Chapter 6 details the
synthesis of dual-purpose, fluorescent metal-chelating polymers and the performance of their
polymer-antibody conjugates in model mass cytometric and FACS assays. Finally, Chapter 7 is a
reflection on possible future extensions for this project.
23
2 Chapter 2: General Experimental Details
2.1 Overview
This chapter collects general experimental details common to a number of the subsequent
chapters.
2.2 Experimental
2.2.1 Instrumentation and Characterization
2.2.1.1 Gel Permeation Chromatography
The nominal molecular weights and polydispersities (PDI = Mw/Mn) of poly(tert-butyl
acrylate) (PtBA) samples were measured on one of two systems. The first system consisted of a
Viscotek SECMax size exclusion chromatograph (SEC) equipped with a Viscotek 2501 UV/VIS
detector (set to 310 nm), TDA302 triple detector array, and Viscotek GMHHR-H and GMHHR-
M Viscogel SEC columns (kept at 35 0C). The flow rate was maintained at 0.6 mL/min using a
VE2001 solvent/sample module. The second system consisted of a gel-permeation
chromatograph (SEC) system equipped with a Viscotek VE 3219 UV/VIS detector (set to 310
nm), VE 3580 RI (refractive index) detector, and a Polymer Labs gel 5 micrometer Mixed-D
(300*7.5 mm) column and a gel 5 micrometer guard column (kept at room temperature). The
flow rate was maintained at 0.6 mL/min using a Waters 515 HPLC Pump. Both systems utilized
tetrahydrofuran (THF) as the eluent, and were conventionally calibrated with polystyrene
standards.
The nominal molecular weights and polydispersities of all anionic, water-soluble samples
were measured with a Viscotek size exclusion chromatograph (SEC) equipped with a Viscotek
VE3210 UV/VIS detector, VE3580 refractive index detector, and Viscotek ViscoGEL
G4000PWXL and G2500PWXL columns (kept at 30 0C). The flow rate was maintained at 1.0
mL/min using a Viscotek VE1122 Solvent Delivery System and VE7510 SEC Degasser. In
Chapter 4, an eluent of 0.2 M KNO3 and 200 ppm NaN3 was used. In Chapters 3, 5 and 6 the
eluent additionally contained 25 mM pH 8.5 phosphate buffer. The system was calibrated with
poly(methacrylic acid) standards. In Chapters 3 & 4, samples were dissolved in sodium
bicarbonate/carbonate buffer (pH 9.4, 200 mM) prior to injection. In Chapters 5 & 6, samples
were simply dissolved in eluent prior to injection.
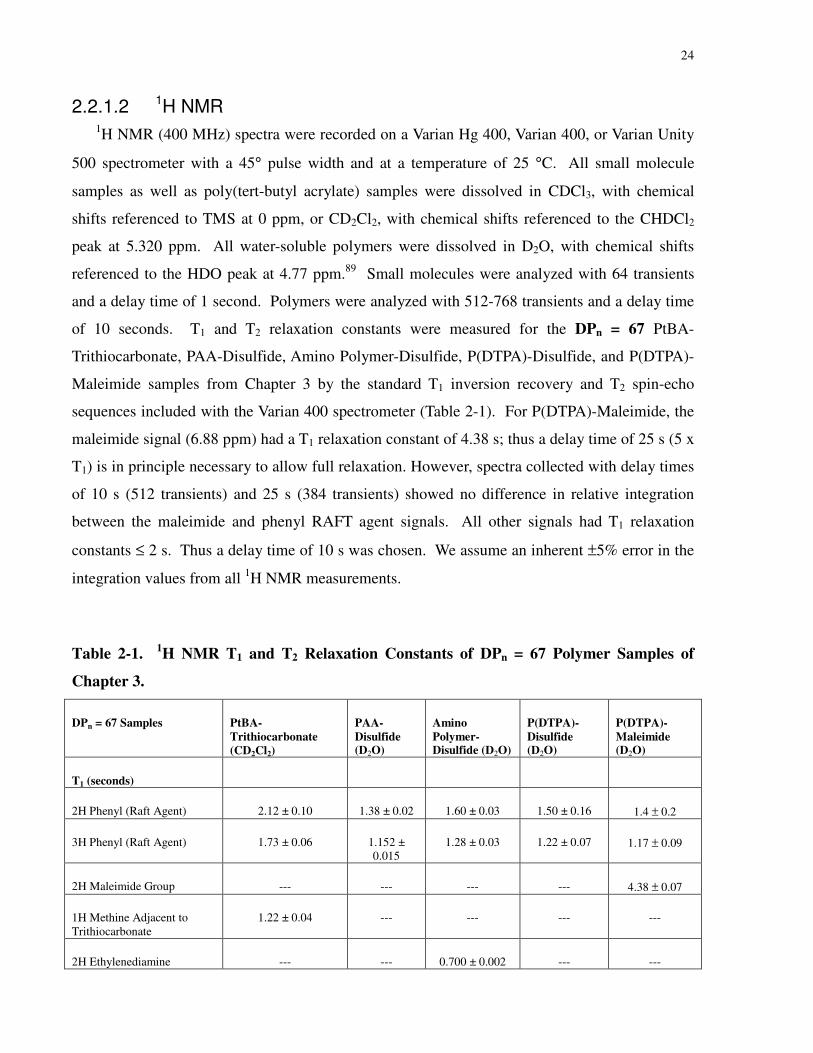
24
2.2.1.2 1H NMR 1H NMR (400 MHz) spectra were recorded on a Varian Hg 400, Varian 400, or Varian Unity
500 spectrometer with a 45° pulse width and at a temperature of 25 °C. All small molecule
samples as well as poly(tert-butyl acrylate) samples were dissolved in CDCl3, with chemical
shifts referenced to TMS at 0 ppm, or CD2Cl2, with chemical shifts referenced to the CHDCl2
peak at 5.320 ppm. All water-soluble polymers were dissolved in D2O, with chemical shifts
referenced to the HDO peak at 4.77 ppm.89 Small molecules were analyzed with 64 transients
and a delay time of 1 second. Polymers were analyzed with 512-768 transients and a delay time
of 10 seconds. T1 and T2 relaxation constants were measured for the DPn = 67 PtBA-
Trithiocarbonate, PAA-Disulfide, Amino Polymer-Disulfide, P(DTPA)-Disulfide, and P(DTPA)-
Maleimide samples from Chapter 3 by the standard T1 inversion recovery and T2 spin-echo
sequences included with the Varian 400 spectrometer (Table 2-1). For P(DTPA)-Maleimide, the
maleimide signal (6.88 ppm) had a T1 relaxation constant of 4.38 s; thus a delay time of 25 s (5 x
T1) is in principle necessary to allow full relaxation. However, spectra collected with delay times
of 10 s (512 transients) and 25 s (384 transients) showed no difference in relative integration
between the maleimide and phenyl RAFT agent signals. All other signals had T1 relaxation
constants ≤ 2 s. Thus a delay time of 10 s was chosen. We assume an inherent ±5% error in the
integration values from all 1H NMR measurements.
Table 2-1. 1H NMR T1 and T2 Relaxation Constants of DPn = 67 Polymer Samples of
Chapter 3.
DPn = 67 Samples PtBA-
Trithiocarbonate
(CD2Cl2)
PAA-
Disulfide (D2O)
Amino
Polymer-Disulfide (D2O)
P(DTPA)-
Disulfide (D2O)
P(DTPA)-
Maleimide (D2O)
T1 (seconds)
2H Phenyl (Raft Agent) 2.12 ± 0.10 1.38 ± 0.02 1.60 ± 0.03 1.50 ± 0.16 1.4 ± 0.2
3H Phenyl (Raft Agent) 1.73 ± 0.06 1.152 ± 0.015
1.28 ± 0.03 1.22 ± 0.07 1.17 ± 0.09
2H Maleimide Group --- --- --- --- 4.38 ± 0.07
1H Methine Adjacent to Trithiocarbonate
1.22 ± 0.04 --- --- --- ---
2H Ethylenediamine --- --- 0.700 ± 0.002 --- ---
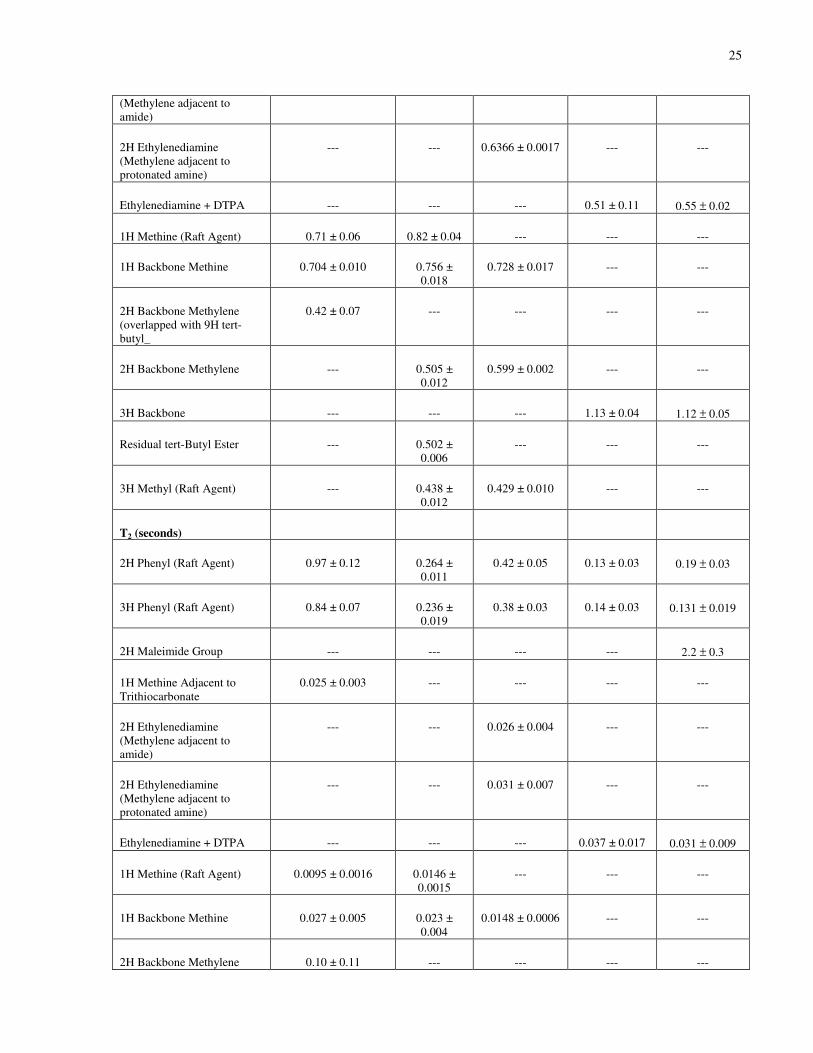
25
(Methylene adjacent to amide)
2H Ethylenediamine (Methylene adjacent to protonated amine)
--- --- 0.6366 ± 0.0017 --- ---
Ethylenediamine + DTPA --- --- --- 0.51 ± 0.11 0.55 ± 0.02
1H Methine (Raft Agent) 0.71 ± 0.06 0.82 ± 0.04 --- --- ---
1H Backbone Methine 0.704 ± 0.010 0.756 ± 0.018
0.728 ± 0.017 --- ---
2H Backbone Methylene (overlapped with 9H tert-butyl_
0.42 ± 0.07 --- --- --- ---
2H Backbone Methylene --- 0.505 ± 0.012
0.599 ± 0.002 --- ---
3H Backbone --- --- --- 1.13 ± 0.04 1.12 ± 0.05
Residual tert-Butyl Ester --- 0.502 ± 0.006
--- --- ---
3H Methyl (Raft Agent) --- 0.438 ± 0.012
0.429 ± 0.010 --- ---
T2 (seconds)
2H Phenyl (Raft Agent) 0.97 ± 0.12 0.264 ± 0.011
0.42 ± 0.05 0.13 ± 0.03 0.19 ± 0.03
3H Phenyl (Raft Agent) 0.84 ± 0.07 0.236 ± 0.019
0.38 ± 0.03 0.14 ± 0.03 0.131 ± 0.019
2H Maleimide Group --- --- --- --- 2.2 ± 0.3
1H Methine Adjacent to Trithiocarbonate
0.025 ± 0.003 --- --- --- ---
2H Ethylenediamine (Methylene adjacent to amide)
--- --- 0.026 ± 0.004 --- ---
2H Ethylenediamine (Methylene adjacent to protonated amine)
--- --- 0.031 ± 0.007 --- ---
Ethylenediamine + DTPA --- --- --- 0.037 ± 0.017 0.031 ± 0.009
1H Methine (Raft Agent) 0.0095 ± 0.0016 0.0146 ± 0.0015
--- --- ---
1H Backbone Methine 0.027 ± 0.005 0.023 ± 0.004
0.0148 ± 0.0006 --- ---
2H Backbone Methylene 0.10 ± 0.11 --- --- --- ---
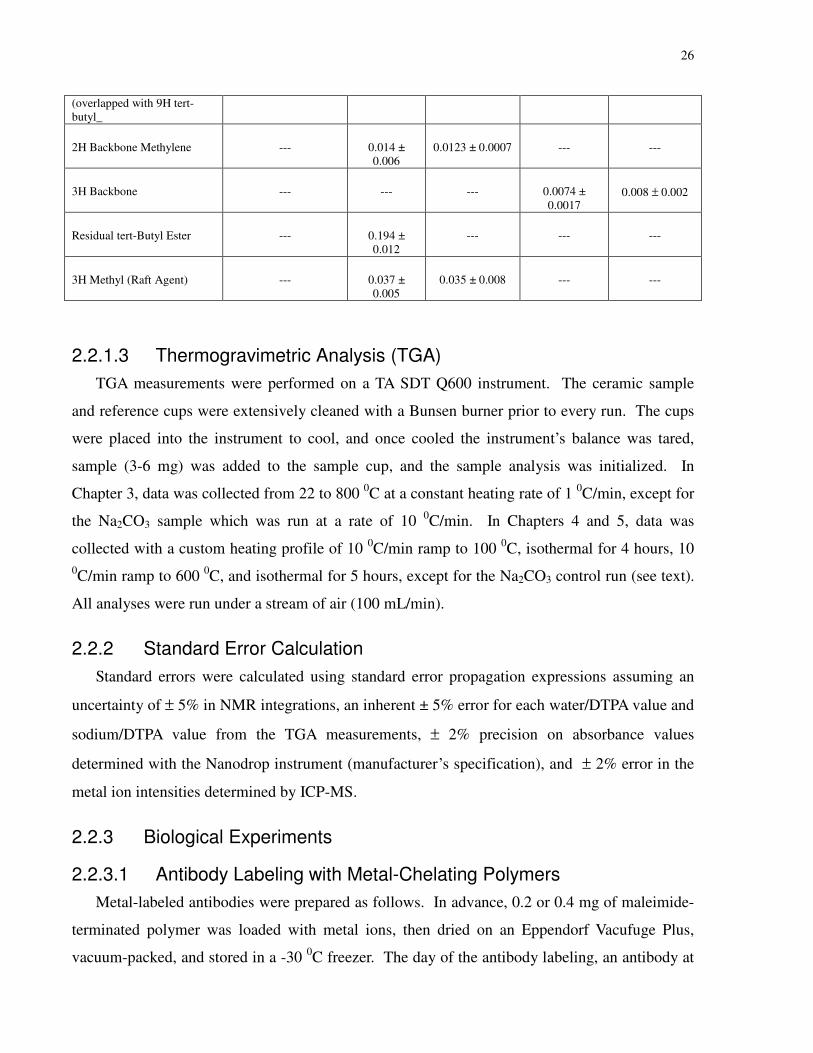
26
(overlapped with 9H tert-butyl_
2H Backbone Methylene --- 0.014 ± 0.006
0.0123 ± 0.0007 --- ---
3H Backbone --- --- --- 0.0074 ± 0.0017
0.008 ± 0.002
Residual tert-Butyl Ester --- 0.194 ± 0.012
--- --- ---
3H Methyl (Raft Agent) --- 0.037 ± 0.005
0.035 ± 0.008 --- ---
2.2.1.3 Thermogravimetric Analysis (TGA)
TGA measurements were performed on a TA SDT Q600 instrument. The ceramic sample
and reference cups were extensively cleaned with a Bunsen burner prior to every run. The cups
were placed into the instrument to cool, and once cooled the instrument’s balance was tared,
sample (3-6 mg) was added to the sample cup, and the sample analysis was initialized. In
Chapter 3, data was collected from 22 to 800 0C at a constant heating rate of 1 0C/min, except for
the Na2CO3 sample which was run at a rate of 10 0C/min. In Chapters 4 and 5, data was
collected with a custom heating profile of 10 0C/min ramp to 100 0C, isothermal for 4 hours, 10
0C/min ramp to 600 0C, and isothermal for 5 hours, except for the Na2CO3 control run (see text).
All analyses were run under a stream of air (100 mL/min).
2.2.2 Standard Error Calculation
Standard errors were calculated using standard error propagation expressions assuming an
uncertainty of ± 5% in NMR integrations, an inherent ± 5% error for each water/DTPA value and
sodium/DTPA value from the TGA measurements, ± 2% precision on absorbance values
determined with the Nanodrop instrument (manufacturer’s specification), and ± 2% error in the
metal ion intensities determined by ICP-MS.
2.2.3 Biological Experiments
2.2.3.1 Antibody Labeling with Metal-Chelating Polymers
Metal-labeled antibodies were prepared as follows. In advance, 0.2 or 0.4 mg of maleimide-
terminated polymer was loaded with metal ions, then dried on an Eppendorf Vacufuge Plus,
vacuum-packed, and stored in a -30 0C freezer. The day of the antibody labeling, an antibody at
27
1 mg/mL in 150 mM sodium phosphate buffer, pH 7.2 and in the absence of bovine serum
albumin (BSA) or gelatin was subjected to mild reduction by TCEP (tris(2-
carboxyethyl)phosphine) to convert the disulfides in the Fc fragment to thiols. The reduction and
subsequent antibody-polymer conjugation steps were performed in 1.5 mL 50K MWCO
centrifugal devices (Millipore YM-50). The maleimide group of the purified, metal ion-loaded
metal-chelating polymer was bound to the thiol groups of the partially-reduced antibody in tris-
buffered saline (TBS, 25 mM Tris, 150 mM NaCl, 2 mM KCl, pH 7.4). The metal-tagged
antibody was washed several times in EDTA-free TBS and stored at +4 0C. When loaded with
lanthanide ions these polymers are resistant to leaching, and the Winnik group has observed no
exchange of lanthanide ions between differently tagged antibodies when deployed in a multiple
antibody staining cocktail.5
2.2.3.2 Mass Cytometry
Labeled cells were analyzed by mass cytometry8 using a CyTOFTM instrument from DVS
Sciences, Richmond Hill, Ontario. Mass cytometry is a real-time analytical technique whereby
cells or particles are individually introduced into an inductively-coupled plasma flame, and each
resultant ion-cloud is analyzed by time-of-flight mass spectrometry. Dual-counting, the
combination of digital counting and analog modes of ion detection, allows a much wider range of
ion signal (simultaneous detection of very small and very large signals). Data was collected in
FCS 3.0 format and was processed by FlowJoTM software.

28
29
3 Chapter 3: Synthesis of a Functional Metal-Chelating Polymer and Steps towards Quantitative Mass Cytometry Bioassays
3.1 Introduction
The sensitivity of mass cytometric bioassays depends linearly on the number of lanthanide
ions carried by each antibody. This in turn depends upon the number of lanthanide ions bound to
the metal-chelating polymer, as well as the number of these polymers attached to each antibody.
To increase the sensitivity and range of the methodology, it is important to increase the ion-
carrying capacity of the metal-chelating polymers. One imagines that as the length of the
polymer is increased, there is greater likelihood that the polymer could interfere with antibody-
antigen recognition. Metal-chelating polymer synthesis for bioassays is a young field, however,
and one lacks the knowledge necessary to design optimal polymers for this analytical technique.
In this chapter, I describe the synthesis and characterization of a second generation metal-
chelating polymer intended for antibody labeling. The requirement set for the polymer was to
have a metal-binding ligand in essentially every repeat unit, to have a degree of polymerization
of 60 or larger, thus increasing the number of metal binding sites per polymer chain, to obtain
polymer molecules with a narrow distribution of lengths, and to maximize the yield of polymer
with a suitable end functionality for antibody attachment. Radical addition-fragmentation chain
transfer (RAFT) polymerization is a useful methodology to synthesize polymers of controlled
length, narrow molar mass distribution, and with control over end groups. To meet our
requirements, we explored the idea that RAFT polymerization of an inexpensive, commercially
available monomer followed by pendant group modification in near quantitative yield would
have several advantages. One of the most important advantages is that the mean chain length
and distribution can be characterized at this early stage of the synthesis, and that these
characteristics would be largely preserved throughout the subsequent transformations.
One of the objectives of this chapter is to describe the synthesis and pendant group
transformations with an emphasis on analytical characterization of the polymer at each stage.
The functional end group content was characterized by reaction of the free thiol, protected as a
disulfide throughout the synthesis, with a bismaleimide to introduce the reactive group for
antibody modification. The functional end group content was also characterized by a
30
spectrophotometric assay using 4,4’-dithiopyridine, as performed by Isaac Herrera.90,91
Isothermal titration microcalorimetry, using Gd3+ citrate as a probe, was performed by Isaac
Herrera to compare the number of lanthanide ions bound to the polymer to the number of
diethylentriaminepentaacetic acid (DTPA) ligands determined by 1H NMR. Using goat anti-
mouse IgG as a model, Olga Ornatsky used traditional ICP-MS to establish that antibody
modification with the metal-chelating polymer introduced an average of 161 ± 4 159Tb atoms.
These data indicate that there were an average of 2.4 metal-containing polymer molecules per
antibody.
In addition, this metal-chelating polymer was used by Olga Ornatsky for antibody labeling
and 11-plex single cell analysis using mass cytometry for the identification and abundance of the
different cell populations in human umbilical cord blood.
3.2 Experimental
3.2.1 Polymer Synthesis
3.2.1.1 Materials
All reagents and solvents, including carbon disulfide (≥99.9%, Sigma-Aldrich), cesium
carbonate (99%, Aldrich), (1-bromoethyl)benzene (97%, Aldrich), trifluoroacetic acid (TFA)
(Caledon Laboratories LTD), diethylenetriaminepentaacetic acid (DTPA) (98%, Aldrich), DL-
dithiothreitol (DTT) (99%, Aldrich), and other compounds were used without further purification
unless otherwise noted. Acetonitrile was dried over 4A molecular sieves. Tert-butyl acrylate
(98%, Aldrich) was gravity-filtered over silica to remove the inhibitor before polymerization.
Water was purified through a MilliQ water purification system (10 MΩcm). All buffers were
prepared in our laboratory. The Spectra/Por dialysis membrane (MWCO 1 kDA) was purchased
from Spectrum Laboratories, Inc. The 4 mL and 15 mL, 3 kDa MWCO Millipore Amicon spin
filters were purchased from Fisher Science, Canada.
2,2'-(ethylenedioxy)bis(ethylmaleimide) (Acanthus Research, Toronto, Canada), 2,2'-
Azobis(2-methylbutyronitrile) (AMBN, Dupont USA), 4-(4,6-dimethoxy-1,3,5-triazin-2-yl)-4-
methylmorpholinium chloride (DMTMM, Acros Organics, 99+%, from Fisher Science, Canada),
and t-BOC-ethylenediamine (>97%, TCI America) were stored in a dessicator inside a freezer at
-20 0C. Before use, their temperatures were equilibrated in a dessicator kept at room
temperature.
31
3.2.1.1.1 Synthesis of Di-1-Phenylethyl Trithiocarbonate (CTA)
The procedure to synthesize this CTA was taken from the literature.44 To a 100 mL round-
bottom flask was added carbon disulfide (1.51 mL, 25 mmol), cesium carbonate (8.15 g, 25
mmol) and dry acetonitrile (20 mL). After mixing for two hours at room temperature, the
mixture had a pale red color. At this point, (1-bromoethyl)benzene (3.41 mL, 25 mmol) in dry
acetonitrile (5 mL) was added, and the mixture was stirred for an additional 2 days. Afterwards,
the yellow reaction mixture was poured into a 1 L separatory funnel containing ice water (500
mL), after which ethyl acetate (250 mL) was added. After agitation the water layer was
removed, and then the ethyl acetate layer was washed with additional water (250 mL), dried over
magnesium sulfate, and filtered over a fritted funnel containing celite. The ethyl acetate was
removed by rotary evaporator, after which the crude product was purified by flash column
chromatography, eluting with hexanes:dichloromethane (9:1 v:v), product TLC Rf = 0.20.
Finally, all solvent was removed by rotary evaporator, followed by drying under vacuum (room
temperature, <10-3 torr) to yield an orange oil. Yield: 2.64 g (66%); 1H NMR (CDCl3): δ(ppm)
1.72 (t, 3H, CH3), 5.30 (q, 1H, methine), 7.32 (m, 5H, aromatic)
3.2.1.2 Polymer Series
Two polymer samples were synthesized using the same chemistry, with number average
degrees of polymerization (DPn) of 67 and 79. Details are provided for the DPn = 67 sample, but
characterization data are provided for both samples. All reagents and solvent volumes scale with
the amount of reactant.
3.2.1.2.1 RAFT polymerization of tBA
The polymerization was carried out using 80% monomer/20% acetone by volume as a
diluent, a round-bottom flask fitted with a rubber septum, and purging with N2 as the degassing
method. The molar ratio of tBA:CTA:AMBN was 85:0.5:0.1. To a 50 mL round-bottom flask
was added CTA (174 mg), AMBN (18.6 mg), tert-butyl acrylate (11.90 g), acetone (2.69 g), and
a magnetic stir bar, after which the septum was secured and the contents purged with N2 for 15
minutes. The flask was lowered into a 60 0C oil bath, and after 3.3 hours the solution was
observed to be viscous. The septum was opened and an aliquot was removed and dissolved in
CDCl3 for 1H NMR analysis. [Comparison of the 1H NMR signals of the vinylic monomer
(5.72, 6.03, and 6.30 ppm, 3H) to the methine polymer backbone signal (2.15-2.35 ppm, 1H)

32
showed a monomer conversion of 78%.] Acetone (10 mL) was added to the polymerization
mixture, after which the polymer was precipitated twice from a concentrated acetone solution
(ca. 20 mL) into a mixture of water and methanol (1:1, v:v, 300 mL), transferred to a tared
round-bottom flask as an acetone solution, and then dried by rotary evaporation using a water
bath at 70 0C. Dissolution in acetone and rotary evaporation was repeated a total of seven times
to remove any remaining monomer. Finally, the polymer was dried for 24 hours under ca. 10-3
torr vacuum at 70 0C, and then stored in a refrigerator at 12 0C; Yield = 8.69 g (73%); 1H NMR
(CD2Cl2): δ(ppm, integrated peak areas are reported are based on C6H5 = 5H as the reference)
1.1-1.9 (broad, 2H per monomer, backbone methylene, peak overlapped), 1.43 (s, 9H per
monomer, -C(CH3)3 ester, peak overlapped), 2.1-2.5 (broad, 1H per monomer, backbone
methine, integration = 66.1), 2.71 (s, 1H per polymer, (phenyl)(methyl)-C(H)- methine,
integration = 0.9), 4.60 (s, 1H end group methine, integration = 0.9), 7.17 and 7.26 (broad
doublet and triplet, 5H, end group phenyl, integration = 5.0); DPn = 67, calculated by comparing
the integration of the 1H NMR signals at 7.17 and 7.26 ppm (end group) to that at 2.1-2.5 ppm
(backbone methine) + 4.60 (end group methine); SEC (THF, RI) Mn = 16,000 Da, PDI = 1.11,
strong corresponding peak observed in the UV/VIS trace monitored at 310 nm.
P(tBA) DPn = 79. Synthesis: molar ratio tBA:CTA:AMBN = 105:0.5:0.1;, polymerization
time = 3.5 hours, monomer conversion = 76%; Yield = 8.83 (69%). 1H NMR (CD2Cl2): 1.1-1.9
(peak overlapped), 1.43 (peak overlapped), 2.1-2.5 (integration = 77.8), 2.71 (integration = 0.9),
4.60 (integration = 1.0), 7.17 and 7.26 (integration = 5.0); calculated DPn = 79. SEC (THF, RI)
Mn = 19,000 Da, PDI = 1.11, strong corresponding peak observed in the UV/VIS trace (310 nm).
3.2.1.2.2 Aminolysis of the Trithiocarbonate and Formation of a Polymeric Disulfide
PtBA (DPn = 67, 3.37 g) was placed in a 500 mL round-bottom flask. THF (12.64 mL),
ethanolamine (126 µL), and a magnetic stir bar were added, after which a glass stopper was
secured with Apiezon H grease. After stirring the solution at room temperature overnight, the
disulfide PtBA product was recovered by removing the solvent with a rotary evaporator using a
water bath at room temperature. SEC (THF, RI) Mn = 14,400 Da, PDI = 1.16, no corresponding
peak observed in the UV/VIS trace (310 nm).
DPn = 79 sample: Synthesis reaction scale = 2.66 g; SEC (THF, RI) Mn = 17,000 Da, PDI =
1.16, no corresponding peak observed in the UV/VIS trace (310 nm).
33
3.2.1.2.3 Deprotection of PtBA to PAA
The PtBA-Disulfide (DPn = 67, entire sample) was dissolved in dichloromethane (20.2 mL).
Trifluoroacetic acid (8.6 mL) was added and the solution was stirred overnight. The polymer
precipitated as a large mass, which was then collected over a fritted funnel and washed with
dichloromethane (30 mL) and then diethyl ether (30 mL). After being transferred to a round-
bottom flask, the precipitate was dried for 30 minutes on a rotary evaporator using a water bath
at room temperature. The polymer was dissolved in H2O:MeOH (2:1 v:v, 25.3 mL), and then
transferred to a Spectra/Por dialysis bag (MWCO 1 kDa). The polymer was dialyzed against
water (4 L) for three days, with the water being changed twice daily. Afterwards the solution
was transferred to a 50 mL Falcon centrifuge tube and then freeze-dried to yield PAA-Disulfide.
Yield = 1.78 g (94%); 1H NMR (D2O): δ(ppm, integrated peak areas reported based on C6H5 =
5H) 1.25 (b, 3H, end group –CH3, integration = 3.0), 1.46 (s, 9H, 1% unremoved tert-butyl ester,
integration = 3.2), 1.4-2.1 (b, 2H per monomer, backbone methylene, integration = 127.0), 2.2-
2.7 (b, 1H per monomer, backbone methine, integration = 66.1), 7.2-7.45 (m, 5H, phenyl,
integration = 5.0); SEC (aqueous, relative to poly(methacrylic acid) standards, RI) Mn = 17,400
Da, PDI = 1.19.
DPn = 79 sample: Yield = 1.40 g (97%); 1H NMR (D2O): δ(ppm) 1.25 (integration = 2.8),
1.46 (integration = 6.9), 1.4-2.1 (integration = 152), 2.2-2.7 (integration = 78.5), 7.2-7.45
(integration = 5.0); SEC (Aq., RI) Mn = 21,100 Da, PDI = 1.17.
3.2.1.2.4 Coupling of t-BOC-ethylenediamine to PAA
PAA-Disulfide (DPn = 67, 50 mg) was added to a 50 mL round-bottom flask and dissolved in
water (5 mL). A solution of t-BOC-ethylenediamine (277 mg) in 5 mL water was added to the
polymer solution. A solution of DMTMM (480 mg) in water (8.75 mL) was added immediately,
and the mixture was stirred at room temperature overnight. The solution took on the appearance
of milk after one hour, and had precipitated by the next morning. The liquid was poured off, and
the polymer was rinsed with water (3 x 10 mL). To remove all water, the polymer product was
dissolved in dichloromethane, and then the solvent was removed with a rotary evaporator using a
water bath at room temperature. This dissolution in dichloromethane and rotary evaporation was
repeated a total of seven times in order to azeotropically remove all water. The polymer product
was not characterized, but was used directly in the deprotection step.
34
3.2.1.2.5 Deprotection of Boc Groups to Yield the Amino Polymer
Boc-protected polymer (DPn = 67, entire sample) was dissolved in dichloromethane (9 mL),
after which anisole (1.5 mL) and trifluoroacetic acid (4.5 mL) were added with stirring. The
mixture was stirred for 30 min, after which the product polymer was observed to have
precipitated on the walls of the flask as a transparent goo. After three hours of stirring, the
mother liquor was poured off, and the precipitated polymer was rinsed with diethyl ether (2 x 10
mL). The product was dried on a rotary evaporator using a water bath at room temperature for
five minutes, after which it was dissolved in water and then washed with water (5 x 11 mL) using
a 15 mL, 3 kDA MWCO Millipore Amicon spin filter. Finally, the aqueous solution was freeze-
dried to yield the Amino Polymer-Disulfide as the trifluoroacetate salt.; Yield = 165 mg (100%);
1H NMR (D2O): δ(ppm, integrated peak areas reported based on C6H5 = 5H) 1.19 (broad t, 3H,
end group –CH3, integration = 3.4), 1.25-2.40 (broad, 2H per monomer, backbone methylene +
1H per monomer, backbone methine, integration = 194), 3.13 (broad s, 2H per monomer,
ethylenediamine –CH2-NH3+, integration = 126), 3.47 (broad s, 2H per monomer,
ethylenediamine –CO-NH-CH2-, integration = 132.0), 7.15-7.45 (m, 5H phenyl, integration =
5.0).
DPn = 79 sample: Yield = 127 mg (80%); 1H NMR (D2O): δ(ppm) 1.19 (integration = 3.8),
1.25-2.40 (integration = 239), 3.13 (integration = 153), 3.47 (integration = 160), 7.15-7.45
(integration = 5.0).
3.2.1.2.6 Synthesis of P(DTPA)
DTPA (3.5 g, ca. 80 equivalents to each polymeric amino group) and H2O (5 mL) were added
to a 100 mL round-bottom flask. Next, NaOH (5 M aq.) was added to dissolve the DTPA and
bring the solution pH to 8.5 (monitored with a pH meter). DMTMM (250 mg, ca. 8 equivalents
to each polymeric amino group) was dissolved in water (5 mL) with sonication and added
quickly with stirring to the first solution. This solution was given 5 minutes to pre-react. Then a
solution of the Amino Polymer (25 mg) in water (5 mL) was added quickly with stirring. The
reaction solution was stirred for 1 hour, then transferred to a 15 mL 3kDA MWCO Millipore
Amicon spin filter and washed with water (9 x 11 mL). Finally, the aqueous solution was freeze-
dried to yield P(DTPA)-Disulfide.; Yield = 52 mg (85%); 1H NMR (D2O): δ(ppm, integrated
peak areas reported based on C6H5 = 5H) 1.0-2.4 (b, 3H per monomer, backbone, integration =
187), 2.7-4.0 (broad m, 4H ethylenediamine and 18H DTPA per monomer, integration = 1400),

35
7.15 – 7.45 (broad t, 5H phenyl, integration = 5.0); SEC (Aqueous, relative to poly(methacrylic
acid) standards, RI) Mn = 36,800 Da, PDI = 1.18.
DPn = 79 sample: Yield = 56 mg (93%); 1H NMR (D2O): δ(ppm) 1.0-2.4 (integration =
225.4), 2.7-4.0 (integration = 1620), 7.15 – 7.45 (integration = 5.0); SEC (Aq., RI) Mn = 43,300
Da, PDI = 1.17.
3.2.1.2.7 Reduction of P(DTPA)-Disulfide with DTT Followed by Functionalization with a Bismaleimide Linker
I adapted the procedure described previously.5 All volumes of solution and quantities of
reagents scaled with the mass of polymer used in the reaction. Due to solution handling
difficulties, reactions using less than 10 mg polymer were nevertheless performed on the same
scale used for 10 mg polymer. A solution of DTT (dithiothreitol, 20 mM, 2.5 mL) was freshly
prepared in phosphate buffer (50 mM, pH 8.5). P(DTPA)-Disulfide was transferred to a 20 mL
scintillation vial and dissolved in 300 µL of this DTT solution. The vial threads were wrapped
with Teflon tape; the cap was secured, and the solution was stirred at 50 0C for one hour.
Immediately afterwards the polymer solution was diluted with acetate buffer (3.5 mL, 50 mM,
pH 3.0) and transferred to a 4 mL 3 kDA MWCO Millipore Amicon spin filter. The solution was
spun through the filter, after which the polymer was washed (3 x 4 mL) with aqueous acetic acid
(5 mM, pH = 3.5). Next, the resultant polymer solution (100 µL) was transferred to a 2 dram
vial and diluted to a total volume of 300 µL with phosphate buffer (200 mM, pH 7.0). In the
reaction trial with 50% DMF for the bismaleimide reaction, DMF (150 µL) was added to the
polymer solution. Next, a freshly prepared solution of 2,2'-(ethylenedioxy)bis(ethylmaleimide)
(10 mg) in DMF (150 uL) was quickly added with mixing to the polymer solution, and the
solution was stirred for 1 hr at room temperature. Directly after this, the solution was diluted
with water (2 mL), filtered through a Pall Acrodisc 13 mm syringe filter with 200 nm nylon
membrane into a new 4 mL 3 kDA MWCO Millipore Amicon spin filter, and washed with one of
three different wash procedures: (a) water (7 x 4 mL), (b) water, (3 x 4 mL), phosphate buffer
(200 mM, pH 7.00) (1 x 4 mL), and again water (3 x 4 mL), (c) phosphate buffer (200 mM, pH
7.00) (4 x 4 mL) and water (3 x 4 mL), or (d) water, (4 x 4 mL), phosphate buffer (200 mM, pH
7.00) (1 x 4 mL), and again water (4 x 4 mL). Finally, the aqueous solution was freeze-dried to
yield maleimide end-labeled DTPA polymer. Wash procedure (a), yield = 6.3 mg (63%); 1H
NMR (D2O): δ(ppm, integrated peak areas reported based on C6H5 = 5H) 1.0-2.4 (broad, 3H per
36
monomer, backbone, integration = 203), 2.7-4.0 (broad m, 4H ethylenediamine and 18H DTPA
per monomer, integration = 1580), 6.88 (s, 2H vinylic maleimide, integration = 1.84), 7.15 – 7.45
(broad peaks, 5H phenyl, integration = 5.0). SEC (Aqueous, relative to poly(methacrylic acid)
standards, RI) Mn = 22,500 Da, PDI = 1.15.
DPn = 79 sample. Wash procedure (a), yield = 14.3 mg (75%); 1H NMR (D2O): δ(ppm) 1.0-
2.4 (integration = 237), 2.7-4.0 (integration = 1830), 6.88 (integration = 1.66), 7.15 – 7.45
(integration = 5.0). SEC (Aq, RI) Mn = 26,100 Da, PDI = 1.17.
DPn = 79 sample. Wash procedure (a), second run, yield = 8.6 mg (72%); 1H NMR (D2O):
δ(ppm) 1.0-2.4 (integration = 244), 2.7-4.0 (integration = 1780), 6.88 (integration = 1.60), 7.15 –
7.45 (integration = 5.0). SEC (Aq, RI) Mn = 25,100 Da, PDI = 1.20.
DPn = 79 sample. Wash procedure (b), yield = 8.8 mg (73%); 1H NMR (D2O): δ(ppm) 1.0-
2.4 (integration = 260), 2.7-4.0 (integration = 1984), 6.88 (integration = 1.35), 7.15 – 7.45
(integration = 5.0). SEC (Aq, RI) Mn = 25,500 Da, PDI = 1.21.
DPn = 79 sample. Bismaleimide reaction with 50% DMF, wash procedure (d), yield = 6.5
mg (72%); 1H NMR (D2O): δ(ppm) 1.0-2.4 (integration = 262), 2.7-4.0 (integration = 1873),
6.88 (integration = 1.35), 7.15 – 7.45 (integration = 5.0). SEC (Aq, RI) Mn = 26,600 Da, PDI =
1.19.
DPn = 79 sample. Wash procedure (c), yield = 9.4 mg (78%); 1H NMR (D2O): δ(ppm) 1.0-
2.4 (integration = 246), 2.7-4.0 (integration = 1781), 5.90-5.97 and 6.30-6.37 (d, 2H hydrolyzed
maleimide, integration = ca. 0.16), 6.88 (integration = 1.18), 7.15 – 7.45 (integration = 5.0).
SEC (Aq, RI) Mn = 25,400 Da, PDI = 1.22.
3.2.2 Instrumentation and Characterization
3.2.2.1 Spectroscopic Determination of Thiol End-Groups
Thiol end-group functionality was determined spectrophotometrically by Isaac Herrera, using
4,4’-dithiodipyridine (4-DTP) as previously described.90,91 Briefly, P(DTPA)-Disulfide Polymers
(DPn = 67 and 79) were dissolved in D.I. water (1.1 mL) to a concentration lower than 1 mM.
Aliquots (40 µL) from each polymer solution were transferred to clean tubes and diluted with
phosphate buffer 8.0 (100 µL, 100mM) and 5% NaBH4 reagent (30 µL, dissolved in 1 M
NaOH). The samples were thoroughly mixed and incubated at 50 0C for 30 min. After this time,
the samples were acidified with 2.0 M HCl (45 µL) to quench excess NaBH4. The reduced

37
polymer samples were diluted with phosphate buffer 7.0 (500 µL, 100mM) and reacted with the
4-DTP reagent (50 µL, 2 mM). After 5 minutes, the absorbance for polymer solutions was
measured at 324 nm (Perkin Elmer Lambda 35 UV/VIS spectrometer). Measurements were
performed in triplicate to generate average and standard deviation values. In addition to the
polymer samples, blank samples were also measured. Blank samples contained all reagents
except for the polymer solution aliquots.
3.2.2.2 Isothermal Titration Calorimetry (ITC)
The lanthanide ion binding capacity of the DTPA-containing polymers was determined by
Isaac Herrera, using isothermal titration calorimetry using Gd3+ as a probe following an approach
slightly modified from that reported for characterizing DTPA groups attached to
polysaccharides.27,32 For this purpose, P(DTPA)-Disulfide (sample DPn = 79) was dissolved in
citrate buffer (100 mM, pH 5.5) to a concentration lower than 0.5 mM. Calorimetry titrations
were performed on a Microcal VP-ITC instrument (Microcal, Inc., Northampton, MA, USA).
The sample cell (1.40 mL) was filled with a solution of the analyte (e.g. polymer or DTPA) in
citrate buffer and the syringe (300 µL) was filled wih Gd3+ (5.0 mM) in citrate buffer (100 mM,
pH 5.5). For each titration, the samples were continuously stirred (400 rpm), while the titrant
was injected (5 to 10 µL) in the thermostated cell (25 ºC) with a 300 second delay between
injections and a 2 second data collection interval. Titrations were performed in triplicate for
statistical purposes, and the data was processed with OriginPro 7.0 software.
3.2.3 Biological Experiments
3.2.3.1 Antibody Labeling with Metal-Chelating Polymers
Metal-labeled antibodies were prepared by Dr. Olga Ornatsky, following the procedure
described in Chapter 2.
3.2.3.2 Metal Atoms per Antibody
The number of metal atoms carried by each antibody was determined quantitatively by Olga
Ornatsky, using a combination of UV/VIS spectroscopy and ICP-MS analysis. Goat anti-mouse
immunoglobulins (Pierce #31168) labeled with P(DTPA)-Maleimide (DPn = 79 sample)
chelating 159Tb were resuspended in Tris-buffered saline (25 mM, pH 7.4, 150 mM NaCl).
Protein concentration was measured using a Nanodrop ND-1000 UV/VIS spectrometer (Thermo

38
Fisher Scientific, USA). An aliquot of labeled antibody was diluted 1:100000 in 2% HCl, and
0.1 mL was analyzed by ICP-MS using an ELAN DRCPlusTM instrument (PerkinElmer SCIEX).
A 0.50 ppb terbium standard was prepared from 1 mg/mL PE Pure single-element standard
solution (PerkinElmer, Shelton, CT) and used for metal quantification in antibody samples. The
ICP-MS data quantify the number of terbium atoms per mL, and the Nanodrop determines the
number of antibody molecules per mL. Thus, the mean number of terbium atoms per antibody
molecule could be calculated. When combined with the ITC data that gave the number of
lanthanide ions per polymer chain, it was possible to calculate the number of polymer chains per
antibody.
3.2.3.3 11 Antibody Whole Cord Blood Analysis
Antibodies for a simultaneous 11-plex assay of whole cord blood were obtained from
BioLegend Inc. (San Diego, US). The sample of umbilical whole core blood was obtained from
the University Health Network, Toronto. Each of the 11 antibodies was labeled as described
above with P(DTPA)-Maleimide 79 following binding to the polymer of a different lanthanide
isotope (see Table 3-1) for each antibody. For cell staining all eleven antibodies were mixed
together at 10 mg/ml of each antibody in 1% BSA, and a titration series of 0.1, 1 and 10 mg/ml
antibody was prepared. Whole heparinized umbilical cord blood was treated with RBC lysis
buffer (BioLegend Inc., San Diego). The leukocytes were washed once with 5% BSA/PBS and
were stained with the 11 metal-tagged antibody cocktail. Washed cells were fixed in 3.7%
formaldehyde and counter-stained with an Ir-intercalator8 for nucleated cell identification.
Table 3-1. Antibodies Used for Whole Cord Blood Analysis and the Lanthanide Isotopes
Used to Label Them.
Antibody Isotope Antibody Isotope Antibody Isotope Antibody Isotope
CD33 141Pr CD8 146Nd CD11b 158Gd CD38 165Ho
CD4 142Nd CD3 152Sm CD45 159Tb CD15 170Er
CD16 144Nd CD20 156Gd CD14 162Dy
39
3.3 Results and Discussion
3.3.1 Polymer Synthesis
The synthesis of the metal-chelating polymers described in this chapter began with the RAFT
polymerization of a suitable backbone. I began by synthesizing poly(t-butyl acrylate)92 using di-
1-phenylethyl trithiocarbonate (CTA) as the RAFT agent. The degree of polymerization was
determined by 1H NMR end-group analysis in CD2Cl2; the spectrum of the DPn = 67 is presented
in Figure 3-1. In the next few pages of this chapter I present a more detailed discussion about the
trustworthiness of end-group analyses by 1H NMR. The symmetrical polymer, as a concentrated
(20 wt %) solution in THF, was treated in air with a small excess of aminoethanol (8.5 eq. per
symmetrical chain) with the idea that these conditions would aminolyze the trithiocarbonate
group and also promote spontaneous oxidation to the dimeric disulfide polymer.93,67 After this
treatment, no trace of the trithiocarbonate group could be detected in the SEC (THF)
chromatogram of the polymer monitored with a UV/VIS detector at 310 nm. Furthermore,
Refractive Index (RI) traces for the polymer samples before and after aminolysis suggest that
most of the polymer retained its dimeric length, consistent with the idea that the polymer was
oxidized to a disulfide linked dimer. The advantage of this approach is that the trithiocarbonate
group, which is susceptible to reaction with amines, is replaced by a disulfide linkage, which is
stable to the pendant groups transformations described below. SEC (THF) chromatograms of the
trithiocarbonate- and disulfide-linked polymers, using RI and UV/VIS (310 nm) detectors, are
presented in Figure 3-2.

40
Figure 3-1. 1H NMR Spectrum (CD2Cl2) of PtBA-Trithiocarbonate (DPn = 67). End-group analysis shows
the degree of polymerization to be 67.
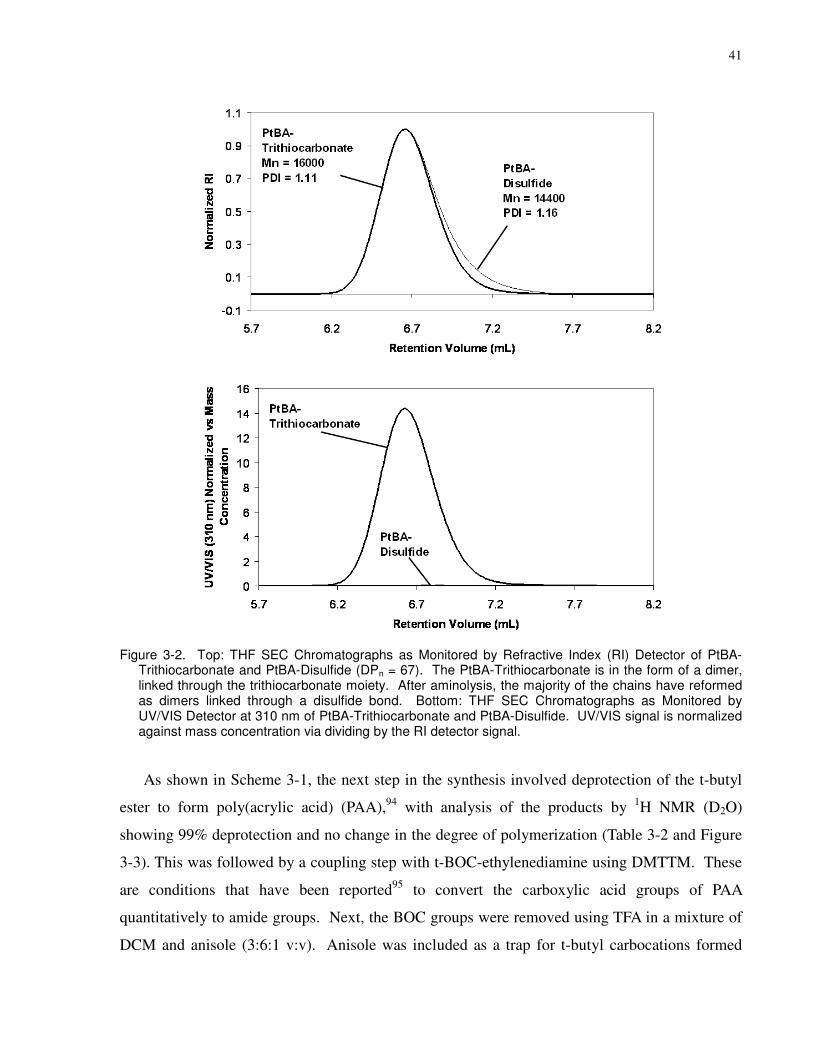
41
Figure 3-2. Top: THF SEC Chromatographs as Monitored by Refractive Index (RI) Detector of PtBA-Trithiocarbonate and PtBA-Disulfide (DPn = 67). The PtBA-Trithiocarbonate is in the form of a dimer, linked through the trithiocarbonate moiety. After aminolysis, the majority of the chains have reformed as dimers linked through a disulfide bond. Bottom: THF SEC Chromatographs as Monitored by UV/VIS Detector at 310 nm of PtBA-Trithiocarbonate and PtBA-Disulfide. UV/VIS signal is normalized against mass concentration via dividing by the RI detector signal.
As shown in Scheme 3-1, the next step in the synthesis involved deprotection of the t-butyl
ester to form poly(acrylic acid) (PAA),94 with analysis of the products by 1H NMR (D2O)
showing 99% deprotection and no change in the degree of polymerization (Table 3-2 and Figure
3-3). This was followed by a coupling step with t-BOC-ethylenediamine using DMTTM. These
are conditions that have been reported95 to convert the carboxylic acid groups of PAA
quantitatively to amide groups. Next, the BOC groups were removed using TFA in a mixture of
DCM and anisole (3:6:1 v:v). Anisole was included as a trap for t-butyl carbocations formed

42
from the deprotection of the Boc groups.96 1H NMR analysis of the resultant amino polymer
demonstrated quantitative acrylamide functionality, within NMR error. Figure 3-4 presents the
1H NMR (D2O) spectrum of the Amino Polymer (DPn = 67 sample), along with a description of
how acrylamide functionality was determined.
Figure 3-3. 1H NMR Spectrum (D2O) of PAA-Disulfide (DPn = 67). The degree of polymerization has not
changed relative to the PtBA sample, remaining at 67. T-butyl ester deprotection is largely complete; the peak at 1.46 ppm has an integration of 3, representing ~0.5% of initial t-butyl groups present before deprotection.
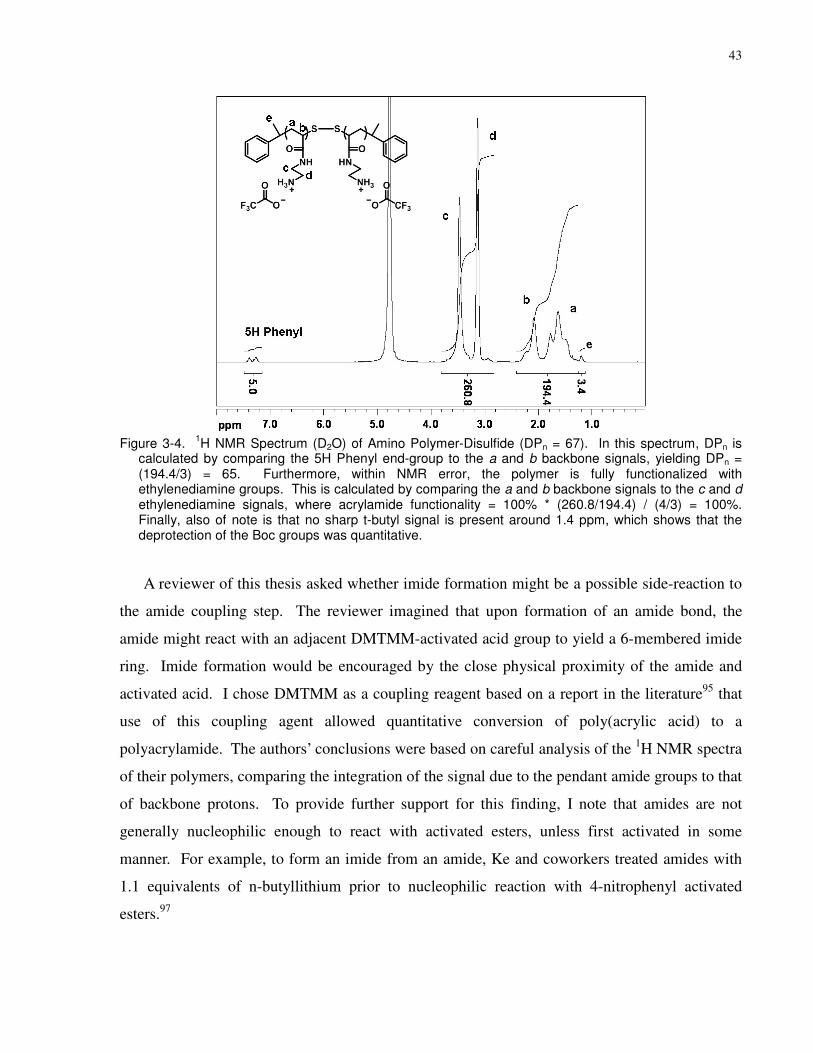
43
Figure 3-4. 1H NMR Spectrum (D2O) of Amino Polymer-Disulfide (DPn = 67). In this spectrum, DPn is
calculated by comparing the 5H Phenyl end-group to the a and b backbone signals, yielding DPn = (194.4/3) = 65. Furthermore, within NMR error, the polymer is fully functionalized with ethylenediamine groups. This is calculated by comparing the a and b backbone signals to the c and d ethylenediamine signals, where acrylamide functionality = 100% * (260.8/194.4) / (4/3) = 100%. Finally, also of note is that no sharp t-butyl signal is present around 1.4 ppm, which shows that the deprotection of the Boc groups was quantitative.
A reviewer of this thesis asked whether imide formation might be a possible side-reaction to
the amide coupling step. The reviewer imagined that upon formation of an amide bond, the
amide might react with an adjacent DMTMM-activated acid group to yield a 6-membered imide
ring. Imide formation would be encouraged by the close physical proximity of the amide and
activated acid. I chose DMTMM as a coupling reagent based on a report in the literature95 that
use of this coupling agent allowed quantitative conversion of poly(acrylic acid) to a
polyacrylamide. The authors’ conclusions were based on careful analysis of the 1H NMR spectra
of their polymers, comparing the integration of the signal due to the pendant amide groups to that
of backbone protons. To provide further support for this finding, I note that amides are not
generally nucleophilic enough to react with activated esters, unless first activated in some
manner. For example, to form an imide from an amide, Ke and coworkers treated amides with
1.1 equivalents of n-butyllithium prior to nucleophilic reaction with 4-nitrophenyl activated
esters.97
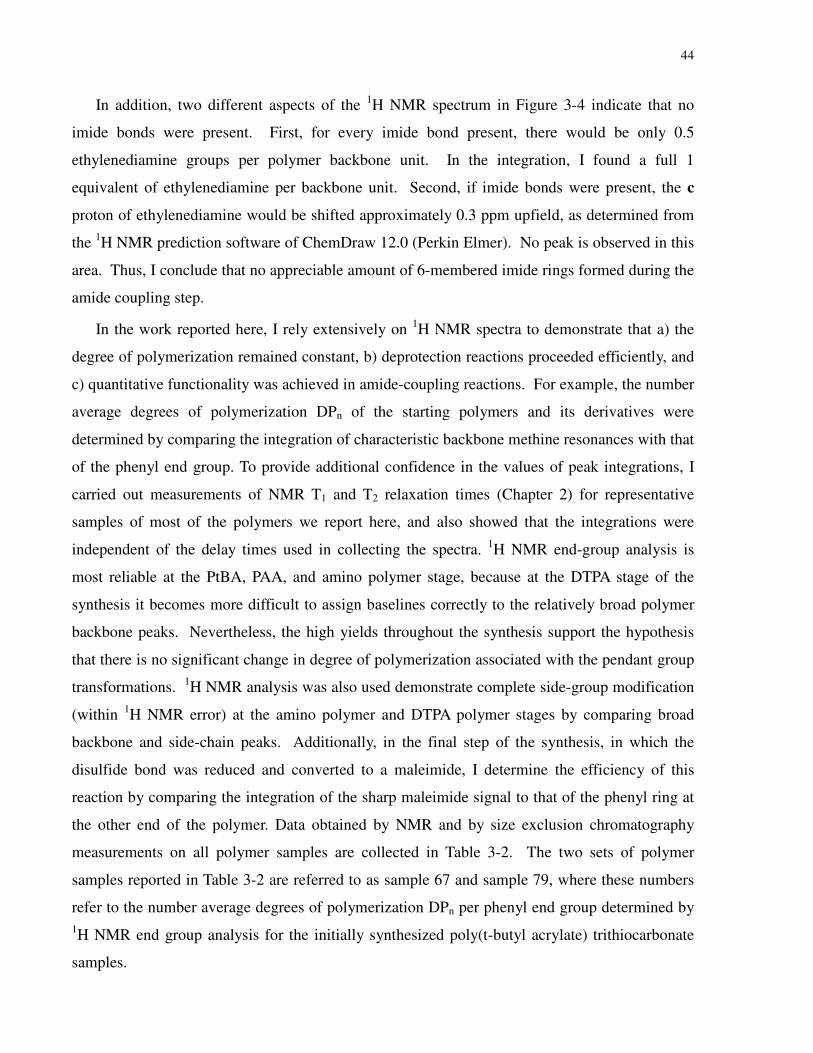
44
In addition, two different aspects of the 1H NMR spectrum in Figure 3-4 indicate that no
imide bonds were present. First, for every imide bond present, there would be only 0.5
ethylenediamine groups per polymer backbone unit. In the integration, I found a full 1
equivalent of ethylenediamine per backbone unit. Second, if imide bonds were present, the c
proton of ethylenediamine would be shifted approximately 0.3 ppm upfield, as determined from
the 1H NMR prediction software of ChemDraw 12.0 (Perkin Elmer). No peak is observed in this
area. Thus, I conclude that no appreciable amount of 6-membered imide rings formed during the
amide coupling step.
In the work reported here, I rely extensively on 1H NMR spectra to demonstrate that a) the
degree of polymerization remained constant, b) deprotection reactions proceeded efficiently, and
c) quantitative functionality was achieved in amide-coupling reactions. For example, the number
average degrees of polymerization DPn of the starting polymers and its derivatives were
determined by comparing the integration of characteristic backbone methine resonances with that
of the phenyl end group. To provide additional confidence in the values of peak integrations, I
carried out measurements of NMR T1 and T2 relaxation times (Chapter 2) for representative
samples of most of the polymers we report here, and also showed that the integrations were
independent of the delay times used in collecting the spectra. 1H NMR end-group analysis is
most reliable at the PtBA, PAA, and amino polymer stage, because at the DTPA stage of the
synthesis it becomes more difficult to assign baselines correctly to the relatively broad polymer
backbone peaks. Nevertheless, the high yields throughout the synthesis support the hypothesis
that there is no significant change in degree of polymerization associated with the pendant group
transformations. 1H NMR analysis was also used demonstrate complete side-group modification
(within 1H NMR error) at the amino polymer and DTPA polymer stages by comparing broad
backbone and side-chain peaks. Additionally, in the final step of the synthesis, in which the
disulfide bond was reduced and converted to a maleimide, I determine the efficiency of this
reaction by comparing the integration of the sharp maleimide signal to that of the phenyl ring at
the other end of the polymer. Data obtained by NMR and by size exclusion chromatography
measurements on all polymer samples are collected in Table 3-2. The two sets of polymer
samples reported in Table 3-2 are referred to as sample 67 and sample 79, where these numbers
refer to the number average degrees of polymerization DPn per phenyl end group determined by
1H NMR end group analysis for the initially synthesized poly(t-butyl acrylate) trithiocarbonate
samples.
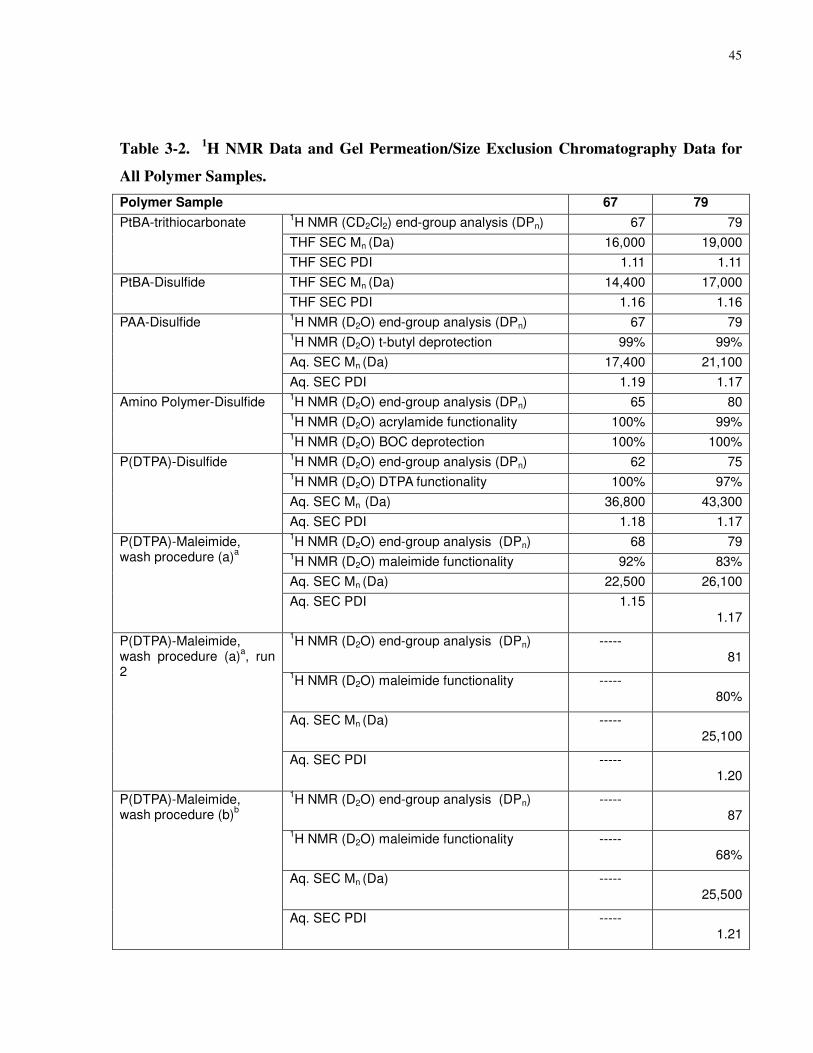
45
Table 3-2. 1H NMR Data and Gel Permeation/Size Exclusion Chromatography Data for
All Polymer Samples.
Polymer Sample 67 79 1H NMR (CD2Cl2) end-group analysis (DPn) 67 79
THF SEC Mn (Da) 16,000 19,000
PtBA-trithiocarbonate
THF SEC PDI 1.11 1.11
THF SEC Mn (Da) 14,400 17,000 PtBA-Disulfide
THF SEC PDI 1.16 1.16 1H NMR (D2O) end-group analysis (DPn) 67 79
1H NMR (D2O) t-butyl deprotection 99% 99%
Aq. SEC Mn (Da) 17,400 21,100
PAA-Disulfide
Aq. SEC PDI 1.19 1.17 1H NMR (D2O) end-group analysis (DPn) 65 80
1H NMR (D2O) acrylamide functionality 100% 99%
Amino Polymer-Disulfide
1H NMR (D2O) BOC deprotection 100% 100%
1H NMR (D2O) end-group analysis (DPn) 62 75
1H NMR (D2O) DTPA functionality 100% 97%
Aq. SEC Mn (Da) 36,800 43,300
P(DTPA)-Disulfide
Aq. SEC PDI 1.18 1.17 1H NMR (D2O) end-group analysis (DPn) 68 79
1H NMR (D2O) maleimide functionality 92% 83%
Aq. SEC Mn (Da) 22,500 26,100
P(DTPA)-Maleimide, wash procedure (a)
a
Aq. SEC PDI 1.15
1.17
1H NMR (D2O) end-group analysis (DPn) -----
81
1H NMR (D2O) maleimide functionality -----
80%
Aq. SEC Mn (Da) -----
25,100
P(DTPA)-Maleimide, wash procedure (a)
a, run
2
Aq. SEC PDI -----
1.20
1H NMR (D2O) end-group analysis (DPn) -----
87
1H NMR (D2O) maleimide functionality -----
68%
Aq. SEC Mn (Da) -----
25,500
P(DTPA)-Maleimide, wash procedure (b)
b
Aq. SEC PDI -----
1.21
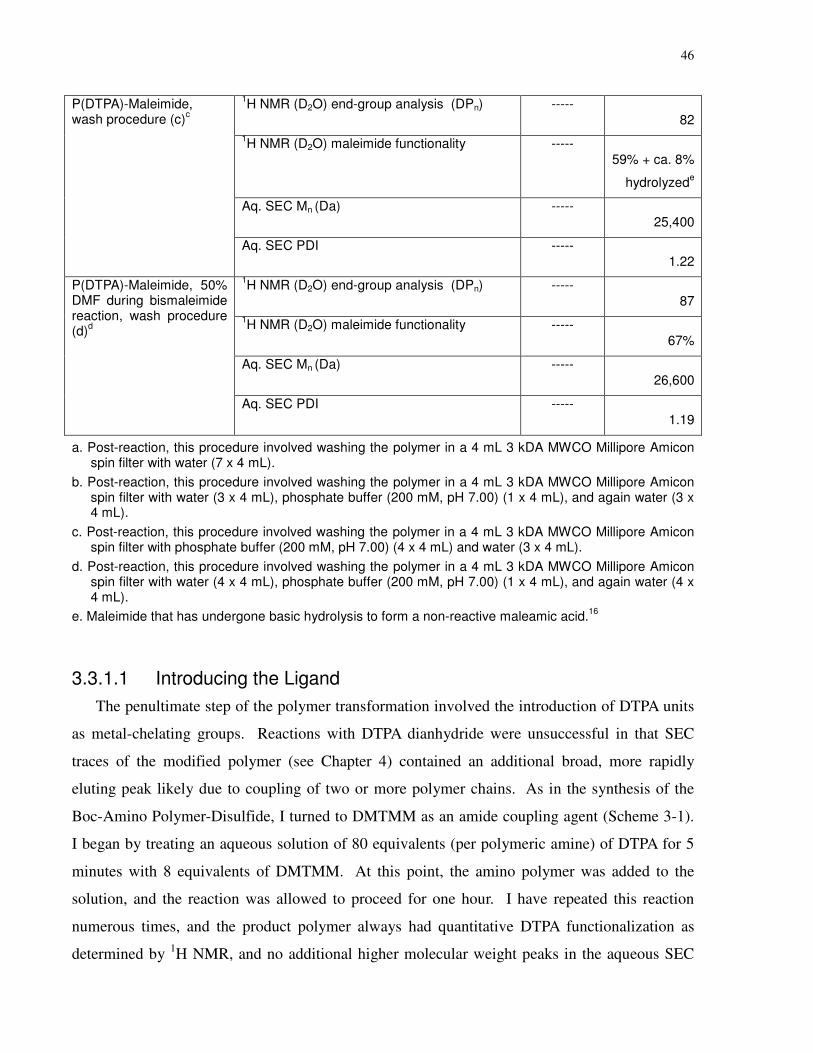
46
1H NMR (D2O) end-group analysis (DPn) -----
82
1H NMR (D2O) maleimide functionality -----
59% + ca. 8%
hydrolyzede
Aq. SEC Mn (Da) -----
25,400
P(DTPA)-Maleimide, wash procedure (c)
c
Aq. SEC PDI -----
1.22
1H NMR (D2O) end-group analysis (DPn) -----
87
1H NMR (D2O) maleimide functionality -----
67%
Aq. SEC Mn (Da) -----
26,600
P(DTPA)-Maleimide, 50% DMF during bismaleimide reaction, wash procedure (d)
d
Aq. SEC PDI -----
1.19
a. Post-reaction, this procedure involved washing the polymer in a 4 mL 3 kDA MWCO Millipore Amicon spin filter with water (7 x 4 mL).
b. Post-reaction, this procedure involved washing the polymer in a 4 mL 3 kDA MWCO Millipore Amicon spin filter with water (3 x 4 mL), phosphate buffer (200 mM, pH 7.00) (1 x 4 mL), and again water (3 x 4 mL).
c. Post-reaction, this procedure involved washing the polymer in a 4 mL 3 kDA MWCO Millipore Amicon spin filter with phosphate buffer (200 mM, pH 7.00) (4 x 4 mL) and water (3 x 4 mL).
d. Post-reaction, this procedure involved washing the polymer in a 4 mL 3 kDA MWCO Millipore Amicon spin filter with water (4 x 4 mL), phosphate buffer (200 mM, pH 7.00) (1 x 4 mL), and again water (4 x 4 mL).
e. Maleimide that has undergone basic hydrolysis to form a non-reactive maleamic acid.16
3.3.1.1 Introducing the Ligand
The penultimate step of the polymer transformation involved the introduction of DTPA units
as metal-chelating groups. Reactions with DTPA dianhydride were unsuccessful in that SEC
traces of the modified polymer (see Chapter 4) contained an additional broad, more rapidly
eluting peak likely due to coupling of two or more polymer chains. As in the synthesis of the
Boc-Amino Polymer-Disulfide, I turned to DMTMM as an amide coupling agent (Scheme 3-1).
I began by treating an aqueous solution of 80 equivalents (per polymeric amine) of DTPA for 5
minutes with 8 equivalents of DMTMM. At this point, the amino polymer was added to the
solution, and the reaction was allowed to proceed for one hour. I have repeated this reaction
numerous times, and the product polymer always had quantitative DTPA functionalization as
determined by 1H NMR, and no additional higher molecular weight peaks in the aqueous SEC
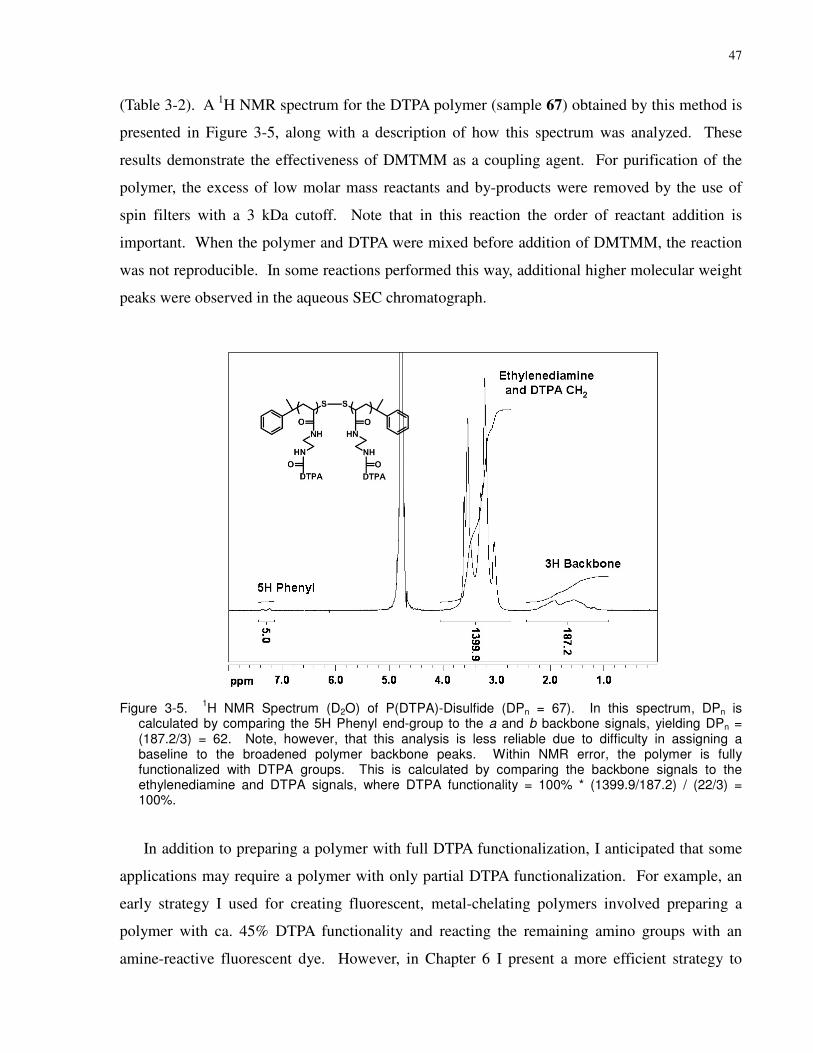
47
(Table 3-2). A 1H NMR spectrum for the DTPA polymer (sample 67) obtained by this method is
presented in Figure 3-5, along with a description of how this spectrum was analyzed. These
results demonstrate the effectiveness of DMTMM as a coupling agent. For purification of the
polymer, the excess of low molar mass reactants and by-products were removed by the use of
spin filters with a 3 kDa cutoff. Note that in this reaction the order of reactant addition is
important. When the polymer and DTPA were mixed before addition of DMTMM, the reaction
was not reproducible. In some reactions performed this way, additional higher molecular weight
peaks were observed in the aqueous SEC chromatograph.
Figure 3-5. 1H NMR Spectrum (D2O) of P(DTPA)-Disulfide (DPn = 67). In this spectrum, DPn is
calculated by comparing the 5H Phenyl end-group to the a and b backbone signals, yielding DPn = (187.2/3) = 62. Note, however, that this analysis is less reliable due to difficulty in assigning a baseline to the broadened polymer backbone peaks. Within NMR error, the polymer is fully functionalized with DTPA groups. This is calculated by comparing the backbone signals to the ethylenediamine and DTPA signals, where DTPA functionality = 100% * (1399.9/187.2) / (22/3) = 100%.
In addition to preparing a polymer with full DTPA functionalization, I anticipated that some
applications may require a polymer with only partial DTPA functionalization. For example, an
early strategy I used for creating fluorescent, metal-chelating polymers involved preparing a
polymer with ca. 45% DTPA functionality and reacting the remaining amino groups with an
amine-reactive fluorescent dye. However, in Chapter 6 I present a more efficient strategy to
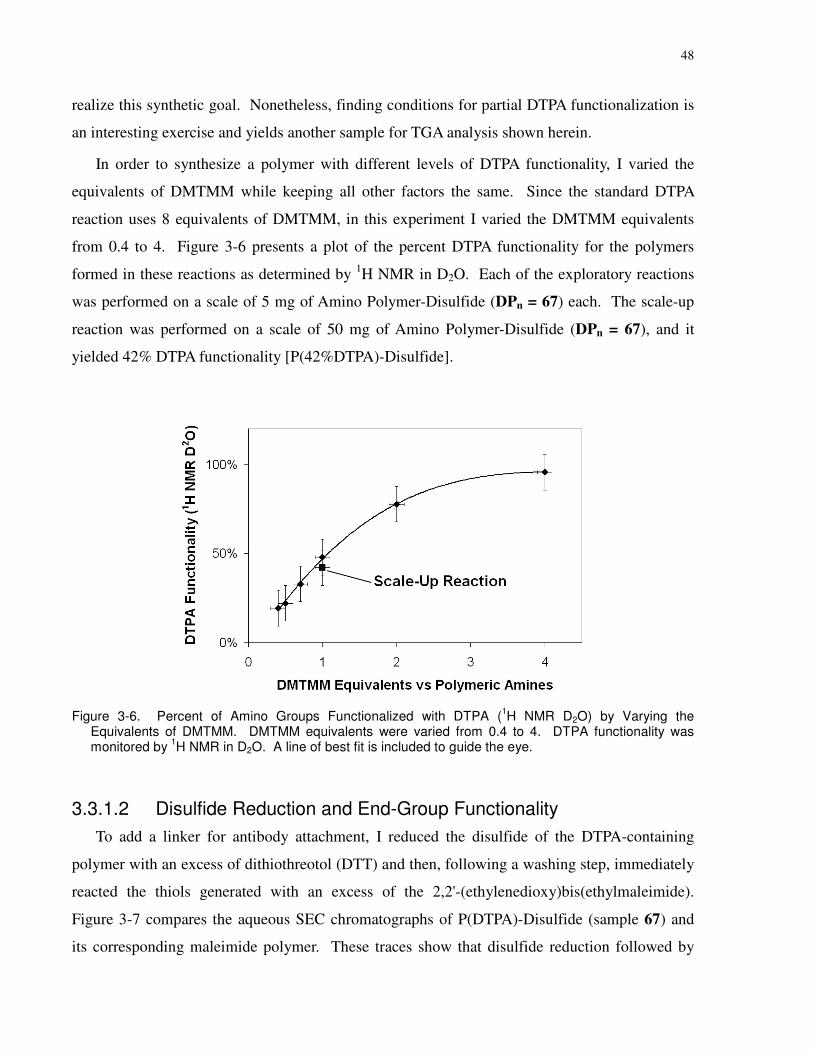
48
realize this synthetic goal. Nonetheless, finding conditions for partial DTPA functionalization is
an interesting exercise and yields another sample for TGA analysis shown herein.
In order to synthesize a polymer with different levels of DTPA functionality, I varied the
equivalents of DMTMM while keeping all other factors the same. Since the standard DTPA
reaction uses 8 equivalents of DMTMM, in this experiment I varied the DMTMM equivalents
from 0.4 to 4. Figure 3-6 presents a plot of the percent DTPA functionality for the polymers
formed in these reactions as determined by 1H NMR in D2O. Each of the exploratory reactions
was performed on a scale of 5 mg of Amino Polymer-Disulfide (DPn = 67) each. The scale-up
reaction was performed on a scale of 50 mg of Amino Polymer-Disulfide (DPn = 67), and it
yielded 42% DTPA functionality [P(42%DTPA)-Disulfide].
Figure 3-6. Percent of Amino Groups Functionalized with DTPA (1H NMR D2O) by Varying the
Equivalents of DMTMM. DMTMM equivalents were varied from 0.4 to 4. DTPA functionality was monitored by
1H NMR in D2O. A line of best fit is included to guide the eye.
3.3.1.2 Disulfide Reduction and End-Group Functionality
To add a linker for antibody attachment, I reduced the disulfide of the DTPA-containing
polymer with an excess of dithiothreotol (DTT) and then, following a washing step, immediately
reacted the thiols generated with an excess of the 2,2'-(ethylenedioxy)bis(ethylmaleimide).
Figure 3-7 compares the aqueous SEC chromatographs of P(DTPA)-Disulfide (sample 67) and
its corresponding maleimide polymer. These traces show that disulfide reduction followed by

49
bismaleimide addition, resulted, as expected, in a transformation from a dimeric polymer to a
unimer. The protons on the double bond of the maleimide provide a signal at 6.88 ppm that can
be used for quantifying the reactive end-group content of the polymer. An example is shown in
the spectrum in Figure 3-8 for the polymer sample 67. Comparison of the integration of the 2H
maleimide vinylic signal at 6.9 ppm to that of the pair of peaks at 7 – 7.4 ppm due to the 5H
phenyl end group indicates that 92% of the chains contain a terminal maleimide.
Figure 3-7. Aqueous SEC Chromatographs of P(DTPA)-Disulfide and P(DTPA)-Maleimide (DPn = 67). The initial DTPA polymer is in the form of a polymeric disulfide. After reduction with DTT and reaction with the bismaleimide linker, the polymers are in their final unimeric form with a maleimide end group. Before reaction Mn = 36,800 Da (PDI = 1.18), and after reaction Mn = 22,500 Da (PDI = 1.15).

50
Figure 3-8. Partial 1H NMR Spectrum (D2O) of P(DTPA)-Maleimide (DPn = 67). Comparing the 5H
phenyl end-group with the 2H vinylic protons of the maleimide linker shows end-functionalization =
(1.84/2) × 100% = 92%.
Scheme 3-1: Synthesis of Metal-Chelating Polymers. AMBN = 2,2'-azobis(2-methylbutyronitrile), THF = tetrahydrofuran, DCM = dichloromethane, TFA = trifluoroacetic acid, DTT = dithiothreitol, PB =
phosphate buffer, DMF = dimethylformamide. n ≈ 67 or 79.
51
The above results are apparently excellent. However, I found unexpected results with further
trials of this reaction. When the same bismaleimide reaction was performed for samples of the
79 polymer, end-functionalities of 80% - 83% were obtained. While lower, this level of end-
functionality is still comparable with the sample 67 polymer result. However, I obtained a
poorer result when I repeated the sample 79 polymer reaction with one or four of the water
washes replaced with phosphate buffer washes. In these experiments, the end-functionality was
68% and 59%, respectively.
There are two reasons why using phosphate buffer washes can yield a lower end-
functionality. The first is tied to the strongly anionic character of the DTPA polymer. In a
previous, unrelated experiment, a DTPA polymer was incubated in an aqueous buffer of 4-
methoxybenzylamine/4-methoxybenzylammonium chloride. On purifying the polymer in a spin
filter with water washes, I found that the 1H NMR spectrum showed 1.7 equivalents of 4-
methoxybenzylammonium per DTPA unit. On further washing in a spin filter with phosphate
buffer washes, I found that the 4-methoxybenzylammonium signals had disappeared from the 1H
NMR spectrum. The organic amine had been replaced by sodium counter-ions. This evidence
shows that the DTPA polymer electrostatically retains cations despite water washes in a spin
filter. Similarly, Plamper and coworkers found that specific cationic counter-ions are not
removed from poly(acrylic acid) by dialysis against water.94 I suspect that ca. 12% of the
maleimide signal for reactions performed with wash procedure (a) is actually due to maleimide
that is electrostatically, not chemically, associated with the polymer.
One explanation for this effect is that the bismaleimide molecule was contaminated with O-
(2-aminoethyl)-O′-(2-maleimidoethyl)ethylene glycol, the analogue of the bismaleimide
molecule with one amino and one maleimide group. However, the ESI mass spectrum of the
bismaleimide molecule did not show this species. A more likely explanation is that the strongly
anionic DTPA polymer protonated a very small number of maleimide groups. Lazarova and
coworkers report that maleimide groups can become protonated at low pH.98 Once protonated,
the bismaleimide molecule will remain with the polymer until a phosphate buffer wash is used to
displace it with a sodium ion.
The second reason that phosphate buffer washes might yield lower bismaleimide
functionality is due to buffer-catalyzed hydrolysis of the maleimide group. In comparing wash
procedures (b) and (c), both yield similar amounts of total maleimide, but for procedure (c), ca.

52
8% of this total is hydrolyzed. The formation of this maleamic acid is undesirable because it is
non-reactive to Michael addition of thiols.16 There is precedence for this phenomenon in the
literature, as even in neutral pH, phosphate buffer is known to promote the decomposition of
maleimides.99 Thus it is beneficial to limit the amount of time the maleimide-end-labeled
polymer is exposed to buffer, and to use a buffer of lower concentration as well.
Results presented at the end of this chapter show that sample 79 P(DTPA)-Maleimide (wash
procedure (a)) works well in bioassays, even though only 2/3 of the polymer chains have
maleimide end-functionality. A separate question, however, is whether this problem with end-
functionality yield is due to a problem with the precursor P(DTPA)-Disulfide or simply a
limitation of the bismaleimide reaction. To answer this question a number of other experiments
bear mentioning. In Chapter 5, I present the synthesis of polymers with pendant EDTA, DTPA,
TTHA, and DOTA ligands. The P(EDTA) and P(TTHA) samples show 89% and 74%
bismaleimide functionality, respectively, using the wash procedure (b). The P(TTHA) result is
similar to that of P(DTPA), but the P(EDTA) result is excellent. In addition, all four polymers
were quantitatively end-labeled with N-(5-fluoresceinyl)maleimide, as characterized by a
combination of UV/VIS and TGA. These results indicate that the disulfide polymers do have
high end-functionality.
Given these results, I was curious as to why the Michael addition goes to completion with N-
(5-fluoresceinyl)maleimide, but only goes to ca. 68% with 2,2'-(ethylenedioxy)bis-
(ethylmaleimide). An important consideration is solubility of the maleimide reagent. For both
reactions, the maleimide reagent was dissolved in DMF and then added to the aqueous polymer
solution. For the reaction with 2,2'-(ethylenedioxy)bis(ethylmaleimide), unfortunately, a visually
significant amount of bismaleimide precipitated a few minutes after addition. This reaction
utilized a 2:1 aqueous:DMF mixture. I hypothesized that a higher proportion of DMF would
improve solubility of the bismaleimide; thus I repeated this reaction with a 1:1 aqueous:DMF
mixture. During this reaction no precipitation of the bismaleimide reagent was observed.
Unfortunately, the maleimide functionality of the product polymer was 67%, which was no
improvement over the previous result. This result indicates that solubility of the maleimide
reagent is not the only important consideration.
Another contributing factor may be the mechanism and kinetics of the reaction. Thiolate
addition to an α,β-unsaturated olefin proceeds by a concerted mechanism, in which S-C bond
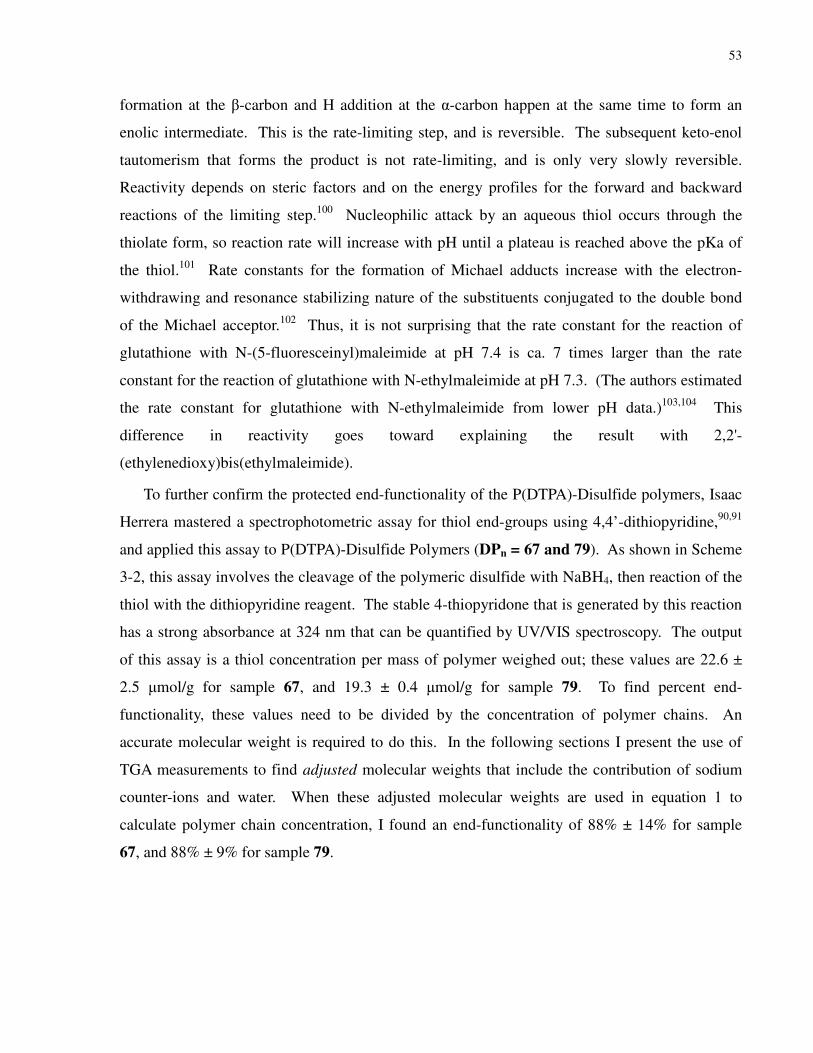
53
formation at the β-carbon and H addition at the α-carbon happen at the same time to form an
enolic intermediate. This is the rate-limiting step, and is reversible. The subsequent keto-enol
tautomerism that forms the product is not rate-limiting, and is only very slowly reversible.
Reactivity depends on steric factors and on the energy profiles for the forward and backward
reactions of the limiting step.100 Nucleophilic attack by an aqueous thiol occurs through the
thiolate form, so reaction rate will increase with pH until a plateau is reached above the pKa of
the thiol.101 Rate constants for the formation of Michael adducts increase with the electron-
withdrawing and resonance stabilizing nature of the substituents conjugated to the double bond
of the Michael acceptor.102 Thus, it is not surprising that the rate constant for the reaction of
glutathione with N-(5-fluoresceinyl)maleimide at pH 7.4 is ca. 7 times larger than the rate
constant for the reaction of glutathione with N-ethylmaleimide at pH 7.3. (The authors estimated
the rate constant for glutathione with N-ethylmaleimide from lower pH data.)103,104 This
difference in reactivity goes toward explaining the result with 2,2'-
(ethylenedioxy)bis(ethylmaleimide).
To further confirm the protected end-functionality of the P(DTPA)-Disulfide polymers, Isaac
Herrera mastered a spectrophotometric assay for thiol end-groups using 4,4’-dithiopyridine,90,91
and applied this assay to P(DTPA)-Disulfide Polymers (DPn = 67 and 79). As shown in Scheme
3-2, this assay involves the cleavage of the polymeric disulfide with NaBH4, then reaction of the
thiol with the dithiopyridine reagent. The stable 4-thiopyridone that is generated by this reaction
has a strong absorbance at 324 nm that can be quantified by UV/VIS spectroscopy. The output
of this assay is a thiol concentration per mass of polymer weighed out; these values are 22.6 ±
2.5 µmol/g for sample 67, and 19.3 ± 0.4 µmol/g for sample 79. To find percent end-
functionality, these values need to be divided by the concentration of polymer chains. An
accurate molecular weight is required to do this. In the following sections I present the use of
TGA measurements to find adjusted molecular weights that include the contribution of sodium
counter-ions and water. When these adjusted molecular weights are used in equation 1 to
calculate polymer chain concentration, I found an end-functionality of 88% ± 14% for sample
67, and 88% ± 9% for sample 79.
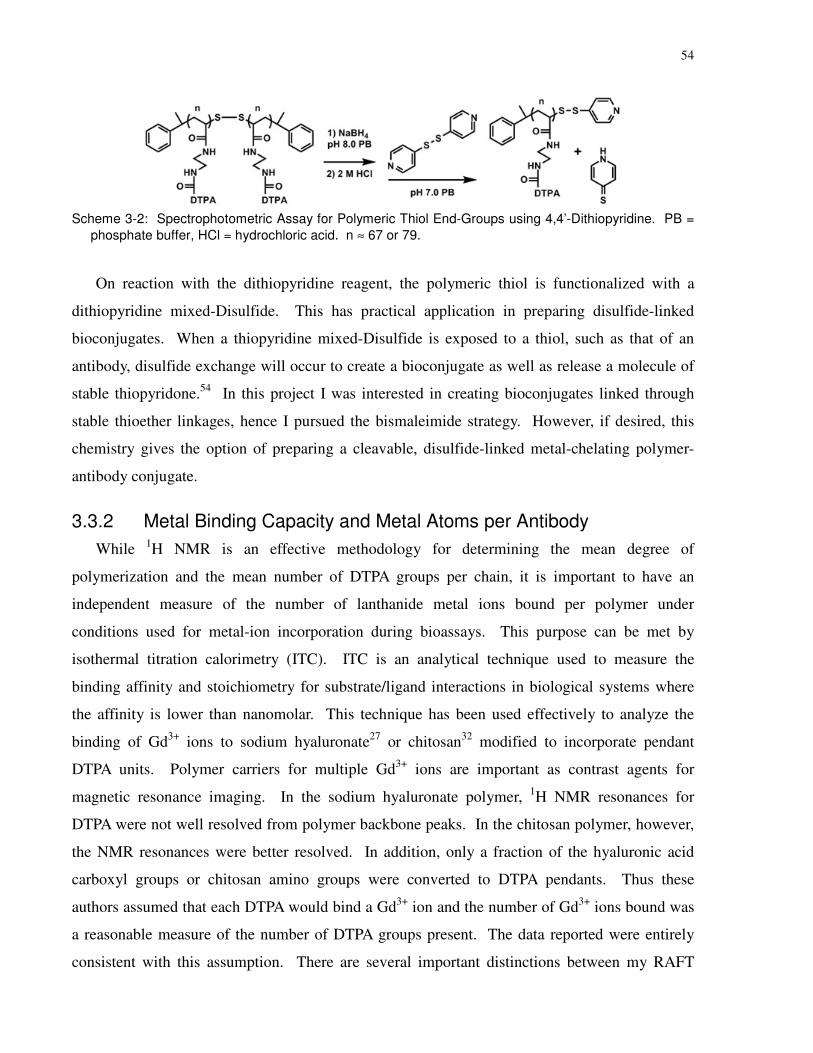
54
Scheme 3-2: Spectrophotometric Assay for Polymeric Thiol End-Groups using 4,4’-Dithiopyridine. PB =
phosphate buffer, HCl = hydrochloric acid. n ≈ 67 or 79.
On reaction with the dithiopyridine reagent, the polymeric thiol is functionalized with a
dithiopyridine mixed-Disulfide. This has practical application in preparing disulfide-linked
bioconjugates. When a thiopyridine mixed-Disulfide is exposed to a thiol, such as that of an
antibody, disulfide exchange will occur to create a bioconjugate as well as release a molecule of
stable thiopyridone.54 In this project I was interested in creating bioconjugates linked through
stable thioether linkages, hence I pursued the bismaleimide strategy. However, if desired, this
chemistry gives the option of preparing a cleavable, disulfide-linked metal-chelating polymer-
antibody conjugate.
3.3.2 Metal Binding Capacity and Metal Atoms per Antibody
While 1H NMR is an effective methodology for determining the mean degree of
polymerization and the mean number of DTPA groups per chain, it is important to have an
independent measure of the number of lanthanide metal ions bound per polymer under
conditions used for metal-ion incorporation during bioassays. This purpose can be met by
isothermal titration calorimetry (ITC). ITC is an analytical technique used to measure the
binding affinity and stoichiometry for substrate/ligand interactions in biological systems where
the affinity is lower than nanomolar. This technique has been used effectively to analyze the
binding of Gd3+ ions to sodium hyaluronate27 or chitosan32 modified to incorporate pendant
DTPA units. Polymer carriers for multiple Gd3+ ions are important as contrast agents for
magnetic resonance imaging. In the sodium hyaluronate polymer, 1H NMR resonances for
DTPA were not well resolved from polymer backbone peaks. In the chitosan polymer, however,
the NMR resonances were better resolved. In addition, only a fraction of the hyaluronic acid
carboxyl groups or chitosan amino groups were converted to DTPA pendants. Thus these
authors assumed that each DTPA would bind a Gd3+ ion and the number of Gd3+ ions bound was
a reasonable measure of the number of DTPA groups present. The data reported were entirely
consistent with this assumption. There are several important distinctions between my RAFT
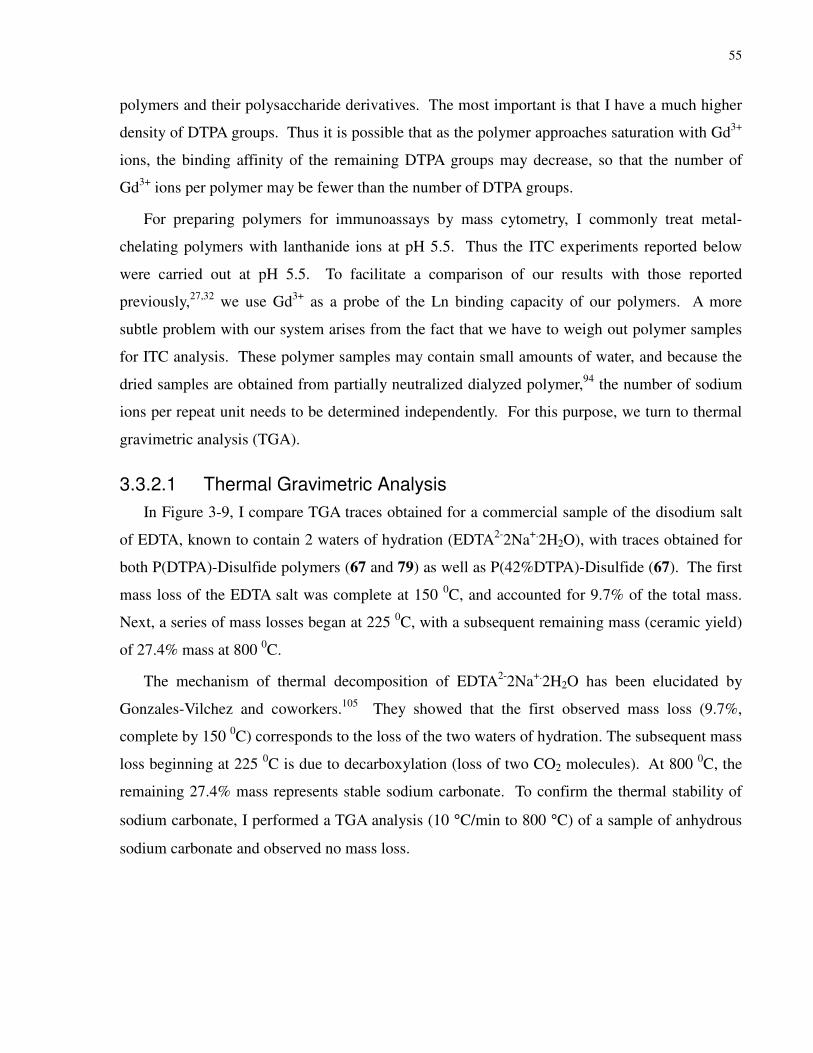
55
polymers and their polysaccharide derivatives. The most important is that I have a much higher
density of DTPA groups. Thus it is possible that as the polymer approaches saturation with Gd3+
ions, the binding affinity of the remaining DTPA groups may decrease, so that the number of
Gd3+ ions per polymer may be fewer than the number of DTPA groups.
For preparing polymers for immunoassays by mass cytometry, I commonly treat metal-
chelating polymers with lanthanide ions at pH 5.5. Thus the ITC experiments reported below
were carried out at pH 5.5. To facilitate a comparison of our results with those reported
previously,27,32 we use Gd3+ as a probe of the Ln binding capacity of our polymers. A more
subtle problem with our system arises from the fact that we have to weigh out polymer samples
for ITC analysis. These polymer samples may contain small amounts of water, and because the
dried samples are obtained from partially neutralized dialyzed polymer,94 the number of sodium
ions per repeat unit needs to be determined independently. For this purpose, we turn to thermal
gravimetric analysis (TGA).
3.3.2.1 Thermal Gravimetric Analysis
In Figure 3-9, I compare TGA traces obtained for a commercial sample of the disodium salt
of EDTA, known to contain 2 waters of hydration (EDTA2-2Na+.2H2O), with traces obtained for
both P(DTPA)-Disulfide polymers (67 and 79) as well as P(42%DTPA)-Disulfide (67). The first
mass loss of the EDTA salt was complete at 150 0C, and accounted for 9.7% of the total mass.
Next, a series of mass losses began at 225 0C, with a subsequent remaining mass (ceramic yield)
of 27.4% mass at 800 0C.
The mechanism of thermal decomposition of EDTA2-2Na+.2H2O has been elucidated by
Gonzales-Vilchez and coworkers.105 They showed that the first observed mass loss (9.7%,
complete by 150 0C) corresponds to the loss of the two waters of hydration. The subsequent mass
loss beginning at 225 0C is due to decarboxylation (loss of two CO2 molecules). At 800 0C, the
remaining 27.4% mass represents stable sodium carbonate. To confirm the thermal stability of
sodium carbonate, I performed a TGA analysis (10 °C/min to 800 °C) of a sample of anhydrous
sodium carbonate and observed no mass loss.
56
Figure 3-9. TGA Traces of EDTA2-
2Na+.
H2O, P(DTPA)-Disulfide Polymers (67 and 79), and P(42%DTPA)-Disulfide (67). These TGA traces were collected in the presence of air at a heating rate of 1
0C/min.
The corresponding polymer traces in Figure 3-9 show much broader transitions. Some water
molecules in these non-crystalline polymer samples will be bound less tightly than the waters of
hydration in the EDTA crystals, and it is likely that the higher density of –COOH groups leads to
a lower onset temperature for decarboxylation. Thus only a fraction of the mass loss up to 200
°C is due to possible moisture content. The fact that both 100% DTPA polymer samples
obtained from freeze-drying gave near identical traces also suggests that the moisture content in
these samples is small. In my view, if the samples were highly hygroscopic, the amount of
moisture they contained would vary with small differences in handling or delays between the
freeze-drying and the TGA measurements. My initial assumption in the data analysis is that the
ca. 5% mass loss up to 150 °C is due to loss of moisture. At 800 0C, the samples had ceramic
yields of 21.2% (sample 67), 20.7% (sample 79), and 8.1% (sample 67, 42% DTPA) which we
assign to the formation of Na2CO3.
To proceed with my analysis, I make three distinct assumptions about water content of the
samples: (i) no significant moisture, (ii) water loss complete by 150 °C, corresponding to the
behavior seen for the EDTA salt, and (iii) mass loss to 200 °C due only to moisture. The values
calculated with these assumptions for sodium ion content of the polymer and the corresponding
polymer molecular weights are collected in Table 3-3. In compiling this table, I calculate
molecular weights (Mn) for the P(DTPA)-Disulfide polymer, based upon DPn = 67 and 79,
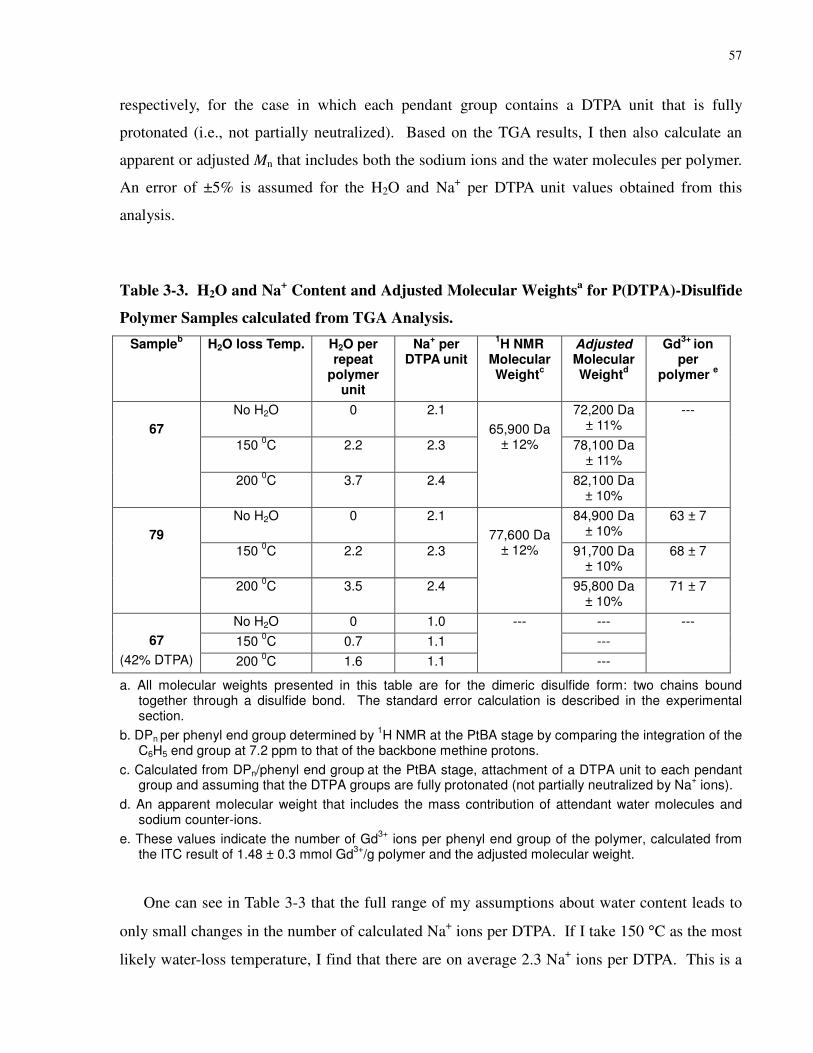
57
respectively, for the case in which each pendant group contains a DTPA unit that is fully
protonated (i.e., not partially neutralized). Based on the TGA results, I then also calculate an
apparent or adjusted Mn that includes both the sodium ions and the water molecules per polymer.
An error of ±5% is assumed for the H2O and Na+ per DTPA unit values obtained from this
analysis.
Table 3-3. H2O and Na+ Content and Adjusted Molecular Weights
a for P(DTPA)-Disulfide
Polymer Samples calculated from TGA Analysis.
Sampleb H2O loss Temp. H2O per
repeat polymer
unit
Na+ per
DTPA unit
1H NMR
Molecular Weight
c
Adjusted Molecular Weight
d
Gd3+
ion per
polymer e
No H2O 0 2.1 72,200 Da ± 11%
150 0C 2.2 2.3 78,100 Da
± 11%
67
200 0C 3.7 2.4
65,900 Da ± 12%
82,100 Da ± 10%
---
No H2O 0 2.1 84,900 Da ± 10%
63 ± 7
150 0C 2.2 2.3 91,700 Da
± 10% 68 ± 7
79
200 0C 3.5 2.4
77,600 Da ± 12%
95,800 Da ± 10%
71 ± 7
No H2O 0 1.0 ---
150 0C 0.7 1.1 ---
67
(42% DTPA) 200 0C 1.6 1.1
---
---
---
a. All molecular weights presented in this table are for the dimeric disulfide form: two chains bound together through a disulfide bond. The standard error calculation is described in the experimental section.
b. DPn per phenyl end group determined by 1H NMR at the PtBA stage by comparing the integration of the
C6H5 end group at 7.2 ppm to that of the backbone methine protons.
c. Calculated from DPn/phenyl end group at the PtBA stage, attachment of a DTPA unit to each pendant group and assuming that the DTPA groups are fully protonated (not partially neutralized by Na
+ ions).
d. An apparent molecular weight that includes the mass contribution of attendant water molecules and sodium counter-ions.
e. These values indicate the number of Gd3+
ions per phenyl end group of the polymer, calculated from the ITC result of 1.48 ± 0.3 mmol Gd
3+/g polymer and the adjusted molecular weight.
One can see in Table 3-3 that the full range of my assumptions about water content leads to
only small changes in the number of calculated Na+ ions per DTPA. If I take 150 °C as the most
likely water-loss temperature, I find that there are on average 2.3 Na+ ions per DTPA. This is a
58
reasonable result, given that the DTPA was attached to the polymer backbone in the presence of
DMTMM at pH 8.5 in a sodium DTPA buffer. Subsequent purification of a macromolecule by
dialysis against DI water, as was performed here, is not expected to remove the counter-ions.94
The reported pKa values of a DTPA monamide are reported to be 1.8, 3.8, 6.4, and 9.9.106 There
will be a broader range of pKa values for a polymer containing multiple DTPA-amide units. My
finding of 2.3 Na+ per DTPA is not inconsistent with this range of pKa values.
Interestingly, the polymer with 42% DTPA has significantly fewer sodium counter-ions per
DTPA unit. The likely explanation is that the remaining amino groups on the backbone act as
counter-ions to the DTPA carboxylic acids, and, as a consequence, fewer sodium counter-ions are
retained during spin filter washes. This has implications for the nucleophilicity of amino groups
in proximity to a DTPA polymer. In Chapter 6 I will go into more detail on this issue.
Nevertheless, the most useful result from Table 3-3 is the adjusted polymer molecular weight
values calculated for the 100% DTPA polymers. These values are necessary for interpreting the
ITC data presented below.
3.3.2.2 Isothermal Titration Calorimetry
The ITC measurements reported previously27,32 for the binding of Gd3+ to DTPA-groups
attached to a polysaccharide backbone were carried out for samples in acetate buffer. These
experiments showed that the titration end points were easily identified from the isotherms plotted
from the data.27,32 A quantitative analysis of these data in terms of binding constants was more
difficult because of the very large binding constant (logK= 22.5) of the DTPA-Gd pair. In this
study, Isaac Herrera employed citrate buffer with the dual role of maintaining constant pH as
well as serving as a competitive ligand of lower binding affinity (logK= 7.83) to Gd3+. To test
the reasonableness of this hypothesis, Isaac first carried out titrations of DTPA itself, adding
solutions of Gd3+ in citrate buffer (100 mM, pH 5.5) into citrate buffer (blank), and into solutions
of DTPA (0.5 mM) in the same buffer. These thermograms are presented in the top part of
Figure 9-1 in the Chapter 3 Appendix. For the background titration of Gd3+ into citrate buffer
(blank), small exothermic signals (~0.2 µcal/sec) correspond to the heat of dilution of the Gd-
citrate complex in citrate buffer. In contrast, the titration of Gd3+ into a solution of DTPA in
citrate buffer showed strong endothermic peaks (6 µcal/sec). Smaller injections were performed
near the equivalence point to improve the accuracy of the titrations. The titration isotherm

59
calculated from the data is plotted in the lower part of Figure 9-1, and the end point occurs for a
1:1 molar equivalence.
Figure 3-10. Top: Isothermal Titration Calorimetric Thermogram of P(DTPA)-Disulfide Polymer (sample 79, 0.27 mg of polymer per mL) with Gd
3+ (5.0 mM) in Citrate Buffer (100 mM, pH 5.5) at 25 ºC.
Endothermic signals correspond to the dissociation of Gd3+
-citrate and binding to a DTPA pendant group. Bottom: Binding Isotherm Calculated from the Titration Above. The solid line was obtained from nonlinear least squares regression of a two binding site model and used to extract the equivalence points for each binding site (n1, n2). The total equivalence point (ntot) corresponds to the sum of the individual equivalence points and represents the mmol of Gd
3+ required to saturate the
DTPA pendant groups in one gram of polymer. This value is situated at the inflection point of the titration curve (ntot = 1.48 ± 0.3 mmol of Gd
3+ per gram of polymer).
A representative binding isotherm for the titration of the P(DTPA)-Disulfide polymer (sample
79) with Gd3+, as measured and analyzed by Isaac Herrera, is shown in Figure 3-10. The binding
curve shows a slight decrease in the enthalpy of binding for the injections before 1.0 mmol of
Gd3+ per gram of polymer. After this, a rapid change in the signal is observed for the following
injections. The curve reaches a constant value after saturation of the binding sites in the polymer
60
chain. Unlike the case of DTPA itself, these data cannot be fitted successfully to a one-site
binding model characterized by a single binding equilibrium constant. The fits are better to a
two-site model, but the values of the numbers of Gd3+ per binding site (n1, n2) from the fitted
data varied from titration to titration. This result suggests the existence of multiple sites with
different binding strengths along the polymer backbone. The sums of the stoichiometric values
for the two-site model fits (ntot) were similar for the titrations, and this result provides a
quantitative measure of the number of Gd3+ that bind to the polymer chain regardless of the
binding energetics for each site. From triplicate titrations, Isaac found that the polymer sample
contains 1.48 ± 0.03 mmol Gd3+ per gram of polymer.
The quantity of interest to me is the mean number of Gd3+ ions per polymer, where I consider
that the disulfide bond in P(DTPA)-Disulfide links two polymer chains. Another way of thinking
about this value is in terms of the number of Gd3+ ions per phenyl end group. To determine this
value, I begin by calculating (eq 1) the amount of polymer (in mmol/g) in a weighed sample of
this polymer. This calculation (eq 1) relies on the values of the “adjusted molecular weight”
reported in Table 3-3.
)/(
)/(1000)/(2)/(
molgghtlecularWeiAdjustedMo
molmmoldisulfidechainsgmmoleculesPolymerMol
•= (1)
This value, in combination with the ITC result of 1.48 mmol DTPA/g polymer leads to the
values of Gd3+ per phenyl end group listed in Table 3-3. For the 79 sample, I see that assuming
that the freeze-dried disulfide polymer contains no water leads to a value of 63 ± 7 of Gd3+ per
phenyl end group, whereas the finding of 2.2 H2O molecules per DTPA leads to a value of 68 ± 7
of Gd3+ per phenyl end group. This value 68 ± 7 is consistent with the value of DPn = 79 for the
precursor polymer as the P(tBA)-trithiocarbonate and PAA–disulfide, and the 1H NMR result
indicating full DTPA functionalization of the polymer backbone.
For the purposes of this chapter, I assume the binding capacity of these metal-chelating
polymers is identical for all trivalent lanthanide ions. In the experiments described below, Olga
Ornatsky used Tb3+ as a single isotope lanthanide ion to determine how many polymers are
attached per antibody under our normal antibody labeling protocol. This is an assumption that
can be checked in the future by ITC experiments with different metal ions.

61
3.3.2.3 Covalent Attachment of Metal-Chelating Polymers to Antibodies
In this section I discuss experiments done by Olga Ornatsky on the attachment of P(DTPA)-
Maleimide (wash procedure (a)) to monoclonal antibodies (mAbs) and the quantification of the
mean number of polymers per antibody. As described in detail in the Experimental section,
mAb modification begins with reduction of disulfide bonds to thiols in the hinge region of the
antibody using TCEP in 150 mM sodium phosphate buffer, pH 7.2. In parallel, the DTPA sites of
the P(DTPA)-Maleimide were loaded with an isotopically enriched lanthanide solution in 20 mM
ammonium acetate buffer, pH 5.2. Finally, the maleimide group of the purified, lanthanide-
loaded polymer was bound to the thiol groups of the partially-reduced mAb in tris-buffered
saline (TBS, 25 mM Tris, 150 mM NaCl, 2 mM KCl, pH 7.4). The metal-tagged mAb was
washed several times in EDTA-free TBS and stored at +4 0C. The strong chelation of the
lanthanide by DTPA is resistant to leaching, and we have observed no exchange between
differently tagged mAbs when deployed in a multiple antibody staining cocktail.5
In order to interpret mass cytometry data quantitatively in terms of the number of biomarkers
per cell, it is necessary to know the number of metal ions (i.e., the number of metal-chelating
polymers) carried per antibody.79,80 In order to obtain this information, Olga carried out model
experiments on goat anti-mouse secondary antibody labeled with 159Tb via reaction with the
P(DTPA)-Maleimide sample 79, which we assume contains an average of 68 ± 7 Tb3+/polymer.
After purification of the functionalized Ab to remove excess polymer and metal ions, the
antibody concentration was measured by Olga with a Nanodrop UV/VIS spectrometer, yielding
2.73 x10¹⁰ molecules Ab/mL. In addition, an aliquot of this solution was diluted and analyzed by
conventional ICP-MS, from which Olga determined the metal concentration to be 4.4 x10¹²
atoms 159Tb/mL. Dividing the metal concentration by the antibody concentration yields an
average of 161 ± 4 metal atoms per antibody. Finally, dividing 161 metal atoms per antibody by
an assumed 68 Tb3+ ions per chain shows that there are an average of 2.4 ± 0.3 polymer chains
bound to each antibody. Note that using values of 63 or 71 binding sites per chain changes this
value only slightly, to 2.6 ± 0.3 or 2.3 ± 0.2 polymer chains, respectively, per antibody.
3.3.3 Simultaneous 11-plex Antibody Staining and Analysis of Whole Cord Blood
Metal chelating polymer P(DTPA)-Maleimide 79 (wash procedure (a)) was used by Olga
Ornatsky to label 11 primary antibodies with different lanthanide isotopes. The 11 labeled
62
antibodies were mixed together in 1% BSA at a concentration of 10 mg/mL of each antibody.
This solution was diluted to also form solutions at 1 and 0.1 mg/mL of each antibody. Taken
together, the 10, 1, and 0.1 mg/mL antibody cocktails constituted an antibody dilution series.
Next, these antibody cocktails were used to stain a sample of umbilical cord blood. Three
aliquots of whole heparinized umbilical cord blood (100 µL per sample) were treated with RBC
lysis buffer to disintegrate the majority of red blood cells. The leukocytes were washed once
with 5% BSA/PBS, and then each aliquot was stained with one of the three antibody cocktail
solutions. Washed cells were fixed in 3.7% formaldehyde and counter-stained with an Ir-
intercalator. The fixing of the cells permeabilized the cell membranes, which in turn allowed the
Ir-intercalator to enter all cells and intercalate with the nuclear DNA. Samples were analyzed by
mass cytometry,8 and the data in FCS 3.0 format were processed by FlowJoTM software.
The major cell populations (such as lymphocytes, granulocytes, monocytes, and subsets of
CD3 T-cells and B-cells) present in the umbilical cord blood sample are shown on the two-
dimensional smoothed dot-plots presented in Figure 3-11. Interpretation of the data began with
the 191Ir vs. 193Ir plot at the top of the figure. Single nucleated cells that bind the Ir-intercalator
(with 191Ir and 193Ir stable isotopes) are distinguished from debris by the high expression of both
Ir isotopes. From the cell events selected by this gate, cells that bind different levels of the
antibodies CD15-170Er and CD45-159Tb in the 170Er vs. 159Tb plot are grouped into lymphocytes
(Lymphs, low 170Er and high 159Tb), monocytes (Mono, high 170Er and high 159Tb), and
granulocytes (Gran, high 170Er and low 159Tb). From within these populations, further
subdivision by biomarker expression is possible. For example, the lymphocytes from the central
170Er vs. 159Tb plot are plotted for 152Sm vs. 144Nd signal in the plot below. The cells that show a
high level of CD3-152Sm signal are considered CD3 T cells. In turn, events for these CD3 T cells
are plotted for 165Ho vs. 156Gd signal, and the cells with high CD20-156Gd signal are considered
CD20+ B cells. The CD20- B cells are even further subdivided into CD4+ or CD8+ T cells in
the 142Nd vs. 146Nd plot below.
As mentioned above, this experiment was performed with antibody cocktail solutions at 10,
1, and 0.1 mg/mL of each antibody. The data from each of these trials was processed, and the
metal isotope counts (instrument response for each metal isotope) for cells within each gate were
used to create titration curves. Optimal antibody concentrations for each metal-tagged Ab were
determined from the dilution series (Appendix to Chapter 3, Figure 9-2 and Figure 9-3). The

63
graphs show that at the appropriate concentration of metal-tagged antibody, the cell population is
defined by several specific markers. The mean percentage of cells in the granulocyte (16.0%),
monocyte (12.3%) and lymphocyte (51.1%) populations is within normal values.107 It is
interesting to note that all T cells expressed high levels of CD38, which is consistent with
previous findings.108
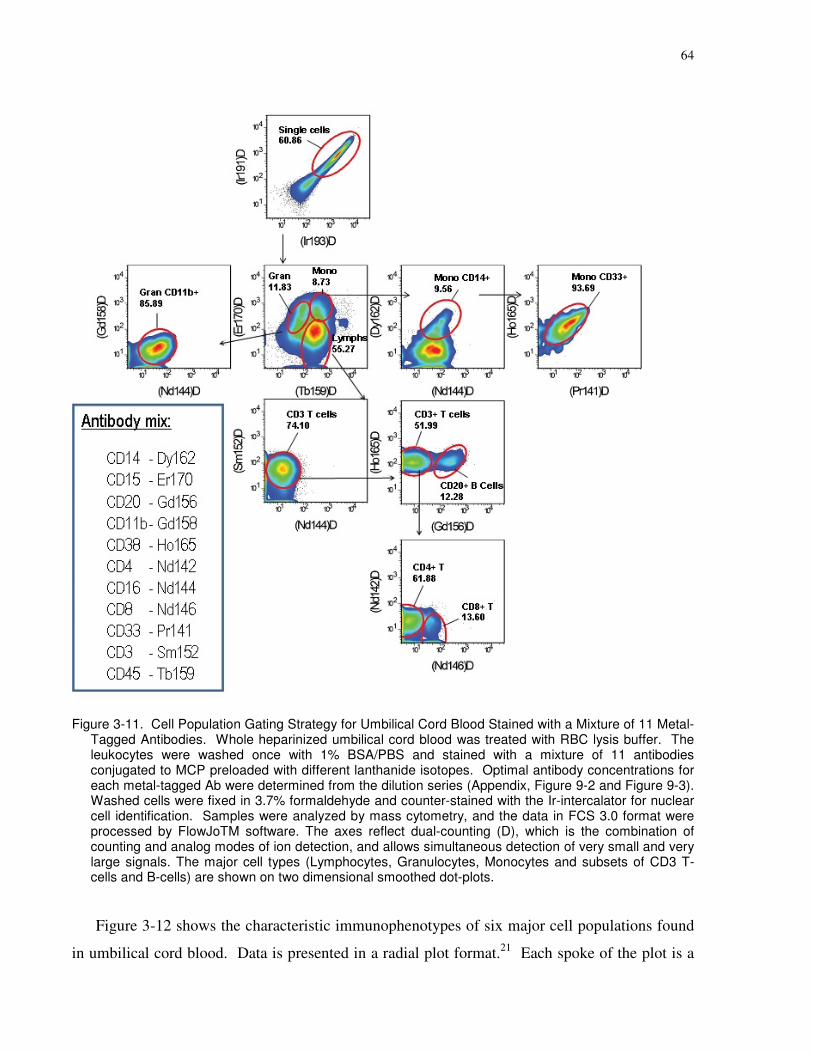
64
Figure 3-11. Cell Population Gating Strategy for Umbilical Cord Blood Stained with a Mixture of 11 Metal-Tagged Antibodies. Whole heparinized umbilical cord blood was treated with RBC lysis buffer. The leukocytes were washed once with 1% BSA/PBS and stained with a mixture of 11 antibodies conjugated to MCP preloaded with different lanthanide isotopes. Optimal antibody concentrations for each metal-tagged Ab were determined from the dilution series (Appendix, Figure 9-2 and Figure 9-3). Washed cells were fixed in 3.7% formaldehyde and counter-stained with the Ir-intercalator for nuclear cell identification. Samples were analyzed by mass cytometry, and the data in FCS 3.0 format were processed by FlowJoTM software. The axes reflect dual-counting (D), which is the combination of counting and analog modes of ion detection, and allows simultaneous detection of very small and very large signals. The major cell types (Lymphocytes, Granulocytes, Monocytes and subsets of CD3 T-cells and B-cells) are shown on two dimensional smoothed dot-plots.
Figure 3-12 shows the characteristic immunophenotypes of six major cell populations found
in umbilical cord blood. Data is presented in a radial plot format.21 Each spoke of the plot is a
65
logarithmic measure of a single antigen’s expression. Eleven antigens were identified by the
eleven respective metal-tagged antibodies; therefore, eleven spokes are featured in the plot.
Antibodies are arranged in an arbitrary order. The 12 o’clock spoke is the decimal fraction of the
population of each cell type. Each cell type is assigned a color line; for example the B cells are
recognized by the red line. We find the radial plot format useful because it visually represents
how one particular cell differs from another in immunophenotype. Thus, the B-cells show high
CD20, CD38, CD45 expression, while granulocytes are negative for CD20, CD3, are low for
CD38 and CD45, but express high levels of specific markers such as CD15, CD16, CD11b.
These results demonstrate that by using a metal-chelating polymer with different lanthanide
isotopes to create an 11 antibody cocktail, it is possible to perform phenotypic analysis of the
major cell types in whole cord blood in a multiplex format in a single mixture. Mass cytometry
does not require compensation, as in fluorescent methods, for the analysis of 11 biomarkers in a
single sample of 100 µl of whole blood.
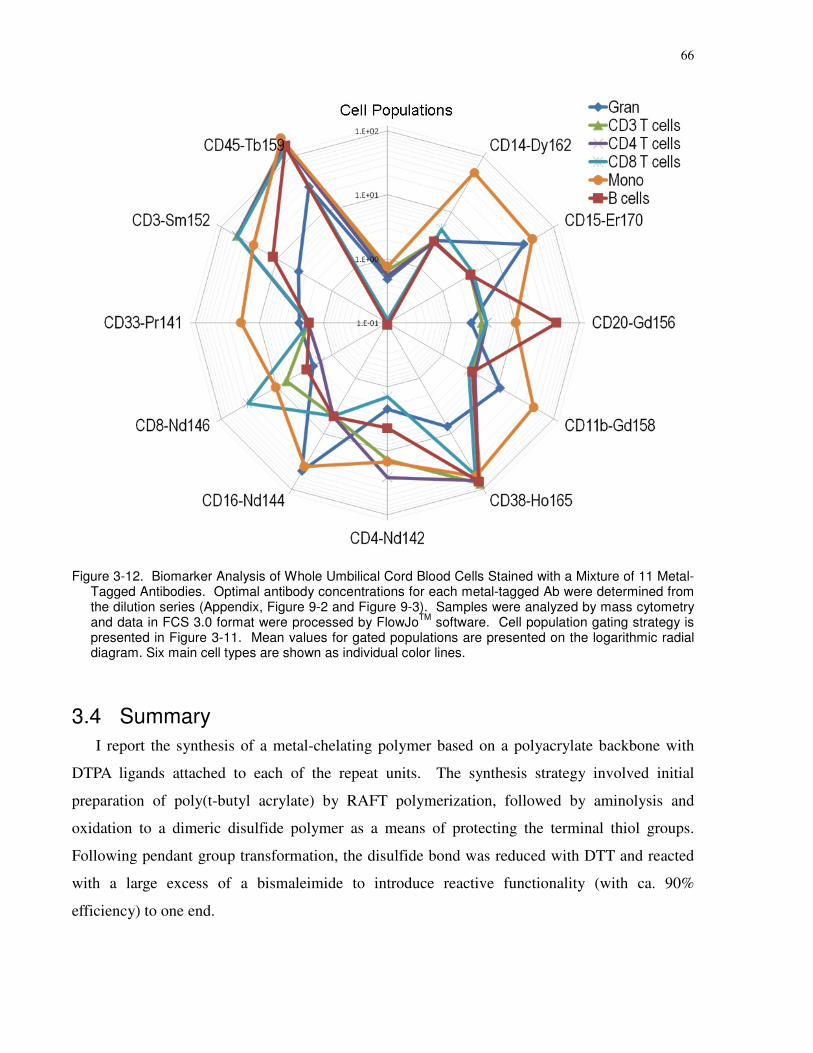
66
Figure 3-12. Biomarker Analysis of Whole Umbilical Cord Blood Cells Stained with a Mixture of 11 Metal-Tagged Antibodies. Optimal antibody concentrations for each metal-tagged Ab were determined from the dilution series (Appendix, Figure 9-2 and Figure 9-3). Samples were analyzed by mass cytometry and data in FCS 3.0 format were processed by FlowJo
TM software. Cell population gating strategy is
presented in Figure 3-11. Mean values for gated populations are presented on the logarithmic radial diagram. Six main cell types are shown as individual color lines.
3.4 Summary
I report the synthesis of a metal-chelating polymer based on a polyacrylate backbone with
DTPA ligands attached to each of the repeat units. The synthesis strategy involved initial
preparation of poly(t-butyl acrylate) by RAFT polymerization, followed by aminolysis and
oxidation to a dimeric disulfide polymer as a means of protecting the terminal thiol groups.
Following pendant group transformation, the disulfide bond was reduced with DTT and reacted
with a large excess of a bismaleimide to introduce reactive functionality (with ca. 90%
efficiency) to one end.
67
The polymer was characterized 1H NMR to determine the mean degree of polymerization
and end-group content and by size exclusion chromatography to determine the polydispersity. I
used thermal gravimetric analysis to estimate moisture and sodium ion content of the partially
neutralized polymer and Isaac Herrera performed isothermal titration calorimetry (ITC) to
measure the lanthanide binding capacity. For sample 79, I found a number average degree of
polymerization of 79 for the initial formation of PtBA and this value remained in the range of 75
to 79 (± 7%) following subsequent pendant group transformations. This value is within
experimental error of the number of Gd3+ ions found by ITC to bind to the polymer.
Olga Ornatsky attached this polymer to a series of antibodies to biomarkers for human cord
blood cell components as well as to a sample of goat anti-mouse secondary antibody. Using
traditional ICP-MS analysis, Olga determined that this secondary antibody on average contained
161 ± 4 159Tb ions. Assuming that Tb3+ and Gd3+ bind equally well to metal chelating polymer
sample 79, I infer that the intact antibodies are labeled with an average 2.4 ± 0.3 polymer
molecules. The correspondingly labeled monoclonal primary metal-tagged antibodies were used
by Olga in a 11-plex mass cytometry bioassay to determine the main types of cells present in a
small amount of whole cord blood.
3.5 Contents of Appendix to Chapter 3
Thermogravimetric analysis results of disodium EDTA.2H2O, isothermal titration calorimetry
thermogram and binding isotherm for the binding of Gd3+-citrate with DTPA, antibody dilution
series for all 11 tagged antibodies, and a description of clusters of differentiation (CD).

68
69
4 Chapter 4: Metal-Chelating Polymer Synthesis: Recovering End-Group-Functionality at the Late Stage
4.1 Introduction
There are four requirements for a metal-chelating polymer intended to be attached to a library
of antibodies for bioassays based upon ICP-MS. First, the polymer must not be so long that it
interferes with antibody-antigen recognition. Second, it must have a narrow distribution of chain
lengths, so that each labeled antibody will carry a similar number of metal ions. Third, it must
contain the maximum number of metal-chelating sites for a given degree of polymerization in
order to maximize the sensitivity of the technique. Finally the polymer must contain appropriate
functionality for covalent attachment to antibodies. An important consideration in designing
syntheses for polymers to meet these requirements is that the final steps, particularly those that
unmask the reactive end group, have to occur in high chemical yield. The metal-chelating
polymer presented in Chapter 3 meets all of these requirements. One defining characteristic of
the strategy used to synthesize the polymers described in Chapter 3 was the early stage
conversion of the trithiocarbonate group to the protected form of a disulfide.
Before I developed the relatively successful chemistry described in Chapter 3, I examined a
different approach. This first strategy involved the RAFT polymerization of PtBA with a
dodecyl trithiocarbonate RAFT agent. A number of pendant group modification steps were
performed to add a DTPA group to every repeat unit. These modifications were a) deprotection
of the tert-butyl ester to a carboxylic acid through treatment with trifluoroacetic acid in
dichloromethane,94 b) formation of a t-BOC-aminoethylamide through the use of the amide
coupling agent DMTMM in water,95 c) removal of the t-BOC group with trifluoroacetic acid in
dichloromethane, and finally d) functionalization of the pendant amines with a DTPA group,
again through the use of DMTMM in water. In steps where the polymer end-group was exposed
to primary amines, belonging either to a reagent or the pendant groups of the polymer itself,
there was a chance for the trithiocarbonate group to become aminolyzed. However, through 1H
NMR and UV/VIS analysis at different points in the synthesis, I observed that the
hydrophobicity of the dodecyl chain imparted appreciable protection against aqueous aminolysis
of the RAFT agent. Finally, after preparing the DTPA polymer with intact trithiocarbonate, my
70
plan was to aminolyze the trithiocarbonate with the polymer dissolved in water, and then directly
react the liberated thiol with a bismaleimide molecule. Attempts to recover end-functionality at a
late stage, in aqueous solution, failed to yield a polymer with maleimide end-content as high as
seen with the strategy in Chapter 3.
4.2 Experimental
4.2.1 Polymer Synthesis
4.2.1.1 Materials
All reagents and solvents, including diethylenetriaminepentaacetic acid (DTPA) (98%,
Aldrich), diethylenetriaminepentaacetic acid dianhydride (95%, Fluka), DL-dithiothreitol (DTT)
(99%, Aldrich), dodecanethiol (98%, Aldrich), potassium tert-butoxide (95%, Aldrich),
trifluoroacetic acid (TFA) (Caledon Laboratories LTD), and other compounds were used without
further purification unless otherwise noted. Tetrahydrofuran (THF) was distilled over sodium
metal and benzophenone. Acetonitrile was dried over 4A molecular sieves. Tert-butyl acrylate
(98%, Aldrich) was gravity-filtered over silica before polymerization to remove the inhibitor.
Water was purified through a MilliQ water purification system (10 MΩcm). pH 9.4, 200 mM
sodium bicarbonate/carbonate buffer was purchased from Pierce Biotechnology. All other
buffers were prepared in our laboratory. The Spectra/Por dialysis membrane (MWCO 1 kDA)
was purchased from Spectrum Laboratories, Inc. The 4 mL and 15 mL, 3 kDa and 10 kDa
MWCO Millipore Amicon spin filters were purchased from Fisher Science, Canada.
2,2'-(ethylenedioxy)bis(ethylmaleimide) (Acanthus Research, Toronto, Canada), 4,4′-
Azobis(4-cyanovaleric acid) (ACVA, 97%, Fluka)), 4-(4,6-dimethoxy-1,3,5-triazin-2-yl)-4-
methylmorpholinium chloride (DMTMM, Acros Organics, 99+%, from Fisher Science, Canada),
and t-BOC-ethylenediamine (>97%, TCI America) were stored in a dessicator inside a freezer at
-20 0C. Before use, their temperatures were equilibrated in a dessicator kept at room
temperature.
4.2.1.1.1 Synthesis of Bis(dodecylsulfanylthiocarbonyl) Disulfide
The procedure to synthesize this compound was taken from a patent.109 A 250 mL round-
bottom flask was charged with 175 mL of heptane, which was then degassed by purging with N2.
Potassium tert-butoxide (4.338 g) suspended in THF (34.8 mL) was added, after which the flask
was cooled to 0 0C, and dodecanethiol (8.98 mL) was injected. The thick white slurry was
71
stirred for half an hour at 0 0C, and then carbon disulfide (2.5 mL) was slowly injected over 20
minutes. I2 (5.0 g) was added in portions with stirring over 40 minutes to the yellow slurry at
room temperature. Ten minutes after finishing the I2 addition, most of the yellow slurry had
dissolved, and the solution colour had changed to dark reddish-brown. The solution was stirred
overnight at room temperature. H2O (150 mL) was added to reaction mixture, after which the
organic phase was separated and washed with 150 mL portions of 1 M sodium chloride + 1 M
sodium thiosulfate, and then with 0.5 M NaCl. The organic phase was dried over MgSO4.
Finally, the solvent was removed by rotary evaporator, and the resulting orange oil was dried for
one hour at room temperature under ca. 10-3 torr vacuum. Upon standing in a -20 0C freezer the
oil became a yellowish-orange solid. Yield: 10.69 g (103%); 1H NMR (CDCl3): δ(ppm) 0.88 (t,
6H, CH3), 1.25,1.39 (s broad, 18H, CH2), 1.69 (q, 2H, CH2), 3.30 (t, 2H, CH2).
4.2.1.1.2 Synthesis of 4-cyano-4-(dodecylsulfanylthiocarbonyl)sulfanyl Pentanoic Acid (CTA)
The procedure to synthesize this compound was modified from that described in a patent.109
Bis(dodecylsulfanylthiocarbonyl) disulfide (0.833 g), 4,4′-azobis(4-cyanovaleric acid) (ACVA)
(0.701 g), and ethyl acetate (20 mL) were added to a 100 mL round-bottom flask with a well-
secured septum and degassed by purging with N2. The mixture was heated at 60 0C for 2 hours,
70 0C overnight, and finally 85 0C for an additional 24 hours. Next, the reaction solution was
concentrated to 2-3 mL by rotary evaporator, then precipitated into 30 mL of heptane in a round-
bottom flask. After sitting at room temperature for 15 minutes, the solution was poured off into a
fresh round-bottom flask, and the viscous byproduct sticking to the walls of the first round-
bottom flask was discarded. The second round-bottom flask was allowed to sit at -20 0C in a
freezer overnight. The next morning, the precipitate was collected on a fritted funnel with a
layer of celite, washed with -20 0C heptane, and dissolved off the fritted funnel with CHCl3. The
solvent was removed by rotary evaporator and then one hour at room temperature under ca. 10-3
torr vacuum, after which the product was solidified by storing it overnight at -20 0C in the
freezer. This material was used without further purification. Yield: 0.82 g (67%); 1H NMR
(CDCl3): δ(ppm) 0.88 (t, 3H, CH3 dodecyl), 1.26 (broad and s, 16H, CH2 dodecyl), 1.40 (t, 2H,
CH2 dodecyl), 1.70 (q, 2H, CH2 dodecyl), 1.86 (s, 3H, CH3), 2.39 & 2.54 (double q, 2H, CH2),
2.69 (t, CH2), 3.33 (t, 2H, CH2 dodecyl).
72
4.2.1.2 Polymer Synthesis
4.2.1.2.1 P1) RAFT Polymerization of Tert-Butyl Acrylate (tBA) with CTA to Form PtBA
The molar ratio of tBA:CTA:ACVA was chosen to be 75:1:0.1. The polymerization was
carried out in bulk using a round-bottom flask with a rubber septum and purging with N2 as the
degassing method. To a 10 mL round-bottom flask was added CTA (162 mg), ACVA (11.2 mg),
tert-butyl acrylate (3.85 g), and a magnetic stir bar, after which the septum was secured and the
contents purged with N2 for 15 minutes. The flask was lowered into a 60 0C oil bath, and after
11.3 hours the solution was observed to be viscous. The septum was opened and an aliquot was
removed and dissolved in CDCl3 for 1H NMR analysis. [Comparison of the 1H NMR signals of
the vinylic monomer (5.72, 6.03, and 6.30 ppm, 3H) to the methine polymer backbone signal
(2.15-2.35 ppm, 1H) showed a monomer conversion of 80%.] THF was added to the
polymerization mixture, after which the polymer was precipitated twice from a concentrated
THF solution into a mixture of water and methanol (1:1, v:v), transferred to a tared round-bottom
flask as a CHCl3 solution, and dried for 72 hours under ca. 10-3 torr vacuum at 80 0C. The
polymer product was stored at 12 0C. Yield: 2.84 g (74%, based on all tBA present); 1H NMR
(CDCl3): δ(ppm, integrated peak areas are reported are based on dodecyl -CH2- adjacent to
trithiocarbonate = 2H as the reference) 0.88 (t, 3H, dodecyl -CH3, integration = 5.5), [1.2-1.9
(broad, 2H per monomer, backbone methylene), 1.26 (s, 18H, dodecyl -CH2-), 1.44 (s, 9H per
monomer, -C(CH3)3 ester), total overlapped integration = 746.7], 2.15-2.7 (broad, multiple peaks,
1H per monomer, backbone methine, integration = 64.6), 3.33 (t, 2H, dodecyl -CH2- adjacent to
trithiocarbonate, integration = 2.0), 4.69 (s, 1H, backbone methine adjacent to trithiocarbonate,
integration = 1.0); DPn (Number Average Degree of Polymerization) = 66 by comparing the
integration of the 1H NMR signal at 3.33 ppm (end group) to that at 2.15-2.7 ppm and 4.69 ppm
(backbone methine); SEC (THF, relative to polystyrene standards, RI): Mn = 6000 Da, PDI =
1.24. The UV/VIS detector showed a strong corresponding peak when monitored at 310 nm.
4.2.1.2.2 P2) Deprotection of PtBA to Poly(acrylic acid) (PAA)
PtBA (1.2 g) was dissolved in 8 mL of dichloromethane. Trifluoroacetic acid (3.4 mL) was
added, and the solution was stirred overnight at room temperature. By the next morning a large
chunk of polymer had precipitated out of the reaction solution. The precipitate was collected
over a fritted funnel and then washed with diethyl ether. After being transferred to a round-
73
bottom flask, the precipitate was dried for 30 minutes on a rotary evaporator with a water bath at
room temperature. It was then dissolved in 6 mL of a 2:1 (v:v) water:methanol mixture, and
transferred to a Spectra/Por dialysis bag (MWCO 1 kDA). The polymer was dialyzed against 2
L of water for three days, with the water being changed twice daily. Afterwards the solution was
transferred to a sample vial, and concentrated by heating at 50 0C under a stream of compressed
air. Finally, the concentrated solution was freeze-dried to yield PAA. Yield: 635 mg (93%); 1H
NMR (D2O): δ(ppm, integrated peak areas are reported are based on polymer backbone methine
= 65H as the reference) 0.91 (b, 3H, dodecyl -CH3, integration = 2.6), 1.05-1.4 (multiple peaks,
18H, dodecyl -CH2-, integration = 17.8), 1.4-2.25 (broad, multiple peaks, 2H per monomer,
backbone methylene, integration = 110.8), 2.25-2.75 (broad, 1H per monomer, backbone
methine, integration = 65), 3.39 (broad, 2H, dodecyl -CH2- adjacent to trithiocarbonate,
integration = 1.5) 3.69 (broad, 1H, backbone methine adjacent to trithiocarbonate, integration =
1.1).
4.2.1.2.3 P3’) Partial Trithiocarbonate Aminolysis Followed by Coupling of t-BOC-ethylenediamine to PAA
PAA (20 mg, equivalent to 1.25 mmol carboxylic acid groups) was added to a 25 mL round-
bottom flask and dissolved in 2 mL water. A solution of t-BOC-ethylenediamine (111 mg, 2.5
molar equivalents to acid groups) in 2 mL water was added to the polymer solution, after which
the solution was stirred for 2 days. During this time some white precipitate formed in the
solution. This precipitate was sedimented by centrifugation and removed, after which a solution
of DMTMM (192 mg, 2.5 molar equivalents to acid groups) in 3.5 mL water was added, and the
mixture was stirred at room temperature overnight. One hour after the addition of DMTMM the
solution had taken on the appearance of milk, and by the next morning the polymer had
completely precipitated onto the walls of the reaction flask with the remaining solution clear.
The liquid was poured off, and the polymer was rinsed with water (3 x 5 mL), and then dried by
rotary evaporator with the heating bath set to 50 0C. The polymer product was not characterized
at this point, but instead was used directly in the deprotection step.
4.2.1.2.4 P3) Direct Coupling of t-BOC-ethylenediamine to PAA
PAA (50 mg) was functionalized with t-BOC-ethylenediamine similarly to the delayed
reaction described above. All quantities of reactants and solvents were scaled according to the
amount of PAA. The only difference in this procedure was the DMTMM solution was added

74
directly after the t-BOC-ethylenediamine solution. Here too the solution took on the appearance
of milk after one hour, and had precipitated by the next morning. As above, the polymer product
was not characterized at this point, but was used directly in the deprotection step.
4.2.1.2.5 P4’) Deprotection of Boc Groups to Yield an Amino Polymer
P3’ (total sample) was dissolved in 2 mL of dichloromethane, after which trifluoroacetic acid
(3 mL) was added with stirring. The mixture was stirred overnight at room temperature. Then
almost all of the solvent was removed by a stream of compressed air. Next, the polymer was
dissolved in 1 mL of methanol, precipitated into 12 mL of diethyl ether, and lightly centrifuged
to separate out the precipitate. After repeating the precipitation, the polymer was dissolved in
water and then washed with water (5 x 4 mL) using a 4 mL 3 kDA MWCO Millipore Amicon
spin filter. Finally, the aqueous solution was freeze-dried to yield P4’ as the trifluoroacetate salt.
Yield: 53 mg (84%); 1H NMR (D2O): δ(ppm, integrated peak areas are reported are based on
polymer backbone protons = 198H as the reference), 1.25-1.35 (broad, 18H, dodecyl -CH2-,
integration = 9.9), 1.4-2.5 (broad, 3H per monomer, backbone protons, integration = 198), [3.12
(broad s, 2H per monomer, ethylenediamine –CH2-NH3+), 3.46 (broad s, 2H per monomer,
ethylenediamine –CO-NH-CH2-), combined integration = 269], 4.01, (s, 6H, triazine -O-CH3,
integration = 4.1).
4.2.1.2.6 P4) Deprotection of Boc Groups to Yield an Amino Polymer
P3 (total sample) was deprotected as described above to yield P4 as the trifluoroacetate salt.
All quantities of reactants and solvents were scaled according to the amount of polymer. Yield:
123 mg (78%); 1H NMR (D2O): δ(ppm, integrated peak areas are reported are based on polymer
backbone protons = 198H as the reference), 0.85 (t, 3H, dodecyl -CH3, integration = 2.9), 1.25-
1.35 (broad, 18H, dodecyl -CH2-, integration = 25.5), 1.4-2.5 (broad, 3H per monomer, backbone
protons, integration = 198), [3.12 (broad s, 2H per monomer, ethylenediamine –CH2-NH3+), 3.46
(broad s, 2H per monomer, ethylenediamine –CO-NH-CH2-), combined integration = 272].
4.2.1.2.7 P5) Functionalization of P4 with DTPA Dianhydride
P4 (40 mg) was dissolved in sodium bicarbonate/carbonate buffer (40 mL, 200 mM, pH 9.4).
DTPA dianhydride (518 mg, 9 eqv. per polymeric amine) was added all at once with vigorous
stirring, directly after which 5 M aq. NaOH was added to raise the pH to 9 (monitored by pH
paper). After stirring for two hours, the reaction solution was transferred to a 15 mL 3 kDA

75
MWCO Millipore Amicon spin filter and washed with 100 mM pH 8.0 phosphate buffer
containing 100 mM NaCl (5 x 15 mL), and then with water (4 x 15 mL). The concentrated
aqueous solution was freeze-dried to yield P5. Yield: 50 mg (58%); 1H NMR (D2O): δ(ppm,
integrated peak areas are reported are based on polymer backbone protons and 18H dodecyl
protons = 216H as the reference) 0.87 (broad, 3H, dodecyl -CH3, integration = 2.7), 1.04-2.5
(broad, 18H, dodecyl -CH2- and broad, 3H per monomer, backbone, combined integration =
216), 2.6-4.2 (broad m, 4H ethylenediamine and 18H DTPA per monomer, integration = 997);
SEC (Aqueous, relative to poly(methacrylic acid standards, RI): main product peak Mn = 11,100
Da, PDI = 1.25, high molecular weight peak Mn = 80,400 Da, PDI = 1.07.
4.2.1.2.7.1 Note: Three Batches of P6 P(DTPA)
Three different batches of P6 P(DTPA) polymer were synthesized from the same batch of P4.
These P6 polymers were used in the subsequent syntheses of P7 and P8 polymers. Polymers
from each batch will be referred to with a prefix of B1-, B2-, or B3-.
4.2.1.2.8 P6) Functionalization of P4 with DTPA by the DMTMM-DTPA Method
This reaction was performed as described in Chapter 3. B1-P6 1H NMR (D2O): δ(ppm,
integrated peak areas are reported are based on polymer backbone protons and 18H dodecyl
protons = 216H as the reference) 0.86 (broad, 3H, dodecyl -CH3, integration = 3.3), 1.04-2.5
(broad, 18H, dodecyl -CH2- and broad, 3H per monomer, backbone, combined integration =
216), 2.6-4.2 (broad m, 4H ethylenediamine and 18H DTPA per monomer, integration = 1424).
Table 4-1. Experimental Details of Functionalization of P4 with DTPA by the DMTMM-
DTPA Method.
Batch P4 Reactant Mass Yield Mn (Aq. SEC, Da)a PDI (Aq. SEC)
B1-P6 20 mg 42 mg (98%) 22,100 1.24
B2-P6 9.6 mg 19.3 mg (79%) 23,600 1.41
B3-P6 50 mg 106 mg (84%) 22,500 1.35
a. Apparent molecular weights from Aqueous SEC are relative to poly(methacrylic acid) standards.
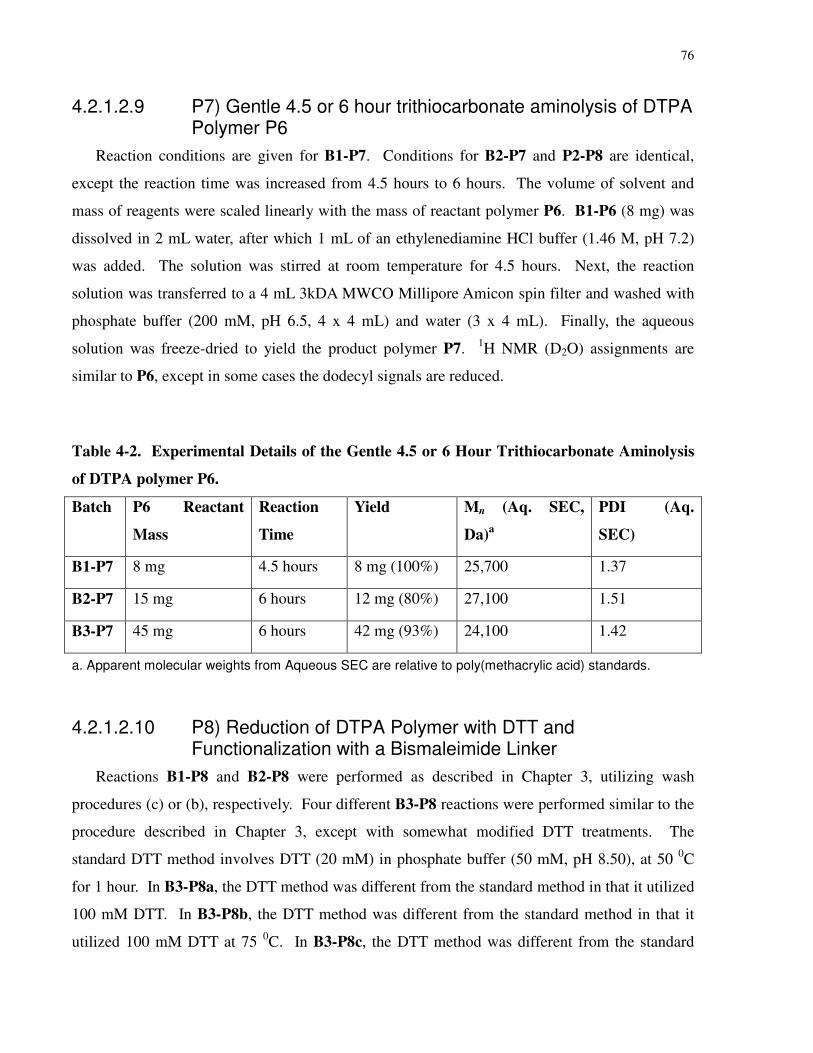
76
4.2.1.2.9 P7) Gentle 4.5 or 6 hour trithiocarbonate aminolysis of DTPA Polymer P6
Reaction conditions are given for B1-P7. Conditions for B2-P7 and P2-P8 are identical,
except the reaction time was increased from 4.5 hours to 6 hours. The volume of solvent and
mass of reagents were scaled linearly with the mass of reactant polymer P6. B1-P6 (8 mg) was
dissolved in 2 mL water, after which 1 mL of an ethylenediamine HCl buffer (1.46 M, pH 7.2)
was added. The solution was stirred at room temperature for 4.5 hours. Next, the reaction
solution was transferred to a 4 mL 3kDA MWCO Millipore Amicon spin filter and washed with
phosphate buffer (200 mM, pH 6.5, 4 x 4 mL) and water (3 x 4 mL). Finally, the aqueous
solution was freeze-dried to yield the product polymer P7. 1H NMR (D2O) assignments are
similar to P6, except in some cases the dodecyl signals are reduced.
Table 4-2. Experimental Details of the Gentle 4.5 or 6 Hour Trithiocarbonate Aminolysis
of DTPA polymer P6.
Batch P6 Reactant
Mass
Reaction
Time
Yield Mn (Aq. SEC,
Da)a
PDI (Aq.
SEC)
B1-P7 8 mg 4.5 hours 8 mg (100%) 25,700 1.37
B2-P7 15 mg 6 hours 12 mg (80%) 27,100 1.51
B3-P7 45 mg 6 hours 42 mg (93%) 24,100 1.42
a. Apparent molecular weights from Aqueous SEC are relative to poly(methacrylic acid) standards.
4.2.1.2.10 P8) Reduction of DTPA Polymer with DTT and Functionalization with a Bismaleimide Linker
Reactions B1-P8 and B2-P8 were performed as described in Chapter 3, utilizing wash
procedures (c) or (b), respectively. Four different B3-P8 reactions were performed similar to the
procedure described in Chapter 3, except with somewhat modified DTT treatments. The
standard DTT method involves DTT (20 mM) in phosphate buffer (50 mM, pH 8.50), at 50 0C
for 1 hour. In B3-P8a, the DTT method was different from the standard method in that it utilized
100 mM DTT. In B3-P8b, the DTT method was different from the standard method in that it
utilized 100 mM DTT at 75 0C. In B3-P8c, the DTT method was different from the standard
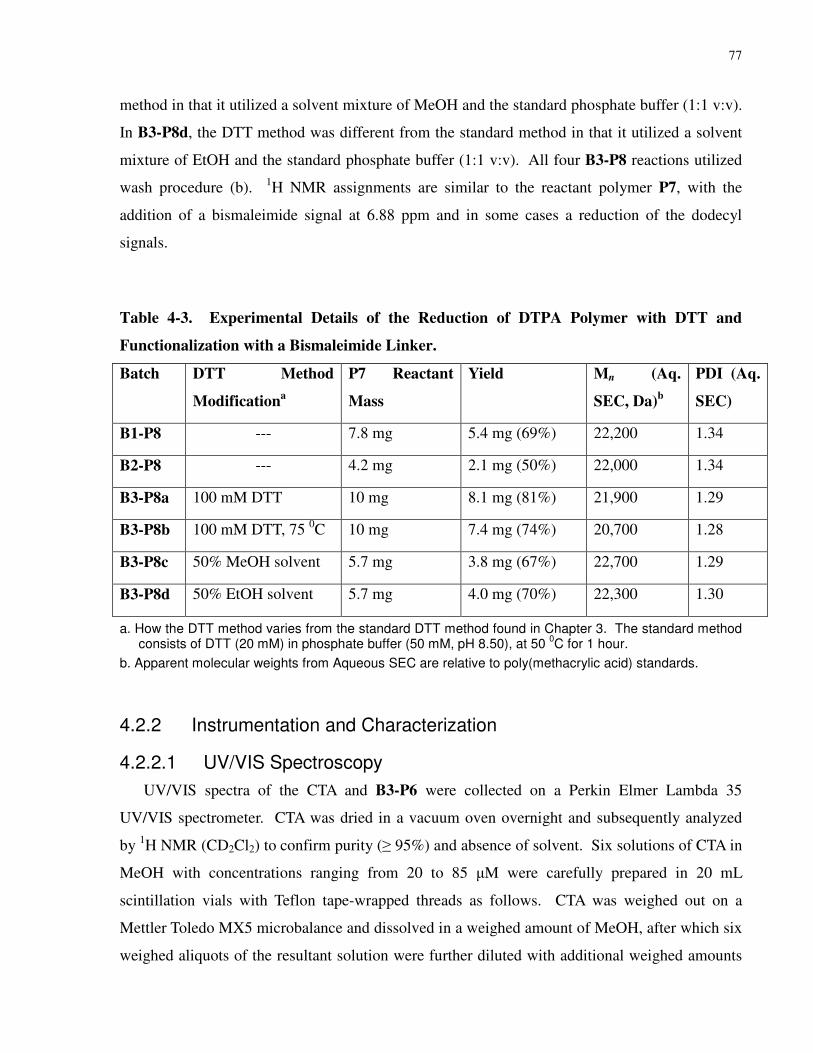
77
method in that it utilized a solvent mixture of MeOH and the standard phosphate buffer (1:1 v:v).
In B3-P8d, the DTT method was different from the standard method in that it utilized a solvent
mixture of EtOH and the standard phosphate buffer (1:1 v:v). All four B3-P8 reactions utilized
wash procedure (b). 1H NMR assignments are similar to the reactant polymer P7, with the
addition of a bismaleimide signal at 6.88 ppm and in some cases a reduction of the dodecyl
signals.
Table 4-3. Experimental Details of the Reduction of DTPA Polymer with DTT and
Functionalization with a Bismaleimide Linker.
Batch DTT Method
Modificationa
P7 Reactant
Mass
Yield Mn (Aq.
SEC, Da)b
PDI (Aq.
SEC)
B1-P8 --- 7.8 mg 5.4 mg (69%) 22,200 1.34
B2-P8 --- 4.2 mg 2.1 mg (50%) 22,000 1.34
B3-P8a 100 mM DTT 10 mg 8.1 mg (81%) 21,900 1.29
B3-P8b 100 mM DTT, 75 0C 10 mg 7.4 mg (74%) 20,700 1.28
B3-P8c 50% MeOH solvent 5.7 mg 3.8 mg (67%) 22,700 1.29
B3-P8d 50% EtOH solvent 5.7 mg 4.0 mg (70%) 22,300 1.30
a. How the DTT method varies from the standard DTT method found in Chapter 3. The standard method consists of DTT (20 mM) in phosphate buffer (50 mM, pH 8.50), at 50
0C for 1 hour.
b. Apparent molecular weights from Aqueous SEC are relative to poly(methacrylic acid) standards.
4.2.2 Instrumentation and Characterization
4.2.2.1 UV/VIS Spectroscopy
UV/VIS spectra of the CTA and B3-P6 were collected on a Perkin Elmer Lambda 35
UV/VIS spectrometer. CTA was dried in a vacuum oven overnight and subsequently analyzed
by 1H NMR (CD2Cl2) to confirm purity (≥ 95%) and absence of solvent. Six solutions of CTA in
MeOH with concentrations ranging from 20 to 85 µM were carefully prepared in 20 mL
scintillation vials with Teflon tape-wrapped threads as follows. CTA was weighed out on a
Mettler Toledo MX5 microbalance and dissolved in a weighed amount of MeOH, after which six
weighed aliquots of the resultant solution were further diluted with additional weighed amounts
78
of MeOH. The UV/VIS absorption data was used to construct an extinction coefficient curve.
B3-P6 was accurately weighed on a Mettler Toledo MX5 microbalance, transferred to a 20 mL
scintillation vial with Teflon tape-wrapped threads, then dissolved in a weighed amount of
phosphate buffer (50 mM, pH 7.00). Adjusted molecular weights derived from TGA and 1H
NMR analyses were combined with the UV/VIS measurement to calculate the number of
trithiocarbonate groups molecules per chain.
4.3 Results and Discussion
4.3.1 Amino Polymer Synthesis
RAFT methodology has the advantage of producing polymers with low polydispersity,
controlled molecular weight, and a protected thiol at the chain end. These advantages are why I
chose RAFT polymerization to prepare the polymer backbone. As we will see below,
preservation of the chain-end –SH group is one of the main determinants of the success of these
reactions. As in Chapter 3, the synthesis involved the polymerization of t-butyl acrylate,92
deprotection to form poly(acrylic acid),94 conversion of the –COOH groups to a t-BOC-
aminoethylamide,95 followed by removal of the t-BOC group to yield a polymer with primary
amino groups along the backbone.
Scheme 4-1 describes the pendant group chemistry for the PtBA synthesized with 4-cyano-4-
(dodecylsulfanylthiocarbonyl)sulfanyl pentanoic acid (CTA) as the RAFT chain transfer agent.
Following deprotection of the t-butyl ester groups with trifluoroacetic acid (TFA), the polymer
was treated with an excess (2.5 eq. per –COOH group) of t-BOC-ethylenediamine in water using
DMTMM as a coupling agent. These are conditions that have been reported to convert the
carboxylic acid groups of PAA quantitatively to amide groups.95 As nucleophilic amines are
known to efficiently aminolyze trithiocarbonate groups, we initially expected the trithiocarbonate
group would be cleaved at the same time. To promote this cleavage, we allowed the polymer and
t-BOC-ethylenediamine to stir two days prior to addition to DMTMM. Within an hour after
adding the coupling agent, the solution turned milky, and overnight the BOC-amino-polymer
precipitated. Deprotection with TFA led to the polyamine polymer that we refer to as P4’.
Alternatively, DMTMM was added immediately after the t-BOC-ethylenediamine. Here, too,
the reaction turned milky over the first hour and the polymer precipitated overnight. We refer to
the polymer obtained here after deprotection with TFA as P4. The 1H NMR spectra of polymers
P4 and P4’ are presented in Figure 4-1 and Figure 4-2, respectively.
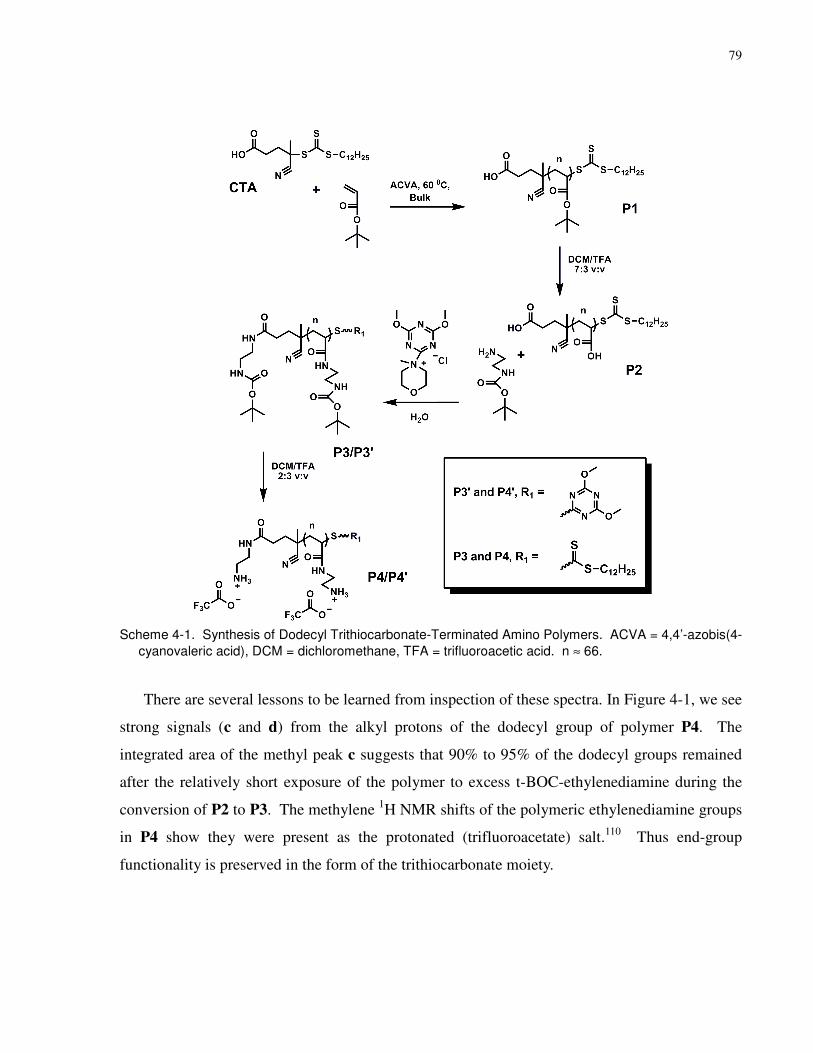
79
Scheme 4-1. Synthesis of Dodecyl Trithiocarbonate-Terminated Amino Polymers. ACVA = 4,4’-azobis(4-
cyanovaleric acid), DCM = dichloromethane, TFA = trifluoroacetic acid. n ≈ 66.
There are several lessons to be learned from inspection of these spectra. In Figure 4-1, we see
strong signals (c and d) from the alkyl protons of the dodecyl group of polymer P4. The
integrated area of the methyl peak c suggests that 90% to 95% of the dodecyl groups remained
after the relatively short exposure of the polymer to excess t-BOC-ethylenediamine during the
conversion of P2 to P3. The methylene 1H NMR shifts of the polymeric ethylenediamine groups
in P4 show they were present as the protonated (trifluoroacetate) salt.110 Thus end-group
functionality is preserved in the form of the trithiocarbonate moiety.
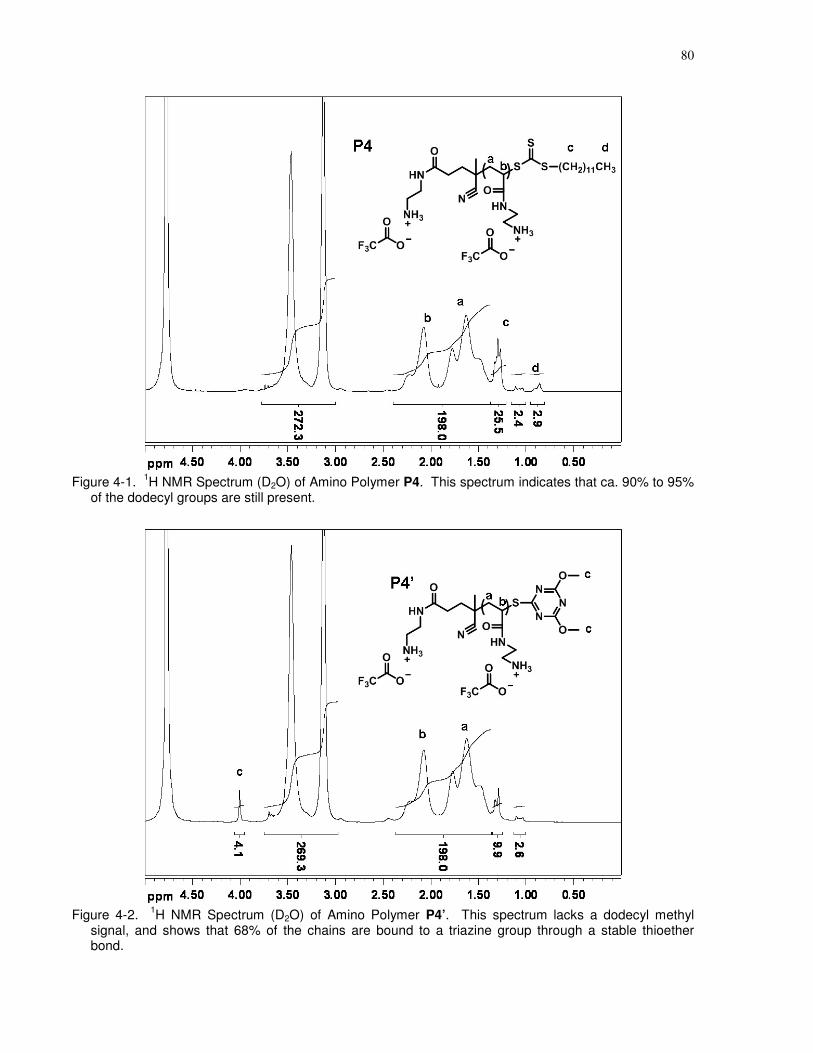
80
Figure 4-1. 1H NMR Spectrum (D2O) of Amino Polymer P4. This spectrum indicates that ca. 90% to 95%
of the dodecyl groups are still present.
Figure 4-2. 1H NMR Spectrum (D2O) of Amino Polymer P4’. This spectrum lacks a dodecyl methyl
signal, and shows that 68% of the chains are bound to a triazine group through a stable thioether bond.
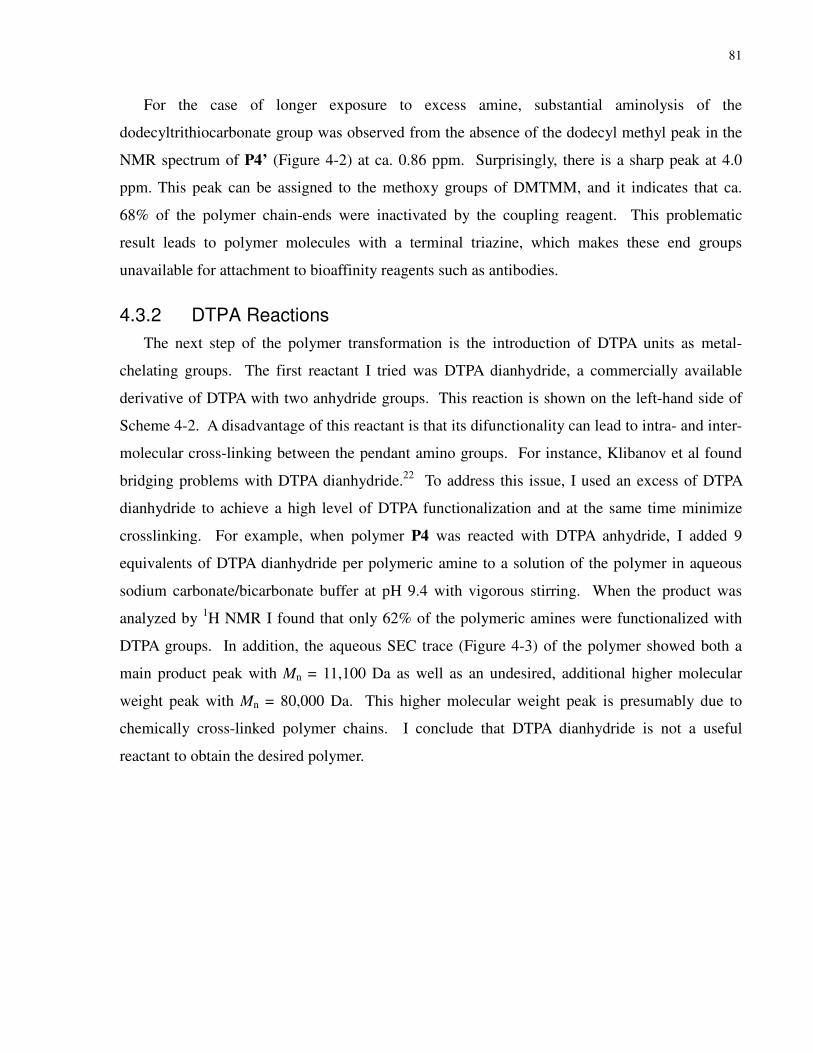
81
For the case of longer exposure to excess amine, substantial aminolysis of the
dodecyltrithiocarbonate group was observed from the absence of the dodecyl methyl peak in the
NMR spectrum of P4’ (Figure 4-2) at ca. 0.86 ppm. Surprisingly, there is a sharp peak at 4.0
ppm. This peak can be assigned to the methoxy groups of DMTMM, and it indicates that ca.
68% of the polymer chain-ends were inactivated by the coupling reagent. This problematic
result leads to polymer molecules with a terminal triazine, which makes these end groups
unavailable for attachment to bioaffinity reagents such as antibodies.
4.3.2 DTPA Reactions
The next step of the polymer transformation is the introduction of DTPA units as metal-
chelating groups. The first reactant I tried was DTPA dianhydride, a commercially available
derivative of DTPA with two anhydride groups. This reaction is shown on the left-hand side of
Scheme 4-2. A disadvantage of this reactant is that its difunctionality can lead to intra- and inter-
molecular cross-linking between the pendant amino groups. For instance, Klibanov et al found
bridging problems with DTPA dianhydride.22 To address this issue, I used an excess of DTPA
dianhydride to achieve a high level of DTPA functionalization and at the same time minimize
crosslinking. For example, when polymer P4 was reacted with DTPA anhydride, I added 9
equivalents of DTPA dianhydride per polymeric amine to a solution of the polymer in aqueous
sodium carbonate/bicarbonate buffer at pH 9.4 with vigorous stirring. When the product was
analyzed by 1H NMR I found that only 62% of the polymeric amines were functionalized with
DTPA groups. In addition, the aqueous SEC trace (Figure 4-3) of the polymer showed both a
main product peak with Mn = 11,100 Da as well as an undesired, additional higher molecular
weight peak with Mn = 80,000 Da. This higher molecular weight peak is presumably due to
chemically cross-linked polymer chains. I conclude that DTPA dianhydride is not a useful
reactant to obtain the desired polymer.
82
Figure 4-3. Comparison of Aqueous SEC Chromatographs of Polymer P5, Formed by Reaction of P4 with DTPA Dianhydride, and B1-P6, From the Reaction of P4 with DMTMM-DTPA. Calibration of the column with poly(methacrylic acid) standards leads to values of Mn = 80,000 Da (PDI = 1.07) and 11,100 Da (PDI = 1.25) for the two components of P5, and Mn = 22,100 Da (PDI = 1.24) for B1-P6.
As an alternative, I turned to DMTMM as an amide coupling agent (Scheme 4-2, right side).
As discussed in Chapter 3, using the DMTMM-DTPA procedure to couple DTPA to the polymer
resulted in a polymer product with quantitative DTPA functionality as determined by 1H NMR,
and no additional higher molecular weight peaks in the aqueous SEC.
1H NMR analysis of all three batches of P6, a DTPA polymer synthesized from P4 by the
DMTMM-DTPA method, confirms that the polymer batches are quantitatively functionalized
with DTPA. SEC analysis of B1-P6, as presented in Figure 4-3, shows two noteworthy features.
First, the peak of B1-P6 has double the molecular weight of the main peak of P5. This is a result
of the difference in DTPA functionality between the two polymers. Second, the peak of B1-P6
has a slight high molecular weight shoulder. Indeed, the two other batches of P(DTPA) polymer,
B2-P6 and B3-P6, show even more pronounced shoulders, with PDIs of 1.41 and 1.35
respectively. SEC chromatographs for all three batches of P6 are presented in the Chapter 4
Appendix as Figure 9-4.
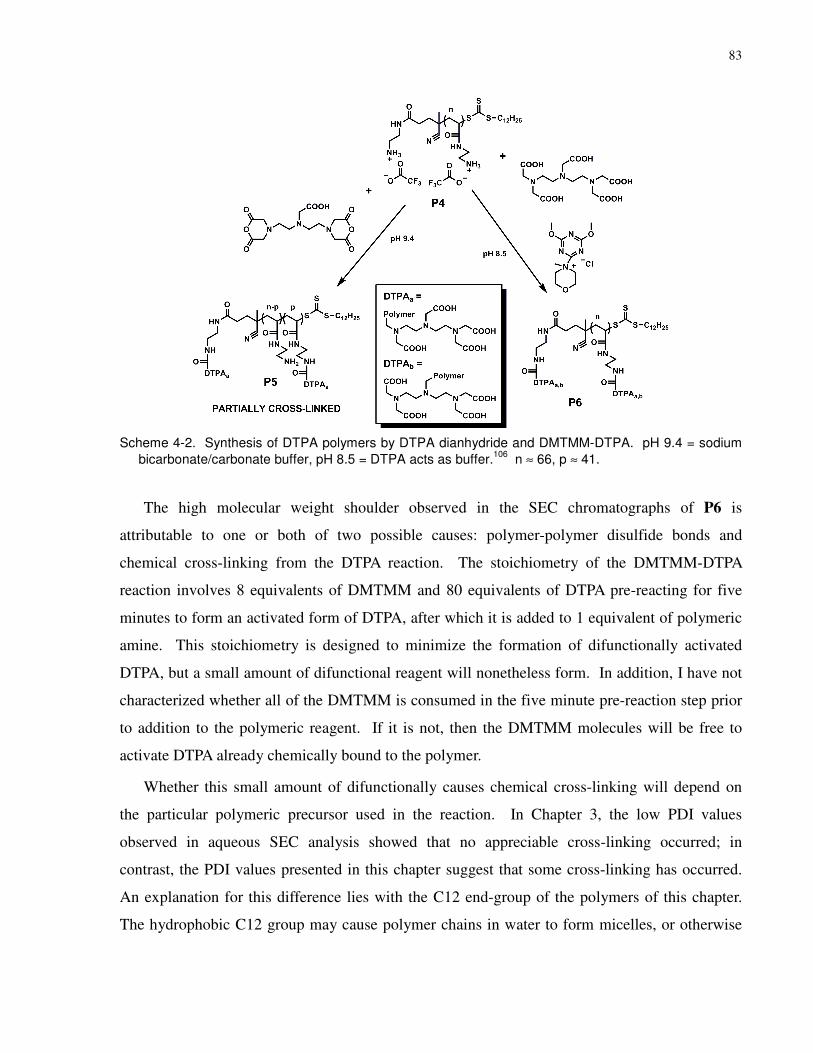
83
Scheme 4-2. Synthesis of DTPA polymers by DTPA dianhydride and DMTMM-DTPA. pH 9.4 = sodium
bicarbonate/carbonate buffer, pH 8.5 = DTPA acts as buffer.106
n ≈ 66, p ≈ 41.
The high molecular weight shoulder observed in the SEC chromatographs of P6 is
attributable to one or both of two possible causes: polymer-polymer disulfide bonds and
chemical cross-linking from the DTPA reaction. The stoichiometry of the DMTMM-DTPA
reaction involves 8 equivalents of DMTMM and 80 equivalents of DTPA pre-reacting for five
minutes to form an activated form of DTPA, after which it is added to 1 equivalent of polymeric
amine. This stoichiometry is designed to minimize the formation of difunctionally activated
DTPA, but a small amount of difunctional reagent will nonetheless form. In addition, I have not
characterized whether all of the DMTMM is consumed in the five minute pre-reaction step prior
to addition to the polymeric reagent. If it is not, then the DMTMM molecules will be free to
activate DTPA already chemically bound to the polymer.
Whether this small amount of difunctionally causes chemical cross-linking will depend on
the particular polymeric precursor used in the reaction. In Chapter 3, the low PDI values
observed in aqueous SEC analysis showed that no appreciable cross-linking occurred; in
contrast, the PDI values presented in this chapter suggest that some cross-linking has occurred.
An explanation for this difference lies with the C12 end-group of the polymers of this chapter.
The hydrophobic C12 group may cause polymer chains in water to form micelles, or otherwise
84
associate in space, which in turn would increase the likelihood of polymer chains becoming
chemically cross-linked.
4.3.3 Quantification of the C12 Trithiocarbonate End-Group at the P6 Stage
I describe two variations on the Amino Polymers presented in this chapter. In the first
variation, I attempted to aminolyze the trithiocarbonate group at the stage where t-BOC-
ethylenediamine was coupled to P2 PAA. As a result, polymer P4’ had 68% of its chains capped
with a stable thioether bond to a triazine ring. While it is reported that this group can be cleaved
by treating the thioether with an equivalent of sodium methoxide in refluxing methanol,111 this is
not an effective strategy to obtaining useful metal-chelating polymers.
In the second variation, I performed the DMTMM coupling of t-BOC-ethylenediamine to
PAA in a rapid manner in order to avoid significant aminolysis. The resultant polymer P4 was
more promising because it retained ca. 90% to 95% of its trithiocarbonate chain-ends, as
monitored by 1H NMR. DTPA groups were introduced along the backbone of P4 using the
DMTMM-DTPA reaction described above. I hypothesized that the dodecyltrithiocarbonate
groups would not be significantly cleaved during the DTPA reaction converting P4 to P6. In
aqueous solution, the polymeric amino groups of P4 start out as the trifluoroacetate salt. These
amino groups are deprotonated upon addition to the pH 8.5 DMTMM-DTPA solution, and
subsequently quickly react with the activated DTPA reagent to form amides. Still, some
hydrolysis or aminolysis of the trithiocarbonate groups is possible.
Thus, the degree of trithiocarbonate preservation at the P6 stage was characterized by 1H
NMR and UV/VIS spectroscopy. A partial 1H NMR spectrum of B3-P6 is presented in Figure
4-5(A). The integration of the methyl group indicates that the dodecyltrithiocarbonate is fully
present. The spectra of B1-P6 and B2-P6 are near identical to that of B3-P6. However, NMR
alone is not sufficient evidence, so the UV/VIS absorption of the polymeric trithiocarbonate
group of B3-P6 was also used as a measure of quantification.
In order to perform a quantitative UV/VIS measurement I required an extinction coefficient
for the trithiocarbonate. The literature contains a number of values ranging from 9,700 to 15,800
M-1cm-1 for trithiocarbonate containing RAFT agents.112,113,56,114 Considering the range of
values, I decided to experimentally determine the extinction coefficient myself, using the CTA
(4-cyano-4-(dodecylsulfanylthiocarbonyl)sulfanyl pentanoic acid) as a model compound. As a

85
control experiment, I collected UV/VIS spectra of the CTA in MeOH, iPrOH, and THF, and
found them identical. Thus MeOH was chosen as the solvent with which to determine the
extinction coefficient. Figure 9-5 and Figure 9-6 in the Chapter 3 Appendix contain the UV/VIS
spectra and extinction coefficient curves from this exercise. At 298 nm, ε = 10,000 ± 200 M-1cm-
1, and at 308 nm, ε = 9,700 ± 160 M-1cm-1.
After having determined the extinction coefficient of the trithiocarbonate group, my next step
was to analyze the DTPA polymer B3-P6. First, this polymer was analyzed by TGA using the
procedure described in Chapter 5. This analysis (Figure 9-7 of the Chapter 4 Appendix) gave a
result of 3.0 H2O and 2.6 Na+ per DTPA. 1H NMR and TGA data were combined, using the
mathematical method used in Chapters 3 and 5, to find that B3-P6 had an adjusted molecular
weight of 40,500 Da ± 10%. Next, the UV/VIS spectrum of this polymer was collected in
phosphate buffer (50 mM, pH 7.00). Unfortunately, there was not enough polymer sample
remaining to collect spectra at a range of concentrations, so only one solution was prepared.
This spectrum is presented in Figure 9-8 of the Chapter 4 Appendix. From the absorption at
308 nm I find that there are 0.94 ± 0.10 trithiocarbonate groups per chain. This result is
consistent with the idea that up to this point in the synthesis a small but non-zero fraction of the
trithiocarbonate groups have been aminolyzed. However, this fraction of 0.06 groups per chain
is still within the 0.10 error of the measurement.
4.3.4 Thiol End-Group Functionality and Conversion to a Terminal Maleimide
Preservation of end-group functionality on the polymer is a major goal of this research. It is
difficult to store polymers with a free –SH end group because of its sensitivity to oxidation and
other reactions. To avoid these problems, my strategy was to immediately convert these thiols to
a terminal maleimide group by reaction with a large excess of 2,2'-(ethylenedioxy)-
bis(ethylmaleimide). The maleimide also provides a signal in the 1H NMR that can be used for
quantifying the reactive end-group content of the polymer.
To recover the thiol end-groups protected as trithiocarbonate moieties, P6 was aminolyzed
using ethylenediamine. A number of considerations went into the design of the aminolysis
conditions. First, there is known precedence for problems in the hydrolysis of RAFT end groups
in basic aqueous solution. For example, Llauro and coworkers found that the hydrolysis of
trithiocarbonate-capped PAA by sodium hydroxide in water led not only to thiol and polymeric
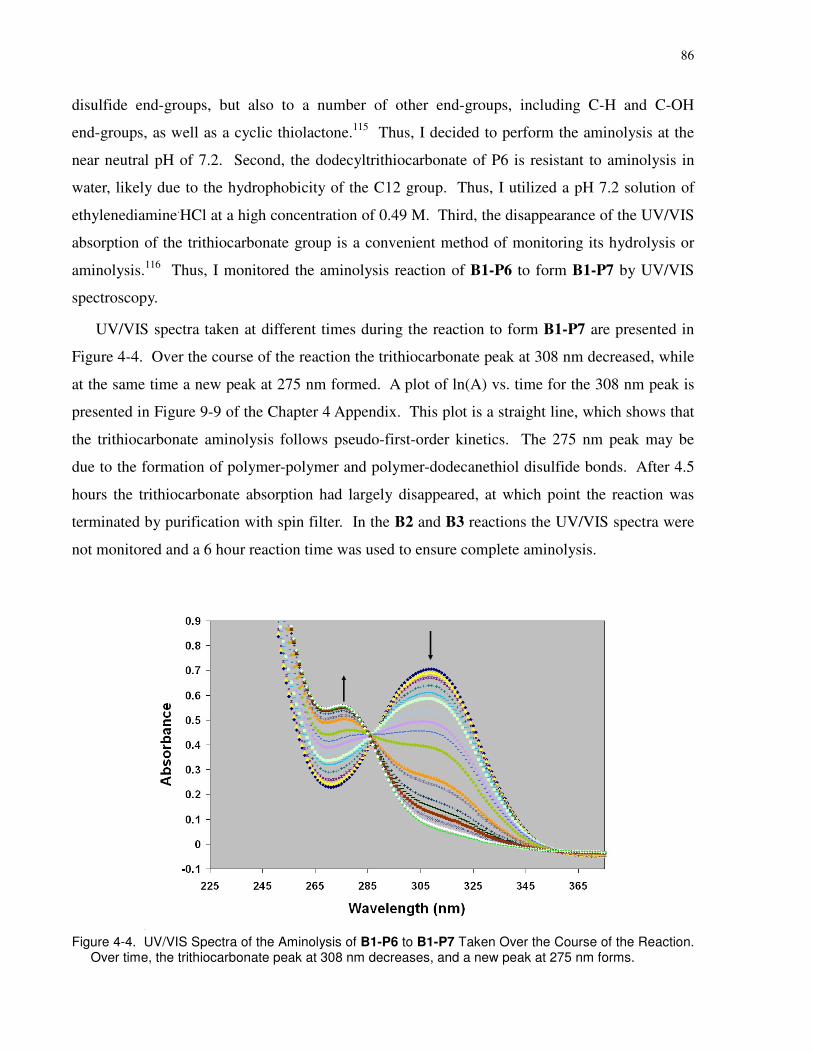
86
disulfide end-groups, but also to a number of other end-groups, including C-H and C-OH
end-groups, as well as a cyclic thiolactone.115 Thus, I decided to perform the aminolysis at the
near neutral pH of 7.2. Second, the dodecyltrithiocarbonate of P6 is resistant to aminolysis in
water, likely due to the hydrophobicity of the C12 group. Thus, I utilized a pH 7.2 solution of
ethylenediamine.HCl at a high concentration of 0.49 M. Third, the disappearance of the UV/VIS
absorption of the trithiocarbonate group is a convenient method of monitoring its hydrolysis or
aminolysis.116 Thus, I monitored the aminolysis reaction of B1-P6 to form B1-P7 by UV/VIS
spectroscopy.
UV/VIS spectra taken at different times during the reaction to form B1-P7 are presented in
Figure 4-4. Over the course of the reaction the trithiocarbonate peak at 308 nm decreased, while
at the same time a new peak at 275 nm formed. A plot of ln(A) vs. time for the 308 nm peak is
presented in Figure 9-9 of the Chapter 4 Appendix. This plot is a straight line, which shows that
the trithiocarbonate aminolysis follows pseudo-first-order kinetics. The 275 nm peak may be
due to the formation of polymer-polymer and polymer-dodecanethiol disulfide bonds. After 4.5
hours the trithiocarbonate absorption had largely disappeared, at which point the reaction was
terminated by purification with spin filter. In the B2 and B3 reactions the UV/VIS spectra were
not monitored and a 6 hour reaction time was used to ensure complete aminolysis.
Figure 4-4. UV/VIS Spectra of the Aminolysis of B1-P6 to B1-P7 Taken Over the Course of the Reaction. Over time, the trithiocarbonate peak at 308 nm decreases, and a new peak at 275 nm forms.
87
The P7 aminolyzed polymers were characterized by 1H NMR and aqueous SEC. A partial 1H
NMR for B3-P7 is presented in Figure 4-5(B). The integration of the dodecyl methyl signal is
2.8 out of a theoretically possible 3.0, which indicates that after aminolysis ca. 90% of the
dodecanethiol groups formed a mixed disulfide with the polymeric thiol. The integration of
dodecyl methyl signal in the 1H NMR spectra of B1-P7 and B2-P7 is 1.8 and 3.2, respectively.
Higher mixed disulfide yield may be a consequence of a longer reaction time, as the B1 reaction
time was 4.5 hours and the B2 and B3 reaction time was 6 hours. Nevertheless, it is reasonable
to conclude that P6 has a strong tendency to form mixed polymer-dodecanethiol disulfides upon
aminolysis to P7.
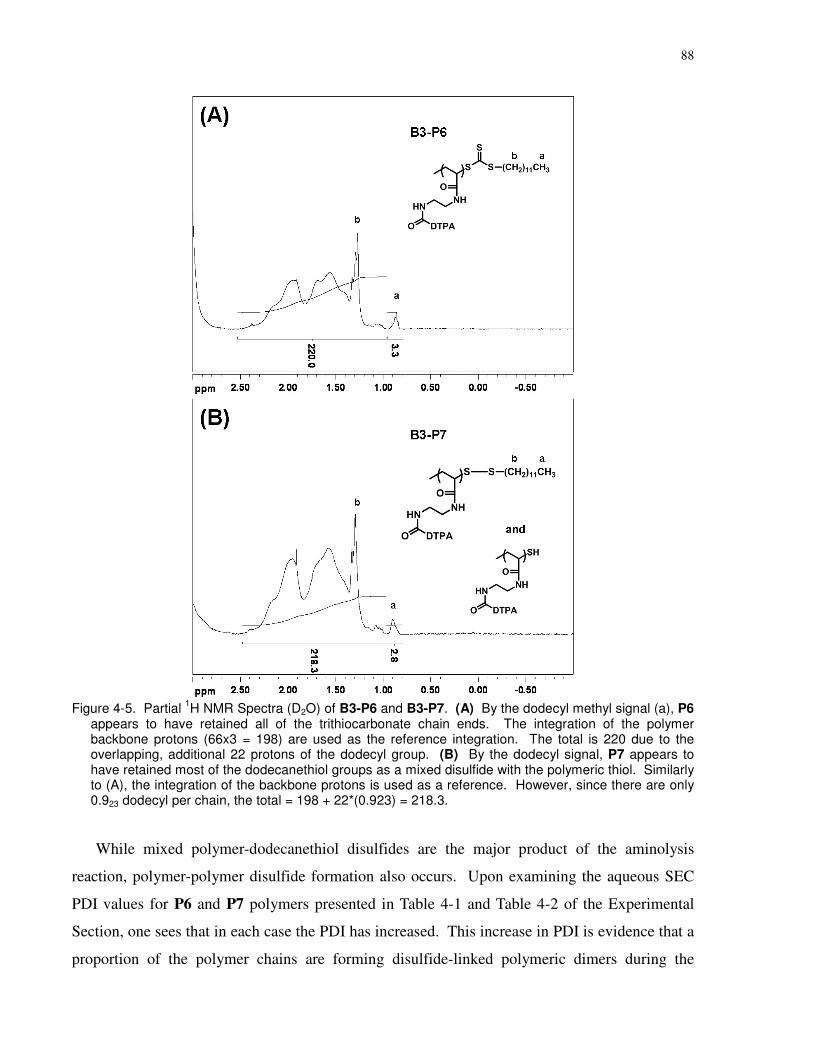
88
Figure 4-5. Partial 1H NMR Spectra (D2O) of B3-P6 and B3-P7. (A) By the dodecyl methyl signal (a), P6
appears to have retained all of the trithiocarbonate chain ends. The integration of the polymer backbone protons (66x3 = 198) are used as the reference integration. The total is 220 due to the overlapping, additional 22 protons of the dodecyl group. (B) By the dodecyl signal, P7 appears to have retained most of the dodecanethiol groups as a mixed disulfide with the polymeric thiol. Similarly to (A), the integration of the backbone protons is used as a reference. However, since there are only 0.923 dodecyl per chain, the total = 198 + 22*(0.923) = 218.3.
While mixed polymer-dodecanethiol disulfides are the major product of the aminolysis
reaction, polymer-polymer disulfide formation also occurs. Upon examining the aqueous SEC
PDI values for P6 and P7 polymers presented in Table 4-1 and Table 4-2 of the Experimental
Section, one sees that in each case the PDI has increased. This increase in PDI is evidence that a
proportion of the polymer chains are forming disulfide-linked polymeric dimers during the
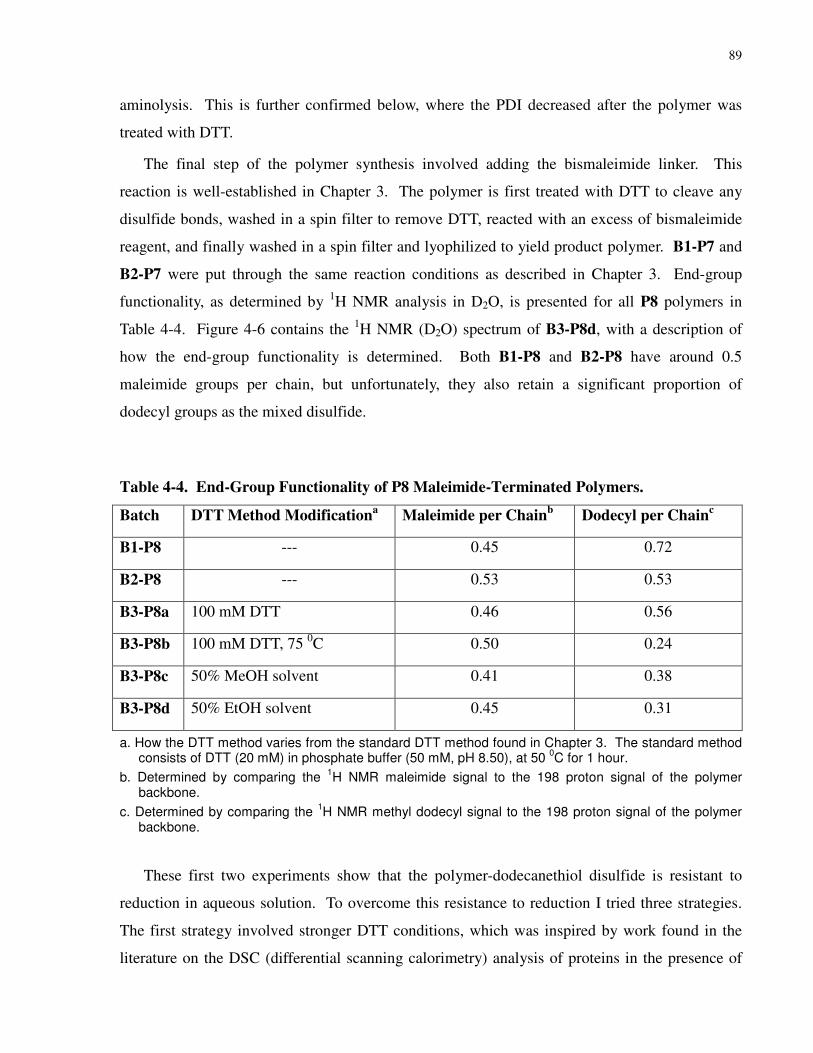
89
aminolysis. This is further confirmed below, where the PDI decreased after the polymer was
treated with DTT.
The final step of the polymer synthesis involved adding the bismaleimide linker. This
reaction is well-established in Chapter 3. The polymer is first treated with DTT to cleave any
disulfide bonds, washed in a spin filter to remove DTT, reacted with an excess of bismaleimide
reagent, and finally washed in a spin filter and lyophilized to yield product polymer. B1-P7 and
B2-P7 were put through the same reaction conditions as described in Chapter 3. End-group
functionality, as determined by 1H NMR analysis in D2O, is presented for all P8 polymers in
Table 4-4. Figure 4-6 contains the 1H NMR (D2O) spectrum of B3-P8d, with a description of
how the end-group functionality is determined. Both B1-P8 and B2-P8 have around 0.5
maleimide groups per chain, but unfortunately, they also retain a significant proportion of
dodecyl groups as the mixed disulfide.
Table 4-4. End-Group Functionality of P8 Maleimide-Terminated Polymers.
Batch DTT Method Modificationa Maleimide per Chain
b Dodecyl per Chain
c
B1-P8 --- 0.45 0.72
B2-P8 --- 0.53 0.53
B3-P8a 100 mM DTT 0.46 0.56
B3-P8b 100 mM DTT, 75 0C 0.50 0.24
B3-P8c 50% MeOH solvent 0.41 0.38
B3-P8d 50% EtOH solvent 0.45 0.31
a. How the DTT method varies from the standard DTT method found in Chapter 3. The standard method consists of DTT (20 mM) in phosphate buffer (50 mM, pH 8.50), at 50
0C for 1 hour.
b. Determined by comparing the 1H NMR maleimide signal to the 198 proton signal of the polymer
backbone.
c. Determined by comparing the 1H NMR methyl dodecyl signal to the 198 proton signal of the polymer
backbone.
These first two experiments show that the polymer-dodecanethiol disulfide is resistant to
reduction in aqueous solution. To overcome this resistance to reduction I tried three strategies.
The first strategy involved stronger DTT conditions, which was inspired by work found in the
literature on the DSC (differential scanning calorimetry) analysis of proteins in the presence of

90
denaturing agents. The authors show that increasing DTT concentration from 20 mM to 100 mM
can lead to a marked reduction in protein stability.117 Thus in the B3-P8a reaction, the
concentration of DTT was raised from 20 mM to 100 mM. Unfortunately, this trial did not show
any improvement.
The second strategy focused on making the disulfide group more accessible. It is my
hypothesis that the hydrophobicity of the dodecyl group imparts steric hindrance to the nearby
disulfide bond, making it difficult for DTT to approach. It is established that DTT will only
reduce disulfide bonds that are accessible.16 Some DTT procedures for proteins use a 2 minute
incubation in a boiling water bath to completely denature the protein and thus expose all
disulfide bonds.16 Therefore, my strategy for the B3-P8b reaction was to again use 100 mM
DTT, but with a higher temperature of 75 0C. This trial did not show an improvement in
maleimide yield, but happily the fraction of chains with dodecyl groups was reduced to only
0.24.
Figure 4-6. 1H NMR Spectrum (D2O) of B3-P8b. As in Figure 4-5, the integration of the polymer
backbone protons (66x3 = 198) plus remaining overlapping dodecyl integration are used as the reference integration. The integration of the dodecyl methyl signal at 0.88 ppm shows there are an average of 0.24 dodecyl groups per chain remaining. The integration of the maleimide signal at 6.88 ppm shows that there is an average of 0.50 maleimide groups per chain.
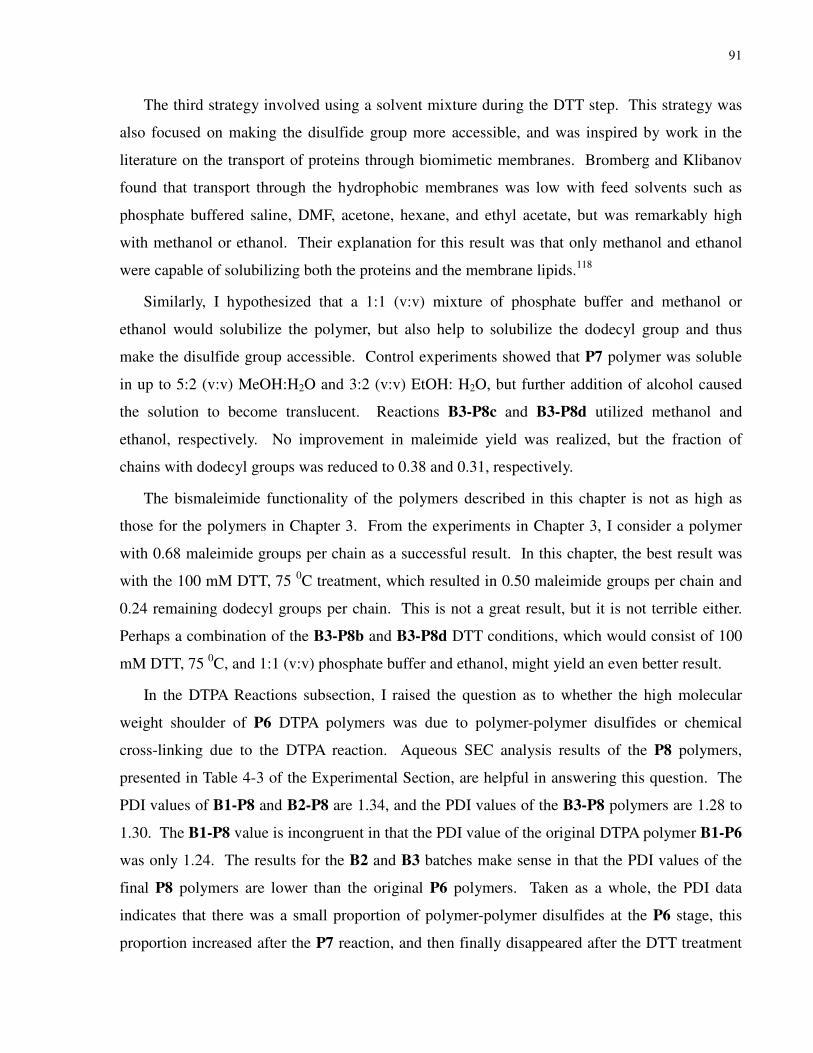
91
The third strategy involved using a solvent mixture during the DTT step. This strategy was
also focused on making the disulfide group more accessible, and was inspired by work in the
literature on the transport of proteins through biomimetic membranes. Bromberg and Klibanov
found that transport through the hydrophobic membranes was low with feed solvents such as
phosphate buffered saline, DMF, acetone, hexane, and ethyl acetate, but was remarkably high
with methanol or ethanol. Their explanation for this result was that only methanol and ethanol
were capable of solubilizing both the proteins and the membrane lipids.118
Similarly, I hypothesized that a 1:1 (v:v) mixture of phosphate buffer and methanol or
ethanol would solubilize the polymer, but also help to solubilize the dodecyl group and thus
make the disulfide group accessible. Control experiments showed that P7 polymer was soluble
in up to 5:2 (v:v) MeOH:H2O and 3:2 (v:v) EtOH: H2O, but further addition of alcohol caused
the solution to become translucent. Reactions B3-P8c and B3-P8d utilized methanol and
ethanol, respectively. No improvement in maleimide yield was realized, but the fraction of
chains with dodecyl groups was reduced to 0.38 and 0.31, respectively.
The bismaleimide functionality of the polymers described in this chapter is not as high as
those for the polymers in Chapter 3. From the experiments in Chapter 3, I consider a polymer
with 0.68 maleimide groups per chain as a successful result. In this chapter, the best result was
with the 100 mM DTT, 75 0C treatment, which resulted in 0.50 maleimide groups per chain and
0.24 remaining dodecyl groups per chain. This is not a great result, but it is not terrible either.
Perhaps a combination of the B3-P8b and B3-P8d DTT conditions, which would consist of 100
mM DTT, 75 0C, and 1:1 (v:v) phosphate buffer and ethanol, might yield an even better result.
In the DTPA Reactions subsection, I raised the question as to whether the high molecular
weight shoulder of P6 DTPA polymers was due to polymer-polymer disulfides or chemical
cross-linking due to the DTPA reaction. Aqueous SEC analysis results of the P8 polymers,
presented in Table 4-3 of the Experimental Section, are helpful in answering this question. The
PDI values of B1-P8 and B2-P8 are 1.34, and the PDI values of the B3-P8 polymers are 1.28 to
1.30. The B1-P8 value is incongruent in that the PDI value of the original DTPA polymer B1-P6
was only 1.24. The results for the B2 and B3 batches make sense in that the PDI values of the
final P8 polymers are lower than the original P6 polymers. Taken as a whole, the PDI data
indicates that there was a small proportion of polymer-polymer disulfides at the P6 stage, this
proportion increased after the P7 reaction, and then finally disappeared after the DTT treatment
92
of the P8 reaction. In Figure 4-7 I present the aqueous SEC chromatographs of B3-P6, B3-P7,
and B3-P8b as support for this hypothesis.
If the DTT treatment does cleave all polymer-polymer disulfides, one might ask why the final
PDI values of the B3-P8 polymers are as high as 1.28 to 1.30. By examining the remaining
high molecular weight shoulder of these polymers, for example as seen for B3-P8b in Figure
4-7, it seems that a small degree of chemical chain cross-linking did occur during the DMTMM-
DTPA reaction.
Figure 4-7. Aqueous SEC Chromatographs of B3-P6, Aminolyzed P7, and Maleimide End-Labeled P8b. B3-P6 has a proportion of polymer-polymer disulfides. This proportion increases in the aminolyzed sample, and is finally removed in the maleimide sample. The maleimide sample B3-P8b shows a small degree of chemical chain cross-linking. Calibration of the column with poly(methacrylic acid) standards leads to values of of Mn = 22,500 Da (PDI = 1.35) for B3-P6, Mn = 24,100 Da (PDI = 1.42) for B3-P7, and Mn = 20,700 Da (PDI = 1.28) for B3-P8b.
4.4 Summary
I describe the synthesis of a metal-chelating polymer based on a dodecyl trithiocarbonate
RAFT agent. A central part of the synthetic strategy was the recovery of end-group functionality
at a late stage of the synthesis. Unfortunately, the best result yielded only 0.50 maleimide groups
per chain, compared to the 0.68 maleimide groups per chain achieved using the strategy in
Chapter 3.
93
The dodecyl trithiocarbonate moiety utilized in this chapter is notable for its hydrophobicity
and consequent resistance to aqueous aminolysis. In the step where t-BOC-ethylenediamine was
coupled to P2 PAA, immediate addition of DMTMM to yield P3 (and subsequently deprotected
P4) yielded a polymer with 90-95% intact dodecyl trithiocarbonate groups, despite the polymer
having been in the presence of excess amine prior to precipitating out of solution. Alternatively,
allowing P2 PAA to incubate with the amine for two days prior to addition of DMTMM led to
substantial aminolysis of the trithiocarbonate. This led to an undesirable triazine thioether end-
group, so this approach was not investigated further.
The P4 polymer was subsequently used to prepare the DTPA polymer P6. UV/VIS analysis
demonstrated that the P6 polymer retained ca. 0.94 trithiocarbonate groups per chain. Gentle
aminolysis conditions were devised in order to liberate the polymeric thiol end-group, and it was
possible to monitor the completeness of the aminolysis reaction through UV/VIS spectroscopy.
Upon 1H NMR analysis of the aminolyzed product P7, I found that the majority of the chains
were in the form of mixed disulfides with dodecanethiol.
A number of reactions were performed to add a bismaleimide linker to the P7 polymer.
Different reaction conditions focused on the DTT step, with strategies including a higher
concentration of DTT, a higher temperature, and mixtures of phosphate buffer and alcohols as
solvent. The best result was with the 100 mM DTT at 75 0C reduction conditions, which yielded
0.50 maleimide groups per chain plus 0.24 undesired remaining dodecyl groups per chain.
Perhaps these conditions combined with 1:1 (v:v) phosphate buffer:ethanol as solvent can
improve upon this result.
Taken as a whole, aqueous SEC analysis of the P6, P7, and P8 samples shed further light on
the system. At the P6 stage a high molecular weight shoulder was observed, at the P7 stage this
shoulder increased in size, and at the P8 stage this shoulder was reduced but still present. This
can be explained as follows: the shoulder in the P6 chromatograph was due to a combination of
polymer-polymer disulfide as well as chemical cross-links, and the shoulder in the P8
chromatograph is due only to the chemical cross-links. This is interesting because it shows that
good water-solubility of the reactant Amino Polymer, which P4 presumably does not have, is
important in preventing the introduction of chemical cross-links during the DMTMM-DTPA
reaction

94
4.5 Contents of Appendix to Chapter 4
Aqueous SEC chromatographs of the three batches of P6, UV/VIS spectra and an extinction
coefficient curve for the CTA in MeOH, TGA trace of B3-P6, UV/VIS spectrum of B3-P6 in
phosphate buffer, and a plot of ln(A) vs time for the aminolysis of B1-P6 to form B1-P7.
95
5 Chapter 5: Curious Results with Palladium- and Platinum-Carrying Polymers in Mass Cytometry Bioassays and an Unexpected Application as a Dead Cell Stain
5.1 Introduction
To carry out multiplexed immunoassays by mass cytometry, one labels antibodies with metal-
chelating polymers in such a way that each distinct antibody, targeted to a specific cell
biomarker, is labeled with a different metal isotope. Lanthanide isotopes are ideal for this
purpose. They have low natural abundance and similar chemistry, and isotopically enriched
lanthanides such as 151Eu and 153Eu are available commercially. This means that a common
metal-chelating polymer, with appropriate end-functionality for attachment to an antibody, will
serve to label many different antibodies for a multiplexed immunoassay. I have described the
synthesis and some applications of this type of polymer in Chapter 3. Using this approach,
coworkers and I have reported an 11-plex assay of the cell types present in human cord blood
and a 20-plex assay of the biomarker distribution in leukemic cell lines and in patient samples
obtained from the Leukemic Cell Bank of Quebec. While in principle there are more than 50
discrete isotopes of lanthanide (Ln) metals, which would make a 50-plex assay possible, in
practice only 31 are readily available.
When our group began this research 5 years ago, the idea that 30-plex immunoassays could
be carried out seemed only a dream. Now such assays are routine, with instrumentation and
reagents commercially available. With its success has come a growing need to increase the
multiplicity of cell surface and intracellular biomarkers that can be detected at high throughput
on individual cells. Thus we need to turn our attention to water-soluble polymers that can bind
other metals, with masses in the range of 100 to 220 amu that can be detected by mass cytometry.
Palladium and platinum represent promising choices for use in mass cytometric bioassays.
They are in the same periodic table group, and thus have similar chemistry. Together they have 8
isotopes with at least 10% natural abundance that are commercially available in 95%+ isotopic
purity. These 8 isotopes represent additional labels that can be used, in principle, to increase the
multiplicity of immunoassays. In addition, there exists literature describing palladium(II) and
platinum(II) complexes with polyaminocarboxylates such as EDTA, DTPA, and
96
TTHA.119,120,121,122,123 One of the challenges I address in this chapter is the extension of the
DTPA synthetic methodology I present in Chapter 3 to attach EDTA (ethylenediaminetetraacetic
acid), TTHA (triethylenetetraminehexaacetic acid), and DOTA (tetraazocyclododecanetetraacetic
acid) as pendant groups to the polymer backbone. Another more serious challenge is that many
of the conditions used to synthesize polyaminocarboxylates complexes of Pd(II) and Pt(II) are
quite harsh and risk destroying the polymeric maleimide group used for attachment to an
antibody. I have sought more gentle conditions for loading palladium and platinum into metal-
chelating polymers.
In the experiments reported here, I describe the synthesis of polymers containing EDTA,
DTPA, TTHA, and DOTA pendant groups using a sample of the Amino-Polymer-Disulfide with
DPn = 79 per phenyl end group as a common precursor. I report conditions for coupling a
fluorescein dye on the end of each chain via reduction of the disulfide to a pair of –SH groups.
The dye enables a rapid assay of the metal ion content of the polymers by a combination of
UV/VIS and ICP-MS measurements. This assay was used to examine the loading of lanthanide,
palladium, and platinum ions into polymers with pendant EDTA, DTPA, TTHA, or DOTA
ligands. Based upon those results, I prepared samples of a Pd-loaded and a Pt-loaded EDTA-
containing polymer and Dr. Olga Ornatsky employed them in a model mass cytometric
immunoassay. The results of the bioassay were unexpected. These polymers were uniquely
effective in labeling the small fraction of dead cells in a cell population, rather than the target
antigen of the labeled antibody.
5.2 Experimental
5.2.1 Polymer Synthesis
5.2.1.1 Materials
All reagents and solvents, including ethylenediaminetetraacetic acid disodium salt dihydrate
(EDTA) (Sigma, 99%), diethylenetriaminepentaacetic acid (DTPA) (98%, Aldrich),
triethylenetetraaminehexaacetic acid (TTHA) (98%, Aldrich), tetraazocyclododecanetetraacetic
acid hexahydrate (DOTA.6H2O) (≥95%, Macrocyclics), dithiothreitol (DTT) (99%, Aldrich),
lanthanum(III) chloride hydrate (≥99.0%, Fluka), terbium(III) chloride hexahydrate (99.999%,
Aldrich), ytterbium(III) chloride hexahydrate (99.9%, Aldrich), potassium
tetrachloropalladate(II) (K2PdCl4, 99.99%, Aldrich), potassium tetrachloroplatinate(II) (K2PtCl4,
97
99.99%, Aldrich), dichloro(ethylenediamine)platinum(II) (Pt(en)Cl2, Aldrich)), and other
compounds were used without further purification unless otherwise noted. Water was purified
through a MilliQ water purification system (12 MΩcm). All buffers were prepared in our
laboratory. The 4 mL and 15 mL 3 kDa MWCO Millipore Amicon spin filters were purchased
from Fisher Science. The 0.5 mL Pall Nanosep 3K Omega filters and 0.45 µm MF filters were
purchased from VWR. The Pall Acrodisc 13 mm syringe filters with 200 nm nylon membrane
were purchased from VWR.
2,2'-(ethylenedioxy)bis(ethylmaleimide) (Acanthus Research, Toronto, Canada), 4-(4,6-
dimethoxy-1,3,5-triazin-2-yl)-4-methylmorpholinium chloride (DMTMM, Acros Organics,
99+%, from Fisher Science, Canada), and N-(5-Fluoresceinyl)maleimide (Sigma, 90+%) were
stored in a dessicator inside a freezer at -20 0C. Before use, their temperatures were equilibrated
in a dessicator kept at room temperature.
5.2.1.2 Polymer Synthesis
5.2.1.2.1 Amino Polymer-Disulfide
A new batch of DPn = 79 Amino Polymer-Disulfide was synthesized in an identical manner,
and from the same batch of PAA-Disulfide, as presented in Chapter 3.
5.2.1.2.2 Synthesis of P(EDTA)
EDTA (ethylenediaminetetraacetic acid disodium salt dihydrate, 6.53 g, ca. 80 equivalents to
each polymeric amino group) and H2O (16 mL) were added to a 100 mL round-bottom flask.
Next, NaOH (5 M aq.) was added with stirring to create a solution of pH 8.75 (monitored with a
pH meter). The resultant volume was 25 mL. DMTMM (500 mg, ca. 8 equivalents to each
polymeric amino group) was dissolved in water (10 mL) with sonication and added quickly with
stirring to the first solution. This solution was given 5 minutes to pre-react. Then a solution of
the Amino Polymer (50 mg) in water (10 mL) was added quickly with stirring. The reaction
solution was stirred for 1 hour, concentrated in 2x 15 mL 3kDA MWCO Millipore Amicon spin
filters, and washed with water (9 x 11 mL for each filter). Finally, the aqueous solution was
freeze-dried to yield P(EDTA)-Disulfide.; Yield = 97 mg (95%); 1H NMR (D2O): δ(ppm,
integrated peak areas reported based on C6H5 = 5H) 1.0-2.4 (b, 3H per monomer, backbone,
integration = 240), 2.7-4.2 (broad m, 4H ethylenediamine and 12H EDTA per monomer,
98
integration = 1373), 7.15 – 7.45 (broad t, 5H phenyl, integration = 5.0); SEC (Aqueous, relative
to poly(methacrylic acid) standards, RI) Mn = 33,200 Da, PDI = 1.19.
5.2.1.2.3 Synthesis of P(DTPA)
DTPA (6.90 g, ca. 80 equivalents to each polymeric amino group) and H2O (10 mL) were
added to a 100 mL round-bottom flask. Next, NaOH (5 M aq.) was added with stirring to create
a solution of pH 8.5 (monitored with a pH meter). The resultant volume was 29 mL. DMTMM
(500 mg, ca. 8 equivalents to each polymeric amino group) was dissolved in water (10 mL) with
sonication and added quickly with stirring to the first solution. This solution was given 5
minutes to pre-react. Then a solution of the Amino Polymer (50 mg) in water (10 mL) was
added quickly with stirring. The reaction solution was stirred for 1 hour, concentrated in 2x 15
mL 3kDA MWCO Millipore Amicon spin filters, and washed with water (9 x 11 mL for each
filter). Finally, the aqueous solution was freeze-dried to yield P(DTPA)-Disulfide.; Yield = 111
mg (87%); 1H NMR (D2O): δ(ppm, integrated peak areas reported based on C6H5 = 5H) 1.0-2.4
(b, 3H per monomer, backbone, integration = 233), 2.7-4.2 (broad m, 4H ethylenediamine and
18H DTPA per monomer, integration = 1845), 7.15 – 7.45 (broad t, 5H phenyl, integration =
5.0); SEC (Aqueous, relative to poly(methacrylic acid) standards, RI) Mn = 37,200 Da, PDI =
1.18.
5.2.1.2.4 Preparation of Fully Protonated Form of P(DTPA)
P(DTPA) (14.7 mg) was dissolved in H2O (11 mL) and transferred to a 15 mL 3 kDA
MWCO Millipore Amicon spin filter, after which the solution was concentrated through the
filter. Next, the solution was washed with aqueous acetic acid (100 mM, pH ~2.9) (4 x 11 mL)
and water (3 x 11 mL). During the final two aqueous acetic acid washes the polymer was
observed to partially precipitate from solution. After the completion of the washes, the polymer
was recovered by scraping precipitated polymer up with a glass Pasteur pipette as well as by
repeated rinsing with water (5 x 0.5 mL), followed by lyophilization.; Yield = 10.0 mg (75%);
Sparing soluble in water, estimated solubility ~ 2 mg/mL.
5.2.1.2.5 Synthesis of P(TTHA)
TTHA (5.0 g, ca. 80 equivalents to each polymeric amino group) and H2O (2.9 mL) were
added to a 100 mL round-bottom flask. Next, NaOH (5 M aq.) was added with stirring to create
a solution of pH 8.5 (monitored with a pH meter). The resultant volume was 16 mL. DMTMM
99
(289 mg, ca. 8 equivalents to each polymeric amino group) was dissolved in water (5.8 mL) with
sonication and added quickly with stirring to the first solution. This solution was given 5
minutes to pre-react. Then a solution of the Amino Polymer (28.8 mg) in water (5.8 mL) was
added quickly with stirring. The reaction solution was stirred for 1 hour, concentrated in 2x 15
mL 3kDA MWCO Millipore Amicon spin filters, and washed with water (9 x 11 mL for each
filter). Finally, the aqueous solution was freeze-dried to yield P(TTHA)-Disulfide.; Yield = 78
mg (87%); 1H NMR (D2O): δ(ppm, integrated peak areas reported based on C6H5 = 5H) 1.0-2.4
(b, 3H per monomer, backbone, integration = 230), 2.7-4.2 (broad m, 4H ethylenediamine and
24H TTHA per monomer, integration = 2272), 7.15 – 7.45 (broad t, 5H phenyl, integration =
5.0); SEC (Aqueous, relative to poly(methacrylic acid) standards, RI) Mn = 39,200 Da, PDI =
1.19.
5.2.1.2.6 Synthesis of P(DOTA)
DOTA.6H2O (2.0 g, ca. 70 equivalents to each polymeric amino group) and H2O (2.54 mL)
were added to a 50 mL round-bottom flask. Next, NaOH (5 M aq.) was added with stirring to
create a solution of pH 8.5 (monitored with a pH meter). The resultant volume was 5 mL.
DMTMM (123.4 mg, ca. 8 equivalents to each polymeric amino group) was dissolved in water
(2.54 mL) with sonication and added quickly with stirring to the first solution. This solution was
given 5 minutes to pre-react. Then a solution of the Amino Polymer (12.7 mg) in water (2.54
mL) was added quickly with stirring. The reaction solution was stirred for 1 hour, concentrated
in a 15 mL 3kDA MWCO Millipore Amicon spin filter, and washed with water (9 x 11 mL).
Finally, the aqueous solution was freeze-dried to yield P(DOTA)-Disulfide.; Yield = 30.0 mg
(91%); 1H NMR (D2O): δ(ppm, integrated peak areas reported based on C6H5 = 5H) 1.0-2.4 (b,
3H per monomer, backbone, integration = 221), 2.7-4.2 (broad m, 4H ethylenediamine and 24H
DOTA per monomer, integration = 2112), 7.15 – 7.45 (broad t, 5H phenyl, integration = 5.0);
SEC (Aqueous, relative to poly(methacrylic acid) standards, RI) Mn = 30,500 Da, PDI = 1.19.
5.2.1.2.7 Reduction of P(EDTA)-Disulfide with DTT Followed by Reaction with N-(5-fluoresceinyl)maleimide
I describe this reaction for P(EDTA)-Disulfide; however, the reaction was identical for
P(DTPA) and P(TTHA), and scaled accordingly for P(DOTA). A solution of DTT (dithiothreitol,
20 mM, 2.5 mL) was freshly prepared in phosphate buffer (50 mM, pH 8.50). P(EDTA)-
Disulfide (35 mg) was transferred to a 20 mL scintillation vial with stir bar and dissolved in 1050
100
µL of this DTT solution. The vial threads were wrapped with Teflon tape; the cap was secured,
and the solution was stirred at 50 0C for one hour. Immediately afterwards the polymer solution
was diluted with acetate buffer (10 mL, 50 mM, pH 3.0) and transferred to a 15 mL 3 kDA
MWCO Millipore Amicon spin filter. The solution was spun through the filter, after which the
polymer was washed (3 x 11 mL) with aqueous acetic acid (5 mM, pH = 3.5). Next, the resultant
polymer solution (350 µL) was transferred to a 20 mL scintillation vial and diluted to a total
volume of 1050 µL with phosphate buffer (200 mM, pH 7.00). A freshly prepared solution of N-
(5-Fluoresceinyl)maleimide (5 mg) in DMF (525 uL) was quickly added with mixing to the
polymer solution, and the solution was stirred for 1 hr at room temperature while protected from
light. Directly after this, the solution was diluted with phosphate buffer (200 mM, pH 8.50),
transferred to a new 15 mL 3 kDA MWCO Millipore Amicon spin filter, and washed with
phosphate buffer (200 mM, pH 8.50) (4 x 11 mL) followed by water (3 x 11 mL). Finally, the
aqueous solution was filtered through a Pall Acrodisc 13 mm syringe filter with 200 nm nylon
membrane and freeze-dried to yield P(EDTA)-Fluorescein. Yield = 32 mg (91%); SEC
(Aqueous, relative to poly(methacrylic acid) standards, RI) Mn = 20,700 Da, PDI = 1.20, strong
corresponding peak observed in the UV/VIS trace monitored at 494 nm.
P(DTPA) N-(5-Fluoresceinyl)maleimide Reaction. Yield = 32 mg (91%); SEC (Aqueous,
relative to poly(methacrylic acid) standards, RI) Mn = 23,600 Da, PDI = 1.20, strong
corresponding peak observed in the UV/VIS trace monitored at 494 nm.
P(TTHA) N-(5-Fluoresceinyl)maleimide Reaction. Yield = 33 mg (94%); SEC (Aqueous,
relative to poly(methacrylic acid) standards, RI) Mn = 25,100 Da, PDI = 1.19, strong
corresponding peak observed in the UV/VIS trace monitored at 494 nm.
P(DOTA) N-(5-Fluoresceinyl)maleimide Reaction. Yield = 11.7 mg (75%); SEC
(Aqueous, relative to poly(methacrylic acid) standards, RI) Mn = 18,200 Da, PDI = 1.22, strong
corresponding peak observed in the UV/VIS trace monitored at 494 nm.
5.2.1.2.8 Reduction of P(EDTA)-Disulfide with DTT Followed by Functionalization with a Bismaleimide Linker
I describe this reaction for P(EDTA)-Disulfide; however, the reaction conditions were
identical for P(TTHA). A solution of DTT (dithiothreitol, 20 mM, 2.5 mL) was freshly prepared
in phosphate buffer (50 mM, pH 8.50). P(EDTA)-Disulfide (12 mg) was transferred to a 20 mL
scintillation vial with stir bar and dissolved in 360 µL of this DTT solution. The vial threads were
101
wrapped with Teflon tape; the cap was secured, and the solution was stirred at 50 0C for one
hour. Immediately afterwards the polymer solution was diluted with acetate buffer (3.5 mL, 50
mM, pH 3.0) and transferred to a 4 mL 3 kDA MWCO Millipore Amicon spin filter. The
solution was spun through the filter, after which the polymer was washed (3 x 4 mL) with
aqueous acetic acid (5 mM, pH = 3.5). Next, the resultant polymer solution (150 µL) was
transferred to a 2 dram vial and diluted to a total volume of 360 µL with phosphate buffer (200
mM, pH 7.00). A freshly prepared solution of 2,2'-(ethylenedioxy)bis(ethylmaleimide) (12 mg)
in DMF (180 uL) was quickly added with mixing to the polymer solution, and the solution was
stirred for 1 hr at room temperature. Directly after this, the solution was diluted with water (2
mL), filtered through a Pall Acrodisc 13 mm syringe filter with 200 nm nylon membrane into a
new 4 mL 3 kDA MWCO Millipore Amicon spin filter, and washed with water, (3 x 4 mL),
phosphate buffer (200 mM, pH 7.00) (1 x 4 mL), and again water (3 x 4 mL). Finally, the
aqueous solution was filtered through a Pall Acrodisc 13 mm syringe filter with 200 nm nylon
membrane and freeze-dried to yield P(EDTA)-Maleimide. Yield = 10.7 mg (89%); 1H NMR
(D2O): δ(ppm, integrated peak areas reported based on C6H5 = 5H) 1.0-2.4 (broad, 3H per
monomer, backbone, integration = 268), 2.7-4.0 (broad m, 4H ethylenediamine and 12H EDTA
per monomer, integration = 1503), 6.88 (s, 2H vinylic maleimide, integration = 1.79), 7.15 – 7.45
(broad peaks, 5H phenyl, integration = 5.0). SEC (Aqueous, relative to poly(methacrylic acid)
standards, RI) Mn = 20,200 Da, PDI = 1.20.
P(TTHA) Bismaleimide Reaction. Yield = 12.0 mg (100%); 1H NMR (D2O): δ(ppm,
integrated peak areas reported based on C6H5 = 5H) 1.0-2.4 (b, 3H per monomer, backbone,
integration = 250), 2.7-4.2 (broad m, 4H ethylenediamine and 24H TTHA per monomer,
integration = 2343), 6.88 (s, 2H vinylic maleimide, integration = 1.47), 7.15 – 7.45 (broad peaks,
5H phenyl, integration = 5.0). SEC (Aqueous, relative to poly(methacrylic acid) standards, RI)
Mn = 27,000 Da, PDI = 1.22.
5.2.2 Metal-Loading Reactions
5.2.2.1 Lanthanides
P(EDTA)-Fluorescein, P(DTPA)-Fluorescein, and P(DOTA)-Fluorescein were loaded with
lanthanum, terbium, and/or ytterbium ions in a number of different reaction trials. Polymer (0.4
mg) was dissolved in 190 µL of ammonium acetate buffer (20 mM, pH 6.0) and transferred to a 2
mL centrifuge tube. A volume of LnCl3 solution (50 mM aqueous solution) containing the
102
desired number of metal equivalents was added. The solution was incubated at 37 0C for 30
minutes or 3 hours while protected from light. During this incubation step, the reaction between
P(DTPA) and 1.5 equivalents of LaCl3 precipitated as an orange solid (with colorless mother
liquor), and could not be redispersed. Consequently, this particular reaction trial was discarded.
In the other reaction trials, the reaction solution was concentrated on a 0.5 mL Pall Nanosep 3K
Omega spin filter and subsequently washed with tris-buffered saline (25 mM Tris, 150 mM
NaCl, 2 mM KCl, pH 7.4) (3 x 300 µL) and water (3 x 300 µL). After the first tris-buffered
saline wash, the reaction trial for P(EDTA) and 1.5 equivalents of TbCl3 had precipitated as an
orange solid (with colorless mother liquor), and would not redissolve with pipette-mixing. Thus,
this reaction trial was discarded as well. For the remaining reaction trials, after completion of the
washes, the resultant polymer solution was split into two 2 mL centrifuge tubes, dried on an
Eppendorf Vacufuge Plus, and both ca. 0.2 mg aliquots were subsequently stored for further use
at room temperature protected from light.
5.2.2.2 Palladium
P(EDTA)-Fluorescein, P(DTPA)-Fluorescein, P(TTHA)-Fluorescein, and P(DOTA)-
Fluorescein were loaded with palladium. Polymer (0.4 mg) was dissolved in 100 µL of water. A
solution of K2PdCl4 (for P(EDTA) 0.305 mg [1.1 equiv. per ligand] or 0.555 mg [2 equiv. per
ligand], for P(DTPA) 0.442 mg [2 equiv. per ligand], for P(TTHA) 0.716 mg [4 equiv. per
ligand], for P(DOTA) 0.449 mg [2 equiv. per ligand]) in HCl (50 mM, 1500 µL) was added. The
solution was incubated at room temperature for 2 hours or overnight, while protected from light.
Approximately one hour after the addition of the palladium solution the polymer was observed to
precipitate as a fluffy yellow precipitate. After the incubation period was complete, the
precipitate was spun down by centrifugation (5 min at 11,000 RCF). The mother liquor was
pipetted off, after which the precipitate was rinsed, vortexed, and spun down (5 min at 11,000
RCF) with 50 mM HCl (3 x 300 µL). To the precipitate was added phosphate buffer (200 mM,
pH 7.00, 300 µL), and the mixture was vortexed until a clear solution formed. This solution was
concentrated on a 0.5 mL Pall Nanosep 3K Omega spin filter and subsequently washed once
more with phosphate buffer (200 mM, pH 7.00, 300 µL), followed by washes with water (2 x
300 µL). After completion of the washes the polymer solution was split into two 2 mL centrifuge
tubes, dried on an Eppendorf Vacufuge Plus, and both ca. 0.2 mg aliquots were subsequently
stored for further use at room temperature protected from light.
103
5.2.2.3 Platinum
P(EDTA)-Fluorescein was loaded with platinum. To Pt(en)Cl2 (0.220 mg [0.8 equiv. per
ligand], or 0.551 mg [2 equiv, per ligand]) in a 2 mL centrifuge tube with locking cap was added
a solution of AgNO3 (0.220 mg or 0.549 mg, respectively [1.9 equiv. per Pt(en)Cl2]) in H2O (100
µL). This mixture was incubated in a 60 0C oven for 3 hours, with short sonication every half
hour, during which the platinum reagent dissolved and AgCl precipitated. The mixture was then
incubated at 4 0C for 1 hour. Immediately, the platinum solution was filtered through a 0.5 mL
Pall Nanosep 0.45 µm MF spin filter to remove AgCl. Polymer (0.4 mg) was dissolved in 100
µL of water and transferred to a 2 mL centrifuge tube, after which platinum solution (100 µL)
was added. This solution was incubated at room temperature in the dark for 30 minutes (0.8
equiv Pt) or 2 hours (2 equiv. Pt), after which it was transferred to a 0.5 mL Pall Nanosep 3K
Omega spin filter. The reaction centrifuge tube was rinsed with phosphate buffer (200 mM, pH
7.00, 100 µL) and the rinse was added to the spin filter. The solution was concentrated on the
spin filter and subsequently washed with phosphate buffer (200 mM, pH 7.00, 2 x 300 µL) and
water (2 x 300 µL). After completion of the washes the polymer solution was split into two 2 mL
centrifuge tubes, dried on an Eppendorf Vacufuge Plus, and both ca. 0.2 mg aliquots were
subsequently stored for further use at room temperature protected from light.
5.2.3 Instrumentation and Characterization
5.2.3.1 UV/VIS Spectroscopy
UV/VIS spectra of the fluorescein-labeled polymers were collected on a Perkin Elmer
Lambda 35 UV/VIS spectrometer. Polymer sample (ca. 0.5 mg) was accurately weighed on a
Mettler Toledo MX5 microbalance, transferred to a 20 mL scintillation vial with Teflon tape-
wrapped threads, then dissolved in a weighed amount of phosphate buffer (200 mM, pH 8.50).
Adjusted molecular weights derived from TGA and 1H NMR analyses were combined with the
UV/VIS measurement to calculate the number of fluorescein molecules per chain, or
alternatively, the effective extinction coefficient per chain.
5.2.3.2 Inductively Coupled Plasma-Mass Spectroscopy
ICP-MS measurements were made on a commercial ELAN DRCPlusTM (PerkinElmer
SCIEX) operated under normal plasma conditions. The sample uptake rate was ca. 500 µL/min,
and sample size was 1500 µL. A MicroFlow PFA-ST concentric nebulizer (Elemental Scientific,
104
Inc.) was used in all instances. Experiments were performed using an autosampler (Perkin Elmer
AS 91) modified for operation with Eppendorf 2 ml tubes. Lanthanide standards were prepared
from 1000 µg/mL PE Pure single-element standard solutions (PerkinElmer, Shelton, CT) by
sequential dilution with high purity deionized water produced using a Elix/ Gradient (Millipore,
Bedford, MA) water purification system. Palladium and platinum standards were prepared from
1000 µg/mL Aristar Plus single-element standard solutions (VWR International) by sequential
dilution with 2% HCl.
5.2.3.3 Polymer Metal Content
The metal content of a given sample was determined through a combination of UV/VIS
spectroscopy and solution inductively coupled plasma-mass spectrometry (ICP-MS). Metal-
loaded polymer (ca. 0.2 mg) was dissolved in phosphate buffer (200 mM, pH 8.00, 50 µL). A 2
µL aliquot was placed into a NanoDrop ND-1000 spectrophotometer, and the fluorescein
absorbance was measured to yield polymer chain concentration. (In addition to chain
concentration, this measurement is also an indication of polymer recovery or yield after the
metal-loading reaction. This is done by comparing the measured chain concentration to the
concentration of an unloaded 0.4 mg aliquot of polymer dissolved in 100 µL buffer). Next, a 5
µL aliquot of the polymer solution was taken for ICP-MS analysis. Early ICP-MS analyses of
individual samples both with and without the digestion process described below demonstrated
that, with the exception of P(DOTA), the intensity of the ICP-MS signal for lanthanide-loaded
polymers was independent of whether the digestion process was used. (Table 9-2 in the
Appendix to Chapter 5 compares the effect a digestion process has on intensity of ICP-MS signal
for some early experiments.) Thus the 5 µL aliquot of polymer solution was directly diluted to
5000 µL with 2% HCl, after which a 5 µL aliquot of that solution was again diluted to 5000 µL
with 2% HCl. In contrast, early experiments demonstrated that lanthanide-loaded P(DOTA) and
all palladium- and platinum-loaded polymers do require a digestion process in order to observe
full metal signal in ICP-MS. Therefore, the 5 µL aliquot of polymer solution was added to a 15
mL centrifuge tube, concentrated HNO3 (250 µL) and concentrated HCl (50 µL) were added, and
the solution was heated in an 85 0C bath for 2 hours.124 After cooling, the solution was diluted to
5000 µL with 2% HCl, after which a 5 µL aliquot of that solution was again diluted to 5000 µL
with 2% HCl. ICP-MS signal was converted to ppb through the concurrent analysis of separate 1
ppb metal standards. Finally, the number of metal atoms per chain was calculated by dividing
105
the metal concentration of the original polymer solution, as calculated from the ICP-MS data,
with the polymer chain concentration, as found by NanoDrop UV/VIS.
5.2.4 Biological Experiments
5.2.4.1 Antibody Labeling with Metal-Chelating Polymers
Metal-labeled antibodies were prepared by as follows. In advance, 0.4 mg of P(EDTA)-
Maleimide was loaded with palladium (2 equivalents, 2 hour method) or platinum (0.8
equivalents, 0.5 hour method), dried into a PCR tube on an Eppendorf Vacufuge Plus, and stored
vacuum-packed in a -30 0C freezer. The antibody labeling was performed by Dr. Olga Ornatsky,
following the procedure described in Chapter 2.
5.2.4.2 Mass Cytometry Bioassays
Goat anti-mouse (GAM) and CD45 antibodies were obtained from Pierce and Biolegend
(respectively). KG1a and Ramos cells were obtained from ATCC (American Type Culture
Collection, Manassas, VA). GAM was labeled with P(EDTA)-Maleimide-Pd and P(EDTA)-
Maleimide-Pt as described above. All mass cytometry experiments were performed by Dr. Olga
Ornatsky.
To test GAM-P(EDTA)-Maleimide-Pd, Ramos cells were incubated with a Rh-intercalator15
to identify dead cells, then stained with primary CD45 followed by secondary GAM-P(EDTA)-
Maleimide-Pd. Washed cells were fixed in 3.7% formaldehyde and counter-stained with an Ir-
intercalator8 for nucleated cell identification.
To test GAM-P(EDTA)-Maleimide-Pt, two separate aliquots of KG1a cells were prepared.
The first aliquot consisted of live cells, and the cells of the second aliquot were fixed 3.7%
formaldehyde. Separate aliquots of live and dead cells were stained with CD45 followed by
secondary GAM-P(EDTA)-Maleimide-Pt. As above, washed cells were fixed in 3.7%
formaldehyde and counter-stained with an Ir-intercalator.
Dead cell staining experiments were performed as follows. KG1a cells were killed by 3.7%
formaldehyde or heat (5 min at 60 0C). Cells were counted with a hemacytometer and mixtures
of live and dead cells were prepared by mixing given proportions of cells from live and dead
aliquots of KG1a. These mixtures were first incubated with an Rh-intercalator,15 and were
subsequently stained with a solution (50 µL per each cell pellet of 1x10⁶ cells) of a palladium
reagent. GAM-P(EDTA)-Maleimide-Pd was used at 0.001 mg/mL, and P(EDTA)-Fluorescein-

106
Pd was used at 0.01 mg/mL or 0.1 mg/mL. Finally, as above, washed cells were fixed in 3.7%
formaldehyde and counter-stained with an Ir-intercalator.
Labeled cells were analyzed by mass cytometry8 as described in Chapter 2.
5.3 Results and Discussion
5.3.1 Polymer Synthesis
The starting point for the syntheses described here is Amino Polymer-Disulfide shown in
Scheme 5-1. This dimeric polymer was obtained by quantitative pendant group transformation
of a poly(t-butyl acrylate) sample with DPn = 79 per phenyl end group prepared by RAFT
polymerization, as described in Chapter 3. The disulfide group is stable to the various reactions
carried out on this polymer. It serves as the source of end-functional thiol groups that can be
generated by mild reduction and then further reacted with a bismaleimide linker for attachment
to an antibody. Scheme 5-1 summarizes the polymer transformations described in this chapter.
In this chapter, my goal was to investigate commonly available polyaminocarboxylate
ligands as carriers of palladium and platinum to create Pd- and Pt-loaded metal-chelating
polymers. In Chapter 3 I have shown that the pendant primary amines of the Amino Polymer-
Disulfide could be quantitatively functionalized with DTPA groups using DMTMM as a
coupling agent. Here I extend these experiments to include the available homologues EDTA,
TTHA, and DOTA. In each case, I obtained quantitative ligand attachment, as monitored by 1H
NMR. Analysis of the samples by aqueous size exclusion chromatography (SEC) showed no
evidence for cross-linking or broadening of the molecular weight distribution.
To gauge the success of loading the polymer with metal ions, I needed to be able to
determine the molar concentration of polymer molecules as well as the concentration of polymer-
bound metal ions. One way to facilitate measurement of the polymer concentration was to attach
a dye molecule of known molar extinction coefficient to the thiol group at the end of each chain.
To proceed, I reduced the polymer disulfide with dithiothreitol (DTT), and then reacted the
liberated polymeric thiol with an excess of N-(5-fluoresceinyl)maleimide. Subsequent
purification by spin filter removed excess dye. The characterization of these dye-labeled
polymers is described below.
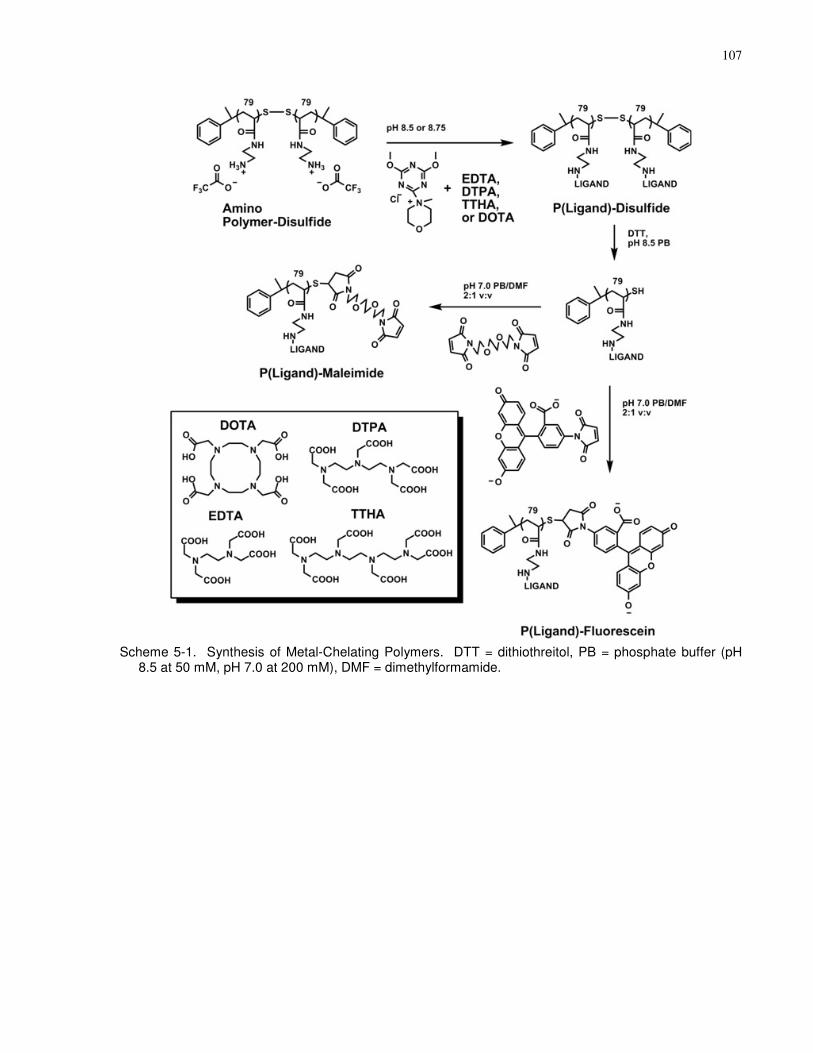
107
Scheme 5-1. Synthesis of Metal-Chelating Polymers. DTT = dithiothreitol, PB = phosphate buffer (pH 8.5 at 50 mM, pH 7.0 at 200 mM), DMF = dimethylformamide.
108
5.3.2 Polymer Chain Extinction Coefficients
The syntheses described above were designed to attach a single fluorescein dye to every
polymer chain. The success of this approach needed to be tested. In addition, I needed to
determine an effective molar extinction coefficient for the polymer-bound chromophore in order
to use the UV/VIS absorbance of fluorescein as a measure of polymer chain concentration. It is
not difficult to prepare polymer solutions of known mass concentration, but the mass
concentration must be converted to molar concentration. 1H NMR analysis at points along the
synthesis up to and including P(Ligand)-Disulfide showed that the degree of polymerization was
79 for all four polymers, and that every polymer repeat unit was functionalized with a ligand.
This information allowed me to calculate Mn values corresponding to the fully protonated
carboxylic acid form of the polymers. However, these “1H NMR molecular weights” need to be
corrected for the presence of both sodium counter-ions associated with the pendant groups as
well as any water that was not removed during sample lyophilization. As in Chapter 3, once
these values are known, one can calculate adjusted molecular weights that include the
contributions of sodium and residual moisture to convert mass concentration to molar
concentration. This information is available from thermal gravimetric analysis (TGA) of the
lyophilized polymer.
5.3.2.1 Thermal Gravimetric Analysis
In Chapter 3, I described TGA experiments employing a linear temperature sweep. From this
approach, there was no clear demarcation between the end of water loss and the start of polymer
degradation. Here I employed a step-scan approach that separated the water-loss step from the
thermal decomposition of the polymer. In this procedure, the samples were held at 100 °C for 4
hours to drive off water without degrading the polymer. Then the temperature was increased
rapidly and held at 600 °C for 5 hours to destroy the polymer without degrading Na2CO3.
Na2CO3 is the only non-volatile product formed in the TGA analysis of the sodium salts of
polyaminocarboxylates105 at temperatures less than 800 °C. Control experiments to test the
validity of this approach are described in the appendix of this chapter.
Step-scan TGA traces for P(EDTA)-Fluorescein, P(DTPA)-Fluorescein, P(TTHA)-
Fluorescein, and P(DOTA)-Fluorescein are presented in Figure 5-1. All four polymer samples
showed similar traces, with essentially flat baselines at the end of both isothermal periods. The

109
calculated amounts of water, sodium ions and adjusted molecular weights are presented in Table
5-1. From the data in Table 5-1, one can see that the number of H2O molecules and Na+ per
ligand unit increased as the pendant ligand increased in size from EDTA through to TTHA. This
is not unexpected as the larger ligands contain more carboxylic acids to attract water and to carry
sodium counter-ions. In Chapter 3, the assumption of 150 0C as the water loss temperature for
the linear temperature ramp in the TGA measurements yielded 2.2 H2O and 2.3 Na+ per DTPA
unit. This is not very different from the more reliable results presented here.
Figure 5-1. Step-scan TGA Traces of P(EDTA)-Fluorescein, P(DTPA)-Fluorescein, P(TTHA)-Fluorescein, and P(DOTA)-Fluorescein. Temperature is displayed on the right-hand y-axis. All four polymer samples display similar traces, with essentially flat baselines at the end of both isothermal (100
0C and
600 0C) periods.
110
Table 5-1. H2O and Na+ Content and Adjusted Molecular Weights for P(EDTA)-
Fluorescein, P(DTPA)-Fluorescein, P(TTHA)-Fluorescein, and P(DOTA)-Fluorescein
Polymer Samples Calculated from TGA Analysis.
Sample H2O per
Ligand unit
Na+ per
Ligand unit
1H NMR
Molecular Weightb
Adjusted
Molecular Weightc
P(EDTA)-
Fluorescein
2.3 1.7 30,800 Da ± 12% 37,200 Da ± 10%
P(DTPA)-
Fluorescein
2.9 2.2 38,800 Da ± 12% 46,700 Da ± 10%
P(TTHA)-
Fluorescein
3.2 2.5 48,600 Da ± 12% 57,600 Da ± 10%
P(DOTA)-
Fluorescein
2.5 1.6 39,700 Da ± 12% 45,900 Da ± 11%
a. The standard error calculation is described in the experimental section.
b. Calculated from DPn/phenyl end group at the PtBA stage, attachment of a ligand to each pendant group and assuming that the ligand groups are fully protonated (not partially neutralized by Na
+ ions).
c. An apparent molecular weight that includes the mass contribution of attendant water molecules and sodium counter-ions.
In addition to characterizing the water and sodium content of the above polymers, there is
utility in preparing a DTPA polymer in the fully protonated form. A protonated DTPA polymer
will not have sodium counter-ions, and may also have low to zero water content. This could
make it unnecessary to run routine TGA to determine an adjusted molecular weight. A
protonated DTPA polymer is also interesting in that it may have better solubility in organic
solvents.
Protonated DTPA polymer was prepared by washing P(DTPA)-Disulfide with 100 mM acetic
acid in a spin filter. The rationale was similar to discussion in Chapters 3 and 6: washing with
sodium phosphate buffer was found to exchange all counter-ions to sodium, and washing with
triethylammonium bicarbonate was found to exchange counter-ions to triethylammonium.
Similarly, I expected that washing with a protic acid would exchange all counter-ions to a proton.
Aqueous acetic acid at 100 mM was chosen for the four acid washes because an 11 mL wash
111
volume contains approximately 20 equivalents of acetic acid per every sodium counter-ion in a
15 mg sample of P(DTPA), and yet, it has a rather gentle pH of 2.9, so no polymer degradation
was anticipated.
On washing P(DTPA) with the acetic acid solution, partial precipitation was observed. A
recovery of 75% yield was nevertheless obtained by gently scraping up precipitated polymer and
using multiple rinses with water. By having noted that 2 mL of water was necessary to dissolve
4 mg of fully protonated P(DTPA), I estimate the water solubility of this polymer to be only ~2
mg/mL. TGA analysis of this polymer, using the same step-scan approach as above, is presented
in Figure 5-2. A water mass-loss of 3.8% was observed, which corresponds to 1.1 H2O per
DTPA. In the polymer degradation step the percent mass went down to zero, which shows that
all the sodium counter-ions were replaced by protons.
While it is possible to prepare a fully protonated polymer, the sparing water solubility makes
it a poor choice for routine use. In addition, the sodium-salt form of P(DTPA) seems to retain
relatively reproducible amounts of water and sodium between different synthetic batches.
Experiments with the continuous-scan TGA procedure in Chapter 3 gave near identical results
for the DPn = 67 and 79 P(DTPA) polymer samples. Experiments with the newer step-scan
approach in this chapter and in Chapter 4 gave 2.9 H2O / 2.2 Na+, and 3.0 H2O / 2.6 Na+, per
DTPA, for the respective P(DTPA) samples. Once this reproducibility is further verified, routine
TGA will perhaps not be necessary to calculate an adjusted molecular weight.

112
Figure 5-2. Step-Scan TGA trace of Fully Protonated P(DTPA)-Disulfide. Temperature is displayed on the right-hand y-axis. Percent mass was zero after the polymer degradation step, which shows that this sample contained no sodium counter-ions.
5.3.2.2 Polymer Chain Extinction Coefficients
Aliquots of all four fluorescein-end-labeled polymers were dissolved in phosphate buffer (pH
8.50) and examined by standard quantitative UV/VIS spectroscopy. All samples showed the
visible absorption spectrum of the dianion form of fluorescein.125 This absorbance data was
combined with the TGA data to calculate the number of fluorescein molecules per chain, as
presented in Table 5-2. For this calculation a fluorescein extinction coefficient of 88,000 M-1cm-
1 was used.125 The results for P(EDTA) and P(DTPA) are exceptionally good, almost exactly one
dye per polymer molecule. In contrast, the measured absorbance values for P(TTHA) and
P(DOTA) are somewhat higher than expected, leading to calculated values of 1.14 and 1.13 (±
0.13) dyes per polymer, respectively. These values are still within experimental error of 1
fluorescein molecule per chain. I used this data to calculate effective molar extinction coefficient
values for each polymer. These values are presented in Table 5-2.
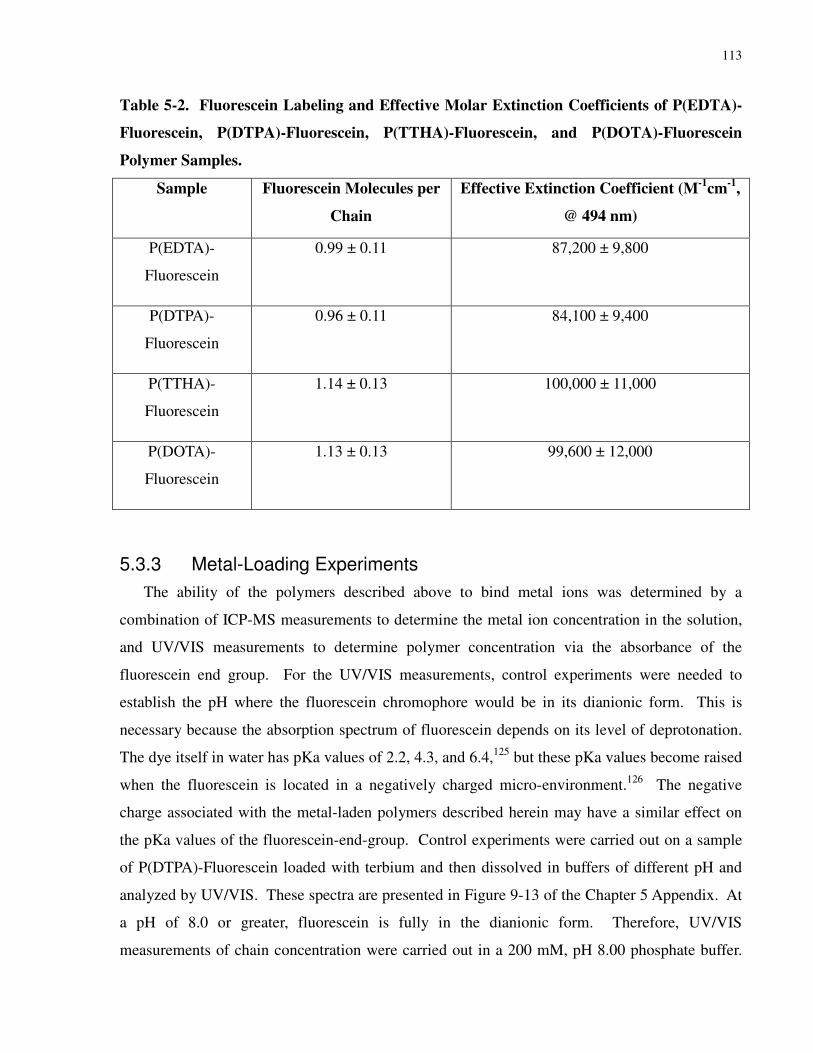
113
Table 5-2. Fluorescein Labeling and Effective Molar Extinction Coefficients of P(EDTA)-
Fluorescein, P(DTPA)-Fluorescein, P(TTHA)-Fluorescein, and P(DOTA)-Fluorescein
Polymer Samples.
Sample Fluorescein Molecules per
Chain
Effective Extinction Coefficient (M-1
cm-1
,
@ 494 nm)
P(EDTA)-
Fluorescein
0.99 ± 0.11 87,200 ± 9,800
P(DTPA)-
Fluorescein
0.96 ± 0.11 84,100 ± 9,400
P(TTHA)-
Fluorescein
1.14 ± 0.13 100,000 ± 11,000
P(DOTA)-
Fluorescein
1.13 ± 0.13 99,600 ± 12,000
5.3.3 Metal-Loading Experiments
The ability of the polymers described above to bind metal ions was determined by a
combination of ICP-MS measurements to determine the metal ion concentration in the solution,
and UV/VIS measurements to determine polymer concentration via the absorbance of the
fluorescein end group. For the UV/VIS measurements, control experiments were needed to
establish the pH where the fluorescein chromophore would be in its dianionic form. This is
necessary because the absorption spectrum of fluorescein depends on its level of deprotonation.
The dye itself in water has pKa values of 2.2, 4.3, and 6.4,125 but these pKa values become raised
when the fluorescein is located in a negatively charged micro-environment.126 The negative
charge associated with the metal-laden polymers described herein may have a similar effect on
the pKa values of the fluorescein-end-group. Control experiments were carried out on a sample
of P(DTPA)-Fluorescein loaded with terbium and then dissolved in buffers of different pH and
analyzed by UV/VIS. These spectra are presented in Figure 9-13 of the Chapter 5 Appendix. At
a pH of 8.0 or greater, fluorescein is fully in the dianionic form. Therefore, UV/VIS
measurements of chain concentration were carried out in a 200 mM, pH 8.00 phosphate buffer.

114
In parallel, size exclusion chromatography (SEC) measurements were used to test for water-
solubility as well as polymer cross-linking by the formation of metal-ion bridges between chains.
5.3.3.1 Lanthanides
I began the metal-loading experiments with lanthanide ions. P(EDTA)-Fluorescein,
P(DTPA)-Fluorescein, and P(DOTA)-Fluorescein were treated with 1.5 equivalents of terbium
chloride following the procedure utilized in Chapter 3. During the washing steps, the DTPA and
DOTA polymers remained soluble, but the EDTA polymer irreversibly precipitated. The
precipitation of the EDTA polymer demonstrates how net anionic charge promotes water-
solubility. Each EDTA-monoamide pendant group has only three carboxylic acids, and will thus
be neutral when loaded with a lanthanide(III) ion. This charge neutrality leads to a loss of water-
solubility. Alric and coworkers observed a similar solubility problem with gold nanoparticles
covered with DTPA-bisamide ligands. When fully loaded with gadolinium, the loss of anionic
repulsion led to agglomeration. This problem was avoided by only loading Gd3+ into some of the
ligands, leaving unloaded ligands to provide anionic repulsion.127 In the case of the DTPA-
monoamide polymer, the extra carboxylic acid of the pendant group provides the net anionic
charge per repeat unit to promote solubility in water.
Precipitation was also expected with the DOTA polymer, as it too has three carboxylic acid
groups per ligand; however, the polymer remained soluble. The data presented in Table 5-3
indicates that even with a 3 hour metal-loading time, some DOTA units remain unloaded with a
terbium ion, presumably in part due to the slow loading kinetics of DOTA-monoamide.40 Thus,
the presence of unloaded DOTA units gave the polymer chain a net anionic charge, which I
assume is important in maintaining water-solubility.
I also investigated the loading of lanthanum and ytterbium into the DTPA polymer. The
results with ytterbium were quite similar to those with terbium. However, the lanthanum-loaded
DTPA polymer precipitated during the loading step. Ternovaya and coworkers 128 have shown it
is possible to prepare binuclear lanthanide-DTPA complexes, depending on which lanthanides
are used and the order of the lanthanide addition. Thus, in my reaction with 1.5 equivalents of
lanthanum chloride, an average of more than one La3+ was taken up by each DTPA group. This
led to charge neutrality, with an attendant loss of water-solubility. Alternatively, when I repeated
the reaction with only 0.8 equivalents of lanthanum, the polymer maintained water-solubility

115
throughout. From these results I have decided that in the future, my standard procedure for
loading any lanthanide metal will utilize 0.8 equivalents.
The data presented in Table 5-3 shows the degree of metal-loading as well as the aqueous
SEC data for all metal-loading experiments. Interestingly, the apparent Mn (aqueous SEC) of
lanthanide-loaded polymers decreased significantly. This indicates a smaller hydrodynamic
volume in solution, likely due to the shielding effect of the cationic metal centers chelated by the
polymer.

116
Table 5-3. Metal Content, Polymer Yield, and Aqueous SEC Data of all Metal-Loading
Reactions with P(EDTA)-Fluorescein, P(DTPA)-Fluorescein, P(TTHA)-Fluorescein, and
P(DOTA)-Fluorescein.
Sample Reagent Metal
Equiv.
Time
(hr)
Polymer
Yield
Metal/
Chain
Metal/
Ligand
Mn (Aq.
SEC,
Da)c
PDI
(Aq.
SEC)
P(EDTA) --- --- --- --- --- --- 20,700 1.20
P(DTPA) --- --- --- --- --- --- 23,600 1.20
P(TTHA) --- --- --- --- --- --- 25,100 1.19
P(DOTA) --- --- --- --- --- --- 18,200 1.22
P(EDTA) TbCl3 1.5 0.5 Complete precipitation on metal-loading
P(DTPA) LaCl3 1.5 0.5 Complete precipitation on metal-loading
P(DTPA) LaCl3 0.8 0.5 87% ± 5% 60 ± 9 0.76 ± 0.11 18,100 1.23
P(DTPA) TbCl3 1.5 0.5 71% ± 3% 77 ± 11 0.97 ± 0.13 16,600 1.24
P(DTPA) YbCl3 1.5 0.5 83% ± 5% 71 ± 10 0.90 ± 0.13 17,800 1.24
P(DOTA) TbCl3 1.5 0.5 82% ± 6% 64 ± 9 0.81 ± 0.12 10,600 1.29
P(DOTA) TbCl3 1.5 3 75% ± 6% 69 ± 10 0.87 ± 0.13 10,800 1.28
P(EDTA) K2PdCl4 1.1 2 68% ± 3% 52 ± 7 0.65 ± 0.09 18,100 1.31
P(EDTA) K2PdCl4 2 2 77% ± 4% 79 ± 11 1.00 ± 0.14 19,200 1.34
P(EDTA) K2PdCl4 2 16 99% ± 6% 76 ± 11 0.96 ± 0.14 19,100 1.28
P(DTPA) K2PdCl4 2 16 68% ± 3% 119 ± 17 1.5 ± 0.2 18,200 1.34
P(TTHA) K2PdCl4 4 16 66% ± 3% 157 ± 22 2.0 ± 0.3 22,400 1.37
P(DOTA) K2PdCl4 2 2 70% ± 6% 115 ± 17 1.5 ± 0.2 17,100 1.30
P(EDTA) Pt(en)(H2O)22+ 0.8 0.5 87% ± 4% 47 ± 7 0.60 ± 0.09 19,500 1.22
P(EDTA) Pt(en)(H2O)22+ 2 2 80% ± 4% 90 ± 13 1.14 ± 0.16 18,500 1.34
a. A full error propagation calculation was performed using the sources of error described in the experimental section.
b. Data is organized by metal: unloaded, lanthanides, palladium, and platinum.
c. Apparent molecular weights from Aqueous SEC are relative to poly(methacrylic acid) standards.
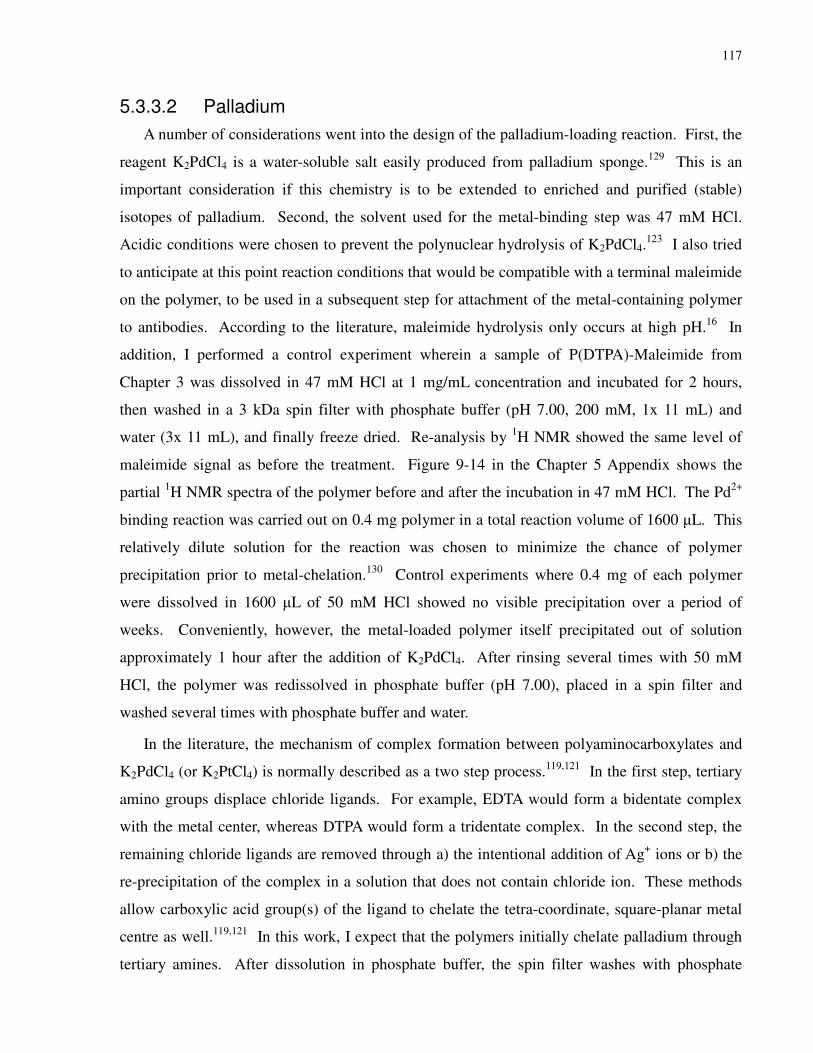
117
5.3.3.2 Palladium
A number of considerations went into the design of the palladium-loading reaction. First, the
reagent K2PdCl4 is a water-soluble salt easily produced from palladium sponge.129 This is an
important consideration if this chemistry is to be extended to enriched and purified (stable)
isotopes of palladium. Second, the solvent used for the metal-binding step was 47 mM HCl.
Acidic conditions were chosen to prevent the polynuclear hydrolysis of K2PdCl4.123 I also tried
to anticipate at this point reaction conditions that would be compatible with a terminal maleimide
on the polymer, to be used in a subsequent step for attachment of the metal-containing polymer
to antibodies. According to the literature, maleimide hydrolysis only occurs at high pH.16 In
addition, I performed a control experiment wherein a sample of P(DTPA)-Maleimide from
Chapter 3 was dissolved in 47 mM HCl at 1 mg/mL concentration and incubated for 2 hours,
then washed in a 3 kDa spin filter with phosphate buffer (pH 7.00, 200 mM, 1x 11 mL) and
water (3x 11 mL), and finally freeze dried. Re-analysis by 1H NMR showed the same level of
maleimide signal as before the treatment. Figure 9-14 in the Chapter 5 Appendix shows the
partial 1H NMR spectra of the polymer before and after the incubation in 47 mM HCl. The Pd2+
binding reaction was carried out on 0.4 mg polymer in a total reaction volume of 1600 µL. This
relatively dilute solution for the reaction was chosen to minimize the chance of polymer
precipitation prior to metal-chelation.130 Control experiments where 0.4 mg of each polymer
were dissolved in 1600 µL of 50 mM HCl showed no visible precipitation over a period of
weeks. Conveniently, however, the metal-loaded polymer itself precipitated out of solution
approximately 1 hour after the addition of K2PdCl4. After rinsing several times with 50 mM
HCl, the polymer was redissolved in phosphate buffer (pH 7.00), placed in a spin filter and
washed several times with phosphate buffer and water.
In the literature, the mechanism of complex formation between polyaminocarboxylates and
K2PdCl4 (or K2PtCl4) is normally described as a two step process.119,121 In the first step, tertiary
amino groups displace chloride ligands. For example, EDTA would form a bidentate complex
with the metal center, whereas DTPA would form a tridentate complex. In the second step, the
remaining chloride ligands are removed through a) the intentional addition of Ag+ ions or b) the
re-precipitation of the complex in a solution that does not contain chloride ion. These methods
allow carboxylic acid group(s) of the ligand to chelate the tetra-coordinate, square-planar metal
centre as well.119,121 In this work, I expect that the polymers initially chelate palladium through
tertiary amines. After dissolution in phosphate buffer, the spin filter washes with phosphate
118
buffer and water will remove the remaining chloride ligands in a process analogous to re-
precipitation in a solution that does not contain chloride ion.
Owing to the ease of this palladium-loading reaction, all four polymers and a number of
conditions were investigated, as summarized in Table 5-3. Perhaps the most interesting result is
the behavior of the DTPA and TTHA polymers: in the presence of excess Pd2+, every DTPA unit
chelates an average of 1.5 Pd, and every TTHA unit chelates an average of 2.0 Pd. Bimetallic
complexes of palladium and TTHA have been previously reported.122 However, small-molecule
DTPA complexes of palladium are usually prepared and purified as 1:1 complexes, where the
metal is complexed by three tertiary amines and one carboxylic acid.123,120 In my experiments, it
appears that each polymeric DTPA group chelates one palladium with two of its tertiary amines
and two of its carboxylic acids, and in addition cooperatively chelates half of another metal
centre with a single tertiary amine and carboxylic acid. Scheme 5-2 shows one possible way this
could occur.
Scheme 5-2. Cooperative Chelation of Palladium by P(DTPA). Each DTPA group chelates an average of 1.5 palladium metal centers. Each metal center is square-planar, although not drawn as such. This is only one of several possible ways this cooperative chelation can be drawn.
It was my hope that DOTA, with its cyclic structure, would form a 1:1 complex with
palladium that involved chelation only through the four tertiary amines. This result is desirable
because palladium, being a soft metal, forms stronger bonds with amines than with carboxylic
acids.119,121 While not directly comparable, palladium forms a 1:1 complex with 1,4,8,11-
tetrathiacyclotetradecane, a cyclic thioether.131 To my knowledge, there are no reports of
palladium or platinum complexes with DOTA. Unfortunately, when I reacted P(DOTA)-
Fluorescein with 2 equivalents of K2PdCl4, I found 1.5 Pd per ligand. This shows that P(DOTA),
119
like the other polymers, has a propensity to form complexes with mixed chelation by amino and
carboxylic acid groups.
While P(DTPA) and P(TTHA) are attractive options because they carry more palladium, I
decided to use palladium-loaded P(EDTA) in the bioassay described below. The best loading
conditions for P(EDTA) were 2 equivalents of K2PdCl4 per EDTA and 2 hours incubation. The
recovered yield of polymer was somewhat lower than for longer reaction times, but the reaction
time is conveniently shorter.
5.3.3.3 Platinum
Early experiments with platinum involved K2PtCl4 and a procedure analogous to that used
for palladium. Upon treatment of the polymer with K2PtCl4 in the presence of aqueous HCl,
some precipitation was observed. However, the precipitate did not fully dissolve in phosphate
buffer. The precipitate disappeared after several phosphate buffer spin filter washes. Upon
analysis of the product, I found ca. 50% polymer yield, a PDI of ≥ 1.70 by aqueous SEC, and
only ca. 10 platinum atoms per chain. These results with K2PtCl4 showed poor metal-loading as
well as significant inter-chain crosslinking. This is not surprising; platinum is more kinetically
inert than palladium, and it is this inertness which makes platinum complexes such as cisplatin
suitable as crosslinking anti-cancer drugs.132 To overcome this problem it was necessary to
activate a platinum complex into a more reactive form.
K2PtCl4 can be made more reactive to substitution by replacing chloride with more labile
ligands. One not very attractive option is to prepare K2PtCl4 as a dilute solution in water and age
it for a number of days. This will replace some of the chloride ligands with reactive aqua
ligands. These species are an ill-defined mixture of starting material and mono- and di-aqua
complexes, and upon aging can lead to polynuclear hydrolysis of the platinum species.133,134
Nevertheless, I attempted to load P(EDTA) with a solution of K2PtCl4 aged 36 hr at room
temperature. I found an apparent improvement in metal ion content (24 ± 3 Pt per chain), but
also a 740 Da peak in the SEC chromatograph that was possibly a product of polynuclear
hydrolysis. Another option was to treat K2PtCl4 with 4 equivalents of KI to convert it to the
more reactive K2PtI4 reagent.135 Unfortunately, my attempt with this strategy yielded no
platinum per chain, as well as an exceedingly fine black precipitate, presumably Pt(0).136
According to the literature, it is possible to prepare the tetraaqua complex of platinum. I did not
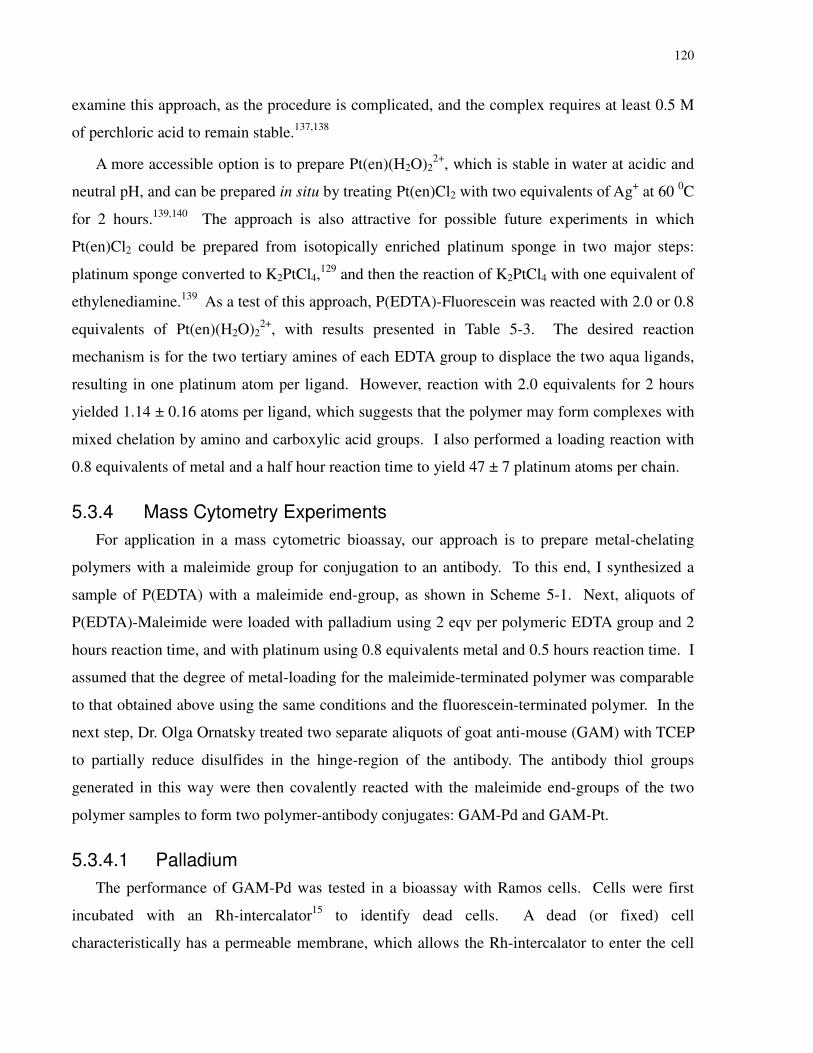
120
examine this approach, as the procedure is complicated, and the complex requires at least 0.5 M
of perchloric acid to remain stable.137,138
A more accessible option is to prepare Pt(en)(H2O)22+, which is stable in water at acidic and
neutral pH, and can be prepared in situ by treating Pt(en)Cl2 with two equivalents of Ag+ at 60 0C
for 2 hours.139,140 The approach is also attractive for possible future experiments in which
Pt(en)Cl2 could be prepared from isotopically enriched platinum sponge in two major steps:
platinum sponge converted to K2PtCl4,129 and then the reaction of K2PtCl4 with one equivalent of
ethylenediamine.139 As a test of this approach, P(EDTA)-Fluorescein was reacted with 2.0 or 0.8
equivalents of Pt(en)(H2O)22+, with results presented in Table 5-3. The desired reaction
mechanism is for the two tertiary amines of each EDTA group to displace the two aqua ligands,
resulting in one platinum atom per ligand. However, reaction with 2.0 equivalents for 2 hours
yielded 1.14 ± 0.16 atoms per ligand, which suggests that the polymer may form complexes with
mixed chelation by amino and carboxylic acid groups. I also performed a loading reaction with
0.8 equivalents of metal and a half hour reaction time to yield 47 ± 7 platinum atoms per chain.
5.3.4 Mass Cytometry Experiments
For application in a mass cytometric bioassay, our approach is to prepare metal-chelating
polymers with a maleimide group for conjugation to an antibody. To this end, I synthesized a
sample of P(EDTA) with a maleimide end-group, as shown in Scheme 5-1. Next, aliquots of
P(EDTA)-Maleimide were loaded with palladium using 2 eqv per polymeric EDTA group and 2
hours reaction time, and with platinum using 0.8 equivalents metal and 0.5 hours reaction time. I
assumed that the degree of metal-loading for the maleimide-terminated polymer was comparable
to that obtained above using the same conditions and the fluorescein-terminated polymer. In the
next step, Dr. Olga Ornatsky treated two separate aliquots of goat anti-mouse (GAM) with TCEP
to partially reduce disulfides in the hinge-region of the antibody. The antibody thiol groups
generated in this way were then covalently reacted with the maleimide end-groups of the two
polymer samples to form two polymer-antibody conjugates: GAM-Pd and GAM-Pt.
5.3.4.1 Palladium
The performance of GAM-Pd was tested in a bioassay with Ramos cells. Cells were first
incubated with an Rh-intercalator15 to identify dead cells. A dead (or fixed) cell
characteristically has a permeable membrane, which allows the Rh-intercalator to enter the cell
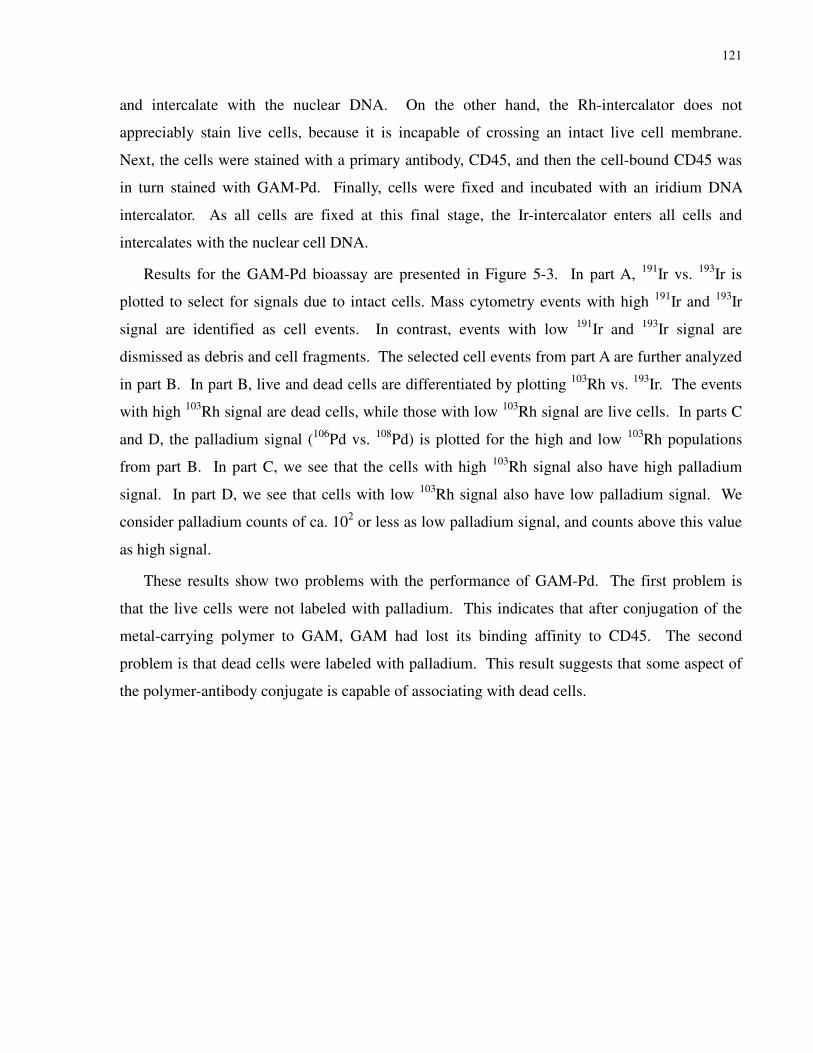
121
and intercalate with the nuclear DNA. On the other hand, the Rh-intercalator does not
appreciably stain live cells, because it is incapable of crossing an intact live cell membrane.
Next, the cells were stained with a primary antibody, CD45, and then the cell-bound CD45 was
in turn stained with GAM-Pd. Finally, cells were fixed and incubated with an iridium DNA
intercalator. As all cells are fixed at this final stage, the Ir-intercalator enters all cells and
intercalates with the nuclear cell DNA.
Results for the GAM-Pd bioassay are presented in Figure 5-3. In part A, 191Ir vs. 193Ir is
plotted to select for signals due to intact cells. Mass cytometry events with high 191Ir and 193Ir
signal are identified as cell events. In contrast, events with low 191Ir and 193Ir signal are
dismissed as debris and cell fragments. The selected cell events from part A are further analyzed
in part B. In part B, live and dead cells are differentiated by plotting 103Rh vs. 193Ir. The events
with high 103Rh signal are dead cells, while those with low 103Rh signal are live cells. In parts C
and D, the palladium signal (106Pd vs. 108Pd) is plotted for the high and low 103Rh populations
from part B. In part C, we see that the cells with high 103Rh signal also have high palladium
signal. In part D, we see that cells with low 103Rh signal also have low palladium signal. We
consider palladium counts of ca. 102 or less as low palladium signal, and counts above this value
as high signal.
These results show two problems with the performance of GAM-Pd. The first problem is
that the live cells were not labeled with palladium. This indicates that after conjugation of the
metal-carrying polymer to GAM, GAM had lost its binding affinity to CD45. The second
problem is that dead cells were labeled with palladium. This result suggests that some aspect of
the polymer-antibody conjugate is capable of associating with dead cells.
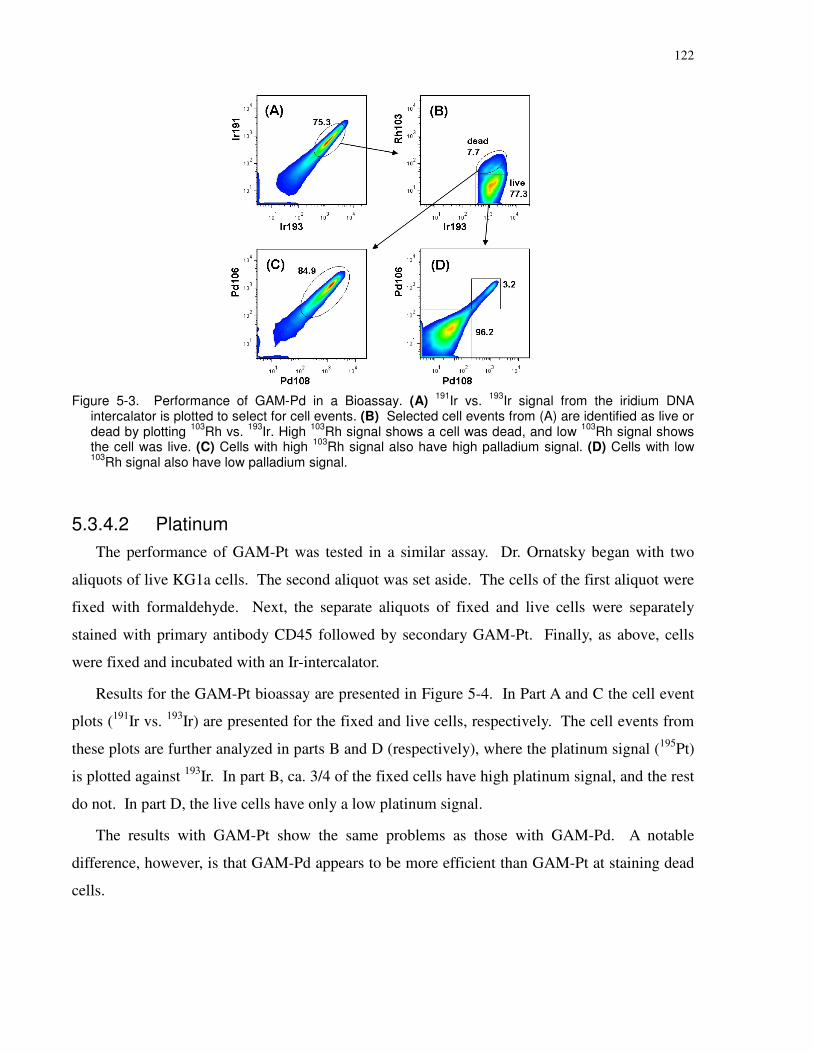
122
Figure 5-3. Performance of GAM-Pd in a Bioassay. (A) 191
Ir vs. 193
Ir signal from the iridium DNA intercalator is plotted to select for cell events. (B) Selected cell events from (A) are identified as live or dead by plotting
103Rh vs.
193Ir. High
103Rh signal shows a cell was dead, and low
103Rh signal shows
the cell was live. (C) Cells with high 103
Rh signal also have high palladium signal. (D) Cells with low 103
Rh signal also have low palladium signal.
5.3.4.2 Platinum
The performance of GAM-Pt was tested in a similar assay. Dr. Ornatsky began with two
aliquots of live KG1a cells. The second aliquot was set aside. The cells of the first aliquot were
fixed with formaldehyde. Next, the separate aliquots of fixed and live cells were separately
stained with primary antibody CD45 followed by secondary GAM-Pt. Finally, as above, cells
were fixed and incubated with an Ir-intercalator.
Results for the GAM-Pt bioassay are presented in Figure 5-4. In Part A and C the cell event
plots (191Ir vs. 193Ir) are presented for the fixed and live cells, respectively. The cell events from
these plots are further analyzed in parts B and D (respectively), where the platinum signal (195Pt)
is plotted against 193Ir. In part B, ca. 3/4 of the fixed cells have high platinum signal, and the rest
do not. In part D, the live cells have only a low platinum signal.
The results with GAM-Pt show the same problems as those with GAM-Pd. A notable
difference, however, is that GAM-Pd appears to be more efficient than GAM-Pt at staining dead
cells.
123
Figure 5-4. Performance of GAM-Pt in a Bioassay. (A) and (C) 191
Ir vs. 193
Ir is plotted to select cell events for fixed and live cells, respectively. (B) Selected cell events from (A) are plotted for platinum signal (
195Pt) against
193Ir. A large proportion have high platinum signal, and a smaller proportion do
not. (D) Selected cell events from (C) are plotted for platinum signal. The live cells show low platinum signal.
5.3.4.3 The Effect of Soft Metal Atoms
These curious results are most likely due to the soft nature of palladium and platinum ions.
With P(EDTA), the palladium and platinum ions are chelated by a mixture of tertiary amino and
carboxylic acid ligands. Since carboxylic acid ligands are hard, they form a relatively weak
bond with these metals; this bond is susceptible to hydrolysis and/or exchange with a more
appropriate soft ligand. Platinum anticancer drugs usually have two carboxylic acid ligands (or
one bidentate acid ligand) for this purpose.132 Palladium, the relatively more reactive metal, can
even undergo hydrolysis with soft bidentate ligands, making some palladium complexes useful
as catalysts for peptide cleavage.141
As such, my idea is that the aforementioned problems are caused by metal centers along the
polymer backbone. I suspect that these metal centers form mixed complexes with soft ligands
along the antibody, and if this chemical modification occurred near the antigen-binding region,
the antibody would lose its affinity.142
In a related fashion, the metal centers form mixed complexes with ligands encountered on the
inside and/or outside of dead cells. Since the data does not show significant staining of live
cells, it is clear that the formation of these bonds is encouraged by features specific only to dead
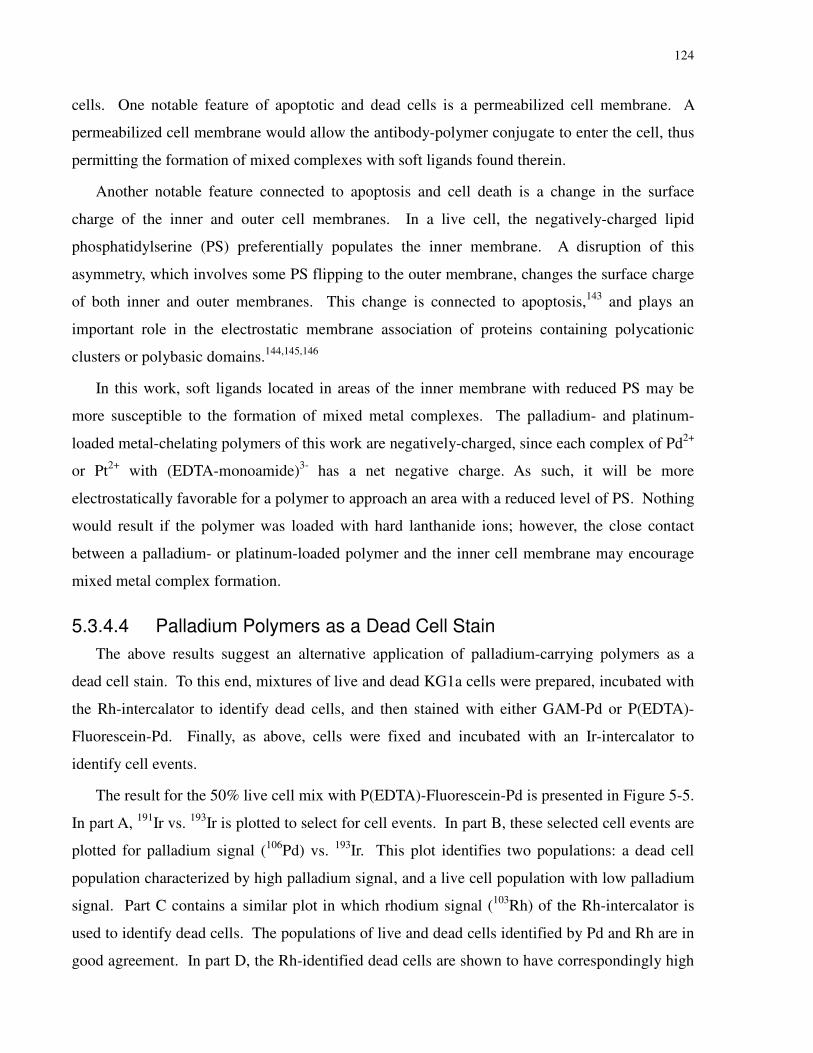
124
cells. One notable feature of apoptotic and dead cells is a permeabilized cell membrane. A
permeabilized cell membrane would allow the antibody-polymer conjugate to enter the cell, thus
permitting the formation of mixed complexes with soft ligands found therein.
Another notable feature connected to apoptosis and cell death is a change in the surface
charge of the inner and outer cell membranes. In a live cell, the negatively-charged lipid
phosphatidylserine (PS) preferentially populates the inner membrane. A disruption of this
asymmetry, which involves some PS flipping to the outer membrane, changes the surface charge
of both inner and outer membranes. This change is connected to apoptosis,143 and plays an
important role in the electrostatic membrane association of proteins containing polycationic
clusters or polybasic domains.144,145,146
In this work, soft ligands located in areas of the inner membrane with reduced PS may be
more susceptible to the formation of mixed metal complexes. The palladium- and platinum-
loaded metal-chelating polymers of this work are negatively-charged, since each complex of Pd2+
or Pt2+ with (EDTA-monoamide)3- has a net negative charge. As such, it will be more
electrostatically favorable for a polymer to approach an area with a reduced level of PS. Nothing
would result if the polymer was loaded with hard lanthanide ions; however, the close contact
between a palladium- or platinum-loaded polymer and the inner cell membrane may encourage
mixed metal complex formation.
5.3.4.4 Palladium Polymers as a Dead Cell Stain
The above results suggest an alternative application of palladium-carrying polymers as a
dead cell stain. To this end, mixtures of live and dead KG1a cells were prepared, incubated with
the Rh-intercalator to identify dead cells, and then stained with either GAM-Pd or P(EDTA)-
Fluorescein-Pd. Finally, as above, cells were fixed and incubated with an Ir-intercalator to
identify cell events.
The result for the 50% live cell mix with P(EDTA)-Fluorescein-Pd is presented in Figure 5-5.
In part A, 191Ir vs. 193Ir is plotted to select for cell events. In part B, these selected cell events are
plotted for palladium signal (106Pd) vs. 193Ir. This plot identifies two populations: a dead cell
population characterized by high palladium signal, and a live cell population with low palladium
signal. Part C contains a similar plot in which rhodium signal (103Rh) of the Rh-intercalator is
used to identify dead cells. The populations of live and dead cells identified by Pd and Rh are in
good agreement. In part D, the Rh-identified dead cells are shown to have correspondingly high
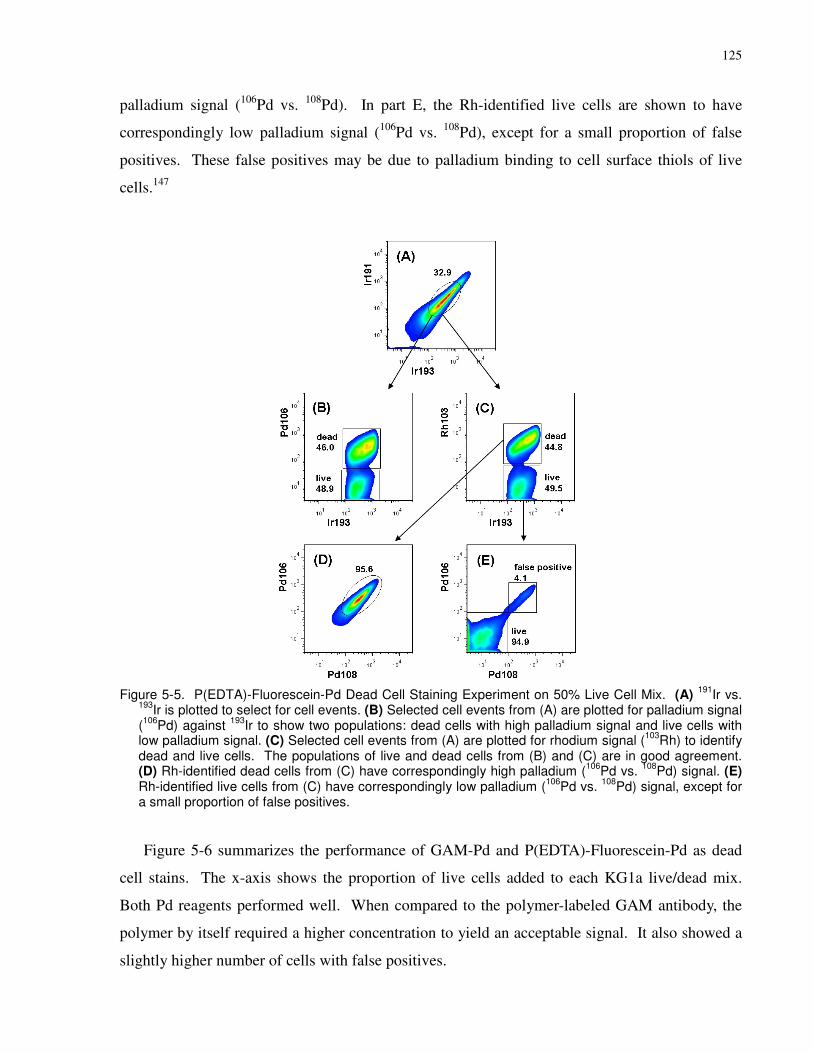
125
palladium signal (106Pd vs. 108Pd). In part E, the Rh-identified live cells are shown to have
correspondingly low palladium signal (106Pd vs. 108Pd), except for a small proportion of false
positives. These false positives may be due to palladium binding to cell surface thiols of live
cells.147
Figure 5-5. P(EDTA)-Fluorescein-Pd Dead Cell Staining Experiment on 50% Live Cell Mix. (A) 191
Ir vs. 193
Ir is plotted to select for cell events. (B) Selected cell events from (A) are plotted for palladium signal (106
Pd) against 193
Ir to show two populations: dead cells with high palladium signal and live cells with low palladium signal. (C) Selected cell events from (A) are plotted for rhodium signal (
103Rh) to identify
dead and live cells. The populations of live and dead cells from (B) and (C) are in good agreement. (D) Rh-identified dead cells from (C) have correspondingly high palladium (
106Pd vs.
108Pd) signal. (E)
Rh-identified live cells from (C) have correspondingly low palladium (106
Pd vs. 108
Pd) signal, except for a small proportion of false positives.
Figure 5-6 summarizes the performance of GAM-Pd and P(EDTA)-Fluorescein-Pd as dead
cell stains. The x-axis shows the proportion of live cells added to each KG1a live/dead mix.
Both Pd reagents performed well. When compared to the polymer-labeled GAM antibody, the
polymer by itself required a higher concentration to yield an acceptable signal. It also showed a
slightly higher number of cells with false positives.

126
Figure 5-6. Summary of the Performance of GAM-Pd and P(EDTA)-Fluorescein-Pd as Dead Cell Stains. Live KG1a cells were mixed with dead KG1a cells at the % values shown on the X-axis. GAM-Pd was used at 0.001 mg/mL, and P(EDTA)-Fluorescein-Pd was used at 0.1 mg/mL.
5.4 Summary
Metal-chelating polymers with four different polyaminocarboxylate ligands (EDTA, DTPA,
TTHA, DOTA) were synthesized from a common Amino Polymer precursor. These polymers
were characterized by 1H NMR measurements to determine degree of polymerization and ligand
functionalization, and then were end-labeled with N-(5-fluoresceinyl)maleimide. The
fluorescein-terminated polymers were characterized by a combination of UV/VIS and TGA to
find the number of dye molecules per chain. For all four samples I found 1 dye molecule per
chain, within experimental error. Different metal-loading conditions were investigated for these
polymers, using chloride salts of three different lanthanide isotopes as well as palladium and
platinum salts. Aqueous SEC measurements were used to monitor polymer solubility and to
establish the absence of significant metal-ion-induced chain-crosslinking. The number of metal

127
atoms per polymer chain was determined by a combination of UV/VIS and conventional ICP-
MS measurements.
Metal-loading experiments with La3+, Tb3+terbium, and Yb3+ yielded important results. First,
I found that a net anionic charge is important for maintaining water-solubility. Second, I found
that La3+ is capable of forming bimetallic complexes with DTPA,128 which led to a loss of
solubility. This result can be avoided by loading the polymers with less than one equivalent of
metal ion per DTPA group.
Conditions were developed for gently loading these polymers with palladium and platinum
ions. Palladium was loaded through the use of K2PdCl4 in 47 mM HCl, while platinum was
loaded through the use of an activated species, Pt(en)(H2O)22+, in water. I was able to load all
four polymers with palladium, and loaded the EDTA polymer with platinum. I imagine that in
these samples, metal binding involved interaction of the Pd and Pt ions with both the tertiary
amines and carboxylic acids of the chelating group.
When Dr. Ornatsky employed P(EDTA)-Maleimide loaded with palladium or platinum in
mass cytometric bioassays, we found curious results. The secondary antibody-polymer
conjugate lost its affinity for the target primary antibody, and instead bound selectively to dead
cells. I believe this occurs because the soft metal atoms are not sufficiently sequestered by their
ligands, and thus these palladium or platinum atoms form new bonds with soft ligands found
inside dead cells. This was a disappointing result in terms of my initial objective of creating new
metal-containing polymers to increase the multiplexing capabilities of immunoassays based on
mass cytometry. Nevertheless, I discovered that these polymers, particularly the palladium-
loaded polymer and antibody-polymer conjugate, act as effective and sensitive stains for dead
cells. Future work will be directed towards ligand systems capable of fully sequestering these
soft metal atoms for applications in assays by mass cytometry.
5.5 Contents of Appendix to Chapter 5
Control experiments for TGA step-scan approach, a description of the importance of aqueous
SEC measurements of metal-loaded polymers, UV/VIS spectra of P(DTPA)-Fluorescein-Tb at
different pH, and partial 1H NMR (D2O) spectra of a sample of P(DTPA)-Maleimide before and
after a 2 hr incubation in 47 mM HCl.

128
129
6 Chapter 6: Dual-Purpose Polymer Labels for Fluorescent and Mass Cytometric Bioassays
6.1 Introduction
The technique of mass cytometry is analogous to the well-established technique of
fluorescence-activated cell sorting (FACS). The main difference is that in mass cytometry,
metal-chelating polymers replace fluorescent dyes as the label, and ICP-MS replaces
fluorescence as the detection method. While mass cytometry has many advantages, it is not
designed to completely replace FACS. FACS is a proven technology, and benefits from
requiring simpler reagents and instrumentation. However, fluorescence has a number of
limitations; (a) it is difficult to monitor more than 10-15 biomarkers in a single assay, (b) the
dynamic range is only two to three orders of magnitude, (c) compensation between different
fluorophores is required, and (d) cell autofluorescence can be problematic. In contrast, mass
cytometry using stable lanthanide isotopes allows over 30 biomarkers to be monitored
simultaneously, has a nine order of magnitude dynamic range, does not require compensation
between signals, and does not exhibit background signal.10 I was interested in utilizing both
methods by creating a dual-purpose antibody tag which exhibits both fluorescence and mass
cytometric signal.
Dual-purpose tags of this sort will enable a number of direct applications. First, FACS and
mass cytometry assays performed in parallel will help to further validate the technique of mass
cytometry with the more established fluorescence assay.10 Second, the tags will allow a
researcher to perform a quick assay with FACS, followed later by a higher multiplexity mass
cytometric assay. Third, the dual tags will allow a researcher to sort samples by FACS148,149
using a few markers prior to further detailed multi-parametric analysis by mass cytometry. This
approach is useful in situations where a researcher is interested in a small cell subset present in a
heterogeneous population of cells. Steps would include staining cells with one to three150,151
dual-purpose antibody tags that are characteristic for the cell subset of interest, sorting the cells
using a FACS instrument, staining the isolated cells with additional, but non-fluorescent, metal-
carrying antibody tags, and finally analyzing the cells by mass cytometry.
One approach to create a dual-purpose antibody tag is to functionalize an antibody with both
commercially available reactive fluorescent dyes and metal-chelating moeties.88,86 However, as a
130
general rule it is best to limit the degree of antibody modification; if an antibody is over-
modified, it can lose specificity for its target.142 The most straightforward approach is to create
an all-in-one probe that contains both fluorescent dye molecules and metal-chelating groups.87
In the experiments described in Chapters 3 to 5, the goal was to create polymers with a
pendant ligand such as DTPA on every repeat unit of the polymer chain, and a maleimide on the
end of the chain for antibody attachment. In the experiments described in this chapter, my aim
was to retain those features while additionally including 1-5 pendant fluorescent dye molecules
per chain. One challenge here is to add the fluorescent dye(s) in an efficient manner and at a late
stage of the synthesis. This is necessitated by the high price of modern, reactive fluorescent
dyes. It also significantly simplifies the synthesis because one precursor polymer can be used to
create polymers with different dyes. Another challenge is to maintain the same high DTPA
functionality as seen with the earlier non-fluorescent polymers.
In the experiments described in this chapter, I start the synthesis with the Amino Polymer
first described in Chapter 3; this polymer has an amino group on every polymer repeat unit. My
strategy was to add short, protected PEG amino spacers to ca. 12% of the units, add DTPA
groups to the remaining 88%, then to deprotect and functionalize the PEG amino spacers with
amine-reactive fluorescent dyes. I chose 4 dyes: FITC as an inexpensive reagent to develop the
chemistry, and DyLight 405, 549, and 649 for more colors in the fluorescence assay. The
product polymers have 2-6 dyes per chain and nearly the same lanthanide binding capacity as a
non-fluorescent polymer. The polymers were then functionalized with a maleimide linker,
although the maleimide yields in this step were not as high as those seen in Chapter 3. Finally,
the polymers were loaded with stable lanthanide isotopes, and used to create dual-purpose
antibody tags. All antibody manipulations and bioassays were performed by Dr. Olga Ornatsky
and Leslie Fung. The first antibody tag created was a conjugate of the FITC-labeled polymer
and goat anti-mouse (GAM). This GAM conjugate was used to stain CD45-stained Ramos cells.
Analysis by mass cytometry as well as by FACS demonstrated that the cells were stained with
both lanthanide and fluorescent markers. Next, four primary antibody tags were created with
CD3, CD13, CD38, and CD45 and the four different polymers, and subsequently used to stain
KG1a and Jurkat cells. Analysis by mass cytometry and FACS demonstrated that the FITC and
DyLight 649 antibody tags performed well, but the other two tags did not. Further experiments
are required to determine why the DyLight 405 and 549 antibody tags failed to perform
satisfactorily in the bioassays.
131
6.2 Experimental
6.2.1 Polymer Synthesis
6.2.1.1 Materials
All reagents and solvents, including diethylenetriaminepentaacetic acid (DTPA, 98%,
Aldrich), dithiothreitol (DTT, 99%, Aldrich), lanthanum(III) chloride hydrate (≥99.0%, Fluka),
N-hydroxysuccinimide (NHS, 98%, Aldrich), and other compounds were used without further
purification unless otherwise noted. Water was purified through a MilliQ water purification
system (12 MΩcm). All buffers were prepared in our laboratory. The 4 mL and 15 mL 3 kDa
MWCO Millipore Amicon spin filters were purchased from Fisher Science. The 0.5 mL Pall
Nanosep 3K Omega filters were purchased from VWR. The Pall Acrodisc 13 mm syringe filters
with 200 nm nylon membrane were purchased from VWR.
2,2'-(ethylenedioxy)bis(ethylmaleimide) (Acanthus Research, Toronto, Canada), 4-(4,6-
dimethoxy-1,3,5-triazin-2-yl)-4-methylmorpholinium chloride (DMTMM, Acros Organics,
99+%, from Fisher Science, Canada), 1-ethyl-3-(3-dimethylaminopropyl) carbodiimide HCl
(EDC, 99.0%, Fluka), N-Boc-N′-succinyl-4,7,10-trioxa-1,13-tridecanediamine (95%, Aldrich),
fluorescein isothiocyanate isomer I (FITC, ≥ 90%, Sigma), and DyLight 405, 549 and 649 NHS
esters (Pierce Biotechnology, from Fisher Science, Canada) were stored in a dessicator inside a
freezer at -20 0C. Before use, their temperatures were equilibrated in a dessicator kept at room
temperature.
6.2.1.2 Polymer Synthesis
6.2.1.2.1 Amino Polymer-Disulfide
A new batch of DPn = 79 Amino Polymer-Disulfide was synthesized in an identical manner,
and from the same batch of PAA-Disulfide, as described in Chapter 3.
6.2.1.2.2 Synthesis of P(12%PEGAminoBoc)-Disulfide
N-Boc-N′-succinyl-4,7,10-trioxa-1,13-tridecanediamine (0.44 equiv., 40.2 mg) in DMF (191
µL), N-hydroxysuccinimide (0.44 equiv., 11.0 mg) in DMF (191 µL), triethylamine (0.84 equiv.,
25.5 µL), and 1-ethyl-3-(3-dimethylaminopropyl) carbodiimide) HCl (0.4 equiv., 16.7 mg)
suspended in DMF (347 µL), were added to a 2 mL centrifuge tube and incubated for 40 minutes
at room temperature. Amino Polymer-Disulfide (1 equiv. amine, 50 mg) was dissolved in
132
HEPES buffer (0.5 M, pH 7.4, 2.55 mL) and transferred to a 15 mL round-bottom flask. The
first mixture was added to the polymer solution, and the resultant solution was stirred for 18
hours at room temperature. Next, the reaction solution was diluted with aqueous trifluoracetic
acid (TFA, 10 mM), transferred to a 15 mL 3kDA MWCO Millipore Amicon spin filter, and
washed with aqueous TFA (10 mM, 4 x 11 mL) and water (3 x 11 mL). Finally, the aqueous
solution was freeze-dried to yield P(12%PEGAminoBoc)-Disulfide.; Yield = 54.5 mg (95%); 1H
NMR (D2O): δ(ppm, integrated peak areas reported based on C6H5 = 5H) 1.37-1.45 (s, 9H per
PEGAminoBoc, boc t-butyl, integration = 91), 1.45-1.90 (multiple peaks, broad, 2H per
monomer, backbone & 4H per PEGAminoBoc, integration = 168), 1.90-2.32 (s broad, 1H per
monomer, backbone, integration = 79), 2.45-2.56 (s, 4H per PEGAminoBoc, integration = 37),
2.76-3.60 (multiple peaks, broad, 4H per ethylenediamine spacer & 8H per PEGAminoBoc,
integration = 439), 3.60-3.76 (m, broad, 8H per PEGAminoBoc, integration = 73), 7.15 – 7.45
(broad t, 5H phenyl, integration = 5.0).
6.2.1.2.3 Synthesis of P(12%PEGAminoBoc)(88%DTPA)-Disulfide
DTPA (7.56 g) and H2O (10.8 mL) were added to a 250 mL round-bottom flask. Next,
NaOH (5 M aq.) was added with stirring to create a solution of pH 8.5 (monitored with a pH
meter). DMTMM (540 mg) was dissolved in water (10.8 mL) with sonication and added quickly
with stirring to the first solution. This solution was given 5 minutes to pre-react. Then a solution
of P(12%PEGAminoBoc)-Disulfide (total sample) in water (10.8 mL) was added quickly with
stirring. The reaction solution was stirred for 1 hour, concentrated in 2x 15 mL 3kDA MWCO
Millipore Amicon spin filters, and washed with water (9 x 11 mL for each filter). Finally, the
aqueous solution was freeze-dried to yield P(12%PEGAminoBoc)(88%DTPA)-Disulfide.; Yield
= 104 mg (86%); 1H NMR (D2O): δ(ppm, integrated peak areas reported based on C6H5 = 5H)
0.97-2.31 (broad, multiple peaks, 9H per PEGAminoBoc, boc t-butyl & 3H per monomer,
backbone, & 4H per PEGAminoBoc, integration = 376), 2.47-2.57 (s, broad, 4H per
PEGAminoBoc, integration = 46), 2.67-4.08 (multiple peaks, broad, 4H per ethylenediamine
spacer & 16H per PEGAminoBoc & 18H per DTPA group, integration = 1598), 7.15 – 7.45
(broad t, 5H phenyl, integration = 5.0). SEC (Aqueous, relative to poly(methacrylic acid)
standards, RI) Mn = 31,900 Da, PDI = 1.22.
133
6.2.1.2.4 Deprotection to P(12%PEGAmino)(88%DTPA)-Disulfide
P(12%PEGAminoBoc)-(88%DTPA)-Disulfide (total sample) was dissolved in water (3.5
mL) in a 20 mL scintillation vial with teflon tape-wrapped threads. TFA (3.5 mL) was added
with stirring, and the solution was stirred at room temperature for 2 hours. Next, the solution
was diluted with phosphate buffer (200mM, pH 7.00), transferred to two 15 mL 3kDA MWCO
Millipore Amicon spin filters, and washed with phosphate buffer (200 mM, pH 7.00, 4 x 11 mL
for each filter) and water (3 x 11 mL for each filter). Finally, the aqueous solution was freeze-
dried to yield P(12%PEGAmino)(88%DTPA)-Disulfide.; Yield = 92 mg (90%); 1H NMR (D2O):
Same as that of P(12%PEGAminoBoc)(88%DTPA)-Disulfide, but no t-butyl signal at 1.4 ppm.
SEC (Aqueous, relative to poly(methacrylic acid) standards, RI) Mn = 32,200 Da, PDI = 1.23.
6.2.1.2.5 Loading of P(12%PEGAmino)(88%DTPA)-Disulfide with La3+
P(12%PEGAmino)(88%DTPA)-Disulfide (total sample) was dissolved in ammonium acetate
buffer (20 mM, pH 6.00, 43.7 mL) and transferred to a 100 mL round-bottom flask containing a
stir bar. A solution of lanthanum chloride (50 mM, 4.40 mL, 1.5 equiv. of La3+ per DTPA) was
added with stirring, upon which the solution became translucent. A septum was secured, and the
solution was immersed in a 37 0C oil bath with stirring for 30 minutes, during which the solution
became clear. Next, the solution was concentrated in two 15 mL 3kDA MWCO Millipore
Amicon spin filters, then washed with tris-buffered saline (Tris 25 mM, NaCl 150 mM, KCl 2
mM, pH 7.4, 3 x 11 mL for each filter) and water (3 x 11 mL for each filter). Finally, the
aqueous solution was freeze-dried to yield P(12%PEGAmino)(88%DTPA)(La)-Disulfide. Yield
= 97 mg (79%); SEC (Aqueous, relative to poly(methacrylic acid) standards, RI) Mn = 111,300
Da, PDI = 1.08, and Mn = 23,200, PDI = 1.32.
6.2.1.2.6 Dye Attachment to La-Containing Polymers
This reaction is described for FITC. Reactions with the other dyes were performed
identically, with volumes scaled to the amount of polymer reacted.
P(12%PEGAmino)(88%DTPA)(La)-Disulfide (11.8 mg) was dissolved in phosphate buffer with
potassium nitrate (200 mM, pH 8.00, with 1.66 M KNO3, 0.90 mL) in a 20 mL scintillation vial.
DMSO (0.333 mL) was added with stirring, upon which some precipitate (presumably KNO3)
formed. A solution of FITC in DMSO (2.67 mg in 0.267 mL DMSO [10 mg/mL concentration],
30 equiv. dyes per chain) was added with stirring, and the solution was stirred for 2 hours at
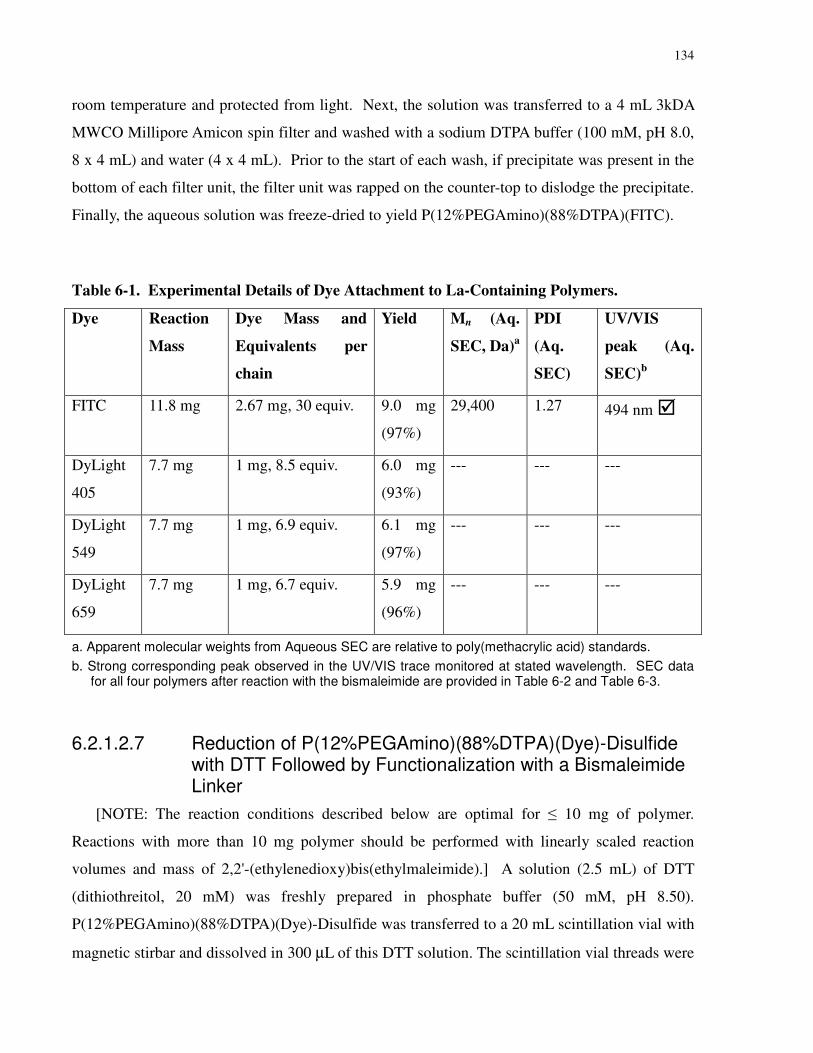
134
room temperature and protected from light. Next, the solution was transferred to a 4 mL 3kDA
MWCO Millipore Amicon spin filter and washed with a sodium DTPA buffer (100 mM, pH 8.0,
8 x 4 mL) and water (4 x 4 mL). Prior to the start of each wash, if precipitate was present in the
bottom of each filter unit, the filter unit was rapped on the counter-top to dislodge the precipitate.
Finally, the aqueous solution was freeze-dried to yield P(12%PEGAmino)(88%DTPA)(FITC).
Table 6-1. Experimental Details of Dye Attachment to La-Containing Polymers.
Dye Reaction
Mass
Dye Mass and
Equivalents per
chain
Yield Mn (Aq.
SEC, Da)a
PDI
(Aq.
SEC)
UV/VIS
peak (Aq.
SEC)b
FITC 11.8 mg 2.67 mg, 30 equiv. 9.0 mg
(97%)
29,400 1.27 494 nm
DyLight
405
7.7 mg 1 mg, 8.5 equiv. 6.0 mg
(93%)
--- --- ---
DyLight
549
7.7 mg 1 mg, 6.9 equiv. 6.1 mg
(97%)
--- --- ---
DyLight
659
7.7 mg 1 mg, 6.7 equiv. 5.9 mg
(96%)
--- --- ---
a. Apparent molecular weights from Aqueous SEC are relative to poly(methacrylic acid) standards.
b. Strong corresponding peak observed in the UV/VIS trace monitored at stated wavelength. SEC data for all four polymers after reaction with the bismaleimide are provided in Table 6-2 and Table 6-3.
6.2.1.2.7 Reduction of P(12%PEGAmino)(88%DTPA)(Dye)-Disulfide with DTT Followed by Functionalization with a Bismaleimide Linker
[NOTE: The reaction conditions described below are optimal for ≤ 10 mg of polymer.
Reactions with more than 10 mg polymer should be performed with linearly scaled reaction
volumes and mass of 2,2'-(ethylenedioxy)bis(ethylmaleimide).] A solution (2.5 mL) of DTT
(dithiothreitol, 20 mM) was freshly prepared in phosphate buffer (50 mM, pH 8.50).
P(12%PEGAmino)(88%DTPA)(Dye)-Disulfide was transferred to a 20 mL scintillation vial with
magnetic stirbar and dissolved in 300 µL of this DTT solution. The scintillation vial threads were
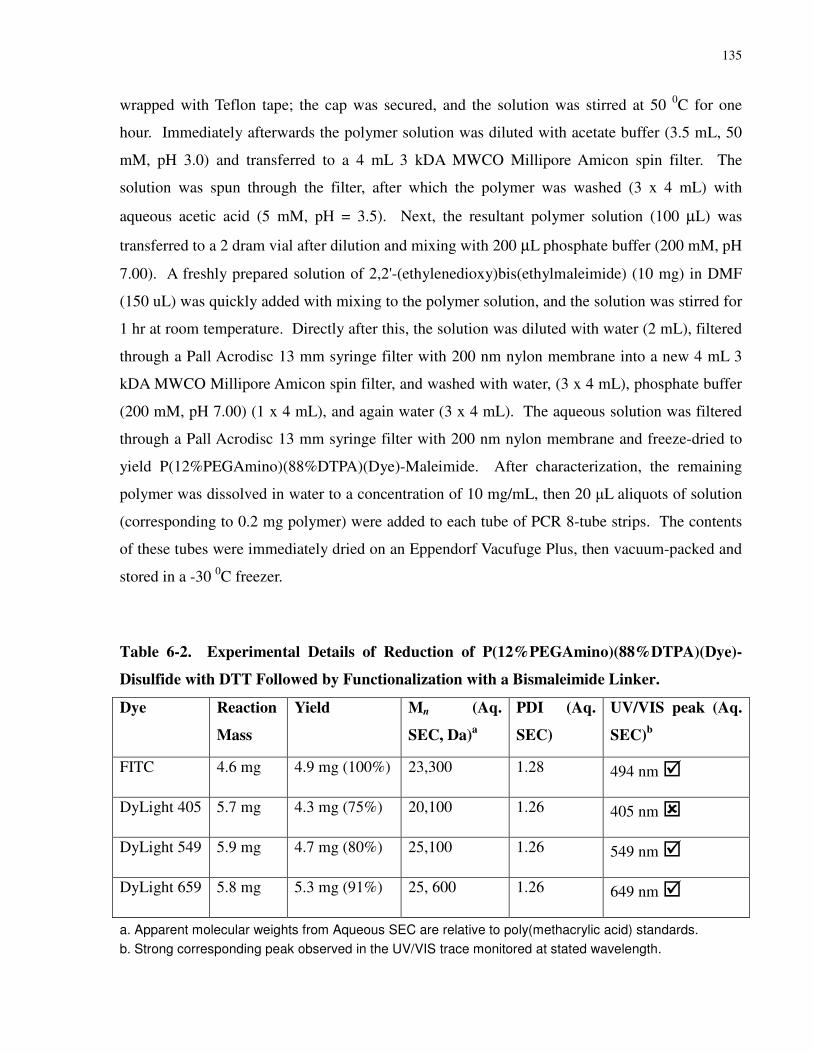
135
wrapped with Teflon tape; the cap was secured, and the solution was stirred at 50 0C for one
hour. Immediately afterwards the polymer solution was diluted with acetate buffer (3.5 mL, 50
mM, pH 3.0) and transferred to a 4 mL 3 kDA MWCO Millipore Amicon spin filter. The
solution was spun through the filter, after which the polymer was washed (3 x 4 mL) with
aqueous acetic acid (5 mM, pH = 3.5). Next, the resultant polymer solution (100 µL) was
transferred to a 2 dram vial after dilution and mixing with 200 µL phosphate buffer (200 mM, pH
7.00). A freshly prepared solution of 2,2'-(ethylenedioxy)bis(ethylmaleimide) (10 mg) in DMF
(150 uL) was quickly added with mixing to the polymer solution, and the solution was stirred for
1 hr at room temperature. Directly after this, the solution was diluted with water (2 mL), filtered
through a Pall Acrodisc 13 mm syringe filter with 200 nm nylon membrane into a new 4 mL 3
kDA MWCO Millipore Amicon spin filter, and washed with water, (3 x 4 mL), phosphate buffer
(200 mM, pH 7.00) (1 x 4 mL), and again water (3 x 4 mL). The aqueous solution was filtered
through a Pall Acrodisc 13 mm syringe filter with 200 nm nylon membrane and freeze-dried to
yield P(12%PEGAmino)(88%DTPA)(Dye)-Maleimide. After characterization, the remaining
polymer was dissolved in water to a concentration of 10 mg/mL, then 20 µL aliquots of solution
(corresponding to 0.2 mg polymer) were added to each tube of PCR 8-tube strips. The contents
of these tubes were immediately dried on an Eppendorf Vacufuge Plus, then vacuum-packed and
stored in a -30 0C freezer.
Table 6-2. Experimental Details of Reduction of P(12%PEGAmino)(88%DTPA)(Dye)-
Disulfide with DTT Followed by Functionalization with a Bismaleimide Linker.
Dye Reaction
Mass
Yield Mn (Aq.
SEC, Da)a
PDI (Aq.
SEC)
UV/VIS peak (Aq.
SEC)b
FITC 4.6 mg 4.9 mg (100%) 23,300 1.28 494 nm
DyLight 405 5.7 mg 4.3 mg (75%) 20,100 1.26 405 nm
DyLight 549 5.9 mg 4.7 mg (80%) 25,100 1.26 549 nm
DyLight 659 5.8 mg 5.3 mg (91%) 25, 600 1.26 649 nm
a. Apparent molecular weights from Aqueous SEC are relative to poly(methacrylic acid) standards.
b. Strong corresponding peak observed in the UV/VIS trace monitored at stated wavelength.
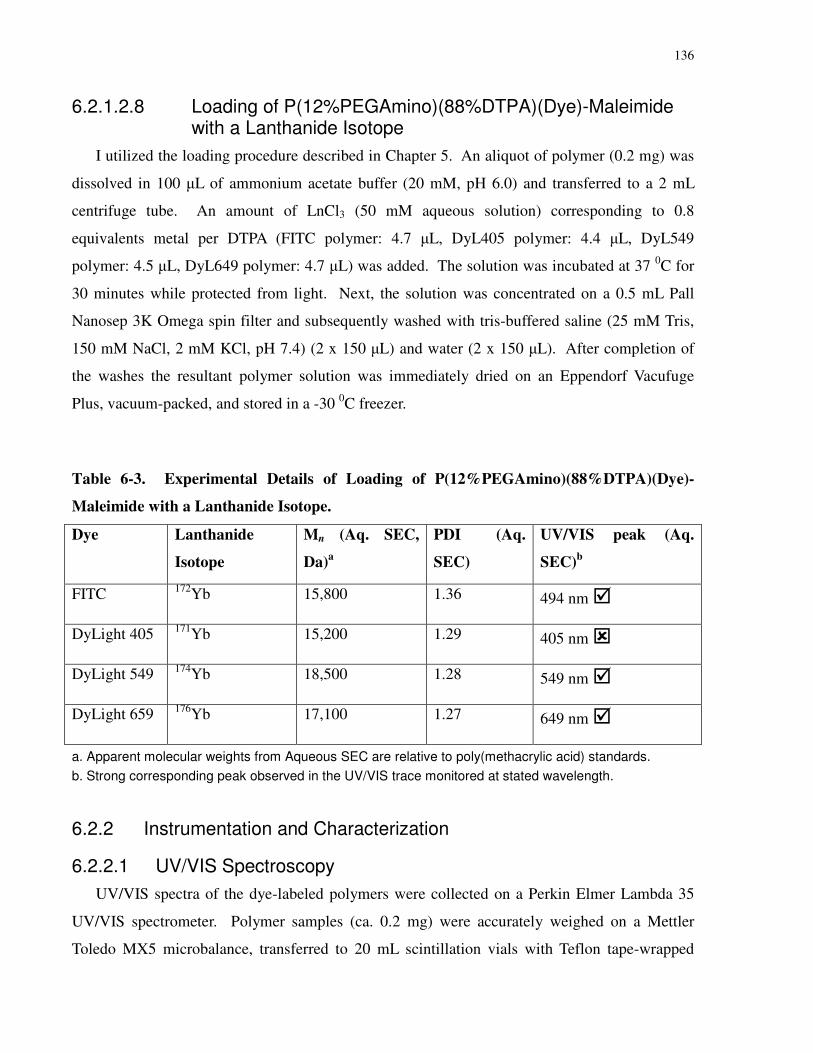
136
6.2.1.2.8 Loading of P(12%PEGAmino)(88%DTPA)(Dye)-Maleimide with a Lanthanide Isotope
I utilized the loading procedure described in Chapter 5. An aliquot of polymer (0.2 mg) was
dissolved in 100 µL of ammonium acetate buffer (20 mM, pH 6.0) and transferred to a 2 mL
centrifuge tube. An amount of LnCl3 (50 mM aqueous solution) corresponding to 0.8
equivalents metal per DTPA (FITC polymer: 4.7 µL, DyL405 polymer: 4.4 µL, DyL549
polymer: 4.5 µL, DyL649 polymer: 4.7 µL) was added. The solution was incubated at 37 0C for
30 minutes while protected from light. Next, the solution was concentrated on a 0.5 mL Pall
Nanosep 3K Omega spin filter and subsequently washed with tris-buffered saline (25 mM Tris,
150 mM NaCl, 2 mM KCl, pH 7.4) (2 x 150 µL) and water (2 x 150 µL). After completion of
the washes the resultant polymer solution was immediately dried on an Eppendorf Vacufuge
Plus, vacuum-packed, and stored in a -30 0C freezer.
Table 6-3. Experimental Details of Loading of P(12%PEGAmino)(88%DTPA)(Dye)-
Maleimide with a Lanthanide Isotope.
Dye Lanthanide
Isotope
Mn (Aq. SEC,
Da)a
PDI (Aq.
SEC)
UV/VIS peak (Aq.
SEC)b
FITC 172Yb 15,800 1.36 494 nm
DyLight 405 171Yb 15,200 1.29 405 nm
DyLight 549 174Yb 18,500 1.28 549 nm
DyLight 659 176Yb 17,100 1.27 649 nm
a. Apparent molecular weights from Aqueous SEC are relative to poly(methacrylic acid) standards.
b. Strong corresponding peak observed in the UV/VIS trace monitored at stated wavelength.
6.2.2 Instrumentation and Characterization
6.2.2.1 UV/VIS Spectroscopy
UV/VIS spectra of the dye-labeled polymers were collected on a Perkin Elmer Lambda 35
UV/VIS spectrometer. Polymer samples (ca. 0.2 mg) were accurately weighed on a Mettler
Toledo MX5 microbalance, transferred to 20 mL scintillation vials with Teflon tape-wrapped
137
threads, then dissolved in a weighed amount of phosphate buffer (200 mM, pH 8.00). The
polymers were assumed to carry 2.9 H2O and 2.2 Na+ per DTPA unit, as this is what the
P(DTPA) sample from Chapter 5 was found to contain. This assumption and data from the 1H
NMR analysis were combined with the UV/VIS measurement to calculate the number of dye
molecules per chain.
6.2.2.2 Polymer Metal Content
The metal content of a given sample was determined through solution inductively coupled
plasma-mass spectrometry (ICP-MS). An aliquot of the solution prepared for UV/VIS
spectroscopy was diluted by a factor of 4 to 10 with 2% HCl, after which a 5 µL aliquot of that
solution was diluted to 5000 µL with 2% HCl. Diluted samples were analyzed on a Perkin Elmer
SCIEX Elan 9000 ICP-MS equipped with auto-sampler. The ICP-MS signal was converted to
ppb through the concurrent analysis of separate 1 ppb metal standards. Separately, I calculated a
theoretical metal concentration that would be obtained on analysis of a fully-metal-loaded
polymer. This concentration was calculated from the polymer mass concentration and by
assuming that each DTPA unit carried one lanthanide, one Na+, and 2.9 H2O. Finally, the
number of metal atoms per chain was calculated by dividing the experimentally-determined
metal concentration by the theoretical metal concentration.
6.2.2.3 Fluorescence Spectroscopy
Excitation and emission fluorescence spectra of the Yb-loaded maleimide polymers were
collected on a Jobin Yvon Horiba FL3-22 Fluorolog. Solutions were prepared at a concentration
where the primary peak of the fluorescent dye had an absorbance of 0.10.
6.2.3 Biological Experiments
6.2.3.1 Antibody Labeling with Metal-Chelating Polymers
Metal-labeled antibodies were prepared Dr. Olga Ornatsky and Leslie Fung, following the
procedure described in Chapter 2. Bioassay experiments were also performed by Dr. Olga
Ornatsky and Leslie Fung.
6.2.3.2 Metal Atoms per Antibody
The number of metal atoms carried by each antibody was determined quantitatively by Dr.
Olga Ornatsky, following the procedure described in Chapter 3.
138
6.2.3.3 Fluorescent and Mass Cytometric Assays
Goat anti-mouse (GAM) was obtained from Pierce, CD3, CD13, and CD38 antibodies were
obtained from Biolegend, and CD45 antibody was obtained from eBioscience. Ramos, KG1a,
and Jurkat cells were obtained from ATCC (American Type Culture Collection, Manassas, VA).
Polymer-antibody conjugates were prepared as described in Chapter 2.
All antibody staining steps utilized 50 µL of staining solution per cell pellet of 1x10⁶ cells.
To test the FITC-labeled polymer in the initial proof of concept assays, a polymer-antibody
conjugate was prepared with P(12%PEGAmino)(88%DTPA)(172Yb)(FITC)-Maleimide and
GAM. Ramos cells were stained with primary CD45 followed by the secondary GAM-tag.
Washed cells were fixed in 3.7% formaldehyde and counterstained with an Ir intercalator for
nucleated cell identification.
To test all four polymers in the mass cytometry and FACS tetraplex assays, polymer-antibody
conjugates were prepared with the four dye-labeled polymers and CD3, CD13, CD38, and CD45,
as listed in Table 6-5. KG1a and Jurkat cells were stained with six different staining solutions.
Each staining solution contained a different concentration of all four antibody tags, as shown in
Table 9-3 in the Appendix to Chapter 6. As above, washed cells were fixed in 3.7%
formaldehyde and counterstained with an Ir intercalator prior to analysis.
Labeled cells were analyzed by mass cytometry, as described in Chapter 2, and by FACS on a
BD Biosciences LSRII instrument. DyL405, FITC, DyL549, and DyL649 fluorescent signal
were monitored with the laser and filter setups of the instrument intended for pacific blue
(excitation 405 nm, emission 440/40 nm), FITC (excitation 488 nm, emission 530/30 nm),
phycoerythrin (excitation 532 nm, emission 575/26 nm) and Alexa fluor 647 (excitation 633 nm,
emission 660/20 nm), respectively. Unstained Ramos or KG1a cells were run as a negative
control to determine background fluorescence signal. Mass cytometry and FACS data were
collected in FCS 3.0 format and processed by FlowJo (Tree Star Inc., Ashland, OR) software.
6.3 Results and Discussion
6.3.1 Polymer Synthesis
6.3.1.1 Precursor Polymer Synthesis
I began the synthesis with a DPn = 79 Amino Polymer-Disulfide. As described in Chapter 3,
the synthesis of this polymer began with the reversible addition-fragmentation chain transfer

139
(RAFT) synthesis of poly(tert-butyl acrylate). Through a number of post-polymerization
modifications, I obtained an acrylamide polymer with an average of 79 primary amines and an
end-functional thiol group, protected as a polymeric disulfide. I have shown in Chapters 3 and 5
that the pendant primary amines can be quantitatively functionalized with DTPA, after which the
thiol can be reacted with a maleimide containing molecule.
In my synthetic design, I considered how the pH microenvironment can affect fluorescent
dyes. For example, fluorescein has pKa values of 2.2, 4.4, and 6.3, and only exhibits efficient
fluorescence when fully depronated.125 These pKa values are raised by an anionic
microenvironment, resulting in poor fluorescence at neutral pH.126 The lanthanide-loaded DTPA
pendant groups will be anionic at neutral pH;152 thus my concern was that this anionic
microenvironment may have a similar effect on fluorescein. This problem can be avoided
through the use of fluorescein derivatives with electron-withdrawing groups.153 However, I was
still interested in using FITC, as it is the least expensive reactive dye for use in aqueous
bioassays. To avoid these potential problems with FITC, I chose to functionalize a small number
of the primary amino groups of Amino Polymer-Disulfide with N-Boc-N′-succinyl-4,7,10-trioxa-
1,13-tridecanediamine (Scheme 6-1). This short PEG spacer serves two purposes. The first is to
add a small number of protected amino groups before the reaction in which DTPA groups are
added. These amino groups are reacted with a fluorescent dye in the penultimate synthetic step.
The second is to add a spacer to separate the fluorescent dye molecules from the DTPA groups.
The first step in the synthesis was the EDC/NHS-mediated coupling of N-Boc-N′-succinyl-
4,7,10-trioxa-1,13-tridecanediamine to Amino Polymer-Disulfide. The mean degree of
modification was 9 units per 79 unit polymer chain, as determined from the 1H and gCOSY
(gradient correlation spectroscopy) NMR spectra presented in Figure 6-1 and Figure 6-2,
respectively. I assume that the resultant polymer is a random copolymer. Next, the remaining
primary amino groups were functionalized with DTPA by the established procedure from
Chapter 3. Following this step, the polymer was treated with 50% TFA in water for 2 hours at
room temperature to remove the BOC protecting group from the terminal amines of the short
PEG linker. Deprotection was confirmed by the complete disappearance of the BOC tert-butyl
peak in the 1H NMR spectrum of the product (Chapter 6 Appendix, Figure 9-15).
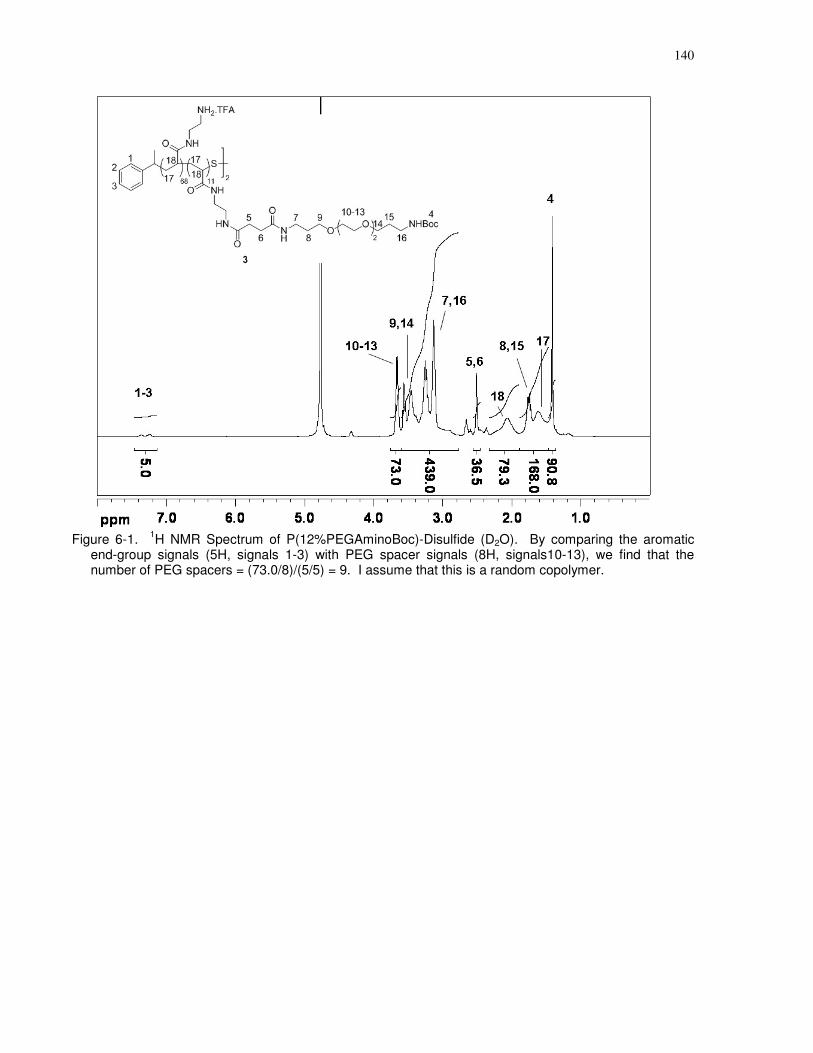
140
Figure 6-1. 1H NMR Spectrum of P(12%PEGAminoBoc)-Disulfide (D2O). By comparing the aromatic
end-group signals (5H, signals 1-3) with PEG spacer signals (8H, signals10-13), we find that the number of PEG spacers = (73.0/8)/(5/5) = 9. I assume that this is a random copolymer.
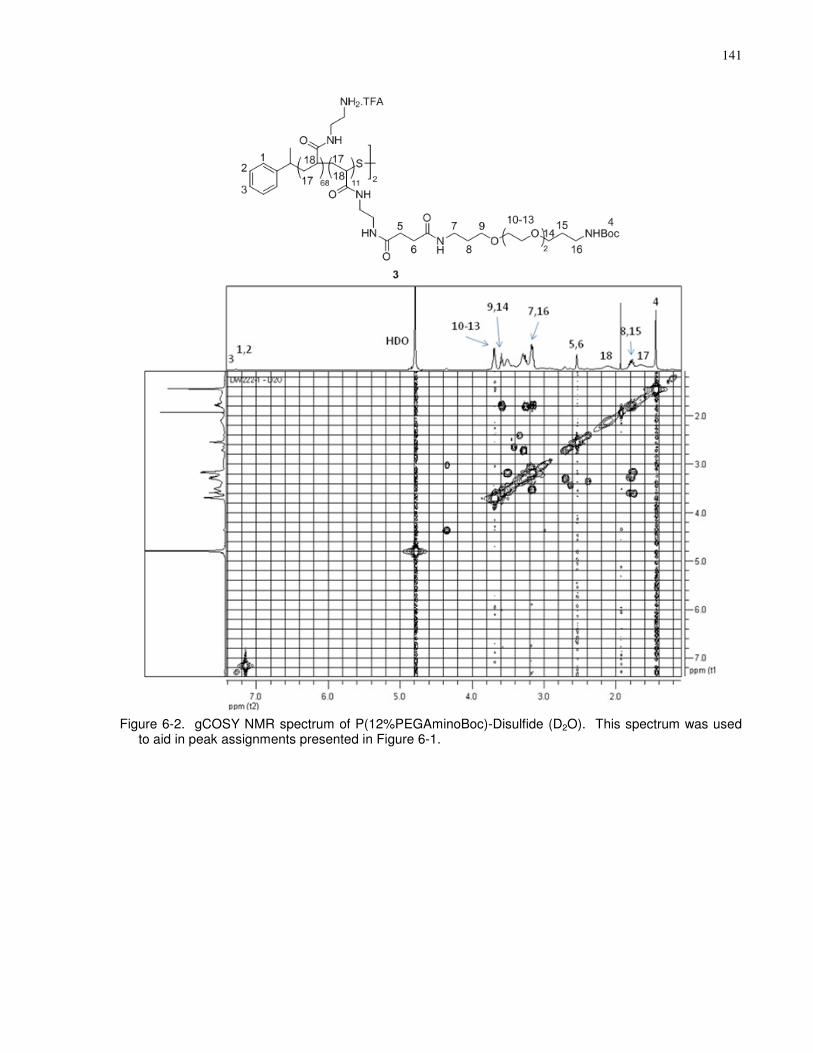
141
Figure 6-2. gCOSY NMR spectrum of P(12%PEGAminoBoc)-Disulfide (D2O). This spectrum was used to aid in peak assignments presented in Figure 6-1.
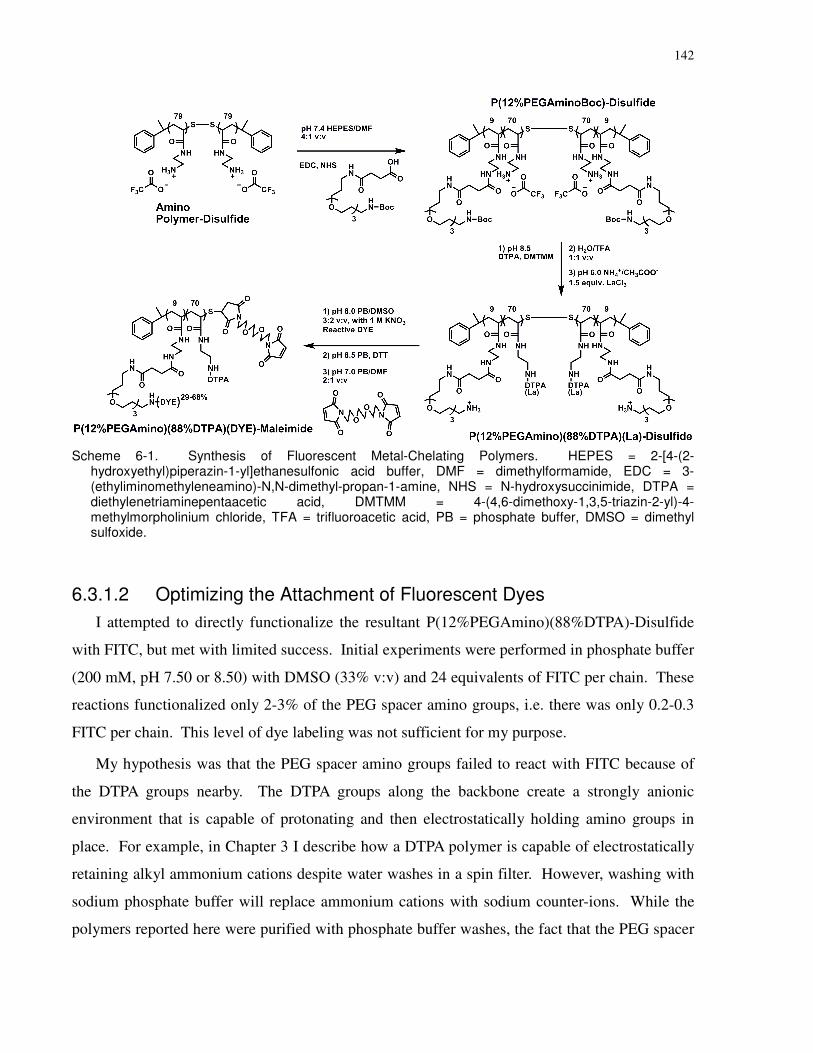
142
Scheme 6-1. Synthesis of Fluorescent Metal-Chelating Polymers. HEPES = 2-[4-(2-hydroxyethyl)piperazin-1-yl]ethanesulfonic acid buffer, DMF = dimethylformamide, EDC = 3-(ethyliminomethyleneamino)-N,N-dimethyl-propan-1-amine, NHS = N-hydroxysuccinimide, DTPA = diethylenetriaminepentaacetic acid, DMTMM = 4-(4,6-dimethoxy-1,3,5-triazin-2-yl)-4-methylmorpholinium chloride, TFA = trifluoroacetic acid, PB = phosphate buffer, DMSO = dimethyl sulfoxide.
6.3.1.2 Optimizing the Attachment of Fluorescent Dyes
I attempted to directly functionalize the resultant P(12%PEGAmino)(88%DTPA)-Disulfide
with FITC, but met with limited success. Initial experiments were performed in phosphate buffer
(200 mM, pH 7.50 or 8.50) with DMSO (33% v:v) and 24 equivalents of FITC per chain. These
reactions functionalized only 2-3% of the PEG spacer amino groups, i.e. there was only 0.2-0.3
FITC per chain. This level of dye labeling was not sufficient for my purpose.
My hypothesis was that the PEG spacer amino groups failed to react with FITC because of
the DTPA groups nearby. The DTPA groups along the backbone create a strongly anionic
environment that is capable of protonating and then electrostatically holding amino groups in
place. For example, in Chapter 3 I describe how a DTPA polymer is capable of electrostatically
retaining alkyl ammonium cations despite water washes in a spin filter. However, washing with
sodium phosphate buffer will replace ammonium cations with sodium counter-ions. While the
polymers reported here were purified with phosphate buffer washes, the fact that the PEG spacer
143
amino groups are chemically attached to the polymer allowed the DTPA groups to retain these
amino groups as an ion-pair.
To allow the PEG spacer amino groups to be nucleophilic, I attempted to shield the charges
and thus discourage the formation of this problematic ion-pair. For instance, in one experiment I
replaced the sodium counter-ions of the DTPA groups with stronger triethylammonium or
tetraethylammonium counter-ions by washing in a spin filter with a 200 mM, pH 8.5 buffer of
the respective tri- or tetra-ethylammonium bicarbonate buffer. 1H NMR measurement of the
triethylammonium sample confirmed that the triethylammonium counter-ions were present with
the purified polymer. On performing the dye-labeling reactions with the respective tri- or tetra-
ammonium bicarbonate buffer and with DMSO (33% and 40% v:v, respectively), I found 5%
and 14% dye functionalization, respectively. This result was still not optimal, so I pursued a
different strategy.
In another experiment, I used phosphate buffer (200 mM, pH 8.00) and DMSO (33%) as
before, but also included 1 M KNO3. KNO3 was utilized because potassium is a very efficient
shielding cation,154 and because KNO3 is highly soluble in water and DMSO. On running this
reaction, I found 14% dye functionalization. This demonstrated that KNO3 improves the
nucleophilicity of the PEG spacer amino groups. However, further improvement was still
warranted.
To further discourage the formation of the problematic ion-pair, I mitigated the anionic
character of the DTPA groups by loading them with a (cationic) lanthanide ion. In principle, if
every monoamide-DTPA4- group chelates one metal atom, then the resultant complex will have a
charge of (-1), as opposed to the original (-4). As discussed in Chapter 5, I utilized loading
conditions (1.5 equivalents of LaCl3) designed to add more than 1 lanthanum atom per DTPA.128
In the experiments described in Chapter 5, I observed that a polymer with a DTPA group on
every repeat unit precipitated under these conditions. In contrast, in the experiments described in
this chapter, I observed that the DTPA polymer with 12% PEG amino spacer groups remained
water-soluble under these conditions. However, the polymer did show a higher molecular weight
peak in the aqueous SEC chromatograph. On reacting this polymer with 30 equivalents of FITC
in phosphate buffer (200 mM, pH 8.00) with 1 M KNO3 and DMSO (40% v:v), I found 37% dye
functionalization (3.4 dyes per chain). Multiple spin filter washes with a sodium DTPA (100
mM, pH 8.0) buffer stripped almost all of the lanthanum from the polymers, as monitored by
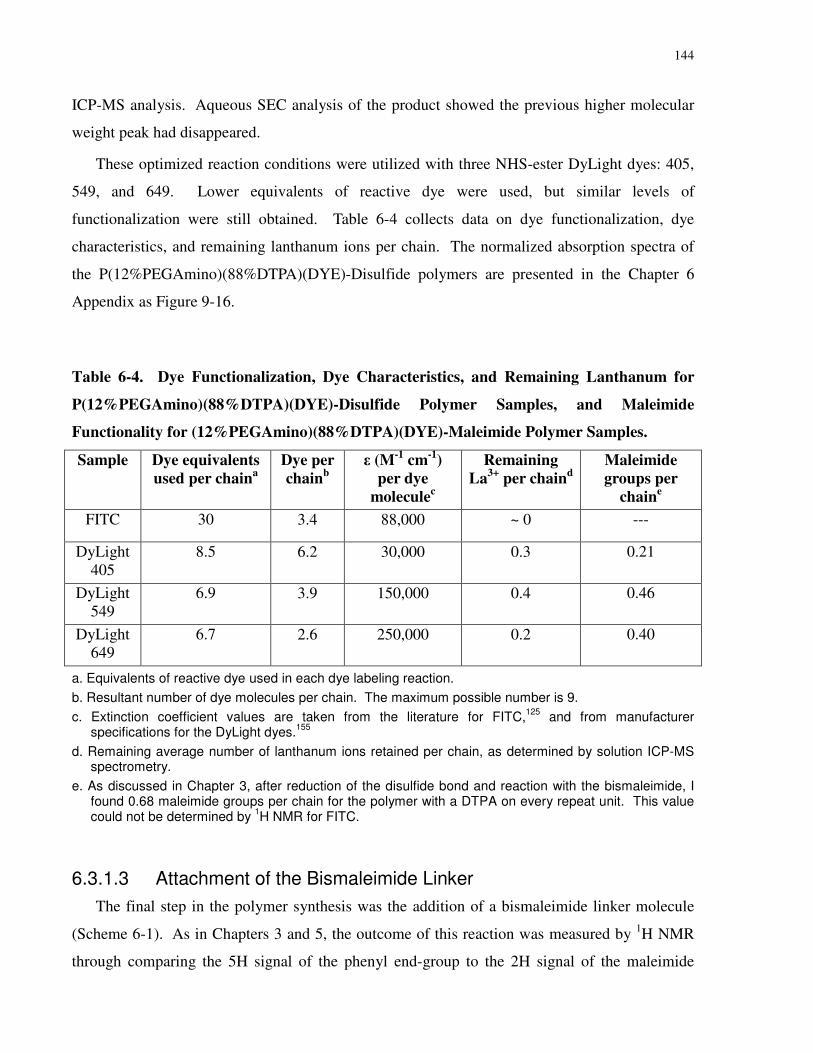
144
ICP-MS analysis. Aqueous SEC analysis of the product showed the previous higher molecular
weight peak had disappeared.
These optimized reaction conditions were utilized with three NHS-ester DyLight dyes: 405,
549, and 649. Lower equivalents of reactive dye were used, but similar levels of
functionalization were still obtained. Table 6-4 collects data on dye functionalization, dye
characteristics, and remaining lanthanum ions per chain. The normalized absorption spectra of
the P(12%PEGAmino)(88%DTPA)(DYE)-Disulfide polymers are presented in the Chapter 6
Appendix as Figure 9-16.
Table 6-4. Dye Functionalization, Dye Characteristics, and Remaining Lanthanum for
P(12%PEGAmino)(88%DTPA)(DYE)-Disulfide Polymer Samples, and Maleimide
Functionality for (12%PEGAmino)(88%DTPA)(DYE)-Maleimide Polymer Samples.
Sample Dye equivalents
used per chaina
Dye per
chainb
ε (M-1
cm-1
)
per dye
moleculec
Remaining
La3+
per chaind
Maleimide
groups per
chaine
FITC 30 3.4 88,000 ~ 0 ---
DyLight 405
8.5 6.2 30,000 0.3 0.21
DyLight 549
6.9 3.9 150,000 0.4 0.46
DyLight 649
6.7 2.6 250,000 0.2 0.40
a. Equivalents of reactive dye used in each dye labeling reaction.
b. Resultant number of dye molecules per chain. The maximum possible number is 9.
c. Extinction coefficient values are taken from the literature for FITC,125
and from manufacturer specifications for the DyLight dyes.
155
d. Remaining average number of lanthanum ions retained per chain, as determined by solution ICP-MS spectrometry.
e. As discussed in Chapter 3, after reduction of the disulfide bond and reaction with the bismaleimide, I found 0.68 maleimide groups per chain for the polymer with a DTPA on every repeat unit. This value could not be determined by
1H NMR for FITC.
6.3.1.3 Attachment of the Bismaleimide Linker
The final step in the polymer synthesis was the addition of a bismaleimide linker molecule
(Scheme 6-1). As in Chapters 3 and 5, the outcome of this reaction was measured by 1H NMR
through comparing the 5H signal of the phenyl end-group to the 2H signal of the maleimide
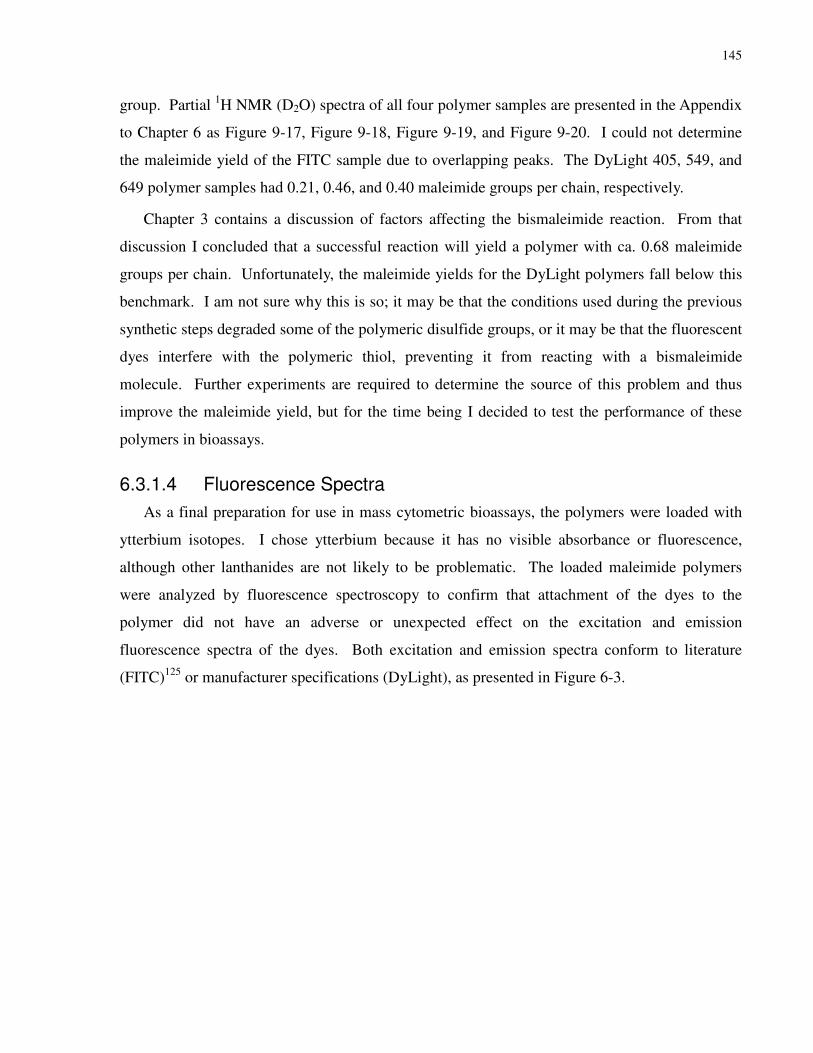
145
group. Partial 1H NMR (D2O) spectra of all four polymer samples are presented in the Appendix
to Chapter 6 as Figure 9-17, Figure 9-18, Figure 9-19, and Figure 9-20. I could not determine
the maleimide yield of the FITC sample due to overlapping peaks. The DyLight 405, 549, and
649 polymer samples had 0.21, 0.46, and 0.40 maleimide groups per chain, respectively.
Chapter 3 contains a discussion of factors affecting the bismaleimide reaction. From that
discussion I concluded that a successful reaction will yield a polymer with ca. 0.68 maleimide
groups per chain. Unfortunately, the maleimide yields for the DyLight polymers fall below this
benchmark. I am not sure why this is so; it may be that the conditions used during the previous
synthetic steps degraded some of the polymeric disulfide groups, or it may be that the fluorescent
dyes interfere with the polymeric thiol, preventing it from reacting with a bismaleimide
molecule. Further experiments are required to determine the source of this problem and thus
improve the maleimide yield, but for the time being I decided to test the performance of these
polymers in bioassays.
6.3.1.4 Fluorescence Spectra
As a final preparation for use in mass cytometric bioassays, the polymers were loaded with
ytterbium isotopes. I chose ytterbium because it has no visible absorbance or fluorescence,
although other lanthanides are not likely to be problematic. The loaded maleimide polymers
were analyzed by fluorescence spectroscopy to confirm that attachment of the dyes to the
polymer did not have an adverse or unexpected effect on the excitation and emission
fluorescence spectra of the dyes. Both excitation and emission spectra conform to literature
(FITC)125 or manufacturer specifications (DyLight), as presented in Figure 6-3.
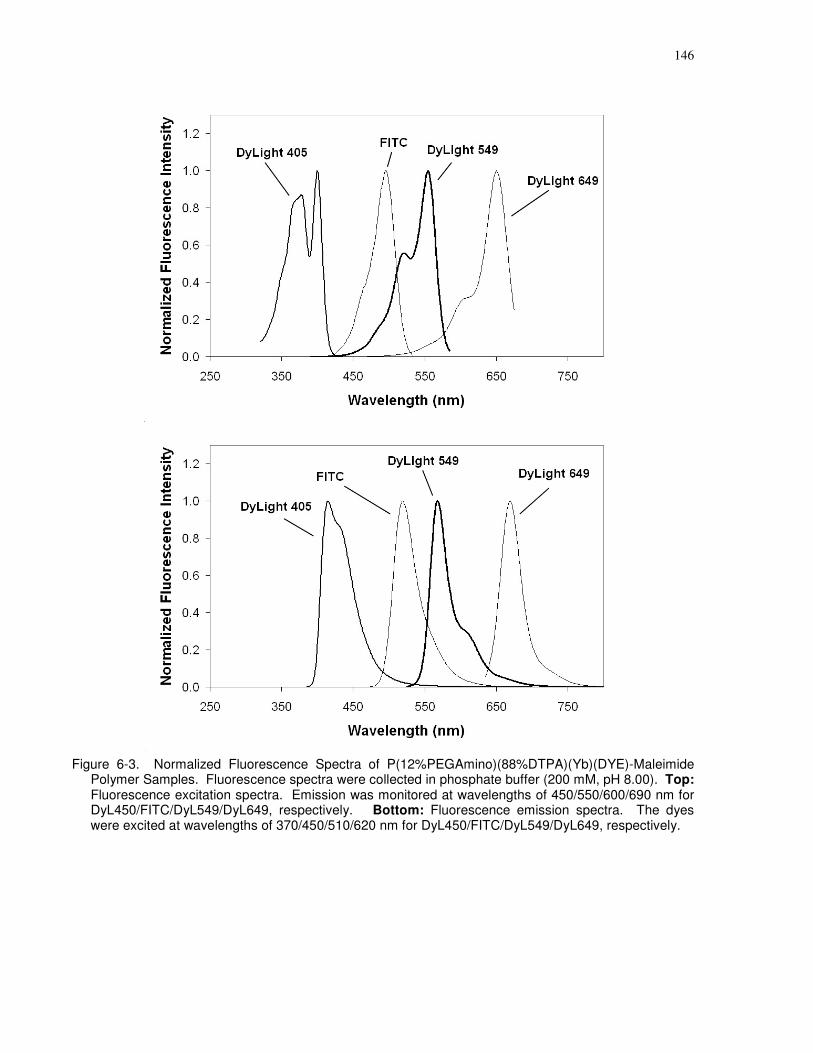
146
Figure 6-3. Normalized Fluorescence Spectra of P(12%PEGAmino)(88%DTPA)(Yb)(DYE)-Maleimide Polymer Samples. Fluorescence spectra were collected in phosphate buffer (200 mM, pH 8.00). Top: Fluorescence excitation spectra. Emission was monitored at wavelengths of 450/550/600/690 nm for DyL450/FITC/DyL549/DyL649, respectively. Bottom: Fluorescence emission spectra. The dyes were excited at wavelengths of 370/450/510/620 nm for DyL450/FITC/DyL549/DyL649, respectively.
147
6.3.2 Mass Cytometry and FACS Bioassays
6.3.2.1 Proof of Concept Bioassays
The performance of the dual-purpose polymers was tested in two model mass cytometric
bioassays. As an initial proof of concept, P(12%PEGAmino)(88%DTPA)(172Yb)(FITC)-
Maleimide was used to label a secondary antibody directed against a murine monoclonal IgG
specific for CD45. To start, an aliquot of secondary goat anti-mouse (GAM) was treated with
TCEP to partially reduce disulfides in the hinge region of the antibody. The resultant thiol
groups were reacted to form covalent bonds with the maleimide group of the 172Yb-loaded,
FITC-labeled polymer. This antibody GAM-tag was set aside. Growing Ramos cells were
collected from the tissue culture flask and stained with CD45 primary antibody, after which
GAM-tag was used to stain the Fc fragment of CD45. Prior to mass cytometric analysis, the cells
were fixed and incubated with a DNA iridium-intercalator in order to identify cell events, as
discussed in Chapter 5. Results for the mass cytometric analysis of the stained Ramos cells are
presented in Figure 6-4. High 172Yb signal was obtained when the cells were stained with a 2.5
µg/mL solution of the GAM-tag.
Figure 6-4. Mass Cytometry Results for Proof of Concept Bioassay using the Secondary Antibody GAM Conjugate of P(12%PEGAmino)(88%DTPA)(
172Yb)(FITC)-Maleimide to Stain CD45-Stained Ramos
Cells. (A) 191
Ir vs 193
Ir is plotted to select for cell events. This is shown for the experiment with GAM-tag at a concentration of 2.5 µg/mL. (B) A histogram of
172Yb signal is plotted for the cell events from
(A). High signal was obtained when the cells were stained with a 2.5 µg/mL solution of GAM-tag.
In a separate experiment, a fresh batch of cells was stained with CD45 and the same 2.5
µg/mL solution of GAM-tag, and then analyzed by FACS on a BD Biosciences LSRII
instrument. Unstained Ramos cells were also run on the instrument as a negative control.
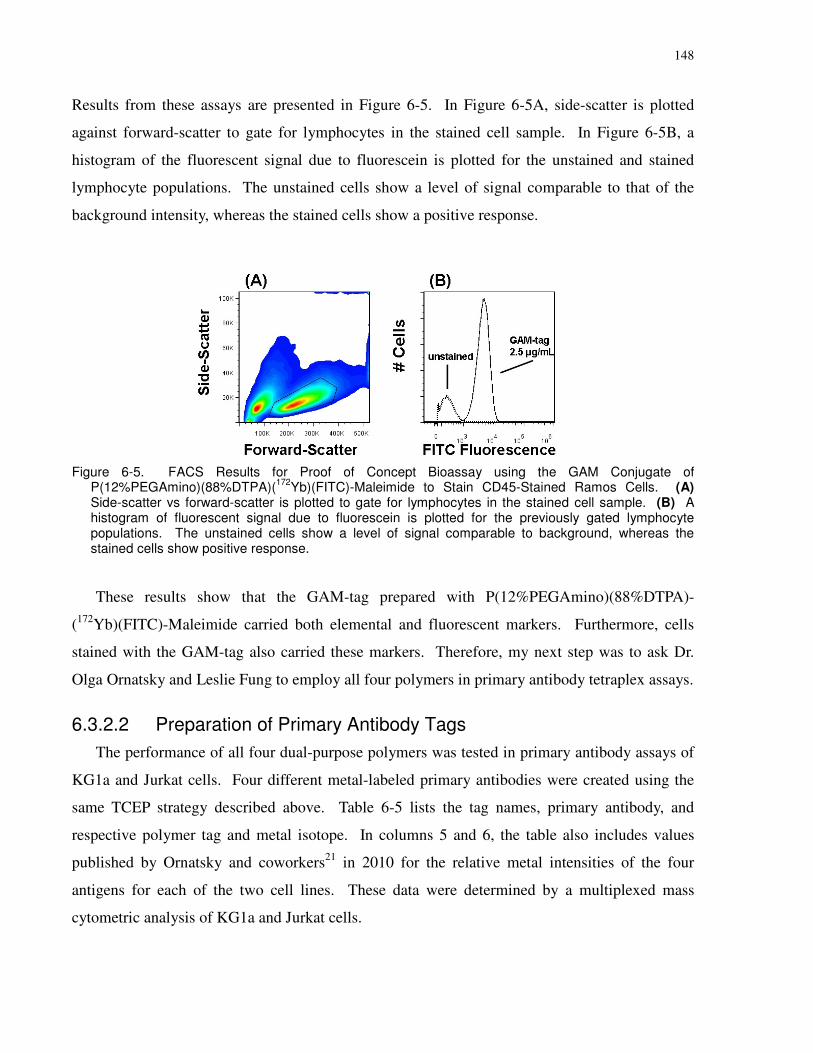
148
Results from these assays are presented in Figure 6-5. In Figure 6-5A, side-scatter is plotted
against forward-scatter to gate for lymphocytes in the stained cell sample. In Figure 6-5B, a
histogram of the fluorescent signal due to fluorescein is plotted for the unstained and stained
lymphocyte populations. The unstained cells show a level of signal comparable to that of the
background intensity, whereas the stained cells show a positive response.
Figure 6-5. FACS Results for Proof of Concept Bioassay using the GAM Conjugate of P(12%PEGAmino)(88%DTPA)(
172Yb)(FITC)-Maleimide to Stain CD45-Stained Ramos Cells. (A)
Side-scatter vs forward-scatter is plotted to gate for lymphocytes in the stained cell sample. (B) A histogram of fluorescent signal due to fluorescein is plotted for the previously gated lymphocyte populations. The unstained cells show a level of signal comparable to background, whereas the stained cells show positive response.
These results show that the GAM-tag prepared with P(12%PEGAmino)(88%DTPA)-
(172Yb)(FITC)-Maleimide carried both elemental and fluorescent markers. Furthermore, cells
stained with the GAM-tag also carried these markers. Therefore, my next step was to ask Dr.
Olga Ornatsky and Leslie Fung to employ all four polymers in primary antibody tetraplex assays.
6.3.2.2 Preparation of Primary Antibody Tags
The performance of all four dual-purpose polymers was tested in primary antibody assays of
KG1a and Jurkat cells. Four different metal-labeled primary antibodies were created using the
same TCEP strategy described above. Table 6-5 lists the tag names, primary antibody, and
respective polymer tag and metal isotope. In columns 5 and 6, the table also includes values
published by Ornatsky and coworkers21 in 2010 for the relative metal intensities of the four
antigens for each of the two cell lines. These data were determined by a multiplexed mass
cytometric analysis of KG1a and Jurkat cells.
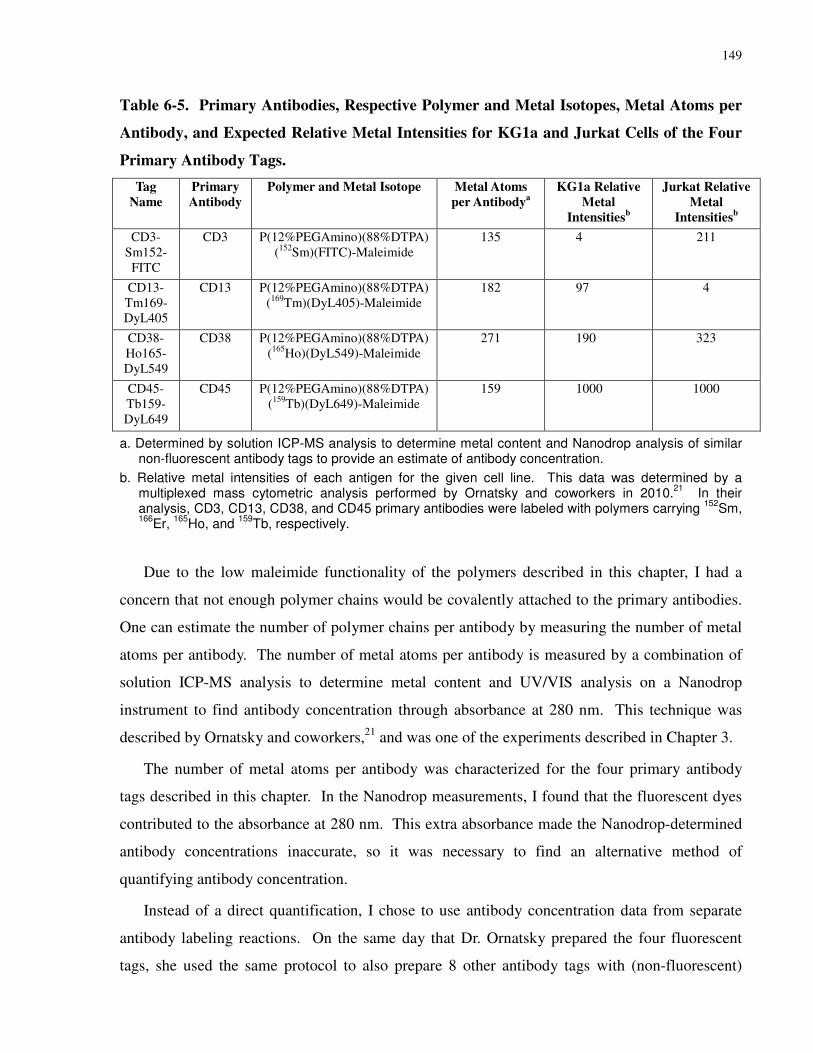
149
Table 6-5. Primary Antibodies, Respective Polymer and Metal Isotopes, Metal Atoms per
Antibody, and Expected Relative Metal Intensities for KG1a and Jurkat Cells of the Four
Primary Antibody Tags.
Tag
Name
Primary
Antibody
Polymer and Metal Isotope Metal Atoms
per Antibodya
KG1a Relative
Metal
Intensitiesb
Jurkat Relative
Metal
Intensitiesb
CD3-Sm152-FITC
CD3 P(12%PEGAmino)(88%DTPA)(152Sm)(FITC)-Maleimide
135 4 211
CD13-Tm169-DyL405
CD13 P(12%PEGAmino)(88%DTPA)(169Tm)(DyL405)-Maleimide
182 97 4
CD38-Ho165-DyL549
CD38 P(12%PEGAmino)(88%DTPA)(165Ho)(DyL549)-Maleimide
271 190 323
CD45-Tb159-DyL649
CD45 P(12%PEGAmino)(88%DTPA)(159Tb)(DyL649)-Maleimide
159 1000 1000
a. Determined by solution ICP-MS analysis to determine metal content and Nanodrop analysis of similar non-fluorescent antibody tags to provide an estimate of antibody concentration.
b. Relative metal intensities of each antigen for the given cell line. This data was determined by a multiplexed mass cytometric analysis performed by Ornatsky and coworkers in 2010.
21 In their
analysis, CD3, CD13, CD38, and CD45 primary antibodies were labeled with polymers carrying 152
Sm, 166
Er, 165
Ho, and 159
Tb, respectively.
Due to the low maleimide functionality of the polymers described in this chapter, I had a
concern that not enough polymer chains would be covalently attached to the primary antibodies.
One can estimate the number of polymer chains per antibody by measuring the number of metal
atoms per antibody. The number of metal atoms per antibody is measured by a combination of
solution ICP-MS analysis to determine metal content and UV/VIS analysis on a Nanodrop
instrument to find antibody concentration through absorbance at 280 nm. This technique was
described by Ornatsky and coworkers,21 and was one of the experiments described in Chapter 3.
The number of metal atoms per antibody was characterized for the four primary antibody
tags described in this chapter. In the Nanodrop measurements, I found that the fluorescent dyes
contributed to the absorbance at 280 nm. This extra absorbance made the Nanodrop-determined
antibody concentrations inaccurate, so it was necessary to find an alternative method of
quantifying antibody concentration.
Instead of a direct quantification, I chose to use antibody concentration data from separate
antibody labeling reactions. On the same day that Dr. Ornatsky prepared the four fluorescent
tags, she used the same protocol to also prepare 8 other antibody tags with (non-fluorescent)
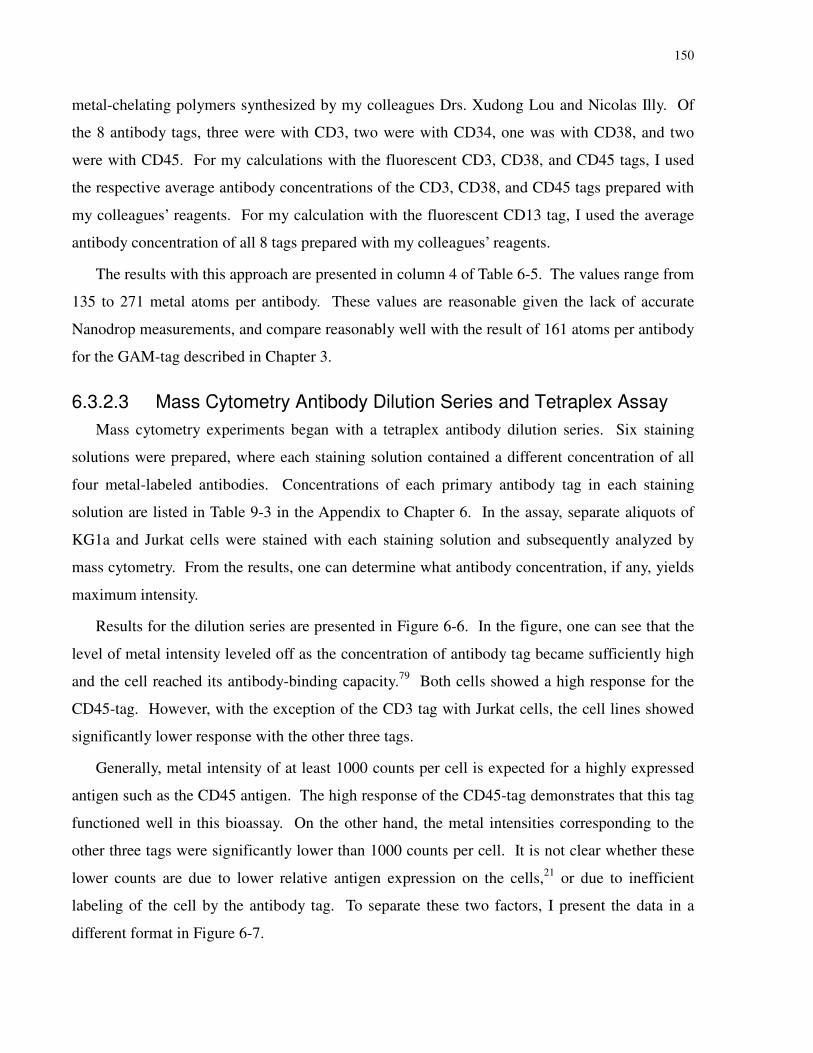
150
metal-chelating polymers synthesized by my colleagues Drs. Xudong Lou and Nicolas Illy. Of
the 8 antibody tags, three were with CD3, two were with CD34, one was with CD38, and two
were with CD45. For my calculations with the fluorescent CD3, CD38, and CD45 tags, I used
the respective average antibody concentrations of the CD3, CD38, and CD45 tags prepared with
my colleagues’ reagents. For my calculation with the fluorescent CD13 tag, I used the average
antibody concentration of all 8 tags prepared with my colleagues’ reagents.
The results with this approach are presented in column 4 of Table 6-5. The values range from
135 to 271 metal atoms per antibody. These values are reasonable given the lack of accurate
Nanodrop measurements, and compare reasonably well with the result of 161 atoms per antibody
for the GAM-tag described in Chapter 3.
6.3.2.3 Mass Cytometry Antibody Dilution Series and Tetraplex Assay
Mass cytometry experiments began with a tetraplex antibody dilution series. Six staining
solutions were prepared, where each staining solution contained a different concentration of all
four metal-labeled antibodies. Concentrations of each primary antibody tag in each staining
solution are listed in Table 9-3 in the Appendix to Chapter 6. In the assay, separate aliquots of
KG1a and Jurkat cells were stained with each staining solution and subsequently analyzed by
mass cytometry. From the results, one can determine what antibody concentration, if any, yields
maximum intensity.
Results for the dilution series are presented in Figure 6-6. In the figure, one can see that the
level of metal intensity leveled off as the concentration of antibody tag became sufficiently high
and the cell reached its antibody-binding capacity.79 Both cells showed a high response for the
CD45-tag. However, with the exception of the CD3 tag with Jurkat cells, the cell lines showed
significantly lower response with the other three tags.
Generally, metal intensity of at least 1000 counts per cell is expected for a highly expressed
antigen such as the CD45 antigen. The high response of the CD45-tag demonstrates that this tag
functioned well in this bioassay. On the other hand, the metal intensities corresponding to the
other three tags were significantly lower than 1000 counts per cell. It is not clear whether these
lower counts are due to lower relative antigen expression on the cells,21 or due to inefficient
labeling of the cell by the antibody tag. To separate these two factors, I present the data in a
different format in Figure 6-7.
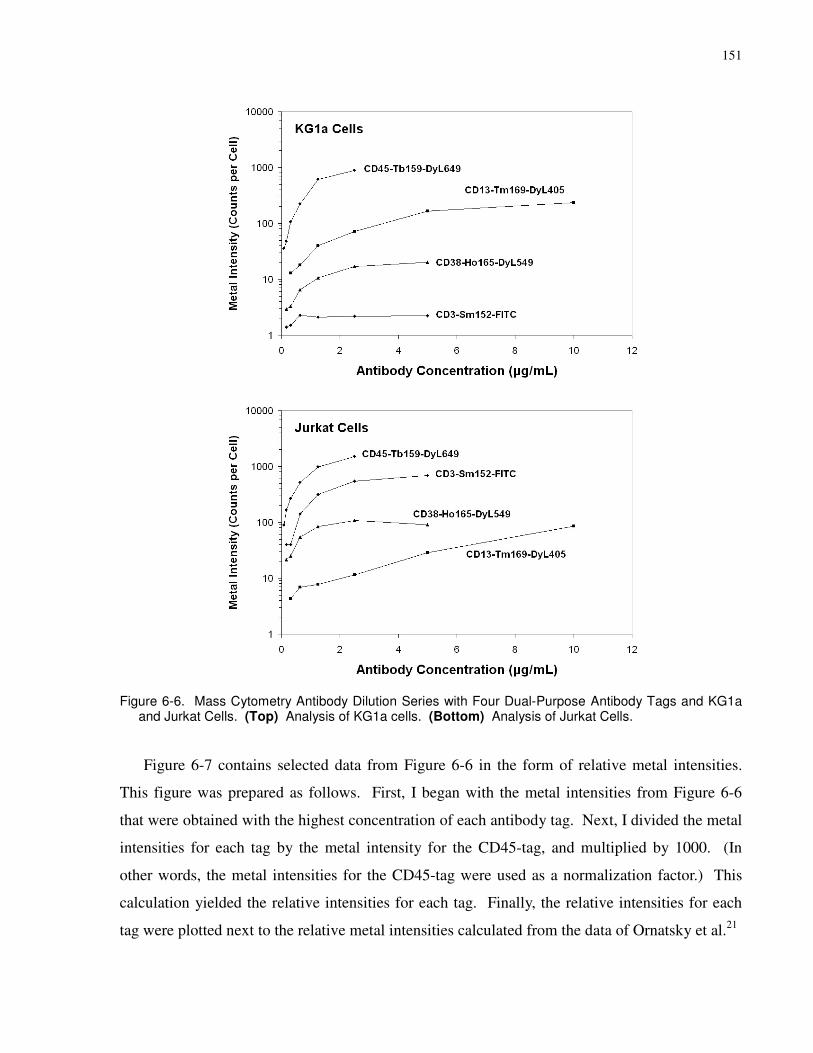
151
Figure 6-6. Mass Cytometry Antibody Dilution Series with Four Dual-Purpose Antibody Tags and KG1a and Jurkat Cells. (Top) Analysis of KG1a cells. (Bottom) Analysis of Jurkat Cells.
Figure 6-7 contains selected data from Figure 6-6 in the form of relative metal intensities.
This figure was prepared as follows. First, I began with the metal intensities from Figure 6-6
that were obtained with the highest concentration of each antibody tag. Next, I divided the metal
intensities for each tag by the metal intensity for the CD45-tag, and multiplied by 1000. (In
other words, the metal intensities for the CD45-tag were used as a normalization factor.) This
calculation yielded the relative intensities for each tag. Finally, the relative intensities for each
tag were plotted next to the relative metal intensities calculated from the data of Ornatsky et al.21

152
It is not entirely accurate to compare relative metal intensities from the work described in this
chapter to the work published by Ornatsky et al.21 This inaccuracy arises from the relationship
between metal intensity and the actual number of atoms per cell. The number of metal atoms per
cell is calculated from the metal intensity through multiplying by an intensity-to-count
conversion factor and dividing by a transmission coefficient.21 These instrument corrections are
different for different isotopes; this is a concern for the CD13-tag, because it was labeled with
166Er in the work by Ornatsky et al., but 169Tm in this work. Even though the other three tags
were labeled with the same metal isotope, there is a concern that the instrument corrections will
vary over time. Thus, the comparison of relative metal intensities presented in Figure 6-7 should
only be interpreted in a semi-quantitative manner.
The cell-labeling efficiency of each antibody tag can be estimated from the data in Figure
6-7. Consider in detail the results for the CD3-tag. The relative metal intensities obtained for
KG1a cells in this work and in the work by Ornatsky et al. are both near zero. Therefore, I
conclude that the near zero signal obtained in this work is due to lack of CD3 antigen expression
on KG1a cells. The relative metal intensity obtained for Jurkat cells in this work is 460,
compared to 210 in the experiments by Ornatsky et al. From this, I conclude that the CD3-tag
described in this chapter efficiently labeled Jurkat cells.
Using similar analyses, I reached conclusions about the other antibody tags. I conclude that
the CD13-tag prepared in this chapter was efficient in labeling KG1a cells, and the CD45-tag
was efficient in labeling both cell lines. Unfortunately, the relative metal intensities observed for
the CD38-tag described in this chapter were much lower than those from the work of Ornatsky et
al. Therefore, I conclude that the CD38-tag did not efficiently label cells.

153
Figure 6-7. Comparison of Mass Cytometry Relative Metal Intensities for KG1a and Jurkat Cells to Published Data.
21 Relative intensities were calculated by dividing the metal counts obtained for each
tag with the highest concentration antibody staining solution by the metal counts for the CD45-tag, and multiplying by 1000. The relative metal intensities were plotted next to published data for relative metal intensities.
21
The data from the antibody dilution series experiment can also be presented as histogram
plots. The data obtained with the highest concentration staining cocktail of all four antibodies
are presented in Figure 6-8. In Figure 6-8(A) and Figure 6-8(B), 191Ir vs. 193Ir is plotted for each
cell sample to select for cell events. Histogram plots for both cell lines are presented for each
antibody tag in Figure 6-8(C-F). The x-axis denotes the metal intensity for each cell event, and
the y-axis denotes the relative number of cell events with a given metal intensity. These figures
are interpreted by comparing the levels of metal signal obtained for one cell line to the other.
Distinct peaks are termed cell populations, and cell populations with high and low levels of
signal are considered + and – for the given antigen, respectively.
Consider the CD3 data in Figure 6-8(C). All the KG1a cell events had a low level of signal,
whereas the Jurkat cell events covered a range from low to high levels of signal. From this I
conclude that KG1a cells were CD3-, and the Jurkat cells were a mix of CD3+ and CD3- cells.
This difference between the cell lines is in agreement with the published relative metal intensities
presented in Table 6-5.
Next, consider the CD13 data in Figure 6-8(D). In the figure, the Jurkat cells appear to show
two populations, and the KG1a cells show the same level of signal as the high-signal Jurkat cells.
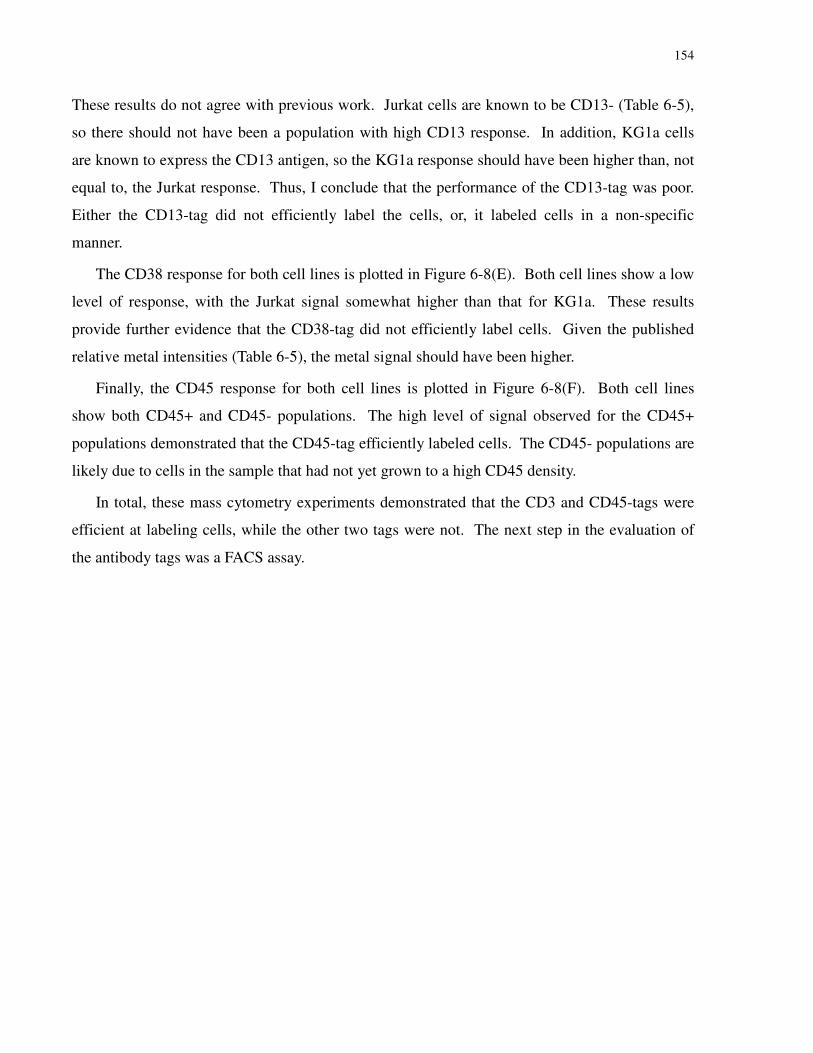
154
These results do not agree with previous work. Jurkat cells are known to be CD13- (Table 6-5),
so there should not have been a population with high CD13 response. In addition, KG1a cells
are known to express the CD13 antigen, so the KG1a response should have been higher than, not
equal to, the Jurkat response. Thus, I conclude that the performance of the CD13-tag was poor.
Either the CD13-tag did not efficiently label the cells, or, it labeled cells in a non-specific
manner.
The CD38 response for both cell lines is plotted in Figure 6-8(E). Both cell lines show a low
level of response, with the Jurkat signal somewhat higher than that for KG1a. These results
provide further evidence that the CD38-tag did not efficiently label cells. Given the published
relative metal intensities (Table 6-5), the metal signal should have been higher.
Finally, the CD45 response for both cell lines is plotted in Figure 6-8(F). Both cell lines
show both CD45+ and CD45- populations. The high level of signal observed for the CD45+
populations demonstrated that the CD45-tag efficiently labeled cells. The CD45- populations are
likely due to cells in the sample that had not yet grown to a high CD45 density.
In total, these mass cytometry experiments demonstrated that the CD3 and CD45-tags were
efficient at labeling cells, while the other two tags were not. The next step in the evaluation of
the antibody tags was a FACS assay.
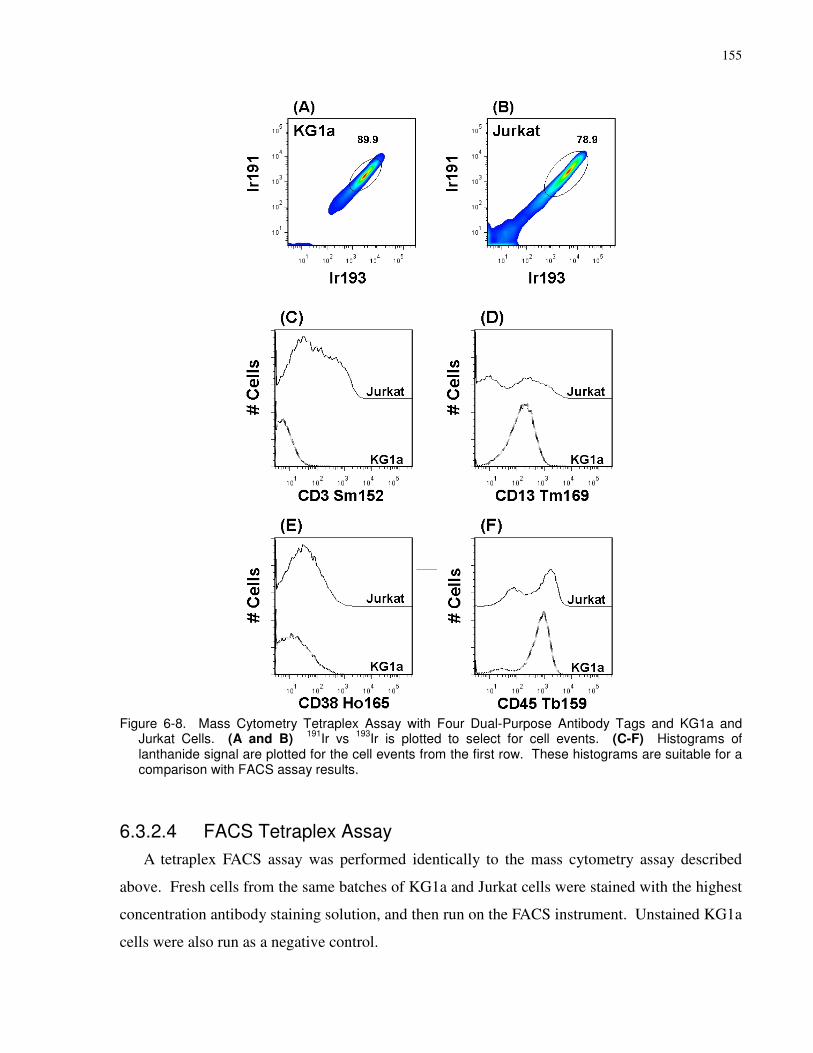
155
Figure 6-8. Mass Cytometry Tetraplex Assay with Four Dual-Purpose Antibody Tags and KG1a and Jurkat Cells. (A and B)
191Ir vs
193Ir is plotted to select for cell events. (C-F) Histograms of
lanthanide signal are plotted for the cell events from the first row. These histograms are suitable for a comparison with FACS assay results.
6.3.2.4 FACS Tetraplex Assay
A tetraplex FACS assay was performed identically to the mass cytometry assay described
above. Fresh cells from the same batches of KG1a and Jurkat cells were stained with the highest
concentration antibody staining solution, and then run on the FACS instrument. Unstained KG1a
cells were also run as a negative control.

156
Data from this assay is presented as histogram plots in Figure 6-9. In Figure 6-9(A-C), side-
scatter is plotted against forward-scatter to select for cells. In Figure 6-9(D-G), histogram plots
of fluorescence intensity are presented for each antibody tag. The x-axis denotes the
fluorescence intensity for each cell event, and the y-axis denotes the relative number of cell
events with a given fluorescence intensity. These figures are interpreted by comparing the
fluorescence intensity of the stained cells to that of the unstained KG1a. The unstained KG1a
was included as a negative control to account for background signal and cell autofluorescence.
As above, distinct peaks are termed cell populations, and cell populations with high and low
levels of signal are considered + and – for the given antigen, respectively.
The CD3 response is plotted in Figure 6-9(D). All the KG1a cells had the same fluorescence
intensity as the unstained negative control. The majority of the Jurkat cells had the same level of
intensity; however, there was a small population with a higher level of fluorescence. From this
result, I once again conclude that KG1a cells are CD3-, and Jurkat cells are a mix of CD3+ and
CD3-. One interesting difference between the mass cytometry and FACS results is the relative
populations of Jurkat cells identified as CD3+ and CD3-. In Figure 6-8(C), it appears that
approximately 40% of the cells are CD3+, while in Figure 6-9(D), it appears that only ca. 10% of
the cells are CD3+. In the literature, there is a report156 of a sample of Jurkat cells in which 57%
of the cells are CD3+. It is possible that the discrepancy between the two assays described here
is simply due to each assay being run with Jurkat cells grown to different densities.
Figure 6-9(E) and Figure 6-9(F) contain the data for the CD13 and CD38 response. In both
plots, the stained cells show the same level of fluorescence as the unstained negative control.
This lack of positive response stands as further evidence that the CD13 and CD38-tags did not
efficiently label cells.
Finally, the CD45 response is plotted in Figure 6-9(G). Both cell lines show fluorescence
intensity significantly higher than that of the unstained negative control. However, the Jurkat
cells show some overlap with the negative control, and the KG1a cells show a small but distinct
CD45- population. The high fluorescence intensity of the CD45+ cells is further evidence that
the CD45-tag efficiently labeled cells. As above, the CD45- cells were likely those in the sample
that had not yet grown to a high density of CD45.
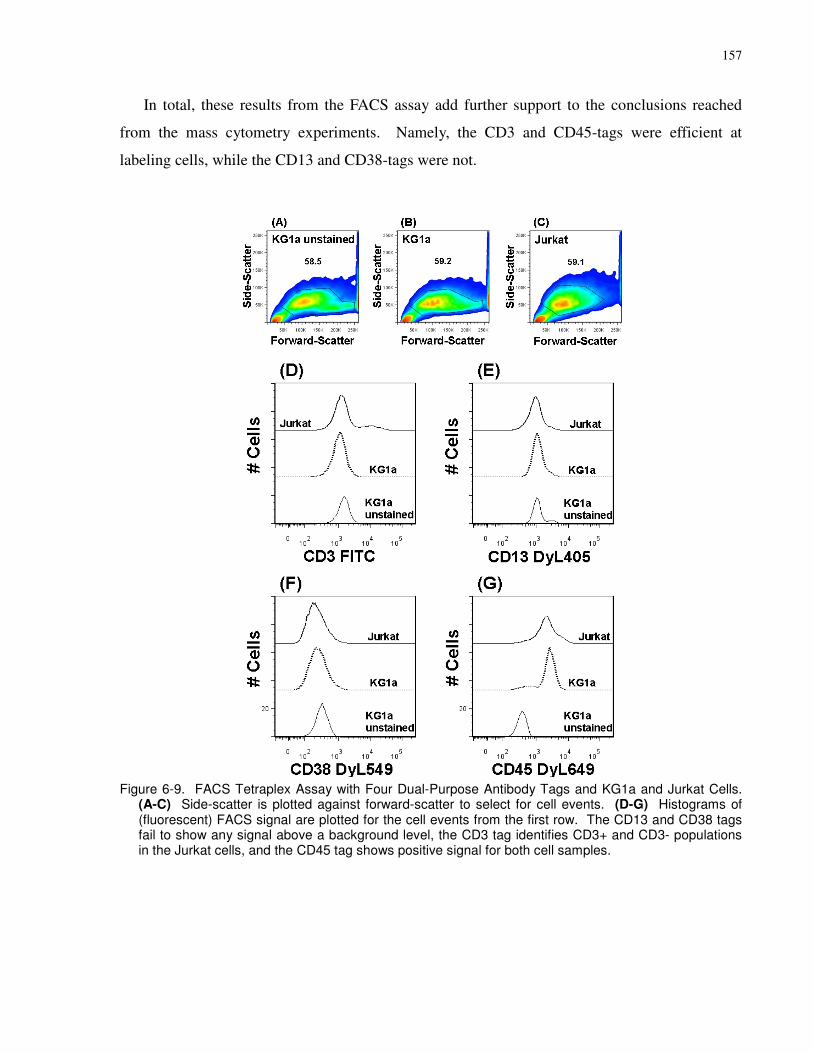
157
In total, these results from the FACS assay add further support to the conclusions reached
from the mass cytometry experiments. Namely, the CD3 and CD45-tags were efficient at
labeling cells, while the CD13 and CD38-tags were not.
Figure 6-9. FACS Tetraplex Assay with Four Dual-Purpose Antibody Tags and KG1a and Jurkat Cells. (A-C) Side-scatter is plotted against forward-scatter to select for cell events. (D-G) Histograms of (fluorescent) FACS signal are plotted for the cell events from the first row. The CD13 and CD38 tags fail to show any signal above a background level, the CD3 tag identifies CD3+ and CD3- populations in the Jurkat cells, and the CD45 tag shows positive signal for both cell samples.
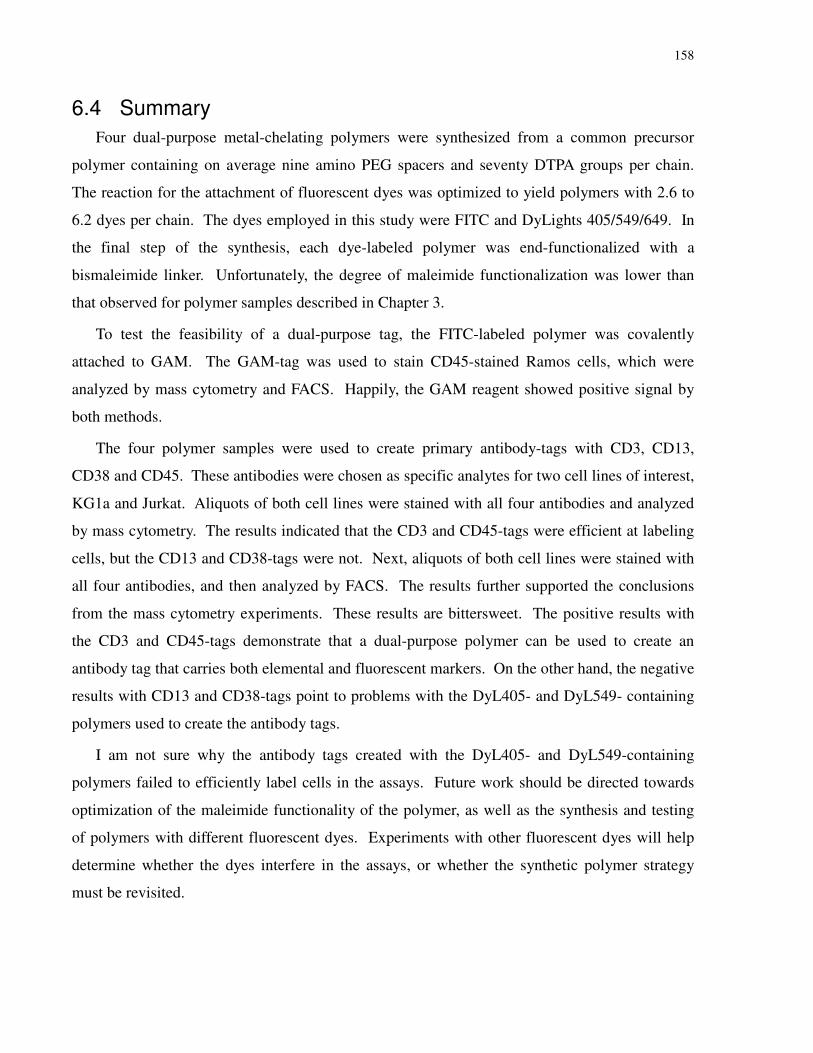
158
6.4 Summary
Four dual-purpose metal-chelating polymers were synthesized from a common precursor
polymer containing on average nine amino PEG spacers and seventy DTPA groups per chain.
The reaction for the attachment of fluorescent dyes was optimized to yield polymers with 2.6 to
6.2 dyes per chain. The dyes employed in this study were FITC and DyLights 405/549/649. In
the final step of the synthesis, each dye-labeled polymer was end-functionalized with a
bismaleimide linker. Unfortunately, the degree of maleimide functionalization was lower than
that observed for polymer samples described in Chapter 3.
To test the feasibility of a dual-purpose tag, the FITC-labeled polymer was covalently
attached to GAM. The GAM-tag was used to stain CD45-stained Ramos cells, which were
analyzed by mass cytometry and FACS. Happily, the GAM reagent showed positive signal by
both methods.
The four polymer samples were used to create primary antibody-tags with CD3, CD13,
CD38 and CD45. These antibodies were chosen as specific analytes for two cell lines of interest,
KG1a and Jurkat. Aliquots of both cell lines were stained with all four antibodies and analyzed
by mass cytometry. The results indicated that the CD3 and CD45-tags were efficient at labeling
cells, but the CD13 and CD38-tags were not. Next, aliquots of both cell lines were stained with
all four antibodies, and then analyzed by FACS. The results further supported the conclusions
from the mass cytometry experiments. These results are bittersweet. The positive results with
the CD3 and CD45-tags demonstrate that a dual-purpose polymer can be used to create an
antibody tag that carries both elemental and fluorescent markers. On the other hand, the negative
results with CD13 and CD38-tags point to problems with the DyL405- and DyL549- containing
polymers used to create the antibody tags.
I am not sure why the antibody tags created with the DyL405- and DyL549-containing
polymers failed to efficiently label cells in the assays. Future work should be directed towards
optimization of the maleimide functionality of the polymer, as well as the synthesis and testing
of polymers with different fluorescent dyes. Experiments with other fluorescent dyes will help
determine whether the dyes interfere in the assays, or whether the synthetic polymer strategy
must be revisited.
159
6.5 Contents of Appendix to Chapter 6
Table of antibody tag concentrations in the staining solutions used for the tetraplex antibody
dilution series, 1H NMR spectrum of P(12%PEGAmino)(88%DTPA)-Disulfide (D2O),
normalized UV/VIS absorption spectra of P(12%PEGAmino)(88%DTPA)(DYE)-Disulfide
polymers, and partial 1H NMR spectra of P(12%PEGAmino)(88%DTPA)(Dye)-Maleimide
(D2O) polymers.

160
161
7 Chapter 7: Future Work
7.1 Overview
The purpose of this chapter is to outline future experiments geared towards expanding on and
further illuminating the work presented in this thesis. Future experiments are organized by
which previous chapter served as the inspiration.
7.2 Chapter 3
7.2.1 Influence of Metal-Chelating Polymer on Antibody Binding Affinity
The binding of an antibody to an antigen is generally an equilibrium process. The affinity of
the interaction is mathematically defined as the concentration of antibody-antigen complex
divided by the multiplied concentrations of free antibody and free antigen. As such, it is a
measure of how good a match the antibody is for the antigen.157,158 One aspect that the Tanner
and Winnik groups have not directly examined is whether the attachment of MCP (metal-
chelating polymer) chains to an antibody changes the binding affinity of the antibody for its
target antigen. There is a concern that the binding affinity might be lowered by two effects. The
first possible effect is that chemical modification of an antibody close to its binding region will
cause the antibody to lose specificity.142 To minimize this problem, the Tanner group eschewed
lysine side-chain modification in favor of cysteine modification. The second possible effect is
that the polymer chains may cause steric hindrance to the approach of the polymer-antibody
conjugate towards the antigen. To determine whether these possible problems are actually a
concern, my approach would be to empirically measure the performance of the modified
antibodies.
One can measure the performance of the polymer-antibody conjugate by using the conjugate
to quantify the ABC (antibody-binding capacity) of a well-known cell type. This experiment has
been done by Ornatsky and coworkers,21 as described in the introduction to this thesis. In their
experiments, they found that the ABC values determined by mass cytometry were in agreement
with literature values determined by FACS (fluorescence-activated cell sorting) experiments.
This result shows is it is possible to stain every antigen site with a metal-loaded antibody tag.
However, this result alone does not yield information on the actual value of binding affinity.
162
There are a number of methods available for characterizing antibody-antigen binding
affinity.157 One set of methods to characterize the affinity is through non-competitive and
indirect competitive ELISA (enzyme-linked immunosorbent assay).158 In the non-competitive
ELISA, antigen coated on a plate is treated with varying concentrations of antibody. The
concentration of antibody that yields half saturation is the reciprocal of the affinity. The
downside to this method is that immobilization of the antigen can have a strong effect on its
conformation and thus the antibody-antigen binding affinity.
In the application of mass cytometry, immobilization of the antigen is not a concern. In fact,
an antigen on the surface of a cell is the routine analyte. Thus, an antibody dilution series,21
where a fixed number of cells is exposed to varying concentrations of metal-loaded antibody tag,
can be considered analogous to a non-competitive ELISA. In this case, what one would have to
do to find the binding affinity is to perform an antibody dilution series and find the concentration
of antibody tag that yields half saturation.
Half saturation techniques can be difficult to perform, however, due to the low concentrations
required. Since antibody-antigen interactions have binding affinities of ca. 109, half antigen
saturation will require an antibody concentration of ca. 10-9. In practice, these assays are done
by starting with one binding partner at a concentration ten times lower than Kd (dissocation
constant), and titrating in the other binding partner from a concentration well below Kd to at least
ten times higher than Kd. One must ensure that a useful level of analyte signal can be obtained at
these low concentrations.
In the indirect competitive ELISA,158 the goal is to measure affinity of the antibody to a non-
immobilized antigen. In this assay, a fixed concentration of antibody is incubated in solution
with varying concentrations of antigen. The solution is given time to reach equilibrium. Next,
the unsaturated antibody is captured with bead- or plate-immobilized antigen and quantified by
ELISA.
I can imagine performing similar experiments with metal-labeled antibodies and mass
cytometry. One would start by preparing a metal-labeled GAM (goat anti-mouse) antibody. One
would then expose a fixed concentration of GAM-tag to various concentrations of mouse anti-
human CD45 in solution, and allow them to equilibrate. Next, one would add each of these
solutions to a solution of CD45-stained Ramos cells. The CD45-stained Ramos cells will
capture the unsaturated GAM-tag. After purification, mass cytometric analysis of the cells will
163
quantify the unsaturated antibody. From these data one can calculate the affinity for the
formation of the GAM-tag/CD45 complex in solution.
Another method to characterize the affinity is through ITC (isothermal titration
calorimetry).159 In Chapter 3 I described how ITC experiments were used to monitor the
chelation of Gd3+ by a metal-chelating polymer. Similarly, ITC can be used to monitor the
formation of an antibody-antigen complex. Schwarz and coworkers159 found that below 48 0C,
the affinities for complex formation were above 107, which along with the working antibody
concentrating of 0.1 mM, made the affinities too high to measure. Thus, they performed the
titrations at 48 0C, and used the heat of titration per injection to calculate room temperature
affinities. One can imagine performing the same experiment with metal-loaded antibodies.
While the enthalpy of binding of may change after the attachment of the metal-chelating
polymers, this should not be a problem, because the enthalpy of binding can be determined from
the fitting of each set of experimental data.
7.3 Chapter 4
7.3.1 Do Dodecyl-Terminated Amino or DTPA Polymers form Micelles in Water?
In the work presented in Chapter 4, I waited until the penultimate synthetic step to aminolyze
the dodecyltrithiocarbonate. Thus, a dodecyl-terminated amino polymer was used in the
preceding reaction in which DTPA was added. Aqueous SEC analysis of the product DTPA
polymers indicated that there was a small degree of inter-chain cross-links. My idea is that these
cross-links formed because the dodecyl-terminated amino polymer formed micelles under the
conditions used for the DTPA reaction.
The literature contains examples where a hydrophobic moiety of a hydrophilic polymer will
associate in water. For example, in 2000, Nezu and F.M. Winnik160 reported association in water
of a pyrene-labeled PAA. They monitored the degree of pyrene interaction by noting the ratio of
pyrene monomer to excimer fluorescence. In another example, Dai and coworkers161 reported
the aggregation of methacrylic acid/ethyl acrylate copolymers in dilute, alkaline aqueous
solution. They found both single chains and aggregates in solution through DLS (dynamic light-
scattering) measurements.
164
Fluorescence measurements are not possible for the dodecyl-terminated polymer. However,
DLS should prove useful in determining whether this polymer forms aggregates when dissolved
in water.
7.4 Chapter 5
7.4.1 Indium-Loaded Metal-Chelating Polymers
In the literature, there are numerous reports of DTPA and DOTA complexes of radioactive
111In.162,163,164 These complexes are used in the treatment of breast cancer, and are usually
prepared by first mixing the indium chloride with an acetate or citrate buffer of high
concentration.
Similarly, one can imagine preparing indium-loaded metal-chelating polymers for use in
mass cytometry. Naturally-occurring indium contains one major isotope (115In); thus, use of this
isotope would expand the multiplexity of mass cytometry by one. As part of my work in Chapter
5, I performed a few exploratory indium-loading reactions with indium chloride dissolved in
acetate buffer. Unfortunately, I found unexpected precipitate and irreproducible levels of indium
loaded into the polymer.
Subsequently, my colleagues Isaac Herrera and Yijie Lu demonstrated that indium can be
loaded into DTPA and DTPA-carrying polymers, respectively, if first dissolved in a high
concentration citrate buffer. I think it is worthwhile to confirm the indium loading conditions by
using them to bind In3+ to my fluorescein-terminated DTPA polymer. Next, one would
characterize the polymer metal content using the procedure from Chapter 5. Finally, one would
prepare an indium-loaded, maleimide-terminated polymer, use it to label GAM, and
subsequently use the GAM-tag in a model mass cytometric assay.
7.4.2 Soft Ligands for Palladium and Platinum
The main conclusion from the work in Chapter 5 is that polyaminocarboxylate ligands are
not sufficiently soft to fully sequester soft metal atoms like palladium and platinum. To
overcome this problem, I suggest that we should prepare polymers with soft, cage-like ligands.
One attractive option is the sarcophagine ligand.165 This ligand is a tri-arm cage structure with
six secondary amines. In addition, the two ends of the ligand can be orthogonally functionalized,
for example with an amine on one end and an aminobenzyl on the other. While these ligands are

165
popularly used for radioactive 64Cu in PET (positron emission tomography),166 there are also
reports of hexadentate platinum(IV) complexes with this ligand.167,168
I think it is worthwhile to prepare polymeric reagents with these complexes. One challenge
would lie in controlling the charge of these polymers. All my previous work with lanthanide-
carrying polymers has shown that in mass cytometry bioassays, polymers with a negative charge
per repeat unit are effective. However, our group has not tested alternatives, such as zwitterionic
polymers, in model mass cytometry assays. My hypothesis is that negatively-charged polymers
yield low background in these assays because the surface of a cell is negatively-charged.169 This
prevents non-specific adsorption of the polymer-antibody tag. Unfortunately, a platinum(IV)
complex of sarcophagine will carry a +4 charge. Thus, one will have to devise methods of
modifying the polymer to ensure it carries a net negative charge. If we can develop a satisfactory
strategy, we could prepare maleimide-terminated polymers, label GAM, and perform model mass
cytometric assays to determine whether the sarcophagine ligand sufficiently sequesters Pd and Pt
atoms.
7.5 Chapter 6
7.5.1 Improved Dual-Purpose Fluorescent Polymers
In Chapter 6, only two of the four dual-purpose tags performed well in model fluorescent and
cytometric assays. One problem was with low maleimide end-functionality of the polymers. A
second problem was that it was unclear whether the dyes themselves interfered with the Michael
addition reactions of bismaleimide attachment to polymer and polymeric maleimide attachment
to antibody.
There are a number of experiments I would like to see carried out in order to have better
control over the synthesis. First, one should prepare a control polymer where the amino groups
of the PEG spacers are blocked with succinic anhydride. One could then perform the
bismaleimide reaction and monitor the maleimide end-functionality. If this end-functionality is
lower than that of the polymers presented in Chapter 3, one would learn that the synthetic
strategy, described in Chapter 6, is detrimental to obtaining high end-functionality, and must be
revisited.
Another set of worthwhile experiments is to synthesize polymers with other fluorescent dyes,
such as the Alexa brand dyes, as well as simpler dyes whose structures are known, including

166
AMCA (7-amino-4-methylcoumarin-3-acetate) and TRITC (tetramethylrhodamine
isothiocyanate). The performance of antibody tags created with these polymers will indicate
whether certain DyLight dyes were the problem, or again, if the synthetic strategy itself must be
revisited.
167
8 References
(1) Biomarkers Definitions Working Group, Bethesda, Md Clinical Pharmacology &
Therapeutics 2001, 69, 89-95.
(2) Celis, J. E.; Østergaard, M.; Basse, B.; Celis, A.; Lauridsen, J. B.; Ratz, G. P.; Andersen, I.; Hein, B.; Wolf, H.; Ørntoft, T. F.; Rasmussen, H. H. Cancer Research 1996, 56, 4782-4790.
(3) Ring, B. Z.; Seitz, R. S.; Beck, R.; Shasteen, W. J.; Tarr, S. M.; Cheang, M. C. U.; Yoder, B. J.; Budd, G. T.; Nielsen, T. O.; Hicks, D. G.; Estopinal, N. C.; Ross, D. T. Journal of Clinical Oncology 2006, 24, 3039-3047.
(4) Guinn, B.-A.; Mohamedali, A.; Mills, K. I.; Czepulkowski, B.; Schmitt, M.; Greiner, J. Biomark Insights 2007, 2, 69-79.
(5) Lou, X.; Zhang, G.; Herrera, I.; Kinach, R.; Ornatsky, O.; Baranov, V.; Nitz, M.; Winnik, M. A. Angewandte Chemie International Edition 2007, 46, 6111-6114.
(6) Zhang, C.; Wu, F.; Zhang, Y.; Wang, X.; Zhang, X. Journal of Analytical Atomic
Spectrometry 2001, 16, 1393-1396.
(7) Zhang, C.; Zhang, Z.; Yu, B.; Shi, J.; Zhang, X. Analytical Chemistry 2002, 74, 96-99.
(8) Bandura, D. R.; Baranov, V. I.; Ornatsky, O. I.; Antonov, A.; Kinach, R.; Lou, X.; Pavlov, S.; Vorobiev, S.; Dick, J. E.; Tanner, S. D. Analytical Chemistry 2009, 81, 6813-6822.
(9) Majonis, D.; Herrera, I.; Ornatsky, O.; Schulze, M.; Lou, X.; Soleimani, M.; Nitz, M.; Winnik, M. A. Analytical Chemistry 2010, 82, 8961-8969.
(10) Bendall, S. C.; Simonds, E. F.; Qiu, P.; Amir, E.-a. D.; Krutzik, P. O.; Finck, R.; Bruggner, R. V.; Melamed, R.; Trejo, A.; Ornatsky, O. I.; Balderas, R. S.; Plevritis, S. K.; Sachs, K.; Pe’er, D.; Tanner, S. D.; Nolan, G. P. Science 2011, 332, 687-696.
(11) Baranov, V. I.; Quinn, Z.; Bandura, D. R.; Tanner, S. D. Analytical Chemistry 2002, 74, 1629-1636.
(12) Chinen, L. K.; Galen, K. P.; Kuan, K. T.; Dyszlewski, M. E.; Ozaki, H.; Sawai, H.; Pandurangi, R. S.; Jacobs, F. G.; Dorshow, R. B.; Rajagopalan, R. Journal of Medicinal
Chemistry 2008, 51, 957-962.
(13) Quinn, Z. A.; Baranov, V. I.; Tanner, S. D.; Wrana, J. L. Journal of Analytical Atomic
Spectrometry 2002, 17, 892-896.
(14) Ornatsky, O.; Baranov, V. I.; Bandura, D. R.; Tanner, S. D.; Dick, J. Journal of
Immunological Methods 2006, 308, 68-76.

168
(15) Tanner, S. D.; Ornatsky, O.; Bandura, D. R.; Baranov, V. I. Spectrochimica Acta Part B:
Atomic Spectroscopy 2007, 62, 188-195.
(16) Hermanson, G. Bioconjugate techniques; 2nd ed.; Academic Press: Amsterdam, Netherlands and Boston, Mass., 2008.
(17) Razumienko, E.; Ornatsky, O.; Kinach, R.; Milyavsky, M.; Lechman, E.; Baranov, V.; Winnik, M. A.; Tanner, S. D. Journal of Immunological Methods 2008, 336, 56-63.
(18) Ornatsky, O. I.; Kinach, R.; Bandura, D. R.; Lou, X.; Tanner, S. D.; Baranov, V. I.; Nitz, M.; Winnik, M. A. Journal of Analytical Atomic Spectrometry 2008, 23, 463.
(19) Ornatsky, O. I.; Lou, X.; Nitz, M.; Sheldrick, W. S.; Baranov, V. I.; Bandura, D. R.; Tanner, S. D. Analytical Chemistry 2008, 80, 2539-2547.
(20) Tanner, S. D.; Bandura, D. R.; Ornatsky, O.; Baranov, V. I.; Nitz, M.; Winnik, M. A. Pure and Applied Chemistry 2008, 80, 2627-2641.
(21) Ornatsky, O.; Bandura, D.; Baranov, V.; Nitz, M.; Winnik, M. A.; Tanner, S. Journal of
Immunological Methods 2010, 361, 1-20.
(22) Klibanov, A.; Sllnkin, M.; Torchilin, V. Applied Biochemistry and Biotechnology 1989, 22, 45-58.
(23) Sieving, P. F.; Watson, A. D.; Rocklage, S. M. Bioconjugate Chemistry 1990, 1, 65-71.
(24) Slinkin, M. A.; Klibanov, A. L.; Torchilin, V. P. Bioconjugate Chemistry 1991, 2, 342-348.
(25) Wang, T. S.; Fawwaz, R. A.; Alderson, P. O. Journal of Nuclear Medicine 1992, 33, 570-574.
(26) Rebizak, R.; Schaefer, M.; Dellacherie, E. Bioconjugate Chemistry 1997, 8, 605-610.
(27) Gouin, S.; Winnik, F. M. Bioconjugate Chemistry 2001, 12, 372-377.
(28) Torchilin, V. P. Current Pharmaceutical Biotechnology 2000, 1, 183-215.
(29) Trubetskoy, V. S.; Torchilin, V. P. Analytical Biochemistry 1995, 229, 345-347.
(30) Yan, G.-P.; Zhuo, R.-X.; Yang, Y.-H.; Li, L.-Y.; Liu, M.-L.; Ye, C.-H. Journal of
Bioactive and Compatible Polymers 2002, 17, 139-151.
(31) Erdogan, S.; Roby, A.; Torchilin, V. P. Molecular Pharmaceutics 2006, 3, 525-530.
(32) Darras, V.; Nelea, M.; Winnik, F. M.; Buschmann, M. D. Carbohydrate Polymers 2010, 80, 1137-1146.
(33) Fukukawa, K.-ichi; Rossin, R.; Hagooly, A.; Pressly, E. D.; Hunt, J. N.; Messmore, B. W.; Hawker, C. J. Biomacromolecules 2008, 9, 1329-1339.

169
(34) Arano, Y.; Akizawa, H.; Uezono, T.; Akaji, K.; Ono, M.; Funakoshi, S.; Koizumi, M.; Yokoyama, A.; Kiso, Y.; Saji, H. Bioconjugate Chemistry 1997, 8, 442-446.
(35) Wängler, C.; Moldenhauer, G.; Eisenhut, M.; Haberkorn, U.; Mier, W. Bioconjugate
Chemistry 2008, 19, 813-820.
(36) Yu, K.; Hamdan, Y.; Wan, F.; Li, Y.; Huang, K.; Zhou, J. Australian Journal of
Chemistry 2007, 60, 218.
(37) Mayor, M.; Scheffold, R.; Walder, L. Helvetica Chimica Acta 1997, 80, 1183-1189.
(38) Ebright, Y. W.; Chen, Y.; Ludescher, R. D.; Ebright, R. H. Bioconjugate Chemistry 1993, 4, 219-225.
(39) Shi, M.; Wosnick, J. H.; Ho, K.; Keating, A.; Shoichet, M. S. Angewandte Chemie
International Edition 2007, 46, 6126-6131.
(40) Keire, D. A.; Kobayashi, M. Bioconjugate Chemistry 1999, 10, 454-463.
(41) Moad, G.; Rizzardo, E.; Thang, S. H. Australian Journal of Chemistry 2005, 58, 379.
(42) Willcock, H.; O’Reilly, R. K. Polymer Chemistry 2010, 1, 149.
(43) Moad, G.; Rizzardo, E.; Thang, S. H. Polymer International 2011, 60, 9-25.
(44) Aoyagi, N.; Ochiai, B.; Mori, H.; Endo, T. Synlett 2006, 0636-0638.
(45) Li, B.; Majonis, D.; Liu, P.; Winnik, M. A. Canadian Journal of Chemistry 2011, 89, 317-325.
(46) McCaffrey, V. P.; Forbes, M. D. E. The Journal of Physical Chemistry A 2005, 109, 4891-4898.
(47) Sprong, E.; De Wet-Roos, D.; Tonge, M. P.; Sanderson, R. D. Journal of Polymer
Science Part A: Polymer Chemistry 2003, 41, 223-235.
(48) Bathfield, M.; D’Agosto, F.; Spitz, R.; Charreyre, M.-T.; Delair, T. Journal of the
American Chemical Society 2006, 128, 2546-2547.
(49) Gody, G.; Boullanger, P.; Ladavière, C.; Charreyre, M.-T.; Delair, T. Macromolecular
Rapid Communications 2008, 29, 511-519.
(50) Roth, P. J.; Wiss, K. T.; Zentel, R.; Theato, P. Macromolecules 2008, 41, 8513-8519.
(51) Roth, P. J.; Kim, K.-S.; Bae, S. H.; Sohn, B.-H.; Theato, P.; Zentel, R. Macromolecular
Rapid Communications 2009, 30, 1274-1278.
(52) Roth, P. J.; Jochum, F. D.; Zentel, R.; Theato, P. Biomacromolecules 2010, 11, 238-244.
170
(53) Wiss, K. T.; Theato, P. Journal of Polymer Science Part A: Polymer Chemistry 2010, 48, 4758-4767.
(54) Boyer, C.; Liu, J.; Bulmus, V.; Davis, T. P.; Barner-Kowollik, C.; Stenzel, M. H. Macromolecules 2008, 41, 5641-5650.
(55) Boyer, C.; Bulmus, V.; Priyanto, P.; Teoh, W. Y.; Amal, R.; Davis, T. P. Journal of
Materials Chemistry 2009, 19, 111.
(56) Heredia, K. L.; Grover, G. N.; Tao, L.; Maynard, H. D. Macromolecules 2009, 42, 2360-2367.
(57) De, P.; Li, M.; Gondi, S. R.; Sumerlin, B. S. Journal of the American Chemical Society 2008, 130, 11288-11289.
(58) Stamenović, M. M.; Espeel, P.; Camp, W. V.; Du Prez, F. E. Macromolecules 2011, 44, 5619-5630.
(59) Liu, J.; Bulmus, V.; Barner-Kowollik, C.; Stenzel, M. H.; Davis, T. P. Macromolecular
Rapid Communications 2007, 28, 305-314.
(60) Chong, Y. K.; Moad, G.; Rizzardo, E.; Thang, S. H. Macromolecules 2007, 40, 4446-4455.
(61) Perrier, S.; Takolpuckdee, P.; Mars, C. A. Macromolecules 2005, 38, 2033-2036.
(62) York, A. W.; Scales, C. W.; Huang, F.; McCormick, C. L. Biomacromolecules 2007, 8, 2337-2341.
(63) Scales, C. W.; Convertine, A. J.; McCormick, C. L. Biomacromolecules 2006, 7, 1389-1392.
(64) Narain, R.; Gonzales, M.; Hoffman, A. S.; Stayton, P. S.; Krishnan, K. M. Langmuir 2007, 23, 6299-6304.
(65) Gemici, H.; Legge, T. M.; Whittaker, M.; Monteiro, M. J.; Perrier, S. Journal of Polymer
Science Part A: Polymer Chemistry 2007, 45, 2334-2340.
(66) Whittaker, M. R.; Goh, Y.-K.; Gemici, H.; Legge, T. M.; Perrier, S.; Monteiro, M. J. Macromolecules 2006, 39, 9028-9034.
(67) You, Y.-Z.; Zhou, Q.-H.; Manickam, D. S.; Wan, L.; Mao, G.-Z.; Oupický, D. Macromolecules 2007, 40, 8617-8624.
(68) Zhang, Q.; Ye, J.; Lu, Y.; Nie, T.; Xie, D.; Song, Q.; Chen, H.; Zhang, G.; Tang, Y.; Wu, C.; Xie, Z. Macromolecules 2008, 41, 2228-2234.
(69) Boyer, C.; Bulmus, V.; Davis, T. P. Macromolecular Rapid Communications 2009, 30, 493-497.

171
(70) Boyer, C.; Liu, J.; Bulmus, V.; Davis, T. P. Australian Journal of Chemistry 2009, 62, 830.
(71) Qiu, X.-P.; Winnik, F. M. Macromolecular Rapid Communications 2006, 27, 1648-1653.
(72) Boyer, C.; Davis, T. P. Chemical Communications 2009, 6029.
(73) Boyer, C.; Granville, A.; Davis, T. P.; Bulmus, V. Journal of Polymer Science Part A:
Polymer Chemistry 2009, 47, 3773-3794.
(74) Roth, P. J.; Kessler, D.; Zentel, R.; Theato, P. Macromolecules 2008, 41, 8316-8319.
(75) Grover, G. N.; Alconcel, S. N. S.; Matsumoto, N. M.; Maynard, H. D. Macromolecules 2009, 42, 7657-7663.
(76) Chen, M.; Ghiggino, K. P.; Mau, A. W. H.; Rizzardo, E.; Sasse, W. H. F.; Thang, S. H.; Wilson, G. J. Macromolecules 2004, 37, 5479-5481.
(77) Ginaldi, L.; Farahat, N.; Matutes, E.; De Martinis, M.; Morilla, R.; Catovsky, D. Journal
of Clinical Pathology 1996, 49, 539-544.
(78) Ginaldi, L.; Matutes, E.; Farahat, N.; De Martinis, M.; Morilla, R.; Catovsky, D. British
Journal of Haematology 1996, 93, 921-927.
(79) Davis, K. A.; Abrams, B.; Iyer, S. B.; Hoffman, R. A.; Bishop, J. E. Cytometry 1998, 33, 197-205.
(80) Iyer, S. B.; Hultin, L. E.; Zawadzki, J. A.; Davis, K. A.; Giorgi, J. V. Cytometry 1998, 33, 206-212.
(81) D’Arena, G.; Musto, P.; Cascavilla, N.; Dell’Olio, M.; Di Renzo, N.; Carotenuto, M. American Journal of Hematology 2000, 64, 275-281.
(82) Wang, L.; Abbasi, F.; Gaigalas, A. K.; Vogt, R. F.; Marti, G. E. Cytometry Part B:
Clinical Cytometry 2006, 70B, 410-415.
(83) Wang, L.; Abbasi, F.; Gaigalas, A. K.; Hoffman, R. A.; Flagler, D.; Marti, G. E. Cytometry Part B: Clinical Cytometry 2007, 72B, 442-449.
(84) Jiang, L.; Yuan, C. M.; Hubacheck, J.; Janik, J. E.; Wilson, W.; Morris, J. C.; Jasper, G. A.; Stetler-Stevenson, M. British Journal of Haematology 2009, 145, 173-179.
(85) Jasper, G. A.; Arun, I.; Venzon, D.; Kreitman, R. J.; Wayne, A. S.; Yuan, C. M.; Marti, G. E.; Stetler-Stevenson, M. Cytometry Part B: Clinical Cytometry 2011, 80B, 83-90.
(86) Purvis, N.; Ornatsky, O.; Shults, K.; Baranov, V.; Tanner, S.; Stelzer, G. A comparative analysis of quantitative techniques using flow and mass cytometric platforms. 2010.
(87) Louie, A. Chemical Reviews 2010, 110, 3146-3195.
172
(88) Zhang, Z.; Yan, X.; Xu, M.; Yang, L.; Wang, Q. Journal of Analytical Atomic
Spectrometry 2011, 26, 1175-1177.
(89) Gottlieb, H. E.; Kotlyar, V.; Nudelman, A. The Journal of Organic Chemistry 1997, 62, 7512-7515.
(90) Hansen, R. E.; stergaard, H.; Nrgaard, P.; Winther, J. R. Analytical Biochemistry 2007, 363, 77-82.
(91) Riener, C. K.; Kada, G.; Gruber, H. J. Analytical and Bioanalytical Chemistry 2002, 373, 266-276.
(92) Zhang, L.; Chen, Y. Polymer 2006, 47, 5259-5266.
(93) Zhang, X.; Li, Z.-C.; Li, K.-B.; Lin, S.; Du, F.-S.; Li, F.-M. Progress in Polymer Science 2006, 31, 893-948.
(94) Plamper, F. A.; Becker, H.; Lanzendörfer, M.; Patel, M.; Wittemann, A.; Ballauff, M.; Müller, A. H. E. Macromolecular Chemistry and Physics 2005, 206, 1813-1825.
(95) Thompson, K.; Michielsen, S. Journal of Polymer Science Part A: Polymer Chemistry 2006, 44, 126-136.
(96) Lawrence, S. Amines: synthesis, properties, and applications; Cambridge University Press: New York, 2004.
(97) Ke, D.; Zhan, C.; Li, X.; Li, A.; Yao, J. Synlett 2009, 2009, 1506-1510.
(98) Lazarova, E.; Yankova, T.; Aleksiev, B. Langmuir 1995, 11, 2231-2236.
(99) Gregory, J. D. Journal of the American Chemical Society 1955, 77, 3922-3923.
(100) Schwöbel, J. A. H.; Madden, J. C.; Cronin, M. T. D. SAR and QSAR in Environmental
Research 2010, 21, 693-710.
(101) Girouard, S.; Houle, M.-H.; Grandbois, A.; Keillor, J. W.; Michnick, S. W. Journal of
the American Chemical Society 2005, 127, 559-566.
(102) Friedman, M.; Wall, J. S. The Journal of Organic Chemistry 1966, 31, 2888-2894.
(103) Epps, D. Analytical Biochemistry 2001, 295, 101-106.
(104) Miyadera, T.; Kosower, E. M. Journal of Medicinal Chemistry 1972, 15, 534-537.
(105) Esteban, M. F. G.; Vizcaino, M. C. P.; Gonzalez-Vilchez, F. Thermochimica Acta 1983, 62, 257-265.
(106) Sherry, A. D.; Cacheris, W. P.; Kuan, K.-T. Magnetic Resonance in Medicine 1988, 8, 180-190.
173
(107) D’Arena, G.; Musto, P.; Cascavilla, N.; Di Giorgio, G.; Fusilli, S.; Zendoli, F.; Carotenuto, M. Haematologica 1998, 83, 197-203.
(108) Harris, D. T.; Schumacher, M. J.; Locascio, J.; Besencon, F. J.; Olson, G. B.; DeLuca, D.; Shenker, L.; Bard, J.; Boyse, E. A. Proceedings of the National Academy of Sciences
of the United States of America 1992, 89, 10006-10010.
(109) Farnham, W. B. Synthesis of Trithiocarbonate RAFT Agents and Iintermediates Thereof.
(110) Deng, Z.; Bouchékif, H.; Babooram, K.; Housni, A.; Choytun, N.; Narain, R. Journal of
Polymer Science Part A: Polymer Chemistry 2008, 46, 4984-4996.
(111) Tosato, M. L.; Soccorsi, L. Journal of the Chemical Society, Perkin Transactions 2 1982, 1321-1326.
(112) Li, H.; Li, M.; Yu, X.; Bapat, A. P.; Sumerlin, B. S. Polymer Chemistry 2011, 2, 1531.
(113) Tao, L.; Kaddis, C. S.; Loo, R. R. O.; Grover, G. N.; Loo, J. A.; Maynard, H. D. Macromolecules 2009, 42, 8028-8033.
(114) Gruendling, T.; Kaupp, M.; Blinco, J. P.; Barner-Kowollik, C. Macromolecules 2011, 44, 166-174.
(115) Llauro, M.-F.; Loiseau, J.; Boisson, F.; Delolme, F.; Ladavière, C.; Claverie, J. Journal
of Polymer Science Part A: Polymer Chemistry 2004, 42, 5439-5462.
(116) Grasselli, M.; Betz, N. Nuclear Instruments and Methods in Physics Research Section B:
Beam Interactions with Materials and Atoms 2005, 236, 201-207.
(117) Li-Chan E.C.Y.; Ma C.-Y. Food Chemistry 2002, 77, 495-502.
(118) Bromberg, L. E.; Klibanov, A. M. Proceedings of the National Academy of Sciences of
the United States of America 1995, 92, 1262-1266.
(119) Busch, D. H.; Bailar, J. C. Journal of the American Chemical Society 1956, 78, 716-719.
(120) Grevtsev, A. M.; Zheligovskaya, N. N.; Popov, L. V.; Spitsyn, V. I. Bulletin of the
Academy of Sciences of the USSR Division of Chemical Science 1977, 26, 867-869.
(121) Grevtsev, A. M.; Zheligovskaya, N. N.; Popov, L. V.; Spitsyn, V. I. Bulletin of the
Academy of Sciences of the USSR Division of Chemical Science 1978, 27, 213-215.
(122) Napoli, A. Talanta 1984, 31, 153-154.
(123) Anderegg, G.; Malik, S. C. Helvetica Chimica Acta 1976, 59, 1498-1511.
(124) Ashoka, S.; Peake, B. M.; Bremner, G.; Hageman, K. J.; Reid, M. R. Analytica Chimica
Acta 2009, 653, 191-199.
(125) Klonis, N.; Sawyer, W. H. Journal of Fluorescence 1996, 6, 147-157.
174
(126) Agi, Y.; Walt, D. R. Journal of Polymer Science Part A: Polymer Chemistry 1997, 35, 2105-2110.
(127) Alric, C.; Taleb, J.; Duc, G. L.; Mandon, C.; Billotey, C.; Meur-Herland, A. L.; Brochard, T.; Vocanson, F.; Janier, M.; Perriat, P.; Roux, S.; Tillement, O. Journal of the
American Chemical Society 2008, 130, 5908-5915.
(128) Ternovaya, T. V.; Kostromina, N. A.; Kundrya, V. T. Zhurnal Neorganicheskoi Khimii 1975, 20, 2957-63.
(129) Livingstone, S. E. Synthesis and Reactivity in Inorganic and Metal-Organic Chemistry 1971, 1, 1-7.
(130) Battaglia, G.; Cigala, R. M.; Crea, F.; Sammartano, S. Journal of Chemical &
Engineering Data 2008, 53, 363-367.
(131) Bell, M. N.; Blake, A. J.; Gould, R. O.; Holder, A. J.; Hyde, T. I.; Lavery, A. J.; Reid, G.; Schroder, M. Journal of Inclusion Phenomena and Macrocyclic Chemistry 1987, 5, 169-172.
(132) Jones, C. Medicinal applications of coordination chemistry; Royal Society of Chemistry,: Cambridge, 2007.
(133) Sanders, C. I.; Martin, D. S. Journal of the American Chemical Society 1961, 83, 807-810.
(134) Lederer, M.; Leipzig-Pagani, E. Analytica Chimica Acta 1997, 350, 203-208.
(135) Ziegler, C. J.; Silverman, A. P.; Lippard, S. J. Journal of Biological Inorganic Chemistry 2000, 5, 774-783.
(136) Oksanen, A.; Kivekäs, R.; Lumme, P.; Laitalainen, T. Acta Crystallographica Section C
Crystal Structure Communications 1991, 47, 719-722.
(137) Elding, L. I. Inorganica Chimica Acta 1976, 20, 65-69.
(138) Groening, O.; Elding, L. I. Inorganic Chemistry 1989, 28, 3366-3372.
(139) Summa, N.; Schiessl, W.; Puchta, R.; van Eikema Hommes, N.; van Eldik, R. Inorganic
Chemistry 2006, 45, 2948-2959.
(140) Djinovic, V. M.; Galanski, M.; Arion, V. B.; Keppler, B. K. Dalton Transactions 2010, 39, 3633-3643.
(141) Ašanin, D. P.; Rajković, S.; Molnar-Gabor, D.; Djuran, M. I. Monatshefte für Chemie /
Chemical Monthly 2004, 135, 1445-1453.
(142) Paik, C. H.; Murphy, P. R.; Eckelman, W. C.; Volkert, W. A.; Reba, R. C. Journal of
Nuclear Medicine 1983, 24, 932-936.
175
(143) Kay, J. G.; Grinstein, S. Sensors 2011, 11, 1744-1755.
(144) McLaughlin, S.; Murray, D. Nature 2005, 438, 605-611.
(145) Heo, W. D.; Inoue, T.; Park, W. S.; Kim, M. L.; Park, B. O.; Wandless, T. J.; Meyer, T. Science 2006, 314, 1458-1461.
(146) Yeung, T. Science 2006, 313, 347-351.
(147) Sahaf, B.; Heydari, K.; Herzenberg, L. A.; Herzenberg, L. A. Proceedings of the
National Academy of Sciences of the United States of America 2003, 100, 4001-4005.
(148) Shapiro, H. M. Practical Flow Cytometry; Alan R. Liss: New York, 1985.
(149) Alexander, C. M.; Puchalski, J.; Klos, K. S.; Badders, N.; Ailles, L.; Kim, C. F.; Dirks, P.; Smalley, M. J. Cell Stem Cell 2009, 5, 579-583.
(150) Osawa, M.; Hanada, K.; Hamada, H.; Nakauchi, H. Science 1996, 273, 242-245.
(151) van Bekkum, D. W.; van den Engh, G. J.; Wagemaker, G.; Bol, S. J.; Visser, J. W. Blood
Cells 1979, 5, 143-159.
(152) Manning, T. J.; Fiskus, W.; Mitchell, M.; Dees, L. Spectroscopy Letters: An
International Journal for Rapid Communication 1999, 32, 463-467.
(153) Lavis, L. D.; Rutkoski, T. J.; Raines, R. T. Analytical Chemistry 2007, 79, 6775-6782.
(154) Kinugasa, T.; Kondo, A.; Mouri, E.; Ichikawa, S.; Nakagawa, S.; Nishii, Y.; Watanabe, K.; Takeuchi, H. Separation and Purification Technology 2003, 31, 251-259.
(155) Thermo Scientific. Prod. No. 46426, 46400, 46402, 46407, 46412, 46414, 46415, 46418, 46420, 46421 53068 Doc. No. 1963 Instructions for DyLight Amine Reactive Fluors.
(156) Zeng, H.; Wang, H.; Chen, F.; Xin, H.; Wang, G.; Xiao, L.; Song, K.; Wu, D.; He, Q.; Shen, G. Analytical Biochemistry 2006, 351, 69-76.
(157) Neri, D.; Montigiani, S.; Kirkham, P. M. Trends in Biotechnology 1996, 14, 465-470.
(158) Goldberg, M. E.; Djavadi-Ohaniance, L. Current Opinion in Immunology 1993, 5, 278-281.
(159) Schwarz, F. P.; Tello, D.; Goldbaum, F. A.; Mariuzza, R. A.; Poljak, R. J. European
Journal of Biochemistry 1995, 228, 388-394.
(160) Nezu, T.; Winnik, F. M. Biomaterials 2000, 21, 415-419.
(161) Dai, S.; Tam, K. C.; Jenkins, R. D. European Polymer Journal 2000, 36, 2671-2677.
(162) Costantini, D. L.; Chan, C.; Cai, Z.; Vallis, K. A.; Reilly, R. M. Journal of Nuclear
Medicine 2007, 48, 1357-1368.

176
(163) Mukai, T.; Namba, S.; Arano, Y.; Ono, M.; Fujioka, Y.; Uehara, T.; Ogawa, K.; Konishi, J.; Saji, H. The Journal of Pharmacy and Pharmacology 2002, 54, 1073-1081.
(164) Li, C.; Yu, D. F.; Inoue, T.; Yang, D. J.; Tansey, W.; Liu, C. W.; Milas, L.; Hunter, N. R.; Kim, E. E.; Wallace, S. Journal of Nuclear Medicine 1997, 38, 1042-1047.
(165) Di Bartolo, N. M.; Sargeson, A. M.; Donlevy, T. M.; Smith, S. V. Journal of the
Chemical Society, Dalton Transactions 2001, 2303-2309.
(166) Voss, S. D.; Smith, S. V.; DiBartolo, N.; McIntosh, L. J.; Cyr, E. M.; Bonab, A. A.; Dearling, J. L. J.; Carter, E. A.; Fischman, A. J.; Treves, S. T.; Gillies, S. D.; Sargeson, A. M.; Huston, J. S.; Packard, A. B. Proceedings of the National Academy of Sciences of
the United States of America 2007, 104, 17489-17493.
(167) Lay, P. A.; Sargeson, A. M. Inorganic Chemistry 1986, 25, 4801-4802.
(168) Boucher, H. A.; Lawrance, G. A.; Lay, P. A.; Sargeson, A. M.; Bond, A. M.; Sangster, D. F.; Sullivan, J. C. Journal of the American Chemical Society 1983, 105, 4652-4661.
(169) Finkelstein, E. I.; Chao, P.-hsiu G.; Hung, C. T.; Bulinski, J. C. Cell Motility and the
Cytoskeleton 2007, 64, 833-846.
(170) Zola, H.; Swart, B.; Nicholson, I.; Aasted, B.; Bensussan, A.; Boumsell, L.; Buckley, C.; Clark, G.; Drbal, K.; Engel, P.; Hart, D.; Horejsí, V.; Isacke, C.; Macardle, P.; Malavasi, F.; Mason, D.; Olive, D.; Saalmueller, A.; Schlossman, S. F.; Schwartz-Albiez, R.; Simmons, P.; Tedder, T. F.; Uguccioni, M.; Warren, H. Blood 2005, 106, 3123-3126.
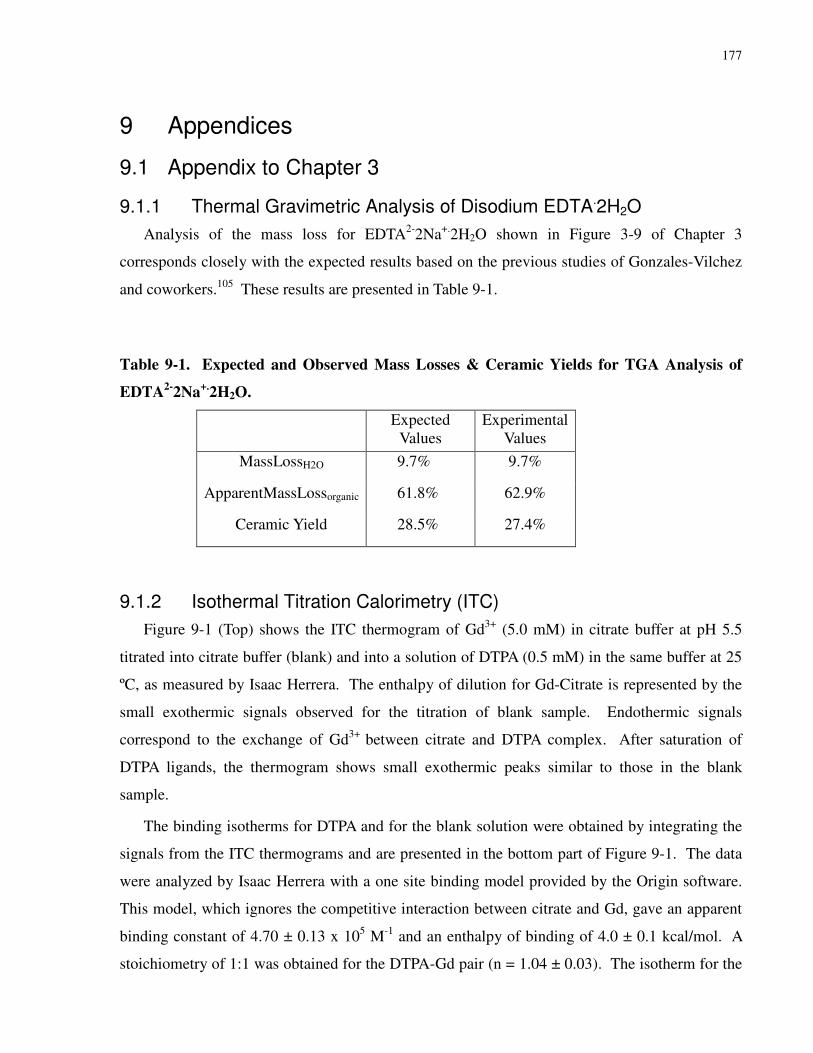
177
9 Appendices
9.1 Appendix to Chapter 3
9.1.1 Thermal Gravimetric Analysis of Disodium EDTA.2H2O
Analysis of the mass loss for EDTA2-2Na+.2H2O shown in Figure 3-9 of Chapter 3
corresponds closely with the expected results based on the previous studies of Gonzales-Vilchez
and coworkers.105 These results are presented in Table 9-1.
Table 9-1. Expected and Observed Mass Losses & Ceramic Yields for TGA Analysis of
EDTA2-
2Na+.
2H2O.
Expected Values
Experimental Values
MassLossH2O 9.7% 9.7%
ApparentMassLossorganic 61.8% 62.9%
Ceramic Yield 28.5% 27.4%
9.1.2 Isothermal Titration Calorimetry (ITC)
Figure 9-1 (Top) shows the ITC thermogram of Gd3+ (5.0 mM) in citrate buffer at pH 5.5
titrated into citrate buffer (blank) and into a solution of DTPA (0.5 mM) in the same buffer at 25
ºC, as measured by Isaac Herrera. The enthalpy of dilution for Gd-Citrate is represented by the
small exothermic signals observed for the titration of blank sample. Endothermic signals
correspond to the exchange of Gd3+ between citrate and DTPA complex. After saturation of
DTPA ligands, the thermogram shows small exothermic peaks similar to those in the blank
sample.
The binding isotherms for DTPA and for the blank solution were obtained by integrating the
signals from the ITC thermograms and are presented in the bottom part of Figure 9-1. The data
were analyzed by Isaac Herrera with a one site binding model provided by the Origin software.
This model, which ignores the competitive interaction between citrate and Gd, gave an apparent
binding constant of 4.70 ± 0.13 x 10⁵ M-1 and an enthalpy of binding of 4.0 ± 0.1 kcal/mol. A
stoichiometry of 1:1 was obtained for the DTPA-Gd pair (n = 1.04 ± 0.03). The isotherm for the
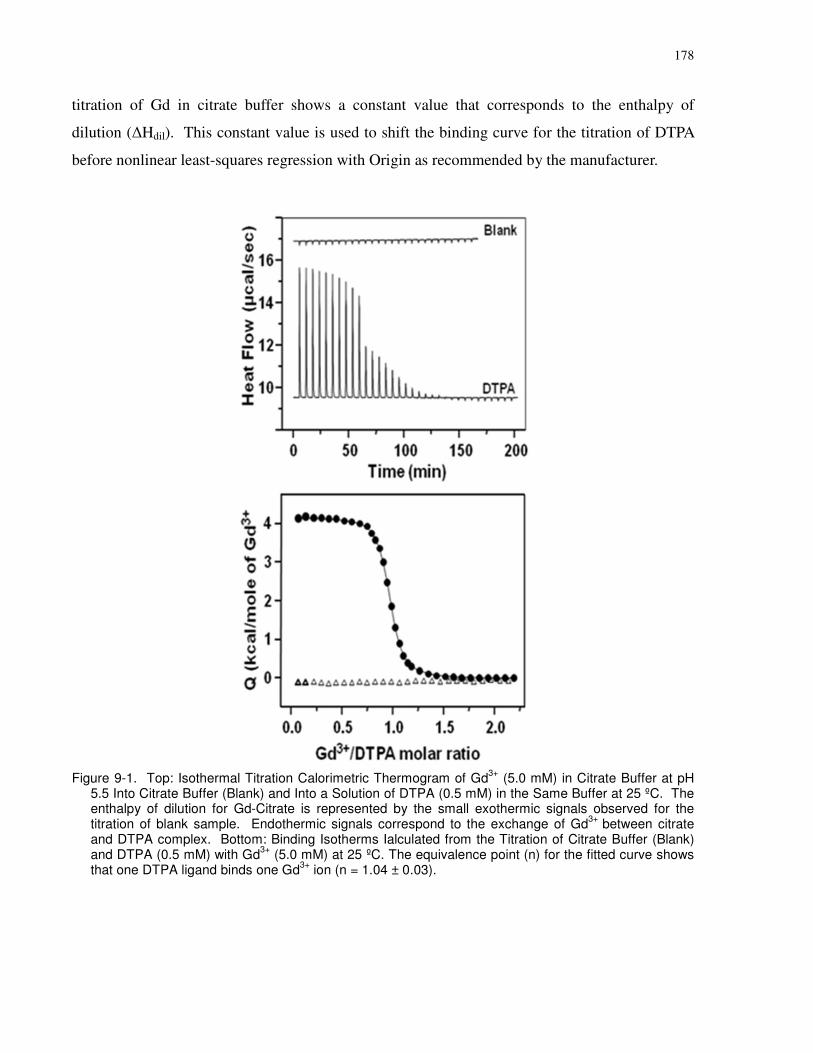
178
titration of Gd in citrate buffer shows a constant value that corresponds to the enthalpy of
dilution (∆Hdil). This constant value is used to shift the binding curve for the titration of DTPA
before nonlinear least-squares regression with Origin as recommended by the manufacturer.
Figure 9-1. Top: Isothermal Titration Calorimetric Thermogram of Gd3+
(5.0 mM) in Citrate Buffer at pH 5.5 Into Citrate Buffer (Blank) and Into a Solution of DTPA (0.5 mM) in the Same Buffer at 25 ºC. The enthalpy of dilution for Gd-Citrate is represented by the small exothermic signals observed for the titration of blank sample. Endothermic signals correspond to the exchange of Gd
3+ between citrate
and DTPA complex. Bottom: Binding Isotherms Ialculated from the Titration of Citrate Buffer (Blank) and DTPA (0.5 mM) with Gd
3+ (5.0 mM) at 25 ºC. The equivalence point (n) for the fitted curve shows
that one DTPA ligand binds one Gd3+
ion (n = 1.04 ± 0.03).
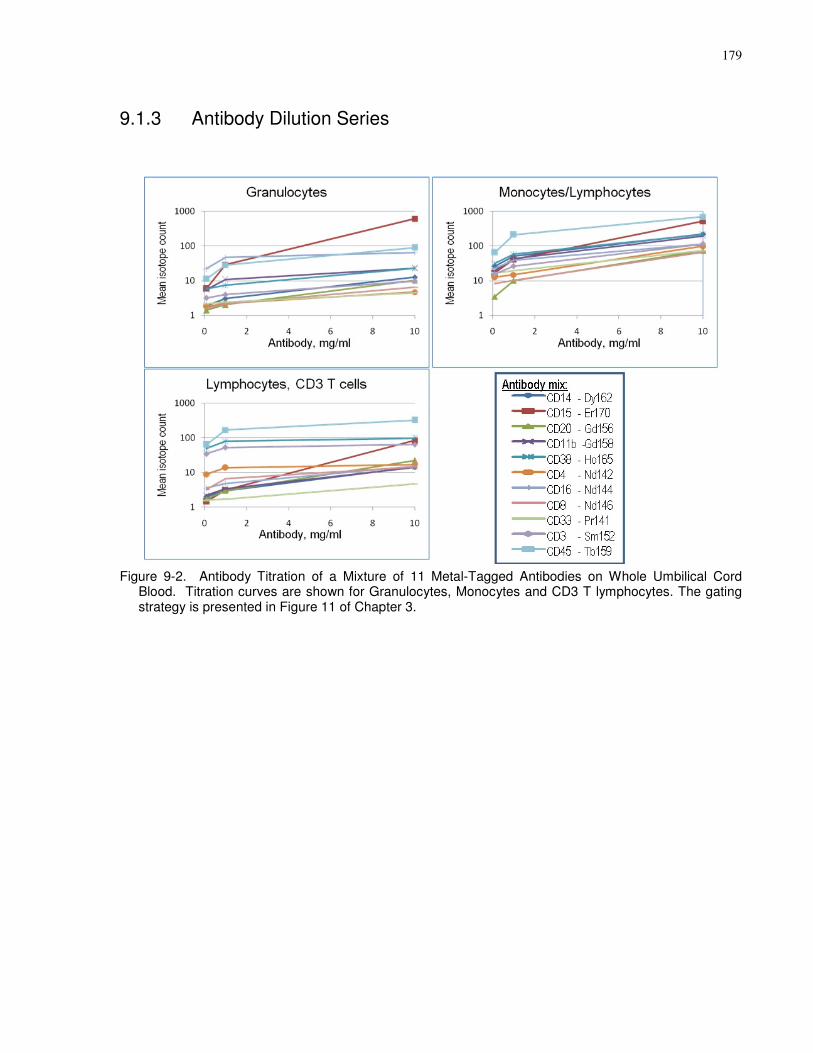
179
9.1.3 Antibody Dilution Series
Figure 9-2. Antibody Titration of a Mixture of 11 Metal-Tagged Antibodies on Whole Umbilical Cord Blood. Titration curves are shown for Granulocytes, Monocytes and CD3 T lymphocytes. The gating strategy is presented in Figure 11 of Chapter 3.
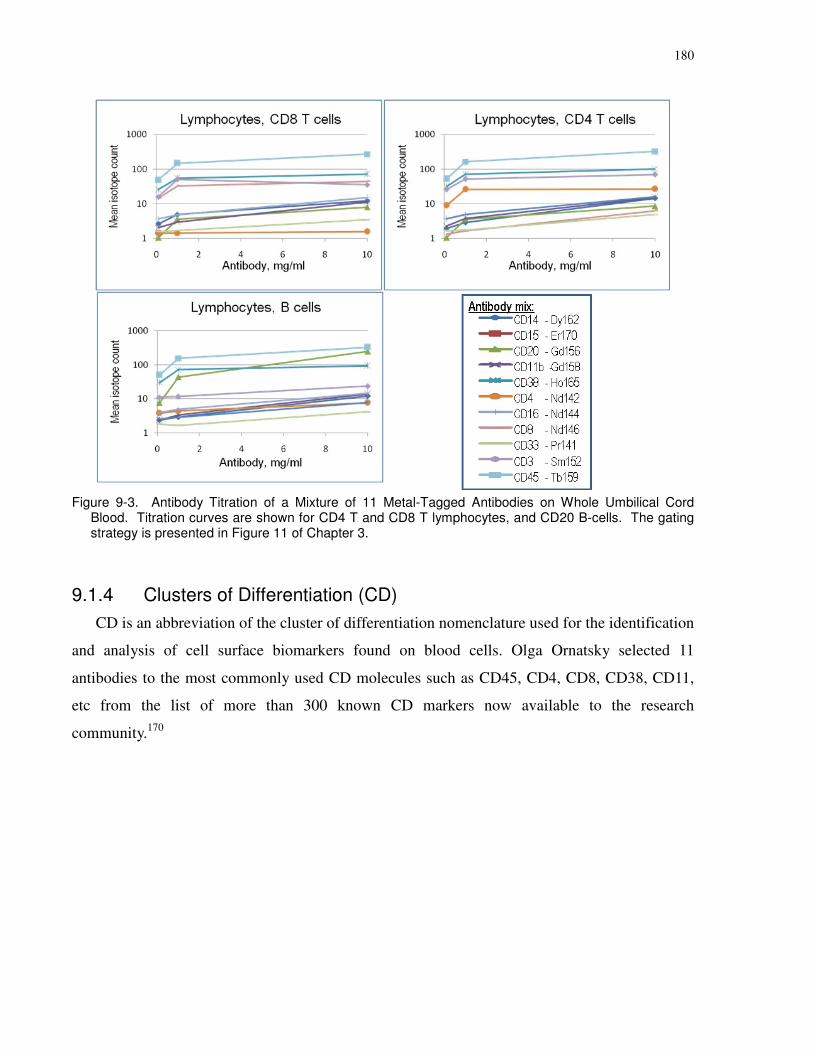
180
Figure 9-3. Antibody Titration of a Mixture of 11 Metal-Tagged Antibodies on Whole Umbilical Cord
Blood. Titration curves are shown for CD4 T and CD8 T lymphocytes, and CD20 B-cells. The gating strategy is presented in Figure 11 of Chapter 3.
9.1.4 Clusters of Differentiation (CD)
CD is an abbreviation of the cluster of differentiation nomenclature used for the identification
and analysis of cell surface biomarkers found on blood cells. Olga Ornatsky selected 11
antibodies to the most commonly used CD molecules such as CD45, CD4, CD8, CD38, CD11,
etc from the list of more than 300 known CD markers now available to the research
community.170

181
9.2 Appendix to Chapter 4
9.2.1 Figures
Figure 9-4. Comparison of Aqueous SEC Chromatographs of the Three Batches of P(DTPA) Polymer P6. Calibration of the column with poly(methacrylic acid) standards leads to values of Mn = 22,100 Da (PDI = 1.24) for B1-P6, Mn = 23,600 Da (PDI = 1.41) for B2-P6, and Mn = 22,500 Da (PDI = 1.35) for B3-P6.
Figure 9-5. UV/VIS Spectra of CTA (4-cyano-4-(dodecylsulfanylthiocarbonyl)sulfanyl pentanoic acid) in MeOH at Concentrations Ranging from 20 to 85 µM.
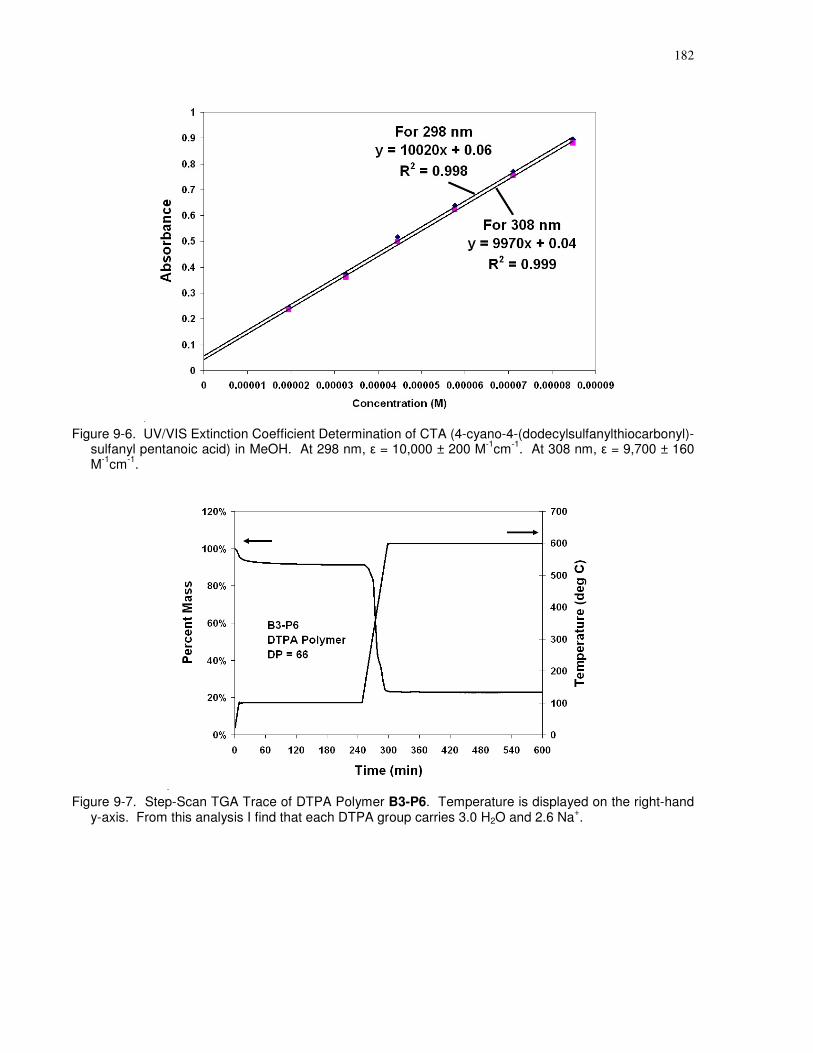
182
Figure 9-6. UV/VIS Extinction Coefficient Determination of CTA (4-cyano-4-(dodecylsulfanylthiocarbonyl)-sulfanyl pentanoic acid) in MeOH. At 298 nm, ε = 10,000 ± 200 M
-1cm
-1. At 308 nm, ε = 9,700 ± 160
M-1
cm-1
.
Figure 9-7. Step-Scan TGA Trace of DTPA Polymer B3-P6. Temperature is displayed on the right-hand y-axis. From this analysis I find that each DTPA group carries 3.0 H2O and 2.6 Na
+.
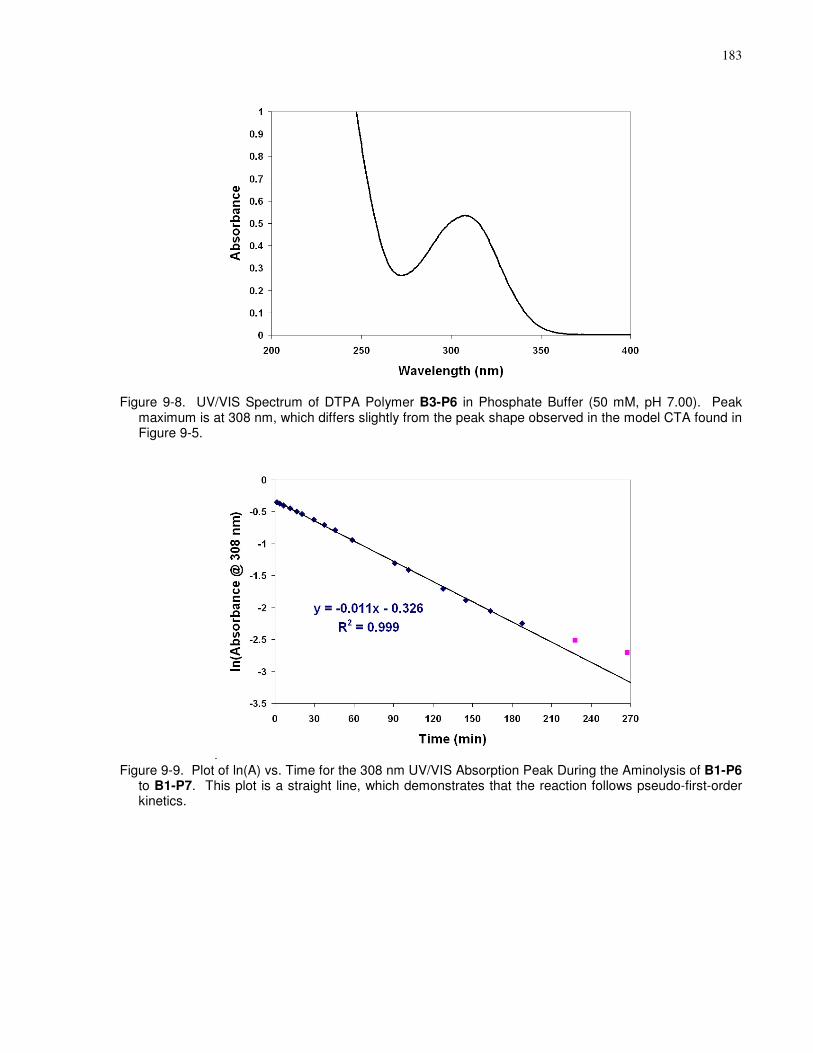
183
Figure 9-8. UV/VIS Spectrum of DTPA Polymer B3-P6 in Phosphate Buffer (50 mM, pH 7.00). Peak maximum is at 308 nm, which differs slightly from the peak shape observed in the model CTA found in Figure 9-5.
Figure 9-9. Plot of ln(A) vs. Time for the 308 nm UV/VIS Absorption Peak During the Aminolysis of B1-P6 to B1-P7. This plot is a straight line, which demonstrates that the reaction follows pseudo-first-order kinetics.
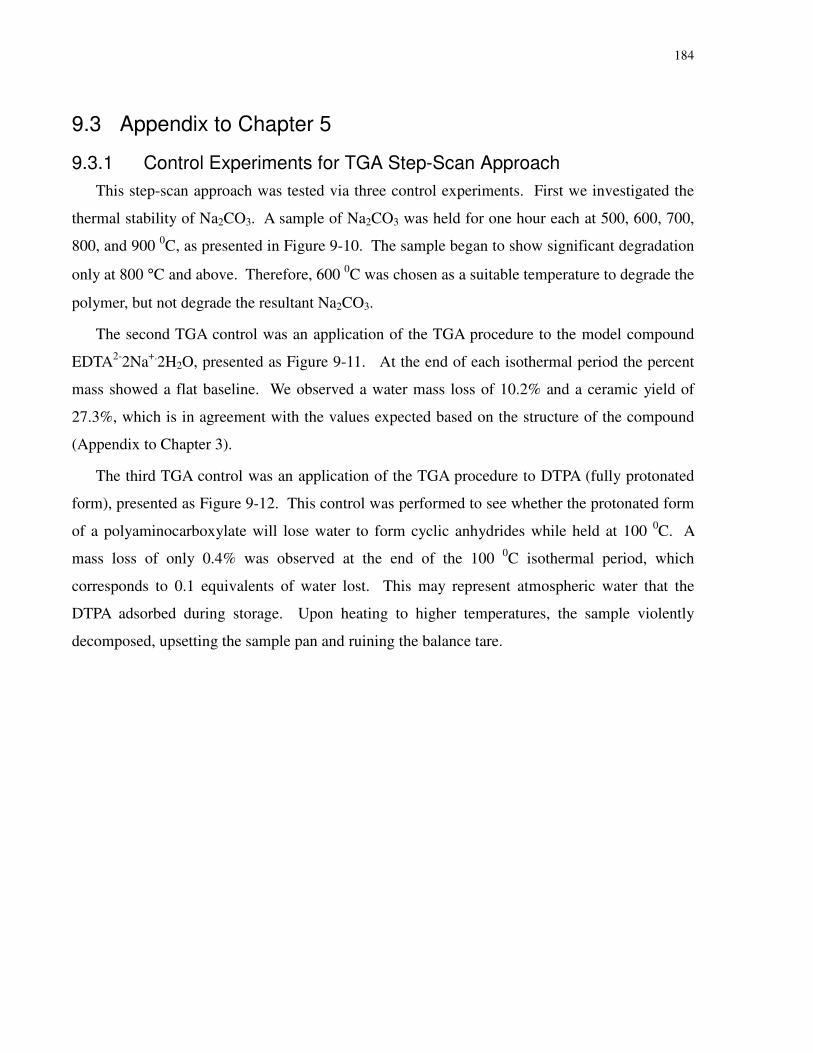
184
9.3 Appendix to Chapter 5
9.3.1 Control Experiments for TGA Step-Scan Approach
This step-scan approach was tested via three control experiments. First we investigated the
thermal stability of Na2CO3. A sample of Na2CO3 was held for one hour each at 500, 600, 700,
800, and 900 0C, as presented in Figure 9-10. The sample began to show significant degradation
only at 800 °C and above. Therefore, 600 0C was chosen as a suitable temperature to degrade the
polymer, but not degrade the resultant Na2CO3.
The second TGA control was an application of the TGA procedure to the model compound
EDTA2-2Na+.2H2O, presented as Figure 9-11. At the end of each isothermal period the percent
mass showed a flat baseline. We observed a water mass loss of 10.2% and a ceramic yield of
27.3%, which is in agreement with the values expected based on the structure of the compound
(Appendix to Chapter 3).
The third TGA control was an application of the TGA procedure to DTPA (fully protonated
form), presented as Figure 9-12. This control was performed to see whether the protonated form
of a polyaminocarboxylate will lose water to form cyclic anhydrides while held at 100 0C. A
mass loss of only 0.4% was observed at the end of the 100 0C isothermal period, which
corresponds to 0.1 equivalents of water lost. This may represent atmospheric water that the
DTPA adsorbed during storage. Upon heating to higher temperatures, the sample violently
decomposed, upsetting the sample pan and ruining the balance tare.
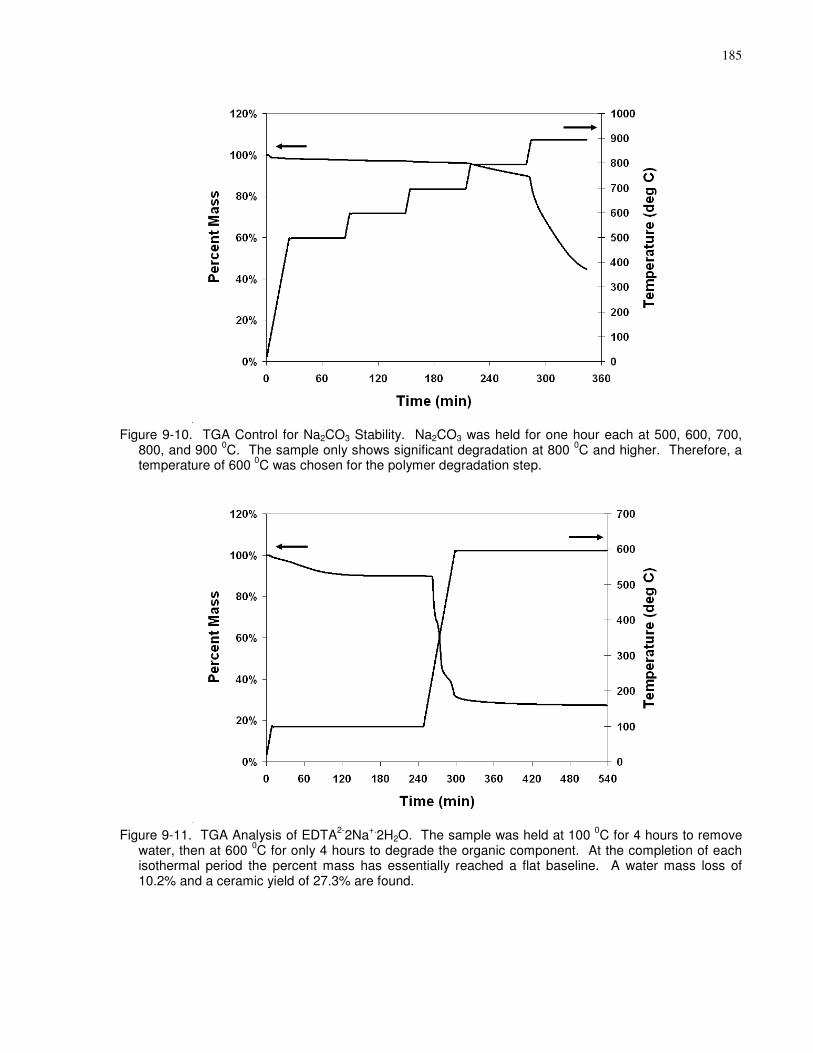
185
Figure 9-10. TGA Control for Na2CO3 Stability. Na2CO3 was held for one hour each at 500, 600, 700, 800, and 900
0C. The sample only shows significant degradation at 800
0C and higher. Therefore, a
temperature of 600 0C was chosen for the polymer degradation step.
Figure 9-11. TGA Analysis of EDTA2-
2Na+.
2H2O. The sample was held at 100 0C for 4 hours to remove
water, then at 600 0C for only 4 hours to degrade the organic component. At the completion of each
isothermal period the percent mass has essentially reached a flat baseline. A water mass loss of 10.2% and a ceramic yield of 27.3% are found.
186
Figure 9-12. TGA Analysis of DTPA (Protonated Form). At the end of the 100 0C isothermal period only
0.4% percent mass had been lost. This corresponds to 0.1 equivalents of water. Upon heating to higher temperatures, the sample violently decomposed, upsetting the sample pan and ruining the initial tare. This phenomenon was reproducible.
9.3.2 Aqueous SEC Characterization of Metal-Loaded Polymers
In Chapter 5, aqueous SEC was one method used to characterize the success of metal-loading
experiments. Analysis by SEC demonstrated the desirable properties of a) water-solubility, b)
absence of appreciable chain-to-chain crosslinks, and c) net anionic charge. If a polymer lacks a
net anionic charge, our experiments have demonstrated that our chosen eluent cannot provide
sufficient charge-shielding, and thus no signal will be observed in the SEC chromatograph. Net
anionic charge is a desirable property because it is analogous to the well-established lanthanide-
loaded DTPA polymers already in use. These lanthanide-loaded polymers consist of mono-
amide DTPA groups, with four carboxylic acids and a lanthanide(III) ion, to give a net charge of
(-1) at neutral pH. This is a reasonable assumption about the DTPA-monoamide complex; Gd-
DTPA’s first two pKa values are 1.52 and 2.27.152
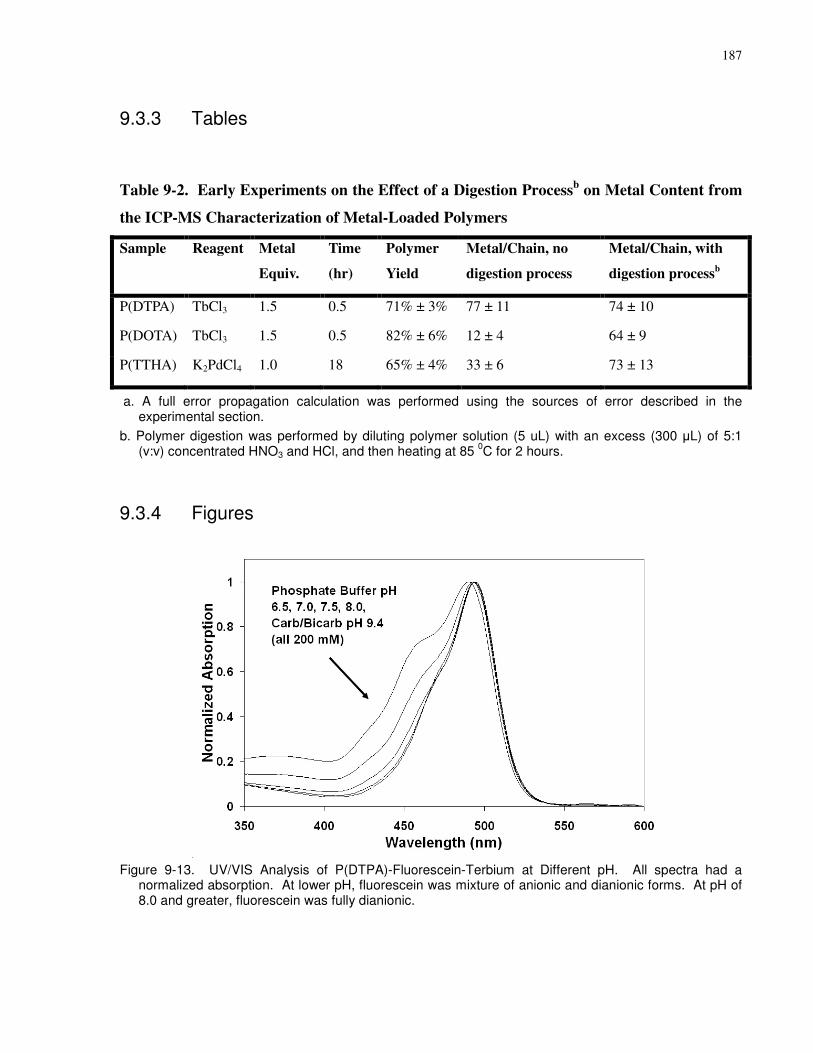
187
9.3.3 Tables
Table 9-2. Early Experiments on the Effect of a Digestion Processb on Metal Content from
the ICP-MS Characterization of Metal-Loaded Polymers
Sample Reagent Metal
Equiv.
Time
(hr)
Polymer
Yield
Metal/Chain, no
digestion process
Metal/Chain, with
digestion processb
P(DTPA) TbCl3 1.5 0.5 71% ± 3% 77 ± 11 74 ± 10
P(DOTA) TbCl3 1.5 0.5 82% ± 6% 12 ± 4 64 ± 9
P(TTHA) K2PdCl4 1.0 18 65% ± 4% 33 ± 6 73 ± 13
a. A full error propagation calculation was performed using the sources of error described in the experimental section.
b. Polymer digestion was performed by diluting polymer solution (5 uL) with an excess (300 µL) of 5:1 (v:v) concentrated HNO3 and HCl, and then heating at 85
0C for 2 hours.
9.3.4 Figures
Figure 9-13. UV/VIS Analysis of P(DTPA)-Fluorescein-Terbium at Different pH. All spectra had a normalized absorption. At lower pH, fluorescein was mixture of anionic and dianionic forms. At pH of 8.0 and greater, fluorescein was fully dianionic.
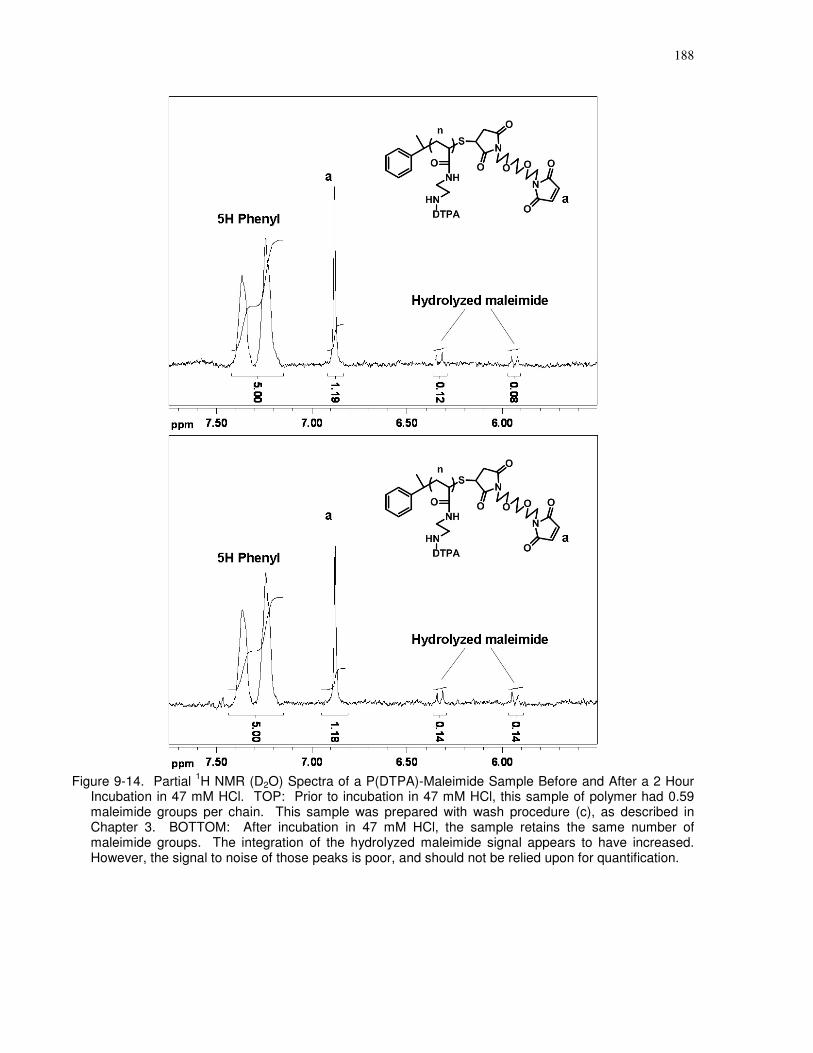
188
Figure 9-14. Partial 1H NMR (D2O) Spectra of a P(DTPA)-Maleimide Sample Before and After a 2 Hour
Incubation in 47 mM HCl. TOP: Prior to incubation in 47 mM HCl, this sample of polymer had 0.59 maleimide groups per chain. This sample was prepared with wash procedure (c), as described in Chapter 3. BOTTOM: After incubation in 47 mM HCl, the sample retains the same number of maleimide groups. The integration of the hydrolyzed maleimide signal appears to have increased. However, the signal to noise of those peaks is poor, and should not be relied upon for quantification.

189
9.4 Appendix to Chapter 6
9.4.1 Tables
Table 9-3. Concentrationa of Antibody Tags in Staining Solutions used for Antibody
Dilution Experiment.
Staining
Solution
CD3-Sm152-
FITC
CD13-Tm169-
DyL405
CD38-Ho165-
DyL549
CD45-Tb159-
DyL649
#1 0.16 0.31 0.16 0.08
#2 0.31 0.62 0.31 0.16
#3 0.62 1.25 0.62 0.31
#4 1.25 2.5 1.25 0.62
#5 2.5 5.0 2.5 1.25
#6 5.0 10.0 5.0 2.5
a. Concentration is given as µg/mL antibody.
9.4.2 Figures
Figure 9-15. 1H NMR Spectrum of P(12%PEGAmino)(88%DTPA)-Disulfide (D2O). BOC deprotection is
complete as evidenced by the lack of a tert-butyl BOC signal at 1.42 ppm.

190
Figure 9-16. Normalized UV/VIS Absorption Spectra of P(12%PEGAmino)(88%DTPA)(DYE)-Disulfide Polymers.
Figure 9-17. Partial 1H NMR Spectrum of P(12%PEGAmino)(88%DTPA)(FITC)-Maleimide (D2O). Both
the maleimide and polymer end-group signals are overlapped by the FITC signals, making it impossible to quantify maleimide content.
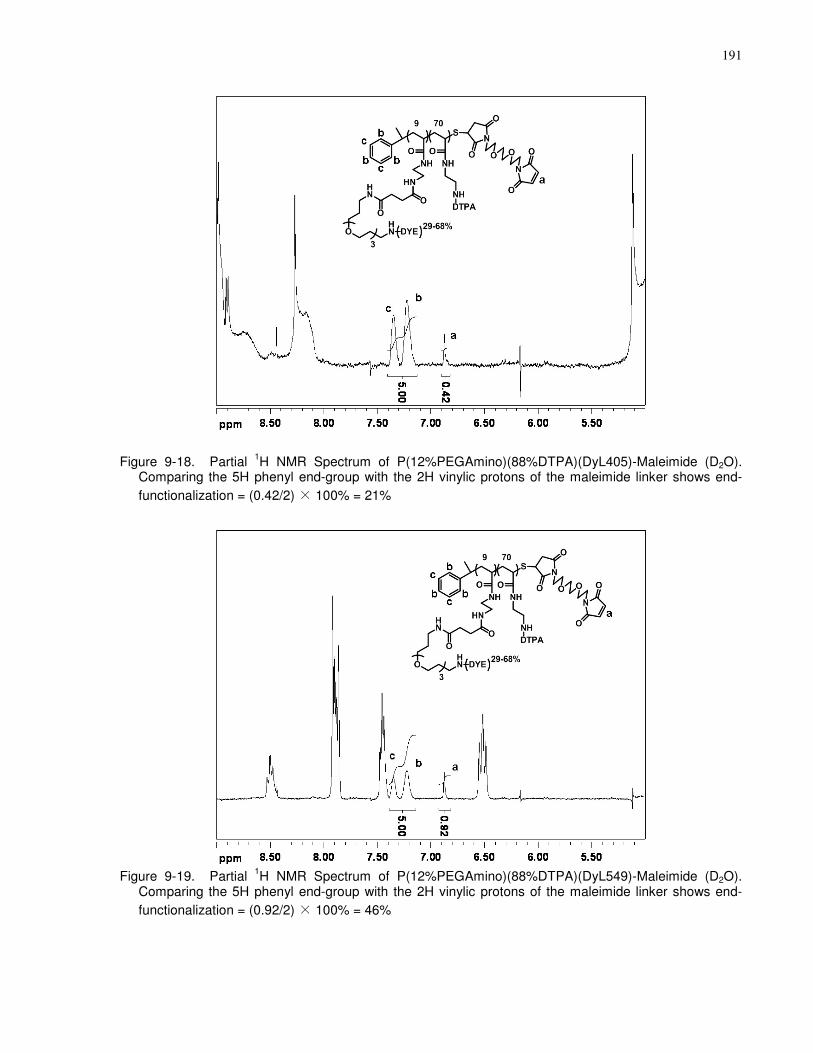
191
Figure 9-18. Partial 1H NMR Spectrum of P(12%PEGAmino)(88%DTPA)(DyL405)-Maleimide (D2O).
Comparing the 5H phenyl end-group with the 2H vinylic protons of the maleimide linker shows end-
functionalization = (0.42/2) × 100% = 21%
Figure 9-19. Partial 1H NMR Spectrum of P(12%PEGAmino)(88%DTPA)(DyL549)-Maleimide (D2O).
Comparing the 5H phenyl end-group with the 2H vinylic protons of the maleimide linker shows end-
functionalization = (0.92/2) × 100% = 46%
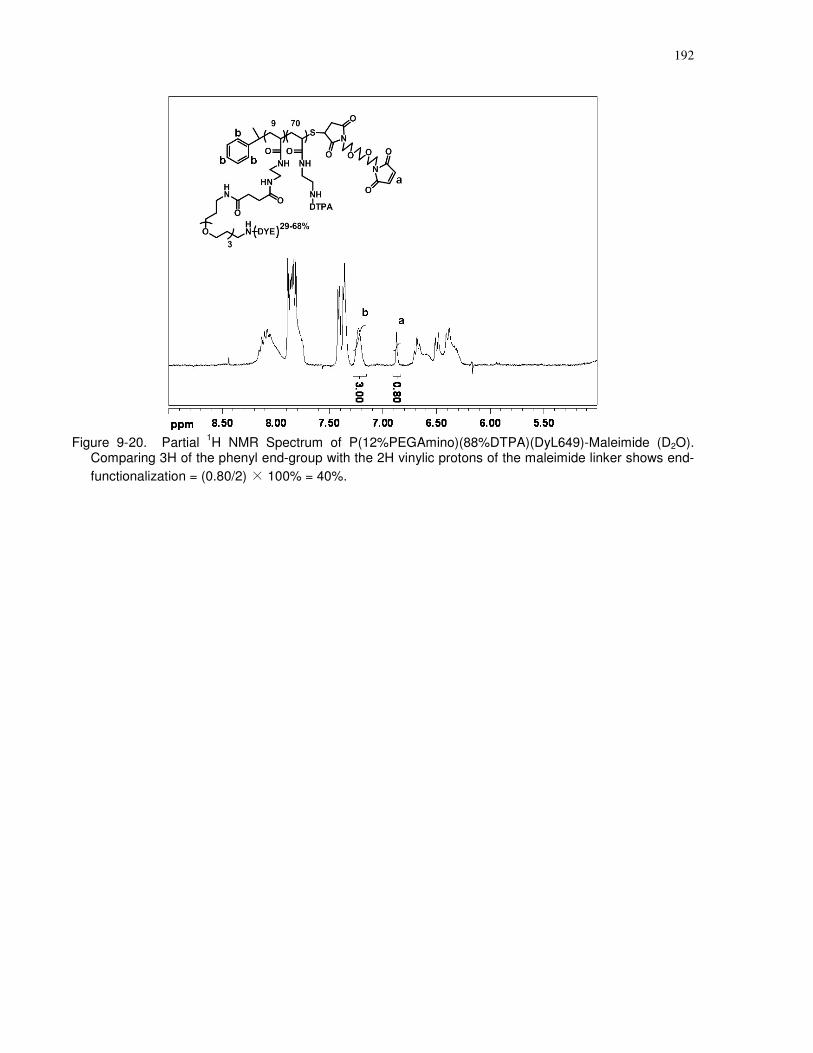
192
Figure 9-20. Partial 1H NMR Spectrum of P(12%PEGAmino)(88%DTPA)(DyL649)-Maleimide (D2O).
Comparing 3H of the phenyl end-group with the 2H vinylic protons of the maleimide linker shows end-
functionalization = (0.80/2) × 100% = 40%.


![Sorption Studies of Heavy Metal Ions on a Novel Chelating Resin [Stripping of Mercury II]](https://static.fdocuments.in/doc/165x107/577d2d231a28ab4e1eaceff8/sorption-studies-of-heavy-metal-ions-on-a-novel-chelating-resin-stripping.jpg)