
Synthesis and Functionalization of Carbohydrate Capped ...
223
I Synthesis and Functionalization of Carbohydrate Capped Silicon Nanoparticles for Targeting Cancer Cells By Jayshree Hemant Ahire School of Chemistry University of East Anglia Norwich U.K. 2014 A thesis submitted in fulfilment of the requirements for the degree of Doctor of Philosophy of the University of East Anglia. © This copy of the thesis has been supplied on condition that anyone who consults it is understood to recognise that its copyright rests with the author and that use of any information derived there from must be in accordance with current UK Copyright Law. In addition, any quotation or extract must include full attribution.
Transcript of Synthesis and Functionalization of Carbohydrate Capped ...

I
Synthesis and Functionalization of
Carbohydrate Capped Silicon
Nanoparticles for Targeting Cancer Cells
By
Jayshree Hemant Ahire
School of Chemistry
University of East Anglia
Norwich
U.K.
2014
A thesis submitted in fulfilment of the requirements for the degree of Doctor of Philosophy
of the University of East Anglia.
© This copy of the thesis has been supplied on condition that anyone who consults it is understood to
recognise that its copyright rests with the author and that use of any information derived there from must be
in accordance with current UK Copyright Law. In addition, any quotation or extract must include full
attribution.

II
Declaration
I hereby declare that the work described in this thesis, submitted for the degree of Doctor of
Philosophy, has been carried out by myself and to the best of my knowledge, except where
due reference is made to other authors has not previously been submitted by me for a
degree at this or any other universities.
- Jayshree Hemant Ahire

III
Acknowledgements
In the course on my PhD, there are a lot of people who have helped make this thesis possible
and whom I would like to thank. First and foremost I offer my sincerest gratitude to my
supervisor Dr. Yimin Chao, for giving me the opportunity to pursue this work and providing
me with dedicated support throughout. I would also like to extend my deepest thanks to Dr.
Isabelle Chambrier who has been a surrogate supervisor to me and whose assistance has
always been on hand and freely given. My thesis wouldn’t have been accomplished without
her support and valuable criticism throughout this research work. I also acknowledge the
help and kindness of Dr. Victoria Sherwood, for providing me with the necessary laboratory
facilities to carry out the biomedical research of this work and also for her help to improve
my biology perception during this research. Without their expertise, I would never have
been able to fully appreciate the wide range of experimental techniques I’ve been privileged
to use nor realize the completion of this work.
I am also thankful to Prof. Andrew Cammidge for his advice as my second supervisor as well
as providing me with the necessary laboratory facility to carry out my synthetic chemistry
work.
I also thank Dr. Yongping Bao and Mrs Wei Wang for providing me the cell lines to carry out
the biomedical research in this work.
My sincere appreciation also goes to my colleagues, Dr. Paul Coxon, Qi Wang and Shane
Ashby for their constant help and critical discussions about my research work, especially for
their good humour and friendship. Furthermore I would like to take this opportunity to
thank all the members from Dr. Yimin Chao’s research group, past and present: Mehrnaz
Behray, Jason Thomas, Wenchao Zhang, Ruoxi Liu, Frederik Huld, Ting Li and Tiezheng Bian
for their hospitality and friendship.
I would also like to thank Carl Webster, for his help in carrying out the biological assays. I am
also thankful to the members of Prof. Andrew Cammidge’s research group: Alejandro Diaz-
Moscoso, Daniel Gonzalez Lucas and Sonia Remiro Buenamanana for their help, support and
friendship.
Many friends have helped me stay sane through these difficult years. Their support and care
helped me overcome setbacks and stay focused on my study. I greatly value their friendship
and I deeply appreciate their belief in me.

IV
I would also like to thank my parents-in-law Mr. Vasant B Ahire and Mrs. Lata V Ahire for
their patience and understanding throughout my study.
Finally, I thank my beloved parents, Mr. Ramesh Sakharam Gurjar and Lakshmi R Gurjar, for
their unfailing support, patience and understanding throughout all my studies. They taught
me how to work hard through their own example and the importance of respecting myself,
my family and others.
My brothers Mr. Ketan Gurjar, Kiran and my sister Rajshree has been my best friends all my
life and I love them dearly and thanks them for their constant love and encouragement
throughout my journey.
Finally, I must express my very profound gratitude to my husband, Mr. Hemant Ahire for
providing me with unfailing support and continuous encouragement throughout my years of
study and especially through the process of this thesis. This accomplishment would not have
been possible without his willing support and encouragement.
He has always been my ideal, my best friend and a wonderful husband. I am grateful to him
not only because he has given up so much to make my career a priority in our life, but also
because of being an amazing companion for me during the entire journey of my research. I
owe my accomplishments, both scientific and personal, to his great attitude as my best
companion and guiding light.

V
This thesis is dedicated to my beloved
husband Hemant Ahire
I love you.
VI
Abstract
Silicon nanoparticles (SiNPs) hold prominent interest in various aspects of biomedical
applications. For this purpose, surface functionalization of the NPs is essential to stabilize
them. A facile method is reported here to synthesize highly stable and brightly luminescent
amine-terminated SiNPs. The diameter of the crystal cores is 4.6 nm. The NPs emit strong
blue-green photoluminescence (PL) at peak position 460 nm with quantum yield (QY) 22%.
The NPs exhibited an exceptional stability over a wide pH range (4−14) and are resistant to
aging over several weeks.
For SiNPs to target specific disease area, and allow them to selectively bind to the cells or the
bio-molecules present on the surface of the cells, carbohydrate capped SiNPs were
synthesized. However, no such functionalization has been explored with SiNPs. In this study,
we report the first synthesis of SiNPs functionalized with carbohydrates (Galactose,
Mannose, Glucose and Lactose). The NPs show blue-green luminescence in water and orange
luminescence in the dry state with emission of 600nm with the highest QY and exhibit an
exceptional stability over weeks.
Further study explores the possibility of using carbohydrate capped SiNPs to detect and
outline various cell types on the basis of the more physiologically related carbohydrate-
receptor interactions. The NPs prove to be very stable in biological media. The toxicity,
which was tested both in vitro and in vivo, proved that the NPs were non-toxic. The cellular
uptake efficiency was quantified by flow cytometry and indicated that the NPs internalize in
the cell within 24 hours. The fluorescence uptake was quantified by both cancer and non-
cancerous cell lines and the cancerous cells were shown to uptake more NPs than normal
cell lines. The cellular uptake of these NPs, which was visualized by fluorescence and
confocal microscopy, showed quick accumulation inside cancer cells within cytoplasm.

VII
Publications:
The following list details the papers which have resulted over the duration of this work.
Ahire, J. H.; Wang, Q.; Coxon, P.; Malhotra, G.; Brydson, R.; Chen, R. and Chao, Y.,
Highly Luminescent and Nontoxic Amine-Capped Nanoparticles from Porous Silicon:
Synthesis and Their Use in Biomedical Imaging. ACS Applied Materials & Interfaces.
2012, 4 (6), 3285-3292
Ahire, J. H.; Chambrier, I.; Mueller, A.; Bao, Y.; Chao, Y., Synthesis of D-Mannose
Capped Silicon Nanoparticles and Their Interactions with MCF-7 Human Breast
Cancerous Cells. ACS Applied Materials & Interfaces 2013, 5 (15), 7384-7391
Wang, Q.; Bao, Y.; Ahire, J. H.; Chao, Y., Co-encapsulation of Biodegradable
Nanoparticles with Silicon Quantum Dots and Quercetin for Monitored Delivery.
Advanced Healthcare Materials 2013, 2(3), 459-466
Coxon, P. R.; Ahire, J. H.; Ashby, S., P.; Frogley, M., D.; Chao, Y.; Amine-terminated
Nanoparticle films: Pattern Deposition by a Simple Nanostencilling Technique and
Stability Studies under X-ray Irradiation. Physical Chemistry Chemical Physics 2014,
16, 5817-5823

VIII
1 Contents
1 Contents ................................................................................................................................................... VIII
1 Introduction ................................................................................................................................................ 1
1.1 Nanotechnology ......................................................................................................................... 1
1.1.1 Nanotechnology in Ancient History ................................................................... 2
1.2 Semiconductor Nanoparticles.............................................................................................. 3
1.2.1 Quantum Confinement Effect ............................................................................... 3
1.2.2 Core-shell Semiconductor Quantum Dots ....................................................... 5
1.2.3 Silicon Nanoparticles ............................................................................................... 6
1.2.4 Surface Functionalization of SiNPs .................................................................... 7
1.3 Synthetic Strategies for SiNPs .............................................................................................. 8
1.3.1 Top Down/ Bulk Reduction method ................................................................. 8
1.3.2 Bottom-up Synthetic Methods / Assembly Methods ............................... 10
1.4 Applications of Silicon Nanoparticles ............................................................................ 13
1.5 Biomedical Applications of Semiconductor Nanoparticles .................................. 14
1.5.1 Cytotoxicity ............................................................................................................... 15
1.6 Biomedical Applications of SiNPs .................................................................................... 17
1.7 Glyconanoparticles for Biomedical Applications ...................................................... 18
1.7.1 The “GLYCO” Perspective .................................................................................... 19
1.7.2 The “NANO” Perspective ..................................................................................... 19
1.8 Scope of This Thesis .............................................................................................................. 26
1.9 References ................................................................................................................................. 28
2 Silicon Nanoparticle Synthesis and Characterization Techniques .................................... 40
2.1 Synthesis of Hydrogen terminated Porous Silicon NPs.......................................... 40
2.1.1 Porous Silicon .......................................................................................................... 40
2.1.2 Brief History of Porous Silicon .......................................................................... 40
2.1.3 Synthesis of Porous Silicon ................................................................................ 41

IX
2.2 Synthesis of Amine-terminated SiNPs ........................................................................... 44
2.2.1 Hydrosilylation ........................................................................................................ 44
2.2.2 Procedure to Synthesize Amine-Capped SiNPs ......................................... 45
2.3 Synthesis of Carbohydrates capped SiNPs .................................................................. 46
2.3.1 Synthesis of Carboxylic Acid Functionalized Carbohydrates ............... 46
2.3.2 General Procedure to Synthesize Mannose and Lactose
pentaacetate (2a and 4a)..................................................................................... 46
2.3.3 General Procedure for Allylation of Galactose, Glucose and
Mannose Pentaacetate ......................................................................................... 47
2.3.4 General Procedure for Oxidation of 1-Allyl-2,3,4,6-tetra-O-
acetyl-β-D-galacto-, gluco-, and manno-pyranosides .............................. 49
2.3.5 General Procedure to Synthesize Carbohydrate capped SiNPs
Using DCC Coupling Reagent ............................................................................. 51
2.3.6 General Procedure to Synthesize Carbohydrate capped SiNPs
Using EDC Coupling Reagent ............................................................................. 51
2.3.7 General Procedure for Deacetylation of β-D-galactose
mannose, glucose and lactose capped SiNPs .............................................. 52
2.4 Characterization of Amine terminated SiNPs and Carbohydrate
capped SiNPs ............................................................................................................................ 52
2.5 Optical measurements ......................................................................................................... 52
2.5.1 Photoluminescence Spectroscopy (PL) ......................................................... 52
2.5.2 Ultraviolet-visible Spectroscopy (UV-vis) .................................................... 53
2.5.3 Quantum Yield Measurement............................................................................ 54
2.6 Size and Dispersity Measurements ................................................................................. 55
2.6.1 Transmission Electron Microscopy (TEM) .................................................. 55
2.6.2 Dynamic Light Scattering (DLS) ....................................................................... 56
2.7 Chemical Analysis .................................................................................................................. 57
2.7.1 Nuclear Magnetic Resonance Spectroscopy (NMR) ................................. 57
2.7.2 Fourier Transform Infrared Spectroscopy (FTIR).................................... 57
2.7.3 X-ray Photoelectron Spectroscopy (XPS) ..................................................... 58
2.8 Biological Studies ................................................................................................................... 60

X
2.8.1 Culture of Cell Lines .............................................................................................. 60
2.9 Cytotoxicity Studies............................................................................................................... 61
2.9.1 In Vivo Toxicity Assay in Xenopus laevis ........................................................ 61
2.9.2 Colourimetric MTT Assay (In Vitro) ............................................................... 62
2.10 Bioimaging Studies ................................................................................................................ 63
2.10.1 Microscope Slide Preparation ........................................................................... 63
2.10.2 Cell Staining .............................................................................................................. 63
2.10.3 Fluorescence Microscopy .................................................................................... 64
2.10.4 Confocal Laser Scanning Microscopy ............................................................. 64
2.11 Cellular Uptake ........................................................................................................................ 65
2.12 Flow Cytometry ...................................................................................................................... 66
2.13 Statistics ..................................................................................................................................... 66
2.14 References ................................................................................................................................. 67
3 Highly Luminescent and Nontoxic Amine-Capped silicon Nanoparticles from
Porous Silicon: Synthesis and Their Use in Biomedical Imaging ....................................... 70
3.1 Introduction and Motivation ............................................................................................. 71
3.2 Synthesis of H-terminated Porous Silicon NPs .......................................................... 72
3.3 Synthesis of Amine-terminated SiNPs Using Thermally Induced
Hydrosilylation Reaction. ................................................................................................... 74
3.4 Synthesis of Amine-terminated SiNPs Using UV Induced
Hydrosilylation Reaction. ................................................................................................... 75
3.5 Synthesis of Amine-terminated SiNPs Using Pt catalysed
Hydrosilylation ....................................................................................................................... 75
3.6 Purification of Amine-terminated SiNPs ...................................................................... 77
3.7 Characterization of Amine-terminated SiNPs ............................................................ 78
3.7.1 Size Measurement .................................................................................................. 78
3.7.2 DLS Measurement .................................................................................................. 80
3.8 Chemical bonding and elemental analysis ................................................................... 81
3.8.1 IR Spectroscopy ...................................................................................................... 81
3.8.2 NMR Spectroscopy ................................................................................................. 83

XI
3.8.3 X-ray Photoelectron Spectroscopy .................................................................. 84
3.9 Optical properties .................................................................................................................. 87
3.9.1 Absorption and Emission Spectra ................................................................... 87
3.9.2 Quantum Yield Measurement............................................................................ 88
3.9.3 pH effect ..................................................................................................................... 91
3.9.4 Stability of amine-terminated SiNPs by PL .................................................. 92
3.10 Bioimaging Studies of Amine-terminated SiNPs ....................................................... 94
3.10.1 In vitro Cytotoxicity Assay .................................................................................. 95
3.11 Conclusion ................................................................................................................................. 96
3.12 References ................................................................................................................................. 97
4 Synthesis of Carbohydrate Capped Silicon Nanoparticles for selective
targeting of cancer cells ................................................................................................................... 101
4.1 Introduction and Motivation .......................................................................................... 102
4.2 Carbohydrate capped SiNPs NPs from Hydrosilylation ...................................... 104
4.2.1 Acetylation Reaction .......................................................................................... 104
4.2.2 Allylation Reaction .............................................................................................. 105
4.2.3 Attempted Thermally induced Hydrosilylation reaction .................... 106
4.2.4 Attempted Hydrosilylation reaction using Pt catalyst ......................... 107
4.3 Carbohydrates capped SiNPs Using Amine-terminated SiNPs ......................... 108
4.3.1 Oxidation Reaction ............................................................................................. 111
4.3.2 Using N,N′-dicyclohexylcarbodiimide Coupling Reagent
(DCC) ........................................................................................................................ 111
4.3.3 Using 1-Ethyl-3-(3-dimethylaminopropyl) Carbodiimide
Coupling Reagent (EDC or EDAC) ................................................................. 112
4.4 Carbodiimide Coupling Reaction Mechanism ......................................................... 112
4.5 Size Measurement with TEM and DLS ........................................................................ 114
4.6 Zeta-potential ....................................................................................................................... 117
4.7 Chemical Bonding and Elemental Analysis .............................................................. 118
4.7.1 Energy-dispersive X-ray Measurements (EDX) ...................................... 118

XII
4.7.2 Fourier Transform Infrared Spectroscopy (FTIR)................................. 120
4.7.3 Nuclear Magnetic Resonance Spectroscopy (NMR) .............................. 122
4.7.4 X-ray Photoelectron Spectroscopy (XPS) .................................................. 124
4.8 Optical Properties of Carbohydrate capped SiNPs ................................................ 126
4.8.1 Photoluminescence Spectroscopy (PL) ...................................................... 126
4.8.2 Quantum Yield (QY) ........................................................................................... 129
4.8.3 Photoinduced Electron Transfer (PET)...................................................... 134
4.8.4 pH effect .................................................................................................................. 135
4.8.5 Photoluminescence (PL) Stability ................................................................ 136
4.9 Biochemical Activity .......................................................................................................... 137
4.10 Targeting Cancerous Cells ............................................................................................... 140
4.11 Crystallization of Carbohydrate capped SiNPs ....................................................... 142
4.11.1 SEM images of Carbohydrate capped SiNPs Crystals ........................... 143
4.11.2 HRTEM images of Carbohydrate capped SiNPs Crystals .................... 143
4.11.3 Elemental Analysis of Carbohydrate SiNPs Crystals ............................ 144
4.12 Conclusion .............................................................................................................................. 153
4.13 References .............................................................................................................................. 154
5 Carbohydrate Capped Silicon Nanoparticles for Selective Targeting of Cancer
cells ........................................................................................................................................................... 160
5.1 Introduction and motivations ........................................................................................ 160
5.2 Synthesis of Carbohydrate capped SiNPs ................................................................. 162
5.3 Stability of Carbohydrate capped SiNPs in Biological Media ............................ 164
5.4 Cytotoxicity Assay of Carbohydrate capped SiNPs ............................................... 168
5.4.1 In vitro Toxicity .................................................................................................... 168
5.4.2 Toxicity by Cell Viability images ................................................................... 171
5.4.3 In Vivo Toxicity Assay ........................................................................................ 173
5.5 Cellular Uptake of Carbohydrate capped SiNPs Using Flow Cytometry ....... 176
5.6 Cellular Uptake of Carbohydrate capped SiNPs Using Microscopy ................ 182

XIII
5.7 Cellular Uptake Using Synchrotron FTIR Spectroscopy ..................................... 184
5.8 Conclusion .............................................................................................................................. 186
5.9 References .............................................................................................................................. 188
6 Summary and Future Prospects ................................................................................................... 192
6.1 Discussion and Future Prospects ................................................................................. 195

XIV
List of Figures:
Figure 1.1: The figure depicts the sizes of nanoparticles in relation to other biological
objects. ................................................................................................................................................... 1
Figure 1.2: The Lycurgus Cup in (a) reflected and (b) transmitted light, Department
of Prehistory and Europe, The British Museum. .................................................................. 2
Figure 1.3: Schematic energy diagrams illustrating the state of a NP, in between a
molecule and a bulk semiconductor. ........................................................................................ 4
Figure 1.4: Schematic representation of core/shell/coat quantum dot. ........................................... 6
Figure 1.5: Thermal processing of hydrogen silsesquioxane (HSQ) for synthesizing
silica NPs /SiO2-like (nc-Si/SiO2) nanocomposites. Reproduced from
Veinot’s et. al.89 ................................................................................................................................... 9
Figure 1.6: Various solution methods to synthesize SiNPs by oxidation and reduction
reaction. ............................................................................................................................................. 12
Figure 1.7: The concept of prospective uses of glyconanoparticles in biomedical
applications. Reproduced from Penadés et al.1 ................................................................. 18
Figure 1.8: Schematic representation of E. coli strain ORN178 incubated with Man-
MGNPs followed by magnet mediated separation of detected bacteria,
showing up to 88% of the bacteria removed by this procedure. ............................... 21
Figure 1.9: Schematic representations of the glyco Au-NPs showing that it can reduce
the binding between DC-SIGN and gp120, which have a significant
inhibitory effect on HIV infection to cells expressing DC-SIGN.173 ............................ 22
Figure 1.10: The incubation of Lacto-AuNPs with mouse melanoma B16F10 cells
prior to intravenous inoculation in C57/Bl6 mice significantly reduced
the lung metastasis of the tumour. In comparison, the Glc-AuNPs were
ineffective in reducing metastasis.176 .................................................................................... 23
Figure 1.11: Confocal image of glyconanoparticles upon incubation with sperm. (a)
GlcNAc-QDs was mainly found on the heads of sea-urchin sperm (scale
bar=20 μm), and b) Man-QD labelled the tail of mouse sperm.180 ............................. 24
Figure 2.1: Schematic diagram of formation of porous silicon - Top left shows a two-
electrode electrochemical cell used to make porous silicon. Lower left,
enlarged cross-section of the Psi-Si interface. Top right, silicon wall
isolated by two pores with possible routes for a hole to cross the silicon
highlighted (blue and purple arrows). Lower right, energy barriers for
the hole penetrating into a wall (blue arrow) and a pore base (purple
arrow). Reproduced from Lehmann et al. (1993). ........................................................... 43

XV
Figure 2.2: Schematic representation of an energy diagram (Jablonski diagram)
shows the process of fluorescence. The colored circles represent the
energy state of the fluorophore, where green depicts the normal energy
level and red the maximum energy level. ............................................................................ 53
Figure 2.3: Schematic representation of Transition electron microscopy .................................... 55
Figure 2.4: Schematic representation of X-ray Photoelectron spectrometer equipped
with an x-ray source and a hemispherical analyzer ........................................................ 59
Figure 2.5: Internal workings of a confocal microscope-reproduced from Prasad et
al.34 ....................................................................................................................................................... 65
Figure 3.1: Washing experiment of amine-terminated Si NPs using various solvents. ............ 78
Figure 3.2: (a, c, e) shows HRTEM images of amine-terminated SiNPs. (b, d, f) shows
TEM images of amine-terminated SiNPs, the white circle showing an
individual silicon nanocrystal and the crystal lattice planes. ...................................... 79
Figure 3.3: Histogram showing the size distribution of amine-terminated SiNPs. .................... 80
Figure 3.4: Dynamic light scattering spectrum displays the overall diameter and
distribution of amine-capped SiNPs in water. ................................................................... 81
Figure 3.5: FTIR spectrum of amine-capped SiNPs in chloroform (32 scans, 4 cm-1
resolution). ....................................................................................................................................... 82
Figure 3.6: FTIR spectra of amine-terminated SiNPs in solid state (32 scans, 4 cm-1
resolution). ....................................................................................................................................... 82
Figure 3.7: 1H NMR spectrum of amine-terminated SiNPs in D2O. ................................................... 84
Figure 3.8: 1H NMR spectra of amine-terminated SiNPs in CDCl3 ..................................................... 84
Figure 3.9: XPS survey spectrum from the film of amine-terminated SiNPs deposited
on a gold substrate. ....................................................................................................................... 85
Figure 3.10: XPS core-level spectra of Si-NPs obtained at 20C to normal emission:
the dotted line is experimental data that is fitted with various mixed
components. (a) O1s, photon energy 588 eV, (b) C1s, photon energy 347
eV, (c) Si2p, photon energy 150 eV, and (d) N1s, photon energy 400 eV. .............. 86
Figure 3.11: The dotted line shows the absorption spectrum of amine-capped SiNPs
in water: the solid line shows the photoluminescence spectrum of amine-
capped SiNPs in water at an excitation at 360 nm. The inset image shows
the luminescence from a vial of amine-capped SiNPs in water when
excited with a UV lamp. ............................................................................................................... 87
Figure 3.12: Quantum yield measurement of quinine sulphate: (a) Absorption and (b)
emission spectra obtained for different concentrations of quinine

XVI
sulphate, (c) Scatter plot of integrated intensity (area under emission
spectrum) against absorbance at 310 nm. .......................................................................... 89
Figure 3.13: Quantum yield measurement of amine-terminated SiNPs: (a)
Absorption and (b) emission spectra obtained for different
concentrations of amine-terminated SiNPs, (c) Scatter plot of integrated
intensity (area under emission spectrum) against absorbance at 360 nm. .......... 90
Figure 3.14 : Initial and after 2 days effect of pH onto the emission of the amine-
terminated SiNPs ........................................................................................................................... 91
Figure 3.15: PL stability results of the amine-terminated SiNPs in water. .................................... 93
Figure 3.16: Ageing effect on luminescence spectra for amine-capped SiNPs in water
at different pH values and in PBS (excitation wavelength = 360 nm): (a)
peak intensity; (b) peak wavelength. The samples were stored in glass
vials in the dark under ambient conditions and no attempt was made to
purge the suspensions of oxygen. ........................................................................................... 93
Figure 3.17: HepG2 cells observed under a confocal microscope, (a) nuclei staining
with DAPI; (b) fluorescence from the amine-capped SiNPs; (c) the bright
field; and (d) the combination of all three. .......................................................................... 94
Figure 3.18: MTT assay of amine-capped SiNPs in HepG2 cells ......................................................... 96
Figure 4.1: (a) TEM image of Gal-capped SiNPs and inset showing a high-resolution
TEM image of an individual silicon nanocrystal screening the crystal
lattice planes (b) Histogram showing size distribution (in diameter) of
Gal capped SiNPs. ........................................................................................................................ 115
Figure 4.2: TEM images of Gal (a), Lac (c) Glu (e) and Man (g) capped SiNPs. Dynamic
light scattering spectrum displays the size and size distribution (in
diameter) of Gal (b), Lac (d) Glu (f) and Man (h) capped SiNPs in water. ........... 116
Figure 4.3: EDX spectroscopy of (a) man, (b) Gal, (c) Glu, and (d) Lac capped SiNPs............ 119
Figure 4.4: FTIR spectra of (a) Amine-terminated SiNPs, (b) Starting material acid
sugar c, (c) Intermediate OAc-carbohydrate capped SiNPs, and (d) Pure
carbohydrate capped SiNPs in the solid state (32 scans, 2 cm -1
resolution). .................................................................................................................................... 120
Figure 4.5: 13C NMR spectra of (a) starting material 2c in CDCl3, (b) Intermediate
OAc-man capped SiNPs in CDCl3, and (c) Pure man capped SiNPs in D2O. ......... 123
Figure 4.6: 13C NMR spectra of starting material 2c, Intermediate OAc-man capped
SiNPs and pure man capped SiNPs, expanded from the region of 167-176
pmm. ................................................................................................................................................. 123

XVII
Figure 4.7: XPS survey spectrum from the film of gal capped SiNPs deposited on a
gold substrate ............................................................................................................................... 124
Figure 4.8: XPS core-level spectra of carbohydrate capped SiNPs obtained at 20C to
normal emission: the dotted line is experimental data that is fitted with
various mixed components (a) Si2p, (b) C1s, (c) O1s, and (d) N1s at 400
eV. ...................................................................................................................................................... 125
Figure 4.9: The dotted line shows the absorption spectrum of man capped SiNPs in
water; the solid line shows the photoluminescence spectrum of man
capped SiNPs in water under an excitation of 360 nm. The inset photo
shows the fluorescence from Man capped SiNPs in water under a UV
lamp. ................................................................................................................................................. 126
Figure 4.10: The dotted line shows the absorption spectrum in water; the solid line
shows the photoluminescence spectrum of (a) gal capped SiNPs, (b) glu
capped SiNPs and (c) lac capped SiNPs in water under an excitation of
360 nm ............................................................................................................................................. 127
Figure 4.11: The photoluminescence spectrum of man capped SiNPs in the dry state
under an excitation of 360 nm. The inset photo shows the fluorescence
from a solid sample of man capped SiNPs under a UV lamp. .................................... 128
Figure 4.12: Quantum yield measurement of mannose capped SiNPs: (a) Absorption
and (b) emission spectra obtained for different concentrations of man
capped SiNPs, (c) Scatter plot of integrated intensity (area under
emission spectrum) against absorbance at 360 nm. .................................................... 130
Figure 4.13: Quantum yield measurement of galactose capped SiNPs: (a) Absorption
and (b) emission spectra obtained for different concentrations of gal
capped SiNPs, (c) Scatter plot of integrated intensity (area under
emission spectrum) against absorbance at 360 nm. .................................................... 131
Figure 4.14: Quantum yield measurement of glucose capped SiNPs: (a) Absorption
and (b) emission spectra obtained for different concentrations of glu
capped SiNPs, (c) Scatter plot of integrated intensity (area under
emission spectrum) against absorbance at 360 nm. .................................................... 132
Figure 4.15: Quantum yield measurement of lactose capped SiNPs: (a) Absorption
and (b) emission spectra obtained for different concentrations of lac
capped SiNPs, (c) Scatter plot of integrated intensity (area under
emission spectrum) against absorbance at 360 nm. .................................................... 133
Figure 4.16: Schematic representation of the fluorophore – spacer – receptor format
of PET system (top) and the analogous Gal receptor conjugation – spacer
– SiQDs. ............................................................................................................................................ 134

XVIII
Figure 4.17: pH effect of carbohydrate capped SiNPs by emission using an excitation
wavelength at 360 nm. (a) man capped SiNPs, (b) gal capped SiNPs, (c)
glu capped SiNPs and (d) lac capped SiNPs. .................................................................... 135
Figure 4.18: Ageing effect of carbohydrates capped SiNPs measured by PL using an
excitation wavelength 360nm. (a) man capped SiNPs, (b) glu capped
SiNPs, (c) gal capped SiNPs and (d) lac capped SiNPs in water. .............................. 136
Figure 4.19: Ageing effect of Man capped SiNPs in the dry state measured by PL using
an excitation wavelength 360 nm. ....................................................................................... 137
Figure 4.20: Graphical representation of agglutination of carbohydrate capped SiNPs
by Con A tetramer in water. .................................................................................................... 138
Figure 4.21 (a) Aggregations of man capped SiNPs and (b) gal capped SiNPs with Con
A as monitored by PL spectroscopy. (c) TEM image of man capped SiNPs
after addition of Con A. ............................................................................................................. 139
Figure 4.22: PL of amine terminated SiNPs upon addition of ConA with time ......................... 140
Figure 4.23: Fluorescence images inside living MCF-7 cancerous cells: (a) control; (b)
fluorescence from Man-capped SiNPs inside the cells after 48 h
incubation; (c) after 48 h Lysotracker stain; (d) merged images. Pictures
were taken on live cells using a Leica fluorescence microscope. ............................ 141
Figure 4.24: SEM images of (a) glucose, (b) galactose, (c) lactose and (d) mannose
capped SiNPs crystals................................................................................................................ 143
Figure 4.25: HRTEM image of glucose capped SINPs crystal. .......................................................... 144
Figure 4.26: EDX analysis (left) and SEM images (right) of carbohydrate capped SiNP
crystals. (a) glu capped SiNP, (b) lac capped SiNPs, (c) man capped SiNPs
and (d) gal capped SiNPs. ........................................................................................................ 145
Figure 4.27: Mapping spectrum over an area of galactose capped SiNPs showing 2D
and 3D spectrum. Red represents high intensity and blue represents low
intensity along with video mapping image area. The 3D mapping area
was selected from the amide bonding region from 1765 cm-1 to 1580 cm-1.
............................................................................................................................................................ 147
Figure 4.28: FTIR spectrum of gal capped SiNPs crystals and starting material acid
galactose ......................................................................................................................................... 147
Figure 4.29: Mapping spectrum over an area of mannose capped SiNPs showing 2D
and 3D spectrum. Red represents high intensity and blue represents low
intensity along with video mapping image area. The 3D mapping area
was selected from the amide bonding region from 1685 cm-1 - 1593 cm-1. ....... 148

XIX
Figure 4.30: FTIR spectrum of man capped SiNPs crystals and starting material acid
mannose .......................................................................................................................................... 148
Figure 4.31: Mapping spectrum over an area of mannose capped SiNPs showing the
distribution of Man capped SiNPs in 3D and 2D plot along with video
image of the area mapped out of man capped SiNPs. The red represents
high intensity, and blue represents low intensity. ........................................................ 150
Figure 4.32: Mapping spectrum over an area of glucose capped SiNPs showing 3D
and 2D mapping. Red represents high intensity and blue represents low
intensity along with video mapping image area. ........................................................... 151
Figure 4.33: Mapping spectrum over an area of lactose capped SiNPs showing the
distribution of lac capped SiNPs in 3D and 2D plot along with video image
of the area mapped. The red represents high intensity, and blue
represents low intensity. ......................................................................................................... 152
Figure 5.1: Stability of (a) Gal, (b) man, (c) Glu and (d) Lac-capped SiNPs in DMEM
media at various time points. ................................................................................................. 165
Figure 5.2: Stability of (a) Gal, (b) man, (c) Glu and (d) Lac-capped SiNPs in RPMI
media at various time points. ................................................................................................. 166
Figure 5.3: Stability of (a) Gal, (b) man, (c) Glu and (d) Lac-capped SiNPs in MMR
media at various time points. ................................................................................................. 167
Figure 5.4: MTT graph of carbohydrate capped SiNPs in A549 cell lines at various
concentrations.............................................................................................................................. 168
Figure 5.5: MTT graph of carbohydrate capped SiNPs in MDCK cell lines at various
concentrations.............................................................................................................................. 169
Figure 5.6: MTT graph of carbohydrate capped SiNPs in HHL5 cell lines at various
concentrations.............................................................................................................................. 169
Figure 5.7: IC50 of amine-terminated SiNPs in HeLa cells. ................................................................. 171
Figure 5.8: Effect of carbohydrate capped SiNPs on cell morphology in cancerous cell
line A549 (Lung cancer) and non-cancerous cell lines MDCK (canine
kidney) and HHL5 (human immortalized hepatocytes). ............................................ 172
Figure 5.9: (b) - (f) representative range of Xenopus embryos exposed to a highest
concentration of carbohydrate capped SiNPs 200µg/mL (a) control, (b)
gal capped SiNPs, (c) Man capped SiNPs, (d) Glu capped SiNPs, (e) Lac
capped SiNPs and (f) Amine-terminated SiNPs. ............................................................. 174
Figure 5.10: Graph representing the total Xenopus embryos at 200 g/mL of conc. of
NPs and classified as percentage of dead, having abnormalities or no
abnormalities at stage 38. ....................................................................................................... 175

XX
Figure 5.11: Uptake efficiency of carbohydrate capped SiNPs in cancer cells (A549,
SK-Mel and MCF-7) and non-cancerous cells (MDCK, HHL5) at various
incubation times (a) 24, (b) 48 and (c) 72 hrs. Collective results are
normalized to untreated control cells, 24, 48 and 72 hours. Values are
mean ± S.D of the results from three independent experiments. ........................... 177
Figure 5.12: Time dependent uptake efficiency of carbohydrate capped SiNPs in
cancer cells (A549, SK-Mel and MCF-7) and non-cancerous cells (MDCK,
HHL5) at incubation time of 24, 48 and 72 hrs. Collective results are
normalized to untreated control cells, 24, 48 and 72 hours. Values are
mean ± S.D of the results from three independent experiments. ........................... 179
Figure 5.13: Time dependent uptake efficiency of carbohydrate capped SiNPs in SK-
Mel cells at various incubation times of 1, 3, 6, 24, 48 and 72 hrs.
Collective results are normalized to untreated control cells. Values are
mean ± S.D of the results from three independent experiments. ........................... 180
Figure 5.14: Uptake efficiency of carbohydrate capped SiNPs in SK-Mel cell line at (a)
4°C and (b) 37°C: Control-black, Gal-red, Man-blue, Glu-purple, Lac-
orange at concentration of 200µ g/mL. ............................................................................. 181
Figure 5.15: Uptake efficiency of carbohydrate capped SiNPs in SK-Mel cells at 4°C
(Red) and 37°C (Blue) presented as a percentage of untreated control
cells. Values are mean ± S.D of the results from three independent
experiments. .................................................................................................................................. 181
Figure 5.16: Fluorescence images of HHL5 cells incubated with gal capped SiNPs for
24 hours. (a) Control (without NPs) and (b) HHL5 cell with gal capped
NPs. Red fluorescence from actin staining, blue from DAPI and green
fluorescence from the Gal capped SiNPs. .......................................................................... 182
Figure 5.17: Fluorescence images of A549 cells incubated with gal capped SiNPs for
24 hours. (a) Control (without NPs) and (b), (c) and (d) A549 cell with
gal capped SiNPs. Red fluorescence from actin staining, blue from DAPI
and green fluorescence from the Gal capped SiNPs ..................................................... 183
Figure 5.18: Fluorescence images of A549 cells incubated with gal capped SiNPs for
24 hours. (a) Control (cells without NPs) and (b) cells treated with NPs.
Red fluorescence from LysoTracker-red and green fluorescence from the
Gal capped SiNPs. ........................................................................................................................ 183
Figure 5.19: Fluorescence confocal images of A549 cells incubated with gal capped
SiNPs for 24 hours. (a) Control (cells without NPs) and (b) A549 cell with
NPs. Red fluorescence from Phalloidin red, blue from DAPI and green
fluorescence from the Gal capped SiNPs ........................................................................... 184
Figure 5.20: FTIR spectrum from MCF-7 cells stimulated with mannose capped SiNPs ...... 185

XXI
Figure 5.21: Mapping spectrum over an area of MCF-7 cells showing the distribution
of man capped SiNPs. The red represents high intensity, blue represents
low intensity.................................................................................................................................. 186
Figure 6.1: Schematic representation of SiNPs encapsulated mannose functionalized
drug delivery system. ................................................................................................................ 197

XXII
List of schemes:
Scheme 2.1: Reaction mechanism of H-terminated porous SiNPs formed by
electrochemical etching reproduced from Lehmann & Gösele (1991).7 ................. 42
Scheme 2.2: Hydrosilylation reaction by Chalk-Harrod and Modified-Chalk-Harrod
mechanisms. ..................................................................................................................................... 45
Scheme 3.1: Synthesis of Amine-terminated SiNPs using thermally induced
hydrosilylation. ............................................................................................................................... 74
Scheme 3.2: Functionalization of H-terminated SiNPs with allylamine using Pt
Catalyst. .............................................................................................................................................. 76
Scheme 4.1: Schematic representation to synthesize carbohydrate capped SiNPs
from hydrosilylation reaction. ............................................................................................... 104
Scheme 4.2: Acetylation of carbohydrates derivatives. ...................................................................... 105
Scheme 4.3: Acetylation of Lactose sugar. ................................................................................................ 105
Scheme 4.4: Allylation reaction of carbohydrates derivatives ........................................................ 105
Scheme 4.5: Allylation reaction of Lactose heptaacetate. .................................................................. 106
Scheme 4.6: Attempted Hydrosilylation reaction of carbohydrates derivatives. .................... 106
Scheme 4.7: TBDMS protection to carbohydrate derivative. ........................................................... 107
Scheme 4.8: Attempted synthesis of gal capped SiNPs by protecting with TBDMS ................ 107
Scheme 4.9: Synthesis of Galactose capped SiNPs using Pt catalyst ............................................. 107
Scheme 4.10: Schematic Representation of Synthesis of D-Mannose Capped SiNPs ............. 109
Scheme 4.11: Schematic representation of Galactose, Glucose and Lactose capped
SiNPs synthesized in this work. ............................................................................................ 110
Scheme 4.12: Oxidation of carbohydrate derivatives .......................................................................... 111
Scheme 4.13: Oxidation of Lactose derivative ........................................................................................ 111
Scheme 4.14: Reaction mechanism of formation of carbohydrate capped SiNPs using
EDC, NHS coupling reagent and amine-terminated SiNPs. ........................................ 113
Scheme 5.1: Schematic representation of synthesis of carbohydrate capped SiNPs ............. 163

XXIII
List of Tables:
Table 3.1: Surface morphology of Si chips etched at various current and time setting ........... 73
Table 3.2: Synthesis of amine-terminated SiNPs by changing reaction parameters ................. 77
Table 3.3: shows the molecular bonding information of amine-terminated SiNPs. .................. 83
Table 3.4: Quantum yields of amine-capped SiNPs in water solutions of different pH
values and PBS expressed as the percentage of photons emitted per
photon absorbed, using quinine sulphate as standard reference .............................. 92
Table 4.1: DLS data of carbohydrates capped SiNPs in water (± is repeatability) .................. 115
Table 4.2: Zeta-potential of carbohydrates capped SiNPs in water ............................................... 118
Table 4.3: Infra-red band analysis of carbohydrates capped SiNPs .............................................. 121
Table 4.4: Quantum Yields of carbohydrate Capped SiNPs in Water as the Percentage
of Photons Emitted per Photon Absorbed, Using Quinine Sulphate as
Standard Reference .................................................................................................................... 129
Table 5.1: Diameter of carbohydrate capped SiNPs by DLS in DMEM, RPMI and MMR
media (± repeatability) ............................................................................................................. 165

XXIV
Abbreviations:
AFM Atomic Force Microscopy
ASGP-R Asialoglycoprotein Receptor
ATR Attenuated Total Reflectance
a.u Abbreviated Units
AuNP Gold Nanoparticle
CDCl3 Deuterated chloroform
CdSe Cadmium Selenide
CdTe Cadmium Telluride
CO2 Carbon Dioxide
Con A Concanavalin A
CT Cholera Toxin
DAPI 4’,6-diamidino-2-phenylindole
DCC N,N'-Dicyclohexylcarbodiimide
DCM Dichloromethane
DI Deionized Water
DLS Dynamic Light Scattering
DMEM Dulbecco’s Modified Eagle Medium
DMSO Dimethylsulfoxide
DNA Deoxyribonucleic acid
ECACC European Collection of Cell Cultures
EDC 1-Ethyl-3-(3-dimethylaminopropyl)carbodiimide
EDX Energy Dispersive X-ray Spectroscopy
EMA Effective Mass Approximation
ESCA Electron Spectroscopy for Chemical Analysis
EtOAc Ethyl Acetate
EtOH Ethanol
FBS Foetal Bovin Serum
FTIR Fourier Transform Infrared Spectroscopy
FWHM Full Width at Half Maximum
HA-QD Hyaluronic Acid coated Quantum dot
H-terminated Hydrogen-terminated
H2O Hydrogen Oxide
HF Hydrofluoric Acid
HIV Human Immunodeficiency Virus
HNO3 Nitric Acid
H2PtCl6 Hexachloroplatinic Acid
HRTEM High Resolution Transmission Electron Microscope
H2SO4 Sulfuric Acid
IC50 Half Maximal Inhibitory Concentration
ITC Isothermal Titration Calorimetry
LEC Lymphatic Endothelial Cells
LiAlH4 Lithium Aluminium Hydride
LYVE-1 Lymphatic Vessel Endothelial Receptor 1

XXV
MGNP Magnetic Glyco-nanoparticle
MMR Marc's Modified Ringers
MRI Magnetic Resonance Imaging
MTT 3-(4,5-dimethylthiazol-2-yl)-2,5-diphenyltetrazolium bromide
NaCl Sodium Chloride
NF Nieuwkoop and Faber
NHS N-Hydroxysuccinimide
NaHCO3 Sodium Bicarbonate
NaOH Sodium Hydroxide
Na2SO4 Sodium Sulfate
nm Nanometer
NMR Nuclear Magnetic Resonance Spectroscopy
NP Nanoparticle
OAc Acetate
PBS Phosphate Buffered Saline
PET Photoinduced Electron Transfer
PL Photoluminescence
P-Si Porous Silicon
Pt Platinum Catalyst
QD Quantum Dots
QY Quantum Yield
RES Reticuloendothelical System
RPMI Roswell Park Memorial Institute medium
S.D. Standard Deviation
Si Silicon
SiCl4 Silicon Tetrachloride
SiNP Silicon Nanoparticle
SiO2 Silicon Dioxide
SiQD Silicon Quantum Dot
SPR Surface Plasmon Resonance
SR-FTIR Synchrotron Radiation Fourier transform infrared Spectroscopy
TBDMS tert-Butyldimethylsilyl
TEM Transmission Electron Microscopy
UV Ultra Violet
UV-vis Ultra Violet-Visible
Wt Weight
w/v Weight to Volume Ratio
XPS X-ray Photoelectron Spectroscopy
ZnS Zinc Sulphide

1
1 Introduction
Nanotechnology will change the world. It will affect almost any aspect of our lives:
medicines we use, power of our computers, the energy supplies we require, the food
we eat, the cars we drive, the buildings we live in and the clothes we wear.”
P. Holister
1.1 Nanotechnology
Nanotechnology is the promising interdisciplinary field, which involves biological,
chemical, physical and engineering studies of nano-sized objects (1-100 nm scale, Figure
1.1).1 The recorded history of nanotechnology is generally understood to have begun in
December 1959 when physicist Richard Feynman gave a speech, “There's Plenty of Room at
the Bottom” (Feynman 1959), at an American Physical Society meeting at the California
Institute of Technology in which he identified the potential of nanotechnology.2
Figure 1.1: The figure depicts the sizes of nanoparticles in relation to other biological objects.
Nanotechnology is a revolutionary new approach towards the construction and use
of functional structures designed from atomic or molecular scale with at least one
characteristic dimension measured in nanometers. In other words it is concerned with the
study of nano-meter sized objects (1-100 nm). As the size of a material decreases from bulk
to the range of about 1 to 100 nanometers, the object displays physical attributes
substantially different from those displayed by either atoms or bulk materials. One of the
most exciting and challenging aspects of the nanomaterial is the role which quantum
mechanics plays within it.3, 4 Quantum phenomena are, of course, the ultimate basis of atoms
2
and molecules, but are largely hidden behind classical macroscopic matter and structures.
The real breakthrough in nanoscience was the invention of the Scanning Tunneling
Microscope (STM).5 This invention allowed an entrance into the nano world by direct
observation of nanostructures. Since then, this field is blossoming: knowledge, creativity and
futuristic visions of scientists of different profiles gather to create and study new nano-
objects, of which many have already found applications in various fields of medicine6, 7 and
technology.8
1.1.1 Nanotechnology in Ancient History
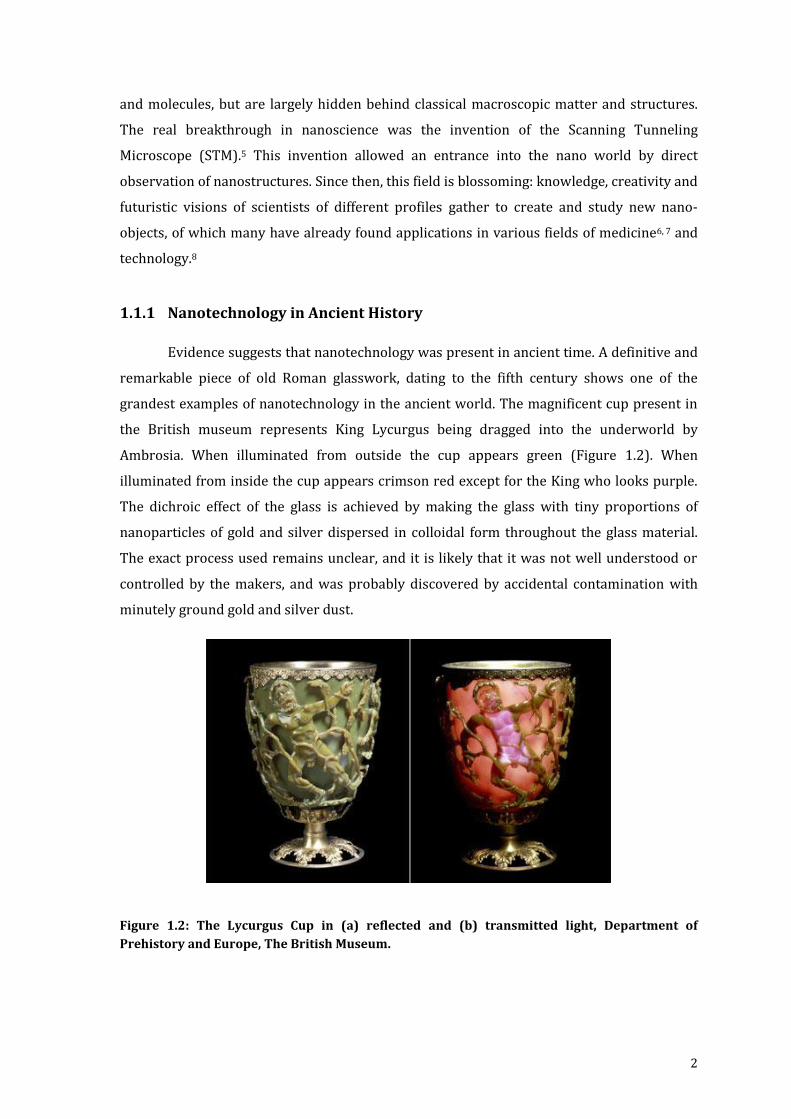
Evidence suggests that nanotechnology was present in ancient time. A definitive and
remarkable piece of old Roman glasswork, dating to the fifth century shows one of the
grandest examples of nanotechnology in the ancient world. The magnificent cup present in
the British museum represents King Lycurgus being dragged into the underworld by
Ambrosia. When illuminated from outside the cup appears green (Figure 1.2). When
illuminated from inside the cup appears crimson red except for the King who looks purple.
The dichroic effect of the glass is achieved by making the glass with tiny proportions of
nanoparticles of gold and silver dispersed in colloidal form throughout the glass material.
The exact process used remains unclear, and it is likely that it was not well understood or
controlled by the makers, and was probably discovered by accidental contamination with
minutely ground gold and silver dust.
Figure 1.2: The Lycurgus Cup in (a) reflected and (b) transmitted light, Department of
Prehistory and Europe, The British Museum.
3
1.2 Semiconductor Nanoparticles
Semiconductor nanoparticles (NPs), also referred to as Quantum dots (QDs), have
attracted a lot of interest from interdisciplinary areas of science due to their unique optical,
electronic and mechanical properties that differ from their bulk counterparts. QDs were first
fabricated in the 1980s by Louis E. Brus9 and the unique properties of these special nano-
structures attracted interest from many fields.10-12 Nanoparticles with diameters in the
range of 1 nm to 20 nm exhibit unique physical properties that give rise to many potential
applications in fields such as nonlinear optics, luminescence, electronics, catalysis, solar
energy conversion and optoelectronics. Two essential factors, related to the size of the
individual nanocrystal, are responsible for these unique properties. The first is the large
surface to volume ratio, and the second is the quantum confinement effect.3, 9 As the size of
the semiconductor material decreases the ratio of the number of surface atoms to those
contained within the NP volume increases, which leads to the surface taking a dominant role
in the properties of the material.13 Concurrently the band gap gradually increases due to the
quantum confinement effect. Thus the synthetic method, which controls the particle size,
determines the physical and electronic properties of the semiconductor NP produced, which
gives scientists the unique ability to change and control the electronic and chemical
properties of a semiconductor material.
1.2.1 Quantum Confinement Effect
The most striking property of semiconductor NPs is the large change observed in
their electronic and optical spectra as their sizes are reduced. This size dependent property
is generally called the quantum confinement effect.14 The word “confinement” refers to the
motion of randomly moving electrons as their motion in specific energy levels (discreteness)
is restricted and “quantum” reflects the atomic realm of particles. Therefore as the size of a
particle decreases up to the nano scale, the decrease in confining dimension makes the
energy levels discrete and this increases or widens up the band gap and ultimately the band
gap energy also increases. Since the band gap and wavelength are inversely related to each
other the wavelength decreases with decrease in size and this gives rise to the blue emission
by the particle. This is shown in figure 1.3, as the cluster size of a semiconductor decreases,
the gap between valence and conduction band increases.15-17

4
Figure 1.3: Schematic energy diagrams illustrating the state of a NP, in between a molecule and
a bulk semiconductor.
This phenomenon can be explained by the relationship between the position and
energy of an electron in both free and confined space. The energy or crystal momentum of
an electron in a bulk semiconductor can be precisely defined, while the position cannot.
However, in the case of a semiconductor NP, the momentum is no longer well defined as the
uncertainty in the electron position decreases. In the bulk semiconductor, series of nearby
transitions occur at slightly different energies, while in the NP, transitions will be
compressed by quantum confinement into a single, intense transition.15 The electron-hole
pair produced by the absorption of a photon is delocalized across the interior of the NP, and
recombination of the electron and hole causes emission of the photon. The
photoluminescence (PL) of the semiconductor NP is a result of such a phenomenon. Efficient
PL is only possible when the size of semiconductor NP is smaller than the exciton Bohr
radius of the bulk material.18 This radius controls how large a crystal must be before its
energy bands can be treated as continuous. In general, semiconductor show large size-
dependent changes in their spectroscopy below a radius of a few nm; the precise radius is
characteristic of the material: these quantum confinement effects set in for particle radii of 5
nm for silicon (Si) and for cadmium selenide (CdSe), a widely employed luminescent label.
Absorption of light in the bulk semiconductor promotes an electron to a higher energy
LUMO
HOMO
Conductionband
Valenceband
Ene
rgy
QDs (1-10 nm)
3Å
ΔE ΔE
BULKSEMICONDUCTOR

5
orbital and creates an unoccupied orbital at lower energy (a “hole”) which behaves as a
mobile positive charge. The lowest excited state of the solid can be pictured as consisting of
the electron orbiting the hole in a manner analogous to the hydrogen atom. However,
compared with the hydrogen atom, there are two important differences: the effective mass
of the hole is much less than that of the proton and the electrostatic interaction between the
electron and hole is screened by the intervening atoms in the solid. The radius of the
wavefunction describing the electron-hole pair (exciton) is therefore much larger (5 nm)
than the Bohr radius of hydrogen (0.053 nm). Therefore, the exciton Bohr radius defines
whether a crystal can be called a semiconductor quantum dot, or simply acts like a bulk
semiconductor.19
1.2.2 Core-shell Semiconductor Quantum Dots
It took nearly 16 years for the QDs to enter their new role as fluorescent probes,20-23
since the first directed synthesis of QDs.24 In order to achieve high stability and high-quality
QDs, it was essential to develop an efficient synthesis procedure. Following the initial
reports,3, 24 extensive research has been carried out in terms of developing a variety of Group
II-VI QDs.25 The research finally progressed to an advanced and commercial stage, with the
development of CdSe/ZnS/silane (Core/shell/coat) QDs. Nowadays, these stable,
multifunctional and highly bright QDs are used for a variety of in vitro and in vivo bioimaging
purposes.26-28 These core shell NPs consist of three segments, the first centre core (heart) is
CdSe, the second outer layer is the ZnS shell and the final coating is the silane layer. The
CdSe core is responsible for the PL and can be tuned by controlling the size in order to
achieve different colors across the visible region of the spectrum.29 The ZnS shell, is a high
band gap material desirable to stabilize the PL of the core and to provide a physical barrier
with the surrounding.30 The ultimate silane layer is necessary to reduce the toxicity of the
semiconductor materials and also to provide a hydrophilic interface with aqueous solutions.
It increases stability and can be subjected to subsequent functionalization.28
Different materials can be used for building core/shell/coat complex structures to
specifically adjust the emission wavelength of QDs from UV to IR, such as Group II-VI
compounds (ZnSe and CdTe 25, 31-35 or SnTe) and Group II-V materials (InP and GaAs).36-38

6
Figure 1.4: Schematic representation of core/shell/coat quantum dot.
However, these core/shell/coat QDs have some limiting factors regarding their
potential application range, such as large overall size and not least high elemental toxicity.
These properties restrict their use in cellular application, because the internalization
(cellular uptake) of small NPs is much more efficient. The intrinsic toxicity of Group II-VI
semiconductors is a major concern for application in any biological system.39, 40 Silane
coatings help to reduce this problem, but the porosity thereof is hard to control. Another
often used method for the coating of core/shell QDs is the use of various polymers. In this
case further specific functionalization is not important but the required reaction conditions
may interfere with the stability of the polymer coating. However such stabilized QDs are still
highly useful for novel solar cell and light-emitting diode applications.41, 42
In addition, long-term toxicity of waste materials after the use of such QDs is also a
concern. Considering the above described limiting factors there is certainly a great
opportunity (and huge commercial interest) for the development of a smaller, more
versatile, and less toxic class of luminescent QDs for use in biological and many other
applications.
1.2.3 Silicon Nanoparticles
Silicon (Si) nanoparticles (SiNPs) hold prominent interest, due to their high
chemical stability,43, 44 low inherent toxicity as compared to all Group II-VI nanoparticles,45
and their potential to make future nano-electronic and nano-photonic devices.46, 47 Most of
all Group II-VI QDs are known to have a direct band-gap transition, while bulk Si is an
indirect band-gap semiconductor. In this case the transition from the bottom of the
CdSecore
ZnS shell
Silane coat
Appendix
________________________________________________________________________
113
Appendix
Figure 1.1. Semiconductor energy levels.
Si
S
S
S
SS
S
Si
Si
Si
Si
Si
O
OH
O
O
O
O
O
O
O
O
OH
Si
Si
Si
Si
O
O
O
HO
NH2
SHOH
DNA
Figure 1.2. Sketch of core/shell/coat quantum dot and some possible functionalizations.

7
conduction band to the top of the valence band interrupts conservation of momentum and is
electronically forbidden.48, 49 The transition does occur, but only with phonon (a quantum of
lattice vibration) assistance,50-52 which is an indirect process with a low probability. Thus,
SiNPs tend to have a long PL lifetime and low PL efficiencies when compared to direct band-
gap semiconductors.53 PL mechanism in SiNPs can be explained by quantum confinement
effects, which was described in the previous section. Besides that, it is also dependent on
surface reconstruction54, 55 and surface termination56 of SiNPs. The Si atoms on the surface of
the NP adopt a significantly different geometry to the bulk lattice structure due to surface
reconstruction. These alterations can have a major impact on NP properties, particularly in
ultra-small SiNPs (i.e. 1-2 nm).54 The surface termination also has a big effect on the final
photophysical properties of SiNPs. In the case of a monohydride termination, each surface
atom has three Si-Si “back-bonds” and one Si-H bond, which gives a different set of bonding
constrains, as compared to dihydride termination.50, 57
1.2.4 Surface Functionalization of SiNPs
Due to the low stability of Si–H and Si–X (X = Cl, Br) bonds,58 H or X terminated-NPs
are extremely prone to oxidation in air. Further stabilization is a necessity and is usually
performed by reaction with alkyl-lithium salts59 or terminal alkenes,60 to provide very stable
Si-C linkages. In order to form the covalent bonding on planar or porous silicon surfaces
hydrosilylation reactions are often employed, in which surface Si-H61-64 or Si-X
(X=halogen)64,65 bonds add across terminal carbon-carbon double bonds. The reaction can
be initiated thermally,63, 65, 66 photochemically (with UV67 or visible light62, 68, 69) or by a
radical initiator,67, 70 alkyl- or aryl-carbanions71 and a variety of platinum72 and
triphenylcarbenium-based catalysts.73 Alkylation with Grignard or alkyl lithium reagents
occurs through nucleophilic attack by a carbanion on an electron-deficient Si atom, cleaving
Si-Si bonds to form Si-C bonds and silyl anion (Si-) species.74 The advantage of the
hydrosilylation reaction is that it occurs without breaking Si-Si bond which leads to an
adverse effect on optical properties and also on particle solubility.63 A very broad range of
compounds can be used to functionalize the surface and provide the desired stability by
using hydrosilylation reactions. For example, it has been demonstrated that attaching
terminating –COOH63 or –NH2 groups72, 75, 76 (Chapter 3) makes the NPs water soluble, while
using nonpolar groups at the end of the alkyl chain makes them soluble in nonpolar solvents.

8
1.3 Synthetic Strategies for SiNPs
Since the first bottom-up synthesis in 1992 in which SiNPs were prepared via the
reduction of SiCl4 and RSiCl3 with sodium,77 Several methods have been developed and
reported that produce stable and monodisperse SiNPs, as well as reproducible surface
chemistry, shape and size control, tunable optical properties, etc. Several reviews about the
synthesis and optoelectronic properties of SiNPs have been published.60, 78
These can be divided into two approaches:
Top-down, i.e. the reduction of bulk materials to nanometer-sized objects
Bottom-up, i.e. the assembly of Si atoms up to nanometer size.
In general, the produced Si nanocrystals are hydrogen or halogen-terminated, but
require a second surface passivation step to prevent the particle from oxidation and
subsequent degradation. The oxidation has a large influence on the optical properties, since
the initial luminescence originates from quantum confinements effects in non-oxidized
SiNPs, which shifts to luminescence effects originating from surface-state effects in oxidized
particles.53, 79, 80 Each of the individual methods has its own advantages and disadvantages
with respect of control of monodispersity, reaction yield, surface chemistry, shape, stability
and optical properties and are described below in more detail.
1.3.1 Top Down/ Bulk Reduction method
1.3.1.1 Electrochemical etching and sonication of silicon wafers
Leigh Canham81 was first to demonstrate that porous Si materials can have large PL
efficiency at room temperature. He used electrochemical and chemical dissolution methods
to produce mesoporous Si layers of high porosity, which exhibited visible red PL at room
temperature. Subsequently a few years later, Heinrich and co-workers82 electrochemically
etched n-type or p-type silicon wafers to form porous silicon by applying an electric
potential on a wafer upon soaking in a (1:1) HF:ethanol solution. After etching, the material
was ultrasonically dispersed to form suspensions of SiNPs. The resulting material was a
polydisperse colloidal solution of SiNPs with size 1 nm to m and was irregularly shaped.
Nayfeh and co-workers used this method to produce SiNPs with a very broad range of sizes
that could not be well controlled.83 In 1999, Wolkin et al.53 produced hydrogen terminated
SiNPs by electrochemical etching followed by photo-assisted stain etching of p-type Si
wafers. They demonstrated that depending on the size of the SiNP the PL of such SiNP could

9
be tuned from the near infrared to the ultraviolet. In the same year, Sweryda-Krawiec et al.84
produced colloidal solutions of SiNPs by sonicating porous Si wafers. During sonication, NPs
leached out from the porous Si network and dissolved in toluene. The SiNPs were then
modified by heating with 1-undecanol, 1-hexadecanol, and 1-octanol to obtain alcohol-
capped SiNPs of size 1-100 nm. In 2002, Belomoin and co-workers85 obtained H-capped
SiNPs as a family of discrete sizes (1.0, 1.67, 2.15, 2.9, and 3.7nm in diameter) using
electrochemical etching. The smallest four exhibited ultra-bright blue, green, yellow, and red
luminescence. Lie et al. in 200286 also produced alkyl-terminated SiNP by refluxing porous Si
in toluene solutions of alkenes. A hydrocarbon monolayer was formed at the SiNP surfaces
by hydrosilylation of alkene, which protected the SiNPs and solubilized them in organic
solvents. The size of the Si core of these particles was about 2.5 nm diameter and could
easily be re-dispersed in organic solvents.87, 88
1.3.1.2 Etching of Hydrosilsesquioxane/ Thermal decomposition
A relatively new and a straightforward method described by Veinot and co-
workers89-92 for preparing small quantities (ca 0.25g) of nc-Si/SiO2 and Fs-nc-Si that shows
luminescence in visible and near IR-regions of the electromagnetic spectrum. The bulk
preparation of nanocrystalline Si-SiO2 (nc-Si/SiO2) was carried out via straightforward
reductive thermal annealing of a well-defined molecular precursor, hydrogen silsesquioxane.
The method provides high yield and excellent purity and optical properties.
Figure 1.5: Thermal processing of hydrogen silsesquioxane (HSQ) for synthesizing silica NPs
/SiO2-like (nc-Si/SiO2) nanocomposites. Reproduced from Veinot’s et. al.89
1.3.1.3 Annealing of SiO Powders
A relatively new method described by Liu, Kimura and co-workers93, 94 involves
annealing SiO powders at 1000°C under ambient atmosphere, etching the annealed powders
with 10% HF and functionalizing the etched particles by common hydrosilylation. The

10
resulting SiNPs were polydisperse (5.1 ± 1.9 nm) but also had a significant amount of oxygen
on their surface. The advantage of this method is its low cost.
1.3.1.4 Laser ablation
Niu and co-workers synthesized SiNPs with a diameter of 4 nm at high rate 400-500
mg/h by using the pulsed laser ablation of a Si (100) wafer in an inert gas.95 Similarly,
Umezu and co-workers prepared SiNPs by laser ablation in He/H2 gas by pulsing a laser on a
Si single crystal. It was found that the higher the H2 gas pressures the higher the particle
crystallinity.96 Shiharata and co-workers performed a one-pot synthesis with Si wafer by
laser ablation in the presence of 1-octene, which effectively capped the NPs resulting in
octyl-terminated SiNPs. The diameter of the SiNPs ranged from 1 to 10 nm and the highest
fluorescence emission was found around 375 nm.97
1.3.1.5 High energy ball milling
Heintz and co-workers synthesized alkyl-capped SiNPs by milling silicon pieces. The
resulting particles were 5-10 nm in diameter and showed fluorescence emission around 450
nm.98 Recently, they developed a method to functionalize SiNPs with acids, aldehydes, and
alcohols.99 However, this functionalization is carried out via the oxygen atoms on the surface,
which renders them unavailable for further use and affects both their optical properties and
long-term stability.
1.3.1.6 Reactive Sputtering
In 1998 Furukawa and Miyasato100 successfully synthesized crystalline H-terminated
SiNPs materials using a reactive sputtering technique with a low substrate temperature of
~100K. The obtained SiNP had a wide optical band-gap of up to 2.4 eV. The structural
analysis showed that the materials consisted of small crystalline Si particles surrounded by
hydrogen atoms.
1.3.2 Bottom-up Synthetic Methods / Assembly Methods
1.3.2.1 Laser-Driven Pyrolysis
Swihart and co-workers modified a method in which silane is pyrolyzed (thermally
dissociated) by a CO2 laser beam.101 A flow of H2/He gas and temperature is used to tune the
reaction. By controlling the flow rate and the laser power the NP sizes can be controlled to a

11
certain extent and by employing higher temperatures (at least 850C) helps particle
nucleation. These particles required further etching with HF and HNO3 to remove the
surface oxidation layer and to reduce the size. The obtained NPs (up to 20-200 mg/h) have
an average diameter of 5 nm with a mixture of hydrogen- and oxygen-terminated Si atoms at
the surface. However, the photophysical properties did not remain constant, mainly due to
the significant degree of oxidation and the irregularity of the surface.101 The SiNPs were
further etched with 5% HF and thermally hydrosilylated with a series of alkyl- and ester-
termination which resulted in a much more stable photoluminescence.62, 102
1.3.2.2 Synthesis in supercritical fluids
Among others Korgel and co-workers have used the decomposition of organosilanes
(e.g. diphenylsilane) in solvents heated and pressurized above their critical points to build
SiNPs.103, 104 The reaction was performed in a continuous flow reactor, in octanol at 500C at
approximately 250 bar. The obtained SiNPs were monodisperse with an average diameter of
1.5 nm, but the surface coverage of alkoxy termination was only 50%.105 Adding hexane as a
co-solvent, thereby reducing the Si/octanol ratio, could increase the size of the NPs. The
same synthesis principle can be used to produce more polydisperse SiNPs with a diameter of
4.7 ± 1.4 nm.104 The drawback of the decomposition method is the lack of control of the
functionalization of the NPs. The same synthetic approach can be employed to produce Si
nanowires.103, 106, 107
1.3.2.3 Oxidation and Reduction in Solution
Various solution phase oxidation-reduction reactions have been developed and
extensively studied. Kauzlarich and co-workers made an extensive effort to synthesize SiNPs
using various solution routes. The first solution synthesis method was developed in 1996 by
Bley and Kauzlarich.108 They reacted Zintl compound KSi with silicon tetrachloride (SiCl4) to
fabricate crystalline SiNPs at ambient temperature. Conversely in their next paper they
reported several problems regarding the Zintle synthesis method, such as low yields and the
lack of size control due to the heterogeneous nature of the reaction mixture. In 2002, Liu and
Kauzlarich109 described a new synthetic route for the synthesis of hydrogen-terminated (H-
terminated) SiNPs by the initial reaction of the metal silicide with either SiCl4 or bromine
and subsequently with lithium aluminium hydride. These reactions produced H-terminated
SiNPs, which could be suspended in an organic solvent. A variety of other routes have been
investigated: such as oxidation of Mg2Si with Br2,59, 109 reduction of SiCl4 with Na-
naphthalenide110 to give stable SiNPs.

12
Figure 1.6: Various solution methods to synthesize SiNPs by oxidation and reduction reaction.
The size of the SiNPs can be controlled by changing the balance between growth and
nucleation speed through controlling several parameters such as temperature,
concentration of precursors and the choice of functionalizing ligands. Similar synthetic
methodology and principle can be used to synthesize GeNPs (2 nm size).111 The advantage of
these methods is their versatility, as they can also be used to synthesize doped SiNPs (with
Mn112 or P113) or mixed Si-Ge NPs.114 The obtained NPs initially terminated with halogen
atoms (Cl or Br) give an access for further functionalization using alkyllithium (R-Li)
compounds,59, 115 alkoxy groups (via reaction with alcohols)110, 116 or hydrogen atoms by
reduction with LiAlH4.109
Out of all these methods a few claim to provide partial control over the NP shape.
Particularly sodium naphthalenide has been proven useful for preparing free standing SiNPs
of various sizes and surface chemistry.117 The major drawbacks of this synthesis approach
are: the polydispersity of the obtained material (1-20 nm, and in the best case 3-6 nm), time-
consuming reaction conditions (~72 h per reaction), and the requirement of an extensive
purification protocol. FTIR analysis of isolated NPs shows, besides the characteristic C-H
bands, a significant degree of oxidation, which subsequently leads to red-tailed broad
emission features.

13
1.3.2.4 Synthesis in reverse micelles
In order to gain more control over the size and size distribution of SiNPs, Wilcoxon
and group developed a method to synthesize SiNPs in reverse micelles.118 Performing the
reaction in nanoreactors limits the size of the resulting SiNPs, and a narrower size
distribution is achieved. In this approach, an anhydrous compound (e.g. SiX4; X = Cl, Br or I)
is dissolved in the hydrophilic interior of a solution of micelles and nucleation and growth of
SiNPs are restricted to the micelle interior. Control of cluster size can be achieved by
variation of the micelles size, inter-micellar interactions and reaction chemistry. The
reduction of SiCl4 with LiAlH4 in nanoreactors, was carried out by Wilcoxon and
coworkers,118 resulting in SiNPs with a broad size distribution of 2-10 nm which exhibit a
highly structured optical absorption and photoluminescence across the visible range of the
spectrum. It was assumed that the obtained NP surfaces were hydride terminated, however,
no experimental evidence was provided. HRTEM and selected-area electron diffraction of
small samples were consistent with diamond lattice Si. Tilley et al.119 later used a variation of
such solution reduction to prepare very small quantities of small, relatively monodisperse,
freestanding SiNPs (d = 1.8 ± 0.2 nm). Recently, Rosso-Vasic et al.75 synthesized amine-
functionalised SiNPs using inverse micelles. The obtained SiNPs were stable over a wide pH
range (1–13) and high temperatures (120°C), and were suitable for bioimaging studies as
they were readily taken up by BV2 cells.
1.3.2.5 Plasma Processing
In 2005, Mangolini et al.120 presented a single-step continuous flow non-thermal
plasma process that produced luminescent SiNPs on time scales of a few milliseconds. The
luminescent SiNPs had diameters of 2-8 nm and process yields of 14–52 mg/h. In the same
year, Giesen et al.121 investigated the formation and growth of SiNPs by the addition of silane
to plasma gases (i.e. argon/hydrogen) in a microwave reactor. The SiNPs formed by this
approach were found to lie in the 5–8 nm range and contained crystalline Si.
1.4 Applications of Silicon Nanoparticles
SiNPs have attracted tremendous interest from the scientific community because of
their unique characteristics that differ from those of their bulk counterparts, such as novel
optical, catalytic, electronic, and mechanical properties.15, 122 At nanometer scales, silicon
exhibits visible photoluminescence because of the quantum confinement effect that can be
exploited for uses in electronic and photonic devices.47, 123 Indeed, silicon has several

14
advantages to be an ideal nanoparticle material such as size-dependent tunable light
emission,85, 104, 124 high brightness,125 and their great stability against photobleaching
compared to organic dye molecules used for bioimaging.72, 126 Moreover, their core consists
of non-toxic silicon, which has been further studied for SiNPs in particular,127, 128 whereas
the conventional group II-VI or III-V QDs often consist of the inherently toxic Cd, CdTe
ZnSe.40, 129 In general, group II-VI or III-V QDs are typically stabilized by attachment of non-
covalently bound organic molecules such as oleic acid, thiols or phosphine oxide
derivatives.130 This leaves them intolerant to many solvents, since the stability of such a
layer is highly dependent on the chemical environment, and these non-covalently attached
molecules can thus dissociate from the QDs and thereby cause them to precipitate.
Furthermore, a lot of effort has been invested in preventing leakage of the toxic Cd, Zn and
Se ions from the core of the group II-VI or III-V QDs by applying organic polymeric coatings,
since the small capping molecules are not sufficient.131 Next to the non-toxicity of the Si core,
the covalently attached organic monolayer tolerates a wide range of solvents. So far, fewer
applications with SiNPs have been developed than with group II-VI or III-V QDs, which is
most likely due to the lack of a method to synthesize well defined, functional SiNPs in large
amounts with relatively easy methods. Furthermore, in contrast to group II-VI or III-V QDs,
the SiNPs have an indirect bandgap, which is characterized by relatively low luminescence
efficiency. The combination of these properties opens a new avenue of applications of SiNPs
for optoelectronic and bioimaging purposes.
1.5 Biomedical Applications of Semiconductor Nanoparticles
Significant interest has arisen in the field of NPs during the last decade, in particular
towards biomedical applications. The integration of nanotechnology into the field of medical
science has opened new possibilities. Working with nanomaterials has allowed a better
understanding of molecular biology. As a consequence, there is the potential for providing
novel methods for the treatment of diseases which were previously difficult to target due to
size restrictions. For biomedical applications, the synthesis of biofunctionalized NPs is very
important, and it has recently drawn the attention of numerous research groups, making
this area constantly grow. Silicon nanoparticles and structures hold prominent interest in
various aspects of biomedical research. Their applications in drug delivery, cancer cell
diagnostics and therapeutics have been active fields of research over recent years.11, 132, 133

15
1.5.1 Cytotoxicity
In vitro studies have become an essential component in assessing NP toxicity since
they are a relatively rapid and cost-effective way of screening134; moreover, they restrict
animal use, as required by ethical issues. Although a large number of studies have been
performed with in vitro systems, yet there remain some serious obstacles as data on this
topic obtained by several groups are often contradictory. Multiple factors are responsible for
the differences found in toxicity studies; some might be related to particles sizes, shapes and
physicochemical surface properties, while others may relate to the cell lines used, and finally
one should consider differences in methodologies of the test itself. Cytotoxicity of the NPs
inside the cells can be determined by different assay.
Bright field microscopy can be used as a simple tool to visualize the cellular and
nuclear morphological changes in the cells; the majority of the cytotoxicity assays measure
the colorimetric changes upon cell death. These colorimetric methods are divided into two
categories including plasma membrane integrity measurements and mitochondrial activity
tests.129 For example, Trypan blue dye exclusion assay provides information of cell death by
showing dye staining on cells that were ruptured, while live cells remain colourless, and the
amount of cell death can be determined via light microscopy.135
Another method to determine the cytotoxicity is the MTT (3-(4,5- dimethylthiazol-2-
yl)-2,5-diphenyl tetrazolium bromide) assay, which measures the activity of the
mitochondrial dehydrogenase enzyme.136, 137 This enzyme present in living cells cleaves the
tetrazolium ring, which only occurs in living cells.138 MTT is pale yellow in solution but
produces an insoluble purple formazan product within live cells.
Another method to test the cytotoxicity of the cells uses the genotoxicity assay,
which tests the toxicity of NPs exposure on the genome by means of the COMET system. This
is the most widely used method able to detect both single- and double-stranded breaks of
DNA chains. In fact, if any DNA is damaged, the cell would produce a comet tail whose length
is proportional to the amount of damaged DNA. A DNA-specific dye such as propidium
iodide and 4',6-diamidino-2-phenylindole (DAPI) is used to visualize the comet. The amount
of DNA damage is indicated by the amount of DNA found in the tail.139
Other factors responsible for toxicity in the cells are the physical and chemical
properties of NPs. The overall size of the nanoparticles plays an important role to induced
toxicity. NPs sometimes show aggregation and morphological variation when dispersed in
water, therefore it is important to check their stability in biological media first. For size

16
analysis, either dynamic light scattering (DLS) or transmission electron microscopy (TEM) is
mostly used. For instance Lin et al.140 found that it is very important to control the
aggregation state in the cell culture medium. They studied two different sizes (15 nm and 46
nm) of NPs and found no difference, the reason being that both nanoparticles reached a
similar size due to aggregation in the culture medium. Therefore, NP aggregation state is a
critical parameter that needs to be controlled.
Another source of nanoparticle-induced cytotoxicity occurs when the NP is
composed of toxic materials that can be gradually released. Some examples of the
fluorescent semiconductor NPs that gradually release heavy metal ions such as Cd2+ from
CdSe or CdSe/ZnS quantum dots are well known.39, 40 Heavy metal ions are cytotoxic and
often show several pathways of cytotoxicity. Indeed, Cd2+ may induce hepatotoxicity,
immunotoxicity, and nephrotoxicity, apoptosis being a critical part of each toxicity type.141
Studies concerning Cd-induced hepatotoxicity show, for example, the relevance of direct and
indirect cytotoxic pathways.142 The direct pathway is caused by Cd2+ binding to sulfhydryl
groups on key mitochondrial molecules, thus damaging the mitochondria. The indirect
pathway, though, is assumed to occur via activation of Kupffer cells. Derfus and group
reported that the cadmium selenide (CdSe) core causes acute toxicity under certain
condition. However they also mention that CdSe NPs did not show cytotoxicity when
functionalized with mercaptoacetic acid under standard synthesis condition. The
cytotoxicity of green, yellow, and red light emitting mercapto-undecanoic acid-modified QDs
was investigated by Shiohara et al., using three types of cells: Vero cell, HeLa cell and
primary human hepatocyte. The results showed that the cell viability decreased with
increasing concentration of NPs. They proposed that SiNPs could be the new safer QDs143 to
eliminate cytotoxic effect. Kirchner and colleagues39 investigated the effect of different
organic coatings (i.e. mercaptopropionic acid) on QD cytotoxicity. Their results showed that
the zinc sulphide capping (ZnS) layer of a CdSe core-shell NP reduced the toxicity, which is
in agreement with the work of Derfus et al.40 They also found that embedding the particles in
a stable ligand shell dramatically reduces the release of Cd2+ ions. Thus, the cytotoxicity of
semiconductor NPs can be reduced when their cores are protected from degradation given
that the added coatings are biocompatible.
The cytotoxicity of group II-VI semiconductor NPs (e.g CdSe, Cadmium telluride
(CdTe), ZnS) is extensively studied as compared to SiNPs. The long-term cytotoxic effect of
porous silicon material on primary hepatocytes was explored by Chin et. al.144 The
attachment and spreading of primary hepatocyte on nanoporous silicon were compared
across a variety of culture conditions. He demonstrated that cells in all conditions remained

17
viable at comparable levels, suggesting that there were no long-term cytotoxic effects of
nanoporous silicon on primary hepatocytes. Alsharif et al.145 investigated the intracellular
internalization and toxicity of alkyl-capped silicon nanocrystals in human neoplastic and
normal primary cells. Their findings suggested no evidence of in vitro cytotoxicity when the
cells were exposed to the alkyl-capped nanocrystals. Thus, surface functionalized SiNPs
exhibit insignificant cytotoxicity and show great potential over ordinary semiconductor NPs
in biomedical research.
One in vivo study carried out by Sailor's group demonstrated that porous SiNPs
injected intravenously were accumulated mainly in mononuclear phagocytic system organs.
Within a few days the SiNPs were degraded in vivo into non-toxic products and removed
from the body through renal clearance.146
Consequently, Si nanoparticles show very low cytotoxicity taking care that all
potential sources of cytotoxicity are prevented efficiently.
1.6 Biomedical Applications of SiNPs
In order to employ NPs in biological applications, the particles have to be water
soluble, non-toxic, possess high luminescence quantum yield and should have the ability to
be labeled with targeting agents to direct the particles to specific tissues or areas inside cells.
SiNPs have substantial photoluminescence quantum yields, great stability against
photobleaching and low toxicity compared with heavy metals. In order to stabilize SiNPs in
water and in biological environment to prevent aggregation and precipitation, they require a
desirable surface functionalization.72 Several methods have been developed to functionalize
SiNPs to use them for biological applications. Perez et al.147 synthesized nanometric particles
from porous silicon film to investigate the growth behavior of B. subtilis and K. pneumoniae
bacterial strains. The different and particular behavior that each bacterium presents when
grown in a medium containing nanometric silicon particles supports the idea that these
particles can work well as a bacteriological sensor. Li and Ruckenstein87 synthesized poly-
acrylic acid terminated SiNPs for cell imaging. The SiNPs are water soluble, exhibited bright
fluorescence images and provided higher resistance to photobleaching than the commonly
used organic dyes. Warner et al.72 described a simple room-temperature synthesis for
producing water-soluble SiNPs that exhibited strong blue photoluminescence with a rapid
rate of recombination. They used these allylamine capped SiNPs to demonstrate bioimaging
in HeLa cells. The bright blue fluorescence from the SiNPs is distributed uniformly inside the

18
cytosol of the HeLa cells and shows the possibility of using these hydrophilic SiNPs as
chromophores in biological fluorescence imaging.
1.7 Glyconanoparticles for Biomedical Applications
Since the last decade, there has been an explosion in the synthesis, characterization
and applications of nanomaterials, which can potentially revolutionize the diagnosis and
treatment of diseases.148-151 The field is actively progressing towards using more specific and
targeted nano-therapies by gaining the knowledge at cellular and molecular level.
Tremendous advances have been made in recruiting sugar-functionalized nanocomposites
for biological applications by recognizing the important multi-faceted roles that
carbohydrates play in many biological systems (figure 1.6).149, 150, 152 Currently Glyco-
nanomaterials have attracted a great deal of attention owing to their multi-faceted
carbohydrate functionality, small size, biocompatibility, as well as their unique optical,
electronic and magnetic properties.
Figure 1.7: The concept of prospective uses of glyconanoparticles in biomedical applications.
Reproduced from Penadés et al.1

19
1.7.1 The “GLYCO” Perspective
Carbohydrates play a critical role in the process of cell recognition.11, 153, 154 Naturally
occurring carbohydrates, glycoproteins and glycolipids present at the surface of cells play
crucial roles in biological events, acting as recognition sites between cells. They can trigger
various phenomena such as cell growth, inflammatory responses to viral infections.
Carbohydrate-mediated interactions at the cell surface range from hormones, enzymes and
antibodies to bacteria, viruses and toxins. Surface-exposed carbohydrate moieties that are
characteristic of a given microbe may serve as key biomarkers for bacteria and pathogen
identification, diagnosis and vaccine development. Carbohydrates, as a detection platform,
have already demonstrated tremendous potential to achieve superior sensitivity and
selectivity.155, 156 At present, carbohydrate-functionalized glyconanomaterials are finding
many important applications in explaining carbohydrate protein interactions and cell-cell
communication.154, 157-160 Identifying, quantifying and imaging the carbohydrates,
glycoproteins and glycolipids are critical both for elucidating their biological function and
for the evaluation and design of therapeutics.
Despite all the developments, there are still several obstacles, which need to be
overcome in order to use the carbohydrates in diagnosing and therapeutics applications.
Carbohydrate-based molecular interactions have been shown to be generally weak and of
low affinity, but Nature seems to compensate these drawbacks with a multivalent receptor
ligand presentation.160, 161 Thus, a suitable platform is required to display carbohydrates in a
polyvalent system to increase the binding strength and selectivity. In the second challenge,
unlike the specific receptor interaction, there can be several receptors recognizing the same
carbohydrate ligand thus strategies need to be developed to differentiate these receptors.
The third challenge is to obtain pure carbohydrates for biological studies. Due to the
heterogeneity it is difficult to purify large quantities of oligosaccharides from natural
sources. Therefore, to realize the full potential of carbohydrates in biomedical applications
requires a multi-disciplinary approach.
1.7.2 The “NANO” Perspective
Nanomaterials can act as promising platforms for displaying carbohydrates for
biological recognition. Owing to their small size and large surface to volume ratio NPs can
enable higher capacity in receptor binding. Moreover functionalizing the NPs with multiple
carbohydrate ligands can potentially enhance the binding affinities of individual ligands to

20
their binding partners. Glyco-conjugated / bioconjugated nanoparticles have been utilized in
various fields of in vivo and in vitro work.
Penadés and co-worker provided excellent contributions to the field where they
investigated carbohydrate-carbohydrate interactions and carbohydrate-mediated cell–cell
adhesion processes. In their early report they demonstrated the synthesis of disaccharide
lactose (Gal (14)Glc1 - OR) and trisaccharide Lewisx (Lex-) Gal (14) [Fuc
(13) ] GlcNAc1-OR) to functionalize Gold NPs (AuNPs) as a multivalent ligand carrier for
studying Ca2+ mediated carbohydrate-carbohydrate interactions.162 They used different
hydrophobic and hydrophilic linkers to bind the carbohydrates to the gold core. Using TEM
they revealed the specific binding between Ca2+ and Lex-AuNPs as it resulted in self-
aggregation, while Lacto-AuNPs did not show any clustering. The method proved the
importance of the sugar structure in inducing aggregation. Later they studied the adhesion
forces between Lex antigens self-assembled on gold surfaces. They verified this phenomenon
using Atomic force microscopy (AFM).163 Furthermore they showed that Ca2+ mediated
aggregation of Lex-AuNPs was a slow but highly exothermic process, while in the case of
Lacto-AuNPs the heat evolved was very low and its thermal equilibrium was quickly
achieved. They proved this phenomenon by using surface plasmon resonance (SPR) and
isothermal titration calorimetry (ITC).164, 165 El-Boubbou synthesized Mannose capped (Man-)
Magnetic glyco-nanoparticles (MGNPs).166 They incubated Man-MGNPs with E. coli and
reported that within five minutes 65% of the E. coli ORN178 cells were removed from the
solution using a hand-held magnet (figure 1.7). Furthermore, in addition to Man-MGNPs,
they also synthesized Gal-MGNPs in order to overcome the challenge that different types of
bacteria may bind to the same carbohydrate with various affinities. Based on this they used
three different E. coli strains (ORN178, ORN208 and an environmental strain) and showed
that they were easily differentiated. Thus, they demonstrated that MGNPs present a unique
approach, which can be used not only for rapid pathogen detection, but also for strain
differentiation and efficient pathogen decontamination.

21
Figure 1.8: Schematic representation of E. coli strain ORN178 incubated with Man-MGNPs
followed by magnet mediated separation of detected bacteria, showing up to 88% of the
bacteria removed by this procedure.
In addition Syková et al.167 showed that Mannose-modified iron oxide NPs were
efficient probes for labeling stem cells.
The Cho group prepared superparamagnetic NPs coated with a galactose polymer
(Gal-SPIONs) (diameter ~ 25 nm)168 and applied them to target liver cells knowing that liver
cells (hepatocyte) contain the galactoside binding asialoglycoprotein receptor (ASGP-R)
which selectively binds to galactose. Using confocal microscopy studies they validated the
receptor-mediated endocytosis. Later they used these NPs in Vivo module by injecting into a
rat tail vein; the experiment showed a 75% T2 signal drop for rat liver by MRI, which was
more than twice the contrast change (36%) observed using control NPs without any
galactose.
Lin and co-workers169 synthesized polyvalent glyco-NPs (Man-, Glu- or Gal-AuNPs)
and proved the high affinity and specificity of multivalent carbohydrate-protein interactions.
They quantitatively analyzed the binding affinity with lectin Concanavalin A (Con A) using
surface plasma resonance. Later they reported the separation of carbohydrate binding
proteins from protein mixtures aided by the gold glyco-NPs as affinity probes. Furthermore,
using this approach, they determined the identity and the carbohydrate binding epitopes of
the proteins by mass spectrometry analysis.170
For studying NP-cell interactions, the Penadés groups reported the preparation of
gold and gold–iron NPs171 (Size 1.5-2.5 nm) functionalized with maltose (Malto), Glc
(Glucose) and Lactose (Lacto) and evaluated their biological effects.172 It was shown that
Lacto-NPs were taken up by endocytosis in a human fibroblast cell line without provoking
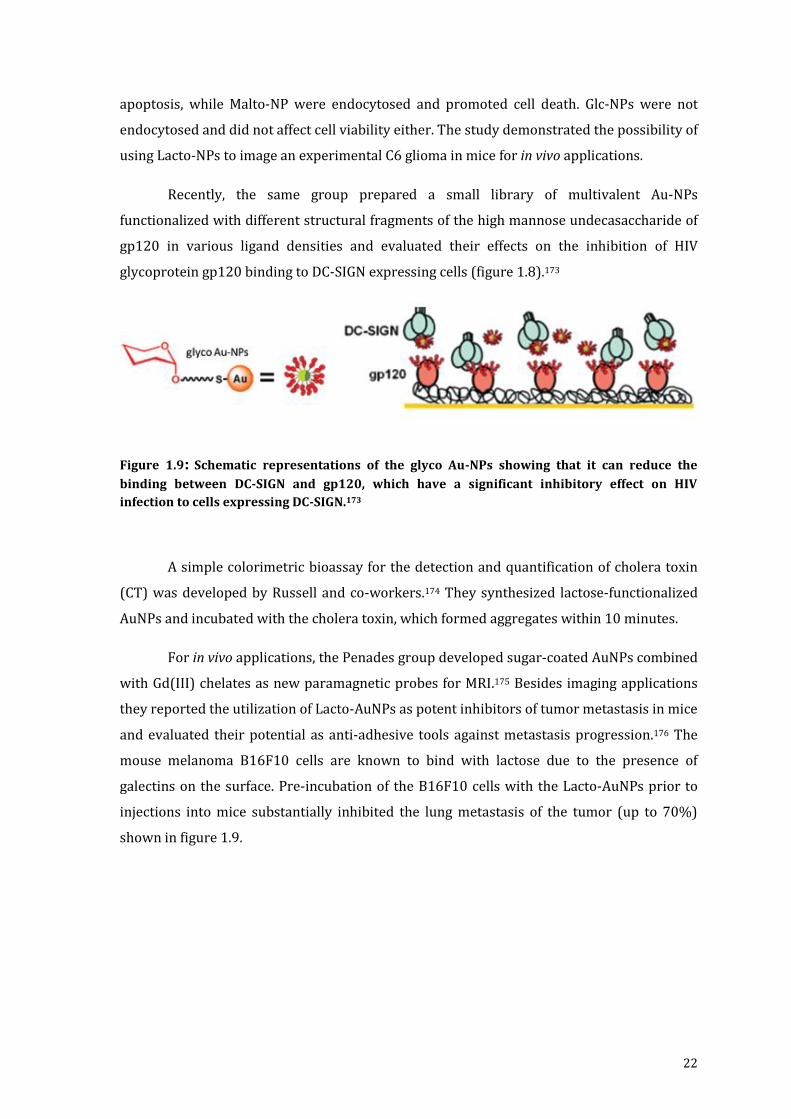
22
apoptosis, while Malto-NP were endocytosed and promoted cell death. Glc-NPs were not
endocytosed and did not affect cell viability either. The study demonstrated the possibility of
using Lacto-NPs to image an experimental C6 glioma in mice for in vivo applications.
Recently, the same group prepared a small library of multivalent Au-NPs
functionalized with different structural fragments of the high mannose undecasaccharide of
gp120 in various ligand densities and evaluated their effects on the inhibition of HIV
glycoprotein gp120 binding to DC-SIGN expressing cells (figure 1.8).173
Figure 1.9: Schematic representations of the glyco Au-NPs showing that it can reduce the
binding between DC-SIGN and gp120, which have a significant inhibitory effect on HIV
infection to cells expressing DC-SIGN.173
A simple colorimetric bioassay for the detection and quantification of cholera toxin
(CT) was developed by Russell and co-workers.174 They synthesized lactose-functionalized
AuNPs and incubated with the cholera toxin, which formed aggregates within 10 minutes.
For in vivo applications, the Penades group developed sugar-coated AuNPs combined
with Gd(III) chelates as new paramagnetic probes for MRI.175 Besides imaging applications
they reported the utilization of Lacto-AuNPs as potent inhibitors of tumor metastasis in mice
and evaluated their potential as anti-adhesive tools against metastasis progression.176 The
mouse melanoma B16F10 cells are known to bind with lactose due to the presence of
galectins on the surface. Pre-incubation of the B16F10 cells with the Lacto-AuNPs prior to
injections into mice substantially inhibited the lung metastasis of the tumor (up to 70%)
shown in figure 1.9.

23
Figure 1.10: The incubation of Lacto-AuNPs with mouse melanoma B16F10 cells prior to
intravenous inoculation in C57/Bl6 mice significantly reduced the lung metastasis of the
tumour. In comparison, the Glc-AuNPs were ineffective in reducing metastasis.176
Later in 2009 Mousa and co-workers reported the synthesis of heparin coated
AuNPs (HP-AuNPs).177 Heparin is a class of naturally occurring polysaccharide, which can
inhibit basic fibroblast growth factor-2 induced angiogenesis.178 They studied HP-AuNPs in a
mouse model where they demonstrated that HP-AuNPs have significantly higher anti-
angiogenesis efficiency compared with Glc-AuNPs, while control Au was lethal to the animal
at the same concentration.
In 2003 the Rosenzweig group reported the QDs protected with polysaccharide.179
They synthesized carboxymethyldextran and polylysine coated CdSe-ZnS QDs through
electrostatic interaction and demonstrated Con A had binding affinities with glycol-QDs.
Subsequently Fang and coworkers prepared CdSe-ZnS QDs terminated with β-N-
acetylglucosamine (GlcNAc) and Mannose through an in situ reduction and coating
procedure. They incubated these glycol-NPs with live sperm from mice, pigs and sea-
urchin.180 Interestingly, their results showed that GlcNAc captured QDs were found to be
concentrated at the sea-urchin sperm heads, while Man-coated QDs tended to spread over
the whole body of mouse sperm (figure 1.10). This was presumably due to the different
distribution of the GlcNAc and Man receptors on the sperm surface. Their work suggested
that glycol-NPs could be useful as fluorescent tags for monitoring cellular events.
Lungs from animals treatedWith B16F10 tumour cells No B16F10
No NPtreatment
Glc-AuNP(90 µM)
Lac-AuNP(90 µM)

24
Figure 1.11: Confocal image of glyconanoparticles upon incubation with sperm. (a) GlcNAc-
QDs was mainly found on the heads of sea-urchin sperm (scale bar=20 μm), and b) Man-QD
labelled the tail of mouse sperm.180
Furthermore the glyco- QDs are also used in in vivo detection. Kim and co-worker
reported the synthesis of hyaluronic acid coated QDs (HA-QDs).181 They demonstrated that
HA-QDs were able to selectively endocytose by lymphatic vessel endothelial receptor 1
(LYVE-1) over-expressing lymphatic endothelial cells (LEC) and HeLa cells, but not by LYVE-
1 negative human dermal fibroblasts. The binding between LYVE-1 and HA-QDs in mice was
confirmed by immunohistochemistry, where LYVE-1 and HA-QDs were found to co-localize
in mouse tissues. Additionally HA-QDs were also used to image liver in cirrhotic mice.182
Through in vitro assay the authors demonstrated that the HA-QDs were taken up more by
chronic liver diseased cells such as hepatic stellate cells (HSC-T6) and hepatoma cells
(HepG2), than normal hepatocytes (FL83B). They then administrated HA-QDs in cirrhotic
mice and observed the enhanced fluorescence from the liver. The clearance of the
fluorescence from the cirrhotic mouse liver was much slower than that from the normal
mice, allowing detection of the cirrhotic liver.
Later the Seeberger group reported the synthesis of Man, Gal, GalN (Galactosamine) -
capped PEGylated QDs to study in vivo liver imaging.153 They demonstrated that Gal- and
GalN-capped QDs were selectively taken up by hepatocellular carcinoma HepG2 cells via the
ASGP-R receptor.
By looking at the extensive work done on glyco-NPs it is clear that the affinity
between carbohydrates and receptors can be greatly improved through the multivalent
display of carbohydrates on nanomaterials. In order to fully appreciate the potential of

25
glyco-nanotechnology, especially for future clinical applications, better fundamental
knowledge of how NPs interact with biological systems is required. This can be achieved by
changing the parameters such as size, shape, surface charge, ligand type and ligand density.
Moreover, bio-distribution, clearance and long-term side effect/toxicity of
glyconanocomposites need to be established.
Silicon nanoparticles and structures hold prominent interest in various aspects of
biomedical research. Current fields of interest range from imaging, detection and sensing to
drug delivery and new therapeutic uses. This is in addition to the intrinsic electronic and
optical properties of the nanostructures. Their fluorescence signatures, high quantum
efficiency, size-dependent tunable light emission, high brightness and great stability against
photobleaching compared to organic dye molecules make them ideal tools for fluorescence
imaging. These properties have helped to establish silicon based nanoparticles in a swathe
of diagnostic and assay roles as fluorescent cellular markers.45, 183 Furthermore, silicon
exhibits a low inherent toxicity when compared with the heavy elements of several other
types of semiconductor quantum dots, which can pose significant risks to human health. The
overall combination of these properties of SiNPs opens up new avenues of applications in
optoelectronics and bioimaging.
When considering biomedical applications, surface functionalization of SiNPs is
essential in order to target them to specific disease areas and to allow them to selectively
interact with cells or biomolecules.184, 185 When capped with organic molecules SiNPs can
take their functionality and display a number of interesting additional properties, such as
increasing overall stability of NPs, increased solubility and preventing aggregation and
precipitation in a biological environment, all of which are important in biomedical
applications. The properties of nanoparticles can be controlled as a result of variation in
chemical synthesis methods. The organic shell located on the external part of the SiNPs
provides chemical functionality to the nanostructure and is thus responsible for solubility,
stability, charge effects and interactions with other molecules. By looking at the potential
application and development of SiNPs in biomedical fields, it is worth synthesizing
carbohydrate capped SiNPs. However, no such functionalization has been explored with
SiNPs.

26
1.8 Scope of This Thesis
This thesis consists of five chapters; a brief summary of each is given below.
This thesis deals with the development and optimization of a method for the
preparation of stable and monodisperse SiNPs, and their photophysical characterization. In
addition, it displays possible applications of SiNPs as well as the investigations into their
toxicity, specifically in the realm of bioimaging.
Chapter 1 gives a general introduction about semiconductor quantum dots and Si NPs, in
particular. It gives an overview about the variety of methods published so far that are used
for the production of SiNPs and the description of the origin of Si NPs luminescence. It also
gives an overview about the cytotoxicity and applications of the NPs in biomedical field.
Chapter 2 describes the methods for producing and functionalizing SiNPs such as amine-
terminated SiNPs and carbohydrate capped SiNPs. Also discussed are various physical and
chemical characterization techniques. In addition, the methods and materials used in the
biomedical studies of the particles are described.
In Chapter 3, the preparation of water-soluble amine functionalized silicon nanoparticles is
described. A facile method to synthesize highly stable amine-terminated SiNPs including
their photophysical characterization such as ultra violet-visible (UV-vis) spectroscopy
measurements are outlined and discussed. The surface chemical composition of amine-
terminated SiNPs was confirmed by Fourier Transform Infrared Spectroscopy (FTIR),
Nuclear Magnetic Resonance Spectroscopy (NMR) and X-ray Photoelectron Spectroscopy
(XPS). The size of amine-terminated SiNPs was examined using Transmission Electron
Microscope (TEM) and Dynamic Light Scattering (DLS) techniques. Moreover
photoluminescence (PL) and pH stability of the obtained SiNPs were studied.
The work described in this chapter has led to the following publication:
Ahire, J. H.; Wang, Q.; Coxon, P. R.; Malhotra, G.; Brydson, R.; Chen, R.; Chao, Y., Highly
Luminescent and Nontoxic Amine-Capped Nanoparticles from Porous Silicon: Synthesis and
Their Use in Biomedical Imaging. ACS Applied Materials & Interfaces 2012, 4 (6), 3285-3292.
Coxon, P. R.; Ahire, J. H.; Ashby, S., P.; Frogley, M., D.; Chao, Y.; Amine-terminated Nanoparticle
films: Pattern Deposition by a Simple Nanostencilling Technique and Stability Studies under X-
ray Irradiation. Physical Chemistry Chemical Physics 2014, 16, 5817-5823

27
Chapter 4 demonstrates the synthesis of highly stable and water-soluble carbohydrate
capped SiNPs. A simplified method is described to functionalize SiNPs with various
monosaccharide and disaccharide sugar moiety. The surface functionalization of
carbohydrate capped SiNPs is confirmed by FTIR, NMR, and energy dispersive X-ray
spectroscopy (EDX) studies. The photophysical and optical properties were measured by UV
and PL spectroscopy. The size of all NPs was measured by TEM, while the hydrodynamic
diameter and Zeta-potential were obtained by DLS. The biochemical activity of carbohydrate
capped SiNPs was tested with ConA as a target protein.
The work described in this chapter has led to the following publication:
Ahire, J. H.; Chambrier, I.; Mueller, A.; Bao, Y.; Chao, Y., Synthesis of d-Mannose Capped Silicon
Nanoparticles and Their Interactions with MCF-7 Human Breast Cancerous Cells. ACS Applied
Materials & Interfaces 2013, 5 (15), 7384-7391.
Chapter 5 deals with the application of carbohydrate capped SiNPs for selectively targeting
cancerous cells as well as for bioimaging purposes. All carbohydrate capped SiNPs are
studied by using several mammalian cell lines. All carbohydrate capped SiNPs proved to be
non-toxic inside normal mammalian cells and cancer cells, moreover they were found to be
highly stable in biological media. It was shown that carbohydrate capped SiNPs are taken up
selectively by cancerous cells rather than normal cells. All the SiNPs can be successfully used
for staining several cancer cell lines, as well as demonstrated receptor mediate endocytosis,
which could favor the development of nanomedicine in cancer treatment.

28
1.9 References
1. de la Fuente, J. M.; Penadés, S., Glyconanoparticles: Types, synthesis and applications in glycoscience, biomedicine and material science. Biochimica et Biophysica Acta (BBA) - General Subjects 2006, 1760 (4), 636-651.
2. Feynman, R., "There's plenty of room at the bottom" Seminar talk 1959.
3. Alivisatos, A. P., Semiconductor Clusters, Nanocrystals, and Quantum Dots. Science 1996, 271 (5251), 933-937.
4. Whitesides, G. M., Nanoscience, Nanotechnology, and Chemistry. Small 2005, 1 (2), 172-179.
5. Binnig, G.; Rohrer, H., Scanning tunneling microscopy. IBM J. Res. Dev. 2000, 44 (1-2), 279-293.
6. Iverson, N.; Plourde, N.; Chnari, E.; Nackman, G.; Moghe, P., Convergence of Nanotechnology and Cardiovascular Medicine. BioDrugs 2008, 22 (1), 1-10.
7. Nazem, A.; Mansoori, G. A., Nanotechnology Solutions for Alzheimer's Disease: Advances in Research Tools, Diagnostic Methods and Therapeutic Agents. Journal of Alzheimer's Disease 2008, 13 (2), 199-223.
8. Kaounides, L.; Yu, H.; Harper, T., Nanotechnology innovation and applications in textiles industry: current markets and future growth trends. Materials Technology 2007, 22 (4), 209-237.
9. Brus, L. E., Electron-electron and electron-hole interactions in small semiconductor crystallites: The size dependence of the lowest excited electronic state. The Journal of Chemical Physics 1984, 80 (9), 4403-4409.
10. Ntziachristos, V.; Tung, C.-H.; Bremer, C.; Weissleder, R., Fluorescence molecular tomography resolves protease activity in vivo. Nat Med 2002, 8 (7), 757-761.
11. Michalet, X.; Pinaud, F. F.; Bentolila, L. A.; Tsay, J. M.; Doose, S.; Li, J. J.; Sundaresan, G.; Wu, A. M.; Gambhir, S. S.; Weiss, S., Quantum dots for live cells, in vivo imaging, and diagnostics. Science 2005, 307 (5709), 538-544.
12. Gao, X.; Cui, Y.; Levenson, R. M.; Chung, L. W. K.; Nie, S., In vivo cancer targeting and imaging with semiconductor quantum dots. Nat Biotech 2004, 22 (8), 969-976.
13. Pickett, N. L.; O’Brien, P., Syntheses of semiconductor nanoparticles using single-molecular precursors. The Chemical Record 2001, 1 (6), 467-479.
14. Woggon, U.; Gaponenko, S.; Langbein, W.; Uhrig, A.; Klingshirn, C., Homogeneous linewidth of confined electron-hole-pair states in II-VI quantum dots. Physical Review B 1993, 47 (7), 3684-3689.
15. Nirmal, M.; Brus, L., Luminescence Photophysics in Semiconductor Nanocrystals. Accounts of Chemical Research 1999, 32 (5), 407-414.
16. Zorman, B.; Ramakrishna, M. V.; Friesner, R. A., Quantum Confinement Effects in CdSe Quantum Dots. The Journal of Physical Chemistry 1995, 99 (19), 7649-7653.
17. Rama Krishna, M. V.; Friesner, R. A., Quantum confinement effects in semiconductor clusters. The Journal of Chemical Physics 1991, 95 (11), 8309-8322.
18. Einevoll, G. T., Confinement of excitons in quantum dots. Physical Review B 1992, 45 (7), 3410-3417.

29
19. Kastner, M. A., Artificial Atoms. Print edition 1993, 46 (1), 24-31.
20. Wang, Y., Luminescent CdTe and CdSe Semiconductor Nanocrystals: Preparation, Optical Properties and Applications. Journal of Nanoscience and Nanotechnology 2008, 8 (3), 1068-1091.
21. Sharma, P.; Brown, S.; Walter, G.; Santra, S.; Moudgil, B., Nanoparticles for bioimaging. Advances in Colloid and Interface Science 2006, 123–126 (0), 471-485.
22. Santra, S.; Xu, J.; Wang, K.; Tand, W., Luminescent Nanoparticle Probes for Bioimaging. Journal of Nanoscience and Nanotechnology 2004, 4 (6), 590-599.
23. Hoshino, A.; Fujioka, K.; Oku, T.; Nakamura, S.; Suga, M.; Yamaguchi, Y.; Suzuki, K.; Yasuhara, M.; Yamamoto, K., Quantum Dots Targeted to the Assigned Organelle in Living Cells. Microbiology and Immunology 2004, 48 (12), 985-994.
24. Murray, C. B.; Norris, D. J.; Bawendi, M. G., Synthesis and characterization of nearly monodisperse CdE (E = sulfur, selenium, tellurium) semiconductor nanocrystallites. Journal of the American Chemical Society 1993, 115 (19), 8706-8715.
25. Liu, W.; Choi, H. S.; Zimmer, J. P.; Tanaka, E.; Frangioni, J. V.; Bawendi, M., Compact Cysteine-Coated CdSe(ZnCdS) Quantum Dots for in Vivo Applications. Journal of the American Chemical Society 2007, 129 (47), 14530-14531.
26. Pinaud, F.; Michalet, X.; Bentolila, L. A.; Tsay, J. M.; Doose, S.; Li, J. J.; Iyer, G.; Weiss, S., Advances in fluorescence imaging with quantum dot bio-probes. Biomaterials 2006, 27 (9), 1679-1687.
27. Michalet, X.; Pinaud, F.; Lacoste, T. D.; Dahan, M.; Bruchez, M. P.; Alivisatos, A. P.; Weiss, S., Properties of Fluorescent Semiconductor Nanocrystals and their Application to Biological Labeling. Single Molecules 2001, 2 (4), 261-276.
28. Gerion, D.; Pinaud, F.; Williams, S. C.; Parak, W. J.; Zanchet, D.; Weiss, S.; Alivisatos, A. P., Synthesis and Properties of Biocompatible Water-Soluble Silica-Coated CdSe/ZnS Semiconductor Quantum Dots. The Journal of Physical Chemistry B 2001, 105 (37), 8861-8871.
29. Dabbousi, B. O.; Rodriguez-Viejo, J.; Mikulec, F. V.; Heine, J. R.; Mattoussi, H.; Ober, R.; Jensen, K. F.; Bawendi, M. G., (CdSe)ZnS Core-Shell Quantum Dots:Synthesis and Characterization of a Size Series of Highly Luminescent Nanocrystallites. The Journal of Physical Chemistry B 1997, 101 (46), 9463-9475.
30. Little, R. B.; El-Sayed, M. A.; Bryant, G. W.; Burke, S., Formation of quantum-dot quantum-well heteronanostructures with large lattice mismatch: ZnS/CdS/ZnS. The Journal of Chemical Physics 2001, 114 (4), 1813-1822.
31. Liu, F.-C.; Cheng, T.-L.; Shen, C.-C.; Tseng, W.-L.; Chiang, M. Y., Synthesis of Cysteine-Capped Znx Cd1-x Se Alloyed Quantum Dots Emitting in the Blue-Green Spectral Range. Langmuir 2008, 24 (5), 2162-2167.
32. Yang, C. S.; Wang, J. S.; Lai, Y. J.; Luo, C. W.; Chen, D. S.; Shih, Y. T.; Jian, S. R.; Chou, W. C., Formation of a precursor layer in self-assembled CdTe quantum dots grown on ZnSe by molecular beam epitaxy. Nanotechnology 2007, 18 (38), 385602.
33. Thuy, U. T. D.; Liem, N. Q.; Thanh, D. X.; Protiere, M.; Reiss, P., Optical transitions in polarized CdSe, CdSe‚ZnSe, and CdSe/CdS/ZnS quantum dots dispersed in various polar solvents. Applied Physics Letters 2007, 91 (24), -.

30
34. Li, C. L.; Nishikawa, K.; Ando, M.; Enomoto, H.; Murase, N., Highly luminescent water-soluble ZnSe nanocrystals and their incorporation in a glass matrix. Colloids and Surfaces A: Physicochemical and Engineering Aspects 2007, 294 (1-3), 33-39.
35. Lee, H. S.; Park, H. L.; Kim, T. W., Formation mode of self-assembled CdTe quantum dots directly grown on GaAs substrates. Journal of Crystal Growth 2006, 291 (2), 442-447.
36. Ulloa, J. M.; Anantathanasarn, S.; van Veldhoven, P. J.; Koenraad, P. M.; Nötzel, R., Influence of an ultrathin GaAs interlayer on the structural properties of InAs/InGaAsP/InP (001) quantum dots investigated by cross-sectional scanning tunneling microscopy. Applied Physics Letters 2008, 92 (8), -.
37. Gong, M.; Duan, K.; Li, C.-F.; Magri, R.; Narvaez, G. A.; He, L., Electronic structure of self-assembled InAs / InP quantum dots: Comparison with self-assembled InAs/GaAs quantum dots. Physical Review B 2008, 77 (4), 045326.
38. Anantathanasarn, S.; Barbarin, Y.; Cade, N. I.; van Veldhoven, P. J.; Bente, E. A. J. M.; Oei, Y. S.; Kamada, H.; Smit, M. K.; Nötzel, R., Wavelength tunable InAs/InP(10 0) quantum dots in 1.55-μm telecom devices. Materials Science and Engineering: B 2008, 147 (2-3), 124-130.
39. Kirchner, C.; Liedl, T.; Kudera, S.; Pellegrino, T.; Muñoz Javier, A.; Gaub, H. E.; Stölzle, S.; Fertig, N.; Parak, W. J., Cytotoxicity of Colloidal CdSe and CdSe/ZnS Nanoparticles. Nano Letters 2004, 5 (2), 331-338.
40. Derfus, A. M.; Chan, W. C. W.; Bhatia, S. N., Probing the Cytotoxicity of Semiconductor Quantum Dots. Nano Letters 2003, 4 (1), 11-18.
41. Li, Y.; Rizzo, A.; Cingolani, R.; Gigli, G., White-light-emitting diodes using semiconductor nanocrystals. Microchim Acta 2007, 159 (3-4), 207-215.
42. Chaudhary, S.; Ozkan, M.; Chan, W. C. W., Trilayer hybrid polymer-quantum dot light-emitting diodes. Applied Physics Letters 2004, 84 (15), 2925-2927.
43. Canham, L., A glowing future for silicon. New Scientist 1993, 138, 23-37.
44. Brus, L., Squeezing light from silicon. Nature 1991, 353 (6342), 301-302.
45. Mayne, A. H.; Bayliss, S. C.; Barr, P.; Tobin, M.; Buckberry, L. D., Biologically Interfaced Porous Silicon Devices. physica status solidi (a) 2000, 182 (1), 505-513.
46. Chao, Y.; Houlton, A.; Horrocks, B. R.; Hunt, M. R. C.; Poolton, N. R. .; Yang, .; S iller, L., Optical luminescence from alkyl-passivated Si nanocrystals under vacuum ultraviolet excitation: Origin and temperature dependence of the blue and orange emissions. Applied Physics Letters 2006, 88 (26), -.
47. Froner, E.; Adamo, R.; Gaburro, Z.; Margesin, B.; Pavesi, L.; Rigo, A.; Scarpa, M., Luminescence of porous silicon derived nanocrystals dispersed in water: dependence on initial porous silicon oxidation. Journal of Nanoparticle Research 2006, 8 (6), 1071-1074.
48. Kovalev, D.; Heckler, H.; Polisski, G.; Koch, F., Optical Properties of Si Nanocrystals. physica status solidi (b) 1999, 215 (2), 871-932.
49. Kovalev, D.; Diener, J.; Heckler, H.; Polisski, G.; Künzner, N.; Koch, F., Optical absorption cross sections of Si nanocrystals. Physical Review B 2000, 61 (7), 4485-4487.
50. Allan, G.; Delerue, C.; Lannoo, M., Excitons in silicon nanostructures. Journal of Luminescence 1993, 57 (1-6), 239-242.

31
51. Allan, G.; Delerue, C.; Lannoo, M., Nature of Luminescent Surface States of Semiconductor Nanocrystallites. Physical Review Letters 1996, 76 (16), 2961-2964.
52. Delerue, C.; Allan, G.; Lannoo, M., Optical band gap of Si nanoclusters. Journal of Luminescence 1998, 80 (1-4), 65-73.
53. Wolkin, M. V.; Jorne, J.; Fauchet, P. M.; Allan, G.; Delerue, C., Electronic States and Luminescence in Porous Silicon Quantum Dots: The Role of Oxygen. Physical Review Letters 1999, 82 (1), 197-200.
54. Mitas, L.; Therrien, J.; Twesten, R.; Belomoin, G.; Nayfeh, M. H., Effect of surface reconstruction on the structural prototypes of ultrasmall ultrabright Si29 nanoparticles. Applied Physics Letters 2001, 78 (13), 1918-1920.
55. Puzder, A.; Williamson, A. J.; Reboredo, F. A.; Galli, G., Structural Stability and Optical Properties of Nanomaterials with Reconstructed Surfaces. Physical Review Letters 2003, 91 (15), 157405.
56. Belomoin, G.; Rogozhina, E.; Therrien, J.; Braun, P. V.; Abuhassan, L.; Nayfeh, M. H.; Wagner, L.; Mitas, L., Effects of surface termination on the band gap of ultrabright Si29 nanoparticles: Experiments and computational models. Physical Review B 2002, 65 (19), 193406.
57. Nayfeh, M. H.; Rigakis, N.; Yamani, Z., Photoexcitation of Si-Si surface states in nanocrystallites. Physical Review B 1997, 56 (4), 2079-2084.
58. David R. Lide, Handbook of Chemistry and Physics. 81 ed ed.; 2000.
59. Pettigrew, K. A.; Liu, Q.; Power, P. P.; Kauzlarich, S. M., Solution Synthesis of Alkyl- and Alkyl/Alkoxy-Capped Silicon Nanoparticles via Oxidation of Mg2Si. Chemistry of Materials 2003, 15 (21), 4005-4011.
60. Veinot, J. G. C., Synthesis, surface functionalization, and properties of freestanding silicon nanocrystals. Chemical Communications 2006, (40), 4160-4168.
61. Hua, F.; Erogbogbo, F.; Swihart, M. T.; Ruckenstein, E., Organically Capped Silicon Nanoparticles with Blue Photoluminescence Prepared by Hydrosilylation Followed by Oxidation. Langmuir 2006, 22 (9), 4363-4370.
62. Hua, F. J.; Swihart, M. T.; Ruckenstein, E., Efficient surface grafting of luminescent silicon quantum dots by photoinitiated hydrosilylation. Langmuir 2005, 21 (13), 6054-6062.
63. Rogozhina, E. V.; Eckhoff, D. A.; Gratton, E.; Braun, P. V., Carboxyl functionalization of ultrasmall luminescent silicon nanoparticles through thermal hydrosilylation. Journal of Materials Chemistry 2006, 16 (15), 1421-1430.
64. Sato, S.; Swihart, M. T., Propionic-Acid-Terminated Silicon Nanoparticles:Synthesis and Optical Characterization. Chemistry of Materials 2006, 18 (17), 4083-4088.
65. Scheres, L.; Arafat, A.; Zuilhof, H., Self-Assembly of High-Quality Covalently Bound Organic Monolayers onto Silicon. Langmuir 2007, 23 (16), 8343-8346.
66. Sieval, A. B.; Vleeming, V.; Zuilhof, H.; Sudhölter, E. J. R., An Improved Method for the Preparation of Organic Monolayers of 1-Alkenes on Hydrogen-Terminated Silicon Surfaces. Langmuir 1999, 15 (23), 8288-8291.
67. Linford, M. R.; Fenter, P.; Eisenberger, P. M.; Chidsey, C. E. D., Alkyl Monolayers on Silicon Prepared from 1-Alkenes and Hydrogen-Terminated Silicon. Journal of the American Chemical Society 1995, 117 (11), 3145-3155.

32
68. Stewart, M. P.; Buriak, J. M., Exciton-Mediated Hydrosilylation on Photoluminescent Nanocrystalline Silicon. Journal of the American Chemical Society 2001, 123 (32), 7821-7830.
69. Sun, Q.-Y.; de Smet, L. C. P. M.; van Lagen, B.; Giesbers, M.; Thüne, P. C.; van Engelenburg, J.; de Wolf, F. A.; Zuilhof, H.; Sudhölter, E. J. R., Covalently Attached Monolayers on Crystalline Hydrogen-Terminated Silicon:‚Extremely Mild Attachment by Visible Light. Journal of the American Chemical Society 2005, 127 (8), 2514-2523.
70. de Smet, L. C. P. M.; Zuilhof, H.; Sudhölter, E. J. R.; Lie, L. H.; Houlton, A.; Horrocks, B. R., Mechanism of the Hydrosilylation Reaction of Alkenes at Porous Silicon: Experimental and Computational Deuterium Labeling Studies. The Journal of Physical Chemistry B 2005, 109 (24), 12020-12031.
71. Buriak, J. M., Organometallic Chemistry on Silicon and Germanium Surfaces. Chemical Reviews 2002, 102 (5), 1271-1308.
72. Warner, J. H.; Hoshino, A.; Yamamoto, K.; Tilley, R. D., Water-Soluble Photoluminescent Silicon Quantum Dots. Angewandte Chemie International Edition 2005, 44 (29), 4550-4554.
73. Nelles, J. r.; Sendor, D.; Ebbers, A.; Petrat, F.; Wiggers, H.; Schulz, C.; Simon, U., Functionalization of silicon nanoparticles via hydrosilylation with 1-alkenes. Colloid Polym Sci 2007, 285 (7), 729-736.
74. Buriak, J. M., Silicon-Carbon Bonds on Porous Silicon Surfaces. Advanced Materials 1999, 11 (3), 265-267.
75. Rosso-Vasic, M.; Spruijt, E.; Popovic, Z.; Overgaag, K.; van Lagen, B.; Grandidier, B.; Vanmaekelbergh, D.; Dominguez-Gutierrez, D.; De Cola, L.; Zuilhof, H., Amine-terminated silicon nanoparticles: synthesis, optical properties and their use in bioimaging. Journal of Materials Chemistry 2009, 19 (33), 5926-5933.
76. Ahire, J. H.; Wang, Q.; Coxon, P. R.; Malhotra, G.; Brydson, R.; Chen, R.; Chao, Y., Highly Luminescent and Nontoxic Amine-Capped Nanoparticles from Porous Silicon: Synthesis and Their Use in Biomedical Imaging. ACS Applied Materials & Interfaces 2012, 4 (6), 3285-3292.
77. Heath, J. R., A Liquid-Solution-Phase Synthesis of Crystalline Silicon. Science 1992, 258 (5085), 1131-1133.
78. Shirahata, N., Colloidal Si nanocrystals: a controlled organic-inorganic interface and its implications of color-tuning and chemical design toward sophisticated architectures. Physical Chemistry Chemical Physics 2011, 13 (16), 7284-7294.
79. Fan, J.; Chu, P. K., Group IV Nanoparticles: Synthesis, Properties, and Biological Applications. Small 2010, 6 (19), 2080-2098.
80. Zhou, Z.; Brus, L.; Friesner, R., Electronic Structure and Luminescence of 1.1- and 1.4-nm Silicon Nanocrystals:‚Äâ Oxide Shell versus Hydrogen Passivation. Nano Letters 2003, 3 (2), 163-167.
81. Canham, L. T., Silicon quantum wire array fabrication by electrochemical and chemical dissolution of wafers. journal article 1990, 57 (10), 1046-1048.
82. Henrich, J. L.; Curtis, C. L.; Credo, G. M.; Sailor, M. J.; Kavanagh, K. L., Luminescent Colloidal Silicon Suspensions from Porous Silicon. Science 1992, 255 (5040), 66-68.
83. Yamani, Z.; Ashhab, S.; Nayfeh, A.; Thompson, W. H.; Nayfeh, M., Red to green rainbow photoluminescence from unoxidized silicon nanocrystallites. Journal of Applied Physics 1998, 83 (7), 3929-3931.

33
84. Sweryda-Krawiec, B.; Cassagneau, T.; Fendler, J. H., Surface Modification of Silicon Nanocrystallites by Alcohols. The Journal of Physical Chemistry B 1999, 103 (44), 9524-9529.
85. Belomoin, G.; Therrien, J.; Smith, A.; Rao, S.; Twesten, R.; Chaieb, S.; Nayfeh, M. H.; Wagner, L.; Mitas, L., Observation of a magic discrete family of ultrabright Si nanoparticles. journal article 2002, 80 (5), 841-843.
86. Lie, L. H.; Duerdin, M.; Tuite, E. M.; Houlton, A.; Horrocks, B. R., Preparation and characterisation of luminescent alkylated-silicon quantum dots. Journal of Electroanalytical Chemistry 2002, 538-539, 183-190.
87. Li, Z. F.; Ruckenstein, E., Water-Soluble Poly(acrylic acid) Grafted Luminescent Silicon Nanoparticles and Their Use as Fluorescent Biological Staining Labels. Nano Letters 2004, 4 (8), 1463-1467.
88. Chao, Y.; Krishnamurthy, S.; Montalti, M.; Šiller, L.; Lie, L. H.; Houlton, A.; Horrocks, B. R.; Kjeldgaard, L.; Dhanak, V. R.; Hunt, M. R. C., Reactions and luminescence in passivated Si nanocrystallites induced by vacuum ultraviolet and soft-x-ray photons. Journal of Applied Physics 2005, 98 (4), 044316.
89. Hessel, C. M.; Henderson, E. .; Veinot, . G. C., Hydrogen Silsesquioxane: A Molecular Precursor for Nanocrystalline Si−SiO2 Composites and Freestanding Hydride-Surface-Terminated Silicon Nanoparticles. Chemistry of Materials 2006, 18 (26), 6139-6146.
90. Kelly, J. A.; Veinot, J. G. C., An Investigation into Near-UV Hydrosilylation of Freestanding Silicon Nanocrystals. ACS Nano 2010, 4 (8), 4645-4656.
91. Regli, S.; Kelly, J. A.; Shukaliak, A. M.; Veinot, J. G. C., Photothermal Response of Photoluminescent Silicon Nanocrystals. The Journal of Physical Chemistry Letters 2012, 3 (13), 1793-1797.
92. Dasog, M.; Yang, Z.; Regli, S.; Atkins, T. M.; Faramus, A.; Singh, M. P.; Muthuswamy, E.; Kauzlarich, S. M.; Tilley, R. D.; Veinot, J. G. C., Chemical Insight into the Origin of Red and Blue Photoluminescence Arising from Freestanding Silicon Nanocrystals. ACS Nano 2013, 7 (3), 2676-2685.
93. Liu, S.-M.; Yang; Sato, S.; Kimura, K., Enhanced Photoluminescence from Si Nano-organosols by Functionalization with Alkenes and Their Size Evolution. Chemistry of Materials 2006, 18 (3), 637-642.
94. Liu, S.-m.; Sato, S.; Kimura, K., Synthesis of Luminescent Silicon Nanopowders Redispersible to Various Solvents. Langmuir 2005, 21 (14), 6324-6329.
95. Niu, H.-j.; Zhang, L.; Zhu, J.-y.; Zhang, M.-l.; Bai, X.-d., High-yield synthesis of silicon nanoparticles via the perpendicular pulsed laser ablation in the inert gas. Optoelectron. Lett. 2010, 6 (2), 81-84.
96. Umezu, I.; Kondo, I.; Sugimura, A., Formation of surface stabilized Si nanocrystal by pulsed laser ablation in hydrogen gas. Appl. Phys. A 2008, 93 (3), 717-720.
97. Shirahata, N.; Linford, M. R.; Furumi, S.; Pei, L.; Sakka, Y.; Gates, R. J.; Asplund, M. C., Laser-derived one-pot synthesis of silicon nanocrystals terminated with organic monolayers. Chemical Communications 2009, (31), 4684-4686.
98. Heintz, A. S.; Fink, M. J.; Mitchell, B. S., Mechanochemical Synthesis of Blue Luminescent Alkyl/Alkenyl-Passivated Silicon Nanoparticles. Advanced Materials 2007, 19 (22), 3984-3988.

34
99. Heintz, A. S.; Fink, M. J.; Mitchell, B. S., Silicon nanoparticles with chemically tailored surfaces. Applied Organometallic Chemistry 2010, 24 (3), 236-240.
100. Furukawa, S.; Miyasato, T., Quantum size effects on the optical band gap of microcrystalline Si:H. Physical Review B 1988, 38 (8), 5726-5729.
101. Li, X.; He, Y.; Talukdar, S. S.; Swihart, M. T., Process for Preparing Macroscopic Quantities of Brightly Photoluminescent Silicon Nanoparticles with Emission Spanning the Visible Spectrum. Langmuir 2003, 19 (20), 8490-8496.
102. Li, X.; He, Y.; Swihart, M. T., Surface Functionalization of Silicon Nanoparticles Produced by Laser-Driven Pyrolysis of Silane followed by HF-HNO3 Etching. Langmuir 2004, 20 (11), 4720-4727.
103. Shah, P. S.; Hanrath, T.; Johnston, K. P.; Korgel, B. A., Nanocrystal and Nanowire Synthesis and Dispersibility in Supercritical Fluids. The Journal of Physical Chemistry B 2004, 108 (28), 9574-9587.
104. English, D. S.; Pell, L. E.; Yu, Z.; Barbara, P. F.; Korgel, B. A., Size Tunable Visible Luminescence from Individual Organic Monolayer Stabilized Silicon Nanocrystal Quantum Dots. Nano Letters 2002, 2 (7), 681-685.
105. Holmes, J. D.; Ziegler, K. J.; Doty, R. C.; Pell, L. E.; Johnston, K. P.; Korgel, B. A., Highly Luminescent Silicon Nanocrystals with Discrete Optical Transitions. Journal of the American Chemical Society 2001, 123 (16), 3743-3748.
106. Lee, D. C.; Hanrath, T.; Korgel, B. A., The Role of Precursor-Decomposition Kinetics in Silicon-Nanowire Synthesis in Organic Solvents. Angewandte Chemie International Edition 2005, 44 (23), 3573-3577.
107. Holmes, J. D.; Johnston, K. P.; Doty, R. C.; Korgel, B. A., Control of Thickness and Orientation of Solution-Grown Silicon Nanowires. Science 2000, 287 (5457), 1471-1473.
108. Bley, R. A.; Kauzlarich, S. M., A Low-Temperature Solution Phase Route for the Synthesis of Silicon Nanoclusters. Journal of the American Chemical Society 1996, 118 (49), 12461-12462.
109. Liu, Q.; Kauzlarich, S. M., A new synthetic route for the synthesis of hydrogen terminated silicon nanoparticles. Materials Science and Engineering: B 2002, 96 (2), 72-75.
110. Baldwin, R. K.; Pettigrew, K. A.; Ratai, E.; Augustine, M. P.; Kauzlarich, S. M., Solution reduction synthesis of surface stabilized silicon nanoparticles. Chemical Communications 2002, (17), 1822-1823.
111. Tanke, R. S.; Kauzlarich, S. M.; Patten, T. E.; Pettigrew, K. A.; Murphy, D. L.; Thompson, M. E.; Lee, H. W. H., Synthesis of Germanium Nanoclusters with Irreversibly Attached Functional Groups: Acetals, Alcohols, Esters, and Polymers. Chemistry of Materials 2003, 15 (8), 1682-1689.
112. Zhang, X.; Brynda, M.; Britt, R. D.; Carroll, E. C.; Larsen, D. S.; Louie, A. Y.; Kauzlarich, S. M., Synthesis and Characterization of Manganese-Doped Silicon Nanoparticles: Bifunctional Paramagnetic-Optical Nanomaterial. Journal of the American Chemical Society 2007, 129 (35), 10668-10669.
113. Baldwin, R. K.; Zou, J.; Pettigrew, K. A.; Yeagle, G. J.; Britt, R. D.; Kauzlarich, S. M., The preparation of a phosphorus doped silicon film from phosphorus containing silicon nanoparticles. Chemical Communications 2006, (6), 658-660.

35
114. Yang, C.-S.; Kauzlarich, S. M.; Wang, Y. C., Synthesis and Characterization of Germanium/Si-Alkyl and Germanium/Silica Core-Shell Quantum Dots. Chemistry of Materials 1999, 11 (12), 3666-3670.
115. Mayeri, D.; Phillips, B. L.; Augustine, M. P.; Kauzlarich, S. M., NMR Study of the Synthesis of Alkyl-Terminated Silicon Nanoparticles from the Reaction of SiCl4 with the Zintl Salt, NaSi. Chemistry of Materials 2001, 13 (3), 765-770.
116. Zou, J.; Baldwin, R. K.; Pettigrew, K. A.; Kauzlarich, S. M., Solution Synthesis of Ultrastable Luminescent Siloxane-Coated Silicon Nanoparticles. Nano Letters 2004, 4 (7), 1181-1186.
117. Baldwin, R. K.; Pettigrew, K. A.; Garno, J. C.; Power, P. P.; Liu, G.-y.; Kauzlarich, S. M., Room Temperature Solution Synthesis of Alkyl-Capped Tetrahedral Shaped Silicon Nanocrystals. Journal of the American Chemical Society 2002, 124 (7), 1150-1151.
118. Wilcoxon, J. P.; Samara, G. A., Tailorable, visible light emission from silicon nanocrystals. journal article 1999, 74 (21), 3164-3166.
119. Tilley, R. D.; Warner, J. H.; Yamamoto, K.; Matsui, I.; Fujimori, H., Micro-emulsion synthesis of monodisperse surface stabilized silicon nanocrystals. Chemical Communications 2005, (14), 1833-1835.
120. Mangolini, L.; Thimsen, E.; Kortshagen, U., High-Yield Plasma Synthesis of Luminescent Silicon Nanocrystals. Nano Letters 2005, 5 (4), 655-659.
121. Giesen, B.; Wiggers, H.; Kowalik, A.; Roth*, P., Formation of Si-nanoparticles in a microwave reactor: Comparison between experiments and modelling. Journal of Nanoparticle Research 2005, 7 (1), 29-41.
122. Zhu, X.; Yukawa, T.; Kishi, T.; Hirai, M.; Suematsu, H.; Jiang, W.; Yatsui, K., Synthesis of Light-emitting Silicon Nanoparticles by Intense Pulsed ion-beam Esvaporation. Journal of Nanoparticle Research 2005, 7 (6), 669-673.
123. Chao, Y.; Siller, L.; Krishnamurthy, S.; Coxon, P. R.; Bangert, U.; Gass, M.; Kjeldaard, L.; Patole, S. N.; Lie, L. H.; O' Farrell, N.; Alsop, T. A.; Houlton, A.; Horrocks, B. R., Evaporation and deposition of alkyl-capped silicon nanocrystals in ultrahigh vacuum. Nat Nano 2007, 2 (8), 486-489.
124. Schuppler, S.; Friedman, S. L.; Marcus, M. A.; Adler, D. L.; Xie, Y. H.; Ross, F. M.; Chabal, Y. J.; Harris, T. D.; Brus, L. E.; Brown, W. L.; Chaban, E. E.; Szajowski, P. F.; Christman, S. B.; Citrin, P. H., Size, shape, and composition of luminescent species in oxidized Si nanocrystals and H-passivated porous Si. Physical Review B 1995, 52 (7), 4910.
125. Rogozhina, E.; Belomoin, G.; Smith, A.; Abuhassan, L.; Barry, N.; Akcakir, O.; Braun, P. V.; Nayfeh, M. H., Si-N linkage in ultrabright, ultrasmall Si nanoparticles. journal article 2001, 78 (23), 3711-3713.
126. Rosso-Vasic, M.; Spruijt, E.; van Lagen, B.; De Cola, L.; Zuilhof, H., Alkyl-Functionalized Oxide-Free Silicon Nanoparticles: Synthesis and Optical Properties. Small 2008, 4 (10), 1835-1841.
127. Ruizendaal, L.; Bhattacharjee, S.; Pournazari, K.; Rosso-Vasic, M.; de Haan, L. H. J.; Alink, G. M.; Marcelis, A. T. M.; Zuilhof, H., Synthesis and cytotoxicity of silicon nanoparticles with covalently attached organic monolayers. Nanotoxicology 2009, 3 (4), 339-347.
128. Bhattacharjee, S.; de Haan, L.; Evers, N.; Jiang, X.; Marcelis, A.; Zuilhof, H.; Rietjens, I.; Alink, G., Role of surface charge and oxidative stress in cytotoxicity of organic monolayer-
36
coated silicon nanoparticles towards macrophage NR8383 cells. Particle and Fibre Toxicology 2010, 7 (1), 25.
129. Lewinski, N.; Colvin, V.; Drezek, R., Cytotoxicity of Nanoparticles. Small 2008, 4 (1), 26-49.
130. Chan, W. C. W.; Nie, S., Quantum Dot Bioconjugates for Ultrasensitive Nonisotopic Detection. Science 1998, 281 (5385), 2016-2018.
131. Selvan, S. T.; Tan, T. T.; Ying, J. Y., Robust, Non-Cytotoxic, Silica-Coated CdSe Quantum Dots with Efficient Photoluminescence. Advanced Materials 2005, 17 (13), 1620-1625.
132. Salata, O., Applications of nanoparticles in biology and medicine. Journal of Nanobiotechnology 2004, 2 (1), 3.
133. Ghaderi, S.; Ramesh, B.; Seifalian, A. M., Fluorescence nanoparticles "quantum dots" as drug delivery system and their toxicity: a review. Journal of Drug Targeting 2011, 19 (7), 475-486.
134. Sayes, C. M.; Reed, K. L.; Warheit, D. B., Assessing Toxicity of Fine and Nanoparticles: Comparing In Vitro Measurements to In Vivo Pulmonary Toxicity Profiles. Toxicological Sciences 2007, 97 (1), 163-180.
135. Altman, S. A.; Randers, L.; Rao, G., Comparison of Trypan Blue Dye Exclusion and Fluorometric Assays for Mammalian Cell Viability Determinations. Biotechnology Progress 1993, 9 (6), 671-674.
136. Takahashi, H.; Niidome, Y.; Niidome, T.; Kaneko, K.; Kawasaki, H.; Yamada, S., Modification of Gold Nanorods Using Phosphatidylcholine to Reduce Cytotoxicity. Langmuir 2005, 22 (1), 2-5.
137. Magrez, A.; Kasas, S.; Salicio, V.; Pasquier, N.; Seo, J. W.; Celio, M.; Catsicas, S.; Schwaller, B.; Forró, L., Cellular Toxicity of Carbon-Based Nanomaterials. Nano Letters 2006, 6 (6), 1121-1125.
138. Mosmann, T., Rapid colorimetric assay for cellular growth and survival: Application to proliferation and cytotoxicity assays. J. Immunol. Methods 1983, 65 (1-2), 55-63.
139. Fairbairn, D. W.; Olive, P. L.; O'Neill, K. L., The comet assay: a comprehensive review. Mutation Research/Reviews in Genetic Toxicology 1995, 339 (1), 37-59.
140. Lin, W.; Huang, Y.-w.; Zhou, X.-D.; Ma, Y., In vitro toxicity of silica nanoparticles in human lung cancer cells. Toxicology and Applied Pharmacology 2006, 217 (3), 252-259.
141. Kondoh, M.; Araragi, S.; Sato, K.; Higashimoto, M.; Takiguchi, M.; Sato, M., Cadmium induces apoptosis partly via caspase-9 activation in HL-60 cells. Toxicology 2002, 170 (1-2), 111-117.
142. Rikans, L. E.; Yamano, T., Mechanisms of cadmium-mediated acute hepatotoxicity. Journal of Biochemical and Molecular Toxicology 2000, 14 (2), 110-117.
143. Shiohara, A.; Hoshino, A.; Hanaki, K.-i.; Suzuki, K.; Yamamoto, K., On the Cyto-Toxicity Caused by Quantum Dots. Microbiology and Immunology 2004, 48 (9), 669-675.
144. Chin, V.; Collins, B. E.; Sailor, M. J.; Bhatia, S. N., Compatibility of Primary Hepatocytes with Oxidized Nanoporous Silicon. Advanced Materials 2001, 13 (24), 1877-1880.
145. Alsharif, N. H.; Berger, C. E. M.; Varanasi, S. S.; Chao, Y.; Horrocks, B. R.; Datta, H. K., Alkyl-Capped Silicon Nanocrystals Lack Cytotoxicity and have Enhanced Intracellular

37
Accumulation in Malignant Cells via Cholesterol-Dependent Endocytosis. Small 2009, 5 (2), 221-228.
146. Park, J.-H.; Gu, L.; von Maltzahn, G.; Ruoslahti, E.; Bhatia, S. N.; Sailor, M. J., Biodegradable luminescent porous silicon nanoparticles for in vivo applications. Nat Mater 2009, 8 (4), 331-336.
147. Perez, L.; Flores, M.; Avalos, J.; San Miguel, L.; Resto, O.; Fonseca, L., In Comparative study of the growth curves of B. Subtilis, K. Pneumoniae, C. Xerosis and E. Coli bacteria in medium containing nanometric silicon particles. Materials Research Society Symposium Proceedings, Materials Research Society: 2003.
148. Pankhurst, Q. A.; Thanh, N. T. K.; Jones, S. K.; Dobson, J., Progress in applications of magnetic nanoparticles in biomedicine. Journal of Physics D: Applied Physics 2009, 42 (22), 224001.
149. Huang, X.; Neretina, S.; El-Sayed, M. A., Gold Nanorods: From Synthesis and Properties to Biological and Biomedical Applications. Advanced Materials 2009, 21 (48), 4880-4910.
150. Peer, D.; Karp, J. M.; Hong, S.; Farokhzad, O. C.; Margalit, R.; Langer, R., Nanocarriers as an emerging platform for cancer therapy. Nat Nano 2007, 2 (12), 751-760.
151. Ferrari, M., Cancer nanotechnology: opportunities and challenges. Nat Rev Cancer 2005, 5 (3), 161-171.
152. Pankhurst, Q. A.; Connolly, J.; Jones, S. K.; Dobson, J., Applications of magnetic nanoparticles in biomedicine. Journal of Physics D: Applied Physics 2003, 36 (13), R167.
153. Kikkeri, R.; Lepenies, B.; Adibekian, A.; Laurino, P.; Seeberger, P. H., In Vitro Imaging and in Vivo Liver Targeting with Carbohydrate Capped Quantum Dots. Journal of the American Chemical Society 2009, 131 (6), 2110-2012.
154. Lis, H.; Sharon, N., Lectins: Carbohydrate-Specific Proteins That Mediate Cellular Recognition. Chemical Reviews 1998, 98 (2), 637-674.
155. Babu, P.; Sinha, S.; Surolia, A., Sugar−Quantum Dot Conjugates for a Selective and Sensitive Detection of Lectins. Bioconjugate Chemistry 2006, 18 (1), 146-151.
156. Dam, T. K.; Brewer, C. F., Thermodynamic Studies of Lectin−Carbohydrate Interactions by Isothermal Titration Calorimetry. Chemical Reviews 2002, 102 (2), 387-430.
157. Ratner, D. M.; Adams, E. W.; Disney, M. D.; Seeberger, P. H., Tools for Glycomics: Mapping Interactions of Carbohydrates in Biological Systems. ChemBioChem 2004, 5 (10), 1375-1383.
158. Oh, E.; Lee, D.; Kim, Y.-P.; Cha, S. Y.; Oh, D.-B.; Kang, H. A.; Kim, J.; Kim, H.-S., Nanoparticle-Based Energy Transfer for Rapid and Simple Detection of Protein Glycosylation. Angewandte Chemie International Edition 2006, 45 (47), 7959-7963.
159. Lindhorst, T. K., Essentials of carbohydrate chemistry and biochemistry. Wiley-VCH: Weinheim, 2003.
160. Lee, Y. C.; Lee, R. T., Carbohydrate-Protein Interactions: Basis of Glycobiology. Accounts of Chemical Research 1995, 28 (8), 321-327.
161. Mammen, M.; Choi, S.-K.; Whitesides, G. M., Polyvalent Interactions in Biological Systems: Implications for Design and Use of Multivalent Ligands and Inhibitors. Angewandte Chemie International Edition 1998, 37 (20), 2754-2794.

38
162. de la Fuente, J. M.; Barrientos, A. G.; Rojas, T. C.; Rojo, J.; Cañada, J.; Fernández, A.; Penadés, S., Gold Glyconanoparticles as Water-Soluble Polyvalent Models To Study Carbohydrate Interactions. Angewandte Chemie International Edition 2001, 40 (12), 2257-2261.
163. Tromas, C.; Rojo, J.; de la Fuente, J. M.; Barrientos, A. G.; García, R.; Penadés, S., Adhesion Forces between LewisX Determinant Antigens as Measured by Atomic Force Microscopy. Angewandte Chemie International Edition 2001, 40 (16), 3052-3055.
164. Hernáiz, M. J.; de la Fuente, J. M.; Barrientos, Á. G.; Penadés, S., A Model System Mimicking Glycosphingolipid Clusters to Quantify Carbohydrate Self-Interactions by Surface Plasmon Resonance. Angewandte Chemie International Edition 2002, 41 (9), 1554-1557.
165. de la Fuente, J. M.; Eaton, P.; Barrientos, A. G.; Menéndez, M.; Penadés, S., Thermodynamic Evidence for Ca2+-Mediated Self-Aggregation of Lewis X Gold Glyconanoparticles. A Model for Cell Adhesion via Carbohydrate−Carbohydrate Interaction. Journal of the American Chemical Society 2005, 127 (17), 6192-6197.
166. El-Boubbou, K.; Gruden, C.; Huang, X., Magnetic Glyco-nanoparticles: A Unique Tool for Rapid Pathogen Detection, Decontamination, and Strain Differentiation. Journal of the American Chemical Society 2007, 129 (44), 13392-13393.
167. Hora k, D.; Babic , M.; endelova , P.; Herynek, V.; Trchova , M.; Pientka, Z.; Pollert, E.; Hájek, M.; Syková, E., d-Mannose-Modified Iron Oxide Nanoparticles for Stem Cell Labeling. Bioconjugate Chemistry 2007, 18 (3), 635-644.
168. Yoo, M. K.; Kim, I. Y.; Kim, E. M.; Jeong, H.-J.; Lee, C.-M.; Jeong, Y. Y.; Akaike, T.; Cho, C. S., Superparamagnetic Iron Oxide Nanoparticles Coated with Galactose-Carrying Polymer for Hepatocyte Targeting. Journal of Biomedicine and Biotechnology 2007, 2007.
169. Lin, C.-C.; Yeh, Y.-C.; Yang, C.-Y.; Chen, G.-F.; Chen, Y.-C.; Wu, Y.-C.; Chen, C.-C., Quantitative analysis of multivalent interactions of carbohydrate-encapsulated gold nanoparticles with concanavalin A. Chemical Communications 2003, (23), 2920-2921.
170. Chen, Y.-J.; Chen, S.-H.; Chien, Y.-Y.; Chang, Y.-W.; Liao, H.-K.; Chang, C.-Y.; Jan, M.-D.; Wang, K.-T.; Lin, C.-C., Carbohydrate-Encapsulated Gold Nanoparticles for Rapid Target-Protein Identification and Binding-Epitope Mapping. ChemBioChem 2005, 6 (7), 1169-1173.
171. de la Fuente, J. M.; Alcántara, D.; Eaton, P.; Crespo, P.; Rojas, T. C.; Fernández, A.; Hernando, A.; Penadés, S., Gold and Gold−Iron Oxide Magnetic Glyconanoparticles: Synthesis, Characterization and Magnetic Properties. The Journal of Physical Chemistry B 2006, 110 (26), 13021-13028.
172. De la Fuente, J. M.; Alcantara, D.; Penades, S., Cell Response to Magnetic Glyconanoparticles: Does the Carbohydrate Matter? NanoBioscience, IEEE Transactions on 2007, 6 (4), 275-281.
173. Martínez-Ávila, O.; Hijazi, K.; Marradi, M.; Clavel, C.; Campion, C.; Kelly, C.; Penadés, S., Gold Manno-Glyconanoparticles: Multivalent Systems to Block HIV-1 gp120 Binding to the Lectin DC-SIGN. Chemistry – A European Journal 2009, 15 (38), 9874-9888.
174. Schofield, C. L.; Field, R. A.; Russell, D. A., Glyconanoparticles for the Colorimetric Detection of Cholera Toxin. Analytical Chemistry 2007, 79 (4), 1356-1361.
175. Marradi, M.; Alcantara, D.; de la Fuente, J. M.; Garcia-Martin, M. L.; Cerdan, S.; Penades, S., Paramagnetic Gd-based gold glyconanoparticles as probes for MRI: tuning relaxivities with sugars. Chemical Communications 2009, (26), 3922-3924.

39
176. Rojo, J.; Díaz, V.; de la Fuente, J. M.; Segura, I.; Barrientos, A. G.; Riese, H. H.; Bernad, A.; Penadés, S., Gold Glyconanoparticles as New Tools in Antiadhesive Therapy. ChemBioChem 2004, 5 (3), 291-297.
177. Kemp, M. M.; Kumar, A.; Mousa, S.; Dyskin, E.; Yalcin, M.; Ajayan, P.; Linhardt, R. J.; Mousa, S. A., Gold and silver nanoparticles conjugated with heparin derivative possess anti-angiogenesis properties. Nanotechnology 2009, 20 (45), 455104.
178. Wang, Z.; Xu, Y.; Yang, B.; Tiruchinapally, G.; Sun, B.; Liu, R.; Dulaney, S.; Liu, J.; Huang, X., Preactivation-Based, One-Pot Combinatorial Synthesis of Heparin-like Hexasaccharides for the Analysis of Heparin–Protein Interactions. Chemistry – A European Journal 2010, 16 (28), 8365-8375.
179. Chen, Y.; Ji, T.; Rosenzweig, Z., Synthesis of Glyconanospheres Containing Luminescent CdSe−ZnS Quantum Dots. Nano Letters 2003, 3 (5), 581-584.
180. Robinson, A.; Fang, J.-M.; Chou, P.-T.; Liao, K.-W.; Chu, R.-M.; Lee, S.-J., Probing Lectin and Sperm with Carbohydrate-Modified Quantum Dots. ChemBioChem 2005, 6 (10), 1899-1905.
181. Bhang, S. H.; Won, N.; Lee, T.-J.; Jin, H.; Nam, J.; Park, J.; Chung, H.; Park, H.-S.; Sung, Y.-E.; Hahn, S. K.; Kim, B.-S.; Kim, S., Hyaluronic Acid-Quantum Dot Conjugates for In Vivo Lymphatic Vessel Imaging. ACS NANO 2009, 3 (6), 1389-1398.
182. Kim, K. S.; Hur, W.; Park, S.-J.; Hong, S. W.; Choi, J. E.; Goh, E. J.; Yoon, S. K.; Hahn, S. K., Bioimaging for Targeted Delivery of Hyaluronic Acid Derivatives to the Livers in Cirrhotic Mice Using Quantum Dots. ACS NANO 2010, 4 (6), 3005-3014.
183. Erogbogbo, F.; Yong, K.-T.; Roy, I.; Xu, G.; Prasad, P. N.; Swihart, M. T., Biocompatible Luminescent Silicon Quantum Dots for Imaging of Cancer Cells. ACS Nano 2008, 2 (5), 873-878.
184. Erogbogbo, F.; Tien, C.-A.; Chang, C.-W.; Yong, K.-T.; Law, W.-C.; Ding, H.; Roy, I.; Swihart, M. T.; Prasad, P. N., Bioconjugation of Luminescent Silicon Quantum Dots for Selective Uptake by Cancer Cells. Bioconjugate Chemistry 2011, 22 (6), 1081-1088.
185. Sailor, M. J.; Park, J.-H., Hybrid Nanoparticles for Detection and Treatment of Cancer. Advanced Materials 2012, 24 (28), 3779-3802.

40
2 Silicon Nanoparticle Synthesis and Characterization
Techniques
The following chapter describes the synthesis, methods to functionalize the
nanoparticles, experimental apparatus, and chemicals used in the work presented in this
thesis. An overview of the preparation methods used in the synthesis of amine terminated
silicon nanoparticles, different types of carbohydrates capped silicon nanoparticles, and the
biological methods and materials used to implicate the NPs inside the cells. All chemical
analyses of the compounds, optical measurements, size determinations for the entire
samples are also described in detail, followed by the techniques used in the biomedical
applications.
All chemicals used were purchased from Sigma-Aldrich or Fisher Scientific and
employed without further purification unless specified differently.
2.1 Synthesis of Hydrogen terminated Porous Silicon NPs
2.1.1 Porous Silicon
As mentioned in the introductory chapter 1, there are two major strategies to
synthesize silicon nanoparticles: bulk reduction (top down) and self-assembly (bottom up).
The silicon nanoparticles studied and synthesized throughout this work are derived from
the nanostructures found within the surface layers of porous silicon by bulk reduction (top
down) method. The formation of porous silicon can be carried out in several ways. In this
work porous silicon was obtained by electrochemical etching (anodisation) of crystalline
silicon. Many nanoparticle production methods involve elaborate and expensive techniques
with relatively low yields and low purity. Fabrication of porous silicon is, by contrast, a
cheap and simple procedure based upon the electrochemical dissolution of crystalline
silicon.
2.1.2 Brief History of Porous Silicon
Porous Silicon (p-Si) was accidentally discovered in 1956 by the husband and wife
team Arthur and Ingeborg Uhlir working at Bell Laboratories in the United States.1 They
were trying to develop an electrochemical method to machine silicon wafers for use in

41
microelectronic circuits. They observed that under appropriate electrochemical conditions,
the silicon wafer did not dissolve uniformly as expected, but instead the surfaces appeared
to be covered in dark red-brown stains. These deposits were dismissed as a suboxide of
silicon and no further research was carried out on it for over a decade. However, in the
1970s and 1980s a significant level of interest in this obscure material grew because its
large internal surface area offered a model of the crystalline silicon surface in IR
spectroscopic studies2, 3, as a precursor to generate thick oxide layers on silicon, and as a
dielectric layer in capacitance-based chemical sensors4. In 1990, Leigh Canham5 discovered
its visible luminescence properties. Researchers started studying its nonlinear optical,
electric and mechanical properties. These academic and technological efforts have enabled
the fabrication of uniform porous layers with size as small as one nanometer, permitting an
enormous inner surface area, which is useful for biosensing applications.
2.1.3 Synthesis of Porous Silicon
Porous silicon samples were made by anodisation (electrochemical ‘etching’) of bulk
silicon in a hydrofluoric acid (HF) based electrolyte (1:1 98 wt.% ethanol: 48 wt.% HF
volumetric ratio). HF is typically used since it is known to dissolve bulk silicon in an efficient
manner.6 The addition of ethanol is useful for several reasons; owing to the hydrophobic
nature of the clean silicon surface, access to the fine pores by the pure electrolyte is severely
restricted. Ethanol increases the surface wettability, aiding pore penetration, which
improves the lateral homogeneity and leads to a more uniform porous layer. In addition to
this, the presence of ethanol helps with the removal of hydrogen gas (see equation 2.1),
which form during the dissolution reaction from the surface of silicon and allows a more
uniform current density to be maintained. The dissolution process is based upon the
presence of holes (h+) at the Si:HF solution interface
Equation: 2.1
In the dissolution process, a vacancy is formed in the silicon valence band. A vacancy
is also called a hole. In other words, an electron is removed from near one of the Si–H bonds.
This activates the previously passivated Si–H bond, making it susceptible to attack by the
fluoride solution. After initiation, the etching of one silicon atom proceeds very rapidly
according to the mechanism outlined in Scheme 2.1.

42
Scheme 2.1: Reaction mechanism of H-terminated porous SiNPs formed by electrochemical
etching reproduced from Lehmann & Gösele (1991).7
The anodisation was carried out in a PTFE (Teflon) cell where the silicon wafer acts
as anode and HF-resistant electrode (Tungsten wire) serves as the cathode. The PTFE
(Teflon) cell is used in order to withstand the aggressive nature of hydrofluoric acid used
during the etching process. The cell chamber consists of an upper and lower plate, and the
silicon chip is positioned between two plates. The upper plate contains an open cavity in the
center to hold the etchant or electrolyte solution and is fitted with a VitonTM O-ring
(Polymax LT) to prevent the etching solution from leaking. The p-Si (100) wafer (10 cm
1. In the absence of electron holes, a hydrogen saturated silicon surface is virtually free from attack by flouride ions in the HF based electrolyte. The induced polarisationbetween the hydrogen and silicon atoms is low because the electron affinity of hydrogen is about that of silicon.
2. When a hole reaches the surface, nucleophilic attack on an Si-H bond by a fluoride ion can occur and a Si-F bond is formed
3. The Si-F bond causes a polarisation effect allowing a second fluorine ion to attack and replace the remaining hydrogen bond. Two hydrogen atoms can then combine, injecting an electron into the substrate.
4. The polarisation induced by the Si-F bonds reduces the electron density of the remaining Si-Si backbonds making them susceptible to attack by the HF in a manner such that the remaining silicon surface atoms are bonded to the hydrogen atoms.
5. The silicon tetrafluoride molecule reacts with the HF to form the highly stable SiF6
2- fluoroanion.
The surface returns to it’s ‘neutral’ state until another hole is made available.
Si
HH
SiSi
Si
H
Si
H
Si
F F
F F
F

43
resistivity, Compart Technology, Peterborough, UK) was first cut into 1.25cm x1.25cm
square chips to fit the anodisation cell (circular in cross-section). The wafers were cut into
the chips by using a diamond-tipped scribe. After cutting, the chips were rinsed in absolute
ethanol (EtOH, 98 wt.% Sigma-Aldrich) and distilled water, in order to eliminate impurities
from the surface, and dried under nitrogen flow.
Figure 2.1: Schematic diagram of formation of porous silicon - Top left shows a two-electrode
electrochemical cell used to make porous silicon. Lower left, enlarged cross-section of the Psi-
Si interface. Top right, silicon wall isolated by two pores with possible routes for a hole to
cross the silicon highlighted (blue and purple arrows). Lower right, energy barriers for the
hole penetrating into a wall (blue arrow) and a pore base (purple arrow). Reproduced from
Lehmann et al. (1993).
Prior to the etching process, the chip was dipped rapidly (approximately 30 sec) in
48 wt.% HF (VWR International Ltd.) then rinsed gently with distilled water and dried under
nitrogen flow. After drying the chip was placed into the cell in such a way that only the
polished side of the chip is exposed to the electrolyte solution. The upper plate of the cell
+
+
Si
P Si
HF
2 nm
2 nm
HF
+
O-ring
Si chip (anode)Powersupply
Tungsten wire(cathode)
HF based electrolyte
platinum foil
PTFE cell
Si
+
H

44
with an O-ring is fastened to the lower plate and the cell is filled with the electrolyte solution
(1:1 98 wt.% ethanol: 48 wt.% HF). The counter electrode is a piece of tungsten wire (0.5
mm in diameter, Goodfellow UK) coiled into a loop to improve the uniformity of the current
distribution, which is suspended from an insulated arm above the cell and submerged in the
electrolyte solution. A constant current source (Keithley Source Meter 2061) is then
connected across the cathode and anode in order to transmit current through the electrolyte
solution and the surface of the Si chip. The direction of current flow is important; if the
connections are switched, no pore formation takes place.
In this work porous silicon layers were formed by 5 min etching at a current of
400mA with a maximum driving potential of 40 V. After the process was complete the
solution is decanted and the H-terminated porous silicon chips were dried under vacuum.
2.2 Synthesis of Amine-terminated SiNPs
Amine terminated silicon nanoparticles were synthesized using a hydrosilylation
reaction method, i.e. the addition across a carbon-carbon multiple bond under catalysis by
transition metal complexes. Hydrogen terminated porous SiNPs produced from the
electrochemical etching were reacted with allylamine using a platinum catalyst (Pt).
2.2.1 Hydrosilylation
The first reports of the covalent attachment of alkenes and alkynes onto hydrogen-
terminated silicon by hydrosilylation of the unsaturated molecules in the early 1990s
marked an important development. The early work by Matthew Linford at Stanford
University successfully demonstrated Si-C bonded organic monolayers prepared by
hydrosilylation of the unsaturated molecules which remained robust, even at elevated
temperatures or under highly acidic conditions8 9 and the field has continued to attract
attention ever since.
Several methods for the formation of Si-C bonded monolayers at hydrogen-
terminated silicon surfaces have been proposed.10-13 The hydrosilylation reaction of 1-
alkenes with the hydrogen-terminated silicon surfaces is somewhat flexible, and may be
induced by photochemical14-16 or thermal17-19 means, UV irradiation20 or by employing
catalysts (typically EtAlCl2 or H2PtCl6) on porous silicon and single-crystal surfaces.21-23
In order to properly understand the physical and chemical properties of these
monolayers, it is crucial to understand the mechanism, which governs their formation. The
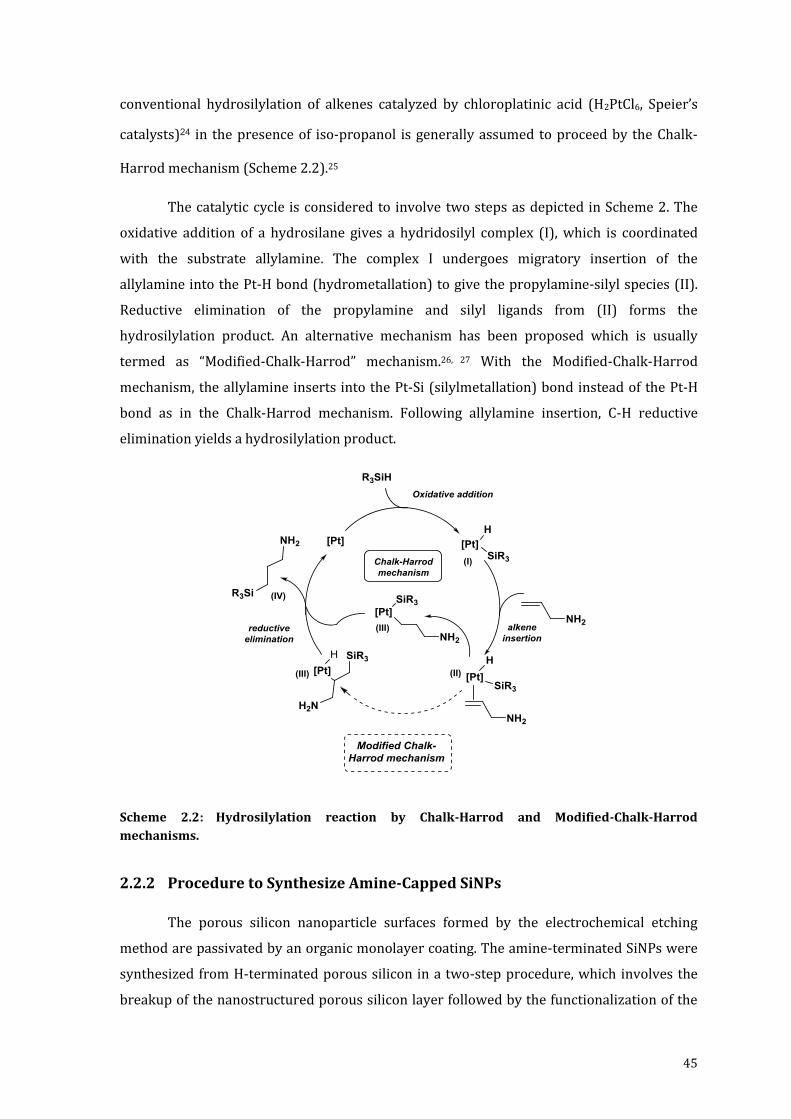
45
conventional hydrosilylation of alkenes catalyzed by chloroplatinic acid (H2PtCl6, Speier’s
catalysts)24 in the presence of iso-propanol is generally assumed to proceed by the Chalk-
Harrod mechanism (Scheme 2.2).25
The catalytic cycle is considered to involve two steps as depicted in Scheme 2. The
oxidative addition of a hydrosilane gives a hydridosilyl complex (I), which is coordinated
with the substrate allylamine. The complex I undergoes migratory insertion of the
allylamine into the Pt-H bond (hydrometallation) to give the propylamine-silyl species (II).
Reductive elimination of the propylamine and silyl ligands from (II) forms the
hydrosilylation product. An alternative mechanism has been proposed which is usually
termed as “Modified-Chalk-Harrod” mechanism.26, 27 With the Modified-Chalk-Harrod
mechanism, the allylamine inserts into the Pt-Si (silylmetallation) bond instead of the Pt-H
bond as in the Chalk-Harrod mechanism. Following allylamine insertion, C-H reductive
elimination yields a hydrosilylation product.
Scheme 2.2: Hydrosilylation reaction by Chalk-Harrod and Modified-Chalk-Harrod
mechanisms.
2.2.2 Procedure to Synthesize Amine-Capped SiNPs
The porous silicon nanoparticle surfaces formed by the electrochemical etching
method are passivated by an organic monolayer coating. The amine-terminated SiNPs were
synthesized from H-terminated porous silicon in a two-step procedure, which involves the
breakup of the nanostructured porous silicon layer followed by the functionalization of the
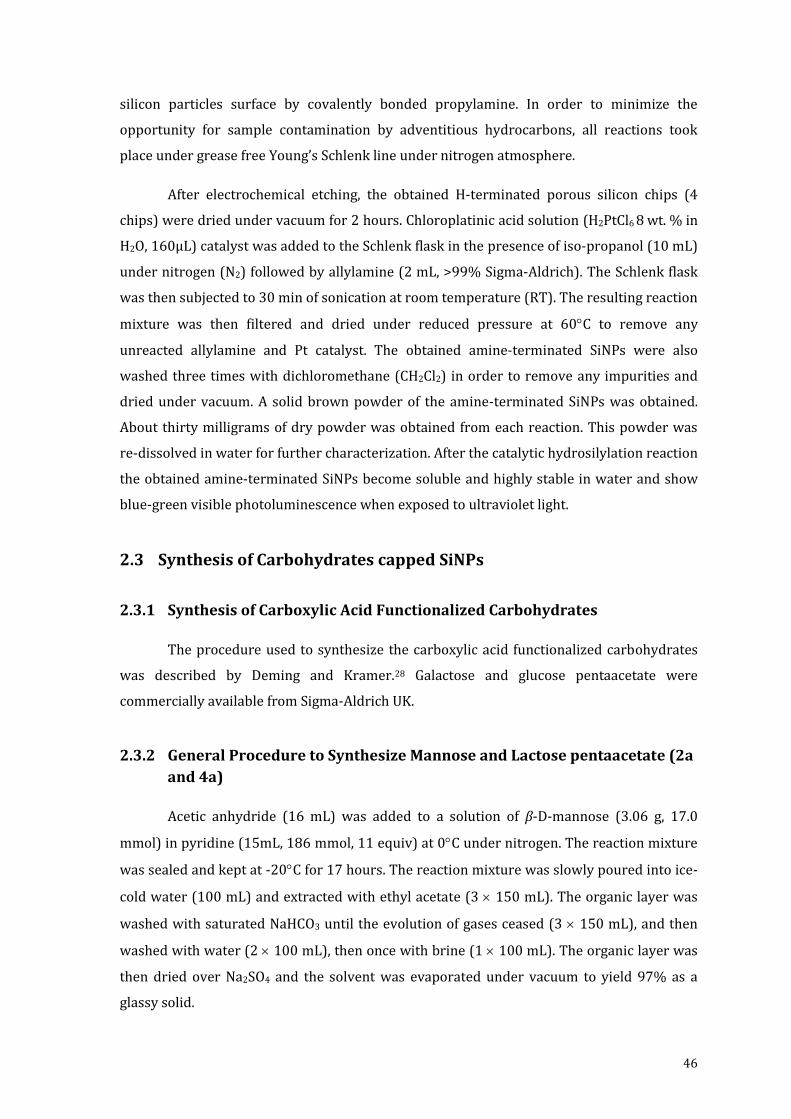
46
silicon particles surface by covalently bonded propylamine. In order to minimize the
opportunity for sample contamination by adventitious hydrocarbons, all reactions took
place under grease free Young’s Schlenk line under nitrogen atmosphere.
After electrochemical etching, the obtained H-terminated porous silicon chips (4
chips) were dried under vacuum for 2 hours. Chloroplatinic acid solution (H2PtCl6 8 wt. % in
H2O, 160μL) catalyst was added to the Schlenk flask in the presence of iso-propanol (10 mL)
under nitrogen (N2) followed by allylamine (2 mL, >99% Sigma-Aldrich). The Schlenk flask
was then subjected to 30 min of sonication at room temperature (RT). The resulting reaction
mixture was then filtered and dried under reduced pressure at 60C to remove any
unreacted allylamine and Pt catalyst. The obtained amine-terminated SiNPs were also
washed three times with dichloromethane (CH2Cl2) in order to remove any impurities and
dried under vacuum. A solid brown powder of the amine-terminated SiNPs was obtained.
About thirty milligrams of dry powder was obtained from each reaction. This powder was
re-dissolved in water for further characterization. After the catalytic hydrosilylation reaction
the obtained amine-terminated SiNPs become soluble and highly stable in water and show
blue-green visible photoluminescence when exposed to ultraviolet light.
2.3 Synthesis of Carbohydrates capped SiNPs
2.3.1 Synthesis of Carboxylic Acid Functionalized Carbohydrates
The procedure used to synthesize the carboxylic acid functionalized carbohydrates
was described by Deming and Kramer.28 Galactose and glucose pentaacetate were
commercially available from Sigma-Aldrich UK.
2.3.2 General Procedure to Synthesize Mannose and Lactose pentaacetate (2a
and 4a)
Acetic anhydride (16 mL) was added to a solution of β-D-mannose (3.06 g, 17.0
mmol) in pyridine (15mL, 186 mmol, 11 equiv) at 0C under nitrogen. The reaction mixture
was sealed and kept at -20C for 17 hours. The reaction mixture was slowly poured into ice-
cold water (100 mL) and extracted with ethyl acetate (3 150 mL). The organic layer was
washed with saturated NaHCO3 until the evolution of gases ceased (3 150 mL), and then
washed with water (2 100 mL), then once with brine (1 100 mL). The organic layer was
then dried over Na2SO4 and the solvent was evaporated under vacuum to yield 97% as a
glassy solid.

47
Mannose pentaacetate (2a)
1H NMR (500 MHz, CDCl3) δ = 6.07 (1H, d, J=1.5 Hz), 5.33 (1H, dd, J=2.5, 3.5 Hz), 5.24 (1H, t,
J= 2Hz), 4.26 (1H, dd, J=5, 12.5 Hz), 4.09 (1H, dd, J=2, 2.5 Hz), 4.02-4.05 (1H,m), 2.16 (3H, s),
2.15 (3H, s), 2.08 (3H, s), 2.04 (3H, s), 1.99 (3H, s) ppm; 13C NMR (126 MHz, CDCl3) δ 170.75,
170.10, 169.85, 169.64, 168.17, 90.72, 73.42, 70.73, 68.85, 68.45, 65.66, 62.22, 20.97, 20.88,
20.82, 20.77, 20.75, 20.65 ppm.
β-D-lactose was synthesized following the same route:
β-D-lactose (2g), Acetic anhydride (12.8 mL), pyridine (24 mL), reaction was kept at -20C
for 48 hours.
Lactose octaacetate (4a)
1H NMR (500 MHz, CDCl3) δ = 5.66 (1H, d, J=8.5 Hz), 5.34 (1H, d, J= 3.5 Hz), 5.23 (1H, t, J=9
Hz), 5.1 (1H, t, J=10.5 Hz), 5.03 (1H, t, J=8 Hz), 4.43-4.48 (2H, m), 4.05-4.16 (4H, m), 3.81-
3.89 (2H, m), 2.14 (3H, s), 2.11 (3H, s), 2.09 (3H, s), 2.06 (3H, s), 2.04 (3H, s), 2.03 (3H, s),
2.02 (3H, s), 1.95 (3H, s) ppm; 13C NMR (126 MHz, CDCl3) δ 170.49, 170.44, 170.27, 170.19,
169.75, 169.69, 169.14, 168.99, 101.10, 91.67, 75.81, 73.64, 72.77, 71.10, 70.88, 70.65, 69.14,
66.73, 61.88, 60.97, 60.52, 21.18, 20.97, 20.94, 20.89, 20.77, 20.73, 20.64, 14.33 ppm.
2.3.3 General Procedure for Allylation of Galactose, Glucose and Mannose
Pentaacetate
To a solution of pentaacetate 1a (7.50 g, 19.2 mmol) in dry acetonitrile (40 mL) at
0C under N2 was added allyltrimethylsilane (9.20 mL, 57.6 mmol, 3 equiv). Boron
trifluoride etherate (13.6 mL, 96.1 mmol, 5 equiv) was then added dropwise over fifteen
minutes. The reaction mixture was stirred for 2 hours at 0C and then allowed to warm to
room temperature as stirring continued for an additional 14 hours. The reaction was slowly
poured into saturated NaHCO3 (150 mL) and stirred until the evolution of gases ceased. The

48
mixture was extracted with CH2Cl2 (3 x 100 mL), washed with brine and dried over Na2SO4.
Following evaporation of the solvent under reduced pressure, the crude residue was
purified by flash chromatography on silica (eluent 35-45% EtOAc in hexanes) to give the
product as a clear oil (55-75% yield).
1-Allyl-2,3,4,6-tetra-O-acetyl-β-D-galactopyranoside (1b)
1H NMR (500MHz, CDCl3) δ = 5.69-5.79 (1H, m), 5.39-5.41 (1H, m), 5.23 (1H, dq, J= 6, 11.5
Hz), 5.13-5.14 (1H, m), 5.06-5.11 (1H, m), 4.28 (1H, p, J=6, 12.5 Hz), 4.14-4.22 (1H, m), 4.04-
4.13 (2H, m), 2.41-2.49 (1H, m), 2.22-2.32 (1H, m), 2.10 (3H, s), 2.05 (3H, s), 2.02 (3H,s), 2.01
(3H, s) ppm; 13C NMR (126 MHz, CDCl3) δ 170.57, 170.10, 169.95, 169.83, 133.33, 117.67,
71.44, 68.27, 67.93, 67.60, 61.46, 60.38, 30.93, 20.78, 20.72, 20.66, 14.19 ppm.
Compound 2b was prepared as above.
1-Allyl-2,3,4,6-tetra-O-acetyl-β-D-mannopyranoside (2b)
Yield 65 %. 1H NMR (500MHz, CDCl3) δ = 5.71-5.79 (1H, m), 5.25 (1H, dd, J= 3, 8.5 Hz), 5.17-
5.19 (2H, m), 5.13-5.15 (1H, m), 5.10-5.12 (1H, m), 4.09 (1H, dd, J= 2.5,3 Hz), 4.0-4.04 (1H,
m), 3.86-3.90 (1H, m), 3.60-3.63 (1H, m), 2.46-2.54 (1H, m), 2.37-2.42 (1H, m), 2.10 (3H, s),
2.07 (3H, s), 2.0 (3H, s), 2.01 (3H, s) ppm. 13C NMR (126 MHz, CDCl3) δ = 170.79, 170.31,
170.07, 169.79, 132.64, 118.44, 74.24, 70.75, 70.11, 68.89, 67.11, 62.50, 33.67, 21.05, 20.86,
20.80, 14.30 ppm.
Compound 3b was prepared as above but was stirred at room temperature for 72 hrs.
1-Allyl-2,3,4,6-tetra-O-acetyl-β-D-glucopyranoside (3b)

49
Yield 54 %. 1H NMR (500MHz, CDCl3) δ =5.69-5.77 (1H, m), 5.31 (1H, dd, J = 9, 18 Hz), 5.0-
5.18 (2H, m), 4.87-4.98 (1H, m), 4.24-4.28 (1H, m), 4.19 (1H, dd, J=5.5, 12.5 Hz), 4.04-4.12
(1H, m), 3.83-3.86 (1H, m), 2.50-2.57 (1H, m), 2.29-2.34 (1H, m), 2.05 (3H, s), 2.03 (3H, s),
2.02 (3H, s), 2.01 (3H, s) ppm; 13C NMR (126 MHz, CDCl3) δ 170.79, 170.32, 169.81, 169.54,
133.10, 117.98, 72.06, 70.51, 69.96, 68.95, 68.03, 62.38, 61.60, 31.07, 30.70, 20.86, 20.80,
20.71, 20.59 ppm.
Compound 4b was prepared as above:
Lactose octaacetate 2b (3g), allyltrimethylsilane (1.5 equiv, 12ml), Boron trifluoride etherate
(14.9 mL, 2.5 equiv) and was stirred at room temperature for 72 hrs.
Allyl Lactose (4b)
Yield 55 %. 1H NMR (500 MHz, CDCl3) δ = 5.61-5.70 (1H, m), 5.24-5.29 (2H, m), 5.01-5.07
(2H, m), 4.88-4.91 (2H, m), 4.45 (1H, d, J=8 Hz), 4.27 (1H, dd, J= 2.5, 11.5 Hz), 4.00-4.11 (5H,
m), 3.84 (1H, t, J=7), 3.72-3.75 (1H, m), 2.07 (3H, s), 2.01 (3H, s), 1.99 (3H, s), 1.98 (3H, s),
1.96 (3H, s), 1.95 (3H, s), 1.88 (3H, s) ppm; 13C NMR (126 MHz, CDCl3) δ 170.37, 170.31,
170.07, 169.98, 169.86, 169.55, 169.13, 133.10, 117.69, 101.26, 76.52, 71.44, 70.97, 70.70,
70.05, 70.00, 69.75, 69.09, 66.75, 62.26, 60.91, 60.30, 30.99, 20.96, 20.82, 20.75, 20.70, 20.58,
20.57, 20.45, 14.14 ppm.
2.3.4 General Procedure for Oxidation of 1-Allyl-2,3,4,6-tetra-O-acetyl-β-D-
galacto-, gluco-, and manno-pyranosides
To a solution of 1b (0.755 g, 2.03 mmol) in acetonitrile (8 mL), carbon tetrachloride
(8 mL), and water (12 mL) was added first NaIO4 (1.95 g, 9.13 mmol, 4.5 equiv) followed by
RuCl3 (21.2 mg, 0.08 mmol, 4 mol %,). The reaction was stirred at room temperature for 3
hours then transferred to a separating funnel. After the addition of water (50 mL) the
mixture was extracted with CH2Cl2 (3 x 50mL), and the combined organic phase was washed
with brine (50 mL) and dried over Na2SO4. Following evaporation of the solvent under
reduced pressure, the crude dark brown oil was passed through a silica plug (eluent 100%
EtOAc) to give 1b as white solids. (72-92% yield).
Compound 1c was prepared as above.
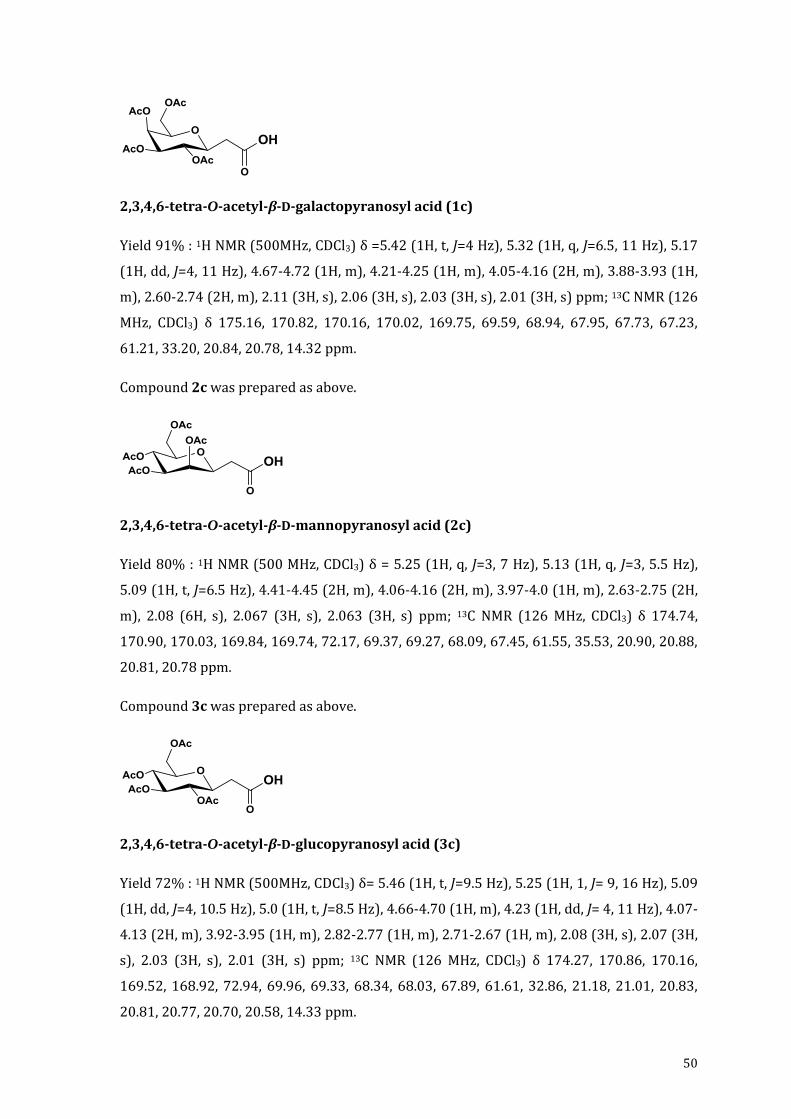
50
2,3,4,6-tetra-O-acetyl-β-D-galactopyranosyl acid (1c)
Yield 91% : 1H NMR (500MHz, CDCl3) δ =5.42 (1H, t, J=4 Hz), 5.32 (1H, q, J=6.5, 11 Hz), 5.17
(1H, dd, J=4, 11 Hz), 4.67-4.72 (1H, m), 4.21-4.25 (1H, m), 4.05-4.16 (2H, m), 3.88-3.93 (1H,
m), 2.60-2.74 (2H, m), 2.11 (3H, s), 2.06 (3H, s), 2.03 (3H, s), 2.01 (3H, s) ppm; 13C NMR (126
MHz, CDCl3) δ 175.16, 170.82, 170.16, 170.02, 169.75, 69.59, 68.94, 67.95, 67.73, 67.23,
61.21, 33.20, 20.84, 20.78, 14.32 ppm.
Compound 2c was prepared as above.
2,3,4,6-tetra-O-acetyl-β-D-mannopyranosyl acid (2c)
Yield 80% : 1H NMR (500 MHz, CDCl3) δ = 5.25 (1H, q, J=3, 7 Hz), 5.13 (1H, q, J=3, 5.5 Hz),
5.09 (1H, t, J=6.5 Hz), 4.41-4.45 (2H, m), 4.06-4.16 (2H, m), 3.97-4.0 (1H, m), 2.63-2.75 (2H,
m), 2.08 (6H, s), 2.067 (3H, s), 2.063 (3H, s) ppm; 13C NMR (126 MHz, CDCl3) δ 174.74,
170.90, 170.03, 169.84, 169.74, 72.17, 69.37, 69.27, 68.09, 67.45, 61.55, 35.53, 20.90, 20.88,
20.81, 20.78 ppm.
Compound 3c was prepared as above.
2,3,4,6-tetra-O-acetyl-β-D-glucopyranosyl acid (3c)
Yield 72% : 1H NMR (500MHz, CDCl3) δ= 5.46 (1H, t, J=9.5 Hz), 5.25 (1H, 1, J= 9, 16 Hz), 5.09
(1H, dd, J=4, 10.5 Hz), 5.0 (1H, t, J=8.5 Hz), 4.66-4.70 (1H, m), 4.23 (1H, dd, J= 4, 11 Hz), 4.07-
4.13 (2H, m), 3.92-3.95 (1H, m), 2.82-2.77 (1H, m), 2.71-2.67 (1H, m), 2.08 (3H, s), 2.07 (3H,
s), 2.03 (3H, s), 2.01 (3H, s) ppm; 13C NMR (126 MHz, CDCl3) δ 174.27, 170.86, 170.16,
169.52, 168.92, 72.94, 69.96, 69.33, 68.34, 68.03, 67.89, 61.61, 32.86, 21.18, 21.01, 20.83,
20.81, 20.77, 20.70, 20.58, 14.33 ppm.

51
Compound 4c was prepared as above.
Acid Lactose (4c)
Yield 81% :1H NMR (500 MHz, CDCl3) δ = 5.34 (1H, d, J=3.5 Hz), 5.31 (1H, t, J=7 Hz), 5.10-
5.13 (1H, m), 5.02 (1H, q, J=5, 7.5 Hz), 4.97 (1H, dd, J=3.5, 10.5 Hz), 4.58 (1H, p, J=5, 9.5), 4.51
(1H, d, J=8), 4.34 (1H, dd, J=3.5, 12 Hz), 4.07-4.17 (6H, m), 3.86-3.91 (2H, m), 3.68 (1H, t, J=7
Hz), 2.76 (1H, q, J=9, 16 Hz), 2.64 (1H, dd, J=5, 15.5 Hz), 2.16 (3H, s), 2.14 (3H, s), 2.09 (3H, s),
2.05 (6H, s), 2.03 (3H, s), 1.96 (3H, s) ppm.
2.3.5 General Procedure to Synthesize Carbohydrate capped SiNPs Using DCC
Coupling Reagent
A corresponding pyranosyl acid (30 mg, 0.078 mmol) and DCC (18 mg, 1.1 equiv,
0.085 mmol) were dissolved in dichloromethane (5 ml) and left, with stirring, for 2 hr at
room temperature. Freshly prepared amine-terminated SiNPs (10 mg) were added into the
reaction mixture and stirred overnight at room temperature. The reaction mixture was
washed with water (3 × 10 mL) and extracted into CH2Cl2. The mixture was dried with
Na2SO4, and solvent was removed under vacuum.
2.3.6 General Procedure to Synthesize Carbohydrate capped SiNPs Using EDC
Coupling Reagent
A corresponding pyranosyl acid (30 mg, 0.078 mmol) and EDC (14 mg, 1 equiv, 0.085
mmol) were dissolved in dichloromethane (5 ml) and left, with stirring, for 2 hr at room
temperature. After 2 hour N-hydroxysuccinimide (NHS) (7 mg, 1 equiv) and freshly
prepared amine terminated SiNPs (10 mg) were dissolved in methanol and added into the
reaction mixture and stirred overnight at room temperature. The reaction mixture was
washed with water (3 × 10 mL) and extracted into CH2Cl2. The mixture was dried with
Na2SO4, and solvent was removed under vacuum.

52
2.3.7 General Procedure for Deacetylation of β-D-galactose mannose, glucose
and lactose capped SiNPs
To a solution of carbohydrate capped SiNPs (30 mg) in methanol (5 mL) was added
0.5 M sodium methoxide in methanol (0.015 mL, 0.0076mmol). The reaction was stirred for
4 hours at room temperature. The reaction mixture was neutralized by stirring with Dowex
50W-X8 [H+] resin for 30 min, filtered, and concentrated to yield a brownish sticky solid of
carbohydrate capped SiNPs (93-98% yield). The obtained SiNPs were characterized by 13C
NMR and FTIR.
2.4 Characterization of Amine terminated SiNPs and Carbohydrate
capped SiNPs
Characterization of the functionalized NPs is essential to address the validity of the
synthetic procedure. A variety of different experimental techniques have been used to
explore the characteristics of the amine terminated and carbohydrate capped SiNPs in an
attempt to understand their influences on properties.
2.5 Optical measurements
All measurements have been performed at standard pressure and room
temperature, unless stated differently.
2.5.1 Photoluminescence Spectroscopy (PL)
Photoluminescence spectroscopy is a non-contact, non-destructive method of
probing the electronic structure of materials. In essence, light is directed onto a sample,
where it is absorbed and where a process called photo-excitation can occur (figure 2.2). The
photo-excitation causes the electrons in a material to jump to a higher electronic state. As it
relaxes, the electrons return to a lower energy level through the release of energy (photons).
The emission of light or luminescence through this process is photoluminescence, PL.
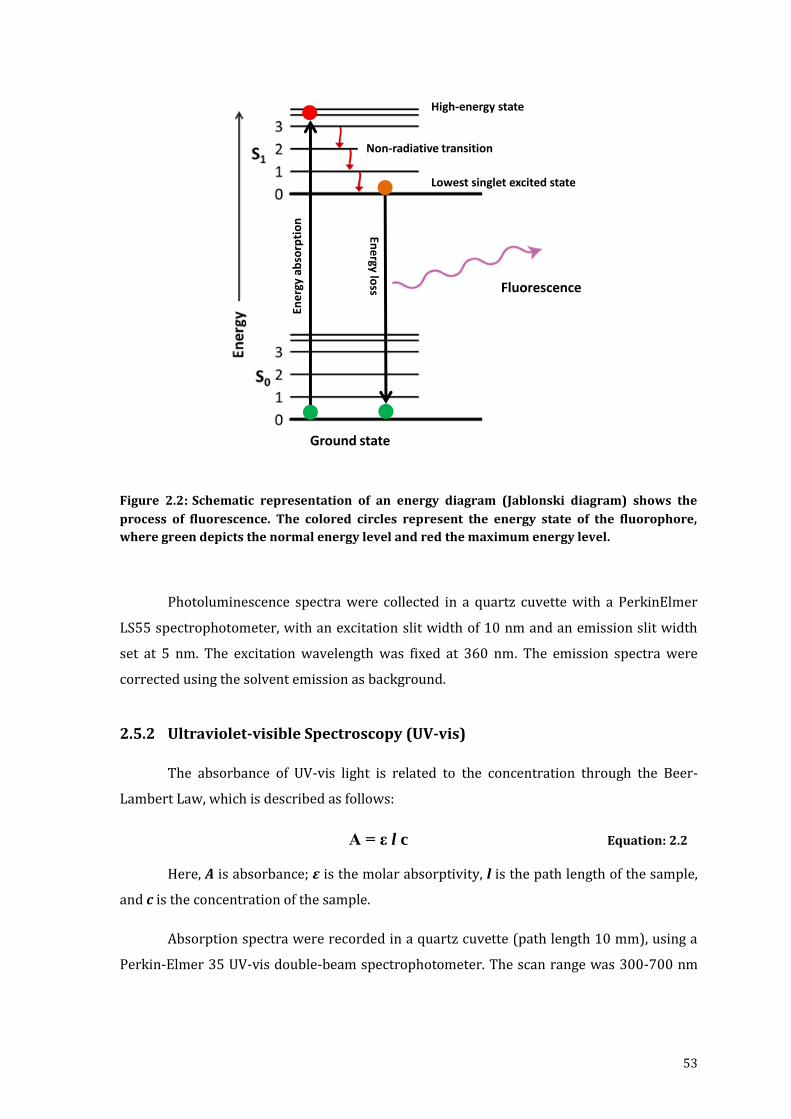
53
Figure 2.2: Schematic representation of an energy diagram (Jablonski diagram) shows the
process of fluorescence. The colored circles represent the energy state of the fluorophore,
where green depicts the normal energy level and red the maximum energy level.
Photoluminescence spectra were collected in a quartz cuvette with a PerkinElmer
LS55 spectrophotometer, with an excitation slit width of 10 nm and an emission slit width
set at 5 nm. The excitation wavelength was fixed at 360 nm. The emission spectra were
corrected using the solvent emission as background.
2.5.2 Ultraviolet-visible Spectroscopy (UV-vis)
The absorbance of UV-vis light is related to the concentration through the Beer-
Lambert Law, which is described as follows:
A = ε l c Equation: 2.2
Here, A is absorbance; ε is the molar absorptivity, l is the path length of the sample,
and c is the concentration of the sample.
Absorption spectra were recorded in a quartz cuvette (path length 10 mm), using a
Perkin-Elmer 35 UV-vis double-beam spectrophotometer. The scan range was 300-700 nm
High-energy state
Lowest singlet excited state
Fluorescence
Non-radiative transition
Ene
rgy
abso
rpti
on
Energy lo
ss
Ground state

54
with a 900 nm/min rate. Absorption spectra are corrected for solvent absorption, by
subtracting the contribution from solvent from the recorded spectrum.
2.5.3 Quantum Yield Measurement
The fluorescence quantum yield is the ratio of the number of photons absorbed to
the number of photons emitted through fluorescence. There are two ways of measuring
quantum yields, called “absolute” and “relative”. While measurements of the absolute
quantum yield require sophisticated instrumentation, it is easier to determine the relative
quantum yield of a fluorophore by comparison to a reference fluorophore with a well-known
quantum yield. There are two methods for relative quantum yield measurements: a single-
point and a comparative method.29 Using the single-point method the quantum yield is
calculated using the integrated emission intensities from a single sample and reference pair
at identical concentrations. The quantum yield of the unknown sample is calculated using
equation 2.3:
Equation: 2.3
Where Q is the quantum yield, I is the integrated intensity, is the refractive index of
the solvent, A is the absorbance. The subscript R refers to the standard fluorophore of a
known quantum yield.
Although this method is fast and easy, it is not always reliable due to the inaccurate
measurement of the fluorophore’s absorbance. The second is the comparative method of
Williams et al., which involves the use of multiple well-characterized references with known
fluorescence quantum yields.30 It is more time consuming but provides much higher
accuracy. In this case, solutions with absorbance between 0.1 and 0.01 were prepared and
the quantum yield is obtained by calculating the slope of the line generated by plotting the
integrated fluorescence intensity against the absorption for multiple concentrations of
fluorophore. The quantum yield can be calculated, using equation 2.4.
(
) (
) Equation: 2.4
Where Q is the quantum yield, and η is the refractive index of the solvent. Grad is the
gradient from the plot of integrated fluorescence intensity vs. absorbance. The subscript R
refers to the reference fluorophore of a known quantum yield. Quinine sulphate (QR =0.546
in 0.5M H2SO4)31 was used as reference in this study.

55
2.6 Size and Dispersity Measurements
2.6.1 Transmission Electron Microscopy (TEM)
Transmission Electron Microscopy (TEM) is an electron-based technique used to
study materials. TEM probes the internal structure of samples to give an access to
morphological fine structural details.
Figure 2.3: Schematic representation of Transition electron microscopy
The instrument is operated under high level of vacuum to avoid scattering of
electrons from the air molecules. TEM uses a beam of electrons that transmit through a thin
sample and are detected on the other side (figure 2.3). Electrons interact very strongly with
matter, giving rise to the ability to use contrast for detection. Dark areas in the image
56
represent regions where electrons do not transmit through, while lighter areas are those
that are more electron transparent.32
In this work, the samples were visualized on a JOEL 2000EX instrument with the
accelerating voltage at 200kV. Dilute suspensions of amine-terminated SiNPs and all
carbohydrate capped SiNPs were prepared in distilled water. Drops of suspension were
placed on carbon-coated 300-mesh copper grid (Agar Scientific). The excess liquid was
wiped away with filter paper, and the grid was dried in air. At least 100 particles were
counted from each sample, and five different regions were scanned to assure representative
results. ImageJ software was used to view and analyze the micrographs.
The High resolution transmission electron microscope images (HRTEM) of amine-
terminated SiNPs were acquired with a Philips CM200 FEGTEM microscope at Leeds
University (Leeds, UK) in collaboration with Prof. Rik Brydson and group.
2.6.2 Dynamic Light Scattering (DLS)
Dynamic Light Scattering (DLS) is also known as Photon Correlation Spectroscopy.
This is an alternative technique for measuring the size of particles, which is typically in the
sub-micron region. Shining a monochromatic light beam, such as a laser, onto a solution with
spherical particles in Brownian motion causes a Doppler Shift when the light hits the moving
particle, changing the wavelength of the incoming light. This change is related to the size of
the particle. The velocity of the Brownian motion is defined by the translational diffusion
coefficient. So the size of a particle can be calculated from the translational diffusion
coefficient by using the Stokes- Einstein equation 2.5;
Equation: 2.5
Where Dh is the hydrodynamic diameter, Dt is translational diffusion coefficient, kB is
the Boltzmann’s constant, T is the absolute temperature, and η is the dynamic viscosity. The
diameter that is measured in DLS is a value that refers to how a particle diffuses within a
fluid so it is referred to as a hydrodynamic diameter. Measurements of the hydrodynamic
diameter of amine-terminated SiNPs and carbohydrate capped SiNPs were performed in a
variety of solvents including distilled water, absolute ethanol, dichloromethane, including
biological solvents like phosphate buffer saline (PBS) and in biological media such as DMEM
(Dulbecco’s modified essential medium), RPMI (Roswell Park Memorial Institute medium)
and MMR (Marc's Modified Ringers) using a Zetasizer Nano ZS (Malvern Instruments,

57
Malvern, UK). The scattered photons were detected under an angle of 173°, and the relative
number distribution was obtained. In order to obtain accurate measurements
ultrasonication (2 min) and filtration (Whatman Anotop 25 0.2µm 25mm Syringe Filters)
were applied before any measurement.
2.7 Chemical Analysis
2.7.1 Nuclear Magnetic Resonance Spectroscopy (NMR)
The selective absorption of electromagnetic radiation by the nuclei of atoms placed
in the presence of strong magnetic field is called as NMR spectroscopy. The nuclei of
different atoms absorb unique frequencies of radiation depending on their environment,
thus by analyzing these frequencies which are absorbed by a sample placed in a strong
magnetic field, the sample is analyzed. NMR spectroscopy is widely used to get the molecular
information of the compounds and to understand the structure of the compounds.
1H and 13C NMR (500 MHz) spectra of samples in D2O and CDCl3 were recorded on a
Bruker 500 MHz spectrometer. The fresh sample was dried under vacuum and re-dissolved
in D2O and CDCl3, respectively.
2.7.2 Fourier Transform Infrared Spectroscopy (FTIR)
Fourier Transform Infrared Spectroscopy (FTIR) most commonly deals with an
infrared radiation range of 4500 cm-1 to 500 cm-1. The molecules or parts of the molecules
absorb the radiation at specific frequencies and give structural information. It is a very
powerful tool for identifying types of chemical bonds in a molecule. In the case of
nanoparticles surface functionalization is necessary to stabilize them and therefore changing
the functionalization from one group to another could be confirmed by the appearance of
the new group and disappearance of the reacted group. Solution spectra gave weak signals,
so it was better to measure powder samples using Attenuated Total Reflection (ATR)
Fourier Transform-Infra-Red (FT-IR) spectroscopy. The instrument used was a Perkin-
Elmer 65 FTIR spectrometer with a SensIR single pass diamond ATR attachment. The solid
sample of NPs was placed directly on the ATR crystal and the spectra corrected by the
background signal.
In this work Synchrotron radiation FTIR microscopy was also used to analyze the
samples by mapping the interesting area and to obtain the structural information of
carbohydrate capped SiNPs. The crystals of carbohydrate capped SiNPs were mainly

58
characterized with 3D Synchrotron radiation FTIR by mapping the crystal. The carbohydrate
capped SiNPs were also analyzed inside the biological cells. Using synchrotron radiation
(SR) IR microscopy gives a high spatial resolution and signal-to-noise ratio for cell study.
The principle of FTIR microscopy is to couple an FTIR spectrometer with a microscope using
the synchrotron emission in the infrared domain as a source of light. It enables on one hand
to visualize the sample and to choose specifically the region for analysis and on the other
hand to carry out two-dimensional acquisitions by raster scanning the sample. Infrared
spectra are acquired at each pixel of 1D or 2D maps, and chemical maps can thus be derived.
Compared to classical laboratory sources, the synchrotron radiation brightness is far greater
and enables the beam size to be reduced below 10µm without a significant loss of photons.
The measurements were performed with a Bruker IFS66V FTIR Microscope: Bruker
Hyperion 3000, Detector: 100x100 mikron MCT (MIR) at beam line D7 in MAX-lab at Lund,
Sweden.
The biological cell samples were analyzed with a Bruker Vertex 80 V Fourier
Transform IR Interferometer Microscope: Hyperion 3000 microscope, Detector: 100x100
MCT broadband at beam line B22 of Diamond at Oxfordshire, UK.
2.7.3 X-ray Photoelectron Spectroscopy (XPS)
X-ray photoelectron spectroscopy is one of the surface analytical techniques that
bombard the sample with photons, electrons or ions in order to excite the emission of
photons, electrons or ions. It is also known as ESCA (electron spectroscopy for chemical
analysis) and was developed by the group of Siegbahn at the University of Uppsala in
Sweden.
The sample is irradiated with photons of energy h which interact with the sample
by exchanging enough energy (see figure 2.4). The electrons from the inner orbital near the
surface of the material gets excited and result in ejection of electrons. Depending upon the
photon energy the electrons will jump from the solid state and get detected. Ejected core
electrons have a specific kinetic energy (Ek) that is related to the energy of the exciting
photon (h), the binding energy of the electron to the atom (Eb) and the characteristic work
function of the material () by the relation shown in equation 2.6:
Ek = hν – Eb - ɸ Equation: 2.6
Every element has a specific binding energy associated with each atomic orbital,
such that each element will give rise to a characteristic set of peaks in the photoelectron

59
spectrum at kinetic energies determined by the photon energy and the respective binding
energies.
Figure 2.4: Schematic representation of X-ray Photoelectron spectrometer equipped with an x-
ray source and a hemispherical analyzer
The measurements were performed with a SCIENTA ESCA300 XPS analyzer at the
National Centre for Electron Spectroscopy and Surface Analysis (NCESS), Daresbury
Laboratory, U.K. A few drops of the suspension of SiNPs sonicated in dichloromethane were
cast onto a freshly cleaned gold substrate. The sample was introduced immediately into a
nitrogen-filled locked chamber and allowed to dry before being transferred into the
instrument chamber where the base pressure was kept below 1 × 10⁻⁸ mbar. All spectra
were acquired at room temperature in normal emission, and the energy resolution was kept
under 0.4 eV. In all photoemission spectra, binding energies (Eb) were referenced to the
Au4f7/2 line measured on a gold foil in direct electrical contact with the sample, which was
found at Eb of 83 eV.
Electron energyanalyzer
Sample
UHV Pump
UHV Chamber
Entrance slit
Electron optics
Exit slit
e- Detector
e-
e-
60
2.8 Biological Studies
2.8.1 Culture of Cell Lines
Six mammalian cell lines including MCF-7 (human breast adenocarcinoma), HHL-5
(immortalized human hepatocytes), HepG2 (human liver hepatocellular carcinoma), A549
(Human lung adenocarcinoma epithelial cell line), MDCK (Madin Darby canine kidney cells),
SK-Mel (Human Melanoma cell line) were used in the study. The cell culture facilities and
cells were kindly provided by Dr. Victoria Sherwood (School of Pharmacy, UEA). Some of the
cell lines such as MCF-7, HHL5 and HepG2 were generously supplied by Dr.Yongping Bao
(Biomedical Research Centre, UEA). All cell lines are adherent cell lines, which grow in vitro
until they have covered the available surface area or the medium nutrients are depleted. At
this point the cell lines should be subcultured in order to prevent cell death.
In general, cells were subcultured when they reached 80% confluence. The old cell
medium was removed by 10 mL pipette then cells were washed with pre-warmed (37°C)
Phosphate Buffered Saline (PBS). This approach was done by carefully pipetting PBS into the
flask, gently mixing by tilting the flask from side to side twice. Cells were detached by adding
1mL Trypsin/EDTA (0.25%, Invitrogen, Carlsbad, CA), and incubated at 37°C for 5-10 min.
Trypsin was deactivated by adding 5 mL fresh media. Cells were maintained at 37°C in a
humidified 5% CO2 atmosphere. The medium was changed every two-three days and the
cells often checked under the microscope.
All cell lines were incubated with required medium supplements according to the
European Collection of Cell Cultures (ECACC) recommendation. MCF-7, HepG2, HHL-5,
MDCK, SK-Mel were cultured in Dulbecco’s modified essential medium (DMEM, Invitrogen,
Carlsbad, CA) supplemented with 10% Fetal Bovine Serum (FBS, biosera). A549 was
cultured in Roswell Park Memorial Institute medium (RPMI, Invitrogen, Carlsbad, CA)
supplemented with 10% Fetal Bovine Serum (FBS, biosera). All media contained 1%
Penicillin/ Streptomycin (P/S, 5000u) (Invitrogen, Carlsbad, CA) and 1% L-Glutamine
(200mM) (Invitrogen, Carlsbad, CA).

61
2.9 Cytotoxicity Studies
2.9.1 In Vivo Toxicity Assay in Xenopus laevis
2.9.1.1 Obtaining Embryos
The Xenopus embryos were kindly supplied by Dr. Grant N. Wheeler (Biological
science, UEA) in collaboration with Dr. Victoria Sherwood (School of Pharmacy, UEA)
Female Xenopus laevis were primed by injection of 100 units of pregnant mare serum
gonadotrophin (PMSG) into the dorsal lymph sac 5-7 days before the eggs were required.
Ovulation was then induced by injection of 250μl of human chorionic gonadotrophin (hCG)
into each dorsal lymph sac. After 14–16 hrs at 18°C, the eggs were liberated into a petri dish
from the female by manual squeezing of the abdomen. Eggs can be collected once every hour,
6 times a day per frog. Testis were removed from a sacrificed male Xenopus and stored in
testes buffer. A portion of the testis was rubbed on the isolated eggs. The eggs were then
covered, for 5 min at 18°C, by testes that have been homogenized in MMR. Concentration of
the salt solution was reduced to 0.1 x MMR and the eggs were left for 20 min at 18°C for
fertilization. The eggs were placed in a beaker containing 2% cysteine pH 8.0 dissolved in
MMR and gently stirred to remove the jelly coat the eggs are encased in. Cysteine was
removed by washing in MMR followed by a wash of 0.1 x MMR. Embryos were left at
different temperatures to control the rate of development until they were at the required
stage according to Nieuwkoop and Faber (NF) (Nieuwkoop and Faber, 1956). The eggs were
cleaned once every hour in 0.1 x MMR and gentamycin until they reached the necessary
stage. Any dead embryos were removed.
Reagents: 2% cysteine (pH 8) in MMR, MMR (pH 7.5) (100mM NaCl, 5nM HEPES, 2mM KCl,
2nM CaCl2, 1mM MgCl2), 0.1 x MMR (pH 7.5) (10mM NaCl, 0.5 mM HEPES, 0.2mM KCl,
0.2mM CaCl2, 0.1mM MgCl2), Testes buffer (pH 7.5) (100% FCS, MMR (4:1), 1:1000
gentamycin).
2.9.1.2 Exposure to Silicon Nanoparticles
Live embryos were collected for exposure to SiNPs at NF stages 4, 15, and 38, as
described in 2.9.1.1. The stages of Xenopus were selected to assess NP toxicity during key
stages of the development of an organism. These stages correlate to pre-gastrulation (NF
stage 4), pre-neuralation (NF stage 15), and pre-tadpole (NF stage 38). Concentrations of
NPs were made up using serial dilutions in 0.1 x MMR, total volume 500μl per well. In a 24-

62
well plate, 5 embryos per well were collected in 500μl of 0.1 x MMR and added to the NPs,
total volume 1000 μl per well.
Embryos were incubated, exposed to NPs, at 18°C until the required NF stage.
Embryos exposed to NPs at NF stages 4 and 15 were fixed, as described in 2.9.1.3, at NF
stage 38. Those that were exposed to NPs at NF stage 38 were fixed at NF stage 45.
2.9.1.3 Fixing Embryos
Once the embryos reached the required stage they were washed in 0.1 x MMR and
fixed in MEMFA. The embryos were left in MEMFA for 1hr at room temperature or overnight
at 4°C. After 2 washes in PBS all embryos were ranked by phenotypic abnormalities. Once
ranked, the embryos were dehydrated in increasing concentrations of methanol, 25%, 50%,
and 75%, before being stored at -20°C in 100% MeOH.
The embryos were rehydrated using decreasing concentrations of MeOH, 75%, 50%,
and 25% and 2 washes of PBST, before imaging.
Reagents: MEMFA (3.7% formaldehyde, MEM salts, MQW (1:1:8)), PBST (pH 7.2) (8g NaCl,
0.2g KCl, 1.44g Na2HPO4, 0.24g KH2PO4, 2 ml Tween- 20, 800 ml MQW), MeOH.
2.9.2 Colourimetric MTT Assay (In Vitro)
To evaluate the influence of cell proliferation by carbohydrates capped SiNPs and
amine terminated SiNPs, an MTT (3-(4,5-dimethylthiazol-2-yl)-2,5 diphenyltetrazolium
bromide) assay was performed to determine cell viability. MTT measures mitochondrial
activity using tetrazolium salts as mitochondrial dehydrogenase enzymes cleave the
tetrazolium ring, which only occurs in living cells.33 HHL-5, HepG2, MDCK and A549 cells
were seeded in a 96- wells plate (Applied Biosystems) for 72 hours. Then, the cells were
stimulated with samples at various concentrations (50, 300, 500, 700 and 1000μg /mL) for
72 hours. After incubation for specified times, the medium was removed. 10μL of MTT
(Sigma-Aldrich) solution (5mg/mL in sterile water) mixed with 100μL fresh medium was
added to each well, including controls. After four hours incubation at 37°C, the medium was
removed, and formazan was solubilized in dimethylsulfoxide (DMSO, Sigma-Aldrich). The
absorbance was recorded on a microplate reader at the wavelength of 560 nm, blanking on
control wells. The percentage of viable cells was estimated by comparison with the
untreated control cells. All experiments were repeated at least on three different occasions.

63
2.10 Bioimaging Studies
2.10.1 Microscope Slide Preparation
Cells were grown on cover slips (VWR international, size 18 mm, thickness 0.16 mm)
which were each set in 35 mm not TC- treated culture dish (Corning®). Approx. 1mL fresh
medium was added in each pre-marked culture dishes. Cells were grown on cover slips until
approx. 50% confluent. The growth medium was then removed and 50, 150 and 300 μg /mL
of sample were added on top of the cells (Control was also made at the same time). Various
incubation times (24 hrs, 48 hrs and 72 hrs) at 37°C were used. The cells were then rinsed in
PBS and fixed either by a Methanol or Paraformaldehyde solution for 10 min. Then, a drop
(approximately 2μL) of fluorescent mounting medium (VECTASHIELD® hard, Vector Labs)
was added on top of the microscope slide. The cover slip in which cells were grown was
turned upside down on top of the mounting medium. The slide was then dried in the fridge
for approx. 30 min before use.
2.10.2 Cell Staining
The glass cover slips were taken out from the well plate and carefully placed on
parafilm (small plastic box covered with parafilm) surrounded by a damp cloth or wet tissue
(to prevent the cells from dehydration). The cells were fixed with paraformaldehyde
solution (approx. 300 µl) to envelop all the glass cover slip, for 10 min. After that time the
solution was taken out carefully using a small suction pump, then permeablise buffer
solution was mounted on the cover slip and left for 5 min. The solution was then removed by
suction and the cells were washed with wash buffer (4 × 300 µL). Texas Red®-X Phalloidin
(6 µM) or LysoTracker® Red (50 nM) in PBS solution was mounted on the cover slips
(making sure all the cell area was covered) and left for 20 min in the dark. After that time,
the solution was removed by suction and DAPI (300 nM in PBS) was added on the cover
slips to stain the nuclei. After 5 min the DAPI solution was removed and cells were washed
once with permeablise buffer and with wash buffer (6 × 300 µL). The cells were fixed with
paraformaldehyde solution (300 µL) for 10 min and washed with wash buffer (3 × 300 µL).
Then, a drop (approximately 2μL) of fluorescent mounting medium (VECTASHIELD® hard,
Vector Labs) was added on top of the microscope slide. The cover slip which cells were
grown in was dipped into water, tapped on tissue paper and turned upside down on top of
the mounting medium. The slide was then dried in the fridge for approx. 30 min before use.

64
Permeablise buffer: PBS, 1% fetal calf serum, 0.1% sodium azide, 0.1 % saponin (pH 7.4-
7.6, adjusted by adding drops of NaOH)
2.10.3 Fluorescence Microscopy
The Fluorescence microscope uses a much higher intensity light source, which
excites a fluorescent species in a sample. In most cases the sample is labeled with a
fluorescent substance known as a fluorophore and then illuminated through the lens with
the higher energy source. The illumination light is absorbed by the fluorophores and causes
them to emit a longer wavelength (lower energy) light that produces the magnified image
instead of the original light source by a special dichroic mirror, which reflects light shorter
than a certain wavelength, and passes light longer than that wavelength. The fluorescent
microscopy analysis for bioimaging was performed using a Leica TCS inverted fluorescence
microscope with green/blue (carbohydrates capped SiNP) and red (LysoTracker® Red or
Texas Red®-X Phalloidin) filters.
2.10.4 Confocal Laser Scanning Microscopy
Compared to fluorescent microscopy, confocal microscopy has an additional pinhole,
which is efficient at rejecting out of focus fluorescent light. The pinhole is conjugated to the
focal point of the lens, thus it is a confocal pinhole.34 Figure 2.5 shows the internal workings
of a confocal microscope. By scanning many thin sections through a sample, a very clean
three-dimensional image of the sample can be built up. In this study, cells were observed
using a laser scanning confocal microscope Zeiss 510 LSM through a 40 x 1.30 NA oil
immersion objective lens. The pinhole was set to one Airy. Carbohydrates capped SiNPs
were excited using a 488 nm laser. LysoTrcker-Red was excited using 577 nm laser and
Texas Red®-X phalloidin red (Life technologies Ltd) was excited using 591 nm laser.

65
Figure 2.5: Internal workings of a confocal microscope-reproduced from Prasad et al.34
First, the laser light is directed by a dichroic mirror towards a pair of rotating
mirrors that scan the light in x and y axis. Then, the light passes through the microscope
objective and excites the sample. The fluoresced light from the sample passes back through
the objective, followed by the same set of rotating mirrors used to scan the sample. After
that, the light passes through the dichroic mirror through a pinhole placed in the confocal
plane of the sample. The pinhole thus rejects all out-of-focus light arriving from the sample.
Finally the light that emerges from the pinhole is measured by a detector.
2.11 Cellular Uptake
Cells were selected to investigate in vitro uptake of amine capped SiNPs and
carbohydrates capped SiNPs. Cells were seeded on 12-well plates with cover slips at a
density of 104 cells per well and exposed to 50, 150 or 300 μg /mL of SiNPs for 1–24 hours.
The cells were then washed twice by PBS (Gibco®) and fixed by ice-cold methanol (Fisher
Chemical) or Paraformaldehyde. Cover slips with intact cells were inverted and mounted on
a microscope slide using mounting gel. The images were taken under a confocal microscope
(Zeiss LSM510 META system) using a 40 × oil immersion objective lens. DAPI produced a
blue fluorescence with an excitation wavelength 380 nm and emission at 460 nm. The SiNPs
laser
detector
Rotatingmirror
Dichromatic mirror
Rotatingmirror
Microscope
Fluorescent specimen
PinholeAperture
PinholeAperture
Focal plane

66
were excited at GFP region 488 nm, whereas the LysoTrcker-Red was excited using 577 nm
laser and Texas Red®-X phalloidin red was excited using 591 nm laser.
2.12 Flow Cytometry
Flow cytometers have been used in many biological applications to measure both
light scattering and fluorescence from particles or biological cells.35 It is able to characterize
individual cells with fluorophore labels, which provide semi quantitative information of
cellular uptake of the NPs. It supplies excitation energy with lasers and detects fluorescent
emissions with a range of filters and detectors. It can also measure the size of a cell using
forward scatter, and the granularity of a cell using side scatter.36
In our experiments, cells were seeded on 24-wells plate at a density of 3 × 10⁴ cells
per well and incubated at 37°C overnight. After treatment with 50, 100, 200, 300 μg /mL of
SiNPs at different time point from 1–72 hrs cells were harvested by trypsinisation
and suspended in the medium (300 μL). Then the cells were immediately taken to perform
Flow cytometry. Flow cytometry was performed with an Accuri C6 Flow Cytometer System
using 380 nm excitation with 10,000 events from each sample, and analysis was performed
using FlowJo software.
2.13 Statistics
All data are representative of at least three independent experiments. Data are
presented as means ± standard deviation (S.D). Statistical significance was determined using
a one-way analysis of variance between the two groups.

67
2.14 References
1. A Uhlir, Electrolytic shaping of germanium and silicon. The Bell System Technical Journal 1956, 35, 333-347.
2. Dillon, A.; Robinson, M.; Han, M.; George, S., Diethylsilane decomposition on silicon surfaces studied using transmission FTIR spectroscopy. Journal of the Electrochemical Society 1992, 139, 537-543.
3. Gupta, P.; Dillon, A.; Bracker, A.; George, S., FTIR studies of H2O and D2O decomposition on porous silicon surfaces. Surface Science 1991, 243, 360-372.
4. Anderson, R. C.; Muller, R. S.; Tobias, C. W., Investigations of porous silicon for vapor sensing. Sensors and Actuators. A: Physical 1990, 23, 835 – 839.
5. Cullis, A. G.; Canham, L. T.; Calcott, P. D. J., The structural and luminescence properties of porous silicon. Journal of Applied Physics 1997, 82 (3), 909-965.
6. Hamilton, B., Porous silicon. Semiconductor Science and Technology. 1995, 10, 1187 – 1207.
7. Lehmann, V.; Gösele, U., Porous silicon formation: A quantum wire effect. Applied Physics Letters 1991, 58 (8), 856-858.
8. Linford, M.; Chidsey, C., Alkyl monolayers covalently bonded to silicon surfaces. Journal of the American Chemical Society 1993, 115, 12631 – 12632.
9. Linford, M.; Fenter, P.; Eisenberger, P.; Chidsey, C., Alkyl monolayers on silicon prepared from 1-alkenes and hydrogen-terminated silicon. Journal of the American Chemical Society 1995, 117, 3145 – 3155.
10. Linford, M. R.; Chidsey, C. E. D., Alkyl monolayers covalently bonded to silicon surfaces. Journal of the American Chemical Society 1993, 115 (26), 12631-12632.
11. Linford, M. R.; Fenter, P.; Eisenberger, P. M.; Chidsey, C. E. D., Alkyl Monolayers on Silicon Prepared from 1-Alkenes and Hydrogen-Terminated Silicon. Journal of the American Chemical Society 1995, 117 (11), 3145-3155.
12. Bateman, J.; Eagling, R.; Worrall, D.; Horrocks, B.; Houlton, A., Alky- lation of porous silicon by direct reaction with alkenes and alkynes. Angewandte Chemie- International Edition 1998, 37, 2683-2685.
13. Gurtner, C.; Wun, A.; Sailor, M., Surface modification of porous silicon by electrochemical reduction of organo halides. Angewandte Chemie-International Edition 1999, 38, 1966-1968.
14. Effenberger, F.; Götz, G.; Bidlingmaier, B.; Wezstein, M., Photoactivated Preparation and Patterning of Self-Assembled Monolayers with 1-Alkenes and Aldehydes on Silicon Hydride Surfaces. Angewandte Chemie International Edition 1998, 37 (18), 2462-2464.
15. Cicero, R. L.; Linford, M. R.; Chidsey, C. E. D., Photoreactivity of Unsaturated Compounds with Hydrogen-Terminated Silicon(111). Langmuir 2000, 16 (13), 5688-5695.
16. Stewart, M. P.; Buriak, J. M., Exciton-Mediated Hydrosilylation on Photoluminescent Nanocrystalline Silicon. Journal of the American Chemical Society 2001, 123 (32), 7821-7830.

68
17. Sung, M. M.; Kluth, G. J.; Yauw, O. W.; Maboudian, R., Thermal Behavior of Alkyl Monolayers on Silicon Surfaces. Langmuir 1997, 13 (23), 6164-6168.
18. Bateman, J. E.; Eagling, R. D.; Worrall, D. R.; Horrocks, B. R.; Houlton, A., Alkylation of Porous Silicon by Direct Reaction with Alkenes and Alkynes. Angewandte Chemie International Edition 1998, 37 (19), 2683-2685.
19. Boukherroub, R.; Wojtyk, J. T. C.; Wayner, D. D. M.; Lockwood, D. J., Thermal Hydrosilylation of Undecylenic Acid with Porous Silicon. Journal of The Electrochemical Society 2002, 149 (2), H59-H63.
20. Wayner, D. D. M.; Wolkow, R. A., Organic modification of hydrogen terminated silicon surfaces1. Journal of the Chemical Society, Perkin Transactions 2 2002, (1), 23-34.
21. Zazzera, L. A.; Evans, J. F.; Deruelle, M.; Tirrell, M.; Kessel, C. R.; Mckeown, P., Bonding Organic Molecules to Hydrogen‚ÄêTerminated Silicon Wafers. ournal of The Electrochemical Society 1997, 144 (6), 2184-2189.
22. M. Buriak, J., Organometallic chemistry on silicon surfaces: formation of functional monolayers bound through Si-C bonds. Chemical Communications 1999, (12), 1051-1060.
23. Schmeltzer, J. M.; Porter, L. A.; Stewart, M. P.; Buriak, J. M., Hydride Abstraction Initiated Hydrosilylation of Terminal Alkenes and Alkynes on Porous Silicon. Langmuir 2002, 18 (8), 2971-2974.
24. Speier, J. L., Homogeneous Catalysis of Hydrosilation by Transition Metals. In Advances in Organometallic Chemistry, Stone, F. G. A.; Robert, W., Eds. Academic Press: 1979; Vol. Volume 17, pp 407-447.
25. Chalk, A. J.; Harrod, J. F., Homogeneous Catalysis. II. The Mechanism of the Hydrosilation of Olefins Catalyzed by Group VIII Metal Complexes1. Journal of the American Chemical Society 1965, 87 (1), 16-21.
26. Tilley, T. D., Transition-Metal Silyl Derivatives. In Organic Silicon Compounds (1989), John Wiley & Sons, Ltd: 2004; pp 1415-1477.
27. Harrod, J. F.; Chalk, A. J., In Organic Synthesis via Metal Carbonyls. Eds.: John Wiley & Sons Ltd.: New York, 1977; Vol. 2.
28. Kramer, J. R.; Deming, T. J., Glycopolypeptides via Living Polymerization of Glycosylated-l-lysine N-Carboxyanhydrides. Journal of the American Chemical Society 2010, 132 (42), 15068-15071.
29. Lakowicz, J. R., Principles of Fluorescence Spectroscopy. Kluwer Acad./Plenum Publ.: 1999.
30. Williams, A. T. R.; Winfield, S. A.; Miller, J. N., Relative fluorescence quantum yields using a computer-controlled luminescence spectrometer. Analyst 1983, 108 (1290), 1067-1071.
31. Eaton, D. F., Reference materials for fluorescence measurement. Pure Applied Chemistyr 1988, 60, 1107-1114.
32. Keyse, R. J.; Garratt-Reed, A. J.; Goodhew, P. J.; Lorimer, G. W., Introduction To Scanning Transmission Electron Microscopy. Spinger-Verlag: New York, 1998.
33. Sayes, C. M.; Fortner, J. D.; Guo, W.; Lyon, D.; Boyd, A. M.; Ausman, K. D.; Tao, Y. J.; Sitharaman, B.; Wilson, L. J.; Hughes, J. B.; West, J. L.; Colvin, V. L., The Differential Cytotoxicity of Water-Soluble Fullerenes. Nano Letters 2004, 4 (10), 1881-1887.

69
34. Prasad, V.; Semwogerere, D.; Weeks, E. R., Confocal microscopy of colloids. Journal of Physics: Condensed Matter 2007, 19 (11), 113102.
35. Kumar, A.; Pandey, A. K.; Singh, S. S.; Shanker, R.; Dhawan, A., A flow cytometric method to assess nanoparticle uptake in bacteria. Cytometry Part A 2011, 79A (9), 707-712.
36. Zucker, R. M.; Massaro, E. J.; Sanders, K. M.; Degn, L. L.; Boyes, W. K., Detection of TiO2 nanoparticles in cells by flow cytometry. Cytometry Part A 2010, 77A (7), 677-685.

70
3 Highly Luminescent and Nontoxic Amine-Capped silicon
Nanoparticles from Porous Silicon: Synthesis and Their
Use in Biomedical Imaging
Part of this chapter is published as:
“Highly Luminescent and Nontoxic Amine-Capped Nanoparticles from Porous Silicon: Synthesis and
Their Use in Biomedical Imaging”, Jayshree H. Ahire, Qi Wang, Paul R. Coxon, Girish Malhotra,
Rik Brydson, Rongjun Chen, and Yimin Chao, ACS Applied Materials & Interfaces 2012, 4 (6), 3285-
3292.
Si
H
H
H
H H
H
H
H
SiH2N
H2NNH2
NH2
H2N
NH2NH2
NH2
NH2
H2PtCl6

71
3.1 Introduction and Motivation
Silicon nanoparticles (SiNPs), or “quantum dots” (QDs), have attracted tremendous
interest from the scientific community because of their unique characteristics that differ
from those of their bulk counterparts, such as novel optical, catalytic, electronic, and
mechanical properties.1, 2 At nanometer scales, silicon exhibits visible photoluminescence
(PL) because of the quantum confinement effect that can be exploited for uses in electronic
and photonic devices.3, 4 Furthermore, SiNPs have several advantages in biological
applications such as size-dependant tuneable light emission,5-7 high brightness,8 great
stability against photobleaching compared to organic dye molecules9, 10 and also SiNPs
exhibit a low inherent toxicity in comparison with other types of semiconductor quantum
dots, which can pose significant risks to human health.11-14 The combination of these
properties opens a new avenue of SiNPs for optoelectronic and bioimaging purposes.
For SiNPs to be employed within biomedical applications, it is essential that they are
water-soluble and hydrophilic to prevent aggregation and precipitation in a biological
environment, have a substantial photoluminescence quantum yield in the visible region and
a fast radiative recombination rate. The chemical processes used to terminate the surfaces of
the SiNPs change the internal electronic structure and thus play an important role in the
resultant emission wavelength, radiative lifetime, and ultimately determine the solubility.15
As mentioned in Chapter 1 silicon nanoparticles can be synthesized by a wide range
of chemical or physical methods, including solution routes using a variety of reducing
agents,16, 17 micro-emulsion techniques,18, 19 ultrasonic dispersion of electrochemically
etched silicon,3, 20, 21 laser-induced pyrolysis of silane,22, 23 and synthesis in inverse micelles10.
The H-terminated SiNPs obtained by electrochemical etching are very prone to
oxidation therefore surface functionalization is necessary in order to stabilise them in a
biological environment. A good surface functionalization increases the stability and
dispersity in a wide range of solvents, helps to increase the brightness of photoluminescence
(Quantum yield) and stabilises through a wide range of pHs.
For instance Warner et al. in 2005 synthesized amine-terminated SiNPs by using
Lithium aluminium hydride (LiAlH4) as a reducing agent to reduce micelles of silicon
tetrachloride (SiCl4) within inverse micelles. The obtained H-capped SiNPs were
functionalized with allylamine using a platinum catalysed hydrosilylation reaction. They
demonstrated the application of amine-terminated SiNPs in bioimaging using HeLa cells.10 In
a subsequent contribution, M Rosso-Vasic et al in 2009 synthesized amine-terminated SiNPs

72
again by the reduction of inverse micelles by capping with different amine linkers using
platinum catalysed hydrosilylation.24 They demonstrated the influence of amine groups and
linker lengths on the optical properties of alkylamine-functionalized SiNPs they also
determined their band gap and examined their cellular uptake by regulating their location
inside the cell and the behaviour of cells after labelling.
In this chapter we have demonstrated a simple room-temperature synthesis of
amine-terminated SiNPs, which are soluble in water and exhibit strong blue
photoluminescence. These amine-terminated SiNPs are made from H-terminated SiNPs, a
common starting material ideally suited for further functionalization. The H-terminated
SiNPs are cleaved from a porous layer of an electrochemically etched silicon wafer in
hydrofluoric acid (HF) and ethanol in a simple and short reaction step. This is a key
difference from other reported syntheses of amine-terminated SiNPs, which typically
involve an intermediate step before the final capping layer which is time consuming; the
chemical synthesis route leaves multiple starting material impurities in the final product
which are often toxic to cells. Moreover, due to the impurities, the functionalised SiNPs lose
stability in solvents and are responsible for decreasing the quantum yield of the SiNPs.
Here, a dried powder of nanoparticles can be obtained in under 4 h, at room
temperature, and uses a simple metallic catalyst which is easily removed and ensures a pure
final product. The advantages of using H-terminated porous SiNPs as a starting material lie
in the relative simplicity of its preparation and excluding the necessary etching fluids, is a
relatively environmentally friendly process. Nanoparticles are widely anticipated to be used
in a growing number of commercial and clinical products and devices,25 and so health and
environmental impact of the synthesis, handling procedures and the nanoparticles
themselves are likely to come under increasing scrutiny.
3.2 Synthesis of H-terminated Porous Silicon NPs
A hydrogen-terminated layer of porous silicon was formed by electrochemical
etching of a boron-doped p-Si (100) as described previously in Chapter 2. In order to obtain
highly luminescent H-terminated SiNPs with a good surface coverage we performed several
experiments by changing the current density and time as summarized in Table 3.1.

73
Table 3.1: Surface morphology of Si chips etched at various current and time setting
A layer of dark brownish luminescent porous silicon powder was obtained after
cleaving the porous silicon layer from the surface of the silicon wafer by electrochemical
etching using high current density (>200 mA, Table 3.1). As the current density was
increased, the fluorescence of SiNPs powder changed from red to orange, as observed under
illumination from a handheld mercury lamp (λ= 365 nm). These results are in agreement
with other studies of porous silicon.16, 19 At 400 mA, the amount of H-terminated SiNPs yield
was increased along with increasing current density and etching time (Table 3.1). Thus, for

74
the best result, safety and convenience, the electrochemical etching parameter was set at
400 mA/5min throughout this work.
The obtained H-terminated SiNPs are unstable as they undergo oxidation in air; to
stabilize them surface functionalization is necessary. Functionalization of SiNPs using
allylamine makes them stable to oxidation and soluble in polar solvents such as water and
alcohols.7, 14
3.3 Synthesis of Amine-terminated SiNPs Using Thermally Induced
Hydrosilylation Reaction.
An attempt was made to synthesize amine terminated SiNPs using thermally induced
hydrosilylation reaction. The hydrosilylation reaction mechanism was originally suggested
as a radical reaction26 in which the surface Si-H bonds add across the carbon-carbon double
bonds (Briefly explained in Chapter 2). In this way the Si-C bond is formed by a silyl radical
attacking the alkene causing a radical centre on the β-carbon atom to be formed. The chain
then propagates over by abstraction of an H atom from the nearest-neighbour Si atom by the
carbon-centred radical. The monolayer grows by addition of 1-alkenes surface to the end of
a kinetic chain, which walks over the surface. This methodology has been used for
synthesising alkyl capped SiNPs.27, 28
Scheme 3.1: Synthesis of Amine-terminated SiNPs using thermally induced hydrosilylation.
The H-terminated SiNPs were reacted with allylamine in refluxing toluene for 6 hr.
The obtained solution was filtered and the solvent was removed under vacuum. The
resulting dark brown powder was characterized by FTIR; the spectra did not show any Si-C

75
bonding. The time of reaction was increased from 6 hr to overnight till to up to 3 days but
there was no sign of improvement.
3.4 Synthesis of Amine-terminated SiNPs Using UV Induced
Hydrosilylation Reaction.
The next attempt was made to synthesize amine-terminated SiNPs using UV
irradiation as described by Wayner et al.29 The H-terminated porous silicon chips were
introduced into allylamine diluted in ethanol in a 1% volumetric ratio. Prior to reaction, the
ethanol mixture was bubbled with N2 for one hour to remove the dissolved oxygen that
could inhibit the radical-initiated reaction. The whole solution was then subjected to
ultrasonic dispersion for 50 min at 40C. The whole mixture was then kept with magnetic
stirring under UV irradiation for five hours to overnight for the allylamine to react with the
Si-H sites of the surface. A homemade photochemical reactor equipped with two 48 watt UV
tubes was used. The temperature of the reactor chamber was kept at room temperature.
After UV irradiation, the solvent of the reaction mixture was removed under vacuum and a
dry sample was obtained. The resulting powder was characterized by FTIR and NMR,
confirming that no reaction took place. Further attempts were made, changing solvents and
temperatures but the reaction did not show any sign of improvement.
3.5 Synthesis of Amine-terminated SiNPs Using Pt catalysed
Hydrosilylation
After attempting several ways to synthesize amine-terminated SiNPs, the decision
was made to perform catalytic hydrosilylation reaction using Platinum catalyst (Pt). The
mechanism of the hydrosilylation reaction in which the surface Si-H bond adds across the
unsaturated carbon-carbon bonds, by using a metal catalyst is briefly explained in Chapter 2.
The hydrosilylation of allylamine when catalysed by chloroplatinic acid (H2PtCl6, Speier’s
catalysts) in the presence of Iso-propanol is generally assumed to proceed by the Chalk-
Harrod mechanism (Chapter 2).

76
Scheme 3.2: Functionalization of H-terminated SiNPs with allylamine using Pt Catalyst.
Several reaction parameters were changed (Table 3.2) in order to obtain fully
functionalized and pure amine-terminated SiNPs. Initially, after drying the H-terminated
porous silicon chips, iso-propanol was added followed by H2PtCl6. Then allylamine was
added to the Schlenk flask under N2 and evolution of gas was immediately observed. After 2
hr of sonication, the H-terminated SiNPs dissolved and the mixture became slightly cloudy.
The reaction mixture was later filtered and dried under vacuum. A dark brownish powder
was obtained and characterized by FTIR. The product showed the presence of Si-C bond and
proved the functionalization of amine on the surface. The reaction was improved by
changing several parameters as shown in Table 3.2. It was observed that sonication time and
temperature did not play any role in the reaction, unlike the sonication step applied to
remove the NPs from the surface of the chips and to break them into nm size. It was also
observed that using higher amounts of allylamine and catalyst did not improve the reaction.
Moreover it made the purification of the final reaction mixture difficult. The best parameters
were chosen to use 0.5 mL of allylamine and 40 μL of catalyst for 2 chips
Si
H
H
H
H H
H
H
H
SiH2N
H2NNH2
NH2
H2N
NH2NH2
NH2
NH2
H2PtCl6 Isopropanol
30 min sonication at RT

77
Table 3.2: Synthesis of amine-terminated SiNPs by changing reaction parameters
Amine-terminated SiNPs were obtained by reacting the H-terminated SiNPs with
allylamine (0.5 mL) within a Schlenk flask under N2, in the presence of 0.05 M H2PtCl6 (40 μL)
catalyst in iso-propanol. After 30 min of sonication, the resulting reaction mixture was
filtered and dried. The obtained amine-terminated SiNPs were washed three times with
dichloromethane in order to remove impurities and dried under vacuum. A solid brown
powder of the amine-terminated SiNP product was obtained (Scheme 3.2). About thirty
milligrams of dry powder was obtained from each reaction. This powder was re-dissolved in
water for further characterization. After attachment of the amines onto the SiNPs, the
surface functionalized particles become highly soluble and stable in water and also show
blue-green visible photoluminescence when exposed to ultraviolet light.
3.6 Purification of Amine-terminated SiNPs
In order to achieve purity, the obtained amine-terminated SiNPs were washed with
various organic solvents such as petroleum ether, diethyl ether, dichloromethane,
chloroform, iso-propanol etc. The washing experiment was monitored by PL, shown in
figure 3.1. It was observed that washing of the resulting product using dichloromethane
successfully removed all the starting material and impurities from the products and left pure
amine-capped SiNPs, which showed photoluminescence spectra under an excitation
wavelength of 360 nm.
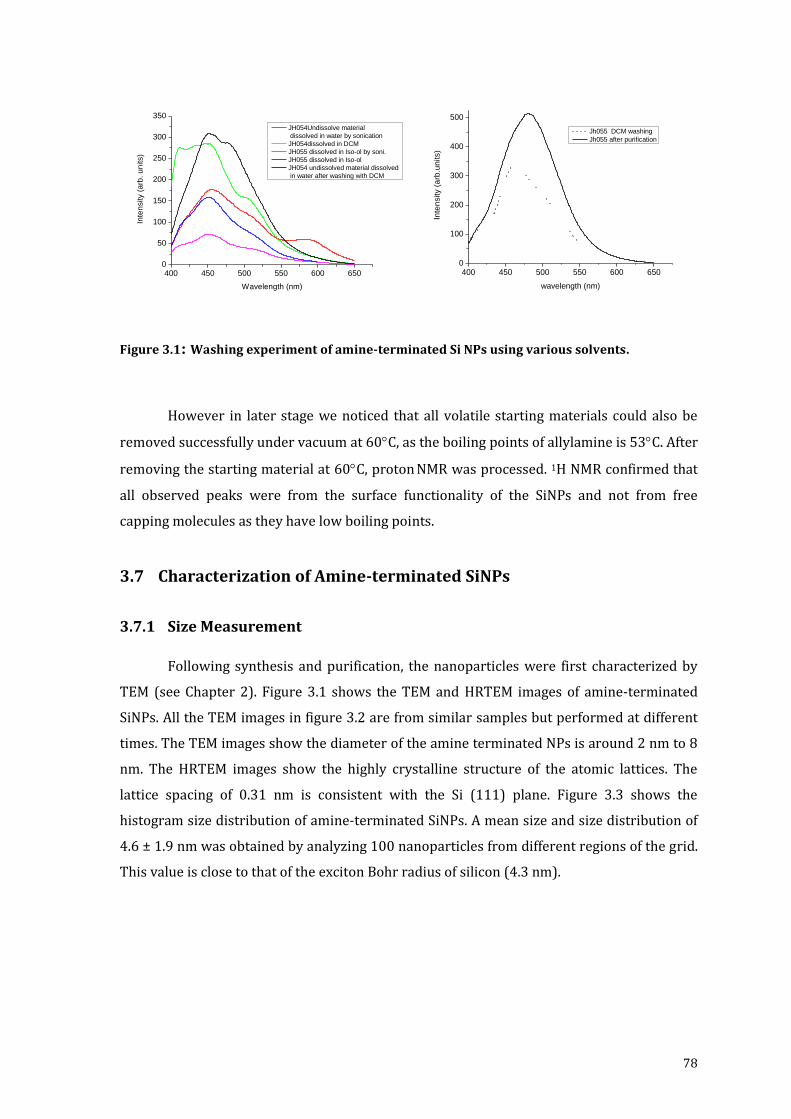
78
Figure 3.1: Washing experiment of amine-terminated Si NPs using various solvents.
However in later stage we noticed that all volatile starting materials could also be
removed successfully under vacuum at 60C, as the boiling points of allylamine is 53C. After
removing the starting material at 60C, proton NMR was processed. 1H NMR confirmed that
all observed peaks were from the surface functionality of the SiNPs and not from free
capping molecules as they have low boiling points.
3.7 Characterization of Amine-terminated SiNPs
3.7.1 Size Measurement
Following synthesis and purification, the nanoparticles were first characterized by
TEM (see Chapter 2). Figure 3.1 shows the TEM and HRTEM images of amine-terminated
SiNPs. All the TEM images in figure 3.2 are from similar samples but performed at different
times. The TEM images show the diameter of the amine terminated NPs is around 2 nm to 8
nm. The HRTEM images show the highly crystalline structure of the atomic lattices. The
lattice spacing of 0.31 nm is consistent with the Si (111) plane. Figure 3.3 shows the
histogram size distribution of amine-terminated SiNPs. A mean size and size distribution of
4.6 ± 1.9 nm was obtained by analyzing 100 nanoparticles from different regions of the grid.
This value is close to that of the exciton Bohr radius of silicon (4.3 nm).
400 450 500 550 600 6500
50
100
150
200
250
300
350
Inte
nsity (
arb
. u
nits)
Wavelength (nm)
JH054Undissolve material
dissolved in water by sonication
JH054dissolved in DCM
JH055 dissolved in Iso-ol by soni.
JH055 dissolved in Iso-ol
JH054 undissolved material dissolved
in water after washing with DCM
400 450 500 550 600 6500
100
200
300
400
500
Inte
nsity (
arb
.un
its)
wavelength (nm)
Jh055 DCM washing
Jh055 after purification

79
Figure 3.2: (a, c, e) shows HRTEM images of amine-terminated SiNPs. (b, d, f) shows TEM
images of amine-terminated SiNPs, the white circle showing an individual silicon nanocrystal
and the crystal lattice planes.
(a)
50 nm
(b)
(c)
10nm
(d)
(e) (f)
100 nm

80
Figure 3.3: Histogram showing the size distribution of amine-terminated SiNPs.
3.7.2 DLS Measurement
Dynamic light scattering (DLS) is one of the principal characterizing techniques used
to calculate the diameter of the nanoparticles in a variety of solvents (see Chapter 2). It is
important to remember that DLS size distributions are a measurement of the hydrodynamic
diameter of the particle and not the physical radius of the particle. Consequently,
interpretation of the DLS size distributions (figure 3.4) results in measurements that appear
as an overestimate of the size when compared to the data obtained by TEM. Secondly, the
solvation properties of the solvent will affect the overall size. The purified NPs were
dissolved in water and the effective diameters were measured at room temperature. The
DLS measurements were also performed in solvents like methanol, ethanol and iso-propanol.
In all solvents the SiNPs show good size distribution and do not show any sign of
aggregation.

81
Figure 3.4: Dynamic light scattering spectrum displays the overall diameter and distribution of
amine-capped SiNPs in water.
In Figure 3.4, the DLS spectrum confirms that the mean size of the amine-terminated
SiNPs is 7.5 ± 1.0 nm (± is the repeatability). The mean diameter obtained from DLS is
slightly larger than the one gained from TEM measurements, because the amine groups
render SiNPs hydrophilicity and form a hydration shell.30
3.8 Chemical bonding and elemental analysis
3.8.1 IR Spectroscopy
As explained in Chapter 2 FTIR is an important technique to obtain the information
of molecular bonding on the surface of the NPs. To confirm that the surface of SiNPs is
covered with Si−C bonded amine moieties, it was important to perform FTIR spectra in
normal transmission alignment. The aim was to carry out FTIR in both solution and solid
states, to obtain clear surface bonding information of amine-terminated SiNPs. Samples
were first dried under high vacuum. For FTIR in solution the dry powder was dissolved in
chloroform using sonication for a few minutes (Figure 3.5) and the spectrum was obtained
by subtracting chloroform background. For solid FTIR the dry powder was directly placed
on the diamond crystal of the instrument and the spectrum was obtained (Figure 3.6).

82
Figure 3.5: FTIR spectrum of amine-capped SiNPs in chloroform (32 scans, 4 cm-1 resolution).
Figure 3.6: FTIR spectra of amine-terminated SiNPs in solid state (32 scans, 4 cm-1 resolution).
The above FTIR spectra of amine-terminated SiNPs in solution and in the solid state
are similar in terms of features. In this case the FTIR spectrum in solution showed better
features of Si-C bonding at 1260 cm-1 and 1457 cm-1, but mostly the FTIR spectrum of amine-
500 1000 1500 2000 2500 3000 3500 4000
926790
Tra
ns
mit
tan
ce
(%
)
Wavenumber (cm-1
)
1105
1457
28531605
1260
2924
2926
3687
3598
500 1000 1500 2000 2500 3000 3500 4000
Tra
ns
mit
an
ce
(%
)
Wavenumber ( cm-1)
1011786
9291260
1440
1640
3393
2927
2847
665
3113

83
terminated SiNPs in solvent shows lot of noise and background due to the solvent
vaporisation in the cell. In the solid state the FTIR spectrum of amine-terminated SiNPs is
always good and shows the best features.
Table 3.3: shows the molecular bonding information of amine-terminated SiNPs.
Structural Feature Vibrational Motion Wavenumber / cm-1
Amine N-H stretching 3500 to 3690
-CH2- C-H stretch 2853-2926
Amine N-H scissoring 1650
Si-OR Vibrational stretching 920-1110
Si-CH2 Vibrational scissoring 1457
Si-C Symmetric bending 1260
Amine N-H wagging 790
From the FTIR spectrum, the observed bands at 1457 and 1260 cm−1 are attributed
to Si-CH2 vibrational scissoring and symmetric bending.31 The features observed around
2853 to 2926 cm−1 are attributed to the C−H stretching of alkane. The transmittance
between 3500 to 3690 cm−1 is assigned to the N−H stretching of an amine.32 The band at
1605 cm−1 is attributed to allylamine N-H scissoring. The features between 920 and 1110
cm−1 are attributed to the vibrational stretching of Si-OR. The band at 790 cm−1 is N−H
wagging. The data are summarized in table 3.3. These features highlight the strength and
stability of the Si−C bond formed between the SiNPs and the allylamine as well as the
minimal number of Si-OR surface bonds present.10
3.8.2 NMR Spectroscopy
NMR spectroscopy (see Chapter 2) is an important technique to obtain accurate
information on the chemical bonding from the sample. The surface coverage with amines
was also confirmed by 1H NMR spectroscopy. Figure 3.7 shows the NMR spectra of amine-
terminated SiNPs in D2O and Figure 3.8 in chloroform. In order to perform the NMR in
chloroform the sample was dried and re-dissolved in chloroform by sonication for 5 min, as
it is poorly soluble in organic solvents.
A doublet of triplet (dt) peak in Figure 3.7 found between 3.38 and 3.42 ppm is
attributed to the protons adjacent to the amine group.32 The sharp singlet at 4.6 ppm
corresponds to the dispersing solvent.

84
Figure 3.7: 1H NMR spectrum of amine-terminated SiNPs in D2O.
Similarly, the doublet of triplet (dt) peak at 3.57 ppm in Figure 3.8 arises from the
protons next to the amine group, the broadening of the peak may have occurred due to the
poor solubility of the amine-terminated SiNPs in chloroform. The sharp peak at 1.18 ppm is
from the two protons of the amine moiety.
Figure 3.8: 1H NMR spectra of amine-terminated SiNPs in CDCl3
3.8.3 X-ray Photoelectron Spectroscopy
X-ray photoelectron spectroscopy (XPS) is an important technique for gathering
information on the elements present on the surface of the SiNPs (see Chapter 2). XPS can
also indicate the environment in which these elements exist. The process of analysis and
identification strongly depends on the fitting of the observed peaks with Gaussians and
requires care. A full survey of the photoelectron spectrum is shown in Figure 3.9.

85
Figure 3.9: XPS survey spectrum from the film of amine-terminated SiNPs deposited on a gold
substrate.
The silicon, carbon and oxygen contributions are clearly seen. The N1s peak at 399
eV (Figure 3.9) is too weak to be revealed by the single sweep of the survey scan but is
resolved after multiple sweeps of the N1s energy window with small (0.02 eV) sized steps.
The surface chemical bonding was further studied using high resolution XPS
spectroscopy. Figure 3.10 shows high-resolution XPS spectra of Si2p, C1s, O1s, and N1s
regions of a thin film of amine-terminated SiNPs.
The O1s spectrum presented in the Figure 3.10a is fitted with two components and a
Shirley background. The two components are at binding energy 532.68 and 534.23 eV
respectively. The first distinct O1s peak at 532.68 eV is from Si−O group of the oxidized
surface of SiNPs. The second component is possibly from hydroxide O−H group.33
The C1s spectrum present in the Figure 3.10b is fitted with three components and a
Shirley background. The three peaks are at 285.13, 286.45, and 284.45 eV, respectively. The
first C1s peak at binding energy 285.13 eV is assigned to C−C or C−H bonding.34, 35 The
second broad peak at 286.45 eV is ascribed to C−N bonding,36 and the third distinct peak at
binding energy 284.45 eV is attributed to the C−Si bonding.33 The existence of a C−Si
component implies that the surface of the silicon nanoparticle changed from hydrogen to
amine termination.

86
Figure 3.10: XPS core-level spectra of Si-NPs obtained at 20C to normal emission: the dotted
line is experimental data that is fitted with various mixed components. (a) O1s, photon energy
588 eV, (b) C1s, photon energy 347 eV, (c) Si2p, photon energy 150 eV, and (d) N1s, photon
energy 400 eV.
The Si2p spectrum present in the Figure 3.10c is fitted with three peaks and a
Shirley background. The three peaks are at 101.75, 102.80, and 100.74 eV. The first
component is attributed to Si−C indicating that the surface of the SiNP is terminated with
amine by replacing the hydrogen with amine. The second component is assigned to Si−O,
which is indicative of the sample surface oxidation under ambient conditions. The third peak
at 100.74 eV is attributed to Si−Si within the silicon core of the SiNPs.33, 37
The N1s spectrum presented in Figure 3.10d is fitted with a single Gaussian and a
Shirley background. The broad distinct peak is at 399.03 eV is attributed to the C−N bonding
of the amine-terminated SiNPs.36
528 530 532 534 536 538 540 542
Inte
nsity (
arb
.un
its)
Binding energy (eV)
A
B
Position FWHM Area Mixing
O1s (A) 532.68 1.087 19.4 (96.21%)
O1s (B) 534.23 2.104 0.8 (3.79%)
(a) O1s
280 282 284 286 288 290 292 294
Inte
nsity (
arb
.un
its)
Binding energy (eV)
(b) C1s
A
BC
Position FWHM Area Mixing
C1s (A) 285.13 1.15 8.3 (89.76%)
C1s (B) 286.45 2.343 1.6 (7.60%)
C1s (C) 284.45 1.161 0.5 (2.63%)
100 102 104 106 108 110
Inte
nsity (
arb
.un
its)
Binding energy (eV)
(c) Si 2p Position FWHM Area Mixing
Si 2p (A) 101.75 1.172 7.0 (93.17%)
Si 2p (B) 102.80 1.358 0.4 (5.29%)
Si 2p (C) 100.74 0.972 0.1 (1.54%)
A
BC
390 393 396 399 402 405 408 411 414
Inte
nsity (
arb
.un
its)
Binding energy (eV)
(d) N1s Position FWHM Area Mixing
N1s 399.033 1.769 0.2 (100%)

87
All data presented in the above section of surface chemical bonding analysis suggest
that all features appeared in FTIR, NMR and XPS are from amine-capped SiNPs, because
“uncapped” SiNPs as such do not exist. Without any capping, bare SiNPs are very quickly
oxidized under ambient conditions and are not biocompatible. The propensity of nanoscale
structures derived from bulk silicon through electrochemical etching to undergo surface
oxidation in ambient conditions is a well-known effect that has been studied with both
theoretical and experimental approaches.38-40 Given the small size of nanoparticles studied
here, once they are fully oxidized, they may no longer be described as SiNPs, and should
properly be described as silica NPs. For the SiNPs described here, the initial hydrogen
termination layer on the etched wafer serves a dual role: first as a convenient molecular
anchor point at which surface modification may be performed and second as an interim
guard against oxidation in order to preserve the chemical character of the silicon core prior
to subsequent functionalization steps.
3.9 Optical properties
3.9.1 Absorption and Emission Spectra
The absorption and emission spectra of amine-terminated SiNPs in water are
presented in Figure 3.11. The inset shows a photograph of the amine-capped SiNPs in water
under UV illumination at 254 nm.
Figure 3.11: The dotted line shows the absorption spectrum of amine-capped SiNPs in water:
the solid line shows the photoluminescence spectrum of amine-capped SiNPs in water at an
excitation at 360 nm. The inset image shows the luminescence from a vial of amine-capped
SiNPs in water when excited with a UV lamp.
350 400 450 500 550 600 650 700
absorbance
Ab
so
rban
ce (
arb
.un
it)
(a)
Wavelength (nm)
emission
300 350 400 450 500 550 600 650
Emission
Wavelength (nm)
Excitation
Inte
ns
ity
(a
.u)
Exti
nct
ion

88
The gradual increase in the absorbance with decreasing excitation wavelength from
the onset wavelength of 450 nm, corresponding to the absorption edge of 2.75 eV, is
characteristic of absorption across the indirect band gap of silicon.41 The solid line shows the
photoluminescence spectrum of amine-capped SiNPs in water at room temperature with the
maximum emission peak centred at approximately 450 nm with a full width at half-
maximum height of 107 nm under an excitation wavelength of 360 nm.
3.9.2 Quantum Yield Measurement
The luminescence quantum yield is defined as the ratio of the number of photons
emitted to the number of photons absorbed by the sample. In terms of NPs it is important to
know the overall fluorescence emitted by the sample. (see Chapter 2) Here, it is measured by
a comparative method described by Williams et al.42 The standard samples should be
chosen to ensure they absorb at the excitation wavelength of choice for the test sample, as
well as being well characterized in literature and suitable for such use. Photoluminescence
quantum yields of the amine-capped SiNPs in water (Figure 3.12) were obtained using
quinine sulfate (Figures 3.13) as a reference emitter which has the quantum yield 54.6%
when dissolved in 0.5 M H2SO4.43 Solutions with absorbance (also called optical densities)
within 0.1 and 0.01 were prepared. The obtained gradients from the plot of the integrated
fluorescence intensity vs. absorbance were determined for both the sample and the
reference.
The quantum yield of our amine-terminated SiNPs was found to be at approximately
22 % with an excitation wavelength at 360 nm.

89
Figure 3.12: Quantum yield measurement of quinine sulphate: (a) Absorption and (b) emission
spectra obtained for different concentrations of quinine sulphate, (c) Scatter plot of integrated
intensity (area under emission spectrum) against absorbance at 310 nm.
400 450 500 550 600 6500
150
300
450
600
750
0.45ug/mL Quinine Sulphate in 0.5M H2SO4
0.88ug/mL Quinine Sulphate in 0.5M H2SO4
1.36ug/mL Quinine Sulphate in 0.5M H2SO4
1.76ug/mL Quinine Sulphate in 0.5M H2SO4
2.64ug/mL Quinine Sulphate in 0.5M H2SO4
Inte
ns
ity
(a
.u.)
Wavelength (nm)
300 350 400 450 500 550 600
0.00
0.02
0.04
0.06
0.08
0.10
Quinine Sulphate in 1N H2SO4 0.45ug/mL
Quinine Sulphate in 1N H2SO4 0.88ug/mL
Quinine Sulphate in 1N H2SO4 1.36ug/mL
Quinine Sulphate in 1N H2SO4 1.76ug/mL
Quinine Sulphate in 1N H2SO4 2.64ug/mL
Ab
so
rba
nc
e
Wavelength (nm)
(a) (b)
(c)
0.00 0.01 0.02 0.03 0.04 0.05 0.06 0.07
0
10000
20000
30000
40000
50000
60000
Inte
gra
ted
in
ten
sit
y
Absorbance at 360 nm
Y=1015.63+832456.15X

90
Figure 3.13: Quantum yield measurement of amine-terminated SiNPs: (a) Absorption and (b)
emission spectra obtained for different concentrations of amine-terminated SiNPs, (c) Scatter
plot of integrated intensity (area under emission spectrum) against absorbance at 360 nm.
The quantum yield of water soluble amine-terminated SiNPs was calculated from the
following equation:
(
) (
) Equation: 3.1
Where Q is the quantum yield, Grad is the gradient from the plot of integrated
fluorescence intensity vs absorbance, η is the refractive index of the solvent. The subscript R
refers to the reference fluorophore of known quantum yield.
The gradient of quinine sulphate and amine-terminated SiNPs was obtained as
832456 and 342129 respectively (Figures 3.12c and 3.13c). The refractive index of both
solvents were known, thus the quantum yield of the amine-terminated SiNPs can be
calculated as follows:
(
) (
)
0.000 0.015 0.030 0.045 0.060 0.075
0
5000
10000
15000
20000
Inte
gra
ted
In
ten
sit
y
Absorbance at 360
Y =-1923.49+342129.70X
300 350 400 450 500 550 600 650 7000.00
0.02
0.04
0.06
0.08
0.10
0.12
0.14
Ab
so
rban
ce
Wavelength (nm)
Si-NH2 in water
Si-NH2 in water
Si-NH2 in water
Si-NH2 in water
Si-NH2 in water
400 450 500 550 600 6500
40
80
120
160
200
240
Inte
nsit
y (
arb
.un
its)
Wavelength (nm)
Si-NH2 in water
Si-NH2 in water
Si-NH2 in water
Si-NH2 in water
Si-NH2 in water
(a) (b)
(c)

91
The calculated quantum yield of the amine-terminated SiNPs is about 22% with an
excitation wavelength at 360 nm. The observed QY value in water is comparable to values of
QY for SiNPs reported in the literature, which range from 2-18% in water.44, 45
3.9.3 pH effect
It is well known that the amine moiety can strongly quench the emission of
semiconductor quantum dots under certain pH values,46 so it is interesting to investigate
this phenomenon to determine the effect of pH upon the emission characteristics of our
amine-terminated SiNPs. With this aim, we obtained PL spectra from amine-terminated
SiNPs over a range of pH environments (4 to 14) (Figure 3.14). Different pH buffer solutions
were prepared using pH 4, 7 and 9 tablet and values were set up to pH 14 by adding stock
solutions of 0.1M citric acid (19.2g/L) and 0.2M sodium citrate (28.4g/L). The pH of
solutions was tested using pH electrode. For PL measurements, the SiNP particles were left
at each pH for 2 days prior to measurement. We observed that the maximum emission peak
position is independent of the pH.
Figure 3.14 : Initial and after 2 days effect of pH onto the emission of the amine-terminated
SiNPs
Figure 3.14 shows that increase in pH decreases the luminescence of amine-capped
SiNPs while decreasing the pH increases the luminescence of particle. This implies that the
SiNPs remain stable in extremely acidic or in basic conditions and that the emission with
protonated (non-quencher) and non-protonated (quencher) amine groups originates from
the same state. At low pH the amine group is protonated, and electron transfer between the
amine moieties and the Si core is prohibited, yielding higher emission intensity.24 At higher
400 450 500 550 600 6500
40
80
120
160
200
Inte
ns
ity
(a
rb.u
nit
s)
Wavelength (nm)
0.2 ml in 3 ml of PH-4
0.2 ml in 3 ml of PH-5
0.2 ml in 3 ml of PH-6
0.2 ml in 3 ml of PH-7
0.2 ml in 3 ml of PH-8
0.2 ml in 3 ml of PH-9
0.2 ml in 3 ml of PH-10
0.2 ml in 3 ml of PH-12
0.2 ml in 3 ml of PH-14
400 450 500 550 600 6500
50
100
150
200
Inte
ns
ity
(a
rb.u
nit
s)
Wavelength (nm)
PH 4
PH 5
PH 6
PH 7
PH 8
PH 9
PH10
PH12
PH14
Si-NH2 NPs after 2 days in different pH

92
pH protonation is either incomplete or absent, which allows involvement of the nitrogen
lone pair in relaxation processes and yields a reduced emission.24 It was consequently
deemed interesting to investigate the quantum yield of amine-terminated SiNPs in acidic,
basic and neutral pH. At low pH, if the fluorescence of the NPs increases then the quantum
yield should also increase and at higher pH it should decrease. The quantum yield of amine-
terminated SiNPs was calculated in different pH and PBS. A solution of amine-terminated
SiNPs was prepared at pH-4, pH-7, pH-9 and PBS with absorbances between 0.1 and 0.01
and the gradient of the plot of integrated fluorescence intensity against absorbance was
found. The quantum yield of amine-terminated SiNPs in different pH and PBS is shown in
Table 3.4. As expected the quantum yield of amine-terminated SiNPs was found to decrease
at higher pH (pH-9) and increase at low pH (pH-4). At low pH the quantum yield increases
slightly, however decreasing pH further may perhaps increases the quantum yield of amine-
terminated SiNPs and vise-versa.
Table 3.4: Quantum yields of amine-capped SiNPs in water solutions of different pH values and
PBS expressed as the percentage of photons emitted per photon absorbed, using quinine
sulphate as standard reference
Solvent (pH) Quantum yield (%)
Water (4) 23±3
Water (7) 22±2
Water (9) 16±5
PBS (7) 18±5
3.9.4 Stability of amine-terminated SiNPs by PL
The lack of PL stability of nanostructured silicon is one of the major barriers to
commercial applications.45 To investigate the PL stability at different pH values, PBS and
water further, time dependent PL spectra of amine-terminated SiNPs were measured by
monitoring the emission using an excitation wavelength of 360 nm, Figure 3.15 and Figure
3.16.

93
Figure 3.15: PL stability results of the amine-terminated SiNPs in water.
The photoluminescence spectrum in Figure 3.15 shows that the amine-capped SiNPs
are moderately stable over a month. The above PL spectra of amine-terminated SiNPs do not
show any sign of oxidation of the emission peak. The overall PL intensity slightly decreases
with time but it still substantial.
Figure 3.16: Ageing effect on luminescence spectra for amine-capped SiNPs in water at
different pH values and in PBS (excitation wavelength = 360 nm): (a) peak intensity; (b) peak
wavelength. The samples were stored in glass vials in the dark under ambient conditions and
no attempt was made to purge the suspensions of oxygen.
The results shown in Figure 3.15 and Figure 3.16, show that the PL from amine-
capped SiNPs decays over a month, but is still strong (about two thirds of initial PL
intensity). This is much better than that shown by many other semiconductor QDs. Although
400 450 500 550 600 6500
100
200
300
400
500
600
Inte
nsity (
arb
.un
its)
Wavelength (nm)
day 1
day 4
day 5
day 12
day 14
day 17
day 19
day 22
day 24
day 26
day 28
day 35
pH-4 pH-5 pH-6 pH-7 pH-8 pH-9 pH-10 PBS
200
300
400
500
600
700
800
900
1000 (a)
Inte
ns
ity
(a
rb.u
nit
s)
pH and PBS
Day-1
Day-5
1 Week
pH-4 pH-5 pH-6 pH-7 pH-8 pH-9 pH-10 PBS430
435
440
445
450
455
460(b)
Peak w
avele
ng
th /
nm
pH and PBS
Day-1
Day-5
1 Week
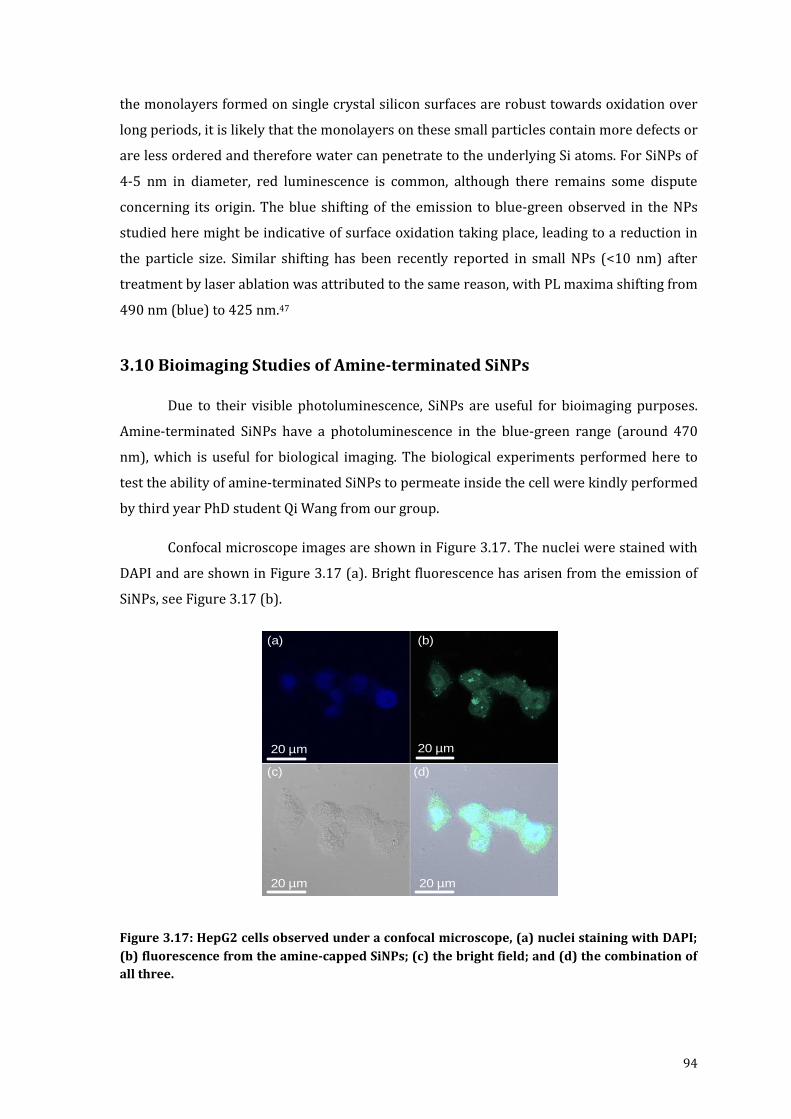
94
the monolayers formed on single crystal silicon surfaces are robust towards oxidation over
long periods, it is likely that the monolayers on these small particles contain more defects or
are less ordered and therefore water can penetrate to the underlying Si atoms. For SiNPs of
4-5 nm in diameter, red luminescence is common, although there remains some dispute
concerning its origin. The blue shifting of the emission to blue-green observed in the NPs
studied here might be indicative of surface oxidation taking place, leading to a reduction in
the particle size. Similar shifting has been recently reported in small NPs (<10 nm) after
treatment by laser ablation was attributed to the same reason, with PL maxima shifting from
490 nm (blue) to 425 nm.47
3.10 Bioimaging Studies of Amine-terminated SiNPs
Due to their visible photoluminescence, SiNPs are useful for bioimaging purposes.
Amine-terminated SiNPs have a photoluminescence in the blue-green range (around 470
nm), which is useful for biological imaging. The biological experiments performed here to
test the ability of amine-terminated SiNPs to permeate inside the cell were kindly performed
by third year PhD student Qi Wang from our group.
Confocal microscope images are shown in Figure 3.17. The nuclei were stained with
DAPI and are shown in Figure 3.17 (a). Bright fluorescence has arisen from the emission of
SiNPs, see Figure 3.17 (b).
Figure 3.17: HepG2 cells observed under a confocal microscope, (a) nuclei staining with DAPI;
(b) fluorescence from the amine-capped SiNPs; (c) the bright field; and (d) the combination of
all three.
(a) (b)
(c) (d)
20 µm
20 µm20 µm
20 µm
(b)
20 µm

95
The image observed in bright field and merged results are also shown in Figure 3.17
(c) and (d). The fluorescence is almost evenly distributed throughout the cells. However,
higher concentrations can be observed in the nuclei, where fluorescence overlaps with the
DAPI stain. Importantly, no signs of morphological damage to cells were observed upon
treatment with the amine-capped SiNPs in de-ionized (DI) water. Such a result is in contrast
to recent studies, which suggest the positive charge of the amine-terminated surface can
lead to an increase in cytotoxicity. This is a significant advance in the biological applications
of SiNPs. Otherwise choosing a suitable solvent would be critical.48, 49
3.10.1 In vitro Cytotoxicity Assay
Different types of nanoparticles possess their own particular physicochemical
properties, which in turn determine their potential toxicity or lack thereof. Amine capping
has been applied to a variety of nanoparticles in order to render them compatible with
biological media.50 To evaluate the cytotoxicity of our synthesized nanoparticles, we
performed an MTT [3-(4,5-dimethylthiazol-2-yl)-2,5-diphenyltetrazolium bromide] assay to
determine cell proliferation. MTT measures mitochondrial activity within cells using
tetrazolium salts as mitochondrial dehydrogenase enzymes cleave the tetrazolium ring,
which occurs only in living cells. Briefly, HepG2 (human liver hepatocellular carcinoma) cells
were seeded in a 96-well plate for 24 h. Then the cells were treated with amine-capped
SiNPs at various concentrations (0, 1, 5, 10, 50, 100, and 200 μg mL−1) for a period of 48 h.
All experiments were repeated at least three times. After incubation the medium was
removed and followed by washing the cells with phosphate buffered saline (PBS). Then, the
medium was changed and incubated with the MTT solution (5 mg mL−1) for 2 h. The medium
was removed, and formazan was solubilized in dimethylsulfoxide (DMSO). The absorbance
was recorded on a microplate reader at the wavelength of 540 nm. The percentage of viable
cells was estimated by direct comparison against the untreated control cells.
There was no evidence of morphology change when the cells were observed under a
phase-contrast microscope. The values of cytotoxicity induced by exposure to amine-capped
SiNPs are given in Figure 3.18.

96
Figure 3.18: MTT assay of amine-capped SiNPs in HepG2 cells
As shown in Figure 3.18, treatment with amine-terminated SiNPs (0-200µg/mL-1)
did not remarkably affect the proliferation of HepG2 cells. Amine-terminated SiNPs
treatment (0-200 µg/mL-1) did not result in a dose-dependent inhibition of cell growth, as
compared to vehicle-treated controls.
3.11 Conclusion
In conclusion, a facile method has been demonstrated to synthesize highly stable
amine-terminated SiNPs by using electrochemically etched porous silicon. The surface of
silicon quantum dots was effectively modified by using allylamine which conferred the
silicon surface hydrophilicity. The obtained nanoparticles have a narrow size distribution
and a very high mobility in water exposed by high-resolution TEM images and DLS and show
strong blue photoluminescence under UV excitation with a luminescent quantum yield of
22%. These surface functionalized nanoparticles have remarkable photostability against
degradation; they are stable for several weeks and demonstrate a great chemical stability
over a wide pH range. The FTIR, NMR and XPS displayed the surface chemistry and
confirmed that the surface is effectively modified with amine group.
Furthermore MTT assays show that amine- capped SiNPs are nontoxic to HepG2
cells. The synthesized amine-terminated SiNPs not only serve as a great tool for biomedical
application but also opens a new door for further surface chemistry.
0
20
40
60
80
100
120
con H₂O₂
400µM
SiNP-NH₂
1µg·ml
SiNP-NH₂
5µg·ml
SiNP-NH₂
10·µg·ml
SiNP-NH₂
50µg·ml
SiNP-NH₂
100µg·ml
SiNP-NH₂
200µg·ml
% c
ell
pro
life
rati
on
-1-1-1-1-1-1
% c
ell v
iab
ility

97
3.12 References
1. Zhu, X.; Yukawa, T.; Kishi, T.; Hirai, M.; Suematsu, H.; Jiang, W.; Yatsui, K., Synthesis of Light-emitting Silicon Nanoparticles by Intense Pulsed ion-beam Esvaporation. Journal of Nanoparticle Research 2005, 7 (6), 669-673.
2. Nirmal, M.; Brus, L., Luminescence Photophysics in Semiconductor Nanocrystals. Accounts of Chemical Research 1999, 32 (5), 407-414.
3. Chao, Y.; Šiller, L.; Krishnamurthy, S.; Coxon, P. R.; Bangert, U.; Gass, M.; Kjeldgaard, L.; Patoleo, S. N.; Lie, L. H.; O'Farrell, N.; Alsop, T. A.; Houlton, A.; Horrocks, B. R., Evaporation and deposition of alkyl-capped silicon nanocrystals in ultrahigh vacuum. Nature Nanotechnology 2007, 2 (8), 486-489.
4. Froner, E.; Adamo, R.; Gaburro, Z.; Margesin, B.; Pavesi, L.; Rigo, A.; Scarpa, M., Luminescence of porous silicon derived nanocrystals dispersed in water: dependence on initial porous silicon oxidation. Journal of Nanoparticle Research 2006, 8 (6), 1071-1074.
5. English, D. S.; Pell, L. E.; Yu, Z.; Barbara, P. F.; Korgel, B. A., Size Tunable Visible Luminescence from Individual Organic Monolayer Stabilized Silicon Nanocrystal Quantum Dots. Nano Letters 2002, 2 (7), 681-685.
6. Belomoin, G.; Therrien, J.; Smith, A.; Rao, S.; Twesten, R.; Chaieb, S.; Nayfeh, M. H.; Wagner, L.; Mitas, L., Observation of a magic discrete family of ultrabright Si nanoparticles. journal article 2002, 80 (5), 841-843.
7. Schuppler, S.; Friedman, S. L.; Marcus, M. A.; Adler, D. L.; Xie, Y. H.; Ross, F. M.; Chabal, Y. J.; Harris, T. D.; Brus, L. E.; Brown, W. L.; Chaban, E. E.; Szajowski, P. F.; Christman, S. B.; Citrin, P. H., Size, shape, and composition of luminescent species in oxidized Si nanocrystals and H-passivated porous Si. Physical Review B 1995, 52 (7), 4910.
8. Rogozhina, E.; Belomoin, G.; Smith, A.; Abuhassan, L.; Barry, N.; Akcakir, O.; Braun, P. V.; Nayfeh, M. H., Si-N linkage in ultrabright, ultrasmall Si nanoparticles. journal article 2001, 78 (23), 3711-3713.
9. Rosso-Vasic, M.; Spruijt, E.; van Lagen, B.; De Cola, L.; Zuilhof, H., Alkyl-Functionalized Oxide-Free Silicon Nanoparticles: Synthesis and Optical Properties. Small 2008, 4 (10), 1835-1841.
10. Warner, J. H.; Hoshino, A.; Yamamoto, K.; Tilley, R. D., Water-Soluble Photoluminescent Silicon Quantum Dots. Angewandte Chemie International Edition 2005, 44 (29), 4550-4554.
11. Pelley, J. L.; Daar, A. S.; Saner, M. A., State of Academic Knowledge on Toxicity and Biological Fate of Quantum Dots. Toxicological Sciences 2009, 112 (2), 276-296.
12. Kirchner, C.; Liedl, T.; Kudera, S.; Pellegrino, T.; Muñoz Javier, A.; Gaub, H. E.; Stölzle, S.; Fertig, N.; Parak, W. J., Cytotoxicity of Colloidal CdSe and CdSe/ZnS Nanoparticles. Nano Letters 2004, 5 (2), 331-338.
13. Nilsson, J. R., How Cytotoxic is Zinc? A Study on Effects of Zinc on Cell Proliferation, Endocytosis, and Fine Structure of the Ciliate Tetrahymena. Acta Protozool 2003, 42, 19-29.
14. Mayne, A. H.; Bayliss, S. C.; Barr, P.; Tobin, M.; Buckberry, L. D., Biologically Interfaced Porous Silicon Devices. physica status solidi (a) 2000, 182 (1), 505-513.

98
15. Zhou, Z.; Brus, L.; Friesner, R., Electronic Structure and Luminescence of 1.1- and 1.4-nm Silicon Nanocrystals: Oxide Shell versus Hydrogen Passivation. Nano Letters 2003, 3 (2), 163-167.
16. Zhang, X.; Neiner, D.; Wang, S.; Louie, A. Y.; Kauzlarich, S. M., A new solution route to hydrogen-terminated silicon nanoparticles: synthesis, functionalization and water stability. Nanotechnology 2007, 18 (9).
17. Neiner, D.; Chiu, H. W.; Kauzlarich, S. M., Low-temperature solution route to macroscopic amounts of hydrogen terminated silicon nanoparticles. Journal of the American Chemical Society 2006, 128 (34), 11016-11017.
18. Tilley, R. D.; Yamamoto, K., The Microemulsion Synthesis of Hydrophobic and Hydrophilic Silicon Nanocrystals. Advanced Materials 2006, 18 (15), 2053-2056.
19. Yu, Z. R.; Aceves-Mijares, M.; Cabrera, M. A. I., Single electron charging and transport in silicon rich oxide. Nanotechnology 2006, 17 (15), 3962-3967.
20. Lie, L. H.; Duerdin, M.; Tuite, E. M.; Houlton, A.; Horrocks, B. R., Preparation and characterisation of luminescent alkylated-silicon quantum dots. Journal of Electroanalytical Chemistry 2002, 538-539, 183-190.
21. Chao, Y.; Krishnamurthy, S.; Montalti, M.; Šiller, L.; Lie, L. H.; Houlton, A.; Horrocks, B. R.; Kjeldgaard, L.; Dhanak, V. R.; Hunt, M. R. C., Reactions and luminescence in passivated Si nanocrystallites induced by vacuum ultraviolet and soft-x-ray photons. Journal of Applied Physics 2005, 98 (4), 044316.
22. Hua, F. J.; Swihart, M. T.; Ruckenstein, E., Efficient surface grafting of luminescent silicon quantum dots by photoinitiated hydrosilylation. Langmuir 2005, 21 (13), 6054-6062.
23. Hua, F.; Erogbogbo, F.; Swihart, M. T.; Ruckenstein, E., Organically Capped Silicon Nanoparticles with Blue Photoluminescence Prepared by Hydrosilylation Followed by Oxidation. Langmuir 2006, 22 (9), 4363-4370.
24. Rosso-Vasic, M.; Spruijt, E.; Popovic, Z.; Overgaag, K.; van Lagen, B.; Grandidier, B.; Vanmaekelbergh, D.; Dominguez-Gutierrez, D.; De Cola, L.; Zuilhof, H., Amine-terminated silicon nanoparticles: synthesis, optical properties and their use in bioimaging. J. Mater. Chem. 2009, 19 (33), 5926-5933.
25. Azzazy, H. M. E.; Mansour, M. M. H.; Kazmierczak, S. C., From diagnostics to therapy: Prospects of quantum dots. Clinical Biochemistry 2007, 40 (13–14), 917-927.
26. de Smet, L. C. P. M.; Zuilhof, H.; Sudhölter, E. J. R.; Lie, L. H.; Houlton, A.; Horrocks, B. R., Mechanism of the Hydrosilylation Reaction of Alkenes at Porous Silicon: Experimental and Computational Deuterium Labeling Studies. The Journal of Physical Chemistry B 2005, 109 (24), 12020-12031.
27. Coxon, P. R., Studies of Silicon and Carbon Nanomaterials by Electron and X-ray Spectroscopies. Ph.D. thesis, Newcastle University 2010.
28. de Smet, L. C., Covalently Bound Organic Monolayers on Silicon Surfaces. Ph.D. thesis, Wageningen Universiteit. 2006.
29. Wayner, D. D. M.; Wolkow, R. A., Organic modification of hydrogen terminated silicon surfaces1. Journal of the Chemical Society, Perkin Transactions 2 2002, (1), 23-34.
30. Wang, Q.; Bao, Y.; Zhang, X.; Coxon, P. R.; Jayasooriya, U. A.; Chao, Y., Uptake and Toxicity Studies of Poly-Acrylic Acid Functionalized Silicon Nanoparticles in Cultured Mammalian Cells. Advanced Healthcare Materials 2012, 1, 189-198.

99
31. Wang, J.; Sun, S.; Peng, F.; Cao, L.; Sun, L., Efficient one-pot synthesis of highly photoluminescent alkyl-functionalised silicon nanocrystals. Chemical Communications 2011, 47 (17), 4941-4943.
32. Shiohara, A.; Hanada, S.; Prabakar, S.; Fujioka, K.; Lim, T. H.; Yamamoto, K.; Northcote, P. T.; Tilley, R. D., Chemical Reactions on Surface Molecules Attached to Silicon Quantum Dots. Journal of the American Chemical Society 2009, 132 (1), 248-253.
33. Chao, Y.; Wang, Q.; Pietzsch, A.; Hennies, F.; Ni, H., Soft X-ray induced oxidation on acrylic acid grafted luminescent silicon quantum dots in ultrahigh vacuum. Physica Status Solidi a-Applications and Materials Science 2011, 208 (10), 2424-2429.
34. Wagner, C.; Riggs, W.; Davis, L.; Moulder, J., Handbook of X-ray photoelectron spectroscopy. In Handbook of X-ray photoelectron spectroscopy, Muilenberg, G. E., Ed. Perkin Elmer Corporation: Eden Prairie, Minnesota, 1997.
35. X-ray data booklet. Lawrence Berkeley National Lab: Berkeley, 2001.
36. Dementjev, A. P.; de Graaf, A.; van de Sanden, M. C. M.; Maslakov, K. I.; Naumkin, A. V.; Serov, A. A., X-Ray photoelectron spectroscopy reference data for identification of the C3N4 phase in carbon-nitrogen films. Diamond and Related Materials 2000, 9 (11), 1904-1907.
37. Wang, Q.; Ni, H.; Pietzsch, A.; Hennies, F.; Bao, Y.; Chao, Y., Synthesis of water-dispersible photoluminescent silicon nanoparticles and their use in biological fluorescent imaging. Journal of Nanoparticle Research 2011, 13 (1), 405-413.
38. Wolkin, M. V.; Jorne, J.; Fauchet, P. M.; Allan, G.; Delerue, C., Electronic States and Luminescence in Porous Silicon Quantum Dots: The Role of Oxygen. Physical Review Letters 1999, 82 (1), 197-200.
39. Šiller, L.; Krishnamurthy, S.; Kjeldgaard, L.; Horrocks, B. R.; Chao, Y.; Houlton, A.; Chakraborty, A. K.; Hunt, M. R. C., Core and valence exciton formation in x-ray absorption, x-ray emission and x-ray excited optical luminescence from passivated Si nanocrystals at the Si L-2,L-3 edge. Journal of Physics-Condensed Matter 2009, 21 (9), 095005.
40. Coxon, P. R.; Wang, Q.; Chao, Y., An abrupt switch between the two photoluminescence bands within alkylated silicon nanocrystals. Journal of Physics D: Applied Physics 2011, 44 (49), 495301.
41. Sato, S.; Swihart, M. T., Propionic-Acid-Terminated Silicon Nanoparticles: Synthesis and Optical Characterization. Chemistry of Materials 2006, 18 (17), 4083-4088.
42. Williams, A. T. R.; Winfield, S. A.; Miller, J. N., Relative fluorescence quantum yields using a computer-controlled luminescence spectrometer. Analyst 1983, 108 (1290), 1067-1071.
43. Xiong, H. M.; Wang, Z. D.; Xia, Y. Y., Polymerization Initiated by Inherent Free Radicals on Nanoparticle Surfaces: A Simple Method of Obtaining Ultrastable (ZnO)Polymer Core–Shell Nanoparticles with Strong Blue Fluorescence. Advanced Materials 2006, 18 (6), 748-751.
44. Erogbogbo, F.; Yong, K.-T.; Roy, I.; Xu, G.; Prasad, P. N.; Swihart, M. T., Biocompatible Luminescent Silicon Quantum Dots for Imaging of Cancer Cells. ACS Nano 2008, 2 (5), 873-878.
45. Warner, J. H.; Hoshino, A.; Yamamoto, K.; Tilley, R. D., Water-soluble photoluminescent silicon quantum dots. Angewandte Chemie-International Edition 2005, 44 (29), 4550-4554.

100
46. Landes, C. F.; Braun, M.; El-Sayed, M. A., On the nanoparticle to molecular size transition: Fluorescence quenching studies. Journal of Physical Chemistry B 2001, 105 (43), 10554-10558.
47. Alkis, S.; Okyay, A. K.; Ortac, B., Post-Treatment of Silicon Nanocrystals Produced by Ultra-Short Pulsed Laser Ablation in Liquid: Toward Blue Luminescent Nanocrystal Generation. Journal of Physical Chemistry C 2012, 116 (5), 3432-3436.
48. Alsharif, N. H.; Berger, C. E. M.; Varanasi, S. S.; Chao, Y.; Horrocks, B. R.; Datta, H. K., Alkyl-Capped Silicon Nanocrystals Lack Cytotoxicity and have Enhanced Intracellular Accumulation in Malignant Cells via Cholesterol-Dependent Endocytosis. Small 2009, 5 (2), 221-228.
49. Dickinson, F. M.; Alsop, T. A.; Al-Sharif, N.; Berger, C. E. M.; Datta, H. K.; Siller, L.; Chao, Y.; Tuite, E. M.; Houlton, A.; Horrocks, B. R., Dispersions of alkyl-capped silicon nanocrystals in aqueous media: photoluminescence and ageing. Analyst 2008, 133 (11), 1573-1580.
50. Lee, S. H.; Bae, K. H.; Kim, S. H.; Lee, K. R.; Park, T. G., Amine-functionalized gold nanoparticles as non-cytotoxic and efficient intracellular siRNA delivery carriers. International Journal of Pharmaceutics 2008, 364 (1), 94-101.
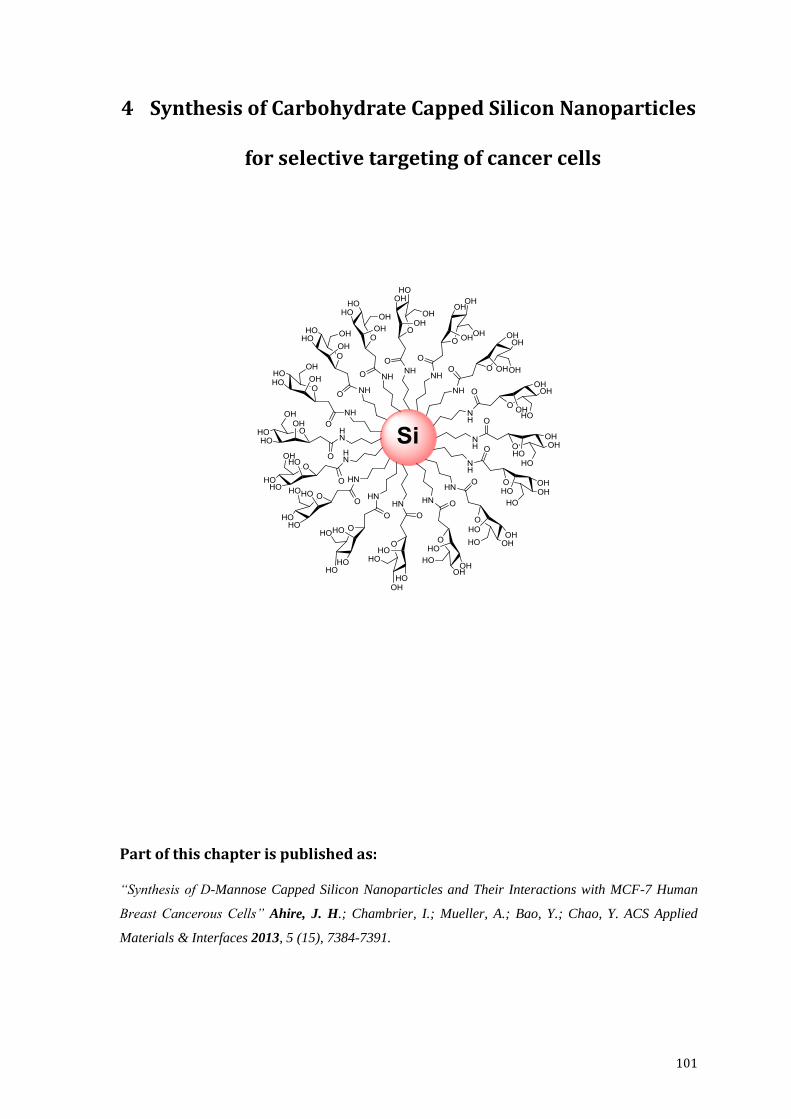
101
4 Synthesis of Carbohydrate Capped Silicon Nanoparticles
for selective targeting of cancer cells
Part of this chapter is published as:
“Synthesis of D-Mannose Capped Silicon Nanoparticles and Their Interactions with MCF-7 Human
Breast Cancerous Cells” Ahire, J. H.; Chambrier, I.; Mueller, A.; Bao, Y.; Chao, Y. ACS Applied
Materials & Interfaces 2013, 5 (15), 7384-7391.

102
4.1 Introduction and Motivation
Over the past decade, there has been a great deal of interest in the fabrication,
characterization and application of nanomaterials, which show potential development in the
diagnosis and treatments of diseases.1-4 Improved understanding at the cellular and
molecular level has led us towards using more specific and targeted nano-therapies.
Recently tremendous advances have been made in recruiting sugar-functionalized
nanocomposites for biological applications following the recognition of the important and
multi-faced role carbohydrates play in many biological systems.5-7 Naturally occurring
carbohydrates, glycoproteins and glycolipids present at the surface of cells play crucial roles
in biological events, acting as recognition sites between cells. As mentioned in the
Introductory Chapter 1, carbohydrates can trigger various phenomena such as cell growth,
inflammatory responses or viral infections. Surface-exposed carbohydrate moieties that are
characteristic of a given microbe may serve as key biomarkers for bacteria and pathogen
identification, diagnosis, and vaccine development. Carbohydrates, as a detection platform,
have already demonstrated tremendous potential to achieve superior sensitivity and
selectivity.8, 9 At present, carbohydrate-functionalized glyconanomaterials are finding many
important applications in explaining carbohydrate protein interactions and cell-cell
communication.10-14
Identifying, quantifying and imaging the carbohydrates, glycoproteins and
glycolipids are critical both for elucidating their biological function and for the evaluation
and design of therapeutics. In order to understand the potential of carbohydrates in
diagnostics and therapeutic applications, several obstacles need to be overcome.
The interaction between a single carbohydrate and its receptor is usually weak,
however nature solves this problem by simultaneously engaging multiple ligands for
binding,14, 15 leading to enhanced affinity through the multivalency effect.16 Thus, a suitable
platform is required to display carbohydrates in a polyvalent format in order to improve the
binding strength and selectivity. The second challenge is that unlike the lock-and-key type of
specific molecular recognition common in antigen and antibody binding,17 there can be
several types of receptors recognizing the same carbohydrate ligand. Strategies need to be
developed to differentiate these receptors. The third challenge relates to the availability of
pure carbohydrates for biological studies. It is difficult to purify large quantities of complex
oligosaccharides from natural sources due to the heterogeneity of carbohydrates on cell
surfaces and proteins. Although chemical and enzymatic synthesis of oligosaccharides and
glyco-conjugates has undergone tremendous progress,18 it is still restricted to specialized

103
laboratories. Therefore, to realize the full potential of carbohydrates in biomedical
applications requires a multi-disciplinary approach bringing together glyco-biologists,
material chemists and synthetic chemists.
Over the past decade, nanotechnology has played an important role in cancer
research and advances in nanoresearch have led to the development of novel nanoparticles
(NPs) where size, geometry, and surface functionality can be controlled at the nanoscale.19, 20
Using antibody-immobilized nanoparticles, various types of cancer cells were detected both
in Vitro and in Vivo. For instance Lin et al. fabricated mannose-coated gold NPs and studied
the selective binding to type 1 pili in Escherichia coli,21 which presented a novel method of
labelling specific proteins on the cell surface.22 Syková et al. showed that mannose-modified
iron oxide NPs were efficient probes for labelling stem cells.23 The Penadés group prepared a
small library of multivalent Au-NPs functionalized with different structural fragments of the
high mannose undecasaccharide of gp120 in various ligand densities and evaluated their
effects on the inhibition of HIV glycoprotein gp120 binding to DC-SIGN expressing cells.24
Besides imaging applications, the Penadés group reported the utilization of Lacto-AuNPs as
potent inhibitors of tumor metastasis in mice and evaluated their potential as anti-adhesive
tools against metastasis progression.25 The mouse melanoma B16F10 cells are known to
bind with lactose, presumably due to the presence of cell surface lectins such as galectins.
Pre-incubation of the B16F10 cells with the Lacto-AuNPs prior to injections into mice
substantially inhibited the lung metastasis of the tumor (up to 70%).
Silicon nanoparticles hold prominent interest in various aspects of biomedical
research. For instance current fields of interest range from imaging, detection, drug delivery
and new therapeutic uses.26, 27 Their fluorescence signatures,28-30 high quantum efficiency,31
size-dependent tunable light emission,29, 30, 32 high brightness33 and stability against
photobleaching compared to organic dye molecules make them ideal tools for fluorescence
imaging.34, 35 These properties have helped to establish silicon based nanoparticles in a
swathe of diagnostic and assay roles as fluorescent cellular markers.36, 37 Furthermore,
silicon exhibits a low inherent toxicity when compared with the heavy elements of several
other types of semiconductor quantum dots, which can pose significant risks to human
health.36, 38-40 The overall combination of these properties of SiNPs opens up new avenues of
applications in optoelectronics and bioimaging.41-43
In this chapter the first synthesis of stable and brightly luminescent carbohydrates
capped SiNPs is demonstrated. Various types of carbohydrate capped SiNPs such as -D-
Mannose (Man), -D-Galactose (Gal), -D-Glucose (Glu) and -D-Lactose (Lac) capped SiNPs

104
were synthesized from amine-terminated SiNPs and the corresponding pyranosyl acid. The
surface functionalization was confirmed by FTIR, NMR XPS and energy dispersive x-ray
spectroscopy (EDX) studies. The mean diameter of the crystal core was measured by TEM,
while the hydrodynamic diameter was obtained by dynamic light scattering (DLS). The
variety of these carbohydrate capped SiNPs constitute a good bio-mimetic model for
carbohydrate presentation on the cell surface, and may prove to be an excellent tool for
further glycobiology, biomedicine and material science investigations. Proof-of-principle
experiments are carried out using Concanavalin A (Con A) as the target protein.
Furthermore the Man functionalized SiNPs were verified inside MCF-7 (human breast
cancer cells) cells.
4.2 Carbohydrate capped SiNPs NPs from Hydrosilylation
Initially the carbohydrate capped SiNPs were designed to synthesized using a
hydrosilylation reaction (scheme 4.1).
Scheme 4.1: Schematic representation to synthesize carbohydrate capped SiNPs from
hydrosilylation reaction.
As explained in chapter 3 the hydrosilylation reaction can be carried out in several
ways such as thermally induced, UV induced or using metal catalyst, in which the surface of
Si-H bonds add across the carbon-carbon double bond. To proceed for a hydrosilylation
reaction it was necessary to synthesize and functionalize carbohydrate derivatives with allyl
groups.
4.2.1 Acetylation Reaction
All allyl functionalized carbohydrate synthesis was carried out using a method
published by Deming and Kramer.44
Formation of both -and -anomers are common in glycopeptides and
glycoproteins.45 Although the purification methodology allows using of either anomer, we
chose to use the -anomers as they were easily obtained in high purity.

105
Scheme 4.2: Acetylation of carbohydrates derivatives.
Scheme 4.3: Acetylation of Lactose sugar.
In order to functionalize the sugar with allyl group it is important to protect the
hydroxyl group of the sugar. Different types of protecting groups can be used to protect the
carbohydrate, such as alkyl ether type, benzoyl (Bz), trimethylacetyl type (Piv),
trifluoroacetyl (TFA), silyl based etc. depending on the reaction and reaction conditions
chosen. The acetate protection reaction for mannose, glucose and galactose was fast as
compared with lactose. The overall yield for all monosaccharide was high (96% yield)
compared to lactose (<50%).
4.2.2 Allylation Reaction
Scheme 4.4: Allylation reaction of carbohydrates derivatives

106
Scheme 4.5: Allylation reaction of Lactose heptaacetate.
Allylation of glu, man, gal pentaacetate and lac heptaacetates was accomplished
according to literature procedures and the pure -anomers (Chapter 2) were isolated.44
Purification of the anomers at this stage in the synthesis is crucial for the ultimate
preparation of optically pure, glyco monomers. The anomers were purified by column
chromatography (see Chapter 2). Mixtures of anomers would lead to SiNPs containing
different sugar configurations, which could make analysis of their properties difficult.
4.2.3 Attempted Thermally induced Hydrosilylation reaction
The hydrosilylation reaction mechanism in which the surface of Si-H bond adds
across the carbon-carbon double bonds was mentioned in Chapter 3 (section 3.3). The
reaction was first attempted using allyl galactose synthesized as per scheme 4.4
Scheme 4.6: Attempted Hydrosilylation reaction of carbohydrates derivatives.
The allyl galactose was reacted with H-terminated SiNPs under a nitrogen
atmosphere by heating at reflux in dry toluene. The resulting reaction mixture did not show
any evidence of product characterized by FTIR. Moreover the FTIR showed disappearance of
acetate (OAc) peaks and appearance of hydroxy (-OH) peaks at around 3400 cm-1 which
suggested using different protection group for carbohydrate.
It was decided to use tert-butyldimethylsilyl (TBDMS) group. Scheme 4.7 shows the
protection of carbohydrate derivative with TBDMS group.

107
Scheme 4.7: TBDMS protection to carbohydrate derivative.
The allyl galactose was protected with tert-butyldimethylsilyl (TBDMS) groups
(scheme 4.7). TBDMS protecting groups are particularly useful because they can be installed
and removed selectively under mild reaction conditions.
Scheme 4.8: Attempted synthesis of gal capped SiNPs by protecting with TBDMS
The reaction was repeated using TBDMS protecting groups but unfortunately did not
show any evidence of the expected product.
4.2.4 Attempted Hydrosilylation reaction using Pt catalyst
Scheme 4.9: Synthesis of Galactose capped SiNPs using Pt catalyst
The hydrosilylation was attempted using a metal catalyst, chloroplatinic acid
(H2PtCl6), in the presence of iso-propanol for 1 hour sonication (Scheme 4.9). Initially the
reaction was carried out at room temperature and sonication for 1 hour, unfortunately the

108
resulting reaction mixture did not show any improvement. Additionally it was noticed that
the red luminescence from the H-terminated SiNPs was disappearing after the addition of
the Pt catalyst. After increasing the temperature, the reaction mixture turned black with
complete loss of the red luminescence. FTIR indicated that the desired reaction had not
occurred.
4.3 Carbohydrates capped SiNPs Using Amine-terminated SiNPs
After several unsuccessful attempts, it was decided to make use of previously
synthesized amine-terminated SiNPs and perform an amidation reaction. For that purpose
the carbohydrates were functionalized with carboxylic acid and reacted with amine-
terminated SiNPs using various coupling reagents (Scheme 4.10). Scheme 4.10 represents
the synthetic route to carbohydrates capped SiNPs from amine-terminated SiNPs and
corresponding pyranosyl acid.

109
Scheme 4.10: Schematic Representation of Synthesis of D-Mannose Capped SiNPs

110
Scheme 4.11: Schematic representation of Galactose, Glucose and Lactose capped SiNPs
synthesized in this work.
All acid functionalized carbohydrate synthesis was carried out using a method
published by Deming and Kramer.44

111
4.3.1 Oxidation Reaction
Scheme 4.12: Oxidation of carbohydrate derivatives
Scheme 4.13: Oxidation of Lactose derivative
The allyl carbohydrate derivatives were functionalized with carboxylic acids by
oxidation reaction using sodium periodate (NaIO4) and Ruthenium chloride catalyst (RuCl3)
in the presence of carbon tetrachloride (CCl4) and water. The carboxylate functionalized
sugar was purified and coupled with amine-terminated SiNPs to give the desired conjugates.
4.3.2 Using N,N′-dicyclohexylcarbodiimide Coupling Reagent (DCC)
A pyranosyl acid and N,N′-dicyclohexylcarbodiimide (DCC) were dissolved in
dichloromethane (10 ml) and left to stir for 1 h at room temperature. Freshly prepared
amine terminated SiNPs (10 mg) were then added into the reaction mixture and stirred for 3
days at room temperature. The reaction mixture was washed with water (3 × 10 mL) and
extracted into CH2Cl2. The mixture was dried with Na2SO4, and the solvent was removed
under vacuum. The by-product of the reaction, dicyclohexylurea, proved difficult to remove
which could only be achieved by multiple filtrations. Furthermore the reaction was slow and
took at least 3 days to completion. Deacetylation of carbohydrate-capped SiNPs was
performed using sodium methoxide in methanol and then stirred 30 min with cation
exchange [H+] resin

112
4.3.3 Using 1-Ethyl-3-(3-dimethylaminopropyl) Carbodiimide Coupling
Reagent (EDC or EDAC)
Because of the purification issue mentioned above, the carbohydrate capped SiNPs
were also synthesized using EDC (1-Ethyl-3-(3-dimethylaminopropyl) carbodiimide) as the
coupling reagent as it is easy to handle, has a high solubility in water and in organic solvents.
The by-product urea formed during the reaction is readily soluble in water and can easily be
removed by extraction.
A corresponding pyranosyl acid and EDC were dissolved in dichloromethane and left
stirring for 2 hr at room temperature. After 2 hours N-hydroxysuccinimide (NHS) and
freshly prepared amine terminated SiNPs were added into the reaction mixture and stirred
overnight at room temperature (see Chapter 2). The product was isolated and purified (see
chapter 2) followed by deacetylation using sodium methoxide in methanol, then neutralized
by adding cation exchange [H+] resin. Using EDC as a coupling reagent the reaction was
completed overnight with an overall higher yield as compared with DCC.
4.4 Carbodiimide Coupling Reaction Mechanism
The reaction of carbodiimide is more complicated than described above (scheme
4.10) however Nakajima and Ikada unraveled the mechanism of the coupling reaction and it
is widely accepted.46 Scheme 4.14 shows the brief mechanism of formation of carbohydrate
capped SiNPs using amine-terminated SiNPs and EDC coupling reagent.

113
Scheme 4.14: Reaction mechanism of formation of carbohydrate capped SiNPs using EDC, NHS
coupling reagent and amine-terminated SiNPs.
The first step in the reaction is the protonation of carbodiimide EDC giving a
carbocation 1. In the presence of carboxylate, carbocation 1 is attacked giving O-acylisourea
3. Amide formation is possible by two routes, the first being when a non-dissociated

114
nucleophile i.e. amine-terminated SiNPs attacks 3 giving the product amide 5 and the urea
derivative 2. On the other hand, a carboxylate, which is a strong nucleophile, can attack 3,
giving an acid anhydride, which a non-dissociated primary amine attack giving the desired
amide coupling product 5. In the absence of nucleophile water can hydrolyze 3 into urea
derivative 2. Since the amount of water is much higher than that of amine SiNPs, the
hydrolysis of 3 is most likely to happen than the formation of amide product. The advantage
of using N-hydroxysuccinimide (NHS) is that it helps to form a less hydro-sensitive compound
that is more reactive towards amine SiNPs. The active O-acylisourea 3 intermediate reacts with
NHS to form succinimidyl ester that is more stable towards the oxidation. The dissociated
hydroxyl group of NHS makes a nucleophilic attack on O-acylisourea 3, giving urea derivative
and succinimidyl ester 4, which can then be attacked by amine-terminated SiNPs, resulting in the
amide product 5 (sugar capped SiNPs) and regenerating NHS.
4.5 Size Measurement with TEM and DLS
The size and size distribution in diameter of carbohydrate-capped SiNPs were
examined by TEM and DLS. Prior to the measurements the sticky solid of pure carbohydrate-
capped SiNPs was dissolved in water. Figure 4.1a shows a TEM image of gal-capped SiNPs
and figure 4.2 shows the TEM images (along with DLS data) for all carbohydrate capped
SiNPs on a carbon coated copper grid.
The histogram in Figure 4.1b shows the size distribution of carbohydrate-capped
SiNPs. The TEM measurement displayed the mean diameter and size distribution in
diameter of carbohydrate-capped SiNPs is 5.5 ± 2.4 nm after analyzing 195 NPs from
different regions of the grid. As all the carbohydrate-capped SiNPs are synthesized from
amine-terminated SiNPs, hence the core size of all gal, man, glu and lac-capped SiNPs remain
similar. The inset in Figure 4.1a shows the highly crystalline structure of the atomic lattices.
The lattice spacing of 0.31 nm is consistent with the Si (111) plane.

115
Figure 4.1: (a) TEM image of Gal-capped SiNPs and inset showing a high-resolution TEM image
of an individual silicon nanocrystal screening the crystal lattice planes (b) Histogram showing
size distribution (in diameter) of Gal capped SiNPs.
The DLS result of all carbohydrate-capped SiNPs is shown in Table 4.1 and in figure
4.2. As mentioned in the previous chapter the DLS measures the hydrodynamic diameter of
the NPs and it is dependent on the functionality present on the surface of the NPs, the larger
the capping functionality the bigger is the hydrodynamic diameter of the NPs. The diameter
of carbohydrate capped SiNPs in water is larger than the one obtained from TEM
measurements because the carbohydrate ligands around the SiNPs form a hydration shell,
whereas DLS measures the hydrodynamic diameter of the carbohydrates-capped SiNPs in
water.8, 47-49
Table 4.1: DLS data of carbohydrates capped SiNPs in water (± is repeatability)
Functionalize SiNPs Diameter measure by DLS
Amine terminated SiNPs 7.5 ± 1.0 nm
Gal capped SiNPs 11 ± 1.0 nm
Man capped SiNPs 15 ± 1.0 nm
Glu capped SiNPs 19 ± 2.0 nm
Lac capped SiNPs 24 ± 1.0 nm

116
Figure 4.2: TEM images of Gal (a), Lac (c) Glu (e) and Man (g) capped SiNPs. Dynamic light
scattering spectrum displays the size and size distribution (in diameter) of Gal (b), Lac (d) Glu
(f) and Man (h) capped SiNPs in water.
1 10 100 1000 10000
0
5
10
15
20
25
Nu
mb
er
(%)
Size (nm)
100 nm
1 10 100 1000
0
5
10
15
20
25
Nu
mb
er
(%)
Size (nm)100 nm
1 10 100 1000 10000
0
3
6
9
12
15
18
Nu
mb
er
(%)
Size (nm)100 nm
(a)(b)
(d)
(f)
(c)
(e)
100 nm1 10 100 1000 10000
0
5
10
15
20
25
Nu
mb
er
(%)
Size nm)
(g)(h)
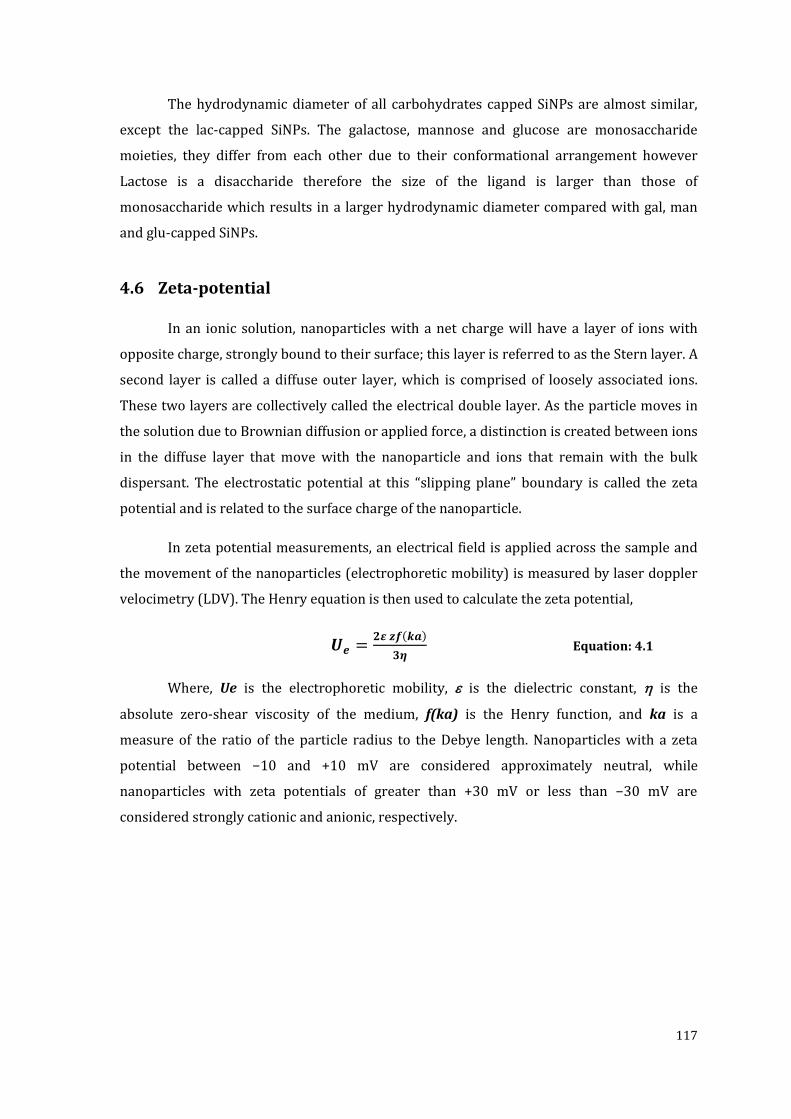
117
The hydrodynamic diameter of all carbohydrates capped SiNPs are almost similar,
except the lac-capped SiNPs. The galactose, mannose and glucose are monosaccharide
moieties, they differ from each other due to their conformational arrangement however
Lactose is a disaccharide therefore the size of the ligand is larger than those of
monosaccharide which results in a larger hydrodynamic diameter compared with gal, man
and glu-capped SiNPs.
4.6 Zeta-potential
In an ionic solution, nanoparticles with a net charge will have a layer of ions with
opposite charge, strongly bound to their surface; this layer is referred to as the Stern layer. A
second layer is called a diffuse outer layer, which is comprised of loosely associated ions.
These two layers are collectively called the electrical double layer. As the particle moves in
the solution due to Brownian diffusion or applied force, a distinction is created between ions
in the diffuse layer that move with the nanoparticle and ions that remain with the bulk
dispersant. The electrostatic potential at this “slipping plane” boundary is called the zeta
potential and is related to the surface charge of the nanoparticle.
In zeta potential measurements, an electrical field is applied across the sample and
the movement of the nanoparticles (electrophoretic mobility) is measured by laser doppler
velocimetry (LDV). The Henry equation is then used to calculate the zeta potential,
( )
Equation: 4.1
Where, Ue is the electrophoretic mobility, is the dielectric constant, is the
absolute zero-shear viscosity of the medium, f(ka) is the Henry function, and ka is a
measure of the ratio of the particle radius to the Debye length. Nanoparticles with a zeta
potential between −10 and +10 mV are considered approximately neutral, while
nanoparticles with zeta potentials of greater than +30 mV or less than −30 mV are
considered strongly cationic and anionic, respectively.

118
Table 4.2: Zeta-potential of carbohydrates capped SiNPs in water
SiNPs in water SiNPs ζ-potential (mV)
Amine terminated SiNPs 0 ± 3.0
Gal capped SiNPs -19 ±1.0
Man capped SiNPs -15 ± 1.0
Glu capped SiNPs -9 ± 1.5
Lac capped SiNPs -12 ± 0.5
The zeta-potential of amine-terminated SiNPs is measured as ±3 mV. In contrast, the
various functionalized carbohydrate capped SiNPs showed a negatively charged ζ-potential
ranging from -20 to +3 mV. The expected zeta-potential value for amine capped particles is
in the region of +30 mV as the amines ionize in the water but the zeta value obtained in water
was neutral ± 3.0mV. The relative zeta values obtained for sugar capped SiNPs comparing with
amine-terminated SiNPs are as expected (i.e. they were less positive since some of the amines
were converted to amides) but the absolute values remained unexplained. The relative zeta
values for sugar capped SiNPs can also be explained on the basis of steric hindrances and poor
capping. Due to the conformational arrangement of sugars on the surface of SiNPs, some area
remains uncapped. Surface oxidation might also have occurred due to the reaction conditions or
the carry forward surface oxidation (SiOx) from amine-terminated SiNPs, which could have
resulted from the strongly oxidising Pt (IV) hydrosilylation catalyst. The zeta potential of
oxidised SiNPs is around -37mV which helps to explain the relative values of sugar capped SiNPs.
The more negative value obtained for gal capped SiNPs suggest that the SiNP is poorly capped
with galactose sugar, which leaves some areas uncapped and possibly some surface oxidation
resulting in the negatively charged zeta potential. This hypothesis also helps to explain the high
QY and bright luminescence obtained for lactose and glucose capped SiNPs compared to that of
gal capped SiNPs. Therefore the more the zeta potential shifts to the neutral, the better is the
capping and thus superior fluorescence QY is observed.
4.7 Chemical Bonding and Elemental Analysis
4.7.1 Energy-dispersive X-ray Measurements (EDX)
EDX analysis was performed on a dry sample; prior to measurement the sample was
coated with gold (Au), which was used as a reference. In Figure 4.3, the EDX analysis shows
all the elements in the expected functionalities in their expected ratios. The SiNPs surface is

119
coated with a large number of carbon and oxygen atoms in agreement with this analysis,
where the highest peak was carbon and the second highest peak oxygen, which are present
in the carbohydrates groups as well as in the Si−O bonding. In addition, there is a sharp peak
of silicon, which is indicative of the core. Overall, the analysis proves that not only is the
surface functionalized with carbohydrates moiety but also the silicon core nanoparticles are
present in the sample.
Figure 4.3: EDX spectroscopy of (a) man, (b) Gal, (c) Glu, and (d) Lac capped SiNPs
(a)
(b)
(c)
(a)
(d)
Man capped SiNPs
Gal capped SiNPs
Glu capped SiNPs
Lac capped SiNPs

120
In Figure 4.3 it is observed that the monosaccharides show higher intensity of Si
peak compared with lactose. Since Lactose is a disaccharide so the amount of carbon and
oxygen molecule will be higher compared with the monosaccharides.
4.7.2 Fourier Transform Infrared Spectroscopy (FTIR)
In order to confirm the SiNPs surface is covered with carbohydrate groups through
an amide bond FTIR spectra were acquired in normal transmission alignment. Figure 4.4
compares the FTIR spectra of the carbohydrate capped SiNPs produced in this work (Figure
4.4.d) with those obtained for the starting amine terminated SiNPs (Figure 4.4a) and D-man
pyranosyl acid 2c (Figure 4.4b) as well as that of the intermediate OAc protected
carbohydrate-capped SiNPs (Figure 4.4.c). All spectra were obtained from dry solid samples.
At this point it is worth reminding that all carbohydrates (Gal, Man, Glu and Lac) have a
similar functionality and bonding, they differ from each other due to their conformational
behavior. Although Lactose is a disaccharide and has two sugar molecules bound to each
other, the ratio of some bonding features will be more intense but it will still show similar
features at similar positions. The FTIR spectra of carbohydrate capped SiNPs are presented
in Figure 4.4 and their detailed analysis is shown in Table 4.3.
Figure 4.4: FTIR spectra of (a) Amine-terminated SiNPs, (b) Starting material acid sugar c, (c)
Intermediate OAc-carbohydrate capped SiNPs, and (d) Pure carbohydrate capped SiNPs in the
solid state (32 scans, 2 cm -1 resolution).
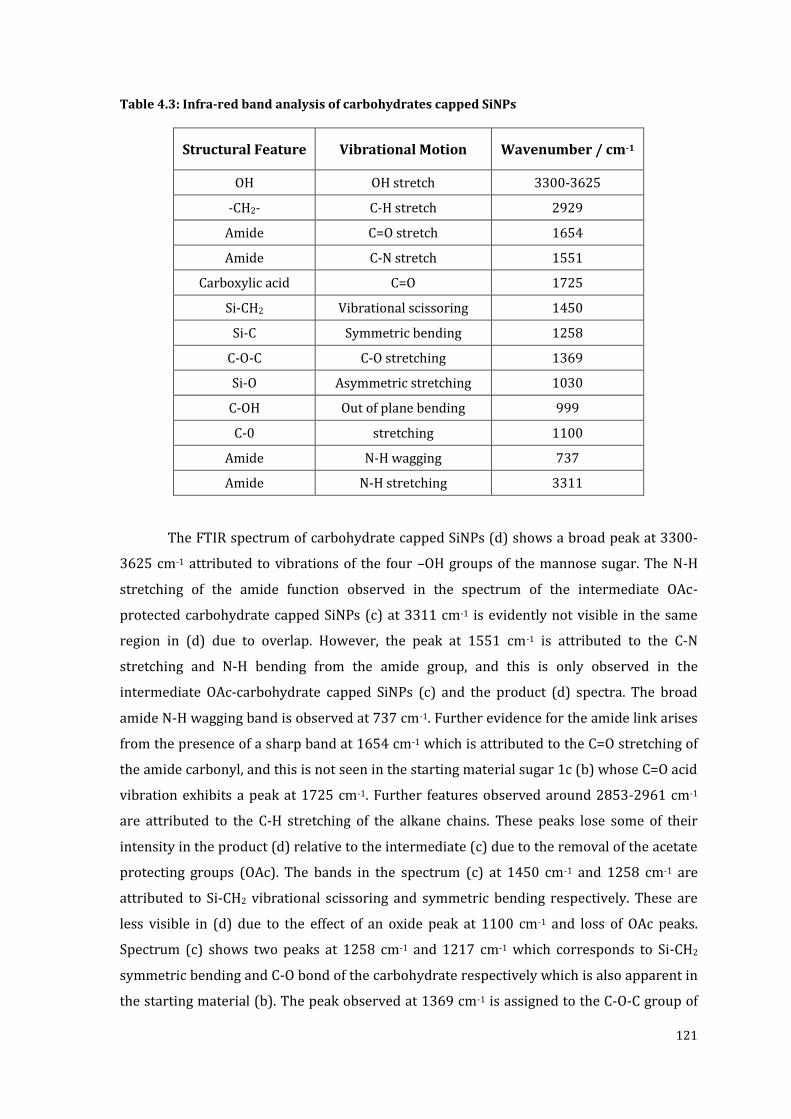
121
Table 4.3: Infra-red band analysis of carbohydrates capped SiNPs
Structural Feature Vibrational Motion Wavenumber / cm-1
OH OH stretch 3300-3625
-CH2- C-H stretch 2929
Amide C=O stretch 1654
Amide C-N stretch 1551
Carboxylic acid C=O 1725
Si-CH2 Vibrational scissoring 1450
Si-C Symmetric bending 1258
C-O-C C-O stretching 1369
Si-O Asymmetric stretching 1030
C-OH Out of plane bending 999
C-0 stretching 1100
Amide N-H wagging 737
Amide N-H stretching 3311
The FTIR spectrum of carbohydrate capped SiNPs (d) shows a broad peak at 3300-
3625 cm-1 attributed to vibrations of the four –OH groups of the mannose sugar. The N-H
stretching of the amide function observed in the spectrum of the intermediate OAc-
protected carbohydrate capped SiNPs (c) at 3311 cm-1 is evidently not visible in the same
region in (d) due to overlap. However, the peak at 1551 cm-1 is attributed to the C-N
stretching and N-H bending from the amide group, and this is only observed in the
intermediate OAc-carbohydrate capped SiNPs (c) and the product (d) spectra. The broad
amide N-H wagging band is observed at 737 cm-1. Further evidence for the amide link arises
from the presence of a sharp band at 1654 cm-1 which is attributed to the C=O stretching of
the amide carbonyl, and this is not seen in the starting material sugar 1c (b) whose C=O acid
vibration exhibits a peak at 1725 cm-1. Further features observed around 2853-2961 cm-1
are attributed to the C-H stretching of the alkane chains. These peaks lose some of their
intensity in the product (d) relative to the intermediate (c) due to the removal of the acetate
protecting groups (OAc). The bands in the spectrum (c) at 1450 cm-1 and 1258 cm-1 are
attributed to Si-CH2 vibrational scissoring and symmetric bending respectively. These are
less visible in (d) due to the effect of an oxide peak at 1100 cm-1 and loss of OAc peaks.
Spectrum (c) shows two peaks at 1258 cm-1 and 1217 cm-1 which corresponds to Si-CH2
symmetric bending and C-O bond of the carbohydrate respectively which is also apparent in
the starting material (b). The peak observed at 1369 cm-1 is assigned to the C-O-C group of

122
the sugar which can also be observed in spectra (b), (c) and (d). The broad band observed at
999-1100 cm-1 is attributed to Si-O, C-O and C-OH. The broadening and the high intensity of
this peak is due to the four hydroxyl OH groups of the sugar and not to the Si-O bond, which
can be clearly seen in both spectra (c) and (d).
All these observed features confirm that the SiNPs are capped with sugar molecules.
Also, these characteristics highlight the strength and stability of the Si−C bond formed
between the SiNPs and the carbohydrates, as well as the minimal level of Si-O due to
oxidation.
4.7.3 Nuclear Magnetic Resonance Spectroscopy (NMR)
The surface chemical bonding of carbohydrate capped SiNPs was also confirmed by
13C NMR spectroscopy. In the case of NPs it is difficult to analyze the proton NMR due to
background noise. In the case of 13C NMR the appearance of the amide carbon at 169.76 ppm
and disappearance of the acid carbon peak at 175.79 ppm was clearly observed. For instance,
Figure 4.5 compares the 13C NMR spectra of acidic Man sugar 1c (starting material) in CDCl3,
intermediate OAc protected Man capped SiNPs in CDCl3 and Man capped SiNPs in D2O.
Figure 4.6 shows the 13C NMR spectra expanded from the interesting amide bonding region,
from 167 ppm-176ppm. Unfortunately, it was not possible to obtain all three spectra in the
same solvent due to the differing solubilities of the various compounds. It is important to
remember at this point that all the monosaccharides differ from each other due to their
conformational arrangement so the 13C NMR for all monosaccharides are similar except for
Lactose that is a disaccharide, although the amide peak is still at a similar position to that of
the monosaccharides.

123
Figure 4.5: 13C NMR spectra of (a) starting material 2c in CDCl3, (b) Intermediate OAc-man
capped SiNPs in CDCl3, and (c) Pure man capped SiNPs in D2O.
Figure 4.6: 13C NMR spectra of starting material 2c, Intermediate OAc-man capped SiNPs and
pure man capped SiNPs, expanded from the region of 167-176 pmm.
The spectrum of the starting material acid sugar 2c (a) shows a peak at 175.79 ppm,
which is attributed to the carbonyl carbon (-C=O) of the acid function of man sugar. The four
(a)
(b)
(c)

124
peaks between 169.6 ppm and 170.6 ppm are attributed to the four OAc protecting groups
of man sugar. The five carbon atoms making up the carbohydrate ring have peaks located
between 67 ppm and 69.4 ppm. The peaks at 61 ppm and 33 ppm are attributed to the two –
CH2 groups of man sugar. The formation of the amide bond is clearly observable in the
intermediate OAc-man capped SiNPs (b) through the disappearance of the acid carbon peak
at 175.79 ppm and the appearance of a new peak at 169.76 ppm, attributed to the amide
carbonyl carbon (see figure 4.6). The spectrum (b) is that of a crude sample due to the
complexity of isolation (see experimental) and shows peaks in the aliphatic region belonging
to reagents and side-products. Following the removal of the acetate groups, the spectrum of
man capped SiNPs (c) shows only a single peak in the carbonyl region at 173 ppm attributed
to the amide carbonyl carbon. The peaks at 115.72 ppm and 133.4 ppm belong to the amine-
capped nanoparticles. The peaks at 215 ppm and 29 ppm originate from acetone-d6, which
was added as a reference for the sample in D2O.
4.7.4 X-ray Photoelectron Spectroscopy (XPS)
As explained in a previous chapter, XPS is an important technique for characterizing
the surface of the SiNPs (see Chapter 2). Furthermore the chemical bonding of carbohydrate
capped SiNPs was also investigated with high resolution XPS over the Si2p, C1s, O1s and N1s.
A full survey of the photoelectron spectrum of gal capped SiNPs is shown in Figure 4.7.
200 400 600 800 1000 1200
Inte
ns
ity
(a
rb.u
nit
s)
Binding Energy (eV)
Si 2p N1s
C1s
O1s
Figure 4.7: XPS survey spectrum from the film of gal capped SiNPs deposited on a gold
substrate
The contribution of silicon, oxygen, carbon and nitrogen are clearly seen. The Si2p
peak shown to be weak, whereas the C1s and O1s are shown to be strong, which suggest that

125
the SiNPs are highly coated with carbohydrate functionality (Galactose). Figure 4.8 shows
high-resolution XPS spectra of Si2p, C1s, O1s and N1s regions of a thin film of gal capped
SiNPs.
The Si2p spectrum was fitted with three peaks and a Shirley background. The three
peaks are at 101.07, 103.20 and 100.98 eV. The first component is attributed to Si−C
indicating that the surface of the SiNP is capped with galactose sugar through the amine
moiety. The second component is assigned to Si−O, which is indicative of the sample surface
oxidation under ambient conditions. The third peak at 100.98 eV is attributed to Si−Si within
the silicon core of the SiNPs.27, 50
Figure 4.8: XPS core-level spectra of carbohydrate capped SiNPs obtained at 20C to normal
emission: the dotted line is experimental data that is fitted with various mixed components (a)
Si2p, (b) C1s, (c) O1s, and (d) N1s at 400 eV.
The C1s spectrum is fitted with four mixed singlet and one Shirley background. The
four components were at 285.42, 283.9, 286.71 and 288.08eV respectively. The first C1s
peak at binding energy 285.42 eV is assigned to C−C or C−H bonding.51, 52 The second broad
peak at binding energy 283.99 eV is attributed to the C−Si bonding.50 and the third distinct
526 528 530 532 534 536 538 540 542
Position FWHM Area Mixing
O1s (A) 532.16 1.61 5556 87.21%
O1s (B) 533.45 1.38 8150 12.79%
O1s
B
A
Inte
nsit
y (
arb
.un
its)
Binding Energy (eV)
94 96 98 100 102 104 106 108 110
B
C
A
Position FWHM Area Mixing
Si 2p (A) 100.98 1.9 225.9 (73.32%)
Si 2p (B) 103.20 1.9 34.6 (11.23%)
Si 2p (C) 101.07 1.9 47.6 (15.44%)
Si2p
Inte
nsit
y (
arb
.un
its)
Binding Energy (eV)
279 282 285 288 291 294 297 300
A
B
C D
Position FWHM Area Mixing
C1s (A) 285.42 1.5 296 53.26%
C1s (B) 283.99 1.2 160 28.79%
C1s (C) 286.71 1.3 559 10.04%
C1s (D) 288.08 1.8 440 7.91%
C1s
Inte
nsit
y (
arb
.un
its)
Binding energy (eV)
390 393 396 399 402 405 408 411
N1s
B
A
Position FWHM Area Mixing
N1s (A) 399.3 1.7 270.7 80.32%
N1s (B) 398.7 1.2 668.9 19.68%
Inte
nsit
y (
arb
.un
its)
Binding Energy (eV)
(a) (b)
(c) (d)

126
peak 286.71 eV is ascribed to C−N bonding and C-OH bonding.53 The fourth peak at binding
energy 288.08 eV is assigned to C=O (amide) bonding.54, 55 The existence of a C−Si and C=O
amide bonding component implies that the surface of the silicon nanoparticle was capped
with galactose moiety.
The O1s spectrum presented in Figure 4.8c is fitted with two components and a
Shirley background. The two components are at binding energy 532.68 and 534.23 eV
respectively. The first distinct O1s peak at 532.68 eV is from a Si−O group of the oxidized
surface of SiNPs. The second component is possibly from hydroxide O−H group.50
The N1s spectrum presented in Figure 4.8d is fitted with two components and a
Shirley background. The broad distinct peak is at 399.34 eV is attributed to the NHC=O
amide bonding of the galactose capped SiNPs.54 The second peak at binding energy of 398.9
is attributed to the C-N bonding of amine functionality.53 This is due to the bulky galactose
molecule on the surface, steric hindrance is present which leaves some space uncapped.
4.8 Optical Properties of Carbohydrate capped SiNPs
4.8.1 Photoluminescence Spectroscopy (PL)
The absorption and emission spectra of carbohydrate capped SiNPs in water are
presented in Figure 4.9 and Figure 4.10.
Figure 4.9: The dotted line shows the absorption spectrum of man capped SiNPs in water; the
solid line shows the photoluminescence spectrum of man capped SiNPs in water under an
excitation of 360 nm. The inset photo shows the fluorescence from Man capped SiNPs in water
under a UV lamp.
(a) Excitation
Inte
nsit
y (
arb
.un
its)
300 350 400 450 500 550 600 650
Emission
Wavelength (nm)

127
The inset photograph in Figure 4.9 shows the man capped SiNPs in water under UV
illumination at 364 nm. The gradual increase in the absorbance of all carbohydrate capped
SiNPs with decreasing excitation wavelength from the onset wavelength of 450 nm,
corresponding to the absorption edge of 2.75 eV, is characteristic of absorption across the
indirect band gap of silicon.28 The PL spectrum of all carbohydrate capped SiNPs in water at
room temperature is shown as a solid line. The maximum emission peak is centered at 468
nm with a full width at half maximum (FWHM) of 58 nm under an excitation wavelength of
360 nm
Figure 4.10: The dotted line shows the absorption spectrum in water; the solid line shows the
photoluminescence spectrum of (a) gal capped SiNPs, (b) glu capped SiNPs and (c) lac capped
SiNPs in water under an excitation of 360 nm
300 350 400 450 500 550 600 650
Emission
Wavelength (nm)
Excitation
Inte
nsit
y (
a.u
)
300 350 400 450 500 550 600 650
Emission
Wavelength (nm)
Excitation
Inte
ns
ity
(a
.u)
300 350 400 450 500 550 600 650
Emission
Wavelength (nm)
Excitation
Inte
nsit
y (
a.u
)
(a)
(b)
(c)
Gal capped SiNPs
Lac capped SiNPs
Glu capped SiNPs

128
Interestingly the PL of these carbohydrates capped SiNPs in the solid phase, where
the sample was drop cast onto a glass coverslip and dried in vacuum, shows a strong orange
luminescence under UV light. The PL emission spectrum of Man capped SiNPs in the solid
phase is presented in Figure 4.11, with an inset showing a photograph of the man capped
SiNPs under UV illumination of 254 nm. The maximum emission peak, under an excitation
wavelength of 360 nm, is centred at 600 nm and the second peak is centred at 476 nm, with
a FWHM of 51 nm and 56 nm respectively. In Figure 4.9 and Figure 4.11 the peak centred at
around 468 nm is characteristic of absorption across the band gap of silicon and is thus
responsible for blue emission. Moreover the blue luminescence may be due to the oxidation
of silicon (Si-O), nevertheless it is mainly the characteristic of silicon binding to nitrogen
which causes a blue-green luminescence recently studied by Veinot et al.56 In Figure 4.11 the
peak centred at 600 nm shows orange emission, could also be a consequence of surface
states and defects due to surface functionality. In the solid phase, both components are
observable, unlike in the solution where the orange emission peak centered at 600 nm is not
present. This suggests there is a quenching effect of the solvent around the surface
functionality of SiNPs. It is believed that the surface functionality causes this change in
luminescence. The hydroxyl –OH groups on the sugar molecule form hydrogen bonds with
the solvent and this causes the quenching of the orange emission.
Figure 4.11: The photoluminescence spectrum of man capped SiNPs in the dry state under an
excitation of 360 nm. The inset photo shows the fluorescence from a solid sample of man
capped SiNPs under a UV lamp.
This phenomenon can also be explained on the basis of previous studies carried out
by Chao et al.57 where it is suggested that the blue PL in alkylated SiNPs prepared by
electrochemical etching method and subsequently oxidized, was determined to originate
(b)
420 480 540 600 660 720 780 840 900
Inte
nsit
y (
arb
.un
its)
Wavelength (nm)
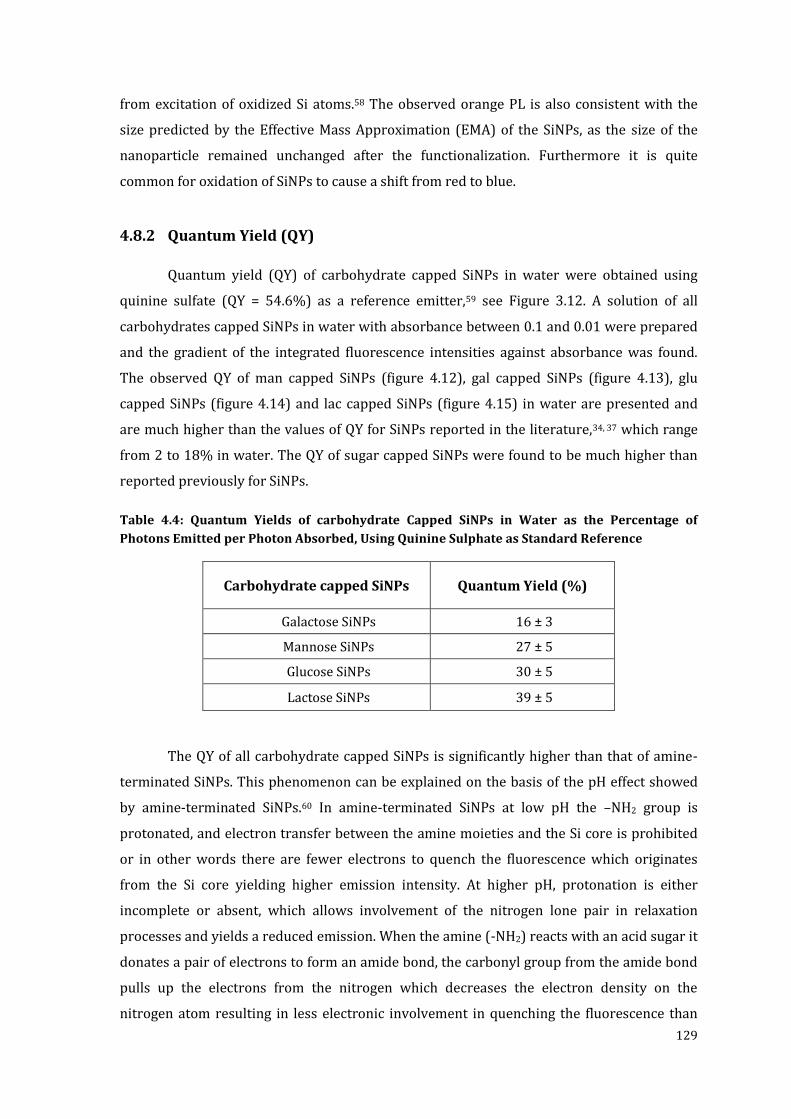
129
from excitation of oxidized Si atoms.58 The observed orange PL is also consistent with the
size predicted by the Effective Mass Approximation (EMA) of the SiNPs, as the size of the
nanoparticle remained unchanged after the functionalization. Furthermore it is quite
common for oxidation of SiNPs to cause a shift from red to blue.
4.8.2 Quantum Yield (QY)
Quantum yield (QY) of carbohydrate capped SiNPs in water were obtained using
quinine sulfate (QY = 54.6%) as a reference emitter,59 see Figure 3.12. A solution of all
carbohydrates capped SiNPs in water with absorbance between 0.1 and 0.01 were prepared
and the gradient of the integrated fluorescence intensities against absorbance was found.
The observed QY of man capped SiNPs (figure 4.12), gal capped SiNPs (figure 4.13), glu
capped SiNPs (figure 4.14) and lac capped SiNPs (figure 4.15) in water are presented and
are much higher than the values of QY for SiNPs reported in the literature,34, 37 which range
from 2 to 18% in water. The QY of sugar capped SiNPs were found to be much higher than
reported previously for SiNPs.
Table 4.4: Quantum Yields of carbohydrate Capped SiNPs in Water as the Percentage of
Photons Emitted per Photon Absorbed, Using Quinine Sulphate as Standard Reference
Carbohydrate capped SiNPs Quantum Yield (%)
Galactose SiNPs 16 ± 3
Mannose SiNPs 27 ± 5
Glucose SiNPs 30 ± 5
Lactose SiNPs 39 ± 5
The QY of all carbohydrate capped SiNPs is significantly higher than that of amine-
terminated SiNPs. This phenomenon can be explained on the basis of the pH effect showed
by amine-terminated SiNPs.60 In amine-terminated SiNPs at low pH the –NH2 group is
protonated, and electron transfer between the amine moieties and the Si core is prohibited
or in other words there are fewer electrons to quench the fluorescence which originates
from the Si core yielding higher emission intensity. At higher pH, protonation is either
incomplete or absent, which allows involvement of the nitrogen lone pair in relaxation
processes and yields a reduced emission. When the amine (-NH2) reacts with an acid sugar it
donates a pair of electrons to form an amide bond, the carbonyl group from the amide bond
pulls up the electrons from the nitrogen which decreases the electron density on the
nitrogen atom resulting in less electronic involvement in quenching the fluorescence than

130
that of amine-terminated SiNPs and ultimately increases the fluorescence QY of
carbohydrate capped SiNPs.
4.8.2.1 QY of mannose capped SiNPs in water
Figure 4.12: Quantum yield measurement of mannose capped SiNPs: (a) Absorption and (b)
emission spectra obtained for different concentrations of man capped SiNPs, (c) Scatter plot of
integrated intensity (area under emission spectrum) against absorbance at 360 nm.
The gradient of quinine sulphate and man capped SiNPs was obtained as 832456 and
512449.9 respectively (figure 3.12c) and (figure 4.12c). The refractive indices of both
solvents were known, thus the quantum yield of the man capped SiNPs can be calculated as
follows:
(
) (
)
The calculated quantum yield of man capped SiNPs by comparing the integrated PL
intensities of the man capped SiNPs and quinine sulphate is about 32.81 % with excitation
wavelength at 360 nm.
0.030 0.045 0.060 0.075 0.090 0.105
12000
18000
24000
30000
36000
42000
48000
Inte
gra
ted
In
ten
sit
y
Absorbance at 360 nm
Y = -3214.64 + 512449.97
400 450 500 550 600 650
0
100
200
300
400
500
600
700
0.02 A
0.04 A
0.06 A
0.08 A
0.10 A
Inte
nsit
y (
a.u
)
Wavelength (nm)
300 350 400 450 500 550 600
0.00
0.04
0.08
0.12
0.16
0.20
0.24
Ab
so
rban
ce
Wavelength (nm)
1% in water
2% in water
3% in water
4% in water
5% in water
(a) (b)
(c)

131
4.8.2.2 QY of Gal capped SiNPs in water
Figure 4.13: Quantum yield measurement of galactose capped SiNPs: (a) Absorption and (b)
emission spectra obtained for different concentrations of gal capped SiNPs, (c) Scatter plot of
integrated intensity (area under emission spectrum) against absorbance at 360 nm.
The gradient of quinine sulphate and gal capped SiNPs was obtained as 832456 and
258324 respectively (figure 3.12c) and (figure 4.13c). The refractive indexes of both
solvents were known, thus the quantum yield of the gal capped SiNPs can be calculated as
follows:
(
) (
)
The calculated quantum yield of gal capped SiNPs by comparing the integrated PL
intensities of the gal capped SiNPs and quinine sulphate is about 16.54% with and excitation
wavelength at 360nm.
0.02 0.04 0.06 0.08 0.10
4000
8000
12000
16000
20000
24000
Inte
gra
ted
In
ten
sit
y
Absorbance at 360 nm
Y= -1765.78 + 258324.01
400 450 500 550 600 650 7000
100
200
300
400
0.02 A
0.04 A
0.06 A
0.08 A
0.1 A
Inte
nsit
y (
a.u
)
Wavelength (nm)
300 400 500 600 700
0.00
0.05
0.10
0.15
0.20
1 % in water
2 % in water
3 % in water
4 % in water
5 % in water
Ab
so
rban
ce
Wavelength (nm)
(a) (b)
(c)

132
4.8.2.3 QY of Glucose capped SiNPs in water
Figure 4.14: Quantum yield measurement of glucose capped SiNPs: (a) Absorption and (b)
emission spectra obtained for different concentrations of glu capped SiNPs, (c) Scatter plot of
integrated intensity (area under emission spectrum) against absorbance at 360 nm.
The gradient of quinine sulphate and glu capped SiNPs was obtained as 832456 and
540115.9 respectively (figure 3.12c) and (figure 4.14c). The refractive indexes of both
solvents were known, thus the quantum yield of the glu capped SiNPs can be calculated as
follows:
(
) (
)
The calculated quantum yield of glu capped SiNPs by comparing the integrated PL
intensities of the glu capped SiNPs and quinine sulphate is about 34.58% with and excitation
wavelength at 360nm.
0.04 0.06 0.08 0.10 0.12
10000
20000
30000
40000
50000
60000
Inte
gra
ted
In
ten
sit
y
Absorbance at 360nm
Y= -12810.96+540115.922
300 350 400 450 500 550 600
0.00
0.05
0.10
0.15
0.20
0.25
0.03 A
0.05 A
0.06 A
0.08 A
0.12 A
Ab
so
rban
ce
Wavelength (nm)
400 450 500 550 600 650
0
150
300
450
600
750
0.03 A
0.05 A
0.06 A
0.08 A
0.12 A
Inte
nsit
y (
arb
.un
its)
Wavelength (nm)
(a) (b)
(c)

133
4.8.2.4 Quantum yield for Lactose SiNPs in water
Figure 4.15: Quantum yield measurement of lactose capped SiNPs: (a) Absorption and (b)
emission spectra obtained for different concentrations of lac capped SiNPs, (c) Scatter plot of
integrated intensity (area under emission spectrum) against absorbance at 360 nm.
The gradient of quinine sulphate and lac capped SiNPs was obtained as 832456 and
696766.5 respectively (figure 3.12c) and (figure 4.15c). The refractive indexes of both
solvents were known, thus the quantum yield of the lac capped SiNPs can be calculated as
follows:
(
) (
)
The calculated quantum yield of lac capped SiNPs by comparing the integrated PL
intensities of the lac capped SiNPs and quinine sulphate is about 11.55% with and excitation
wavelength at 360 nm.
0.030 0.045 0.060 0.075 0.090 0.105
0
10000
20000
30000
40000
50000
60000
Inte
gra
ted
In
ten
sit
y
Absorbance at 360 nm
Y=-19023.013+696766.52
400 450 500 550 600 6500
150
300
450
600
750
0.10 A
0.04 A
0.02 A
0.06 A
0.07 A
Inte
nsit
y (
arb
.un
its)
Wavelenghth (nm)
300 350 400 450 500 550 6000.00
0.04
0.08
0.12
0.16
0.20
0.02 A
0.04 A
0.06 A
0.07 A
0.10 A
A
bso
rban
ce
Wavelength (nm)
(a) (b)
(c)

134
4.8.3 Photoinduced Electron Transfer (PET)
The increasing fluorescence QY in carbohydrate from gal capped SiNPs to lac capped
SiNPs could be due to the Photoinduced Electron Transfer (PET) principle. PET often
underlies the mechanism by which the ‘switching’ or ‘sensing’ effect occurs. Fluorescent
signaling via the PET strategy is distinguished by its intrinsically supramolecular nature
since distinct components perform each one of the necessary functions. The PET can be
inhibited by conformational changes, local polarity modulation and hydrogen bonding. Such
a suppression of the PET process means that the fluorescence is “switched on” again. Several
researchers have reported the enhancement of the fluorescence due to protonation.61-63
Figure 4.16: Schematic representation of the fluorophore – spacer – receptor format of PET
system (top) and the analogous Gal receptor conjugation – spacer – SiQDs.
Figure 4.16 demonstrates the PET between the SiNP and carbohydrate moiety. In its
‘off’ state the excitation from fluorophore (SiQDs) components produces electron transfer
from the receptor to the fluorophore. In its ‘on’ state the electron transfer is prohibited due
to the arrival of the analyte at the receptor site. The prohibition of the electron transfer can
possibly be understood with the help of Auger electron theory, suggested by Efros and
Rosen et. al.64 The Auger decay of multiexciton can lead to the ejection of a charge, a
phenomenon known as Auger ionization. The fluorescence intensity or QY of the
carbohydrate capped SiNPs increases perhaps due to the charging of the SiNPs core, in
which the hot-electron trap65 occurs due to the protective and non-conductive sugar
molecules on the surface. In its “ON” state the electron does not eject from the SiQDs due to
the hot-electron trap resulting in the increasing PL intensity and ultimately increases the QY
of the nanoparticles. In its “OFF” state the fast nonradiative Auger recombination occurs that
quenches the PL, which would correspond to weakly emitting states or week PL intensity.
FluorophoreReceptor Spacer

135
4.8.4 pH effect
The pH effect in carbohydrate capped SiNPs was investigated by measuring
photoluminescence (PL) at different pH conditions (from pH 1-14). It should be noted that
pH effects are also one of the essential parameters in biological systems. For in vivo and in
vitro studies, a photostable NP that is compatible with living cells would be potentially
invaluable.66 Thus, to utilize the semiconductor NPs efficiently and reliably in biomedical
applications it is important to study the effect of pH on carbohydrate capped SiNPs emission
characteristics. Figure 4.17 shows photoluminescence spectra of equal aliquots taken from a
single preparation and dispersed in water, but using a series of different buffers to vary the
pH. The various pH solutions were made by using pH tablets (4, 7 and 9) and values were set
by adding stock solutions of 0.1M citric acid (19.2g/L) and 0.2M sodium citrate (28.4g/L).
The pH of solutions was tested using pH electrode.
Figure 4.17: pH effect of carbohydrate capped SiNPs by emission using an excitation
wavelength at 360 nm. (a) man capped SiNPs, (b) gal capped SiNPs, (c) glu capped SiNPs and (d)
lac capped SiNPs.
In Figure 4.17 it is observed that all carbohydrate capped SiNPs show intense
emission peak at pH-3. As the pH decreases the emission increases up to pH-3. Further
decreasing the pH decreases the emission of carbohydrate capped SiNPs. At higher pH (8-13)
400 450 500 550 600 6500
200
400
600
800
1000
pH 1
pH 2
pH 3
pH 4
pH 5
pH 6
pH 7
pH 8
pH 9
pH 10
pH 11
pH 12
pH 13
Inte
nsit
y (
a.u
)
Wavelength (nm)
400 450 500 550 600 6500
200
400
600
800
1000
pH1
pH-2
pH-3
pH-4
pH-5
pH-6
pH-7
pH-8
pH-9
pH-10
pH-11
pH-12
pH-13
Inte
nsit
y (
a.u
)
Wavelength (nm)
400 450 500 550 600 6500
200
400
600
800
1000
pH-1
pH-2
pH-3
pH-4
pH-5
pH-6
pH-7
pH-8
pH-9
pH-10
pH-11
pH-12
pH-13
Inte
nsit
y (
a.u
)
Wavelength (nm)
400 450 500 550 600 6500
200
400
600
800
1000
pH 1
pH 2
pH 3
pH 4
pH 5
pH 6
pH 7
pH 8
pH 9
pH 10
pH 11
pH 12
pH 13
Inte
nsit
y (
a.u
)
Wavelength (nm)
(a) (b)
(c) (d)

136
the emission decreases rapidly. As mentioned earlier, due to the bulky sugar molecules on
the surface, steric hindrance is present which leaves some of the surface uncapped which is
covered by amine functionality. As explained (see section 3.9.3) at low pH the amine group
is protonated, and electron transfer between the amine moieties and the Si core is
prohibited, yielding higher emission intensity. At higher pH protonation is either incomplete
or absent, which allows involvement of the nitrogen lone pair in relaxation processes and
yields a reduced emission. This phenomenon may perhaps be related to the presence of
amine functionality on the surface of SiNPs due to the poor surface capping of sugar
molecules which results in increasing and decreasing PL intensity by this pH effect
nevertheless it still remains unproven based on the current data.
4.8.5 Photoluminescence (PL) Stability
For Silicon nanoparticles, a limiting factor is the insufficiency of PL stability for
potential biological applications. To investigate the PL stability, time-dependent PL spectra
were measured on all carbohydrate capped SiNPs in water (Figure 4.18) and Man SiNPs in
dry state (Figure 4.19) by monitoring the PL emission using an excitation wavelength of
360nm
Figure 4.18: Ageing effect of carbohydrates capped SiNPs measured by PL using an excitation
wavelength 360nm. (a) man capped SiNPs, (b) glu capped SiNPs, (c) gal capped SiNPs and (d)
lac capped SiNPs in water.
400 450 500 550 600 6500
200
400
600
800
1000
1 day
5 day
6 day
7 day
8 day
11 day
12 day
17 day
19 day
21 day
34 day
50 day
Inte
nsit
y (
arb
.un
its)
Wavelength (nm)
400 450 500 550 600 6500
200
400
600
800
1000
1 day
5 day
7 day
9 day
11 day
13 day
17 day
19 day
21 day
34 day
42 day
50 day
Inte
nsit
y (
arb
.un
its)
Wavelength (nm)
400 450 500 550 600 6500
200
400
600
800
1000
1 day
5 day
7 day
9 day
11 day
13 day
17 day
21 day
25 day
34 day
42 day
50 dayInte
nsit
y (
arb
.un
its)
Wavelength (nm)
400 450 500 550 600 6500
200
400
600
800
1 day
5 day
7 day
9 day
11 day
13 day
17 day
25 day
42 day
50 day
Inte
nsit
y (
arb
.un
its)
Wavelength (nm)
(a) (b)
(c) (d)

137
It is observed that the sample remains stable for over a month if kept in the dark.8
Figure 4.18, shows the PL decay of Man (a), glu (b), gal (c) and lac (d) capped SiNPs are
moderately stable over a month. This gradual decreasing intensity indicates that the surface
of SiNP undergo slow oxidation. Although the surface of SiNPs is highly capped with
carbohydrate molecules but due to the bulky molecule on the surface steric hindrance is
present, which leaves some areas uncapped. This allows some oxidation in water.
Carbohydrate capped SiNPs show blue-green luminescence in water and orange
luminescence in the dry state. Figure 4.19 shows the stability of man capped SiNPs in dry
state.
Figure 4.19: Ageing effect of Man capped SiNPs in the dry state measured by PL using an
excitation wavelength 360 nm.
The sample was mounted on a glass cover slip and dried; this process was repeated
several times until a thick film was formed. The sample was carefully dried under vacuum
and fixed into the sample holder. The emission was monitored using an excitation
wavelength of 360 nm. Figure 4.19 shows that the sample is moderately stable and with no
sign of oxidation.
4.9 Biochemical Activity
As proof of principle the biochemical activity of carbohydrate capped SiNPs was
tested with Con A. Assuming the SiNPs surface is functionalized by carbohydrate moieties,
then the protein (Con A) would be expected to bind to the NPs and form an aggregate, which
400 500 600 700 800 900
day 1
day 5
day 9
day 26
Inte
ns
ity
(a
rb.u
nit
s)
Wavelength (nm)

138
would lead to loss of photoluminescence as well as formation of a precipitate after a certain
time.
Figure 4.20: Graphical representation of agglutination of carbohydrate capped SiNPs by Con A
tetramer in water.
Biochemical activity of man and gal capped SiNPs was tested using Con A (figure
4.20). Con A is a lectin, which has strong binding specificity toward mannose and weak
binding affinity towards galactose. One ConA contain four mannose binding sites which can
cross link to multiple mannose functionalized SiNPs, leading to the aggregation of the
nanoparticles which results in the reduction of emission at 464 nm (Figure 4.21a,b). This
aggregation can also be seen in TEM images (Figure 4.21c).
Concanavalin A
Visible aggregations of Mannose capped SiNPs with ConA
Water
30 min
Mannose capped SiNP

139
Figure 4.21 (a) Aggregations of man capped SiNPs and (b) gal capped SiNPs with Con A as
monitored by PL spectroscopy. (c) TEM image of man capped SiNPs after addition of Con A.
Upon the addition of ConA to man (4.21a) and gal (4.21b) capped SiNPs, visible
aggregates of particles were observed within a minute. This aggregation is associated with a
significant reduction in the intensity of the luminescence peak at 464 nm (Figure 4.21a,b).
The suspended aggregates gradually precipitated out of solution. After approximately 4 hrs
all of the nanoparticle systems had completely precipitated, as shown by the gradual
decreasing PL intensity with increasing time in Figure 4.21a,b. The man and gal capped
SiNPs were also examined by TEM before and after ConA addition. Before ConA addition, the
NPs were highly dispersed, (figure 4.1a), whereas large aggregates were formed after ConA
addition (Figure 4.21c).
400 450 500 550 600 650
Initial
1 min
2 min
4 min
6 min
8 min
10 min
16 min
20 min
23 min
26 min
29 min
34 min
38 min
Inte
ns
ity
(a
rb.u
nit
s)
Wavelength (nm)
400 450 500 550 600 650
Initial
4 min
5 min
7 min
9 min
20 min
31 min
35 min
37 min
Inte
ns
ity
(a
rb.u
nit
s)
Wavelength (nm)
(b)
100 nm
(c)
(a)

140
Figure 4.22: PL of amine terminated SiNPs upon addition of ConA with time
Amine terminated SiNPs was used as a control. In Figure 4.22, it is clearly seen that
upon addition of ConA amine terminated SiNPs do not form any aggregation over time and
therefore no loss in PL emission at 453 nm was observed.
4.10 Targeting Cancerous Cells
After functionalizing, characterizing and obeying the biochemical activity or
interaction with Con A protein, it was time to test the effect of this multi functionalized
carbohydrate capped SiNPs on the cells. Here as a proof of principle, only the influence of
man capped SiNPs in MCF-7 cells was tested. Other carbohydrate capped SiNPs (gal, glu and
lac) were tested on the cells including stability, toxicity etc. and this is briefly explained in
chapter 5.
It is well known that mannose has a strong binding affinity towards lactin,67 which is
present on the surface of cells and is also well characterized with Escherichia coli system.68,
69 After successfully detecting lactin, we evaluated the effectiveness of Man-capped SiNPs in
mammalian cell interaction and cancer cell detection. Antibodies can be used to detect
particular antigens. However, some mutant cancer cells lack these markers. Also, antibodies
can only bind to specific cell surface biomolecules. In contrast, carbohydrates can interact
with a multitude of cells and impart information regarding carbohydrate receptors,
therefore limiting the number of possible reagents.70 MCF-7, a human breast cancer cell line
400 450 500 550 600 650 7000
100
200
300
400
500
600
700
Initial
1min
2 min
5 min
8 min
11 min
14 min
20 min
26 min
30 min
35 min
41 minInte
ns
ity
(a
rb.u
nit
s)
Wavelength (nm)

141
was chosen as the targeting cells by Man-capped SiNPs. In a non-cancerous cell line,
galactoside binding galactines-4, -7, and -8 are absent. However, these galactines are present
in the MCF-7 cancer cells.71 This imaging experiment and cell culture was kindly performed
by Dr Anja Muller from UEA (PHA). The MCF-7 cell line for this experiment was kindly
supplied by Dr Yongping Bao from UEA (MED).
Fluorescence microscope images are shown in Figure 4.23. The control image of
MCF-7 cells without incubation of SiNPs is shown in Figure 4.23a, bright fluorescence arises
from the emission of man capped SiNPs shown in figure 4.23b.
Figure 4.23: Fluorescence images inside living MCF-7 cancerous cells: (a) control; (b)
fluorescence from Man-capped SiNPs inside the cells after 48 h incubation; (c) after 48 h
Lysotracker stain; (d) merged images. Pictures were taken on live cells using a Leica
fluorescence microscope.
In order to visualize the lysosomes, cells were stained with Lysotracker-Red, (see
Figure 4.23c). The merged results are also shown in Figure 4.23d. The selective uptake and
intracellular accumulation of man-capped SiNPs in MCF-7 cells is clearly observed and thus
can lead to the further development of Man-capped SiNPs as a vehicle for targeted drug
delivery.72 Importantly, morphological damage to aqueous Man-capped SiNPs treated cells
cannot be observed.
The strongly binding man-capped SiNPs are found to be internalized by the breast
cancer cells. Although only one tumor cell line was used in this study, there is a possibility
(b)
(c) (d)
(a)

142
that man-capped SiNPs may bind to other cancerous cell lines if there are similar receptors
located on the surface of these cells. The research is still in progress using different types of
tumor cells and testing them with man-capped SiNPs.
4.11 Crystallization of Carbohydrate capped SiNPs
Recently, there has been growing interest in assembling inorganic nanoparticles to
exploit their collective properties and the possibility of using these properties in functional
devices. Ensembles of nanoparticles can be used to improve the mechanical properties of
composite materials; moreover they can display new electronic, magnetic and optical
properties as a result of interactions between the excitons, magnetic moments or surface
plasmons of individual nanoparticles.
Assembly is directed by the balance of attractive forces (such as covalent or
hydrogen bonding, electrostatic attraction between oppositely charged ligands, depletion
forces or dipole-dipole interactions) and repulsive forces (such as steric forces and
electrostatic repulsion between ligands of like charge).73 Self-organization of nanoparticles
generates a variety of structures, including chains,74-77 sheets,78, 79 vesicles,76, 80, 81 three-
dimensional (3D) crystals82-85 or more complex 3D architectures.86
Recently, the formation of 3D nanoparticle crystals with face-centered or body-
centered cubic lattice structures was mediated by hybridizing complementary DNA
molecules attached to the nanoparticle surface.82, 83 The variation in DNA sequences or
length of DNA linkers, and the absence or presence of a non-bonding single-base flexor, was
used to tune interactions between the nanoparticle-DNA conjugates.
In a different strategy, crystals with a diamond-like structure were grown from
oppositely charged gold and silver nanoparticles.85 Crystallization of nanoparticles was
achieved by screening electrostatic interactions; so that each nanoparticle was surrounded
by a layer of counter-ions and the nanoparticles interacted by short-range potentials.
Here, we report the crystals or self-assembly of SiNPs into three-dimensional
superlattice structures, using carbohydrate moieties which act as interparticle linkages. The
formation of needle like crystal structures was observed in a nanoparticle based system. The
characterization of these carbohydrate driven SiNPs crystals was carried out by using
synchrotron FTIR, Scanning electron microscopy (SEM), EDX analysis and HRTEM images.
Synchrotron FTIR microscopy as the main characterization technique was used to study the
carbohydrate capped SiNPs crystals, due to the several advantages mentioned below.

143
4.11.1 SEM images of Carbohydrate capped SiNPs Crystals
After preparing the sample, SEM was used to visualize the shape and size of the
crystals. Figure 4.24 shows the SEM images of glu capped SiNPs taken on to the carbon
coated sample holder. The crystals were dropped onto the sample holder and coated with
Gold (Au) as a reference for 5 minutes.
Figure 4.24: SEM images of (a) glucose, (b) galactose, (c) lactose and (d) mannose capped SiNPs
crystals
The SEM images of glu, gal, lac and man capped SiNPs shown in figure 4.24, confirm
the needle and sheet like crystal structure grown in methanol. The images also show the
root of the crystals. The SEM obtained images showed that the gal, glu and man capped
SiNPs crystals present a needle like structure whereas the lactose capped SiNPs crystals
present a flat sheet or flat needle like structure.
4.11.2 HRTEM images of Carbohydrate capped SiNPs Crystals
The next point was to confirm whether the SiNPs act as a seed to self-assemble the
crystal or act as an impurity. In order to confirm and understand the arrangement of SiNPs
inside the crystals HRTEM imaging was further performed.
(a) (b)
(c) (d)

144
The HRTEM of carbohydrate capped SiNPs were acquired at Leeds University (Leeds,
UK) in collaboration with Prof. Rik Brydson and group. Figure 4.22 shows the HRTEM image
of glucose capped SiNPs crystals. The sample was placed on the grid and a drop of methanol
was added to disperse the crystal.
Figure 4.25: HRTEM image of glucose capped SINPs crystal.
In figure 4.25 the needle shaped glu capped SiNPs crystal shows the skeleton of the
SiNPs arranged inside the crystal. These results are promising, however further study needs
to be undertaken to find out the special arrangement of SiNPs inside the crystal. The HRTEM
image found to be unsuccessful to provide this information. Hypothetically, if the SiNPs
inside the crystal are arranged in 3D form then it is difficult to confirm the assemblies of
SiNPs inside the crystal.
4.11.3 Elemental Analysis of Carbohydrate SiNPs Crystals
4.11.3.1 EDX Measurements
In order to confirm that the crystals are of the carbohydrate capped SiNPs and are
not of the carbohydrates themselves, we performed EDX analysis. Figure 4.26 shows the
EDX analysis of carbohydrate capped SiNPs crystals.
1 µm

145
Figure 4.26: EDX analysis (left) and SEM images (right) of carbohydrate capped SiNP crystals.
(a) glu capped SiNP, (b) lac capped SiNPs, (c) man capped SiNPs and (d) gal capped SiNPs.
In figure 4.26 the EDX graph (left) shows the silicon peak in reference to Au. The EDX
analysis for all carbohydrate capped SiNPs crystals confirms that the crystals are not only
from the starting material sugar but from the carbohydrate capped SiNPs.
4.11.3.2 Synchrotron FTIR Measurements
To confirm the bonding environment of these crystals, synchrotron FTIR microscopy
measurement was carried out. The principle of FT-IR spectroscopy is to promote the
excitation of molecular vibrations by submitting a sample to an infrared beam. The
vibrational energy usually expressed as wave numbers is sensitive to the molecular
composition of the atoms involved in the bond, nature of the bond, surrounding atoms,
structure of the bond, etc. The technique is extensively used to characterize both organic and
(a)
(b)
(c)
(d)

146
inorganic samples. The principle of FTIR microscopy is to couple an FTIR spectrometer with
a microscope. It enables on one hand to visualize the sample and to choose specifically the
region for analysis and on the other hand to carry out two-dimensional acquisitions by
raster scanning the sample. Infrared spectra are acquired at each pixel of 1D, 2D or 3D maps,
and chemical maps can thus be derived. The principle of synchrotron FTIR microscopy is to
use the synchrotron emission in the infrared domain as a source for FTIR microscopy.
Compared to classical and normal FTIR sources, the synchrotron radiation brightness is far
greater and enables the beam size to be reduced below 10 µm without a significant loss of
photons. The usefulness of synchrotron (SR) FTIR micro spectroscopy derives from the fact
that the IR source is 10-1000 times more intense than the conventional laboratory source.87
This equates to superior signal to noise ratios88 in the resultant spectra, improving
acquisition times and spatial resolution, both of which are important for analyzing the
samples. Hence, by looking at all advantages of SR-FTIR spectroscopy, it’s been chosen to
study the carbohydrate capped SiNPs as it is a powerful characterizing technique for the
location of chemical structure and physical heterogeneities in materials, as well as
determinations of their association with localized inclusions.
The SR-FTIR experiments were carried out at Max-lab, Lund, Sweden. The crystals of
carbohydrate capped SiNPs were grown in methanol at room-temperature (see chapter 2).
The non-crystalline samples of carbohydrate capped SiNPs were freshly prepared and dried
under reduced pressure. FTIR spectra of the corresponding acid sugar were also taken to
compare with those of the functionalized carbohydrate SiNPs.
To characterize the bonding environment within the crystals, we performed the SR-
FTIR measurements on acid functionalized sugar (starting material), non-crystalline sample
(carbohydrate capped SINPs without forming crystals) and the crystals of carbohydrate
capped SiNPs.
Figure 4.27 and 4.29 show the 2D and 3D images of SR-FTIR on the gal and man
capped SiNP crystals respectively. Figure 4.28 and 4.30 shows the FTIR spectrum of gal and
man capped SiNPs crystals. The sample was dried at room temperature and dropped on
CaF2 substrate.

147
Figure 4.27: Mapping spectrum over an area of galactose capped SiNPs showing 2D and 3D
spectrum. Red represents high intensity and blue represents low intensity along with video
mapping image area. The 3D mapping area was selected from the amide bonding region from
1765 cm-1 to 1580 cm-1.
Figure 4.28: FTIR spectrum of gal capped SiNPs crystals and starting material acid galactose
Figure 4.29 show the 2D and 3D FTIR images of man capped SiNPs crystals.
Inte
nsit
y (
arb
.un
its)
500 1000 1500 2000 2500 3000 3500 4000
Wavelength (cm-1
)
Acid galactose
Gal capped
SiNPs crystal

148
Figure 4.29: Mapping spectrum over an area of mannose capped SiNPs showing 2D and 3D
spectrum. Red represents high intensity and blue represents low intensity along with video
mapping image area. The 3D mapping area was selected from the amide bonding region from
1685 cm-1 - 1593 cm-1.
Figure 4.30: FTIR spectrum of man capped SiNPs crystals and starting material acid mannose
As mention above, the important characteristic of SR-FTIR microscopy is that it
allows to map an interesting area of the sample and to perform the FTIR analysis on it. In
1000 1500 2000 2500 3000 3500 4000
Inte
nsit
y (
arb
.un
its)
Wavelength (cm-1
)
Acid mannose
Man capped
SiNPs crystal

149
Figure 4.27 and 4.29 the crystals of gal and man capped SiNPs are clearly shown, the area of
the crystals was mapped and analysis was performed. In order to confirm that the crystals
are from the carbohydrate capped SiNPs and not from the starting material, the amide
bonding region which appears from 1620 cm-1 to 1690 cm-1 region was integrated. After
integrating the amide bonding region of 2D and 3D FTIR, it is clearly noticeable from higher
intensity that the crystals are from the carbohydrate capped SiNPs.
Figure 4.28 and 4.30 show a typical FTIR spectrum of gal and man capped SiNPs
crystals. The spectrum shows the feature around 3349 cm-1 characteristic of O-H bonding,
2929 cm-1 C-H bonding, 1651 cm-1 amide stretching, N-H stretching and C-N bending around
1560 cm-1, Si-CH2 symmetric bending and vibrational scissoring is at 1277 cm-1 and 1447
cm-1 respectively and feature at 1080 cm-1 is from C-OH, C-O, Si-O bonding. The amide bond
at around 1634-1655 cm-1 is clearly visible in both FTIR spectra. The overall SR-FTIR
spectrum confirms that the crystals are from the carbohydrate capped SiNPs and not from
the carbohydrate itself.
Furthermore to confirm the bonding analysis, the 2D and 3D FTIR spectra on non-
crystalline samples of carbohydrate capped SiNPs were acquired. The FTIR spectra on two
different types of samples were performed. Firstly, the sample was dispersed in methanol
and drop cast on the CaF2 substrate. After drying, a thin layer of sample was formed on the
substrate. A second sample was dried under vacuum and the powder was dropped on the
CaF2 substrate. The third sample was measured in combination of both thin layer as well as
the dried sample.
4.11.3.2.1 Mannose capped SiNPs
The man capped SiNPs sample was dispersed in methanol (MeOH) and drop cast on
Calcium fluoride (CaF2) substrate. The substrate was placed at room temperature until the
sample had dried out completely and later was introduced on the spectrometer. The area of
interest was chosen and the region was mapped. Figure 4.28 represents 3D and 2D SR-FTIR
spectra of man capped SiNPs, along with the image of the mapped area.
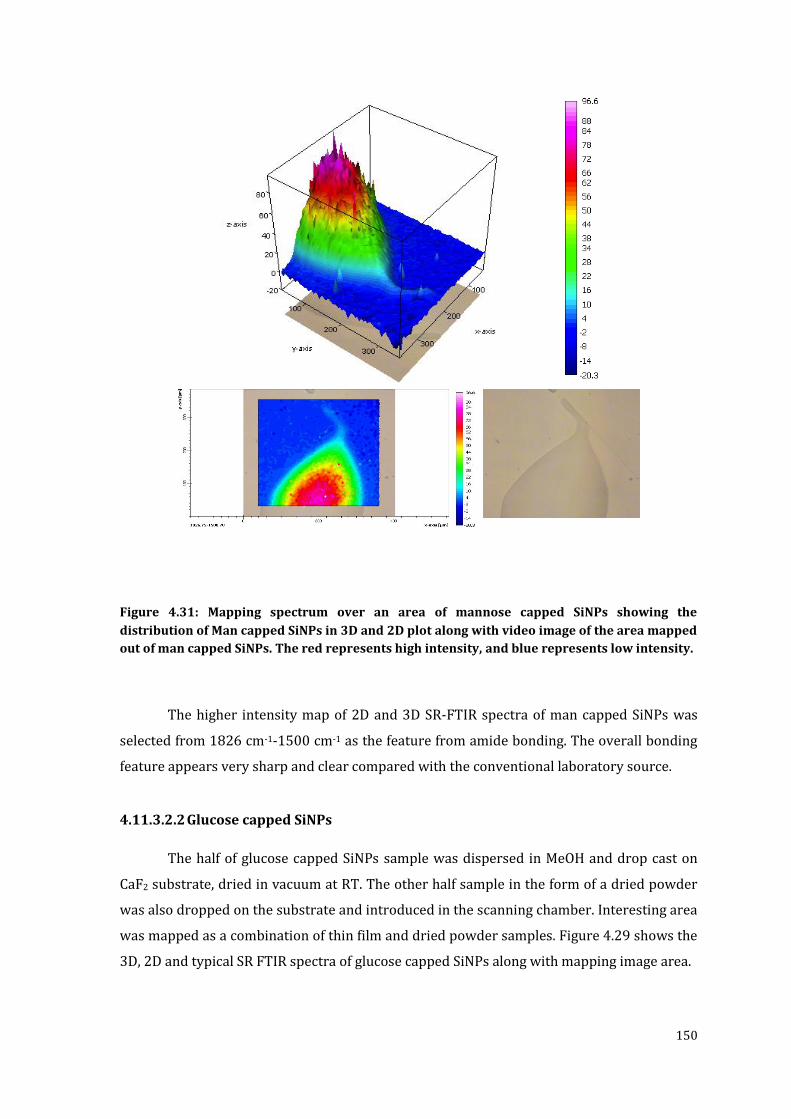
150
Figure 4.31: Mapping spectrum over an area of mannose capped SiNPs showing the
distribution of Man capped SiNPs in 3D and 2D plot along with video image of the area mapped
out of man capped SiNPs. The red represents high intensity, and blue represents low intensity.
The higher intensity map of 2D and 3D SR-FTIR spectra of man capped SiNPs was
selected from 1826 cm-1-1500 cm-1 as the feature from amide bonding. The overall bonding
feature appears very sharp and clear compared with the conventional laboratory source.
4.11.3.2.2 Glucose capped SiNPs
The half of glucose capped SiNPs sample was dispersed in MeOH and drop cast on
CaF2 substrate, dried in vacuum at RT. The other half sample in the form of a dried powder
was also dropped on the substrate and introduced in the scanning chamber. Interesting area
was mapped as a combination of thin film and dried powder samples. Figure 4.29 shows the
3D, 2D and typical SR FTIR spectra of glucose capped SiNPs along with mapping image area.

151
Figure 4.32: Mapping spectrum over an area of glucose capped SiNPs showing 3D and 2D
mapping. Red represents high intensity and blue represents low intensity along with video
mapping image area.
The amide bonding area for glu capped SiNPs was integrated from 1759-1509 cm-1.
4.11.3.2.3 Lactose capped SiNPs
The dried powder of lactose capped SiNPs was dropped on CaF2 substrate and the
interesting area was mapped. Figure 4.33 shows the 3D and 2D images of lactose capped
SiNPs. The amide bonding region was integrated from 1771-1490 cm-1.

152
Figure 4.33: Mapping spectrum over an area of lactose capped SiNPs showing the distribution
of lac capped SiNPs in 3D and 2D plot along with video image of the area mapped. The red
represents high intensity, and blue represents low intensity.
All the obtained results for the crystal sample and non-crystalline sample showed no
difference when the amide bonding region was integrated. This confirms that the crystals
are from carbohydrate capped SiNPs and not from the carbohydrate alone.
The carbohydrate capped SiNPs crystals were accidentally noticed to be growing in
methanol. Initially it was assumed that the crystals were forming due to the hydrogen
bonding present in carbohydrate moiety, to confirm this phenomenon the crystals were
grown with acetate (OAc) protected carbohydrate capped SiNPs (OAc-carbohydrate capped
SiNPs) and it was noticed that the crystals grow even faster and much better than that of

153
unprotected carbohydrate capped SiNPs. This result indicates that the crystals are not
completely driven by carbohydrate moiety, in which SiNPs act as an impurity, whereas the
crystals are actually driven by overall carbohydrate capped SiNPs.
4.12 Conclusion
In conclusion, a simple method has been demonstrated to synthesize highly pure
stable and brightly luminescent carbohydrate capped SiNPs through the utilization of
amine-terminated SiNPs and by using carbodiimide-coupling reagent. The SiNPs capped
with carbohydrate functionality show strong blue photoluminescence under UV excitation in
water and strong orange photoluminescence in the solid state, with a high QY efficiency.
These surface functionalized nanoparticles are stable against degradation over several
weeks. The FTIR and NMR spectra obtained display the surface functionalization, confirming
that the surface is effectively modified with carbohydrate moiety such as galactose, mannose,
glucose and lactose. The EDX confirmed the makeup of the core shell of SiNPs as well as the
overall chemical composition. The biochemical activity of highly pure gal and man capped
SiNPs were tested with ConA. As an example, the SiNPs targeting MCF-7 has been
investigated under the fluorescence microscope. The present work not only has implications
in the area of surface functionalization of SiNPs but also has a broad potential to allow for
study of various further applications, with considerable interest in both medicine and
biology.

154
4.13 References
1. Huang, X.; Neretina, S.; El-Sayed, M. A., Gold Nanorods: From Synthesis and Properties to Biological and Biomedical Applications. Advanced Materials 2009, 21 (48), 4880-4910.
2. Peer, D.; Karp, J. M.; Hong, S.; Farokhzad, O. C.; Margalit, R.; Langer, R., Nanocarriers as an emerging platform for cancer therapy. Nat Nano 2007, 2 (12), 751-760.
3. Ferrari, M., Cancer nanotechnology: opportunities and challenges. Nat Rev Cancer 2005, 5 (3), 161-171.
4. Pankhurst, Q. A.; Connolly, J.; Jones, S. K.; Dobson, J., Applications of magnetic nanoparticles in biomedicine. Journal of Physics D: Applied Physics 2003, 36 (13), R167.
5. Gabius, H.-J.; Siebert, H.-C.; André, S.; Jiménez-Barbero, J.; Rüdiger, H., Chemical Biology of the Sugar Code. ChemBioChem 2004, 5 (6), 740-764.
6. Hakomori, S., Glycosylation defining cancer malignancy: new wine in an old bottle. Proceedings of the National Academy of Sciences of the United States of America 2002, 99 (16), 10231-10233.
7. Dwek, R. A., Glycobiology:Toward Understanding the Function of Sugars. Chemical Reviews 1996, 96 (2), 683-720.
8. Babu, P.; Sinha, S.; Surolia, A., Sugar−Quantum Dot Conjugates for a Selective and Sensitive Detection of Lectins. Bioconjugate Chemistry 2006, 18 (1), 146-151.
9. Dam, T. K.; Brewer, C. F., Thermodynamic Studies of Lectin−Carbohydrate Interactions by Isothermal Titration Calorimetry. Chemical Reviews 2002, 102 (2), 387-430.
10. Ratner, D. M.; Adams, E. W.; Disney, M. D.; Seeberger, P. H., Tools for Glycomics: Mapping Interactions of Carbohydrates in Biological Systems. ChemBioChem 2004, 5 (10), 1375-1383.
11. Oh, E.; Lee, D.; Kim, Y.-P.; Cha, S. Y.; Oh, D.-B.; Kang, H. A.; Kim, J.; Kim, H.-S., Nanoparticle-Based Energy Transfer for Rapid and Simple Detection of Protein Glycosylation. Angewandte Chemie International Edition 2006, 45 (47), 7959-7963.
12. Lis, H.; Sharon, N., Lectins: Carbohydrate-Specific Proteins That Mediate Cellular Recognition. Chemical Reviews 1998, 98 (2), 637-674.
13. Lindhorst, T. K., Essentials of carbohydrate chemistry and biochemistry. Wiley-VCH: Weinheim, 2003.
14. Lee, Y. C.; Lee, R. T., Carbohydrate-Protein Interactions: Basis of Glycobiology. Accounts of Chemical Research 1995, 28 (8), 321-327.
15. Mammen, M.; Choi, S.-K.; Whitesides, G. M., Polyvalent Interactions in Biological Systems: Implications for Design and Use of Multivalent Ligands and Inhibitors. Angewandte Chemie International Edition 1998, 37 (20), 2754-2794.
16. Lundquist, J. J.; Toone, E. J., The Cluster Glycoside Effect. Chemical Reviews 2002, 102 (2), 555-578.
17. Iqbal, S. S.; Mayo, M. W.; Bruno, J. G.; Bronk, B. V.; Batt, C. A.; Chambers, J. P., A review of molecular recognition technologies for detection of biological threat agents. Biosensors and Bioelectronics 2000, 15 (11–12), 549-578.

155
18. Huang, X.; Wang, Z., 1.10 - Strategies in Oligosaccharide Synthesis. In Comprehensive Glycoscience, Kamerling, H., Ed. Elsevier: Oxford, 2007; pp 379-413.
19. Gupta, A. K.; Gupta, M., Synthesis and surface engineering of iron oxide nanoparticles for biomedical applications. Biomaterials 2005, 26 (18), 3995-4021.
20. Koh, I.; Wang, X.; Varughese, B.; Isaacs, L.; Ehrman, S. H.; English, D. S., Magnetic Iron Oxide Nanoparticles for Biorecognition: Evaluation of Surface Coverage and Activity. The Journal of Physical Chemistry B 2006, 110 (4), 1553-1558.
21. Lin, C.-C.; Yeh, Y.-C.; Yang, C.-Y.; Chen, C.-L.; Chen, G.-F.; Chen, C.-C.; Wu, Y.-C., Selective Binding of Mannose-Encapsulated Gold Nanoparticles to Type 1 Pili in Escherichia coli. Journal of the American Chemical Society 2002, 124 (14), 3508-3509.
22. Macher, B. A.; Galili, U., The Galα1,3Galβ1,4GlcNAc-R (α-Gal) epitope: A carbohydrate of unique evolution and clinical relevance. Biochimica et Biophysica Acta (BBA) - General Subjects 2008, 1780 (2), 75-88.
23. Horak, D.; Babic, M.; Jendelova, P.; Herynek, V.; Trchova, M.; Pientka, Z.; Pollert, E.; Hajek, M.; Sykova, E., d-Mannose-Modified Iron Oxide Nanoparticles for Stem Cell Labeling. Bioconjugate Chemistry 2007, 18 (3), 635-644.
24. Martínez-Ávila, O.; Hijazi, K.; Marradi, M.; Clavel, C.; Campion, C.; Kelly, C.; Penadés, S., Gold Manno-Glyconanoparticles: Multivalent Systems to Block HIV-1 gp120 Binding to the Lectin DC-SIGN. Chemistry - A European Journal 2009, 15 (38), 9874-9888.
25. Rojo, J.; Díaz, V.; de la Fuente, J. M.; Segura, I.; Barrientos, A. G.; Riese, H. H.; Bernad, A.; Penadés, S., Gold Glyconanoparticles as New Tools in Antiadhesive Therapy. ChemBioChem 2004, 5 (3), 291-297.
26. O'Farrell, N.; Houlton, A.; Horrocks, B. R., Silicon nanoparticles: applications in cell biology and medicine. International Journal of Nanomedicine 2006, 1 (4), 451-472.
27. Wang, Q.; Ni, H.; Pietzsch, A.; Hennies, F.; Bao, Y.; Chao, Y., Synthesis of water-dispersible photoluminescent silicon nanoparticles and their use in biological fluorescent imaging. Journal of Nanoparticle Research 2011, 13 (1), 405-413.
28. Sato, S.; Swihart, M. T., Propionic-Acid-Terminated Silicon Nanoparticles: Synthesis and Optical Characterization. Chemistry of Materials 2006, 18 (17), 4083-4088.
29. Belomoin, G.; Therrien, J.; Smith, A.; Rao, S.; Twesten, R.; Chaieb, S.; Nayfeh, M. H.; Wagner, L.; Mitas, L., Observation of a magic discrete family of ultrabright Si nanoparticles. Applied Physics Letters 2002, 80 (5), 841-843.
30. English, D. S.; Pell, L. E.; Yu, Z.; Barbara, P. F.; Korgel, B. A., Size Tunable Visible Luminescence from Individual Organic Monolayer Stabilized Silicon Nanocrystal Quantum Dots. Nano Letters 2002, 2 (7), 681-685.
31. Rogozhina, E. V.; Eckhoff, D. A.; Gratton, E.; Braun, P. V., Carboxyl functionalization of ultrasmall luminescent silicon nanoparticles through thermal hydrosilylation. Journal of Materials Chemistry 2006, 16 (15), 1421-1430.
32. Schuppler, S.; Friedman, S. L.; Marcus, M. A.; Adler, D. L.; Xie, Y. H.; Ross, F. M.; Chabal, Y. J.; Harris, T. D.; Brus, L. E.; Brown, W. L.; Chaban, E. E.; Szajowski, P. F.; Christman, S. B.; Citrin, P. H., Size, shape, and composition of luminescent species in oxidized Si nanocrystals and H-passivated porous Si. Physical Review B 1995, 52 (7), 4910.

156
33. Rogozhina, E.; Belomoin, G.; Smith, A.; Abuhassan, L.; Barry, N.; Akcakir, O.; Braun, P. V.; Nayfeh, M. H., Si--N linkage in ultrabright, ultrasmall Si nanoparticles. Applied Physics Letters 2001, 78 (23), 3711-3713.
34. Warner, J. H.; Hoshino, A.; Yamamoto, K.; Tilley, R. D., Water-soluble photoluminescent silicon quantum dots. Angewandte Chemie-International Edition 2005, 44 (29), 4550-4554.
35. Rosso-Vasic, M.; Spruijt, E.; van Lagen, B.; De Cola, L.; Zuilhof, H., Alkyl-Functionalized Oxide-Free Silicon Nanoparticles: Synthesis and Optical Properties. Small 2008, 4 (10), 1835-1841.
36. Mayne, A. H.; Bayliss, S. C.; Barr, P.; Tobin, M.; Buckberry, L. D., Biologically Interfaced Porous Silicon Devices. physica status solidi (a) 2000, 182 (1), 505-513.
37. Erogbogbo, F.; Yong, K.-T.; Roy, I.; Xu, G.; Prasad, P. N.; Swihart, M. T., Biocompatible Luminescent Silicon Quantum Dots for Imaging of Cancer Cells. ACS Nano 2008, 2 (5), 873-878.
38. Nilsson, J. R., How Cytotoxic is Zinc? A Study on Effects of Zinc on Cell Proliferation, Endocytosis, and Fine Structure of the Ciliate Tetrahymena. Acta Protozool 2003, 42, 19-29.
39. Kirchner, C.; Liedl, T.; Kudera, S.; Pellegrino, T.; Muñoz Javier, A.; Gaub, H. E.; Stölzle, S.; Fertig, N.; Parak, W. J., Cytotoxicity of Colloidal CdSe and CdSe/ZnS Nanoparticles. Nano Letters 2004, 5 (2), 331-338.
40. Wang, Q.; Bao, Y.; Ahire, J.; Chao, Y., Co-encapsulation of Biodegradable Nanoparticles with Silicon Quantum Dots and Quercetin for Monitored Delivery. Advanced Healthcare Materials 2013, 2, 459-465.
41. Miller, D. A. B., Silicon sees the light. Nature 1995, 378, 238.
42. Alsharif, N. H.; Berger, C. E. M.; Varanasi, S. S.; Chao, Y.; Horrocks, B. R.; Datta, H. K., Alkyl-Capped Silicon Nanocrystals Lack Cytotoxicity and have Enhanced Intracellular Accumulation in Malignant Cells via Cholesterol-Dependent Endocytosis. Small 2009, 5 (2), 221-228.
43. Arya, H.; Kaul, Z.; Wadhwa, R.; Taira, K.; Hirano, T.; Kaul, S. C., Quantum dots in bio-imaging: Revolution by the small. Biochemical and Biophysical Research Communications 2005, 329 (4), 1173-1177.
44. Kramer, J. R.; Deming, T. J., Glycopolypeptides via Living Polymerization of Glycosylated-l-lysine N-Carboxyanhydrides. Journal of the American Chemical Society 2010, 132 (42), 15068-15071.
45. Taylor, C. M., Glycopeptides and glycoproteins: Focus on the glycosidic linkage. Tetrahedron 1998, 54 (38), 11317-11362.
46. Nakajima, N.; Ikada, Y., Mechanism of Amide Formation by Carbodiimide for Bioconjugation in Aqueous Media. Bioconjugate Chemistry 1995, 6 (1), 123-130.
47. Wang, Q.; Bao, Y.; Zhang, X.; Coxon, P. R.; Jayasooriya, U. A.; Chao, Y., Uptake and Toxicity Studies of Poly-Acrylic Acid Functionalized Silicon Nanoparticles in Cultured Mammalian Cells. Advanced Healthcare Materials 2012, 1, 189-198.
48. Kumar, C. G.; Mamidyala, S. K.; Reddy, M. N.; Reddy, B. V. S., Silver glyconanoparticles functionalized with sugars of sweet sorghum syrup as an antimicrobial agent. Process Biochem. 2012, 47 (10), 1488-1495.

157
49. Earhart, C.; Jana, N. R.; Erathodiyil, N.; Ying, J. Y., Synthesis of Carbohydrate-Conjugated Nanoparticles and Quantum Dots. Langmuir 2008, 24 (12), 6215-6219.
50. Chao, Y.; Wang, Q.; Pietzsch, A.; Hennies, F.; Ni, H., Soft X-ray induced oxidation on acrylic acid grafted luminescent silicon quantum dots in ultrahigh vacuum. Physica Status Solidi a-Applications and Materials Science 2011, 208 (10), 2424-2429.
51. Wagner, C.; Riggs, W.; Davis, L.; Moulder, J., Handbook of X-ray photoelectron spectroscopy. In Handbook of X-ray photoelectron spectroscopy, Muilenberg, G. E., Ed. Perkin Elmer Corporation: Eden Prairie, Minnesota, 1997.
52. X-ray data booklet. Lawrence Berkeley National Lab: Berkeley, 2001.
53. Dementjev, A. P.; de Graaf, A.; van de Sanden, M. C. M.; Maslakov, K. I.; Naumkin, A. V.; Serov, A. A., X-Ray photoelectron spectroscopy reference data for identification of the C3N4 phase in carbon-nitrogen films. Diamond and Related Materials 2000, 9 (11), 1904-1907.
54. Jagst, E. Surface Functional Group Characterization Using Chemical Derivatization X-ray Photoelectron Spectroscopy (CD-XPS). Free University of Berlin, Berlin, 2010.
55. Kerber, S. J.; Bruckner, J. J.; Wozniak, K.; Seal, S.; Hardcastle, S.; Barr, T. L., The nature of hydrogen in x-ray photoelectron spectroscopy: General patterns from hydroxides to hydrogen bonding. Journal of Vacuum Science & Technology A: Vacuum, Surfaces, and Films 1996, 14 (3), 1314-1320.
56. Dasog, M.; Yang, Z.; Regli, S.; Atkins, T. M.; Faramus, A.; Singh, M. P.; Muthuswamy, E.; Kauzlarich, S. M.; Tilley, R. D.; Veinot, J. G. C., Chemical Insight into the Origin of Red and Blue Photoluminescence Arising from Freestanding Silicon Nanocrystals. ACS Nano 2013, 7 (3), 2676-2685.
57. Chao, Y.; Krishnamurthy, S.; Montalti, M.; Lie, L. H.; Houlton, A.; Horrocks, B. R.; Kjeldgaard, L.; Dhanak, V. R.; Hunt, M. R. C.; Šiller, L., Reactions and luminescence in passivated Si nanocrystallites induced by vacuum ultraviolet and soft-x-ray photons. Journal of Applied Physics 2005, 98 (4), -.
58. Li, X.; He, Y.; Talukdar, S. S.; Swihart, M. T., Process for Preparing Macroscopic Quantities of Brightly Photoluminescent Silicon Nanoparticles with Emission Spanning the Visible Spectrum. Langmuir 2003, 19 (20), 8490-8496.
59. Xiong, H. M.; Wang, Z. D.; Xia, Y. Y., Polymerization Initiated by Inherent Free Radicals on Nanoparticle Surfaces: A Simple Method of Obtaining Ultrastable (ZnO)Polymer Core–Shell Nanoparticles with Strong Blue Fluorescence. Advanced Materials 2006, 18 (6), 748-751.
60. Ahire, J. H.; Wang, Q.; Coxon, P. R.; Malhotra, G.; Brydson, R.; Chen, R.; Chao, Y., Highly Luminescent and Nontoxic Amine-Capped Nanoparticles from Porous Silicon: Synthesis and Their Use in Biomedical Imaging. ACS Applied Materials & Interfaces 2012, 4 (6), 3285-3292.
61. Wasielewski, M. R., Photoinduced electron transfer in supramolecular systems for artificial photosynthesis. Chemical Reviews 1992, 92 (3), 435-461.
62. Morawetz, H., Fluorescence studies of polymer dynamics. Journal of Luminescence 1989, 43 (2), 59-71.
63. Shizuka, H.; Nakamura, M.; Morita, T., Intramolecular fluorescence quenching of phenylalkylamines. The Journal of Physical Chemistry 1979, 83 (15), 2019-2024.
64. Efros, A. L.; Rosen, M., Random Telegraph Signal in the Photoluminescence Intensity of a Single Quantum Dot. Physical Review Letters 1997, 78 (6), 1110-1113.

158
65. Galland, C.; Ghosh, Y.; Steinbrück, A.; Hollingsworth, J. A.; Htoon, H.; Klimov, V. I., Lifetime blinking in nonblinking nanocrystal quantum dots. Nat Commun 2012, 3, 908.
66. Liu, Y.-S.; Sun, Y.; Vernier, P. T.; Liang, C.-H.; Chong, S. Y. C.; Gundersen, M. A., pH-Sensitive Photoluminescence of CdSe/ZnSe/ZnS Quantum Dots in Human Ovarian Cancer Cells. The Journal of Physical Chemistry C 2007, 111 (7), 2872-2878.
67. Jiang, X.; Housni, A.; Gody, G.; Boullanger, P.; Charreyre, M.-T. r. s.; Delair, T.; Narain, R., Synthesis of Biotinylated α-d-Mannoside or N-Acetyl β-d-Glucosaminoside Decorated Gold Nanoparticles: Study of Their Biomolecular Recognition with Con A and WGA Lectins. Bioconjugate Chemistry 2010, 21 (3), 521-530.
68. El-Boubbou, K.; Gruden, C.; Huang, X., Magnetic Glyco-nanoparticles: A Unique Tool for Rapid Pathogen Detection, Decontamination, and Strain Differentiation. Journal of the American Chemical Society 2007, 129 (44), 13392-13393.
69. El-Boubbou, K.; Zhu, D. C.; Vasileiou, C.; Borhan, B.; Prosperi, D.; Li, W.; Huang, X., Magnetic Glyco-Nanoparticles: A Tool To Detect, Differentiate, and Unlock the Glyco-Codes of Cancer via Magnetic Resonance Imaging. Journal of the American Chemical Society 2010, 132 (12), 4490-4499.
70. Wang, X.; Liu, L.-H.; Ramström, O.; Yan, M., Engineering Nanomaterial Surfaces for Biomedical Applications. Experimental Biology and Medicine 2009, 234 (10), 1128-1139.
71. Chandrasekaran, S.; Tanzer, M. L.; Giniger, M. S., Characterization of oligomannoside binding to the surface of murine melanoma cells. Potential relationship to oligomannoside-initiated cell spreading. Journal of Biological Chemistry 1994, 269 (5), 3367-3373.
72. Yamazaki, N.; Kojima, S.; Bovin, N. V.; André, S.; Gabius, S.; Gabius, H. J., Endogenous lectins as targets for drug delivery. Advanced Drug Delivery Reviews 2000, 43 (2–3), 225-244.
73. Bishop, K. J. M.; Wilmer, C. E.; Soh, S.; Grzybowski, B. A., Nanoscale Forces and Their Uses in Self-Assembly. Small 2009, 5 (14), 1600-1630.
74. Caswell, K. K.; Wilson, J. N.; Bunz, U. H. F.; Murphy, C. J., Preferential End-to-End Assembly of Gold Nanorods by Biotin−Streptavidin Connectors. Journal of the American Chemical Society 2003, 125 (46), 13914-13915.
75. Kang, Y.; Erickson, K. J.; Taton, T. A., Plasmonic Nanoparticle Chains via a Morphological, Sphere-to-String Transition. Journal of the American Chemical Society 2005, 127 (40), 13800-13801.
76. Nie, Z.; Fava, D.; Kumacheva, E.; Zou, S.; Walker, G. C.; Rubinstein, M., Self-assembly of metal-polymer analogues of amphiphilic triblock copolymers. Nat Mater 2007, 6 (8), 609-614.
77. DeVries, G. A.; Brunnbauer, M.; Hu, Y.; Jackson, A. M.; Long, B.; Neltner, B. T.; Uzun, O.; Wunsch, B. H.; Stellacci, F., Divalent Metal Nanoparticles. Science 2007, 315 (5810), 358-361.
78. Zhao, N.; Liu, K.; Greener, J.; Nie, Z.; Kumacheva, E., Close-Packed Superlattices of Side-by-Side Assembled Au-CdSe Nanorods. Nano Letters 2009, 9 (8), 3077-3081.
79. Tang, Z.; Zhang, Z.; Wang, Y.; Glotzer, S. C.; Kotov, N. A., Self-Assembly of CdTe Nanocrystals into Free-Floating Sheets. Science 2006, 314 (5797), 274-278.
80. Nikolic, M. S.; Olsson, C.; Salcher, A.; Kornowski, A.; Rank, A.; Schubert, R.; Frömsdorf, A.; Weller, H.; Förster, S., Micelle and Vesicle Formation of Amphiphilic Nanoparticles. Angewandte Chemie International Edition 2009, 48 (15), 2752-2754.

159
81. Park, S.; Lim, J.-H.; Chung, S.-W.; Mirkin, C. A., Self-Assembly of Mesoscopic Metal-Polymer Amphiphiles. Science 2004, 303 (5656), 348-351.
82. Park, S. Y.; Lytton-Jean, A. K. R.; Lee, B.; Weigand, S.; Schatz, G. C.; Mirkin, C. A., DNA-programmable nanoparticle crystallization. Nature 2008, 451 (7178), 553-556.
83. Nykypanchuk, D.; Maye, M. M.; van der Lelie, D.; Gang, O., DNA-guided crystallization of colloidal nanoparticles. Nature 2008, 451 (7178), 549-552.
84. Iacovella, C. R.; Glotzer, S. C., Complex Crystal Structures Formed by the Self-Assembly of Ditethered Nanospheres. Nano Letters 2009, 9 (3), 1206-1211.
85. Kalsin, A. M.; Fialkowski, M.; Paszewski, M.; Smoukov, S. K.; Bishop, K. J. M.; Grzybowski, B. A., Electrostatic Self-Assembly of Binary Nanoparticle Crystals with a Diamond-Like Lattice. Science 2006, 312 (5772), 420-424.
86. Sharma, J.; Chhabra, R.; Cheng, A.; Brownell, J.; Liu, Y.; Yan, H., Control of Self-Assembly of DNA Tubules Through Integration of Gold Nanoparticles. Science 2009, 323 (5910), 112-116.
87. Dumas, P.; Miller, L., The use of synchrotron infrared microspectroscopy in biological and biomedical investigations. Vibrational Spectroscopy 2003, 32 (1), 3-21.
88. Sham, T. K., Ed. Chemical Applications of Synchrotron Radiation. WorldScientific Publishing Co. Ltd: Singapore, 2002.

160
5 Carbohydrate Capped Silicon Nanoparticles for
Selective Targeting of Cancer cells
5.1 Introduction and motivations
Each year, millions of people’s lives worldwide are affected by a complex group
of diseases known as cancer. For most cancer, chemotherapy has become an integral
component of cancer treatment. Despite the last 30 years of effort on oncology drug
discovery, conventional chemotherapeutic agents still exhibit poor specificity in
reaching tumour tissue and are often restricted by dose-limiting toxicity. To overcome
the limitation factor found in chemotherapy, targeted drug delivery and controlled drug
release technology may provide a more efficient and less harmful solution. It is well
known that each malignant cell type has a specific molecular signature that
discriminates it from its healthy counterparts. Taking advantage of this molecular
signature expressed by cancer cells, the availability of simple and fast methods to
identify these unique cellular characteristics can greatly benefit cancer treatment and
improve the clinical outcomes for patients. Presently the popular methods used in
targeted cancer detection are biomarkers, including mutated DNA/RNA and
overexpressed antigens. These methods are very time consuming to acquire, as it
requires extensive prior knowledge of the presence of the specific markers. Moreover,
tumour cells have high tendencies to mutate, which changes their antigenic
modifications leading to negative results. An interesting alternative is to take advantage
of the receptors present on the surface of cells as detection events.
Carbohydrates are attractive targets for receptor-mediated interaction and in
particular glycoconjugates, which play important roles in cancer development and
metastasis. All mammalian cells are covered with a dense layer of carbohydrates known
as glycocalyx, in which carbohydrates are bound to proteins and lipids known as
glycoproteins, proteoglycans and glycolipids. These naturally occurring glycoconjugates
play an important role in the process of cell-cell interaction and cell-cell
communications that is vital for physiological and pathological process.1, 2 As one of the
common cell-surface ligands, carbohydrates can direct the initiation of many
medicinally important physiological processes where they are involved in a wide variety
of events,3-5 including inflammatory and immunological responses6-8 tumour

161
metastasis,9 cell-cell signalling,10 apoptosis, adhesion,11 bacterial and viral recognition,11,
12 and anticoagulation.13
The biological roles of carbohydrates as signalling effectors and recognition
markers are associated with specific molecular recognition in which proteins14 or other
carbohydrates15 are involved. This characteristic led to the identification of tumours
associated with carbohydrate molecules,10, 16 and this has greatly improved the
development of carbohydrate-based anticancer vaccine studies.17 In comparison, the
understanding of carbohydrate-binding properties of tumours is not as advanced.
Cancer cells can interact with the extracellular matrix in their microenvironment
through endogenous receptors binding with carbohydrates.17, 18 These interactions vary,
depending on the physiological state of the cells, as supported by the ground-breaking
histological studies of tumour tissues.19, 20 Therefore, the ability to characterize and
distinguish carbohydrate binding profiles of a variety of cells can expedite both the
mechanistic understanding of their role in disease development and the expansion of
diagnostic and therapeutic tools.21-23 As the differences among cancer cell subtypes and
malignant vs normal cells can often be subtle, a suitable tool is needed to quantitatively
analyse the fine characteristics in carbohydrate binding of various cell types.
When nanoparticles are functionalized with ligands such as antibodies, proteins
or peptides, oligonucleotides or carbohydrates, they become excellent vehicles for
biological applications at the cellular and molecular level. However, several features
need to be fine-tuned including ligand density, particle diameter, surface charges,
magnetic, electronic or optical properties, stability and targeting specificity.
Nanomaterials can serve as promising platforms for displaying carbohydrates
for biological recognition. Due to the smaller sizes of NPs compared to their micrometer
sized counterparts, NPs have much larger surface areas, which can enable higher
capacity in receptor binding. In addition, multiple carbohydrate ligands can be
immobilized onto one NP, which can potentially enhance the weak affinities of
individual ligands to their binding partners.
SiNPs hold prominent interest in various fields of biomedical research including
imaging, detection, sensing to drug delivery and new therapeutic uses.24, 25 This is in
addition to the electronic, magnetic and optical properties. Silicon nanoparticles (SiNPs)
or Quantum dots have size dependent tuneable light emission, bright luminescence,
stability against photobleaching compared to organic fluorescent dye molecules which
makes them ideal tools for fluorescence imaging. All these properties have assisted

162
SiNPs as fluorescent cellular markers in a number of diagnostic and assay roles.
Moreover when comparing with heavy metal and other types of semiconductor
quantum dots, SiNPs exhibits low inherent toxicity.26-29
Herein, we explore the possibility of using glycoconjugated SiNPs to detect and
outline various cell types on the basis of the more physiologically related carbohydrate-
receptor interactions. We have focused on SiNPs functionalized with a carbohydrate that
plays key roles in the molecular recognition processes rather than those where
carbohydrates mainly function as NP stabilizing agents.30-32 The information obtained on
the physiologically relevant carbohydrate-receptor interaction can not only enhance our
understanding of the roles carbohydrate plays in cancer but also guide the development
of potential therapeutics such as agents against cancer adhesion.
5.2 Synthesis of Carbohydrate capped SiNPs
The carbohydrate capped SiNPs were synthesized from amine-terminated SiNPs
as described in Chapter 4.33 For instance the corresponding pyranosyl acid was reacted
with EDC and N-hydroxysuccinimide (NHS) in the presence of DCM. After 2 hr the
freshly prepared amine-terminated SiNPs were dissolved in water and added into the
reaction mixture. The reaction was stirred for 24 hr at room temperature (Scheme 5.1).

163
Scheme 5.1: Schematic representation of synthesis of carbohydrate capped SiNPs

164
The detailed procedure to synthesize carbohydrate capped SiNPs using EDC and
NHS is briefly mentioned in the experimental section. The obtained carbohydrate
capped SiNPs were characterized by several techniques discussed in Chapter 4.
5.3 Stability of Carbohydrate capped SiNPs in Biological Media
A significant challenge in application of nanoparticles in biomedical is to retain
their stability in biologically-associated environments. The nanoparticles have to be
hydrophilic and maintain a superior stability in biological media. For advanced
biomedical applications of nanoparticles (e.g., in vivo diagnostics and therapy),
additional requirements such as minimization of non-specific uptake by
reticuloendothelial systems (RES) must be imposed in order to achieve long blood
circulation time and high diagnostic or therapeutic efficiency.34 For investigations of the
in vivo effects of nanoparticles in the circulation and for measuring the effects of
nanoparticles on different types of cells in vitro, nanoparticles have to be dispersed in
physiological solutions. However, particles in solutions with physiological salt
concentrations and pH values form micrometer-sized coarse agglomerates.35-37 Coarse
agglomerates of nanoparticles have been shown to exert different biological effects as
compared to well-dispersed nanoparticles.38-40 Moreover they induce toxicity to both in
vitro and in vivo studies due to the aggregation. Therefore, it is important to investigate
the effect of biological media on carbohydrate capped SiNPs.
In order to monitor the stability of carbohydrate capped SiNPs in biological
medium, Dynamic Light Scattering (DLS) was used to monitor the variation of the
average hydrodynamic size of the NPs in different media. For long-term stability test 0.1
mL solution of carbohydrate capped SiNPs was incubated in 1 mL of Dulbecco’s
Modified Eagle’s Medium (DMEM) with 10% FBS, Roswell Park Memorial Institute
(RPMI) medium with 10% FBS and Marc’s Modified Ringers (MMR) as a function of time.
The average hydrodynamic diameter was measured at four different time points 0, 6, 12
and 24 hours. Figure 5.1 and Table 5.1 show the stability of carbohydrate capped SiNPs
by DLS in DMEM media for various time points such as 6hrs, 12hrs, and 24 hrs.

165
Table 5.1: Diameter of carbohydrate capped SiNPs by DLS in DMEM, RPMI and MMR media
(± repeatability)
Carbohydrate
capped SiNPs
DMEM media
DLS Size (nm)
RPMI media
DLS Size (nm)
MMR media
DLS Size (nm)
6hr 12hr 24hr 6hr 12hr 24hr Initial 24hr
Gal SiNPs 10 ± 1.0 10 ± 1.0 15 ± 1.5 10 ±1.0 10 ±1.0 16 ±1.0 37±3.0 58± 5.0
Man SiNPs 11± 1.0 13 ± 1.0 14 ± 1.0 11 ±1.0 15 ±2.0 20 ±1.0 20±1.5 43±3.0
Glu SiNPs 13± 1.0 13 ± 1.0 13 ± 1.0 14 ±1.0 16 ±1.0 16 ±1.0 15±1.5 72±5.0
Lac SiNPs 14± 1.5 14 ± 1.5 16 ± 1.0 14 ±1.0 15 ±1.0 15 ±1.0 38±4.0 43±5.0
The NPs dimension was monitored by DLS over time to evaluate the occurrence
of cluster formation, through aggregation phenomena, which causes a shift of the
particle size distribution (PSD) toward higher values.
Figure 5.1: Stability of (a) Gal, (b) man, (c) Glu and (d) Lac-capped SiNPs in DMEM media at
various time points.
Figure 5.1 shows that there is some aggregation of carbohydrate capped SiNPs
upon incubation with DMEM media. The gal capped SiNPs (figure5.1a) show a slight
0.1 1 10 100 1000 10000
0.0
1.5
3.0
4.5
6.0
7.5
Gal SiNPs in water
Gal SiNPs in DMEM-6h
Gal SiNPs in DMEM-12h
Gal SiNPs in DMEM-24h
Inte
ns
ity
(%
)
Size (nm)
0.1 1 10 100 1000 10000
0.0
1.5
3.0
4.5
6.0
7.5
Man SiNPs in DMEM-6h
Man SiNPs in DMEM-12h
Man SiNPs in DMEM-24h
Inte
ns
ity
(%
)
Size (nm)
0.1 1 10 100 1000 10000
0.0
1.5
3.0
4.5
6.0
7.5
Glu SiNPs in water
Glu SiNPs in DMEM-6h
Glu SiNPs in DMEM-12h
Glu SiNPs in DMEM-24h
Inte
ns
ity
(%
)
Size (nm)
0.1 1 10 100 1000 10000
0.0
1.5
3.0
4.5
6.0
7.5
Lac SiNPs in DMEM-6h
Lac SiNPs in DMEM-12h
Lac SiNPs in DMEM-24h
Inte
ns
ity
(%
)
Size (nm)
(a) (b)
(c) (d)

166
broadening of the peak after 6 and 12 hrs but the peak position does not change. After
24 hrs the peak position shifts slightly but the overall results do not show any sign of
aggregation in DMEM media. Besides gal capped SiNPs, the man, glu and lac capped
SiNPs are also very stable in DMEM media.
Figure 5.2: Stability of (a) Gal, (b) man, (c) Glu and (d) Lac-capped SiNPs in RPMI media at
various time points.
The carbohydrate capped SiNPs were also incubated in RPMI media for various
time points shown in figure 5.2. The gal capped SiNPs (figure 5.2a) did not show any
aggregation for 6 and 12 hours but the peak position shifted slightly after 24 hr, which
suggest that slight aggregation occurred. Similarly slight aggregation was observed in
man capped SiNPs (figure 5.2b) after 24 hrs. The glu and lac-capped SiNPs were
moderately stable and did not show any sign of aggregation.
Similar to the DMEM and RPMI biological media the carbohydrate capped SiNPs
were also tested in MMR media, which was used to culture the Xenopus embryo. The NPs
were incubated in MMR and the DLS spectra were obtained after adding the sample and
after incubating for 24hrs. Figure 5.3 shows the DLS size distribution of carbohydrate
capped SiNPs in MMR media.
0.1 1 10 100 1000 10000
0.0
1.5
3.0
4.5
6.0
7.5
Gal SiNPs in RPMI-6h
Gal SiNPs in RPMI-12h
Gal SiNPs in RPMI-24h
Inte
ns
ity
(%
)
Size (nm)
0.1 1 10 100 1000 10000
0.0
1.5
3.0
4.5
6.0
7.5
Man in RPMI-6h
Man in RPMI-12h
Man in RPMI-24h
Inte
ns
ity
(%
)Size (nm)
0.1 1 10 100 1000 10000
0.0
1.5
3.0
4.5
6.0
7.5
Glu SiNPs in RPMI-6h
Glu SiNPs in RPMI-12h
Glu SiNPs in RPMI-24h
Inte
ns
ity
(%
)
Size (nm)
0.1 1 10 100 1000
0.0
1.5
3.0
4.5
6.0
7.5
Lac SiNPs in RPMI-6h
Lac SiNPs in RPMI-12h
Lac SiNPs in RPMI-24h
Inte
ns
ity
(%
)
Size (nm)
(a) (b)
(c) (d)

167
Figure 5.3: Stability of (a) Gal, (b) man, (c) Glu and (d) Lac-capped SiNPs in MMR media at
various time points.
From figure 5.3 (table 5.1) it is clear that carbohydrate capped SiNPs show some
extent of aggregation in MMR media. The size of gal capped SiNPs (figure 5.3a)
increased in MMR immediately after the addition from around 11 nm to 37 nm (Table
5.1). After 24 hrs the overall diameter had increased up to 58 nm showing aggregation.
Man capped SiNPs did not show any significant shift at the initial time point but the
overall diameter increased slightly after 24 hrs. The glu capped SiNPs were stable after
the addition but showed massive aggregation after 24 hrs. Similarly the lac capped
SiNPs showed an increase in size after addition and some extent of aggregation after 24
hrs.
The overall DLS stability results demonstrate that the carbohydrate capped
SiNPs are very stable in biological media like DMEM and RPMI. The main challenge of
the NPs when developing for biological application or in vivo study is that they interact
with body fluid and form an aggregation or a protein corona around the NPs,
significantly reducing their selectivity towards the target as well as causing toxicity and
1 10 100 1000 10000
0
8
16
24
32
40
Gal SiNPs Initial
Gal SiNPs after 24 hrs
In
ten
sit
y (
%)
Size (nm)
1 10 100 1000 10000
0
10
20
30
40
50
60
Lac SiNPs Initial
Lac SiNPs after 24 hrs
Inte
ns
ity
(%
)
Size (nm)
1 10 100 1000 10000
0
25
50
75
100
Glu SiNPs Initial
Glu SiNPs after 24 hrs
Inte
ns
ity
(%
)
Size (nm)
1 10 100 1000 10000
0
5
10
15
20
25
30
35
Man SiNPs Initial
Man SiNPs after 24 hrs
Inte
ns
ity
(%
)
Size (nm)
(a) (b)
(c) (d)

168
affecting the final therapeutic performance. This is the great advantage of carbohydrate
capped SiNPs as they did not interact with the protein, which is contained in the DMEM
and RPMI media, and were moderately stable. These stability results suggest that
carbohydrate capped SiNPs can serve as an important platform to be used for in vivo
study as well as for other biological applications.
On the other hand carbohydrate capped SiNPs exhibit aggregation in MMR
media. This is possibly due to the basicity of MMR media that interferes with the surface
charge of the carbohydrate capped NPs and forms the aggregates.
5.4 Cytotoxicity Assay of Carbohydrate capped SiNPs
5.4.1 In vitro Toxicity
The effect of carbohydrate capped SiNPs on the cytotoxicity of cells was
determined by MTT assay. The toxicity was verified in both cancerous and non-
cancerous cell lines. A549 (Human lung carcinoma), HHL-5 (human immortalized
hepatocytes) and MDCK (Normal Kidney Epithelium cells) cells were plated in 200μL of
complete culture medium containing 50, 300, 500, 700 and 1000 μg/mL concentrations
of carbohydrate capped SiNPs in 96-well plates for 72 hours.
Figure 5.4: MTT graph of carbohydrate capped SiNPs in A549 cell lines at various
concentrations
0 2 0 0 4 0 0 6 0 0 8 0 0 1 0 0 0
0
2 0
4 0
6 0
8 0
1 0 0
1 2 0
1 4 0
A 5 4 9
C o n c e n tra t io n ( g /m l)
Ce
ll v
iab
ilit
y %
G lu S iN P s
L a c S iN P s
M a n S iN P s
NH 2 S iN P s
G a l S iN P s

169
Figure 5.5: MTT graph of carbohydrate capped SiNPs in MDCK cell lines at various
concentrations
Figure 5.6: MTT graph of carbohydrate capped SiNPs in HHL5 cell lines at various
concentrations
0 2 0 0 4 0 0 6 0 0 8 0 0 1 0 0 0
0
2 0
4 0
6 0
8 0
1 0 0
1 2 0
1 4 0
M D C K
C o n c e n tra t io n ( g /m l)
Ce
ll V
iab
ilit
y (
%)
G a l S iN P s
G lu S iN P s
L a c S iN P s
M a n S iN P s
NH 2 S iN P s
0 2 0 0 4 0 0 6 0 0 8 0 0 1 0 0 0
0
2 0
4 0
6 0
8 0
1 0 0
1 2 0
H H L 5
C o n c e n tra t io n ( g /m l)
Ce
ll V
iab
ilit
y (
%) G a l S iN P s
G lu S iN P s
M a n S iN P s
L a c S iN P s
NH 2 S iN P s

170
The results of the MTT assay, as a measure of metabolic competence of the cells
for 72 hours exposure to carbohydrate capped SiNP, are shown in Figure 5.4, 5.5 and 5.6.
As mentioned earlier the cell viability was verified in both cancerous and non-cancerous
cell lines. Figure 5.4 shows the MTT data of carbohydrate capped SiNPs compared with
amine-terminated SiNPs as a control in A549 (Lung cancer) cell line. It is observed that
even at a higher particle concentration, i.e. 1000 µg/mL, all the cells could normally
proliferate and maintain >95% of cell viability to that of the control cells during 72
hours culture. Whereas amine-terminated SiNPs induced toxicity above 200 µg/mL
concentration, suggesting that the NPs are highly capped with carbohydrate moieties
which make them non-toxic for cells. That amine-terminated SiNPs induce toxicity at
200μg/mL was confirmed by calculating IC50, as shown in figure 5.7. This result suggests
the lack of cytotoxic effects of carbohydrate SiNPs upon the cells. The carbohydrate
capped SiNPs were also tested in normal cell lines i.e. HHL-5 and MDCK cell lines. Figure
5.5 shows the MTT data of carbohydrate capped SiNPs in MDCK cells. The cells
maintained their viability throughout all concentrations compared to that of amine-
terminated SiNPs suggesting that the carbohydrate capped SiNPs are non-toxic for
normal cells as well. When the NPs were introduced to the HHL-5 cells (figure 5.6), the
gal and lac-capped SiNPs showed some level of toxicity but less than amine-terminated
SiNPs. Furthermore, as can be seen from Figures 5.4, 5.5 and 5.6, the proliferations of
cells is not affected by increasing particle concentration (1000 µg/mL) in all of the cell
cultures, which suggests the carbohydrate capped SiNPs did not cause any apparent
harm to the viability of the different types of cells (HHL5, MDCK, A549) as well as for
both normal and cancer cell lines.
The IC50 of amine-terminated SiNPs was calculated in HeLa cells by a research
collaborator Dr. Nattika Saengkrit from Thailand. The stock solution of amine-
terminated SiNPs was prepared by dissolving in water at conc. of 1mg/mL. The cells
were then exposed to the amine-terminated SiNPs and incubated for 72 hours at 37°C.
The MTT measurement was carried out using the standard procedure explained in
chapter 2.
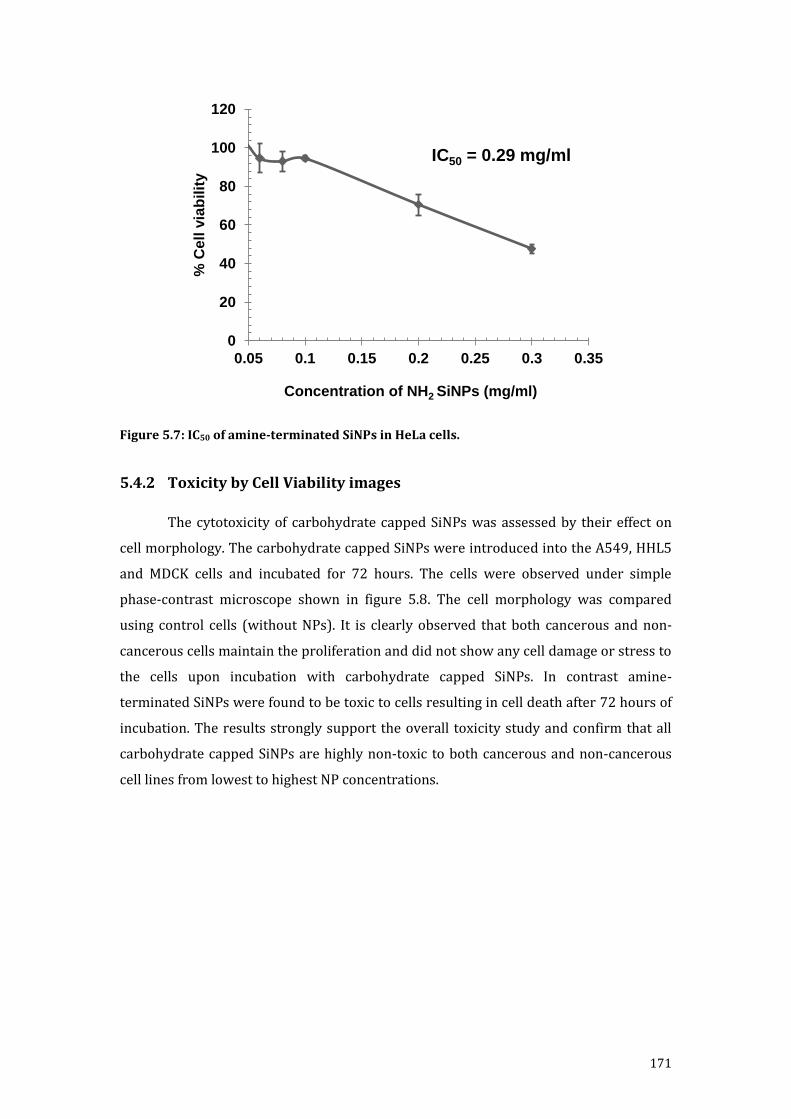
171
Figure 5.7: IC50 of amine-terminated SiNPs in HeLa cells.
5.4.2 Toxicity by Cell Viability images
The cytotoxicity of carbohydrate capped SiNPs was assessed by their effect on
cell morphology. The carbohydrate capped SiNPs were introduced into the A549, HHL5
and MDCK cells and incubated for 72 hours. The cells were observed under simple
phase-contrast microscope shown in figure 5.8. The cell morphology was compared
using control cells (without NPs). It is clearly observed that both cancerous and non-
cancerous cells maintain the proliferation and did not show any cell damage or stress to
the cells upon incubation with carbohydrate capped SiNPs. In contrast amine-
terminated SiNPs were found to be toxic to cells resulting in cell death after 72 hours of
incubation. The results strongly support the overall toxicity study and confirm that all
carbohydrate capped SiNPs are highly non-toxic to both cancerous and non-cancerous
cell lines from lowest to highest NP concentrations.
0
20
40
60
80
100
120
0.05 0.1 0.15 0.2 0.25 0.3 0.35
% C
ell
via
bilit
y
Concentration of NH2 SiNPs (mg/ml)
IC50 = 0.29 mg/ml

172
Figure 5.8: Effect of carbohydrate capped SiNPs on cell morphology in cancerous cell line
A549 (Lung cancer) and non-cancerous cell lines MDCK (canine kidney) and HHL5 (human
immortalized hepatocytes).
A549 MDCK
200 µm
HHL5
200 µm
200 µm 200 µm
200 µm 200 µm
200 µm 200 µm 200 µm
200 µm200 µm 200 µm
200 µm
200 µm
200 µm

173
5.4.3 In Vivo Toxicity Assay
To study the interaction of nanomaterials with biological systems various in vivo
biological models have been proposed. Although in widespread use, small animal
models (rodents) are costly and labour intensive and furthermore raise important
ethical issues and have generated resistance to life science research from the anti-
vivisectionist lobby. All these issues and concerns can be relieved by using non-
mammalian embryos for in vivo studies to probe the interaction between nanomaterials
and tissues. Developmental biology offers powerful models to study the cell biological
interaction with NPs. Embryos are particularly sensitive indicators of adverse biological
effects on the organism. Moreover they provide a useful platform to study the
mechanism of action of adverse effects resulting from exposure to NPs.41, 42 For normal
embryo development, highly coordinated cell-to-cell communications and molecular
signaling are required; any perturbations by nanomaterials will disrupt orderly
embryogenesis leading to abnormal development manifested as morphological
malformations, behavioural changes and even embryo death.
As an experimental test system, Xenopus laevis offers several advantages: large
numbers of embryos with each fecundation (thousands) with a very short early
development time (3 days to reach tadpole), external development, close homology with
human genes, aside from requiring much less material than small mammals for the
assessment of nanomaterial–biological interactions and toxicity and less expensive
husbandry/housing.
In this work we have used Xenopus laevis embryos as models for biodistribution
studies of carbohydrate capped SiNPs. The carbohydrate capped SiNPs toxicity assay in
Xenopus embryos was carried out by first year PhD student Carl Webster from Dr.
Victoria Sherwood’s group. Figure 5.9 shows the images of X. laevis embryos.

174
Figure 5.9: (b) - (f) representative range of Xenopus embryos exposed to a highest
concentration of carbohydrate capped SiNPs 200µg/mL (a) control, (b) gal capped SiNPs,
(c) Man capped SiNPs, (d) Glu capped SiNPs, (e) Lac capped SiNPs and (f) Amine-
terminated SiNPs.
Glu SiNPs200 µg/mL
Lac SiNPs200 µg/mL
Amine SiNPs200 µg/mL
ControlGal SiNPs
200 µg/mLMan SiNPs200 µg/mL
(a) (b) (c)
(d) (e) (f)

175
Figure 5.10: Graph representing the total Xenopus embryos at 200 g/mL of conc. of NPs
and classified as percentage of dead, having abnormalities or no abnormalities at stage 38.
In figure 5.9 the Xenopus embryos were exposed to a highest conc. of
carbohydrate capped SiNPs and amine-terminated SiNPs at Nieuwkoop and Faber stage
(NF ST) 15 and fixed at NF ST 38. The toxicity was compared using control Xenopus
embryos (without NPs) shown in figure 5.9a. In total 30 embryos were assessed for each
NP at highest conc. and classified as dead, having abnormalities, or no abnormalities,
common malformations include stunted development, bent spine and tail, eye
deformities, gut abnormalities, edema and blistering.
From figure 5.9 it is clearly observed that carbohydrate capped SiNPs show no
or minimal toxicity to the Xenopus embryos at highest conc. Lac capped SiNPs showed to
be slightly toxic as spotted by looking at tail deformities comparing to that of mannose
(c) and glucose (d) capped SiNPs. Similarly gal capped SiNPs exposed embryos showed
bent spine suggesting some toxicity. The experiment was carried out using various conc.
such as 50, 100 and 200 g/mL, nonetheless only highest conc. of Xenopus embryos
images are shown in figure 5.9 as the lowest conc. did not show any morphological
abnormalities in Xenopus embryos. Comparing to carbohydrate capped SiNPs, amine
terminated SiNPs were shown to be highly toxic and resulted in the death of Xenopus
embryos as shown in figure 5.9 and 5.10.

176
By studying both in vitro and in vivo toxicity it is clear that the carbohydrate
capped SiNPs are non-toxic up to a certain extent and represent the potential for further
biomedical application.
5.5 Cellular Uptake of Carbohydrate capped SiNPs Using Flow
Cytometry
To clarify and demonstrate the relevance of the functionalization strategy on the
NP-cell interaction, we performed cell uptake experiments using both cancerous and
non-cancerous cell lines, all of which were done under the same conditions for all NPs.
Flow cytometry was used to semi-quantitatively measure cellular uptake of the NPs. The
instrument gave an accumulated intensity of the particles fluorescent in a number of
cells (i.e. 10,000 cells). Therefore, the total fluorescence of particles in one cell is
measured by this approach.43 The carbohydrate capped SiNPs were introduced to
cancerous cell lines like A549, MCF7, SK-Mel and normal non-cancerous cell lines
including MDCK and HHL5.
A major hurdle for cancer treatment and early cancer detection is the
identification of pertinent cellular signatures to allow the differentiation of normal cells
from their cancerous counterparts. We envision that this can be achieved by analysis of
the respective cellular characteristics toward carbohydrate binding.
This phenomenon was verified by evidence from the literature that MCF-7/Adr-
res cells contain the cancer-specific galactoside binding galectins-4, -7, and -8, which are
absent in non-cancer cell lines.44 The Penades group also demonstrated that mouse
melanoma cells are known to bind with lactose due to the presence of galectins on the
surface.45 It is also well known that liver cell hepatocytes contain the galactoside binding
asialoglycoprotein receptor (ASGP-R) with galactose and galactosamine known to
accumulate selectively in the liver via ASGP-R binding.46 The evidences from the
literature on overall glyco-nanoparticles specific binding to the specific cells are
mentioned briefly in chapter-1.
Initially the uptake efficiency of carbohydrate capped SiNPs was measured at
various time points in both cancerous and non-cancerous cell lines. Figure 5.11 and 5.12
show the uptake efficiency of carbohydrate capped SiNPs at conc. 200 µg/mL in A549,
MCF7, SK-Mel, MDCK and HHL5 cells for 24, 48 and 72 hours.

177
Figure 5.11: Uptake efficiency of carbohydrate capped SiNPs in cancer cells (A549, SK-Mel
and MCF-7) and non-cancerous cells (MDCK, HHL5) at various incubation times (a) 24, (b)
48 and (c) 72 hrs. Collective results are normalized to untreated control cells, 24, 48 and
72 hours. Values are mean ± S.D of the results from three independent experiments.
0
5000
10000
15000
20000
25000
30000
SK-mel A549 MCF7 MDCK HLL5
No
rmal
ize
FLA
-1 v
alu
e
Cancer and non-cancerous cell lines
(a) 24 hours
Gal SiNPs
Man SiNPs
Glu SiNPs
Lac SiNPs
0
2000
4000
6000
8000
10000
12000
14000
16000
SK-mel A549 MCF7 MDCK HLL5
No
rmal
ize
FLA
-1 v
alu
e
Cancer and non-cancerous cell lines
(b) 48 hours
Gal SiNPs
Man SiNPs
Glu SiNPs
Lac SiNPs
0
2000
4000
6000
8000
10000
12000
14000
SK-mel A549 MCF7 MDCK HLL5
No
rmal
ize
FLA
-1 v
alu
e
Cancer and non-cancerous cell lines
(c) 72 hours
Gal SiNPs
Man SiNPs
Glu SiNPs
Lac SiNPs

178
From figure 5.11 it is observed that the carbohydrate capped SiNPs are
successfully taken up by both cancer and non-cancer cell lines. It is clear that the uptake
efficiency of cancer cells is assuredly more than that of the normal cells. The time
dependent uptake efficiency of these NPs was also monitored at various time points 24
(figure 5.11a), 48 (figure 5.11 b) and 72 (figure 5.11 c) hours. The carbohydrate capped
SiNPs were shown to be internalized within 24 hours, the uptake efficiency decreasing
at 48 and 72 hours’ time points (figure 5.12).
(a)
(b)

179
Figure 5.12: Time dependent uptake efficiency of carbohydrate capped SiNPs in cancer
cells (A549, SK-Mel and MCF-7) and non-cancerous cells (MDCK, HHL5) at incubation time
of 24, 48 and 72 hrs. Collective results are normalized to untreated control cells, 24, 48
and 72 hours. Values are mean ± S.D of the results from three independent experiments.
(c)
(d)
(e)

180
From figure 5.12 it is clear that all cells take up the carbohydrate capped SiNPs
within 24 hrs, the overall uptake efficiency decreasing with increasing time. Based on
flow cytometry response, it is observed that the binding of gal capped SiNPs and lac
capped SiNPs in cancerous cells is higher, suggesting that these cell lines have active
galactose and lactose receptors. SK-Mel cells were found to interact with gal and lac
SiNPs more efficiently. This is of special interest since it is reported that melanoma cells
bind to lactose, due to the presence of galactin on the surface.45 Furthermore the brief
time dependent uptake studies of carbohydrate capped SiNPs was performed in SK-Mel
cells. The cells were exposed to the NPs at various time points and the results quantified
by flow cytometry in figure 5.13.
Figure 5.13: Time dependent uptake efficiency of carbohydrate capped SiNPs in SK-Mel
cells at various incubation times of 1, 3, 6, 24, 48 and 72 hrs. Collective results are
normalized to untreated control cells. Values are mean ± S.D of the results from three
independent experiments.
Figure 5.13 clearly shows SK-Mel cells internalize the carbohydrate capped
SiNPs within 24 hrs, which indicates that it is receptor mediate endocytosis.
To study further, the internalization mechanism of carbohydrate capped SiNPs
was considered by incubating cells with all the NPs at 4°C and 37°C. Traditionally it has
been proposed that diffusion and active transport of molecules across the cellular
membrane are temperature dependent.47 At low temperature transport activity is
strongly reduced, thus uptake of molecules could be attributed to a non-specific
diffusional entry into the cells.48 Effects from low temperature may affect the binding of
the ligand to specific cell receptors, the lateral mobility of the ligand-receptor complex,49

181
the formation of necks in the clathrin coated pits,50 and/or the transport of endocytosed
material from endosomes to lysosomes.51 Endocytosis of ligands such as transferrin,
cholera toxin or some viruses has been shown to be temperature dependent,52-54 as the
ligands are able to attach to cell membrane at low temperatures but are not internalized.
Based on the concept, carbohydrate capped SiNPs were incubated in SK-Mel cell
line at different temperatures and data was obtained using flow cytometry analysis
shown in figure 5.14.
Figure 5.14: Uptake efficiency of carbohydrate capped SiNPs in SK-Mel cell line at (a) 4°C
and (b) 37°C: Control-black, Gal-red, Man-blue, Glu-purple, Lac-orange at concentration of
200µ g/mL.
Figure 5.15: Uptake efficiency of carbohydrate capped SiNPs in SK-Mel cells at 4°C (Red)
and 37°C (Blue) presented as a percentage of untreated control cells. Values are mean ±
S.D of the results from three independent experiments.
NPs at 4°C NPs at 37°C
(a) (b)

182
From figure 5.14 and 5.15 it is clearly observed that the NPs kept at 4°C were not
internalized in SK-Mel cells, while at 37°C all the carbohydrate capped SiNPs were
internalized into the cells as confirmed by flow cytometry analysis. Therefore, the
obtained results suggest that the cellular uptake of carbohydrate capped SiNPs is most
likely energy-dependent.55
5.6 Cellular Uptake of Carbohydrate capped SiNPs Using Microscopy
In order to gain insights into how carbohydrate capped SiNPs internalize within
the cells, a cellular uptake experiment was performed using fluorescence and confocal
microscopy. Figure 5.16 and 5.17 show fluorescence images of HHL5 and A549 cells
incubated with 150g/mL Gal capped SiNPs for 24 hours. The cells were stained with
actin staining (Texas Red®-X Phalloidin), DAPI was used to stain the nuclei. Figure 5.16
shows the fluorescence image of HHL5 cells incubated with gal capped SiNPs.
Figure 5.16: Fluorescence images of HHL5 cells incubated with gal capped SiNPs for 24
hours. (a) Control (without NPs) and (b) HHL5 cell with gal capped NPs. Red fluorescence
from actin staining, blue from DAPI and green fluorescence from the Gal capped SiNPs.
Figure 5.16b shows HHL5 cells incubated for 24 hr with gal capped SiNPs. The
results indicate that gal capped SiNPs did not accumulate within the cell and are in
agreement with flow cytometry results.
Figure 5.17 shows the A549 cells incubated with gal capped SiNPs for 24 hours.
The cells were stained with Phalloidin red and the nuclei stained with DAPI.
(a) (b)

183
Figure 5.17: Fluorescence images of A549 cells incubated with gal capped SiNPs for 24
hours. (a) Control (without NPs) and (b), (c) and (d) A549 cell with gal capped SiNPs. Red
fluorescence from actin staining, blue from DAPI and green fluorescence from the Gal
capped SiNPs
In the case of A549 cells the gal capped SiNPs were found to be internalized
within the cytoplasm, the green fluorescence is from gal capped SiNPs.
Figure 5.18: Fluorescence images of A549 cells incubated with gal capped SiNPs for 24
hours. (a) Control (cells without NPs) and (b) cells treated with NPs. Red fluorescence
from LysoTracker-red and green fluorescence from the Gal capped SiNPs.
(a) (b)
(d)(c)
(a) (b)

184
In order to visualize the lysosomes, cells were stained with Lysotracker-Red, see
figure 5.18b. The selective uptake and intracellular accumulation of Gal-capped SiNPs in
A549 cells is clearly observed and thus all these results can lead to the further
development of carbohydrate capped SiNPs as a vehicle for targeted drug delivery.
Figure 5.19: Fluorescence confocal images of A549 cells incubated with gal capped SiNPs
for 24 hours. (a) Control (cells without NPs) and (b) A549 cell with NPs. Red fluorescence
from Phalloidin red, blue from DAPI and green fluorescence from the Gal capped SiNPs
Figure 5.19 shows the confocal images of A549 cells incubated with gal capped
SiNPs for 24 hours. It is clearly observed that the gal capped SiNPs internalize within
cytoplasm showing green fluorescence. Further study is ongoing to test other
carbohydrate capped SiNPs in various cell lines including cancer and non-cancer cells.
5.7 Cellular Uptake Using Synchrotron FTIR Spectroscopy
To study the biological cells using infrared spectroscopy (IR) is nowadays an
extensive and active area of research. Using synchrotron radiation (SR) IR microscopy
gives a high spatial resolution and signal-to-noise ratio for cell study and has proven to
be an ideal tool for investigating the biochemical composition of biological samples at
the molecular scale. We tried to use this concept to investigate the surface
functionalization of SiNPs inside the cells. The main aim of this study was to acquire and
investigate the chemical bonding information of carbohydrate capped SiNPs inside the
cells and confirm the uptake by cancerous cells using synchrotron FTIR. The MCF-7
(Human Breast cancer cell) were pre-incubated and stimulated with man capped SiNPs
and fixed on the glass cover slip using paraformaldehyde (see chapter 2).
(a) (b)

185
Figure 5.20 shows a typical FTIR spectrum from the region of MCF-7 cells
stimulated with man capped SiNPs.
Figure 5.20: FTIR spectrum from MCF-7 cells stimulated with mannose capped SiNPs
The spectrum shows features around 3292 cm-1 from O-H bonding, 2927 cm-1
from C-H bonding, 1650 cm-1 from amide stretching, N-H stretching and C-N bending
around 1542 cm-1, Si-CH2 symmetric bending and vibrational scissoring at 1230 cm-1 and
1452 cm-1 respectively and feature at 1039 cm-1 from C-OH, C-O, Si-O bonding. The
features for C-C bonding also arise to related position to that of Si-C bonding at 1230 cm-
1 and 1452 cm-1.
Figure 5.21 shows the mapping 3D spectrum of MCF-7 cells, stimulated with
man capped SiNPs.
1000 1500 2000 2500 3000 3500 4000
0.0
0.2
0.4
0.6
0.8
1.0
Ab
so
rba
nc
e.
un
its
W a ve le ng th (c m -1)
2927 C -H
3292 O H
1650 N H -C = O
C -N
N -H
s tretc hing
S i-C H 2
C -O -C
1230
1452S i-O
C -O
C -O H

186
Figure 5.21: Mapping spectrum over an area of MCF-7 cells showing the distribution of
man capped SiNPs. The red represents high intensity, blue represents low intensity.
The result showed the FTIR features for man capped SiNPs in MCF-7 cell line.
Nevertheless it was difficult to distinguish the features from cells and sample as all cells
contain carbohydrates and therefore they show exactly similar features in similar
regions to that of the sample. In order to distinguish the features between the cells and
the nanoparticles, further study needs to be undertaken to synthesize the carbohydrate
capped SiNPs using a specific marker, which successfully appears in the blank region of
FTIR i.e. from 1900 cm-1 to 2700cm-1. This could be possible by using azide functionality
or C=C / triple bond containing molecules.
5.8 Conclusion
The carbohydrate capped SiNPs prove to be very stable in biological media and
this was confirmed by DLS measurements. The toxicity of carbohydrate capped SiNPs
was tested both in vitro and in vivo (Xenopus embryo). The in vitro toxicity was tested by
MTT assay in both cancer and non-cancer cell lines. The carbohydrate capped SiNPs
were found to be non-toxic at highest concentration of 1000µg/mL. The in vivo toxicity
of carbohydrate capped SiNPs was tested in Xenopus Laevis embryos; the SiNPs were

187
shown to be non-toxic for embryos up to a certain extent and no death or morphological
damage was observed. The results were compared with amine-terminated SiNPs, which
proved to be highly toxic and resulted in the death of embryos. The obtained results
suggest that the SiNPs are highly capped with carbohydrate molecules, which make
them stable as well as non-toxic for both in vivo and in vitro conditions.
The uptake efficiency of carbohydrate capped SiNPs was quantified by flow
cytometry. The obtained results indicated that carbohydrate capped SiNPs internalize in
the cell within 24 hours. The fluorescence uptake of carbohydrate capped SiNPs was
quantified by both cancer and non-cancerous cell lines and the cancerous cell was
shown to uptake more NPs than normal cell lines, which is important in terms of
developing future targeted drug delivery systems. The uptake of carbohydrate capped
SiNPs was visualized by fluorescence and confocal microscopy. The NPs showed quick
accumulation inside cancer cells within cytoplasm.
Our understanding of cancer cell functions, such as endocytosis, cell-matrix and
cell-cell communications, can be greatly enhanced by studying carbohydrate-receptor
functions as a result of carbohydrate capped SiNP utilization. In addition, such studies
can help further understanding of specificity and ligand optimization. In the future, this
increasing knowledge base will enhance the applications of carbohydrate capped SiNPs
for in vivo cancer detection.

188
5.9 References
1. Dwek, R. A., Glycobiology: Toward Understanding the Function of Sugars. Chemical Reviews 1996, 96 (2), 683-720.
2. Varki, A., Biological roles of oligosaccharides: all of the theories are correct. Glycobiology 1993, 3 (2), 97-130.
3. Werz, D. B.; Seeberger, P. H., Carbohydrates as the Next Frontier in Pharmaceutical Research. Chemistry – A European Journal 2005, 11 (11), 3194-3206.
4. Raman, R.; Sasisekharan, V.; Sasisekharan, R., Structural Insights into Biological Roles of Protein-Glycosaminoglycan Interactions. Chemistry & Biology 2005, 12 (3), 267-277.
5. Seeberger, P. H.; Werz, D. B., Synthesis and medical applications of oligosaccharides. Nature 2007, 446 (7139), 1046-1051.
6. Simanek, E. E.; McGarvey, G. J.; Jablonowski, J. A.; Wong, C.-H., Selectin−Carbohydrate Interactions: From Natural Ligands to Designed Mimics. Chemical Reviews 1998, 98 (2), 833-862.
7. Macher, B. A.; Galili, U., The Galα1,3Galβ1,4GlcNAc-R (α-Gal) epitope: A carbohydrate of unique evolution and clinical relevance. Biochimica et Biophysica Acta (BBA) - General Subjects 2008, 1780 (2), 75-88.
8. Rabinovich, G. A.; Toscano, M. A., Turning 'sweet' on immunity: galectin-glycan interactions in immune tolerance and inflammation. Nat Rev Immunol 2009, 9 (5), 338-352.
9. Nangia-Makker, P.; Conklin, J.; Hogan, V.; Raz, A., Carbohydrate-binding proteins in cancer, and their ligands as therapeutic agents. Trends in Molecular Medicine 2002, 8 (4), 187-192.
10. Hakomori, S.-I.; Zhang, Y., Glycosphingolipid antigens and cancer therapy. Chemistry & Biology 1997, 4 (2), 97-104.
11. Pieters, R. J., Maximising multivalency effects in protein-carbohydrate interactions. Organic & Biomolecular Chemistry 2009, 7 (10), 2013-2025.
12. Lingwood, C. A., Oligosaccharide receptors for bacteria: a view to a kill. Current Opinion in Chemical Biology 1998, 2 (6), 695-700.
13. Petitou, M.; van Boeckel, C. A. A., A Synthetic Antithrombin III Binding Pentasaccharide Is Now a Drug! What Comes Next? Angewandte Chemie International Edition 2004, 43 (24), 3118-3133.
14. Lee, Y. C.; Lee, R. T., Carbohydrate-Protein Interactions: Basis of Glycobiology. Accounts of Chemical Research 1995, 28 (8), 321-327.
15. Hakomori, S. I., Carbohydrate carbohydrate interaction as an initial step in cell recognition. Pure Appl. Chem. 1991, 63, 473.
16. Danishefsky, S. J.; Allen, J. R., From the Laboratory to the Clinic: A Retrospective on Fully Synthetic Carbohydrate-Based Anticancer Vaccines. Angewandte Chemie International Edition 2000, 39 (5), 836-863.

189
17. Dai, Z.; Zhou, J.; Qiu, S.-J.; Liu, Y.-K.; Fan, J., Lectin-based glycoproteomics to explore and analyze hepatocellular carcinoma-related glycoprotein markers. ELECTROPHORESIS 2009, 30 (17), 2957-2966.
18. Barthel, S. R.; Gavino, J. D.; Descheny, L.; Dimitroff, C. J., Targeting selectins and selectin ligands in inflammation and cancer. Expert Opinion on Therapeutic Targets 2007, 11 (11), 1473-1491.
19. Kayser, K.; Heil, M.; Gabius, H. J., Is the Profile of Binding of a Panel of Neoglycoproteins Useful as a Diagnostic Marker in Human Lung Cancer? Pathology - Research and Practice 1989, 184 (6), 621-629.
20. Kayser, K.; Bovin, N.; Zemlyanukhina, T.; Donaldo-Jacinto, S.; Koopmann, J.; Gabius, H.-J., Cell type-dependent alterations of binding of synthetic blood group antigen-related oligosaccharides in lung cancer. Glycoconjugate J 1994, 11 (4), 339-344.
21. Rye, P. D.; Bovin, N. V., Selection of carbohydrate-binding cell phenotypes using oligosaccharide-coated magnetic particles. Glycobiology 1997, 7 (2), 179-182.
22. Lerchen, H.-G.; Baumgarten, J.; Piel, N.; Kolb-Bachofen, V., Lectin-Mediated Drug Targeting: Discrimination of Carbohydrate-Mediated Cellular Uptake between Tumor and Liver Cells with Neoglycoconjugates Carrying Fucose Epitopes Regioselectively Modified in the 3-Position. Angewandte Chemie International Edition 1999, 38 (24), 3680-3683.
23. Kim, E. Y. L.; Gronewold, C.; Chatterjee, A.; von der Lieth, C.-W.; Kliem, C.; Schmauser, B.; Wiessler, M.; Frei, E., Oligosaccharide Mimics Containing Galactose and Fucose Specifically Label Tumour Cell Surfaces and Inhibit Cell Adhesion to Fibronectin. ChemBioChem 2005, 6 (2), 422-431.
24. Wang, Q.; Ni, H.; Pietzsch, A.; Hennies, F.; Bao, Y.; Chao, Y., Synthesis of water-dispersible photoluminescent silicon nanoparticles and their use in biological fluorescent imaging. Journal of Nanoparticle Research 2011, 13 (1), 405-413.
25. O'Farrell, N.; Houlton, A.; Horrocks, B. R., Silicon nanoparticles: applications in cell biology and medicine. International Journal of Nanomedicine 2006, 1 (4), 451-472.
26. Wang, Q.; Bao, Y.; Ahire, J.; Chao, Y., Co-encapsulation of Biodegradable Nanoparticles with Silicon Quantum Dots and Quercetin for Monitored Delivery. Advanced Healthcare Materials 2013, 2.
27. Kirchner, C.; Liedl, T.; Kudera, S.; Pellegrino, T.; Muñoz Javier, A.; Gaub, H. E.; Stölzle, S.; Fertig, N.; Parak, W. J., Cytotoxicity of Colloidal CdSe and CdSe/ZnS Nanoparticles. Nano Letters 2004, 5 (2), 331-338.
28. Nilsson, J. R., How Cytotoxic is Zinc? A Study on Effects of Zinc on Cell Proliferation, Endocytosis, and Fine Structure of the Ciliate Tetrahymena. Acta Protozool 2003, 42, 19-29.
29. Mayne, A. H.; Bayliss, S. C.; Barr, P.; Tobin, M.; Buckberry, L. D., Biologically Interfaced Porous Silicon Devices. physica status solidi (a) 2000, 182 (1), 505-513.
30. Chen, Y.; Ji, T.; Rosenzweig, Z., Synthesis of Glyconanospheres Containing Luminescent CdSe−ZnS Quantum Dots. Nano Letters 2003, 3 (5), 581-584.
31. Moore, A.; Marecos, E.; Bogdanov, A.; Weissleder, R., Tumoral Distribution of Long-circulating Dextran-coated Iron Oxide Nanoparticles in a Rodent Model. Radiology 2000, 214 (2), 568-574.

190
32. Hu, Y.; Jiang, X.; Ding, Y.; Ge, H.; Yuan, Y.; Yang, C., Synthesis and characterization of chitosan–poly(acrylic acid) nanoparticles. Biomaterials 2002, 23 (15), 3193-3201.
33. Ahire, J. H.; Chambrier, I.; Mueller, A.; Bao, Y.; Chao, Y., Synthesis of d-Mannose Capped Silicon Nanoparticles and Their Interactions with MCF-7 Human Breast Cancerous Cells. ACS Applied Materials & Interfaces 2013, 5 (15), 7384-7391.
34. Moghimi, S. M.; Hunter, A. C.; Murray, J. C., FASEB J 2005, 19, 311-330.
35. Murdock, R. C.; Braydich-Stolle, L.; Schrand, A. M.; Schlager, J. J.; Hussain, S. M., Characterization of Nanomaterial Dispersion in Solution Prior to IN VITRO Exposure Using Dynamic Light Scattering Technique. Toxicological Sciences 2008, 101 (2), 239-253.
36. Deguchi, S.; Yamazaki, T.; Mukai, S.-a.; Usami, R.; Horikoshi, K., Stabilization of C60 Nanoparticles by Protein Adsorption and Its Implications for Toxicity Studies. Chemical Research in Toxicology 2007, 20 (6), 854-858.
37. Buford, M.; Hamilton, R.; Holian, A., A comparison of dispersing media for various engineered carbon nanoparticles. Particle and Fibre Toxicology 2007, 4 (1), 6.
38. Wick, P.; Manser, P.; Limbach, L. K.; Dettlaff-Weglikowska, U.; Krumeich, F.; Roth, S.; Stark, W. J.; Bruinink, A., The degree and kind of agglomeration affect carbon nanotube cytotoxicity. Toxicology Letters 2007, 168 (2), 121-131.
39. Sager, T. M.; Porter, D. W.; Robinson, V. A.; Lindsley, W. G.; Schwegler-Berry, D. E.; Castranova, V., Improved method to disperse nanoparticles for in vitro and in vivo investigation of toxicity. Nanotoxicology 2007, 1 (2), 118-129.
40. Foucaud, L.; Wilson, M. R.; Brown, D. M.; Stone, V., Measurement of reactive species production by nanoparticles prepared in biologically relevant media. Toxicology Letters 2007, 174 (1–3), 1-9.
41. Tseng, C.-L.; Peng, C.-L.; Huang, J.-Y.; Chen, J.-C.; Lin, F.-H., Gelatin nanoparticles as gene carriers for transgenic chicken applications. Journal of Biomaterials Applications 2013, 27 (8), 1055-1065.
42. Fako, V. E.; Furgeson, D. Y., Zebrafish as a correlative and predictive model for assessing biomaterial nanotoxicity. Advanced Drug Delivery Reviews 2009, 61 (6), 478-486.
43. dos Santos, T.; Varela, J.; Lynch, I.; Salvati, A.; Dawson, K. A., Quantitative Assessment of the Comparative Nanoparticle-Uptake Efficiency of a Range of Cell Lines. Small 2011, 7 (23), 3341-3349.
44. Chandrasekaran, S.; Tanzer, M. L.; Giniger, M. S., Characterization of oligomannoside binding to the surface of murine melanoma cells. Potential relationship to oligomannoside-initiated cell spreading. Journal of Biological Chemistry 1994, 269 (5), 3367-3373.
45. Rojo, J.; Díaz, V.; de la Fuente, J. M.; Segura, I.; Barrientos, A. G.; Riese, H. H.; Bernad, A.; Penadés, S., Gold Glyconanoparticles as New Tools in Antiadhesive Therapy. ChemBioChem 2004, 5 (3), 291-297.
46. Lee, R. T.; Myers, R. W.; Lee, Y. C., Further studies on the binding characteristics of rabbit liver galactose/N-acetylgalactosamine-specific lectin. Biochemistry 1982, 21 (24), 6292-6298.
191
47. Fricker, G., Biological Membranes and Drug Transport. In Transporters as Drug Carriers, Wiley-VCH Verlag GmbH & Co. KGaA: 2010.
48. Pascual, I.; Berjón, A.; Lostao, M. P.; Barber, A., Transport of d-galactose by the gastrointestinal tract of the locust, Locusta migratoria. Comparative Biochemistry and Physiology Part B: Biochemistry and Molecular Biology 2006, 143 (1), 20-26.
49. Pastan, I.; Willingham, M., The Pathway of Endocytosis. In Endocytosis, Pastan, I.; Willingham, M., Eds. Springer US: 1985; pp 1-44.
50. Willingham, M. C.; Pastan, I., Formation of receptosomes from plasma membrane coated pits during endocytosis: analysis by serial sections with improved membrane labeling and preservation techniques. Proceedings of the National Academy of Sciences 1983, 80 (18), 5617-5621.
51. Tjelle, T. E.; Brech, A.; Juvet, L. K.; Griffiths, G.; Berg, T., Isolation and characterization of early endosomes, late endosomes and terminal lysosomes: their role in protein degradation. Journal of Cell Science 1996, 109 (12), 2905-2914.
52. Mercer, J.; Schelhaas, M.; Helenius, A., Virus Entry by Endocytosis. Annual Review of Biochemistry 2010, 79 (1), 803-833.
53. Sofer, A.; Futerman, A. H., Cationic Amphiphilic Drugs Inhibit the Internalization of Cholera Toxin to the Golgi Apparatus and the Subsequent Elevation of Cyclic AMP. Journal of Biological Chemistry 1995, 270 (20), 12117-12122.
54. Harding, C.; Heuser, J.; Stahl, P., Receptor-mediated endocytosis of transferrin and recycling of the transferrin receptor in rat reticulocytes. The Journal of cell biology 1983, 97 (2), 329-339.
55. Silverstein, S. C.; Steinman, R. M.; Cohn, Z. A., Endocytosis. Annual Review of Biochemistry 1977, 46 (1), 669-722.

192
6 Summary and Future Prospects
Nanotechnology is an emerging multidisciplinary science, which deals with the
formation, investigation and manipulation of nano-objects (1-100 nm). Since the basis of
many different physical processes can now be controlled up to the nanometer-scale,
nanotechnology has a huge potential to revolutionize diverse fields of medicine and
engineering.
In nanotechnology, research on semiconductor nanoclusters has been greatly
focused on the properties of quantum dots (QDs); due to their unique size-range,
characteristically on the boundary between quantum mechanics and Newtonian physics,
the properties of nanoparticles differ from those of the bulk and of single atoms. Among
semiconductor QDs, SiNPs in particular have additional advantages: exceptional optical
and electronic properties such as size dependent-tunable light emission wavelengths,
intense fluorescence, resistance against photobleaching and simultaneous excitation of
multiple fluorescent colours. All these qualities make SiNPs in many respects superior
over organic dyes and fluorescent proteins that are used for bioimaging purposes so far.
SiNPs can be synthesized from a variety of methods with different sizes and
morphologies. By creating Si with nanoscale dimensions (SiNPs), it can be coaxed to
emit visible light with relatively high efficiencies. The silicon surface can be well
passivated, by synthesizing stable Si-C bonds. The methods to tailor silicon surfaces
were developed on porous and planar Si and can also be applied for the
functionalization of SiNPs surfaces. Such a coating of SiNPs could prevent surface
oxidation. A high luminescence, well-developed surface passivation principles, and a low
inherent toxicity of Si initiated the enthusiasm for the research in SiNPs.
The goals of the work described in this thesis are:
The development and optimization of methods to synthesize stable and
monodisperse SiNPs
Photophysical characterization of synthesized NPs, also in terms of their
functionalization
Exploration of their possible applications, mostly in the area of biomedicine.

193
Chapter 1 describes the general properties of semiconductor quantum dots and
SiNPs, in particular. The origin of SiNPs luminescence is described in detail, and an
overview of published methods for the synthesis and functionalization of SiNPs is given,
with a discussion of the advantages and drawbacks of each method. Moreover the
possible biomedical applications as well as cytotoxicity studies of semiconductor NPs
and SiNPs are also discussed.
Chapter 2 describes the origin and detailed methods used to synthesize porous
SiNPs from electrochemical etching. It also explains the various apparatus and research
techniques, including biological materials and cell lines, used in this thesis.
Chapter 3 describes the synthesis of stable and brightly luminescent amine-
terminated SiNPs. The surface analysis of obtained amine-terminated SiNPs was
confirmed by FTIR, NMR and XPS. The mean diameter of the crystal core of 4.6 nm was
measured by transmission electron microscopy (TEM), which is in good agreement with
the size obtained by dynamic light scattering (DLS).
The dry, amine-terminated product can be obtained from bulk silicon wafers in
less than 4 h. This represents a significant improvement over similar routine procedures
using porous silicon where times of >10 h are common. The emission quantum yield
was found to be about 22%, which is the highest reported so far for silicon. The
nanoparticles exhibited an exceptional stability over a wide pH range (4-14). They are
resistant to aging over several weeks. The in vitro cellular uptake was monitored inside
HepG2 cells, the amine-terminated SiNPs show quick accumulation in the cells
confirmed by confocal microscopy. The amine-terminated SiNPs showed no significant
cytotoxic effects toward HepG2 cells, as assessed with MTT assays.
Chapter 4 describes the first synthesis of SiNPs functionalized with
carbohydrates. In this study, stable and brightly luminescent Galactose (Gal), Mannose
(Man), Glucose (Glu) and Lactose (Lac) capped SiNPs were synthesized from amine
terminated SiNPs and corresponding pyranoside acid. The surface functionalization was
confirmed by FTIR, NMR, XPS and EDX studies. The mean diameter of the crystal core
was 5.5 nm, as measured by TEM, while the hydrodynamic diameter obtained by DLS for
Gal (11 nm), Man (15 nm), Glu (19 nm) and Lac (24 1.0 nm) capped SiNPs were
measured in water. The quantum yield (QY) of photoluminescence emission found for
gal, man, glu and lac capped SiNPs was about 16 %, 27%, 30% and 39% respectively.
This is the highest QY reported so far for SiNPs. This phenomenon was successfully
explained by photoinduced electron transfer (PET). The carbohydrate capped SiNPs

194
exhibited an exceptional stability over several weeks. Furthermore pH effect
measurements demonstrated that the obtained SiNPs were highly stable in aqueous
environments. The Man-capped SiNPs may prove to be valuable tools for further
investigating within glycobiological, biomedical and material science fields. Experiments
were carried out using Concanavalin A (ConA) as a target protein in order to prove the
hypothesis. When Man functionalized SiNPs were treated with ConA, cross-linked
aggregates were formed, as showed in TEM images as well as monitored by
photoluminescence spectroscopy (PL). Man functionalized SiNPs can target cancerous
cells. Visualization imaging of SiNPs in MCF-7 human breast cancer cells showed the
fluorescence is distributed throughout the cytoplasm of these cells.
Chapter 5 explores the possibility of using carbohydrate capped SiNPs to target
various types of cancerous cells using active receptor-mediated interaction. The stability
of carbohydrate capped SiNPs in biological environment was confirmed by DLS analysis.
The obtained data proved that the carbohydrate capped SiNPs do not form aggregation
with proteins which are present in biological media and are highly stable. The toxicity of
carbohydrate capped SiNPs was tested both in vitro and in vivo (Xenopus embryo). The
in vitro toxicity was verified by MTT assay in both cancer and non-cancer cell lines. The
carbohydrate capped SiNPs were found to be highly non-toxic up to the highest
concentration of 1000 µg/mL. The in vivo toxicity of carbohydrate capped SiNPs was
tested in Xenopus Laevis embryo. The SiNPs were found to be non-toxic for embryos up
to a certain extent and no death or morphological damage was observed. The results
were compared with control experiments of amine-terminated SiNPs which was used as
the starting material in the synthesis of carbohydrate capped SiNPs. The obtained
toxicity results in both in vivo and in vitro ascertained that the amine-terminated SiNPs
are highly toxic and their presence led to cell (in vitro) and embryo (in vivo) death. The
obtained results highlighted that SiNPs are functionalized with carbohydrate ligands
which makes them non-toxic for in vitro and in vivo studies. Conversely amine-
terminated SiNPs were shown to be poisons at similar concentration. The selective
uptake efficiency of carbohydrate capped SiNPs in various cancerous and non-cancerous
cell lines were quantified by flow cytometry analysis. The results indicated that
carbohydrate capped SiNPs internalize in the cell within 24 hours of incubation.
Moreover when compared with normal cells, the carbohydrate capped SiNPs were
found to be accumulating more in cancerous cell than in the normal cells. In order to try
and understand the internalization mechanism, cells were incubated with carbohydrate
capped SiNPs at 4°C and 37°C. The obtained data showed that carbohydrate capped

195
SiNPs kept at 4°C were not internalized in SK-Mel cells, while at 37°C all the
carbohydrate capped SiNPs were internalized into the cells as confirmed by flow
cytometry analysis. This suggests that the cellular uptake is most likely energy-
dependent or receptor mediated. The fluorescence uptake of carbohydrate capped
SiNPs was visualized by fluorescence and confocal microscopy. The NPs show quick
accumulation inside cancer cells within the cytoplasm.
6.1 Discussion and Future Prospects
The overall results described in the thesis provide a vision to understand the
properties of SiNPs. The results also provide an excellent solution to synthesize stable
and water soluble SiNPs, which show enormous possible applications in bioimaging as
well in biomedical field. It is well known that SiNPs have a low intrinsic toxicity in
various mammalian cell lines in contrast to Cd, for example. This is a huge advantage of
SiNPs when considering their application in the biomedical field. While the number of
NPs types continues to increase, studies to characterize their effects after exposure and
to address their potential toxicity are few in comparison. In order to use SiNPs into
clinical field, it is important to understand and uncover further toxicology study, like
how multiple factors such as size, shape, composition, surface coverage, stability,
concentration etc., influence the toxicity. The potential applications of SiNPs in
biomedical field are: high-resolution cellular imaging, long-term in vivo cell tracking,
tumour targeting, diagnostics, therapeutics etc. For all of these purposes it is significant
to understand the biodegradation of SiNPs in the cellular environment and also
important to study what cellular degradation SiNPs may induce. Moreover it is still
unclear what happens with the NPs once they enter the body and how they influence
various functions in cells and organism as a whole.
In order to understand and move forward, to explore the application of SiNPs
more study needs to be undertaken. The research we have stated on various cell lines
must be more systematic.
With respect to the synthesis of the SiNPs, it would be extremely useful to
extend the method to allow for larger scale production of monodisperse SiNPs of a wide
range of sizes (colours). Efforts also need to be directed towards, improving the purity
of the final product by improving the method and reducing the use of toxic chemicals.
This would provide a wider range of applications, especially in bioimaging,
where dyes emitting < 600 nm are problematic to use, since biomaterials could be

196
seriously damaged by the UV light needed for their excitation, and because auto-
fluorescence is otherwise a nearly insurmountable problem. SiNPs with significantly
higher emission wavelengths could also be used for deep-tissue imaging, as there would
be much less interference (absorption) by the surrounding biomaterial.
The use of SiNPs for bioimaging should definitely be examined and extended to a
wide variety of cell types, as each of them might display different toxicities. The
influence of the functional groups attached to SiNPs should also be examined in detail,
because this could also be a source of toxicity and not the SiNPs themselves.
In chapter 4 we have demonstrated an excellent method to synthesize
carbohydrate capped SiNPs from amine-terminated SiNPs (in chapter 3). This opens a
new door for various surface functionalizations on SiNPs using amine-terminated SiNPs
as a precursor.
The purpose of synthesizing carbohydrate capped SiNPs is to selectively target
various cancer cells. Our understanding of cancer cell functions, such as endocytosis,
cell-matrix and cell-cell communications, can be greatly enhanced by studying
carbohydrate-receptor functions as a result of carbohydrate capped SiNPs utilization. In
addition, such studies can help further understanding of specificity and ligand
optimization. However a systematic research needs to be undertaken to study the
specific cancer cell with a similar pair of normal cells. To confirm that carbohydrate
capped SiNPs can target specific cancer cell or can bind selectively to specific cancer, in
vivo study needs to be performed. At present the literature reports the selectivity of
glyco-conjugated NPs towards the detection of cancer and other types of diseases
(chapter 5).
In terms of future prospective of using carbohydrate capped SiNPs for in vivo
study to target a specific cancer and to eradicate the cancer, a drug delivery strategy
needs to be developed. In our study we correspondingly design the drug delivery system
to selectively target cancer and to eradicate the cancer. The modified drug delivery
system shown in figure 6.1 represents a simple method to synthesize encapsulated
carbohydrate functionalized SiNPs. In the course of my PhD, I synthesized the polymeric
micelle, but unfortunately due to the time limitation couldn’t proceed further. The
carbohydrate with various surface conformations with both hydrophilic and
hydrophobic ends was synthesized. The polymeric micelle was then formed by
encapsulating drugs and SiNPs, using a double emulsion method, as illustrated in Figure
6.1. Specific surface conformation will provide potential to target different kind of

197
receptors in cancerous cells and SiNPs will help to monitor the capsule inside the in vivo
system.
Figure 6.1: Schematic representation of SiNPs encapsulated mannose functionalized drug
delivery system.
Further research is important in respect of developing and examining this
micelle in both in vitro and in vivo systems. This will help to increase the understanding
about selective targeting and delivering drugs to the cancer cells.
In chapter 4 we have highlighted the corresponding study of carbohydrate
capped SiNPs mediated self-assemblies or crystals. The overall results confirm that the
crystals are from carbohydrate capped SiNPs and not from the carbohydrate alone.

198
Moreover they also indicate that the crystals are not completely driven by carbohydrate
moiety, where SiNPs act as an impurity. The crystals are actually driven by overall
carbohydrate capped SiNPs, where SiNPs possibly act as seed and assemble into the
crystal with the help of the carbohydrate moieties. Further study needs to be
undertaken to resolve the crystals and to find out the special arrangement of SiNPs
inside the crystals. Small Angle X-ray crystallography (SAXS) may help to resolve the
question, as SAXS is capable of delivering structural information of macromolecules
between 5 and 25 nm, of repeat distances in partially ordered systems.
In chapter 5 we attempted to monitor the carbohydrate capped SiNPs inside the
cells. Due to the presence of similar bonding environment inside the cells, it was difficult
to capture carbohydrate capped SiNPs inside the cells by SFTIR. Further study needs to
be undertaken to synthesize the carbohydrate capped SiNPs using a specific marker,
which successfully appears in the blank region of FTIR i.e. from 1900 cm-1 to 2700cm-1.
This could be possible by using azide functionality or C=C / triple bond containing
molecules.
Furthermore in chapter 4 SiNPs are proven to be excellent energy donors (PET).
There is a big opportunity in using them as pH sensor as well as application of this
design principle to QDs would provide an opportunity for many more QD based probes,
thereby taking advantage of their superior optical properties. Their high emission
quantum yields would make them great candidates for many other energy transfer
studies. In order to increase the energy transfer efficiency, other molecule should be
considered as acceptors.
Elucidating some of the above mentioned problems would bring SiNPs closer to
commercial applications, as there is a growing interest for their use in many different
areas. Practical applications will not come without careful research, but the
multidisciplinary nature of nanotechnology may accelerate these goals by combining the
great minds of researchers in many different fields of science.