SYNTHESIS AND CHARACTERIZATION OF POLYMERIC MAGNETIC ...
128
SYNTHESIS AND CHARACTERIZATION OF POLYMERIC MAGNETIC NANOPARTICLES LOADED BY GEMCITABINE A THESIS SUBMITTED TO THE GRADUATE SCHOOL OF NATURAL AND APPLIED SCIENCES OF MIDDLE EAST TECHNICAL UNIVERSITY BY MARYAM PARSIAN IN PARTIAL FULFILLMENT OF THE REQUIREMENTS FOR THE DEGREE OF MASTER OF SCIENCE IN BIOTECHNOLOGY SEPTEMBER 2014
Transcript of SYNTHESIS AND CHARACTERIZATION OF POLYMERIC MAGNETIC ...

SYNTHESIS AND CHARACTERIZATION OF POLYMERIC MAGNETIC
NANOPARTICLES LOADED BY GEMCITABINE
A THESIS SUBMITTED TO
THE GRADUATE SCHOOL OF NATURAL AND APPLIED SCIENCES
OF
MIDDLE EAST TECHNICAL UNIVERSITY
BY
MARYAM PARSIAN
IN PARTIAL FULFILLMENT OF THE REQUIREMENTS
FOR
THE DEGREE OF MASTER OF SCIENCE
IN
BIOTECHNOLOGY
SEPTEMBER 2014

ii

iii
Approval of the thesis:
SYNTHESIS AND CHARACTERIZATION OF POLYMERIC MAGNETIC
NANOPARTICLES LOADED BY GEMCITABINE
submitted by MARYAM PARSIAN in partial fulfillment of the requirements for the
degree of Master of Science in Biotechnology Department, Middle East
Technical University by,
Prof. Dr. Canan Özgen
Dean, Graduate School of Natural and Applied Sciences
Prof. Dr. Filiz Bengu Dilek
Head of Department, Biotechnology
Prof. Dr. Ufuk Gündüz
Supervisor, Biology Department, METU
Assoc. Prof. Aysen Tezcaner
Co-Supervisor, Engineering Sciences Department, METU
Examining Committee Members:
Assoc. Prof. Dr. Mayda Gürsel
Biology Department, METU
Prof. Dr. Ufuk Gündüz
Biology Department, METU
Assoc. Prof. Dr. Dilek Keskin
Engineering Sciences Department, METU
Assist. Prof. Dr. Serap Yalcin Azarkan
Food Engineering Department, Ahi Evran University
Dr. Pelin Mutlu
Central Laboratory, Bio and Biotech R&D Center, METU Date: 03.September.2014

iv
I hereby declare that all information in this document has been obtained and
presented in accordance with academic rules and ethical conduct. I also declare
that, as required by these rules and conduct, I have fully cited and referenced
all material and results that are not original to this work.
Name, Last name: Maryam Parsian
Signature:

v
ABSTRACT
SYNTHESIS AND CHARACTERIZATION OF POLYMERIC MAGNETIC
NANOPARTICLES LOADED BY GEMCITABINE
Parsian, Maryam
M.S., Department of Biotechnology
Supervisor: Prof. Dr. Ufuk Gündüz
Co-Supervisor: Assoc. Prof. Dr. Ayşen Tezcaner
September 2014, 110 pages
In this study, different types of magnetic nanoparticles were synthesized for
treatment of breast cancer by targeted drug delivery. Polyamidoamine (PAMAM)
dendrimer, Chitosan (CS) and Polyhydroxybutyrate (PHB) coated magnetic
nanoparticles were prepared and loaded with Gemcitabine.
The loading efficiency of drug for various half generations of dendrimer coated
magnetic nanoparticles (DcMNPs), Chitosan coated magnetic nanoparticles
(CSMNPs) and Polyhydroxybutyrate magnetic nanoparticles (PHB-MNPs) were
investigated in different solvents. The results were confirmed by spectrophotometric,
FT-IR, XPS, Zeta-potential and TEM analyses.
The release and stability of Gemcitabine from the nanoparticles at various pH were
investigated. The release studies were shown Gemcitabine release was higher at pH
4.2 compared to pH 5.2. The stability results indicated that Gemcitabine conjugated
nanoparticles were highly stable.

vi
The cytotoxicities of drug free nanoparticles and Gemcitabine loaded nanoparticles
were determined with proliferation assays (XTT) using SKBR-3 and MCF-7 cell
lines. DcMNPs, CSMNPs and PHB-MNPs were not cytotoxic by themselves. When
the drug was loaded on DCMNPs, CSMNPs and PHB-MNPs, the antiproliferative
effect of the drug increased. IC50 values of drugs remarkably decreased 6, 1.4 and 2
folds on SKBR-3 and 3, 2.6 and 2 folds on MCF-7 cell lines, when conjugated to
DcMNPs, CSMNPs and PHB-MNPs, respectively.
Considering the fact that the synthesized bare magnetic nanoparticles were not
cytotoxic and Gemcitabine loaded nanoparticles exhibited higher antiproliferative
activity than free drug in vitro, we suggested that these nanoparticles can be a
promising candidate for the development of novel targeted drug delivery systems.
Keywords: Magnetic Nanoparticle, Targeted Drug Delivery, Gemcitabine, Half
generation PAMAM Dendrimer, Chitosan, Polyhydroxybutyrate.
vii
ÖZ
GEMSİTABİN YÜKLÜ POLİMERİK MANYETİK NANOPARÇACIKLARIN
SENTEZİ VE KARAKTERİZASYONU
Parsian, Maryam
Yüksek Lisans, Biyoteknoloji Bölümü
Tez Yöneticisi: Prof. Dr. Ufuk Gündüz
Ortak Tez Yöneticisi: Doç. Dr. Ayşen Tezcaner
Eylül 2014, 110 sayfa
Bu çalışmada, ilaç hedefleme yolu ile meme kanseri tedavisi amaçlanmış ve farklı
türlerde manyetik nanoparçarcacıklar sentezlenmiştir. Poliamidoamin (PAMAM)
dendrimer, Kitosan (CS), ve Polihidroksibutirat (PHB) kaplı manyetik
nanoparçacıklar Gemsitabin ile yüklenmiştir.
Farklı tampon çözeltilerde farklı yarı jenerasyonlarda sentezlenen dendrimer
manyetik nanoparçacık (DcMNPs), kitosan manyetik nanoparçacık (CSMNPs) ve
PHB manyetik nanoparçacıklarin (PHB-MNP) etkili ilaç yüklenme miktarı
araştırılmıştır. Sonuçlar spektrofotometrik, FT-IR, XPS, Zeta-potansiyel ve TEM
analizleri ile doğrulanmıştır. Manyetik nanoparçacıklardan Gemsitabin salımı, farklı
pH larda ve nanoparçacıkların kararlılıkları incelenmiştir.
İlaç yüklü olmayan nanoparçacıkların ve ilaç yüklü nanoparçacıkların
sitotoksisiteleri SKBR-3 ve MCF-7 hücre hatlarında hücre çoğalma analizi (XTT) ile
belirlenmiştir. DcMNP, CSMNP ve PHB-MNP‟lerin hücreler üzerinde kendi

viii
başlarına toksik etkilerinin bulunmadığı, ilaç yüklü DcMNP, CSMNP ve PHB-
MNP‟lerin hücre üremesini önemli ölçüde azalttığı belirlenmiştir. İlaç yüklü
DcMNP, CSMNP ve PHB-MNP‟lerin IC50 değerlerini serbest ilaca göre SKBR-3
hücre hattında sırasıyla 6, 1.4 and 2 kat ve MCF-7 hücre hattında sırasıyla 3, 2.6 and
2 kat azalttığı görülmüştür.
Sentezlenen boş manyetik nanoparçacıkların sitotoksik olmaması ve Gemsitabin
yüklü nanoparçacıkların serbest ilaca göre daha fazla antiproliferatif etki göstermesi
göz önüne alındığında, bu nanoparçacıklar kanser tedavisinde yeni ilaç hedefleme
sistemleri için uygun birer aday olabilirler.
Anahtar Kelimeler: Manyetik nanoparçacık, İlaç hedefleme, Gemsitabin, PAMAM
Dendrimer, Kitosan, PHB

ix
To my valuable parents, my sister and brother.
x
ACKNOWLEDGEMENTS
First of all, I would like to express my deepest gratitude to my supervisor Prof. Dr.
Ufuk Gündüz for her great academic guidance, advices, support and encouragement
throughout this study. I also thank to my co-supervisor Assoc. Prof. Dr. Aysen
Tezcaner for her support and encouragement in this research.
I would like to thank Prof. Dr. Inci Eroglu, Assoc. Prof. Dr. Bora Maviş and Gokce
Avcioglu for endless support at their Laboratory. Examining committee members
Assoc. Prof. Dr. Çağdaş Son, Assoc. Prof. Dr. Dilek Keskin are also greatly
acknowledged for their kind participation and valuable comments during this
research.
I am grateful to Assist. Prof. Dr. Serap Yalçın, Dr. Pelin Mutlu and Aktan Alpsoy for
their advices, encouragement, kind and pleasant collaboration in this study.
I am deeply thankful to Negar Taghavi, Gozde Unsoy, Çağrı Urfalı, Murat Erdem,
Ayca Nabioglu,, and other members of Lab 206 for their help, friendship and
contributions throughout my study.
My time in Ankara became meaningful by my good friends and several invaluable
friendships. Special thanks to my good friends Aslan Masahi, Kevser Betul Burun,
Serhat Ozdemir and Hikmet Taner Teker for their invaluable friendship and helps
during my study and living in Turkey.
I would like to express my great appreciation to my mother Mansoreh Zargar Salehi
my father Mohammad Parsian, my sister Farzaneh Parsian and my brother Amir
Parsian for their endless love, trust and support in every step of my life. Also special
thanks for my Great nephew Ata Jodeyri Rad for his persuasion and encourage.

xi
TABLE OF CONTENTS
ABSTRACT ....…………………………………………………..…………..………....v
ÖZ…...…......………………………………………………….……….......……..…....vi
ACKNOWLEDGEMENTS.……………………………..…………….…..………….viii
TABLE OF CONTENTS..………………………………………………..……….. ….ix
LIST OF FIGURES..………………………………………………...……..……....…xiii
LIST OF TABLES………………………………….……………………….……….xviii
CHAPTERS
1 INTRODUCTION .............................................................................................. 1
1.1 Biology of Cancer ............................................................................................ 1
1.1.1 Breast Cancer ............................................................................................. 2
1.1.2 Physiopathological Characteristics of Tumor Tissues ............................... 4
1.1.2.1 Leaky Vasculature .............................................................................. 4
1.1.2.2 Enhanced Permeability and Retention Effect ..................................... 5
1.1.2.3 Acidic Tumor Microenvironment....................................................... 6
1.2 Treatment of Breast Cancer ........................................................................... 7
1.2.1 Surgery ....................................................................................................... 8
1.2.2 Hormone Therapy ...................................................................................... 8
1.2.3 Radiation Therapy...................................................................................... 9
1.2.4 Chemotherapy ............................................................................................ 9
1.2.4.1 Gemcitabine (Gemzar) ..................................................................... 10
1.2.4.2 Side Effects of Chemotherapy and Gemcitabine.............................. 13
1.2.5 Targeted Therapy ..................................................................................... 14
1.2.5.1 Tumor Specific Targeting ................................................................ 14
1.2.5.2 Targeting by Drug Delivery Systems ............................................... 15
1.3 Nanoparticles in Drug Delivery Systems..................................................... 16
1.3.1 Principal Mechanisms of Drug Targeting to Tumors .............................. 17
1.3.2 Magnetic Nanoparticles ........................................................................... 18

xii
1.4 Coating of Magnetic Nanoparticles for Drug Delivery .............................. 21
1.4.1 Dendrimers for Surface Coating of Magnetic Nanoparticles .................. 22
1.4.1.1 PAMAM Dendrimer ......................................................................... 24
1.4.1.2 Dendrimers in Biomedical Applications .......................................... 25
1.4.1.3 Interaction Between Dendrimer and Drugs ...................................... 26
1.4.2 Chitosan for Surface Coating of Magnetic Nanoparticles ....................... 27
1.4.3 Polyhydroxybutyrate (PHB) for Surface Coating of Magnetic
Nanoparticles .......................................................................................................... 29
1.5 Aim of the Study ............................................................................................ 30
2 MATERIALS AND METHODS ..................................................................... 31
2.1 Materials ........................................................................................................ 31
2.2 Methods .......................................................................................................... 32
2.2.1 Synthesis of PAMAM Coated Magnetic Nano Particles (DcMNPs) ...... 32
2.2.1.1 Preparation of Bare Magnetic Nano Particles (MNP) ...................... 32
2.2.1.2 Coating of Bare Magnetic Nanoparticles by APTS ......................... 34
2.2.1.3 Surface Coating of MNPs with PAMAM Dendrimer ...................... 35
2.2.2 Synthesis of Chitosan Coated Magnetic Nano Particles .......................... 36
2.2.3 Synthesis of PHB Coated Magnetic Nano Particles ................................ 36
2.2.4 Gemcitabine Loading, Release and Stability on DcMNPs ...................... 37
2.2.4.1 Loading of Gemcitabine on Different Half-Generation of DcMNPs37
2.2.4.2 Release of Gemcitabine from DcMNPs ........................................... 39
2.2.4.3 Stability of Gemcitabine on DcMNPs .............................................. 39
2.2.5 Gemcitabine Loading, Release property and Stability of CSMNPs ........ 40
2.2.5.1 Loading of Gemcitabine on CSMNPs .............................................. 40
2.2.5.2 Release of Gemcitabine from CSMNPs ........................................... 40
2.2.5.3 Stability of Gemcitabine on CSMNPs .............................................. 40
2.2.6 Gemcitabine Loading, Release and Stability on PHB-MNPs ................. 41
2.2.6.1 Loading of Gemcitabine on PHB ..................................................... 41
2.2.6.2 Release of Gemcitabine from PHB-MNPs ....................................... 41
2.2.6.3 Stability of Gemcitabine on PHB-MNPs ......................................... 41
2.2.7 Chemical Characterizations ..................................................................... 42
2.2.8 Cell Culture .............................................................................................. 43
2.2.8.1 Cell Lines and Culture Conditions ................................................... 43
2.2.8.2 Cell Proliferation Assay with XTT Reagent .................................... 43
3 RESULTS AND DISCUSSION ....................................................................... 45
xiii
3.1 Characterization of Half Generation of PAMAM Magnetic Nano
Particles (DcMNPs) .................................................................................................. 45
3.1.1 Analysis of PAMAM DcMNPs ............................................................... 47
3.1.1.1 TEM Analyses .................................................................................. 47
3.1.1.2 Zeta (ζ) Potential Analyses ............................................................... 48
3.1.1.3 Fourier Transform-Infrared Spectroscopy (FT-IR) .......................... 50
3.2 Gemcitabine Loading Efficiencies on various half generation of DcMNPs
…………………………………………..……………………………………51
3.2.1 Characterization of Gemcitabine Loaded G5.5 PAMAM DcMNPs ....... 53
3.2.1.1 TEM Analyses .................................................................................. 53
3.2.1.2 X-Ray Photoelectron (XPS) Analyses ............................................. 54
3.2.1.3 Fourier Transform-Infrared spectroscopy (FT-IR) ........................... 56
3.2.1.4 Zeta (ζ) Potential Analyses ............................................................... 58
3.2.2 Release and Stability Efficiencies of Gemcitabine from G5.5 PAMAM
DcMNPs ................................................................................................................. 59
3.2.2.1 Release Profiles ................................................................................ 59
3.2.2.2 Stability Efficiencies ........................................................................ 60
3.2.3 In vitro Cytotoxicity Studies of Bare and Gemcitabine Conjugated G5.5
PAMAM DcMNPs on SKBR-3 and MCF-7 Cell Lines ........................................ 61
3.3 Gemcitabine Loading Efficiencies on Chitosan Coated Magnetic
Nanoparticles (CSMNPs)......................................................................................... 65
3.3.1 Characterization of Gemcitabine Loaded CSMNPs ................................ 66
3.3.1.1 TEM Analyses .................................................................................. 66
3.3.1.2 X-ray Photoelectron (XPS) Analyses ............................................... 67
3.3.1.3 Fourier transform-infrared spectroscopy (FT-IR) ............................ 69
3.3.1.4 Zeta (ζ) Potential Analyses ............................................................... 70
3.3.2 Release and Stability Efficiencies of Gemcitabine from CSMNPs ......... 71
3.3.2.1 Release Profile .................................................................................. 71
3.3.2.2 Stability Profile ................................................................................. 73
3.3.3 In Vitro Cytotoxicity Studies of CSMNPs and Gemcitabine Loaded
CSMNPs on SKBR-3 and MCF-7 Cell Lines ........................................................ 74
3.4 Gemcitabine Loading Efficiencies on PHB Magnetic Nanoparticles
(PHB_MNPs) ............................................................................................................ 78
3.4.1 Characterization of Gemcitabine Loaded PHB-MNPs ............................ 79
3.4.1.1 TEM Analyses .................................................................................. 79
3.4.1.2 X-ray Photoelectron (XPS) Analyses ............................................... 80
3.4.1.3 Fourier Transform-Infrared Spectroscopy (FT-IR) .......................... 82
3.4.1.4 Zeta (ζ) Potential Analysis ............................................................... 83

xiv
3.4.2 Release and Stability Efficiencies of Gemcitabine from PHB-MNPs ..... 84
3.4.2.1 Release Profile .................................................................................. 84
3.4.2.2 Stability Profile ................................................................................. 85
3.4.3 In Vitro Cytotoxicity Studies of Bare and Gemcitabine Loaded PHB-
MNPs….. ................................................................................................................ 86
3.5 Summary ........................................................................................................ 90
4 CONCLUSION ................................................................................................. 91
REFERENCES ......................................................................................................... 93
APPENDIXS
ADDITIONAL ANALYSIS OF PAMAM DCMNPS ......................................... 103 A.1. Loading of Gemcitabine on Generation 4 and 7 of DcMNPs ...................... 103
A.2. PAMAM Dendrimer Synthesized with Mechanical Stirrer ......................... 104
A.3. Zeta (ζ) Potential Analysis ........................................................................... 105
A.4.Fourier Transform-Infrared spectroscopy (FT-IR) ........................................ 106
A.5. Standard curves of Gemcitabine ................................................................... 107
A.6. XTT Cell Proliferation Assay ....................................................................... 108
A.7. Light Microscopy Images of MCF-7 Cells .................................................. 109
ADDITIONAL ANALYSIS OF CSMNPS .......................................................... 110 B.1. Loading of Gemcitabine on CSMNPs .......................................................... 110

xv
LIST OF FIGURES
FIGURES
Figure 1.1. New cases of breast cancer in the USA .................................................... 2
Figure 1.2. Differences between normal (A) and tumor tissues (B) .......................... 5
Figure 1.3. Differences between healthy (A) and tumor tissues (B) ........................... 6
Figure 1.4. Treatment modalities of early stage and metastatic breast cancer ............ 7
Figure 1.5. Chemical structure of Gemcitabine ........................................................ 10
Figure 1.6. Gemcitabine metabolism, self-potentiation and mechanisms of actions 12
Figure 1.7. HER2 Targeted Therapy ......................................................................... 14
Figure 1.8. Time line of clinical stage for nanomedicine.......................................... 15
Figure 1.9. NPs and their physicochemical characteristics which affect their
performance both in vitro and in vivo ........................................................................ 16
Figure 1.10. Therapeutic strategy using magnetic particles ...................................... 18
Figure 1.11. Surface coating of magnetic nanoparticles. .......................................... 21
Figure 1.12. Schematic overview of the sub-classes of dendritic polymers family. . 22
Figure 1.13. Graphical presentation of PAMAM dendrimers from core to G7 ........ 24
Figure 1.14. Chemical structure of G2 PAMAM dendrimer. ................................... 25
Figure 1.15. The interaction between Chitosan and TPP .......................................... 28
Figure 1.16. Polyhydroxybutyrate (PHB) structure .................................................. 29
Figure 2.1. The bare MNP experimental synthesis setup. ......................................... 33
Figure 2.2. (a) G5.5 PAMAM dendrimer magnetic nanoparticle (G5.5 DcMNPs), (b)
Gemcitabine (dfdc), (c) G5.5 DcMNPs conjugated by dfdc. ..................................... 38
Figure 3.1. (A) Full generation PAMAM dendrimer, (B) Half generation PAMAM
dendrimer ................................................................................................................... 46
Figure 3.2. (A) TEM images of G5DcMNPs, (B) G5.5 DcMNPs ............................ 47
Figure 3.3. Zeta (ζ) Potential of G5 DcMNPs (A) and G5.5 DcMNPs (B) .............. 48
Figure 3.4. FT-IR spectra of the G5 DcMNPs and G5.5 DcMNPs .......................... 50
Figure 3.5. Loading efficiencies of Gemcitabine conjugated to different half-
generations for DcMNPs. ........................................................................................... 51
Figure 3.6. TEM images of G5.5 DcMNPs (A) and Gemcitabine conjugated G5.5
DcMNPs (B) .............................................................................................................. 53
Figure 3.7. XPS spectra of G5.5 DcMNPs, and Gemcitabine conjugated G5.5
DcMNPs ..................................................................................................................... 54
Figure 3.8. XPS particular Fluorine analyses of Gemcitabine conjugated DcMNPs.
.................................................................................................................................... 55
Figure 3.9. Gemcitabine FT-IR spectra .................................................................... 56

xvi
Figure 3.10. FT-IR spectra of (A) Gemcitabine conjugated G5.5 dendrimer coated
magnetic nanoparticles, (B) G5.5 dendrimer-modified magnetic nanoparticles. ...... 57
Figure 3.11. Zeta (ζ) potential graphs of Gemcitabine conjugated to G5.5 DcMNPs.
.................................................................................................................................... 58
Figure 3.12. Gemcitabine release profile of DcMNPs at pH 4.2 and pH 5.2. .......... 59
Figure 3.13. Gemcitabine release of G5.5 DcMNPs in PBS (pH 7.2) results for
stability test. ............................................................................................................... 60
Figure 3.14. Cytotoxicity of G5.5 DcMNPs on MCF-7 and SKBR-3 cell lines ...... 61
Figure 3.15. XTT cell proliferation assay of (A) Gemcitabine, (B) Gemcitabine
conjugated DcMNPs on SKBR-3 cells. ..................................................................... 63
Figure 3.16. XTT cell proliferation assay of (A) Gemcitabine, (B) Gemcitabine
conjugated DcMNPs on MCF-7 cells. ....................................................................... 64
Figure 3.17. Loading efficiencies of Gemcitabine conjugated to CSMNPs ............. 65
Figure 3.18. TEM images of CSMNPs (A) and Gem-CSMNPs (B) ........................ 66
Figure 3.19. XPS scanning spectra of CSMNPs, and Gemcitabine loaded CSMNPs.
.................................................................................................................................... 67
Figure 3.20. XPS particular fluorine analyses of Gemcitabine conjugated CSMNPs.
.................................................................................................................................... 68
Figure 3.21. FT-IR spectra of CSMNPs and Gem-CSMNPS ................................... 69
Figure 3.22. Zeta potential measurements of CSMNPs (A) and Gem-CSMNPs (B).
.................................................................................................................................... 70
Figure 3.23. Gemcitabine release profile of CSMNPs in acetate buffer at pH4.2 and
pH 5.2.. ....................................................................................................................... 71
Figure 3.24. Stability of Gemcitabine conjugated CSMNPs in PBS buffer (pH 7.2)..
.................................................................................................................................... 73
Figure 3.25. Cytotoxicity of CSMNPs on MCF-7 and SKBR-3 cell lines. .............. 74
Figure 3.26. XTT cell proliferation assay of Gemcitabine and Gemcitabine
conjugated CSMNPs on SKBR-3 cells.. .................................................................... 76
Figure 3.27. XTT cell proliferation assay of Gemcitabine and Gemcitabine
conjugated CSMNPs on MCF-7 cells. ..................................................................... 77
Figure 3.28. Loading efficiencies of Gemcitabine conjugated to PHB-MNPs ......... 78
Figure 3.29. TEM images of PHB-MNPs (A) and Gemcitabine conjugated PHB-
MNPs (B) ................................................................................................................... 79
Figure 3.30. XPS scanning spectrum of PHB-MNPs, and Gemcitabine conjugated
PHB-MNPs ................................................................................................................ 80
Figure 3.31. XPS results for Fluorine analysis of Gemcitabine conjugated PHB-
MNPs. ........................................................................................................................ 81
Figure 3.32. FT-IR results related to PHB-MNPs and Gemcitabine conjugated PHB-
MNPs ......................................................................................................................... 82

xvii
Figure 3.33. Zeta (ζ) Potential graphs of PHB-MNPs (A), and Gemcitabine
conjugated PHB-MNPS (B). ...................................................................................... 83
Figure 3.34. Gemcitabine release profile of PHB-MNPs at pH 4.2. ......................... 84
Figure 3.35. Stability of Gemcitabine loading PHB-MNPs in PBS buffer (pH 7.2). 85
Figure 3.36. Cytotoxicity of PHB-MNPs on MCF-7 and SKBR-3 cell lines ........... 86
Figure 3.37. XTT cell proliferation assay results (A) Gemcitabine, (B) Gemcitabine
loaded PHB-MNPs on SKBR-3 cells. ........................................................................ 88
Figure 3.38. XTT cell proliferation assay results (A) Gemcitabine, (B) Gemcitabine
loaded PHB-MNPs on MCF-7 cells. .......................................................................... 89
Figure A. 1. Gemcitabine conjugation efficiency of various half – generation of
PAMAM dendrimer synthesized with mechanical stirrer………………………….104
Figure A. 2. FT-IR spectra of Gemcitabine, G4.5MNP and G4.5MNPs conjugated by
7.5, 15 and 22.5 µg/ml Gemcitabine.........................................................................106
Figure A. 3. FT-IR spectra for GEM-G7.5 DcMNP. Difference between
Gemcitabine, DcMNPs and Gem-DcMNPs……………………………………….106
Figure A. 4. Standard curves of Gemcitabine in (A) PBS (pH 7.2), and acetate buffer
at (B) pH 4.2 and (C) pH 5.2………………………………………………………107
Figure A. 5. Schematic representation of MCF-7 (6x10³cells/well) cells seeded to 96
well plates and treated by bare DcMNPs, 4h after XTT regent addition to plate….108
Figure A. 6. Schematic representation of MCF-7 (6x10³cells/well) cells seeded to 96
well plates and treated by Gemcitabine conjugated DcMNPs, 4h after XTT regent
addition to plate……………………………………………………………………108
Figure A. 7. Cellular internalization of DcMNPs by light microscopy (A) MCF-7
(6x10³cells/well) cells. (B) Bare DcMNPs treated MCF-7 cells. (C) lowest drug
dose (2.5 µM) treated MCF-7 cells. (D). Highest drug dose (90 µM) treated MCF-7
cells………………………………………………………………...………….……109

xviii
LIST OF TABLES
TABLES
Table 1.1 Classification of breast cancer ..................................................................... 3
Table 1.2. Relationships between particle size distribution and removal from the
capillaries of the human vascular system (Arruebo et al. 2007). ............................... 20
Table 3.1. Loaded amounts of Gemcitabine to 2.5 mg/ml G5.5 DcMNPs on different
drug concentration. ..................................................................................................... 52
Table 3.2. Loaded amounts of Gemcitabine to 2.5 mg/ml CSMNPs using different
initial drug loading concentrations…………………………………………………..65
Table 3.3. Loaded amounts of Gemcitabine to PHB-MNPs using different initial
drug loading concentrations…………………………………………………………78
Table A. 1. Effect of initial drug concentration and solvent on encapsulation
efficiency of G4 and G7 DcMNPs at various solvents............................................103
Table A. 2 Zeta potential results for different half generations of PAMAM
number……………………………………………………………………………..105
Table B. 1. Loading efficiencies of different initial Gemcitabine loading
concentrations on 2.5 mg/ml Chitosan magnetic nanoparticles in various
solvents.....................................................................................................................110

1
CHAPTER 1
1 INTRODUCTION
1.1 Biology of Cancer
Cancer is an expression used for diseases by out-of-control cell growth that could
invade other tissues. It is the result of unregulated cell dividing. The cells divide
when they are not assumed and do not stop dividing when they are assumed and do
not die when they must. In the harmful cases, cancer cells could spread to all of the
body through the lymphatic and blood systems and arose metastases. There are over
than 100 different types of cancer. Each cancer type is classified by the organ or the
cell in which they start and initially affected (Cancer.gov 2014a).
The body can be harmed by cancer when cells divide uncontrollably and form
tumors. The grown tumor can intervene with the circulatory, digestive and nervous.
Also all body function can be modified by release of hormones from tumors (Crosta
2014). The out of control development of cancer cell take place in a multi-step
procedure. The more abnormal cells obtain new capabilities, such as release of
digestive enzymes and growth factors. The cells keep on dividing and so reduce the
function of the damaged organ. It takes many years for a tumor to reach the size that
can be diagnosed. Cancer cells do not exactly share the similar steps for
development. Development of blood vessels (angiogenesis) is the critical step for
growing a tumor which provides nutrients and transports away waste (Cancerquest
2014).
Cancer tumors can invade surrounding areas or metastasize to areas beyond the
nearby tissue. Metastatic tumors would be the most hazardous and also explain to a
lot of large proportion of cancer deaths.

2
1.1.1 Breast Cancer
Breast cancer is a heterogeneous as a disease which is seen among women and men
in the world. Two common types of breast cancer are ductal carcinoma and lobular
carcinoma. Ductal carcinoma incepts in the milk ducts, which carries milk from the
lobules to the nipple, hence, lobular carcinoma incepts in the milk glands. Ductal
carcinoma was the majority of in situ breast cancers between 2004-2008 years, which
caused about 83% of breast cancer instances (DeSantis, Siegel, and Jemal 2012).
In recent years, the occurrence and mortality of breast cancer could be seen in the
USA (Figure 1.1).
Figure 1.1. New cases of breast cancer in the USA (Cancer.gov 2014b).

3
Breast cancer classified as, HER2, luminal A and B, normal and basal subtypes due
to progesterone receptor (PR), estrogen receptor (ER) and human epidermal growth
factor receptor 2 (HER2) (Holliday et al. 2011). Each subtype has various prognosis
and treatment response. The luminal A and luminal B subtypes are ER+, are
responsive to hormone therapy. Also, luminal B and HER2 groups are HER2+ and
they are potential candidates for trastuzumab, labatinip and pertuzumab therapy
(Table 1.1) (Mohamed et al. 2013).
Table 1.1. Classification of breast cancer (Holliday et al. 2011).
Alternative treatments for breast cancer are surgery, systemic therapy and radiation
therapy. Systemic therapies cover hormonal therapies, chemotherapy and also
targeted therapies (DeSantis et al. 2012).

4
1.1.2 Physiopathological Characteristics of Tumor Tissues
1.1.2.1 Leaky Vasculature
In 1–2 mm3 sized solid tumors; diffusion is the simple way to transport nutrients and
oxygen to the center of the tumor. Cellular hypoxia begins, when tumors reach to 2
mm3 and induces angiogenesis. Angiogenesis is essential step for survival and cell
function, which involves the formation of new bloodstream from existing ones,
delivery of vital nutrients and oxygen to newly forming cells. In this manner, tumors
become capable to attain their own blood vessels (Danhier et al. 2010). The rapid
and uncontrollable dividing is the characteristic of tumor cells, which leads to
hypoxic conditions, as a result of restrictions of nutrients and oxygen within the
tumor environment. For that reason, a series of steps to the development of the
capillary tubing occurs, to be able to make new vessels. The proangiogenic growth
factors, including; basic fibroblast growth factor, vascular endothelial growth factor,
nitric oxide, prostaglandins, bradykinins, and so on, mediate this process at the tumor
site. In contrast to the normal cells, the new tumor blood supplies in this abnormal
growth condition present a tortuous structure and are disorganized, with holes
between endothelial cells, making a porous and leaky vasculature, leading to a
heightened vascular permeability to macromolecules (Egusquiaguirre et al. 2012).

5
1.1.2.2 Enhanced Permeability and Retention Effect
Reducing the lymphatic canalization and chaotic leakiness of the newly formed
tumor bloodstreams, is named enhanced permeability and retention effect (EPR).
Abnormal characteristics of the tumor blood vessels, such as; higher ratio of
proliferating endothelial cells, abnormal bottom membrane formation and pericyte
deficiency, lead the tissues to an enhanced vascular permeability (Figure1.2)
(Danhier et al. 2010).
The EPR effect is probably the most significant mechanism whereby the
macromolecules and nanoparticles can be accumulated in the tumor interstitium
(Egusquiaguirre et al. 2012).
Figure 1.2. Differences between normal (A) and tumor tissues (B) (Danhier et al.
2010).
Normal tissues comprise linear blood vessels kept up by fibroblasts and pericytes.
Macrophages, lymph vessels and collagen fibers are present in the extracellular
matrix (Figure 1.2 A). Many abnormal blood vessels with cavities and fenestrations
could be seen in tumor tissues. Also more macrophages and collagen fibers,
fibroblasts could be seen in the extracellular matrix of the tumor tissue than that of
normal tissue. Lymph vessels are missing (Figure 1.2 B).

6
1.1.2.3 Acidic Tumor Microenvironment
In addition to the EPR effect, remarkably proliferative cancer cells show a greater
metabolic ratio. To complement their needs tumor cells should receive additional
energy by glycolysis. These cells could not properly drain the waste products
because of not organized lymphatic network. Therefore, the amount of wastes and
protons concentration increases in these tissues. As a result, these generate a minor
extracellular pH than normal tissues (Figure 1.3) (Gu et al. 2007).
Figure 1.3. Differences between healthy (A) and tumor tissues (B) (Gu et al. 2007).

7
1.2 Treatment of Breast Cancer
Systemic and local therapies are the two common methods for the treatment of breast
cancer. Targeted therapy, hormone therapy, and chemotherapy are the types of
systemic therapy, which make it possible for traveling the drugs all over the body in
bloodstream to destroy cancer cells. Surgery and also radiation therapies are local
therapies hoping to treat simply at tumor site and they do not affect the whole body
(Figure 1.4) (National Cancer 2014).
Figure 1.4. Treatment modalities of early stage and metastatic breast cancer (National Cancer 2014).
8
1.2.1 Surgery
The principle of breast cancer surgery is to eliminate the cancer through the breast
and also to assess the actual stage of disease. A simple mastectomy includes removal
of the whole breast. In a modified radical mastectomy involves removal of the whole
breasts and also lymph nodes under the arm, without removing the underlying chest
wall muscle, as which has done in radical mastectomy. In a lumpectomy, just
malignant tissue along with a rim of healthy tissue is taken out. Lumpectomy is
actually accompanied by radiation therapy. The survival chance of radiation
therapies beside lumpectomy are the same as mastectomy (National Cancer Institute
2014).
1.2.2 Hormone Therapy
Estrogen encourages the development of numerous breast cancers. The positive
estrogen test women could be handed a drug, which is known as hormone therapy to
reduce estrogen levels or by blocking the consequences of estrogen on the growth of
breast cancer tissues. Toremifene (Fareston) and Tamoxifen are drugs which prevent
the binding of estrogen to breast cancer cells. They have effective range in
premenopausal and postmenopausal patients.
The mechanism of Fulvestrant is reducing the number of estrogen receptors on breast
tumors. It is usually efficacious in postmenopausal women still when the breast
cancer is not answering to tamoxifen (National Cancer 2014).

9
1.2.3 Radiation Therapy
Watching over the operation, radiation therapy is commonly given to patients to
eliminate the any leftover cancer cells. It damages cancer cells by higher energy
beams or particles leading to harm at DNA level. X-ray, Gamma ray and charged
particles are used in radiation therapy.
The external beam radiation therapy is applied to body from outside. In
brachytherapy the radioactive material is put near by the tumor site in breast tissue
(National Cancer 2014) (DeSantis et al. 2012).
1.2.4 Chemotherapy
The main benefit of chemotherapy depends on various factors, such as the size of
tumors, the actual presence of progesterone or estrogen receptors, the amount of
lymph nodes involved and the amount of HER2 protein. In most cases, it was shown
that the combinations of drugs will more effective than a single drug for cancer
treatments. Based on the combination of drugs which are used, adjuvant
chemotherapy is normally offered for 3 to 6 months.
Chemotherapy is actually effective when the cycle and full dose of drugs are
completed regularly (DeSantis et al. 2012).

10
1.2.4.1 Gemcitabine (Gemzar)
Gemcitabine (2′, 2′-diflurodeoxycytidine) is an analogue of deoxycytidine which is
structurally different, by its fluorine exchange on position 2′ of furanose ring (Figure
1.5) (Alexander et al. 2005)(Mini et al. 2006). It is potent nucleoside analogue
inducing S-phase detention and inhibiting DNA synthesis.
Figure 1.5. Chemical structure of Gemcitabine (Bildstein et al. 2011).
Gemcitabine is used as anticancer drug against several solid tumors, including
pancreatic, lung, ovarian, colon, bladder and breast cancers (Chitkara et al.
2013)(Martín-Banderas et al. 2013).
It had been initially investigated as an antiviral agent then produced as an anticancer
drug based on its impressive in vivo and in vitro anti-tumoral activity. Evidence of
the effectiveness of gemcitabine to prevent the growth of human neoplasms had been
obtained in a broad range of hematological and solid cancer cell lines, in addition to
in vivo murine solid tumors and also human tumor xenografts in nude mice (Mini et
al. 2006).

11
Due to Gemcitabine hydrophilicity it could not cross the plasma membrane
passively; therefore the therapeutic effectiveness is reduced. This inhibits a higher
payload and also prolonged drug release. Therefore, it must be transported into the
cells by nucleoside transporters (NTs), such as the human Equilibrative Nucleoside
Transporters (hENT) or human sodium gradient coupled nucleoside transporters
(Mini et al. 2006)(Bildstein et al. 2010)(Chitkara et al. 2013).
Gemcitabine is a prodrug; its mechanism of action is based on cellular uptake and
also intracellular phosphorylation. In the cytoplasm of the cell, it is converted into
biologically active form by phosphorylation. Deoxycytidine kinase (dCK)
phosphorylated gemcitabine to monophosphate (dFdCMP), and then it is changed to
gemcitabine di-(dFdCDP) and triphosphate (dFdCTP), respectively. (Figure 1.6)
Gemcitabine has several intracellular locations. Its antiproliferative action is
considered to be dependent mostly on several inhibitory steps of DNA synthesis
(Bildstein et al. 2010)(Mini et al. 2006). Gemcitabine triphosphate (dFdCTP) can
inhibit DNA polymerase and become incorporated into DNA. After its incorporation,
DNA polymerase could add only one nucleotide by into the DNA chain, which leads
to termination of chain elongation (Alexander et al. 2005)(Mini et al. 2006).
Also non-terminal position of dFdCTP in the DNA chain inhibits recognition and
restoration by DNA repair enzymes (masked chain termination). Masked termination
obviously locks the drug into DNA and the proofreading enzymes are unable to
eliminate gemcitabine from this position, which cause inhibition of DNA synthesis
and induce apoptotic cell death (Mini et al. 2006).
Inhibition of ribonucleotide reductase (RR) is the other mechanism of action of
gemcitabine, which causes a loss of competing deoxyribonucleotide pools required
for DNA synthesis (Alexander et al. 2005).

12
Figure 1.6. Gemcitabine metabolism, self-potentiation and mechanisms of actions
(Mini et al. 2006).
Inhibition of deoxycytidylate deaminase (dCMP deaminase) and cytidine
triphosphate syntheses (CTP syntheses) by dFdCTP are the other reported activities
of gemcitabine metabolites (Mini et al. 2006)(Robinson et al. 2001).
Clinical data demonstrated that patients with tumors along with a lowered expression
of hENT1 have a considerably lower survival rate following gemcitabine therapy
compared to patients with tumors that convey a higher level of hENT1. In excess of
90% Gemcitabine which have been internalized in to cells are phosphorylated to
Gemcitabine triphosphate (dFdCTP) and they generally deaminated by
deoxycytidine deaminase (dCDA) to make inactive metabolite 2′-deoxy-2′, 2′-
difluorouridine (dFdU). As a result, deamination influences the actual efficiency of
gemcitabine adversely (Lansakara-P et al. 2012)(Chitkara et al. 2013)(Sloata et al.
2011).

13
1.2.4.2 Side Effects of Chemotherapy and Gemcitabine
Chemotherapeutic drugs target the dividing cells, so they cannot identify between
healthy and cancerous cells. In many healthy cells, such as, bone marrow, hair
follicle, gastrointestinal track and reproductive track, dividing occurs as a normal
function. Toxicity and numerous side effects are noticed in these tissues and organs
by this method of treatment. In addition, at molecular level, it could also cause to the
drug resistance (Liu et al. 2014).
Genetic background of a person, period and type of treatment and also type and
dosage of drugs could cause a long term and short term effects in patients.
Many solid tumors are treated by Gemcitabine, but due to some aspects, its clinical
benefits have been limited. The short plasma half-life of Gemcitabine (less than 20
min in human plasma) after intravenous administration and rapid metabolism into
inactive form 2,2–diflurodeoxyuridine (dFdU) by cytidine deaminase, display the
main restrictions of this drug (Martín-Banderas et al. 2013). Moreover, a poor
diffusion directly into cells leads to the use of its higher doses, so it cause to major
systemic toxicity and drug resistance, which usually restricts its therapeutic
efficiency (Maksimenko et al. 2013).
Acute adverse effects of gemcitabine are (American Cancer Society 2013):
The increasing risk of infection because of reducing the number of white
blood cells in the blood.
The increasing risk of bleeding because of reducing the number of platelets in
the blood.
Anemia; decreasing number of red blood cell in the blood.
Feeling sick ; symptoms like tiredness, weakness, or shortness of breath
Nausea
Hair loss
Vomiting and loss of appetite
Fever
Swelling of the arms and legs or other parts of the body

14
1.2.5 Targeted Therapy
Targeted treatment is one of the significant concepts that has been rising for the fight
against cancer and also for avoiding the side effects of chemotherapeutic drugs
through the last few years (Sawyers 2004).
1.2.5.1 Tumor Specific Targeting
Various cell specific targeted treatments with an essential role in growth and tumor
progression, are designed to particular molecular target. In the breast cancer
treatment estrogen receptor (ER) and human epidermal growth factor receptor 2
(HER2) are actually the main targets for therapy and also drug development (Figure
1.7).
For ER+ patients, Tamoxifen, Aromatase inhibitors (AIS) and Fulvestrant are among
the hormonal targeting agents that are used. For HER2+ patients usually Lapatinib
Trastuzumab, and Pertuzuman have been used (Mohamed et al. 2013).
Figure 1.7. HER2 Targeted Therapy (cancer.gov n.d.).

15
1.2.5.2 Targeting by Drug Delivery Systems
One of the distinguished methods that have been used for targeted drug delivery is
controlled drug delivery systems (DDS), which usually combined of polymers and/or
lipids. Magnetic nanoparticles, dendrimers, polymers, carbon materials and
liposomes, are the different nanostructures, which are used as carriers in drug
delivery systems.
Figure 1.8. Time line of clinical stage for nanomedicine (Kamaly et al. 2012).
They have several positive aspects when compared with classic drug applying
methods; especially it seems the severe difference between the dose of a drug and
toxic effects. Also drug can be delivered to the cancer tissue and it cause minimizing
the side effect of the drug on undesirable tissues. It has efficient, increase on drug
accumulation in the tumor tissue; therefore, the specified doses of drugs are
decreased significantly (Wilczewska et al. 2012).

16
1.3 Nanoparticles in Drug Delivery Systems
In the last two decades, the design of nanoparticles (NPs) with specific functional
properties in therapeutics and diagnostics has gained attention for a drug delivery
system. Nanoparticles have enabled more efficient and safer drug delivery for many
drugs and help for improving the treatment of different pathologies. Their nanoscale
size, high surface area and their ability to reach the different areas of the body make
nanoparticles a promising tool for drug delivery system. Reducing the side effects of
drugs and prolonging circulation half-times are another advantages for delivery of
drugs by this system (Viota et al. 2013) (Hu et al. 2010).
1–100 nm size range of nanoparticles makes it different from bulk materials, and
therefore, have great potential for using in the chemical, biological, mechanical and
electronic industries (Inkyo et al. 2006) (Figure 1.9). Metal, metal oxide and
semiconductor nanoparticles coupled to biomolecules have recently attracted a great
interest because the resulting hybrid materials call for new applications in biological
systems (Egusquiaguirre et al. 2012).
Figure 1.9. NPs and their physicochemical characteristics which affect their
performance both in vitro and in vivo (Kamaly et al. 2012).

17
In cancer treatments, the leaky tumor vasculatures cause the better accumulation of
nanoparticles in tumor site. These benefits make therapeutic nanoparticles a
promising candidate to replace traditional chemotherapy (Viota et al. 2013).
1.3.1 Principal Mechanisms of Drug Targeting to Tumors
In the last few years, targeted NP therapeutics have shown great attention for cancer
therapy, as they lead to increased internalization of drugs and supply enhanced
efficacy and more importantly, reduced side effects and systemic toxicities. NP drug
delivery to tumor tissues consists passive, active or triggered targeting.
Passive delivery refers to nanoparticles extravasations by enhanced permeability and
retention effect through leaky tumor vascularization. The 'leaky' vascularization
refers to the EPR effect which causes to accumulation of nanoparticles and drug
within the tumor microenvironment followed by the release and diffusion of drug
through the tumor tissue. Nanocarriers show more accumulation in tumor tissues
than normal tissues because they have longer circulation times in the blood vessels
and it drives more chances for reaching the tumor area and releasing a greater
amount of drug in this area. The result is efficient anti-cancer therapy with less toxic
effect. Some nanoparticles are designed to acquire “pH-controlled response and drug
release” characteristic, due to acidic environment of the tumor (Egusquiaguirre et al.
2012; Kamaly et al. 2012). Although passive targeting has several limitations due to
lees diffusion efficiency of some drugs, also sometimes it is difficult to control the
process of delivery due to many nature approaches, beside all of these limitations
some tumors do not exhibit an EPR effect. Active and passive targeting are deeply
dependent to each other because the active targeting occurs only after accumulation
of drug in tumors after passive targeting.
Active targeting requires the use of affinity ligands to direct binding of NPs to
peptides, antigens, monoclonal antibodies which are differentially overexpressed on

18
the membrane of diseased cells or to the extracellular matrix proteins that are
differentially overexpressed in the disease tissue (Kamaly et al. 2012).
Triggered targeting is another type of drug targeting mechanism. In this method by
the help of some external stimulus such as magnetic field, hyperthermia, ultrasound,
electrical irradiation, and light nanocarriers could release their payloads
(Egusquiaguirre et al. 2012).
1.3.2 Magnetic Nanoparticles
Magnetic micro/nanoparticles ranging from micrometer to nanometer scale are being
used in an increasing number of medical and biological applications such as
magnetic resonance imaging (MRI), magnetic cell separation, enzyme and protein
immobilization, hyperthermia, RNA and DNA purification, and targeted drug
delivery systems (Douziech-Eyrolles et al. 2007). The important properties of
magnetic particles for medical applications are their nontoxicity, biocompatibility,
and high-level accumulation in the target tissue or organ (Ito et al. 2005).
Figure 1.10. Therapeutic strategy using magnetic particles (medscape.com 2014).

19
Efforts in implementing magnetic particles for medical applications are based on
their lack of toxicity, biodegradability, good biocompatibility, and absorption. In
addition, controllable sizes and targeting ability to the desired site by an external
magnetic field are the advantages of magnetic nanoparticles. Magnetic nanoparticles
provide an opportunity for the development of the next generation of focused
diagnostic and therapeutic oncological applications. MNPs deliver in manageable
sizes, which range from a few up to tens of nanometers; therefore, their particular
optimization easily matches with the interest of study. Magnetic nanoparticles could
be manipulated by an external magnetic field. This is the main advantage of MNPs.
Another tremendous advantage of MNPs is the role them in visualization, which is
used as MRI agents (Gao et al. 2009).
Different physicochemical factors control the biodistribution of drug-loaded
nanoparticles in the body, such as surface charge, the size of nanoparticles, drug
loading and release, stability, toxicity, surface hydrophobicity, hydration behavior,
molecular weight and crystallinity. Nevertheless, the destiny of magnetic
nanoparticles also depends upon the dosage and the administration route
(intravenous, pulmonary, oral, transdermal, and ocular) (Arruebo et al. 2007).
Ferrous or ferric oxide and metals such as nickel and cobalt are the main fields of
magnetic particles (Ito et al. 2005). Food and Drug Administration approved iron
oxide nanoparticles for clinical use (Wilczewska et al. 2012). Iron oxide magnetite
and maghemite occur naturally in human heart, spleen and liver, which mark their
biocompatibility and non-toxicity at a physiological concentration. In addition, easy
synthesis by alkaline co-precipitation of Fe2+
and Fe3+
, chemical stability in
physiological conditions and possibility of coating iron oxide cores with various
shells make iron oxide nanoparticles favorable for biomedical use (Ahmed et al.
2013).
Smaller MNPs could escape from opsonisation by the reticuloendothelial system and
be retained within the systemic circulation. This leads to longer circulation times of

20
these nanoparticles in the body (Table 1.2). Magnetic nanoparticles with less than 5
nm hydrodynamic diameter have short blood circulation times and rapidly
extravasate across the endothelium. MNPs around 6 nm in size go through renal
clearance and glomerular filtration. MNPs more than 8 nm in size, and with specific
surface properties such as charge and hydrophobicity, are phagocytosed by Kupffer
cells and they also undergo clearance via the biliary system (Ahmed et al. 2013).
Magnetic nanoparticles have responsive surface that can be readily modified with
biocompatible coatings and loaded with drugs (Sun et al. 2008)(Nune et al. 2009).
These magnetic nanoparticles are generally composed of magnetite (Fe3O4) core and
a polymeric shell where the drugs, nucleic acids, and proteins are bound. The
polymeric shells such as dendrimers, dextran, PEG, PLGA, PHB and chitosan must
have active groups for conjugation to biomolecules.
Table 1.2. Relationships between particle size distribution and removal from the
capillaries of the human vascular system (Arruebo et al. 2007).
21
1.4 Coating of Magnetic Nanoparticles for Drug Delivery
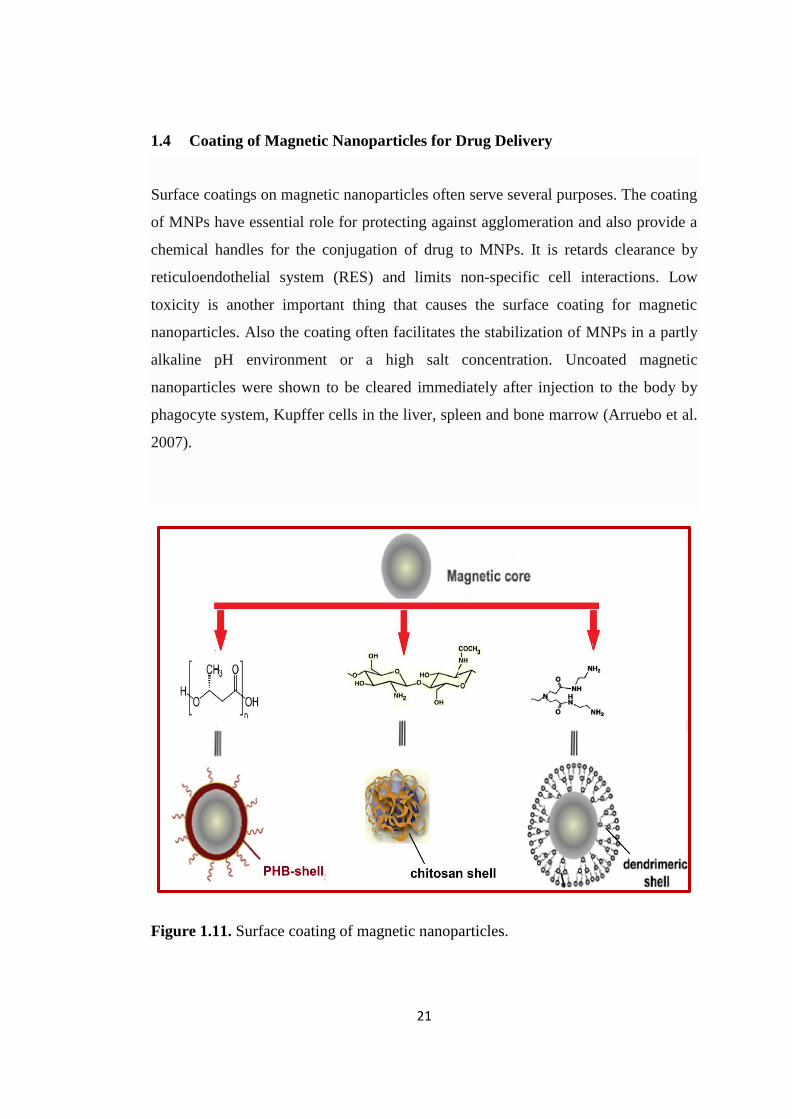
Surface coatings on magnetic nanoparticles often serve several purposes. The coating
of MNPs have essential role for protecting against agglomeration and also provide a
chemical handles for the conjugation of drug to MNPs. It is retards clearance by
reticuloendothelial system (RES) and limits non-specific cell interactions. Low
toxicity is another important thing that causes the surface coating for magnetic
nanoparticles. Also the coating often facilitates the stabilization of MNPs in a partly
alkaline pH environment or a high salt concentration. Uncoated magnetic
nanoparticles were shown to be cleared immediately after injection to the body by
phagocyte system, Kupffer cells in the liver, spleen and bone marrow (Arruebo et al.
2007).
Figure 1.11. Surface coating of magnetic nanoparticles.

22
Many different coating materials can be used for preventing of nanoparticles
opsonization and permitting a longer circulation time. Various kinds of polymers,
dendrimers and chitosan have been used for coating of magnetic iron oxide
nanoparticles (Figure 1.11).
Loading of a drug with MNPs may be achieved by electrostatic interactions, covalent
binding, adsorption, or encapsulation process. Targeting of drug-MNP conjugates to
diseased tissues can be carried out by passive or active mechanism depending on
their size and surface chemistry (Wilczewska et al. 2012).
1.4.1 Dendrimers for Surface Coating of Magnetic Nanoparticles
In the 1830's, synthetic polymers were introduced as macromolecules that had been
typically synthesized with a cascade of chemical reactions of monomers. Those
linear polymers had been focused by traditional chemistry and technology. Starting
point for the synthesis of dendritic polymers was the synthesized a branched
polypropylene-amine "cascade molecules" that were generated through repetitive
monomers by Vogtle et al. in 1978 (Walter et al. 2012).
Figure 1.12. Schematic overview of the sub-classes of dendritic polymers family.
(Walter et al. 2012).
23
Dendrimers are new classes of spherical and highly branched polymeric
macromolecules introduced by Tomalia et al. as a monodisperse poly(amidoamine),
(PAMAM), and by Newkome et al. as a poly(etheramide) araborols at the end of
1980's (Walter et al.2012).
The dendrimers demonstrate an exponential increase of surface groups as a purpose
of generation. The molecular weight of the dendrimer nearly doubles with each
additional generation, though the volume of the sphere improves with the cube of the
generation. Numerous functional groups, dendrons, from center to arms give nearly-
perfect 3D geometric structure in nanometer size range. These characteristics supply
a high degree of functionality and wide variety of skills to dendrimers (Shcharbin et
al. 2009).
Dendrimers possess three components: an initiator core (G0), interior layers
(branches), and exterior (terminal functional groups). The polyfunctional initiator
core is in the heart of the molecule, and interior layers composed of repeating units
which extend outward from it. The monomers attached to the G0, are called first
generation monomers (G1) and repeating generation monomers are attached to the
previous generation monomers (Bharali et al. 2009). The chemistry of the terminal
functional groups provides many of the special properties of dendrimers such as
solubility and reactivity. In addition, terminal groups can be modified to get both a
charged (cationic or anionic), and hydrophilic or lipophilic properties for the ideal
biological and drug delivery applications (Majoros et al. 2003).
The structure of dendrimers offers various advantages over other architectural forms
of polymers which used in drug delivery systems. They can be synthesized and
designed for specific applications. They have narrow polydispersity; they are in the
nanometer size range from 1 to 100 nm, which allows less susceptible for RES
uptake; host–guest chemistry can take place either in the interior for drug entrapment
or on the terminal groups of the dendrimer for drug adsorption (Pan et al. 2005; Jain
et al. 2010).

24
Polyamidoamine (PAMAM), polyethyleneimine, polyarylether and
polypropyleneimine are samples of dendrimers that have been investigated for
biopharmaceutical applications.
1.4.1.1 PAMAM Dendrimer
Poly-amidoamine (PAMAM) dendrimer is a well-defined, special three-dimensional
structure and has a multivalent surface and internal cavities that can play an
important role in drug delivery systems suitable. Several experiments indicated that
higher transfection efficiency and lower toxicity can be obtained by using completion
of DNA with PAMAM, as well as for the completion between siRNA and PAMAM
dendrimers (Jain et al. 2010)(Vasumathi et al. 2010).
PAMAM synthesized by the divergent method starting from an ethylenediamine
interior core and an amidoamine repeat branches. They can be synthesized in a
diversity of molecular weights. Their surface functionality and size are explained by
Figure 1.13. Graphical presentation of PAMAM dendrimers from core to G7
(Svenson et al. 2005).

25
the number of monomeric units added dendrimers at different generations are
obtained (up to generation 109
) (Boas et al. 2006) (Figure 1.13).
Their great monodispersity, bioavailability and biocompatibility make PAMAM
dendrimers excellent candidates for drug delivery (Taghavi Pourianazar et al. 2014).
Despite these advantages, it is usually necessary to change the surface cationic amine
groups of dendrimers to avoid the toxicity and liver (Gillies et al. 2005).
1.4.1.2 Dendrimers in Biomedical Applications
PAMAM dendrimers are water-soluble and they are the only type of dendrimer that
are mono-dispersed. In these dendrimers charge denseness is high and the surface of
molecules limits this charge. The synthesis of PAMAM can be carried out due to the
need for a cationic or anionic surface charge. Full generations such as 1, 2, have
cationic amine surface charge; while half generations such as 1.5, 2.5. etc., have
anionic carboxylic acid groups at the surface (Figure 1.14) (Pan et al. 2005).
Masking the cationic charge of dendrimers and converting them into biocompatible
and less toxic dendrimers surface engineering is a rewarding strategy (Yang et al.
2012). PEGylation, folate, acetylation, peptide, and carbohydrate conjugation or by
introducing anionic charge such as half-generation dendrimers are the engineering
methods to neutralize the charge of PAMAM dendrimers (Taghavi Pourianazar et al.
2014). Previously Jin et el performed a surface modification with diethylenetriamine
by a amidation reaction of PAMAM (G3.5) dendrimer resulting in a 1,2-
diaminoethane surface. They depicted that DNA delivery could be increased by
appropriate modification and amine surface structure changing of PAMAM
dendrimers (Jin et al. 2011).

26
Figure 1.14. chemical structure of G2 PAMAM dendrimer. The representative structure of the surface modified dendrimers: (A) amine-, (B) carboxyl-,
and (C) acetyl-terminated dendrimers (Yang et al. 2012).
1.4.1.3 Interaction Between Dendrimer and Drugs
The perfectly branched structures and external surfaces of dendrimers have been
assembled a potential sites for encapsulation and interaction with drugs. The loading
capacity of the drug extremely depends on the surface group of dendrimers. Large
numbers of ionisable groups, which increases two fold with each generation, on the
surface of dendrimer provides an opportunity for electrostatic interaction with drugs.
Electrostatic interaction can occur between the anionic carboxyl end groups of the
dendrimers and the cationic amine groups of the drugs, or vice versa between the
cationic amine group of dendrimers and carboxyl or hydroxyl groups of drugs
(Figure 2.2 C) (Garg et al. 2011). Hydrolyzable and biodegradable linkage in
covalent attachment of drug and surface groups of the dendrimers provide the
opportunity for drug release control. Host and guest interaction causes to
dramatically an increase in the encapsulation of drug between branches (Garg et al.
2011)(Jain et al. 2010)(Pan et al. 2005).

27
1.4.2 Chitosan for Surface Coating of Magnetic Nanoparticles
Recently, there has been an increasing attention to use nanoparticles for drug
deliveries particularly in cancer treatment. Tumor-specific targeted delivery of
anticancer drugs will reduce systemic toxicity and, hence, increase the efficacy of the
drug and decrease side effects. Among the various drug delivery systems, chitosan
has gained considerable attention due to its biocompatibility, biodegradability, and
non-toxicity.
Chitosan is a polycationic natural linear polysaccharide which is achieved by partial
N-deacetylation of chitin and it plays an important role in controlling the proteins,
peptides and release of drugs. The solubility and cationic character on one side, and
biodegradability and mucoadhesivity on the other side make chitosan very attractive
for biological applications. It has been examined greatly in the pharmaceutical
industries for its outstanding potential in the evolution of drug delivery systems.
Chitosan has been extensively investigated for biological and medical applications
such as drug delivery systems, tissue engineering, wound healing, agricultural
industries and magnetic nanoparticles coatings. The degradation products of chitosan
are nontoxic, nonimmunogenic, and noncarcinogenic (Ibezim et al. 2011).
The solubility of chitosan salts in water depends on the degree of deacetylation and
the pH of the solution. In this regard, highly deacetylated chitosan (85%) is readily
soluble in solutions of pH up to 6.5, but as the deacetylation degree decreases, the
solubilization becomes more difficult (Cho et al. 2000).
Chitosan promotes cross linkage with sodium tripolyphosphate (TPP) anions to
provide an effective mesh work for entrapment of the drugs. To increase the
magnetic nanoparticles conjugation efficiency and for targeting the drug or
antibodies to the specific tissues, chitosan coated MNPs had been synthesized (Arya
et al. 2011).

28
Figure 1.15. The interaction between Chitosan and TPP (Unsoy et al. 2012).
Likeness other polymers, the chitosan molecules contain a number of free amine
groups, which allow binding of many agents such as; drugs, antibodies, DNA.
Chitosan has been used in binding and delivering DNA to cells for transfection,
while chitosan magnetic nanoparticles are unable to bind and deliver DNA (Kievit et
al. 2009)(Arya et al. 2011).
Recently synthesized nanocarriers, composed of a magnetite core and chitosan
coating was synthesized in this study. The aim of using the magnetic core is to
actively target the drug loaded nanoparticles to the tumor site by an externally
applied magnetic field.

29
1.4.3 Polyhydroxybutyrate (PHB) for Surface Coating of Magnetic
Nanoparticles
There are many different biodegradable synthetic and natural polymers used for
coating of nanoparticle such as dendrimers, chitosan, polyesters such as
polylacticacid and polyhydroxybutyrate. In this study polyhydroxybutyrate (PHB)
which belongs to Polyhydroxyalkanoates (PHAs) family is used as a coating polymer
(Yalcin et al. 2014).
Polyhydroxybutyrate (PHB) is a linear biodegradable biopolymer that has been
widely used in biomedical applications. PHB is naturally produced by a variety of
microorganisms. In PHB commercially production many cheap substrates such as
cane and beet molasses, ethanol, methanol and starch have been used. Nonetheless, it
is commonly nontoxic, because it is degraded to end products (CO2 and H2O) which
are naturally occurring in human body (Chaijamrus et al. 2008)(Larsson et al. 2014).
PHB is used as a storage polymer in microorganisms due to excess carbon and
energy sources and also under the environmental stress conditions such as nutrient,
phosphorus, nitrogen and oxygen limitations (Althuri et al. 2013). PHB can be
degraded to carbon and energy sources when the sources of limiting nutrient is
restored (Choi et al. 1999). PHAs and PHB are beneficial candidates for use in nerve
scaffolding and bone tissue engineering and drug delivery systems. They possess all
the properties required for these systems (Piddubnyak et al. 2004).
Figure 1.16. Polyhydroxybutyrate (PHB) structure.

30
1.5 Aim of the Study
The aim of this study was to obtain an effective targeted delivery system for
Gemcitabine by using PAMAM dendrimer, Chitosan and Polyhydroxybutyrate
(PHB) coated magnetic nanoparticles (MNPs).
Gemcitabine were conjugated onto different half-generations of synthesized
PAMAM dendrimer, chitosan and PHB coated magnetic nanoparticles. The loading
efficiency, surface and conjugation characters, release and stability profiles of
Gemcitabine loaded magnetic nanoparticles as well as their antiproliferative effect on
SKBR-3 and MCF-7 cells were investigated.

31
CHAPTER 2
2 MATERIALS AND METHODS
2.1 Materials
Iron (II) chloride tetrahydrate (FeCl2.4H2O), iron (III) chloride hexahydrate
(FeCl3.6H2O), 3-aminopropyl trimethoxysilane (APTS) [NH2 (CH2)3-Si-(OCH3)3],
ethanol, methanol, methyl acrylate, ethylene di amine, phosphate buffer saline (PBS),
dimethylsulfoxide (DMSO), Chitosan (LMW, 85% deacetylated),
polyhdroxybutyrate (PHB), and Gemcitabine hydrochloride, were purchased from
Sigma-Aldrich (U.S.A).
Sodium tripolyphosphate (TPP, Sigma-Aldrich Chemie GmbH, Germany) was
provided by Assoc. Prof. Dr. Ayşen TEZCANER‟s Lab.
Acetic acid (CH3COOH), ammonium hydroxide solution (32%, NH4OH) was
obtained from Merck (Germany). Nitrogen gas was provided from Asya Gaz
(Turkey).
Trypsin-EDTA, gentamycin sulphate, trypan blue and XTT cell proliferation kit were
purchased from Biological Industries, Israel.
MCF-7 cells were provided by SAP Institute (Ankara, Turkey) and SKBR-3 was
donated by Assoc. Prof. Dr. Rengul Atalay, Bilkent University. The cells were grown
in RPMI 1640 medium supplemented with 10% heat-inactivated fetal bovine serum,
1% L-glutamine, 1% gentamicin (Biological Industries, Israel) and maintained at
37oC in a humidified air atmosphere with 5% CO2.

32
2.2 Methods
2.2.1 Synthesis of PAMAM Coated Magnetic Nano Particles (DcMNPs)
2.2.1.1 Preparation of Bare Magnetic Nano Particles (MNP)
In recent years, many different methods were used to synthesize magnetic
nanoparticles (Gupta et al. 2005). Co-precipitation is one of them that was used in
this study. Because of spherical shape and small size (10-15 nm) MNPs are mostly
used in biomedical applications (Gao et al. 2009)(Khodadust et al. 2013)
Under nitrogen environment and mixing with a mechanical stirrer (Heildolf RZR
2021, Germany), Fe (II) and Fe (III) salts (by 1:2 ratios) were dissolved in 150 ml
distilled water and heated until 90oC (Figure 2.1). After 1 hour, ammonia hydroxide
solution was added to the system dropwise for the next 2 hours. Obtained black
precipitate was washed by distilled water and then by ethanol (Khodadust et al.
2013).
The chemical reaction for MNPs is given below:
Fe2+ + 2Fe3
+ + 8OH
- → Fe3O4 + 4H2O Equation 2.1

33
Figure 2.1. The bare MNP experimental synthesis setup.
Magnetic iron oxide synthesis in balloon which placed in mantle (90 oC) and stirred
by mechanical stirrer (2000 rpm). Cooling, temperature and nitrogen gas probes
were attached to fine necked balloon. Ammonia solution pumped by a peristaltic
pump within the balloon.

34
2.2.1.2 Coating of Bare Magnetic Nanoparticles by APTS
The agglomeration was the main problem of bare nanoparticles due to Van der Waals
forces between the nanoparticles. For preventing this problem, bare MNPs were
coated with 3-aminopropyl trimethoxysilane (APTS). For obtaining APTS coated G0
MNPs, 10 ml 3-aminopropyl trimethoxysilane was added to MNPs with sonication
(Bandelin Sonopuls Ultrasonic Homogenizer HD 2200, Berlin, Germany). The
process was continued by stirring the solution at 2000 rpm for 15 hours at room
temperature. The black precipitate was washed by ethanol several times by the help
of magnetic field (Gao et al. 2009)(Khodadust et al. 2013).
Previously characterization of the bare and APTS-modified MNPs were performed
in our lab by transmission electron microscopy (TEM), X-ray diffraction (XRD),
Fourier transform infrared spectroscopy (FT-IR), dynamic light scattering (DLS),
thermal gravimetric analysis (TGA), X-ray photoelectron spectroscopy (XPS), and
vibrating sample magnetometer (VSM) analyses (Khodadust et al. 2013).
35
2.2.1.3 Surface Coating of MNPs with PAMAM Dendrimer
Divergent synthesis was initially applied in the synthesis of PAMAM dendrimers. To
be able to synthesize a PAMAM dendrimer, a two-step series should be repeated.
The first step produces a half generation, starting with a Michael addition of methyl
acrylate which followed by amidation with ethylenediamine to complete the full
generation (Taghavi Pourianazar et al. 2014). The first step started by adding
methylacrylate methanol solution (20%, v/v) to the G0 DCMNPs, and mixed at room
temperature for 7 h by ultrasonic water bath or mechanical stirrer. The obtained
G0.5 DcMNPs were separated by the help of magnetic decantation and washed with
methanol. The second step for completing the full generation started by adding the
ethylenediamine-methanol solution (50%, v/v) and suspension was mixed for
additional 3 hours. The obtained G1 DcMNPs were separated by magnetic
decantation and washed several times with methanol. The stepwise growth of
dendrimers was repeated until the desired numbers of generations were achieved
(Gomez et al. 2009)(Yang et al. 2012)(Khodadust et al. 2013). For achieving the
half-generation of PAMAM (DcMNPs), after synthesis the desired generation of
PAMAM dendrimer, methylacrylate solution was added to particles for additional 7
hours. By this method the end group of PAMAM becomes anionic carboxyl group
(Figure 2.2a).

36
2.2.2 Synthesis of Chitosan Coated Magnetic Nano Particles
Precipitation of Fe(II) and Fe(III) salts in the presence of chitosan and TPP
molecules was used to in situ synthesize of Chitosan coated magnetic iron oxide
nano particles. Under nitrogen condition with mixing by a mechanical stirrer
(Heildolf RZR 2021, Germany), iron salts (1:2 ratios) dissolved in 30 ml of 0.5%
chitosan solution, in which 0.15 g chitosan was dissolved in 30 ml of 1% acetic acid
and pH was adjusted to 4.8 by NaOH (10 M). 10 ml of 7.5% TPP, used for cross-
linking of low molecular weight chitosan and 25 ml NH4OH (32%), were added
slowly to the solution to produce smaller sized chitosan coated magnetic
nanoparticles (CSMNPs). The solution was stirred for an additional 1 hour at room
temperature. The synthesized CSMNPs were extensively washed with deionized
water and methanol for several times and separated by the help of magnetic field
(Unsoy et al. 2012).
2.2.3 Synthesis of PHB Coated Magnetic Nano Particles
Previously Xiong et al. synthesized PHB coated MNPs by the co-precipitation
method (Xiong et al. 2010). Under nitrogen (N2) gas flow and stirring at 2500 rpm,
iron oxide II (1.34 g) and iron (III) (3.40 g) salts were dissolved in 30 ml of 1 % PHB
solution. Then ammonium hydroxide was added slowly by the help of the peristaltic
pump. The solution was stirred for more 2h at room temperature. The colloidal PHB-
MNPs were washed with ethanol and then with methanol for several times (Yalçın et
al., 2014).

37
2.2.4 Gemcitabine Loading, Release and Stability on DcMNPs
2.2.4.1 Loading of Gemcitabine on Different Half-Generation of DcMNPs
In this study, G4.5, G5.5, G6.5, G7.5 DcMNPs (2.5 mg/ml) and various amount of
Gemcitabine in methanol solution were incubated on rotator (10 rpm with five-
second vibration intervals) for 24h at room temperature while being protected from
light (Figure. 2.2 c). After the incubation period, Gemcitabine-conjugated DcMNPs
were separated by magnetic field and conjugation efficiency was quantified by
measuring the absorbance of the supernatant at 269 nm by a UV spectrophotometer
(Multiskan GO, Thermo Scientific). The amount of Gemcitabine was calculated with
the help of standard solution. (Equation 2.2) The conjugation of maximum
Gemcitabine to G5.5 DcMNPs was confirmed by FT-IR, XPS and Z-potential
analysis.
( )
Equation 2.2
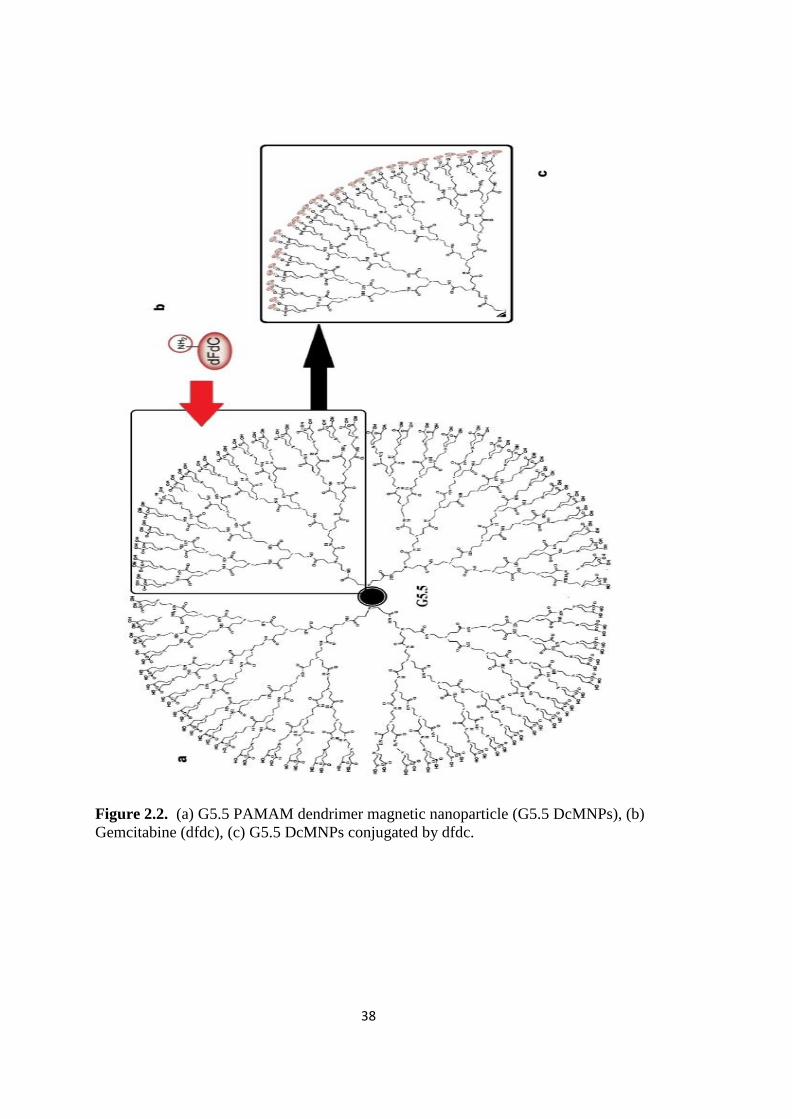
38
Figure 2.2. (a) G5.5 PAMAM dendrimer magnetic nanoparticle (G5.5 DcMNPs), (b)
Gemcitabine (dfdc), (c) G5.5 DcMNPs conjugated by dfdc.

39
2.2.4.2 Release of Gemcitabine from DcMNPs
The release of Gemcitabine (6.47 - 6.62 µg/ml) from G5.5 DcMNPs (2.5 mg/ml) was
analyzed in acetate buffer at 4.2 and 5.2 pH value for 24 h. The amount of released
Gemcitabine was determined by measuring the absorbance of the supernatant at 269
nm using acetate buffer standard curve (Appendix A. Figure A.4B,C).
2.2.4.3 Stability of Gemcitabine on DcMNPs
The stability of G5.5 DcMNPs loaded with the highest amounts of Gemcitabine
(6.57 µg/ml) was perused in PBS buffer (pH 7.2) up to 6 weeks at 37ºC. The release
of Gemcitabine from magnetic nanoparticles in PBS buffer was determined by
spectrophotometric measurements at 269 nm by using standard curve constructed
with different concentrations of Gemcitabine in PBS buffer (Appendix A. Figure
A.4, A).

40
2.2.5 Gemcitabine Loading, Release property and Stability of CSMNPs
2.2.5.1 Loading of Gemcitabine on CSMNPs
Gemcitabine loading on CSMNPs (2.5 mg/ml) was performed in methanol with
different drug concentrations in order to obtain the highest drug loading efficiency.
The mixture of CSMNPs and Gemcitabine in methanol was rotated (Biosan Multi
RS-60 Rotator) at 90 rpm with 5 seconds vibration intervals for 24 hours in the light
protected tubes at room temperature. After 24h, Gemcitabine conjugated CSMNPs
was quantified by determining drug concentration in the supernatant. The amount of
Gemcitabine was found by measuring absorbance at 269 nm and determining the
concentration with the help standard solution (Equation 2.2). The loading of
Gemcitabine to CSMNPs was confirmed by FT-IR, XPS and Z-potential analyses.
2.2.5.2 Release of Gemcitabine from CSMNPs
The release of Gemcitabine (8.65 µg/ml) from CSMNPs (2.5 mg/ml) was studied in
acetate buffers at pH 4.2 and 5.2 for 24 h. The amount of released Gemcitabine was
determined by measuring the absorbance of the supernatant at 269 nm by using the
calibration curve constricted (Appendix A. Figure A.4.B,C).
2.2.5.3 Stability of Gemcitabine on CSMNPs
The stability of CSMNPs loaded with the highest amounts of Gemcitabine (9.1
µg/ml) was determined in PBS buffer (pH 7.2) up to 72h at 37ºC. The release of
Gemcitabine from nanoparticles in PBS buffer was measured by a UV
spectrophotometer at 269 nm.

41
2.2.6 Gemcitabine Loading, Release and Stability on PHB-MNPs
2.2.6.1 Loading of Gemcitabine on PHB
The different drug concentrations of Gemcitabine were conjugated on PHB-MNPs
(2.5 mg/ml) in methanol for 24h to obtain the highest drug loading efficiency. The
solution was rotated (Biosan Multi RS-60 Rotator) at 90 rpm with 5 seconds
vibration intervals in the light protected tubes at room temperature. Gemcitabine
conjugated PHB-MNPs was quantified by measuring the absorbance of supernatant
at 269 nm. The amount of Gemcitabine was calculated with the help of standard
solution (Equation 2.2). The loading of maximum Gemcitabine to PHB-MNPs was
confirmed by FT-IR, XPS and Z-potential analyses.
2.2.6.2 Release of Gemcitabine from PHB-MNPs
The release of Gemcitabine (6.5 µg/ml) from PHB-MNPs (2.5 mg/ml) was studied in
acetate buffer at 4.2 pH value for 24 h. The amount of released Gemcitabine was
determined by measuring the absorbance of the supernatant at 269 nm.
2.2.6.3 Stability of Gemcitabine on PHB-MNPs
The stability of PHB-MNPs loaded with the highest amounts of Gemcitabine (6.4
µg/ml) was determined in PBS buffer (pH 7.2) up to 36h at 37ºC. The release of
Gemcitabine from nanoparticles in PBS buffer was determined by measuring
absorbance at 269 nm.

42
2.2.7 Chemical Characterizations
Previously, Khodadust et al. performed the characterizations of full generation
dendrimer coated MNPs (Khodadust et al. 2013). Characterization and comparison
of half-generation PAMAM dendrimers with full generation and Gemcitabine
conjugated half-generation DcMNPs were done by Fourier Transform Infrared (FT-
IR) Spectroscopy, Transmission Electron Microscopy (TEM), X-Ray Diffraction
spectroscopy (XPS) and Zeta-Potential analyses.
The same analyses were also performed for chitosan coated magnetic nanoparticles
(DCMNPs) and PHB coated magnetic nanoparticles before and after loadings by
Gemcitabine, too. The Fourier Transform Infrared Spectroscopy analyses were
performed in Hacettepe University and METU Central Laboratory. The
Transmission Electron Microscopy, X-Ray Diffraction spectroscopy and Zeta-
Potential measurements were carried in METU Central Laboratory.

43
2.2.8 Cell Culture
2.2.8.1 Cell Lines and Culture Conditions
MCF-7 and SKBR-3 human breast cancer cell lines were grown in RPMI 1640
medium (Biochrom AG, Berlin), supplemented with 10% (v/v) fetal bovine serum
(FBS) (Biochrom AG, Berlin) and 10% (w/v) gentamicin (Biological Industries,
Israel).
Cells were cultured under sterile laminar flow (BioAir, Italy), cells were seeded in
cell culture dishes and were passaged by using trypsin-EDTA (1 ml for 75cm2
culture flasks) when cell growth reached 80% confluency. The cells were passaged at
a 1:3 ratio and incubated at 37°C in a humidified atmosphere with 5% CO2, in
incubator (Heraeus, Germany).
2.2.8.2 Cell Proliferation Assay with XTT Reagent
Cytotoxicity of bare DcMNPs, CSMNPs, PHB-MNPs and Gemcitabine conjugated
nanoparticles was determined by using XTT cell proliferation assay kit. SKBR-3 and
MCF-7 (6x10³cells/well) cells were seeded to 96 well plates at 37°C. Cells that were
exposed to free MNPs, Gemcitabine and Gemcitabine conjugated nanoparticles were
incubated for 72 h at 37°C. Viability of cells was determined by XTT assay and 50%
viability of treated cells was calculated from the relative viability curves for which
the viability of the untreated control cells was taken as 100%.

44

45
CHAPTER 3
3 RESULTS AND DISCUSSION
3.1 Characterization of Half Generation of PAMAM Magnetic Nano Particles
(DcMNPs)
Poly(amidoamine) (PAMAM) dendrimers play an important role in drug delivery
systems, because of their special three-dimensional architecture, presence of internal
cavities and multifunctional surface (Jain et al. 2010). Their great monodispersity,
bioavailability and biocompatibility make PAMAM dendrimers excellent candidates
for drug delivery (Taghavi Pourianazar et al. 2014). Despite these advantages, it is
generally necessary to modify the surface amine groups of these dendrimers to avoid
the toxicity and liver accumulation associated with their polycationic surfaces
(Gillies et al. 2005). For masking the cationic charge of dendrimers and convert them
into biocompatible and less toxic dendrimers surface engineering is a rewarding
strategy (Yang et al. 2012). Previously, Jin et al. performed a surface modification
with diethylenetriamine by an amidation reaction of PAMAM (G3.5) dendrimer
resulting in a 1, 2- diaminoethane surface. They depicted that DNA delivery could be
increased by appropriate modification and amine surface structure changing of
PAMAM dendrimers (Figure 3.1) (Jin et al. 2011).
Recently, characterizations of full generation dendrimer coated MNPs were
performed (Khodadust et al. 2013). Amine end group of full generation PAMAM
prevented the conjugation of our drug, therefore half generation of PAMAM
dendrimers having free carboxyl group were used in this study. Loading studies
demonstrated that generation 5.5 had the best conjugation efficiency. Therefore
generation 5.5 DcMNPs were used for further analysis in this study.
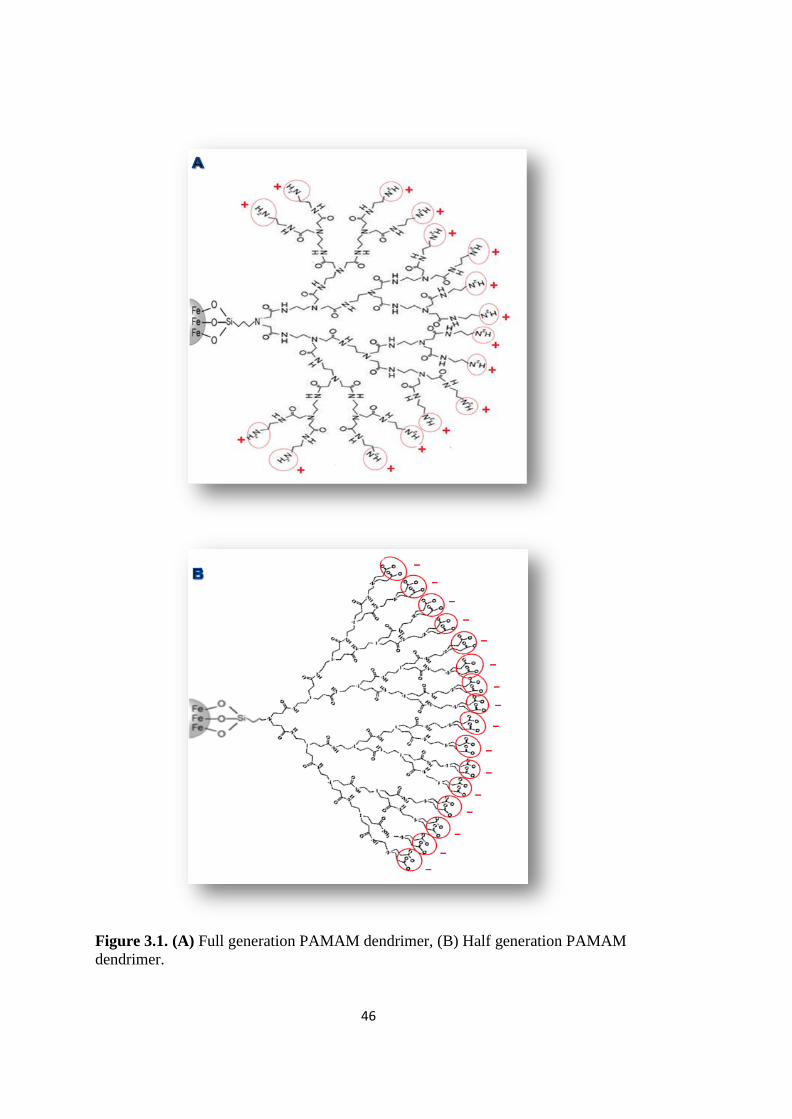
46
Figure 3.1. (A) Full generation PAMAM dendrimer, (B) Half generation PAMAM
dendrimer.

47
3.1.1 Analysis of PAMAM DcMNPs
3.1.1.1 TEM Analyses
The morphology and size of synthesized full and half generations of PAMAM
magnetic nanoparticles have been examined with TEM in this study. TEM images of
G5DcMNPs and G5.5 DcMNPs are shown in Figure 3.2. However, there were no
significant differences between the sizes and shapes of full and half generations of
dendrimeric nanoparticles. The average diameters of G5DcMNPs and G5.5 DcMNPs
were around 12 nm and almost 13-14 nm, respectively.
Figure 3.2. (A) TEM images of G5DcMNPs, (B) G5.5 DcMNPs.
B A
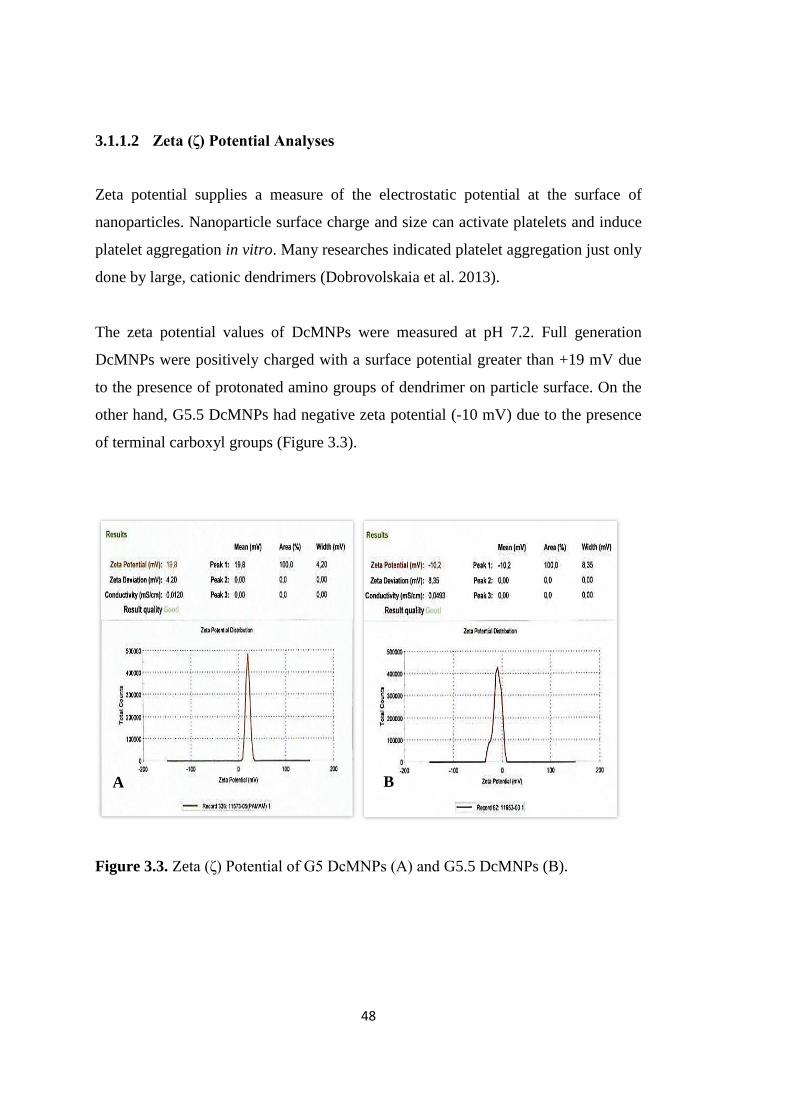
48
3.1.1.2 Zeta (ζ) Potential Analyses
Zeta potential supplies a measure of the electrostatic potential at the surface of
nanoparticles. Nanoparticle surface charge and size can activate platelets and induce
platelet aggregation in vitro. Many researches indicated platelet aggregation just only
done by large, cationic dendrimers (Dobrovolskaia et al. 2013).
The zeta potential values of DcMNPs were measured at pH 7.2. Full generation
DcMNPs were positively charged with a surface potential greater than +19 mV due
to the presence of protonated amino groups of dendrimer on particle surface. On the
other hand, G5.5 DcMNPs had negative zeta potential (-10 mV) due to the presence
of terminal carboxyl groups (Figure 3.3).
Figure 3.3. Zeta (ζ) Potential of G5 DcMNPs (A) and G5.5 DcMNPs (B).
A B

49
Previously, Dobrovolskaia et al. showed that the hydroxyl and carboxyl terminated
PAMAM dendrimers and also small amine terminated (cationic) dendrimers (G3) did
not result in aggregation of human platelets in vitro. However, large cationic
PAMAM dendrimers (G4, G5 and G6) resulted in platelet aggregation in human
plasma and caused lysis of red blood cells. There was significant difference between
3rd generation PAMAM dendrimer and larger dendrimers. However, no clear
difference was observed between G4, G5 and G6 dendrimers for platelet aggregation.
There results demonstrated that both surface charge and particle size are important
physicochemical properties which determine dendrimer interaction with human
platelets (Dobrovolskaia et al. 2013).

50
3.1.1.3 Fourier Transform-Infrared Spectroscopy (FT-IR)
The coatings of DcMNPs with a PAMAM dendrimer layer of G5.5 and G5 were
validated by FT-IR. Significant difference was seen at 1650-1750 cm-1
and 2800-
3000 cm-1
between G5 DcMNPs and G5.5 DcMNPs (Figure 3.4). The COOH bonds
related to G5.5 DcMNPs can be seen at 1730 cm-1
. Vibrations of –CO–NH– bonds
for G5 DcMNPs were observed at 1450, 1490, 1530, and 1620 cm-1
, which were not
seen in G5.5 DcMNPs. Also the vibration after 3000 cm-1
that mostly belongs to N-H
bonds were not observed for G5.5 DcMNPs.
Figure 3.4. FT-IR spectra of the G5 DcMNPs and G5.5 DcMNPs.
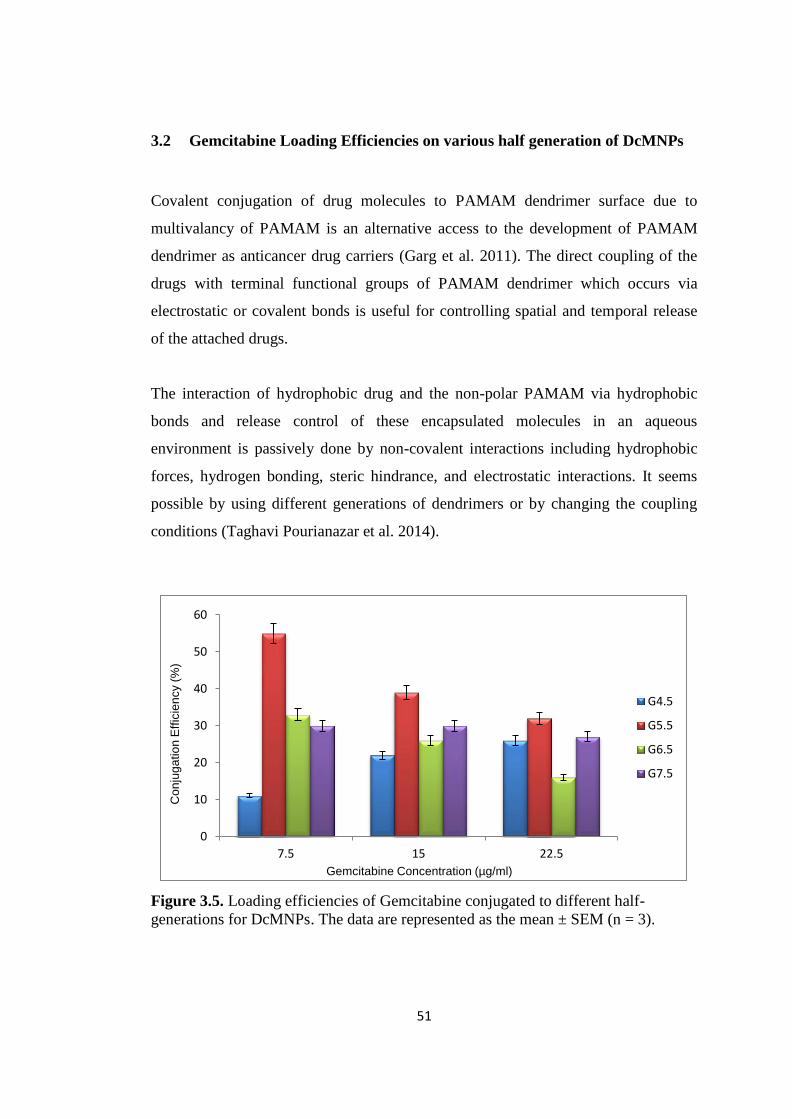
51
3.2 Gemcitabine Loading Efficiencies on various half generation of DcMNPs
Covalent conjugation of drug molecules to PAMAM dendrimer surface due to
multivalancy of PAMAM is an alternative access to the development of PAMAM
dendrimer as anticancer drug carriers (Garg et al. 2011). The direct coupling of the
drugs with terminal functional groups of PAMAM dendrimer which occurs via
electrostatic or covalent bonds is useful for controlling spatial and temporal release
of the attached drugs.
The interaction of hydrophobic drug and the non-polar PAMAM via hydrophobic
bonds and release control of these encapsulated molecules in an aqueous
environment is passively done by non-covalent interactions including hydrophobic
forces, hydrogen bonding, steric hindrance, and electrostatic interactions. It seems
possible by using different generations of dendrimers or by changing the coupling
conditions (Taghavi Pourianazar et al. 2014).
Figure 3.5. Loading efficiencies of Gemcitabine conjugated to different half-
generations for DcMNPs. The data are represented as the mean ± SEM (n = 3).
0
10
20
30
40
50
60
7.5 15 22.5
Co
nju
ga
tio
n E
ffic
ien
cy (
%)
Gemcitabine Concentration (µg/ml)
G4.5
G5.5
G6.5
G7.5

52
Loading efficiencies were tested in methanol with different drug concentrations and
different half generations (4.5, 5.5, 6.5, and 7.5) of DcMNPs (2.5 mg/ml). The
loading efficiencies of 7.5, 15 and 22.5 µg/ml Gemcitabine were conjugated 55%,
39% and 32% in methanol to G5.5 DcMNPs, respectively (Figure 3.5). The highest
and most efficient drug conjugation concentration was obtained for 22.5µg/ml with
generation 5.5 which is around 24 µM (Table 3.1).
Conformation of the conjugation of Gemcitabine to G5.5 PAMAM DcMNPs was
done by TEM, Zeta (ζ) potential, FT-IR and XPS analyses.
Table 3.1. Loaded amounts of Gemcitabine to 2.5 mg/ml G5.5 DcMNPs using
different initial drug loading concentrations.
In our initial attempts, we tried to load Gemcitabine (7.5, 15 and 22.5 µg/ml) on 2.5
mg/ml of PAMAM dendrimers (G4-DcMNP and G7-DcMNP) in methanol, PBS,
water and TPP. However, Gemcitabine binding was not observed on full generations
of (G4 and G7) PAMAM dendrimers. Then, we synthesized and characterized the
half-generations of PAMAM DcMNPs (G4.5 up to G7.5) (Appendix A. Table A1).
Gemcitabine concentration (µg/ml)
Loaded amount of
Gemcitabine (µg)
Loaded amount of
Gemcitabine (µM)
7.5 µg/ml
4.1 µg
14 µM
15 µg/ml
5.9 µg
19.5 µM
22.5 µg/ml
7.2 µg
24 µM
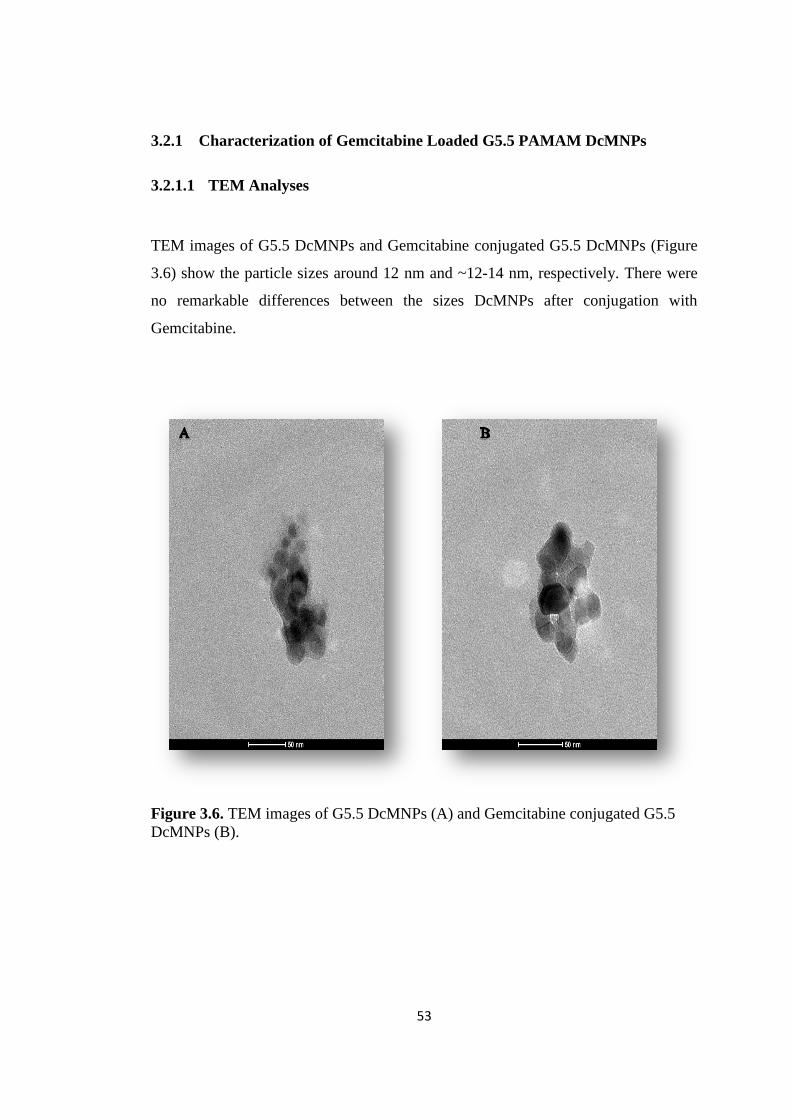
53
3.2.1 Characterization of Gemcitabine Loaded G5.5 PAMAM DcMNPs
3.2.1.1 TEM Analyses
TEM images of G5.5 DcMNPs and Gemcitabine conjugated G5.5 DcMNPs (Figure
3.6) show the particle sizes around 12 nm and ~12-14 nm, respectively. There were
no remarkable differences between the sizes DcMNPs after conjugation with
Gemcitabine.
Figure 3.6. TEM images of G5.5 DcMNPs (A) and Gemcitabine conjugated G5.5
DcMNPs (B).

54
3.2.1.2 X-Ray Photoelectron (XPS) Analyses
XPS was used to examine shell structure of the synthesized product because core
electron lines of ferrous and ferric ions can both be detectable and distinguishable in
XPS.
Figure 3.7 shows representative XPS spectrum of the DcMNPs and Gemcitabine
conjugated DcMNPs. The peaks obtained upon XPS analysis belong to C 1s (286
eV), N 1s (400 eV), O 1s (531 eV), and Fe 2p (721 eV). The N1s band of DcMNPs
at 400 eV is assigned to amino groups (–NH2). There was an increase in the oxygen
(O1s) and nitrogen (N1s) contents in Gemcitabine conjugated DcMNPs.
Figure 3.7. XPS spectra of G5.5 DcMNPs, and Gemcitabine conjugated G5.5
DcMNPs.
c/s

55
The fluorine atom was observed in XPS specific spectra analysis between 650-700
eV binding energy and under 4000 c/s of Gemcitabine conjugated DcMNPs (Figure
3.8). These results demonstrated that the Gemcitabine was conjugated successfully to
G5.5 PAMAM dendrimer coating magnetic nanoparticles.
Figure 3.8. XPS particular Fluorine analyses of Gemcitabine conjugated DcMNPs.
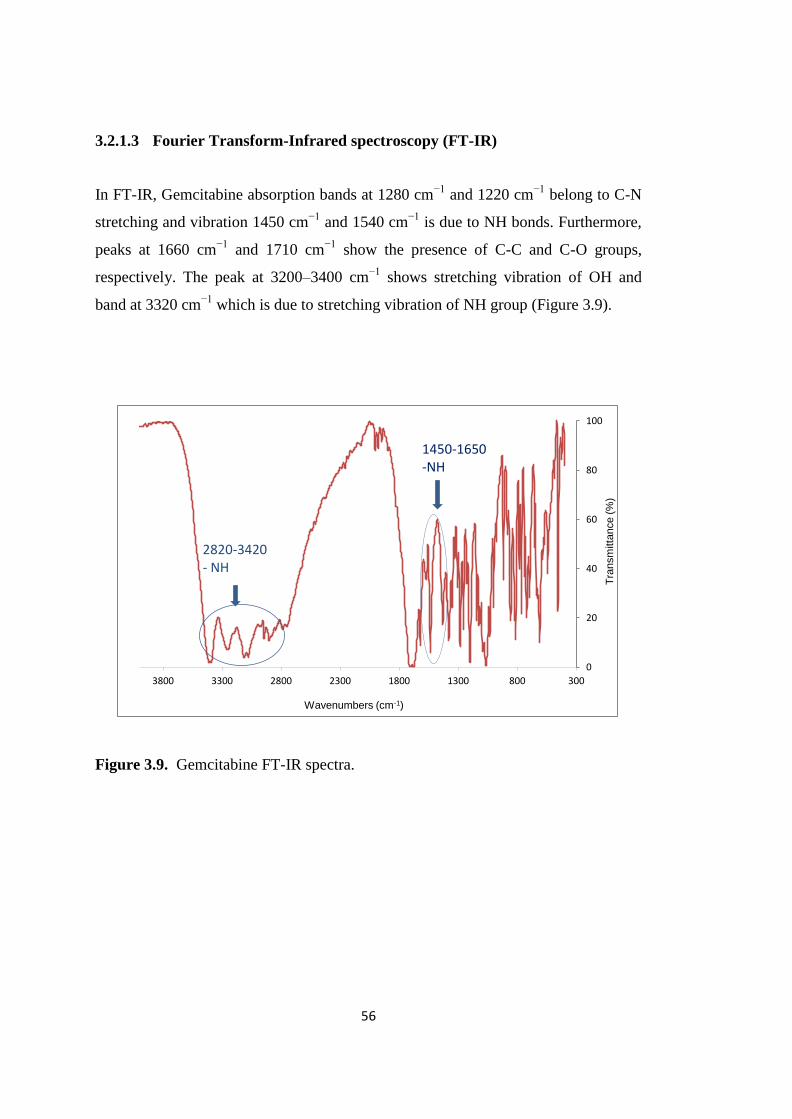
56
3.2.1.3 Fourier Transform-Infrared spectroscopy (FT-IR)
In FT-IR, Gemcitabine absorption bands at 1280 cm−1
and 1220 cm−1
belong to C-N
stretching and vibration 1450 cm−1
and 1540 cm−1
is due to NH bonds. Furthermore,
peaks at 1660 cm−1
and 1710 cm−1
show the presence of C-C and C-O groups,
respectively. The peak at 3200–3400 cm−1
shows stretching vibration of OH and
band at 3320 cm−1
which is due to stretching vibration of NH group (Figure 3.9).
Figure 3.9. Gemcitabine FT-IR spectra.
0
20
40
60
80
100
300800130018002300280033003800
Tra
nsm
itta
nce (
%)
Wavenumbers (cm-1)
1450-1650 -NH
2820-3420 - NH
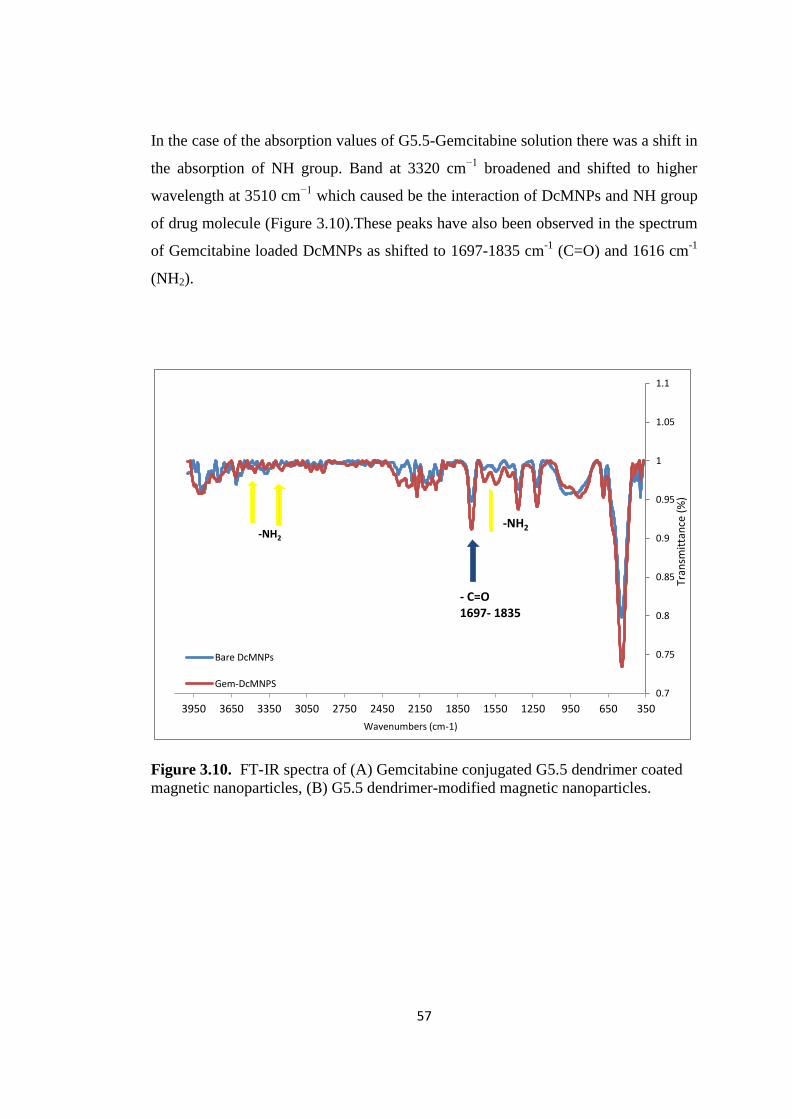
57
In the case of the absorption values of G5.5-Gemcitabine solution there was a shift in
the absorption of NH group. Band at 3320 cm−1
broadened and shifted to higher
wavelength at 3510 cm−1
which caused be the interaction of DcMNPs and NH group
of drug molecule (Figure 3.10).These peaks have also been observed in the spectrum
of Gemcitabine loaded DcMNPs as shifted to 1697-1835 cm-1
(C=O) and 1616 cm-1
(NH2).
Figure 3.10. FT-IR spectra of (A) Gemcitabine conjugated G5.5 dendrimer coated
magnetic nanoparticles, (B) G5.5 dendrimer-modified magnetic nanoparticles.
0.7
0.75
0.8
0.85
0.9
0.95
1
1.05
1.1
3506509501250155018502150245027503050335036503950
Tran
smit
tan
ce (
%)
Wavenumbers (cm-1)
Bare DcMNPs
Gem-DcMNPS
- C=O 1697- 1835
-NH2 -NH2

58
3.2.1.4 Zeta (ζ) Potential Analyses
The zeta potential of G5.5 DcMNPs in aqueous dispersion was determined to be
about −10.2 mV. On the other hand, the zeta potential of Gemcitabine conjugated
G5.5 DcMNPs was slightly negative (- 4.85 mV) (Figure 3.11).
This results support our hypothesis that Gemcitabine conjugation was achieved at the
negative carboxylic groups of the nanoparticles.
Figure 3.11. Zeta (ζ) potential graphs of Gemcitabine conjugated to G5.5 DcMNPs.

59
3.2.2 Release and Stability Efficiencies of Gemcitabine from G5.5 PAMAM
DcMNPs
3.2.2.1 Release Profiles
Gemcitabine release studies were performed in acetate buffer at pH 4.2 and 5.2 and
the amount of drug release was determined using calibration curves constructed with
known concentrations of Gemcitabine in acetate buffer at relevant pH (Appendix A.
Figure A.4 (B),(C)).
The release profiles of the drug from DcMNPs at pH 4.2 and pH 5.2 are given in
Figure 3.12. The release studies were continued up to 24 h. The entire drug (100%)
was released within first 15 h at pH 4.2, and nearly 75% of the drug was released at
pH 5.2. Gemcitabine release was higher at pH 4.2 compared to pH 5.2. Electrostatic
interactions between protonated amino residues on Gemcitabine and anionic groups
on nanoparticles are responsible for the surface interactions involved in the burst
release (Khaira et al., 2014).
Figure 3.12. Gemcitabine release profile of DcMNPs at pH 4.2 and pH 5.2.
The data are represented as the mean ± SEM (n = 3).
0
20
40
60
80
100
0 3 6 9 12 15 18 21 24
Ge
mci
tab
ine
Re
leas
e (
%)
Time (hours)
pH 4.2
pH 5.2

60
It was shown Gemcitabine release was higher at pH 4.2 compared to pH 5.2. As the
pH decreased, the drug release increased. Then, the drug is expected to be released at
the targeted cancer cells, because the pH of tumor tissue and endosomes are acidic.
Burst release of Gemcitabine from nanoparticles at initial stage will occur. Nearly the
whole drug was released within first 15 h from all nanoparticles in pH 4.2.
3.2.2.2 Stability Efficiencies
The stability of Gemcitabine loaded nanoparticles was evaluated up to 6 weeks in
PBS (pH 7.2) at 37ºC by the help of standard curve (Appendix A. Figure A.4,A),
which mimics the physiological conditions (Figure 3.13). Results showed that the
stability of Gemcitabine loaded G5.5 DcMNPs were around 94 % at 37ºC.
Figure 3.13. Gemcitabine release of G5.5 DcMNPs in PBS (pH 7.2) results for
stability test. The data are represented as the mean ± SEM (n = 3).
The results indicated that only 6% of Gemcitabine drug content was released after 6
weeks showing that DcMNPs were stable at 37ºC in PBS buffer. This is a desirable
property, which provides an advantage in the storage of Gemcitabine conjugated
DcMNPs.

61
3.2.3 In vitro Cytotoxicity Studies of Bare and Gemcitabine Conjugated G5.5
PAMAM DcMNPs on SKBR-3 and MCF-7 Cell Lines
Cytotoxicities of G5.5 DcMNPs, free Gemcitabine and Gemcitabine conjugated G5.5
DcMNPs were investigated by XTT cell proliferation assay using SKBR-3 and
MCF-7 breast cancer cell lines. MCF-7 and SKBR-7 cells were treated with bare
G5.5 PAMAM dendrimers for 72 hours in 96- well plates. After incubation period,
cell viability was determined for each cell type.
Previously, Khodadust et al. (2013) reported empty G4DcMNPs as significantly
cytotoxic at concentrations of more than 250 μg/ml (Khodadust et al. 2013). Our
results demonstrated that the bare half generation PAMAM dendrimers have no
cytotoxicity on SKBR-3 and MCF-7 cell lines over 250μg/ml concentration.
Figure 3.14. Cytotoxicity of G5.5 DcMNPs on MCF-7 and SKBR-3 cell lines.
The data are represented the mean ± SEM (n = 2)
0
20
40
60
80
100
120
0.830.560.370.250.160.110.070.02
Ce
ll Su
rviv
al (
%)
DcMNP Concentration (mg/ml)
MCF7 cell line
0
20
40
60
80
100
120
1.671.110.740.490.220.150.070.04
Ce
ll Su
rviv
el (
%)
DcMNP Concentration (mg/ml)
SKBR-3 cell line

62
Survival rates of G5.5 DcMNPs indicated that there was no significant cytotoxic
effect of the nanoparticles on SKBR-3 and MCF-7 cells up to 1.67 mg/ml and 0.83
mg/ml concentrations, respectively (Figure 3.14).
IC50 (half maximal inhibitory concentration) values for Gemcitabine and
Gemcitabine conjugated G5.5 DcMNPs were determined at the 72 h treatments. IC50
values were calculated from the logarithmic trend line of the cell proliferation
percentage versus concentration plots.
Figures 3.15 and 3.16 demonstrated the antiproliferative effects of Gemcitabine
loaded G5.5 DcMNPs with increasing concentrations on SKBR-3 and MCF-7 cell
lines. As demonstrated in Figure 3.15, IC50 values of Gemcitabine and Gemcitabine
conjugated nanoparticles was about 6.5 μM and 1.2 μM on SKBR-3 cells,
respectively. In Figure 3.16, IC50 values of Gemcitabine and Gemcitabine conjugated
nanoparticles was found as 3.9 μM and 1.1 μM on MCF-7 cells, respectively.
Gemcitabine conjugated DcMNPs were found as nearly 6 and 3 fold more toxic on
SKBR-3 and MCF-7 cells respectively compared to free Gemcitabine. These results
showed that Gemcitabine conjugated DcMNPs are more effective over breast cancer
cell lines. It is suggested that these nanoparticles could overcome the drug resistance.

63
Figure 3.15. XTT cell proliferation assay of (A) Gemcitabine, (B) Gemcitabine
conjugated DcMNPs on SKBR-3 cells.
The data are represented the mean ± SEM (n = 3).
y = -20.34ln(x) + 53.329 R² = 0.9403
0
20
40
60
80
100
120
0 1 2 3 4 5 6 7 8
Cel
l Su
rviv
al (
%)
Gemcitabine concentration (µM)
- IC50= 1.2µM
y = -9.715ln(x) + 68.193 R² = 0.9896
0
20
40
60
80
100
0 20 40 60 80 100 120 140
Cel
l Su
rviv
al (
%)
Gemcitabine Concentration (µM)
- IC50 = 6.5µM

64
Figure 3.16. XTT cell proliferation assay of (A) Gemcitabine, (B) Gemcitabine
conjugated DcMNPs on MCF-7 cells.
The data are represented the mean ± SEM (n = 3).
y = -9.891ln(x) + 63.549 R² = 0.9142
0
20
40
60
80
100
120
0 20 40 60 80 100
Ce
ll Su
rviv
al (
%)
Gemcitabine Concentration (µM)
- IC50= 3.9 µM
y = -22.28ln(x) + 51.814 R² = 0.9394
0
20
40
60
80
100
120
0 0.5 1 1.5 2 2.5 3
Ce
ll Su
rviv
al (
%)
Gemcitabine Concentration (µM)
- IC50 = 1.1µM

65
3.3 Gemcitabine Loading Efficiencies on Chitosan Coated Magnetic
Nanoparticles (CSMNPs)
Gemcitabine loading was investigated at different drug dilutions (7.5, 15 and 22.5
µg/ml) using 2.5 mg/ml of CSMNPs (Figure 3.17). The loading efficiencies of 7.5,
15 and 22.5 µg/ml Gemcitabine were 63%, 44% and 39% in methanol to CSMNPs,
respectively.
Figure 3.17. Loading efficiencies of Gemcitabine conjugated to CSMNPs.
The data are represented the mean ± SEM (n = 3)
Loading efficiency (39%) was increased up to 9 µg/ml with the highest amount of
Gemcitabine (22.5 µg/ml) in methanol solution. The highest drug loading was 30 µM
(Table 3.2).
Table 3.2. Loaded amounts of Gemcitabine to 2.5 mg/ml CSMNPs using different
initial drug loading concentrations.
0
20
40
60
80
7.5 15 22.5
Ge
mci
tab
ine
Lo
adin
g Ef
fici
en
cy (
%)
Gemcitabine Concentration (µg/ml)
Gemcitabine concentration (µg/ml)
Loaded amount of
Gemcitabine (µg)
Loaded amount of
Gemcitabine (µM)
7.5 µg/ml
4.8 µg
16 µM
15 µg/ml
6.6 µg
22 µM
22.5 µg/ml
8.8 µg
30 µM
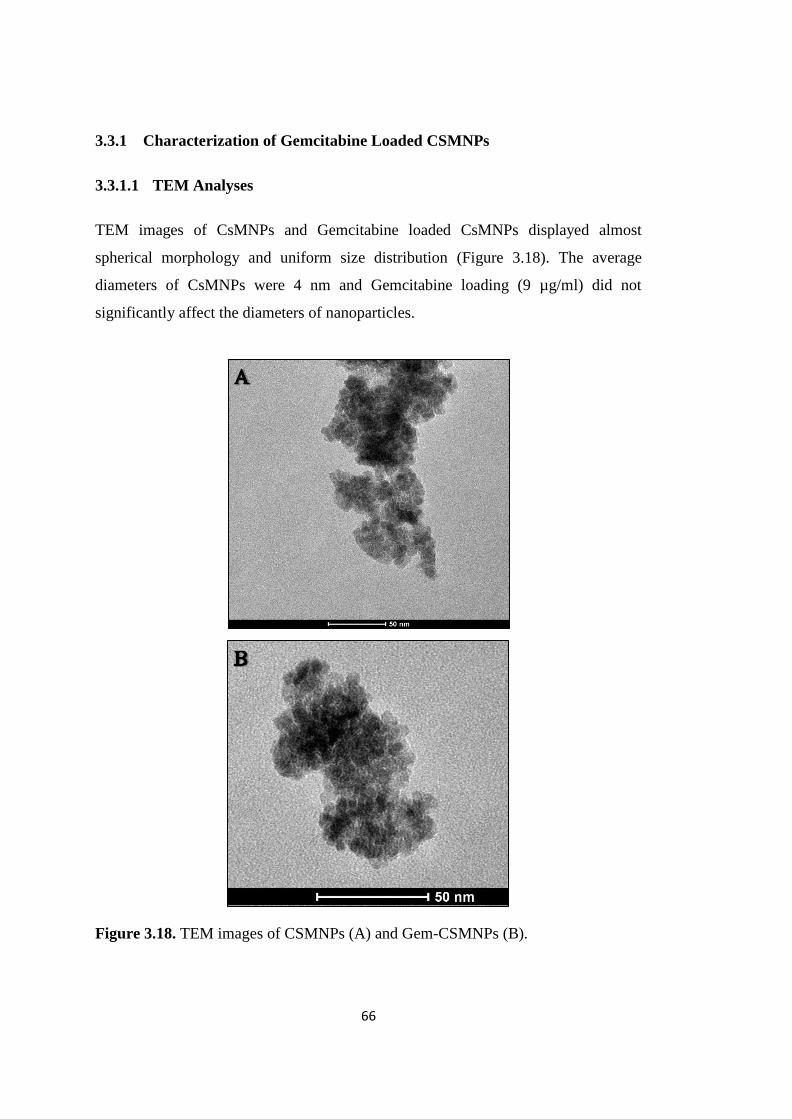
66
3.3.1 Characterization of Gemcitabine Loaded CSMNPs
3.3.1.1 TEM Analyses
TEM images of CsMNPs and Gemcitabine loaded CsMNPs displayed almost
spherical morphology and uniform size distribution (Figure 3.18). The average
diameters of CsMNPs were 4 nm and Gemcitabine loading (9 µg/ml) did not
significantly affect the diameters of nanoparticles.
Figure 3.18. TEM images of CSMNPs (A) and Gem-CSMNPs (B).

67
3.3.1.2 X-ray Photoelectron (XPS) Analyses
X-ray photoelectron spectrophotometry give insight to the interactions between the
surface of chitosan coated iron oxide nanoparticles and Gemcitabine. Figure 3.19
shows representative XPS spectra of the CsMNPs and Gemcitabine loaded CsMNPs.
The N1s band of CSMNPs at 400 eV is assigned to amino groups (–NH2). The peaks
obtained upon XPS analysis belonged to C 1s (286 eV), N 1s (400 eV), O 1s (531
eV), and Fe 2p (721 eV).
Figure 3.19. XPS scanning spectra of CSMNPs, and Gemcitabine loaded CSMNPs.

68
Nitrogen and oxygen amounts did not change significantly because of that XPS
specifically reveals atomic composition of the surface of nanoparticles (Figure 3.19).
Most of loaded Gemcitabine enters into the cavities of chitosan network rather than
the surface of CsMNPs. However, the peak belonging to Fluorine atom of
Gemcitabine appeared in the spectrum of Gemcitabine loaded CsMNPs,
demonstrating the presence of drug on the surface of CsMNPs. Fluorine peak was
between 670-700 eV binding energy and under 1200 c/s (Figure 3.20).
Results demonstrated that Gemcitabine was loaded both onto the surface and into the
cavities of chitosan coated magnetic nanoparticles.
Figure 3.20. XPS particular fluorine analyses of Gemcitabine conjugated CSMNPs.
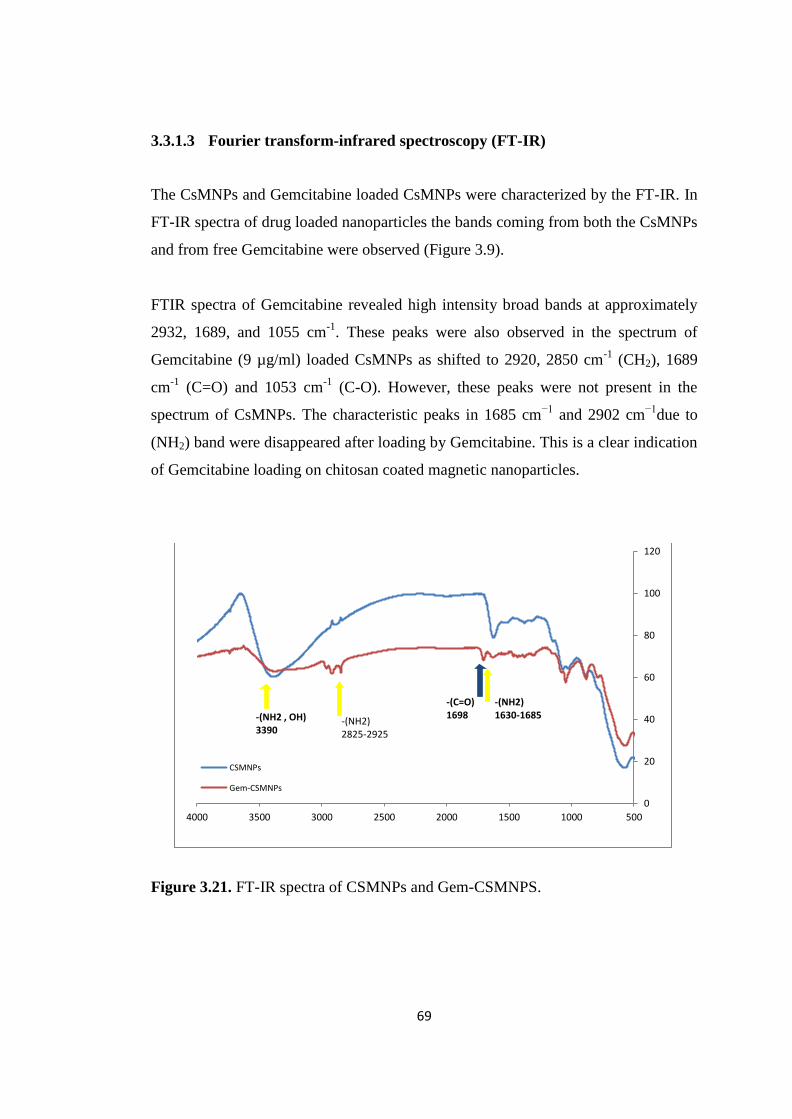
69
3.3.1.3 Fourier transform-infrared spectroscopy (FT-IR)
The CsMNPs and Gemcitabine loaded CsMNPs were characterized by the FT-IR. In
FT-IR spectra of drug loaded nanoparticles the bands coming from both the CsMNPs
and from free Gemcitabine were observed (Figure 3.9).
FTIR spectra of Gemcitabine revealed high intensity broad bands at approximately
2932, 1689, and 1055 cm-1
. These peaks were also observed in the spectrum of
Gemcitabine (9 µg/ml) loaded CsMNPs as shifted to 2920, 2850 cm-1
(CH2), 1689
cm-1
(C=O) and 1053 cm-1
(C-O). However, these peaks were not present in the
spectrum of CsMNPs. The characteristic peaks in 1685 cm−1
and 2902 cm−1
due to
(NH2) band were disappeared after loading by Gemcitabine. This is a clear indication
of Gemcitabine loading on chitosan coated magnetic nanoparticles.
Figure 3.21. FT-IR spectra of CSMNPs and Gem-CSMNPS.
0
20
40
60
80
100
120
5001000150020002500300035004000
CSMNPs
Gem-CSMNPs
-(NH2 , OH) 3390
-(C=O) 1698
-(NH2) 1630-1685
-(NH2) 2825-2925

70
3.3.1.4 Zeta (ζ) Potential Analyses
The zeta potential of CsMNPs was determined as -19.8 mV in aqueous medium at
pH 7.2. Unsoy et al. reported that CsMNPs have negative charge at pH˃6.7 due to
the deprotonation of amino groups on chitosan layer (Unsoy et al. 2012). An
electrostatic interaction is expected between the aqueous dispersion of negatively
charged CsMNPs (pH 7.2) and positively charged Gemcitabine (by the protonation
of NH2 group). Zeta potential of Gemcitabine (30 µM) loaded CsMNPs was -8.66
mV at pH 7.2 (Figure 3.22). This significant increase in zeta potential could
explained by entrapment of Gemcitabine to the chitosan coated iron oxide
nanoparticles neutralizing negative charges.
Figure 3.22. Zeta potential measurements of CSMNPs (A) and Gem-CSMNPs (B).

71
3.3.2 Release and Stability Efficiencies of Gemcitabine from CSMNPs
3.3.2.1 Release Profile
Gemcitabine release studies showed pH dependent release pattern. The release
profiles of the drug from CsMNPs in acetate buffer at pH 4.2 and pH 5.2 are given in
Figure 3.23. The release studies were continued up to 24 h. Gemcitabine release was
higher at pH 4.2 (65.4%) compared to pH 5.2 (33%). This faster release at lower pH
was related to the higher solubility of Chitosan at lower pH values, thus, allowing
Gemcitabine to leak out at a faster rate.
CsMNPs showed 25% and 10% initial burst release of Gemcitabine at pH 4.2 and
5.2, respectively during a period of 3h. This initial rapid release, characterized as
„„burst effect‟‟, occurs by desorption of Gemcitabine, localized on the surface of
nanoparticles or upper layer of mesh cavities. Therefore, the entire drug entrapped in
the mesh cavities shows slow release from nanoparticles.
Figure 3.23. Gemcitabine release profile of CSMNPs in acetate buffer at pH4.2 and
pH 5.2. The data are represented as the mean ± SEM (n = 3).
0
20
40
60
80
100
0 3 6 9 12 15 18 21 24
Ge
mci
tab
ine
Re
leas
e (
%)
Time (hours)
pH 4.2
pH 5.2
72
Maximum 25% and 10% burst releases of Gemcitabine at pH 4.2 and 5.2 indicated
that drug was mostly entrapped in the mesh cavities of CsMNPs more than the
surface. It has been reported that chitosan starts to degrade at pH 4.2 (Rodrigues et
al. 2012). So, higher release of Gemcitabine was obtained at pH 4.2 (65%). As pH of
the release media was decreased, the drug release increased. Then, the drug is
expected to be released at the targeted cancer cells, because the pH of tumor tissue
and endosomes are acidic.
Garg et al. (2012) investigated in vitro release kinetics of Gemcitabine from
chitosan/poly(ethylene glycol)anisamide (CTS/PEG-AA) nanoparticles by dialysis
bag method using PBS (10 mM, pH 5.8) as release medium. They showed that nearly
79% of the drug was released from CsMNPs during 10 days (Garg et al. 2012).
Contrarily, Arias et al. (2011) obtained much faster Gemcitabine release rate from
chitosan nanoparticles at pH 5. They observed 65% release within 2 h, while the
remaining drug was slowly released in the next 22 h (Arias et al. 2011). It took
longer time to release whole drug load of CsMNPs compared to the study of Arias et
al. because entrapped Gemcitabine amount (9 µg/ml) was higher in CsMNPs. In the
study of Garg et al. they needed more time to release their drug load due to the
encapsulation of drug inside the nanoparticles.

73
3.3.2.2 Stability Profile
The stability of Gemcitabine loaded nanoparticles was evaluated up to 72h in PBS at
37ºC, which mimics the physiological conditions (Figure 3.24). Results showed 12h
steady-state release (2%) continued by burst release up to 24h and again steady-state
up to 72h (8%). The percentage of cumulative release was around 8% in PBS buffer
(pH 7.2). Consequently, Gemcitabine conjugated CSMNPs were highly stable (92%)
up to 72h.
Figure 3.24. Stability of Gemcitabine conjugated CSMNPs in PBS buffer (pH
7.2). The data are represented as the mean ± SEM (n = 3).
Arias et al. demonstrated the release of gemcitabine adsorbed onto the chitosan
nanoparticles was complete within 2 h at pH 7.4. On the contrary, the entrapped
gemcitabine within chitosan nanoparticles showed a burst drug release (≈40% in 2h),
which is indicate the leakage of the surface-associated and poorly entrapped drug and
the remaining drug being released through next 4 days (Arias et al. 2011).
In this study, the results indicated that Gemcitabine conjugated CSMNPs were highly
stable (≈92%) up to 72h in PBS buffer. This is a desirable property, which provides
an advantage in the storage of Gemcitabine conjugated CSMNPs.

74
3.3.3 In Vitro Cytotoxicity Studies of CSMNPs and Gemcitabine Loaded
CSMNPs on SKBR-3 and MCF-7 Cell Lines
Cytotoxicities of CSMNPs and Gemcitabine loaded CSMNPs were investigated by
XTT cell proliferation assay on SKBR-3 and MCF-7 breast cancer cell lines. MCF-7
and SKBR-7 cells were treated with CSMNPs for 72 hours in 96- well plates. After
incubation period, cell viability profiles were determined for each cell type.
As previously reported by Unsoy et al., when 0.75 mg/ml CsMNPs were applied to
HeLa, SiHa and MCF-7 cells, a significant toxicity was not observed on these cell
lines (Unsoy et al. 2012). XTT results showed that CsMNPs were not significantly
cytotoxic on SKBR-3 cells up to 1.7 mg/ml concentration. On the other hand, 0.8
mg/ml CsMNPs showed 30% cytotoxicity in MCF-7 cells (Figure 3.25). However,
less CsMNP (0.5 mg/ml) is enough for Gemcitabine loading studies on MCF-7 and
SKBR-3 cell lines (Figure 3.25).
Figure 3.25. Cytotoxicity of CSMNPs on MCF-7 and SKBR-3 cell lines.
The data are represented as the mean ± SEM (n = 2).
0
20
40
60
80
100
120
1.671.110.740.490.220.150.070.04
Ce
ll Su
rviv
al (
%)
CSMNPs Concentration (mg/ml)
SKBR cell line
0
20
40
60
80
100
120
0.830.560.370.250.110.070.050.02
Ce
ll Su
rviv
al (
%)
CSMNPs Concentration (mg/ml)
MCF-7 cell line
75
Figures 3.26 and 3.27 demonstrate the dose dependent antiproliferative effect of
Gemcitabine and Gemcitabine loaded CSMNPs on SKBR-3 and MCF-7 cell lines,
respectively. IC50 values of Gemcitabine and Gemcitabine conjugated CsMNPs were
calculated from the logarithmic trend line of cell proliferation percentage versus
concentration plots. IC50 values of Gemcitabine and Gemcitabine conjugated
CsMNPs were 6.5 μM and 4.8 μM on SKBR-3 cells, and 3.9 μM and 1.5 μM on
MCF-7 cells, respectively (Figures 3.26, 3.27).
Results showed that, Gemcitabine loaded CsMNPs were found as nearly 1.4 and 2.6
fold more toxic compared to free Gemcitabine on SKBR-3 and MCF-7 cells,
respectively. These results showed that loading of Gemcitabine on CsMNPs are more
effective over breast cancer cell lines. Similarly, Unsoy et al (2014) reported that the
efficacy of Doxorubicin loaded CsMNPs was 2 folds higher than free Doxorubicin
on MCF-7 cells. In another cell proliferation assay of Bortezomib loaded CsMNPs
on HeLa cells revealed that the required amount of drug decreased 2 folds compared
to free Bortezomib (Unsoy et al. 2014). Consequently, the inhibition of cancer cell
proliferation was achieved with less drug concentrations by CsMNPs in vitro.

76
Figure 3.26. XTT cell proliferation assay of Gemcitabine and Gemcitabine
conjugated CSMNPs on SKBR-3 cells. The data are represented as the mean
± SEM (n = 3).
y = -9.715ln(x) + 68.193 R² = 0.9896
0
10
20
30
40
50
60
70
80
90
100
0 20 40 60 80 100 120 140
Cel
l Su
rviv
al (
%)
Gemcitabine (µM)
- IC50 = 6.5µM
y = -18.6ln(x) + 79.4 R² = 0.9143
0
20
40
60
80
100
120
0.00 0.67 1.34 2.01 2.68 3.35 4.02 4.69 5.36 6.03 6.70 7.37
Ce
ll Su
rviv
al (
%)
Gemcitabine (µM)
- IC50 = 4.86µM

77
Figure 3.27. XTT cell proliferation assay of Gemcitabine and Gemcitabine
conjugated CSMNPs on MCF-7 cells. The data represent the mean ± SEM (n = 3).
y = -9.891ln(x) + 63.549 R² = 0.9142
0
20
40
60
80
100
120
0 20 40 60 80 100
Ce
ll Su
rviv
al (
%)
Gemcitabine (µM)
- IC50= 3.9 µM
y = -22.35ln(x) + 59.061 R² = 0.954
0
20
40
60
80
100
120
0.0 0.5 1.0 1.5 2.0 2.5 3.0 3.5 4.0 4.5 5.0 5.5 6.0 6.5
Ce
ll Su
rviv
al (
%)
Gemcitabine (µM)
- IC50 = 1.49µM

78
3.4 Gemcitabine Loading Efficiencies on PHB Magnetic Nanoparticles
(PHB_MNPs)
Loading efficiencies were investigated in methanol with different drug
concentrations using (2.5 mg/ml) PHB-MNPs (Figure 3.28). The loading efficiencies
of 7.5, 15 and 22.5 µg/ml Gemcitabine were 32%, 27% and 29% in methanol to
PHB-MNPs, respectively.
Figure 3.28. Loading efficiencies of Gemcitabine conjugated to PHB-MNPs
The data are represented as the mean ± SEM (n = 3)
Loading efficiency (29%) was increased up to 6.5 µg/ml with the highest amount of
Gemcitabine (22.5 µg/ml) in methanol solution. The highest loaded concentration of
drug was 22 µM (Table 3.3).
Table 3.3. Loaded amounts of Gemcitabine to PHB-MNPs using different initial
drug loading concentrations.
0
20
40
60
7.5 15 22.5
Gem
cita
bin
e Lo
adin
g Ef
fici
ency
(%
)
Gemcitabine Concentration (µg/ml)
Gemcitabine concentration (µg/ml)
Loaded amount of
Gemcitabine (µg)
Loaded amount of
Gemcitabine (µM)
7.5 µg/ml
2.4 µg
8 µM
15 µg/ml
4 µg
13.5 µM
22.5 µg/ml
6.5 µg
22 µM

79
3.4.1 Characterization of Gemcitabine Loaded PHB-MNPs
3.4.1.1 TEM Analyses
The sizes of magnetic polymer and morphological properties before and after
conjugated by drug were observed through TEM images. TEM images of PHB-
MNPs and Gemcitabine conjugated PHB-MNPs (Figure 3.29) show the particle sizes
were around 13 nm and ~13-15 nm, respectively. There were no remarkable
differences between the sizes of MNPs after loading with 6.5 µg Gemcitabine.
Figure 3.29. TEM images of PHB-MNPs (A) and Gemcitabine conjugated PHB-
MNPs (B)

80
3.4.1.2 X-ray Photoelectron (XPS) Analyses
XPS was used to examine shell structure of the synthesized product. Figure 3.30
shows representative XPS spectra of the PHB-MNPs and Gemcitabine loaded PHB-
MNPs. XPS specifically reveals atomic surface characteristics of nanoparticles. The
peaks obtained upon XPS analysis were belonging to C1 2p (200 eV), C 1s (286 eV),
O 1s (531 eV), and Fe 2p (721 eV). The atomic percent of these peaks did not change
significantly after Gemcitabine conjugation.
Figure 3.30. XPS scanning spectrum of PHB-MNPs, and Gemcitabine conjugated
PHB-MNPs.

81
In figure 3.30, nitrogen peak belonging to Gemcitabine NH2 were not seen in the
Gemcitabine loaded PHB-MNPs spectra. However Fluorine atom was observed in
XPS particular analysis between 670-700 eV binding energy and under 2000 C/S of
Gemcitabine loaded PHB-MNPs (Figure 3.31). The absence of nitrogen atom and
presence small amount of fluorine demonstrated that Gemcitabine was encapsulated
within PHB-MNPs mesh-works more than surface association.
Figure 3.31. XPS results for Fluorine analysis of Gemcitabine conjugated PHB-
MNPs.

82
3.4.1.3 Fourier Transform-Infrared Spectroscopy (FT-IR)
In order to characterize the chemical composition of synthesized PHB magnetic
nanoparticles (PHB-MNPs) and to support the information of Gemcitabine loaded to
PHB-MNPs, FT-IR spectra were obtained.
The peak at the 583 cm−1
region, characteristic for the Fe-O group, was found in
PHB coated magnetic nanoparticles and Gemcitabine loaded particles spectra,
confirming that the products contained magnetite. The characteristic peaks at 2750
cm−1
, 3050 cm−1
and 3390 cm−1
due to NH2 band disappeared in PHB-MNPs (Figure
3.32). These peaks were seen in Gemcitabine FTIR (Figure 3.9) and also appeared in
PHB-MNPs after Gemcitabine loading. This is a clear indication that Gemcitabine
was efficiently entrapped into the PHB-MNPs.
Figure 3.32. FT-IR results related to PHB-MNPs and Gemcitabine conjugated PHB-
MNPs.
0
20
40
60
80
100
120
3506509501250155018502150245027503050335036503950
Tran
smit
tan
ce (
%)
Wavenumbers (cm-1)
PHB-MNPs
Gem-PHB-MNPs
-(NH2 , OH) 3390
2750-3050

83
3.4.1.4 Zeta (ζ) Potential Analysis
The zeta potential of PHB-MNPs in aqueous dispersion was around 19.9 mV. On the
other hand, the zeta potential of Gemcitabine loaded PHB-MNPs was 24.5 mV
(Figure 3.33). These results demonstrated that Gemcitabine loading was achieved
and the cationic charge of PHB did not so much change after drug loading.
Figure 3.33. Zeta (ζ) Potential graphs of PHB-MNPs (A), and Gemcitabine
conjugated PHB-MNPS (B).

84
3.4.2 Release and Stability Efficiencies of Gemcitabine from PHB-MNPs
3.4.2.1 Release Profile
Gemcitabine release studies were performed in acetate buffer at pH 4.2 for 24 h. The
release profile of the drug from PHB-MNPs at pH 4.2 is given in Figure 3.34. The
total amount of the drug released within 24h from PHB-MNPs was around 48.8 % at
pH 4.2. 13% burst release was observed in first 3h which was lower than observed in
DcMNPs (17%) and CSMNPs (25%). PHB-MNPs released 48.8% of drug after 24h
as opposed to DcMNPs, which released whole adsorbed drug after 15h. These results
indicated that firstly Gemcitabine adsorbed to the surface of PHB-MNPs or inside
the upper layer of cavities were released and drug entrapped in the deeper mesh
cavities needed more time for release. Yalcin et al. (2014) showed 60% of
Doxorubicin loaded to PHB-MNPs needed 65h to be released at pH 4.5. It was
showed nearly 50% of Doxorubicin (400 µg/ml and 500 µg/ml) were released after
24h (Yalcin et al. 2014).
Figure 3.34. Gemcitabine release profile of PHB-MNPs at pH 4.2. The data are represented as the mean ± SEM (n = 3).
0
20
40
60
80
100
0 3 6 9 12 15 18 21 24
Ge
mci
tab
ine
Re
leas
e (
%)
Time (hours)

85
3.4.2.2 Stability Profile
The stability of Gemcitabine loaded PHB nanoparticles was investigated up to 36
hours in PBS (pH 7.2) at 37ºC, which mimics the physiological conditions (Figure
3.35). Results showed that the 15h burst release (19%) continued by steady-state
release up to 36h. However only 19.4% of the drug was released after 36h of
incubation.
Figure 3.35. Stability of Gemcitabine loading PHB-MNPs in PBS buffer (pH 7.2).
The data are represented as the mean ± SEM (n = 3).
The results indicated that Gemcitabine loaded PHB-MNPs were stable (≈80%) up to
36h in PBS buffer. Previously, Yalcin et al. showed that about 35% of the
Doxorubicin was released from PHB-MNPs at pH 7.2 within 2 weeks, and 65% of
the drug was not released up to 8 weeks (Yalcin et al. 2014). This is a desirable
property, which provides an advantage in the storage of drugs conjugated PHB-
MNPs.
0
5
10
15
20
25
0 3 6 9 12 15 18 21 24 27 30 33 36
Ge
mci
tab
ine
Re
leas
e (
%)
Time (hours)

86
3.4.3 In Vitro Cytotoxicity Studies of Bare and Gemcitabine Loaded PHB-
MNPs
Cytotoxicities of PHB-MNPs, free Gemcitabine and Gemcitabine loaded PHB-MNPs
on SKBR-3 and MCF-7 breast cancer cell lines were investigated by XTT cell
proliferation assay. MCF-7 and SKBR-7 cells were treated with bare PHB-MNPS
for 72 hours in 96- well plates. After incubation period, cell viability profiles were
determined for each cell type.
Previously, Yalcin et al. (2014) reported empty PHB-MNPs were not cytotoxic in the
highest dose on PHB-MNPs (500 µg/ml) at Doxorubicin sensitive and resistance
MCF-7 cell lines (Yalcin et al. 2014 a) (Yalçın, S. et al. 2014 b).
Figure 3.36. Cytotoxicity of PHB-MNPs on MCF-7 and SKBR-3 cell lines.
0
20
40
60
80
100
120
0.830.560.370.250.160.110.070.02
Ce
ll Su
rviv
al (
%)
PHB-MNPs Concentration (mg/ml)
MCF-7 cell line
0
20
40
60
80
100
120
1.671.110.740.490.220.150.070.04
Ce
ll Su
rviv
al (
%)
PHB-MNPs Concentration (mg/ml)
SKBR cell line

87
Cell survival rates with PHB-MNPs indicated that there was no significant cytotoxic
effect of the nanoparticles on SKBR-3 cells up to 1.67 mg/ml, but has a little
cytotoxic effect on MCF-7 cell lines at high MNPs concentrations (above 0.5 mg/ml)
(Figure 3.36).
IC50 values for Gemcitabine and Gemcitabine conjugated PHB-MNPs were
determined at the 72 h treatments. IC50 were calculated from the logarithmic trend
line of the cell proliferation percentage versus concentration plots. Figures 3.37 and
3.38 demonstrated the antiproliferative effects of Gemcitabine loaded PHB-MNPs
with increasing concentrations on SKBR-3 and MCF-7 cell lines. IC50 values of
Gemcitabine and Gemcitabine loaded nanoparticles was about 6.5 μM and 3.5 μM
for SKBR-3 cells (Figure 3.37), and 3.9 μM and 1.98 μM for MCF-7 cell lines,
respectively (Figure 3.38).
As results indicated, Gemcitabine loaded PHB-MNPs were found as nearly 2 fold
more toxic on SKBR-3 and MCF-7 cells compared to free Gemcitabine. These
results showed that Gemcitabine conjugated PHB-MNPs are more effective over
breast cancer cell lines than free Gemcitabine and we claim that, this treatment could
overcome the drug resistance.
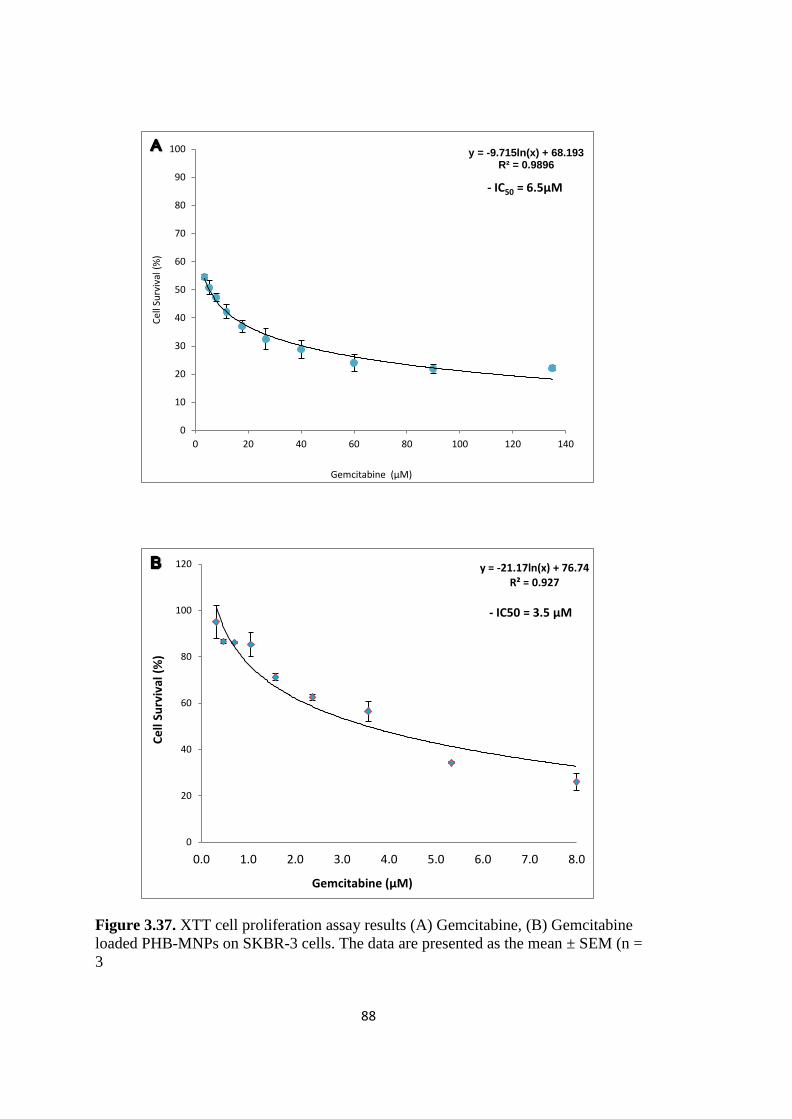
88
Figure 3.37. XTT cell proliferation assay results (A) Gemcitabine, (B) Gemcitabine
loaded PHB-MNPs on SKBR-3 cells. The data are presented as the mean ± SEM (n =
3
y = -9.715ln(x) + 68.193 R² = 0.9896
0
10
20
30
40
50
60
70
80
90
100
0 20 40 60 80 100 120 140
Cel
l Su
rviv
al (
%)
Gemcitabine (µM)
- IC50 = 6.5µM
y = -21.17ln(x) + 76.74 R² = 0.927
0
20
40
60
80
100
120
0.0 1.0 2.0 3.0 4.0 5.0 6.0 7.0 8.0
Ce
ll Su
rviv
al (
%)
Gemcitabine (µM)
- IC50 = 3.5 µM

89
Figure 3.38. XTT cell proliferation assay results (A) Gemcitabine, (B) Gemcitabine
loaded PHB-MNPs on MCF-7 cells. The data are presented as the mean ± SEM (n =
3)
y = -9.891ln(x) + 63.549 R² = 0.9142
0
20
40
60
80
100
120
0 10 20 30 40 50 60 70 80 90 100
Ce
ll Su
rviv
al (
%)
Gemcitabine Concentration (µM)
- IC50= 3.9 µM
y = -33.58ln(x) + 73.078 R² = 0.958
0
20
40
60
80
100
120
0.0 0.5 1.0 1.5 2.0 2.5 3.0 3.5 4.0 4.5 5.0 5.5 6.0 6.5
Ce
ll Su
rviv
al (
%)
Gem. Concentration (µM)
- IC50 = 1.98µM

90
3.5 Summary
PAMAM magnetic nanoparticles
(DcMNPs)
Chitosan magnetic nanoparticles
(CSMNPs)
PHB magnetic nanoparticles (PHB-MNPs)
Bare DcMNPs
Gem-DcMNPs
Bare CSMNPs
Gem-CSMNPs
Bare PHB-MNPs
Gem-PHB-MNPs
TEM results
12 nm
12-14
nm
4 nm
4 nm
13 nm
13-15
nm
XP
S re
sult
s Nitrogen atom% 8.2% 10.2% 2.1% 2.3% 0% 0%
Fluorine atom
- + - + - +
Zeta Potential results
-10.2 -4.85 -19.8 -8.66 19.9 mV 24.5 mV
pH Gem-
G5.5DcMNPs Gem-CSMNPs
Gem-PHB-MNPs
Loading amount 2
4h
7.2 7.2 µg 8.8 µg 6.5 µg
Release &
Stability
24
h 4.2 100% 65% 49%
5.2 100% 33% -
36
h
7.2 <5% <8% 19%
Bare-G5.5
DcMNPs Gem-G5.5 DcMNPs
Bare CSMNPs
Gem-CSMNPs
Bare PHB-MNPs
Gem-PHB-MNPs
MCF-7 (IC50=3.9
µM)
Nontoxic up to 800
µg/ml
3 fold decrease in IC50 value
Nontoxic up to 560
µg/ml
2.6 fold decrease in IC50 value
Nontoxic up to 500
µg/ml
2 fold decrease in IC50 value
SKBR-3 (IC50=6.5
µM)
Nontoxic up to 1670
µg/ml
6 fold decrease in IC50 value
Nontoxic up to 1110
µg/ml
1.4 fold decrease in IC50 value
Nontoxic up to 1670
µg/ml
2 fold decrease in IC50 value

91
CHAPTER 4
4 CONCLUSION
Magnetic Nanoparticles were synthesized to be used for targeting of tumor cells in
the presence of magnetic field. PAMAM, Chitosan and PHB coating around the
magnetic nanoparticles reduce the agglomeration, and provide surface functional
groups and internal cavities for conjugation or loading of therapeutics drugs.
The terminal amine group of full generation DcMNP with a Cationic bar reduces the
binding and encapsulating efficiency of PAMAM with cationic dCdF. Therefore, in
this study, the various half generation of PAMAM synthesized for achieving the
anionic PAMAM dendrimers. The supplementary tests confirmed the differences
between surface structure of half generations and full generation of PAMAM
DCMNPs.
Electrostatic interaction could be occurred between the carboxyl groups of weakly
acidic Gemcitabine and the amine groups of the half-generation synthesized
dendrimers. The chitosan and PHB magnetic nanoparticles loading amount were
nearly the same amount with half generation PAMAM dendrimer.
TEM images of Gemcitabine loaded MNPs showed the uniform shape and same size
with bare nanoparticles. The FT-IR and XPS analyses supported the drug loading
results of nanoparticles. The zeta-potential analysis indicated a decreased surface
charge in drug bounded anionic PAMAM and Chitosan nanoparticles and increased
surface charge in cationic PHB magnetic nanoparticles.
It was shown Gemcitabine release from magnetic nanoparticles were higher at pH
4.2 compared to pH 5.2. Then, the drug is expected to be released at the targeted

92
cancer cells, because the pH of tumor tissue and endosomes are acidic. Burst release
of Gemcitabine was resulted from DcMNPs at initial stage. Nearly the whole drug
was released within first 15h from DcMNPs in pH 4.2. At the same condition
Gemcitabine release from CSMNPs and PHB-MNPs showed the different release
pattern. Only 65% of drug from CSMNPs and 49% from PHB-MNPs at pH 4.2 were
released during 24h. These difference burst release were due to conjugation of drug
to the surface of DcMNPs which release whole drug in acidic condition, but in the
case of CSMNPs and PHB-MNPs it needs more time for released from interior
cavities.
The stability results indicated that Gemcitabine conjugated DcMNPs were highly
stable up to 6 weeks in PBS buffer. During 24h just around 4% of drug was released
from DcMNPs, but it showed nearly 2 and 5 fold more release in CSMNPs and PHB-
MNPs than DcMNPs. DcMNPs and PHB-MNPs were shown stable release after 15h,
while at CSMNPs burst release could be seen after 12h.
The bare half generation PAMAM dendrimers have no cytotoxicity on both cell lines
at high concentration. But high concentration of bare CSMNPs and PHB-MNPs
were shown negligible cytotoxic effect on the MCF-7 cell line. In addition, the IC50
values of SKBR-3 and MCF-7 cells lines decreased nearly 6 and 3 fold on
Gemcitabine conjugated DcMNPs, While the Gem-CSMNPs just decreased 1.4 and
2.6 fold and Gem-PHB-MNPs 2 fold. These results showed that Gemcitabine
conjugated MNPs were more effective over breast cancer cell lines.
As a conclusion, Gemcitabine was more effectively loaded on half-generations of
PAMAM DcMNPs when compared to full-generation and also the loaded
nanoparticles were found more toxic compared to free form of the drug. The results
of this study can provide new insights to the development of targeted drug delivery
systems in cancer therapy.

93
REFERENCES
A.K. Gupta, M. Gupta. 2005. “Synthesis and Surface Engineering of Iron Oxide
Nano- Particles for Biomedical Applications.”
Ahmed, M., and M. Douek. 2013. “The Role of Magnetic Nanoparticles in the
Localization and Treatment of Breast Cancer.” BioMed Research Inernational
2013:281230. Retrieved June 19, 2014
(http://www.pubmedcentral.nih.gov/articlerender.fcgi?artid=3722907&tool=pm
centrez&rendertype=abstract).
Alexander, RL, and BT Greene. 2005. “A Novel Phospholipid Gemcitabine
Conjugate Is Able to Bypass Three Drug-Resistance Mechanisms.” Cancer
Chemotherapy and Pharmacology 15–21. Retrieved July 17, 2013
(http://link.springer.com/article/10.1007/s00280-004-0949-0).
Althuri, Avanthi et al. 2013. “Microbial Synthesis of Poly-3-Hydroxybutyrate and Its
Application as Targeted Drug Delivery Vehicle.” Bioresource Technology
145:290–96. Retrieved September 25, 2014
(http://www.ncbi.nlm.nih.gov/pubmed/23415943).
American Cancer Society. 2013. “No Title.” Retrieved
(http://www.cancer.org/treatment/treatmentsandsideeffects/guidetocancerdrugs/
gemcitabine). Last accessed date: August 06,2014.
Arias, José L., L. Harivardhan Reddy, and Patrick Couvreur. 2011. “Superior
Preclinical Efficacy of Gemcitabine Developed as Chitosan Nanoparticulate
System.” Biomacromolecules 12(1):97–104. Retrieved July 21, 2012
(http://www.ncbi.nlm.nih.gov/pubmed/21117615).
Arruebo, Manuel, Rodrigo Fernández-pacheco, M. Ricardo Ibarra, and Jesús
Santamaría. 2007. “Magnetic Nanoparticles for Drug Delivery.” 2(3):22–32.
Arya, Geetanjali, Mallaredy Vandana, Sarbari Acharya, and Sanjeeb K. Sahoo. 2011.
“Enhanced Antiproliferative Activity of Herceptin (HER2)-Conjugated
Gemcitabine-Loaded Chitosan Nanoparticle in Pancreatic Cancer Therapy.”
Nanomedicine : Nanotechnology, Biology, and Medicine 7(6):859–70.
Retrieved November 12, 2013
(http://www.ncbi.nlm.nih.gov/pubmed/21550422).
Bharali, Dhruba J., Marianne Khalil, Mujgan Gurbuz, Tessa M. Simone, and Shaker
a Mousa. 2009. “Nanoparticles and Cancer Therapy: A Concise Review with

94
Emphasis on Dendrimers.” International Journal of Nanomedicine 4:1–7.
Retrieved July 17, 2012
(http://www.pubmedcentral.nih.gov/articlerender.fcgi?artid=2720735&tool=pm
centrez&rendertype=abstract).
Bildstein, L. Dubernet, C. Marsaud, V. Chacun, H. Nicolas, V. Gueutin, C. Sarasin,
A.Bénech, H. Lepêtre-Mouelhi, S. Desmaële, D. Couvreur, P. 2010b.
“Transmembrane Diffusion of Gemcitabine by a Nanoparticulate Squalenoyl
Prodrug: An Original Drug Delivery Pathway.” Journal of Controlled Release :
Official Journal of the Controlled Release Society 147(2):163–70. Retrieved
November 12, 2013 (http://www.ncbi.nlm.nih.gov/pubmed/20691740).
Bildstein, L., C. Dubernet, and P. Couvreur. 2011. “Prodrug-Based Intracellular
Delivery of Anticancer Agents.” Advanced Drug Delivery Reviews 63(1-2):3–
23. Retrieved May 30, 2013 (http://www.ncbi.nlm.nih.gov/pubmed/21237228).
Boas, u ; Christensen, J.B; Heegaard, P. M. .. 2006. “Dendrimers : Design ,
Synthesis.” Dendrimers in Medicine and Biotechnology. New Moleculat Tools
(978-0-85404-852-6):28. Retrieved May 20, 2011
(http://www.springer.com/978-0-85404-852-6).
Cancer.gov. 2014a. “Defining Cancer.” Retrieved
(http://www.cancer.gov/cancertopics/cancerlibrary/what-is-cancer). Last
accessed date March 07, 2014
Cancer.gov. 2014b. “Definition of Breast Cancer.” Retrieved
(http://www.cancer.gov/cancertopics/types/breast). Last accessed date: March
07, 2014.
cancer.gov. n.d. “www.cancer.gov/cancertopics/cancerlibrary/what-Is-Cancer.” Last
accessed date: March 07, 2014.
Cancerquest. 2014. “How Cancer Begins.” Retrieved
(http://www.cancerquest.org/how-cancer-begins introduction.html). Last
accessed date: Agusut 09, 2012.
Chaijamrus, S., and N. Udpuay. 2008. “Production and Characterization of
Polyhydroxybutyrate from Molasses and Corn Steep Liquor Produced by
Bacillus Megaterium ATCC 6748.” Agricultural Engineering International: …
X:1–12. Retrieved September 25, 2014
(http://www.cigrjournal.org/index.php/Ejounral/article/view/1216).
Chitkara, Deepak, Anupama Mittal, Stephan W. Behrman, Neeraj Kumar, and Ram
I. Mahato. 2013. “Self-Assembling, Amphiphilic Polymer-Gemcitabine
Conjugate Shows Enhanced Antitumor Efficacy against Human Pancreatic

95
Adenocarcinoma.” Bioconjugate Chemistry 24(7):1161–73. Retrieved May 30,
2014 (http://www.ncbi.nlm.nih.gov/pubmed/23758084).
Cho, Y. W., J. Jang, C. R. Park, and S. W. Ko. 2000. “Preparation and Solubility in
Acid and Water of Partially Deacetylated Chitins.” Biomacromolecules
1(4):609–14. Retrieved May 30, 2010
(http://www.ncbi.nlm.nih.gov/pubmed/11710189).
Choi, Jong-il, and Sang Yup Lee. 1999. “High-Level Production of Te ) by Fed-
Batch Culture of Recombinant Escherichia Coli High-Level Production of Poly
( 3-Hydroxybutyrate-Co-3- Hydroxyvalerate ) by Fed-Batch Culture of
Recombinant Escherichia Coli.”
Crosta, Peter. 2014. “Cancer.” Medical News Today. Retrieved November 30, 2014
(http://www.medicalnewstoday.com/info/cancer-oncology/).
Danhier, Fabienne, Olivier Feron, and Véronique Préat. 2010. “To Exploit the Tumor
Microenvironment: Passive and Active Tumor Targeting of Nanocarriers for
Anti-Cancer Drug Delivery.” Journal of Controlled Release : official journal of
the Controlled Release Society 148(2):135–46. Retrieved May 26, 2014
(http://www.ncbi.nlm.nih.gov/pubmed/20797419).
DeSantis, Carol, Rebecca Siegel, and Ahmedin Jemal. 2012. “Breast Cancer Facts &
Figures Is a Publication of the American Cancer Society, Atlanta, Georgia.”
American Cancer Society.
Dobrovolskaia, Marina A. et al. 2013. “Nanoparticle Size and Surface Charge
Determine Effects of PAMAM Dendrimers on Human Platelets in Vitro.” NIH
Public Access 9(3):382–93.
Douziech-Eyrolles, Laurence et al. 2007. “Nanovectors for Anticancer Agents Based
on Superparamagnetic Iron Oxide Nanoparticles.” International Journal of
Nanomedicine 2(4):541–50. Retrieved November 12, 2011
(http://www.pubmedcentral.nih.gov/articlerender.fcgi?artid=2676819&tool=pm
centrez&rendertype=abstract).
Egusquiaguirre, Susana Patricia, Manuela Igartua, Rosa María Hernández, and José
Luis Pedraz. 2012. “Nanoparticle Delivery Systems for Cancer Therapy:
Advances in Clinical and Preclinical Research.” Clinical & Translational
Oncology : official publication of the Federation of Spanish Oncology Societies
and of the National Cancer Institute of Mexico 14(2):83–93. Retrieved
November 12, 2013 (http://www.ncbi.nlm.nih.gov/pubmed/22301396).
Gao, Jinhao, Hongwei Gu, and Bing Xu. 2009. “Multifunctional Magnetic
Nanoparticles: Design, Synthesis, and Biomedical Applications.” Accounts of
Chemical Research 42(8):1097–1107.
96
Garg, Neeraj K., Priya Dwivedi, Christopher Campbell, and Rajeev K. Tyagi. 2012.
“Site Specific/targeted Delivery of Gemcitabine through Anisamide Anchored
Chitosan/poly Ethylene Glycol Nanoparticles: An Improved Understanding of
Lung Cancer Therapeutic Intervention.” European Journal of Pharmaceutical
Sciences : official journal of the European Federation for Pharmaceutical
Sciences 47(5):1006–14. Retrieved August 6, 2014
(http://www.ncbi.nlm.nih.gov/pubmed/23041219).
Garg, Tarun, and Onkar Singh. 2011. “Dendrimer: A Novel Scaffold for Drug
Delivery.” International Journal of Pharmaceutical Sciences Review and
Research 7(2). Retrieved September 25, 2014 (www.globalresearchonline.net ).
Gillies, Elizabeth R., and Jean M. J. Fréchet. 2005. “Dendrimers and Dendritic
Polymers in Drug Delivery Well as Agents for Both Boron Neutron Capture
Therapy and Photodynamic Therapy . REVIEWS.” Drug Discovery Today
10(1). Retrieved November 12, 2011 ( www.drugdiscoverytoday.com).
Gomez, M. Victoria, Javier Guerra, V. Sue Myers, Richard M. Crooks, and Aldrik H.
Velders. 2009. “Nanoparticle Size Determination by (1)H NMR Spectroscopy.”
Journal of the American Chemical Society 131(41):14634–35. Retrieved
November 12, 2013 (http://www.ncbi.nlm.nih.gov/pubmed/19785420).
Gu, FX, R. Karnik, and AZ Wang. 2007. “Targeted Nanoparticles for Cancer
Therapy.” Nano today. Retrieved September 25, 2014
(http://www.sciencedirect.com/science/article/pii/S174801320770083X).
Holliday, Deborah L., and Valerie Speirs. 2011. “Choosing the Right Cell Line for
Breast Cancer Research.” Breast Cancer Research : BCR 13(4):215. Retrieved
(http://www.pubmedcentral.nih.gov/articlerender.fcgi?artid=3236329&tool=pm
centrez&rendertype=abstract).
Hu, Che-Ming Jack, Santosh Aryal, and Liangfang Zhang. 2010. “Nanoparticle-
Assisted Combination Therapies for Effective Cancer Treatment.” Therapeutic
Delivery 1(2):323–34. Retrieved September 25, 2014
(http://www.ncbi.nlm.nih.gov/pubmed/22816135).
Ibezim, Emmanuel Chinedum, Cristina Tristao Andrade, Cristina Marcia, Bianca
Barretto, and Damian Chukwu Odimegwu. 2011. “Ionically Cross-Linked
Chitosan / Tripolyphosphate Microparticles for the Controlled Delivery of
Pyrimethamine.” Ibnosina Journal of Medicine and Biomedical Sciences 77–88.
Retrieved September 15, 2013 (http://www.ijmbs.org).
Inkyo, Mitsugi et al. 2006. “Experimental Investigation of Nanoparticle Dispersion
by Beads Milling with Centrifugal Bead Separation.” Journal of Colloid and
Interface Science 304(2):535–40. Retrieved November 12, 2013
(http://www.ncbi.nlm.nih.gov/pubmed/17022990).

97
Ito, Akira, Masashige Shinkai, Hiroyuki Honda, and Takeshi Kobayashi. 2005.
“Medical Application of Functionalized Magnetic Nanoparticles.” Journal of
Boscience and Bioengineering 100(1):1–11. Retrieved November 7, 2013
(http://www.ncbi.nlm.nih.gov/pubmed/16233845).
Jain, Amit, Subodh Dubey, Atul Kaushik, and A. Tyagi. 2010. “Dendrimer: A
Complete Drug Carrier.” International Journal of Pharmaceutical Sciences and
Research 1(4):38–52. Retrieved September 25, 2014 (www.ijpsr.com).
Jin, Geun Woo et al. 2011. “PAMAM Dendrimer with a 1,2-Diaminoethane Surface
Facilitates Endosomal Escape for Enhanced pDNA Delivery.” Polymer
52(2):339–46. Retrieved September 25, 2014
(http://www.sciencedirect.com/science/article/pii/S0032386110010104).
Kamaly, N., and Z. Xiao. 2012. “Targeted Polymeric Therapeutic Nanoparticles:
Design, Development and Clinical Translation.” Chemical Society …
41(7):2971–3010. Retrieved September 25, 2014
(http://pubs.rsc.org/en/content/articlehtml/2012/cs/c2cs15344k).
Khaira, Rekha, Jyoti Sharma, and Vinay Saini. 2014. “Development and
Characterization of Nanoparticles for the Delivery of Gemcitabine
Hydrochloride.” The Scientific World Journal 2014:560962. Retrieved October
25, 2014
(http://www.pubmedcentral.nih.gov/articlerender.fcgi?artid=3925564&tool=pm
centrez&rendertype=abstract).
Khodadust, Rouhollah, Gozde Unsoy, Serap Yalcın, Gungor Gunduz, and Ufuk
Gunduz. 2013. “PAMAM Dendrimer-Coated Iron Oxide Nanoparticles:
Synthesis and Characterization of Different Generations.” Journal of
Nanoparticle Research 15(3):1488. Retrieved May 31, 2014
(http://link.springer.com/10.1007/s11051-013-1488-6).
Kievit, Forrest M. et al. 2009. “PEI-PEG-Chitosan Copolymer Coated Iron Oxide
Nanoparticles for Safe Gene Delivery: Synthesis, Complexation, and
Transfection.” Advanced Functional Materials 19(14):2244–51. Retrieved May
31, 2014
(http://www.pubmedcentral.nih.gov/articlerender.fcgi?artid=2756666&tool=pm
centrez&rendertype=abstract).
Lansakara-P, Dharmika S. P., B. Leticia Rodriguez, and Zhengrong Cui. 2012.
“Synthesis and in Vitro Evaluation of Novel Lipophilic Monophosphorylated
Gemcitabine Derivatives and Their Nanoparticles.” International Journal of
Pharmaceutics 429(1-2):123–34. Retrieved July 17, 2013
(http://www.pubmedcentral.nih.gov/articlerender.fcgi?artid=3335205&tool=pm
centrez&rendertype=abstract).

98
Larsson, Mikael, Anna Bergstrand, Lilyan Mesiah, Celine Van Vooren, and Anette
Larsson. 2014. “Nanocomposites of Polyacrylic Acid Nanogels and
Biodegradable Polyhydroxybutyrate for Bone Regeneration and Drug
Delivery.” Journal of Nanomaterials 2014:1–9. Retrieved September 25, 2014
(http://www.hindawi.com/journals/jnm/2014/371307/).
Liu Dechun, Chen Yanbin, Feng Xiaoshan, DengMiao, Xie Gangqiang, Wang
Jianguang, Zhang Like , Liu Qipeng, Yuan Pengfei. 2014. “Micellar
Nanoparticles Loaded with Gemcitabine and Doxorubicin Showed Synergistic
Effect.” Colloids and Surfaces. B, Biointerfaces 113:158–68. Retrieved May 15,
2014 (http://www.ncbi.nlm.nih.gov/pubmed/24077114).
Majoros, István J., Balázs Keszler, Scott Woehler, Tricia Bull, and James R. Baker.
2003. “Acetylation of Poly(amidoamine) Dendrimers.” Macromolecules
36(15):5526–29. Retrieved September 12, 2012
(http://pubs.acs.org/doi/abs/10.1021/ma021540e).
Maksimenko, Andrei et al. 2013. “Polyisoprenoyl Gemcitabine Conjugates Self
Assemble as Nanoparticles, Useful for Cancer Therapy.” Cancer Letters
334(2):346–53. Retrieved November 6, 2013
(http://www.ncbi.nlm.nih.gov/pubmed/22935679).
Martín-Banderas, Lucía et al. 2013. “Biocompatible Gemcitabine-Based
Nanomedicine Engineered by Flow Focusing for Efficient Antitumor Activity.”
International Journal of Pharmaceutics 443(1-2):103–9. Retrieved November
12, 2013 (http://www.ncbi.nlm.nih.gov/pubmed/23299085).
medscape.com. 2014. “712338-fig3.” Retrieved September 25, 2014
(http://www.medscape.com/viewarticle/712338_7). Last accessed date:
September 25, 2014
Mini, E., S. Nobili, B. Caciagli, I. Landini, and T. Mazzei. 2006. “Cellular
Pharmacology of Gemcitabine.” Annals of Oncology : official journal of the
European Society for Medical Oncology / ESMO 17 Suppl 5(Supplement 5):v7–
12. Retrieved November 12, 2013
(http://www.ncbi.nlm.nih.gov/pubmed/16807468).
Mohamed, Ali, Kenneth Krajewski, Burcu Cakar, and Cynthia X. Ma. 2013.
“Targeted Therapy for Breast Cancer.” The American Journal of Pathology
183(4):1096–1112. Retrieved November 12, 2013
(http://www.ncbi.nlm.nih.gov/pubmed/23988612).
National Cancer, Institute. 2014. “National Cancer Institute.” Retrieved September
25, 2014
(http://www.cancer.gov/cancertopics/understandingcancer/targetedtherapies/bre
astcancer_htmlcourse#a). Last accessed date: September 25, 2014

99
Nune, SK, and Padmaja Gunda. 2009. “Nanoparticles for Biomedical Imaging.” NIH
Public Access 6(11):1175–94. Retrieved September 25, 2014
(http://informahealthcare.com/doi/abs/10.1517/17425240903229031).
Pan, G. 2005. “Studies on PEGylated and Drug-Loaded PAMAM Dendrimers.”
Journal of Bioactive and Compatible Polymers 20(1):113–28. Retrieved May
31, 2014 (http://jbc.sagepub.com/cgi/doi/10.1177/0883911505049656).
Piddubnyak, Valeria et al. 2004. “Oligo-3-Hydroxybutyrates as Potential Carriers for
Drug Delivery.” Biomaterials 25(22):5271–79. Retrieved September 25, 2014
(http://www.ncbi.nlm.nih.gov/pubmed/15110478).
Robinson, Blaine W. et al. 2001. “Radiosensitization by Gemcitabine in p53 Wild-
Type and Mutant MCF-7 Breast Carcinoma Cell Lines Radiosensitization by
Gemcitabine in p53 Wild-Type and Mutant.” American Association for Cancer
Research 2581–89. Retrieved September 12, 2012
(http://clincancerres.aacrjournals.org/content/7/8/2581).
Rodrigues, Susana, Marita Dionísio, Carmen Remuñán López, and Ana Grenha.
2012. “Biocompatibility of Chitosan Carriers with Application in Drug
Delivery.” Journal of Functional Biomaterials 3(4):615–41. Retrieved January
12, 2014 (http://www.mdpi.com/2079-4983/3/3/615/).
Rouhollah, Khodadust, and Mutlu Pelin. 2013. “Doxorubicin Loading, Release, and
Stability of Polyamidoamine Dendrimer‐ coated Magnetic Nanoparticles.”
Journal of … 102(6):1825–35. Retrieved September 25, 2014
(http://onlinelibrary.wiley.com/doi/10.1002/jps.23524/full).
Sawyers, Charles. 2004. “Targeted Cancer Therapy.” Nature 432(7015):294–97.
Retrieved September 25, 2013
(http://www.ncbi.nlm.nih.gov/pubmed/15549090).
Shcharbin, D. G., B. Klajnert, and M. Bryszewska. 2009. “Dendrimers in Gene
Transfection.” Biochemistry 74(10):1070–79. Retrieved May 31, 2014
(http://www.ncbi.nlm.nih.gov/pubmed/19916919).
Sloata Brian R., Sandovala Michael A, Lib Dong, Chunga Woon-Gye , Lansakara-Pa
Dharmika S.P., Proteaub Philip J., Kiguchic Kaoru, DiGiovannic John, Cui
Zhengrong. 2011. “In Vitro and in Vivo Anti-Tumor Activities of a Gemcitabine
Derivative Carried by Nanoparticles.” International Journal of Pharmaceutics
409(1-2):278–88. Retrieved November 12, 2013
(http://www.pubmedcentral.nih.gov/articlerender.fcgi?artid=3079786&tool=pm
centrez&rendertype=abstract).

100
Sun, Conroy, Jerry S. H. Lee, and Miqin Zhang. 2008. “Magnetic Nanoparticles in
MR Imaging and Drug Delivery.” Advanced Drug Delivery Reviews
60(11):1252–65. Retrieved November 12, 2013
(http://www.pubmedcentral.nih.gov/articlerender.fcgi?artid=2702670&tool=pm
centrez&rendertype=abstract).
Svenson, Sönke, and Donald a Tomalia. 2005. “Dendrimers in Biomedical
Applications--Reflections on the Field.” Advanced Drug Delivery Reviews
57(15):2106–29. Retrieved December 12, 2013
(http://www.ncbi.nlm.nih.gov/pubmed/16305813).
Taghavi Pourianazar, Negar, Pelin Mutlu, and Ufuk Gunduz. 2014. “Bioapplications
of Poly(amidoamine) (PAMAM) Dendrimers in Nanomedicine.” Journal of
Nanoparticle Research 16(4):2342. Retrieved May 15, 2014
(http://link.springer.com/10.1007/s11051-014-2342-1).
Unsoy, Gozde, Serap Yalcin, Rouhollah Khodadust, Gungor Gunduz, and Ufuk
Gunduz. 2012. “Synthesis Optimization and Characterization of Chitosan-
Coated Iron Oxide Nanoparticles Produced for Biomedical Applications.”
Journal of Nanoparticle Research 14(11):964. Retrieved January 12, 2014
(http://link.springer.com/10.1007/s11051-012-0964-8).
Vasumathi, V., and Prabal K. Maiti. 2010. “Complexation of siRNA with
Dendrimer: A Molecular Modeling Approach.” Macromolecules 43(19):8264–
74. Retrieved November 12, 2013
(http://pubs.acs.org/doi/abs/10.1021/ma1012495).
Viota, J L, Carazo, A., Munoz-Gamez, J a, Rudzka, K., Gómez-Sotomayor, R., Ruiz-
Extremera, A., Salmerón, J., Delgado, a V. 2013. “Functionalized Magnetic
Nanoparticles as Vehicles for the Delivery of the Antitumor Drug Gemcitabine
to Tumor Cells. Physicochemical in Vitro Evaluation.” Materials Science &
Engineering. C, Materials for Biological Applications 33(3):1183–92. Retrieved
November 12, 2013 (http://www.ncbi.nlm.nih.gov/pubmed/23827558).
Walter, Marie V, and Michael Malkoch. 2012. “Simplifying the Synthesis of
Dendrimers: Accelerated Approaches.” Chemical Society Reviews 41(13):4593–
4609. Retrieved May 31, 2014
(http://www.ncbi.nlm.nih.gov/pubmed/22592560).
Wilczewska, Agnieszka Z., Katarzyna Niemirowicz, Karolina H. Markiewicz, and
Halina Car. 2012. “Nanoparticles as Drug Delivery Systems.” Pharmacological
reports : PR 64(5):1020–37. Retrieved May 31, 2014
(http://www.ncbi.nlm.nih.gov/pubmed/24124007).
Xiong, Yu-Cui, Yong-Chao Yao, Xiao-Yong Zhan, and Guo-Qiang Chen. 2010.
“Application of Polyhydroxyalkanoates Nanoparticles as Intracellular Sustained

101
Drug-Release Vectors.” Journal of Biomaterials Science. Polymer Edition
21(1):127–40. Retrieved September 25, 2014
(http://www.ncbi.nlm.nih.gov/pubmed/20040158).
Yalcin, Serap. n.d. “Synthesis and Characterization of Poly-Hydroxybutyrate (PHB)
Coated Magnetic Nanoparticles as Biodegradable Drug Delivery Agent.”
Yalcin, Serap, Gozde Unsoy, Pelin Mutlu, Rouhollah Khodadust, and Ufuk Gunduz.
2014. “Polyhydroxybutyrate-Coated Magnetic Nanoparticles for Doxorubicin
Delivery: Cytotoxic Effect Against Doxorubicin-Resistant Breast Cancer Cell
Line.” American journal of therapeutics (1):2–11. Retrieved
(http://www.ncbi.nlm.nih.gov/pubmed/25137407).
Yalçın, S. ; Khodadust, R. ; Ünsoy, G.; Garip, I.C. ; Mumcuoğlu, Z.D. ; Gündüz, U.
2014. “Synthesis and Characterization of Poly-Hydroxybutyrate (PHB) Coated
Magnetic Nanoparticles: Toxicity Analyses on Different Cell Lines.” Synthesis
and Reactivity in Inorganic, Metal-Organic, and Nano-Metal Chemistry S.
Yang Yang, Suhair Sunoqrot, Chelsea Stowell, Jingli Ji, Chan-Woo Lee, Jin Woong
Kim, Seema A. Khan, and Seungpyo Hong. 2012. “Effect of Size, Surface
Charge, and Hydrophobicity of Poly(amidoamine) Dendrimers on Their Skin
Penetration.” Biomacromolecules 13(7):2154–62.

102

103
APPENDIX A
Additional Analysis of PAMAM DcMNPs
A.1. Loading of Gemcitabine on Generation 4 and 7 of DcMNPs
In our initial attempts, we tried to load Gemcitabine (7.5, 15 and 22.5 µg/ml) on 2.5
mg/ml of PAMAM dendrimers (G4-DcMNP and G7-DcMNP) at methanol, PBS,
water and TPP. However, Gemcitabine binding was not observed on full generations
of (G4 and G7)PAMAM dendrimers.
Table A. 1. Effect of initial drug concentration and solvent on encapsulation
efficiency of G4 and G7 DcMNPs at various solvents.
Drug Concentration
7.5 µg/ml 15 µg/ml 22.5 µg/ml
Methanol 0 0 0.9 µg
PBS 0 0 1.35 µg
Dis Water 0 0 0

104
A.2. PAMAM Dendrimer Synthesized with Mechanical Stirrer
The adding of methylacrylate methanol solution and ethylenediamine-methanol
solution for coating the DCMNPs, were also done by mechanical stirrer at room
temperature. The results of conjugation efficacy of Gemcitabine to these DcMNPs
did not shown so much difference with ultrasonic synthesized DcMNPs.
Figure A. 2 Gemcitabine conjugation efficiency of various half – generation of
PAMAM dendrimer synthesized with mechanical stirrer.

105
A.3. Zeta (ζ) Potential Analysis
The zeta potential values for different half-generation of DcMNPs were measured at
pH 7.2.
Table A. 2. Zeta potential results for different half generations of PAMAM number.
Generation
number of
PAMAM
G4.5 G5.5 G6.5 G7.5
-2.28 -10.2 -6.68 -4.14

106
A.4.Fourier Transform-Infrared spectroscopy (FT-IR)
FT-IR spectra of Gemcitabine conjugated G4.5 and G7.5 PAMAM dendrimer coated
magnetic nanoparticles, band at 2800-3000 cm−1
showed the interaction of DcMNPs
and NH group of drug molecule.
Figure A. 2. FT-IR spectra of Gemcitabine, G4.5MNP and G4.5MNPs conjugated by
7.5, 15 and 22.5 µg/ml Gemcitabine.
Figure A. 3. FT-IR spectra for GEM-G7.5 DcMNP. Difference between
Gemcitabine, DcMNPs and Gem-DcMNPs.
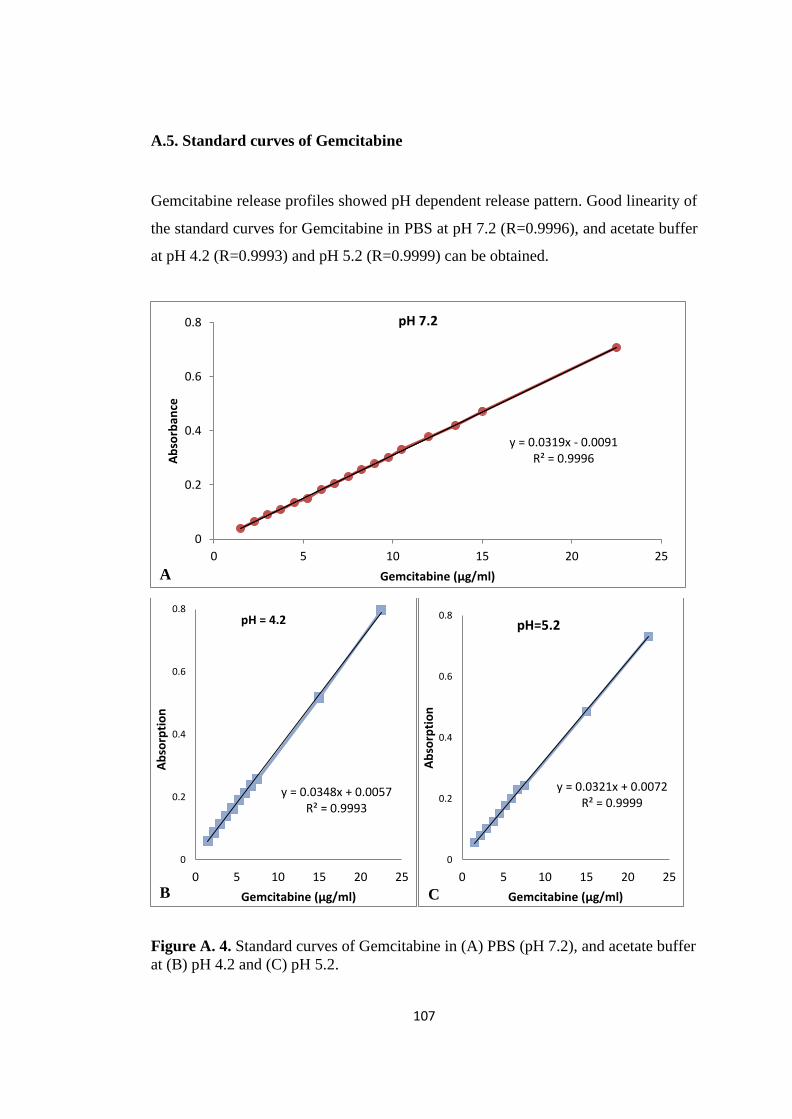
107
A.5. Standard curves of Gemcitabine
Gemcitabine release profiles showed pH dependent release pattern. Good linearity of
the standard curves for Gemcitabine in PBS at pH 7.2 (R=0.9996), and acetate buffer
at pH 4.2 (R=0.9993) and pH 5.2 (R=0.9999) can be obtained.
Figure A. 4. Standard curves of Gemcitabine in (A) PBS (pH 7.2), and acetate buffer
at (B) pH 4.2 and (C) pH 5.2.
y = 0.0319x - 0.0091 R² = 0.9996
0
0.2
0.4
0.6
0.8
0 5 10 15 20 25
Ab
sorb
ance
Gemcitabine (µg/ml)
pH 7.2
y = 0.0348x + 0.0057 R² = 0.9993
0
0.2
0.4
0.6
0.8
0 5 10 15 20 25
Ab
sorp
tio
n
Gemcitabine (µg/ml)
pH = 4.2
y = 0.0321x + 0.0072 R² = 0.9999
0
0.2
0.4
0.6
0.8
0 5 10 15 20 25
Ab
sorp
tio
n
Gemcitabine (µg/ml)
pH=5.2
A
B C

108
A.6. XTT Cell Proliferation Assay
Figure A. 5. Schematic representation of MCF-7 (6x10³cells/well) cells seeded to 96
well plates and treated by bare DcMNPs, 4h after XTT regent addition to plate.
Figure A. 6. Schematic representation of MCF-7 (6x10³cells/well) cells seeded to 96
well plates and treated by Gemcitabine conjugated DcMNPs, 4h after XTT regent
addition to plate.

109
A.7. Light Microscopy Images of MCF-7 Cells
Figure A. 7. Cellular internalization of DcMNPs by light microscopy (A) MCF-7
(6x10³cells/well) cells. (B) Bare DcMNPs treated MCF-7 cells. (C) lowest drug dose
(2.5 µM) treated MCF-7 cells. (D). Highest drug dose (90 µM) treated MCF-7 cells

110
APPENDIX B
Additional Analysis of CSMNPs
B.1. Loading of Gemcitabine on CSMNPs
Gemcitabine loading was investigated at different drug dilutions (7.5, 15 and 22.5
µg/ml) using 2.5 mg/ml of CSMNPs in various solvents were done.
Table B. 2. Loading efficiencies of different initial Gemcitabine loading
concentrations on 2.5 mg/ml Chitosan magnetic nanoparticles in various solvents.
Drug
concentration 7.5 µg/ml 15 µg/ml 22.5 µg/ml
TPP 25% 0 0
PBS (pH 7) 29.4% 17% 6%
PPB (pH 7.2) 20% 10% 6.2%
PPB (pH 6.2) 16% 15% 14.3%
PPB (pH 6) 7.4% 3% 0