SYNTHESIS AND CHARACTERIZATION OF MULTIWALL ... - …studentsrepo.um.edu.my/7283/1/Thesis.pdf ·...
269
SYNTHESIS AND CHARACTERIZATION OF MULTIWALL CARBON NANOTUBES USING MICROWAVE HEATING FOR REMOVAL OF HEAVY METALS MUBARAK MUJAWAR A THESIS SUBMITTED IN FULFILMENT OF THE REQUIREMENTS FOR THE DEGREE OF DOCTOR OF PHILOSOPHY FACULTY OF ENGINEERING UNIVERSITY OF MALAYA KUALA LUMPUR 2015
-
Upload
phamkhuong -
Category
Documents
-
view
227 -
download
0
Transcript of SYNTHESIS AND CHARACTERIZATION OF MULTIWALL ... - …studentsrepo.um.edu.my/7283/1/Thesis.pdf ·...

SYNTHESIS AND CHARACTERIZATION OF MULTIWALL
CARBON NANOTUBES USING MICROWAVE HEATING
FOR REMOVAL OF HEAVY METALS
MUBARAK MUJAWAR
A THESIS SUBMITTED IN FULFILMENT OF THE
REQUIREMENTS FOR THE DEGREE OF DOCTOR OF
PHILOSOPHY
FACULTY OF ENGINEERING
UNIVERSITY OF MALAYA
KUALA LUMPUR
2015

ii
ORIGINAL LITERARY WORK DECLARATION
Name of Candidate: MUBARAK MUJAWAR (I.C/Passport No.: F7864962)
Registration/Matric No.: KHA110085
Name of Degree: Doctor of Philosophy (Ph.D.)
Title of Project Paper/Research Report/Dissertation/Thesis (“this Work”):
SYNTHESIS AND CHARACTERIZATION OF MULTIWALL CARBON NANOTUBES USING
MICROWAVE HEATING FOR REMOVAL OF HEAVY METALS
Field of Study: Chemical Engineering
I do solemnly and sincerely declare that:
(1) I am the sole author/writer of this Work;
(2) This Work is original; (3) Any use of any work in which copyright exists was done by way of fair dealing and for
permitted purposes and any excerpt or extract from, or reference to or reproduction of any
copyright work has been disclosed expressly and sufficiently and the title of the Work and its
authorship have been acknowledged in this Work;
(4) I do not have any actual knowledge nor ought I reasonably to know that the making of this work
constitutes an infringement of any copyright work;
(5) I hereby assign all and every rights in the copyright to this Work to the University of Malaya
(―UM‖), who henceforth shall be owner of the copyright in this Work and that any reproduction
or use in any form or by any means whatsoever is prohibited without the written consent of UM
having been first had and obtained;
(6) I am fully aware that if in the course of making this Work I have infringed any copyright
whether intentionally or otherwise, I may be subject to legal action or any other action as may be determined by UM.
Candidate’s Signature Date:
Subscribed and solemnly declared before,
Witness’s Signature Date:
Name:
Designation: Department of Chemical Engineering,
Faculty of Engineering, University of Malaya, Kuala Lumpur, 50603, Malaysia
Tel. /Fax: +60105491759/03- 79675319

iii
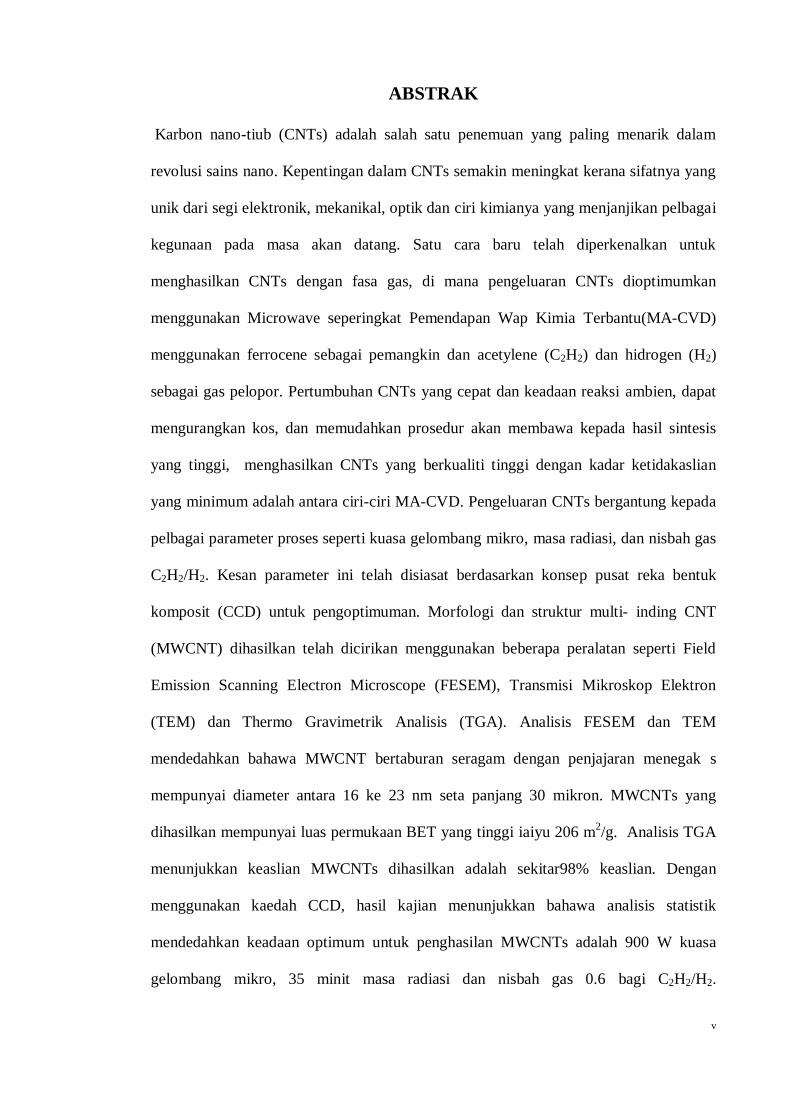
ABSTRACT
Carbon nanotubes (CNTs) are among the most eminent materials in the first rank of the
nanotechnology revolution. The most eye-catching features of these structures are their
electronic, mechanical, optical and chemical characteristics, which open a way for
future applications. A new method is introduced for synthesis of CNTs by gas phase,
single stage microwave assisted chemical vapor deposition (MA-CVD) using ferrocene
as a catalyst and acetylene (C2H2) and hydrogen (H2) as precursor gases. A fast CNTs
growth and ambient reaction condition, lowers the cost, and simplifies the procedure
leading to a high yield synthesis of high-quality CNTs with minimal impurity are
among the characteristics of the MA-CVD. Production of CNTs depends on various
process parameters such as microwave power, radiation time, and gas ratio of C2H2/H2
and further investigation was based on the central composite design (CCD) for
optimization. The morphology and structures of multiwall carbon nanotubes
(MWCNTs) produced were characterized using Field Emission Scanning Electron
Microscope (FESEM), Transmission Electron Microscope (TEM) and Thermo
Gravimetric Analysis (TGA). FESEM and TEM analyses revealed that the uniformly
dispersed vertical alignment of MWCNTs have diameters ranging from 16 to 23 nm and
30 micron long and high BET surface area of 206 m2/g. The TGA analysis showed that
the purity of MWCNTs produced is around 98% purity. Results reveal that the
optimized conditions for MWCNTs production were 900 W microwave power, 35 min
radiation time, and 0.6 gas ratio of C2H2/H2. Removal of heavy metal from industrial
waste water leads to the biggest challenge nowadays due to it the novel MWCNTs
samples are tested for performances in the removal of heavy metals. The effect of
process parameters such as pH, MWCNTs dosage, agitation speed and adsorption time
were investigated using a CCD. The optimization and kinetic study on the removal of

iv
Pb (II), Cd (II), Cu (II) and Zn (II) using novel MWCNTs was conducted. Maximum
adsorption capacities (qm) for Pb (II), Cd (II), Cu (II) and Zn (II) ions were obtained as
104.2, 88.62, 99 and 90.9 mg/g, respectively. Analysis of results revealed that the
optimum conditions for the highest removal (99.9%) of Pb (II) and (98.8%) Cd (II)
were recorded to have pH 5, MWCNTs dosage 0.1 g, contact time 22.5 min for Pb (II)
and 50 min for Cd (II) and agitation speed of 160 rpm, respectively, with the initial
concentration of 10 mg/l. In addition, statistical analysis revealed that the optimum
conditions for the highest removal (99%) of Cu (II) and (99.9%) Zn (II) were recorded
to have pH 5.5, and pH10 MWCNTs dosage 0.1 and 0.05 g, contact time 35 min for Cu
(II) and 60 min for Zn (II) and agitation speed of 160 rpm for Cu (II) and 120 rpm for
Zn (II) respectively. The Langmuir and Freundlich isotherm models matched the
experimental data very well and adsorption kinetic obeyed pseudo-second for Pb (II),
Cd (II), Cu (II) and Zn (II). The results proved that MWCNTs can be used as an
effective adsorbent due to the high adsorption capacity as well as the short adsorption
time needed to achieve equilibrium.
.
v
ABSTRAK
Karbon nano-tiub (CNTs) adalah salah satu penemuan yang paling menarik dalam
revolusi sains nano. Kepentingan dalam CNTs semakin meningkat kerana sifatnya yang
unik dari segi elektronik, mekanikal, optik dan ciri kimianya yang menjanjikan pelbagai
kegunaan pada masa akan datang. Satu cara baru telah diperkenalkan untuk
menghasilkan CNTs dengan fasa gas, di mana pengeluaran CNTs dioptimumkan
menggunakan Microwave seperingkat Pemendapan Wap Kimia Terbantu(MA-CVD)
menggunakan ferrocene sebagai pemangkin dan acetylene (C2H2) dan hidrogen (H2)
sebagai gas pelopor. Pertumbuhan CNTs yang cepat dan keadaan reaksi ambien, dapat
mengurangkan kos, dan memudahkan prosedur akan membawa kepada hasil sintesis
yang tinggi, menghasilkan CNTs yang berkualiti tinggi dengan kadar ketidakaslian
yang minimum adalah antara ciri-ciri MA-CVD. Pengeluaran CNTs bergantung kepada
pelbagai parameter proses seperti kuasa gelombang mikro, masa radiasi, dan nisbah gas
C2H2/H2. Kesan parameter ini telah disiasat berdasarkan konsep pusat reka bentuk
komposit (CCD) untuk pengoptimuman. Morfologi dan struktur multi- inding CNT
(MWCNT) dihasilkan telah dicirikan menggunakan beberapa peralatan seperti Field
Emission Scanning Electron Microscope (FESEM), Transmisi Mikroskop Elektron
(TEM) dan Thermo Gravimetrik Analisis (TGA). Analisis FESEM dan TEM
mendedahkan bahawa MWCNT bertaburan seragam dengan penjajaran menegak s
mempunyai diameter antara 16 ke 23 nm seta panjang 30 mikron. MWCNTs yang
dihasilkan mempunyai luas permukaan BET yang tinggi iaiyu 206 m2/g. Analisis TGA
menunjukkan keaslian MWCNTs dihasilkan adalah sekitar98% keaslian. Dengan
menggunakan kaedah CCD, hasil kajian menunjukkan bahawa analisis statistik
mendedahkan keadaan optimum untuk penghasilan MWCNTs adalah 900 W kuasa
gelombang mikro, 35 minit masa radiasi dan nisbah gas 0.6 bagi C2H2/H2.

vi
Penyingkiran logam berat dari air sisa industri merupakan cabaran terbesar masa kini,
dengan ini sampel MWCNT yang baru ini diaplikasikan bagi menentukan prestasi
penyingkiran logam beratnya. Pengoptimuman dan kajian kinetik bagi penyingkiran Pb
(II), Cd (II), Cu (II) dan Zn (II) menggunakan MWCNTs yang baru ini juga dijalankan.
Kapasiti penjerapan maksimum (qm) untuk Pb (II), Cd (II), Cu (II) dan Zn (II) ion yang
diperoleh masing-masing pada 104.2, 88.62, 99 dan 90.9 mg/g. Keputusan analisis
menunjukkan bahawa keadaan optimum untuk penyingkiran tertinggi Pb (II) iaitu
99.9% & Cd (II) iaitu 98.8% telah direkodkan mempunyai pH 5, MWCNTs dos 0.1 g,
masa sentuhan 22.5 untuk Pb (II) dan 50 minit untuk Cd (II) dengan masing-masing
mempunyai kelajuan pengadukan 160 rpm, yang mana kepekatan awalnya adalah 10
mg/l. Tambahan itu, analisis statistik pula mendedahkan bahawa keadaan optimum
untuk penyingkiran tertinggi Cu (II) & Zn (II) telah direkodkan mempunyai pH 5.5, dan
pH10 MWCNTs dos 0.1 dan 0.05 gram, masa sentuhan 35 untuk Cu (II) dan 60 minit
untuk Zn (II) dengan kelajuan pengadukan 160 untuk Cu (II) dan 120 rpm untuk Zn (II).
Kedua-dua model isotermal Langmuir dan Freundlich berpadanan dengan data uji kaji
dengan baik dan penjerapan kinetik mematuhi pseudo-kedua untuk Pb (II), Cd (II), Cu
(II), & Zn (II). Oleh itu, kesemua ujian telah membuktikan bahawa MWCNTs
merupakan penjerap yang efektif untuk penyingkiran logam berat dari rawatan air sisa
dan proses pemisahan kerana kapasiti penjerapan yang tinggi serta masa penjerapan
yang pendek diperlukan bagi mencapai keseimbangan.
vii
ACKNOWLEGMENTS
In the name of Allah, the Most Gracious and the Most Merciful.
First of all, the author would like to raise his hand of syukur (appreciation) to Allah
(S.W.T) for the guidance, wisdom and barakah for all these years till now, where he has
reached to this important destination of his journey in life to accomplish his goal.
Every success is paid through the continuous and diligent effort. As for the
author, it is a success to finish the project as well as the report within the time. This
success was not meant for only the author, but the rest of people who have contributed
to the completion of this work and the author would like to extend a word of thanks and
express his gratitude and appreciation to all of them.
Author wish to express his sincere gratitude to the chairman of the supervisory
committee, Prof. Dr. Jayakumar Natesan Subramanian Nayagar, and members of the
supervisory committee, Assoc. Prof. Dr. Jaya Narayan Sahu and Prof. Dr. Ezzat Chan
Abdullah for their valuable guidance, thoughtful ideas, keen interest, encouragement
and support at all stages of this work. The author is proud and honored to work with
them and it was a delightful and enriching experience.
Finally, the author presents his most heartfelt and warmest appreciation to the
great parents and parents in law (may ALLAH SWT bless and reward them), brothers
and sisters who always encouraged and supported him during the study period. Special
and heartiest gratitude to the author‘s dearest wife, Muna Tasnim and son, Muhammad
Fayyad, for their invariable encouragement, endless sacrifices, patience, understanding,
ideas and inspirations from time to time in finishing the Doctorate of Philosophy in
Chemical Engineering smoothly and timely.
viii
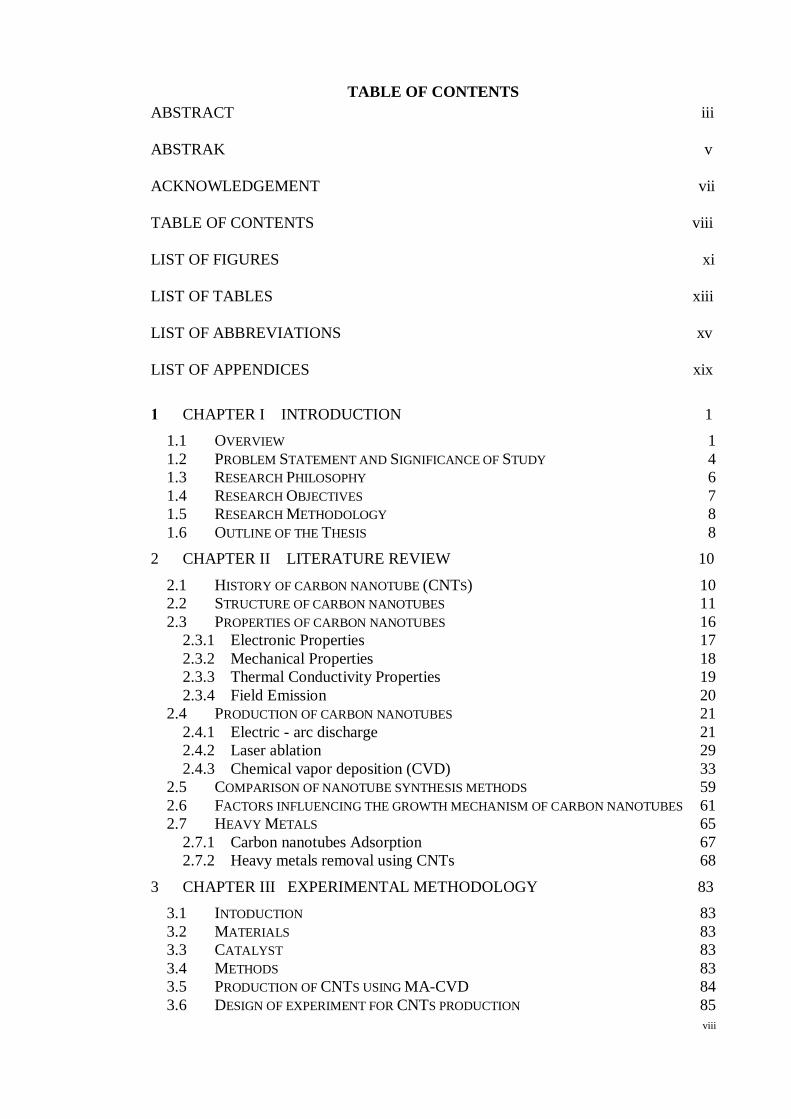
TABLE OF CONTENTS ABSTRACT iii
ABSTRAK v
ACKNOWLEDGEMENT vii
TABLE OF CONTENTS viii
LIST OF FIGURES xi
LIST OF TABLES xiii
LIST OF ABBREVIATIONS xv
LIST OF APPENDICES xix
1 CHAPTER I INTRODUCTION 1
1.1 OVERVIEW 1
1.2 PROBLEM STATEMENT AND SIGNIFICANCE OF STUDY 4 1.3 RESEARCH PHILOSOPHY 6
1.4 RESEARCH OBJECTIVES 7 1.5 RESEARCH METHODOLOGY 8
1.6 OUTLINE OF THE THESIS 8
2 CHAPTER II LITERATURE REVIEW 10
2.1 HISTORY OF CARBON NANOTUBE (CNTS) 10 2.2 STRUCTURE OF CARBON NANOTUBES 11
2.3 PROPERTIES OF CARBON NANOTUBES 16 2.3.1 Electronic Properties 17
2.3.2 Mechanical Properties 18 2.3.3 Thermal Conductivity Properties 19
2.3.4 Field Emission 20 2.4 PRODUCTION OF CARBON NANOTUBES 21
2.4.1 Electric - arc discharge 21 2.4.2 Laser ablation 29
2.4.3 Chemical vapor deposition (CVD) 33 2.5 COMPARISON OF NANOTUBE SYNTHESIS METHODS 59
2.6 FACTORS INFLUENCING THE GROWTH MECHANISM OF CARBON NANOTUBES 61 2.7 HEAVY METALS 65
2.7.1 Carbon nanotubes Adsorption 67 2.7.2 Heavy metals removal using CNTs 68
3 CHAPTER III EXPERIMENTAL METHODOLOGY 83
3.1 INTODUCTION 83
3.2 MATERIALS 83 3.3 CATALYST 83
3.4 METHODS 83 3.5 PRODUCTION OF CNTS USING MA-CVD 84
3.6 DESIGN OF EXPERIMENT FOR CNTS PRODUCTION 85

ix
3.7 PREPARATION OF STOCK SOLUTION 87 3.7.1 Optimization of removal of heavy metals 87
3.7.2 Adsorption iostherms study 90 3.7.3 Adsorption kinetics 93
3.8 CHARACTERIZATION OF CNTS 94 3.8.1 Field Emission Scanning Electron Microscopy 95
3.8.2 Transmission Electron Microscopy 95 3.8.3 Thermogravimetric Analysis 95
3.8.4 BET surface area 96 3.8.5 Raman spectra Analysis 96
3.8.6 XRD analysis 96 3.8.7 Inductively Couple Plasma 97
3.8.8 FTIR analysis 97
4 CHAPTER IV RESULTS AND DISCUSSION 98
4.1 INTRODUCTION 98 4.2 EFFECT OF PROCESS PARAMETERS ON SYNTHESIS OF CNT 98
4.2.1 Effect of microwave power 99 4.2.2 Effect of radiation time 100
4.2.3 Effect of Gas ratio 102 4.3 STATISTICAL OPTIMIZATION OF CNTS PRODUCTION 103
4.3.1 Effect of process parameters on CNTs production 106 4.3.2 Effect of radiation time and microwave power on weight of CNTs 107
4.3.3 Effect of gas ratio and microwave power on weight of CNT 110 4.3.4 Effect of gas ratio and radiation time on weight of CNT 112
4.3.5 Effect of perturbation plot on weight of CNTs 115 4.4 CHARACTERIZATION OF SELECTED CNT SAMPLES PRODUCED 117
4.4.1 Field Emission Scanning Electron Microscope 117 4.4.2 Transmission Electron Microscope 118
4.4.3 High Resolution Transmission Electron Microscope 120 4.4.4 Thermogravimetric Analysis 121
4.4.5 X-ray Diffraction 122 4.4.6 Raman spectroscopy 123
4.4.7 BET surface area 125 4.5 HEAVY METALS REMOVAL 126
4.5.1 Statistical optimization of removal of Pb (II) using CNTs 127 4.5.2 Adsorption isotherm of Pb (II) 133
4.5.3 Adsorption kinetics of Pb (II) 134 4.5.4 Thermodynamic study of Pb (II) 143
4.5.5 FTIR analysis of Pb (II) adsorption 144 4.6 STATISTICAL OPTIMIZATION OF REMOVAL OF CD (II) USING CNTS 145
4.6.1 Adsorption isotherm of Cd (II) 151 4.6.1 Adsorption kinetics of Cd (II) 152 4.6.2 Thermodynamic study of Cd (II) 159
4.6.3 FTIR analysis of Cd (II) adsorption 160 4.7 STATISTICAL OPTIMIZATION OF REMOVAL OF CU (II) USING CNTS 161
4.7.1 Adsorption isotherm of Cu (II) 168 4.7.2 Adsorption kinetics of Cu (II) 169
4.7.3 Thermodynamic study of Cu (II) 176 4.7.4 FTIR analysis of Cu (II) adsorption 177
4.8 STATISTICAL OPTIMIZATION OF REMOVAL OF ZN (II) USING CNTS 178

x
4.8.1 Adsorption isotherm of Zn (II) 184 4.8.2 Adsorption kinetics of Zn (II) 185
4.8.3 Thermodynamic study 192 4.8.4 FTIR analysis of Zn (II) adsorption 193
4.8.5 Zeta potential of MWCNTs 194
5 CHAPTER V CONCLUSIONS AND RECOMMENDATIONS 196
5.1 CONCLUSIONS 196 5.2 RECOMMENDATIONS 198
BIBLIOGRAPHY 200
APPENDICES 233
APPENDIX A 233 APPENDIX B 234
APPENDIX C 235 APPENDIX D 236
APPENDIX E 237 APPENDIX F 238
APPENDIX G 241 LIST OF PUBLICATIONS 241
PATENT 245 EXHIBITIONS 245

xi
LIST OF FIGURES
Figure 2.1 (a) A graphene sheet made of C atoms placed at the corners of
hexagons forming the lattice with arrows AA and ZZ denoting the
rolling direction of the sheet to make (b) a (5,5) armchair nanotube
and (c) a (10,0) zigzag nanotube (Srivastava, et al., 2003). 12
Figure 2.2 (a) Zig-Zag Single-Walled Nanotube. (zig-zag pattern around
circumference and m = 0), (b) Chiral Single-Walled Nanotube (
twisting of hexagons around tubule body. (c) Armchair Single-Walled
Nanotube. Note the chair-like pattern around circumference and n = m
(Gogotsi, 2006; Harris and Harris, 2001). 13
Figure 2.3 Schematic illustrations of the structures of CNTs (Baughman, et al.,
2002). 14
Figure 2.4 Diagram showing rolling direction of nanotube (Dresselhaus, et al.,
1996). 15
Figure 2.5 Different types of CNTs (Ebbesen et al., 1993; Saito, et al., 1993). 16
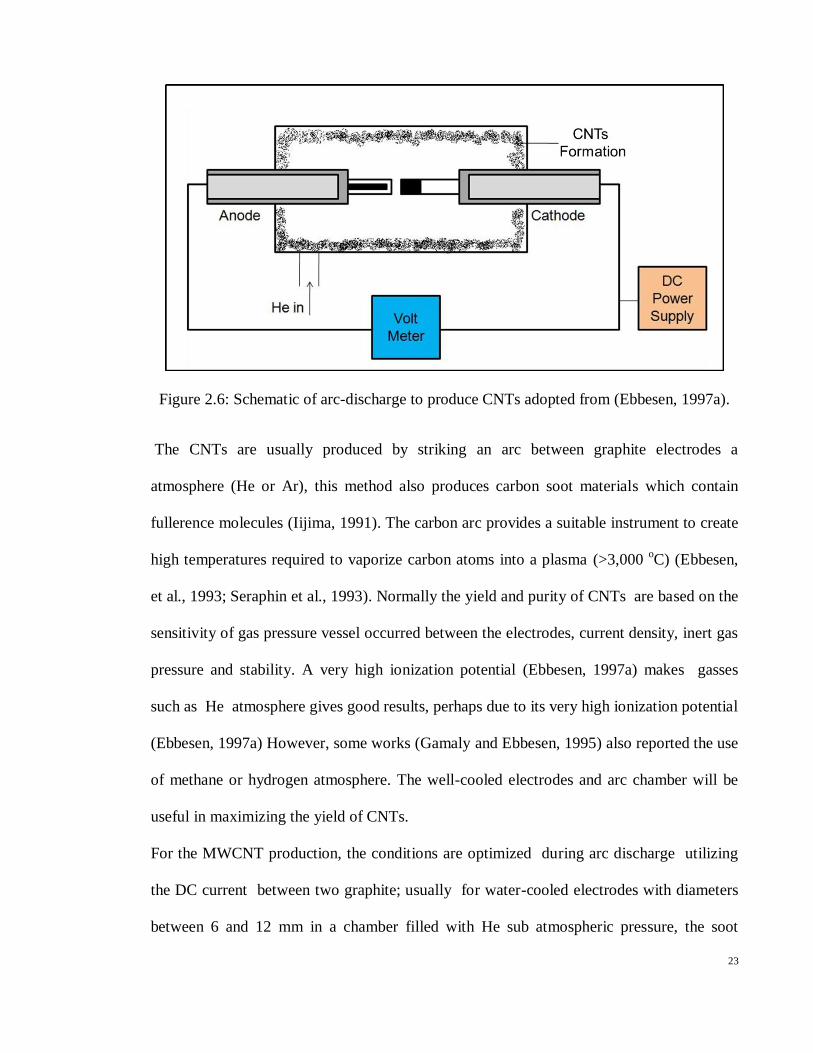
Figure 2.6 Schematic of arc-discharge to produce CNTs adopted from (Ebbesen,
1997a). 23
Figure 2.7 Diagram of laser furnace apparatus to produce CNTs adopted from
Ando et al. [82]. 30
Figure 2.8 Diagram of CVD to produce CNTs adopted from (Mubarak, et al.,
2011). 35
Figure 2.9 Schematic diagram of a vapor phase growth apparatus (Nikolaev, et
al., 1999) 39
Figure 2.10 Schematic diagram of thermal CVD apparatus (Zheng et al., 2002). 46
Figure 2.11 Schematic diagram of Plasma Enhanced CVD apparatus (Bower,
Zhou, et al., 2000) 56
Figure 3.1 Flow chart of the overall experiment. 84
Figure 3.2 Schematic of MA-CVD for CNT production. 85
Figure 4.1 Effect of microwave power on weight of CNTs and purity. 100
Figure 4.2 Effect of radiation time on weight of CNTs. 101
Figure 4.3 Effect of gas ratio on weight of CNTs at optimal CNTs. 103
Figure 4.4 Relationship between Predicted and Experimental values of yield of
CNTs 105

xii
Figure 4.5 (a-b) Effect of radiation time and microwave power on CNT
production. 109
Figure 4.6 (a-b) Effect of gas ratio and microwave power on CNT production. 111
Figure 4.7 (a-b) Effect of gas ratio and microwave power on CNT production. 113
Figure 4.8 Effect of perturbation plot of CNTs production. 117
Figure 4.9 (a-c) FESEM image of CNTs produced at optimal conditions. 118
Figure 4.10 (a-c) TEM images of the selected CNT prepared at optimal condition. 119
Figure 4.11 (a-d) HRTEM image of CNT prepared at optimal conditions. 121
Figure 4.12 TGA analysis of the CNT produced at optimal conditions 122
Figure 4.13 XRD patterns of CNT prepared at optimal conditions. 123
Figure 4.14 Raman spectra of CNT prepared at optimal conditions. 124
Figure 4.15 (a) N2 adsorption/desorption isotherm of CNTs, (b) Pore size
distribution curves of the CNTs prepared under optimal condition. 126
Figure 4.16 Relationship between Predicted values of removal of Pb (II). 130
Figure 4.17 3-D plots of removal of Pb (II) using optimized CNTs production, (a)
interaction of agitation speed and pH, (b) interaction of CNTs dosage
and pH, and (c) interaction of time and pH. 132
Figure 4.18 Adsorption capacity (qt) versus concentration (t) with different Pb (II)
solution concentration. 134
Figure 4.19 (a) Langmuir isotherm (b) Freundlich isotherm (c) Temkin isotherm,
and (d) Dubinin –Radushkevich isotherm plots for adsorption of Pb
(II). 137
Figure 4.20 (a) Pseudo-first order kinetics (b) Pseudo second order kinetics for
adsorption of Pb (II). 142
Figure 4.21 FTIR analysis of (a) CNTs before and (b) CNTs after adsorption of Pb
(II). 145
Figure 4.22 Relationship between actual value vs predicted values of removal of
Cd (II). 148
Figure 4.23 3-D plots of removal of Cd (II) using optimized CNTs production, (a)
interaction of agitation speed and pH, (b) interaction of CNTs dosage
and pH, and (c) interaction of time and pH. 150

xiii
Figure 4.24 Adsorption capacity (qt) versus contact time (t) with different Cd (II)
solution concentration. 152
Figure 4.25 (a) Langmuir isotherm (b) Freundlich isotherm (c) Temkin isotherm,
and (d) Dubinin –Radushkevich isotherm plots for adsorption of Cd
(II). 155
Figure 4.26 (a) pseudo-first order kinetics (b) pseudo second order kinetic for
adsorption of Cd (II). 158
Figure 4.27 FTIR adsorption spectra for (a) CNTs before (b) CNTs after
adsorption of Cd (II) 161
Figure 4.28 Relationship between actual value and predicted values of removal of
Cu (II). 163
Figure 4.29 3-D plots of removal of Cu (II) using optimized CNTs production, (a)
interaction of agitation speed and pH, (b) interaction of CNTs dosage
and pH, and (c) interaction of time and pH. 167
Figure 4.30 Adsorption capacity (qt) versus contact time (t) with different Cu (II)
solution. 169
Figure 4.31 (a) Langmuir isotherm (b) Freundlich isotherm (c) Temkin isotherm,
and (d) Dubinin –Radushkevich isotherm plots for adsorption of Cu
(II). 172
Figure 4.32 (a) Pseudo-first order kinetics (b) Pseudo second order kinetics for
adsorption of Cu (II). 175
Figure 4.33 FTIR adsorption spectra for (a) CNTs before (b) CNTs after
adsorption of Cu (II). 178
Figure 4.34 Relationship between actual value and predicted values of removal of
Zn (II). 182
Figure 4.35 3-D plots of removal of Zn (II) using optimized CNTs production, (a)
interaction of agitation speed and pH, (b) interaction of CNTs dosage
and pH,and (c) interaction of time and pH. 183
Figure 4.36 Adsorption capacity (qt) versus contact time (t) with different Zn (II)
solution concentration. 185
Figure 4.37 (a) Langmuir isotherm (b) Freundlich isotherm (c) Temkin isotherm,
and (d) Dubinin –Radushkevich isotherm plots for adsorption of Zn
(II). 188
Figure 4.38 (a) Pseudo-first order kinetics (b) Pseudo second order kinetic for
adsorption of Zn (II). 191

xiv
Figure 4.39 FTIR adsorption spectra for (a) CNTs before (b) CNTs after
adsorption of Zn (II). 194

xv
LIST OF TABLES
Table 2.1 Summary of CVD process 48
Table 2.2 Comparison of Arc-discharge, Laser ablation and CVD 61
Table 2.3 Brief summary of removal of heavy metal using non-modified CNTs. 78
Table 2.4 Brief summary of removal of heavy metals using functionalized
CNTs. 79
Table 3.1 A lower and upper limits for CCD experiments design for CNTs
production 87
Table 3.2 Experimental design for batch adsorption of Pb (II) removal using
CCD. 89
Table 3.3 Experimental design for batch adsorption of Cd (II) removal using
CCD 89
Table 3.4 Experimental design for batch adsorption of Cu (II) removal using
CCD. 90
Table 3.5 Experimental design for batch adsorption of Zn (II) removal using
CCD. 90
Table 4.1 ANOVA for the selected factorial Model for CNTs production. 106
Table 4.2 Validation study for selection of best yield, high quality and high
purity of CNTs 114
Table 4.3 Review on microwave assisted synthesized CNTs 115
Table 4.4 ANOVA for the selected quadratic model for removal of Pb (II). 129
Table 4.5 Isotherm parameters for Pb (II) adsorption by CNTs. 138
Table: 4.6 Summary of removal of Pb (II) 139
Table 4.7 Experimental values of constants of adsorption kinetics model. 141
Table 4.8 Thermodynamic parameters for Pb (II) adsorption. 144
Table 4.9 ANOVA for the selected factorial Model for removal of Cd (II). 147
Table 4.10 Isotherm parameters for Cd (II) adsorption by CNTs 153
Table 4.11 Review on Cd (II) removal using CNTs. 154
xvi
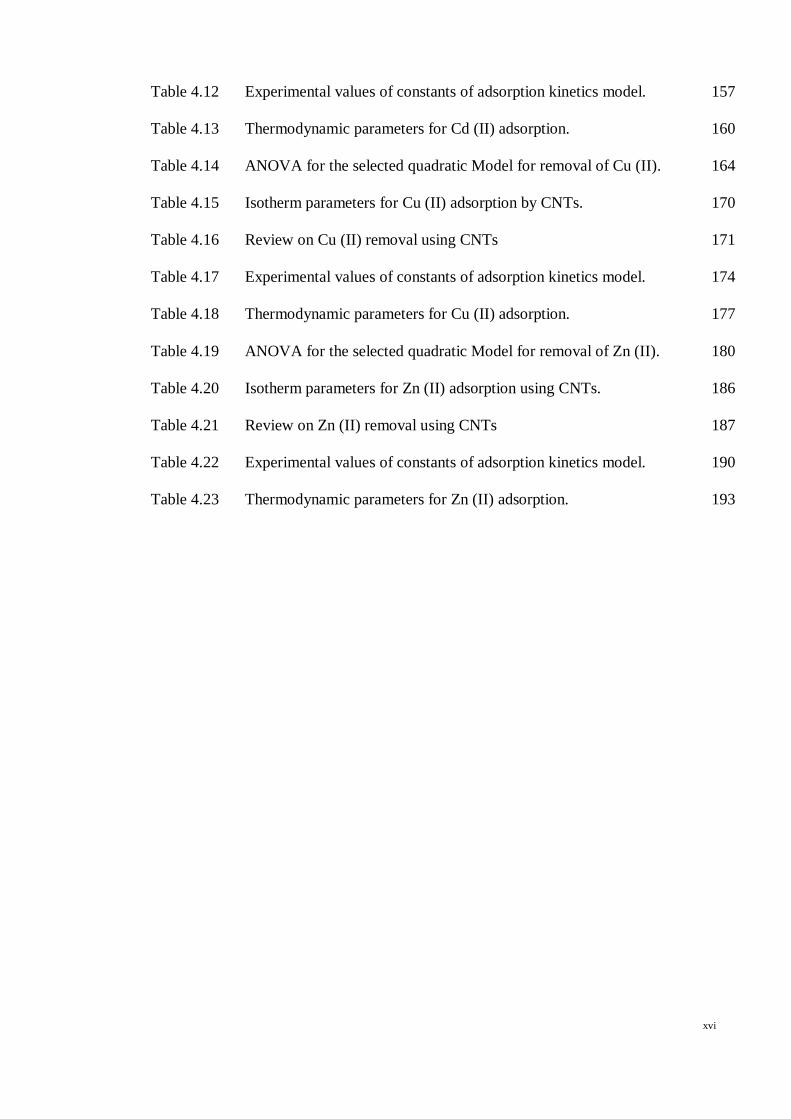
Table 4.12 Experimental values of constants of adsorption kinetics model. 157
Table 4.13 Thermodynamic parameters for Cd (II) adsorption. 160
Table 4.14 ANOVA for the selected quadratic Model for removal of Cu (II). 164
Table 4.15 Isotherm parameters for Cu (II) adsorption by CNTs. 170
Table 4.16 Review on Cu (II) removal using CNTs 171
Table 4.17 Experimental values of constants of adsorption kinetics model. 174
Table 4.18 Thermodynamic parameters for Cu (II) adsorption. 177
Table 4.19 ANOVA for the selected quadratic Model for removal of Zn (II). 180
Table 4.20 Isotherm parameters for Zn (II) adsorption using CNTs. 186
Table 4.21 Review on Zn (II) removal using CNTs 187
Table 4.22 Experimental values of constants of adsorption kinetics model. 190
Table 4.23 Thermodynamic parameters for Zn (II) adsorption. 193
xvii
LIST OF ABBREVIATIONS
List of abbreviations
CNTs Carbon Nanotubes
SWCNTs Single walled Carbon nanotubes
MWCNTs Multiwalled Carbon Nanotubes
FESEM Field Emission Scanning Electron Microscope
TEM Transmission Electron Microscope
HRTEM High Resolution Transmission Electron Microscope
XRD X-ray Diffraction
TGA Thermogravemetric analysis
MW Microwave
ANOVA Analysis of variance
DOE Design of Experiment
PLV Pulsed laser vaporization
CCD Central composite design
CNTs Carbon Nanotubes
DWCNTs Double walled Carbon nanotubes
MPECVD Microwave plasma enhanced chemical vapor deposition
MA-CVD Microwave Assisted-Chemical Vapour Deposition
FESEM Field Emission Scanning Electron Microscope
TEM Transmission Electron Microscope
HRTEM High Resolution Transmission Electron Microscope
XRD X-ray Diffraction
TGA Thermogravemetric analysis

xviii
MFCNTs Metal- Filled Carbon nanotubes
FTIR Fourier Transform Infrared
xix
LIST OF APPENDICES
APPENDIX A : Experimental array of CNTs production via microwave heating 233
APPENDIX B : Experimental array of Pb (II) removal using MWCNTs 234
APPENDIX C : Experimental array of Cd (II) removal using MWCNTs 235
APPENDIX D : Experimental array of Cu (II) removal using MWCNTs 236
APPENDIX E : Experimental array of Zn (II) removal using MWCNTs 237
APPENDIX F : Design Expert Soft were overview 238
APPENDIX G : List of Achievements 241

1
1 CHAPTER I
INTRODUCTION
1.1 Overview
Research on new materials technology is attracting the attention of researchers all over the
world. Developments are being made to improve the properties of the materials and to find
alternative precursors that can give desirable properties of the materials. Nanotechnology,
which is one of the new technologies, refers to the development of devices, structures, and
systems whose size varies from 1 to 100 nanometers (nm). The last decade has seen the
advancement in every side of nanotechnology, such as: nanoparticles and powders,
nanolayers and coats, electrical optic and mechanical nanodevices, and nanostructured
biological materials. Nanotechnology is estimated to be influential in the next 20-30 years,
in all fields of science and technology (Harris and Harris, 2001). Great interest has recently
been developed in the area of nanostructures carbon materials. Carbon nanostructure
materials are becoming of considerable commercial importance with interest growing
rapidly over the decade or so since the discovery of buckminsterfullerene, carbon
nanotubes (CNTs), and carbon nanofibers (CNFs) (Dresselhaus and Avouris, 2001). CNTs
and CNFs are among the most eminent materials in the first rank of revolution
nanotechnology. The most eye-catching features of these structures are their electronic,
mechanical, optical and chemical characteristics, which open a way for future applications.
These properties can even be measured on single nanotube and nanofiber. For commercial
application, large quantities of purified CNTs are needed (Dresselhaus et al., 1996;
Ebbesen, 1997b).
Fundamental and practical CNTs researches have shown possible applications to almost all
the scientific areas, such as aerospace science, bioengineering, environmental, energy,

2
materials, industry, medical and medicine, science, electronic computer, security and
safety, waste water treatment, bioscience and science education. They are known to be
superior to any other existing material in mechanical, electrical, and hydrogen storage
characteristics. Various synthesis methods have been developed aiming at bulk production
of CNT by mainly looking into ways at controlling their characteristics and morphologies.
Conventional methods of synthesizing CNT are Laser Ablation (Journet and Bernier,
1998), Electric Arc Discharge (Thess et al., 1996), and Chemical Vapor Deposition
(Bethune et al., 1993; Cassell et al., 1999; Liu et al., 2004).
In recent years, microwave irradiation has attracted the attention of chemists and engineers
due to its capability of molecular level heating, which leads to homogeneous and quick
thermal reaction (Brunetti et al., 2007; Dallinger and Kappe, 2007). It is of current
development of new techniques for the efficient and the selective synthesis of CNTs and
CNFs, and other carbon nanostructures at the cheapest possible cost. One such possibility is
the use of microwave radiation, which over the past few years has played an important role
as a thermal tool in organic synthesis due to considerable advantages over conventional
methods (Lidström et al., 2001). The use of microwave radiation in the synthesis and
functionalization of CNTs or other nanostructures is advantageous because it provides a
fast and uniform heating rate that can be selectively directed towards a targeted area. The
first report of the production of carbon nanostructures with microwaves was made by
(Ikeda et al., 1995) who synthesized fullerenes from microwave-induced naphthalene-
nitrogen plasma at atmospheric pressure inside a cylindrical coaxial cavity. Kharissova,
(2004) has reported the synthesis of vertically aligned CNTs using a domestic microwave
oven. Unlike conventional heating, microwave heating has a higher heating rate, which
results from the intrinsic transition of electromagnetic energy to thermal energy by a

3
molecular interaction with the electromagnetic field, rather than heat transfer by conduction
or convection (V zquez and Prato, 9).
Water resources are being polluted from various sources such as metallurgy, mining,
tannery, chemical manufacturing, fossil fuel, battery manufacturing industries and the
production of plastics, involving the use of metal compounds, particularly as heat
stabilizers etc (Bansal, 2005; Muyibi et al., 2008). The types of emerging pollutant are also
increasing while the traditional pollutants are not efficiently solved yet. Removal of toxic
metals is one of the biggest challenges in ensuring safe water for all as well as protecting
the environment (Bansal, 2005; Muyibi et al., 2008). It might cause several health problem
to human such as nervous system damages, renal kidney disease, mental retardation, cancer
and anemia (Calderón et al., 2001; Friberg, 1979; Li, Wang, et al., 2002). There are many
conventional methods that are being used to remove the metal ions that include oxidation
and reduction (Ling, 2010), precipitation (Wirojanagud et al., 2004), membrane filtration
(Kim and Anderson, 1994), ion exchange (Wójtowicz and Stoklosa, 2002) and adsorption
(Choi et al., 2006; Rao et al., 2007; Ye and Yu, 2010). Among the above methods, the
promising process for the removal of metal ions from water and wastewater is adsorption,
because some of the used adsorbent can be regenerated by suitable desorption process and
it is highly effective and economical (Choi et al., 2006; Rao et al., 2007; Ye and Yu, 2010).
Several adsorbents have been studied for adsorption of metal ions such as activated carbon
(AC) (Kim and Anderson, 1994), fly ash (Weng and Huang, 2004), peat (Ho and McKay,
1999a) sewage sludge ash (Pan et al., 2003), zeolite (Biškup and Subotić, 5), and
biomaterials (Li et al., 2004). However, these adsorbents suffer from low adsorption
capacities or removal efficiencies of metal ions. Until now, the process of removing these
metal ions has not reached the optimum condition which is still in lower efficiency of
4
removal. The high performance of CNTs in separation process technology is becoming a
major concern of development. In the treatment process of adsorption, CNTs is used as a
new absorbents to replace AC. In order to optimize the efficiency of the removal, the study
of CNTs as new absorbent is being developed. It is a member of carbon family that has
novel properties with the special characteristic of the shape and properties of CNT is used
to optimize the process of absorption in the removal of heavy metal ions in wastewater
treatment. Many researchers have studied the removal of heavy metals using CNTs for
water treatment, which are still in experimental stages only, but it may consider them to be
very much promising at least at the pilot plant level. It is convinced that waste water
treatment in large scale to remove heavy metals and separation in conjunction with CNTs is
expected to create a major breakthrough in the coming future.
1.2 Problem Statement and Significance of Study
Generally, there are few techniques employed to produce CNTs such as electric- arc
discharge, laser ablation and Chemical Vapor Deposition (CVD). Among these, technique,
CVD is very different from the other two common methods used for CNTs production,
namely; arc discharge and laser ablation (Ebbesen and Ajayan, 1992; Journet et al., 1997;
Thess, et al., 1996). At the moment, arc discharge methods generally produce larger
quantities of impure material and produces a small amount of CNTs yield (Journet and
Bernier, 1998). Whereas for laser ablation, the method was said to be uneconomical
feasible due to high laser power required and involves high-purity graphite rods, as well as
it produces small amounts of nanotubes (Guo et al., 1995). The material prepared by these
techniques has to be purified using chemical and separation methods (Kokai et al., 2002).
None of these techniques are scalable (Guo, 1995) to make the industrial quantities needed

5
for many applications (e.g., In composites), and this has been a bottleneck in nanotube
research and development (R&D).
In recent years, work has focused on developing microwave assisted chemical vapor
deposition (MA- CVD) (Bower, Zhou, et al., 2000; Dallinger and Kappe, 2007; Hong et al.,
2003) which is one of the most popular method to produce CNTs using C2H2 and H2 as
precursors, while Argon (Ar) acts as parching gas. MA - CVD seems to be the most
promising method for possible industrial scale-up due to the relatively low growth
temperature, high yields and high purities that can be achieved (Fu et al., 2013; Liu and
Ting, 2003; Méndez et al., 2003). It is of current general interest that the development of
new techniques for the efficient and the selective synthesis of CNTs at the cheapest
possible cost. One such possibility is the use of microwave radiation, which over the past
few years has played an important role as a thermal tool in organic synthesis due to
considerable advantages over conventional methods. MA- CVD is a very promising process
with respect to large-scale production of different kinds of carbon nanostructures materials
as for example for multi, and single-walled carbon nanotubes. The economic, social,
environmental and public health implications of decreasing water quality are a worldwide
threat. Water resources are being polluted from various sources. Different types of
emerging pollutants have been increasing while the removal of traditional pollutants is not
solved efficiently. Environmental issues and its consequences effect towards the living
creatures and fauna on earth has been a serious problem for the past few decades. In regards
to this issue, water pollution has been highlighted as one of the most crucial issues which
needs an abrupt solution to avoid further impact on the environment. One of the main
contributions to water pollution issue would be the emission of heavy metal ions from
extensive industries. Many methods have already been discovered and established to adsorb

6
these heavy metals from the contaminated waste water streams. Adsorption is enclosed to
be one of the highest efficient methods due to its simplicity and flexibility. However, due to
the lack of significant adsorbent, this method is still unable to reach its peak demand and
meets the environmental regulations regarding the emission heavy metal into the surround
environment. Therefore, overcome this problem, to optimize the efficiency of the removal,
the study of novel multiwall carbon nanotube (MWCNTs) as new absorbent is being
developed. With the special characteristic of shape and properties, a MWCNTs is used to
optimize the process of absorption in the removal of heavy metal ions. Hence, MWCNTs
are the most promising candidate for removal of heavy metal from wastewater treatment
and separation process.
1.3 Research Philosophy
In this research, single stage mass production of CNTs using microwave technology for
various industrial applications. In our innovation microwave-assisted synthesis, including
fast CNTs growth and ambient reaction condition, low growth temperature, high surface
area, high adsorption capacity, less pollution and energy saving, and simplifies the
procedure leading to a high yield synthesis of high-quality CNTs with minimal impurity. It
is of current general interest the development of new techniques for the efficient and the
selective synthesis of CNTs at the cheapest possible cost. CNTs are in the limelight
globally as a new dream material in the 21st century and are broadening their niche
applications to almost all the scientific areas, such as waste water treatment, materials
industry. However, synthesis conditions have major influences on the nature of the CNTs
product formed. Reaction conditions, including microwave power, gas ratio, and radiation
time. The nature and composition of metallic catalysts leading to the CNTs formation

7
which in turn affects the properties of the final product have to be still explored to
understand these influences. In addition, CNTs have great attention as a novel type of
adsorbent due to their extraordinary properties such as chemical stability, mechanical and
thermal stability, and the high surface area which leads to various applications including
waste water treatment, hydrogen storage, and protein purification. Removal of heavy metal
from industrial waste water leads to the biggest challenge nowadays. In order to reduce
environmental problems, the CNTs are promising candidates for the adsorption of heavy
metals
1.4 Research Objectives
This study embarks on the following objectives:
i. To produce high purity and high yield CNTs using microwave assisted
chemical vapor deposition (MA-CVD).
ii. To investigate the effect of process parameters on CNTs such as microwave
power, radiation time and gas ratio of C2H2/H2.
iii. To optimize the process parameters on CNTs production by varying
microwave power, radiation time and gas ratio C2H2/H2 using central
composite design (CCD) to produce high quality and high yield of CNTs.
iv. To optimize the process parameters such as agitation speed, pH, CNTs
dosage and contact time by using CCD for the removal of heavy metals Pb
(II), Cd (II), Cu (II) and Zn (II) from aqueous solution.
v. To study the adsorption isotherm and adsorption kinetics on the removal of
heavy metals from aqueous solution.

8
1.5 Research Methodology
In this research, CNTs is produced using microwave assisted chemical vapor deposition
(MA-CVD). In order to achieve high purity of CNTs, the process parameters were
optimized, such as gas ratio (C2H2/H2), radiation time, microwave power, using Design
Expert® version 6.0.8. The characterization of produced CNTs in order to achieve high
yield and high purity of CNTs were used for the removal of heavy metals. Application of
CNTs on synthetic water polluted with toxic metals (Pb (II), Cd (II), Cu (II) and Zn (II)) to
study the adsorption behavior. In addition, optimization of the adsorption conditions such
as pH, CNTs dosage, contact time, and agitation speed using CCD Futhermore,
thermodynamics and kinetic study of each heavy metal adsorption were conducted.
1.6 Outline of the Thesis
This thesis comprised of five chapters, as follows:
Chapter I include a brief background overview of CNTs synthesis using microwave assisted
CNTs and application of CNTs in heavy metal removal. The problem statement and
philosophy of the research work are mentioned, followed by the objectives of the research,
and finally the research methodology.
Chapter II discusses the background of CNT structure and properties, a summary of
production of CNTs using CVD and microwave assisted synthesis of CNTs. It also explains
various parameters influences the production of CNTs and comparison between the
technique was made. In addition, the nature of different heavy metal removal issuing
modified and non modified CNTs for removal of heavy metals were explained in detail.
Furthermore, previous removal studies on heavy metals using CNTs were discussed.

9
Finally the theoretical background of adsorption isotherm and kinetic models were
elaborated.
Chapters III discusses the detailed research methodology of optimization of CNTs
production using microwave heating, as well as the method of detail experimental
procedure for production CNTs and follow up the characterization of CNTs analysis.
Detail deigns experiment for production of CNTs as well as optimization of heavy metals
removal are described in this chapter.
Chapter IV The results are mainly focused on the optimization of process parameters on
CNTs synthesis and detail characterization of CNTs. The preparation conditions were
statistically optimized using central composite design (CCD) to produce the high quality
and high weight of CNTs. The optimized condition of MWCNTs sample has proven to be
an outstanding adsorbent for the removal of heavy metals such as, Pb (II), Cd (II), Cu (II)
and Zn (II) from aqueous solution. The studies on the isotherm kinetic and isotherm model
were developed and investigated as well. In addition, the thermodynamic parameters were
also investigated.
Chapter V The optimization the process parameters for CNTs synthesis using the single
stage MA-CVD is investigated in this chapter. In order to produce high purity and high
yield of CNTs microwave power and catalyst play a vital role in the synthesis and
controlling diamter of CNTs. The optimized CNTs was tested for efficiency of removal of
heavy metals such as Pb (II), Cd (II), Cu (II) and Zn (II) from aqueous solution. Our results
proved novel CNTs is the best adsorbent for removal of heavy metals with high adsorption
capacity compared to existing literature review. Furthermore, for future work different
catalyst may be used for synthesis of CNTs via microwave heating and tested for other
heavy metals such as As +6
, Ni, Hg etc.
10
2 CHAPTER II
LITERATURE REVIEW
2.1 History of carbon nanotube (CNTs)
The most popular is the identification of the structure of the fullerenes in 1985 by (Kroto et
al., 1985). A further study in 1991 by (Iijima, 1991) discovered the multi-walled carbon
nanotubes (MWCNTs) and single-walled carbon nanotubes (SWCNTs), whereas the
SWCNTs were independently discovered by (Iijima and Ichihashi, 1993) and (Bethune, et
al., 1993). Earlier to the discovery of nanotubes, the significance of the investigations made
on carbon fibers with diameters bigger than 7 nm was not clear until the connection
between fullerenes and nanotubes was revealed. One of the articles (Ball, 2001) reported a
decade before the discovery of nanotubes, stated that nanotubes were unintentionally
produced by chemists experimenting on methane in the late nineteenth century (Hughes and
Chambers,1989). In 1960, nanoscale scrolls of graphite were produced by (Bacon, 1960).
The truth is that Iijima, who has generated a mixture of scrolls and tubes by using his own
procedure (Amelinckx et al., 1995; Mordkovich et al., 1998; Y. Maniwa, 2001), suggests
that Bacon may have also done this. In the previous study, showed a hollow carbon fibre
with nanometer-scale diameters using a vapor-growth technique (Oberlin et al., 1976).
Wiles and Abrahamson also, found ―mats of small fibres‖ in on one electrode when sparks
were passed between two graphite electrodes. (Gibson, 1992) reported that, (Davis et al.,
1953) were the first to see a nanotube, but some researchers like (Monthioux and
Kuznetsov, 2006), agreed that the credit should be given to (Radushkevich and
Lukyanovich, 1952) in 1952 for producing first nanometric-sized carbon filaments. The
researchers (Baker et al., 1972) who investigated on the growth of vapor grown carbon

11
fibres may have also yieldedvaporubes because tfibershnique used nowadays to produce
nanotube is similar. Recently, (José‐Yacamán et al., 1993) using chemical vapor deposition
(CVD) have made a large achievement in synthesis and the application of CNTa large
achievement investigations in the synthesis and application of CNTs has been studied
wisely (José‐Yacamán, et al., 1993).
2.2 Structure of carbon nanotubes
With the revolutionary discovery of fullerenes and CNTs, different research fields in the
domain of carbon experienced an enormous boom. Fullerenes are spherical molecules, the
smallest of which composed of 60 carbon atoms that are arranged like the edges of the
hexagons and pentagons on a football. Nanotubes can be described as a rolled-up tubular
shell of graphene sheet see Fig. 2.1, which is made of benzene-type hexagonal rings of
carbon atoms. The body of the tubular shell is thus mainly made of hexagonal rings (in a
sheet) of carbon atoms, whereas the ends are capped by half-dome shaped half-fullerene
molecules (Gogotsi, 2006). Due to their special one-dimensional form, they have
interesting physical properties like they have metallic or semiconducting electrical
conductivity depending on the chirality‘s of the carbon atoms in the tube. Nanotubes have a
large geometric aspect ratio which promoted them to be use in different applications such
as electrode material in super capacitors and hydrogen storage material for the fuel storage
or as field emitters in flat panel displays (Srivastava et al., 2003).

12
Figure 2.1: (a) A graphene sheet made of C atoms placed at the corners of hexagons
forming the lattice with arrows AA and ZZ denoting the rolling direction of the sheet to
make (b) a (5,5) armchair nanotube and (c) a (10,0) zigzag nanotube (Srivastava, et al.,
2003).
CNTs may be classified into three different types: armchair, zigzag, and chiral nanotubes,
depending on how the two-dimensional graphene sheet is "rolled up". Fig. 2.2 shows the
three structural categories of SWCNTs. Fig. 2.2 (a) shows the zig-zag SWCNT which is
named for the pattern of hexagons as one move circumferentially around the body of the
tubule. Fig. 2.2 (b) shows the second form known as chiral SWCNT and is believed to be
the most commonly occurring SWCNT. The name chiral means handedness and indicates
that the tubes may twist in either direction. While, Fig. 2.2 (c) shows the third structures
named armchair SWCNT, which describes one of the two conformers of cyclohexane, a

13
hexagon of carbon atoms, and describes the shape of the hexagons as one move around the
body of the tubule (Baughman et al., 2002)
Figure 2.2: (a) Zig-Zag Single-Walled Nanotube. (zig-zag pattern around circumference
and m = 0), (b) Chiral Single-Walled Nanotube ( twisting of hexagons around tubule body.
(c) Armchair Single-Walled Nanotube. Note the chair-like pattern around circumference
and n = m (Gogotsi, 2006; Harris and Harris, 2001).
The geometry of the chiral SWCNT lies between that of the armchair and zigzag SWCNTs
as shown in Fig. 2.3 (A-G) (Baughman, et al., 2002). A SWCNT can be described as a
rolled up graphene sheet that is closed at each end with half of a fullerene. Fig. 2.3 (A)
armchair, (B) zigzag, and (C) chiral SWCNTs. Projections normal to the tube axis and
perspective views along the tube axis are on the top and bottom, respectively. (D)
Tunneling electron microscope image showing the helical structure of a 1.3-nm-diameter
chiral SWCNT for projection normal to the tube axis. (E) Transmission electron
microscope (TEM) image of a MWCNT containing a concentrically nested array of nine
(a)
(b)
(c)
C70
C80
C60
(n,m)=(9,0)
(n,m)=(5,5)
(n,m)=(10,5)

14
SWCNTs. (F) TEM micrograph showing the lateral packing of 1.4-nm-diameter SWCNTs
in a bundle. (G) Scanning electron microscope (SEM) image of an array of MWCNTs
grown as a nanotube forest. Fig. 2.4 shows the nanotube is usually characterized by its
diameter dt and the chiral angle θ ( ≤ |θ| ≤ 3 °). The chiral vector Ch is defined with the
two integers (n, m) and the basis vectors of the graphene sheet (Dresselhaus and Avouris,
2001; Harris and Harris, 2001; Saito et al., 1993) .
Ch = n*a1 +m*a2 (2.1)
The so-called chiral vector of the nanotube, Ch, where a1 and a2 are unit vectors in the two-
dimensional hexagonal lattice, and n and m are integers. Another important parameter is the
chiral angle, which is the angle between Ch and a (Kiang et al., 1998).
Figure 2.3: Schematic illustrations of the structures of CNTs (Baughman, et al., 2002).
In order to discriminate between different types of CNTs, the chiral angle and vector play
an important role in determining the important properties of nanotubes. Armchair
nanotubes are formed when n = m and the chiral angle is 30°. Zigzag nanotubes are formed
when either n or m is zero and the chiral angle is 0°. All other nanotubes, with chiral angles
intermediate between 0° and 30°, are known as chiral nanotubes. The properties of

15
nanotubes are also determined by their diameter, which depends on n and m. A nanotube is
usually characterized by its diameter dt and the chiral angle θ ( ≤ |θ| ≤ 3 °). The integers
(n, m) determine dt and θ (Baughman, et al., 2002; Dresselhaus et al., 1995).
nmmn
mnmmnd t
22
22
2
3sin,
1
(2.2)
Figure 2.4:Diagram showing rolling direction of nanotube (Dresselhaus, et al., 1996).
Fig. 2.5 shows, there are two main types of CNTs with high structural perfection; they are
SWCNTs, which consist of a single graphite sheet seamlessly wrapped into a cylindrical
tube and MWCNTs, which comprise an array of concentric cylinders (Odom et al., 1998).
The image of TEM with high resolution shows the spacing between of inter shell found to
vary from 0.34, augmenting with the diameter of tube diminishing. The biggest spacing for
the smallest diameter is allocated in the high curve, following in a distasteful force
augmented, linked to the diameter diminished by the shells of CNTs (Gogotsi, 2006; Saito,
et al., 1993). The value of 0.34 nm spacing in the bulk graphite crystal is approximately that
of the CNTs. However, a closer study revealed that the mean value of the interlayer spacing

16
is 0.3444 ± 0.001 nm; the values in CNTs are larger, by a few percent, than those in the
bulk graphite crystal (Ru, 2000). According to theoretical calculations the distance between
two layers is d = 3.39 Å, slightly bigger than in graphite. Based on TEM images, the
interlayer separation of d = 3.4 Å is commonly reported for MWCNT (Ebbesen, 1997a).
Figure 2.5: Different types of CNTs (Ebbesen et al., 1993; Saito, et al., 1993).
2.3 Properties of carbon nanotubes
A SWCNT has three different structures as described before, SWCNT can be either
metallic or semiconducting, according to their chirality‘s vector (n, m). A metallic nanotube
is found when the difference n-m is a multiple of three. If the difference is not a multiple of
three, a semiconducting nanotube will be formed. Besides, it is also possible to connect
nanotubes with different chiralities creating nanotube heterojunctions, which can shape a
variety of nanoscale molecular electronic device components (Saito, 1998) single and
multi-wall nanotubes have very good elasto-mechanical properties. These structural and
material characteristics of nanotubes point towards their possible use in making the next
generation of extremely lightweight with highly elastic and very strong composite

17
materials. CNTs have high aspect-ratio structures with good electrical and mechanical
properties. Consequently, the applications of nanotubes in field-emission displays, and
scanning probe microscope tips for metrology have started to materialize in the commercial
sector.
2.3.1 Electronic Properties
Carbon nanotubes have some different electrical properties. One of the important properties
of CNT is that it can exhibit the characteristics of a metal or a semiconductor depending on
their chiral vector. Electronic structure, usually characterized using electron scanning
microscopy (Satishkumar et al., 2000). One possible use of the CNTs is as a diode. One
can view CNTs as giant conjugated molecular wires with a conjugation length
corresponding to the whole length of the tube. Carbon has four valence electrons of which
three are strongly bound to neighboring atoms, giving graphene its very high in-plane
rigidity (Andriotis et al., 2000; Collins and Avouris, 2000; Schujman et al., 2002)
considered CNTs with junctions to be of potential value in nanoelectronics; for such
applications, it is important to be able to connect the CNTs of different chirality and
diameters. Nanotube fabrication was via a pyrolysis method. The fourth electron is
delocalized and shared by all the atoms, thus allowing for electronic current transport.
However, because of its particular structure graphene is electronically between a
semiconductor and a metal.
Depending on their chiral vector, CNTs with a small diameter are either semi-conducting or
metallic. The differences in conducting properties are caused by the molecular structure
that results in a different band structure and thus a different band gap. The differences in
conductivity can easily be derived from the graphene sheet properties (Collins and Avouris,

18
2000). It was shown that a (n,m) nanotube is metallic as accounts that: n=m or (n-m) = 3i,
where i is an integer and n and m are defining the nanotube. The resistance to conduction is
determined by quantum mechanical aspects and was proved to be independent of the
nanotube length by (Tans et al., 1997). The small size (diameter) of nanotubes in
combination with their transport properties is vercombinationve in this context. CNT
technology offers a new approach that may turn out to be more suitable for devices with
nanometer-scale dimensions.
2.3.2 Mechanical Properties
The basal-plane elastic modulus of graphite is one of the largest of any known material.
CNTs are the strongest fibers that are currently known. The reason for that, the carbon
atoms form a planar honeycomb lattice in which each atom is connected via a strong
chemical bond to three neighbor atoms. Therefore, these compounds are potentially suitable
for applications in composite materials that need anisotropic properties. CNTs have a very
large Young Modulus in their axial direction. The Young Modulus of SWCNT is up to
1TPa, which is more than 4 times greater than steel (230 GPa) while the density is only 1.3
g/cm3 (Qian et al., 2002). From this study, estimated that the tensile stress at fracture in the
CNT was ~ 55 GPa, based on polymer-NT specimens and if the stress is transferred to the
CNTs via the interface shear mechanism (Schadler et al., 1998; Wagner et al., 1998)
directly measured the tensile strength of MWCNTs made by CVD by pulling on very long
(~2 mm) ropes with a tensile strength of 1.72 ± 0.64 GPa. The tubes had an inner diameter
and outer diameter of 12 and 30 nm, respectively, and spacing of about 100 nm between the
tubes. Account for this spacing, they use the effective cross sectional area. They treat the
CNTs was parallel resistors of conductance 1/R by measuring this value; they estimate the

19
rate at which the tubes break. They measured the tensile strength of the ropes to be an order
of magnitude lower than that of graphite whiskers.
Pan et al. (1999) were employed tensile strength of 20 mm long ropes consisting of soundly
aligned SWCNT ropes, made by catalytic decomposition of hydrocarbons, in direct tensile
strength measurements. The average tensile strength of SWCNT rope composites was high
as 3.6 ± 0.4 GPa, that of carbon fibers. The tensile strength of SWCNT bundles was
extrapolated to be 2.3±0.2 to 14.2±1.4 GPa by taking into account the volume fraction of
SWCNT bundles in the mini-composite. Tensile strengths of single SWCNT estimated to
be as high as 22.2±2.2 GPa. The ropes consist of roughly aligned bundles, which consist of
well-aligned SWCNTs. Li et al (2005) was prepared bulk CNTs samples by spark plasma
sintering. The prepared bulk CNTs material exhibited brittle fracture similar to that of
common ceramics. Its fracture toughness was around 4.2 MPa m1/2
while flexural strength
was 50 MPa due to the weak bonding between CNTs. CNTs bridging was found during the
development of the crack induced, which provides a possibility of CNTs tough material.
2.3.3 Thermal Conductivity Properties
Despite the significant amount of research on carbon nanotubes, the thermal conductivity of
individual single-wall carbon nanotubes has not been well established. The thermal
conductivity of carbon nanotubes is higher than most known material ranges (Hone, 2001).
Thermal conductivity values of aligned ropes of SWNTs at room temperature have been
measured to be greater than 200w/m.k, while mats of nanotubes possess a thermal
conductivity of 35w/mK (Hone, 2001). This property of carbon nanotubes can be exploited
for the development of thermal interface material. Molecular dynamics simulation results
range from several hundred to 6600 W/m K and existing theoretical predictions
range from

20
several dozens to 9500 W/m.k To clarify the several-order-of-magnitude discrepancy in the
molecular dynamics simulation to systematically examine the thermal conductivity of
several individuals
(10, 10) single-wall carbon nanotubes as a function of length,
temperature, boundary conditions and molecular dynamics simulation methodology by
(Jennifer, 2007).
2.3.4 Field Emission
Carbon nanotube films are excellent field emitters, producing large emission currents at
relatively low applied electric fields which were best known as field emitters of any
material (Bonard et al., 1998). Recently, studies have shown that carbon nanotubes have
promising electron field emission properties compared to the conventional field emitters,
with low emission threshold fields (Saito et al., 1997). The smaller the tips radius of
curvature, the more concentrated the electric field were leading to increased field emission.
Besides that, CNTs also was utilized as a source for field emission due to its astonishing
characteristics such as small diameter, high surface area and high aspect ratio. In this case,
high aspect ratio means that only a little amount of CNTs will be needed to provide the
same electrical conductivity as high dosage of other substances. Field emission or also
known as field electron emission is a process which results from tunnelling electrons from
the tip of a metal into a vacuum field, usually under the utilization of a strong electric field
(Che et al., 1998). It was also discovered that the light is emitted in the visible part of the
spectrum, which is lured by the electron field emission.

21
2.4 Production of carbon nanotubes
Generally, there are few techniques employed to produce CNTs such as electric- arc
discharge, laser ablation and CVD. By using any of these techniques, different type of
CNTs, can be produced such as vapor grown, carbon fiber and types of carbon
nanostructure materials.
In the arc discharge, a vapor is created by an arc discharge between two carbon electrodes
with or without catalyst. In the laser ablation technology, a high achievement laser beam,
impose to a volume of the carbon, containing feedstock gas (methane or carbon monoxide).
Laser ablation produces a very small amount of pure nanotubes, while an arc-discharge
method produces in general large amounts of the impure material. Production of CNTs
using CVD is the most promising method for possible industrial scale-up due to the
relatively low growth temperature. In this process any hydrocarbon in the presence of a
catalyst (Fe/Co/Ni) at high temperature (600 to 1000oC) produce large amount and high
purities of CNTs.
2.4.1 Electric - arc discharge
Electric - arc discharge is known to be the most common technique and also one of the
oldest ways in the CNTs production. This method is known to be a traditional and simple
device to produce high temperature needed to evaporate carbon atoms in plasma. (Iijima,
1991) was the one who first observed the CNTs structure using this method. Electric arc
vaporizes a hollow graphite anode packed with a mixture of transition metals (such as Fe,
Co or Ni) and graphite powder. The inert gas flow is maintained at 50-600 Torr. Nominal
conditions involve 2,000 to 3,000 oC, 100 amps and 20 V (Ebbesen and Ajayan, 1992;
Iijima, 1991; Journet and Bernier, 1998; Jung et al., 2003; Kiang et al., 1995). The variation

22
of process parameters such as flow rate, gas pressure, and metal concentration is needed to
obtain the highest yield of CNTs which occurred in 'pillar-like tubes' either in single-
walled tubes or multi- walled tubes. The structures of the nanotubes produced are usually
short tubes. SWCNTs with diameters ranging from 0.6 to 1.4 nm and 10 nm diameter
MWCNTs, this method is relatively easy to be implemented and 30% yield will be
obtained. The content of impurities in CNTs produced is higher compared to other
methods, and the consistency of the shape, wall, and lengths of the tubes are somewhat
random (Journet and Bernier, 1998).
Two carbon electrodes are used in the carbon arc discharge technique to produce an arc by
digital current (DC). Fig. 2.6 shows schematic of arc-discharge to produce CNTs. Initially,
the two electrodes are kept independent. The electrodes are kept in a vacuum chamber and
an inert gas is supplied to the chamber. The inert gas increases the speed of carbon
deposition. Once the pressure is stabilized, the power supply is turned on (about 20 V). The
positive electrode is then gradually brought closer to the negative one to strike the electric
arc. The electrodes become red hot and a plasma form. Once the arc stabilizes, the rods are
kept about a millimeter apart while the CNT deposits on the negative electrode. Once the
specific length is reached, the power supply is cut off and the machine is left for cooling.
Precaution needed for the important parameters are; 1) the control of arcing current and 2)
the optimal selection of inert gas pressure in the chamber (Ebbesen, 1997a; Sinha and
Yeow, 2005).
23
Figure 2.6: Schematic of arc-discharge to produce CNTs adopted from (Ebbesen, 1997a).
The CNTs are usually produced by striking an arc between graphite electrodes a
atmosphere (He or Ar), this method also produces carbon soot materials which contain
fullerence molecules (Iijima, 1991). The carbon arc provides a suitable instrument to create
high temperatures required to vaporize carbon atoms into a plasma (>3,000 oC) (Ebbesen,
et al., 1993; Seraphin et al., 1993). Normally the yield and purity of CNTs are based on the
sensitivity of gas pressure vessel occurred between the electrodes, current density, inert gas
pressure and stability. A very high ionization potential (Ebbesen, 1997a) makes gasses
such as He atmosphere gives good results, perhaps due to its very high ionization potential
(Ebbesen, 1997a) However, some works (Gamaly and Ebbesen, 1995) also reported the use
of methane or hydrogen atmosphere. The well-cooled electrodes and arc chamber will be
useful in maximizing the yield of CNTs.
For the MWCNT production, the conditions are optimized during arc discharge utilizing
the DC current between two graphite; usually for water-cooled electrodes with diameters
between 6 and 12 mm in a chamber filled with He sub atmospheric pressure, the soot

24
produced is minimized and 75% of evaporated carbon is made to deposit onto the
opposite graphite cathode surface from graphite anode. The deposited pyrolytic was
removed from the cathode that consists of 3 to 4 layers having 0.3 to 0.4 cm thickness that
needs to be grind for the carbon deposit on morphology and yield of product. The grinding
of the sample was carried out in three ways, the mortar and pestle, ball milling with
alumina balls and tungsten carbide grid. Depending upon the nature of grinding the sample,
the morphology of the sample is quite different from each. The optimal conditions were at
20 to 25 V, 50 to 100 amps. The DC, current density 90 A/Cm2 and the He pressure
maintained at 500 Torr. This method is a variant and easy process to produce high quality
of CNTs having 15 to 60 nm in diameter. However, this technique is not a regular and
unstable method and the yield of CNTs is very less. From these methods, the amount of
CNT on the cathode surface and electrode gap is not constant, as the results, the current
flow is not uniform throughout and electric field is non-homogenous. The temperature
distribution and density of carbon vapor is not uniform and the impurities present on the
surface of CNT collected are not constant, the consequent current flow is not uniform
throughout and electric field is non-homogenous. Hence, the temperature distribution and
density of carbon vapor are not uniform and impurities were present on the surface of
CNTs. To solve these problems that occur during the synthesis of CNTs, many researchers
(Byszewski et al., 1997; Gamaly and Ebbesen, 1995) have conducted the studies to
understand the mechanism of nanotube to produce a large scale synthesis of MWCNTs
using these techniques (Ebbesen and Ajayan, 1992).
Lee and Kim et al., (2002) used the plasma rotating arc discharge to produce large amount
of CNTs where high velocity has been adopted to rotate the graphite anode for the synthesis
of CNTs. The stable plasma was generated by the rotation of the anode with the distribution
25
of the microdischarges homogeneously. The acceleration of the carbon vapor perpendicular
to the anode is generated by the rotation of the centrifugal force. It does not condense on
the cathode surface, but collected on the graphite collector that was placed at the periphery
of the plasma. The nanotube yield increases as the rotation speed of the anode increases and
the collector becomes closer to the plasma. The optimal condition includes the high density
of carbon vapor created by the uniform and high temperature plasma for nucleation and
sufficient temperature of collectors for the nanotube growth. The plasma rotating electrode
process is a continuous process of the stable discharge and it is expected to perform the
mass production of high quality nanotubes.
The CNTs have been produced by using plasma arc jets in large quantities by optimizing
the quenching process in an arc between the graphite anode and cooled copper electrode
(Colbert et al., 1994; Hatta and Murata, 1994; Ishigami et al., 2000) reported for the
continuous synthesis of CNTs using a simplified arc discharge. This method requires only a
DC power supply, graphite electrodes and a container of liquid nitrogen continuous
synthesis need for pumps, seals, water-cooled vacuum chambers, etc. The advantage of
these techniques is simplified as no purging is required and the liquid nitrogen provides a
protective oxygen-free environment as well as being the source of buffer gas during the
arcing process, which are necessary for the production of CNTs by the conventional arc
discharge. They reported that the reaction can run in a continuous fashion and can be scaled
for industrial applications with a CNT yield comparable to that of an optimized
conventional arc reaction. In general, high quality of MWCNT is produced at a high
production rate as these nanotubes have four to eight layers and have long and straight
parallel walls with only occasional surface contamination. In fact, the tubes grown using
the liquid-nitrogen method appear to have consistently cleaner surfaces than tubes grown

26
using other methods. The tubes are composed only of carbon and show no evidence of
nitrogen incorporation. This carbon arc nanotube synthesis method eliminates nearly all the
complex and expensive equipments associated with conventional nanotube growth
techniques. The most important feature of this new synthesis method is that there appear no
obvious cost or technology obstacles to scale the method for high-quantity production.
Shi et al., (1996) produce a high yield synthesis and growth mechanism of carbon nanotube
using arc discharge. The optimal condition of nanotube growth; 100 A DC, and 500 Torr
He, the deposit with high yield nanotube bundles is synthesized. From the
appearance of the deposit and the directions of nanotube bundles and nanotubes, it
is proven that they are not parallel to the hat of electric field so that it can be
further justified that the growth of nanotubes does not mainly depend on the electric
field but the temperature gradient. It is also proven that the existence of nanosize
particles in the carbon vapor is a necessity of the nucleation of the nanotubes. The
intense heat of the plasma, the arc, the yttrium carbide or other clusters reach the
cathode together with carbon vapor and condense on the cathode to form nuclei the
diameters of the nanotubes depend on that of nuclei. The high yield is due to the large
amount of nuclei which spurt from the anode together with carbon vapor for
nanotubes to grow. The formation of single-layered (SL) CNTs has been studied using
different elements and compounds. (Ata et al., 1994; Kiang, Goddard Iii, et al., 1996;
Kiang et al., 1994; Kiang, Dresselhaus, et al., 1996; Lambert et al., 1995; Lin et al., 1994;
Saito, Kawabata, et al., 1995; Saito et al., 1996; Saito, Okuda, et al., 1995; Seraphin et al.,
1994; Zhou et al., 1994) reported that to produce SL, the CNTs are synthesized by catalytic
assistance of rare-earths in a carbon arc. The tube length ranged from 10 to 100 nm
depending on the catalytic activity of the elements, while diameters were 1.8-2.1 nm
27
regardless of the elements. The Y, La, and Ce, which are the three rare-earth elements with
the lowest vapor pressures, denoted the highest activity among the elements investigated.
The vapor pressure is a crucial factor for the formation of SL tubes by using arc-
evaporation of carbon and metal catalysts.
Seraphin and Zhou, (1994) reported that SWCNTs are produced in high yield by mixed
catalysts. The high‐density preparation of single‐wall tubes in the presence of mixed
catalysts of the types Fe/Ni and Co/Ni, in the soot as well as in the weblike deposits
forming in the chamber (Satio, 1994). Diameters cover the range from 0.9 to 3.1 nm. Park
et al (2002) reported that High yield of SWCNT has been synthesized by DC arc discharge
under low pressure of He gas with a small amount of a mixture of nickel and iron powders.
The highest yield of CNTs was obtained at a low pressure of 100 Torr with 5 wt % of metal
mixture. In addition, to produce high yield with low gas pressure they used sulphur as a
promoter to improve the yield and quality of SWCNTs. The SWCNTs were also prepared
by using various oxides (Y2O3, La2O3, CeO2) as catalysts (Saito, et al., 1995). For the Ni-
Y-graphite mixtures, (Journet, et al., 1997) studied the Large-scale production of SWCNTs
by the electric-arc technique and found that high yields (70-90%) of SWCNTs having
diameter range 1.4 nm can be produced. This Ni-Y mixture is now used worldwide for
production of SWCNTs in high yield. Shi et al., (2000) reported large-scale production of
SWCNTs under the arc conditions of 40~50 A DC and He pressure of 500 or 700 Torr by
using a graphite rod with a hole filled with the powder of a mixture of Y-Ni alloy and
graphite or CaC2-Ni and Ni as anode.
Liu et al., (2000) studied the synthesis of macroscopically long ropes of well-aligned
SWCNTs by hydrogen and Ar. The electric arc was operated at 150 A DC under an
atmosphere of 150 Torr H2 and 50 Torr Ar. They obtained ~2g/h SWCNT bundles, the

28
production of SWCNTs in the ropes about 30%, and the diameter of SWCNTs is about 1.72
nm. Ando et al., (2000) a reported mass production of SWCNTs by the arc plasma jet
method. The production rate of the cotton like soot was significantly higher than that by
conventional DC are discharged evaporation, and the highest yield was 1.24 g/min and with
purity 50%. The diameter of each SWCNT was determined to range from 1.28 to 1.52 nm.
Takizawa et al., (1999) reported on the effects of environmental temperature for
synthesizing SWCNTs by arc vaporization. The production rate of SWCNTs by burning of
a Ni-Y catalyzed carbon pellet is investigated by varying the environment temperature
(Tenv). The yield of SWCNTs indicates a maximum in the Tenv range between 400 and
600 oC. At 600
oC, the yield reaches > 70 wt%, while the yield is similar to 30 to 40 wt%
for the sample prepared at room temperature. It was also reported that the Tenv plays an
important role in the high yield synthesis of SWCNTs as well as to select the metal
catalysts.
Recently, (Ando and Zhao, 2006) reported about the synthesis of MWCNT and SWCNT
using DC arc discharge. Ambient gas played an important role, and pure hydrogen gas was
the best gas for obtaining high crystallinity of MWCNTs which obtained less than 0.4 nm
diameters. SWCNT synthesis by an arc discharge, the incorporation of catalytic metal
particles in a graphite anode is necessary, and SWCNTs are obtained as soot in an
evaporation chamber. By an arc-plasma-jet method wherein two electrodes are placed at a
sharp angle, the yield of soot, including SWCNTs is increased by decreasing the amount of
cathode deposit.

29
2.4.2 Laser ablation
The pulsed laser vaporization (PLV), or laser ablation, is a newer method currently being
developed to create nanotubes. Similar to the arc-discharge, this method vaporizes the
carbon and later deposits it onto a substrate. In 1995, the Smalley‘s group at Rice
University reported that the synthesis of CNTs by laser vaporization becomes an efficient
route for the synthesis of bundles of SWCNTs with a narrow distribution. In this method, a
piece of graphite target is vaporized by laser irradiation under high temperature in an inert
atmosphere. The MWCNTs were found when a pure graphite target was used (Guo, et al.,
1995). The quality and yield of these products have been found to depend on the reaction
temperature. The best quality is obtained at 1200 oC reaction temperature. At lower
temperatures, the structure quality decreases and the CNTs start presenting many defects.
As soon as small quantities (few percents or less) of transition metals (Ni, Co) playing the
role of catalysts are incorporated into the graphite pellet, products yielded undergo
significant modifications and SWCNTs are formed instead of MWCNTs. The yield of
SWCNTs strongly depends on the type of metal catalyst used and it is seen to increase with
furnace temperature, among other factors. A high yield with about 50% conversions of
transition-metal/graphite composite rods to SWCNTs was reported in the condensing vapor
in a heated flow tube (operating at 1200 oC) (Guo, et al., 1995).
Fig. 2.7 shows the setup of the laser furnace, which consists of a furnace, a quartz tube with
a window, a target carbon composite doped with catalytic metals, a water-cooled trap, and
flow systems for the buffer gas to maintain constant pressures and flow rates (Ando et al.,
2004; Guo, et al., 1995) . A laser beam (typically a YAG or CO2 laser) is introduced
through the window and focused onto the target located in the center of the furnace. The
target is vaporized in high-temperature Ar buffer gas and forms SWCNTs. The Ar flow rate

30
and pressure are typically 1 cm.s-1
and 500 Torr, respectively. The SWCNTs produced are
conveyed by the buffer gas to the trap, where they are collected. The vaporization surface is
kept as fresh as possible by changing the focus point or moving the target (Thess, et al.,
1996).
Figure 2.7: Diagram of laser furnace apparatus to produce CNTs adopted from Ando et al.
[82].
Thess et al., (1996) reported crystalline ropes of metallic CNTs using the laser ablation. In
this method, by producing CNTs, intense laser pulses were utilized to ablate the carbon
target. The pulsed laser-ablation of graphite in the presence of an inert gas and catalyst
formed SWCNTs at 1200 o
C and yield of SWCNT of more than 70% with a mixture of
carbon – nickel -cobalt mixture. Maser et al., (1998) studied the Production of high-density
SWCNT material by a simple laser-ablation. This method, continuous-operating CO-laser
in combination with a vertical evaporation chamber has been successfully employed to

31
produce high-quality SWCNT material. This system allows effective laser-target–gas-
plasma interactions, and therefore shows that the local condition near the evaporation zone
plays an important role in the formation of SWCNTs (the diameter of SWCNT is 1.1 to 1.6
nm). Similarly, (Muñoz et al., 2000), reported that the production of SWCNTs under Ar,
nitrogen and He atmospheres in the pressure range of 50 to 500 Torr uses a continuous
wave 10.6-mm CO2 laser. Both Ar and nitrogen can be equally used as a buffer gas to
synthesize SWCNTs in high yield between 200 and 400 Torr. Below 200 Torr, the amount
of SWCNTs in the soot is drastically decreased and the materials are dominated by
amorphous carbon. Negligible amounts of SWCNTs were formed using He as ambient gas.
Dillon et al., (2001) denoted that the synthesis of SWCNTs was investigated at room
temperature with a porous target, and at the 1200 oC with a dense target. The tube diameters
were shifted to smaller sizes with increasing pulse power in both cases. Kokai et l., (2002)
noticed that the synthesized SWCNT are 1.2–1.4nm in diameter, and aggregates of single-
wall carbon nanohorns (SWCNHs) by CO2 laser vaporization in Ar gas under pressures of
150 to 60 Torr. At 150 Torr, SWCNTs with smaller diameters were synthesized together
with amorphous carbon. With an increase in the gas pressure, the yield of SWCNTs
decreased, the tube diameters increased, and SWCNH aggregates were synthesized. At 60
Torr, most of the products were SWCNH aggregates. Similarly, (Yudasaka, Kokai, et al.,
1999) mentioned that the formation of SWCNTs from a target is composed of graphite, Ni,
and Co, compared the use of a pulsed CO2 laser with the use of a pulsed Nd: YAG laser.
They noticed that the laser experiments revealed the porous targets of graphite-Co-Ni
(nitrate) yielded twice as much SWCNT material from the standard metal carbon target.
Eklund et al., (2002) reported that the first use of ultrafast laser pulses for large-scale
production of SWCNTs is by the PLV technique. Very high production rates were achieved

32
using only 20% of the nominal average power of the 1KW where carbons soots rich in high
quality bundles of SWCNTs were produced at ≈1. 5 g/h. Similarly, (Jiang et al., 2004)
CNTs were synthesized in an atmospheric chamber by irradiating a metal-catalyst
containing graphite target with a 2 KW continuous wave CO2 laser and capturing the soot
in flowing distilled water to facilitate continuous, rapid production. The ablation products,
swept away by an Ar flow and collected in the distilled water, were further purified to
result in a yield of 50%. The growth rate of purified aggregate ranged from 0.5 to 2 g/h
depending on the laser power. The average diameter and length of nanotubes were 1.3 nm
and 1.5 µm, respectively. The major benefits of this technique are the absence of vacuum
and high-temperature furnace associated with the traditional pulsed laser, and scalability to
meet the industrial production levels. Many researchers have been synthesizing SWCNT
with high yield at the 1200 o
C in the presence of CO/Ni, graphite/bi- metal targets (Bandow
et al., 1998; Bower et al., 1998; Rinzler et al., 1998; Yudasaka, Ichihashi, et al., 1999;
Yudasaka et al., 1997; Yudasaka, Sensui, et al., 1999)] or Rh/Pd (Kataura et al., 1998). In
the early stages of MWCNT with pure graphite target (Guo, 1995; Journet and Bernier,
1998).
Both arc discharge and laser ablation produce some of the most high quality nanotubes, but
suffer from the following disadvantages which limit their use as large scale industrial
processes:
(1) They are both energy extensive methods where a large amount of energy is
required to produce an arc or laser used for the ablation processes. Such a huge
amount of energy is not only impossible but also uneconomical for large scale
production.

33
(2) Both methods require solid carbon/graphite as target which has to be evaporated
to produce nanotubes. It is difficult to get such large graphite to be used as target
in industrial process which limits its exploitation as large scale process.
(3) Both processes grow nanotubes in highly tangled form, mixed with unwanted
forms of carbon or catalysts. Thus, the CNTs produced by these processes
require purification to obtain purified and assembled forms. The designing of
such refining processes is difficult and expensive.
(4) The growth temperature of both methods is higher than other CNT production.
As a result, the crystalline and perfection of arc-produced CNTs are generally
high, and the yield per unit time is also higher than other methods.
(5) The by-products in the case of the arc-discharge and laser-ablation techniques are
fullerenes, graphitic polyhedrons with enclosed metal particles, and amorphous
carbon.
2.4.3 Chemical vapor deposition (CVD)
The CVD is essentially a thermal dehydrogenation reaction whereby a transition metal
catalyst e.g, iron, nickel, or cobalt is used to lower the temperature required in order to
‗crack‘ a gaseous hydrocarbon feed into carbon and hydrogen. The CVD is a versatile
process suitable for the manufacturing of coatings, powders, fibers, and monolithic
components. With the CVD, it is possible to produce most metals, many nonmetallic
elements such as carbon and silicon as well as a large number of compounds, including
carbides, nitrides, oxides, intermetallics, and many others. This technology is now an
essential factor in the manufacturing of semiconductors and other electronic components in
34
the coating of tools, bearings, and other wear-resistant parts and in many optical,
optoelectronic and corrosion applications.
The CVD may be defined as the deposition of a solid on a heated surface from a chemical
reaction in the vapor phase. Hugh et al., (1999) reported that it is a class of vapor-transfer
process, which is atomistic in nature that is the deposition species are atoms or molecules or
a combination of these.
The CNTs samples were produced in the reactor as shown in Fig. 2.8; it comprises a quartz
tube of 50 mm OD, 40 mm ID and 1500 mm length extended through two furnaces. The
catalyst ferrocene was placed in a ceramic boat located inside the ceramic tube at the centre
of the first furnace. The growth of CNTs took place at the second furnace and collected in
ceramic boats which were placed at the center of the second furnace. The system was
initially flushed with Ar in order to ensure an oxygen free environment. In the meantime,
the second furnace was heated to the desired reaction temperature. Heating was continued
until a steady state condition is achieved. The flow of Ar was then stopped and the first
furnace was switched on till the temperature reached 150 o
C. The gas flow for C2H2 along
with H2 was immediately released. The reaction was carried out for the desired reaction
time when the reaction is completed. The CNT produced in the ceramic boats as well as on
the inner walls of the second furnace was collected and weighed separately (Mubarak et al.,
2011).

35
Figure 2.8: Diagram of CVD to produce CNTs adopted from (Mubarak, et al., 2011).
2.4.3.1 Advantages of CVD
Recently, the CVD used in the synthesis of CNTs has attracted much attention because it
has many advantages compared to arc discharge and laser ablation. The CVD has several
important advantages, which make it the preferred process in many cases. These can be
summarized as follows (Hugh, 1999). The CVD is a relatively uncomplicated and flexible
technology, which can accommodate many variations, and the reaction process and reactor
design is simple as the reaction is easy to control and manipulate. Easily available raw
material abundance in the form of gases. With the CVD, it is possible to coat almost any
shape of almost any size. Unlike other thin film, techniques such as sputtering CVD can
also be used to produce, vertically aligned nanotubes, fibers, monoliths, foams and
powders.

36
The CVD is economically competitive.
The CVD of CNT involves flowing carbon precursor gases such as benzene, methane,
acetylene, carbon monoxide or ethanol into a chamber containing one or more heated
objects to be coated. The chemical reactions occur on or near the hot surfaces resulting in
the deposition of thin film on the surface. The CVD synthesis is achieved by taking carbon
species in the gas phase and using an energy source, such as the resistively heated furnace,
in this case, to impart energy to gaseous carbon molecules. The process usually involves
high temperature decomposition of hydrocarbons in hydrogen over the catalyst, which is
pre-deposited on the solid substrate. A typical reactor and thermal decomposition of
acetylene precursor in a hydrogen atmosphere are employed in the CVD process. The
decomposition reaction generates carbon atoms, which reach the surface of the substrate
and diffuse into tiny islands of melted catalyst which dissolve the carbon atoms forming a
metal-carbon solution. When this high temperature solution becomes supersaturated,
carbon precipitates, thus providing the ―building bricks‖ for growth of the CNT structures.
Transition metals such as Fe, Co, and Ni are frequently used as catalysts. The metal catalyst
can stay on top of the CNT forming a cap encapsulating the CNTs (Kuang et al., 2000). In
some cases, it remains at the bottom of the CNT, which promotes a bamboo-shaped
morphology Lee and Park et al., (2000) reported that the described growth mechanism is
very simplistic, and it postulates that carbon atoms from the gas phase are transported
through the melted carbon-catalyst solution to the growth surface of the CNT. This process
is based on the vapor liquid solid (VLS) mechanism. The different process variables
playing key roles in the yield and quality of the synthesized nanotubes include the reaction
temperature, reaction time, gas flow rates, kind of process steps performed during the run,
quality and quantity of the Substrate/Catalyst particle and techniques employed to bond the

37
catalyst particle on the substrate sample. Manipulating any one of them can lead to a totally
different breed of nanotubes, and may also affect the nanotube yield and the ability to
purify the product of the synthesis. Table 1 illustrates the review of synthesis of CNTs
using CVD.
The CVD deposits hydrocarbon molecules on top of the heated catalyst material. Metal
catalysts dissociate with the hydrocarbon molecules. The CVD produces both SWCNTs
and MWCNTs. The CVD process uses hydrocarbons as the carbon source. Hydrocarbons
flow through the quartz tube or ceramic according to (Muataz, 2003), where it is heated at a
high temperature (Sinnott et al., 1999). The energy source is used to ―crack‖ the molecule
into reactive atomic carbon. Then, the carbon diffuses towards the substrate, which is
heated and coated with a catalyst (usually a first row transition metal such as Ni, Fe or Co)
where it will bind. CNTs will be formed if the proper parameters are maintained. Excellent
alignment, as well as the positional control on the nanometer scale, can be achieved by
using the CVD (Muataz, 2003). Control over the diameter, as well as the growth rate of the
nanotubes can also be maintained (Cao et al., 2007; Gulino et al., 2005; Kuo et al., 2006;
Lee, Lyu, et al., 2002; Liu et al., 2003; Masao Yamaguchi, 2008; Nikolaev, 2004; Ren et
al., 1999; Tatsuki et al., 2003; Yudasaka et al., 1995). Recently, the study shows the
synthesis of CNTs using CVD with different hydrocarbon, carbon source, such as ethane
(Tomie et al., 2010), ethylene (Narkiewicz et al., 2010), acetylene (He et al., 2011),
methane (Palizdar et al., 2011), xylene (Atthipalli et al., 2011; Shirazi et al., 2011),
eventually their mixture (Li, He, et al., 2010), ethanol (Hou, 2011; Santangelo et al., 2010)
or isobutene (Yong et al., 2011). In the case of gaseous carbon source (Shukla et al., 2010),
the CNTs was efficiently grown relying on the reactivity and concentration of gas phase
intermediates produced together with reactive species and free radicals as a result of
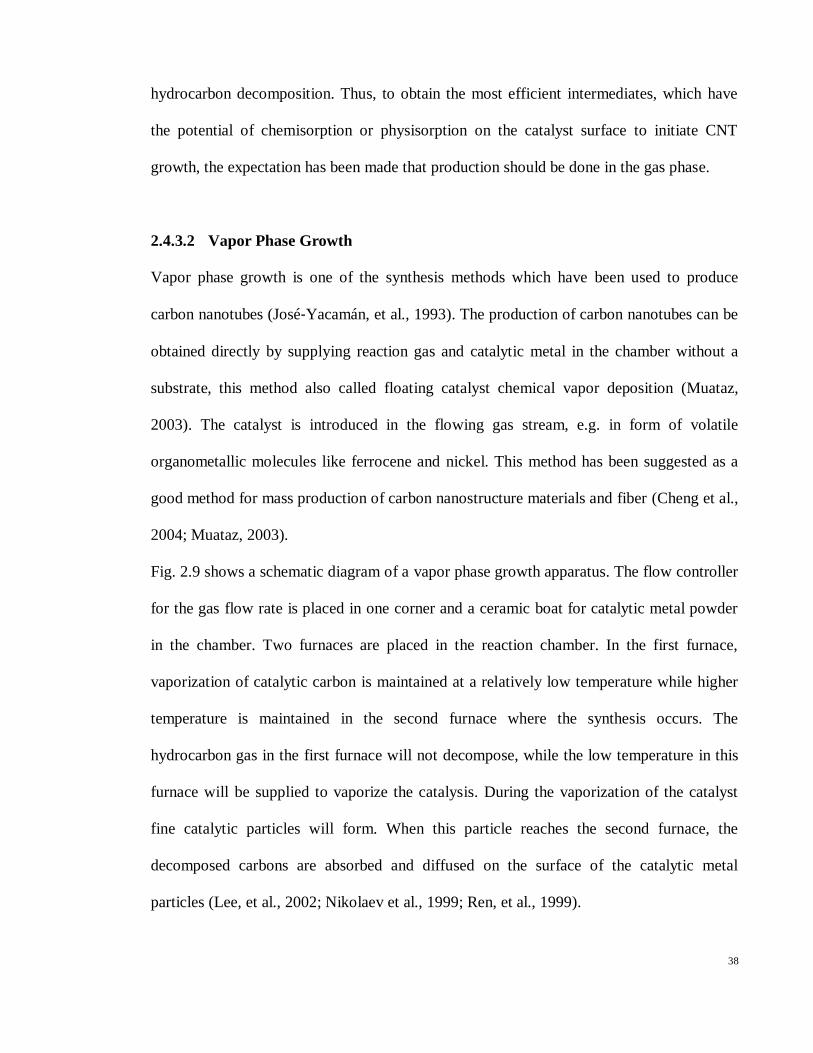
38
hydrocarbon decomposition. Thus, to obtain the most efficient intermediates, which have
the potential of chemisorption or physisorption on the catalyst surface to initiate CNT
growth, the expectation has been made that production should be done in the gas phase.
2.4.3.2 Vapor Phase Growth
Vapor phase growth is one of the synthesis methods which have been used to produce
carbon nanotubes (José‐Yacamán, et al., 1993). The production of carbon nanotubes can be
obtained directly by supplying reaction gas and catalytic metal in the chamber without a
substrate, this method also called floating catalyst chemical vapor deposition (Muataz,
2003). The catalyst is introduced in the flowing gas stream, e.g. in form of volatile
organometallic molecules like ferrocene and nickel. This method has been suggested as a
good method for mass production of carbon nanostructure materials and fiber (Cheng et al.,
2004; Muataz, 2003).
Fig. 2.9 shows a schematic diagram of a vapor phase growth apparatus. The flow controller
for the gas flow rate is placed in one corner and a ceramic boat for catalytic metal powder
in the chamber. Two furnaces are placed in the reaction chamber. In the first furnace,
vaporization of catalytic carbon is maintained at a relatively low temperature while higher
temperature is maintained in the second furnace where the synthesis occurs. The
hydrocarbon gas in the first furnace will not decompose, while the low temperature in this
furnace will be supplied to vaporize the catalysis. During the vaporization of the catalyst
fine catalytic particles will form. When this particle reaches the second furnace, the
decomposed carbons are absorbed and diffused on the surface of the catalytic metal
particles (Lee, et al., 2002; Nikolaev et al., 1999; Ren, et al., 1999).
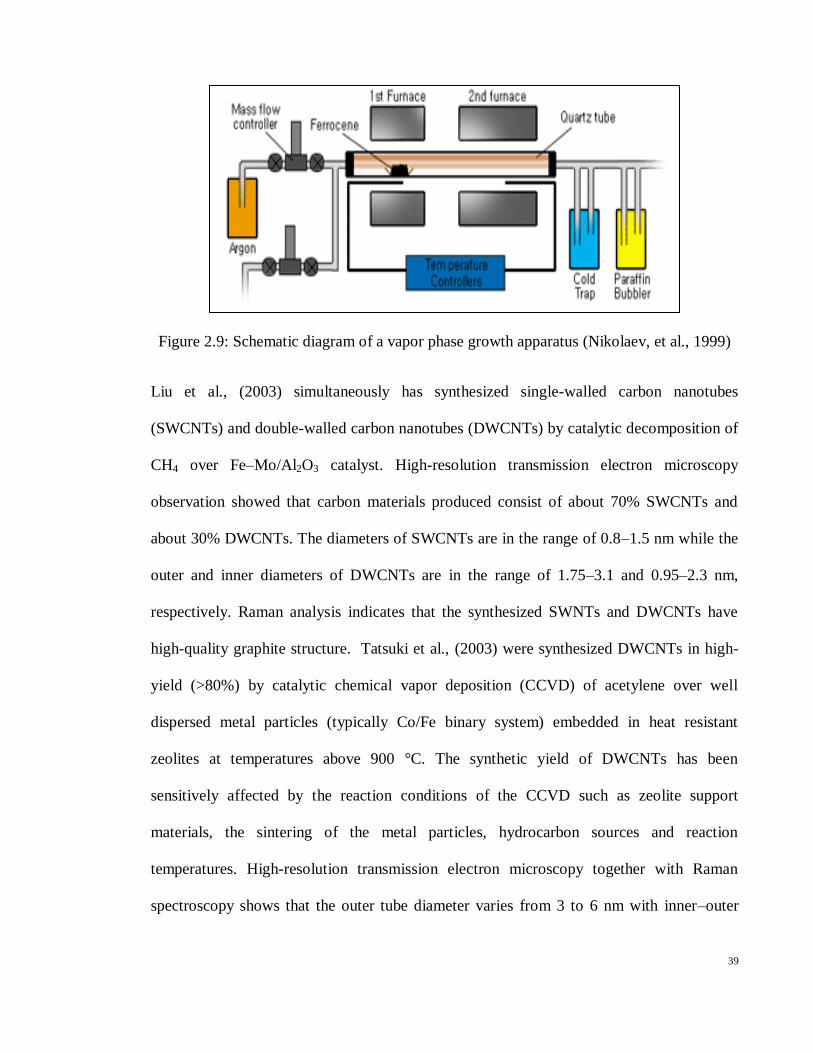
39
Figure 2.9: Schematic diagram of a vapor phase growth apparatus (Nikolaev, et al., 1999)
Liu et al., (2003) simultaneously has synthesized single-walled carbon nanotubes
(SWCNTs) and double-walled carbon nanotubes (DWCNTs) by catalytic decomposition of
CH4 over Fe–Mo/Al2O3 catalyst. High-resolution transmission electron microscopy
observation showed that carbon materials produced consist of about 70% SWCNTs and
about 30% DWCNTs. The diameters of SWCNTs are in the range of 0.8–1.5 nm while the
outer and inner diameters of DWCNTs are in the range of 1.75–3.1 and 0.95–2.3 nm,
respectively. Raman analysis indicates that the synthesized SWNTs and DWCNTs have
high-quality graphite structure. Tatsuki et al., (2003) were synthesized DWCNTs in high-
yield (>80%) by catalytic chemical vapor deposition (CCVD) of acetylene over well
dispersed metal particles (typically Co/Fe binary system) embedded in heat resistant
zeolites at temperatures above 900 °C. The synthetic yield of DWCNTs has been
sensitively affected by the reaction conditions of the CCVD such as zeolite support
materials, the sintering of the metal particles, hydrocarbon sources and reaction
temperatures. High-resolution transmission electron microscopy together with Raman
spectroscopy shows that the outer tube diameter varies from 3 to 6 nm with inner–outer

40
tube separations of 0.36–0.37 nm, which is much larger than the interlayer distance of
graphite (0.335 nm).
Teo et al., (2003), has been studied the formation mechanisms involved in the growth of
carbon nanotubes by spray pyrolysis. Both iron and nickel were used as catalysts for
growth, and nanotubes were produced using thermal chemical vapor deposition for
comparison. Transmission electron microscopy was used to analyze the encapsulated metal
catalyst particles found within the tubes, and the dimensions and location of these particles
were recorded. CNTs grown by spray pyrolysis were found to have encapsulated particles
in both the middle and end of the tubes, with large length to diameter ratios. As a result of
these observations, it is concluded that nanotubes grown using spray pyrolysis are formed
via an open-ended, root growth mechanism. Additionally, the presence of multiple, high
aspect ratio particles within single tubes is explained by an additional growth theory.
During the continued growth of these CNTs, metal atoms or nanoscale metal catalyst
particles deposit in the open ends of growing tubes, forming new particles and helping to
prevent tube closure. CNTs grown with thermal CVD did not contain similar elongated
particles or particles along the middle of the tubes, indicating that this new growth
mechanism is only applicable in the case of tubes grown via spray pyrolysis or other vapor
phase CVD growth methods.
Qui et al., (2004a) have been successfully synthesized SWCNTs from coal gas with
ferrocene as catalyst by catalytic chemical vapor deposition. The results lead to believe that
coal gas is an ideal carbon-containing precursor for preparing SWCNTs. This new
approach to SWCNTs should be of potential in the production of carbon nanotubes in large
scale. Many works are needed to further establish the influence of process parameters on
the formation, yield and quality of the SWCNTs, and to clarify the possible synergic effects
41
of gaseous species in the coal gas. Murakami et al., (2003) were synthesized high purity
SWCNTs from ethanol by the catalytic CVD method. The yield of SWCNTs was
characterized based on TGA complemented by Raman and TEM analyses. The effects of
CVD reaction time and pre-reduction of catalytic metal in the yield and quality of
synthesized SWNTs were investigated. The SWCNT yield of more than 40% was achieved
over the weight of zeolite support powder with Fe/Co catalyst, which corresponded to more
than 800% yield over the weight of the catalytic metal, within the CVD reaction time of
120 min assuring as-grown high quality.
Kobayashi et al., (2004) has been investigated SWCNT growth using a novel Fe3O4
nanoparticle catalyst synthesized with a simple organic chemistry process. They
characterized the structure of the grown SWCNTs through scanning electron microscopy
(SEM), atomic force microscopy (AFM) and microscopic Raman spectroscopy. Discrete
nanoparticles with a uniform diameter of ~4 nm could be deposited on Si substrates with a
thermal oxide layer by spin coating with a nanoparticle solution. Nanoparticles prepared
under optimum conditions remained discrete and uniform without aggregation even after
CVD process and their diameters were reduced to ~1.7 nm due to decomposition reactions
during CVD. These nanoparticles were found to have remarkable catalytic activity in the
CVD growth of the SWCNTs. SWCNTs with diameters of around 1 nm were produced
from the reduced nanoparticle catalyst. The diameters of the grown SWCNTs were closely
correlated with those of the catalytic nanoparticles and tended to be slightly smaller than
the particle size.
Kuo et al., (2005) have been synthesized MWCNTs using a chemical vapor deposition
floating feeding method in a vertical reactor. They were systematically examined Effects of
the preparation variables on the average diameter of carbon nanotubes using the fractional

42
factorial design (FFD), the path of the steepest ascent, and central composite design (CCD)
coupled with the response surface methodology. Factorial design study, the main and
interactive effects of reaction temperature, methane flow rate, and chamber pressure were
concluded to be the key factors influencing the diameter of MWCNTs. Two empirical
models, representing the dependence of the diameter of carbon nanotubes at the vicinities
around maximum (420 nm) and minimum (15 nm) on the reaction temperature and
methane flow rate, were constructed in two independent CCD studies. These models,
shown as contour diagrams, indicated that the diameter of carbon nanotubes generally
increased with increasing reaction temperature and methane flow rate. Based on both
models, the diameter of MWCNTs from 15 to 420 nm can be controlled precisely by using
a continuous CVD fabrication method.
Flahaut et al., (2005) has been reported the influence of catalyst preparation conditions for
the synthesis of carbon nanotubes by CCVD. Catalysts were prepared by the combustion
route using either urea or citric acid as the fuel. They found that the milder combustion
conditions obtained in the case of citric acid can either limit the formation of carbon
nanofibers (defined as carbon structures not composed of perfectly co-axial walls or only
partially tubular) or increase the selectivity of the CCVD synthesis towards CNTs with
fewer walls, depending on the catalyst composition. It is thus for example possible in the
same CCVD conditions to prepare (with a catalyst of identical chemical composition) either
a sample containing more than 90% double- and triple-walled CNTs, or a sample
containing almost 80% double-walled CNTs.
Gulino et al., (2005) has been successfully used ethane as an active and efficient carbon
source in a large-scale synthesis of high quality carbon nanotubes by CVD over Fe/Al2O3
catalyst with an iron loading of 20 wt.% . The carbon nanotube yield of 20 g per gram of

43
catalyst per hour was obtained at a synthesis temperature of 660 °C. The active phase for
growing carbon nanotubes is a mixture of metastable iron carbide (Fe3C) and -Fe, which
were formed in situ by the ethane dissociation followed by carbon diffusion through the
starting a-Fe phase similar to that reported in the literature. The reaction products only
contained multi-walled carbon nanotubes with very homogeneous diameters between 20
and 40 nm and lengths up to several hundred nanometers without any trace of other
impurities such as nanoparticles or amorphous soot. The high yield of the MWCNT
significantly decreases the amount of the catalyst in the final product and the product can
be used directly without the need for post-synthesis treatment in order to remove the
catalyst. Ethane is an active carbon source for growing MWCNTs with high yield and
selectivity. The CNTs formation at the reaction temperature 750 °C contains amorphous
soot and carbon nanoparticles mixed with nanotubes.
Synthesis of MWCNTs through a catalytic chemical vapor deposition method using a
floating reactant method and subsequent thermal treatment up to 2600 °C in a large
quantity (Kim, Hayashi, et al., 2005b). Main characteristics of these nanotubes are (1)
relatively wide distribution of diameters ranging from 20 to 70 nm and linear, long macro-
morphology (aspect ratio >100), (2) highly straight and crystalline layers, (3) high purity
through removal of metallic impurity, (4) very low interlayer spacing (0.3385 nm) and low
R value (ID/IG = 0.0717), (5) high G' intensity over intensity of G band (G'/G = 0.85). The
unusual microstructure of thin multi-walled carbon nanotubes with a partially facetted
cross-sectional shape caused by thermal treatment is mainly ascribed to abrupt density
changes (from 1.89 to 2.1 g/cm3) within a confined nanosized space, accompanying with
the phase separation.

44
Harris et al., (2005) has been synthesized preferential oriented multi-walled carbon
nanotubes by injection CVD using either cyclopentadienyliron dicarbonyl dimer or
cyclooctatetraene iron tricarbonyl as the iron catalyst source. The catalyst precursors were
dissolved in toluene as the carrier solvent for the injections. The concentration of the
catalyst was found to influence both the growth (i.e., MWCNT orientation) of the
nanotubes, as well as the amount of iron in the deposited material. The multi-walled carbon
nanotubes contained as little as 2.8 (wt %) of iron. The material was deposited onto
tantalum foil and fused silica substrates. The CNTs were characterized by scanning electron
microscopy, transmission electron microscopy, and Raman spectroscopy and
thermogravimetric analysis. This synthetic route provides a simple and scalable method to
deposit MWCNTs with a low defect density, low metal content and a preferred orientation.
Pinault et al., (2005) has been reported a study of the initial stages of growth of aligned
MWCNT synthesized by CCVD of liquid aerosol obtained from toluene/ferrocene solution
A special experimental procedure has been developed to stop the process after short
durations (30 s to 2 min). Two different pyrolysis temperatures are considered: 800 and 850
ºC. Both scanning and transmission electron microscopy (SEM, TEM) coupled with
energy-dispersive X-ray (EDX) analyses are used in order to determine the location of
catalyst particles and to examine their chemical nature, morphology and size distribution
when nanotubes start to grow. During the early stages (30s), they observe the formation of
a layer of catalyst particles on silicon substrates before the growth of nanotubes. X-ray
diffraction (XRD) and X-ray photoelectron spectroscopy (XPS) measurements indicate the
occurrence of iron oxide (C-Fe2O3 or Fe3O4). In addition, XPS analysis reveals the
formation of graphite-like carbon, demonstrating that iron oxide particle catalyst the
decomposition of toluene vapor. SEM and TEM observations show that these particles are

45
most often located at the nanotube root, suggesting a base growth mechanism responsible
for the formation of aligned nanotube when prolonging growth time (2 min).
Reported a systematic study on the controlled growth of large areas of aligned multi-wall
carbon nanotube arrays, from ferrocene–benzene precursor, and of nanotube junctions from
ferrocene–thiophene precursor, without hydrogen addition, using an injection CVD method
easy to scale up for industrial production (Tapasztó et al., 2005). A detailed study is
presented of how the synthesis parameters such as growth temperature, active solution flow
rate; catalyst concentration or sulfur addition can control the properties and morphology of
the grown nanotube mat. Nanotube junctions with a considerable yield can be grown by
adding sulfur to the synthesis process. The sulfur addition also results in growth of carbon
nanocones (CNC) in the lower temperature regime of the furnace. Observation of single-
wall carbon nanotubes using Scanning tuning microscopy (STM) investigations provides
further indication that under properly chosen conditions SWCNTs can be grown with
similar continuous processes.
2.4.3.3 CVD Method using Substrate Catalyst
In this method substrates like silicon (Si), Silicon dioxide (SiO2), and aluminium are used
to deposit different types of catalysts such as Fe, Ni, Co on the substrate. After the substrate
was washed with distilled water and diluted HF solution, the substrate was placed in a
ceramic boat. The ceramic boat is positioned in the center of the CVD furnace as shown in
Fig. 2.10. Very thin film of catalyst will be deposited over the substrate catalyst when the
catalyst is injected with hydrocarbon source into the chamber of the furnace tube. During
the injection of the hydrocarbon with catalyst precursor, the organic catalyst will
decompose into fine cluster catalysts and will deposit over the substrate.

46
Figure 2.10: Schematic diagram of thermal CVD apparatus (Zheng et al., 2002).
Chen and Wu (2005) have been study the effect of thickness ratio of Ni:Cr on the density
and alignment of CNTs synthesized by CVD (Changing the layer thickness ratio of Ni:Cr
can change the density and alignment of CNTs dramatically. It is found the density and
alignment can be controlled by adjusting the thickness ratio of Ni: Cr. Meanwhile, the
catalyst encapsulated in the CNT was confirmed to be a Ni by EDX and HRTEM
measurement. They conclude that only Ni has catalysis and Cr acts as dispersant in these
experiments. Thus, their investigations are significant in providing a better understanding
of the acting of catalyst and the controlling of the desirable density and alignment of CNTs
for various applications. Xu et al., (2005) have been explained the importance of substrates
in chemical vapor deposition by using two different substrates such as Kaolin plate and
ceramic plate. Kaolin supported cobalt catalyst was used on these substrates, also without

47
substrate and the catalytic decomposition of C2H2 was carried out at the optimal
temperature (750 °C) in nitrogen atmosphere. They produced two kinds of carbon
nanostructures, carbon nanotubes and carbon spheres.
The peculiar ability of transition metals such as iron, cobalt and nickel to catalyze CNT
formation is mostly linked to their catalytic activity for the decomposition of carbon
compounds, their ability to form carbides and the possibility for carbon to diffuse through
and over the metals extremely rapidly (Sinnott, et al., 1999). The metals used to catalyze
CNT formation are most often transition metals, in particular iron, cobalt and nickel. Many
of the papers available in the literature about the growth of CNTs on iron based catalysts
report growth of MWCNTs (Fan, Wan, et al., 1999; Lee, et al., 2002) for production of
CNTs Many groups also obtained SWNTs (Kim, Hayashi, et al., 2005a; Nikolaev, et al.,
1999). Most of the reported results obtained with cobalt-based catalysts concern formation
of MWCNTs (Ago et al., 2000; Pinheiro et al., 2003), a few others SWNTs (Colomer et al.,
2000; Geng et al., 2002). Mixtures of transition metals are often observed to be more
efficient for CNT production than one metal alone. Iron-nickel alloys are found to produce
MWCNTs (Maroto Valiente et al., 2000), iron– cobalt alloys seem to produce rather
SWNTs (Willems, Konya, et al., 2000) obtained SWNTs with a nickel–cobalt alloy (Dai et
al., 1996). The catalyst nanoparticle would therefore not disturb the electronic transport
properties of the nanotube by forming a Schottky barrier. Nevertheless, palladium has been
used a little as a catalyst for CNT formation, as described in (Vajtai et al., 2002). These
three papers report growth of MWNTs. Other metals than iron, cobalt, nickel or palladium
have been used as a catalyst. These metals are generally, but not necessarily non-active
catalysts alone, but at any rate are used to improve the performance of the ‗‗classical‘‘
catalysts when added to them in different quantities. Molybdenum is the most important,

48
added to iron (Cassell, et al., 1999; Harutyunyan et al., 2002) or to cobalt (Huh et al.,
2003). Table 2.1 illustrates the review of synthesis of CNTs using CVD.
Table 2.1: Summary of CVD process
Reaction Condition
Catalyst and
substrate
Carbon
source
Temp.
(oC)
Time Flow rate of
gases
(ml/min)
Product
Quality
Ref.
Co, Fe,
Cu/SiO2,
Zeolite, clay
C2H2 700 30
min
C2H2 ~8
N2 ~75
MWCNTs
(71-76%) and
SWCNTs
(low yield)
(Fonseca et al.,
1996)
Co-Mo, Co-V,
Co-Fe/SiO2,
Zeolite
C2H2 700 60
min
C2H2 ~30
N2 ~300
NAY/CA
(5%wt by CO-
V,Co-Fe and
CO-MO)
MWCNTs (Willems,
Kónya, et al.,
2000)
Co-Mo ,Co-Ni
CO 1200 60
min
CO ~1200
(flow in
chamber) The
CO pressure
was held at
~100 Torr
SWCNTs
(1-5 nm in
diameter)
(Dai, et al.,
1996)
Co-Mo
(1:2)/SiO2
CO 700 60
min
CO ~100
MWCNTs
(4%) &
SWCNTs
(88%)
(Kitiyanan et
al., 2000)
Co, Ni,
Fe/MgO
H2/CH4
(4:1)
1000 10
min
H2 ~300 CH4
~75
SWCNTs
(1-5 nm in
diameter (70-
80%)
(Colomer, et
al., 2000)
Fe-Mo, Fe-
Ru/Al2O3-SiO2
CH4 900 30
min
CH4 ~6000 SWCNTs
(~42 wt%)
(Cassell, et al.,
1999)
Mg0.9Co0.1M
o0 .025 O
H2/CH4 1000 30
min
18 mol% CH4
CH4 ~250
SWCNTs
/DWCNTs ~
64wt%
(Flahaut et al.,
2003)

49
(>80% 0.5 –5
nm diameter)
Fe/Al2O3 CH4 900 10
min
- DWCNTs
(1-6 nm
diameter)
(Cumings et
al., 2003)
Fe-Mo, CH4 875 30
min
CH4 : Ar
(1:1 ratio)
DWCNTs (in
high yields)
(Endo et al.,
2005)
Fe, Co,
Ni/Al2O3 SiO2
Fe(CO)5
C2H4 800-
1000
10
min
C2H4 ~30
N2 ~80
SWCNTs or
thin MWCNT
(3-12 nm
diameter)
(Cheung et al.,
2002)
Fe, Si-substrate C2H5OH 900 30
min
Ar + H2 (6%)
~20
SWCNTs
(4 cm length)
(Zheng et al.,
2004)
Fe/Mo,
SiO2/Si
CH4 900 7 min CH4 (~1500)
H2(~125)
SWCNTs (Franklin et
al., 2001)
Al/Fe/Mo, Si-
substrate
C2H2 1000 5 s C2H2 ~50-250 SWCNTs
(~1.3nm
diameter)
(Lacerda, Teh,
et al., 2004)
Fe,Co,
Zeolite powder
Mo,Co
C2H5OH
C2H5OH
700-
800
800
30
min
C2H5OH
vapour
(5 Torr),Ar
C2H5OH
vapour
(10 Torr),
Ar-H2(3%)
SWCNTs
( >40 wt%)
Mat of
SWCNTs
(Maruyama et
al., 2002)
Metallocene
M(C5H5)2
(M=Fe, Co,
Ni)
C6H6 900 120
min
Ar (75%)
H2 (25%)
Ar+H2 ~50 &
1000
MWCNTs (Sen et al.,
1997)
M(C5H5)2
(M=Fe,Co,Ni),
Fe(CO)5
C2H2
CH4
1100
1373
60
min
60
min
Ar ~975
H2 ~25
C2H2 ~50
Ar ~950, H2
~50,CH4-50
SWCNTs
(diameter 1-2
nm)
(Satishkumar
et al., 1999;
Satishkumar et
al., 1998)
Fe (C5H5) 2, Coal gas 850-
950
30
min
Coal
~50-200
SWCNTs (1-
2nm
diameter)
(Qiu et al.,
2004b)
Fe (CO)5 CO 800-
1200
60
min
CO (<10 atm)
SWCNTs
(0.7-1.4 nm )
(Nikolaev,
2004;
Nikolaev, et
al., 1999)
Fe (CO)5 CO 1050 60
min
CO (30 atm) SWCNTs
(450 mg/h)
(Kim et al.,
2003)
Ba/Ca
C2H2 700 30
min
C2H2 ~
60ml/min
MWCNT
(100-300nm)
(Eftekhari et
al., 2006)

50
H2/Ar ~10:1
Si3N4 C2H2 800-
1000
5 to
30
min
C2H2 ~(0.5-
100m bar)
SWCNT
(1-5nm
(Kasumov et
al., 2007)
Si
C2H2 600-
750
15
min
H2 ~(0-400
cm3/min)
C2H2 ~ 50
cm3/min
Ar (Fe(CO)5
~(100-300
cm3/min)
MWCNT (Kuo, et al.,
2006)
Ni/SiO2-Al2O3 CH4 850-
1000
10
min
H2/CH4 MWCNT
(16-100 nm)
(Bustero et al.,
2006)
Ni C2H2 550 60
min
C2H2 ~10-90
sccm
MWCNT
(40-80 nm)
(Cao, et al.,
2007)
Si/SiO2/Al2O3 C6H12 750 5 min C6H12
(50 mbar)
H2~400
MWCNT
(10 nm)
[153]
Fe2CO/Al2O3 C2H4 750 10
min
C2H4~(50-
200),
Ar~80,H2~80
MWCNT
(50 nm)
(Magrez et al.,
2011)
Si/SiO2 CH4 900 20
Min
CH4~500
sccm,
H2~500
SWCNT
(5 nm)
(Liu et al.,
2009)
Fe PP,PE,
PVC
800 30
Min
Ar~ 500,
H2 ~30sccm
MWCNT
(29-34 nm)
(Yang et al.,
2010)
NiO/HZSM-5
zeolite
PP 500-
800
35
Min
Plastic feed
rate 80 g/h,
Hydrogen gas
concentration
72.21 vol.%
MWCNTs
(15-25 nm)
(Liu et al.,
2011)
Ni/Fe/CO/
HZSM-5
Zeaolite
PP,PE
PVC,
PET
400-
900
1-60
min
Ar to H2 (50:3
vol %)
MWCNTs
10-50 nm
(Bazargan and
McKay, 2012)
Fe C6H6 750 5-240
min
Ar~100 sccm MWCNT
(2nm).
(McKee et al.,
2009)
2.4.3.4 Microwave assisted Chemical Vapor Deposition (MA-CVD)
Recently, a microwave-assisted synthesis is enabling technology that has been extensively
used in organic synthesis (Brunetti, et al., 2007; Dallinger and Kappe, 2007; Nuchter et al.,
2004). Microwave-assisted modification of CNTs is non-invasive, simple, fast,

51
environmentally friendly, and clean method as compared to traditional methods. Usually,
the use of the microwave facilitates and accelerates reactions, often improving relative
yields. In case of microwave-assisted functionalization of CNTs, microwave irradiation of
CNTs and CNFs reduces the reaction time and gives rise to products with higher degrees of
functionalization than those obtained by the conventional thermal methods (V zquez and
Prato, 2009). Interestingly, suggest a competitive effect of microwave irradiation that both
promotes functionalization and removes some functional groups that are initially present
(Liu et al., 2007). On the other hand, Vazquez and co-workers, 2009 show that a solvent-
free technique combined with microwave irradiation produces functionalized nanotubes in
just 1 h of reaction, paving the way to large scale production of functionalization (Nuchter,
et al., 2004). Although materials are heated differently by microwaves, the maximum
temperature is determined primarily by the dielectric properties of the receptor. The
microwave heating of carbon-based materials gives rise to hot spots that appear as small
sparks or electric arcs, with local temperature higher than 1100 °C. These hot spots have
been well established as the thermal sensitizer upon microwave irradiation in the fields of
organic synthesis, environmental remediation, preparation of catalysts, and carbon
nanostructures (Kharissova, 2004). According to the previous study reported by Mendez et
al., (2003), microwave heating was used to produce carbon nanotubes from graphite by
applying microwave power of 800 W, oven temperature approximately at 1200 oC for 60
min. This study also shows that no catalyst was employed and graphite was directly
targeted for microwave heating as graphite does not require a preliminary heating. Along
with graphite, few other samples such as sucrose-graphite, boric acid with graphite were
also tested with this microwave heating method. By doing this, the formation of nanotubes
and nanofibers for sucrose-graphite sample was observed (Méndez, et al., 2003). The same

52
yield for boric acid and graphite with an additional yield of micro particles was also
observed. Hong et al., (2003) report a method for the synthesis of CNTs by microwave
irradiation. CNTs were successfully synthesized by microwave heating of the catalyst
loaded on various supports such as carbon black, silica powder, or organic polymer
substrates (Teflon and polycarbonate). Microwave ( .45 GHz, 8 W) irradiation used
acetylene as a hydrocarbon source, and 3D transition metals and metal sulfides were used
as the catalysts. Kharissova et al., (2004) developed a study for obtaining long and aligned
carbon nanotubes with or without Fe filling by a highly efficient one step technique.
Ferrocene was utilized as a catalyst to synthesise the aligned carbon nanotubes (CNTs) by
heating it through microwave irradiation. However, in this study, used a catalyst (Fe) and a
silica fused target. Microwave heating allows the growth of vertically aligned.
Lee, (2007) reported that, synthesis of CNTs on various supports, even on organic polymer
substrates, by microwave heating of the catalysts under atmospheric pressure was
conducted in order to establish a better understanding of the influence of chemical
structures and processing conditions on the properties of CNTs which are directly
synthesized on polymeric and organic materials through microwave irradiation. Benito et
al., (2009b) reported that, the microwave-hydrothermal treatment determines the chemico-
physical properties of Co-Zn-Al catalysts obtained by calcination of layered double
hydroxide at 500 °C. The treatment affects to the distribution of the cations within the
layers of the precursors because of an improved order. This effect is also observed in the
catalysts. The kinetic study of carbon growth from the catalytic decomposition of methane
indicates that the treatment improves the activity and the stability of the Co-Zn-Al catalyst.
However, remarkable differences between the different aged catalysts are not found. This
observation is in agreement with the results obtained by characterization, the greatest

53
changes in the properties are observed in the sample aged for the shortest period of time.
On the other hand, the transmission electron microscopy results show that the carbon
products obtained also depend on the duration of microwave-hydrothermal treatment,
producing a change of the type of the nanofilaments formed (herringbone carbon nanofibers
or multi-walled carbon nanotubes) and of the quantity of amorphous carbon produced. In
addition, Zajickova et al., (2009) reported that, the microwave operating in the atmospheric
pressure was successfully applied to the fast deposition of MWNTs on the substrate without
necessity of any vacuum or heating equipment. Different ways to generate in situ and ex-
situ catalytic nanoparticles for the carbon nanotube growth were tested. Dense straight
standing nanotubes were successfully prepared on silicon substrates with or even without
barrier SiOx layer and oxidized Al layer. Therefore, it was possible to produce CNTs
directly on conductive Si and used them as electron-emitting electrode of the gas pressure
sensor. The CNTs grown in microwave torch were also intended to create a gas sensor
based on the changes of electrical resistance measured between two planar electrodes
connected by CNTs.
Zeng et al., (2010) reported that microwave-assisted pyrolysis of methane on the growth
and morphology of carbon nanostructures (carbon nanospheres and CNTs) in the absence
of a catalyst was studied. A vertical quartz tube was placed in a 2.45 GHz domestic
microwave oven to carry out the experiment. A microwave absorber material carbon/carbon
composite without mineral content was placed in the tube, which acted like a catalyst for
nanostructure growth. Flushing the nitrogen before performing the experiments eliminated
the oxygen from the cavity. The reaction was performed in a mixed gas flow CH4/N2 (ratio
of 1:4) for 60 min and then the substance deposited on the quartz wall was used for further
analysis. The results demonstrated that microwave-assisted pyrolysis is a novel and

54
promising approach for synthesizing carbon nanostructures. Besides, the experimental
conditions, such as methane to nitrogen ratio, reaction temperature, and total gas flow rate,
affected the nature of the produced nanostructures.
Vivas-Castro et al., (2011) reported that, synthesis of carbon nanotubes and other carbon
nanostructures by microwave irradiation is simple and low-cost. With this technique and
under various preparation conditions obtained nanostructured material from a graphite/iron
acetate powder mixture using a commercial microwave oven as an energy source.
Microwave absorption by the powder mixture results in pyrolysis of iron acetate.
Decomposition of the acetate provides metallic iron nanoparticles that act as catalysts in the
synthesis of nanotubes and other carbon nanostructures. Different type of nanostructured
carbon can be obtained by variation of preparation conditions. Direct irradiation of
(vacuum sealed) quartz ampoules, and attenuated irradiation by partial submerging the
ampoules in water provide examples of the variety of nanostructures that can be obtained at
different stages of microwave exposure. Reactions are very fast and may become so violent
that can cause explosions of the ampoules. To avoid any accidents, the sites inside the
microwave oven with maximum radiation intensity should be determined before. Exposure
to microwaves and temperature gradients are static, resulting in the growth of well oriented
and aligned MWCNTs arrays. Bekarevich et al., (Bekarevich et al., 2012) MWCNTs and
few-layer graphene sheets have successfully grown on Si and polyimide substrates at
relatively low temperature of 230 to 260°C by the microwave-excited surface wave plasma
technique. Graphite-encapsulated Ni nanoparticles have been used as the catalyst for
growing CNMs in NH3/CH4 plasma. It has been found that bias voltage and the nature of
the substrate can greatly influence the CNMs structure.

55
Recently, Konno et al., (2013) reported that CNTs can be directly prepared by microwave
plasma decomposition of Methane over Fe/Si activated by biased hydrogen plasma. In this
research, using Fe/Si catalyst, methane was decomposed to H2 and CNTs by microwave.
After the hydrogen plasma treatment, both methane and hydrogen gas mixtures (ration 1:4)
were flowing into the reactor, exposed to power of 500W for 30 min reaction time at
temperature of 600oC. Resulting CNTs‘ diameter reaches a maximum value of .5 nm at
treatment time of 20 min and a minimum value of 9.8 nm at treatment time of 30 min. The
maximum height of the MWCNTs increases with increasing plasma treatment time, and
reaches 30.7 nm at 10 min.
2.4.3.5 Microwave Plasma Chemical Vapor Deposition (MP-CVD)
In Plasma enhanced-CVD method, carbon nanotube was growth over the substrate catalyst,
which is coated with a catalyst, but the substrate, is located inside the plasma. In this
method, usually the source of the plasma is RF- (radio frequency), MW- (microwave) or a
DC-plasma (direct current). The plasma enhanced CVD method generates a glow discharge
in a chamber or a reaction furnace by a high frequency voltage applied to both electrodes.
Fig. 2.15 shows a schematic diagram of typical plasma CVD apparatus with a parallel plate
electrode structure and a substrate is placed on the grounded electrode. Hydrocarbon such
as methane (CH4) and hydrogen (H2) gas mixture with a ratio of 1% CH4 to 99% H2 is used
at a total pressure between 1 to 40 mbar and a temperature of 900 °C to produce CNTs
(Bower, Zhu, et al., 2000; Küttel et al., 1998; Ren, et al., 1999).

56
Figure 2.11: Schematic diagram of Plasma Enhanced CVD apparatus (Bower, Zhou, et al.,
2000)
Huang et al., (1998) reported that synthesizing CNTs on low temperatures, by using
microwave plasma enhanced chemical vapor deposition (MPE- CVD). The lowest reported
growth temperature when that research was being conducted was 666 oC (Huang et al.,
1998). Choi et al., (2000) carried out an investigation on producing CNTs a lower
temperature (520 oC) by MPE -CVD using Ni as the growth catalyst and Si as the substrate.
For the carbon source, CH4 and H2 was used. The plasma power was set to 400 W and the
reaction time for CNT growth varied from 50 to 100 min. Characterization of the grown
CNTs shows uniformly graphitized CNTs were synthesized with a high density, which
proves that pure carbon nanotubes were grown at a very low temperature on Si substrates
57
coated with Ni catalyst using MPE-CVD with CH4/H2 gas mixtures. Chhowalla et al.,
(2001) reported, the growth of vertically aligned CNTs using a direct current plasma
enhanced chemical vapor deposition system is reported. The growth, properties is studied
as a function of the Ni catalyst layer thickness, bias voltage, deposition temperature,
C2H2:NH3 ratio, and pressure. It was found that the diameter, growth rate, and areal density
of the CNTs are controlled by the initial thickness of the catalyst layer. The alignment of
the CNTs depends on the electric field the growth occurs by diffusion of carbon through the
Ni catalyst particle, which rides on the top of the growing tube.
Chen et al., (2002) reported that high yield multi walled carbon nanotubes can be obtained
by MP-CVD maintained at a low temperature. In their study, shows that usage of carbon
dioxide as a substitute of hydrogen gas, mixed with methane gas for the carbon source gas
system provides a high yield and good alignment of CNTs that is obtainable by maintaining
a lower temperature of the gas system. Microwave heating of Fe-deposited-Si substrate was
done for 20 min at temperatures lower than 330 oC with microwave power of 300 W.
Rather than using the conventional reaction gas mixtures such as hydrogen-methane,
hydrogen-acetylene and hydrogen-benzene, a different approach by using methane with
carbon dioxide is considered as a successful method in producing high quality CNTs
(Chen, et al., 2002).
Liu and Ting (2003) investigated on the growth of CNTs using microwave plasma
enhanced chemical vapor deposition. In their study, synthesized CNT uses a microwave
with 1500 W and an iron containing liquid compound, Ferrofluid as the catalyst for CNT
growth. Ferrofluid was sprayed onto Si which was used a substrate prior to the heating
process. Gas mixtures of CH4 and H2 were utilized as the carbon source. The reaction time
and the temperature allowed in the plasma were 5 min and 1100 oC respectively. Grown

58
CNTs were studied for characterization and it can be concluded that Liu obtained uniform
and oriented CNTs with an average length of 12 micrometer and methane concentration
and plasma power affects the diameter of CNTs being grown (Liu and Ting, 2003).
Taniguchi et al., (2005) reported that, a study in preparation of dense CNTs film using
microwave plasma-enhanced chemical vapor deposition where dense, vertically aligned
CNT . As in for this study, a carbon source gas where a mixture of acetylene and hydrogen
was used. Microwave power of heating was kept at 900W and 800 oC respectively, and
growth experiment was done for about 10 min. Besides that, heat pre-treatment for the
catalyst was not required for this study. The growth of the carbon nanotubes was evident on
the Co-catalyzed substrate which was buffered with a TiN layer. Observation on the growth
rate behavior was recognized and reported earlier (Bower, Zhou, et al., 2000; Bower, Zhu,
et al., 2000). The CNTs were characterized by a relatively large inner diameter 4 nm and
thinner wall thickness 2–5 concentric layers. Dense, aligned CNTs grown from the laser-
ablated catalytic nanoparticles would be applicable for the vertical wiring of an ultra-large
scale next generation integrated circuit (Taniguchi, et al., 2005).
Quinton et al., (2013) reported that, thermal (T-CVD), MPE-CVD, and floating catalyst
thermal CVD (FCT-CVD). Methane gas was introduced into the microwave as a source of
carbon and Fe use as a catalyst. T-CVD provided the largest diameter tubes, with catalysts
residing mainly at the CNT/diamond interface. The MPE-CVD process yielded a non
uniform defective CNTs, and FCT-CVD resulted in the smallest diameter CNTs with
catalyst particles imbedded throughout the length of the nanotubes. The Raman
spectroscopic analysis suggested that T-CVD had the lowest disordered carbon to graphite
intensity ratio of 0.3 followed by FCT-CVD of 0.83 and the highest by MPE -CVD of 1.94.
T-CVD also produces large diameter CNTs that are otherwise clean, with minimal tubular

59
defects or additional catalytic contaminants. MPE-CVD is sometimes the preferred method
for larger scaled applications.
Nie et al., (2013) prepared CNTs by placing a conductive polymer and ferrocene under the
microwave, where the polymer was the microwave acceptor and the simple microwave
oven in air at room temperature, without the need of an inert gas atmosphere or other gas
feeds. Although this convenient and ultrafast method did not require any complex
apparatus, high temperature or inert atmosphere, the need to synthesize the conductive
polymer layer increased the complexity and cost substantially. In their study reported that, a
one-step and low-cost CNTs fabrication method by a single carbon fiber triggering the
pyrolysis of ferrocene under microwave field. CNTs were synthesized in 15 to 20 S by a
single carbon fiber initiating the pyrolysis of ferrocene under microwave field without any
other chemicals. The growth of CNTs can also be triggered by other carbonaceous
materials and influenced by their configurations. The CNTs prepared by the method
described here have a graphitic structure that is better than the commercial MWCNTs of the
same diameter. The precise mechanism of CNTs growth is still under investigation.
2.5 Comparison of nanotube synthesis methods
Although many methods have been developed for synthesis the MWCNTs and SWCNTs,
only the first three methods which are the electric arc-discharge, laser ablation and CVD
are widely adopted. In the arc discharge, a vapor is created by an arc discharge between two
carbon electrodes with or without catalyst. In the laser ablation technology, a high
achievement laser beam imposes to the volume of the carbon, containing feedstock gas
(methane or carbon monoxide). Laser ablation produces a very small amount of pure
nanotubes, while an arc-discharge produces in general large amounts of the impure

60
material. The production of CNTs using CVD is the most promising method for possible
industrial scale-up due to the its relative simplicity of operation, process control, energy
efficiency, the raw material used, capability to scale up as large unit operation, high yield
and purity. In this process, any hydrocarbons in the presence of a catalyst (Fe/Co/Ni) at
high temperature (600-1000 o
C) can produce large amount of high purities of CNTs.
Compared with conventional heating technques, microwave heating has additional
advantages as follows: higher heating rates selective heating, greater control of heating
process, no direct contact between the heating source and heated materials, and reduced
equipment size. In addition, So, to overcome this shortcomings, MA-CVD seems to be the
most promising method for possible industrial scale-up due to the relatively low growth
temperature, high surface area, high adsorption capacity, less pollution and energy saving.
Low cost and high yield of CNTs for industrial application Single stage production of
carbon nanotubes using microwave heating compared to the conventional method which
requires multiple stage. A comparison of these techniques according to the synthesis
temperature, nanotube graphitization, yield and relative CNTs quantity is shown in Table 2.
The CVD process is very simple, easily reproducible, highly selective (SWCNTs or
MWCNTs alignment, diameter, length) and can be scaled to produce by the kilogram.
Based on these attributes the CVD is the most promising synthesis method for producing
large qualities of CNTs at a low cost.

61
Table 2.2: Comparison of Arc-discharge, Laser ablation and CVD
Process Arc-
Discharge
Laser
ablation
CVD Ref
Reaction
temperature
3000 to 4000
oC
3000 o
C 500 to1100
oC
(Ebbesen, et al., 1993;
Journet and Bernier,
1998)
Per unit design
cost
High High Low (Ando, et al., 2004;
Thess, et al., 1996)
Nanotube
selectivity
Low Low High (Muataz, 2003)
Source of carbon Difficult Difficult Easy
available
(Cao, et al., 2007)
Purification of
CNT ( high
impurities)
High High Low (Fonseca, et al., 1996)
CNTs yield <30% ≈7 % 95-99% (Colomer, et al., 2000;
Fonseca, et al., 1996)
Process nature Batch Batch Continuous (Cassell, et al., 1999;
Zheng, et al., 2004)
Process parameter
control
Difficult Difficult Easy to
control
(Bustero, et al., 2006;
Kim, et al., 2003)
Energy
requirement
High High Low (Nagaraju et al., 2002)
Reactor design Difficult Difficult Easy to
design
reactor
(Kong et al., 1998)
Nanotube
graphitization
High High Middle (Pérez-Cabero et al.,
2004; Zhu et al., 2003)
2.6 Factors influencing the growth mechanism of carbon nanotubes
Among the parameters that influence the growth mechanism of CNTs are the catalyst,
carrier gas, substrate, and temperature of synthesis, reaction time and the flow rate of
carrier gas. Most effective and widely used catalysts are Fe/Co/Ni. The rationale for using
these metals lies in the phase diagrams for these metals and carbons. At a high temperature,
carbon has a finite solubility in these metals, which leads to the formation of metal-carbon
solutions and therefore the aforementioned growth mechanism. Li et al., (2010) reported
that the growth process, catalysts plays an important role in controlling the structure of

62
SWCNTs. Also observed systematically studied the size-controlled synthesis of Fe-based
nanoparticles and the CVD growth of SWCNTs, especially the horizontally aligned
SWCNTs, catalyzed by these produced nanoparticles. Some new catalysts were also
developed. Among them, Cu is shown to be a superior catalyst for growing SWCNT arrays
on both silicon and quartz substrates and Pb was a unique catalyst from which one can
obtain SWCNTs without any metallic contaminant. SWCNTs prepared with both Cu and
Pb was very suitable for building high-performance nano-devices. These studies were also
very helpful in further understanding the growth mechanism of SWCNTs. The growth rate
of CNT is a function of catalyst particle size and the diffusion rate of carbon through the
catalyst. As the catalyst particle size increases, the growth rate will decrease. Meanwhile,
the growth rate of CNTs is directly proportional to the diffusion rate of carbon through the
catalyst (Kim, et al., 2003). Widely used catalyst materials in CNT synthesis is cobalt
(Couteau et al., 2003; Nagaraju, et al., 2002; Sinha et al., 2000), iron (Chen et al., 2003;
Rohmund et al., 2000), titanium (Chen, et al., 2003), nickel (Klinke et al., 2001; Zeng et al.,
2002) a couple of zeolites and combinations of these metals and/oxides (Mukhopadhyay et
al., 1999; Ning et al., 2002; Su et al., 2000; Wang et al., 2001). Another factor that may
influence the productivity of the catalyst material is the dispersion level of the catalyst
material. Large particles and aggregates instead of fine and well dispersed particles may be
inactive for nanotube growth (Kong, et al., 1998) and well-dispersed catalyst systems may
result to a narrower size distribution of the synthesized nanotubes (Hernadi et al., 1996).
Most commonly used, CNT precursors are methane, (Douven et al., 2012; Fan, Chapline, et
al., 1999; Kong, et al., 1998; Li et al., 1996) ethylene, (Satishkumar, et al., 1998),
acetylene, (Sen, et al., 1997) benzene, (Wei et al., 2002) xylene, (Endo, 1991) and carbon
monoxide, (Nikolaev, et al., 1999). (Endo et al., 1993; Endo, 1992) reported the CNT

63
growth from pyrolysis of benzene at 1100 oC, whereas (José‐Yacamán, et al., 1993) got
clear helical MWCNTs at the 700 oC from acetylene. The carrier gas also affects the growth
of CNTs. Carrier gas such as H2 and Ar effects the growth of CNTs. Hydrogen is the most
effective carrier gas as it provides a reducing atmosphere and scavenges oxygen. However,
excess hydrogen will push the reaction in the opposite direction which is not desirable.
Nitrogen has been found to be effective for the growth of bamboo type CNTs by delaying
the surface of passivation of the catalyst particle and enhance carbon diffusion through the
catalyst. Ammonia has been thought to provide large amounts of hydrogen that suppresses
the carbon supply and enhances the tube formation. The growth of CNTs is observed to be
strongly substrate dependent. The high surface roughness pores and defects of substrate
will promote the growth of nanotubes that have surface defects. The amount of substrate
crystallinity also affects the ability for CNTs growth and nucleation.
On the crystalline surface of substrate, the growth of SWCNTs seems to be favored, while
on amorphous and polycrystalline surface, the MWCNTs growth is preferred. The growth
mechanism of CNTs can be categorized into two modes that are the base growth mode and
the tip growth mode depending on the interaction of the catalyst particle with the substrate.
The rate of reactions is a strong function of temperature, thus it is expected that the
concentration of each species will vary with temperature. At a low temperature, a decrease
in the formation of CNTs formation has been observed, possibly due to the partial
deactivation of catalyst (Pérez-Cabero, et al., 2004). It is reported that lower synthesis
temperatures than optimum synthesis temperature result in lower CNTs yield in the product
(Sinha, et al., 2000). It is also reported that the reaction temperature plays an important role
in the alignment properties and diameter of the synthesized nanotubes (Singh et al., 2003).
Generally, the CNT growth temperature (or reaction temperature) used is between 550 o
C
64
and 1000 o
C, and reaction temperature may vary according to the catalyst support material
pair. Zhu et al., (2003) synthesized the CNT on graphite fibers by the thermal CVD. They
showed that the CNTs can only be grown in a limited temperature range. At low growth
temperatures, only a carbon layer is formed on the fiber surface. However, at high
temperatures, the diffusion rate of iron particles into carbon fibers was enhanced and the
nanotube growth possibility is reduced. Li et al., (2002) synthesized the CNTs with
nanocrystalline Ni/metallic oxide catalyst from decomposition of methane. When the
reaction temperature is higher than 1000 K, the CNTs can be obtained. At lower
temperatures, the formation of carbon fibers is observed. (Chiang and Sankaran, 2008)
reported that production of CNTs at below 400 o
C, no appreciable change was observed in
the particle size distribution for Ni particles, indicating that the temperature is too low for
nucleation and growth and also enhanced growth rates and lowering of activation energy
and growth temperature. The typical reaction time is approximately 60 minutes, but the
reaction time also depends on the desired CNTs amount. Furthermore, deviations of the
optimum reaction time for the specific synthesis suffer from the quality of the final product
(Nagaraju, et al., 2002). It is also noted that the yield is proportional to the time of reaction.
Han et al., (2002) studied the influence of flow rate of precursor and carrier gas, and it is
found that if the flow rate of carrier gas is increased, with the precursor flow rate remain
constant, the mean diameter of CNTs will decrease. If the flow rates of both carrier and
precursor gas are increased, the diameter essentially remains constant, but the growth rate
will increase. Abdullahi et al., (2012) reported that the decomposition of methane for
MWCNTs growth among other factors such as operating conditions is dependent on the
catalyst and the loading of the active specie for methane decomposition, catalyst
preparation and pre-treatment such as the calcination and reduction in hydrogen. A kinetic

65
model is developed for the decomposition of methane during growth of MWCNTs over 20
wt % nickel–alumina catalyst by CVD. The activation energy for methane decomposition
on Ni–Al2O3 catalyst was 37.1±3.5 kJ/mol was also observed.
In addition, (Kumar and Ando, 2010) reported that growth mechanism and mass production
of CNTs by CVD with the effect of material aspect such as roles of hydrocarbon, catalyst
and catalyst support. Besides, discussion has been made on the growth-control aspects such
as the effects of temperature vapor pressure and catalyst concentration in the CNT diameter
distribution and single- or multi-wall carbon nanotube. Recently, Danafar et al., (2009)
reported out of different techniques, catalytic CVD in a fluidized bed is the most promising
technique for large scale production of CNTs. Bulk production of CNTs depends on the
gas flow rate, hydrocarbon concentration, temperature, size and shape of the initial
agglomerate and catalyst loading and size. The gas flow rate affects the mass transfer
coefficient, the size and shape of the agglomerate influences the internal diffusion of gas
within the pore, the temperature, hydrocarbon concentration and catalyst loading
determines the reaction rate. The morphology of CNTs depends on the type and size of
catalyst and the carbon supply rate.
2.7 Heavy Metals
New era industries have immensely improved the living standard of human being. But
however, these modern industries also pose serious adverse impacts on our living
surrounding. One of the major environmental concerns is the water pollution by the heavy
metals. Heavy metals in water are the main preoccupation for many years because of the
toxicity towards aquatic-life, human beings and also the environment (Stafiej and
Pyrzynska, 2007). Even though trace amounts of heavy metals are vital for the human

66
body, they are considered as harmful when they become excessive. Contrasting with
organic pollutants, most of which are susceptible to biological degradation, heavy metal
ions do not end product that is harmless to the environment. The contamination of crucial
concern includes lead, cadmium, mercury, zinc, copper, chromium, silver, Stannum, and
other mutagenic nature which also makes up the earth‘s surface (Cho et al., 2009; Hyung
and Kim, 2008; Mubarak et al., 2013; Mubarak et al., 2014; Xu et al., 2008).
Contamination of heavy metals exists in aqueous wastes of various industries, such as
mining operations, tanneries, metal plating, alloy industries and smelting (Masciangioli and
Zhang, 2003). The process involves industries such as metal plating and battery
manufacturing can be counted as the primary source for cadmium pollution in water
(Wang, Gong, et al., 2007). The types of emerging pollutant are also increasing while the
traditional pollutants are not efficiently solved yet. Removal of toxic metals is one of the
biggest challenges in ensuring safe water for all as well as protecting the environment
(Bansal, 2005). It might cause several health problems such as nervous system damages,
renal kidney disease, mental retardation, cancer and anemia (Calderón, et al., 2001; Friberg,
1979; Li, Wang, et al., 2003; Li, Wang, et al., 2002; Vuković et al., 2010). As a result, the
standard B discharge limit of these metals under the Malaysian-Enrironmental Quality Act
1914 (Sewage and Industrial Effluents) 1979 are kept below 1.0 mg/L (MDC, 1997)' The
maximum limit under the standard is 0.02 mg/L for Cd- 0.50 mg/L for Pb (II) and 1"0
mgLeach for Zn, Ni, Cu and Cr (III). Despite their potential toxicity (Aziz et al., 2008)
various types of metal compounds end up in the rivers. Carbon nanotubes (CNTs) as a new
member in the adsorbent family, which was first reported in 1991 (Iijima, 1991), have been
proven for its high efficiency in the removal of heavy metal ions from aqueous solutions
due to its remarkable mechanical (Dai and Mau, 2001; Terrones, 2003), chemical properties

67
(Javey et al., 2003) and electrical (Collins et al., 1997); on the same note, CNTs have large
specific surface area, high thermal and chemical stabilities and provision for large scale
synthesis making a good candidate for adsorption kinetics (Li, Ding, et al., 2003; Li, 2004;
Mubarak, et al., 2013); besides, its light mass density (Chen et al., 2008) have made them
one of the successful adsorbents to be integrated with the removal of heavy metal ions from
aqueous solutions (Kabbashi, 2011; Li, Liu, et al., 2010; Mubarak, et al., 2013). Therefore,
CNTs are the most promising candidate for removal of heavy metal from waste,
particularly in water treatment and separation processes. Due to high surface area, it could
be potential to remove toxic metals for the production of high purity water (Colt, 2006).
2.7.1 Carbon nanotubes Adsorption
There are two main types of CNTs with high structural perfection; they are SWCNTs,
which consist of a single graphite sheet seamlessly wrapped into a cylindrical tube and
MWCNTs, which comprise an array of concentric cylinders (Odom, et al., 1998). They
have been treated as the most promising nanostructured materials and the prospect of
developing novel carbon-based nonmaterial has excited worldwide interest among
researchers (Luo et al., 2000). The CNTs have the large adsorption capacity, which is
mainly attributable to their pore structure, surface area and the existence of a wide spectrum
of surface functional groups. The mechanisms by which the metal ions are sorbed onto
CNTs are very complicated and appear attributable to electrostatic attraction, sorption-
precipitation and chemical interaction between the metal ions and the surface functional
groups of CNTs (Rao, et al., 2007). Consequently, CNTs serve an important role in the
removal of some organic salts, toxic dyes and heavy metals from water.

68
Human activities affect the natural geological and biological redistribution of heavy metals
through pollution of the air, water and soil. The primary anthropogenic sources of heavy
metals are point sources such as mines, foundries, smelters and coal-burning power plants,
as well as diffuse sources such as combustion by-products and vehicle emissions. Heavy
metal removal is one of the most essential processes in wastewater treatment. The CNTs
adsorption is one of the well known methods in removing heavy metals or other traces in
waste water. The adsorption capacity is an aspect to be highlighted where the
successfulness of heavy metal removal is based on the maximum amount of the traces that
can be attracted to and held on to the surface of the CNTs. Many researchers have studied
and explained about the adsorption capacity of the CNTs in their studies which will be
discussed further.
2.7.2 Heavy metals removal using CNTs
Zinc is one of the famous heavy metals occurring in waste water. In water, Zn ion may
associate or react with neutral or ionic compounds to form inorganic salts, stable organic
complexes or inorganic or organic colloids. The quantity of Zn ion available in water from
each of these forms is dependent upon the solubility of these forms, the pH and
temperature, the total amount of the Zn form present in water and the presence of other
metal ions, organic compounds and inorganic compounds. Zn ion exhibits high toxicity to
aquatic organisms and it may cause high chronic toxicity in some cases. For example, the
aquatic toxicity is evidence indicating that the Zn ion is highly toxic to aquatic organisms
and has a high potential to bioaccumulate. Therefore, it is important to remove Zn from
waste water during the treatment. Lu and Chiu, (2006b) in their study explained on the
trend of the graph obtained from the adsorption capacity of Zn2+
onto the CNTs, where

69
adsorption increases when the pH is adjusted from 1-8, achieving maximum between pH 8-
11 and decreased at pH 12. The time taken for the adsorption to reach the equilibrium for
the SWCNTs and MWCNTs are 60 min while for the powdered activated carbon (PAC) it
took 120 min. A comparison on the adsorption of Zn2+
between the CNTs and commercial
PAC was also carried out. With the initial Zn2+
concentration range of 10 to 80 mg l−1
, the
maximum adsorption capacities of Zn2+
calculated by the Langmuir model for the
SWCNTs, MWCNTs and PAC were 43.66, 32.68 and 13.04 mg g−1
respectively. The time
taken to reach equilibrium was short and they suggested that in order to obtain high
adsorption capacity, the SWCNTs and MWCNTs are used in the applications for the Zn2+
removal from water. In another case study, Lu et al., (2006b) reported that the amount of
Zn2+
sorbed onto the CNTs increased with a rise in temperature. Using the same conditions,
the Zn2+
sorption capacity of the CNTs was much greater than that of the commercially
available PAC, reflecting that the SWCNTs and MWCNTs are effective sorbents. The
thermodynamic analysis revealed that the sorption of Zn2+
onto the CNTs is endothermic
and spontaneous. The Zn2+
ions could be easily removed from the surface site of the
SWCNTs and MWCNTs by a 0.1 mol/L nitric acid solution and the sorption capacity was
maintained after 10 cycles of the sorption/desorption process. This suggests that both the
CNTs can be reused through many cycles of water treatment and regeneration. Recently,
Mubarak et al., (2013) reported that the removal of Zn2+
using functionalized CNTs and
magnetic biohcar. Statistical analysis revealed that the optimum conditions for the highest
removal of Zn2+
are at pH 10, dosage 0.09 g, agitation speed and time of 120 rpm and 120
min respectively. The removal efficiency of Zn2+
for an initial concentration of 1.1 mg/L
using functionalized CNT was 99% and using magnetic biochar was 75%.

70
Not only the Zn ion could be removed by the CNTS adsorption, other studies show that
some other trace elements such as Ni, Pb, Cd, chromium (Cr) and Cu can also be absorbed
by this powerful agent, the CNTs. Yang et al., (2009) in their study of adsorption of Ni2+
on
oxidized MWCNTs found that adsorption capacity increases with the increase of pH in the
pH range of 2 to 9 from zero to ~99%. They found that oxidized MWCNTs were the most
suitable material for the solidification and pre-concentration of Ni2+
from aqueous
solutions. In another article, Kandah and Meunier, (2007) reported on their achievement in
adsorption of some heavy metals using functionalized CNTs. With a large adsorption
capacity, they also reported on the ability of the CNTs to remove some organic dyes from
water. In their study, for both produced and oxidized CNTs, the Langmuir model
determined 18.083 and 49.261 mg/g, respectively, as the maximum Ni2+
adsorption uptake.
These two sets of isotherm models suit well with the experimental data. Therefore, it
concluded that the experiment was successful where the CNTs were found to be the most
effective nickel ion absorbent based on higher adsorption capacity as well as the adsorption
time taken which was set to be at an equilibrium state (Kandah and Meunier, 2007).
Chromium at low-level exposure can irritate the skin and cause ulceration. Long-term
exposure can cause kidney and liver damages as well as damaging the circulatory and nerve
tissues. Once again, it is important to eliminate such traces in our waste water by the aid of
the CNTs. Atieh, (2011a) has reported using carbon nanotubes supported by AC to remove
Cr6+
ions from polluted water. The highest adsorption capacity by using an AC coated with
carbon nanotubes adsorbent obtained from the batch adsorption experiment was 9.0 mg/g.
Therefore, it can be concluded that the AC coated with carbon nanotubes is most effective
for the removal of chromium ions. Di et al., (2006) reported that removal of Cr6+
from
drinking water using ceria nanoparticles supported on aligned carbon nanotubes

71
(CeO2/ACNTs). The largest adsorption capacity of CeO2/ACNTs reaches 30.2 mg g-1
at an
equilibrium Cr6+
concentration of 35.3 mg l-1
at pH 7. They also concluded that the
adsorption capacity of the CeO2/ACNTs is 1.5 times higher than that of the AC, 2 times
higher than that of Al2O3 and 1.8 times higher than that of ball-milled ACNTs. The high
adsorption capacity, wider range of pH values makes CeO2/ACNTs a good candidate
material for removal of Cr6+
from drinking water. Hu et al., (2009) reported that the
removal of Cr6+
from aqueous solution using oxidized MWCNTs. The maximum removal
of Cr6+
was found at low pH, and the adsorption kinetics of Cr6+
were suitable for pseudo-
second order models. The removal of chromium mainly depends on the occurrence of redox
reaction of adsorbed Cr6+
on the surface of oxidized MWCNTs to the formation of Cr3+
and
subsequent the sorption of Cr3+
on MWCNTs appears as the leading mechanism for
chromium uptake to MWCNTs. To remove the anionic chromate (CrO42-
) from waste
water, functionalized CNTs were found to be the most suitable compared to unmodified
CNTs in terms of the adsorption capacity, Xu et al., (2011). The authors explained on the
reason of the CNTs showing an excellent adsorption capability of anionic chromate, which
was because of the interaction of CrO42-
with the surface oxygen-containing functional
groups on the modified CNTs. Hence, functionalized CNTs once again can be potentially
employed in adsorbing heavy metal from waste water.
Lu and Su, (2007) reported that MWCNTs were thermally treated to remove natural
organic matter (NOM) in aqueous solution. The amount of adsorbed NOM onto CNTs
increased with a rise in initial NOM concentration and solution ionic strength, but
decreased with a rise in solution pH. Also concluded that the performance of adsorption
using raw CNTs and Treated CNTs and granular activated carbon (GAC). The result
proved that treated CNTs have best NOM adsorption performance compared to others.

72
Besides Zn and Cr, Pb is also one of the famous heavy metals occurring in waste water. Pb
compounds are generally soluble in soft and slightly acidic water. Pb waterworks were
often applied in past days and these may still be present in old buildings. The Pb from pipes
may partially dissolve in the water flowing through. It occurs in almost all water resources
as well as waste water. Despite its toxicity, the presence of lead in the water may affect the
human and marine lives‘ health. Therefore, again, the discussion on the CNTs to absorb
the lead from waste water is still going on. Wang et al., (2007) reported that, the role of
functional groups in the adsorption of Pb2+
to create a chemical complex adsorption. It is
reported that 75.3% of Pb2+
adsorption capacity was achieved. The Pb2+
is in the form of
PbO, Pb (OH)2, and the PbCO3 is adsorbed on the surface of the acidified MWCNTs which
is only 3.4% of the total Pb2+
adsorption capacity. They concluded that the Pb2+
species
adsorbed acidified MWCNTs on the ends and at the defect sites. Wang et al., (2007)
reported that men oxide-coated carbon nanotubes (MnO2/CNTs) was used to remove Pb2+
from aqueous solution. The Pb2+
removal capacity of MnO2/CNTs decreased with the
decrease of pH. From the Langmuir isotherms, maximum adsorption capacity was 78.74
mg/g, comparing with CNTs, significant improvement of Pb2+
adsorption shows
MnO2/CNTs can be good Pb 2+
absorbers. The adsorption of Pb 2+
by MnO2/CNTs occurred
first 15 min of contact time, and equilibrium reach at 2hr, also kinetics adsorption described
was pseudo-second-order rate equation. Wang et al., (2007) in the study on the adsorption
of acidified MWCNTs to Pb2+
found that the experiment met the Langmuir model. The
results demonstrate a high adsorption capacity of acidified MWCNTs for Pb2+
. The reason
stated was due to the formation of oxygenous functional groups on the surface of the CNTs.
Salt formation or complex deposited occurred on the surface of CNTs when acidified
MWCNTs react with Pb 2+
. The adsorption contact time to reach equilibrium is about 20

73
minutes, which proven be shorter than AC (reported to be 120 minutes). Besides the
discussion at an adsorption contact time, the authors also stated that Pb2+
can be easily
regenerated from the acidified MWCNTs by adjusting the solution to pH 2. In another
study, Kabbashi et al., (2009) discussed on the removal of Pb2+
which has reached the
maximum value 85% or 83% at pH 5 or 40 mg/L of the CNTs, respectively. Higher
correlation coefficients from the Langmuir isotherm model indicates the strong adsorptions
of Pb2+
on the surface of CNTs (adsorption capacity Xm = 102.04 mg/g). The results
indicate that the highest percentage removal of Pb2+
(96.03%) can be achieved at pH 5, 40
mg/L of CNTs, contact time 80 minutes and agitation speed 50 r/min.
The effectiveness of an adsorbent depends on the adsorptive properties of their surface.
Adsorption takes place when a solid surface is in contact with a solution and tends to
accumulate a surface layer of solute molecules created by the imbalanced surface forces.
Moradi et al., (2011) explained on the interaction between some heavy metal ions such as
Pb2+
, Cd2+
and Cu2+
ions from aqueous solution adsorbed by single walled carbon nanotube
(SWCNTs) and the carboxylate group functionalized single walled carbon nanotube
(SWCNT-COOH) surfaces. The maximum adsorption capacities (qm) for Pb2+
, Cu2+
and
Cd 2+
ions onto the SWCNT-COOH obtained are 96.02, 77.00 and 55.89 mg/g,
respectively, and by the SWCNTs are 33.55, 24.29 and 24.07 mg/g, respectively. The
thermodynamic parameter values showed that the adsorption of ions on the SWCNT-
COOH and SWCNTs at 283 to 313 K is spontaneous and endothermic
One of the most hazardous heavy metals is cadmium (Cd). Cd, when in humans, long-term
exposure to it is associated with renal dysfunction. Therefore, it is essential to remove Cd
during the wastewater treatment in order to save our lives and the nature. Li et al., (2003)
in their article discussed on the adsorption of Cd2+
by the CNTs. The adsorption capacity is

74
highly dependent on the pH where H2O2 oxidizes the CNTs to reach an equilibrium state
with a high adsorption capacity at lower pH and it is more obvious compared to the HNO3
and KMnO4 oxidized CNTs. The experiments of the CNT dosage effect on the Cd2+
adsorption reflect that the adsorption capacity for KMnO4 oxidized CNTs has a sharper
increase in the CNT dosage from 0.03 to 0.08 g per 100 ml than the as-grown, H2O2 and
HNO3 oxidized CNTs and its removal efficiency almost reaches 100% at the CNT dosage
of 0.08 g per 100 ml. This shows that the CNTs again managed to adsorb Cd2+
with high
adsorption capacity.
In order to prove the efficiency of CNTs in adsorbing heavy metals Gao et al., (2009)
studied on the adsorption of Ni, Cu, Zn and Cd from aqueous solutions on CNTs oxidized
with concentrated nitric acid, which was carried out in single, binary, ternary and
quaternary systems of the complexity of adsorption of metal from multi-component
solution on the CNTs oxidized. They studied with the effect of process parameters such as
the pH value, initial concentration of ions, the surface chemistry of the adsorbent, the kind
and number of components in the adsorption system and the ratio of the metal ion species
in solution. For the single and binary systems, it was revealed that the amount adsorbed on
the CNTs oxidized followed the order of Cu2+
(aq) >Ni2+
(aq) > Cd2+
(aq) > Zn2+
(aq). A
good correlation between the amount adsorbed and standard electrode potential was
discovered indicating that the redox process may serve a role in the mechanism of
adsorption. Meanwhile, for the ternary and quaternary systems, the adsorption was more
complex. The order of amount adsorbed at the same concentration was Cu2+
(aq) > Cd2+
(aq) > Zn2+
(aq) >Ni2+
(aq). Stafiej and pyrzynska (2007) reported that adsorption
characteristics of some divalent metal ions (Cu, Co, Cd, Zn, Mn, Pb). The effect of metal
ions removal at pH9 was Cu2+
> Pb2+
> Co2+
> Zn2+
> Mn2+
. Li et al., (2004) reported that
75
different heavy metals (Pb2+
, Cu2+
and Cd2+
) adsorption using oxidized CNTs. The
maximum adsorption capacities of Pb2+
, Cu2+
, and Cd2+
ions by oxidized CNTs calculated
from Langmuir isotherm were 63.29, 23.89 and11.01 mg/g respectively in the following
order Pb2+
>Cu2+
>Cd2+
. Their kinetic models of first, pseudo second and second order rate
model fit the experimental data better than the two others. For initial metal concentration 30
mg/l the adsorption rate of Pb2+
,Cu2+
and Cd2+
are 0.033,0.049 and 0.096 mg/g.min
respectivey, in the order of Cd2+
>Cu2+
>Pb2+
. Rao et al., (2007) reported that, the sorption
capacities of metal ions to different CNTs follow roughly the order: Pb2+
>Ni2+
>Zn2+
>Cu2+
>Cd2+
. The sorption capacities of metal ions by raw CNTs are very low, but
significant, increase after oxidizing by HNO3, NaOCl, and KMnO4 solutions such surface
oxidized CNTs show great potential as superior sorbents for environmental protection
applications. The sorption mechanism appears mainly attributable to chemical interaction
between the metal ions and the surface functional groups. The order of heavy metal ions
removed from aqueous solutions by CNTs mentioned above shows that their adsorption
does not depend clearly on the ionic radius of metal ions, but depend on properties of CNTs
such as ionic strength, pH, foreign ions, CNT mass, contact time, initial metal ion
concentration, and temperature. However, synthesis conditions have major influences on
the nature of the CNTs product formed. Reaction conditions, including temperature, gas
composition, and the nature and composition of metallic catalysts leading to the CNTs
formation which in turn affects the properties of the final product still need to be explored
in order to understand these influences.
Copper is an essential substance to human life, but in high doses, it can cause anemia, liver
and kidney damages as well as stomach and intestinal irritation. This is the reason why
copper becomes an unwanted material in wastewater. Li et al., (2010) reported that the

76
environmentally friendly adsorbent, the CNTs immobilized by calcium alginate (CNTs/CA)
was prepared to adsorb copper. Its copper adsorption properties were investigated via
equilibrium studies. Experimental results showed that copper removal efficiency of the
CNTs/CA is high and reaches 69.9%, even at a lower pH of 2.1. The copper adsorption
capacity of the CNTs/CA can attain 67.9 mg/g at the copper equilibrium concentration of 5
mg/L. In other cases, Li et al., (2001) reported that the adsorption isotherms were the best
fluoride adsorption of Al2O3/CNTs. It occurs at a pH range of 5 to 9 with the adsorption
capacity for Al2O3/CNTs of about 13.5 times higher than that of the AC-300 carbon and 4
times higher than that of the c-Al2O3 at an equilibrium fluoride concentration of 12 mg/l.
The broad range of the pH values and high adsorption capacity of the Al2O3/CNTs indicates
its suitability to be applied in fluoride removal from water.
Similar work has been reported by Ruparelia et al. (2008) to remove heavy metals such as
the cadmium, lead, nickel and zinc studied on carbon nanomaterials (CNMs), the
adsorption capacity of nanocarbon (NC), nanoporous carbon (NPC) and activation were
tested. Nanoporous carbon was the best among other adsorbents due to its ion exchange
with acidic, oxygen containing functional groups introduced by activation during the post
treatment process as well as due to its unique nanoporous structure. They concluded that
nanoporous carbon has a good potential in water treatment applications.
Many CNT applications require handling in solution-phase; however, CNTs have proven
difficult to disperse in solvents (Ausman et al., 2000). Chemical modification of SWCNTs
is often required for more versatile suspension capabilities and enablement of certain
applications. This has encouraged greater exploitation of their intrinsic properties, as well
as the capability to modify these properties. In particular, the functionalization of CNTs is
required for their aqueous suspension and to allow for molecular interactions with

77
biological systems. Non-modified CNTs was surfactants that have been found to associate
with CNTs via van der Waals interactions through their hydrophobic chains, rendering
CNTs hydrophilic and able to disperse in aqueous environments. SWCNTs can be isolated
from aggregated bundles (Strano et al., 2003), allowing for spectroscopic probing of
individual SWCNTs. Surfactants have been used to prevent nonspecific interactions
between SWCNTs and protein surfactants with modified head groups have also been used
to link SWCNTs to specific molecules (Chen et al., 2001). Kim et al., (2005b) reported that
lipids comprise a class of molecules that interact with CNTs similarly to surfactants. This
class of molecule offers control of its interactions with CNTs through modification of their
hydrophobic chains, while also providing versatility of the functionality that they impart
through the modification of their head groups. Among these, chemical interaction between
the heavy metal ions and the surface functional groups of CNTs is the major adsorption
mechanism. Table 2.3 and 2.4 illustrates the brief summary of the removal of heavy metals
using non-modified and functionalized CNTs.

78
Table 2.3: Brief summary of removal of heavy metal using non-modified CNTs.
Adsorbate &
Adsorbent
CNTs
Initial
Concentration
(mg/L)
Optimised
condition
Adsorption
Capacity
(mg/g)
Surface
Area
(m2/g)
Reference
Pb2+
MWCNTs
10-80 pH5,
CNTs dosage
0.05 g,
Temperature
280-321k
1 134 Li et al.,
(2002)
Pb2+
MWCNTs
AC
10-60 pH5,
Temperature
298 to 323K
CNTs
dosage1g,
Equilibrium
time 20 to120
4
18
162.16
1124.58
(Wang, Zhou,
Peng, Yu, &
Chen, 2007)
Zn2+
SWCNTs
MWCNTs
PAC
10-80 pH (8-11)
Contact time
60 min
43.66
32.68
13.04
423
297
852
(Long and
Yang, 2001)
Ni2+
As-produced
CNTs
10-200 pH(2-8)
Adsorption
time,20-50
min
CNTs dosage
20 mg
18.083 134
(Kandah and
Meunier, 2007)
Ni2+
Sr2+
MWCNTs
/iron oxides
6 pH6.5,
CNTs dosage
2g,
Temperature
298K
9.18
NA
88.53
NA
(Chen et al.,
2009)
Pb2+
,Cu2+
Cd2+
CNTs
5-60 pH5,
CNTs dosage
0.05g,
Temperature
298K
62.50
27.03
9.30
98.69 (Hsieh et al.,
2006)

79
Cd 2+
As grown
CNTs
1.1-9.50
pH (2-12),
CNTs ( 0.05-
0.20 g),
Contact time 4
hour
1.1 to 3.5 122
(Li, Wang, et
al., 2003)
Cr 6+
Normal AC
AC coated
with CNTs
0.5
pH(2-4),
Contact time
60 min,
Agitation
speed 100-200
rpm
8.25
9.0
123
755.8
(Di, et al.,
2006)
Cu2+
As-produced
CNTs
43.1 pH (2-9),
Ionic strength-
0.01M,
Temperature
280-320K,
CNT dosage
0.5g/l.
8.25
82.2
(Wu, 2007)
Table 2.4: Brief summary of removal of heavy metals using functionalized CNTs.
Adsorbate
&Adsorbent
CNTs
Initial
Concentration
(mg/L)
Optimised
condition
Adsorption
Capacity
(mg/g)
Surface
Area
(m2/g)
Reference
Pb2+
Oxidized
MWCNTs
10-60 pH5,
Temperature
298 -323K,
CNTs dosage
1g
59 237.33 (Wang, Zhou,
Peng, Yu, &
Chen, 2007)
Pb2+
Oxidized
MWCNTs
Pristine
Annealed
10-100 Temperature
298K
Oxidation 1 to
6 hr
CNTs dosage
0.025
91
7.2
21
195.49
162.1
253.8
Wang et al.,
(2007)
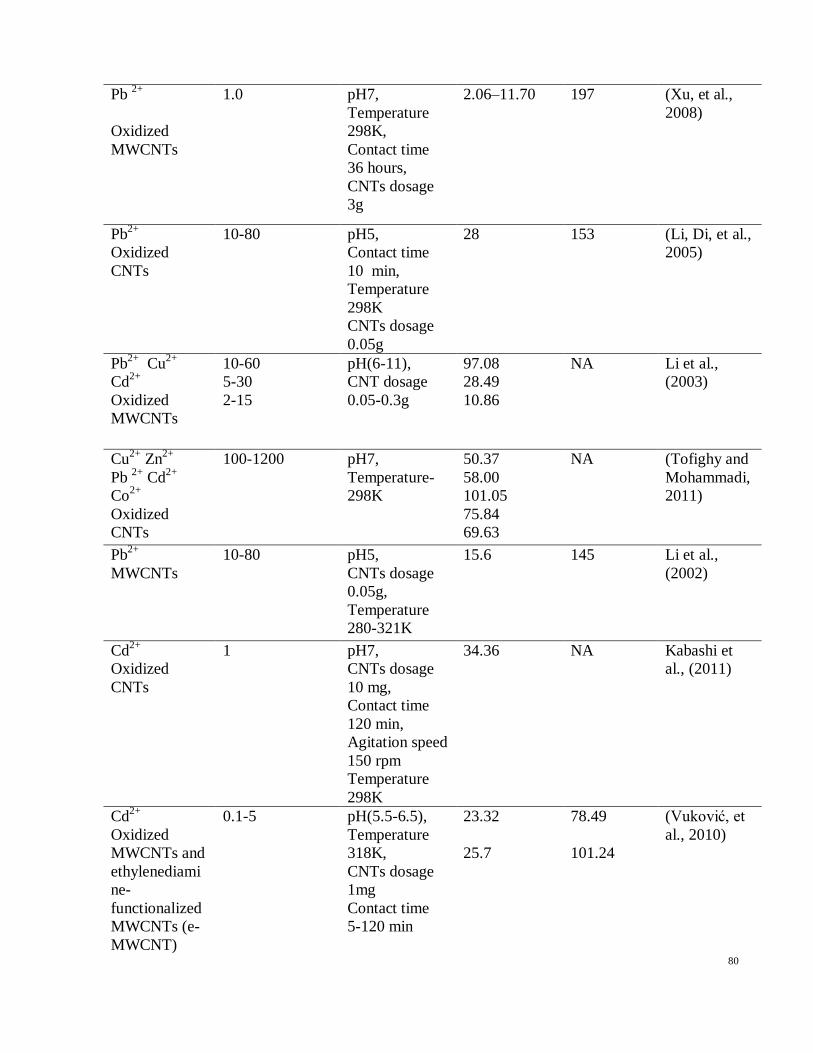
80
Pb 2+
Oxidized
MWCNTs
1.0 pH7,
Temperature
298K,
Contact time
36 hours,
CNTs dosage
3g
2.06–11.70 197 (Xu, et al.,
2008)
Pb2+
Oxidized
CNTs
10-80 pH5,
Contact time
10 min,
Temperature
298K
CNTs dosage
0.05g
28 153
(Li, Di, et al.,
2005)
Pb2+
Cu2+
Cd2+
Oxidized
MWCNTs
10-60
5-30
2-15
pH(6-11),
CNT dosage
0.05-0.3g
97.08
28.49
10.86
NA Li et al.,
(2003)
Cu2+
Zn2+
Pb 2+
Cd2+
Co2+
Oxidized
CNTs
100-1200 pH7,
Temperature-
298K
50.37
58.00
101.05
75.84
69.63
NA (Tofighy and
Mohammadi,
2011)
Pb2+
MWCNTs
10-80 pH5,
CNTs dosage
0.05g,
Temperature
280-321K
15.6 145 Li et al.,
(2002)
Cd2+
Oxidized
CNTs
1 pH7,
CNTs dosage
10 mg,
Contact time
120 min,
Agitation speed
150 rpm
Temperature
298K
34.36 NA Kabashi et
al., (2011)
Cd2+
Oxidized
MWCNTs and
ethylenediami
ne-
functionalized
MWCNTs (e-
MWCNT)
0.1-5 pH(5.5-6.5),
Temperature
318K,
CNTs dosage
1mg
Contact time
5-120 min
23.32
25.7
78.49
101.24
(Vuković, et
al., 2010)
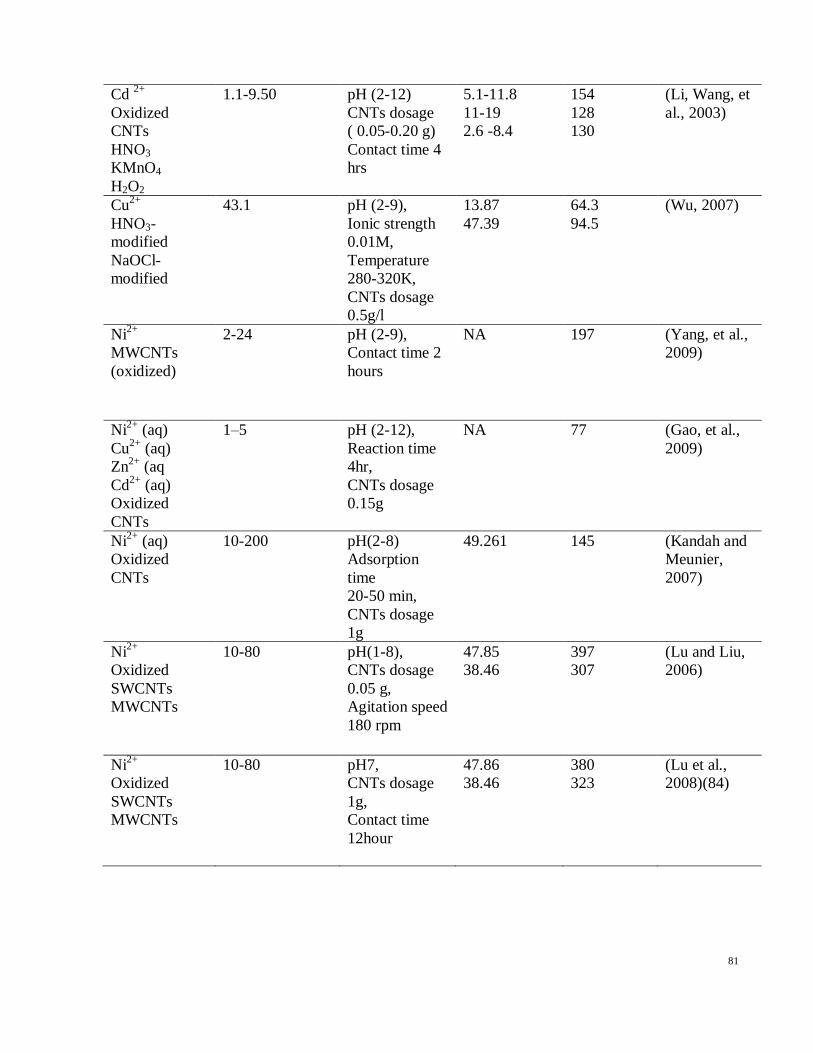
81
Cd 2+
Oxidized
CNTs
HNO3
KMnO4
H2O2
1.1-9.50 pH (2-12)
CNTs dosage
( 0.05-0.20 g)
Contact time 4
hrs
5.1-11.8
11-19
2.6 -8.4
154
128
130
(Li, Wang, et
al., 2003)
Cu2+
HNO3-
modified
NaOCl-
modified
43.1 pH (2-9),
Ionic strength
0.01M,
Temperature
280-320K,
CNTs dosage
0.5g/l
13.87
47.39
64.3
94.5
(Wu, 2007)
Ni2+
MWCNTs
(oxidized)
2-24 pH (2-9),
Contact time 2
hours
NA 197 (Yang, et al.,
2009)
Ni2+
(aq)
Cu2+
(aq)
Zn2+
(aq
Cd2+
(aq)
Oxidized
CNTs
1–5 pH (2-12),
Reaction time
4hr,
CNTs dosage
0.15g
NA 77 (Gao, et al.,
2009)
Ni2+
(aq)
Oxidized
CNTs
10-200 pH(2-8)
Adsorption
time
20-50 min,
CNTs dosage
1g
49.261
145 (Kandah and
Meunier,
2007)
Ni2+
Oxidized
SWCNTs
MWCNTs
10-80 pH(1-8),
CNTs dosage
0.05 g,
Agitation speed
180 rpm
47.85
38.46
397
307
(Lu and Liu,
2006)
Ni2+
Oxidized
SWCNTs
MWCNTs
10-80 pH7,
CNTs dosage
1g,
Contact time
12hour
47.86
38.46
380
323
(Lu et al.,
2008)(84)

82
Ni2+
Oxidized
CNTs
10-200 pH(2-8)
Adsorption
time 20-50 min
CNTs dosage
20 mg
49.261
145
(Kandah and
Meunier,
2007)
.

83
3 CHAPTER III
Experimental Methodology
3.1 Intoduction
This chapter is divided into two parts: experimental materials and experimental methods for
production of CNTs and characterization of the produced CNTs. Details of materials,
equipments and experimental procedures used are further discussed in this section.
3.2 Materials
There are three types of gases used in the production of CNTs namely, H2 (99.99% purity),
C2H2 (99.9%) and Ar (99%). All are analytical grade supplied by MOX Sdn. Bhd.
3.3 Catalyst
Ferrocene catalyst for analytical grade was purchased from Merck and used as received
3.4 Methods
Fig. 3.1 shows the flow chart of the overall experiment conducted throughout the research.

84
Figure 3.1: Flow chart of the overall experiment.
3.5 Production of CNTs using MA-CVD
Fig. 3.2 shows schematic of horizontal tubular microwave model Synotherm-T1500,
(China) reactor for the production of CNTs. It comprised a quartz tube of 55 mm OD, 50
mm ID and 615 mm length. Ferrocene catalyst was placed at the entrance of the chamber

85
and quartz boat size was placed at the middle of the reaction chamber. The system was
initially flushed with Ar in order to ensure an oxygen free environment. The gas flow rate
of C2H2 and H2 was free mixed before entering into the tubular microwave chamber using
gas mixer Model KM-20-2, (Germany). The reaction was carried on for the desired time
period and on completion, the total amount of CNTs produced in the quartz boats was
collected and weighed.
Figure 3.2: Schematic of MA-CVD for CNT production.
3.6 Design of experiment for CNTs production
Response surface methodology is a well know approach to optimizing the effects of
multiple variables on the properties of prepared products using a combination of
mathematical and statistical techniques (Amirhasan et al., 2007; Veziri et al., 2008). The

86
CNTs production parameters were studied using the standard response surface
methodology with a central composite design (CCD). This method was chosen for fitting a
quadratic surface with a minimum number of experiments. It also helps analyze the
interaction between the effective process parameters and identify the factor settings that
optimize response (Amirhasan, et al., 2007). Table 3.1 shows the ranges and levels of the
dependent variables in this study, microwave power (A), radiation time (B) and gas ratio of
C2H2/H2 (C). The lower and upper values of each parameter (microwave power, radiation
time and gas flow rates of C2H2/ H2) were chosen based on previous study on the
production of CNTs (Fonseca et al., 1998; Lacerda, Teo, et al., 2004; Mubarak, et al., 2011;
Satishkumar, et al., 1998; Willems, et al., 2000). Acetylene flow rate was fixed at 40
ml/min and H2 flow rate was being varied and catalyst was fixed to 0.2 g (Couteau, et al.,
2003; Delzeit et al., 2002; Pérez-Cabero, et al., 2004). The CCD for three factors, two
replicate, and two center points per block were selected for CNTs production because there
were three parameters to be optimized. The total number of experimental runs for the
production of CNT samples determined by the statistical software through the design of the
experiment (DOE) were 24. The responses for each run based on the weight of CNTs
(grams) were further statistically analyzed by the software for the determination of the
optimum preparation conditions. Hence, this design was selected to reduce the number of
experiments.

87
Table 3.1: A lower and upper limits for CCD experiments design for CNTs production
Factor Name Units Low High
A Microwave Power W 600 1200
B Radiation time min 10 60
C Gas Ratio (C2H2/H2) - 0.2 1
3.7 Preparation of stock solution
Analytical grade Pb (II), Cd (II), Cu (II) and Zn (II) standard solution which was obtained
from Merck was used to prepare stock solutions containing 1000 mg/L of Pb (II), Cd (II),
Cu (II) and Zn (II) metal ions which were further diluted with distilled water to obtain the
required concentrations. As for this research, the initial concentration of Pb (II), Cd (II), Cu
(II) and Zn (II) metal ions was set to 10 mg/L and the prepared solution were used for batch
adsorption experiments.
3.7.1 Optimization of removal of heavy metals
A batch adsorption experiment was performed by using conical flask of 250 ml of 10.0
mg/L of Pb (II) Cd (II) Cu (II) and Zn (II) agitated with varying dosages of CNTs and other
variable parameters according to the design obtained from the Design of Expert (DOE).
The lower and upper values of each parameter (pH, CNTs dosage, agitation speed and time)
were chosen based on previous study on the removal of Pb (II), Cd (II), Cu (II) and Zn (II)
(Azouaou, et al., 2010; Biškup and Subotić, 5; Li, Luan, et al., 2003a, 2003b; Li, Wang,
et al., 2002; Li, et al., 2010; Li, 2004; Lu, et al., 2006b; Machida et al., 2004; Meena et al.,
2008; Mubarak, et al., 2013; Tofighy and Mohammadi, 2011; Ye and Yu, 2010). The
parameters used for this research is as shown in Table 3.2, 3.3. 3.4 and 3.5 for Pb (II), Cd
(II), Cu (II) and Zn (II) respectively. Statistical optimization of process parameters, pH,

88
CNTs dosage, agitation speed and time using CCD with two centre points and one replicate
was selected for the optimization process for removal of Pb (II), Cd (II), Cu (II) and Zn (II)
from aqueous solution. The total number of experimental runs for the each heavy metal
removal samples determined by the statistical software through the design of the
experiment was 26 runs. The initial pH of the stock solution was adjusted by using 1 M of
NaOH by adding in a few drops of the alkaline solution in the 250 ml of 10 mg/L of Pb (II),
Cd (II), Cu (II) and Zn (II) until the desired pH was obtained. The CNTs were then added
into the 250 ml of 10 mg/L of Pb (II), Cd (II), Cu (II) and Zn (II) solutions and it was
agitated according to the parameters displayed in Table 3.2, 3.3, 3.4 and 3.5. At the end of
each interval of the time, the suspensions were shaken and centrifuged at 4000 rpm for 10
min and the supernatant was withdrawn and filtered by using the ADVANTEC qualitative
filter paper no. 161 having a pore size of 3 µm. The filtrates were analyzed for
contaminants by inductively coupled plasma optical emission spectrometry (ICP-OES)
(Perkin Elmer 7000 DV) using a Perkin-Elmer multimetal standard solutions. The
experimental errors of ICP-OES were within the range of ±2.461% to ±2.983%. The Zn (II)
residual concentrations were measured from the standard calibration curve. All the data
presented are the average of three replicates. Differences between the initial and the
equilibrium metal ion concentrations determine the amount of metal ions being absorbed.
The adsorption capacity of CNTs at a specific time, t as for the adsorption kinetic study
were calculated by using equation (3.1) while the adsorption equilibrium for Pb (II), Cd
(II), Cu (II) and Zn (II) was determined by equation (3.2).
qt (mg/g) = [(Co – Ct)V] / m (3.1)
qe (mg/g) = [(Co – Ce)V] / m (3.2)

89
where Co represent the initial concentration of Pb (II), Cd (II), Cu (II) and Zn (II) solution
(mg/L), qt represents the concentration of Pb (II), Cd (II) , Cu (II) and Zn (II) at time t
(mg/g), Ce represents the equilibrium concentration of Pb (II),Cd (II), Cu (II) and Zn (II)
(mg/L) respectively, V represents the volume of Pb (II) Cd (II) , Cu (II) and Zn (II) stock
solution (L) and m indicates the weight of the adsorbent used (g).
Table 3.2: Experimental design for batch adsorption of Pb (II) removal using CCD.
Factor Name Units Low high Low
coded
High
coded
A pH 4 6 -1 1
B Agitation
Speed
rpm 120 200 -1 1
C MWCNTs
dosage
g 0.05 0.15 -1 1
D Contact
Time
min 5 40 -1 1
Table 3.3: Experimental design for batch adsorption of Cd (II) removal using CCD
Factor Name Units Low high Low
coded
High
coded
A pH 4 6
-1 1
B Agitation
Speed
rpm 120 200 -1
1
C MWCNTs
dosage
g 0.05 0.15 -1
1
D Contact
Time
min 20 80 -1
1

90
Table 3.4: Experimental design for batch adsorption of Cu (II) removal using CCD.
Factor Name Units Low high Low
coded
High
coded
A pH 2 8 -1 1
B Agitation
Speed
rpm 120 200 -1 1
C MWCNTs
dosage
g 0.05 0.15 -1 1
D Contact
Time
min 10 60 -1 1
Table 3-5: Experimental design for batch adsorption of Zn (II) removal using CCD.
Factor Name Units Low high Low
coded
High
coded
A pH 8 12 -1 1
B Agitation
Speed
rpm 120 200 -1 1
C MWCNTs
dosage
g 0.05 0.15 -1 1
D Contact
Time
min 10 110 -1 1
3.7.2 Adsorption iostherms study
Adsorption equilibrium capacities of heavy metals on CNTs at various equilibrium heavy
metals concentrations were studied in the best fit adsorption isotherm model. To understand
the interaction between the metal ion and the adsorbent, a number of models such as
Langmuir, Freundlich, Temkin and Dubinin –Radushevich isotherm models were applied
to analyze the experimental data. In order to study the adsorption process shake flask
experiments were carried out for 2 h at room temperature, as obtained in the optimization
process. The adsorption study was performed using various Pb (II), Cd (II), Cu (II) and Zn

91
(II) concentrations from 10 to 80 mg/L were employed to perform adsorption equilibrium
isotherm experiments. The adsorption runs were conducted at conditions of pH 5, pH5, pH
5.5 and pH 10 and CNTs dosage of 0.1, 0.1, 0.1 and 0.05g for Pb (II) Cd (II), Cu (II) and
Zn (II) respectively. On the other hand, agitation speed of 160 rpm for Pb (II), Cd (II) and
Cu (II), while, 120 rpm for Zn (II). The sample was collected at various time intervals (5 to
120 min) the equilibrium concentration was achieved before 1 hour and conformed after 2
h. At the end of each interval of the time, the solution was filtered by using filter paper.
The final Pb (II), Cd (II), Cu (II) and Zn (II) concentration was determined by inductively
coupled plasma optical emission spectrometry (ICP-OES) (Perkin Elmer). Differences
between the initial and the equilibrium metal ion concentrations determine the amount of
metal ions being adsorbed. The adsorption capacity of CNTs at a specific time, t as for the
adsorption kinetic study was calculated by using Equation (3.1 and 3.2)
The Langmuir isotherm for the adsorption of heavy metals on CNTs was determined from
plotting the relation between equilibrium concentrations Ce of heavy metals adsorption in
the X-axis versus Ce/qe in the Y-axis. The linearized Langmuir equation is represented as
follows:
(3.3)
Where qe (mg/g) and Ce (g/L) are the amount of adsorbed heavy mteals per unit weight of
adsorbent and the unadsorbed heavy metals concentration in solution at equilibrium, KL is
the equilibrium constant or Langmuir constant related to the ffinity of binding sites (L/g)
and qm represents a particle limiting adsorption capacity when the surface is fully covered
with heavy metals (maximum adsorption capacity) and assists in the comparison of
92
adsorption performance. qm and KL were calculated from the slope and intercept of the
straight line Ce/qe versus Ce graph.
Freundlich isotherm for the adsorption of heavy metals on CNTs was also studied by
plotting the relation between ln Ce in the X-axis versus ln qe in the Y-axis.The linearised
Freundlich equation was expressed by logarithmic as follows:
+ ⁄ (3.4)
Where qe (mg/g) is the amount of adsorbed heavy metals per unit weight of the adsorbent
at equilibrium, KF is a Freundlich constant that shows the adsorption capacity of adsorbent,
and n is a constant which shows the greatness of the relationship between adsorbate and
adsorbent. n and KF were determined from the slope and intercept of the linear plot of ln qe
versus ln Ce.
The Temkin isotherm contains a factor that explicitly taking into the account of adsorbent–
adsorbate interactions. By ignoring the extremely low and large value of concentrations, the
model assumes that the heat of adsorption (function of temperature) of all molecules in the
layer would decrease linearly rather than logarithmic with coverage. The isotherm can be
represented by the following equation:
=
(3.6)
= B ln A+ B ln (3.7)
where B=RT/b, R is universal gas constant (8.314 J mol-1
K-1
), T defined as absolute
temperature (K), b is the Temkin constant related to heat of adsorption (J mol-1
) and A the

93
Temkin isotherm constant (L g-1
). The constants A and B are calculated from the slope and
intercept of qe versus ln Ce plot.
Dubinin–Radushkevich isotherm is generally applied to express the adsorption mechanism
with a Gaussian energy distribution onto a heterogeneous surface. The model has often
successfully fitted high solute activities and the intermediate range of concentration data.
The isotherm can be expressed by the following equation.
(3.8)
Where K and are Dubinin –Radushkevich isotherm constant. The saturation adsorption
capacity qm and K were calculated from the intercept and slope of ln qe versus .
3.7.3 Adsorption kinetics
Adsorption kinetics have been proposed to elucidate the adsorption mechanism. The
mechanism of adsorption depends on the physical and chemical characteristics of the
adsorbent as well as on the mass transport process. In order to investigate the mechanism of
adsorption of magnesium on magnetic biochar derived from rice husk and examine the
potential rate, the capability of pseudo-first order (Langergren, 1898) and pseudo-second
order (Ho and McKay, 1999b) kinetic model were examined in this study.
The differential equation of a pseudo first order kinetic is as follows:
(3.9)
Integrating Equation (3.9) for the boundary conditions t=0 to t = t and = 0 and
gives:
(
) (3.10)

94
Where and refers to the amount of adsorbed (mg/g) at equilibrium and at any time t
respectively while K1 is the equilibrium rate constant h-1
. The rate constant was calculated
from the slope of the straight line of plot versus t.
On the other hand, a pseudo second order equation based on the adsorption capacity
is expressed in the form:
(3.11)
Integrating the equation above for the boundary conditions, t=0 to t = t and = 0 and
rearranging the final equation as:
(3.12)
Where K2 is the equilibrium rate constant (g /(mg.h)). K2, qe were calculated from the
intercept and slope of the straight line plot of t/qt versus t.
3.8 Characterization of CNTs
The scanning electron microscopy (Brand: Zeiss Model: Auriga) was used to characterize
the morphology (diameter and the length) of the deposited powder, while the structure was
characterized using the transmission electron microscopy (TEM) for the selected sample.
The SEM gives good results in characterizing the length and the diameter of the CNT and
because it is used to scan only the surface of the sample, but it cannot be used to distinguish
between the structure of the CNT, while the TEM is the best way to distinguish between
them.

95
3.8.1 Field Emission Scanning Electron Microscopy
Field Emission Scanning electron microscopy (FESEM) model Zeiss Auriga, Japan, has an
ultimate lateral resolution of a nanometer (depending on the type of the electron gun
employed), making it a useful alternative to light microscopy for detailed examination of
material having micro and nano structures. FESEM makes use of a tightly focused,
energetic electron beam, which is swept across the surface of the sample in a raster-scan
pattern (this is similar to how the cathode ray tube in your TV works). Secondary electrons
are emitted from the sample and detected, which forms the image observed.
3.8.2 Transmission Electron Microscopy
Transmission electron microscopy (TEM) provides the visualization of the internal
structure of specimens by the use of transmitting electrons. Because electrons have a much
smaller wavelength than that of visible light, microscopy-using electrons offers a much
greater (50,000x) resolving power than light microscopy. Because electrons have a very
limited range transiting matter, TEM samples must be very thin and they must be placed in
a vacuum inside the instrument. The structure of the CNT was characterized using TEM
model Hitachi H-7100, Japan and high-resolution TEM (HRTEM) model JEOL JEM
2100F, Japan.
3.8.3 Thermogravimetric Analysis
TGA measures changes in weight of a sample with increasing temperature. Moisture
content and presence of volatile species can be determined by this technique. Computer
controlled graphics can calculate weight percent losses. The dynamic thermogravimetric
were carried out on small samples (about 10 mg) with an airflow rate of 300 cm3/min. The

96
maximum temperature was 1100 °C and the typical heating rate was 10° per minute. The
purity measurements of CNTs were carried out by using TEM images and TGA. The TEM
images were taken from various locations of the sample. After finishing the scanning of the
sample, serial analysis was carried out in order to measure the purity. The purity of the
CNT was determined by Thermogravimetric Analysis (TGA) model Pyris diamond
TG/DTA, USA. The TGA was used to study the thermal stability of the products in order to
distinguish the deposited carbons according to their different thermal stability level.
3.8.4 BET surface area
Physical characterization of CNTs produced at the optimum condition was analyzed with
Autosorb 1 surface area analyzer by nitrogen adsorption at -77 K. Prior to analysis, the
samples were degassed at 200 oC
for 3 hrs. Surface area was calculated by the BET (Brand:
Quanta Chrome Model: Autosorb 6B) equation using the nitrogen adsorption data. The
adsorbed nitrogen volumes and various equilibrium pressures, and BET surface area of the
sample were reported using the computer - monitoring system.
3.8.5 Raman spectra Analysis
The graphitization of the CNT samples was determined by using Raman spectroscopy
model Renishaw inVia, USA at a wavelength of 532 nm with green laser excitation.
3.8.6 XRD analysis
The crystalline information of CNTs was observed using XRD patterns by using model
Siemens D-500 X-ray, diffractemeter, USA.
97
3.8.7 Inductively Couple Plasma
The heavy metal ion concentrations were measured by Inductively Couple Plasma (ICP) at
283.307 nm, 228.802 nm, 327.393 nm and 206.2 nm Zn (II) for Pb (II) Cd (II), Cu (II) and
Zn (II) respectively.
3.8.8 FTIR analysis
Fourier Transform Infrared (FTIR) spectroscope (Brand: Bruker, Model: IFS66v/S) was
used to analyze the CNTs for determination of the surface functional groups.When light
travels across the boundary between two materials causes reflection of some of the light.
The proportion of reflected light is a function of the angle of incidence, θi, at which the
light encounters the boundary. By measuring the attenuated total reflection as a function of
wavelength, an adsorption spectrum of absorbing medium is obtained.
98
4 CHAPTER IV
RESULTS AND DISCUSSION
4.1 Introduction
In this research, microwave induced MWCNTs synthesized using the single stage MA-
CVD, using acetylene and hydrogen as the precursor gases, and ferrocene as catalyst. The
effect of process parameters such as microwave power, radiation time and gas ratio of
C2H2/H2 was investigated. The preparation conditions were statistically optimized using
central composite design (CCD) to produce the high quality and high weight of MWCNTs
and detailed characterization of MWCNTs was investigated. The optimized condition of
MWCNTs has high BET 206 m2/g surface area and proved to be an outstanding
adsorbent for the removal of Pb (II), Cd (II), Cu (II) and Zn (II) from aqueous solution.
The statistical optimization of process parameters such pH, MWCNTs dosage and agitation
speed and time of removal of Pb (II), Cd (II), Cu (II) and Zn (II) were investigated using
novel MWCNTs. The studies on the isotherm kinetic (Langmuir, Freundlich, Temkin and
Dubinin isotherm) and isotherm model (pseudo-first order and pseudo-second order) were
developed and furthermore thermodynamic parameters were investigated on Pb (II), Cd
(II), Cu (II) and Zn (II) adsorption are also reported in this chapter.
4.2 Effect of process parameters on synthesis of CNT
CNTs production requires the knowledge of optimum microwave power, radiation time and
gas ratio of C2H2/H2 ratio. The effects of process parameters on the synthesis of the CNT
were studied to enhance higher yield with high purity. The effects of each process
parameter were further discussed in the following section.

99
4.2.1 Effect of microwave power
The effect of microwave power on the weight of CNTs and purity is illustrated in Fig. 4.1
The microwave power influence on the structure of the carbon nanomaterials has been
emphasized. It is generally accepted that carbon materials are formed by the carbon atom
dissolving, diffusing, and precipitating through the catalyst droplets in a CVD process
(Ishioka et al., 1993; Ishioka et al., 1992; Kato et al., 1993; Muataz, 2003; Mubarak, et al.,
2011). The dissolving, diffusing and precipitating rates of the carbon atoms are affected by
both the carbon atom concentration and the microwave power. It was found that increase in
microwave power from 600 to 900 W (the temperature inside microwave for 250 to 520 oC)
increase weights and purity of CNTs was observed. Therefore, a maximal CNTs growth
rate and high purity (98%) occurs at 900W (temperature of 520 oC where both of the carbon
diffusion and catalyst activity are optimized (Hayashi et al., 2006; Huang, Chuang, et al.,
2003). The carbon solubility and diffusion in catalyst metals have been recognized as
important factors for CNT growth, but are difficult to quantify. When the microwave
power was less than 900 W, the size of the catalyst was very small and the diffusion rate of
C atoms onto Fe particle was also low, for this reason small amount of carbon
nanostructure materials were formed. By increasing the microwave power, the size of the
Fe catalyst increased, and this leads to the gradual growth of the C atoms on the catalyst. At
a low microwave power, a decrease in the formation of CNTs has been observed, possibly
due to the partial deactivation of catalyst and the carbon concentration from the
decomposition of C2H2 over an iron catalyst is certainly low (Pérez-Cabero, et al., 2004;
Taniguchi, et al., 2005). Furthermore, increase microwave power to 1000 W (the
temperature inside microwave of 540 oC and above), and above decreased the weight of

100
CNTs and purity due to weight loss of carbon (Chhowalla, et al., 2001; Huang, Wang, et
al., 2003). This is due to the diffusion rate of iron particles into carbon fibers was enhanced
and the CNT growth possibility is reduced (Brunetti, et al., 2007; Kim, Kim, et al., 2005;
Li, Chen, et al., 2002). Another possible reason is related to the catalyst distribution on the
substrate, the available carbon flux arriving on the catalysts, and the carbon solubility and
diffusion in catalysts, which are controlled by process parameters including the inputs of a
gas ratio and microwave power. Microwave power a vital role in the formation of high
weight of CNTs and high purity of CNTs.
Figure 4.1: Effect of microwave power on weight of CNTs and purity.
4.2.2 Effect of radiation time
Fig. 4.2 shows the effect of microwave radiation time on the weight of CNTs. Besides
microwave power, radiation time is an important process variable for synthesis of high
weight of CNTs. It was clearly observed that as radiation time increases from 10 to 35 min
increased in the amount of CNTs formation was also observed. The maximum amount of
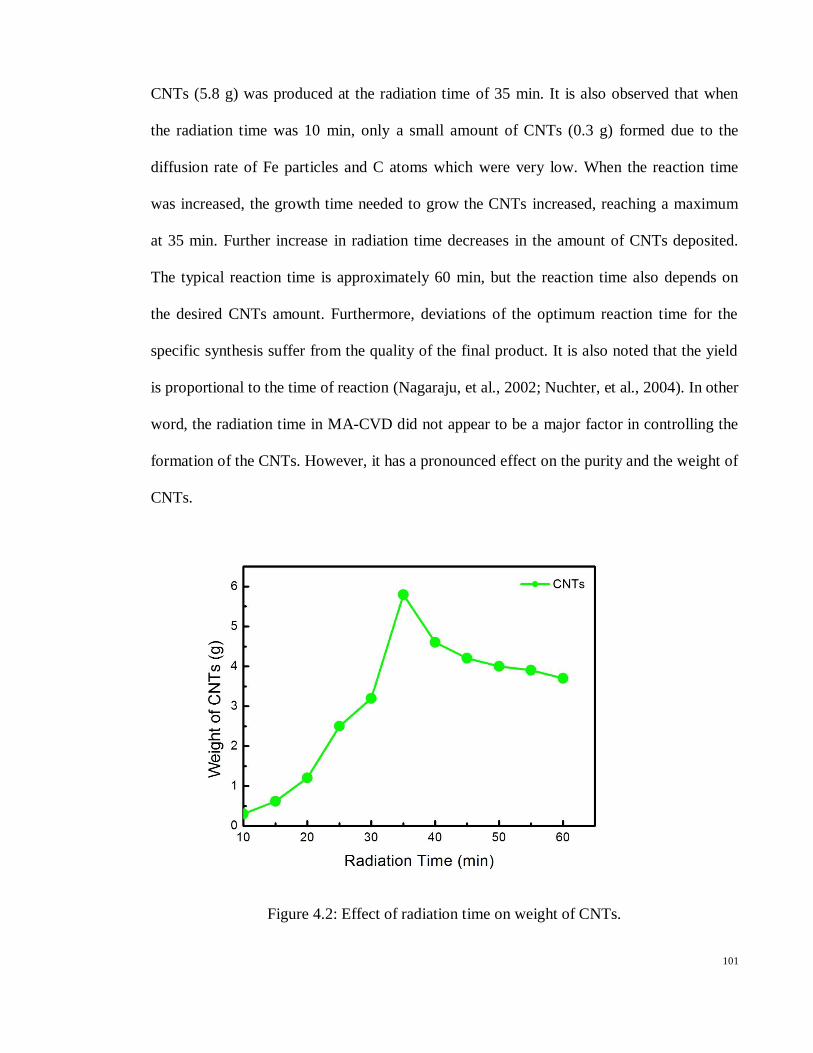
101
CNTs (5.8 g) was produced at the radiation time of 35 min. It is also observed that when
the radiation time was 10 min, only a small amount of CNTs (0.3 g) formed due to the
diffusion rate of Fe particles and C atoms which were very low. When the reaction time
was increased, the growth time needed to grow the CNTs increased, reaching a maximum
at 35 min. Further increase in radiation time decreases in the amount of CNTs deposited.
The typical reaction time is approximately 60 min, but the reaction time also depends on
the desired CNTs amount. Furthermore, deviations of the optimum reaction time for the
specific synthesis suffer from the quality of the final product. It is also noted that the yield
is proportional to the time of reaction (Nagaraju, et al., 2002; Nuchter, et al., 2004). In other
word, the radiation time in MA-CVD did not appear to be a major factor in controlling the
formation of the CNTs. However, it has a pronounced effect on the purity and the weight of
CNTs.
Figure 4.2: Effect of radiation time on weight of CNTs.

102
4.2.3 Effect of Gas ratio
Gas ratio (C2H2/H2) plays a significant role in the formation of CNTs as being the carrier
and reactant gas in the floating catalyst method. Fig. 4.3 shows the effect of gas ratio of
weight of CNTs produced. It was clearly observed that as the gas ratio (0.2 to 0.6)
increase, the amount of CNTs also increased drastically. The C2H2/H2 input had a slight
effect on decreasing the weight of CNTs after 0.6 gas ratio. For most of the situations, CNT
growth rates increased with increasing gas ratio, the maximal amount of CNTs enhanced at
microwave power 900 w with a gas ratio of 0.6 (Kuo, et al., 2006; Quinton, et al., 2013). A
further increase in the gas ratio decreased the amount of the CNT was observed. Synthesis
of CNTs depends on the gas flow rate, hydrocarbon concentration, microwave power, size
and shape of the initial agglomerate and catalyst loading and size. The gas flow rate affects
the mass transfer coefficient, the size and shape of the agglomerate influences the internal
diffusion of gas within the pore, the microwave power, hydrocarbon concentration and
catalyst loading determine the reaction rate. The morphology of CNTs depends on the type
and size of catalyst and the carbon supply rate (Danafar, et al., 2009; V zquez and Prato,
2009). Hence, the effect of gas ratio and microwave power is very important parameter for
synthesis of high quality and high amount of CNTs.

103
Figure 4.3: Effect of gas ratio on weight of CNTs at optimal CNTs.
4.3 Statistical optimization of CNTs production
CCD was employed to attain all possible combinations of all the input factors with
minimum number of experimental runs that could possibly optimize the response within the
region of three dimensional observation spaces. The results from the experiments were
analyzed using analysis of variance (ANOVA) in the design of experiment (DOE). The
variables such as microwave power, radiation time, and gas ratio of C2H2/H2 were
employed for the analysis in the design to obtain the weight of CNTs.
Detailed overview of design expert software as shown in appendix E. In addition, a detailed
experimental array of CNTs production using microwave heating as shown in appendix A.
The results from the analysis are shown in Table 4.1 the regression equation that models the
relationship between the variables was presented. In equation (4.1) the significance of the

104
model parameters was assessed by the values of probability>F-values, lack of fit, and also
the curvature of F. The pattern of interactions between the variables is indicated by these
coefficients. The variables with low probability levels contribute to the model, whereas the
others can be neglected and eliminated from the model. The larger the magnitude of F-
value and smaller the probability>F-values indicate the higher significance of the
corresponding coefficient. The probability value is the probability of obtaining a value at
least as extreme as the one actually obtained. For a significant and convincing coefficient,
the probability values must be smaller than 0.05. The ANOVA of the quadratic regression
model demonstrates the significances of the model. For this optimization study, the
ANOVA of quadratic regression model demonstrated that the model was highly significant,
as evident from the Fisher‘s F-test with a very low probability value [(Prob > F) = 0.0001].
The fisher F-test value signifies how the mean square of the regressed model compared to
the mean square of the residuals (errors). Note that the greater the F value, the more
efficient the model. Meanwhile, lower probability (P value) demonstrates the higher
significance of the regression model. The F-test which is 26.01 implies that the model is
significant. ANOVA shows an F test value of less than 0.05 implies that the model is also
significant. Furthermore, the value of the correlation coefficient (R2 = 0.99) and the
adjusted determination coefficient (R2Adj=0.98) are both very close to one, indicating a
high significance of the model. The developed model Equation (4.1) is as follows.
Weight of CNT = 5.28 +0.44 * A +0.14 * B -0.11 * C -2.55* A2 -0.74 * B
2 -1.44 *C
2
+0.088* A * B -0.069 * A * C +0.088 * B * C (4.1)
Consequently, variables A, B, C, AB, AC and BC were significant model terms. This
indicates that the microwave power (A), radiation time (B) and gas ratio (C) were highly
significant as the values of Probe >F was 0.002. The ANOVA of the quadratic regression

105
model demonstrates the significances of the model. In the analysis of CNTs yield through
the coefficient values from the equation of regression model, it is shown that the
microwave power gives higher positive effect as compared to the radiation time. On the
other hand, gas ratio of C2H2/H2 is giving negative effects. Thus, in short, the coefficient
values obtained show that all the process parameter chosen to be investigated in the
optimization experiments influenced the weight of CNTs in the production process. The
effect of each interaction process parameter was further analyzed by statistical software and
the discussion regarding the matter are noted in the following section. Fig. 4.4 shows
theoretical values versus the experimental values for CNTs yield. It was clearly shown that
the theoretical values obtained were quite close to experimental values, indicating that the
model developed was successful in bridging the correlation between process parameters to
the yield of CNTs.
Figure 4.4: Relationship between Predicted and Experimental values of yield of CNTs

106
Table 4.1: ANOVA for the selected factorial Model for CNTs production.
Source Sum of
squares DF
Mean
square
F
Value
Prob >
F Status
Model 78.33 9 8.7 26.01 0.0001 Significant
A 3.36 1 3.56 6.54 0.002
B 0.34 1 0.34 0.63 0.004
C 0.22 1 0.22 0.4 0.053
A2 17.61 1 17.61 32.39 0.0001
B2 1.47 1 2.71 2.71 0.012
C2 5.60 1 10.31 10.31 0.006
AB 0.12 1 0.12 0.23 0.063
AC 0.076 1 0.076 0.14 0.071
BC 0.12 1 0.12 0.23 0.064
Residual 7.61 14 0.54 0.0234
Lack of fit 6.48 5 1.3 10.36 0.65 Insignificant
Pure Error 1.13 9 0.13
Cor Total 85.96 23
4.3.1 Effect of process parameters on CNTs production
The 3D response surface and the contour plots are the graphical representation of the
regression equation in order to determine the optimum values of the variables (Ishioka, et
al., 1992). The main target of response surface is to obtain the optimum values of the
variables efficiently in such a way that the response is maximized (Veziri, et al., 2008). The
maximum predicted value is referred by the surface confined in the smallest ellipse in the
contour diagram. The perfect interaction between the independent variables can be shown
when elliptical contours are obtained (Mubarak, et al., 2011; Veziri, et al., 2008). Each
contour curve represents an infinitive number of combinations of two test variables. The
graphical representations of the model equation facilitate an examination of the effect of
process parameters on CNTs production, 3D surface and contour plots between

107
production factors were obtained using the DOE. The effect of each interaction process
parameter was further analyzed by statistical software and the discussion regarding the
matter are noted in the following section.
4.3.2 Effect of radiation time and microwave power on weight of CNTs
Fig. 4.5 (a-b) represents the contour and 3-dimensional plot of the production of CNTs
affect by variables are radiation time and microwave power to weight of CNTs. All the 3-
dimensional surface and contour plot is almost perfectly elliptical indicated that a good
interaction between radiation time and microwave power. It was observed that the weight
of CNT reached to the maximum when the radiation time and microwave power is at its
center point. Further increase in radiation time and microwave power resulted in weight of
CNT decreased. Due to deviations of the optimum radiation time for the specific synthesis
suffer from the quality of the final product. On the other hand, when the microwave power
was less than 900 W, the size of the catalyst was very small and the diffusion rate of C
atoms onto Fe particle were also low, for this reason small amount of carbon nanostructure
materials were formed. From the observed increase in microwave power from 600 to 900
W increase the in weight of CNT linearly increased (Benito et al., 2009a; Choi, et al.,
2000; Ikuno et al., 2002; Lacerda, et al., 2004). At 900 W microwave power, the size of the
Fe catalyst increased, and this leads to the gradual growth of the C atoms on the catalyst
(Huang, Chuang, et al., 2003). Further increase in microwave power from 900 to 1200 W
decrease in weight of CNT (Clauss et al., 2010; Hong, et al., 2003; Muataz et al., 2003;
Vivas-Castro, et al., 2011) . This is due to the diffusion rate of iron particles into carbon
fibers was enhanced and possibly lead to the decrease of the CNT growth (Li, Chen, et al.,
2002; Zeng, et al., 2010). It is also noted that the weight of CNTs is proportional to the

108
radiation time (Nagaraju, et al., 2002). In other word, the radiation time in MA-CVD did
not appear to be a major factor in controlling the formation of the CNTs. However, it has a
significant effect on the purity and the weight of CNTs. Hence, microwave power plays a
vital role in the formation of high yield and high quality of CNTs (Huang, Wang, et al.,
2003; Lee et al., 2013).

109
Figure 4.5: (a-b): Effect of radiation time and microwave power on CNT production.
.

110
4.3.3 Effect of gas ratio and microwave power on weight of CNT
Fig. 4.6 (a-b) shows the interaction between gas ratio and microwave power. It was
observed that 3-dimensional surface and contour plot is perfectly elliptical indicated that
all interaction was perfectly optimized to obtain the high weight of CNTs (Ishioka, et al.,
1993; Ishioka, et al., 1992; Kato, et al., 1993). The weight of CNT reached to the
maximum when the gas ratio and microwave power are at 0.6 and 900 W respectively
(Hayashi, et al., 2006; Kuo, et al., 2005; Kuo, et al., 2006). By increasing and decreasing
both parameters from its center point will result in decreasing the weight of CNTs. A
further increase in the gas ratio of 0.6 to 1 and microwave from 900 to 1200 W decreased
the amount of the CNT was observed. Production of CNTs depends on the hydrocarbon
concentration, gas flow rate, microwave power, size and shape of the initial agglomerate
and catalyst loading and size. The gas flow rate affects the mass transfer coefficient, the
size and shape of the agglomerate influences the internal diffusion of gas within the pore,
the microwave power, hydrocarbon concentration and catalyst loading determine the
reaction rate. The growth rate of CNTs is a function of catalyst particle size and the
diffusion rate of carbon through the catalyst (Kim, et al., 2003). The morphology of CNTs
depends on the type and size of catalyst and the carbon supply rate (Danafar, et al., 2009).
Therefore, the effect of gas ratio and microwave power is very important parameter for
synthesis of high quality and high amount of CNTs (Kuo, et al., 2005; Lee, et al., 2002;
Teng et al., 2013).

111
Figure 4.6: (a-b): Effect of gas ratio and microwave power on CNT production.

112
4.3.4 Effect of gas ratio and radiation time on weight of CNT
Fig. 4.7 (a-b) shows the interaction between gas ratio and radiation time. 3-dimensional
and contour plot indicated that almost elliptical indicated that there is good interaction
between gas ratio and radiation time. The mid- point interaction for gas ratio and radiation
time shows the highest weight of CNTs obtained. Further increase in radiation time from
35 to 60 min and gas ratio of 0.6 to 1.0 resulted in weight of CNTs decreased (Han, et al.,
2002; V zquez and Prato, 9). The typical radiation time is approximately 60 min, but
the radiation time also depends on the desired CNTs amount. Furthermore, deviations of
the optimum radiation time for the specific synthesis suffer from the quality of the final
product (Liu, et al., 2007; Nagaraju, et al., 2002; Nuchter, et al., 2004; Willems, et al.,
2000). It is also noted that the yield is proportional to the time of reaction. Hana et al.
(2002) studied the influence of flow rate of precursor and carrier gas, and it is found that if
the flow rate of carrier gas is increased, with the precursor flow rate remain constant, the
mean diameter of CNTs will decrease. If the flow rates of both carrier and precursor gas are
increased, the diameter essentially remains constant, but the growth rate will increase. On
the other hand increase in gas ratio after 0.6 resulted in decreasing the weight of CNTs.
Hence the gas ratio is a vital factor that can influence the formation of the growth
mechanism of CNTs.

113
Figure 4.7: (a-b): Effect of gas ratio and microwave power on CNT production.

114
For the best fit regression of the model, the regression equation and the coefficient of
determination R2
was evaluated. The determination coefficient, R2 and adjusted R
2 values
represented the proportion of variation in the response data explained by the predictors. The
model gave a R2
= 0.996, which means 97 % of the variance; microwave power, radiation
time, and gas ratio (C2H2/H2) were best fitted to the model selected. The statistical analysis
gave four comparative solutions for the production of CNTs based on the weight of CNTs
as shown in Table 4.2. If the desirability value is less than one, it means optimization was
achieved. From the solution obtained from the design it showed the desirability of getting a
value of 0.97, which mean that 97 % of optimization was achieved.
Table 4.2: Validation study for selection of best yield, high quality and high purity of CNTs
Number Microwave
Power (W)
Radiation
time
(min)
Gas
ratio
C2H2/H2
Weight
of CNTs
(g)
Desirability
1 900 35 0.6 5.8 0.97
2 900 33 0.58 5.4 0.91
3 900 32 0.57 5.34 0.89
Based on the statistical result the optimum production conditions for the selected CNT
were; microwave power 900 W, radiation time 35 min, and gas ratio of C2H2/H2 0.6. The
optimization process parameter was related to similar work done by (Amirhasan, et al.,
2007; Das et al., 2006; Kuo, et al., 2005; Otsuka et al., 2004; Veziri, et al., 2008) to
produce high yields and high purity of the CNT. From their observation microwave power,
and gas flow rate played a tremendous role in the formation of the CNT. Table 4.3 Shows a
review on the microwave assisted synthesis of CNTs.

115
Table 4.3: Review on microwave assisted synthesized CNTs
Catalyst Time
(min)
Carbon
Source
Temp
(oC)
Microwave
Power (W)
CNT
Type
Diameter
(nm)
Reference
Fe 35 C2H2/H2 520°C 900 MWCNTs 10-23 This Study
Si 30-90 graphite 1200 800 MWCNTs 50-400
(Méndez,
et al.,
2003)
Catalytic
Cobalt
(Co)
0.5-10 C2H2 800 900 CNTs 4 (Taniguchi
, et al.,
2005)
Pd-CO 10 CH4 750 600 MFCNTs 50
(Hayashi,
et al.,
2006)
Co-Zn-Al
mixed
oxides
300 CH4 125 800 MWCNTs 20-30 (Benito, et
al., 2009a)
Fe 5 S Iron
melonate+
Prussin
blue
1000 800 MWCNT 30-60 (Clauss, et
al., 2010)
Fe 120 graphite >1000 1000 MWCNT 10-30
(Vivas-
Castro, et
al., 2011)
Fe 6 CH4 594-
597
750 SWCNTs 45-100 (Teng, et
al., 2013)
Ferrocene 30 C2H2 600 6000 MWCNTs 50-80 (Fu, et al.,
2013)
Ni 3 CH4 600 800 MWCNTs 60 (Lee, et
al., 2013)
4.3.5 Effect of perturbation plot on weight of CNTs
Among the parameters that influence the growth mechanism of CNTs is the catalyst, gas
flow rate and microwave power. Most effective and widely used catalysts are Fe/Co/Ni.
The rationale for using these metals lies in the phase diagrams for these metals and carbons.
At a high temperature, carbon has a finite solubility in these metals, which leads to the

116
formation of metal-carbon solutions and therefore the aforementioned growth mechanism.
Using the selected quadratic model, the optimization goal was set to a targeted response
prediction and statistically validated the observed experimental data, the numerical
optimization tool in CCD was used to generate contour maps from which optimum
experimental conditions (design points) were identified. The three experimental factors
could be used as axes for the contour maps, it was necessary to choose the factors that were
most sensitive to the response by using perturbation plots. In generating the perturbation
plots, all the factors were plotted on the same response graph. These plots show how the
response changes as each factor moves from a chosen reference point (in this case the
middle of the design space or the midpoint of each factor range). The response (weight of
CNTs) was therefore plotted against the deviation from the reference point of the
interaction of all factors over its entire range as shown in Fig. 4.8. From the observation of
the perturbation plots exhibit good interaction with all the process parameter such as
microwave power (A), radiation time (B) and gas ratio (C). This indicates that the response
(weight of CNTs) is more sensitive to changes in factors A and C than to changes in factor
B. The range of process parameters such as microwave power (600 to 1200 W), radiation
time (10 to 60 min) and gas ratio of C2H2 (0.1 to 1). The range of process parameters was
selected based on the previous study (Cao, et al., 2007; Cheung, et al., 2002; Douven, et al.,
2012; McKee, et al., 2009) .

117
Figure 4.8: Effect of perturbation plot of CNTs production.
4.4 Characterization of selected CNT samples produced
4.4.1 Field Emission Scanning Electron Microscope
The CNT produced at optimal production conditions was examined by FESEM as shown in
Fig. 4.9 (a-c). The quality of CNTs, in terms of crystallinity and impurity content is
dependent on the conditions of synthesis, the use of hydrocarbon gas and metal
nanoparticle catalysts. High purity and high of CNTs array were observed in Fig. 4.9 (a-c).
FESEM images at different magnifications, i.e. 1000, 1000,000 and 2000,000 nm scales.
These produced CNT is free from impurity was observed from the all the images and clear
CNTs was observed. It also shows that these CNT are tens of microns long with uniform
diameters. The bulk morphology of long CNT is filmed like and oriented. The produced
CNTs have the vertical alignment of CNT could be observed with the diameter of CNTs
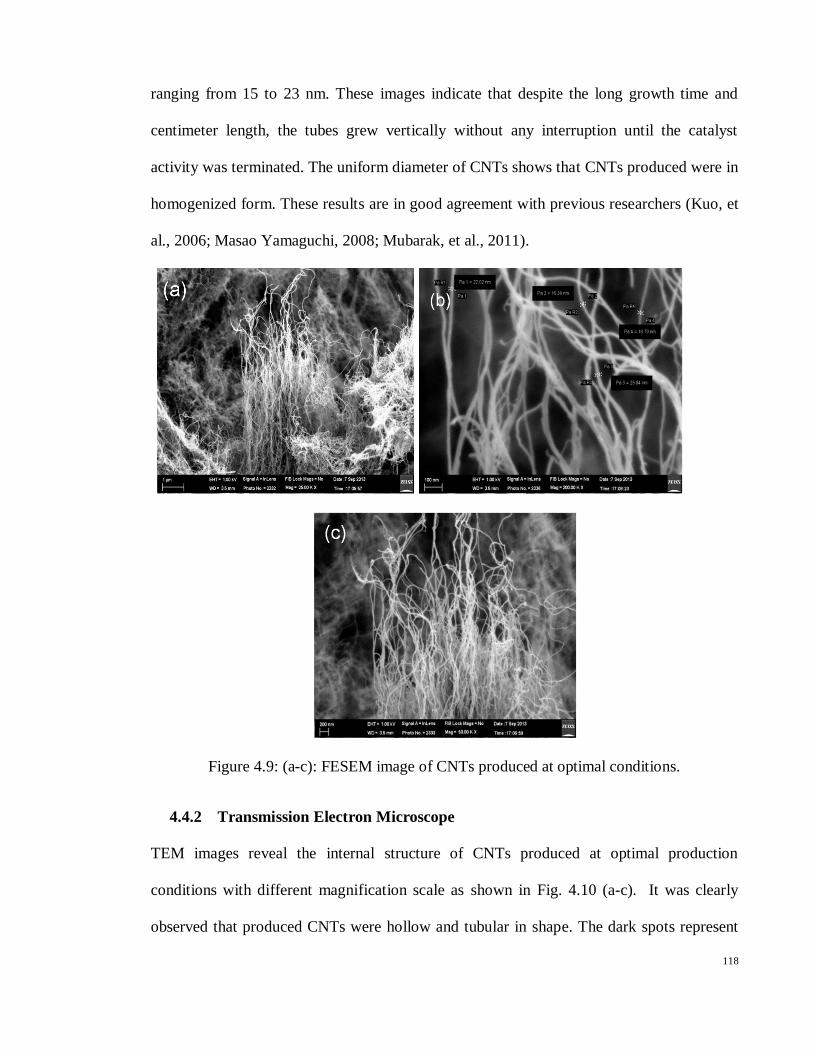
118
ranging from 15 to 23 nm. These images indicate that despite the long growth time and
centimeter length, the tubes grew vertically without any interruption until the catalyst
activity was terminated. The uniform diameter of CNTs shows that CNTs produced were in
homogenized form. These results are in good agreement with previous researchers (Kuo, et
al., 2006; Masao Yamaguchi, 2008; Mubarak, et al., 2011).
Figure 4.9: (a-c): FESEM image of CNTs produced at optimal conditions.
4.4.2 Transmission Electron Microscope
TEM images reveal the internal structure of CNTs produced at optimal production
conditions with different magnification scale as shown in Fig. 4.10 (a-c). It was clearly
observed that produced CNTs were hollow and tubular in shape. The dark spots represent

119
the Fe catalyst nanocrystals encapsulated in carbon graphic layers give evidence of tip
growth mechanism (Kumar and Ando, 2010). It was also observed that the shape of the
catalyst, which served as a seed during the production process, is important because the
produced CNTs are assumed to follow the shape of the catalyst. This fact is obvious in the
TEM images and we see some CNTs follow the shape of the catalyst. Therefore, produced
CNTs were high purity, uniform diameter distribution with no deformity in the structure
was observed in TEM images.
Figure 4.10: (a-c): TEM images of the selected CNT prepared at optimal condition.
120
4.4.3 High Resolution Transmission Electron Microscope
Fig. 4.11 (a-d) shows the HRTEM images of CNTs at different magnification scale. Fig.
4.11 (a-b), a highly ordered crystalline structure of CNTs, revealing that the structure of
this multiwall carbon nanotube (MWCNTs) is a waving structure of graphite sheets at a
short range. Most inner graphite sheets have straight fringes, but the outer graphite sheets
were waving fringes, indicating a defective crystalline structure. The clear fringes of
graphitic sheets are well separated by 5 nm and aligned with a tilted angle of about 2°
toward the tube axis.The space of graphite layers in the MWCNT is 0.34 nm meanwhile the
outer and inner diameters of MWCNT are 5 and 10 nm, respectively. Fig. 4.11 (c-d)
provides evidence that the twisting and winding CNTs are MWCNTs. The length of
product CNTs is estimated at more than several tens of micrometers. Some dark spot was
observed on the surface of MWCNTs, these sports may be a catalyst particle on top.
HRTEM image shows at high resolution indicates that there were about multi layers
graphitic walls of the of CNTs grown at 900 W were observed. The TEM image shows that
there were about 17 graphitic walls of the multi layers CNTs grown at optimal production
conditions. Hence, HRTEM result proved that produced CNTs were appeared in tubular
and hollow shape (Chen, et al., 2002; Mubarak, et al., 2011; N. Grobert and Zhu, 1999).

121
Figure 4.11: (a-d): HRTEM image of CNT prepared at optimal conditions.
4.4.4 Thermogravimetric Analysis
TGA of the CNT was used to examine the purity of the selected CNT. The variations of the
CNT mass with respect to temperatures at specific time are shown in Fig. 4.12 TGA
analysis shows a single peak at one distinct zone, implying high purity of the CNTs.
Moreover, the peak corresponds to the decomposition of one element only, since no other
peaks are observed. There is a very slight loss of weight between 50 to 100oC, which
correspond to the loss of water from the catalyst support. The weight loss in the range of

122
335 to 350 oC is a result of oxidation of amorphous carbon (Chen, Chen, Chen, et al., 2002;
Kim, Kim, et al., 2005; Moon et al., 2001) and the weight loss in the range of 480 to 620 oC
is due to oxidation of CNTs (Kim, Kim, et al., 2005). The observed flat profiles between
620 and 850 °C showed that the metal catalyst and support are not volatile below 800 °C
and thus remain as residue of TGA. The weight loss indicates the purity and yield of CNTs
and the higher the weight loss, the higher is the purity of CNTs. From the TGA analysis,
we concluded that the produced CNTs have almost 98% purity. The above finding proved
by previous research (Das, et al., 2006; Huang, Wang, et al., 2003).
Figure 4.12: TGA analysis of the CNT produced at optimal conditions
4.4.5 X-ray Diffraction
The crystalline information of MWCNTs with average diameters of 15-23 nm is shown in
Fig. 4.12, where these x-ray diffraction (XRD) patterns was measured at a scan rate 10/min
from 200 to 80
0. Two main crystalline peaks C (101) and C (002), are clearly centered at
45o and 26
o on these XRD patterns, indicating the presence of a graphite crystalline

123
structure on these MWCNTs. This phenomenon suggested that the crystalline quality of the
graphite structure on the MWCNTs becomes poor with an increase in the average diameter.
In addition, the broad diffraction peak (centered at 45o) between 43
o and 46
o may be
attributed to the contribution of Fe (110) (centered at 44.7o). This result suggests the
presence of Fe particles, possibly due to the aggregation of Fe atoms from the catalyst
precursor. The diffraction peaks associated with Fe3C and Fe phases are in agreement with
other reports (Das, et al., 2006; Gulino, et al., 2005; Kuo, et al., 2005).
Figure 4.13: XRD patterns of CNT prepared at optimal conditions.
4.4.6 Raman spectroscopy
The quality of the CNTs was assessed Raman spectroscopy as shown in Fig. 4.13. Two
prominent Raman features are observed with the CNTs with D (disordered)-band and G
(graphite)-band. The D-band (1330 cm-1
) is representative of the defects and disorder
associated with the CNTs, such as open caps, wall defects and amorphous carbon deposits

124
(Eklund et al., 1995). The D-band arises from shifts in the phonon modes of the CNTs that
are caused by perturbations in the symmetry of the tubes (Pimenta et al., 2001; Qian et al.,
2003; Saito and Kataura, 2001). Defects are an example of the perturbations that cause
shifts in the vibrational frequency of the phonons (Athalin and Lefrant, 2005). The G-band
1600 cm-1
, represents the graphitization of the CNTs, this is a peak that representative of
highly –ordered pyrolitic graphite (Zhao et al., 2002). It is evidenced by the decrease in the
D to G band ratio (ID/IG) from 19000 to 13000. The above finding agrees well with the
result from HRTEM observation.
Figure 4.14: Raman spectra of CNT prepared at optimal conditions.

125
4.4.7 BET surface area
Fig. 4.14 (a) shows the N2 sorption isotherms of CNTs. The hysteresis behavior apparent
in the isotherms indicates the mesoporous nature of the carbon specimens. The adsorption
isotherm features a combination of type I (the initial part is concave to the p/p° axis) and
type IV isotherms (its apparent hysteresis loop). According to the IUPAC classification
type I isotherm is given by microporous solids which have relatively small external
surfaces and Type IV isotherm is given by many mesoporous industrial adsorbents
(Carabineiro et al., 2011; Huang et al., 2011; Jiang and Zhao, 2004; Sing et al., 1985).
Figure 4.14 (b) shows the pore size distribution (PSD) curves. The mean pore sizes
estimated from the peak positions of the PSD curves was 3 nm. It also shows that a vast
majority of the pores falls into the range of mesopore (Huang, et al., 2011). The BET
surface area evaluated using N2 adsorption isotherms prepared under optimum conditions
was 206.45 m2/g with a pore volume of 0.834 cm
3/g.

126
Figure 4.15: (a) N2 adsorption/desorption isotherm of CNTs, (b) Pore size distribution
curves of the CNTs prepared under optimal condition.
4.5 Heavy Metals removal
The heavy metal ions in waste water are becoming a major concern for environment
conservative and human health. To reduce environmental problems, the CNTs are
promising candidates for the adsorption of heavy metals. Statistical optimization of process

127
parameters such pH, CNTs dosage and agitation speed and time of removal of Pb (II), Cd
(II), Cu (II) and Zn (II) were investigated using optimized MWCNTs conditions produced
via microwave heating. The studies on the isotherm kinetic, isotherm model and
thermodynamic parameters were developed and investigated as well.
4.5.1 Statistical optimization of removal of Pb (II) using CNTs
The initial stride in choosing the most suitable adsorbent with a higher adsorption capacity
of Pb (II) would be the determination of the optimized condition of MWCNTs as a the
adsorbent for removal of Pb (II) (Hu, et al., 2009; Kabbashi, 2011; Mubarak, et al., 2013).
The precise numbers of runs for the optimized condition were regulated based on the design
obtained from DOE. The detail experimental array of adsorption rate of removal of Pb (II)
as shown in appendix B. The results obtained from this particular experiment were
analyzed using the application of ―analysis of variance‖ (ANOVA) obtained from the DOE
and the optimized variables are attainable from Table 3.2. Results obtained from adsorption
experiment were analyzed by employing ANOVA for the removal of Pb (II) using CNTs
are indicated in Table 4.4. The fisher F-test value obtained from Table 4.4 which provides
the comparative of the mean square of the residuals (errors). High F (19.6) value proves the
efficiency of the model while the low probability, P value indicates higher significance of
the regression model. This value indicates both models are significant. On the other hand,
the correlation coefficient value, R-Squared and Adj R-Squared of CNTs were 0.99 and
0.97 respectively. This value defines the high efficiency and significance of both models.
The model equation evolved for the removal of Pb (II) from aqueous solutions for CNTs is
equation (4.2) is as follows:

128
Pb (II) % removal = 100.07 +0.48 * A +0.84 * B+0. 29 * C +1.02 * D -17.93 * A2 -
7.73* B2 -6.93 * C2-11.43 * D2 -0.48 * A * B -0.52 * A * C +1.48 * A * D +2.36 *
B*C-1.64 *B*D+1. 64*C*D (4.2)
Consequently, variables A, B, C, D, AB, AC, AD, BC, BD and CD were significant model
terms. This indicates that the pH (A), agitation speed (B), MWCNTs dosage (C) and time
(D) were highly significant values of Probe >F was 0.0001. The coefficient of single factor
represents the effect of its represented factor while the coefficients of double factors
represent the interaction and effect of both represented factor. Hence, following up to the
equation, the positive sign in the equation represents the synergistic effect while the
negative sign represents antagonistic effect values. Fig. 4.15 shows theoretical values
versus the experimental values for Pb (II) removal. It was clearly shown that the theoretical
values obtained were quite close to experimental values, indicating that the model
developed was successful in bridging the correlation between process parameters for
removal of Pb (II).

129
Table 4.4: ANOVA for the selected quadratic model for removal of Pb (II).
Source Sum of
squares DF
Mean
square
F
Value
Prob >
F Status
Model 8227.21 14 587.658 19.6 < .0001 Significant
A 4.205 1 4.205 0.1 0.7151
B 12.66722 1 12.6672 0.4 0.5290
C 1.560556 1 1.56055 0.1 0.8237
D 18.605 1 18.605 0.6 0.4475
A2 823.0089 1 823.008 27.5 0.0003
B2 152.8938 1 152.893 5.1 0.0452
C2 122.8723 1 122.872 4.1 0.0679
D2 334.3833 1 334.383 11.2 0.0066
AB 3.705625 1 3.70562 0.1 0.7318
AC 4.305625 1 4.30562 0.1 0.7119
AD 35.10563 1 35.1056 1.2 0.3023
BC 88.83063 1 88.8306 3.0 0.1131
BD 43.23062 1 43.2306 1.4 0.2550
CD 43.23063 1 43.2306 1.4 0.2550
Residual 329.7571 11 29.9779
Lack of Fit 327.7571 10 32.775 16.4 0.190 Insignificant
Pure Error 2 1 2
Cor Total 8556.97 25

130
Figure 4.16: Relationship between Predicted values of removal of Pb (II).
Fig. 4.16 represents the 3-D plot for adsorption of Pb (II) prepared under optimized
conditions of CNTs production affected by pH, CNTs dosage and agitation speed. Fig.
4.16 (a) visualized the interaction plot between pH and agitation speed. From the
observation, the removal of Pb (II) reaches the maximum percentage when the interaction
of both pH and agitation speed engaged at the middle point, 5 and 160 rpm respectively. By
increasing and decreasing more values from the middle point for both parameters affected
in decreasing of Pb (II) adsorption. The pH value of the aqueous solution plays a major role
in the adsorption of heavy metals (Chen et al., 2007; Chen and Wang, 2006; Li, Ding, et al.,
2003; Moradi, 2011; Xu, et al., 2008). The lead sorption capacity increased with the
increase in pH and reached the maximum at pH around 5 and starts to decrease after that
due to the effect of precipitation of lead hydroxide as between pH 5.4-6, more than 98% of
Pb (II) species are Pb (II) (Machida, et al., 2004). Similar distribution of Pb (II) species in

131
aqueous solutions were also given by others (Abdel-Ghani et al., 2007; Faur-Brasquet et al.,
2002; Herrera-Urbina and Fuerstenau, 1995; Meena, et al., 2008) and while above pH 6, Pb
(II) starts precipitating as Pb (OH)2 (Wang, Zhou, Peng, Yu, & Yang, 2007; Wang, Gong,
et al., 2007) and hence studies in this range are not conducted. Regardless the precipitation
phenomena, the increase in pH means a decrease in the total number of H+ cations which
are in competition with Pb (II) cations to occupy the active sites on adsorbent. Moreover,
the high pH enhances the surface charge of the adsorbents (Li, Ding, et al., 2003; Wang,
Zhou, Peng, Yu, & Chen, 2007). Fig. 4.16 (b) represents the 3-D interaction plot between
pH and CNTs dosage. From the result, removal of Pb (II) obtained the highest value when
the interaction between both factors were at the pH 5 and 0.1 CNTs dosage before it
dropped linearly after the addition of both pH and dosage. The amount of Pb (II) adsorbed
by the adsorbent increases with the increase of the CNTs dosage. The increase in adsorbent
amount leads to increase in active sites concentration which helps in increasing the
adsorption of the heavy metals. This observation agrees with the previously published
works (Kabbashi, et al., 2009; Li, Wang, et al., 2002; Li, 2004). Furthermore, removal of
Pb (II) was also studied by the interaction of pH and time as shown in Fig. 4.16 (c).
Resulting of the same trend, removal of Pb (II) reached the highest adsorption at the time of
22.5 min with the pH of 5. Prolonged the time up to 40 min does not influence the removal
of solute Pb (II) removal from aqueous solution (Li, et al., 2005; Ruparelia, et al., 2008).

132
Figure 4.17: 3-D plots of removal of Pb (II) using optimized CNTs production, (a)
interaction of agitation speed and pH, (b) interaction of CNTs dosage and pH, and (c)
interaction of time and pH.

133
4.5.2 Adsorption isotherm of Pb (II)
Adsorption isotherm reflects the relationship between the amount of a solute adsorbed at
constant temperature and its concentration in the equilibrium solution. It provides essential
physciochemical data for assessing the applicability of the adsorption process as a
complete unit operation. The successful representation of the dynamic adaptive separation
of solute from solution onto an adsorbent depends upon a good description of the
equilibrium separation between the two phases (Pehlivan, et al., 2008; Rao et al., 2010;
Salmani et al., 2013). The relation between contact time (min) versus adsorption capacity
(qt) was plotted for different Pb (II) concentration as shown in Fig. 4.18. Adsorption of high
initial Pb (II) concentration results in an increase in the adsorption uptake due to increase in
mass transfer driving force leading to higher adsorption rate (Chen, et al., 2009; Chen and
Wang, 2006). More than 95% of maximum equilibrium uptake capacity was reached after
20 min and complete equilibrium was reached in the 20 to 40 min. No significant
additional adsorption was observed after 40 min of contact time. The contact time was thus
maintained for 40 min to ensure that the equilibrium could be achieved (Chen and Wang,
2006; Li, Wang, et al., 2003; Stafiej and Pyrzynska, 2007). It indicates that carbon obtained
has highly active sites with well developed pores, which is responsible for Pb (II)
adsorption. The equilibrium uptake concentration (qe) of Pb (II) on solid phase adsorbent
is directly proportional to Pb (II) connotation in the liquid phase as shown Fig 4.17 which
mainly attributed to unsaturation of the adsorption sites or layers through the adsorption
process. Such observation is usually reported by most of the researchers in the filed of
sorption processes (Kabbashi, 2011; Li, Ding, et al., 2003; Vilar et al., 2006; Vuković, et
al., 2010).

134
Figure 4.18: Adsorption capacity (qt) versus concentration (t) with different Pb (II) solution
concentration.
4.5.3 Adsorption kinetics of Pb (II)
Adsorption kinetics is a powerful isotherm to demonstrate the unique relationship between
carbonaceous adsorbents and the adsorbate. The interaction and affinity of equilibrium data
are important and necessary for realistic and useful design and basic knowledge of
adsorption system. The Langmuir isotherm, Freundlich isotherm and Temkin and Dubinin
isotherm for Pb (II) have been successfully illustrated in Fig. 4.18 (a-d). As for this research
study, four models were employed to determine the optimum model for the Pb (II)
adsorption onto the CNTs surface. The Langmuir model is able to relate the solid phase

135
adsorbate concentration, qe and the uptakes to the equilibrium liquid concentration, Ce as
shown in the equation (4.3):
(4.3)
where qe (mg/g) represents the amount of adsorbed Pb (II) concentration per unit weight
while the Ce (mg/L) represents an adsorbed Pb (II) concentration in solution at equilibrium.
The Langmuir constant which relates to the affinity of the binding sites in the above
equation is represented by KL (L/mg) while the maximum adsorption capacity of the
adsorbent is represented by qm. A graph of Ce / qe against Ce was plotted and the qm and KL
values were calculated from the slope and the intercept of the graph. The relationship
between Pb (II) uptake capacities (qe) in mg/g of adsorbent the residual Pb (II)
concentration Ce in mg/L at equilibrium is given by the following equation (4.4):
(4.4)
Where KF is a Freundlich constant that shows the adsorption capacity of the adsorbent and
n is a constant, which shows the greatness of the relationship between the adsorbate and
adsorbent. KF and n were determined from the slope and intercept of the linear plot of ln qe
versus ln Ce. The Temkin equation (M.J. Temkin and Pyzhev, 1940) proposes a linear
reduction in adsorption energy when the degree of completion of an adsorbent is raised. As
a relationship between adsorbent-adsorbate, when the coverage is increased, the energy
released by adsorption along the layer would decrease. The Temkin isotherm is introduced
as shown in equations (4.5 & 4.6):
=
(4.5)

136
= B ln A+ B ln (4.6)
where B=RT/b, R is the universal gas constant (8.314 J mol-1
K-1
), T defined as absolute
temperature (K), b is the Temkin constant related to the heat of adsorption (J mol-1
) and A
the Temkin isotherm constant (L g-1
). The constants A and B are calculated from the slope
and intercept of qe versus lnCe plot. Dubinin–Radushkevich isotherm is generally applied to
express the adsorption mechanism with a Gaussian energy distribution onto a
heterogeneous surface as shown in equitation (4.7). The model has often successfully fitted
high solute activities and the intermediate range of concentration data well (Dąbrowski,
2001; Günay et al., 2007).
(4.7)
Where K and are Dubinin –Radushkevich isotherm constant. The saturation adsorption
capacity qm and K were calculated from the intercept and slope of lnqe versus .

137
Figure 4.19: (a) Langmuir isotherm (b) Freundlich isotherm (c) Temkin isotherm, and (d)
Dubinin –Radushkevich isotherm plots for adsorption of Pb (II).

138
Their constants and correlation coefficient were tabulated in Table 4.5. The isotherm data
were collected through the measurements of Pb (II) metal ions after certain sorbent/
adsorbate contact intervals. The data collected throughout experiment were proving valid
for Langmuir and Freundlich isotherm R2= 0.97, and R
2= 0.99 respectively. However,
Temkin and dubinin-Radushkevich isotherms do not show a good representation. Hence,
high validity of Freundlich isotherm model proposes the adsorption process was taking
place at the heterogeneous and consistent and well distribution of active sites along the
CNTs surface. Review on Pb (II) removal using CNTs as shown in Table 4.6.
Table 4.5: Isotherm parameters for Pb (II) adsorption by CNTs.
Langmuir
Isotherm
Freundlich
Isotherm
Temkin Isotherm Dubinin-
Radushkevich
qm
(mg g-1
)
104.2 KF
(Lg-1
)
25.83 A
(Lg-1
)
3.47 qm 79.15
KL
(L mg-1
)
0.1 n 2.91 B
(kJmol-1
)
140.6
K x10-6
(mol2 kJ
-2
6.58
R2 0.97 R
2 0.99 R
2 0.92 E (kJ mol
-1) 0.27
R2 0.87

139
Table: 4.6 Summary of removal of Pb (II)
Adsorbent qm
(mg/g)
KL
(L/mg)
R2 Kf
(L/g)
n R2 References
MWCNTs 104.2 0.1 0.97 25.83 2.91 0.99 This study
CNTs 11.23 0.04 0.993 0.68 1.52 0.97 (Hsieh and
Horng, 2007)
CNT/Al203 67.11 0.04 0.989 3.22 1.39 0.979
CNT/MnO2 82.6 1.65 0.998 43.43 3.9 0.867 (Wang, Gong, et
al., 2007)
CNTs 17.44 0.586 0.995 5.99 1.91 0.987 (Li, Wang, et al.,
2002)
MWCNT
Oxidized
49.71 1.73 0.996 3.29 5.01 0.855 (Wang, Zhou,
Peng, Yu, &
Chen, 2007)
CNTs 62.5 0.11 0.964 - - - (Hsieh, et al.,
2006)
MWCNTs 6.71 3.71 0.96 4.76 7 0.98 (Tehrani, 2014)
MWCNTs
oxidized
27.8 1.33 0.93 12.8 3.42 0.899
MWCNT-
TAA
71 0.13 0.945 8.34 1.43 0.99
MWCNT
oxidized
9.92 1.78 0.97 7.57 0.518 0.99 (Xu, et al., 2008)
CNTs
oxidized
28 - - 15.56 4.48 0.965 (Li, et al., 2005)
CNTs
oxidized
97.08 1.51 0.987 - - - (Li, Ding, et al.,
2003)
CNTs
oxidized
63.29 2.47 0.987 - - - (Li, 2004)
CNTs
oxidized
117.64 0.0038 0.933 5.4938 0.407 0.98 (Tofighy and
Mohammadi,
2011)
SWCNT 29.851 0.691 0.99 20.61 9.91 0.99 (Moradi, 2011)
SWCNT-
COOH
90.23 1.1 0.99 52.25 3.88 0.99
CNTs-soaked
in HNO3
2.69 - - 0.175 0.944 0.99 (Stafiej and
Pyrzynska, 2007)
CNT refluxed
in HNO3
3.49 - - 0.183 0.944 0.99

140
In order to investigate the mechanism of Pb (II) adsorption on the CNTs surface and
examine the potential rate-controlling step, the capability of pseudo-first order (Langergren,
1898) pseudo second order (Ho, 2006b; Ho and McKay, 1999b) kinetic models was
examined in this study. The conformity between experimental data and the model predicted
values was expressed by the correlation coefficients (R2 values close or equal 1). A
relatively high R2 values indicate that the model successfully describes the kinetics of Pb
(II) adsorption. Fig. 4.19 (a) shows the plot ln (qe-qt) against time representing the linear
form of pseudo-first order kinetic model. The rate constant K1 was calculated from the
slope of straight line obtained. K2 is the rate constant of pseudo second order adsorption
kinetics (min.g/mg) was calculated from the intercept and slope of the straight line of t/qt
against time as shown in Fig. 4.20 (b). From the observation, the kinetics of adsorption of
Pb (II) ions adsorption on CNTs followed the pseudo second order with more conformity
comparing pseudo first order as shown in Table 4.7. The pseudo second order rate has been
applied widely to the sorption of metal ions, herbicides, oil and organic substances from
aqueous systems (Ho, 2006b; Ho and McKay, 1999b).

141
Table 4.7: Experimental values of constants of adsorption kinetics model.
C0
(mgL-1
)
qe,exp.
(mg g-1
)
Pseudo-First order Pseudo-Second order
qe, cal
(mg g-1
)
K1
(min-1
) R
2
qe,cal.
(mg g-1
)
K2
(min.g mg-1
) R
2
10 23 1.83 0.0111 0.12 24.5 0.080 0.999
20 42 3.29 0.0164 0.13 43.7 0.019 0.999
30 55.01 9.80 0.0406 0.48 57.04 0.0051 0.997
40 61.04 11.21 0.0275 0.46 62.69 0.0047 0.997
50 70.05 8.88 0.0390 0.36 72.8 0.0038 0.996
60 78.59 12.51 0.0404 0.53 81.43 0.0039 0.997
70 89.99 14.71 0.3326 0.49 93.37 0.0029 0.997
80 98.7 11.06 0.0457 0.39 101.18 0.0036 0.998

142
Figure 4.20: (a) Pseudo-first order kinetics (b) Pseudo second order kinetics for adsorption
of Pb (II).

143
4.5.4 Thermodynamic study of Pb (II)
Generally, thermodynamic parameters are able to provide more information regarding the
energetic change involved during the adsorption process. The adsorption isotherm of Pb (II)
onto CNTs was measured at 293, 303, 308 and 323 K and the change in the thermodynamic
parameters of the free energy of sorption (∆G◦), enthalpy (∆H
◦), and entropy (∆S
◦) were
calculated using equations (4.9 & 4.8) from the variation of the thermodynamic
equilibrium constant, K with a change in temperature. Free energy change (∆G) can be
calculated using equation (4.8), where R is the universal gas constant while T is the
temperature in kelvin. Where K is the equilibrium constant and qe and Ce are the amount of
Pb (II) adsorbed per unit mass of CNTs and the equilibrium concentration of Pb (II) in the
solution respectively. The enthalpy change value was obtained from the intercept of the
∆G◦ versus T plot. The values of the thermodynamic parameters obtained are shown in
Table 4.8.
,
(4.8)
(
) (
) (4.9)
The negative ∆G◦ value for the adsorption of Pb (II) on the CNTs surface at all
temperatures proves that the sorption was spontaneous and thermodynamically favorable.
In the same vein, the entropy change value, ∆S suggest that the randomness of the process
at the solid-solution interface, increased when the Pb (II) ions attached to the active sites of
adsorbent. The positive value of the enthalpy change value, ∆H proves that this adsorption
experiment was an endothermic process (Li, Ding, et al., 2003; Pehlivan, et al., 2008).

144
Table 4.8: Thermodynamic parameters for Pb (II) adsorption.
Co
Initial Conc
(mgL-1
)
∆H◦
(kJ mol-1
)
∆S◦
kJ mol-1
K-1
∆G◦ (kJmol
-1)
293
K
303
K
308
K
323
K
10 8.04 27.96 -8185 -8465 -8604 -9024
20 4.2 21.4 -6266 -6480 -6587 -6908
30 210.2 16.67 -4705 -4785 -4946 -5186
40 0.016 11.09 -3252 -3363 -3418 -3585
4.5.5 FTIR analysis of Pb (II) adsorption
The surface chemistry in terms of functional group which is adhered to the surface of CNTs
during the adsorption of Pb (II) on the CNTs surface can be classified by employing
Fourier Transform Infrared (FTIR) spectroscopy (Bruker, IFS66v/S). As for this research,
FTIR was engaged as well to determine the functional groups attached on the surface of
CNTs before and after adsorption of Pb (II). Fig 4.20 (a-b) shows the FTIR profile for
adsorption of Pb (II) onto the CNTs surface before and after adsorption of Pb (II)
respectively. Fig. 4.20 (a) demonstrates that there were few functional groups attached on
the CNTs surface before the adsorption of Pb (II) while there were more peaks observed for
after adsorption of Pb (II) on the CNTs as can be seen in Fig. 4.20 (b). The intensity of the
band in the 3859-2519 cm-1
region contains –OH groups. The width and asymmetry of this
band indicate the presence of strong hydrogen bonds. These hydrogen bonds could be a
result of strongly adsorbed water on hydrophilic functional groups of the CNTs surfaces;
The bands at 1965 and 1746 and from 2250-2400 cm-1
show carbonyl group (Li, et al.,
2005; Li, Wang, et al., 2002), the bands at 996 cm-1
contains saturated carbon (methyl
group –CH3) which might be from the cracking of acetylene (Wang et al., 2004).

145
Absorption peaks at 766 and 702 cm-1
represent NO2 bending vibrations (Mubarak, et al.,
2014; Mubarak, et al., 2011).
Figure 4.21: FTIR analysis of (a) CNTs before and (b) CNTs after adsorption of Pb (II).
4.6 Statistical optimization of removal of Cd (II) using CNTs
In order to determine the most suitable adsorbent with the highest adsorption capacity of Cd
(II) from aqueous solutions, the first crucial step would be to determine the optimized
condition of CNTs as a the adsorbent for removal of Cd (II). Specific runs for the
optimized condition were conducted based on the design obtained from the DOE . The
detail experimental array of adsorption rate of removal of Cd (II) as shown in appendix C.
The results obtained from this particular experiment were analyzed using the application of
―analysis of variance‖ (ANOVA) obtained from the DOE and the optimized variables are
attainable from Table 3.3. The analyses obtained by the application of ANOVA for the

146
removal of Cd (II) using CNTs are indicated in Table 4.9. From the values obtained in
Tables 4.9, the fisher F-test value can be related to the mean square of the regressed model
which leads to the comparative mean square of the residuals (errors). The F value proves
the efficiency of the model as its value increases. On the other hand, low probability, P
value indicates higher significance of the regression model. Hence, from Tables 4.9, it can
be seen that the F-test values using CNTs were 19, which indicates that the model are
significant. Besides that, the values of the correlation coefficient, R-Squared and Adj R-
Squared for CNTs were 0.96 and 0.90 respectively. This value implies that the model of the
adsorbent is very close to each other, which indicates the high efficiency and significance
of the model. The model equation evolved for the removal of Cd (II) from aqueous
solutions for CNTs (3) are as follows:
Cd (II) Removal (%) = 96.50+0.61 * A-1.52 * B-0.26 * C+1.76 * D-10.19 * A2-12.34 *
B2-6.34 * C2-8.84* D2-1.23 * A * B+2.86 * A * C+0.27 * A * D-0.27 * B * C+1.89 * B
* D+1.23 * C * D (4.10)
Consequently, variables A, B, C, D, AB, AC, AD, BC, BD, and CD were significant model
terms. This indicates that the pH (A), agitation speed (B), MWCNTs dosage (C) and time
(D) were highly significant values of Probe >F was 0.001. The coefficient of single factor
represents the effect of its represented factor while the coefficients of double factors
represent the interaction and effect of both represented factor. Hence, following up to the
equation, the positive sign in the equation represents the synergistic effect while the
negative sign represents antagonistic effect values. Fig. 4.21 shows theoretical values
versus the experimental values for Cd (II) removal. It was clearly shown that the theoretical
values obtained were quite close to experimental values, indicating that the model
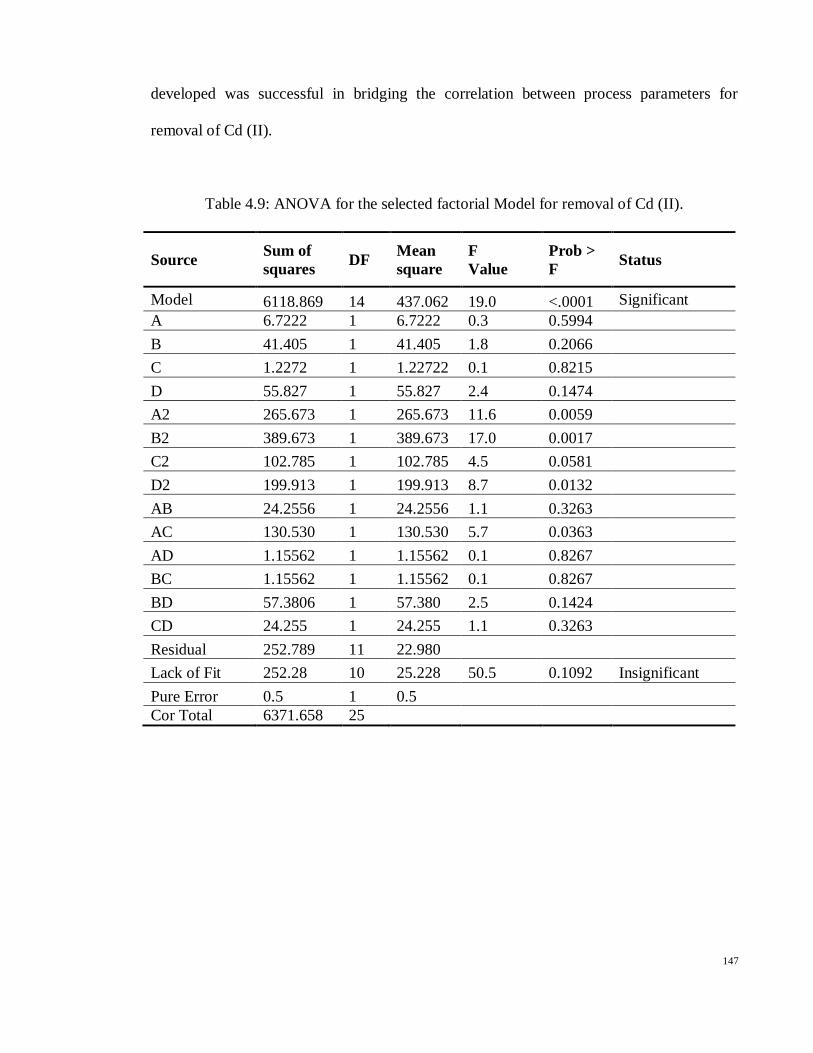
147
developed was successful in bridging the correlation between process parameters for
removal of Cd (II).
Table 4.9: ANOVA for the selected factorial Model for removal of Cd (II).
Source Sum of
squares DF
Mean
square
F
Value
Prob >
F Status
Model 6118.869 14 437.062 19.0 <.0001 Significant
A 6.7222 1 6.7222 0.3 0.5994
B 41.405 1 41.405 1.8 0.2066
C 1.2272 1 1.22722 0.1 0.8215
D 55.827 1 55.827 2.4 0.1474
A2 265.673 1 265.673 11.6 0.0059
B2 389.673 1 389.673 17.0 0.0017
C2 102.785 1 102.785 4.5 0.0581
D2 199.913 1 199.913 8.7 0.0132
AB 24.2556 1 24.2556 1.1 0.3263
AC 130.530 1 130.530 5.7 0.0363
AD 1.15562 1 1.15562 0.1 0.8267
BC 1.15562 1 1.15562 0.1 0.8267
BD 57.3806 1 57.380 2.5 0.1424
CD 24.255 1 24.255 1.1 0.3263
Residual 252.789 11 22.980
Lack of Fit 252.28 10 25.228 50.5 0.1092 Insignificant
Pure Error 0.5 1 0.5
Cor Total 6371.658 25
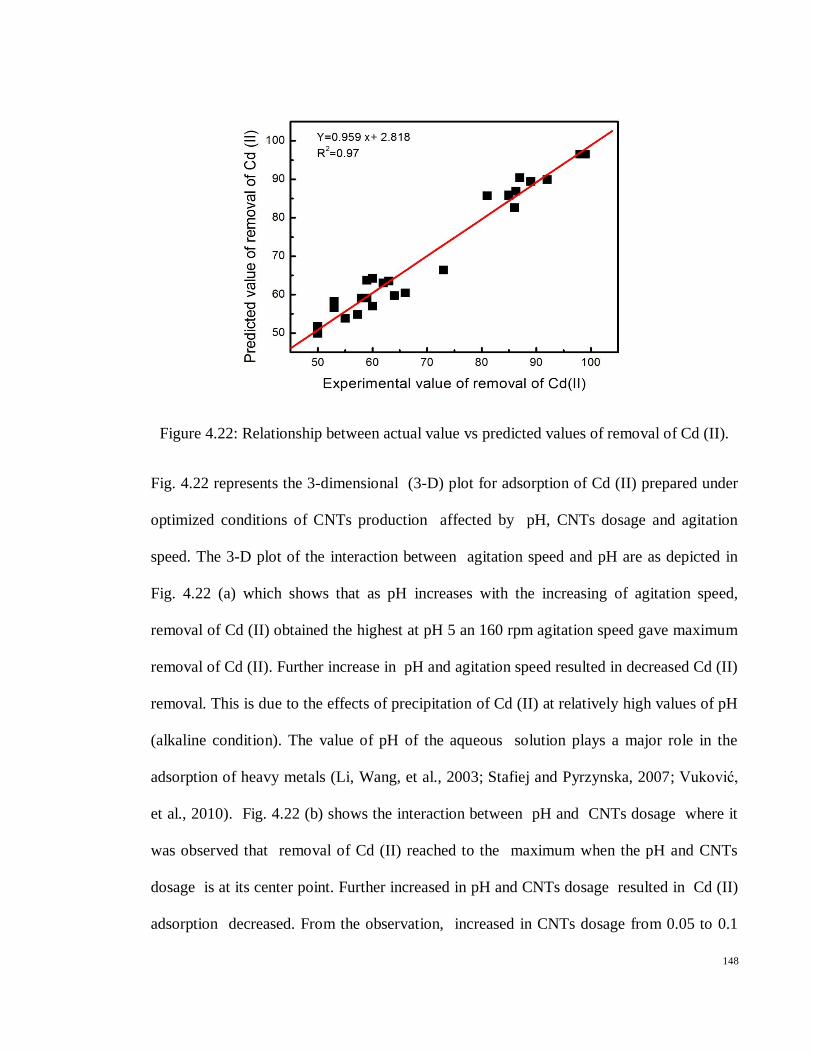
148
Figure 4.22: Relationship between actual value vs predicted values of removal of Cd (II).
Fig. 4.22 represents the 3-dimensional (3-D) plot for adsorption of Cd (II) prepared under
optimized conditions of CNTs production affected by pH, CNTs dosage and agitation
speed. The 3-D plot of the interaction between agitation speed and pH are as depicted in
Fig. 4.22 (a) which shows that as pH increases with the increasing of agitation speed,
removal of Cd (II) obtained the highest at pH 5 an 160 rpm agitation speed gave maximum
removal of Cd (II). Further increase in pH and agitation speed resulted in decreased Cd (II)
removal. This is due to the effects of precipitation of Cd (II) at relatively high values of pH
(alkaline condition). The value of pH of the aqueous solution plays a major role in the
adsorption of heavy metals (Li, Wang, et al., 2003; Stafiej and Pyrzynska, 2007; Vuković,
et al., 2010). Fig. 4.22 (b) shows the interaction between pH and CNTs dosage where it
was observed that removal of Cd (II) reached to the maximum when the pH and CNTs
dosage is at its center point. Further increased in pH and CNTs dosage resulted in Cd (II)
adsorption decreased. From the observation, increased in CNTs dosage from 0.05 to 0.1

149
increase the removal of cd linearly. Furthermore, the increase in the adsorbed amount
leads to increase in active sites concentration which helps in adjusting the adsorption
solution electrostatic charge to an adsorption preferable level by removing the competitive
H+
ions (Hsieh, et al., 2006; Li, Wang, et al., 2003). On the other hand, the adsorption
capacity is highly dependent on the pH where H2O2 oxidizes the CNTs to reach an
equilibrium state with a high adsorption capacity at lower pH (Li, Wang, et al., 2003). Fig.
4.22 (c) shows the interaction between time and pH. The elliptical plot indicated that
there is good interaction between time and pH. The mid- point interaction for a time and
pH shows the highest removal of Cd (II) obtained. Further increase in time 35 to 60
minutes and pH 5 to 6 resulted in decreased of Cd (II) removal (Gao, et al., 2009).

150
Figure 4.23: 3-D plots of removal of Cd (II) using optimized CNTs production, (a)
interaction of agitation speed and pH, (b) interaction of CNTs dosage and pH, and (c)
interaction of time and pH.

151
4.6.1 Adsorption isotherm of Cd (II)
Adsorption is the accumulation of mass transfer process that can generally be defined as
material at the interface between solid and liquid phases. Equilibrium relationships
between sorbent and sorbate are described by sorption isotherms, usually the relation
between the quality sorbed and that remaining in the solution at a fixed temperature at
equilibrium. Adsorption isotherms provide useful information for estimating performance
in full scale stream (Pehlivan, et al., 2008; Rao, et al., 2010; Salmani, et al., 2013). The
relation between contact time (min) versus adsorption capacity (qt) was plotted for different
Cd (II) concentration as shown in Fig. 4.23. Adsorption of high initial Cd (II)
concentration results in an increase in the adsorption uptake due to increase in mass transfer
driving force leading to higher adsorption rate (Chen, et al., 2009; Chen and Wang, 2006).
More than 90% of maximum equilibrium uptake capacity was reached after 50 min and
complete equilibrium was reached in the 50 min to 120 min. No significant additional
adsorption was observed after 120 min of contact time. The contact time was thus
maintained for 120 min to ensure that the equilibrium could be achieved (Chen and Wang,
2006; Li, Wang, et al., 2003; Stafiej and Pyrzynska, 2007). It indicates that carbon obtained
has highly active sites with well developed pores, which is responsible for Cd (II)
adsorption. The equilibrium uptake concentration (qe) of Cd (II) on solid phase adsorbent is
directly proportional to Cd (II) connotation in the liquid phase as shown Fig. 4.23 which
mainly attributed to unsaturation of the adsorption sites or layers through the adsorption
process. Such observation is usually reported by most of the researchers in the filed of
sorption processes (Kabbashi, 2011; Li, Ding, et al., 2003; Vilar, et al., 2006; Vuković, et
al., 2010).

152
Figure 4.24: Adsorption capacity (qt) versus contact time (t) with different Cd (II) solution
concentration.
4.6.1 Adsorption kinetics of Cd (II)
Adsorption isotherm is a powerful isotherm to demonstrate the unique relationship between
carbonaceous adsorbents and the adsorbate. The interaction and affinity of equilibrium data
are important and necessary for realistic and useful design and basic knowledge of
adsorption system. The Langmuir isotherm (equation 4.3), Freundlich isotherm (equation
4.4) and Temkin (equation 4.5 and 4.6) and Dubinin isotherm (equation 4.7) for Cd (II)
have been successfully illustrated in Fig. 4.24 (a-d). As for this research study, four models
were employed to determine the optimum model for the Cd (II) adsorption onto the CNTs
surface.

153
. Their constants and correlation coefficient were tabulated in Table 4.10. The isotherm
data were collected through the measurements of Cd (II) metal ions after certain Sorbent/
adsorbate contact intervals. The data collected throughout the experiment were proving
valid for Langmuir and Freundlich isotherm R2= 0.97, and R
2= 0.98 respectively. However,
Temkin and dubinin-Radushkevich isotherms do not show a good representation. Hence,
high validity of Freundlich isotherm model proposes the adsorption process was taking
place at the heterogeneous and consistent and well distribution of active sites along the
CNTs surface. Review on Cd (II) removal using CNTs as shown in Table 4.11.
Table 4.10: Isotherm parameters for Cd (II) adsorption by CNTs
Langmuir
Isotherm
Freundlich
Isotherm
Temkin Isotherm Dubinin-
Radushkevich
qm
(mg g-1
)
88.62 KF
(Lg-1
)
24.75 A
(Lg-1
)
4.76 qm 66.56
KL
(L mg-1
)
0.135 n 3.5 B
(kJmol-1
)
181.18
K x10-6
(mol2 kJ
-2
5.62
R2 0.97 R
2 0.98 R
2 0.87 E (kJ mol
-1) 0.3
R2 0.81

154
Table 4.11: Review on Cd (II) removal using CNTs.
Adsorbent
qm
(mg/g)
KL
(L/mg)
R2 Kf
(L/mg)
n R2 References
MWCNTs 88.62 0.135 0.97 24.75 3.5 0.98 This study
CNTs/Al2O3 8.89 0.13 0.956 1.17 1.55 0.926 (Hsieh and
Horng,
2007) CNTs 6.19 0.18 0.997 1.94 1.94 0.964
CNTs 9.41 0.37 0.957 - - - (Hsieh, et al.,
2006)
Oxidized
CNTs
10.86 0.29 0.993 - - - (Li, Ding, et
al., 2003)
Oxidized
CNTs
92.59 0.0029 0.906 4.119 0.401 0.95 (Tofighy and
Mohammadi,
2011)
CNTs 34.34 -1.852 0.968 1.896 -0.208 0.968 (Kabbashi,
2011)
Raw-CNTs 1.26 0.135 0.996 0.0027 0.524 0.969 (Vuković, et
al., 2010) Oxidized
CNTs
22.39 0.0317 0.996 0.127 0.601 0.97
Oxidized
CNTs
26 1.18 0.99 -- - - (Gao, et al.,
2009)
CNTs
oxidized
11.01 0.28 0.9926 - - - (Li, 2004)
SWCNTs 18.86 0.544 0.99 13.13 11.07 0.99 (Moradi,
2011)
SWCNTs-
COOH
52.356 1.002 0.999 37.856 10.593 0.983

155
Figure 4.25: (a) Langmuir isotherm (b) Freundlich isotherm (c) Temkin isotherm, and (d)
Dubinin –Radushkevich isotherm plots for adsorption of Cd (II).

156
Adsorption kinetics have been proposed to elucidate the adsorption mechanism. The
mechanism of adsorption depends on the physical and chemical characteristic of the
adsorbent as well as on the mass transfer process. In order to investigate the mechanism of
adsorption of Cd (II) on CNTs and examine the potential rate, the capability of pseudo-first
order (Langergren, 1898) pseudo second order (Ho, 2006b; Ho and McKay, 1999b).
Kinetic models were examined in this study. The conformity between experimental data
and the model predicted values was expressed by the correlation coefficients (R2 values
close or equal 1). A relatively high R2 values indicate that the model successfully describes
the kinetics of Cd (II) adsorption. Fig 4.25 (a) shows the plot ln (qe-qt) against time
representing the linear form of pseudo-first order kinetic model. The rate constant K1 was
calculated from the slope of straight line obtained. K2 is the rate constant of pseudo second
order adsorption kinetics (min.g/mg) was calculated from the intercept and slope of the
straight line of t/qt against time as shown in Fig 4.25 (b). From the observation, the kinetics
of adsorption of Cd (II) ions adsorption on CNTs followed the pseudo second order with
more conformity comparing pseudo first order as shown in Table 4.12. The pseudo second
order rate has been applied widely to the sorption of metal ions, herbicides, oil and organic
substances from aqueous systems (Ho, 2006b; Ho and McKay, 1999b).

157
Table 4.12: Experimental values of constants of adsorption kinetics model.
C0
mgL-1
qe,exp.
(mg g-1
)
Pseudo-First order Pseudo-Second order
qe, cal
(mg g-1
)
K1
(min-1
) R
2
qe,cal.
(mg g-1
)
K2
(min.g mg-1
) R
2
10 22.99 4.11 0.0279 0.49 23.22 0.029 0.999
20 40.89 23.0 0.0536 0.59 43.63 0.003 0.994
30 44.9 11.54 0.0356 0.60 46.01 0.0081 0.999
40 54.9 21.30 0.0337 0.76 56.75 0.0041 0.998
50 59.87 16.66 0.0413 0.48 64.10 0.0024 0.995
60 69.01 25.0 0.0401 0.71 71.99 0.0031 0.997
70 79 33.3 0.0484 0.60 83.12 0.0025 0.997
80 82.9 33.51 0.0421 0.75 86.28 0.0026 0.998

158
Figure 4.26: (a) pseudo-first order kinetics (b) pseudo second order kinetic for adsorption of
Cd (II).

159
4.6.2 Thermodynamic study of Cd (II)
The evaluation of thermodynamic parameters provides in detail intuition into the
mechanism of Cd (II) adsorption process. The adsorption isotherm of Cd (II) onto CNTs
was measured at 293, 303, 308 and 323 K and the change in the thermodynamic parameters
of the free energy of sorption (∆G◦), enthalpy (∆H
◦), and entropy (∆S
◦) were calculated
using equations (4.8 & 4.9) from the variation of the thermodynamic equilibrium constant,
K with a change in temperature. Free energy change (∆G◦) can be calculated using equation
(4.8) below, where R is the universal gas constant while T is the temperature in Kelvin.
Where K is the equilibrium constant and qe and Ce are the amount of Cd (II) adsorbed per
unit mass of CNTs and the equilibrium concentration of Cd (II) in the solution respectively.
The enthalpy change value was obtained from the intercept of the ∆G◦ versus T plot. The
values of the thermodynamic parameters obtained are shown in Table 4.13.
The negative ∆G◦ value for the adsorption of Cd (II) on the CNTs surface at all
temperatures proves that the sorption was spontaneous and thermodynamically favorable.
In the same vein, the entropy change value, ∆S◦ suggest that the randomness of the process
at the solid-solution interface, increased when the Cd (II) ions attached to the active sites of
adsorbent. The negative value of the enthalpy change value, ∆H proves that this adsorption
experiment was an exothermic process (Li, Ding, et al., 2003; Pehlivan, et al., 2008).

160
Table 4.13: Thermodynamic parameters for Cd (II) adsorption.
Co
Initial Conc
(mgL-1
)
∆H◦
(kJ mol-1
)
∆S◦
kJ mol-1
K-1
∆G◦ (kJmol
-1)
293
K
303
K
308
K
323
K
10 -1.264 27.87 -8168 -8446 -8586 -9004
20 -0.584 20.1 -5859 -6090 -6191 -6192
30 -154.74 10.46 -3200 -3364 -3364 -3527
40 -1.44 9.23 -2708 -2800 -2847 -2985
4.6.3 FTIR analysis of Cd (II) adsorption
Adsorption behavior of any adsorbent is influenced by the chemical reactivity of the
surface, especially when the chemically bonded oxygen exists on it in various forms of
functional groups (Kandah and Meunier, 2007; Yang, et al., 2009). FTIR was engaged as
well to determine the functional groups attached on the before and after adsorption of Cd
(II) Fig. 4.26 (a-b) demonstrate the plot for CNTs before and after adsorption of Cd (II).
Fig 4.26 (a) The peaks observed on before CNTs adsorption at a range of 1700 to 1900 cm-
1 defines the carboxylic group, followed by aromatic C=C groups at 1450-1600 cm
-1 and O-
H groups at 2800-3000 cm- 1
as well. Fig. 4.26 (b) shows after adsorption of Cd (II), it was
observed several peaks were observed. The C= O and C–O are stretching frequencies
shifted from 1705 and 1200 cm−1
. Peaks at 1600 cm−1
of amino-functionalized MWCNTs
are due to the N–H stretching of amine groups. Peaks at 2930 and 2860 cm−1
are greatly
enhanced because of the attachment of additional methyl groups. Peaks between 950 and
700 cm−1
are due to the stretching mode of aromatic amine groups, and peaks at 2370 cm−1
may be because of the existence of ammonium ions (Kuan et al., 2005; Peng et al., 2003;
Stevens et al., 2003). The hydrophilic surface structure provides the functionalized CNTs
an advantage of high dispersion in water, which eventually leads to a higher adsorption

161
capacity of Cd (II) ions from aqueous solution compared with before the adsorption of
CNTs. This finding corresponds to many results reported by several previous researchers
who studied on the surface chemistry of CNTs (Kuan, et al., 2005; Peng, et al., 2003;
Smith, 1998; Stevens, et al., 2003; Zhang et al., 2010).
Figure 4.27: FTIR adsorption spectra for (a) CNTs before (b) CNTs after adsorption of Cd
(II)
4.7 Statistical optimization of removal of Cu (II) using CNTs
The first crucial step in determining the most suitable adsorbent with the highest adsorption
capacity of Cu (II) from aqueous solutions would be to find out the optimized condition of
CNTs as a the adsorbent for removal of Cu (II). DOE is used to obtain the specific runs for
the optimized condition. The detail experimental array of adsorption rate of removal of Cu

162
(II) as shown in appendix D. The results obtained from this particular experiment were
analyzed using the application of ―analysis of variance‖ (ANOVA) obtained from the DOE
and the optimized variables are attainable from Table 3.4. The analyses obtained by the
application of ANOVA for the removal of Cu (II) using CNTs are indicated in Table 4.14.
From the values obtained in Tables 4.14, the fisher F-test value can be related to the mean
square of the regressed model which leads to the comparative mean square of the residuals
(errors). The F value proves the efficiency of the model as its value increases. On the other
hand, low probability, P value indicates higher significance of the regression model. Hence,
from Tables 4.14, it can be seen that the F-test values using CNTs were 9.96, which
indicates that the model are significant. Besides that, the values of the correlation
coefficient, R-Squared and Adj R-Squared for CNTs were 0.95 and 0.91 respectively. This
value implies that the model of the adsorbent is very close to each other, which indicates
the high efficiency and significance of the model. The model equation evolved for the
removal of Cu (II) from aqueous solutions for CNTs (4.11) are as follows:
Removal of Cu (II) = 95.30+8.31 * A+1.25 * B+1.08 * C+1.68 * D-25.17 * A2-10.67 *
B2-9.12 * C2 -12.82 * D2+1.53 * A * B-1.3* A * C+2.22 * A * D+1.66 * B * C-
0.28*B*D+0.094*C*D (4.11)
Consequently, variables A, B, C, D, AB, AC, AD, BC, BD and CD were significant model
terms. This indicates that the pH (A), agitation speed (B), MWCNTs dosage (C) and time
(D) were highly significant values of Probe >F was 0.003. The coefficient of single factor
represents the effect of its represented factor while the coefficients of double factors
represent the interaction and effect of both represented factor. Hence, following up to the
equation, the positive sign in the equation represents the synergistic effect while the
negative sign represents antagonistic effect values. Fig. 4.27 shows theoretical values

163
versus the experimental values for Cu (II) removal. It was clearly shown that the theoretical
values obtained were quite close to experimental values, indicating that the model
developed was successful in bridging the correlation between process parameters for
removal of Cu (II).
Figure 4.28: Relationship between actual value and predicted values of removal of Cu (II).

164
Table 4.14: ANOVA for the selected quadratic Model for removal of Cu (II).
Fig. 4.28 represents the 3-dimensional plot for adsorption of Cu (II) prepared under
optimized conditions of CNTs production affected by pH, MWCNTs dosage and agitation
speed. Fig. 4.28 (a) shows the 3-D interaction plot of pH and agitation speed. The
interaction of both factors curved a nice elliptical graph where it gives the highest
percentage of Cu adsorption at pH 5.5 and agitation speed of 160 rpm. The pH value of the
aqueous solution plays a major role in the adsorption of heavy metals (Chen, et al., 2007;
Source
Sum of
squares DF
Mean
square
F
Value
Prob >
F Status
Model 15339.36 14 1095.66 9.66 0.0003 Significant
A 1241.681 1 1241.68 10.94 0.0070
B 28.125 1 28.125 0.25 0.6284
C 20.90889 1 20.9088 0.18 0.6760
D 50.66889 1 50.6688 0.45 0.5177
A2 1622.759 1 1622.75 14.30 0.0030
B2 291.6944 1 291.694 2.57 0.1372
C2 213.1188 1 213.118 1.88 0.1978
D2 421.0588 1 421.058 3.71 0.0803
AB 37.51563 1 37.5156 0.33 0.5768
AC 28.89063 1 28.8906 0.25 0.6238
AD 78.76563 1 78.7656 0.69 0.4225
BC 43.89063 1 43.8906 0.39 0.5466
BD 1.265625 1 1.26562 0.01 0.9178
CD 0.140625 1 0.14062 0.001 0.9725
Residual 1248.069 11 113.460
Lack of Fit 1247.889 10 124.788 693.27 0.1295 Insignificant
Pure Error 0.18 1 0.18 0.0003
Cor Total 16587.43 25 0.0070

165
Chen and Wang, 2006; Li, Ding, et al., 2003; Moradi, 2011; Xu, et al., 2008). On the other
hand, the minimum adsorption of Cu (II) was observed at low pH of 2 this is due to the fact
that the presence of higher concentration and higher mobility of H+ ions favoured its
adsorption compared to Cu (II) ions and furthermore, due to the high solubility and
ionization of Cu (II) salt in the acidic medium (Li, Ding, et al., 2003; Li, 2004). It would be
plausible to suggest that at lower pH value, the surface of the adsorbent is surrounded by
H+, thereby preventing the metal ions from approaching the binding sites of the CNTs. This
means that at the higher H+
concentration, the CNTs surface becomes more positively
charged such that attraction between adsorbents and metal cations is reduced (Li et al.,
2007; Tumin et al., 2008; Wu, 2007). In contrast, with an increase in pH, more negative
sites offered by these functional groups are becoming available for the adsorption of Cu
(II), thus the Cu (II) removal efficiency increases quickly at high pH (Li, et al., 2010). This
is due to the fact, sorption of metal cations increased with increasing pH as the metal ionic
species become less stable in the solution and thus facilitating greater Cu (II) removal (Li,
Luan, et al., 2003b). The maximum adsorption observed at pH 5 it is due to partial
hydrolysis of Cu (II) ions, resulting in the formation of Cu (OH+) ions and Cu (OH) 2,
which would be adsorbed to a greater extent on a less-polar carbon surface of the
adsorbents compares to Cu (II) ions. Furthermore the low solubility of hydrolyzed Cu (II)
species may be another reason for a maximum adsorption at pH5 (Gabaldon et al., 2000;
Ngah and Fatinathan, 2008). It is known that a precipitate of copper hydroxide will be
produced within the higher pH region (at pH> 5.8) (Corapcioglu and Huang, 1987). In
order to eliminate the precipitation effect on the Cu (II) adsorption by the adsorbents,
adsorption isotherm experiments were carried out at the optimum pH of 5 (Corapcioglu and
Huang, 1987). Fig. 4.28 (b) shows a linear increment of Cu (II) removal when the pH start

166
to increase from 2 to 4 before it reached the maximum adsorption at about pH 5.5 when
interacted with CNTs dosage of 0.1. Further increased in pH and CNTs dosage resulted in
Cu (II) adsorption decreased. From the observation, increased in CNTs dosage from 0.05
to 0.1 increase the removal of Cu (II) linearly. Furthermore, the increase in the adsorbent
amount leads to increase in active sites concentration which helps in adjusting the
adsorption solution electrostatic charge to an adsorption preferable level by removing the
competitive H+
ions (Hsieh, et al., 2006; Li, Wang, et al., 2003). On the other hand, the
adsorption capacity is highly dependent on the pH where H2O2 oxidizes the CNTs to reach
an equilibrium state with a high adsorption capacity at lower pH (Li, Wang, et al., 2003).
Fig. 4.28 (c) shows the interaction of pH and time for the removal of Cu (II). It was
observed that the Cu (II) was removed more than 95% at the time of 35 minutes. Further
increase in time 35 to 60 minutes and pH 5.5 to 6 resulted in decreased of Cu (II) removal
(Gao, et al., 2009; Li, et al., 2005; Li, Luan, et al., 2003b; Mubarak et al., 2012).

167
Figure 4.29:3-D plots of removal of Cu (II) using optimized CNTs production, (a)
interaction of agitation speed and pH, (b) interaction of CNTs dosage and pH, and (c)
interaction of time and pH.

168
4.7.1 Adsorption isotherm of Cu (II)
The correlation between the amount of a solute adsorbed at constant temperature and its
concentration in the equilibrium solution is reflected by adsorption isotherm. It gives
important physciochemical data to measure the applicability of the adsorption process as a
complete unit operation. The successful representation of the dynamic adaptive separation
of solute from solution onto an adsorbent depends upon a good description of the
equilibrium spearation between the thow phase (Pehlivan, et al., 2008; Rao, et al., 2010;
Salmani, et al., 2013). The relation between contact time (min) versus adsorption capacity
(qt) was plotted for different Cu (II) concentration as shown in Fig. 4.29. Adsorption of
high initial Cu (II) concentration results in an increase in the adsorption uptake due to
increase in mass transfer driving force leading to higher adsorption rate (Chen, et al., 2009;
Chen and Wang, 2006). It was observed that adsorption of Cu (II) by CNTs was rapid
during first 35 min. Beyond the 35 min, the rate of adsorption was observed to decline
with increment in time, till equilibrium concentration was reached. This rapid adsorption
at the initial time was expected, as the amount of Cu (II) ions present in solution and
available sites on the adsorbent were still high, resulting in high adsorption sites on the
adsorbents reduced, which resulted in a reduction in the rate of adsorption Cu (II) till
equilibrium conentations were noticed. Furthermore, at the lower concentration, it becomes
more difficult for less-polar adsorbents to adsorb Cu (II) from a more polar solvent (Stafiej
and Pyrzynska, 2007; Wu, 2007; Yang, et al., 2009). More than 90% of maximum
equilibrium uptake capacity was reached after 35 min and complete equilibrium was
reached in the 35 min to 120 min. No significant additional adsorption was observed after
120 min of contact time. The contact time was thus maintained for 120 min to ensure that

169
the equilibrium could be achieved (Chen and Wang, 2006; Li, Wang, et al., 2003; Stafiej
and Pyrzynska, 2007).
Figure 4.30: Adsorption capacity (qt) versus contact time (t) with different Cu (II) solution.
4.7.2 Adsorption kinetics of Cu (II)
The unique relationship between carbonaceous adsorbents and the adsorbate can be
demonstrated by this powerful isotherm so called adsorption isotherm. The interaction and
affinity of equilibrium data are essential for practical and functional design and basic
knowledge of adsorption system. The Langmuir isotherm (equation 4.3), Freundlich
isotherm (equation 4.4) and Temkin (equation 4.5 and 4.6) and Dubinin isotherm (equation
4.7) for Cu (II) have been successfully illustrated in Fig 4.30 (a-d). As for this research
study, four models were employed to determine the optimum model for the Cu (II)

170
adsorption onto the CNTs surface. Their constants and correlation coefficient were
tabulated in Table 4.15. The isotherm data were collected through the measurements of Cu
(II) metal ions after certain sorbent/ adsorbate contact intervals. The data collected
throughout experiment were proving valid for Langmuir and Freundlich isotherm R2= 0.96,
and R2= 0.99 respectively. However, Temkin and dubinin-Radushkevich isotherms do not
show a good representation. Hence, high validity of Freundlich isotherm model proposes
the adsorption process was taking place at the heterogeneous and consistent and well
distribution of active sites along the CNTs surface. Review on Cu (II) removal using CNTs
as shown in Table 4.16.
Table 4.15: Isotherm parameters for Cu (II) adsorption by CNTs.
Langmuir
Isotherm
Freundlich
Isotherm
Temkin Isotherm Dubinin-
Radushkevich
qm
(mg g-1
)
99 KF
(Lg-1
)
22.56 A
(Lg-1
)
2.71 qm 71.8
KL
(L mg-1
)
0.012 n 2.85 b
(kJmol-1
)
146.79
K x10-6
(mol2 kJ
-2
6.97
R2 0.96 R
2 0.99 R
2 0.89 E (kJ mol
-1) 0.26
R2 0.81

171
Table 4.16: Review on Cu (II) removal using CNTs
Adsorbent qm
(mg/g)
KL
(L/mg)
R2 Kf
(L/g)
n R2 References
MWCNTs 99 0.012 0.96 22.56 2.85 0.99 This study
CNTs 27.03 0.05 0.969 - - - (Hsieh, et al.,
2006)
CNT 8.25 0.023 0.842 0.498 1.739 0.863
(Wu, 2007)
CNTs
Modified with
HNO3
13.87 0.0542 0.96 1.542 2.33 0.986
CNTs modified
with NaOCl
47.39 2.951 0.974 21.0 5.33 0.98
Oxidized
MWCNT
28.49 3.82 0.982 - - - (Li, Luan, et
al., 2003b)
Oxidized CNT 64.93 0.002 0.89 1.2356 0.5170 0.988 (Tofighy and
Mohammadi,
2011)
Oxidized CNT 40.4 0.885 0.996 - - - (Gao, et al.,
2009)
CNTs 26.41 0.94 0.99 12.77 3.87 0.96 (Li, et al.,
2010) CNTs-CA 84.88 0.78 0.99 32.01 1.84 0.955
SWCNT-
COOH
68.96 1.028 0.99 46.65 7.97 0.99 (Moradi,
2011)
SWCNTs 21.08 0.638 0.99 14.28 9.86 0.99
CNTs-soaked
in HNO3
3.49 - - 0.183 1.005 0.99 (Stafiej and
Pyrzynska,
2007) CNTs refluxed
in HNO3
2.69 - - 0.189 0.992 0.992
CNTs 7.14 0.12 0.996 0.99 1.86 0.980 (Hsieh and
Horng,
2007)
CNTs-AL2O3 26.59 0.10 0.987 2.91 1.66 0.980
CNTs-oxidized 28.33 3.84 0.9809 - - - (Li, 2004)

172
Figure 4.31 :(a) Langmuir isotherm (b) Freundlich isotherm (c) Temkin isotherm, and (d)
Dubinin –Radushkevich isotherm plots for adsorption of Cu (II).

173
In order to investigate the mechanism of Cu (II) adsorption on the CNTs surface and
examine the potential rate-controlling step, the capability of pseudo-first order (Langergren,
1898) pseudo second order (Ho, 2006b; Ho and McKay, 1999b) kinetic models was
examined in this study. The conformity between experimental data and the model predicted
values was expressed by the correlation coefficients (R2 values close or equal 1). A
relatively high R2 values indicate that the model successfully describes the kinetics of Cu
(II) adsorption. Fig 4.31 (a) shows the plot ln (qe-qt) against time representing the linear
form of pseudo-first order kinetic model . The rate constant K1 was calculated from the
slope of straight line obtained. K2 is the rate constant of pseudo second order adsorption
kinetics (min.g/mg) was calculated from the intercept and slope of the straight line of t/qt
against time as shown in Fig 4.31 (b). From the observation, the kinetics of adsorption of
Cu (II) ions adsorption on CNTs followed the pseudo second order with more conformity
comparing pseudo first order as shown in Table 4.17. The pseudo second order rate has
been applied widely to the sorption of metal ions, herbicides, oil and organic substances
from aqueous systems (Ho, 2006b; Ho and McKay, 1999b).

174
Table 4.17: Experimental values of constants of adsorption kinetics model.
C0
mgL-1
qe,exp.
(mg g-1
)
Pseudo-First order Pseudo-Second order
qe, cal
(mg g-1
)
K1
(min-1
) R
2
qe,cal.
(mg g-1
)
K2
(min.g mg-1
) R
2
10 22.65 2.36 0.0173 0.15 23.03 0.027 0.999
20 37.97 9.84 0.0335 0.47 40.0 0.0044 0.995
30 51.9 `16.66 0.0422 0.60 54.82 0.0033 0.995
40 56.99 13.07 0.0434 0.51 59.98 0.0034 0.996
50 63.16 13.46 0.0437 0.62 64.59 0.0061 0.999
60 73.2 10.04 0.0397 0.44 74.62 0.0067 0.999
70 85.44 18.48 0.0442 0.60 88.18 0.0037 0.998
80 90.5 23.10 0.0403 0.54 96.06 0.0017 0.995

175
Figure 4.32: (a) Pseudo-first order kinetics (b) Pseudo second order kinetics for adsorption
of Cu (II).

176
4.7.3 Thermodynamic study of Cu (II)
Thermodynamic parameters are used to present an essential data on the energetic change
involved during the adsorption process. The adsorption isotherm of Cu (II) onto CNTs was
measured at 293, 303, 308 and 323 K and the change in the thermodynamic parameters of
the free energy of sorption (∆G◦), enthalpy (∆H
◦), and entropy (∆S
◦) were calculated using
equations (4.8 & 4.9) from the variation of the thermodynamic equilibrium constant, K
with a change in temperature. Free energy change (∆G◦) can be calculated using equation
(4.8), where R is the universal gas constant while T is the temperature in kelvin. Where K
is the equilibrium constant and qe and Ce are the amount of Cu (II) adsorbed per unit mass
of CNTs and the equilibrium concentration of Cu (II) in the solution respectively. The
enthalpy change value was obtained from the intercept of the ∆G◦ versus T plot. The values
of the thermodynamic parameters obtained are shown in Table 4.18.
The negative ∆G◦ value for the adsorption of Cu (II) on the CNTs surface at all
temperatures proves that the sorption was spontaneous and thermodynamically favorable.
In the same vein, the entropy change value, ∆S◦ suggest that the randomness of the process
at the solid-solution interface, increased when the Cu (II) ions attached to the active sites of
adsorbent. The positive value of the enthalpy change value, ∆H proves that this adsorption
experiment was an endothermic and spontaneous process (Li, Ding, et al., 2003; Pehlivan,
et al., 2008).

177
Table 4.18: Thermodynamic parameters for Cu (II) adsorption.
Co
Initial Conc
(mgL-1
)
∆H◦
(kJ mol-1
)
∆S◦
kJ mol-1
K-1
∆G◦ (kJmol
-1)
293 303 308 323
10 0.38 26.45 -7751 -8015 -8148 -8545
20 0.09 17.17 -5031 -5203 -5289 -5546
30 0.15 14.34 -4203 -4347 -4418 -4634
40 0.015 9.956 -2917 -3016 -3066 -3215
4.7.4 FTIR analysis of Cu (II) adsorption
FTIR is a versatile technique to identify the surface chemistry in terms of functional
groups. It was used to analyze functional groups attached on the before and after
adsorption of Cu (II) Fig. 4.32 (a) and (b) demonstrate the plot for CNTs before and after
adsorption of Cu (II). Fig. 4.32 (a) The peaks observed on before CNTs adsorption at a
range of 1700 to 1900 cm-1
defines the carboxylic group, followed by aromatic C=C groups
at 1450-1600 cm-1
and O-H groups at 2800-3000 cm- 1
as well. Fig. 4.32 (b) shows after
adsorption of Cu (II), it was observed several peaks were observed. The C= O and C–O are
stretching frequencies shifted from 1705 and 1200 cm−1
. Peaks at 1600 cm−1
of amino-
functionalized MWCNTs are due to the N–H stretching of amine groups. Peaks at 2930 and
2860 cm−1
are greatly enhanced because of the attachment of additional methyl groups.
Peaks between 950 and 700 cm−1
are due to the stretching mode of aromatic amine groups,
and peaks at 2370 cm−1
may be because of the existence of ammonium ions (Kuan, et al.,
2005; Peng, et al., 2003; Stevens, et al., 2003). The hydrophilic surface structure provides
the functionalized CNTs an advantage of high dispersion in water, which eventually leads
to a higher adsorption capacity of Cu (II) ions from aqueous solution compared with before
the adsorption of CNTs. This finding corresponds to many results reported by several

178
previous researchers who studied on the surface chemistry of CNTs (Kuan, et al., 2005;
Peng, et al., 2003; Smith, 1998; Stevens, et al., 2003; Zhang, et al., 2010).
Figure 4.33: FTIR adsorption spectra for (a) CNTs before (b) CNTs after adsorption of
Cu (II).
4.8 Statistical optimization of removal of Zn (II) using CNTs
The highest adsorption capacity of Zn (II) from aqueous solutions can be determined by the
optimized condition of CNTs as the adsorbents for Zn (II) removal. Specific runs provided
by the DOE were conducted accordingly. The detail experimental array of adsorption rate
of removal of Pb (II) as shown in appendix E. The results obtained from this particular
experiment were analyzed using the application of ―analysis of variance‖ (ANOVA) and
the optimized variables are attainable from Table 3.5. The analyses achieved by the

179
application of ANOVA for the removal of Zn (II) using CNTs are indicated in Table 4.19.
From the values in Tables 4.19, the fisher F-test value can be related to the mean square of
the regressed model which leads to the comparative mean square of the residuals (errors).
The F value proves the efficiency of the model as its value increases. On the other hand,
low probability, P value indicates higher significance of the regression model. Hence, from
Tables 4.19, it can be seen that the F-test values using CNTs were 32, which indicates that
the models are significant. Besides, the values of the correlation coefficient, R-Squared and
Adj R-Squared for CNTs were 0.97 and 0.94 respectively. This value implies that the
models of adsorbent are very close to each other, which indicates the high efficiency and
significance of the models. The model equation evolved for the removal of Zn (II) from
aqueous solutions for CNTs as Eq. (4.12) are as follows:
Removal of Zn (II) = = 110.30-3.27 * A-0.67 * B+0.63 * C-0.81 * D-25.68 * A2-15.33
* B2-15.33 C2-15.73 * D2+0.031 * A * B+2.90 * A * C+1.58 * A * D-1.74 *
B*C+0.69*B*D+2.06*C*D (4.12)
Consequently, variables A, B, C, D, AB, AD and CD were significant model terms. This
indicates that the pH (A), agitation speed (B), MWCNTs dosage (C) and time (D) were
highly significant values of Probe >F was 0.001. The coefficient of single factor represents
the effect of its represented factor while the coefficients of double factors represent the
interaction effect of both represented factor. Hence, following up to the equation, the
positive sign in the equation represents the synergistic effect while the negative sign
represents antagonistic effect values. Fig 4.33 shows theoretical values versus the
experimental values for Zn (II) removal. It was clearly shown that the theoretical values
obtained were quite close to experimental values, indicating that the model developed was
successful in bridging the correlation between process parameters for removal of Zn (II).

180
Table 4.19: ANOVA for the selected quadratic Model for removal of Zn (II).
Fig. 4.34 shows the 3-dimensional interaction plot for adsorption of Zn (II) prepared under
optimized condition of pH, MWCNTs dosage, agitation speed and time. The pH of an
aqueous solution is one of the major parameters that control the adsorption of ion at the
solid water interfaces. In addition to that it affects the solubility of the metal ions,
concentration of the counter ions on the functional groups of adsorbent and the degree of
ionization of the adsorbate during the reaction (Diniz et al., 2002). The 3-D plot of the
Source Sum of
squares DF
Mean
square
F
Value
Prob >
F Status
Model 21649.43 14 1546.38 32.0
<
0.0001 Significant
A 192.7339 1 192.73 4.0 0.0710
B 8 1 8 0.2 0.6917
C 7.10645 1 7.106 0.1 0.7085
D 11.84222 1 11.84 0.2 0.6301
A2 1688.604 1 1688.60 35.0 0.0001
B2 601.695 1 601.69 12.5 0.0047
C2 602.0876 1 602.08 12.5 0.0047
D2 633.5085 1 633.50 13.1 0.0040
AB 0.015625 1 0.0156 0.0 0.09860
AC 134.56 1 134.56 2.8 0.1231
AD 40.00563 1 40.005 0.8 0.03821
BC 48.3025 1 48.302 1.0 0.03386
BD 7.700625 1 7.7006 0.2 0.06972
CD 68.0625 1 68.062 1.4 0.2600
Residual 530.7995 11 48.254
Lack of Fit 530.7945 10 53.0794 10615.9 0.176 Insignificant
Pure Error 0.005 1 0.005
Cor Total 22180.22 25

181
interaction between agitation speed and pH are as depicted in Fig. 4.35 (a) which shows
the optimum condition for the removal of Zn (II) were at pH 10 and agitation speed of 160
rpm. These conditions gave the highest Zn (II) adsorption. PH 10 was observed to be the
most favorable condition for Zn (II) removal as the adsorption decreased when the pH was
set to less than 10 as well as if it was set to be more than 10. This is due to that zinc species
can be present in deionized water in the forms of Zn (II), Zn (OH)+1
, Zn (OH)20 , Zn
(OH)3−1
and Zn (OH)4 −
(Fu and Wang, 2011; Leyva Ramos et al., 2002; Lu et al., 2006a).
At pH<8, the predominant zinc species are always Zn (II) and the removal of Zn (II) is
mainly accomplished by adsorption reaction. Therefore, the low Zn (II) adsorption that took
place at low pH can be attributed in part to competition between H+ and Zn (II) ions on the
same sites (Lu and Chiu, 2006b; Weng and Huang, 2004; Yin et al., 2012). Furthermore,
the zeta potential of CNTs becomes more negative with the increase of pH, which causes
electrostatic attraction and thus results in the adsorption of more Zn (II) onto CNTs. In the
pH range of 8–10, the removal of Zn remained constant and reached maximum. The main
species are Zn (OH)+1
, Zn (OH)20 and Zn (OH)3
-1 and thus the removal of Zn (II) is
possibly accomplished by simultaneous precipitation of Zn (OH)2(s) and adsorption of Zn
(OH) +1
and Zn (OH)3-1
. Further increase in pH above 10, the predominant zinc species are
the negative spaces Zn (OH)3-1
and Zn (OH)2-4
(Leyva Ramos, et al., 2002). Therefore, the
decrease in Zn (II) removal that took place at a pH of above 10 can be attributed in part to
competition among OH−, Zn (OH)3
-1 and Zn (OH)2
-4 ions on the same sites (Lu and Chiu,
2006b). On the other hand, the increase of agitation speed, improves the diffusion of Zn (II)
ions towards the surface of the CNTs (Lu et al., 2007; Mubarak, et al., 2013). Fig. 4.35 (b)
shows the interaction between CNTs dosage and pH. It was observed highest removal of
Zn (II) was obtained at CNTs dosage 0.10 and pH10, further increase increase in pH
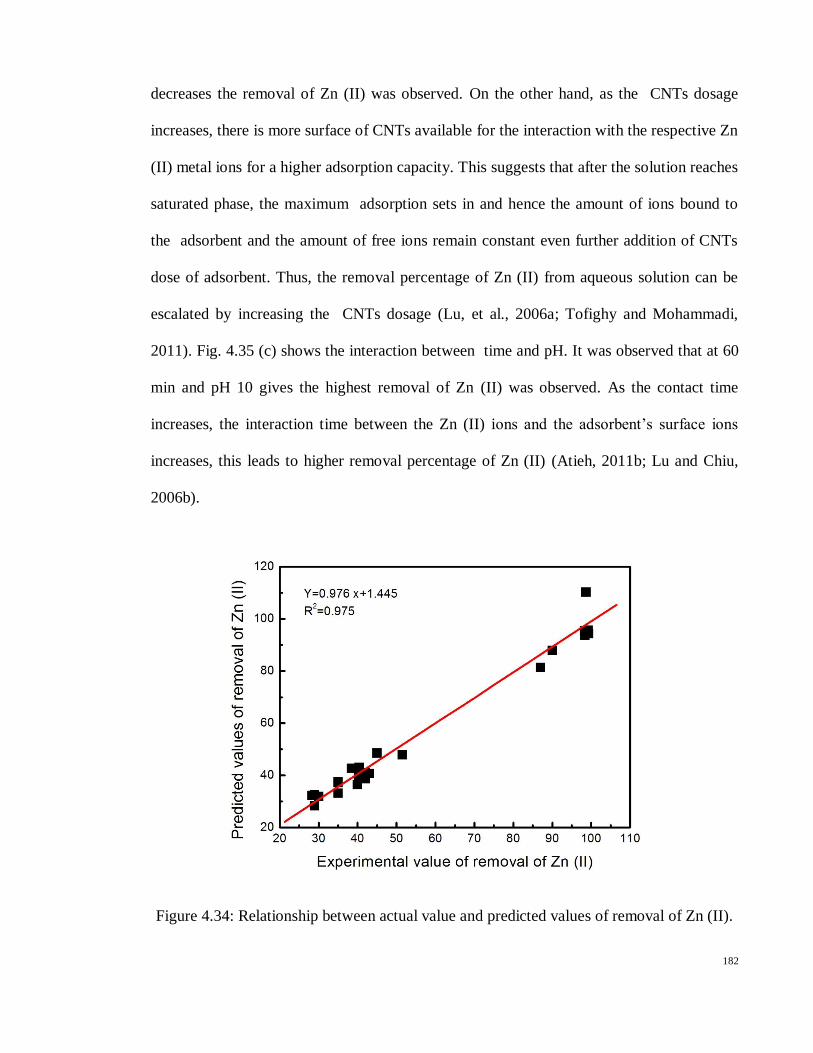
182
decreases the removal of Zn (II) was observed. On the other hand, as the CNTs dosage
increases, there is more surface of CNTs available for the interaction with the respective Zn
(II) metal ions for a higher adsorption capacity. This suggests that after the solution reaches
saturated phase, the maximum adsorption sets in and hence the amount of ions bound to
the adsorbent and the amount of free ions remain constant even further addition of CNTs
dose of adsorbent. Thus, the removal percentage of Zn (II) from aqueous solution can be
escalated by increasing the CNTs dosage (Lu, et al., 2006a; Tofighy and Mohammadi,
2011). Fig. 4.35 (c) shows the interaction between time and pH. It was observed that at 60
min and pH 10 gives the highest removal of Zn (II) was observed. As the contact time
increases, the interaction time between the Zn (II) ions and the adsorbent‘s surface ions
increases, this leads to higher removal percentage of Zn (II) (Atieh, 2011b; Lu and Chiu,
2006b).
Figure 4.34: Relationship between actual value and predicted values of removal of Zn (II).
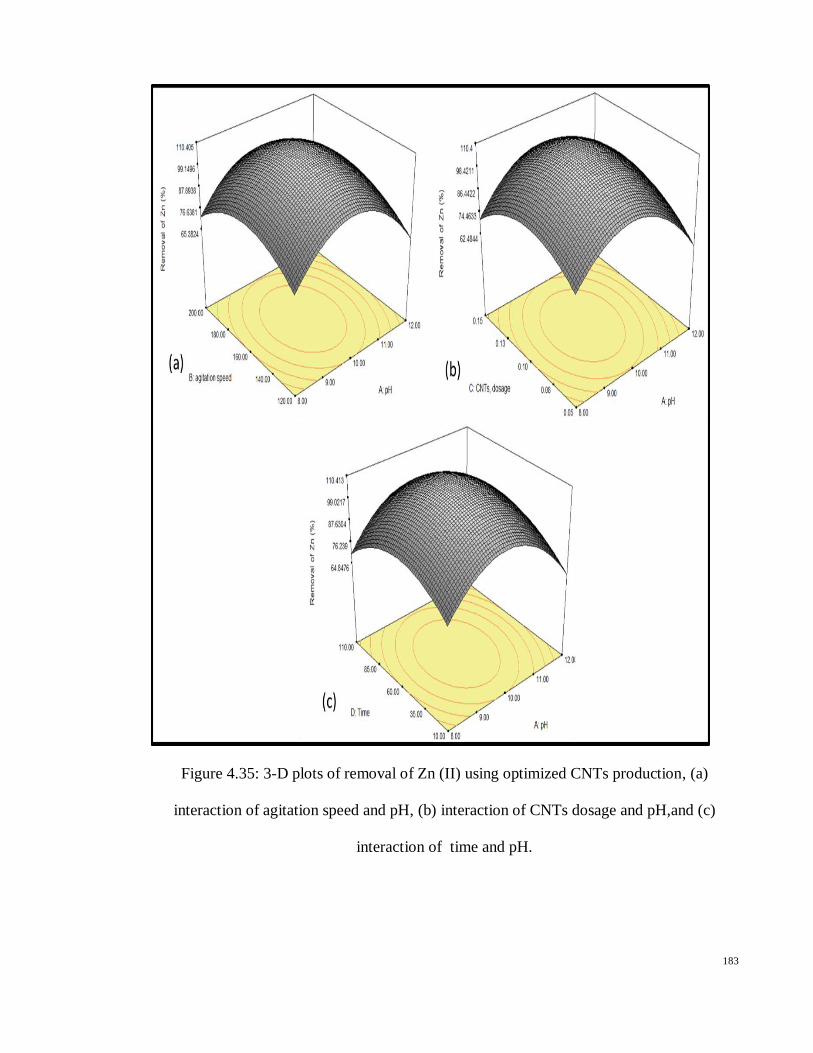
183
Figure 4.35: 3-D plots of removal of Zn (II) using optimized CNTs production, (a)
interaction of agitation speed and pH, (b) interaction of CNTs dosage and pH,and (c)
interaction of time and pH.

184
4.8.1 Adsorption isotherm of Zn (II)
The quantity of absorbent that can be taken up by a particular adsorbent at equilibrium is a
function of both adsorbate concentration and temperature. When experiments are conducted
at constant temperature, the resulting function is commonly referred to as an adsorption
isotherm. The adsorption isotherm is the most extensively employed methods for
representing the equilibrium states of an adsorption system. It gives useful information
regarding the adsorbate, the adsorbent, and the adsorption process (Bansal, 2005).
Theoretically, the adsorption capacity of an adsorbent is achieved at equilibrium when the
rate of adsorption equals the rate of desorption. The successful representation of the
dynamic adaptive separation of solute from solution onto an adsorbent depends upon a
good description of the equilibrium separation between the two phases (Pehlivan, et al.,
2008; Rao, et al., 2010; Salmani, et al., 2013). The relation between contact time (min)
versus adsorption capacity (qt) was plotted for different Zn (II) concentration as shown in
Fig. 4.35. Adsorption of high initial Zn (II) concentration results in an increase in the
adsorption uptake due to increase in mass transfer driving force leading to higher
adsorption rate (Chen, et al., 2009; Chen and Wang, 2006). It was observed that adsorption
of Zn (II) by CNTs increase was rapidly during the first 35 min. Beyond the 60 min, the
rate of adsorption was observed to decline with increment in 60 times, till equilibrium
concentration was reached. This rapid adsorption at the initial time was expected, as the
amount of Zn (II) ions present in solution and available sites on the adsorbent were still
high, resulting in high adsorption sites on the adsorbents reduced, which resulted in a
reduction in the rate of adsorption Zn (II) till equilibrium concentrations were noticed.
Furthermore, at the lower concentration, it becomes more difficult for less-polar adsorbents
to adsorb Zn (II) from a more polar solvent (Stafiej and Pyrzynska, 2007; Wu, 2007; Yang,
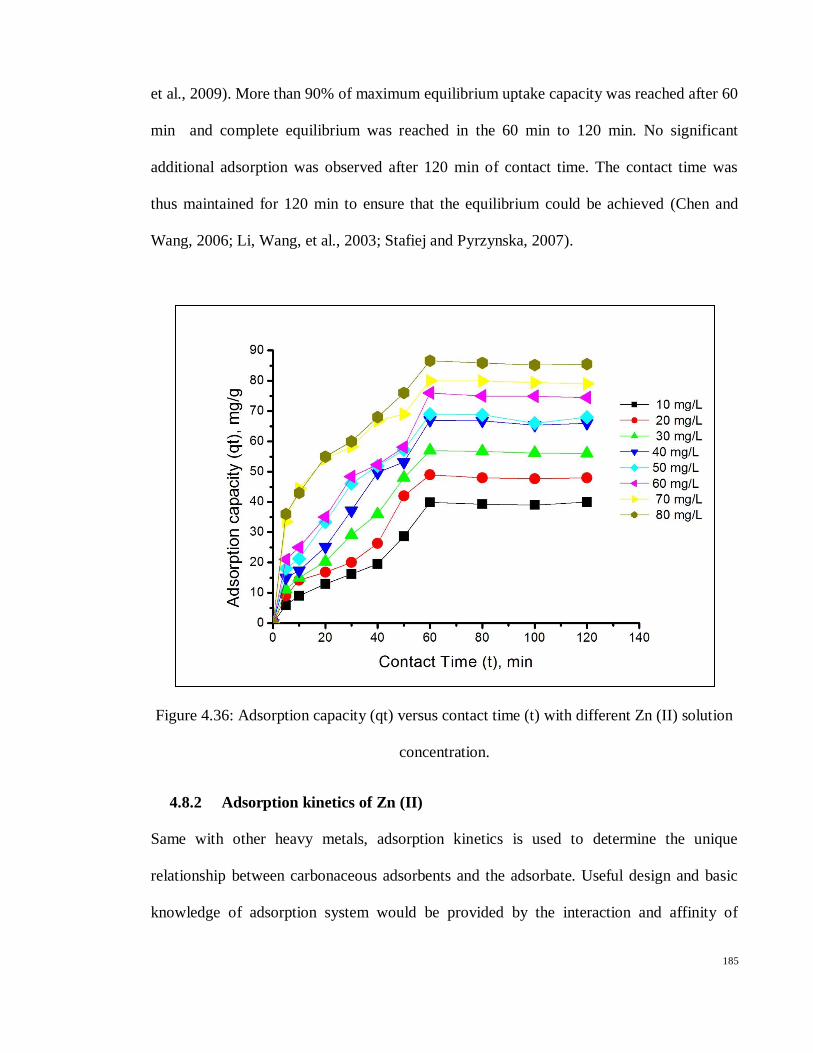
185
et al., 2009). More than 90% of maximum equilibrium uptake capacity was reached after 60
min and complete equilibrium was reached in the 60 min to 120 min. No significant
additional adsorption was observed after 120 min of contact time. The contact time was
thus maintained for 120 min to ensure that the equilibrium could be achieved (Chen and
Wang, 2006; Li, Wang, et al., 2003; Stafiej and Pyrzynska, 2007).
Figure 4.36: Adsorption capacity (qt) versus contact time (t) with different Zn (II) solution
concentration.
4.8.2 Adsorption kinetics of Zn (II)
Same with other heavy metals, adsorption kinetics is used to determine the unique
relationship between carbonaceous adsorbents and the adsorbate. Useful design and basic
knowledge of adsorption system would be provided by the interaction and affinity of

186
equilibrium data. The Langmuir isotherm (equation 4.3), Freundlich isotherm (equation
4.4) and Temkin (equation 4.5 and 4.6) and Dubinin isotherm (equation 4.7) for Zn (II)
have been successfully illustrated in Fig. 4.36 (a-d). As for this research study, four models
were employed to determine the optimum model for the Zn (II) adsorption onto the CNTs
surface. Their constants and correlation coefficient were tabulated in Table 4.20. The
isotherm data were collected through the measurements of Zn (II) metal ions after certain
Sorbent/ adsorbate contact intervals. The data collected throughout experiment were
proving valid for Langmuir and Freundlich isotherm R2= 0.98, and R
2= 0.94 respectively.
However, Temkin and dubinin-Radushkevich isotherms did not show a good
representation. Hence, high validity of the Langmuir isotherm model proposes the
adsorption process was taking place at the heterogeneous and consistent and well
distribution of active sites along the CNTs surface. Review on Zn (II) removal using CNTs
as shown in Table 4.21.
Table 4.20: Isotherm parameters for Zn (II) adsorption using CNTs.
Langmuir
Isotherm
Freundlich
Isotherm
Temkin Isotherm Dubinin-
Radushkevich
qm
(mg/g)
90.9 KF
(L/g)
31.62 A
(L/g)
6.77 qm 66.56
KL
(L/mg)
0.11 n 4.52 b
(kJ/mol)
192.2
K x10-4
(mol2
kJ-2
4.22
R2 0.98 R
2 0.94 R
2 0.89 E
(kJ/mol)
0.39
R2 0.4

187
Table 4.21: Review on Zn (II) removal using CNTs
Adsorbent qm
(mg/g)
KL
(L/mg)
R2 Kf
(L/g)
n R2 References
MWCNTs 90.9 0.11 0.98 31.52 4.52 0.94 This study
Oxidized
CNTs
74.9 0.0019 0.88 1.296 0.502 0.942 (Tofighy and
Mohammadi,
2011)
Oxidized
CNTs
5.2 0.825 0.99 - - - (Gao, et al.,
2009)
Oxidized
CNTs
47.62 0.205 0.99 - - - (Lu et al.,
2009)
84[3] MWCNTs 39.37 0.116 0.98 - - -
SWCNTs 41.84 0.161 0.997 12.37 3.40 0.984 (Lu, et al.,
2006a) MWCNTs 33.33 0.118 0.982 10.62 4.03 0.984
MWCNTs 10.21 0.007 0.471 0.17 0.714 0.928
(Lu and
Chiu, 2008)
MWCNTs-
HNO3
27.2 0.15 0.99 6.14 0.33 0.95
MWCNTs-
KMnO4
28.01 0.16 0.99 9.89 0.236 0.982
MWCNTs-
NaCl
32.68 0.22 0.99 11.84 0.244 0.99
SWCNTs 43.66 0.19 0.99 13.24 0.292 0.945 (Lu and
Chiu, 2006a)
MWCNT-
oxidized
1.05 0.06 0.98 4.41 0.33 0.99 (Mubarak, et
al., 2013)
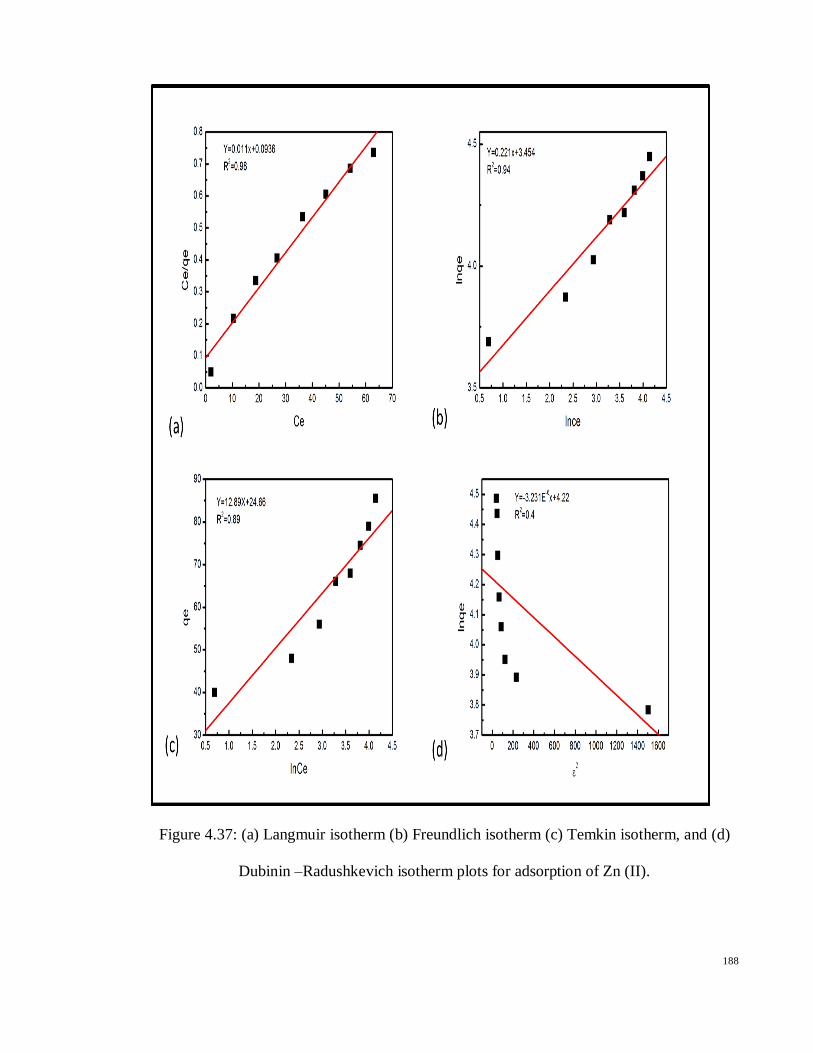
188
Figure 4.37: (a) Langmuir isotherm (b) Freundlich isotherm (c) Temkin isotherm, and (d)
Dubinin –Radushkevich isotherm plots for adsorption of Zn (II).

189
In order to investigate the mechanism of Zn (II) adsorption on the CNTs surface and
examine the potential rate-controlling step, the capability of pseudo-first order (Langergren,
1898) and pseudo second order (Ho, 2006b; Ho and McKay, 1999b) kinetic models were
examined in this study. The conformity between experimental data and the model predicted
values was expressed by the correlation coefficients (R2 values close or equal to 1). A
relatively high R2 values indicate that the model successfully describes the kinetics of Zn
(II) adsorption. Fig. 4.37 (a) shows the plot ln (qe-qt) against time representing the linear
form of pseudo-first order kinetic model. The rate constant K1 was calculated from the
slope of straight line obtained. K2 is the rate constant of pseudo second order adsorption
kinetics (min.g/mg) was calculated from the intercept and slope of the straight line of t/qt
against time as shown in Fig. 4.37 (b). From the observation, the kinetics of adsorption of
Zn (II) ions adsorption on CNTs followed the pseudo second order with more conformity
comparing pseudo first order as shown in Table 4.22. The pseudo second order rate has
been applied widely to the sorption of metal ions, herbicides, oil and organic substances
from aqueous systems (Ho, 2006b; Ho and McKay, 1999b).

190
Table 4.22: Experimental values of constants of adsorption kinetics model.
C0
mgL-1
qe,exp.
(mg g-1
)
Pseudo-First order Pseudo-Second order
qe, cal
(mg g-1
)
K1
(min-1
) R
2
qe,cal.
(mg g-1
)
K2
(min.g mg-1
) R
2
10 40 47.31 0.0239 0.84 45.22 0.00057 0.82
20 48 58.56 0.0296 0.83 56.9 0.00051 0.86
30 56 61.57 0.0266 0.86 61.46 0.00060 0.92
40 66 76.78 0.0383 0.94 79.05 0.00050 0.93
50 68 65.23 0.0358 0.99 77.16 0.00074 0.97
60 74.5 73.77 0.0325 0.97 82.50 0.00068 0.98
70 79 62.07 0.0350 0.97 82.64 0.0013 0.99
80 85.5 84.52 0.0405 0.86 90.57 0.0009 0.99

191
Figure: 4.38: (a) Pseudo-first order kinetics (b) Pseudo second order kinetic for adsorption
of Zn (II).

192
4.8.3 Thermodynamic study
The adsorption isotherm of Zn (II) onto CNTs was measured at 293, 303, 308 and 323 K
and the change in the thermodynamic parameters of the free energy of sorption (∆G◦),
enthalpy (∆H◦), and entropy (∆S
◦) were calculated using equatations ( 4.8 & 4.9) from the
variation of the thermodynamic equilibrium constant, K with a change in temperature.
Thermodynamic parameters are used to provide more information regarding the energetic
change involved during the adsorption process. Free energy change (∆G) can be calculated
using (4.8), where R is the universal gas constant while T is the temperature in Kelvin.
Where K is the equilibrium constant and qe and Ce are the amount of Zn (II) adsorbed per
unit mass of CNTs and the equilibrium concentration of Zn (II) in the solution respectively.
The enthalpy change value was obtained from the intercept of the ∆G◦ versus T plot. The
values of the thermodynamic parameters obtained are shown in Table 4.23.
The negative ∆G◦ value for the adsorption of Zn (II) on the CNTs surface at all
temperatures proves that the sorption was spontaneous and thermodynamically favorable.
In the same vein, the entropy change value, ∆S◦ suggested that the randomness of the
process at the solid-solution interface, increased when the Zn (II) ions attached to the active
sites of adsorbent. The positive value of the entropy change value, ∆H proves that this
adsorption experiment was an endothermic process and a negative value indicates
adsorption was an exothermic process (Li, Ding, et al., 2003; Pehlivan, et al., 2008).

193
Table 4.23: Thermodynamic parameters for Zn (II) adsorption.
Co
Initial Conc
(mgL-1
)
∆H◦
(kJ mol-1
)
∆S◦
(kJ mol-1
K-1
) ∆G◦ (kJmol
-1)
293
K
303
K
308
K
323
K
10 -1.01 24.90 -7297 -7546 -7671 -8044
20 3.81 12.69 -3717 -3844 -3907 -4098
30 4.03 8.86 -2593 -2682 -2726 -2859
40 5.2 7.6 -2232 -2308 -2346 -2460
4.8.4 FTIR analysis of Zn (II) adsorption
In order to investigate the successful functionalization groups attached on the surface of
CNTs were analyzed by using FTIR. FTIR was engaged as well to determine the functional
groups attached on the before and after adsorption of Zn (II). Fig. 4.38 (a-b) demonstrates
the plot for CNTs before and after adsorption of Zn (II). Fig. 4.38 (a) The peaks observed
on before CNTs adsorption at a range of 1700 to 1900 cm-1
defines the carboxylic group,
followed by aromatic C=C groups at 1450-1600 cm-1
and O-H groups at 2800-3000 cm- 1
as
well. Fig. 4.38 (b) shows after adsorption of Zn (II), it was observed several peaks were
observed. The C=O and C–O is stretching frequencies shifted from 1705 and 1200 cm−1
.
Peaks at 1600 cm−1
of amino-functionalized MWCNTs are due to the N–H stretching of
amine groups. Peaks at 2930 and 2860 cm−1
are greatly enhanced because of the attachment
of additional methyl groups. Peaks between 950 and 700 cm−1
are due to the stretching
mode of aromatic amine groups, and peaks at 2370 cm−1
may be because of the existence of
ammonium ions (Kuan, et al., 2005; Peng, et al., 2003; Stevens, et al., 2003). The
hydrophilic surface structure provides the functionalized CNTs an advantage of high
dispersion in water, which eventually leads to a higher adsorption capacity of Zn (II) ions
from aqueous solution compared with before the adsorption of CNTs. This finding

194
corresponds to many results reported by several previous researchers who studied on the
surface chemistry of CNTs (Kuan, et al., 2005; Peng, et al., 2003; Smith, 1998; Stevens, et
al., 2003; Zhang, et al., 2010).
Figure 4.39: FTIR adsorption spectra for (a) CNTs before (b) CNTs after adsorption of Zn
(II).
4.8.5 Zeta potential of MWCNTs
Zeta potential was measured for MWCNTs before and after adsorption of heavy metals.
The zeta potential for MWCNTs was -42.5 mV that made this material lay in the region of
the good stability aqueous system and its surface become more hydrophilic due to the
presence of oxygen-containing functional groups on the surface such as carbonyl and

195
aliphatic carboxylic acids resulting in increasing of electron density and increasing the
electron negativity which is thought to play an important role in the adsorption mechnasim.
After the adsorption process the value of Zeta potential was 6.48, 6, 4.95 and +5.86 mV
because of the saturation of the surface with positive charged of Pb (II), Cd (II), Cu (II) and
Zn (II) ions respectively. That relatively low zeta value has an advantage in the process of
removal of heavy metals by making the adsorbent more hydrophobic and reducing the
stability and as a result the separation of poisoned adsorbent become easier by settling,
coagulation or flocculation (Lu and Chiu, 2006; Lu et al., 2006).

196
5 CHAPTER V
CONCLUSIONS AND RECOMMENDATIONS
5.1 Conclusions
Microwave synthesis, including fast CNTs growth and ambient reaction condition and
simplifies the procedure leading to a high yield synthesis of high-quality CNTs with
minimal impurity. Unlike conventional heating, microwave heating has a higher heating
rate, which results from the intrinsic transition of electromagnetic energy to thermal energy
by a molecular interaction with the electromagnetic field, rather than heat transfer by
conduction or convection. One such possibility is the use of microwave radiation, which
over the past few years has played an important role as a thermal tool in organic synthesis
due to considerable advantages over conventional methods. Another major advantage of the
MA-CVD approach is that CNTs can be produced continuously, which could provide a
very good way to synthesize large quantities of CNTs under relatively, controlled
conditions. Major findings made from this research are summarized as follows.
i. A novel MWCNTs have been successfully synthesized by MA-CVD using
acetylene and hydrogen as the precursor gases, and ferrocene as catalyst.
ii. MWCNTs has been successfully produced by MA-CVD and the statistical analysis
reveal that the optimized conditions for the high yield MWCNTs production were
microwave power of 900 W, radiation time of 35 min and gas ratio of C2H2/H2
was 0.6.
iii. The TGA analysis showed that the purity of MWCNTs produced was almost 98%
purity. FESEM and TEM analyses revealed that the uniformly dispersed MWCNTs
have diameters ranging from 10 to 23 nm and 30 micron long.

197
iv. The produced MWCNTs have a high BET surface area of 206 m2/g and the zeta
potential for MWCNTs was -42.5 mV.
v. The interaction of process parameters on MWCNTs productions between hydrogen,
acetylene and microwave power were the three key parameters to achieve high yield
and high purity of MWCNTs.
vi. Statistical analysis has been examined for validation of the results, and the
observation showed that 97.0% of desirability was achieved, which indicated that
these MWCNTs were high in purity and high yield.
vii. A novel MWCNTs proved to be an outstanding adsorbent for the removal of heavy
metals from aqueous solution.
viii. Characterization has shown a clear demarcation in the physicochemical properties
of MWCNTs.
ix. The optimization and kinetic study on the removal of Pb (II), Cd (II), Cu (II) and Zn
(II) using MWCNTs is conducted. Maximum adsorption capacities (qm) for Pb (II),
Cd (II), Cu (II) and Zn (II) ions were obtained at 104.2, 88.63, 99 and 90.9 mg/g
respectively.
x. Analysis results revealed that the optimum conditions for the highest removal of
(99.9%) Pb (II) and (98%) Cd (II) were recorded to have pH 5, MWCNTs dosage
0.1 g, contact time 22.5 and 50 min and agitation speed of 160 rpm respectively.
xi. The statistical analysis revealed that the optimum conditions for the highest removal
of (99%) Cu (II) and (99.9%) Zn (II) were recorded to have pH 5.5, and pH 10
MWCNTs dosage 0.1 and 0.05 g, contact time 35 and 60 min and agitation speed of
160 and 120 rpm respectively.
198
xii. Four models such as Langmuir, Freundlich, Temkin and Dubinin isotherm model
were tested for each heavy metals. The system was found more likely to follow
Langmuir and Freundlich models match the experimental data very well for each
heavy metals since R2=0. 99.
xiii. Two kinetic models were studied which were pseudo first order and the pseudo
second order for each heavy metals, it was found that adsorption kinetic obeyed
pseudo-second order for each heavy metals since R2=0. 999
xiv. Different thermodynamic parameters, viz., ∆H◦, ∆S
◦ and ∆G
◦ have also been
evaluated and it has been found that the adsorption was feasible, spontaneous and
endothermic in nature for Pb (II), Cu (II) and Zn (II).
xv. The thermodynamic analysis revealed that the sorption of Cd (II) onto MWCNTs is
exothermic and spontaneous in nature.
xvi. Hence, MWCNTs are the most promising candidate for removal of heavy metals
from waste water treatment and separation process.
5.2 Recommendations
Some recommendations can be made from the results obtained and observations throughout
this research study, it is summarized as follows:
i. Wide ranges of hydrocarbon precursors have been successfully used in the synthesis
of carbon nanomaterials. However, there are still many more types of hydrocarbon
precursors that can be studied to produce these materials such as methane, ethylene,
and benzene. Therefore the study of using other hydrocarbon precursors for
synthesis of carbon nanotubes should be continued.

199
ii. Catalyst plays a very important role to produce high purity and high yield of carbon
material. Therefore, the study of using the other types of catalyst like nickel and
cobalt needs to be investigated.
iii. The MA-CVD reactor can be scaled up to a pilot plant, including a continuous
reaction to increase the rate of production of MWCNTs.
iv. MWCNTs are an excellent adsorbent that can be used for removal of other toxic
materials such as heavy metals (As (V), Hg, Ni etc.).
v. MWCNTs exhibited high BET surface area, thus it can be used for gas adsorption
applications such as NOx removal from flue gases or H2 storage.
vi. MWCNTs can be used in immobilization of enzymes and proteins for several
biotechnology applications
vii. A column study can be carried out to determine the breakthrough conditions in the
adsorption process.
viii. MWCNTs material can be fixed in a packed bed filter to be used for continuous
adsorption process for future investigations.

200
Bibliography
Abdel-Ghani, N., Hefny, M., & El-Chaghaby, G. A. (2007). Removal of lead from aqueous
solution using low cost abundantly available adsorbents. International Journal of
Environmental Science & Technology, 4(1), 67-73.
Abdullahi, I., Sakulchaicharoen, N., & Herrera, J. E. (2012). A mechanistic study on the
growth of multi-walled carbon nanotubes by methane decomposition over nickel–
alumina catalyst. Diamond and Related Materials, 23(0), 76-82.
Ago, H., Komatsu, T., Ohshima, S., Kuriki, Y., & Yumura, M. (2000). Dispersion of metal
nanoparticles for aligned carbon nanotube arrays. Applied Physics Letters, 77(1),
79-81.
Amelinckx, S., Bernaerts, D., Zhang, X. B., Van Tendeloo, G., & Van Landuyt, J. (1995).
A structure model and growth mechanism for multishell carbon nanotubes. Science,
267(5202), 1334-1338.
Amirhasan, N., Bahram, G., Mostafa, Z., & Ezatollah, A. (2007). Morphology optimization
of ccvd-synthesized multiwall carbon nanotubes, using statistical design of
experiments. Nanotechnology, 18(11), 115715.
Ando, Y., & Zhao, X. (2006). Synthesis of carbon nanotubes by arc-discharge method. New
Diamond and Frontier Carbon Technology, 16(3), 123-137.
Ando, Y., Zhao, X., Hirahara, K., Suenaga, K., Bandow, S., & Iijima, S. (2000). Mass
production of single-wall carbon nanotubes by the arc plasma jet method. Chemical
Physics Letters, 323(5–6), 580-585.
Ando, Y., Zhao, X., Sugai, T., & Kumar, M. (2004). Growing carbon nanotubes. Materials
Today, 7(10), 22-29.
Andriotis, A., Menon, M., & Froudakis, G. (2000). Catalytic action of ni atoms in the
formation of carbon nanotubes: A combined ab-initio and molecular dynamics
study. Microelectronics, Microsystems and Nanotechnology, papers presented at
MMN.
Ata, M., Kijima, Y., Imoto, H., Matsuzawa, N., & Takahashi, N. (1994). Carbon
microfibers grown on graphite electrode during fullerene generation using
composite graphite rods. Japanese Journal of Applied Physics, Part 1: Regular
Papers and Short Notes and Review Papers, 33(7 A), 4032-4038.
Athalin, H., & Lefrant, S. (2005). A correlated method for quantifying mixed and dispersed
carbon nanotubes: Analysis of the raman band intensities and evidence of
wavenumber shift. Journal of Raman Spectroscopy, 36(5), 400-408.

201
Atieh, M. A. (2011a). Removal of chromium (vi) from polluted water using carbon
nanotubes supported with activated carbon. Procedia Environmental Sciences, 4(0),
281-293.
Atieh, M. A. (2011b). Removal of zinc from water using modified and non-modified carbon
nanofibers. Paper presented at the Proceedings of the 2nd International Conference
on Environmental Science and Technology IPCBEE Singapore.
Atthipalli, G., Epur, R., Kumta, P. N., Yang, M., Lee, J.-K., & Gray, J. L. (2011). Nickel
catalyst-assisted vertical growth of dense carbon nanotube forests on bulk copper.
The Journal of Physical Chemistry C, 115(9), 3534-3538.
Ausman, K. D., Piner, R., Lourie, O., Ruoff, R. S., & Korobov, M. (2000). Organic solvent
dispersions of single-walled carbon nanotubes: Toward solutions of pristine
nanotubes. The Journal of Physical Chemistry B, 104(38), 8911-8915.
Aziz, H. A., Adlan, M. N., & Ariffin, K. S. (2008). Heavy metals (cd, pb, zn, ni, cu and cr
(iii)) removal from water in malaysia: Post treatment by high quality limestone.
Bioresource Technology, 99(6), 1578-1583.
Azouaou, N., Sadaoui, Z., Djaafri, A., & Mokaddem, H. (2010). Adsorption of cadmium
from aqueous solution onto untreated coffee grounds: Equilibrium, kinetics and
thermodynamics. Journal of Hazardous Materials, 184(1), 126-134.
Bacon, R. (1960). Growth, structure, and properties of graphite whiskers. Journal of
Applied Physics, 31(2), 283-290.
Baker, R. T. K., Barber, M. A., Harris, P. S., Feates, F. S., & Waite, R. J. (1972).
Nucleation and growth of carbon deposits from the nickel catalyzed decomposition
of acetylene. Journal of Catalysis, 26(1), 51-62.
Ball, P. (2001). Roll up for the revolution. [10.1038/35102721]. Nature, 414(6860), 142-
144.
Bandow, S., Asaka, S., Saito, Y., Rao, A. M., Grigorian, L., Richter, E., et al. (1998). Effect
of the growth temperature on the diameter distribution and chirality of single-wall
carbon nanotubes. Physical Review Letters, 80(17), 3779-3782.
Bansal, R. C. a. G., M. (2005). Activated carbon adsorption. 351-353.
Baughman, R. H., Zakhidov, A. A., & de Heer, W. A. (2002). Carbon nanotubes--the route
toward applications. Science, 297(5582), 787-792.
Bazargan, A., & McKay, G. (2012). A review – synthesis of carbon nanotubes from plastic
wastes. Chemical Engineering Journal, 195–196(0), 377-391.

202
Bekarevich, R. V., Miura, S., Ogino, A., Rahachou, A. U., & Nagatsu, M. (2012). Low
temperature growth of carbon nanomaterials on the polymer substrates by
microwave plasma technique. Transactions of the Materials Research Society of
Japan, 37(2), 157-160.
Benito, P., Herrero, M., Labajos, F., Rives, V., Royo, C., Latorre, N., et al. (2009a).
Production of carbon nanotubes from methane: Use of co-zn-al catalysts prepared
by microwave-assisted synthesis. Chemical Engineering Journal, 149(1), 455-462.
Benito, P., Herrero, M., Labajos, F. M., Rives, V., Royo, C., Latorre, N., et al. (2009b).
Production of carbon nanotubes from methane: Use of co-zn-al catalysts prepared
by microwave-assisted synthesis. Chemical Engineering Journal, 149(1–3), 455-
462.
Bethune, D. S., Klang, C. H., de Vries, M. S., Gorman, G., Savoy, R., Vazquez, J., et al.
(1993). Cobalt-catalysed growth of carbon nanotubes with single-atomic-layer
walls. [10.1038/363605a0]. Nature, 363(6430), 605-607.
Biškup, B., & Subotić, B. ( 5). Removal of heavy metal ions from solutions using
zeolites. Iii. Influence of sodium ion concentration in the liquid phase on the
kinetics of exchange processes between cadmium ions from solution and sodium
ions from zeolite a. Separation Science and Technology, 39(4), 925-940.
Bonard, J., x, Marc, Salvetat, J.-P., Sto, ckli, T., et al. (1998). Field emission from single-
wall carbon nanotube films. Applied Physics Letters, 73(7), 918-920.
Bower, C., Suzuki, S., Tanigaki, K., & Zhou, O. (1998). Synthesis and structure of pristine
and alkali-metal-intercalated single-walled carbon nanotubes. Applied Physics A,
67(1), 47-52.
Bower, C., Zhou, O., Zhu, W., Werder, D., & Jin, S. (2000). Nucleation and growth of
carbon nanotubes by microwave plasma chemical vapor deposition. Applied Physics
Letters, 77(17), 2767-2769.
Bower, C., Zhu, W., Jin, S., & Zhou, O. (2000). Plasma-induced alignment of carbon
nanotubes. Applied Physics Letters, 77(6), 830-832.
Brunetti, F. G., Herrero, M. A., Muñoz, J. d. M., Giordani, S., Díaz-Ortiz, A., Filippone, S.,
et al. (2007). Reversible microwave-assisted cycloaddition of aziridines to carbon
nanotubes. Journal of the American Chemical Society, 129(47), 14580-14581.
Bustero, I., Ainara, G., Isabel, O., Roberto, M., Inés, R., & Amaya, A. (2006). Control of
the properties of carbon nanotubes synthesized by cvd for application in
electrochemical biosensors. Microchimica Acta, 152(3-4), 239-247.

203
Byszewski, P., Lange, H., Huczko, A., & Behnke, J. F. (1997). Fullerene and nanotube
synthesis. Plasma spectroscopy studies. Journal of Physics and Chemistry of Solids,
58(11), 1679-1683.
Calderón, J., Navarro, M. E., Jimenez-Capdeville, M. E., Santos-Diaz, M. A., Golden, A.,
Rodriguez-Leyva, I., et al. (2001). Exposure to arsenic and lead and
neuropsychological development in mexican children. Environmental Research,
85(2), 69-76.
Cao, Z., Sun, Z., Guo, P., & Chen, Y. (2007). Effect of acetylene flow rate on morphology
and structure of carbon nanotube thick films grown by thermal chemical vapor
deposition. Frontiers of Materials Science in China, 1(1), 92-96.
Carabineiro, S., Pereira, M., Pereira, J., Caparros, C., Sencadas, V., & Lanceros-Mendez, S.
(2011). Effect of the carbon nanotube surface characteristics on the conductivity and
dielectric constant of carbon nanotube/poly(vinylidene fluoride) composites.
Nanoscale Research Letters, 6(1), 302.
Cassell, A. M., Raymakers, J. A., Kong, J., & Dai, H. (1999). Large scale cvd synthesis of
single-walled carbon nanotubes. The Journal of Physical Chemistry B, 103(31),
6484-6492.
Chatterjee, S. K., Bhattacharjee, I., & Chandra, G. (2010). Biosorption of heavy metals
from industrial waste water by geobacillus thermodenitrificans. Journal of
Hazardous Materials, 175(1–3), 117-125.
Che, G., Lakshmi, B. B., Fisher, E. R., & Martin, C. R. (1998). Carbon nanotubule
membranes for electrochemical energy storage and production. Nature, 393(6683),
346-349.
Chen, B., & Wu, P. (2005). Aligned carbon nanotubes by catalytic decomposition of c2h2
over ni–cr alloy. Carbon, 43(15), 3172-3177.
Chen, C.-W., Kao, C.-M., Chen, C.-F., & Dong, C.-D. (2007). Distribution and
accumulation of heavy metals in the sediments of kaohsiung harbor, taiwan.
Chemosphere, 66(8), 1431-1440.
Chen, C., Hu, J., Shao, D., Li, J., & Wang, X. (2009). Adsorption behavior of multiwall
carbon nanotube/iron oxide magnetic composites for ni(ii) and sr(ii). Journal of
Hazardous Materials, 164(2–3), 923-928.
Chen, C., Hu, J., Xu, D., Tan, X., Meng, Y., & Wang, X. (2008). Surface complexation
modeling of sr (ii) and eu (iii) adsorption onto oxidized multiwall carbon nanotubes.
Journal of Colloid and Interface Science, 323(1), 33-41.

204
Chen, C., & Wang, X. (2006). Adsorption of ni(ii) from aqueous solution using oxidized
multiwall carbon nanotubes. Industrial & Engineering Chemistry Research, 45(26),
9144-9149.
Chen, M., Chen, C.-M., & Chen, C.-F. (2002). Preparation of high yield multi-walled
carbon nanotubes by microwave plasma chemical vapor deposition at low
temperature. Journal of Materials Science, 37(17), 3561-3567.
Chen, M., Chen, C.-M., Koo, H.-S., & Chen, C.-F. (2003). Catalyzed growth model of
carbon nanotubes by microwave plasma chemical vapor deposition using ch4 and
co2 gas mixtures. Diamond and Related Materials, 12(10–11), 1829-1835.
Chen, R. J., Zhang, Y., Wang, D., & Dai, H. (2001). Noncovalent sidewall
functionalization of single-walled carbon nanotubes for protein immobilization.
Journal of the American Chemical Society, 123(16), 3838-3839.
Chen, X. H., Chen, C. S., Chen, Q., Cheng, F. Q., Zhang, G., & Chen, Z. Z. (2002). Non-
destructive purification of multi-walled carbon nanotubes produced by catalyzed
cvd. Materials Letters, 57(3), 734-738.
Cheng, J., Zhang, X., Liu, F., Tu, J., Lu, H., Sun, Y., et al. (2004). Long bundles of aligned
carbon nanofibers obtained by vertical floating catalyst method. Materials
Chemistry and Physics, 87(2), 241-245.
Cheung, C. L., Kurtz, A., Park, H., & Lieber, C. M. (2002). Diameter-controlled synthesis
of carbon nanotubes. The Journal of Physical Chemistry B, 106(10), 2429-2433.
Chhowalla, M., Teo, K., Ducati, C., Rupesinghe, N., Amaratunga, G., Ferrari, A., et al.
(2001). Growth process conditions of vertically aligned carbon nanotubes using
plasma enhanced chemical vapor deposition. Journal of Applied Physics, 90(10),
5308-5317.
Chiang, W.-H., & Sankaran, R. M. (2008). Synergistic effects in bimetallic nanoparticles
for low temperature carbon nanotube growth. Advanced Materials, 20(24), 4857-
4861.
Cho, H.-H., Wepasnick, K., Smith, B. A., Bangash, F. K., Fairbrother, D. H., & Ball, W. P.
(2009). Sorption of aqueous zn [ii] and cd [ii] by multiwall carbon nanotubes: The
relative roles of oxygen-containing functional groups and graphenic carbon.
Langmuir, 26(2), 967-981.
Choi, J. H., Kim, S. D., Noh, S. H., Oh, S. J., & Kim, W. J. (2006). Adsorption behaviors of
nano-sized ets-10 and al-substituted-etas-10 in removing heavy metal ions, pb2+
and cd2+. Microporous and Mesoporous Materials, 87(3), 163-169.

205
Choi, Y. C., Bae, D. J., Lee, Y. H., Lee, B. S., Han, I. T., Choi, W. B., et al. (2000). Low
temperature synthesis of carbon nanotubes by microwave plasma-enhanced
chemical vapor deposition. Synthetic Metals, 108(2), 159-163.
Clauss, C., Schwarz, M., & Kroke, E. (2010). Microwave-induced decomposition of
nitrogen-rich iron salts and cnt formation from iron (iii)–melonate fe [c< sub>
9</sub> n< sub> 13</sub>]. Carbon, 48(4), 1137-1145.
Colbert, D. T., Zhang, J., McClure, S. M., Nikolaev, P., Chen, Z., Hafner, J. H., et al.
(1994). Science. 266, 1218-1284.
Collins, P. G., & Avouris, P. (2000). Nanotubes for electronics. Scientific American,
283(6), 62-69.
Collins, P. G., Zettl, A., Bando, H., Thess, A., & Smalley, R. E. (1997). Nanotube
nanodevice. Science, 278(5335), 100-102.
Colomer, J. F., Stephan, C., Lefrant, S., Van Tendeloo, G., Willems, I., Kónya, Z., et al.
(2000). Large-scale synthesis of single-wall carbon nanotubes by catalytic chemical
vapor deposition (ccvd) method. Chemical Physics Letters, 317(1–2), 83-89.
Colt, J. (2006). Water quality requirements for reuse systems. Aquacultural Engineering,
34(3), 143-156.
Corapcioglu, M. O., & Huang, C. P. (1987). The adsorption of heavy metals onto hydrous
activated carbon. Water Research, 21(9), 1031-1044.
Couteau, E., Hernadi, K., Seo, J. W., Thiên-Nga, L., Mikó, C., Gaál, R., et al. (2003). Cvd
synthesis of high-purity multiwalled carbon nanotubes using caco3 catalyst support
for large-scale production. Chemical Physics Letters, 378(1–2), 9-17.
Cumings, J., Mickelson, W., & Zettl, A. (2003). Simplified synthesis of double-wall carbon
nanotubes. Solid State Communications, 126(6), 359-362.
Dąbrowski, A. ( 1). Adsorption—from theory to practice. Advances in Colloid and
Interface Science, 93(1), 135-224.
Dai, H., Rinzler, A. G., Nikolaev, P., Thess, A., Colbert, D. T., & Smalley, R. E. (1996).
Single-wall nanotubes produced by metal-catalyzed disproportionation of carbon
monoxide. Chemical Physics Letters, 260(3–4), 471-475.
Dai, L., & Mau, A. W. H. (2001). Controlled synthesis and modification of carbon
nanotubes and c60: Carbon nanostructures for advanced polymeric composite
materials. Advanced Materials, 13(12-13), 899-913.
Dallinger, D., & Kappe, C. O. (2007). Microwave-assisted synthesis in water as solvent.
Chemical Reviews, 107(6), 2563-2591.

206
Danafar, F., Fakhru‘l-Razi, A., Salleh, M. A. M., & Biak, D. R. A. (2009). Fluidized bed
catalytic chemical vapor deposition synthesis of carbon nanotubes—a review.
Chemical Engineering Journal, 155(1–2), 37-48.
Das, N., Dalai, A., Soltan Mohammadzadeh, J. S., & Adjaye, J. (2006). The effect of
feedstock and process conditions on the synthesis of high purity cnts from aromatic
hydrocarbons. Carbon, 44(11), 2236-2245.
Davis, W. R., Slawson, R. J., & Rigby, G. R. (1953). An unusual form of carbon.
[10.1038/171756a0]. Nature, 171(4356), 756-756.
Delzeit, L., Nguyen, C. V., Chen, B., Stevens, R., Cassell, A., Han, J., et al. (2002).
Multiwalled carbon nanotubes by chemical vapor deposition using multilayered
metal catalysts. The Journal of Physical Chemistry B, 106(22), 5629-5635.
Di, Z.-C., Ding, J., Peng, X.-J., Li, Y.-H., Luan, Z.-K., & Liang, J. (2006). Chromium
adsorption by aligned carbon nanotubes supported ceria nanoparticles.
Chemosphere, 62(5), 861-865.
Dillon, A. C. G., T. , Alleman,J.L., Jones,K.M. Parilla,P.A. Heben M.J. . (2001).
Optimization of single-wall nanotube synthesis for hydrogen storage iea task 12.
Metal Hydrides and Carbon for Hydrogen Storage NREL/CH, 91-95.
Diniz, C. V., Doyle, F. M., & Ciminelli, V. S. (2002). Effect of ph on the adsorption of
selected heavy metal ions from concentrated chloride solutions by the chelating
resin dowex m-4195. Separation Science and Technology, 37(14), 3169-3185.
Douven, S., Pirard, S. L., Chan, F.-Y., Pirard, R., Heyen, G., & Pirard, J.-P. (2012). Large-
scale synthesis of multi-walled carbon nanotubes in a continuous inclined mobile-
bed rotating reactor by the catalytic chemical vapour deposition process using
methane as carbon source. Chemical Engineering Journal, 188(0), 113-125.
Dresselhaus, M., & Avouris, P. (2001). Introduction to carbon materials research. In M.
Dresselhaus, G. Dresselhaus & P. Avouris (Eds.), Carbon nanotubes (Vol. 80, pp.
1-9): Springer Berlin Heidelberg.
Dresselhaus, M. S., Dresselhaus, G., & Eklund, P. C. (1996). Science of fullerenes and
carbon nanotubes: Their properties and applications: Academic Press.
Dresselhaus, M. S., Dresselhaus, G., & Saito, R. (1995). Physics of carbon nanotubes.
Carbon, 33(7), 883-891.
Ebbesen, T. W. (1997a). Carbon nanotubes: Preparartion and properties: CRC press.

207
Ebbesen, T. W. (1997b). Production and purification of carbon nanotubes, in carbon
nanotubes: Preparation and properties,. T.W. Ebbesen, Ed. Boca Raton, FL :CRC
139-162.
Ebbesen, T. W., & Ajayan, P. M. (1992). Large-scale synthesis of carbon nanotubes.
[10.1038/358220a0]. Nature, 358(6383), 220-222.
Ebbesen, T. W., Hiura, H., Fujita, J., Ochiai, Y., Matsui, S., & Tanigaki, K. (1993).
Patterns in the bulk growth of carbon nanotubes. Chemical Physics Letters, 209(1–
2), 83-90.
Eftekhari, A., Manafi, S., & Moztarzadeh, F. (2006). Catalytic chemical vapor deposition
preparation of multi-wall carbon nanotubes with cone-like heads. Chemistry Letters,
35(1), 138-139.
Eklund, P. C., Holden, J. M., & Jishi, R. A. (1995). Vibrational modes of carbon nanotubes;
spectroscopy and theory. Carbon, 33(7), 959-972.
Eklund, P. C., Pradhan, B. K., Kim, U. J., Xiong, Q., Fischer, J. E., Friedman, A. D., et al.
(2002). Large-scale production of single-walled carbon nanotubes using ultrafast
pulses from a free electron laser. Nano Letters, 2(6), 561-566.
Endo, M., Muramatsu, H., Hayashi, T., Kim, Y. A., Terrones, M., & Dresselhaus, M. S.
(2005). Nanotechnology: /`buckypaper/' from coaxial nanotubes.
[10.1038/433476a]. Nature, 433(7025), 476-476.
Endo, M., Takeuchi, K., Igarashi, S., Kobori, K., Shiraishi, M., & Kroto, H. W. (1993). The
production and structure of pyrolytic carbon nanotubes (pcnts). Journal of Physics
and Chemistry of Solids, 54(12), 1841-1848.
Endo, M. F., H. , Fukunaga, E. . (1991). 18th meeting japanese carbon society, japanese
carbon society. Japanese Carbon Society, Saitama,December, 34-35.
Endo, M. T., K. Igarashi,S , Kobori, K. Shiraishi, M., Kroto,H. W. . (1992). 19th meeting
japanese carbon society. Japanese Carbon Society, Kyoto, December 192.
Fan, J., Wan, M., Zhu, D., Chang, B., Pan, Z., & Xie, S. (1999). Synthesis,
characterizations, and physical properties of carbon nanotubes coated by conducting
polypyrrole. Journal of Applied Polymer Science, 74(11), 2605-2610.
Fan, S., Chapline, M. G., Franklin, N. R., Tombler, T. W., Cassell, A. M., & Dai, H.
(1999). Self-oriented regular arrays of carbon nanotubes and their field emission
properties. Science, 283(5401), 512-514.
Faur-Brasquet, C., Reddad, Z., Kadirvelu, K., & Le Cloirec, P. (2002). Modeling the
adsorption of metal ions (cu< sup> 2+</sup>, ni< sup> 2+</sup>, pb< sup>

208
2+</sup>) onto accs using surface complexation models. Applied Surface Science,
196(1), 356-365.
Flahaut, E., Bacsa, R., Peigney, A., & Laurent, C. (2003). Gram-scale ccvd synthesis of
double-walled carbon nanotubes. [10.1039/B301514A]. Chemical
Communications(12), 1442-1443.
Flahaut, E., Laurent, C., & Peigney, A. (2005). Catalytic cvd synthesis of double and triple-
walled carbon nanotubes by the control of the catalyst preparation. Carbon, 43(2),
375-383.
Fonseca, A., Hernadi, K., Nagy, J. B., Bernaerts, D., & Lucas, A. A. (1996). Optimization
of catalytic production and purification of buckytubes. Journal of Molecular
Catalysis A: Chemical, 107(1–3), 159-168.
Fonseca, A., Hernadi, K., Piedigrosso, P., Colomer, J.-F., Mukhopadhyay, K., Doome, R.,
et al. (1998). Synthesis of single-and multi-wall carbon nanotubes over supported
catalysts. Applied Physics A, 67(1), 11-22.
Franklin, N. R., Li, Y., Chen, R. J., Javey, A., & Dai, H. (2001). Patterned growth of
single-walled carbon nanotubes on full 4-inch wafers. Applied Physics Letters,
79(27), 4571-4573.
Freundlich, H. M. F. (1906). Over the adsorption in solution journal of physical chemistry,
57, 385-470.
Friberg, L., Nordberg, G.F. and Vouk, V.B. . ( 1979). Handbook on the toxicology of
metals. New York: Elsevier North Holland, 345.
Fu, D., Ma, Q., Zeng, X., Chen, J., Zhang, W., & Li, D. (2013). Synthesis and magnetic
properties of aligned carbon nanotubes by microwave-assisted pyrolysis of
acetylene. Physica E: Low-dimensional Systems and Nanostructures, 54, 185-190.
Fu, F., & Wang, Q. (2011). Removal of heavy metal ions from wastewaters: A review.
Journal of Environmental Management, 92(3), 407-418.
Gabaldon, C., MARZAL, P., SECO, A., & GONZALEZ, J. A. (2000). Cadmium and
copper removal by a granular activated carbon in laboratory column systems.
Separation Science and Technology, 35(7), 1039-1053.
Gamaly, E. G., & Ebbesen, T. W. (1995). Mechanism of carbon nanotube formation in the
arc discharge. Physical Review B, 52(3), 2083-2089.
Gao, Z., Bandosz, T. J., Zhao, Z., Han, M., & Qiu, J. (2009). Investigation of factors
affecting adsorption of transition metals on oxidized carbon nanotubes. Journal of
Hazardous Materials, 167(1–3), 357-365.
209
Geng, J., Singh, C., Shephard, D. S., Shaffer, M. S., Johnson, B. F., & Windle, A. H.
(2002). Synthesis of high purity single-walled carbon nanotubes in high yield.
Chemical Communications(22), 2666-2667.
Gibson, J. A. E. (1992). Early nanotubes? [10.1038/359369c0]. Nature, 359(6394), 369-
369.
Gogotsi, Y. (2006). Nanomaterials handbook: CRC press.
Gulino, G., Vieira, R., Amadou, J., Nguyen, P., Ledoux, M. J., Galvagno, S., et al. (2005).
C2h6 as an active carbon source for a large scale synthesis of carbon nanotubes by
chemical vapour deposition. Applied Catalysis A: General, 279(1–2), 89-97.
Günay, A., Arslankaya, E., & Tosun, İ. ( 7). Lead removal from aqueous solution by
natural and pretreated clinoptilolite: Adsorption equilibrium and kinetics. Journal of
Hazardous Materials, 146(1), 362-371.
Guo, T., Nikolaev, P., Thess, A., Colbert, D. T., & Smalley, R. E. (1995). Catalytic growth
of single-walled manotubes by laser vaporization. Chemical Physics Letters, 243(1–
2), 49-54.
Guo, T., Nikolaev, P. Rinzler, A.G., Tomanek, D., Colbert, D.T., Smalley, R.E. (1995).
Self-assembly of tubular fullerenes. J. Phys. Chem 10964-10697.
Han, J. H., Choi, S. H., Lee, T. Y., Yoo, J. B., Park, C. Y., Jeong, T. W., et al. (2002). Field
emission properties of modified carbon nanotubes grown on fe-coated glass using
pecvd with carbon monoxide. Physica B: Condensed Matter, 323(1–4), 182-183.
Harris, J. D., Raffaelle, R. P., Gennett, T., Landi, B. J., & Hepp, A. F. (2005). Growth of
multi-walled carbon nanotubes by injection cvd using cyclopentadienyliron
dicarbonyl dimer and cyclooctatetraene iron tricarbonyl. Materials Science and
Engineering: B, 116(3), 369-374.
Harris, P. J., & Harris, P. J. P. J. F. (2001). Carbon nanotubes and related structures: New
materials for the twenty-first century: Cambridge university press.
Harutyunyan, A. R., Pradhan, B. K., Kim, U. J., Chen, G., & Eklund, P. C. (2002). Cvd
synthesis of single wall carbon nanotubes under ―soft‖ conditions. Nano Letters,
2(5), 525-530.
Hatta, N., & Murata, K. (1994). Very long graphitic nano-tubules synthesized by plasma-
decomposition of benzene. Chemical Physics Letters, 217(4), 393-402.
Hayashi, Y., Tokunaga, T., Kaneko, K., Henley, S. J., Stolojan, V., Carey, J. D., et al.
(2006). Microstructure analyses of metal-filled carbon nanotubes synthesized by
microwave plasma-enhanced chemical vapor deposition. Nanotechnology, IEEE
Transactions on, 5(5), 485-490.

210
He, D., Li, H., Li, W., Haghi-Ashtiani, P., Lejay, P., & Bai, J. (2011). Growth of carbon
nanotubes in six orthogonal directions on spherical alumina microparticles. Carbon,
49(7), 2273-2286.
Hernadi, K., Fonseca, A., Nagy, J. B., Bernaerts, D., & Lucas, A. A. (1996). Fe-catalyzed
carbon nanotube formation. Carbon, 34(10), 1249-1257.
Herrera-Urbina, R., & Fuerstenau, D. (1995). The effect of pb (ii) species, ph and dissolved
carbonate on the zeta potential at the quartz/aqueous solution interface. Colloids and
Surfaces A: Physicochemical and Engineering Aspects, 98(1), 25-33.
Ho, Y.-S. (2006a). Review of second-order models for adsorption systems. Journal of
Hazardous Materials, 136(3), 681-689.
Ho, Y.-S. (2006b). Second-order kinetic model for the sorption of cadmium onto tree fern:
A comparison of linear and non-linear methods. Water Research, 40(1), 119-125.
Ho, Y., & McKay, G. (1999a). The sorption of lead (ii) ions on peat. Water Research,
33(2), 578-584.
Ho, Y. S., & McKay, G. (1999b). Pseudo-second order model for sorption processes.
Process Biochemistry, 34(5), 451-465.
Hone, J. (2001). Phonons and thermal properties of carbon nanotubes. In M. Dresselhaus,
G. Dresselhaus & P. Avouris (Eds.), Carbon nanotubes (Vol. 80, pp. 273-286):
Springer Berlin Heidelberg.
Hong, E. H., Lee, K. H., Oh, S. H., & Park, C. G. (2003). Synthesis of carbon nanotubes
using microwave radiation. Advanced Functional Materials, 13(12), 961-966.
Hou, B. X., R. Inoue,T. Einarsson,E. . Chiashi,S Shiomi,J. Miyoshi,A. Maruyama, S.
(2011). Decomposition of ethanol and dimethyl ether during chemical vapour
deposition synthesis of single-walled carbon nanotubes. Jpn J Appl Phys 50(6),
0651011-0651014.
Hsieh, S.-H., & Horng, J.-J. (2007). Adsorption behavior of heavy metal ions by carbon
nanotubes grown on microsized al< sub> 2</sub> o< sub> 3</sub> particles.
Journal of University of Science and Technology Beijing, Mineral, Metallurgy,
Material, 14(1), 77-84.
Hsieh, S.-H., Horng, J.-J., & Tsai, C.-K. (2006). Growth of carbon nanotube on micro-sized
al2o3 particle and its application to adsorption of metal ions. Journal of Materials
Research, 21(05), 1269-1273.

211
Hu, J., Chen, C., Zhu, X., & Wang, X. (2009). Removal of chromium from aqueous
solution by using oxidized multiwalled carbon nanotubes. Journal of Hazardous
Materials, 162(2–3), 1542-1550.
Huang, C.-W., Hsu, C.-H., Kuo, P.-L., Hsieh, C.-T., & Teng, H. (2011). Mesoporous
carbon spheres grafted with carbon nanofibers for high-rate electric double layer
capacitors. Carbon, 49(3), 895-903.
Huang, J. H., Chuang, C. C., & Tsai, C. H. (2003). Effect of nickel thickness and
microwave power on the growth of carbon nanotubes by microwave-heated
chemical vapor deposition. Microelectronic Engineering, 66(1–4), 10-16.
Huang, W., Wang, Y., Luo, G., & Wei, F. (2003). 99.9% purity multi-walled carbon
nanotubes by vacuum high-temperature annealing. Carbon, 41(13), 2585-2590.
Huang, Z., Xu, J., Ren, Z., Wang, J., Siegal, M., & Provencio, P. (1998). Growth of highly
oriented carbon nanotubes by plasma-enhanced hot filament chemical vapor
deposition. Applied Physics Letters, 73(26), 3845-3847.
Hugh, O. P. (1999). Handbook of chemical vapor deposition (cvd) principles, technology,
and applications. Second EditionWilliam Andrew publishing, llc Norwich, New
York, USA.
Hughes, T. V., & Chambers, C. R. Manufacture of carbon filaments,.
Huh, Y., Lee, J. Y., Cheon, J., Hong, Y. K., Koo, J. Y., Lee, T. J., et al. (2003). Controlled
growth of carbon nanotubes over cobalt nanoparticles by thermal chemical vapor
deposition. Journal of Materials Chemistry, 13(9), 2297-2300.
Hyung, H., & Kim, J.-H. (2008). Natural organic matter (nom) adsorption to multi-walled
carbon nanotubes: Effect of nom characteristics and water quality parameters.
Environmental Science & Technology, 42(12), 4416-4421.
Iijima, S. (1991). Helical microtubules of graphitic carbon. [10.1038/354056a0]. Nature,
354(6348), 56-58.
Iijima, S., & Ichihashi, T. (1993). Single-shell carbon nanotubes of 1-nm diameter.
[10.1038/363603a0]. Nature, 363(6430), 603-605.
Ikeda, T., Kamo, T., & Danno, M. (1995). New synthesis method of fullerenes using
microwave‐induced naphthalene‐nitrogen plasma at atmospheric
pressure. Applied Physics Letters, 67(7), 900-902.
Ikuno, T., Ryu, J. T., Oyama, T., Ohkura, S., Baek, Y. G., Honda, S., et al. (2002).
Characterization of low temperature growth carbon nanofibers synthesized by using
plasma enhanced chemical vapor deposition. Vacuum, 66(3-4), 341-345.

212
Ishigami, M., Cumings, J., Zettl, A., & Chen, S. (2000). A simple method for the
continuous production of carbon nanotubes. Chemical Physics Letters, 319(5–6),
457-459.
Ishioka, M., Okada, T., & Matsubara, K. (1993). Preparation of vapor-grown carbon fibers
in straight form by floating catalyst method in linz-donawitz converter gas. Carbon,
31(1), 123-127.
Ishioka, M., Okada, T., Matsubara, K., & Endo, M. (1992). Formation of vapor-grown
carbon fibers in co-co2-h2 mixtures, i. Influence of carrier gas composition.
Carbon, 30(6), 859-863.
Javey, A., Guo, J., Wang, Q., Lundstrom, M., & Dai, H. (2003). Ballistic carbon nanotube
field-effect transistors. [10.1038/nature01797]. Nature, 424(6949), 654-657.
Jennifer, R., and Lukes H. Z. . (2007). Thermal conductivity of individual single-wall
carbon nanotubes. J. Heat Transfer, 129(6), 705 -712.
Jiang, Q., & Zhao, Y. (2004). Effects of activation conditions on bet specific surface area of
activated carbon nanotubes. Microporous and Mesoporous Materials, 76(1–3), 215-
219.
Jiang, W., Ferkel, H., & Molian, P. (2004). Rapid production of carbon nanotubes by high-
power laser ablation. Journal of Manufacturing Science and Engineering, 127(3),
703-707.
José‐Yacamán, M., Miki‐Yoshida, M., Rendón, L., & Santiesteban, J. G. (1993). Catalytic
growth of carbon microtubules with fullerene structure. Applied Physics Letters,
62(2), 202-204.
Journet, C., & Bernier, P. (1998). Production of carbon nanotubes. Applied Physics A,
67(1), 1-9.
Journet, C., Maser, W. K., Bernier, P., Loiseau, A., Lamy de la Chapelle, M., Lefrant, S., et
al. (1997). Large-scale production of single-walled carbon nanotubes by the
electric-arc technique. Nature, 388(6644), 756-758.
Jung, S. H., Kim, M. R., Jeong, S. H., Kim, S. U., Lee, O. J., Lee, K. H., et al. (2003).
High-yield synthesis of multi-walled carbon nanotubes by arc discharge in liquid
nitrogen. Applied Physics A, 76(2), 285-286.
Kabbashi, N. A., Atieh, M. A., Al-Mamun, A., Mirghami, M. E. S., Alam, M. D. Z., &
Yahya, N. (2009). Kinetic adsorption of application of carbon nanotubes for pb(ii)
removal from aqueous solution. Journal of Environmental Sciences, 21(4), 539-544.

213
Kabbashi, N. A., Daoud, J.I., Isam, Y.Q., Mirghami, M.E.S., Rosli, N.F. and Nurhasni, F.R.
(2011). Statistical analaysis for removal of cadmium from aqueous solution at high
ph. Aust. J. Basic. Appl. Sci., 5(6), 440–446.
Kandah, M. I., & Meunier, J.-L. (2007). Removal of nickel ions from water by multi-walled
carbon nanotubes. Journal of Hazardous Materials, 146(1–2), 283-288.
Kasumov, Y. A., Shailos, A., Khodos, I. I., Volkov, V. T., Levashov, V. I., Matveev, V. N.,
et al. (2007). Cvd growth of carbon nanotubes at very low pressure of acetylene.
Applied Physics A, 88(4), 687-691.
Kataura, H., Kimura, A., Ohtsuka, Y., Suzuki, S., Maniwa, Y., Hanyu, T., et al. (1998).
Formation of thin single-wall carbon nanotubes by laser vaporization of rh/pd-
graphite composite rod. Japanese Journal of Applied Physics, Part 2: Letters, 37(5
B), L616-L618.
Kato, T., Matsumoto, T., Saito, T., Hayashi, J.-I., Kusakabe, K., & Morooka, S. (1993).
Effect of carbon source on formation of vapor-grown carbon fiber. Carbon, 31(6),
937-940.
Kharissova, O. V. (2004). Vertically aligned carbon nanotubes fabricated by microwaves.
Review Advances Materials Science, 7, 50.
Kiang, C.-H., Goddard Iii, W. A., Beyers, R., & Bethune, D. S. (1995). Carbon nanotubes
with single-layer walls. Carbon, 33(7), 903-914.
Kiang, C.-H., Goddard Iii, W. A., Beyers, R., Salem, J. R., & Bethune, D. S. (1996).
Catalytic effects of heavy metals on the growth of carbon nanotubes and
nanoparticles. Journal of Physics and Chemistry of Solids, 57(1), 35-39.
Kiang, C.-H., Goddard, W. A., III, Beyers, R., Salem, J. R., & Bethune, D. S. (1994).
Catalytic synthesis of single-layer carbon nanotubes with a wide range of diameters.
The Journal of Physical Chemistry, 98(26), 6612-6618.
Kiang, C. H., Dresselhaus, M. S., Beyers, R., & Bethune, D. S. (1996). Vapor-phase self-
assembly of carbon nanomaterials. Chemical Physics Letters, 259(1–2), 41-47.
Kiang, C. H., Endo, M., Ajayan, P. M., Dresselhaus, G., & Dresselhaus, M. S. (1998). Size
effects in carbon nanotubes. Physical Review Letters, 81(9), 1869-1872.
Kim, D. H., & Anderson, M. A. (1994). Photoelectrocatalytic degradation of formic acid
using a porous titanium dioxide thin-film electrode. Environmental Science &
Technology, 28(3), 479-483.
Kim, K.-E., Kim, K.-J., Jung, W. S., Bae, S. Y., Park, J., Choi, J., et al. (2005).
Investigation on the temperature-dependent growth rate of carbon nanotubes using
214
chemical vapor deposition of ferrocene and acetylene. Chemical Physics Letters,
401(4–6), 459-464.
Kim, N. S., Lee, Y. T., Park, J., Han, J. B., Choi, Y. S., Choi, S. Y., et al. (2003). Vertically
aligned carbon nanotubes grown by pyrolysis of iron, cobalt, and nickel
phthalocyanines. The Journal of Physical Chemistry B, 107(35), 9249-9255.
Kim, Y., Hayashi, T., Endo, M., Kaburagi, Y., Tsukada, T., Shan, J., et al. (2005a).
Synthesis and structural characterization of thin multi-walled carbon nanotubes with
a partially facetted cross section by a floating reactant method. Carbon, 43(11),
2243-2250.
Kim, Y. A., Hayashi, T., Endo, M., Kaburagi, Y., Tsukada, T., Shan, J., et al. (2005b).
Synthesis and structural characterization of thin multi-walled carbon nanotubes with
a partially facetted cross section by a floating reactant method. Carbon, 43(11),
2243-2250.
Kinniburgh, D. G. (1986). General purpose adsorption isotherms. Environmental Science &
Technology, 20(9), 895-904.
Kitiyanan, B., Alvarez, W. E., Harwell, J. H., & Resasco, D. E. (2000). Controlled
production of single-wall carbon nanotubes by catalytic decomposition of co on
bimetallic co–mo catalysts. Chemical Physics Letters, 317(3–5), 497-503.
Klinke, C., Bonard, J.-M., & Kern, K. (2001). Comparative study of the catalytic growth of
patterned carbon nanotube films. Surface Science, 492(1–2), 195-201.
Kobayashi, Y., Nakashima, H., Takagi, D., & Homma, Y. (2004). Cvd growth of single-
walled carbon nanotubes using size-controlled nanoparticle catalyst. Thin Solid
Films, 464, 286-289.
Kokai, F., Takahashi, K., Kasuya, D., Yudasaka, M., & Iijima, S. (2002). Growth dynamics
of single-wall carbon nanotubes and nanohorn aggregates by co2 laser vaporization
at room temperature. Applied Surface Science, 197–198(0), 650-655.
Kong, J., Cassell, A. M., & Dai, H. (1998). Chemical vapor deposition of methane for
single-walled carbon nanotubes. Chemical Physics Letters, 292(4–6), 567-574.
Konno, K., Onoe, K., Takiguchi, Y., & Yamaguchi, T. (2013). Direct preparation of
hydrogen and carbon nanotubes by microwave plasma decomposition of methane
over fe/si activated by biased hydrogen plasma. Green and Sustainable Chemistry,
3, 19.
Kroto, H. W., Heath, J. R., O'Brien, S. C., Curl, R. F., & Smalley, R. E. (1985). C60:
Buckminsterfullerene. [10.1038/318162a0]. Nature, 318(6042), 162-163.

215
Kuan, H.-C., Ma, C.-C. M., Chang, W.-P., Yuen, S.-M., Wu, H.-H., & Lee, T.-M. (2005).
Synthesis, thermal, mechanical and rheological properties of multiwall carbon
nanotube/waterborne polyurethane nanocomposite. Composites Science and
Technology, 65(11–12), 1703-1710.
Kuang, M. H., Wang, Z. L., Bai, X. D., Guo, J. D., & Wang, E. G. (2000). Catalytically
active nickel {110} surfaces in growth of carbon tubular structures. Applied Physics
Letters, 76(10), 1255-1257.
Kumar, M., & Ando, Y. (2010). Chemical vapor deposition of carbon nanotubes: A review
on growth mechanism and mass production. Journal of Nanoscience and
Nanotechnology, 10(6), 3739-3758.
Kuo, C.-S., Bai, A., Huang, C.-M., Li, Y.-Y., Hu, C.-C., & Chen, C.-C. (2005). Diameter
control of multiwalled carbon nanotubes using experimental strategies. Carbon,
43(13), 2760-2768.
Kuo, D. H., Su, M. Y., & Chen, W. R. (2006). Fast rate growth of organized carbon
nanotubes by cvd using iron pentacarbonyl as gas-phase catalyst. Chemical Vapor
Deposition, 12(6), 395-402.
Küttel, O. M., Groening, O., Emmenegger, C., & Schlapbach, L. (1998). Electron field
emission from phase pure nanotube films grown in a methane/hydrogen plasma.
Applied Physics Letters, 73(15), 2113-2115.
Lacerda, R., Teo, K., Teh, A., Yang, M., Dalal, S., Jefferson, D., et al. (2004). Thin-film
metal catalyst for the production of multi-wall and single-wall carbon nanotubes.
Journal of Applied Physics, 96(8), 4456-4462.
Lacerda, R. G., Teh, A. S., Yang, M. H., Teo, K. B. K., Rupesinghe, N. L., Dalal, S. H., et
al. (2004). Growth of high-quality single-wall carbon nanotubes without amorphous
carbon formation. Applied Physics Letters, 84(2), 269-271.
Lambert, J. M., Ajayan, P. M., & Bernier, P. (1995). Synthesis of single and multi-shell
carbon nanotubes. Synthetic Metals, 70(1–3), 1475-1476.
Langergren, S. S., B.K,. (1898). The theory of adsorption of solutes. Veternskapsakad
Handlingar, 24(4), 1-39.
Langmuir, I. (1918). The adsorption of gases on plane surfaces of glass, mica and platinum.
Journal of the American Chemical Society, 40(9), 1361-1403.
Lee, C. J., Lyu, S. C., Kim, H.-W., Park, C.-Y., & Yang, C.-W. (2002). Large-scale
production of aligned carbon nanotubes by the vapor phase growth method.
Chemical Physics Letters, 359(1–2), 109-114.

216
Lee, C. J., & Park, J. (2000). Growth model of bamboo-shaped carbon nanotubes by
thermal chemical vapor deposition. Applied Physics Letters, 77(21), 3397-3399.
Lee, J.-H., Lee, S. H., Kim, D., & Park, Y. S. (2013). The structural and surface properties
of carbon nanotube synthesized by microwave plasma chemical vapor deposition
method for superhydrophobic coating. Thin Solid Films, 546, 94-97.
Lee, K.-H. (2007). Low temperature synthesis of carbon nanotubes by direct microwave
irradiation: DTIC Document.
Lee, S. J., Kim, K., Kim, D. H., Park, J. O., & Park, G. T. (2002). Multiple magnification
images based micropositioning for 3d micro assembly.
Leyva Ramos, R., Bernal Jacome, L., Mendoza Barron, J., Fuentes Rubio, L., & Guerrero
Coronado, R. (2002). Adsorption of zinc (ii) from an aqueous solution onto
activated carbon. Journal of Hazardous Materials, 90(1), 27-38.
Li, H., He, D., Li, T., Genestoux, M., & Bai, J. (2010). Chemical kinetics of catalytic
chemical vapor deposition of an acetylene/xylene mixture for improved carbon
nanotube production. Carbon, 48(15), 4330-4342.
Li, J., Bai, G., Feng, J., & Jiang, W. (2005). Microstructure and mechanical properties of
hot-pressed carbon nanotubes compacted by spark plasma sintering. Carbon,
43(13), 2649-2653.
Li, W. Z., Xie, S. S., Qian, L. X., Chang, B. H., Zou, B. S., Zhou, W. Y., et al. (1996).
Large-scale synthesis of aligned carbon nanotubes. Science, 274(5293), 1701-1703.
Li, Y.-H., Di, Z., Ding, J., Wu, D., Luan, Z., & Zhu, Y. (2005). Adsorption thermodynamic,
kinetic and desorption studies of pb2+ on carbon nanotubes. Water Research, 39(4),
605-609.
Li, Y.-H., Ding, J., Luan, Z., Di, Z., Zhu, Y., Xu, C., et al. (2003). Competitive adsorption
of pb2+, cu2+ and cd2+ ions from aqueous solutions by multiwalled carbon
nanotubes. Carbon, 41(14), 2787-2792.
Li, Y.-H., Luan, Z., Xiao, X., Zhou, X., Xu, C., Wu, D., et al. (2003a). Removal of
cu2<sup>+</sup> ions from aqueous solutions by carbon nanotubes.
Adsorption Science & Technology, 21(5), 475-485.
Li, Y.-H., Luan, Z., Xiao, X., Zhou, X., Xu, C., Wu, D., et al. (2003b). Removal of cu2+
ions from aqueous solutions by carbon nanotubes. Adsorption Science &
Technology, 21(5), 475-485.
Li, Y.-H., Wang, S., Cao, A., Zhao, D., Zhang, X., Xu, C., et al. (2001). Adsorption of
fluoride from water by amorphous alumina supported on carbon nanotubes.
Chemical Physics Letters, 350(5–6), 412-416.

217
Li, Y.-H., Wang, S., Luan, Z., Ding, J., Xu, C., & Wu, D. (2003). Adsorption of
cadmium(ii) from aqueous solution by surface oxidized carbon nanotubes. Carbon,
41(5), 1057-1062.
Li, Y.-H., Wang, S., Wei, J., Zhang, X., Xu, C., Luan, Z., et al. (2002). Lead adsorption on
carbon nanotubes. Chemical Physics Letters, 357(3–4), 263-266.
Li, Y.-H., Zhu, Y., Zhao, Y., Wu, D., & Luan, Z. (2006). Different morphologies of carbon
nanotubes effect on the lead removal from aqueous solution. Diamond and Related
Materials, 15(1), 90-94.
Li, Y.-M., Sun, S.-Q., Zhou, Q., Qin, Z., Tao, J.-X., Wang, J., et al. (2004). Identification of
american ginseng from different regions using ft-ir and two-dimensional correlation
ir spectroscopy. Vibrational Spectroscopy, 36(2), 227-232.
Li, Y., Cui, R., Ding, L., Liu, Y., Zhou, W., Zhang, Y., et al. (2010). How catalysts affect
the growth of single-walled carbon nanotubes on substrates. Advanced Materials,
22(13), 1508-1515.
Li, Y., Liu, F., Xia, B., Du, Q., Zhang, P., Wang, D., et al. (2010). Removal of copper from
aqueous solution by carbon nanotube/calcium alginate composites. Journal of
Hazardous Materials, 177(1–3), 876-880.
Li, Y., Zhao, Y., Hu, W., Ahmad, I., Zhu, Y., Peng, X., et al. (2007). Carbon nanotubes-the
promising adsorbent in wastewater treatment. Paper presented at the Journal of
Physics: Conference Series.
Li, Y. H., Di, Z.C., Luan, Z.K., Ding, J., Zuo, H., Wu, X.Q., Xu, C.L. and Wu, D.H. .
(2004). Removal of heavy metals from aqueous solution by carbon nanotubes:
Adsorption equilibrium and kinetics. J. Environ. Sci. China, 16, 208–211.
Li, Z., Chen, J., Zhang, X., Li, Y., & Fung, K. K. (2002). Catalytic synthesized carbon
nanostructures from methane using nanocrystalline ni. Carbon, 40(3), 409-415.
Lidström, P., Tierney, J., Wathey, B., & Westman, J. (2001). Microwave assisted organic
synthesis—a review. Tetrahedron, 57(45), 9225-9283.
Lin, X., Wang, X. K., Dravid, V. P., Chang, R. P. H., & Ketterson, J. B. (1994). Large scale
synthesis of single‐shell carbon nanotubes. Applied Physics Letters, 64(2), 181-183.
Ling, T. Y., Lipan, S., and Singh, H. (2010). Performance of oxidation ponds in removing
heavy metals from pig farm wastewater. Middle-East Journal of Scientific
Research, 5, 163-169.

218
Liu, B., Ren, W., Gao, L., Li, S., Pei, S., Liu, C., et al. (2009). Metal-catalyst-free growth
of single-walled carbon nanotubes. Journal of the American Chemical Society,
131(6), 2082-2083.
Liu, B. C., Lyu, S. C., Lee, T. J., Choi, S. K., Eum, S. J., Yang, C. W., et al. (2003).
Synthesis of single- and double-walled carbon nanotubes by catalytic
decomposition of methane. Chemical Physics Letters, 373(5–6), 475-479.
Liu, C., Cheng, H. M., Cong, H. T., Li, F., Su, G., Zhou, B. L., et al. (2000). Synthesis of
macroscopically long ropes of well-aligned single-walled carbon nanotubes.
Advanced Materials, 12(16), 1190-1192.
Liu, J., Fan, S., & Dai, H. (2004). Recent advances in methods of forming carbon
nanotubes. MRS Bulletin, 29(04), 244-250.
Liu, J., Jiang, Z., Yu, H., & Tang, T. (2011). Catalytic pyrolysis of polypropylene to
synthesize carbon nanotubes and hydrogen through a two-stage process. Polymer
Degradation and Stability, 96(10), 1711-1719.
Liu, J., Zubiri, M. R. i., Vigolo, B., Dossot, M., Fort, Y., Ehrhardt, J.-J., et al. (2007).
Efficient microwave-assisted radical functionalization of single-wall carbon
nanotubes. Carbon, 45(4), 885-891.
Liu, R.-M., & Ting, J.-M. (2003). Growth of carbon nanotubes using microwave plasma-
enhanced chemical vapor deposition process. Materials Chemistry and Physics,
82(3), 571-574.
Long, R. Q., & Yang, R. T. (2001). Carbon nanotubes as superior sorbent for dioxin
removal. Journal of the American Chemical Society, 123(9), 2058-2059.
Lu, C., & Chiu, H. (2006b). Adsorption of zinc(ii) from water with purified carbon
nanotubes. Chemical Engineering Science, 61(4), 1138-1145.
Lu, C., & Chiu, H. (2008). Chemical modification of multiwalled carbon nanotubes for
sorption of zn< sup> 2+</sup> from aqueous solution. Chemical Engineering
Journal, 139(3), 462-468.
Lu, C., Chiu, H., & Bai, H. (2007). Comparisons of adsorbent cost for the removal of zinc
(ii) from aqueous solution by carbon nanotubes and activated carbon. Journal of
Nanoscience and Nanotechnology, 7(4-5), 4-5.
Lu, C., Chiu, H., & Liu, C. (2006b). Removal of zinc(ii) from aqueous solution by purified
carbon nanotubes: Kinetics and equilibrium studies. Industrial & Engineering
Chemistry Research, 45(8), 2850-2855.
Lu, C., & Liu, C. (2006). Removal of nickel(ii) from aqueous solution by carbon
nanotubes. Journal of Chemical Technology & Biotechnology, 81(12), 1932-1940.

219
Lu, C., Liu, C., & Rao, G. P. (2008). Comparisons of sorbent cost for the removal of ni2+
from aqueous solution by carbon nanotubes and granular activated carbon. Journal
of Hazardous Materials, 151(1), 239-246.
Lu, C., Liu, C., & Su, F. (2009). Sorption kinetics, thermodynamics and competition of
ni2+ from aqueous solutions onto surface oxidized carbon nanotubes. Desalination,
249(1), 18-23.
Lu, C., & Su, F. (2007). Adsorption of natural organic matter by carbon nanotubes.
Separation and Purification Technology, 58(1), 113-121.
Luo, J. Z., Gao, L. Z., Leung, Y. L., & Au, C. T. (2000). The decomposition of no on cnts
and 1 wt% rh/cnts. Catalysis Letters, 66(1-2), 91-97.
M.J. Temkin, & Pyzhev, V. (1940). Acta physiochim. URSS, 12, 217.
Machida, M., Kikuchi, Y., Aikawa, M., & Tatsumoto, H. (2004). Kinetics of adsorption
and desorption of pb (ii) in aqueous solution on activated carbon by two-site
adsorption model. Colloids and Surfaces A: Physicochemical and Engineering
Aspects, 240(1), 179-186.
Magrez, A., Smajda, R., Seo, J. W., Horv th, E., Ribic , P. R., Andresen, J. C., et al. ( 11).
Striking influence of the catalyst support and its acid–base properties: New insight
into the growth mechanism of carbon nanotubes. ACS Nano, 5(5), 3428-3437.
Maroto Valiente, A., Navarro L pez, P., Rodr guez Ramos, I., Guerrero Ruiz, A., Li, C., &
Xin, Q. (2000). In situ study of carbon nanotube formation by c2h2 decomposition
on an iron-based catalyst. Carbon, 38(14), 2003-2006.
Maruyama, S., Kojima, R., Miyauchi, Y., Chiashi, S., & Kohno, M. (2002). Low-
temperature synthesis of high-purity single-walled carbon nanotubes from alcohol.
Chemical Physics Letters, 360(3–4), 229-234.
Masao Yamaguchi, L. P., Seiji Akita, and Yoshikazu Nakayama (2008). Effect of residual
acetylene gas on growth of vertically aligned carbon nanotubes. Jpn. J. Appl. Phys,
47, 1937-1940.
Masciangioli, T., & Zhang, W.-X. (2003). Peer reviewed: Environmental technologies at
the nanoscale. Environmental Science & Technology, 37(5), 102A-108A.
Maser, W. K., Mu oz, E., Benito, A. M., Mart nez, M. T., de la Fuente, G. F., Maniette, .,
et al. (1998). Production of high-density single-walled nanotube material by a
simple laser-ablation method. Chemical Physics Letters, 292(4–6), 587-593.

220
McKee, G. S. B., Deck, C. P., & Vecchio, K. S. (2009). Dimensional control of multi-
walled carbon nanotubes in floating-catalyst cvd synthesis. Carbon, 47(8), 2085-
2094.
MDC. (1997). Laws of malaysia-environmental quality act 1974 and regulations, fourth
ed.Kuala lumpur. Sdn.Bhd.
Meena, A. K., Kadirvelu, K., Mishraa, G., Rajagopal, C., & Nagar, P. (2008). Adsorption
of pb (ii) and cd (ii) metal ions from aqueous solutions by mustard husk. Journal of
Hazardous Materials, 150(3), 619-625.
Méndez, U. O., Kharissova, O. V., & Rodríguez, M. (2003). Synthesis and morphology of
nanostructures via microwave heating. Review Advance Materials Science, 5, 398.
Monthioux, M., & Kuznetsov, V. L. (2006). Who should be given the credit for the
discovery of carbon nanotubes? Carbon, 44(9), 1621-1623.
Moon, J.-M., An, K. H., Lee, Y. H., Park, Y. S., Bae, D. J., & Park, G.-S. (2001). High-
yield purification process of singlewalled carbon nanotubes. The Journal of
Physical Chemistry B, 105(24), 5677-5681.
Moradi, O., Zare, K. and Yari, M. . (2011). Interaction of some heavy metal ions with
single walled carbon nanotube. Int. J. Nano. Dim, 1(3)(203-220).
Mordkovich, V. Z., Yoshimura, S., & Chang, R. P. H. (1998). In supercarbon: Synthesis,
properties and applications. Springer, 107-118.
Muataz, A. A., Fakhrul-Razi, A. A., Dayang, B. A. R., Lsadig, M. E., Chuah, G. T., Ma'an,
F. A., et al. (2003). Carbon nanofiber and carbon nanotube production by floating
catalyst chemical vapour deposition (fc-cvd). Update on Microscopy and
Microanalysis, 14-17.
Muataz, A. A. F.-R., A. . Dayang,B.A.R . EL-Sadig,M Chuah,G.T. . Maan,F. A . Sunny,I
Faizah, Y. Abdul Hamid,M, Mohd Halim, I.S. . (2003). Production of vapor
growth carbon fiber (vgcf) by using cvd. Somche, 596-602.
Mubarak, N., Daniel, S., Khalid, M., & Tan, J. (2012). Comparative study of functionalize
and non-functionalized carbon nanotube for removal of copper from polluted water.
International Journal of Chemical & Environmental Engineering, 3(5), 314-317.
Mubarak, N. M., Alicia, R. F., Abdullah, E. C., Sahu, J. N., Haslija, A. B. A., & Tan, J.
(2013). Statistical optimization and kinetic studies on removal of zn2+ using
functionalized carbon nanotubes and magnetic biochar. Journal of Environmental
Chemical Engineering, 1(3), 486-495.
Mubarak, N. M., Ruthiraan, M., Sahu, J. N., Abdullah, E. C., Jayakumar, N. S., Sajuni, N.
R., et al. (2014). Adsorption and kinetic study on sn2+ removal using modified
221
carbon nanotube and magnetic biochar. International Journal of Nanoscience,
1350044.
Mubarak, N. M., Yusof, F., & Alkhatib, M. F. (2011). The production of carbon nanotubes
using two-stage chemical vapor deposition and their potential use in protein
purification. Chemical Engineering Journal, 168(1), 461-469.
Mukhopadhyay, K., Koshio, A., Sugai, T., Tanaka, N., Shinohara, H., Konya, Z., et al.
(1999). Bulk production of quasi-aligned carbon nanotube bundles by the catalytic
chemical vapour deposition (ccvd) method. Chemical Physics Letters, 303(1–2),
117-124.
Muñoz, E., Maser, W. K., Benito, A. M., Mart nez, M. T., de la Fuente, G. F., Maniette, .,
et al. (2000). Gas and pressure effects on the production of single-walled carbon
nanotubes by laser ablation. Carbon, 38(10), 1445-1451.
Murakami, Y., Miyauchi, Y., Chiashi, S., & Maruyama, S. (2003). Characterization of
single-walled carbon nanotubes catalytically synthesized from alcohol. Chemical
Physics Letters, 374(1), 53-58.
Muyibi, S. A., Ambali, A. R., & Eissa, G. S. (2008). Development-induced water pollution
in malaysia: Policy implications from an econometric analysis. [Article]. Water
Policy, 10(2), 193-206.
N. Grobert, J. P. H., W.-K. Hsu, H. W. Kroto, M. Terrones,, & Zhu, D. R. M. W. a. Y. Q.
(1999). New advances in the creation of nanostructured materials. Pure Appl. Chem,
71(11), 2125-2130.
Nagaraju, N., Fonseca, A., Konya, Z., & Nagy, J. B. (2002). Alumina and silica supported
metal catalysts for the production of carbon nanotubes. Journal of Molecular
Catalysis A: Chemical, 181(1–2), 57-62.
Narkiewicz, U., Podsiadły, M., Jędrzejewski, R., & Pełech, I. ( 1 ). Catalytic
decomposition of hydrocarbons on cobalt, nickel and iron catalysts to obtain carbon
nanomaterials. Applied Catalysis A: General, 384(1–2), 27-35.
Ngah, W., & Fatinathan, S. (2008). Adsorption of cu (ii) ions in aqueous solution using
chitosan beads, chitosan–gla beads and chitosan–alginate beads. Chemical
Engineering Journal, 143(1), 62-72.
Nie, H., Cui, M., & Russell, T. P. (2013). A route to rapid carbon nanotube growth.
Chemical Communications, 49(45), 5159-5161.
Nikolaev, P. (2004). Gas-phase production of single-walled carbon nanotubes from carbon
monoxide: A review of the hipco process. Journal of Nanoscience and
Nanotechnology, 4(4), 307-316.

222
Nikolaev, P., Bronikowski, M. J., Bradley, R. K., Rohmund, F., Colbert, D. T., Smith, K.
A., et al. (1999). Gas-phase catalytic growth of single-walled carbon nanotubes
from carbon monoxide. Chemical Physics Letters, 313(1–2), 91-97.
Ning, Y., Zhang, X., Wang, Y., Sun, Y., Shen, L., Yang, X., et al. (2002). Bulk production
of multi-wall carbon nanotube bundles on sol–gel prepared catalyst. Chemical
Physics Letters, 366(5–6), 555-560.
Nuchter, M., Ondruschka, B., Bonrath, W., & Gum, A. (2004). Microwave assisted
synthesis - a critical technology overview. [10.1039/B310502D]. Green Chemistry,
6(3), 128-141.
Oberlin, A., Endo, M., & Koyama, T. (1976). Filamentous growth of carbon through
benzene decomposition. Journal of Crystal Growth, 32(3), 335-349.
Odom, T. W., Huang, J.-L., Kim, P., & Lieber, C. M. (1998). Atomic structure and
electronic properties of single-walled carbon nanotubes. [10.1038/34145]. Nature,
391(6662), 62-64.
Otsuka, K., Abe, Y., Kanai, N., Kobayashi, Y., Takenaka, S., & Tanabe, E. (2004).
Synthesis of carbon nanotubes on ni/carbon-fiber catalysts under mild conditions.
Carbon, 42(4), 727-736.
Palizdar, M., Ahgababazadeh, R., Mirhabibi, A., Brydson, R., & Pilehvari, S. (2011).
Investigation of fe/mgo catalyst support precursors for the chemical vapour
deposition growth of carbon nanotubes. Journal of Nanoscience and
Nanotechnology, 11(6), 5345-5351.
Pan, S.-C., Lin, C.-C., & Tseng, D.-H. (2003). Reusing sewage sludge ash as adsorbent for
copper removal from wastewater. Resources, Conservation and Recycling, 39(1),
79-90.
Pan, Z., Xie, S., Lu, L., Chang, B., Sun, L., Zhou, W., et al. (1999). Tensile tests of ropes of
very long aligned multiwall carbon nanotubes. Applied Physics Letters, 74(21),
3152-3154.
Park, Y. S., Kim, T. H., Lee, M. H., & Kwon, S. C. (2002). Study on the effect of ultrasonic
waves on the characteristics of electroless nickel deposits from an acid bath. Surface
and Coatings Technology, 153(2–3), 245-251.
Pehlivan, E., an k, B., Ahmetli, G., & Pehlivan, M. ( 8). Equilibrium isotherm studies
for the uptake of cadmium and lead ions onto sugar beet pulp. Bioresource
Technology, 99(9), 3520-3527.
Peng, H., Alemany, L. B., Margrave, J. L., & Khabashesku, V. N. (2003). Sidewall
carboxylic acid functionalization of single-walled carbon nanotubes. Journal of the
American Chemical Society, 125(49), 15174-15182.

223
Peng, X., Luan, Z., Di, Z., Zhang, Z., & Zhu, C. (2005). Carbon nanotubes-iron oxides
magnetic composites as adsorbent for removal of pb(ii) and cu(ii) from water.
Carbon, 43(4), 880-883.
P rez-Cabero, M., Monz n, A., Rodr guez-Ramos, I., & Guerrero-Ru z, A. ( 4).
Syntheses of cnts over several iron-supported catalysts: Influence of the metallic
precursors. Catalysis Today, 93–95(0), 681-687.
Pimenta, M. A., Jorio, A., Brown, S. D. M., Souza Filho, A. G., Dresselhaus, G., Hafner, J.
H., et al. (2001). Diameter dependence of the raman d-band in isolated single-wall
carbon nanotubes. Physical Review B, 64(4), 041401.
Pinault, M., Mayne-L‘Hermite, M., Reynaud, C., Pichot, V., Launois, P., & Ballutaud, D.
(2005). Growth of multiwalled carbon nanotubes during the initial stages of aerosol-
assisted ccvd. Carbon, 43(14), 2968-2976.
Pinheiro, J. P., Schouler, M. C., & Gadelle, P. (2003). Nanotubes and nanofilaments from
carbon monoxide disproportionation over co/mgo catalysts: I. Growth versus
catalyst state. Carbon, 41(15), 2949-2959.
Qian, D., Wagner, G. J., Liu, W. K., Yu, M.-F., & Ruoff, R. S. (2002). Mechanics of
carbon nanotubes. Applied Mechanics Reviews, 55(6), 495-533.
Qian, W., Liu, T., Wei, F., & Yuan, H. (2003). Quantitative raman characterization of the
mixed samples of the single and multi-wall carbon nanotubes. Carbon, 41(9), 1851-
1854.
Qiu, J., An, Y., Zhao, Z., Li, Y., & Zhou, Y. (2004a). Catalytic synthesis of single-walled
carbon nanotubes from coal gas by chemical vapor deposition method. Fuel
processing technology, 85(8), 913-920.
Qiu, J., An, Y., Zhao, Z., Li, Y., & Zhou, Y. (2004b). Catalytic synthesis of single-walled
carbon nanotubes from coal gas by chemical vapor deposition method. Fuel
processing technology, 85(8–10), 913-920.
Quinton, B. T., Barnes, P. N., Varanasi, C. V., Burke, J., Tsao, B.-H., Yost, K. J., et al.
(2013). A comparative study of three different chemical vapor deposition
techniques of carbon nanotube growth on diamond films. Journal of Nanomaterials,
2013, 9.
Radushkevich, L. V., & Lukyanovich, V. M. (1952). J. Phys. Chem. Russia, 1, 88.
Rao, G. P., Lu, C., & Su, F. (2007). Sorption of divalent metal ions from aqueous solution
by carbon nanotubes: A review. Separation and Purification Technology, 58(1),
224-231.

224
Rao, K., Mohapatra, M., Anand, S., & Venkateswarlu, P. (2010). Review on cadmium
removal from aqueous solutions. International Journal of Engineering, Science and
Technology, 2(7).
Ren, Z. F., Huang, Z. P., Wang, D. Z., Wen, J. G., Xu, J. W., Wang, J. H., et al. (1999).
Growth of a single freestanding multiwall carbon nanotube on each nanonickel dot.
Applied Physics Letters, 75(8), 1086-1088.
Rinzler, A. G., Liu, J., Dai, H., Nikolaev, P., Huffman, C. B., Rodríguez-Macías, F. J., et al.
(1998). Large-scale purification of single-wall carbon nanotubes: Process, product,
and characterization. Applied Physics A, 67(1), 29-37.
Rohmund, F., Falk, L. K. L., & Campbell, E. E. B. (2000). A simple method for the
production of large arrays of aligned carbon nanotubes. Chemical Physics Letters,
328(4–6), 369-373.
Ru, C. (2000). Effect of van der waals forces on axial buckling of a double-walled carbon
nanotube. Journal of Applied Physics, 87(10), 7227-7231.
Ruparelia, J. P., Duttagupta, S. P., Chatterjee, A. K., & Mukherji, S. (2008). Potential of
carbon nanomaterials for removal of heavy metals from water. Desalination, 232(1–
3), 145-156.
Saito, R. (1998). Physical properties of carbon nanotubes (paperback).
Saito, R., & Kataura, H. (2001). Optical properties and raman spectroscopy of carbon
nanotubes. In M. Dresselhaus, G. Dresselhaus & P. Avouris (Eds.), Carbon
nanotubes (Vol. 80, pp. 213-247): Springer Berlin Heidelberg.
Saito, Y., Hamaguchi, K., Nishino, T., Hata, K., Tohji, K., Kasuya, A., et al. (1997). Field
emission patterns from single-walled carbon nanotubes. Jpn. J. Appl. Phys, 36(10).
Saito, Y., Kawabata, K., & Okuda, M. (1995). Single-layered carbon nanotubes synthesized
by catalytic assistance of rare-earths in a carbon arc. The Journal of Physical
Chemistry, 99(43), 16076-16079.
Saito, Y., Nishikubo, K., Kawabata, K., & Matsumoto, T. (1996). Carbon nanocapsules and
single‐layered nanotubes produced with platinum‐group metals (ru, rh, pd, os, ir, pt)
by arc discharge. Journal of Applied Physics, 80(5), 3062-3067.
Saito, Y., Okuda, M., Tomita, M., & Hayashi, T. (1995). Extrusion of single-wall carbon
nanotubes via formation of small particles condensed near an arc evaporation
source. Chemical Physics Letters, 236(4–5), 419-426.
Saito, Y., Yoshikawa, T., Bandow, S., Tomita, M., & Hayashi, T. (1993). Interlayer
spacings in carbon nanotubes. Physical Review B, 48(3), 1907-1909.

225
Salmani, M. H., Davoodi, M., Ehrampoush, M. H., Ghaneian, M. T., & Fallahzadah, M. H.
(2013). Removal of cadmium (ii) from simulated wastewater by ion flotation
technique. Iranian Journal of Environmental Health Science and Engineering,
10(1), 16.
Santangelo, S., Messina, G., Faggio, G., Lanza, M., Pistone, A., & Milone, C. (2010).
Calibration of reaction parameters for the improvement of thermal stability and
crystalline quality of multi-walled carbon nanotubes. Journal of Materials Science,
45(3), 783-792.
Satio, Y. O., M., Fujimoto, N. Yoshikawa,T. Tomita,M, Hayashi,T.J. (1994). Single-wall
carbon nanotubes growing radially from ni fine particles formed by arc evaporation.
J. Appl. Phys, 33, L526-L529.
Satishkumar, B., Thomas, P. J., Govindaraj, A., & Rao, C. (2000). Y-junction carbon
nanotubes. Applied Physics Letters, 77(16), 2530-2532.
Satishkumar, B. C., Govindaraj, A., & Rao, C. N. R. (1999). Bundles of aligned carbon
nanotubes obtained by the pyrolysis of ferrocene–hydrocarbon mixtures: Role of the
metal nanoparticles produced in situ. Chemical Physics Letters, 307(3–4), 158-162.
Satishkumar, B. C., Govindaraj, A., Sen, R., & Rao, C. N. R. (1998). Single-walled
nanotubes by the pyrolysis of acetylene-organometallic mixtures. Chemical Physics
Letters, 293(1–2), 47-52.
Schadler, L., Giannaris, S., & Ajayan, P. (1998). Load transfer in carbon nanotube epoxy
composites. Applied Physics Letters, 73, 3842.
Schujman, S., Vajtai, R., Biswas, S., Dewhirst, B., Schowalter, L., & Ajayan, P. (2002).
Electrical behavior of isolated multiwall carbon nanotubes characterized by
scanning surface potential microscopy. Applied Physics Letters, 81(3), 541-543.
Sen, R., Govindaraj, A., & Rao, C. N. R. (1997). Carbon nanotubes by the metallocene
route. Chemical Physics Letters, 267(3–4), 276-280.
Seraphin, S., & Zhou, D. (1994). Single‐walled carbon nanotubes produced at high yield by
mixed catalysts. Applied Physics Letters, 64(16), 2087-2089.
Seraphin, S., Zhou, D., Jiao, J., Minke, M. A., Wang, S., Yadav, T., et al. (1994). Catalytic
role of nickel, palladium, and platinum in the formation of carbon nanoclusters.
Chemical Physics Letters, 217(3), 191-195.
Seraphin, S., Zhou, D., Jiao, J., Withers, J. C., & Loutfy, R. (1993). Effect of processing
conditions on the morphology and yield of carbon nanotubes. Carbon, 31(5), 685-
689.

226
Shi, Z., Lian, Y., Liao, F. H., Zhou, X., Gu, Z., Zhang, Y., et al. (2000). Large scale
synthesis of single-wall carbon nanotubes by arc-discharge method. Journal of
Physics and Chemistry of Solids, 61(7), 1031-1036.
Shi, Z., Zhou, X., Jin, Z., Gu, Z., Wang, J., Feng, S., et al. (1996). High yield synthesis and
growth mechanism of carbon nanotubes. Solid State Communications, 97(5), 371-
375.
Shirazi, Y., Tofighy, M. A., Mohammadi, T., & Pak, A. (2011). Effects of different carbon
precursors on synthesis of multiwall carbon nanotubes: Purification and
functionalization. Applied Surface Science, 257(16), 7359-7367.
Shukla, B., Saito, T., Ohmori, S., Koshi, M., Yumura, M., & Iijima, S. (2010).
Interdependency of gas phase intermediates and chemical vapor deposition growth
of single wall carbon nanotubes. Chemistry of Materials, 22(22), 6035-6043.
Sing, K. S. W., Everett, D. H., Haul, R. A. W., Moscou, L., Pierotti, R. A., Rouquerol, J., et
al. (1985). Pure and Applied Chemistry, 57, 603-V.
Singh, C., Shaffer, M. S. P., & Windle, A. H. (2003). Production of controlled architectures
of aligned carbon nanotubes by an injection chemical vapour deposition method.
Carbon, 41(2), 359-368.
Sinha, A. K., Hwang, D. W., & Hwang, L.-P. (2000). A novel approach to bulk synthesis of
carbon nanotubes filled with metal by a catalytic chemical vapor deposition method.
Chemical Physics Letters, 332(5–6), 455-460.
Sinha, N., & Yeow, J. T. W. (2005). Carbon nanotubes for biomedical applications.
NanoBioscience, IEEE Transactions on, 4(2), 180-195.
Sinnott, S. B., Andrews, R., Qian, D., Rao, A. M., Mao, Z., Dickey, E. C., et al. (1999).
Model of carbon nanotube growth through chemical vapor deposition. Chemical
Physics Letters, 315(1–2), 25-30.
Smith, B. C. (1998). Infrared spectral interpretation: A systematic approach: CRC press.
Srivastava, D., Wei, C., & Cho, K. (2003). Nanomechanics of carbon nanotubes and
composites. Applied Mechanics Reviews, 56(2), 215-230.
Stafiej, A., & Pyrzynska, K. (2007). Adsorption of heavy metal ions with carbon
nanotubes. Separation and Purification Technology, 58(1), 49-52.
Stevens, J. L., Huang, A. Y., Peng, H., Chiang, I. W., Khabashesku, V. N., & Margrave, J.
L. (2003). Sidewall amino-functionalization of single-walled carbon nanotubes
through fluorination and subsequent reactions with terminal diamines. Nano Letters,
3(3), 331-336.

227
Strano, M. S., Doorn, S. K., Haroz, E. H., Kittrell, C., Hauge, R. H., & Smalley, R. E.
(2003). Assignment of (n, m) raman and optical features of metallic single-walled
carbon nanotubes. Nano Letters, 3(8), 1091-1096.
Su, M., Zheng, B., & Liu, J. (2000). A scalable cvd method for the synthesis of single-
walled carbon nanotubes with high catalyst productivity. Chemical Physics Letters,
322(5), 321-326.
Takizawa, M., Bandow, S., Torii, T., & Iijima, S. (1999). Effect of environment
temperature for synthesizing single-wall carbon nanotubes by arc vaporization
method. Chemical Physics Letters, 302(1–2), 146-150.
Taniguchi, M., Nagao, H., Hiramatsu, M., Ando, Y., & Hori, M. (2005). Preparation of
dense carbon nanotube film using microwave plasma-enhanced chemical vapor
deposition. Diamond and Related Materials, 14(3), 855-858.
Tans, S. J., Devoret, M. H., Dai, H., Thess, A., Smalley, R. E., Geerligs, L., et al. (1997).
Individual single-wall carbon nanotubes as quantum wires. Nature, 386(6624), 474-
477.
Tapasztó, L., Kertész, K., Vértesy, Z., Horváth, Z. E., Koós, A. A., Osváth, Z., et al. (2005).
Diameter and morphology dependence on experimental conditions of carbon
nanotube arrays grown by spray pyrolysis. Carbon, 43(5), 970-977.
Tatsuki, H., Tomoju, K., & Junichi, K. (2003). Selective synthesis of double-wall carbon
nanotubes by ccvd of acetylene using zeolite supports. Chemical Physics Letters,
382, 679-685.
Tehrani, M. S., Azar, P.A.,Namin,P.E.,Dehagi,S.M. (2014). Removal of lead ions from
aqueous solution using multiwalled carbon nanotubes:The effect of
functionalization. J. Appl. Environ. Biol. Sci., 4(2), 316-326.
Teng, I.-J., Hsu, H.-L., Jian, S.-R., Wang, L.-C., Chen, K.-L., Kuo, C.-T., et al. (2013).
Temperature-dependent electrical and photo-sensing properties of horizontally-
oriented carbon nanotube networks synthesized by sandwich-growth microwave
plasma chemical vapor deposition. Thin Solid Films, 529, 190-194.
Teo, K. B., Singh, C., Chhowalla, M., & Milne, W. I. (2003). Catalytic synthesis of carbon
nanotubes and nanofibers. Encyclopedia of nanoscience and nanotechnology, 10(1).
Terrones, M. (2003). Science and technology of the twenty-first century: Synthesis,
properties, and applications of carbon nanotubes. Annual Review of Materials
Research, 33(1), 419-501.
Thess, A., Lee, R., Nikolaev, P., Dai, H., Petit, P., Robert, J., et al. (1996). Crystalline ropes
of metallic carbon nanotubes. Science, 273(5274), 483-487.
228
Tofighy, M. A., & Mohammadi, T. (2011). Adsorption of divalent heavy metal ions from
water using carbon nanotube sheets. Journal of Hazardous Materials, 185(1), 140-
147.
Tomie, T., Inoue, S., Kohno, M., & Matsumura, Y. (2010). Prospective growth region for
chemical vapor deposition synthesis of carbon nanotube on c–h–o ternary diagram.
Diamond and Related Materials, 19(11), 1401-1404.
Tsai, W., Chang, C., Lin, M., Chien, S., Sun, H., & Hsieh, M. (2001). Adsorption of acid
dye onto activated carbons prepared from agricultural waste bagasse by zncl< sub>
2</sub> activation. Chemosphere, 45(1), 51-58.
Tumin, N. D., Chuah, A. L., Zawani, Z., & Rashid, S. A. (2008). Adsorption of copper
from aqueous solution by elais guineensis kernel activated carbon. Journal of
Engineering Science and Technology, 3(2), 180-189.
Vajtai, R., Wei, B., Zhang, Z., Jung, Y., Ramanath, G., & Ajayan, P. (2002). Building
carbon nanotubes and their smart architectures. Smart Materials and Structures,
11(5), 691.
V zquez, E., & Prato, M. ( 9). Carbon nanotubes and microwaves: Interactions,
responses, and applications. ACS Nano, 3(12), 3819-3824.
Veziri, C. M., Pilatos, G., Karanikolos, G. N., Labropoulos, A., Kordatos, K., Kasselouri-
Rigopoulou, V., et al. (2008). Growth and optimization of carbon nanotubes in
activated carbon by catalytic chemical vapor deposition. Microporous and
Mesoporous Materials, 110(1), 41-50.
Vilar, V. J., Botelho, C., & Boaventura, R. A. (2006). Equilibrium and kinetic modelling of
cd (ii) biosorption by algae< i> gelidium</i> and agar extraction algal waste. Water
Research, 40(2), 291-302.
Vivas-Castro, J., Rueda-Morales, G., Ortega-Cervantez, G., Moreno-Ruiz, L., Ortega-
Aviles, M., & Ortiz-Lopez, J. (2011). Synthesis of carbon nanostructures by
microwave irradiation.
Vuković, G. D., Marinković, A. D., Čolić, M., Ristić, M. Đ., Aleksić, R., Perić-Grujić, A.
A., et al. (2010). Removal of cadmium from aqueous solutions by oxidized and
ethylenediamine-functionalized multi-walled carbon nanotubes. Chemical
Engineering Journal, 157(1), 238-248.
Wagner, H. D., Lourie, O., Feldman, Y., & Tenne, R. (1998). Stress-induced fragmentation
of multiwall carbon nanotubes in a polymer matrix. Applied Physics Letters, 72(2),
188-190.

229
Wang, H., Zhou, A., Peng, F., Yu, H., & Yang, J. (2007). Mechanism study on adsorption
of acidified multiwalled carbon nanotubes to pb(ii). Journal of Colloid and
Interface Science, 316(2), 277-283.
Wang, H. J., Zhou, A. L., Peng, F., Yu, H., & Chen, L. F. (2007). Adsorption characteristic
of acidified carbon nanotubes for heavy metal pb(ii) in aqueous solution. [Article].
Materials Science and Engineering a-Structural Materials Properties
Microstructure and Processing, 466(1-2), 201-206.
Wang, S.-G., Gong, W.-X., Liu, X.-W., Yao, Y.-W., Gao, B.-Y., & Yue, Q.-Y. (2007).
Removal of lead(ii) from aqueous solution by adsorption onto manganese oxide-
coated carbon nanotubes. Separation and Purification Technology, 58(1), 17-23.
Wang, S., Zhu, W., Liao, D., Ng, C., & Au, C. (2004). In situ ftir studies of no reduction
over carbon nanotubes (cnts) and 1wt.% pd/cnts. Catalysis Today, 93, 711-714.
Wang, X., Chen, C., Hu, W., Ding, A., Xu, D., & Zhou, X. (2005). Sorption of 243am(iii)
to multiwall carbon nanotubes. Environmental Science & Technology, 39(8), 2856-
2860.
Wang, X., Hu, Z., Chen, X., & Chen, Y. (2001). Preparation of carbon nanotubes and nano-
particles by microwave plasma-enhanced chemical vapor deposition. Scripta
Materialia, 44(8–9), 1567-1570.
Wei, B. Q., Vajtai, R., Jung, Y., Ward, J., Zhang, R., Ramanath, G., et al. (2002).
Microfabrication technology: Organized assembly of carbon nanotubes.
[10.1038/416495a]. Nature, 416(6880), 495-496.
Weng, C.-H., & Huang, C. (2004). Adsorption characteristics of zn (ii) from dilute aqueous
solution by fly ash. Colloids and Surfaces A: Physicochemical and Engineering
Aspects, 247(1), 137-143.
Wiles, P. G., & Abrahamson, J. (1978). Carbon fibre layers on arc electrodes—i: Their
properties and cool-down behaviour. Carbon, 16(5), 341-349.
Willems, I., Konya, Z., Colomer, J.-F., Van Tendeloo, G., Nagaraju, N., Fonseca, A., et al.
(2000). Control of the outer diameter of thin carbon nanotubes synthesized by
catalytic decomposition of hydrocarbons. Chemical Physics Letters, 317(1), 71-76.
Willems, I., Kónya, Z., Colomer, J. F., Van Tendeloo, G., Nagaraju, N., Fonseca, A., et al.
(2000). Control of the outer diameter of thin carbon nanotubes synthesized by
catalytic decomposition of hydrocarbons. Chemical Physics Letters, 317(1–2), 71-
76.
Wirojanagud, W., Tantemsapya, N., & Tantriratna, P. (2004). Precipitation of heavy metals
by lime mud waste of pulp and paper mill. Songklanakarin J. Sci. Technol, 26, 45-
53.

230
Wójtowicz, A., & Stoklosa, A. (2002). Removal of heavy metal ions on smectite ion-
exchange column. Polish Journal of Environmental Studies, 11(1), 97-101.
Wu, C.-H. (2007). Studies of the equilibrium and thermodynamics of the adsorption of
cu2+ onto as-produced and modified carbon nanotubes. Journal of Colloid and
Interface Science, 311(2), 338-346.
Xu, D., Tan, X., Chen, C., & Wang, X. (2008). Removal of pb(ii) from aqueous solution by
oxidized multiwalled carbon nanotubes. Journal of Hazardous Materials, 154(1–3),
407-416.
Xu, Y.-j., Rosa, A., Liu, X., & Su, D.-s. (2011). Characterization and use of functionalized
carbon nanotubes for the adsorption of heavy metal anions. New Carbon Materials,
26(1), 57-62.
Xu, Z.-X., Lin, J.-D., Roy, V. A. L., Ou, Y., & Liao, D.-W. (2005). Catalytic synthesis of
carbon nanotubes and carbon spheres using kaolin supported catalyst. Materials
Science and Engineering: B, 123(2), 102-106.
Y. Maniwa, R. F., H. Kira, H. Tou, E. Nishibori, M. Takata, M. Sakata, A. Fujiwara, X.
Zhao, S. Iijima, Y. Ando. (2001). Multiwalled carbon nanotubes grown in hydrogen
atmosphere: An x-ray diffraction study. Phys. Rev. B, 64, 0731051-0731054.
Yang, S., Li, J., Shao, D., Hu, J., & Wang, X. (2009). Adsorption of ni(ii) on oxidized
multi-walled carbon nanotubes: Effect of contact time, ph, foreign ions and paa.
Journal of Hazardous Materials, 166(1), 109-116.
Yang, Z., Zhang, Q., Luo, G., Huang, J.-Q., Zhao, M.-Q., & Wei, F. (2010). Coupled
process of plastics pyrolysis and chemical vapor deposition for controllable
synthesis of vertically aligned carbon nanotube arrays. Applied Physics A, 100(2),
533-540.
Ye, H., & Yu, Z. (2010). Adsorption of pb (ii) onto modified rice bran. Analysis, 5, 10.
Yin, Q., Chen, Q., Sun, M., & Wang, L. (2012). Spectrophotometric determination of zinc
using carboxylic carbon nanotubes. International Journal of Electrochemical
Science, 7(12).
Yong, Z., Fang, L., & Zhi-hua, Z. (2011). Synthesis of heterostructured helical carbon
nanotubes by iron-catalyzed ethanol decomposition. Micron, 42(6), 547-552.
Yudasaka, M., Ichihashi, T., Komatsu, T., & Iijima, S. (1999). Single-wall carbon
nanotubes formed by a single laser-beam pulse. Chemical Physics Letters, 299(1),
91-96.

231
Yudasaka, M., Kikuchi, R., Matsui, T., Ohki, Y., Yoshimura, S., & Ota, E. (1995). Specific
conditions for ni catalyzed carbon nanotube growth by chemical vapor deposition.
Applied Physics Letters, 67(17), 2477-2479.
Yudasaka, M., Kokai, F., Takahashi, K., Yamada, R., Sensui, N., Ichihashi, T., et al.
(1999). Formation of single-wall carbon nanotubes: Comparison of co laser
ablation and nd:Yag laser ablation. The Journal of Physical Chemistry B, 103(18),
3576-3581.
Yudasaka, M., Komatsu, T., Ichihashi, T., & Iijima, S. (1997). Single-wall carbon nanotube
formation by laser ablation using double-targets of carbon and metal. Chemical
Physics Letters, 278(1–3), 102-106.
Yudasaka, M., Sensui, N., Takizawa, M., Bandow, S., Ichihashi, T., & Iijima, S. (1999).
Formation of single-wall carbon nanotubes catalyzed by ni separating from y in
laser ablation or in arc discharge using a c target containing a niy catalyst. Chemical
Physics Letters, 312(2–4), 155-160.
Zajíčkov , L., Jašek, O., Synek, P., Eli š, M., Kudrle, V., Kadlečíkov , M., et al. ( 9).
Synthesis of carbon nanotubes in mw plasma torch with different methods of
catalyst layer preparation and their applications: Nanocon.
Zeng, X., Fu, D., Sheng, H., Xie, S., Li, X., Hu, Q., et al. (2010). Growth and morphology
of carbon nanostructures by microwave-assisted pyrolysis of methane. Physica E:
Low-dimensional Systems and Nanostructures, 42(8), 2103-2108.
Zeng, X., Sun, X., Cheng, G., Yan, X., & Xu, X. (2002). Production of multi-wall carbon
nanotubes on a large scale. Physica B: Condensed Matter, 323(1–4), 330-332.
Zhang, H., Guo, H., Deng, X., Gu, P., Chen, Z., & Jiao, Z. (2010). Functionalization of
multi-walled carbon nanotubes via surface unpaired electrons. Nanotechnology,
21(8), 085706.
Zhao, X., Ando, Y., Qin, L. C., Kataura, H., Maniwa, Y., & Saito, R. (2002). Characteristic
raman spectra of multiwalled carbon nanotubes. Physica B: Condensed Matter,
323(1–4), 265-266.
Zheng, B., Li, Y., & Liu, J. (2002). Cvd synthesis and purification of single-walled carbon
nanotubes on aerogel-supported catalyst. Applied Physics A, 74(3), 345-348.
Zheng, L. X., O'Connell, M. J., Doorn, S. K., Liao, X. Z., Zhao, Y. H., Akhadov, E. A., et
al. (2004). Ultralong single-wall carbon nanotubes. [10.1038/nmat1216]. Nat Mater,
3(10), 673-676.
Zhou, D., Seraphin, S., & Wang, S. (1994). Single‐walled carbon nanotubes growing
radially from yc2 particles. Applied Physics Letters, 65(12), 1593-1595.

232
Zhu, S., Su, C.-H., Lehoczky, S. L., Muntele, I., & Ila, D. (2003). Carbon nanotube growth
on carbon fibers. Diamond and Related Materials, 12(10–11), 1825-1828.

233
6 APPENDICES
APPENDIX A
Table A1: Experimental array of CNTs production via microwave heating
Microwave
power
W,(A)
Radiation
time min,
(B)
Gas Ratio
(C2H2/H2)
(C)
Weight of
CNTs,
gram
600 35 0.6 0.48
600 60 0.2 0.3
1200 60 0.2 1.75
600 10 1 0.08
900 35 1 3.5
600 10 0.2 0.25
1200 10 1 0.23
900 35 0.2 3.8
1200 10 0.2 1
900 60 0.6 4.5
600 60 1 0.58
1200 60 1 0.9
600 10 1 0.38
900 35 0.6 5.8
1200 10 0.2 0.85
1200 60 0.2 0.42
600 60 1 0.2
1200 35 0.6 4.6
1200 60 1 1.15
600 60 0.2 0.5
900 35 0.6 5.56
1200 10 1 0.35
600 10 0.2 0.48
900 10 0.6 4.2

234
APPENDIX B
Table B1: Experimental array of Pb (II) removal using MWCNTs
pH
(A)
Agitation
speed
rpm, (B)
MWCNTs
dosage
g, (C)
Adsorption
time
min, (D)
Ct
(mg/L)
Removal of
Pb (II) %
qt
(mg/g)
4 200 0.15 5 4.5 55 13.75
4 200 0.05 40 5.2 48 12
5 160 0.1 22.5 0.01 99.9 24.97
6 120 0.15 5 5.5 45 11.25
6 200 0.15 5 4.2 58 14.5
6 120 0.05 5 4.5 55 13.75
5 200 0.1 22.5 1.16 88.4 22.1
4 160 0.1 22.5 1.7 83 20.75
5 160 0.05 22.5 0.7 93 23.25
5 160 0.1 40 1 90 22.5
4 120 0.15 40 5.07 49.3 12.32
4 120 0.05 40 4.2 58 14.5
4 120 0.05 5 4.9 51 12.75
6 160 0.1 22.5 1.6 84 21
4 120 0.15 5 4.5 55 13.75
6 120 0.15 40 4.1 59 14.75
4 200 0.05 5 3.8 62 15.5
5 160 0.1 5 1 90 22.5
6 120 0.05 40 3.8 62 15.5
6 200 0.05 40 4.7 53 13.25
5 160 0.15 22.5 0.4 96 24
6 200 0.15 40 3.8 62 15.5
5 120 0.1 22.5 0.1 99 24.75
5 160 0.1 22.5 0.5 95 23.75
6 200 0.05 5 4.3 57 14.25
4 200 0.15 40 3.5 65 16.25
MWCNTs dose= 0.1 gram, Initial Pb (II) aqueous solution Co=10 mg/L,
Temperature= 26± 1 oC
% removal= [(Co-Ct)/Co]x100
Adsorption of Pb (II) mg/L= Co-Ct
Adsorption capacity at time t (qt) in mg/g= [(Co-Ct)/M]xV
V-volume of Pb (II) aqueous solution= 0.25L
M-mass of MWCNTs dosage= 0.1 gram

235
APPENDIX C
Table C1: Experimental array of Cd (II) removal using MWCNTs
pH
(A)
Agitation
speed
rpm, (B)
MWCNTs
dosage
g, (C)
Adsorption
time
min, (D)
Ct
(mg/L)
Removal
of Cd (II)
%
qt
(mg/g)
6 160 0.1 50 1.37 86.3 21.575
5 160 0.1 50 0.2 98 24.5
6 200 0.05 20 5 50 12.5
4 200 0.15 20 5 50 12.5
6 120 0.05 80 4.7 53 13.25
5 160 0.1 80 1.1 89 22.25
6 200 0.15 20 4.5 55 13.75
5 160 0.1 20 1.5 85 21.25
5 120 0.1 50 1.9 81 20.25
4 200 0.05 20 4.2 58 14.5
6 200 0.05 80 4 60 15
4 120 0.05 20 3.8 62 15.5
5 160 0.1 50 0.1 99 24.75
4 120 0.15 80 4.7 53 13.25
5 200 0.1 50 1.4 86 21.5
6 120 0.05 20 3.4 66 16.5
5 160 0.15 50 0.8 92 23
4 120 0.15 20 4.27 57.3 14.325
4 200 0.05 80 3.7 63 15.75
6 120 0.15 20 4.1 59 14.75
4 160 0.1 50 1.5 85 21.25
4 200 0.15 80 4.1 59 14.75
6 120 0.15 80 2.7 73 18.25
4 120 0.05 80 3.6 64 16
5 160 0.05 50 1.3 87 21.75
6 200 0.15 80 4 60 15
MWCNTs dose= 0.1 gram, Initial Cd (II) aqueous solution Co=10 mg/L,
Temperature= 26± 1 oC.
% removal= [(Co-Ct)/Co]x100
Adsorption of Cd (II) mg/L= Co-Ct
Adsorption capacity at time t (qt) in mg/g= [(Co-Ct)/M]xV
V-volume of Cd (II) aqueous solution= 0.25L
M-mass of MWCNTs dosage= 0.1 gram

236
APPENDIX D
Table D1: Experimental array of Cu (II) removal using MWCNTs
pH
(A)
Agitation
speed
rpm, (B)
MWCNTs
dosage
g, (C)
Adsorption
time
min, (D)
Ct
(mg/L)
Removal
of Cu (II)
%
qt
(mg/g)
8 120 0.05 10 6.6 34 8.5
8 200 0.15 10 5.5 45 11.25
5 160 0.15 35 0.8 92 23
2 120 0.05 60 7.15 28.5 7.125
5 160 0.1 60 1.98 80.2 20.05
5 160 0.1 35 0.4 96 24
5 120 0.1 35 0.6 94 23.5
2 120 0.15 10 7 30 7.5
8 120 0.15 60 6 40 10
2 120 0.05 10 6.8 32 8
2 200 0.15 60 6.3 37 9.25
2 200 0.15 10 6.5 35 8.75
8 120 0.15 10 6.7 33 8.25
5 160 0.1 35 0.46 95.4 23.85
2 200 0.05 10 7 30 7.5
8 200 0.15 60 4.8 52 13
2 200 0.05 60 7.1 29 7.25
8 200 0.05 60 5 50 12.5
2 120 0.15 60 6.8 32 8
8 120 0.05 60 5.1 49 12.25
5 160 0.1 10 1.55 84.5 21.125
2 160 0.1 35 5.8 42 10.5
5 160 0.05 35 1.99 80.1 20.025
5 200 0.1 35 2.5 75 18.75
8 160 0.1 35 0.2 98 24.5
8 200 0.05 10 5.7 43 10.75
MWCNTs dose= 0.1 gram, Initial Cu (II) aqueous solution Co=10 mg/L,
Temperature= 26± 1 oC.
% removal= [(Co-Ct)/Co]x100
Adsorption of Cu (II) mg/L= Co-Ct
Adsorption capacity at time t (qt) in mg/g= [(Co-Ct)/M]xV
V-volume of Cu (II) aqueous solution= 0.25L
M-mass of MWCNTs dosage= 0.1 gram

237
APPENDIX E
Table E1: Experimental array of Zn (II) removal using MWCNTs
pH
(A)
Agitation
speed
rpm, (B)
MWCNTs
dosage
g, (C)
Adsorption
time
min, (D)
Ct
(mg/L)
Removal of
Zn (II) %
qt
(mg/g)
8 200 0.15 110 6.5 35 17.5
12 200 0.15 110 5.97 40.3 20.15
12 160 0.1 60 1.3 87 43.5
12 120 0.05 110 7.1 29 14.5
10 160 0.1 10 0.15 98.5 49.25
8 120 0.15 10 6.155 38.45 19.225
8 200 0.05 110 5.8 42 21
8 120 0.05 110 6.5 35 17.5
8 200 0.15 10 6 40 20
10 200 0.1 60 0.15 98.5 49.25
12 200 0.05 110 7 30 15
8 120 0.05 10 4.855 51.45 25.725
8 200 0.05 10 5.5 45 22.5
10 160 0.05 60 0.1 99.0 49.5
8 120 0.15 110 5.7 43 21.5
8 160 0.1 60 1 90 45
12 200 0.05 10 6.5 35 17.5
12 120 0.15 10 5.8 42 21
10 160 0.15 60 0.17 98.3 49.15
12 200 0.15 10 7.1 29 14.5
12 120 0.15 110 5.96 40.4 20.2
10 160 0.1 60 0.14 98.6 49.3
12 120 0.05 10 7.17 28.3 14.15
10 160 0.1 110 0.16 98.4 49.2
10 120 0.05 60 0.08 99.2 49.6
10 160 0.1 60 0.13 98.7 49.35
MWCNTs dose= 0.05 gram, Initial Zn (II) aqueous solution Co=10 mg/L,
Temperature= 26± 1 oC.
% removal= [(Co-Ct)/Co]x100
Adsorption of Zn (II) mg/L= Co-Ct
Adsorption capacity at time t (qt) in mg/g= [(Co-Ct)/M]xV
V-volume of Zn (II) aqueous solution= 0.25L
M-mass of MWCNTs dosage= 0.05 gram

238
APPENDIX F
Design Expert Soft were overview
Design –Expert software version 6.08 was used in this research study to develop, optimize
and statically analyses the experimental data. It provides highly efficient design of
experiment (DOE). Design-expert program offers rotatable 3D plot for visualization of
response surfaces.
Central composite model is used to identify the vital factors that affect the process of
product. CCD model was used for determination of CNTs production run. It was also used
to analyses the adsorption of heavy metals to CNTs sample prepared as a response for view
to select best quality of CNT sample.
A response surface method (RSM) designs is used to find the ideal process settings to
achieve optimal performance. It helps to quantify the relationship between one or more
measured responses and the vital input factor.
Definitions for each statistic in the analysis of variance (ANOVA) are summarized as
follows.
Sum of squares: Total of the sum of squares for the terms in the model, as reported in the
effects list for factorial and on the model screen.
DF: Degrees of freedom for the model: It is the number of model terms, including the
intercept, minus one.
Std Dev: (Root MSE) square root of the residual mean square. Considered this to be an
estimate of the standard deviation with the experiment.
Mean Square: Estimate of the model variance, calculated by the model sum of squares
divided by model degrees of freedom.

239
F Value: Test for comparing model variance with residual (error) variance. If the variance
are close to the same, the ratio will be close to one and it is less likely that any of the
factors have a significant effect on the response.
Prob > F: Probability of seeing the observed F value if the null hypothesis is true (there is
no factor effect). Small probability values call for rejection of the null hypothesis. The
probability equals the proportion of the area under the curve of the F – distribution that lies
beyond the observed F value. The F distribution itself is determined by the degrees of
freedom associated with the variances being compared.
Residual: consists of terms used to estimate experimental error (for 2-level factorials, the
insignificant factors and interactions that fall on the normal probability line on the effect
plot).
Lack of fit: This is the variation of the data around the fitted model. If the model does not
fit the data well, this will be significant.
Pure Error: Amount of variation in the response in replicated design points.
Cor Total: Totals of all information corrected for the mean.
Curvature: (2 –level Factorials only) compares the average response of the factorial
points to test for non-linearity between the factorial points.
Adj R-Squared; A measure of the amount of variation around the mean explained by the
model, adjusted for the number of terms in the model. The adjusted R-squared decrease as
the number of terms in the model increases if those additional terms don‘t add value to the
model.
Pred R-Squared: A measure of the amount of variation in new data explained by the
model.

240
Adequate Precision: This is a signal to noise ratio. It compares the range of the predicted
values at the design points to the average prediction error. Ratios greater than 4 indicates
adequate model discrimination

241
APPENDIX G
List of Achievements
List of publications
i. N.M. Mubarak, J.N. Sahu, E.C. Abdullah,N.S.Jayakumar. Removal of
Heavy Metals from Wastewater Using Carbon Nanotubes. Separation
&purification review. 43:311–338, (2014): ISI: Q1; IF: 3.154. (ISI-Cited
Publication).
ii. N.M. Mubarak, E.C. Abdullah, N. S. Jayakumar, J.N. Sahu. An overview on
methods for the production of carbon nanotubes. Journal of Industrial and
Engineering Chemistry. 20(4):1186-1197, (2014): ISI: Q1; IF: 2.145. (ISI-
Cited Publication).
iii. N.M. Mubarak, J.N. Sahu, E.C. Abdullah, N.S. Jayakumar, P. Ganesan.
Novel microwave-assisted multiwall carbon nanotubes enhancing Cu (II)
adsorption capacity in water .Journal of the Taiwan Institute of Chemical
Engineers. Accepted on 8th February, 2015 ISI:Q1;IF 2.637. (ISI-Cited
Publication)
iv. N.M. Mubarak, J.N. Sahu, E.C. Abdullah,N.S.Jayakumar, P. Ganesan.
Single stage production of carbon nanotubes using microwave technology,
Diamond & Related Materials. 48,52-59, (2014): ISI:Q2; IF: 1.740. (ISI-
Cited Publication).
v. N.M. Mubarak, J.N. Sahu, E.C. Abdullah, N.S. Jayakumar, P. Ganesan.
Microwave assisted multiwall carbon nanotubes enhancing Cd (II)

242
adsorption capacity in aqueous media. Journal of Industrial and Engineering
Chemistry. In Press (2014): ISI: Q1; IF: 2.063. (ISI-Cited Publication).
vi. N.M. Mubarak, J.N. Sahu, E.C. Abdullah, N.S. Jayakumar, P. Ganesan.
Thermodynamic and isotherm study for enhancement on Zn (II) removal
from aqueous solution using Microwave assisted synthesis of multiwall
carbon nanotubes. Clean soil-Air, water – provisionally accepted on 1
October (2014) -3rd
Revision submitted. ISI:Q1:IF; 1.838.(ISI-Cited
Publication).
vii. N.M. Mubarak, J.R.Wong, K.W.Tan, J.N. Sahu, E.C. Abdullah, N.S.
Jayakumar, P. Ganesan. Immobilization of cellulase enzyme on
functionalized multiwall carbon nanotubes. Journal of Molecular Catalysis
B: Enzymatic, 107, 124-131,(2014): ISI:Q2; IF: 2.823. (ISI-Cited
Publication).
viii. N.M Mubarak,R.K. Thines, N.R. Sajuni, E.C. Abdullah, J.N. Sahu , P.
Ganesan , N.S.Jayakumar. Adsorption of chromium (VI) on functionalized
and non-functionalized carbon nanotubes. Korean Journal of Chemical
Engineering. 31(9),1582-1591 (2014): ISI: Q3; IF: 1.059. (ISI-Cited
Publication
ix. R.K. Thines, N.M Mubarak, M.Ruthiraan, E.C. Abdullah, J.N.Sahu,
N.S.Jayakumar,P. Ganesan , N.R.Sajuni. Adsorption isotherm and
thermodynamics studies of Zn (II) on functionalized and non –
functionalized carbon nanotubes. Advanced Science, Engineering and
Medicine. 6(9), 974-984 (2014).(Scopous Cited Publication)

243
x. N.M. Mubarak, E.C. Abdullah, J.N. Sahu, N.S.Jayakumar, P. Ganesan. Mass
Production of Carbon Nanofibers Using Microwave Technology. Journal of
nanoscience and nanotechnology. In Press ISI:Q3 : IF: 1.339 (ISI-Cited
publication) .
xi. M. Ruthiraan, N.M. Mubarak, R.K. Thines, E.C. Abdullah, J.N. Sahu,
N.S.Jayakumar,P.Ganesan. Comparative kinetic study of functionalized
carbon nanotubes and magnetic biochar for removal of Cd2+
ions from waste
water. Korean J. Chem. Eng. 32(3), 446-457 (2015) . ISI: Q3; IF: 1.241.
(ISI-Cited Publication).
xii. N.M. Mubarak, J.N. Sahu, E.C. Abdullah, N.S. Jayakumar, N.R. Sajuni, J.
Tan. Adsorption and kinetic study on Sn2+
removal using modified carbon
nanotube and magnetic biochar.International journal of nanoscience,
12(6),1350044-14, (2013), World Scientific Publisher.
xiii. N.M. Mubarak, S. Daniel, M. Khalid, and J.Tan. Comparative study of
functionalize and non-functionalized carbon nanotube for Removal of
Copper from polluted water. International Journal of Chemical and
Environmental Engineering (IJCEE). 3(5), 314-317, (2012).
xiv. N.M Mubarak, R.F Alicia, E.C.Abdullah, J.N.Sahu, A.B Ayu Haslija ,
J.Tan. Statistical optimization and kinetic studies on removal of Zn2+ using
functionalized carbon nanotubes and magnetic biochar. Journal of
Environmental Chemical Engineering, 1(3) 486–495,(2013) (Scopus cited
publication).

244
Paper under review
i. Rapid adsorptive removal of toxic Pb (II) ions from aqueous solution using
microwave assisted multiwall carbon nanotubes. Chemical Engineering
Research and Design- Revision submitted..
ii. Optimization of carbon nanofibers production using microwave assisted
chemical vapour deposition. Journal of cleaner production – Under review.
iii. Optimization of multiwall carbon nanotubes synthesis by tubular
microwave chemical vapour deposition technique. Arbian journal of
chemistry- Under review.
iv. Comparative kinetic study on removal of zinc and copper using carbon
nanofibers synthesized via microwave technology. Arabian Journal of
chemistry- Under Review .
v. Application potential of carbon nanomaterials in water and wastewater
treatment: a review. Chemosphere- Under review.
Conference presentation
i. N.M Mubarak,N. Sazila, Sahu J.N,Abdullah E.C, N.R. Sajuni,J.Tan,
Comparative Study on phenol removal from aqueous solution by using
carbon nanotubes and magnetic biochar. 27th Regional conference on solid
state science & technology (RCSSST27) 20-22 December 2013, Kota
Kinabalu, Sabah,Malayasia.
ii. N.M. Mubarak, S. Daniel, M. Khalid, J. Tan , M Khalid Comparative study
of functionalize and no functionalized carbon nanotubes for removal of

245
copper from polluted water . International conference on chemical and
biological processes-ICCBP 21-23 June 2012, Kuala Lumpur, Malaysia.
Book Chapter
i. N.M. Mubarak, J.N. Sahu, E.C. Abdullah, N. S. Jayakumar, P. Ganesan,
Chemical Functionalization of Carbon Nanomaterials: Chemistry and
Applications" Book chapter 4 ―Overview on functionalization of carbon
nanotubes‖ Page 83-101. Taylors and Francis Publisher USA. In Press 2015
Patent
i. Production of nanostructured materials using microwave heating, J.N. Sahu,
N.M. Mubarak, E.C. Abdullah. Malaysia Patent File number: PI 2013 701556
Exhibitions
i. Malaysia Technology Expo (MTE-2014) 20-22 February Won Gold
Medal for the poster title‖ Mass production of carbon nanotubes using
microwave technology‖
ii. Malaysia Technology Expo (MTE-2014) 20-22 February Won Best
Award for the poster title‖ Mass production of carbon nanotubes using
microwave technology.
iii. International Engineering invention &innovation exhibition (I-ENVEX
2014) 11 -13April won Gold Medal for poster title ―Immobilization of
cellulase enzyme on functionalized multiwalled carbon nanotubes.

246
Other research achievement
i. N. M. Mubarak, A. Kundu, J.N. Sahu, E.C. Abdullah, N. S. Jayakumar.
Synthesis of palm oil empty fruit bunch magnetic pyrolytic char impregnating
with FeCl3 by microwave heating technique. Biomass and Bioenergy, 61:265-
275, (2014): ISI: Q1; IF: 2.975. (ISI-Cited Publication).
ii. Suchithra Thangalazhy-Gopakumar, Wail Mohammed Ahmed Al-Nadheri,
Dinesh Jegarajan, JN Sahu, NM Mubarak, S Nizamuddin. Utilization of Palm
Oil Sludge through Pyrolysis for Bio-oil and Bio-char Production. Bioresource
technology, In Press 2014. ISI:Q1;IF 5.04. (ISI-Cited Publication).
iii. N. M. Mubarak, R.F Alicia, E.C.Abdullah,J.N.Sahu, A.B Ayu Haslija , J.Tan.
Statistical Optimization of Zinc Removal Using Activated Carbon and Magnetic
Biochar. Advances in Environmental Biology, 8(3) Special 2014, Pages: 686-
691; Scopus cited publication.
iv. N. Sabzoi, N. S. JayaKumar, J. N. Sahu, P. Ganesan, N. M. Mubarak, S. A.
Mazari, Synthesis and characterization of hydrochars produced by hydrothermal
carbonization of oil palm shell. The Canadian Journal of Chemical Engineering,
Accepted 19th Jan 2015. ISI:Q3;IF 1.313. (ISI-Cited Publication)
v. N. Sabzoi, N. S. JayaKumar, J. N. Sahu, P. Ganesan, N. M. Mubarak, S. A.
Mazari, Hydrothermal carbonization of oil palm shell. Korean journal of
chemical engineering. Accepted 18 December 2014. ISI: Q3; IF 1.241. (ISI-
Cited Publication
vi. M. Shyamsundar, S. Z. M. Shamshuddin, N. M. Mubarak, S. R. Prathap.
Catalytic Synthesis of Salicylate Esters over Cordierite Honeycomb Coated with
Mo (VI)/ZrO2. Modern Research in Catalysis, 2013, 2, 39-41 (2013).

247
vii. N. M. Mubarak, N. Sazila, E.C. Abdullah, J. N. Sahu, N.S .Jayakumar, P.
Ganesan. Comparative Study on Phenol Removal from Aqueous Solution by
Using Carbon Nanotubes and Magnetic Biochar. Journal of Solid State Science
& Technology. Accepted 13th October-2014. Scopus Cited publication.
viii. N.M. Mubarak, J.N. Sahu, E.C. Abdullah, N.S.Jayakumar, P. Ganesan. Plam oil
empty fruit bunch based magnetic biochar composite comparison for synthesis
by microwave-assisted and conventional heating. Microporous and Mesoporous
Materials –Under review
ix. N. M. Mubarak, Y.T.Fo, Hikmat Said Al-Salim, J.N. Sahu, E.C. Abdullah, S.
Nizamuddin, N.S.Jayakumar, P.Ganesan. Removal of methylene blue and
orange-G from waste water using magnetic biochar. International Journal of
nanoscience. Accepted on 15th
January 2015, DOI:
10.1142/S0219581X1550009X (Scopus cited publication).
x. Nizamuddin, N.S Jayakumar, J.N Sahu, P. Ganesan, N.M Mubarak, Manoj
Tiripathi. Chemical, dielectric and structural characterization of optimized
hydrochar produced from hydrothermal carbonization of oil palm shell. Fuel,
Under Review.
xi. Nizamuddin, W.E Yong, N.S Jayakumar, J.N Sahu, P. Ganesan, N.M Mubarak,
Shaukat A. Mazari. An optimization study for catalytic hydrolysis of oil palm
shell using response surface methodology. Journal of Oil Palm Research.
Revision submitted.
xii. Nizamuddin, N.S Jayakumar, J.N Sahu, P. Ganesan, N.M Mubarak. Oil Palm
shell from oil palm industry as a feed material for hydrochar production.
Biomass and Bioenergy, Under Review.

248
xiii. N.M Mubarak, S.Shapnathayammal, Suchithra Thangalazhy-Gopakumar, J.N.
Sahu, E.C. Abdullah3, P. Ganesan , N.S.Jayakumar Adsorption and Kinetic
Study on Mg2+ Removal from Waste Water using Rice Husk based Magnetic
Biochar. International Journal of nanoscience.Under Review.
Conference presentation.
i. N.M Mubarak, R.F. Alicia, E.C. Abdullah, J.N. Sahu, A.B Ayu Haslija , J.Tan.
Statistical optimization of zinc removal using activated carbon and magnetic
biochar. Third International Conference on Biotechnology Engineering (ICBIoE
2013) 2-4 July 2013, Kula Lumpur, Malaysia.
ii. N.M. Mubarak, C. Evon, L. Lisa, J.N. Sahu, E.C. Abdullah, N.S. Jayakumar,
P. Ganesan. Removal of Zn2+
using magnetic biochar produced from coconut
shell via microwave heating. 27th Symposium of malaysian chemical engineers
(SOMChE 2014) 29-3 october. 14 Taylor‘s University Lakeside campus,
subangjaya, Kula Lumpur, Malaysia.
Patent
i. Synthesis of magnetic biomass materials using microwave heating, J.N. Sahu,
E.C. Abdullah, N.M. Mubarak. Malaysia Patent File number: PI 2013700218.
Awards
i. International Engineering invention &innovation exhibition (I-ENVEX- 2014)
11 -13April won Gold Medal for poster title ―By products from palm oil
sludge: A promising route for sustainable world‖.

249
ii. International engineering invention &innovation exhibition (I-ENVEX- 2014)
11 -13April Won Sepcial Award MINDS (Malaysian Invention And Design
Society) for poster tittle‖By products from palm oil sludge: A promising route
for sustainable world‖.
iii. International Engineering invention &innovation exhibition (I-ENVEX- 2014)
11 -13April won Silver Medal for poster title ―Adsorption and kinetic study on
removal of Mg2+ from waste water using rice husk based magnetic.
iv. Novel Research and Innovation Competition (NRIC- 2013) 19-23 August won
Gold Medal for poster title‖Synthesis of magnetic biochar using microwave
heating for removal of heavy-metals and dye from waste water‖
v. International Engineering invention &innovation exhibition (I-ENVEX -2013)
16 -19April won Gold Medal for poster title ―Synthesis of novel magnetic
biochar using microwave heating for removal of lead from waste water‖.
vi. Material Lecture competition UM level 17 April 2013, won Gold Medal for
the poster title Synthesis of novel magnetic biochar using microwave heating
for removal of cadmium from waste water‖.
vii. 24th International invention, innovation & Technology Exhibition (ITEX-2013)
9-11May won Gold Medal for poster title Synthesis of novel magnetic biochar
using microwave heating for removal of arsenic from waste water.
viii. Biomalaysia & Bioeconomy Asia Pacific Exhibition (BioInnovation Awards
2013-21 October) won Silver medal for the poster title ―Enhancement of
heavy metal removal from waste water using magnetic biochar synthesized by
microwave technology‖.

250
ix. Biomalaysia & Bioeconomy Asia Pacific Exhibition (BioInnovation Awards
2013-21 October) won Silver medal for the poster title ―Sustainably
production of magnetic biochar from agriculture waste biomass by using
microwave technology‖.