SYNTHESIS AND CHARACTERIZATION OF · PDF filethe elongation of PP. Thermal gravimetric...
89
SYNTHESIS AND CHARACTERIZATION OF POLYPYRROLE NANOPARTICLES AND THEIR NANOCOMPOSITES WITH POLYPROPYLENE A THESIS SUBMITTED TO THE GRADUATE SCHOOL OF NATURAL AND APPLIED SCIENCES OF MIDDLE EAST TECHNICAL UNIVERSITY BY SEVİL BAYTEKİN IN PARTIAL FULFILLMENT OF THE REQUIREMENTS FOR THE DEGREE OF MASTER OF SCIENCE IN POLYMER SCIENCE AND TECHNOLOGY MAY 2009
Transcript of SYNTHESIS AND CHARACTERIZATION OF · PDF filethe elongation of PP. Thermal gravimetric...

SYNTHESIS AND CHARACTERIZATION OF POLYPYRROLE
NANOPARTICLES AND THEIR NANOCOMPOSITES WITH
POLYPROPYLENE
A THESIS SUBMITTED TO
THE GRADUATE SCHOOL OF NATURAL AND APPLIED SCIENCES
OF
MIDDLE EAST TECHNICAL UNIVERSITY
BY
SEVİL BAYTEKİN
IN PARTIAL FULFILLMENT OF THE REQUIREMENTS
FOR
THE DEGREE OF MASTER OF SCIENCE
IN
POLYMER SCIENCE AND TECHNOLOGY
MAY 2009

Approval of the thesis:
SYNTHESIS AND CHARACTERIZATION OF POLYPYRROLE
NANOPARTICLES AND THEIR NANOCOMPOSITES WITH
POLYPROPYLENE
submitted by SEVİL BAYTEKİN in partial fulfillment of the requirements for the
degree of Master of Sciences in Polymer Science and Technology Department,
Middle East Technical University by,
Prof. Dr. Canan Özgen _____________________
Dean, Graduate School of Natural and Applied Sciences
Prof. Dr. Cevdet Kaynak _____________________
Head of Department, Polymer Science and Technology
Prof. Dr. Zuhal Küçükyavuz
Supervisor, Chemistry Dept., METU _____________________
Examining Committee Members:
Prof. Dr. Duygu Kısakürek _____________________
Chemistry Dept., METU
Prof. Dr. Zuhal Küçükyavuz ____________________
Chemistry Dept., METU
Prof. Dr. Cevdet Kaynak _____________________
Metallurgical and Materials Engineering Dept., METU
Prof. Dr. Erdal Bayramlı ____________________
Chemistry Dept., METU
Prof. Dr. Serpil Aksoy ____________________
Chemistry Dept., Gazi University
Date: 21.05.2009

iii
I hereby declare that all information in this document has been obtained and
presented in accordance with academic rules and ethical conduct. I also declare
that, as required by these rules and conduct, I have fully cited and referenced
all material and results that are not original to this work.
Name, Last Name : Sevil BAYTEKİN
Signature :

iv
ABSTRACT
SYNTHESIS AND CHARACTERIZATION OF POLYPYRROLE
NANOPARTICLES AND THEIR NANOCOMPOSITES WITH
POLYPROPYLENE
Baytekin, Sevil
M.S., Department of Polymer Science and Technology
Supervisor: Prof. Dr. Zuhal Küçükyavuz
May 2009, 75 pages
Conducting polypyrrole (PPy) nanoparticles were synthesized via microemulsion
polymerization system. The characterization of PPy nanoparticles was done by
Fourier transform infrared spectrometer (FTIR) and scanning electron microscope
(SEM). Nanocomposites were prepared by melt-mixing of polypyrrole with
polypropylene (PP) and processed with injection molding. The amount of PPy in
nanocomposites varied in the range of 1-20% by weight. The effect of PPy
nanoparticles on mechanical, electrical properties and thermal stability of
nanocomposites were investigated. Tensile test has revealed that increasing amount
of PPy increased the strength and the stiffness of the nanocomposite while limiting
the elongation of PP. Thermal gravimetric analysis has showed that incorporation of
PPy nanoparticles has improved the thermal stability of the nanocomposites. Four
probe conductivity measurement has exhibited that increasing amount of PPy
nanoparticles increases the conductivity of nonconductive PP up to 2,4.10-4
Scm-1
. In
order to improve the dispersion of PPy in PP, sodium dodecylsulphate was used as
dispersant. The same techniques were used to characterize nanocomposites
containing 2% by weight dispersant. Composites prepared with dispersant have
exhibited improvement in some mechanical and thermal properties and involved
smaller dimension PPy nanoparticles.
Keywords: Conducting polymers, polypyrrole, nanocomposite.
v
ÖZ
POLİPİROL NANOPARÇACIKLARININ VE POLİPROPİLENLE
NANOKOMPOZİTLERİNİN SENTEZİ VE KARAKTERİZASYONU
Baytekin, Sevil
Yüksek Lisans, Polimer Bilimi ve Teknolojisi
Tez Yöneticisi: Prof. Dr. Zuhal Küçükyavuz
Mayıs 2009, 75 sayfa
İletken polipirol nanoparçacıkları mikroemülsiyon polimerizasyon sistemi ile
sentezlenmiştir. Polipirol nanoparçacıklarının karakterizasyonu Fourier Transform
kızılötesi spektroskopisi ve taramalı elektron mikroskobu ile yapılmıştır.
Nanokompozitler polipirol ile polipropilenin eriterek karıştırma yöntemi ile
hazırlanmış ve enjeksiyonlu kalıplama ile şekillendirilmiştir. Nanokompozitlerin
içinde polipirol miktarı ağırlıkça 1-20% aralığında değiştirilmiştir. Polipirol
nanoparçacıklarının nanokompozitlerin mekanik, elektriksel özelliklerine ve ısıl
dayanıklılıklarına etkisi incelenmiştir. Çekme testi, artan polipirol nanoparçacık
miktarının polipropilenin dayanımını ve sertliğini arttırırken yüzde uzamasını
düşürdüğünü göstermiştir. Isıl gravimetrik analiz, eklenen polipirol
nanoparçacıklarının nankompozitlerin ısıl dayanıklılığını arttırdığını ortaya
çıkarmıştır. Dört nokta iletkenlik ölçümü, artan polipirol miktarının yalıtkan olan
polipropilenin iletkenliğini 2,4.10-4
Scm-1
’e kadar arttırdığını göstermiştir.
Polipirolün polipropilen içindeki dağılımını iyileştirmek için sodyum dodesilsülfat
dağıtıcı olarak eklenmiştir. Ağırlıkça 2% dağıtıcı içeren nanokompozitleri
karakterize etmek için aynı teknikler kullanılmıştır. Dağıtıcı ile hazırlanan
kompozitler bazı mekanik ve ısıl özelliklerde iyileşme sergilemekte ve daha küçük
boyutlu polipirol nanoparçacıklar içermektedir.
Anahtar kelimeler: İletken polimerler, polipirol, nanokompozit.

vi
To My Family

vii
ACKNOWLEDGEMENTS
I would like to express my deepest gratitude to my supervisor Prof. Dr. Zuhal
Küçükyavuz for her guidance, understanding, kind support, criticism,
encouragements and valuable discussions throughout my thesis.
I also wish to thank to TÜBİTAK for the financial support throughout my masters
programme.
I am grateful to my lab-mate Yasin Kanbur for his friendship, support and help
during my experiments.
I would like to thank Tuğba Efe for her support and friendship, and helping me all
possible ways.
Special thanks go to Mehmet Taner Çöllü for his love, patience and endless support
throughout my thesis work.
Finally, I wish to express by gratitude appreciation to my family since without their
love, advice, care, and support this work would not be possible. My family’s absolute
belief in me has been a constant source of encouragement and has helped me
achieving my goals.
viii
TABLE OF CONTENTS
ABSTRACT ................................................................................................................ iv
ÖZ ................................................................................................................................ v
ACKNOWLEDGEMENTS ....................................................................................... vii
TABLE OF CONTENTS .......................................................................................... viii
LIST OF TABLES ....................................................................................................... x
LIST OF FIGURES .................................................................................................... xi
LIST OF ABBREVIATIONS ................................................................................... xiv
CHAPTERS
1. INTRODUCTION ................................................................................................... 1
1.1 History of Conducting Polymers ........................................................................ 1
1.2 Applications of Conducting Polymers ............................................................... 3
1.3 Principles of Electrical Conduction ................................................................... 4
1.3.1 Band Theory ................................................................................................ 4
1.3.2 Doping Process ........................................................................................... 5
1.3.3 Polaron and Bipolaron Model ..................................................................... 7
1.4 Composites ......................................................................................................... 9
1.4.1 Polymer Matrix Composites ..................................................................... 10
1.4.2 Composites of polypyrrole ........................................................................ 11
1.5 Nanocomposites ............................................................................................... 13
1.5.1 Polymer-based and Polymer-filled Nanocomposites ................................ 14
1.5.2 Nanocomposites of Polypyrrole ................................................................ 15
1.6 Nanoparticle/Polymer Composite Processing .................................................. 18
1.6.1 Direct Mixing ............................................................................................ 18
1.6.2 Solution Mixing ........................................................................................ 18
1.6.3 In-Situ Polymerization .............................................................................. 19
1.7 Polypyrrole ....................................................................................................... 19
1.7.1 Synthesis of Polypyrrole ........................................................................... 20
1.8 Microemulsion Polymerization ........................................................................ 23

ix
1.9 Polypropylene .................................................................................................. 24
1.10 Sodium Dodecysulphate................................................................................. 25
1.11Aim of This Study ........................................................................................... 26
2. EXPERIMENTAL ................................................................................................. 27
2.1 Materials ........................................................................................................... 27
2.2 Synthesis of Polypyrrole .................................................................................. 28
2.3 Preparation of PP/PPy nanocomposites ........................................................... 29
2.3.1 Preparation of mixed and moulded composites ........................................ 29
2.3.2 Injection molding ...................................................................................... 29
2.4 Characterization ............................................................................................... 30
2.4.1 Fourier Transform Infrader Spectrometer (FTIR)..................................... 30
2.4.2 Thermal Gravimetric Analysis (TGA) ...................................................... 30
2.4.3 Tensile Tests.............................................................................................. 30
2.4.4 Conductivity Measurements ..................................................................... 32
2.4.5 Scanning Electron Microscopy (SEM) ..................................................... 33
3. RESULTS AND DISCUSSION ............................................................................ 34
3.1 Synthesis of polypyrrole nanoparticles ............................................................ 34
3.2 Characterization of polypyrrole ....................................................................... 34
3.2.1 FTIR spectrum of polypyrrole .................................................................. 34
3.2.2 Scanning Electron Microscope Analysis of Polypyrrole Nanoparticles ... 35
3.3 Preparation of PP/PPy Nanocomposites .......................................................... 36
3.4 Characterization of PP/PPy Nanocomposites .................................................. 37
3.4.1 Tensile Tests.............................................................................................. 37
3.4.2 Electrical Conductivity Measurement ....................................................... 50
3.4.3 Thermal Gravimetric Analysis .................................................................. 54
3.4.4 Scanning Electron Microscopy of PP/PPy Nanocomposites .................... 58
4. CONCLUSION ...................................................................................................... 70
REFERENCES ........................................................................................................... 72

x
LIST OF TABLES
Table 2.1 Properties of Pyrrole .................................................................................. 27
Table 2.2 Properties of Ferric chloride hexahydrate .................................................. 28
Table 2.3 Properties of Sodium dodecylsulphate ....................................................... 28
Table 2.4 Properties of Polypropylene ....................................................................... 28
Table 2.5 Dimensions of tensile test specimen .......................................................... 31
Table 3.1 Young’s modulus, tensile strength, percentage strain values for PP, PP/PPy
nanocomposites without dispersant. .......................................................................... 42
Table 3.2 Young’s modulus, tensile strength, percentage strain values for PP, PP/PPy
nanocomposites with 2% dispersant by weight. ........................................................ 48
Table 3.3 Electrical conductivities of PP/PPy nanocomposites ................................. 51
Table 3.4 Maximum decomposition temperatures of pure PP, PP/10%PPy and
PP/20%PPy nanocomposites prepared without dispersant. ....................................... 55
Table 3.5 Maximum decomposition temperatures of pure PP, PP/10%PPy and
PP/20%PPy nanocomposites prepared with dispersant. ............................................ 57

xi
LIST OF FIGURES
Figure 1.1 Some examples for conducting polymers ................................................... 2
Figure 1.2 Band theory ................................................................................................. 5
Figure 1.3 Conductivities of insulator, semi-conductors, metals and conjugated
polymers ....................................................................................................................... 6
Figure 1.4 Conductivity of doped and undoped organic materials .............................. 6
Figure 1.5 Oxidative doping of polypyrrole ................................................................ 8
Figure 1.6 Band theory of conducting polymers .......................................................... 9
Figure 1.7 Various forms of nanoscale fillers ............................................................ 15
Figure 1.8 Chemical polymerization of polypyrrole .................................................. 21
Figure 1.9 Structure of polypropylene ....................................................................... 25
Figure 1.10 Sodium dodecylsulphate ......................................................................... 26
Figure 2.1 ASTM Tensile Test Specimen .................................................................. 31
Figure 2.2 Four probe conductivity measurement system ......................................... 32
Figure 3.1 FTIR spectrum of polypyrrole .................................................................. 35
Figure 3.2 SEM micrographs of PPy nanoparticles at magnifications of (a) 80000, (b)
300000. ....................................................................................................................... 36
Figure 3.3 Stress vs strain curve of pure PP............................................................... 38
Figure 3.4 Stress vs strain curve for PP/1%PPy nanocomposite without dispersant. 40
Figure 3.5 Stress vs strain curve for PP/5%PPy nanocomposite without dispersant. 40
Figure 3.6 Stress vs strain curve for PP/10%PPy nanocomposite without dispersant.
.................................................................................................................................... 41
Figure 3.7 Stress vs strain curve for PP/20%PPy nanocomposite without dispersant.
.................................................................................................................................... 41
Figure 3.8 Stress vs strain curves for (a) PP/1%PPy, (b) PP/5%PPy, (c) PP/10%PPy,
(d) PP/20%PPy nanocomposites without dispersant. ................................................ 42
Figure 3.9 Percentage strain at break vs PPy content for PP/PPy nanocomposites
without dispersant. ..................................................................................................... 43

xii
Figure 3.10 Tensile strength vs PPy content for PP/PPy nanocomposites without
dispersant. .................................................................................................................. 43
Figure 3.11 Young’s modulus vs PPy content for PP/PPy nanocomposites without
dispersant. .................................................................................................................. 44
Figure 3.12 Stress vs strain curve for PP/1%PPy with dispersant. ............................ 45
Figure 3.13 Stress vs strain curve for PP/5%PPy with dispersant. ............................ 46
Figure 3. 14 Stress vs strain curve for PP/10%PPy with dispersant. ......................... 46
Figure 3.15 Stress vs strain curve for PP/20%PPy with dispersant. .......................... 47
Figure 3.16 Stress vs strain curves for (a) PP/1%PPy, (b) PP/5%PPy, (c)
PP/10%PPy, (d) PP/20%PPy nanocomposites with dispersant. ................................ 47
Figure 3.17 Percentage strain at break vs PPy content for PP/PPy nanocomposites
with dispersant. .......................................................................................................... 48
Figure 3.18 Tensile strength vs PPy content for PP/PPy nanocomposites with
dispersant. .................................................................................................................. 49
Figure 3.19 Young’s modulus vs PPy content for PP/PPy nanocomposites with
dispersant. .................................................................................................................. 49
Figure 3.20 Conductivity-elongation graph of PP/PPy nanocomposites without
dispersant. .................................................................................................................. 52
Figure 3.21 Conductivity-elongation graph of PP/PPy nanocomposites with
dispersant. .................................................................................................................. 53
Figure 3.22 TGA plots of (a) pure PP, (b) PP/10%PPy, (c) PP/20%PPy
nanocomposites prepared without dispersant, (d) PPy. ............................................. 55
Figure 3.23 TGA plots of (a) pure PP, (b) PP/5%PPy, (c) PP/10%PPy (d)
PP/20%PPy nanocomposites prepared with dispersant, (e) PPy. .............................. 57
Figure 3.24 Fracture surface of PP/1%PPy nanocomposite without dispersant at
magnification of (a) 3000, (b) 30000. ........................................................................ 60
Figure 3.25 Fracture surface of PP/5%PPy without dispersant at magnification of (a)
30000, (b) 80000. ....................................................................................................... 61
Figure 3.26 Fracture surface of PP/10%PPy without dispersant at magnification of
(a) 3000, (b) 10000. .................................................................................................... 62
xiii
Figure 3.27 Fracture surface of PP/20%PPy without dispersant at magnification of
(a) 3000, (b) 30000. .................................................................................................... 63
Figure 3.28 Fracture surface of PP/1%PPy with dispersant at magnification of (a)
3000, (b) 30000. ......................................................................................................... 65
Figure 3.29 Fracture surface of PP/5%PPy with dispersant at magnification of (a)
30000, (b) 80000. ....................................................................................................... 66
Figure 3.30 Fracture surface of PP/10%PPy with dispersant at magnification of (a)
3000, (b) 30000. ......................................................................................................... 67
Figure 3.31 Fracture surface of PP/20%PPy with dispersant at magnification of (a)
3000, (b) 30000. ......................................................................................................... 68

xiv
LIST OF ABBREVIATIONS
PP : Polypropylene
PPy : Polypyrrole
SDS : Sodium dodecylsulphate
FTIR : Fourier Transform Infrared Spectroscope
TGA : Thermal Gravimetric Analysis
SEM : Scanning Electron Microscope

1
CHAPTER 1
INTRODUCTION
1.1 History of Conducting Polymers
Historically, polymers have been considered as insulators and found application
areas due to their insulating properties. Infact, so far, any electrical conduction in
polymers which is generally due to loosely bound ions was mostly regarded as an
undesirable fact [1]. However, emerging as one of the most important materials in
the twentieth century, the use of polymers move from primarily passive materials
such as coatings and containers to active materials with useful optical, electronic,
energy storage and mechanical properties. Indeed, discovery and study of conducting
polymers have already started this development [1,3]. Electrically conducting
polymers are defined as materials with an extended system of conjugatedcarbon-
carbon double bonds (Figure 1.1) [4]. They are synthesized either by reduction or
oxidation reaction, which is called doping process, giving materials with electrical
conductivities up to 105 S/cm. Conducting polymers are different from polymers
filled with carbon black or metals, since the latter are only conductive if the
individual conductive particles are mutually in contact and form a coherent phase [5].

2
Figure 1.1 Some examples for conducting polymers
Although conducting polymers are known as new materials in terms of their
properties, the first work describing the synthesis of a conducting polymer was
published in the nineteeth century. In 1862, Henry Letheby prepared polyaniline by
anodic oxidation of aniline, which was conductive and showed electrochromic
behaviour. However, electronic properties of so called aniline black were not
determined [1,3].
In 1958, Natta et al. synthesized polyacetylene as a black powder which was found to
be a semiconductor with conductivity in the range of 10-11
to 10-3
S/cm, depending
on the process conditions of the polymer [1]. In 1977, drawing attention on
“conducting polymers”, the first intrinsic electrically conducting organic polymer,
doped polyacetylene, was reported. Intrinsically conducting polymers are a different
class of materials than conducting polymers, which are a physical mixture of a non-
conductive polymer with a conducting material such as metal or carbon powder [2].

3
The preparation of polyacetylene by Sirakawa and coworkers and the discovery of
the large increase in its conductivity after “doping” by the group led by MacDiarmid
and Heeger actually launched this new field of research [3].
Electronically conducting polymers possess a variety of properties related to their
electrochemical behaviour and are therefore active materials whose properties can be
altered as a function of their electrochemical potential. The importance and potential
impact of this new class of material was recognized by the world scientific
community when Hideki Shirakawa, Alan J. Heeger and Alan G. MacDiarmid were
awarded the Nobel Prize in Chemistry in 2000 “for the discovery and development of
electronically conductive polymers” [1,3].
1.2 Applications of Conducting Polymers
Electronic industry has been meeting its demand for electrically conducting polymers
by using high loadings of conductive powders such as silver, gold and graphite
sometimes as high as 80% by weight with the polymer matrix. However, there are
numerous disadvantages of this such as high cost and deterioation in other properties
of the polymer. Polyaniline, polypyrrole and polythiophene are examples of
intrinsically conducting polymers that have been intensively studied during the last
decade due to their high electrical conductivity and good environmental stability.
Polypyrole has drawn attention due to its high conductivity, simple preparation,
stability and good mechanical properties. It has been found to have many potential
applications in electronic and electrochromic devices, light-weight batteries,
membrane separation, sensors, and chromatographic stationary phases [7]. There are
other potential application areas of polypyrrole such as drug delivery, rechargable
batteries, supercapacitors, anhydrous electrorheological fluids, microwave shielding
and corrosion protection [26].
4
The improvement of mechanical properties of conducting polymers has increased
their potential for commercial applications. One of the immediate applications of the
conducting polymers is in electrostatic protection and electromagnetic interference
(EMI) shielding. In the last few decades, due to their reasonably high environmental
stability and electrical conductivity, the synthesis of polyheterocyclic polymers, such
as polypyrrole (PPy) and polythiophene (PPt), has received a great deal of attention.
However, these polymers tend to be insoluble and infusible. Inclusion of conducting
polymer in the matrix of a mechanically strong insulating polymer has emerged as a
useful approach to press these conducting polymers into useful and large articles.
Although chemically prepared polyheterocyclic polymers are of poor quality and low
electroconductivity compared with electrochemically prepared polyheterocyclic
polymers, there are several advantages of the chemical oxidative polymerization such
as simple preparation procedures, short reaction times, and mass production [2].
1.3 Principles of Electrical Conduction
1.3.1 Band Theory
The electronic properties of any material are established by its electronic structure.
The most reasonable explanation of electronic structure of materials is achieved by
the band theory. According to quantum mechanism the electrons of an atom can only
have specific or quantized energy levels. However, in the lattice of a crystal, where
the atoms are closely spaced, the energy levels form bands. The highest occupied
electronic levels constitute the valence band and the lowest unoccupied levels
constitute the conduction band. Depending on how the bands are filled, the electrical
properties of conventional materials are determined. When bands are completely
filled or empty no conduction is observed. If the band gap is narrow, at room
temperature, thermal excitation of electrons from valence band to conduction band
gives rise to conductivity which is the case of classical semiconductors. When the
band gap is wide, thermal energy at room temperature is insufficient to excite
electrons across the gap and the solid is an insulator. In conductors, there is no band

5
gap since the valence band overlaps the conduction band and hence their high
conductivity (Figure 1.2) [1].
Figure 1.2 Band theory
1.3.2 Doping Process
Doping process is basically the process that transforms insulating polymers (e.g.,
polyacetylene, conductivity 0.1 S/cm) to excellent conductors (Figure 1.3) [8].
Doping is achieved by formation of charge-transfer complexes by electron donors
such as sodium or potassium (n doping, reduction) or by electron acceptors such as
I2, AsF5, or FeCl3 (p doping, oxidation). As a result of the process the doped polymer
backbone becomes negatively or positively charged with the dopant forming
oppositely charged ions (Na+, K
+, I
3- , I
5- , AsF
6-, FeCl
4- ). Application of an electric
potential results in motion of counterions in and out which enables to switch the

6
polymer between the doped, conductive state and the undoped, insulating state
(Figure 1.4) [5].
Figure 1.3 Conductivities of insulator, semi-conductors, metals and conjugated
polymers
Figure 1.4 Conductivity of doped and undoped organic materials

7
1.3.3 Polaron and Bipolaron Model
The band theory is insufficient to explain the electrical conduction in electrically
conducting organic materials such as polyphenylene, polyacetylene or polypyrrole
where the charge-carrying species (electrons or holes) are spinless. Although the
mechanism is not fully understood, conduction by polarons and bipolarons is now
thought to be the dominant mechanism of charge transport in organic materials. This
concept is also used for explanation of the drastic deepening of color changes
produced by doping. A polaron which is a term used in solid-state physics is defined
as a radical cation that is partially delocalized over several monomer units (e.g. in a
polymer segment) where a bipolaron is a diradical dication. Doping level determines
formation of polaron and bipolarons. Low doping levels gives rise to polarons,
whereas higher doping levels produce bipolarons. Both polarons and bipolarons are
mobile and can move along the polymer chain [5].
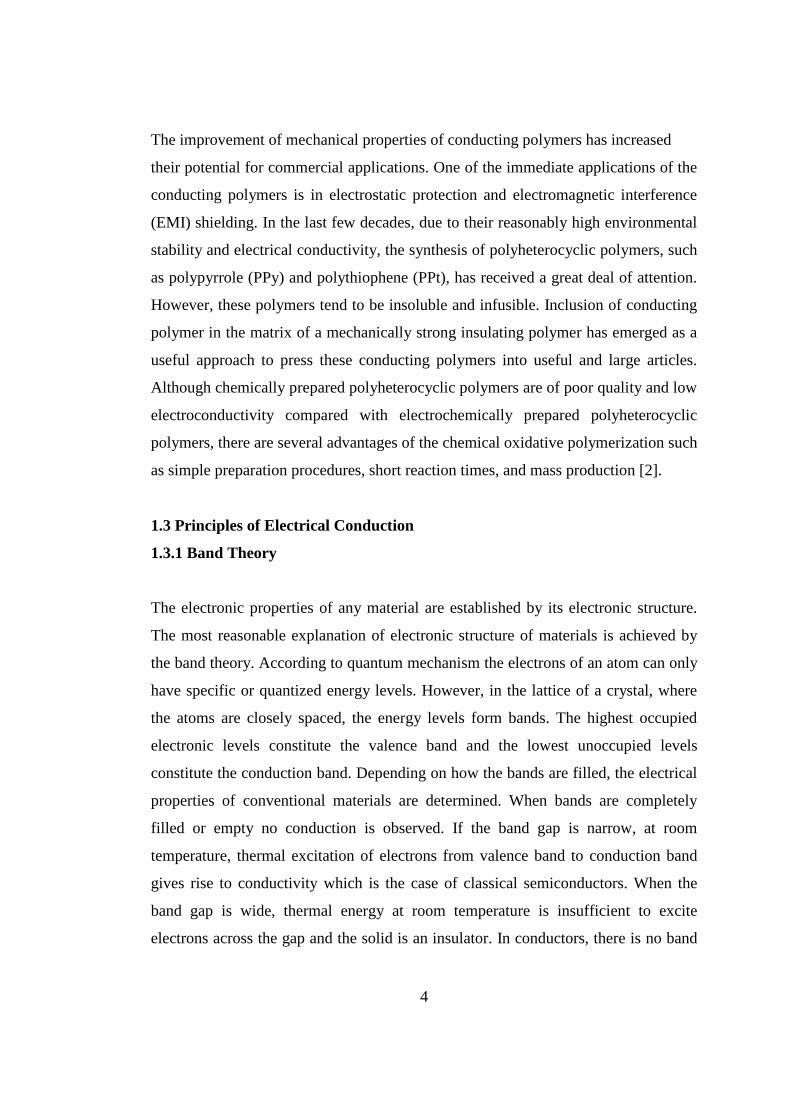
In order to explain the doping process, the oxidative doping of polypyrrole is
described in Figure 1.5. The process begins when an electron is removed from the p-
system of the backbone by the dopant producing free radical and a spinless positive
charge. Due to local resonance of the charge and the radical, the radical and cation
are coupled to each other. This combination of a charge site and a radical is called a
polaron. This could be either a radical cation or radical anion. This creates a new
localized electronic states in the gap, with the lower energy states being occupied by
a single unpaired electrons. The polaron state of polypyrrole are symmetrically
located about 0.5 eV from the band edges. Upon further oxidation the free radical of
the polaron is removed, creating a new spinless defect called a bipolaron. This is of
lower energy than the creation of two distinct polarons. At higher doping levels it
becomes possible that two polarons combine to form a bipolaron. Thus at higher
doping levels the polarons are replaced with bipolarons. The bipolarons are located
symmetrically with a band gap of 0.75 eV in the case of polypyrrole [9].
8
Figure 1.5 Oxidative doping of polypyrrole
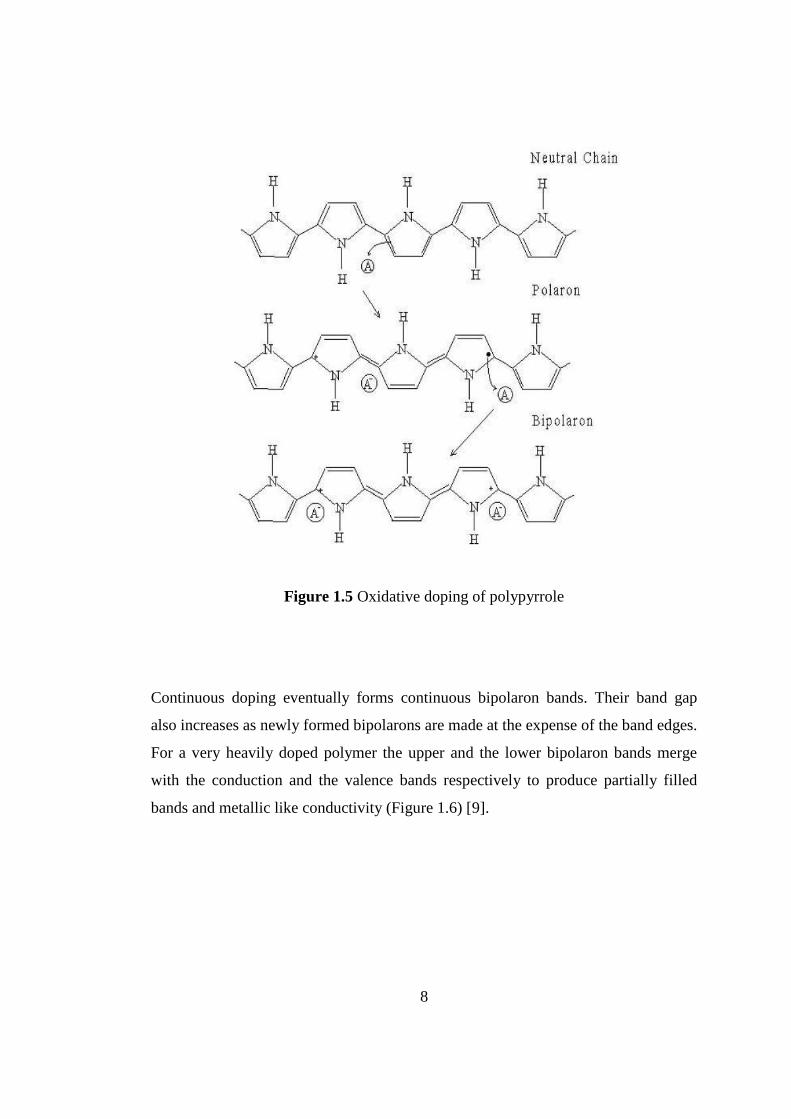
Continuous doping eventually forms continuous bipolaron bands. Their band gap
also increases as newly formed bipolarons are made at the expense of the band edges.
For a very heavily doped polymer the upper and the lower bipolaron bands merge
with the conduction and the valence bands respectively to produce partially filled
bands and metallic like conductivity (Figure 1.6) [9].
9
Figure 1.6 Band theory of conducting polymers
1.4 Composites
A composite is defined as a material created by combination of two or more
components namely, a selected filler or reinforcing agent and a compatible matrix
binder. The combination of these component results in formation of a new material
with specific characteristics and properties. The synthetic assemblage of the
components does not occur as a dissolvation but rather like merging into each other
to act in concert. Although the components act together as a single material, both the
components and the interface between them can usually be physically identified.
Genarally, the behaviour and the properties of the composite is controlled by the
interface of the components. Since the composite is a totally new material having
new and specific characteristics, its properties cannot be achieved by any of its
components acting alone.
The classification of composites can be done in different ways. The composites can
be classified on the basis of the form of their structural components: (i) fibrous where
the composite is composed of fibers in a matrix, (ii) laminar where the composite is
composed of layers in a matrix, and (iii) particulate where the composite is
composed of particles in a matrix [10].

10
Another type of classification can be done on the basis of filler or reinforcing agent
used namely polymer matrix composites (PMCs), metal matrix composites (MMCs),
ceramic matrix composites (CMCs), carbon-carbon matrix composites (CCCs),
intermetallic composites (IMCs), or hybrid composites [11].
1.4.1 Polymer Matrix Composites
Composite materials have been utilized to solve technological problems for a long
time. In 1960s with the introduction of polymeric-based composites, composites start
capturing the attention of industries. Since then, composite materials have become
common engineering materials. They are designed and manufactured for various
applications including automotive components, sporting goods, aerospace parts,
consumer goods, and in the marine and oil industries. Increasing awareness of
product performance and competition in the global market for lightweight
components also supported the growth in composite usage. Among all materials,
composite materials have the potential to replace widely used steel and aluminum,
and many times with better performance. Replacing steel components with
composite components can save 60 to 80% in component weight, and 20 to 50%
weight by replacing aluminum parts. Today, it appears that composites are the
materials of choice for many engineering applications.
The matrix material used in polymer-based composites can either be thermoset
(epoxies, phenolics) or thermoplastic resins (low density polyethylene, high density
polyethylene, polypropylene, nylon, acrylics). The filler or reinforcing agent can be
choosen according to the desired properties. The properties of polymer matrix
composites are determined by properties, orientation and concentration of fibers and
properties of matrix.
The matrix has various functions such as providing rigidity, shaping the structure by
transfering the load to fiber, isolating the fiber to stop or slow the propagation of

11
crack, providing protection to reinforcing fibers against chemical attack and
mechanical damage (wear), and affecting the performance characteristics such as
ductility, impact strength, etc. depending on its type. The failure mode is strongly
affected by the type of matrix material used in the composite as well as its
compatibility with the fiber. The important functions of fibers include carrying the
load, providing stiffness, strength, thermal stability, and other structural properties in
the composites and providing electrical conductivity or insulation, depending on the
type of fiber used [12].
1.4.2 Composites of polypyrrole
Maria Omastova and Ivan Chodak prepared conductive polypropylene/polypyrrole
composites using the method of chemically initiated oxidative modification of
polypropylene particles in suspension by pyrrole. In order to prepare the composite,
polypropylene particles were dispersed in water-methanol mixture and FeCl3 was
added to be used for chemical oxidation. Addition of pyrrole started formation of
polypyrrole particles in polypropylene suspension. The electrical and rheological
properties of the composite were compared with polypropylene/polypyrrole
composite prepared by melt mixing of pure polypropylene with chemically
synthesized polypyrrole and with polypropylene/carbon black composites also
prepared by melt mixing. Elemental analysis verified presence of polypyrrole in
polypropylene matrix. The conductivity studies show that even a very small PPy
amount present in composites results in a significant increase in conductivity.
Processing conditions are observed to have a great effect on electrical conductivites
of composites. The composite prepared by sintering PP particles covered with PPy
shows about 7 orders of magnitude higher conductivity than the composite prepared
by melt mixing of pure polypropylene with chemically synthesized polypyrrole
whereas the conductivity of sintered PP/PPy composites is comparable to that of
PP/Carbon black composite. The PP/CB and injection molded PP/PPy composites
exhibit similar flow properties. However, for compresion molded PP/PPy composites
12
a considerable increase of complex viscosity was observed [13].
Jürgen Pionteck and Maria Omastova prepared an electrical-conducting
polypropylene/polypyrrole (PP/PPy) composite by chemical oxidative modification
reaction of pyrrole on the surface of PP particles in suspension. For comparison,
another type of composite was prepared by mixing coated PP particles with
noncoated PP particles. Both composites were processed with injection and
compresion molding. Beter mechanical properties were achieved by injection molded
composites compared to that of compression molded ones. However, compression
molded composites exhibit beter antistatic behaviour and electrical conductivity.
XPS studies proved that the PP in the PP/PPy powder is almost totally covered with
PPy. Prevention of the outflow of PP melt by PPy layer as heating to 200˚C without
shear was proved by hot-stage optical microscopy studies. The investigation of
mechanical properties and melt viscosities of PP/PPy composites shows that PPy
structure was almost completely destroyed by injection molding whereas
compression molded composites exhibits presence of PPy networklike structure [14].
Miroslava Mravcakova and Maria Omastova prepared
polypropylene/montmorillonite/polypyrrole (PP/MMT/PPY) composites by
oxidative polymerization of pyrrole in the presence of dispersed polypropylene and
montmorillonite particles in aqueous solution of an anionic surfctant,
dodecylbenzenesulfonic acis (DBSA), or in water/methanol solution. The composites
are compared with PP/PPy blends prepared by melt mixing. WAXS study showed
the intercalation of PPy into galleries of MMT in PP/MMT/PPy composites.
Rheology and conductivity studies showed that using DBSA as surfactant during PPy
polymerization changed the gallery structure of MMT and stabilized the structure
also during following processes. The conductivity of compression molded
PP/MMT/PPy composites were found to be 10-5
Scm-1
already at 4,8% PPy content.
However, due to destruction of the conductive shell of PPy particles during melt
mixing, the PP/PPy blends exhibited lower conductivity [15].
13
Feifeng He and Mitsuru Omoto prepared conductive polypyrrole/polyurethane
composite foam by vapor phase polymerization of pyrrole on polyurethne foam.
FeCl2 and FeCl3 were used as oxidants. The study showed that increasing
FeCl2/FeCl3 ratio results in increasing conductivity despite decreasing polypyrole
content. The result was explained as indication of higher density or structurally
different PPy formation from those obtained by FeCl3 alone. Low contents of PPy in
the composite is also pointed out as an advantage for the mechanical propeties of the
composite foam. It is concluded that the mixtures of the two iron chlorides are
preferable to FeCl3 as oxidants for preparation of highly coductive composite foam.
Also, it has been reported that lower reaction temperatures were preferable for higher
conductivity. Regarding the mechanical properties, it is reported that the tensile
strength and elongation of composite foam is comparable to those of pristine
polurethane foam [16].
1.5 Nanocomposites
Nanomaterials and nanocomposites have always existed in nature and have been
used for centuries. However, it is only recently that characterization and control of
structure at nanoscale have drawn intense interest for research and these materials
start to represent new and exciting fields in material science. A nanocomposite is
defined as a composite material where at least one of the dimensions of one of its
constituents is on the nanometer size scale [4]. In other words, nanocomposites can
be considered as solid structures with nanometer-scale dimensional repeat distances
between the different phases that constitute the structure. These materials typically
consist of an inorganic (host) solid containing and an organic component or vice
versa. They can consist of two or more inorganic/organic phases in some
combinational form that at least one of the phases or features is in the nanosize.
In general, nanocomposite materials can exhibit different mechanical, electrical,
optical, electrochemical, catalytic, and structural properties than those of each

14
individual component. The multifunctional behavior for any specific property of the
material is often more than the sum of the individual components [17].
1.5.1 Polymer-based and Polymer-filled Nanocomposites
In recent years, the limits of optimizing composite properties of traditional
micrometer-scale composite fillers have been reached due to the compromises of the
obtained properties. Stiffness is traded for toughness, or toughness is obtained at the
cost of optical clarity. In addition, regions of high or low volume fraction of filler
often results in macroscopic defects which lead to breakdown or failure of the
material. Recently, a new resarch area has provided the opportunity to overcome the
limitations of traditional micrometer-scale polymer composites. This new
investigation area is the nanoscale filled polymer composites where the filler is <100
nm in at least one dimension.
Implementation of the novel properties of nanocomposites strongly depends on
processing methods that lead to controlled particle size distribution, dispersion, and
interfacial interactions. Processing technologies for nanocomposites are different
from those for composites with micrometer-scale fillers, and new developments in
nanocomposite processing are among the reasons for their recent success.
Nanoscale fillers can be in many shapes and sizes, namely tube, plate-like or 3D
particles (Figure 1.7). Fiber or tube fillers have a diameter <100 nm and an aspect
ratio of at least 100. The aspect ratios can be as high as 106 (carbon nanotubes).
Plate-like nanofillers are layered materials typically with a thickness on the order of
1 nm, but with an aspect ratio in the other two dimensions of at least 25. Three
dimensional (3D) nanofillers are relatively equi-axed particles <100 nm in their
largest dimension. This is a convenient way to discuss polymer nanocomposites,
because the processing methods used and the properties achieved depend strongly on
the geometry of the fillers [17].

15
Figure 1.7 Various forms of nanoscale fillers
1.5.2 Nanocomposites of Polypyrrole
Eun Seong Lee and Jae Hyung Park prepared in situ formed procesable polypyrrole
nanoparticle/amphiphilic elastomer composites which could have applications in
biosenors, semiconductors, artificial muscles, polymeric batteries and electrostatic
dissipation due to their processability and considerable conductivities. The
polymerization process of pyrrole was achieved by chemical oxidation of the pyrrole
monomer by FeCl36H2O in the presence of multiblock copolymer dissolved in
methanol/water mixture. The multiblock copolymer was used as a stabilizer during
polypyrrole synthesis and when cast after removing the dissolved polymers, served
as a flexible and elastomeric matrix. The polymerization time, concentration of
multiblock copolymer and the oxidant, reaction medium composition were optimized
in terms of conductivity measurements and the highest conductivity was reported as

16
3,0±0,2 Scm-1
. Mechanical properties such as tensile strength and elongation at break
of the omposites were found to increase with increasing amount of multiblock
copolymer [18].
Tzong-Ming Wu and Shiang-Jie Yen have reported synthesis, characterisation and
properties of monodispersed magnetic coated multi-walled carbon
nanotube/polypyrrole nanocomposites. Fe3O4 was used for coating multi-walled
carbon nanotube (MWCNT). Fe3O4 coated c- MWCNT/PPy nanocomposites were
synthesized via the in situ polymerization. The polymerization of pyrrole molecules
was achieved on the surfaces of Fe3O4 coated c-MWCNT. The comparison of
conducitivities have shown that Fe3O4 coaed c- MWCNT/PPy nanocomposites have
about 4 times higher conductivity that that of pure PPy matrix. Fe3O4 coated c-
MWCNT/PPy nanocomposites were observed to exhibit ferromagnetic behaviour
[19].
Kada Boukerma and Jean-Yves Piquemal prepared montmorillonite/polypyrrole
nanocomposites and investigated their interfacial properties. The synthesis of
MMT/PPy nanocomposites was achieved by in situ polymerization of pyrrole in the
presence of MMT. Scanning electron microscopy results have shown that the surface
morpology of the nanocomposites were more like the surface of untreated MMT. X-
ray photoelectron spectroscopy (XPS) exhibited that the nanocomposites have MMT-
rich surfaces which inicates intercalation of polypyrrole in the host galleries. The
increase in interlamellar spacing was measured by transmission electron microscope.
Invers gas chromatography measurements showed high surface energy of the
nanocomposites [20].
Miroslava Mravcakova and Kada Boukerma prepared montmorillonite/polypyrrole
nanoomposites. The effect of organic modificaton of clay on the chemical and
electrical properties were studied. The morphology investigations showed that the
surface of MMT/PPy has a MMT-rich surface and relatively low conductivity

17
(3,1×10⁻²
Scm-1
) indicating intercalation of PPy in the clay galleries. Whereas, the
organically modified MMT/PPy nanocomposite has a PPy-rich surface and higher
conductivity indicating PPy formation on the surface of MMT. The dispersive
contribution of surface energy of o-MMT was measured to be significantly low
compared to that of MMT due to the stearly chains from the ammonium chlorides
used for organic modification [21].
A.U. Ranaweera and H.M.N Bandara prepared electronically conducting
montmorillonite-Cu2S and montmorillonite-Cu2S-polypyrrole nanocomposites.
MMT-Cu2S nanocomposite was prepared by cation-exchange approach and its
conductivity was measured as 3,03×10⁻⁴
Sm-1
. The polymerization of pyrrole was
achieved berween the layers of MMT-Cu2S to obtain MMT-Cu2S-PPy
nanocomposite. The characterisation was performed by XRD, FT-IR anda c
impedance measurements. The electronic conductivity was reported as 2,65 Sm-1
[22].
Panagiotis Dallas and Dimitrios Niarchos reported interfacial polymerization of
pyrrole and in situ synthesis of polypyrrole/silver nanocomposites. The oxidizing
agents used were Ag(I) or Fe (III). Depending on using different surfactants (SDS or
DTAB) or not using any surfactant, the average diameter of polypyrrole structures
was observed to be in the range of 200-300 nm. The electron microscopy images
exhibited different morphologies of polypyrrole depending on using various
surfactants or not using any as well as the size and shape of the silver
nanocomposites. X-ray diffractometry showed amorphous structure of polymers.
Further characterization was performed by thermogravinetric analysis and FT-IR
spectroscopy [23].

18
1.6 Nanoparticle/Polymer Composite Processing
There are three general ways of dispersing nanofillers in polymers. The first is direct
mixing of the polymer and the nanoparticles either as discrete phases or in solution.
The second is in-situ polymerization in the presence of the nanoparticles, and the
third is both in-situ formation of the nanoparticles and in-situ polymerization. Due to
intimate mixing of the two phases, the latter can result in composites called hybrid
nanocomposites [17].
1.6.1 Direct Mixing
Direct mixing is a well known and established polymer processing technique. When
these traditional melt-mixing or elastomeric mixing methods are feasible, they are
the fastest method for introducing new products to market. Although melt mixing has
been successful in many cases, for some polymers, due to rapid viscosity increase
with the addition of significant volume fractions of nanofiller, this processing
method has limitations. There are many examples showing melt mixing method for
composite production and exhibiting some limitations for the process. [17].
1.6.2 Solution Mixing
In solution mixing, in order to overcome the limitations of melt mixing method, both
the polymer and the nanoparticles are dissolved or dispersed in solution. This method
enables modification of the particle surface without drying, which reduces particle
agglomeration. After dissolvation the nanoparticle/polymer solution can be cast into
a solid, or solvent evaporation or precipitation methods can be used for isolation of
nanoparticle/polymer composite. Conventional techniques can be used for further
processing [17].

19
1.6.3 In-Situ Polymerization
In in-situ polymerization, nanoscale particles are dispersed in the monomer or
monomer solution, and the resulting mixture is polymerized by standard
polymerization methods. This method provides the opportunity to graft the polymer
onto the particle surface. Many different types of nanocomposites have been
processed by in-situ polymerization. Some examples for in-situ polymerization are
polypyrrole nanoparticle/amphiphilic elastomer composites [18], magnetite coated
multi-walled carbon nanotube/polypyrrole nanocomposites [19] and polypyrrole/
silver nanocomposites [23]. The key to in-situ polymerization is appropriate
dispersion of the filler in the monomer. This often requires modification of the
particle surface because, although dispersion is easier in a liquid than in a viscous
melt, the settling process is also more rapid [17].
1.7 Polypyrrole
Among the conjugated polymers, polypyrrole (PPy) is the most representative one
for its easy polymerization and wide application in gas sensors, electrochromic
devices and batteries. Polypyrrole can be produced in the form of powders, coatings,
or films. It is intrinsically conductive, stable and can be quite easily produced also
continuously. The preparation of polypyrrole by oxidation of pyrrole dates back to
1888 and by electrochemical polymerization to 1957. However, this organic p-
system attracted general interest and was found to be electrically conductive in 1963.
Polypyrrole has a high mechanical and chemical stability and can be produced
continuously as flexible film (thickness 80 mm; trade name: Lutamer, BASF) by
electrochemical techniques. Conductive polypyrrole films are obtained directly by
anodic polymerization of pyrrole in aqueous or organic electrolytes.
Apart from electrochemical routes, polypyrrole can also be synthesized by simple
chemical ways to obtain powders. Basically chemical oxidative polymerization

20
methods can be used to sythesize bulk quantities of polypyrrole in a fast and easy
way [5].
Like other conducting polymers polypyrrole exhibit more limited environmetal,
thermal and chemical stability than conventional inert polymer due to the presence of
dopant and its dynamic and electroactive nature [7].
1.7.1 Synthesis of Polypyrrole
Polypyrrole and many of its derivatives can be synthesized via simple chemical or
electrochemical methods [14]. Photochemically initiated and enzyme-catalyzed
polymerization routes have also been descibed but less developed. Different
synthesis routes produce polypyrrole with different forms; chemical oxidations
generally produce powders, while electrochemical synthesis leads to films deposited
on the working electrode and enzymatic polymerization gives aqueous dispersions
[40].
As mentioned above the electrochemical polymerization method is utilized
extensively for production of electroactive/conductive films. The film properties can
be easily controlled by simply varying the electrolysis conditions such as electrode
potential, current density, solvent, and electrolyte. It also enables control of thickness
of the polymers. Electrochemical synthesis of polymers is a complex process and
various factors such as the nature and concentration of monomer/electrolyte, cell
conditions, the solvent, electrode, applied potential and temperature, pH affects the
yield and the quality of the film. Thus, optimization of all of the parameters in one
experiment is difficult. In contrast, chemical polymerization does not require any
special instruments, it is a rather simple and fast process. Chemical polymerization
method involves oxidative polymerization of pyrrole monomer by chemical oxidants
either in aqueous or non-aqueous solvents or oxidation by chemical vapour
deposition in order to produce bulk polypyrrole as fine powders [7].

21
Iron (III) chloride and water are found to be the best oxidant and solvent for chemical
polymerization of pyrrole respectively regarding desirable conductivity
characteristics.
Figure 1.8 Chemical polymerization of polypyrrole
Previous studies have shown that the optimum initial mole ratio of Fe(III)/Pyrrole for
polymerization by aqueous iron (III) chloride solution at 19˚C is 2,25 or 2,33. Also,
several studies have revealed that factor such as solvent, reaction temperature, time,
nature and concentration of oxidizing agent, affect the oxidation potential of the
solution which affects the final conductivity of the product [7].
S.Goel and A. Gupta synthesized polypyrrole samples of different nanodimensions
and morphologies by time dependent interfacial polymerization reaction. Pure
chloroform was used as solvent for pyrrole and ammonium persulphate dissolved in
HCl was used as the oxidizing solution. The polymerization occured in the interface
of organic and aqueous phases and polypyrrole was formed as thin layer on the
interface. Morphology study of polypyrrole nanoparticles was done by scanning
electron microsopy and transmission electron microscopy [27].

22
Yang Liu and Ying Chu synthesized polypyrrole nanoparticles through
microemulsion polymerization. Alcohol-assited microemulsion polymerization was
performed in order to adjust the inner structure of polypyrrole nanoparticles for
polymerization SDS was used as the surfactant, water was used as the solvent and
aqueous solution of NH4S2O8 was used as the oxidant. Characterisation of polpyrrole
was done by FT-IR and morphology study was performed by SEM and TEM [26].
Hongxia Wang and Tong Lin synthesized polypyrrole nanoparticles by oxidation of
pyrrole with ferric chloride solution during microemulsion polymerization process.
Dodecyltrimethyl ammonium bromide (DTAB) was used as the surfactant. Particle
characaterisation was performed by using FTIR, elemental analysis, UV-VIS spectra
and SEM. Variation of particle size from about 50 to 100, 100 to 200 nm with the
change in surfactant concentration was reported [29].
Xinyu Zhang and Sanjeev K. Manohar synthesized narrow pore-diameter
polypyrrole nanotubes. The synthesis was performed by chemical oxidative
polymerization of pyrrole using FeCl3 oxidant and V2O5 nanofibers as the sacrificial
template producing microns long electically conducting polypyrrole nanotubes
having 6 nm average pore diameter [30].
M.R. Karim and C.J. Lee synthesized polypyrrole by radiolysis polymerization
method. Conducting PPy was synthesized by the in situ gamma radiation-induced
chemical oxidative polymerization method. This method was reported to provide a
highly uniform polymer morphology [31].
Jyongsik Jang and Joon H. Oh. synthesized polypyrrole nanoparticles via
microemulsion polymerization with using various surfactants. Iron (III) chloride was
used as the oxidant. the selective fabrication of amorphous polypyrrole nanopartcles
as small as 2 nm in diameter using microemulsion polymerization at low temperature
was reported [32].

23
1.8 Microemulsion Polymerization
In general, polymerization in heterogeneous media results in formation of polymer
colloids or latexes which are known as dispersions of polymer particles usually in
water. The synthesized particles are almost always in the submicron range. The most
widely used way for preparation of polymer colloids is certainly emulsion
polymerization. The particle size of the latexes produced via emulsion
polymerization usually ranges between 0,05 to 0,5 µm. Microemulsions has drawn
attention since it enables production of thermodynamically stable latexes in the
nanosize range which is not achievable with classical emulsion polymerization.
Microlatexes having such characteristics are desirable in certain applications such as
drug delivery or microencapsulation. Microemulsions have many interesting
properties such as large internal interfacial area, optical transparency,
thermodynamic stability, etc. The major difference between emulsion and
microemulsions is the amount of surfactant required to stabilize the systems. Much
more surfactant is needed for microemulsions since a large internal interfacial area is
needed to be stabilized. However, using higher amount of surfactant limits the
potential industrial uses of microemulsion polymerization due to cost [38].
Microemulsions can be used for polymerization of all types of structures. There are a
number studies reporting synthesis of PPy in microemulsion system. Wang H. et al.
have synthesized PPy nanoparticles having an average particle size of 67 nm with the
distribution ranging from 7,5 nm to 127,5 nm using various surfactant concentrations
and different temperatures. It has been reported that increasing surfactant
concentration and decreasing temperature leads to smaller particle size. PPy
nanoparticles are formed in micelles and high surfactant concentration leads to
smaller micelle dimensions and hence smaller PPy particles. Furthermore, it has been
reported that low reaction temperatures results in smaller micelles which limits the
growth of large PPy particles and leading to smaller nanoparticles. [29].
24
A previous study has shown the effect of using surfactant with different chain lengths
using different polymerization temperatures. Surfactants with short carbon chains
(hexyltrimethlammonium bromide) have found to be insufficient to form ordered
structures due to weak hydrophobic interactions related to C-6 chains. On the other
hand, surfactants with hydrocarbon chains longer than C-16 were found to be not
suitable for low temperature microemulsion polymerization due to their liquid-
crystalline state and high viscosity. The size of nanoparticle decrease with decreasing
surfactant chain length. However, the enhanced flexibility of longer chain length
leads to more free volume inside micelles and therefore larger particles. Moreover,
increasing surfactant concentration has found to decrease the nanoparticle size
whereas increasing polmerization temperature leads to increasing nanoparticle size
due to enhanced mobility of surfactant chains. [32].
1.9 Polypropylene
Polypropylene (PP) is a thermoplastic material that is produced by polymerization of
propylene molecules into very long polymer molecule or chains. There are number of
different ways to link the monomers together, but its most widely used form is made
with catalysts that produce crystallizable polymer chains. The resulting product is a
semicrystalline solid with good physical, mechanical, and thermal properties.
Another form of PP produced in much lower volumes as a by product of
semicrystalline PP production and having very poor mechanical and thermal
properties, is a soft, tacky material used in adhesives, sealants, and caulk products.
The above two products are often referred to as “isotactic”(crystallizable) PP (i-PP)
and “atactic” (noncrystallizable) PP (-PP), respectively.
The average length of the polymer chains and the breadth of distribution of the
polymer chain lengths determines the main properties of PP. In the solid state, the
main properties of the PP reflect the type and amount of crystalline and amorphous
regions formed from the polymer chains.

25
Polypropylene has excellent and desirable physical, mechanical and thermal
properties when used in room temperature applications. It is relatively stiff and has a
high melting point, low density and relatively good resistance to impact [6,28].
Figure 1.9 Structure of polypropylene
1.10 Sodium Dodecysulphate
Sodium dodecylsulphate is a member of sulphates group which is the largest and
most important class of synthetic surfactants produced by reaction of an alcohol with
sulphuric acid. It is the most common sulphate surfactant (abbreviated as SDS and
sometimes referred to as sodium lauryl sulphate) and is extensively used both for
fundamental studies as well as in many industrial applications.
Sodium dodecylsulphate is an anionic surfactant which is composed of a
hydrophobic linear akyl group with a chain length of 12 carbon atoms as the tail and
a hydrohilic sulphate group as the head of the molecule (Figure 1.10) [34]. The
negatively charged molecule is neutralized by Na+ which is called the counter ion.

26
Figure 1.10 Sodium dodecylsulphate
In general the properties of sulphates depend on the nature of alkyl chain and the
sulphate group. In the case of sodium dodecylsulphate which is an alkali metal salt,
the molecule shows good solubility in water and it tends to be effected by the
presence of electrolytes [39].
1.11Aim of This Study
Among conjugated polymers polypyrrole has attracted great interest due to its high
conductivity, good thermal and environmental stability and ease of synthesis.
However, it is an infusible, inprocessable polymer having relatively poor mechanical
properties. On the other hand, polypropylene is a well known insulating
thermoplastic with outstanding mechanical properties. In this study, the synergistic
assemblage of polypyrrole with polypropylene is investigated. The aims of this study
are synthesis of polypyrrole nanoparticles via microemulsion polymerization,
preparation of PP/PPy nanocomposites in order to provide some level of
processability to infusible and inprocessable PPy while inducing conductivity to
insulating PP and preparation of PP/PPy nanocomposites with dispersant in order to
improve the dispersion of PPy nanoparticles using identical procedures.

27
CHAPTER 2
EXPERIMENTAL
2.1 Materials
The materials that have been used are: (i) Pyrrole used as the monomer, purchased
from Sigma Aldrich Chemie GmbH. (Table 2.1), distilled under vacuum and stored
at 3˚C in refrigerator before use. (ii) Iron(III) chloride hexahydrate, functioned as the
oxidant and dopant, was obtained from Emir Kimyasalları (Table 2.2). (iii)Sodium
dodecylsulphate, used as surfactant and dispersant, was purchased from Fluka
BioChemika (Table 2.3). (iv)Methanol, used in washing process, produced by Fluka.
(v) The polymer matrix used is Polypropylene which was obtained from Petkim
(Table 2.4).
Table 2.1 Properties of Pyrrole
Molecular Formula C4H5N
Molecular weight 67,09 g/mol
Melting point -23˚C
Boiling Point 131˚C
Density 0,967 g/ml

28
Table 2.2 Properties of Ferric chloride hexahydrate
Table 2.3 Properties of Sodium dodecylsulphate
Table 2.4 Properties of Polypropylene
2.2 Synthesis of Polypyrrole
The surfactant (SDS, 0,86 g) was added to 30 ml distilled water and stirred
moderately with a magnetic stirrer. The solution was stirred for 30 minutes at room
temperature until the surfactant is completely dissolved. When a clear aqueous
solution of surfactant was obtained, the monomer (pyrrole, 1 g) was added dropwise
Molecular Formula FeCl3 6H2O
Molecular weight 270,32 g/mol
Melting point 37˚C
Solubility soluble in water
Molecular Formula C12H25NaO4S
Molecular weight 288,38 g/mol
Melting point 206˚C
Density 1,01 g/ml
Molecular Formula (C3H6)n
Molecular weight of repeat unit 42,08 g/mol
Melting point 173˚C
Crystalline density 0,95 g/cm3
Amorphous density 0,85 g/cm3
29
to the solution while stirring. After obtaining a mixture of aqueous surfactant
solution and the monomer, an aqueous solution of the oxidant (FeCl3 6H2O, 9,25 g)
in 5 ml distilled water was added dropwise to the mixture. Immediate formation of
black PPy precipitate was clearly observed right after addition of the oxidant. The
polymerization process was carried out for 3 hours at room temperature by moderate
stirring. The black polypyrrole precipitate was filtered off and washed with water and
methanol several times. The black polypyrrole powder was dried under vacuum at
room temperature for 10 hours.
2.3 Preparation of PP/PPy nanocomposites
2.3.1 Preparation of mixed and moulded composites
PP/PPy nanocomposites were prepared by melt mixing of pure PP with PPy at 75
rpm for 10 minutes at 210˚C using Brabender Plasti-Corder. The composition of
nanocomposites varied between 1-20% PPy by weight. In order to provide a regular
shape, the nanocomposites were pressed in a mould for 5 minutes at 210˚C followed
by fast cooling. The identical procedure is employed with addition of 2% by weight
dispersant (SDS) during mixing process of pure PP with PPy.
2.3.2 Injection molding
The nanocomposites were processed by injection molding. A laboratory scale
injection molding machine (Microinjector, Daca Instruments) was used. During
molding, barrel and mold temperatures were set to 210˚C and room temperature
respectively. The injection pressure (16 bars) and cycle time (3 min) were identical
for the preparation of each sample.

30
2.4 Characterization
2.4.1 Fourier Transform Infrader Spectrometer (FTIR)
FTIR analysis was carried out on a Nicolet 510 FTIR Spectrophotometer. The FTIR
spectrum of polypyrrole was obtained by preparing a thin KBr pellet containing the
sample.
2.4.2 Thermal Gravimetric Analysis (TGA)
The thermal gravimetric analysis of samples were done using DTG-60 H Shimadzu
thermal gravimetric analyzer. The samples were investigated at a heating rate of
10˚C/min under N2 atmosphere.
2.4.3 Tensile Tests
In order to discuss the changes in mechanical properties tensile tests were performed
for each nanocomposite as well as pure PP. The test was performed according to
ASTM D638 (Standard Test Method for Tensile Properties of Plastics), by using a
Lloyd LR 30K Universal Testing machine at a test rate of 5 cm/min. The shape and
dimensions of the specimens are exhibited in Figure 2.1 and Table 2.5. At least five
samples were used for each nanocomposite.

31
Figure 2.1 ASTM Tensile Test Specimen
Table 2.5 Dimensions of tensile test specimen
Symbol, Definition Dimensions of Specimen (mm)
W, Width of narrow section 7.60
T, Thickness of the specimen 2.0
D, Distance between grips 50
L, Total length of specimen 110
Stress: Stress is defined as the force applied to produce deformation in a unit area of
a test specimen. Stress is a ratio of applied load to the original cross-sectional area.
Strain: Strain is defined as the ratio of the elongation to the gauge length of the test
specimen. In other words, it is the change in length per unit of the original length
(Δl/l). It is expressed as a dimensionless ratio.
32
Young’s modulus: Young’s modulus is the ratio of stress to the corresponding strain
below the proportional limit of a material. It is expressed in F/A. It is a measure of
material’s stiffness.
Tensile Strength= Force (load) / Cross-sectional area
Tensile Strength at Break= Load recorded at break / Cross-sectional area [35].
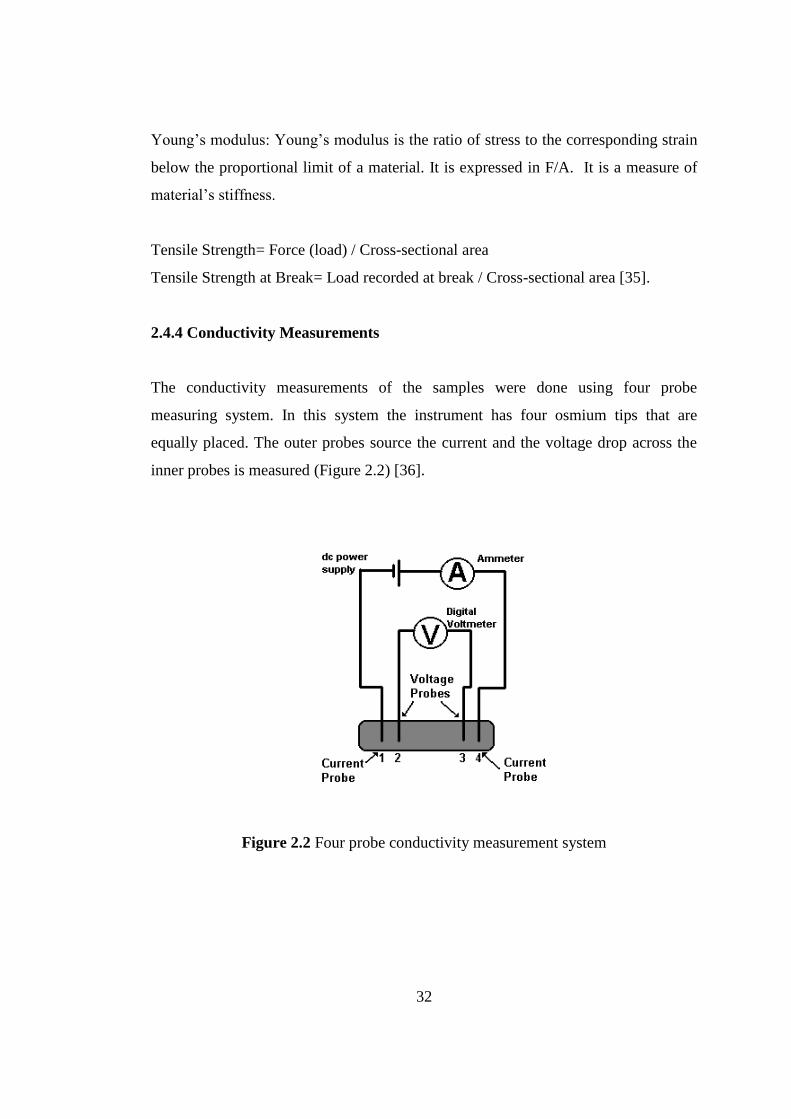
2.4.4 Conductivity Measurements
The conductivity measurements of the samples were done using four probe
measuring system. In this system the instrument has four osmium tips that are
equally placed. The outer probes source the current and the voltage drop across the
inner probes is measured (Figure 2.2) [36].
Figure 2.2 Four probe conductivity measurement system

33
Conductivity is given by σ= ln2 I/ П d V where,
σ: conductivity
I: current passing through outer probes
V:voltage drop across iner probes
d: sample thickness
In order to determine conductivities, the samples were placed under the probes of the
instrument and the head of probes was lowered until it contacts the sample. The
resistivity value of the sample was recorded and using this value conductivity was
calculated. The conductivity measurement was done using FPP 0602 Electrometer.
2.4.5 Scanning Electron Microscopy (SEM)
The morphological studies of the samples were performed by FEI Quanta 400 F
Scanning Electron Microscopy. All investigations are performed using secondary
detector, 3.0 probe size and 20.00 kV acceleration voltage. The fracture surfaces of
the samples were coated by a thin layer of gold before investigation. The aim of this
study was to observe dispersion of PPy nanoparticles in PP matrix and to comment
on dimensions of PPy particles.

34
CHAPTER 3
RESULTS AND DISCUSSION
3.1 Synthesis of polypyrrole nanoparticles
Synthesis of polypyrrole nanoparticles was achieved using microemulsion
polymerization system by oxidation of pyrrole monomer with iron(III)chloride
hexahydrate. As the oxidant was added, the color of the solution changed from
colorless to deep greenish black which is an indication of oxidation of conducting
polypyrrole. The reaction product polypyrrole was obtained in the form of black
powder.
3.2 Characterization of polypyrrole
3.2.1 FTIR spectrum of polypyrrole
The FTIR transmission spectrum of polypyrrole nanoparticles exhibited
characteristic vibration bands at 1531 cm-1
, 1480 cm-1
, 1469 cm-1
for pyrrole ring
strecthing, 1458 cm-1
for conjugated C-N strecthing and 781 cm-1
for C-H wagging
vibrations [29,32]. The vibration bands observed at 1300 cm-1
and 1036 cm-1
are due
to C-H in-plane strecthing and C-H vibration of 2,5-substituted pyrrole [23]. The
FTIR spectrum of PPy nanoparticles demostrating the representative vibrations bands
is given in Figure 3.1.

35
Figure 3.1 FTIR spectrum of polypyrrole
3.2.2 Scanning Electron Microscope Analysis of Polypyrrole Nanoparticles
Scanning electron microscopy was performed in order to investigate the dimensions
and the morphology of polypyrrole nanoparticles. The scanning electron micrographs
of polypyrrole nanoparticles are presented in Figure 3.2. The SEM micrographs of
polypyrrole exhibited globular, nanometer-sized particles. The polypyrrole
nanoparticles are observed to have a distribution of dimensions between 50–150 nm.

36
(a) (b)
Figure 3.2 SEM micrographs of PPy nanoparticles at magnifications of (a) 80000,
(b) 300000.
The SEM results confirm that microemulsion polymerization system was succesful
in the synthesis of nanodimensional polypyrrole particles. The SEM results proves
that the microemulsion polymerization system provided similar dimensions of PPy
nanoparticles with previous studies where 50-100 nm and 100-200 nm polypyrrole
nanoparticles were reported [29,32].
3.3 Preparation of PP/PPy Nanocomposites
The polypyrrole nanoparticles prepared by microemulsion polymerization system
were mixed with polypropylene in order to provide some level of processability to
infusible and inprocessable polypyrrole while inducing conductivity to insulating
polypropylene. In order to obtain PP/PPy nanocomposites, the polypyrrole
nanoparticles were mixed with polypropylene by melt mixing technique followed by
pressing to give a regular shape to nanocomposites. The nanocomposites were
processed with injection molding and several black colored dog-bone shaped

37
samples were obtained succesfully. The composition of nanocomposites varied in the
range of 1-20% by weight polypyrrole nanoparticles in polypropylene.
3.4 Characterization of PP/PPy Nanocomposites
3.4.1 Tensile Tests
In this study, mechanical properties of PP/PPy nanocomposites were investigated by
tensile tests. The effect of loading different amounts of polypyrrole nanoparticles
into thermoplastic polypropylene matrix and the changes in mechanical properties
produced by incorporation of polypyrrole nanoparticles were examined. In order to
understand the effect of using sodium dodecylsulphate as dispersant in PP/PPy
nanocomposites, identical tests were performed also for the nanocomposites prepared
with dispersant.
A stress-strain curve is known to provide information about both linear elastic
properties and mechanical properties related to plastic deformation of a material. In
order to specify a material as ductile or brittle, the response of the material to applied
stress is investigated. The area under stress-strain curve corresponds to the energy
required to break the material. As it is clearly seen in Figure 3.3, pure PP is very
ductile at a test rate of 5 cm/min and the area under the curve is very large indicating
the great energy required to break the material. The Young’s modulus, tensile
strength and percentage strain at break values of pure polypropylene are 430 MPa,
27,8 MPa and %424 respectively.

38
Figure 3.3 Stress vs strain curve of pure PP.
The changes in mechanical properties that are produced by loading different amounts
of polypyrrole nanoparticles can be well understood from stress-strain curves of
PP/PPy nanocomposites which are illustrated in Figure 3.4 through 3.8. As it is
clearly observed in stress-strain curves of nanocomposites, addition of polypyrrole
nanoparticles makes polypropylene matrix very brittle. In fact, addition of even the
smallest amount of polypyrrole which is 1% causes a dramatic decrease in the energy
required to break it.
The Young’s modulus, tensile strength and percentage strain at break values for
PP/PPy nanocomposites are illustrated in Table 3.1. The change in percentage strain
at break, tensile strength and Young’s modulus with increasing amount polypyrrole
nanoparticles are shown in Figure 3.9 through Figure 3.11. As it is clearly seen in
Figure 3.9, addition of 1% PPy to PP matrix causes a dramatic decrease in
percentage strain at break value of pure PP. As the amount of PPy nanoparticles in
Stress (MPa)
0
10
20
Percentage Strain00 100 200 300 400
Tensile Setup
5.00 cm
7.60 mm
2.00 mm
injection pure PP 5
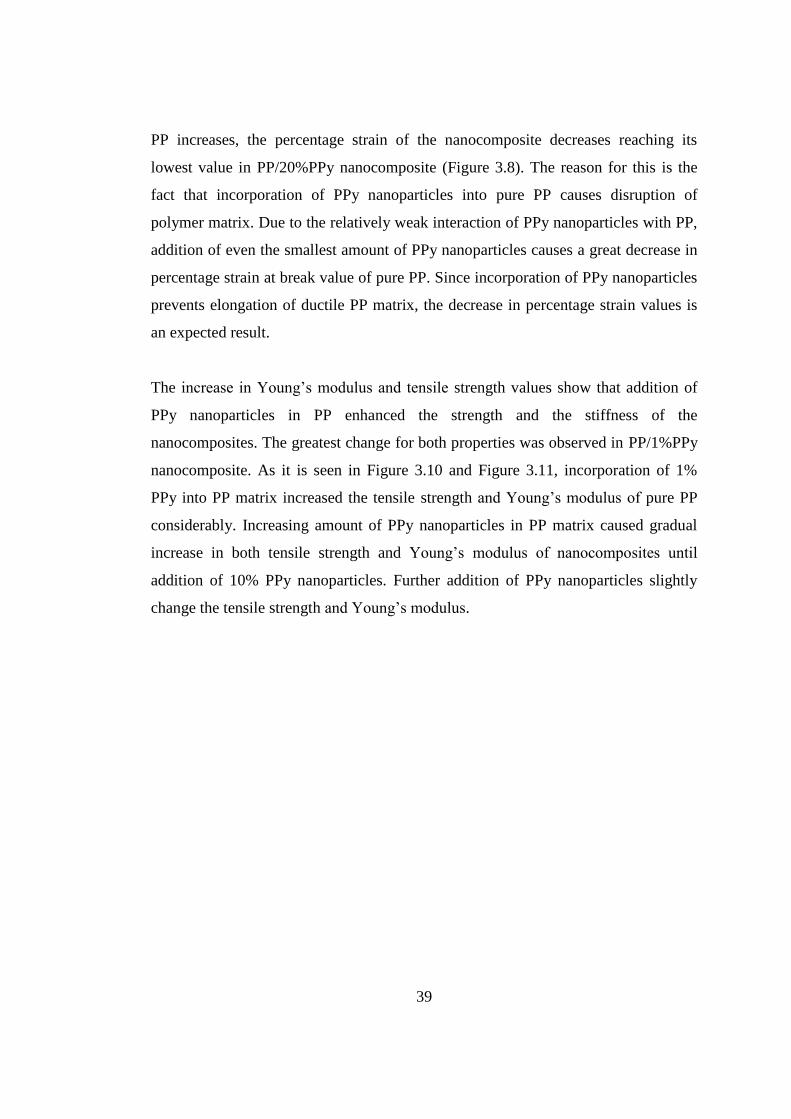
39
PP increases, the percentage strain of the nanocomposite decreases reaching its
lowest value in PP/20%PPy nanocomposite (Figure 3.8). The reason for this is the
fact that incorporation of PPy nanoparticles into pure PP causes disruption of
polymer matrix. Due to the relatively weak interaction of PPy nanoparticles with PP,
addition of even the smallest amount of PPy nanoparticles causes a great decrease in
percentage strain at break value of pure PP. Since incorporation of PPy nanoparticles
prevents elongation of ductile PP matrix, the decrease in percentage strain values is
an expected result.
The increase in Young’s modulus and tensile strength values show that addition of
PPy nanoparticles in PP enhanced the strength and the stiffness of the
nanocomposites. The greatest change for both properties was observed in PP/1%PPy
nanocomposite. As it is seen in Figure 3.10 and Figure 3.11, incorporation of 1%
PPy into PP matrix increased the tensile strength and Young’s modulus of pure PP
considerably. Increasing amount of PPy nanoparticles in PP matrix caused gradual
increase in both tensile strength and Young’s modulus of nanocomposites until
addition of 10% PPy nanoparticles. Further addition of PPy nanoparticles slightly
change the tensile strength and Young’s modulus.
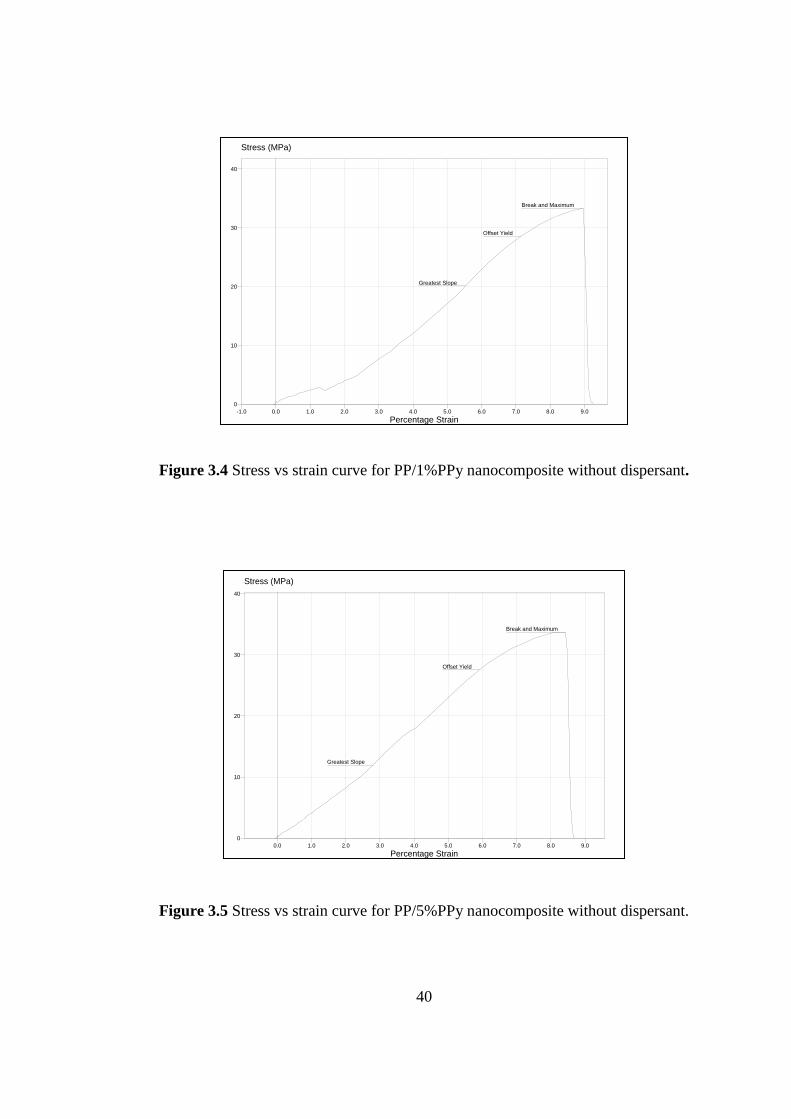
40
Figure 3.4 Stress vs strain curve for PP/1%PPy nanocomposite without dispersant.
Figure 3.5 Stress vs strain curve for PP/5%PPy nanocomposite without dispersant.
Stress (MPa)
0
10
20
30
40
Percentage Strain-1.0 0.0 1.0 2.0 3.0 4.0 5.0 6.0 7.0 8.0 9.0
Break and Maximum
Offset Yield
Greatest Slope
Tensile Setup
5.00 cm
7.60 mm
2.00 mm
PPy 1-4
Stress (MPa)
0
10
20
30
40
Percentage Strain0.0 1.0 2.0 3.0 4.0 5.0 6.0 7.0 8.0 9.0
Break and Maximum
Offset Yield
Greatest Slope
Tensile Setup
5.00 cm
7.60 mm
2.00 mm
PPy 1-2

41
Figure 3.6 Stress vs strain curve for PP/10%PPy nanocomposite without dispersant.
Figure 3.7 Stress vs strain curve for PP/20%PPy nanocomposite without dispersant.
Stress (MPa)
0
10
20
30
40
Percentage Strain-1.0 0.0 1.0 2.0 3.0 4.0 5.0 6.0 7.0 8.0 9.0
Break
Yield and Maximum
Offset Yield
Greatest Slope
Tensile Setup
5.00 cm
7.60 mm
2.00 mm
PPy 1-3
Stress (MPa)
0
10
20
30
40
Percentage Strain0.0 1.0 2.0 3.0 4.0 5.0 6.0 7.0 8.0 9.0
Break and Maximum
Offset Yield
Greatest Slope
Tensile Setup
5.00 cm
7.60 mm
2.00 mm
PPy 5-6

42
a
Figure 3.8 Stress vs strain curves for (a) PP/1%PPy, (b) PP/5%PPy, (c) PP/10%PPy,
(d) PP/20%PPy nanocomposites without dispersant.
Table 3.1 Young’s modulus, tensile strength, percentage strain values for PP,
PP/PPy nanocomposites without dispersant.
PPy content
(w%)
Young's Modulus
(MPa)
Tensile strength
(MPa)
Percentage strain
at break (%)
0 430±10 27,8±0,5 424±9
1 643±53 34,0±0,6 8,5±0,7
5 703±95 34,1±1,2 8,4±2,1
10 787±63 34,0±1,0 8,7±2,0
20 801±46 34,1±0,2 8,9±2,6
Stress (MPa)
0
10
20
30
40
Percentage Strain-1.0 0.0 1.0 2.0 3.0 4.0 5.0 6.0 7.0 8.0 9.0
Break and Maximum
Offset Yield
Greatest Slope
Tensile Setup
5.00 cm
7.60 mm
2.00 mm
PPy 1-4
a b
c d

43
Figure 3.9 Percentage strain at break vs PPy content for PP/PPy nanocomposites
without dispersant.
Figure 3.10 Tensile strength vs PPy content for PP/PPy nanocomposites without
dispersant.

44
Figure 3.11 Young’s modulus vs PPy content for PP/PPy nanocomposites without
dispersant.
The tensile test results of PP/PPy nanocomposites show that incorporation of PPy
nanoparticles in PP improves the strength and the stiffness while limiting the
elongation of PP. In order to investigate the potential improvement in dispersion of
PPy nanoparticles in PP, identical tensile tests were employed to nanocomposites
prepared with dispersant. Due to the effect of dispersant, the interaction between PPy
nanoparticles with PP matrix is expected to be improved. The Young’s modulus,
tensile strength and percentage strain at break values for nanocomposites prepared
with dispersant are presented in Table 3.2. The change in percentage strain at break,
Young’s modulus and tensile strength with increasing polypyrrole content in
nanocomposites prepared with dispersant are shown in Figure 3.17 through Figure
3.19. The gradual decrease in percentage strain at break values for increasing
amounts of PPy is clearly seen in Figure 3.17. Addition of 1% PPy caused a
significant decrease in percentage strain since it prevents extension of PP matrix.

45
However, the decrease in percentage strain is relatively smaller due to binding effect
of dispersant used. Figure 3.18 and 3.19 exhibit the increase in tensile strength and
Young’s modulus of the nanocompoites with addition of PPy. The increase in both
tensile strength and Young’s modulus with increasing PPy content indicate the
reinforcing action of PPy
Figure 3.12 Stress vs strain curve for PP/1%PPy with dispersant.
Stress (MPa)
0
10
20
30
Percentage Strain0.0 5.0 10.0 15.0 20.0
Break
Yield and Maximum
Offset Yield
Greatest Slope
Tensile Setup
5.00 cm
7.60 mm
2.00 mm
PPy 1-SDS 5
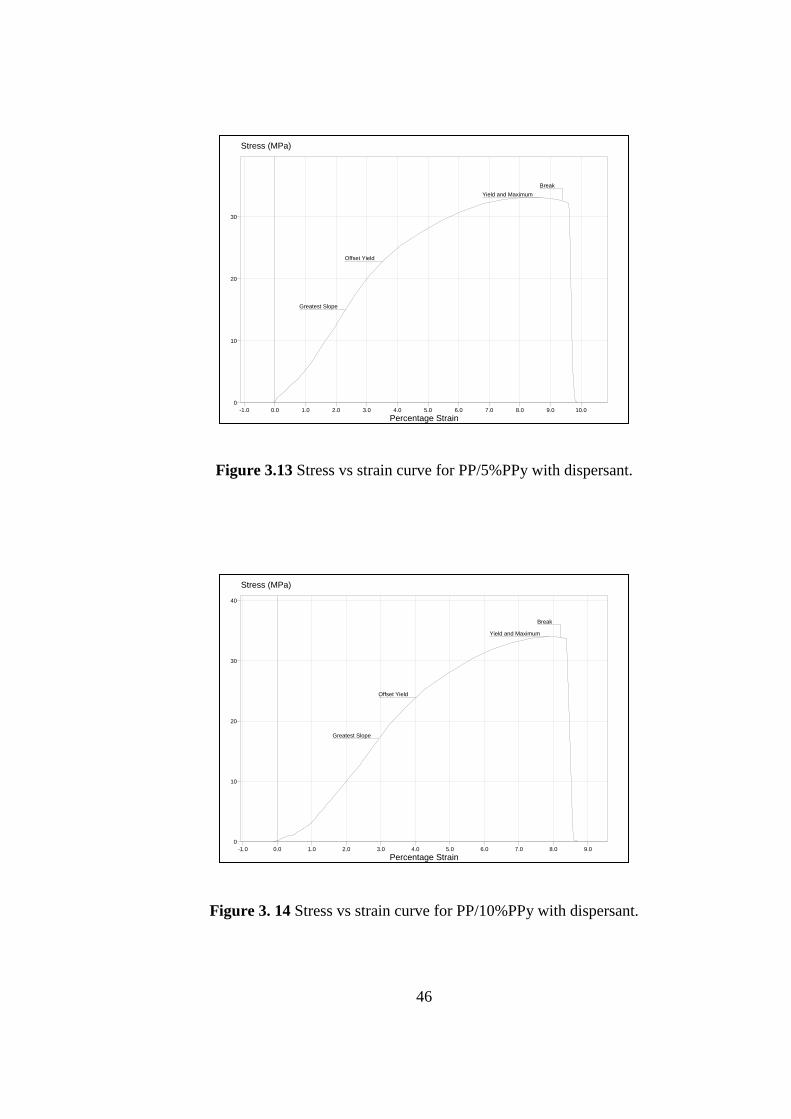
46
Figure 3.13 Stress vs strain curve for PP/5%PPy with dispersant.
Figure 3. 14 Stress vs strain curve for PP/10%PPy with dispersant.
Stress (MPa)
0
10
20
30
Percentage Strain-1.0 0.0 1.0 2.0 3.0 4.0 5.0 6.0 7.0 8.0 9.0 10.0
Break
Yield and Maximum
Offset Yield
Greatest Slope
Tensile Setup
5.00 cm
7.60 mm
2.00 mm
PPy 5-SDS 3
Stress (MPa)
0
10
20
30
40
Percentage Strain-1.0 0.0 1.0 2.0 3.0 4.0 5.0 6.0 7.0 8.0 9.0
Break
Yield and Maximum
Offset Yield
Greatest Slope
Tensile Setup
5.00 cm
7.60 mm
2.00 mm
PPy 10-SDS 2

47
Figure 3.15 Stress vs strain curve for PP/20%PPy with dispersant.
Figure 3.16 Stress vs strain curves for (a) PP/1%PPy, (b) PP/5%PPy, (c)
PP/10%PPy, (d) PP/20%PPy nanocomposites with dispersant.
Stress (MPa)
0
10
20
30
Percentage Strain0.0 1.0 2.0 3.0 4.0 5.0 6.0 7.0 8.0
Break
Yield and Maximum
Offset Yield
Greatest Slope
Tensile Setup
5.00 cm
7.60 mm
2.00 mm
PPy 20-SDS 8
Stress (MPa)
0
10
20
30
Percentage Strain0.0 5.0 10.0 15.0
BreakYield and Maximum
Offset Yield
Greatest Slope
Tensile Setup
5.00 cm
7.60 mm
2.00 mm
PPy 1-SDS 7
a b c
d

48
Table 3.2 Young’s modulus, tensile strength, percentage strain values for PP,
PP/PPy nanocomposites with 2% dispersant by weight.
PPy content
(w%)
Young's Modulus
(MPa)
Tensile strength
(MPa)
Percentage strain
at break (%)
0 430±10 27,8±0,5 424±9
1 583±77 30,1±0,4 14,4±0,2
5 748±53 32,8±0,6 9,3±0,9
10 786±10 32,9±0,4 8,0±0,3
20 831±31 33,2±0,6 7,1±0,2
Figure 3.17 Percentage strain at break vs PPy content for PP/PPy nanocomposites
with dispersant.

49
Figure 3.18 Tensile strength vs PPy content for PP/PPy nanocomposites with
dispersant.
Figure 3.19 Young’s modulus vs PPy content for PP/PPy nanocomposites with
dispersant.

50
In order to investigate the potential effect of dispersant in enhancement of dispersion
of PPy nanoparticles, the change in tensile strength, precentage strain at break and
Young’s modulus for both nanocomposite sets prepared without and with dispersant
are examined (Table 3.1, Table 3.2). The obtained results show that addition of PPy
nanoparticles leads to a similar increase in tensile strength and Young’s modulus of
pure PP in both nanocomposite sets. Although the values are not identical, the values
for nanocomposites involving dispersant did not exhibit significant difference
compared to ones prepared without dispersant. However, the effect of dispersant is
perceived in percentage strain at break values. The nanocomposites prepared using
dispersant exhibited a regular decrease in percentage strain at break while a sudden
decrease was observed for nanocomposites prepared without dispersant. The
percentage strain at break values for PP/1%PPy nanocomposite prepared with and
without dispersant are found to be 14,3 and 8,5 respectively. The higher decrease in
nanocomposite prepared without dispersant can be explained by considering weaker
interaction of polypyrrole with polypropylene. Same case is true for also
nanocomposites with 5% polypyrrole content. Although, similar behaviour was
observed for nanocomposites with 10% and 20% polypyrrole content, the difference
in values are not as considerable as the ones for nanocomposites with 1% and 5%
PPy content.
3.4.2 Electrical Conductivity Measurement
The change in electrical conductivity of PP matrix by incorporation of PPy
nanoparticles was investigated. The amount of PPy nanoparticles in nanocomposites
varied in the range of 1-20% by weight. In order to investigate the effect of
dispersant, identical measurement was performed also with nanocomposites prepared
with dispersant. The conductivity values of PP/PPy nanocomposites prepared
without and with dispersant are shown in Table 3.3 respectively.

51
Table 3.3 Electrical conductivities of PP/PPy nanocomposites
PP/PPy nanocomposites
without dispersant
PP/PPy nanocomposites
with dispersant
w% PPy Conductivity (Scm-1
) Conductivity (Scm-1
)
0 1,0.10-16
1,0.10-16
1 5,60.10-5
9,5.10-5
5 1,24.10-4
1,35.10-4
10 1,32.10-4
1,43.10-4
20 2,25.10-4
2,40.10-4
100 5,2.10-2
5,2.10-2
The electrical conductivity measurement of pure PP showed that conductivity of pure
PP is about 10-16
S cm-1
while the conductivity of PPy nanoparticles is about 5,2.10-2
Scm-1
. The conductivity of PP/1%PPy nanocomposite was found to be about 5,60.10-
5 Scm
-1. As it is clearly observed, addition of even the smallest amount of PPy results
in a considerable increase in electrical conductivity of insulating PP matrix.
Increasing amount PPy nanoparticles increases the conductivity of the
nanocomposite up to 2,25.10-4
S cm-1
. Despite the significant increase in
conductivity of pure PP with addition of 1% PPy nanoparticles, further addition of
PPy did not considerably change the conductivity of the nanocomposites.
The conductivity of PP/1%PPy nanocomposite prepared with dispersant was found
to be about 9,5.10-5
Scm-1
and addition of PPy nanoparticles increases the
conductivity of insulating PP up to 2,40.10-4
S cm-1
. These results show that similar
to nanocomposites prepared without dispersant, increasing amount of PPy
nanoparticles increases the conductivity of pure PP considerably. However,

52
increasing amount of PPy nanoparticles does not appreciably change the conductivity
in nanocomposites prepared with dispersant.
As the amount of PPy nanoparticles increases, formation of a conducting network
begins in PP matrix. Increasing amount of PPy supports formation of a stronger
network while limiting the elongation of PP matrix. The change in conductivity and
elongation with increasing amount of PPy in nanocomposites prepared without and
with dispersant are shown in Figure 3.20 and Figure 3.21 respectively.
Figure 3.20 Conductivity-elongation graph of PP/PPy nanocomposites without
dispersant.

53
Figure 3.21 Conductivity-elongation graph of PP/PPy nanocomposites with
dispersant.
As it is clearly observed in Figures 3.20 and 3.21, there is a range of filler
concentration where the conductivity increases suddenly while the elongation
decreases significantly. This phenomena occurs at a filler concentration range called
percolation threshold. The percolation threshold for PP/PPy nanocomposites
prepared without and with dispersant are found to be 2,0 and 2,4 respectively. These
results confirms that addition of even 1% PPy into PP matrix results in a significant
increase in electrical conductivity. These results are also in agreement with tensile
tests results where the percentage strain values were found to decrease significantly
with incorporation of 1% PPy into PP matrix.
The electrical conductivity results have exhibited that although the conductivity
values of nanocomposite sets are not identical, the order of magnitude, the trend in

54
conductivity and elongation with increasing PPy content are similar. This result show
that dispersant does not have a significant effect on conductivity of the
nanocomposites.
The electrical conductivity of a composite material depend on many factors such as
preparation and processing conditions [14]. Similar to this, synthesis method of PPy
is also crucial in electrical conductivity. Previous studies have shown that the
conductivity of PPy synthesized by oxidative chemical polymerization vary in the
range of 0,9-13 Scm-1
depending on the synthesis conditions [15,37]. Moreover, the
conductivity of PPy nanoparticles synthesized via microemulsion polymerization
system vary in the range of 0,06-9,6 Scm-1
depending synthesis conditions [26,29].
The conductivity of PPy nanoparticles synthesized in this study is found to be about
0,05 Scm-1
which is in agreement with the PPy nanoparticles synthesis studies using
microemulsion polymerization system.
The composites prepared via melt mixing technique are known to have low
conductivities on the order of 10-8
Scm-1
[13]. The reason for that is known to be due
to aggregation and poor dispersion of PPy in PP. In order to overcome aggregation of
PPy particles, researches have studied on potential routes for dispersion of PPy in PP
matrix like surface coating, dispersion solution, in-situ polymerization some reaching
conductivities of 10-2
Scm-1
for 8,9wt% PPy [15]. Since the conductivity of
nanocomposites prepared in this study are in the order of 10-4
Scm-1
, the obtained
results show that homogenization methods like coating or chemical modification
yield composites with higher electrical conductivities.
3.4.3 Thermal Gravimetric Analysis
The thermal stability of nanocomposites was studied by Thermal Gravimetric
Analysis. In order to investigate the effect of dispersant, identical test was employed
also for nanocomposites prepared with dispersant. Figure 3.22 shows the thermal

55
decomposition of pure PP, PPy PP/10%PPy and PP/20%PPy nanocomposites
prepared without dispersant. From derivation of TGA curves, the maximum
decomposition temperatures were estimated and summarized in Table 3.5.
Figure 3.22 TGA plots of (a) pure PP, (b) PP/10%PPy, (c) PP/20%PPy
nanocomposites prepared without dispersant, (d) PPy.
Table 3.4 Maximum decomposition temperatures of pure PP, PP/10%PPy and
PP/20%PPy nanocomposites prepared without dispersant.
Sample Max decomposion temp. (˚C)
Pure PP 412
PP/10%PPy 437
PP/20%PPy 477

56
Polypropylene which is a soft, ductile thermoplatic material decomposes readily
depending on the analysis conditions such as heating rate, instrument, etc. The
maximum decomposition temperature for polypropylene is about 412ºC. Both for
PP/10%PPy and 20% nanocomposites prepared without dispersant, the maximum
decomposition temperatures were shifted to higher values which indicates the
improvement in thermal stability of polypropylene matrix by incorporation of
polypyrrole nanoparticles. The maximum decomposition temperature for
PP/20%PPy nanocomposite prepared without dispersant was found to be 477ºC
which is 65ºC higher than that of pure polypropylene.
TGA results for PP/5%PPy and PP/10%PPy nanocomposites prepared with
dispersant exhibited a significant difference in maximum decomposition temperature
compared to PP/10%PPy nanocomposite prepared without dispersant. TGA results of
pure PP, PPy, PP/5%PPy, PP/10%PPy and PP/20%PPy nanocomposites prepared
with dispersant are presented in Figure 3.23. The maximum decomposition
temperatures are summarized in Table 3.6.
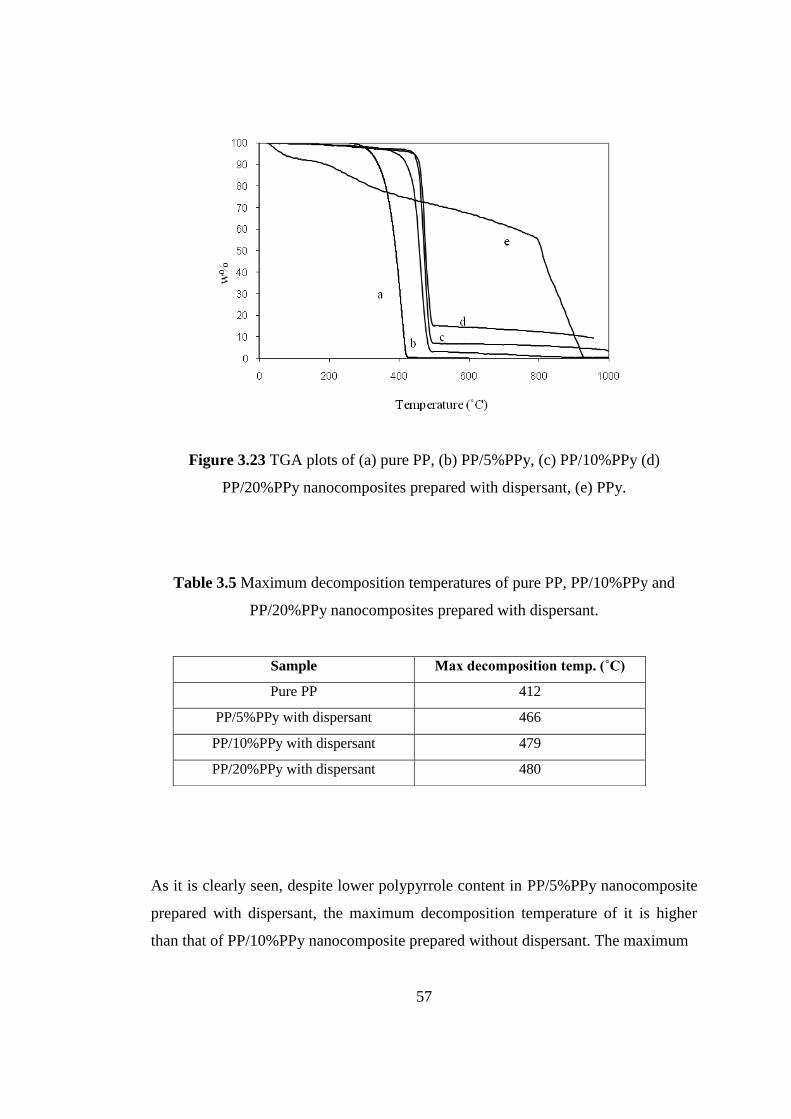
57
Figure 3.23 TGA plots of (a) pure PP, (b) PP/5%PPy, (c) PP/10%PPy (d)
PP/20%PPy nanocomposites prepared with dispersant, (e) PPy.
Table 3.5 Maximum decomposition temperatures of pure PP, PP/10%PPy and
PP/20%PPy nanocomposites prepared with dispersant.
As it is clearly seen, despite lower polypyrrole content in PP/5%PPy nanocomposite
prepared with dispersant, the maximum decomposition temperature of it is higher
than that of PP/10%PPy nanocomposite prepared without dispersant. The maximum
Sample Max decomposition temp. (˚C)
Pure PP 412
PP/5%PPy with dispersant 466
PP/10%PPy with dispersant 479
PP/20%PPy with dispersant 480
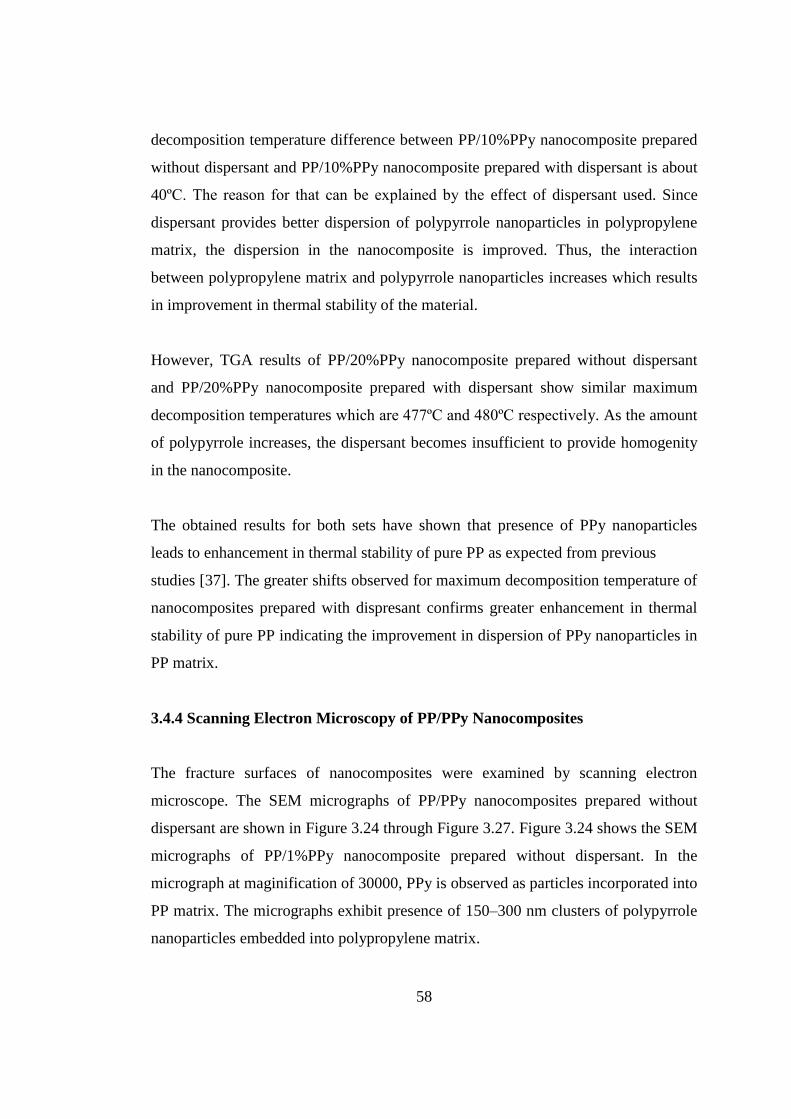
58
decomposition temperature difference between PP/10%PPy nanocomposite prepared
without dispersant and PP/10%PPy nanocomposite prepared with dispersant is about
40ºC. The reason for that can be explained by the effect of dispersant used. Since
dispersant provides better dispersion of polypyrrole nanoparticles in polypropylene
matrix, the dispersion in the nanocomposite is improved. Thus, the interaction
between polypropylene matrix and polypyrrole nanoparticles increases which results
in improvement in thermal stability of the material.
However, TGA results of PP/20%PPy nanocomposite prepared without dispersant
and PP/20%PPy nanocomposite prepared with dispersant show similar maximum
decomposition temperatures which are 477ºC and 480ºC respectively. As the amount
of polypyrrole increases, the dispersant becomes insufficient to provide homogenity
in the nanocomposite.
The obtained results for both sets have shown that presence of PPy nanoparticles
leads to enhancement in thermal stability of pure PP as expected from previous
studies [37]. The greater shifts observed for maximum decomposition temperature of
nanocomposites prepared with dispresant confirms greater enhancement in thermal
stability of pure PP indicating the improvement in dispersion of PPy nanoparticles in
PP matrix.
3.4.4 Scanning Electron Microscopy of PP/PPy Nanocomposites
The fracture surfaces of nanocomposites were examined by scanning electron
microscope. The SEM micrographs of PP/PPy nanocomposites prepared without
dispersant are shown in Figure 3.24 through Figure 3.27. Figure 3.24 shows the SEM
micrographs of PP/1%PPy nanocomposite prepared without dispersant. In the
micrograph at maginification of 30000, PPy is observed as particles incorporated into
PP matrix. The micrographs exhibit presence of 150–300 nm clusters of polypyrrole
nanoparticles embedded into polypropylene matrix.

59
Figure 3.25 shows SEM micrographs of PP/5%PPy nanocomposite at magnifications
of 30000 and 80000. Both micrographs exhibit presence of globular polypyrrole
nanoparticles with relatively large dimensions. The dimensions of polypyrrole
clusters which are about 160–250 nm are clearly observed in the micrograph with
80000 magnification. The reason for formation of clusters can be explained by
agglomeration of PPy nanoparticles due to poor dispersion in PP matrix.
The fracture surface of PP/10%PPy nanocomposite is shown in Figure 3.26. Unlike
PP/1%PPy and 5% nanocomposites, the fracture surface of PP/10%PPy
nanocomposite involves less nanoparticle images which indicates that large amount
of PPy nanoparticles were embedded in PP matrix.
Figure 3.27 exhibits the fracture surface of PP/20%PPy nanocomposites at
magnifications of 3000 and 30000 respectively. The micrograph at 30000
magnification clearly shows clusters of polypyrrole nanoparticles on the fracture
surface of PP/20%PPy nanocomposite. This shows the fact that as the amount of PPy
reaches 20%, by weight, PPy can not be found in the form of nanoparticles and
formation of clusters can no longer be prevented.

60
(a)
(b)
(b)
Figure 3.24 Fracture surface of PP/1%PPy nanocomposite without dispersant at
magnification of (a) 3000, (b) 30000.

61
(a)
(b)
Figure 3.25 Fracture surface of PP/5%PPy without dispersant at magnification of (a)
30000, (b) 80000.
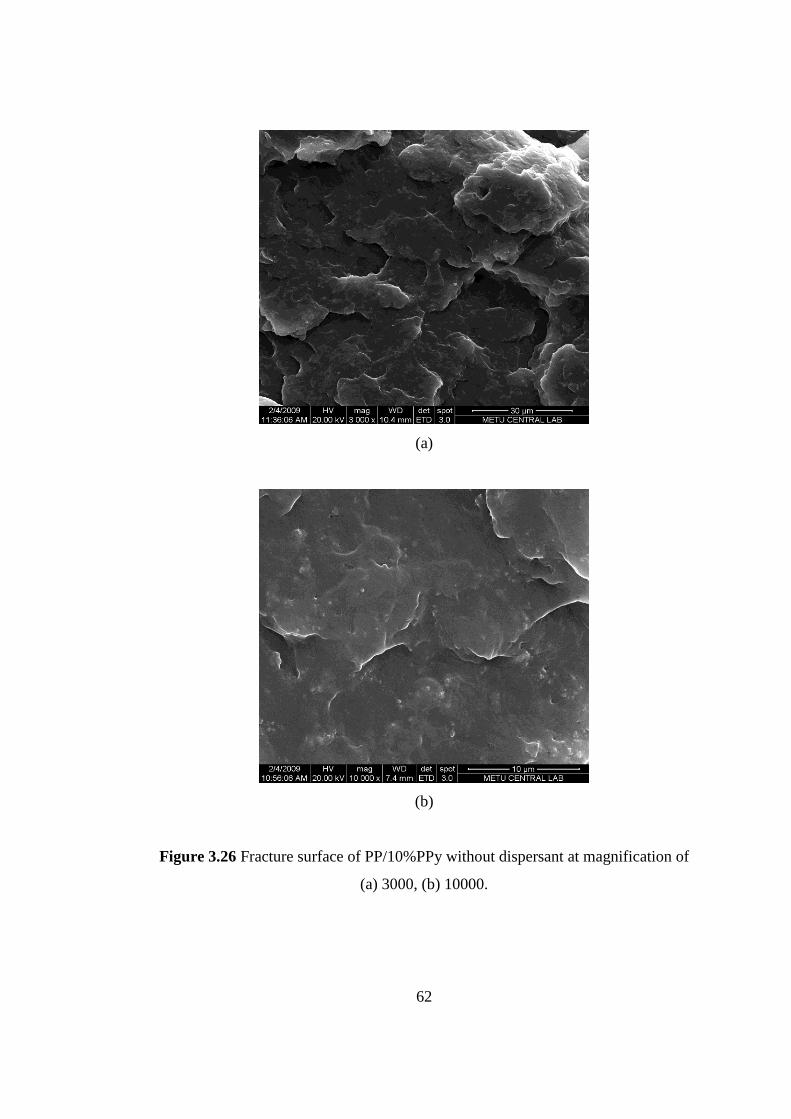
62
(a)
(b)
Figure 3.26 Fracture surface of PP/10%PPy without dispersant at magnification of
(a) 3000, (b) 10000.
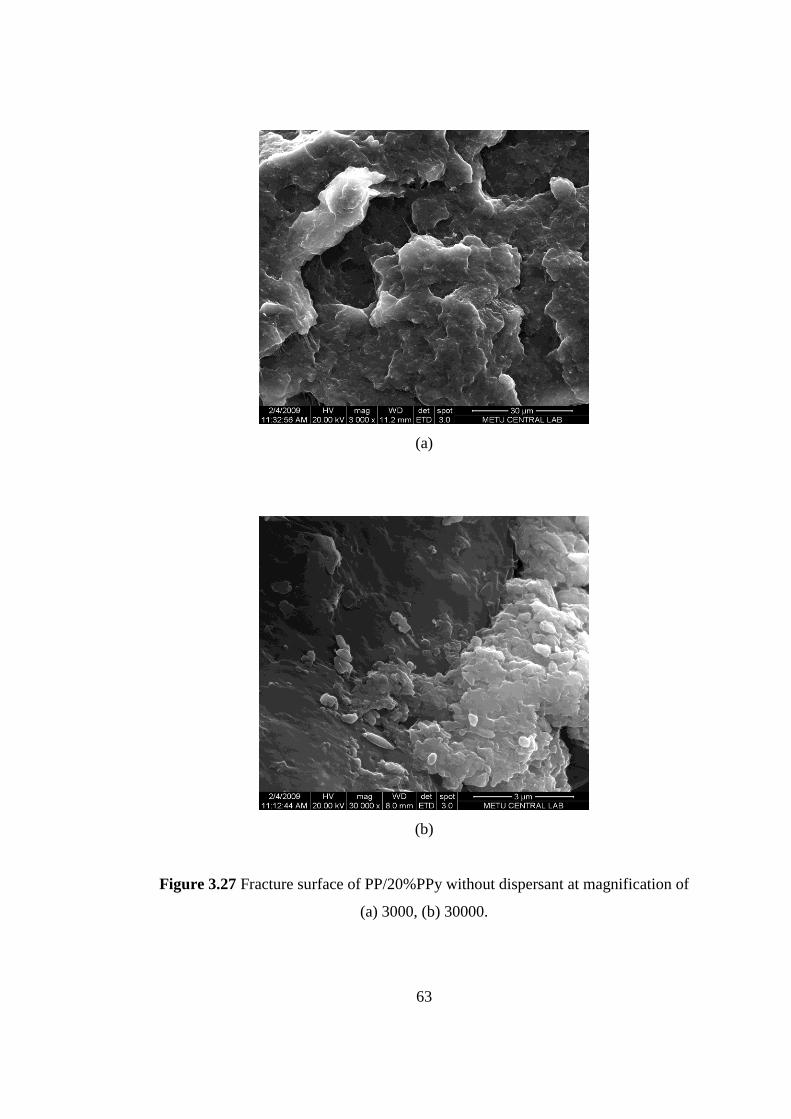
63
(a)
(b)
Figure 3.27 Fracture surface of PP/20%PPy without dispersant at magnification of
(a) 3000, (b) 30000.

64
The fracture surfaces of PP/PPy prepared with dispersant are shown in Figure 3.28
through Figure 3.31. The SEM micrographs of PP/1%PPy nanocomposite prepared
with dispersant which is exhibited in Figure 3.28 clearly shows the presence of
regularly dispersed globular polypyrrole particles having nanodimensions. The
enhancement in dispersion and decrease in nanoparticle dimension can be explained
by the effect of dispersant used.
Figure 3.29 shows SEM micrographs of PP/5%PPy nanocomposite prepared with
dispersant at magnifications of 30000 and 80000 respectively. Similar to PP/1%PPy
nanocomposite prepared with dispersant, globular polypyrrole nanoparticles having
dimensions about 60–100 nm is well observed in the micrograph with 80000
magnification.
The SEM micrographs of PP/10%PPy nanocomposite prepared with dispersant
which are exhibited in Figure 3.30 show presence of polypyrrole both in nanoparticle
and cluster fom embedded in PP matrix. This situation shows that as the amount of
polypyrrole increases, the dispersant becomes insufficient to prevent formation of
polypyrrole clusters.
Figure 3.31 exhibits the fracture surface of PP/20%PPy nanocomposite prepared with
dispersant at magnifications of 3000 and 30000 respectively. Similar to previous
case, the fracture surface of PP/20%PPy nanocomposite prepared with dispersant
exhibits presence of polypyrrole both in nanoparticle and cluster form. Since 20% is
the highest amount of polypyrrole used in nanocomposites, this situation is an
expected result.
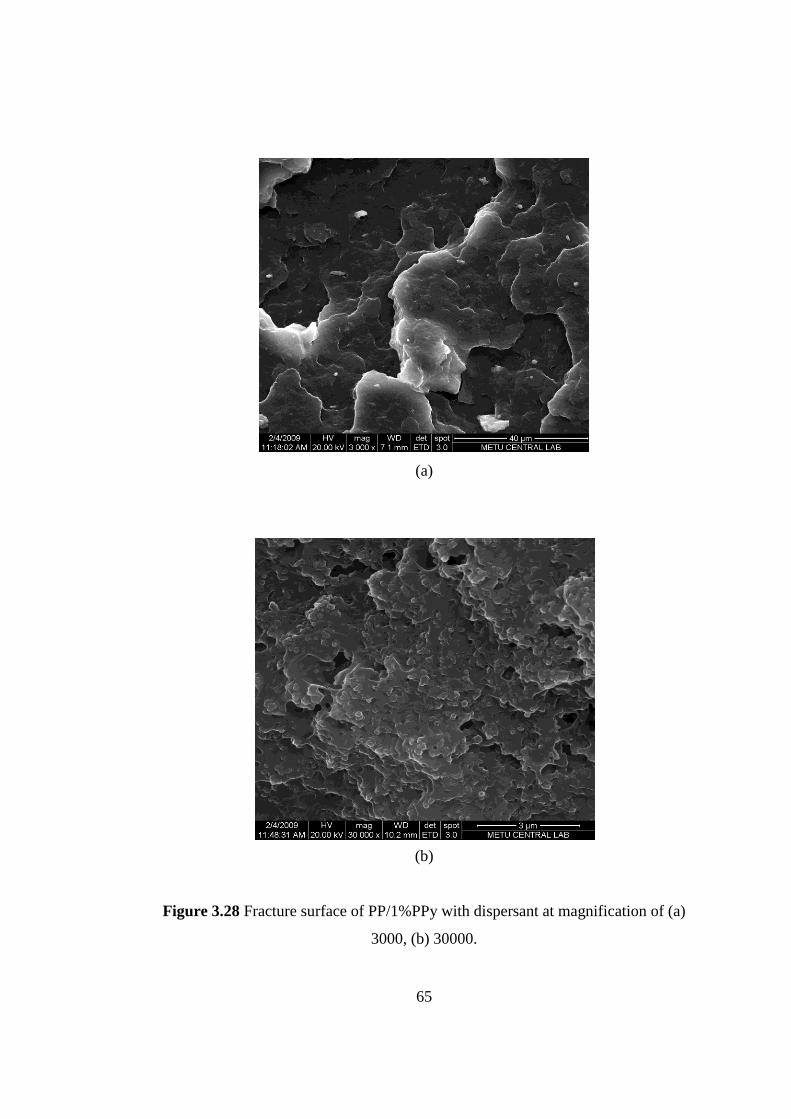
65
(a)
(b)
Figure 3.28 Fracture surface of PP/1%PPy with dispersant at magnification of (a)
3000, (b) 30000.

66
(a)
(b)
Figure 3.29 Fracture surface of PP/5%PPy with dispersant at magnification of (a)
30000, (b) 80000.

67
(a)
(b)
Figure 3.30 Fracture surface of PP/10%PPy with dispersant at magnification of (a)
3000, (b) 30000.

68
(a)
(b)
Figure 3.31 Fracture surface of PP/20%PPy with dispersant at magnification of (a)
3000, (b) 30000.

69
The SEM micrographs of PP/1%PPy and 5% nanocomposites prepared without
dispersant were observed to involve larger polypyrrole nanoparticles compared to
ones prepared with dispersant. Comparison of the micrographs of PP/5%PPy
nanocomposites prepared without and with dispersant clearly shows the difference in
dimensions and dispersion of polypyrrole nanoparticles (Figue 3.25-b, Figure 3.29-
b). In PP/5%PPy nanocomposite prepared without dispersant, the dimension of
polypyrrole nanoparticles were observed to be in the range between 160-200 nm
whereas, PP/5%PPy nanocomposite prepared with dispersant was observed to
involve polypyrrole nanoparticles with dimensions varying between 60-100 nm.
PP/5%PPy nanocomposite prepared without dispersant exhibited relatively better
dispersion and less cluster formation of polypyrrole nanoparticles through
polypropylene matrix compared to the one prepared without dispersant.
PP/20%PPy nanocomposites prepared without dispersant was observed to contain
clusters of polypyrrole embedded in PP matrix whereas, PP/20%PPy nanocomposite
prepared with dispersant involved both polypyrrole nanoparticles and clusters with
relatively better dispersion. These results show that the use of dispersant in
nanocomposites leads to relatively better dispersion and decrease in dimensions of
polypyrrole nanoparticles especially at low PPy nanoparticle contents.

70
CHAPTER 4
CONCLUSION
Polypyrrole nanoparticles were prepared by microemulsion polymerization system
using iron chloride hexahydrate as the oxidant and sodium dodecylsulphate as the
surfactant. The SEM micrographs of polypyrrole have exhibited presence of
globular, nanometer-sized particles having dimensions between 50–150 nm. The
electrical conductivity measurement has shown that electrical conductivity of
polypyrrole is in the order of 10-2
Scm-1
.
The tensile test has shown that addition of PPy nanoparticles has increased the
Young’s modulus and tensile strength similarly in both sets indicating the
enhancement in stiffness and strength of pure PP. However, the effect of dispersant
was perceived in percentage strain at break values. The nanocomposites prepared
with dispersant have exhibited a regular decrease in percentage strain at break while
a sudden decrease was observed for nanocomposites prepared without dispersant.
The higher decrease in nanocomposites prepared without dispersant can be explained
by considering weaker interaction of polypyrrole with polypropylene matrix.
The electrical conductivity measurements have shown that increasing amount PPy
nanoparticles increases the conductivity of the nanocomposites up to orders of 10-4
S
cm-1
both sets. The electrical conductivity results have exhibited that the order of
magnitude and the trend in conductivity-elongation with increasing PPy content were
similar in both nanocomposites sets indicating that using dispersant does not have a
significant effect on conductivity of the nanocomposites.
Thermal Gravimetric Analysis has shown that incorporation of PPy nanoparticles
leads to enhancement in thermal stability of pure PP. The greater shifts observed for

71
maximum decomposition temperature of nanocomposites prepared with dispersant
confirms the greater enhancement in thermal stability of pure PP indicating the
improvement in dispersion of PPy nanoparticles in PP matrix.
The SEM micrographs of PP/1%PPy and 5% prepared without dispersant have
exhibited presence of globular PPy particles with dimensions in the range between
100 to 200 nm. However, PP/1%PPy and 5% nanocomposites prepared with
dispersant have shown PPy nanoparticles having dimensions in the range of 60-100
nm. The SEM results have shown that low PPy content nanocomposites prepared
with dispersant involve smaller dimension nanoparticles compared to ones prepared
without dispersant. confirming the effect of dispersant in prevention of cluster
formation.
72
REFERENCES
[1] Freund, M.S., Deore B., Self-Doped Conducting Polymers, Wiley, pp.1,2, 10-12,
2006.
[2] Epstein, A.J., Electrical Conductivity in Conjugated Polymers, Conductive
Polymers and Plastics in Industrial Applications, Platics Design Library, 1, 93, 1999.
[3] Inzelt, G., Conducting Polymers A New Era in Electrochemistry, Springer, 1,
2008.
[4] Advani, S.G., Processing and Properties of Nanocomposites, World Scientific,
pp. 1, 2007.
[5] Kricheldorf, H.R., Nuyken, O., Swift, G., Handbook of Polymer Synthesis,
Marcel Dekker., Ch. 12, pp 1,3,4, USA, 2005.
[6] Wikipedia, The Free Encylopedia,
http://en.wikipedia.org/wiki/Polypropylene, last accessed on 10th May 2009.
[7] Ansari, R., Polypyrrole conducting electroactive polymers: Synthesis and
stability studies, E-Journal of Chemistry, Vol.3, No.13, pp 186-201, 2006.
[8] Nobel Foundation, Nobel Prize in Chemistry 2000,
http://nobelprize.org/nobel_prizes/chemistry/laureates/2000/chem1c-farg.jpg, last
accessed on 12th May2009.
[9] Conducting Polymers,
http://homepage.ntlworld.comcolin.prattcpoly.pdf, last accessed on 13th May 2009.
[10] Lubin, G., Handbook of Composites, Van Nostrand Reinhold Company Inc.,
USA, pp1,2, 1982.
[11] Schwartz, M.M., Composite Materials, Volume I: Properties, Nondestructive
Testing and Repair, Prentice-Hall Inc., New Jersey, pp 10,11, 1997.
[12] Sanjay, K. Mazumdar, Composites Manufacturing Materials, Product and
Process Engineering, CRC Press LLC, USA, pp 4-6, 2002.
[13] Omastova, M., Chodak I., Pionteck, J., Potschke, P., Preparation and properties
of polyolefins composites, Journal of Macromolecular Science, Part A, 35:7, 1117-
1126, 1998.

73
[14] Pionteck, J., Omastova, M., Potschke, P., Simon, F., Chodak, I., Morphology,
conductivity, and mechanical properties of polypyrrole-containing composites,
Journal of Macromolecular Science, Part B, 38:5, 737-748, 1999.
[15] Mravcakova, M., Omastova, M., Potschke, P., Pozsgy A., Pukanszky, B.,
Pionteck, J., Polypropylene/montmorillonite/polypyrrole composites: structure and
conductivity, Polym. Adv. Technol., 17: 715-726, 2006.
[16] He, F., Omoto, M., Yamamoto, T., Kise, H., Preparation of polypyrrole-
polyurethane composite foam by vapor phase oxidative polymerization, Journal of
Applied Polymer Science, Vol. 55, 283-287, 1995.
[17] Ajayan, P.M., Schadler, L.S., Braun, P.V., Nanocomposite Science and
Technology, Wiley, VCH Verlag GmbH Co. KGaA, Weinheim, pp 10, 77-80, 111,
112, 2003.
[18] Lee, E.S., Park, J.H., Wallace, G.G., Bae, Y.H., In situ formed processable
polypyrrole nanoparticle/amphiphilic elastomer composites and their properties,
Polymer International, 53:400-405, 2004.
[19] Wu, T-M., Yen, S-J., Chen, E-C., Chiang, R-K., Synthesis, characterization, and
properties of monodispersed magnetite coated multi-walled carbon
nanotube/polypyrrole nanocomposites synthesized by in-situ chemical oxidative
polymerization, Journal of Polymer Science: Part B: Polymer Physics, Vol. 46, 727-
733, 2008.
[20] Boukerma, K., Piquemal, J-Y., Chehimi, M.,M., Mravcakova, M., Omastova,
M., Beaunier, P., Synthesis and interfacial properties of montmorillonite/polypyrrole
nanocomposites, Polymer, 47, pp 569-576, 2006.
[21] Mravcakova, M., Boukerma, K., Omastova, M., Chehimi, M.M.,
Montmorillonite/polypyrrole nanocomposites. The effect of organic modification of
clay on the chemical and electrical properties, Materials Science and Engineering C
26, pp 306-313, 2006.
[22] Ranaweera, A.U., Bandara, H.M.N., Rajapakse, R.M.G., Electonically
conducting montmorillonite-Cu2S and montmorillonite-Cu2S-polypyrrole
nanocomposites, Electrochimica Acta, 52, pp 7203-7209, 2007.
[23] Dallas, P., Niarchos, D., Vrbanic, D., Boukos, N., Pejovnik, S., Trapalis, C.,
Petridis, D., Interfacial polymerization of pyrrole and in situ synthesis of
polypyrrole/silver nanocomposites, Polymer 48, pp 2007-2013, 2007.

74
[24] Carotenuto, G., Her ,Y.-S., Matijevic, E., Ind. Eng. Chem. Res., 35,2929, 1996.
[25] Liu, Y-C., Method of evaluating the ionic conductance of polypyrrole films and
improvement of ionic conductance of polyethlene oxide-incoporated polypyrrole
composite, Materials Chemistry and Physics 77, pp 791-795, 2002.
[26] Liu Y., Chu Y., Yang L., Adjusting the inner-structure of polypyrrole
nanoparticles through microemulsion polymerization, Materials Chemistry and
Physics, 98, pp. 304-308, 2006.
[27] Goel, S., Gupta, A., Singh, K.P., Mehrotra, R., Kandpal, H.C., Structural and
optical studies of polypyrrole nanostuctures, International Journal of Applied
Chemistry, Vol. 2, No.3, pp. 157-168, 2006.
[28] Harutun G. Karian, Handbook of Polypropylene and Polypropylene Composites,
2nd edition, Marcel Dekker, Inc., USA, pp 11,12, 2003.
[29]Wang, H., Lin, T., Kaynak, A., Polypyrrole nanoparticles and dye absorption
properties, Synthetic Metals, 151, pp. 136-140, 2005.
[30] Zhang, X., Manohar, S.K., Narrow pore-diameter polypyrrole nanotubes,
Journal of American Chemical Society, 41, pp. 14156-14157, 2005.
[31] Karim, M.R., Lee, C.J., Lee, M.S., Synthesis of conducting polypyrole by
radiolysis polymerization method, Polymers for Advanced Technologies, 18, pp.
916-920, 2007.
[32] Jang, J., Oh, J.H., Stucky, G.D., Fabrication of ultrafine conducting polymer and
graphite nanoparticles, Angew. Chem. Int. Ed., 41, No. 21, 2002.
[33] University of Wisconsin-Madison, Department of Physics, Structural Studies of
Conducting Polymers , http://romano.physics.wisc.edu/winokur/handbook/img2.gif,
last accessed on 10th May 1997.
[34]Wikipedia The Free Encylopedia,
http://upload.wikimedia.org/wikipedia/commons/thumb/4/4c/Sodium_dodecyl_sulfat
e.svg/800px-Sodium_dodecyl_sulfate.svg.png, last accessed on 5th May 2009.
[35] Shah, V., Handbook of Plastics Testing and Failure Analysis, 3rd
Edition, John
Wiley&Sons, Inc., Hoboken, New Jersey, pp . 17-30, 2007
[36] Images Scientific Instruments Inc.,
http://www.imagesco.com/articles/superconductors/four-point-electrical-probe.html,
last accessed on15th April 2007.

75
[37] Omastova, M., Mravcakova, M., Chodak, I., Pionteck J., Haussler L.,
Conductive polypropylene/clay/polypyrrole nanocomposites, Polymer Engineering
and Science, 1069-1078, 2006.
[38] Pavel, F.M., Microemulsion polymerization, Journal of Dispersion Science and
Technology, Vol. 25, No. 1, pp. 1-16, 2004.
[39]. Tadros, T.H., Applied Surfactants, Wiley-VCH Verlag GmbH&Co. KGaA, pp.
1-5, 2005.
[40] Wallace, G.G., Spinks, G.M., Kane-Maguire, L.A.P., Teasdale, P.R.,
Conductive Electroactive Polymers, Intelligent Materials Systems, 2nd edition, CRC
Press LCC, USA, pp.51, 2003.


![The Force-Elongation Curve of a Thin Fibrous Network · terms of a suitable theory. To this end Dodson [1]' has ... of the Force-Elongation Curve During a tensile test the following](https://static.fdocuments.in/doc/165x107/5b16ebee7f8b9a06068b7e80/the-force-elongation-curve-of-a-thin-fibrous-network-terms-of-a-suitable-theory.jpg)