SYNTHESIS AND CHARACTERIZATION OF...
50
SYNTHESIS AND CHARACTERIZATION OF COBALT NANOPARTICLES PREPARED BY LIQUID-PHASE REDUCTION MARY DONNABELLE L. BALELA UNIVERSITI SAINS MALAYSIA 2008
Transcript of SYNTHESIS AND CHARACTERIZATION OF...
SYNTHESIS AND CHARACTERIZATION OF COBALT NANOPARTICLES PREPARED BY
LIQUID-PHASE REDUCTION
MARY DONNABELLE L. BALELA
UNIVERSITI SAINS MALAYSIA 2008

SYNTHESIS AND CHARACTERIZATION OF COBALT NANOPARTICLES PREPARED BY LIQUID-PHASE REDUCTION
by
MARY DONNABELLE L. BALELA
Thesis submitted in fulfillment of the
requirements for the Degree of Master of Science
July 2008

ii
ACKNOWLEDGEMENTS
I would like to extend my gratitude to the following individuals and
institutions for their significant contributions in making the current research work
possible:
• Dr. Zainovia Lockman, for her constant probing, questioning, and
correcting, for her unbelievable patience, for teaching me the value of
research and what it takes to produce a good one.
• Dr. Azizan Aziz, for the conversations, debates, and arguments, for the
commendable patience as well.
• Prof. Eiichiro Matsubara and Dr. Alberto Amorsolo Jr., for their
valuable suggestions and advices.
• AUNSEED-Net/JICA, for the scholarship and financial assistance.
• Pn. Fong, Pn. Haslina, Zaini, Zul, En. Suhaimi, En. Azrul, En. Azam,
En. Rashid, for the company and assistance during experiments. Laboratory
work was never dull because of these people.
• Mr. Muthu and the staff of the Electron Microscope Laboratory, School
of Biology, USM, for the encouragements and support especially during
those long months of frustrations and failures.

iii
• Mr. Karuna of the Crystallography Laboratory, School of Physics,
USM, for the assistance in the XRD analysis.
• Dr. Mohd and En. Elias of SIRIM-AMREC, for the help on the magnetic
measurements.
• Kak Na, Kak Mila, and the rest of the administrative staff of the School
of Materials and Mineral Resources Engg, USM, for their assistance on
purchases and testing.
• Ng, Chia, and Hwee Yeo, for the help during TEM and XRD testing and for
the interesting discussions in the labs.
• Laili and Dr. Azizan Aziz, for the abstract translation.
• Vilay, Erfan, Tedi, Mr. Toguh, Luan, Viet, Dika, Kim, Nad, Parisha,
and to all my USM friends, for putting up with me these past two years.
• To my family, for their encouragement and support.
• Eugene Clef – for the blind faith, for being there 24/7, for keeping me sane
everyday, for making my life fun, interesting, and worth living.
Most of all, to God Almighty for all the blessings and opportunities He bestowed on
me; for the good health and for each day of being alive.

iv
TABLE OF CONTENTS PAGE
ACKNOWLEDGEMENTS ii
TABLE OF CONTENTS iv
LIST OF TABLES x
LIST OF FIGURES xiii
LIST OF ABBREVIATIONS xxii
LIST OF SYMBOLS xxiii
ABSTRAK xxiv
ABSTRACT xxv
CHAPTER 1: INTRODUCTION
1.1 Background of the Study and Problem Statement 1
1.2 Objectives of the Study 4
1.3 Project Overview 4
CHAPTER 2: LITERATURE REVIEW
2.1 Introduction 6
2.2 Cobalt Allotropes and their Allotropic Phase Transformations:
for Bulk and Nanosized Particles
8
2.3 Formation of Monosized and Uniformly Dispersed Cobalt
and Other Metal Nanoparticles
13
2.3.1 Separation of Nucleation and Growth 14
2.3.2 Control of the Growth Process 18
v
2.3.3 Inhibition of Random Agglomeration of Nanoparticles 21
2.3.4 Reserve of Monomers 24
2.4 Liquid-Phase Synthesis of Cobalt and Other Magnetic Nanoparticles 24
2.4.1 Metal Salt Reduction 26
2.4.2 Reactions in Reverse Micelles 29
2.4.3 Organometallic Syntheses 30
2.4.3.1 High Temperature Reduction 31
2.4.3.2 Thermal Decomposition of Organometallic
Compounds
32
2.5 Tailoring the Particle Size of Cobalt and Other Nanoparticles 32
2.5.1 Influence of Temperature on the Particle Size 33
2.5.2 Influence of Reactant Concentration on Particle Size 35
2.5.3 Influence of Reducing Agent on Particle Size 36
2.5.4 Influence of Protective Agents on Particle Size 37
2.5.5 Influences by Other Factors on the Particle Size 37
2.6 Magnetic Properties of Bulk and Nanosized Cobalt Particles 38
2.7 Oxidation of Bulk and Nanosized Cobalt Particles 46
2.8 Applications of Bulk and Nanosized Cobalt Particles 49
CHAPTER 3: MATERIALS AND METHODS
3.1 Introduction 51
3.2 Raw Materials 52
3.3 Method A: Metal Salt Reduction Using Hydrazine 53
3.3.1 Preparation of Solutions 54
3.3.2 Mixing of Solutions 55

vi
3.3.3 Effects of Process Temperature on the Reduction of Cobalt
Ions and on the Particle Size of Cobalt Nanoparticles
56
3.3.4 Effect of Stirring Speed on the Particle Size of Cobalt
Nanoparticles
56
3.3.5 Effects of Amount of Hydrazine on the Reduction of Cobalt
Ions and on the Particle Size of Cobalt Nanoparticles
57
3.3.6 Effect of Precursor Concentration (CoCl2·6H2O) on the
Reduction of Cobalt Ions and on the Particle Size of Cobalt
Nanoparticles
57
3.3.7 Precipitation of Colloidal Cobalt Nanoparticles 58
3.4 Method B: Metal Salt Reduction by the Polyol Method 58
3.4.1 Solution Preparation and Synthesis of Cobalt Particles 60
3.4.2 Effect of Precursor Concentration ((C2H3O2)2Co·4H2O)
on Cobalt Particle Size
60
3.4.3 Effect of Addition of Nucleating Agent on Cobalt
Particle Size
60
3.4.4 Effect of the Amount of Nucleating Agent on Cobalt
Particle Size
61
3.4.5 Effects of Addition of PVP k15 and its Amount on the
Particle Size and Agglomeration of the Cobalt Particles
62
3.5 Washing, Drying, and Storage of Cobalt Nanoparticles 64
3.6 Characterization of Cobalt Nanoparticles 64
3.6.1 Morphological and Structural Analyses 65
3.6.1.1 Transmission Electron Microscope (TEM) 65

vii
3.6.1.2 Field-Emission Scanning Electron Microscope
(FE-SEM)
66
3.6.2 Phase Analysis and Crystallite Size Determination 67
3.6.3 Chemical Analysis 68
3.6.4 Room-Temperature Magnetic Measurements 68
3.7 Chemical Reactivity (Thermal Oxidation Properties) of the Cobalt
Particles Prepared by the Polyol Method
69
CHAPTER 4: RESULTS AND DISCUSSION
4.1 Introduction 70
4.2 Method A: Metal Salt Reduction Using Hydrazine 70
4.2.1 Effects of Process Temperature on the Reduction of
Cobalt Ions and on the Particle Size of Cobalt Nanoparticles
71
4.2.2 Effect of Stirring Speed on Particle Size 81
4.2.3 Effect of Amount of Hydrazine on the Reduction of
Cobalt Ions and on the Particle Size of Cobalt Nanoparticles
85
4.2.4 Effect of Cobalt Chloride Concentration on the Reduction
of Cobalt Ions and on the Particle Size of
Cobalt Nanoparticles
93
4.2.5 Summary of Results 100
4.3 Method B: Metal Salt Reduction by the Polyol Method 101
4.3.1 Effect of Cobalt Acetate Concentration on the Particle Size 108
4.3.2 Effect of Addition of Nucleating Agent on the Cobalt
Particle Size
114
viii
4.3.3 Effect of the Amount of Nucleating Agent on the Cobalt
Particle Size
122
4.3.3.1 Effect of the Amount of AgNO3 on the Cobalt
Particle Size
122
4.3.3.2 Effect of the Amount of PdCl2 on the Cobalt
Particle Size
127
4.3.3.3 Effect of the Amount of H2PtCl6 on the Cobalt
Particle Size
131
4.3.4 Effect of the Addition of PVP k15 on the Particle Size
and Agglomeration of Cobalt Particles
136
4.3.5 Summary of Results 144
4.4 Room-Temperature Magnetic Properties of the Cobalt Particles
Prepared by the Polyol Method
145
4.4.1 Size-Dependence of the Coercivity (Hc) of the
Cobalt Particles
148
4.4.2 Size-Dependence of the Saturation Magnetization (Ms)
and Remanence (Mr/Ms) of the Cobalt Particles
150
4.4.3 Summary of Results 152
4.5 Chemical Reactivity (Thermal Oxidation Properties)
of the Cobalt Particles Prepared by the Polyol Method
152
4.5.1 Chemical Reactivity (Thermal Oxidation Properties)
of Pure Cobalt Particles
154
4.5.2 Chemical Reactivity (Thermal Oxidation Properties)
of the Cobalt Nanoparticles with Pd Nucleus
157

ix
4.5.3 Chemical Reactivity (Thermal Oxidation Properties)
of the Cobalt Nanoparticles with Pt Nucleus
161
4.5.4 Summary of Results 164
CHAPTER 5: CONCLUSIONS AND RECOMMENDATIONS
5.1 Introduction 165
5.2 Conclusions 165
5.2.1 Method A: Metal Salt Reduction Using Hydrazine 165
5.2.2 Method B: Metal Salt Reduction by the Polyol Method 166
5.2.3 Room-Temperature Magnetic Properties of the Cobalt
Particles Prepared by the Polyol Method
166
5.2.4 Chemical Reactivity (Thermal Oxidation Properties)
of the Cobalt Particles Prepared by the Polyol Method
166
5.3 Recommendations for Future Research 167
REFERENCES 168
APPENDIX: REPRODUCIBILITY
LIST OF PUBLICATIONS
LIST OF PRESENTATIONS

x
LIST OF TABLES
PAGE
Table 2.1 Lattice Parameters, Lattice Surface Area (A), Lattice Volume
(V), and Calculated Densities (ρ) for HCP-Co, FCC-Co, and
ε-Co (ICDD Card No. 5-0727 and 15-0806; Dinega and
Bawendi, 1991; Sun and Murray, 1999; Ram, 2001)
9
Table 2.2 Comparison of Diffraction Peaks and Relative Intensities of
11 nm Co Nanocrystals and β-Mn (Sun and Murray, 1999).
12
Table 2.3 Magnetic Moment per Atom and Magnetocrystalline
Anisotropy of HCP-Co, FCC-Co, and ε-Co (Cullity, 1972;
Shukla et al., 2006).
13
Table 2.4 Some Protective Agents Used in the Synthesis of Co
Nanoparticles.
23
Table 2.5 Standard Electrode Potential, E˚ and the Corresponding
Reduction Reactions Taken at STP and in Aqueous Solutions
at Room Temperature (Cushing et al., 2005).
27
Table 2.6 Saturation Magnetization at 20 ˚C (Ms) and 0 K (Mo) and the
Curie Temperatures (Tc) for Fe, Co, and Ni (Cullity, 1972)
41
Table 3.1 Raw Materials
53
Table 3.2 Reactant Concentrations and Reaction Temperatures
Investigated
56
Table 3.3 List of Stirring Speeds Studied
57
Table 3.4 Mole Ratios of N2H4 to Co2+ (R) Experimented 57
xi
Table 3.5 Initial Co2+ Concentrations Employed in the Study
58
Table 3.6 Amounts of (C2H3O2)2Co·4H2O Studied
60
Table 3.7 Concentrations of Reactants Used
61
Table 3.8 Mole Ratios of Nucleating Agent (NA) to Co2+ Studied
62
Table 3.9 Experimental Conditions Employed to Determine the Effect
of PVP k15
63
Table 3.10 ICDD Cards Employed in the Analysis of the XRD Patterns
67
Table 4.1 Synthesis of Co Nanoparticles at Different Temperatures
72
Table 4.2 Calculated Particle and Crystallite Sizes of Co Nanoparticles
Produced at Different Stirring Speeds
84
Table 4.3 Calculated Particle and Crystallite Sizes of Co Nanoparticles
Produced at Different Mole Ratios of N2H4 to Co2+ (R)
92
Table 4.4 Calculated Particle and Crystallite Sizes of Co Nanoparticles
Produced at Increasing Precursor Concentration.
99
Table 4.5 Values of the Mean Particle Size, Calculated Crystallite Size,
and Elemental Composition by EDX Analysis
113
Table 4.6 Values of the Relative Standard Deviation (%) and Crystallite
Size (nm) Obtained from the TEM and XRD Analyses of Co
Particles Nucleated with Ag
125

xii
Table 4.7 Values of the Relative Standard Deviation (%) and Crystallite
Size (nm) Obtained from the TEM and XRD Analyses of Co
Particles Nucleated with Pd
129
Table 4.8 Values of the Mean Particle Size (nm), Relative Standard
Deviation (%), and Crystallite Size (nm) Obtained from the
TEM and XRD Analyses of Co Particles Seeded with Pt.
132
xiii
LIST OF FIGURES
PAGE
Fig. 2.1 Representations of the (a) HCP and (b) FCC crystal structures
of Co (Callister; 2000)
9
Fig. 2.2 Unit cell of ε-cobalt: (a) unit cell cube filled with eight atoms
of Type I (dark) and twelve atoms of Type II (light); (b) the
111-projection of the same cube showing three-fold symmetry
along its main diagonal (Dinega and Bawendi, 1999).
11
Fig. 2.3 La Mer model for the formation of monodispersed systems by
controlled homogenous nucleation and growth: I.
prenucleation period; II. nucleation step; III. growth step
(Redrawn from Viau et al., 1996).
16
Fig. 2.4 (a) TEM image of Co50Ni50 nanoparticles produced by
heterogeneous nucleation with Pt in polyol (dm = 6 nm) and its
corresponding (b) XRD pattern with increasing mole ratios of
Pt to (Co+Ni) showing only peaks of Co and Ni: a. dm = 44
nm; b. dm = 15 nm; c. dm = 5 nm (Viau et al., 2001).
18
Fig. 2.5 Plot illustrating the radius difference (δr/r) among the
nanoparticles as a function of (a) particle radius (r) and (b)
growth period (t) for diffusion-controlled growth (I),
polynuclear growth (II), and mononuclear growth (III)
mechanisms (Modified from Cao, 2004).
20
Fig. 2.6 Scheme depicting the growth mechanism by nucleation and
agglomeration (Capek, 2006)
21
Fig. 2.7 Preparation of metal nanoparticles in homogeneous solution by
liquid-phase synthesis (Toshima, 2003).
25

xiv
Fig. 2.8 Hot injection technique for organometallic synthesis of
magnetic nanoparticles; TC= thermocouple; Compositions of
Solution A and B are detailed in the text (Talapin et al., 2004)
31
Fig. 2.9 Summary of the processes involved during the nucleation and
growth of the nanoparticles in solution.
34
Fig. 2.10 A typical hysteresis loop for a ferromagnetic material (Hibst
and Schwab, 1994).
39
Fig. 2.11 Particle size versus coercivity. The largest coercivity is
achieved at the critical size dc corresponding to the single
domain limit of a material; SPM = Superparamagnetic (Talapin
et al., 2004).
42
Fig. 2.12 Schematic of the energy barrier, ∆E, needed to rotate the
magnetization of a uniaxial magnetic nanoparticle (dotted lines
show the easy axes of magnetization) (Talapin et al., 2004).
44
Fig. 3.1 Schematic diagram of the synthesis of cobalt nanoparticles by
metal salt reduction using hydrazine
54
Fig. 3.2 Flowchart of the synthesis of Co nanoparticles via metal salt
reduction by the polyol method
59
Fig. 4.1 (a) Fibrous materials formed from CoCl2, EG, and N2H4 at 60
˚C, (b) very fine Co nanoparticles produced during reaction at
70 ˚C, (c) large Co nanoparticles prepared at 80 ˚C and (d) its
corresponding particle size distribution. Mole Co2+ = 1.0 mmol
(30 mM); Mole ratio of OH¯ to Co2+ = 2; Mole ratio of N2H4 to
Co2+ = 30.
73

xv
Fig. 4.2 X-ray diffraction pattern of T80. F= FCC; H = HCP. Inset
shows the SEM micrograph of the precipitated nanoparticles of
T80.
78
Fig. 4.3 Typical TEM images of (a) S350 and (b) S420. Insets are the
images obtained at a lower magnification. [Co2+] = 40 mM;
Mole ratio of OH¯ to Co2+ = 2; Mole ratio of N2H4 to Co2+ (R)
= 30.
82
Fig. 4.4 Particle size distributions obtained for (a) S350 and (b) S420.
84
Fig. 4.5 X-ray diffractograms of samples (a) T80/S250 (dm = 12.43
nm), (b) S350 (dm = 5.54 nm), and (c) S420 (dm = 4.10 nm).
H= HCP; F= FCC.
85
Fig. 4.6 TEM images of (a) R10, (b) R12, and (c) R15. [Co2+] = 40
mM; Mole ratio of OH¯ to Co2+ = 2; Stirring rate = 420 rpm.
88
Fig. 4.7 TEM images of (a) R20, (b) R40, and (c) R50. [Co2+] = 40
mM; Mole ratio of OH¯ to Co2+ = 2; Stirring rate = 420 rpm.
89
Fig. 4.8 Plot of average particle size (nm) against mole ratio of N2H4 to
Co2+ (R).
90
Fig. 4.9 Particle size distributions obtained for (a) R10, (b) R 12, and
(c) R15.
90
Fig. 4.10 Particle size distributions obtained for (a) R20, (b) R 40, and
(c) R50.
91
Fig. 4.11 X-ray diffraction patterns of (a) R10 (dm = 7.09 nm), (b) R20
(dm = 4.05 nm), (c) R30 (dm = 4.10 nm), and (d) R50 (dm =
3.59 nm). H = HCP; F = FCC.
93

xvi
Fig. 4.12 Plot of mean particle size (nm) against cobalt chloride
concentration (mM)
95
Fig. 4.13 Typical TEM image of Co nanoparticles obtained at 30 mM
(P30). Mole ratio of N2H4 to Co2+ (R) = 50; Mole ratio of OH¯
to Co2+ = 2; Stirring rate = 420 rpm.
95
Fig. 4.14 Typical TEM images of Co nanoparticles obtained at (a) 50
mM (P50), (b) 70 mM (P70), and (c) 90 mM (P90). Insets are
images taken at lower magnification. Mole ratio of N2H4 to
Co2+ (R) = 50; Mole ratio of OH¯ to Co2+ = 2; Stirring rate =
420 rpm.
96
Fig. 4.15 Particle size distributions obtained for (a) P30 and (b) P50.
97
Fig. 4.16 Particle size distributions obtained for (a) P70 and (b) P90.
98
Fig. 4.17 X-ray diffraction patterns of (a) P90 (dm = 6.79 nm), (b) P70
(dm = 5.94 nm), (c) R50/P40 (dm = 3.59 nm), and (d) P30 (dm =
3.21 nm). H = HCP; F = FCC.
99
Fig. 4.18 Typical (a) TEM and (b) SEM images of C5; Co acetate = 5.0
mmol; PG = 50 ml; SEM magnification = 10,000x
105
Fig. 4.19 The corresponding particle size distribution for C5.
106
Fig. 4.20 X-ray diffraction pattern of C5. H = HCP; F = FCC
107
Fig. 4.21 Plot of mean particle size (nm) against the amount of Co
acetate (mmol)
109

xvii
Fig. 4.22 Typical TEM images of (a) C3 (dm = 388 nm), (b) C4 (dm =
364 nm), and (c) C6 (dm = 152 nm). Vol of PG = 50 ml; Mole
ratio OH¯ to Co2+ = 2.5; dm = mean diameter
110
Fig. 4.23 Corresponding SEM images of (a) C3 (dm = 388 nm), (b) C4
(dm = 364 nm), and (c) C6 (dm = 152 nm) taken at 10,000x
magnification. Vol of PG = 50 ml; Mole ratio OH¯ to Co2+ =
2.5; dm = mean diameter
111
Fig. 4.24 Particle size distributions for (a) C3 (dm = 388 nm), (b) C4 (dm
= 364 nm), and (c) C6 (dm = 152 nm) obtained by analyzing
300 particles for each sample
112
Fig. 4.25 X-ray diffractograms of as-prepared Co nanoparticles from (a)
C3 (dm = 388 nm), (b) C4 (dm = 364 nm), (c) C5 (dm = 298
nm). H = HCP; F = FCC
114
Fig. 4.26 TEM images of (a) Ag2.5 (dm = 106 nm), (b) Pd2.5 (dm = 121
nm), and (c) Pt2.5 (dm = 61 nm). Inset is a TEM image of Pt2.5
at higher magnification. Arrows point to the impurity layer
surrounding the nanoparticles. Nucleation ratio = 2.5 x 10⁻²;
Amount of Co2+ = 5.0 mmol
117
Fig. 4.27 The corresponding SEM images of (a) Ag2.5 (dm = 106 nm),
(b) Pd2.5 (dm = 121 nm), and (c) Pt2.5 (dm = 61 nm).
Nucleation ratio = 2.5 x 10⁻²; Amount of Co2+ = 5.0 mmol
118
Fig. 4.28 Particle size distributions of (a) Ag2.5, (b) Pd2.5, and (c) Pt2.5.
120
Fig. 4.29 XRD diffraction patterns of (a) C5, (b) Pd2.5, (c) Ag2.5, and
(d) Pt2.5. H = HCP; F = FCC; Ag = Ag peaks
121

xviii
Fig. 4.30 Plot of mean particle size (nm) of the Co particles obtained
using varying AgNO3 nucleation ratio (10-2). Amount of Co
acetate = 5.0 mmol
123
Fig. 4.31 TEM images of (a) Ag0.5 (dm = 369 nm), (b) Ag1.5 (dm = 357
nm), and (c) Ag2.0 (dm = 291 nm). Amount of Co acetate = 5.0
mmol.
124
Fig. 4.32 Corresponding particle size distributions of (a) Ag0.5, (b)
Ag1.5, and (c) Ag2.0.
125
Fig. 4.33 X-ray diffraction patterns of (a) Ag0.5, (b) Ag1.5, (c) Ag2.0,
and (d) Ag2.5. F = FCC-Co; H = HCP-Co; Ag = Ag peaks.
126
Fig. 4.34 Plot of mean particle size (nm) of the Co particles obtained
using varying PdCl2 nucleation ratio (10-2). Amount of Co
acetate = 5.0 mmol.
127
Fig. 4.35 TEM images of (a) Pd3.5 (dm = 112 nm), (b) Pd4.0 (dm = 92
nm), (c) Pd4.5 (dm = 88 nm), and (d) Pd5.0 (dm = 57 nm).
Amount of Co acetate = 5.0 mmol.
128
Fig. 4.36 Corresponding particle size distributions of (a) Pd3.5, (b)
Pd4.0, (c) Pd4.5, and (d) Pd5.0.
130
Fig. 4.37 X-ray diffraction patterns of (a) Pd2.5, (b) Pd3.5, (c) Pd4.0,
and (d) Pd4.5. F = FCC-Co; H = HCP-Co; Pd = Pd peaks.
131
Fig. 4.38 TEM images of (a) Pt0.5(dm = 63 nm), (b) Pt1.5 (dm = 57 nm),
(c) Pt3.5 (dm = 59 nm), (d) Pt4.0 (dm = 52 nm), (e) Pt4.5 (dm =
49 nm), and (f) Pt5.0 (dm = 59 nm). Amount of Co acetate =
5.0 mmol.
133
xix
Fig. 4.39 Corresponding particle size distributions of (a) Pt0.5, (b) Pt1.5,
(c) Pt3.5, and (d) Pt4.0.
134
Fig. 4.40 Corresponding particle size distributions of (a) Pt4.5, and (b)
Pt5.0.
135
Fig. 4.41 X-ray diffraction patterns of (a) Pt1.5, (b) Pt2.5, (c) Pt3.5, (d)
Pt4.5, and (e) Pt5.0. F = FCC-Co; H = HCP-Co.
136
Fig. 4.42 Typical TEM micrographs of samples (a) Co-0.075 (dm = 181
nm), (b) CoPd-0.075 (dm = 62 nm), (c) CoAg-0.20 (dm = 166
nm), and (d) CoPt-0.20 (dm = 78 nm). Amount of Co acetate =
5.0 mmol; Nucleation ratio = 2.5 x 10⁻².
138
Fig. 4.43 Particle size distributions for samples (a) Co-0.075, (b) CoPd-
0.075, (c) CoAg-0.20, and (d) CoPt-0.20.
141
Fig. 4.44 X-ray diffraction patterns of (a) pure Co particles produced by
homogeneous nucleation and (b) Co particles nucleated with
PdCl2, with and without the addition of PVP k15. Amount of
Co acetate = 5.0 mmol; Nucleation ratio = 2.5 x 10⁻²; Weight
ratio of Co(OH)2 to PVP k15 = 0.075; H= HCP; F = FCC.
142
Fig. 4.45 X-ray diffraction patterns of Co particles produced by
heterogeneous nucleation with (a) AgNO3 and (b) H2PtCl6,
with and without the addition of PVP k15. Amount of Co
acetate = 5.0 mmol; Nucleation ratio = 2.5 x 10⁻²; Weight ratio
of Co(OH)2 to PVP k15 = 0.20; H= HCP; F = FCC.
143
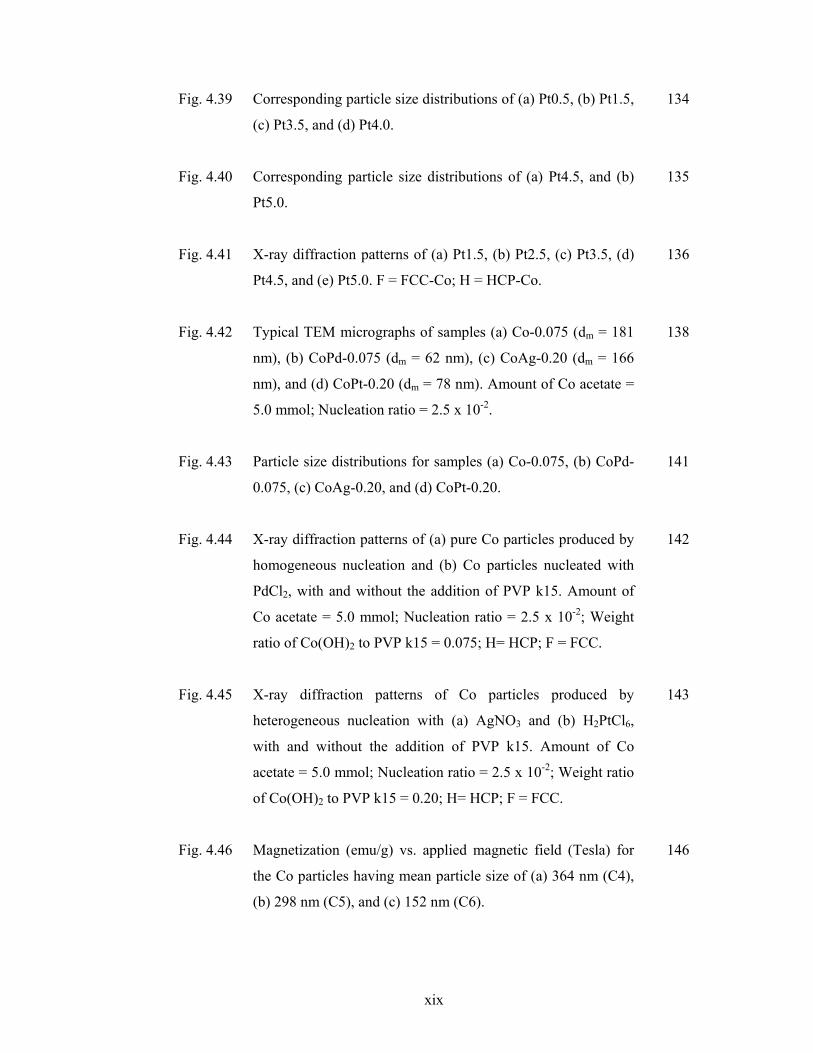
Fig. 4.46 Magnetization (emu/g) vs. applied magnetic field (Tesla) for
the Co particles having mean particle size of (a) 364 nm (C4),
(b) 298 nm (C5), and (c) 152 nm (C6).
146
xx
Fig. 4.47 Magnetization (emu/g) vs. applied magnetic field (Tesla) for
the Co particles having mean particle size of (a) 112 nm
(Pd3.5), (b) 61 nm (Pt2.5), (c) 49 nm (Pt4.5).
147
Fig. 4.48 Plot showing the effect of the particle size (nm) on the
coercivity (Hc, Oe) of the Co particles having average
diameters from 49 to 364 nm at room temperature. Inset is the
plot of coercivity (Hc, Oe) versus the inverse of the particle
size (d-1, nm-1) of the Co particles with diameters > 61 nm.
149
Fig. 4.49 Plots of saturation magnetization (Ms, emu/g) against (a) mean
particle size (nm) and (b) inverse of the mean particle size (d-1,
nm-1) of the Co particles with mean diameters of 49 to 364 nm.
151
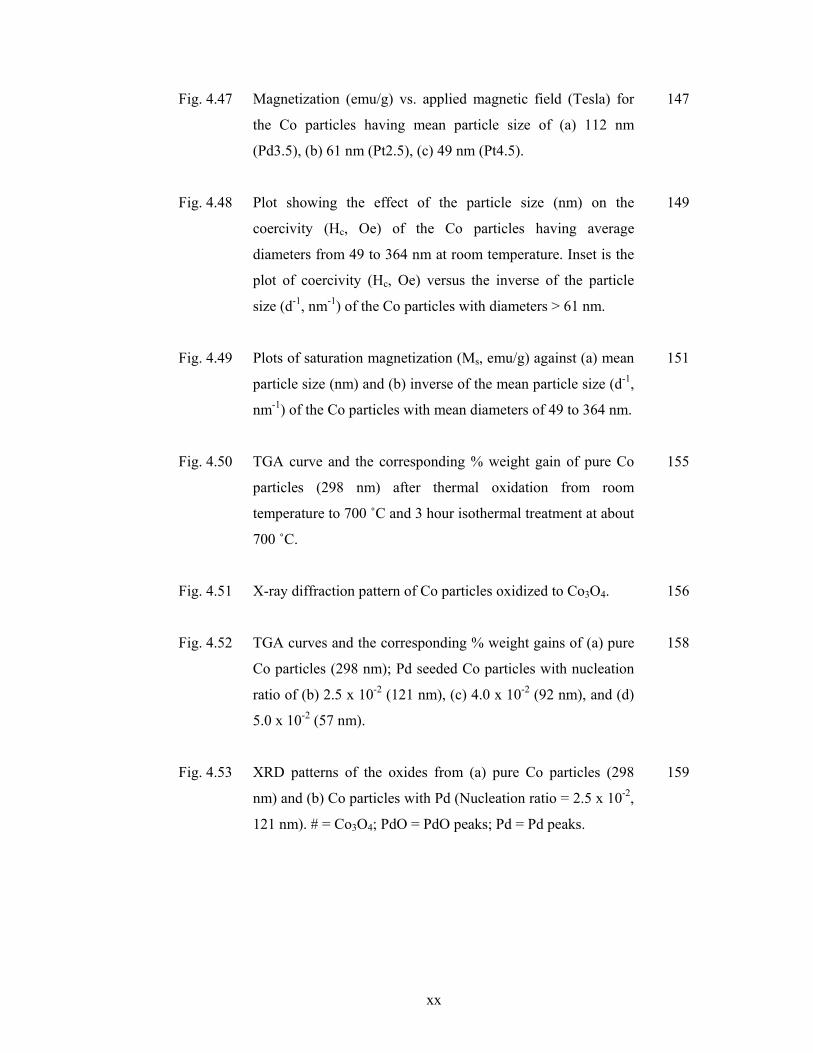
Fig. 4.50 TGA curve and the corresponding % weight gain of pure Co
particles (298 nm) after thermal oxidation from room
temperature to 700 ˚C and 3 hour isothermal treatment at about
700 ˚C.
155
Fig. 4.51 X-ray diffraction pattern of Co particles oxidized to Co3O4.
156
Fig. 4.52 TGA curves and the corresponding % weight gains of (a) pure
Co particles (298 nm); Pd seeded Co particles with nucleation
ratio of (b) 2.5 x 10⁻² (121 nm), (c) 4.0 x 10⁻² (92 nm), and (d)
5.0 x 10⁻² (57 nm).
158
Fig. 4.53 XRD patterns of the oxides from (a) pure Co particles (298
nm) and (b) Co particles with Pd (Nucleation ratio = 2.5 x 10⁻²,
121 nm). # = Co3O4; PdO = PdO peaks; Pd = Pd peaks.
159

xxi
Fig.4.54 XRD patterns of Pd seeded Co particles (Nucleation ratio = 2.5
x 10-2, 121 nm) oxidized for 3 hours at (a) 400 ˚C, (b) 200 ˚C,
(c) 100 ˚C, and (d) room temperature; # = Co3O4 peaks; Co =
Co peaks.
160
Fig. 4.55 TGA curves and the corresponding % weight gains of (a) pure
Co particles (298 nm); Pt seeded Co nanoparticles with
nucleation ratio of (b) 2.5 x 10⁻² (61 nm), (c) 3.5 x 10⁻² (59
nm), and (d) 4.0 x 10⁻² (52 nm).
163
Fig. 4.56 XRD patterns of the oxides from (a) pure Co particles (298
nm) and (b) Co nanoparticles with Pt (nucleation ratio = 2.5 x
10-2, 61 nm). # = Co3O4
163

xxii
LIST OF ABBREVIATIONS AFM : Antiferromagnetic AOT : Bis(2-ethylhexyl) S-sodium Sulfosuccinate CTAB : Centrimethyl Ammonium Bromide DDAB : Didodecyldimethyl Ammonium Bromide DMF : N,N dimethylformamide EDTA : Ethylenediamine-N,N,N’,N’-tetracetic EDX : Energy Dispersive X-ray Spectroscopy EG : Ethylene Glycol FCC : Face-Centered Cubic FE-SEM : Field Emission Scanning Electron Microscope HCP : Hexagonal Close-Packed LA : Lauric Acid NTA : Nitrilotriacetic Acid OA : Oleic Acid PG : Propylene Glycol (ph)3P : Triphenylphosphine PR3 : Trialkylphosphine SDS : Sodium Dodecylsulfosuccinate STP : Standard Temperature and Pressure TEM : Transmission Electron Microscope TGA : Thermogravimetric Analysis TOPO : Trioctylphosphane Oxide Triton X-100 : Polyoxyethylene(10) Isooctylphenyl Ether
VSM : Vibrating Sample Magnetometer XRD : X-ray Diffraction

xxiii
LIST OF SYMBOLS a : Lattice parameter A : Area Ag : Silver Ar : Argon Au : Gold BH4¯ : Borohydride ion β : Beta Co : Cobalt Co2(CO)8 : Dicobalt octacarboynyl E˚ : Standard electrode potential ε : Epsilon Fe : Iron H2 : Hydrogen gas LiBEt3H : Lithium hydride MBH4 : Metal tetraborohydrates Mn : Manganese N2H4 : Hydrazine N2H5
+ : Hydrazinium ion NaBH4 : Sodium borohydride NaOH : Sodium hydroxide Ni : Nickel Pd : Palladium Pt : Platinum PVP : Poly vinyl pyrrolidone ρ : Density µB : Bohr magneton V : Volume
xxiv
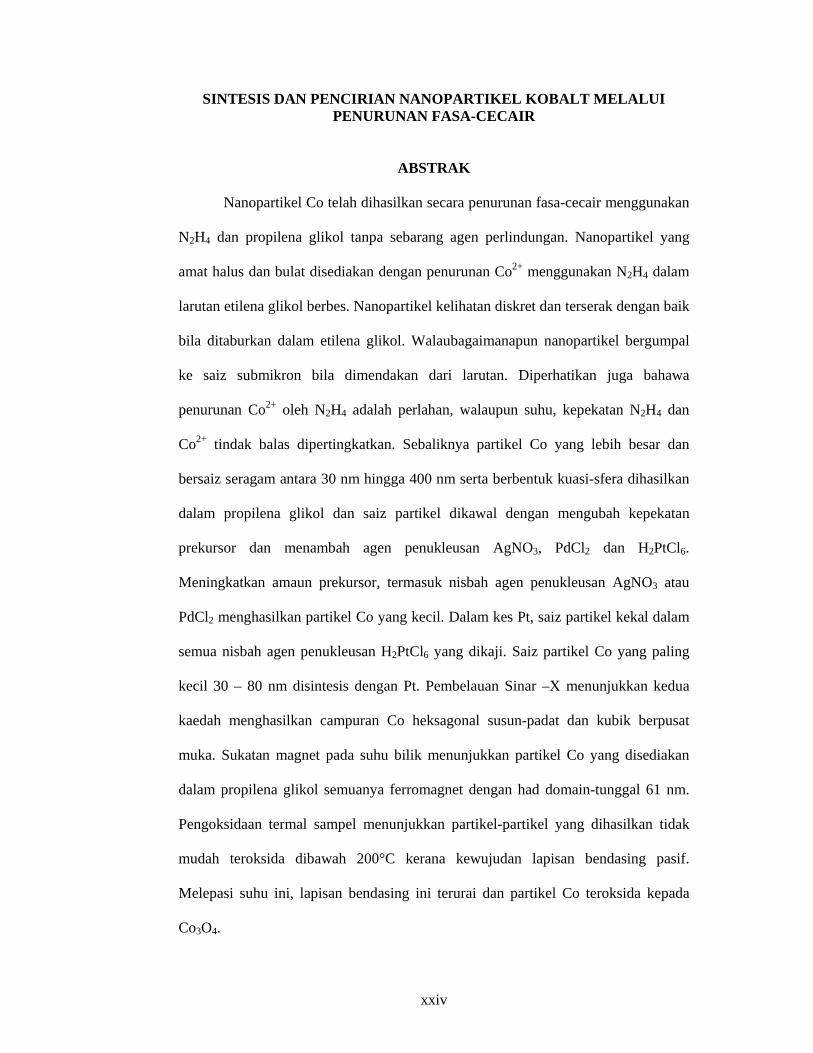
SINTESIS DAN PENCIRIAN NANOPARTIKEL KOBALT MELALUI PENURUNAN FASA-CECAIR
ABSTRAK
Nanopartikel Co telah dihasilkan secara penurunan fasa-cecair menggunakan
N2H4 dan propilena glikol tanpa sebarang agen perlindungan. Nanopartikel yang
amat halus dan bulat disediakan dengan penurunan Co2+ menggunakan N2H4 dalam
larutan etilena glikol berbes. Nanopartikel kelihatan diskret dan terserak dengan baik
bila ditaburkan dalam etilena glikol. Walaubagaimanapun nanopartikel bergumpal
ke saiz submikron bila dimendakan dari larutan. Diperhatikan juga bahawa
penurunan Co2+ oleh N2H4 adalah perlahan, walaupun suhu, kepekatan N2H4 dan
Co2+ tindak balas dipertingkatkan. Sebaliknya partikel Co yang lebih besar dan
bersaiz seragam antara 30 nm hingga 400 nm serta berbentuk kuasi-sfera dihasilkan
dalam propilena glikol dan saiz partikel dikawal dengan mengubah kepekatan
prekursor dan menambah agen penukleusan AgNO3, PdCl2 dan H2PtCl6.
Meningkatkan amaun prekursor, termasuk nisbah agen penukleusan AgNO3 atau
PdCl2 menghasilkan partikel Co yang kecil. Dalam kes Pt, saiz partikel kekal dalam
semua nisbah agen penukleusan H2PtCl6 yang dikaji. Saiz partikel Co yang paling
kecil 30 – 80 nm disintesis dengan Pt. Pembelauan Sinar –X menunjukkan kedua
kaedah menghasilkan campuran Co heksagonal susun-padat dan kubik berpusat
muka. Sukatan magnet pada suhu bilik menunjukkan partikel Co yang disediakan
dalam propilena glikol semuanya ferromagnet dengan had domain-tunggal 61 nm.
Pengoksidaan termal sampel menunjukkan partikel-partikel yang dihasilkan tidak
mudah teroksida dibawah 200°C kerana kewujudan lapisan bendasing pasif.
Melepasi suhu ini, lapisan bendasing ini terurai dan partikel Co teroksida kepada
Co3O4.
xxv
SYNTHESIS AND CHARACTERIZATION OF COBALT NANOPARTICLES PREPARED BY LIQUID-PHASE REDUCTION
ABSTRACT
Co nanoparticles were produced by liquid-phase reduction using N2H4 and
propylene glycol without any protective agent. Very small, though polydispersed,
spherical Co nanoparticles were prepared by Co2+ reduction using N2H4 in a basic
ethylene glycol solution. The nanoparticles appeared to be discrete and well-
separated when dispersed in ethylene glycol. However, they agglomerated to
submicron-sized particles when precipitated from the solution. It was also inferred
that the reduction of Co2+ by N2H4 was generally very slow, though the reaction was
enhanced by an elevated temperature, a high N2H4 concentration, and a large amount
of Co2+. On the other hand, larger but monodispersed quasi-spherical Co particles
with sizes between 30 nm to 400 nm were produced in propylene glycol and the
particle size was tailored by varying the precursor concentration and by adding
nucleating agents such as AgNO3, PdCl2, and H2PtCl6. Increasing the amount of
precursor, as well as AgNO3 or PdCl2 nucleation ratios, formed smaller Co particles.
In the case of samples with Pt, the particle size remained almost constant in all
H2PtCl6 nucleation ratios explored. Even so, the smallest Co particles of 30 – 80 nm
in diameters were synthesized with Pt. XRD then showed that both methods
produced mixtures of HCP and FCC-Co. Room-temperature magnetic
measurements revealed that the Co particles prepared in propylene glycol were all
ferromagnetic with a single-domain limit of 61 nm. Thermal oxidation of the
samples showed that they were not susceptible to oxidation below 200 ˚C due to the
passivation of the impurity layer. Beyond this temperature, the impurity layer
decomposed and the Co particles oxidized to Co3O4.

1
CHAPTER 1 INTRODUCTION
1.1 Background of the Study and Problem Statement
Nanoparticles are zero-dimensional nanostructures (Cao, 2004; Gubin et al.,
2005) and are generally classified according to their composition: metal oxides,
noble metals, transition metals, magnetic metals, etc. (Cao, 2004; Sergeev, 2006).
Like all nanostructures, the properties of nanoparticles are dependent on their size
and shape. The variation of their properties at the nanoscale is not a result of a
scaling factor, but stems from different causes in different materials (Burda et al.,
2005). In semiconductor, it is due to the further confinement of the electronic
motion to a length scale that is comparable to or less than the length scale of the
electronic motion in bulk semiconductors (Moriarty, 2001). In noble metals, it
results from the strong absorption of radiation within the visible region leading to
the collective oscillation of the electrons in the conduction band, called surface
plasmon resonance, from the surface of one particle to another (Burda et al., 2005).
In transition metals, it arises from the large surface to volume ratio resulting to high
chemical activities (Toshima, 2003). And in magnetic metals, it is due to finite-size
and surface effects, which become increasingly important as the particle size of the
magnetic material is reduced (Batlle and Labarta, 2002).
Co is a well-known ferromagnetic material which is commonly used as an
alloying element in permanent magnets (Goldman, 1999). It exists in two forms:
HCP (hexagonal close-packed) and FCC (face-centered cubic). HCP is the stable
phase at room temperature, whereas FCC is stable at temperatures above 450 ˚C
(Dinega and Bawendi, 1999).
2
In nanosized, Co particles display a wide range of interesting size-dependent
structural, electrical, magnetic, and catalytic properties (Puntes et al., 2001). In
particular, because of their large surface area, Co nanoparticles showed high
chemical reactivity, which makes them suitable for catalysis (Hyeon, 2002).
Furthermore, below a critical size of 20 nm, they behave as singe-domain particles
displaying quantum size effects, superparamagnetism, large magnetic anisotropies,
and a maximum coercivity (Ram, 2001). Moreover, at this size range, a new
metastable phase can also be formed, called ε-Co that has a complex β-Mn structure
and has properties in between the HCP and FCC phases. ε-Co can be prepared by
solution chemistry, particularly via organometallic route in the presence of tight
binding ligands (Dinega and Bawendi, 1999; Sun and Murray, 1999). Thus, these
previous studies prove that Co as a nanomaterial is an excellent and interesting
system to study.
Future applications of Co nanoparticles in the fields of separation
technology, information storage systems, catalysis, and biomedicine (Kodama,
1999) require the nanoparticles to be discrete, identical in size and shape, and
uniform in composition and crystal structure (Cao, 2004). However, formation of
nanoparticles satisfying these requirements prove to be difficult due to their high
surface energy, their intrinsic magnetic properties, and the inherent limitations of the
available processes. In addition, there are also concerns regarding the
reproducibility of the existing methods.
By far, liquid-phase synthetic routes are the most successful in the
preparation of monodispersed Co nanoparticles. Examples of liquid-phase processes

3
are metal salt reduction, reverse micelles, and thermal decomposition of
organometallic precursor. Among these methods, direct metal salt reduction in
solution is the simplest, fastest, and the least expensive, which are desirable for
future attempts of large-scale production (Guo et al., 2002).
An important component of metal salt reduction processes is the protective
agent. Protective agents such as surfactants that form a layer of molecular
membrane around the nanoparticles and polymers that provide steric hindrance
between nanoparticles are added during the reaction to inhibit particle agglomeration
and to control the particle growth. However, besides posing as an additional cost to
the total cost of the synthesis, they may complicate the cleaning process of the
nanoparticles since they are not easy to remove by simple washing and might require
secondary cleaning process, such as annealing, to decompose the protective agents
covering the nanoparticles (Wu and Chen, 2003). Moreover, selection of the
suitable protective agent for a particular reaction is a tedious task of trial-and-error,
since the surface chemistry of the nanoparticles is complex due to their high surface
energy and their tendency to accumulate surface charges. Thus, the interaction of the
protective agent with the solvent and with the nanoparticles plus its properties, such
as the solubility in the solvent, molecular weight, and the amount needed for
stabilization, must be taken into account when choosing the right protective agent.
Thus, in some cases, agglomeration of nanoparticles still occurred even in the
presence of protective agents (Chou and Huang, 2001; Lee and Chen, 2006). One
way to solve the problem is by the choice of a solvent that can also act as protective
agent. In this way, not only the nanoparticles can be protected, but the process will
be cheaper and more straightforward.

4
In this study, preparation of Co nanoparticles was performed using Co salt
reduction technique, without adding protective agents. Polyalcohols such as
ethylene glycol and propylene glycol were used as solvents and their ability to act as
the dispersing agent and growth inhibitors were also evaluated based from the
average particle size and size distribution of the Co nanoparticles. Therefore, the
development of “protective-agent free” methods will greatly simplify the formation
of cobalt nanoparticles by liquid-phase reduction.
1.2 Objectives of the Study
As mentioned, the formation of Co nanoparticles is accomplished by Co salt
reduction technique without any protective agent. The objectives of this work are:
(a) to prepare uniformly sized, monodispersed, and size-tunable Co
nanoparticles using a simplified Co salt reduction process.
(b) to investigate the morphology, crystal structure, magnetic properties, and
oxidation behavior of the Co nanoparticles.
1.3 Project Overview
In achieving the objectives, three main experiments were conducted. The
first experiment involves the reduction of Co ions in a basic ethylene glycol solution
using hydrazine, N2H4, as reductant. The size of the Co nanoparticles were tuned by
varying the reaction temperature, stirring speed, precursor concentration, and
amount of N2H4. However, in all samples, the particle size distribution was broad
with a relative standard deviation greater than 20%. Furthermore, severe
agglomeration of the nanoparticles was observed after precipitation.
5
To obtain Co nanoparticles with narrower size distribution, a second
experiment using the polyol method was explored, which was accomplished by
heating an alkaline solution of propylene glycol containing Co acetate up to the
boiling temperature for about two hours with reflux. Control of particle size was
achieved by varying the precursor concentration and by the addition of nucleating
agents. A set of experiments was also performed to study the effect of PVP k15 as
protective agent on the morphology and agglomeration of the nanoparticles.
Furthermore, this was also done to demonstrate how addition of protective agent can
complicate the synthesis and the cleaning procedure of the nanoparticles.
Standard characterization techniques such as TEM, XRD, FE-SEM, EDX,
and VSM were then performed on the synthesized Co nanoparticles.
The third experiment was conducted to study the oxidation behavior of
monodispersed Co nanoparticles obtained from the second experiment. Firstly, this
is important to compare the oxidation behavior of bulk Co or Co in a bar form to that
of the nanoparticles and to investigate the effects of the nucleating agent and the
impurity layer on the surface of the nanoparticles on their oxidation properties.
Thermal oxidation of Co nanoparticles was achieved by exposing the nanoparticles
in flowing oxygen gas and increasing temperature in TGA. Oxidized nanoparticles
were also sent for XRD analysis to identify the phases present.
6
CHAPTER 2 LITERATURE REVIEW
2.1 Introduction
Nanotechnology deals with the ability to fully control the properties of
nanostructured materials through their size, shape, and composition, as well as with
the fabrication of reproducible complex structures from simpler systems (Eggeman
et al., 2006). The development of nanotechnology is expected to proceed at several
levels: materials, devices, and systems (Salata et al., 2004). Currently, the most
advanced in terms of scientific knowledge and potential industrial application is the
materials level (Hyeon, 2002; Salata et al., 2004).
Nanostructured materials refer to those materials whose structural elements
(crystallites, clusters, or molecules) have sizes less than 100 nm at least in one
dimension (Moriarty, 2001). These include nanoparticles, nanorods, nanowires,
nanotubes, and thin films among others (Cao, 2004). Interest on these materials lies
on their novel electrical, optical, chemical and magnetic properties that have great
technological and fundamental scientific importance due to their remarkable
difference from the properties of their bulk counterparts. Furthermore, by
controlling their size and interactions, the fundamental properties of these materials
maybe tailored (Cushing et al., 2004). Thus, it is clear that utilizing these materials
fully and effectively depends on the understanding of their preparation, their general
properties, and the factors that influence these properties.
As mentioned, nanoparticles are zero-dimensional nanostructured materials
in which all characteristics linear dimensions are of the same order of magnitude

7
(Cao, 2004; Gubin et al., 2005). A special class of nanoparticles, i.e. magnetic
nanoparticles, exhibit unique phenomena such as superparamagnetism, high
coercivity, high saturation field, and exchanged anisotropy due to a thin layer of
antiferromagnetic oxide formed around the ferromagnetic core of the nanoparticles
because of their subsequent exposure to air (Tartaj et al., 2003). These phenomena
are attributed to size and surface effects that dominate the behavior of magnetic
particles in nanosized range (Batlle and Labarta, 2002). Typical examples are Co
nanoparticles.
Therefore, in this chapter, the structural, magnetic and oxidation properties
of bulk Co are described and these macroscopic properties are then compared to the
reported properties of nanosized Co particles. Since monodispersed and discrete
nanoparticles are required to realize their applications, the general principles for the
formation of uniformly sized nanoparticles are explained and the common liquid-
phase synthetic routes for Co and other magnetic nanoparticles are also described.
Emphasis is given on these methods by virtue of their wide application and success
in the preparation of monodispersed and high quality Co nanoparticles.
Furthermore, the general effects of synthesis parameters such as temperature,
precursor concentration, reductant, and protective agent on the nanoparticle size and
size distribution are also discussed. Lastly, the potential applications of Co
nanoparticles in separation technology, catalysis, high-density magnetic recording,
and biomedicine are reviewed.
8
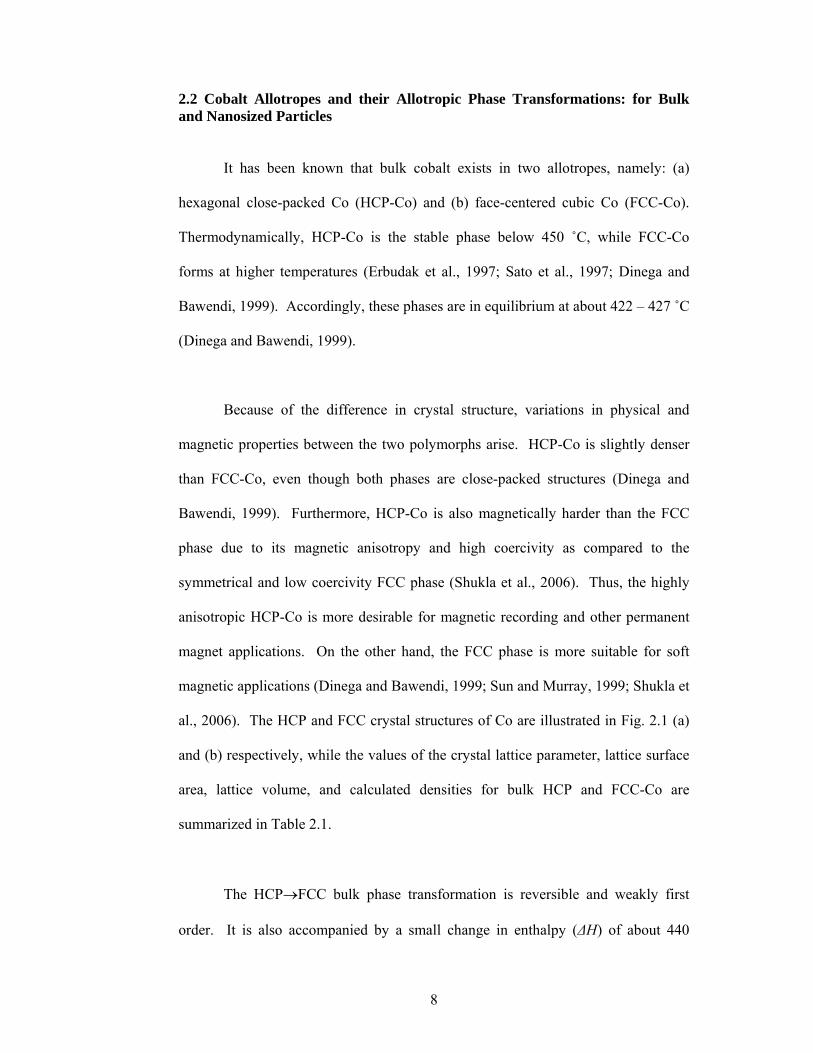
2.2 Cobalt Allotropes and their Allotropic Phase Transformations: for Bulk and Nanosized Particles
It has been known that bulk cobalt exists in two allotropes, namely: (a)
hexagonal close-packed Co (HCP-Co) and (b) face-centered cubic Co (FCC-Co).
Thermodynamically, HCP-Co is the stable phase below 450 ˚C, while FCC-Co
forms at higher temperatures (Erbudak et al., 1997; Sato et al., 1997; Dinega and
Bawendi, 1999). Accordingly, these phases are in equilibrium at about 422 – 427 ˚C
(Dinega and Bawendi, 1999).
Because of the difference in crystal structure, variations in physical and
magnetic properties between the two polymorphs arise. HCP-Co is slightly denser
than FCC-Co, even though both phases are close-packed structures (Dinega and
Bawendi, 1999). Furthermore, HCP-Co is also magnetically harder than the FCC
phase due to its magnetic anisotropy and high coercivity as compared to the
symmetrical and low coercivity FCC phase (Shukla et al., 2006). Thus, the highly
anisotropic HCP-Co is more desirable for magnetic recording and other permanent
magnet applications. On the other hand, the FCC phase is more suitable for soft
magnetic applications (Dinega and Bawendi, 1999; Sun and Murray, 1999; Shukla et
al., 2006). The HCP and FCC crystal structures of Co are illustrated in Fig. 2.1 (a)
and (b) respectively, while the values of the crystal lattice parameter, lattice surface
area, lattice volume, and calculated densities for bulk HCP and FCC-Co are
summarized in Table 2.1.
The HCP→FCC bulk phase transformation is reversible and weakly first
order. It is also accompanied by a small change in enthalpy (∆H) of about 440

9
kJ/mol and in volume (∆V/V) which is approximately equal to 0.0036 (Erbudak et
al., 1997; Ram, 2001). In addition, the FCC→HCP phase transition is martensitic,
resulting in a substantial thermal hysteresis between the heating and cooling
transformations and a considerable change in the stacking sequence.
Fig. 2.1 Representations of the (a) HCP and (b) FCC crystal structures of Co (Callister; 2000) Table 2.1 Lattice Parameters, Lattice Surface Area (A), Lattice Volume (V), and Calculated Densities (ρ) for HCP-Co, FCC-Co, and ε-Co (ICDD Card No. 5-0727 and 15-0806; Dinega and Bawendi, 1991; Sun and Murray, 1999; Ram, 2001)
Crystal Structure
Lattice Parameters,
nm A, 10-2 nm2 V, 10-3 nm3 ρ, g cm-3
HCP a = 0.2507 c = 0.4070 93.90 66.50 8.836
FCC a = 0.3545 75.40 44.55 8.788
ε a = 0.6097 37.17 22.66 8.635
Though thermodynamics predicts that HCP-Co is the stable phase at room
temperatures, both phases can co-exists at ambient temperature in bulk samples.
Furthermore, studies on Co produced by high-temperature crystallization often
yielded mixed phases in one sample, presumably due to the low activation energy of
formation of stacking faults for both HCP and FCC-Co (Dinega and Bawendi, 1999;
Sun and Murray, 1999).
(a) (b)

10
In the case of fine Co particles, recent works on the preparation of Co
nanoparticles by low temperature solution chemistry have similarly produced
mixtures of HCP and FCC-Co, with FCC as the predominant phase as indicated by
the highest peak in the x-ray diffractograms and supported by the electron
diffraction patterns (Toneguzzo et al., 2000; Guo et al., 2002). Additionally, it was
then found that FCC-Co has become more stable at ambient conditions when the
particle size is reduced. Ram (2001) explained this as the influence of the lower
total surface energy of FCC-Co over the HCP phase. From his works, he established
that the crystal structure of Co nanoparticles has a direct correlation with their size,
and due to the lower surface energy and the consequent lower enthalpy of formation
of FCC-Co than HCP-Co, Co nanoparticles are most likely to assume the FCC
crystal structure under conditions of equilibrium to minimize their internal energy.
Hence, he stipulated that within the size range of 10 – 20 nm, the FCC phase is
stable at temperatures below 700 ˚C.
However, there were also evidences that suggest that the stability of FCC-
Co at low temperatures is not solely due to particle size (Sato et al., 1997; Kodama,
1999). In support of this, Sato et al. (1997) annealed large Co nanoparticles of about
200 nm in size above the HCP→FCC transition temperature. Nonetheless, slow
cooling of the annealed nanoparticles did not convert them to HCP-Co, but resulted
to the formation of pure FCC-Co. Lattice defects such as stacking faults,
dislocations, and surface oxidation were identified as possible factors that affect the
crystal structure of Co nanoparticles (Sato et al., 1997; Ram, 2001; Kodama, 1999).
However, Sato et al. (1997) did not explain in detail on how the effects were like.
Then again, a more intensive in-situ structural study is needed in order to

11
qualitatively understand the HCP→FCC phase transformation in Co nanoparticles
and its difference from the bulk phase transition.
Increasing development in the field of solution-phase chemical synthesis of
Co nanoparticles has led to the discovery of a new phase, albeit metastable, in Co
nanoparticles. This phase, designated by Dinega and Bawendi (1999) as epsilon-Co
(ε-Co), has a complex cubic primitive structure, belonging to the P4132 space group
with a unit cell parameter a = 0.6097 ± 0.0001 nm (Dinega and Bawendi, 1999; Sun
and Murray, 1999). Additionally, ε-Co as shown in Fig. 2.2 has 20 Co atoms which
are grouped into two types: (a) 12 Type I atoms and (b) 8 Type II atoms that differ
only in their local coordination in the lattice.
Fig. 2.2 Unit cell of ε-cobalt: (a) unit cell cube filled with eight atoms of Type I (dark) and twelve atoms of Type II (light); (b) the 111-projection of the same cube showing three-fold symmetry along its main diagonal (Dinega and Bawendi, 1999).
Moreover, the ε-Co crystal structure is related to the β-Manganese (β-Mn)
structure, a high-temperature phase of Mn stable between 727 – 1095 ˚C, that also
has 20 atoms and a lattice parameter of 0.63 nm (Sun and Murray, 1999). Table 2.2
gives the diffraction comparison of the β phase of Mn and the 11 nm Co
nanocrystals produced by Sun and Murray (1999) via the reduction of CoCl2
(a) (b)

12
contained in dioctylether solution using superhydride (LiBEt3H) in the presence of
oleic acid (OA) and trialkylphosphine (PR3).
Table 2.2 Comparison of Diffraction Peaks and Relative Intensities of 11 nm Co Nanocrystals and β-Mn (Sun and Murray, 1999)
dCo, Å Rel. Intenstiy dβ-Mn, Å Rel. Intenstiy hkl 2.73 5 2.823 5 210 2.49 4 2.577 5 211 2.16 8 2.231 7 220 2.04 100 2.104 100 221 1.94 56 1.997 60 310 1.85 31 1.904 25 311 1.63 9 1.6872 9 321 1.44 7 1.4874 6 330 1.37 7 1.4115 5 420 1.20 23 1.2377 25 510 1.13 18 1.1721 20 520
Formation of ε-Co is only possible by solution-phase chemistry, particularly
by organometallic route, and generally, using a combination of 2 or more tight
binding ligands or surfactants like OA, PR3, triphenylphosphine ((ph)3P), and
trioctylphosphane oxide (TOPO) (Dinega and Bawendi, 1999). Organometallic
processes, being not thermodynamically controlled, allowed the preparation of
metastable structures like ε-Co (Dinega and Bawendi, 1999; Puntes et al., 2002;
Shukla et al., 2006; Yang et al., 2006; Cheng and Hight Walker, 2007). On the other
hand, the role of these coordinating ligands in the preparation of ε-Co was explained
by Dinega and Bawendi (1999) as responsible for changing the energetics of the
crystal growth by binding tightly around the growing crystal and around the
dissolved Co atoms. In their study, fabrication of Co nanoparticles by thermal
decomposition of dicobalt octacarboynyl, Co2(CO)8, in the absence of TOPO
produced exclusive FCC phase.

13
ε-Co has properties in between the HCP and FCC phases as seen in Table
2.1. Additionally, it is also considered as a soft magnetic material similar to FCC-
Co (Dinega and Bawendi, 1999; Sun and Murray, 1999). The magnetic moment per
atom and magnetocrystalline anisotropy of ε-Co are compared to the values for bulk
HCP-Co and FCC-Co in Table 2.3. The reduced magnetic properties of ε-Co offer
several advantages: (a) it facilitates the stabilization of nanoparticles during
synthesis, (b) it assists in the particle size classification, and (c) it favors the
formation of ordered films for future applications in magnetic recording (Sun and
Murray, 1999).
Table 2.3 Magnetic Moment per Atom and Magnetocrystalline Anisotropy of HCP-Co, FCC-Co, and ε-Co (Cullity, 1972; Shukla et al., 2006).
Crystal Structure Magnetic Moment per Atom, µB
Magnetocrystalline Anisotropy, 106 erg cm-3
HCP 1.72 4.2 FCC 1.75 2.7 ε 1.70 1.5
µB = Bohr Mangeton = 0.927 x 10⁻²⁰ erg/Oe
Phase transition of ε-Co to the HCP or FCC structures can be easily done by
annealing at the proper temperature. Heating the sample at 300 ˚C quantitatively
converts ε-Co to HCP-Co, while annealing to 500 ˚C completely transforms it to the
FCC structure. In addition, subsequent cooling of the heated samples does not revert
them back to the original ε-Co structure (Petit et al., 2007).
2.3 Formation of Monosized and Uniformly Dispersed Cobalt and Other Metal Nanoparticles
Preparation of monosized and uniformly dispersed metal nanoparticles is
very challenging because of the strong tendency of the nanoparticles to agglomerate

14
in order to reduce their high surface energy (Sugimoto, 2001; Cao, 2004). These
attractive forces, a combination of Brownian motion and attractive van der Waals
forces in nanoparticles, are even greater for Co nanoparticles due to the added
influence of their magnetic property (Yondong, 2003). Thus, various strategies have
been proposed to facilitate the formation of well-dispersed and uniformly sized
metal nanoparticles.
Generally, all monodispersed systems, with those having approximately 5%
or less in the relative standard deviation of the particle size distribution, fulfill the
following conditions: (a) the separation of nucleation and growth stages during
synthesis; (b) if possible, the control of the growth mode; (c) the prevention of
random agglomeration of growing particles; and (d) the reserve of monomers
(Sugimoto, 2001; Cao, 2004).
2.3.1 Separation of Nucleation and Growth
This condition is critical in ensuring that all nuclei are formed during the
nucleation stage and that no further nucleation happens during the subsequent
growth, such that all preformed nuclei will grow at the same time leading to the
formation of monosized nanoparticles (Sugimoto, 2001; Cao, 2004; Cushing et al.,
2004; Burda et al., 2005). This requirement was first expressed by La Mer and co-
workers in their study on sulfur sols in the 1950s (Viau et al., 1996; Watzky and
Finke, 1997; Yondong, 2003). Their proposed mechanism on the formation of
monodispersed colloidal particles in homogeneous solutions is the widely cited La
Mer mechanism.
15
According to the La Mer model, formation of colloidal particles is achieved
by nucleation from a supersaturated homogenous solution followed by the diffusive
growth either by molecular addition or by agglomeration to other solid particles
(Watzky and Finke, 1997; Dong et al., 2001; Yondong, 2003; Burda et al., 2005).
The condition of supersaturation is necessary since the energy barrier to nucleation
can only be surmounted in supersaturated solutions, where the probability of
molecular encounters like those needed for the stepwise sequence of molecular
addition is sufficiently high (Watzky and Finke, 1997).
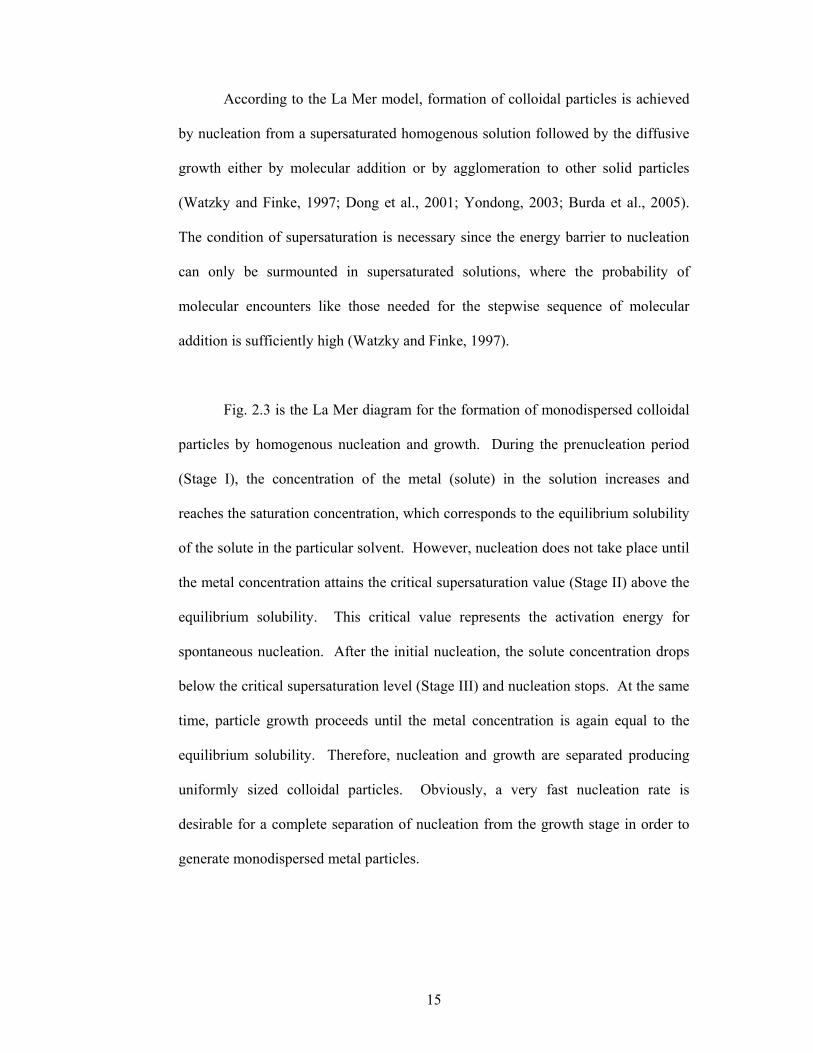
Fig. 2.3 is the La Mer diagram for the formation of monodispersed colloidal
particles by homogenous nucleation and growth. During the prenucleation period
(Stage I), the concentration of the metal (solute) in the solution increases and
reaches the saturation concentration, which corresponds to the equilibrium solubility
of the solute in the particular solvent. However, nucleation does not take place until
the metal concentration attains the critical supersaturation value (Stage II) above the
equilibrium solubility. This critical value represents the activation energy for
spontaneous nucleation. After the initial nucleation, the solute concentration drops
below the critical supersaturation level (Stage III) and nucleation stops. At the same
time, particle growth proceeds until the metal concentration is again equal to the
equilibrium solubility. Therefore, nucleation and growth are separated producing
uniformly sized colloidal particles. Obviously, a very fast nucleation rate is
desirable for a complete separation of nucleation from the growth stage in order to
generate monodispersed metal particles.

16
Fig. 2.3 La Mer model for the formation of monodispersed systems by controlled homogenous nucleation and growth: I. prenucleation period; II. nucleation step; III. growth step (Redrawn from Viau et al., 1996).
In practice, automatic separation of nucleation and growth is difficult to
accomplish and thus, the solute concentration is normally brought abruptly to a very
high supersaturation and quickly decreased below the critical supersaturation level
so that a sharp nucleation is achieved (Cao, 2004). Such techniques are called
supersaturation quenching. Examples of these processes are reduction of pH in the
forced hydrolysis of metal ions, dilution with the solvent, addition of some growth
accelerators, and a quick change of temperature (Sugimoto, 2001).
The La Mer model for the separation of nucleation and growth has been
widely applied in various syntheses of monodispersed particles in homogeneous
solutions. However, inconsistencies were found in some cases, such as in the
formation of gold sols, where kinetics was found to play a part, which does not agree
with the supersaturation theory (Watzky and Finke, 1997). A more recent
mechanism was proposed by Watzky and Finke (1997) to account for the role of
kinetics in the separation of nucleation and growth. Their works on iridium
nanocluster formation using hydrogen gas as reductant demonstrated that (a)
saturation concentration
nucleation concentration
Time
Con
cent
ratio
n of
met
al a
tom
s in
sol
utio
n I II III

17
nucleation in a solution is accomplished via low-level continuous slow process in a
solution that is far from being saturated and (b) a subsequent autocatalytic surface-
growth step achieves the key separation in time necessary for the synthesis
monodispersed nanoclusters. Furthermore, in contrast to the La Mer mechanism, the
autocatalytic surface growth process is generally not diffusion-limited. Instead, the
rate determining step is the metal incorporation onto the particle surface, which in
turn is dependent on the surface area. Nonetheless, even with the existence of this
new mechanism, the short nucleation time model of La Mer is still more commonly
used to explain the precipitation process for many chemical reactions, including the
formation of monosized nanoparticles from solution.
A more drastic measure to separate growth from nucleation is by seeding,
first used by Zsigmondy for Au colloids (Sugimoto, 2001). In this process, seed
crystals are introduced into a monomer solution under a relatively low
supersaturation below the critical supersaturation level. Thus, nucleation process is
performed in a completely separate system. This route, known as the seed mediated-
method, has also been used to synthesize monometallic and bimetallic (core-shell)
nanoparticles (Qian and Yang, 2005).
A variation of this process was employed by Viau et al. (2001) in the
preparation of CoNi nanopowders in polyol. Very fine nanoparticles of Pd, Pt, or
Ag were formed in situ by the introduction of their salts into the metal solution.
Since reduction of noble metals occurs first, Co and Ni atoms preferentially deposit
on the surface of noble metal nanoparticles resulting to uniformly sized CoNi
nanoparticles. Fig 2.4 (a) shows a TEM image of their Co50Ni50 nanoparticles seeded

18
with Pt, while its x-ray diffraction pattern is in Fig. 2.4 (b). Note that no peak
related to Pt was identified from the x-ray diffractogram indicating that all Pt
nanoparticles were covered by Co and Ni. A more recent work on the use of
heterogeneous nucleation employing Ag and Pt as nucleating agents on the
formation of Co80Ni20 nanoparticles was published by Luna et al. (2004).
Fig. 2.4 (a) TEM image of Co50Ni50 nanoparticles produced by heterogeneous nucleation with Pt in polyol (dm = 6 nm) and its corresponding (b) XRD pattern with increasing mole ratios of Pt to (Co+Ni) showing only peaks of Co and Ni: a. dm = 44 nm; b. dm = 15 nm; c. dm = 5 nm (Viau et al., 2001).
2.3.2 Control of the Growth Process
Control of growth mode is important in the synthesis of monodispersed
nanoparticles since the size distribution of the particles is influenced by the
subsequent growth process. Moreover, the final particle size will also be determined
by the growth step. Nanoparticles, in general, grow by molecular addition through
the stepwise addition of monomeric entities of the solute or by secondary growth
process, wherein agglomeration of primary particles occur which form larger
secondary particles. (Viau et al., 1996; Yondong, 2003; Burda et al., 2005).
Particle growth via molecular addition involves four major steps: (a)
generation of growth species, (b) diffusion of growth species from bulk to the
(a) (b)
2θ (˚)

19
growth surface, (c) adsorption of the growth species onto the growth surface, and (d)
surface growth through irreversible incorporation of the growth species onto the
solid surface (Cao, 2004). The first three steps are diffusion-limited processes,
whereas the last step is a surface-controlled process (Cao, 2004). Therefore, the
particle growth mechanism depends on which among these steps is rate limiting,
either a diffusion-controlled or surface-reaction controlled process.
In a diffusion-limited growth, self sharpening of the size distribution is
expected to occur as long as the supersaturation is high, though less than the critical
supersaturation level to avoid renucleation during particle growth (Sugimoto, 2001).
Fig. 2.5 shows that the radius difference among the nanoparticles decreases with the
increase in particle size and with prolonged growth time in a diffusion-controlled
growth, which supports the formation of uniformly sized nanoparticles (Cao, 2004).
To attain a diffusion-dependent growth, several approaches can be done such as by
keeping the amount of the growth species extremely low resulting to very large
diffusion distance, by increasing the viscosity of the solution as in the case of
ethylene glycol when NaOH is added, and by the introduction of a diffusion barrier
such as protective agents like gelatin and PVP (poly vinyl pyrrolidone).
On the other hand, self sharpening of size distribution does not occur in
surface-reaction controlled growth and only the relative width of the size distribution
against the mean size is narrowed (Sugimoto, 2001). Surface-reaction growth can be
further divided into two mechanisms: mononuclear growth and polynuclear growth
(Cao, 2004). In mononuclear growth, the growth process proceeds layer by layer,
such that the growth species are incorporated onto one layer and continues to

20
another layer only after the previous layer is completed. The difference in the
particle size among the nanoparticles increases with the particle size and growth
time as seen in Fig. 2.5. Therefore, mononuclear growth does not promote the
formation of monodispersed nanoparticles.
Fig. 2.5 Plot illustrating the radius difference (δr/r) among the nanoparticles as a function of (a) particle radius (r) and (b) growth period (t) for diffusion-controlled growth (I), polynuclear growth (II), and mononuclear growth (III) mechanisms (Modified from Cao, 2004).
However, in polynuclear growth, the surface process is extremely rapid that
the second growth layer proceeds before the first layer is completed (Viau, 1996;
Cao, 2004). Then, the relative width of the particle size distribution narrows as long
as the particle growth continues. From Fig. 2.5, it can be noted that the radius
difference among the particles is reduced with the increase in size and with longer
growth period. Nonetheless, a predominant diffusion-controlled growth is desirable
for the formation of monosized nanoparticles.
δr/r δr/r
r t
I
II
III
I
II
III
(a) (b)
21
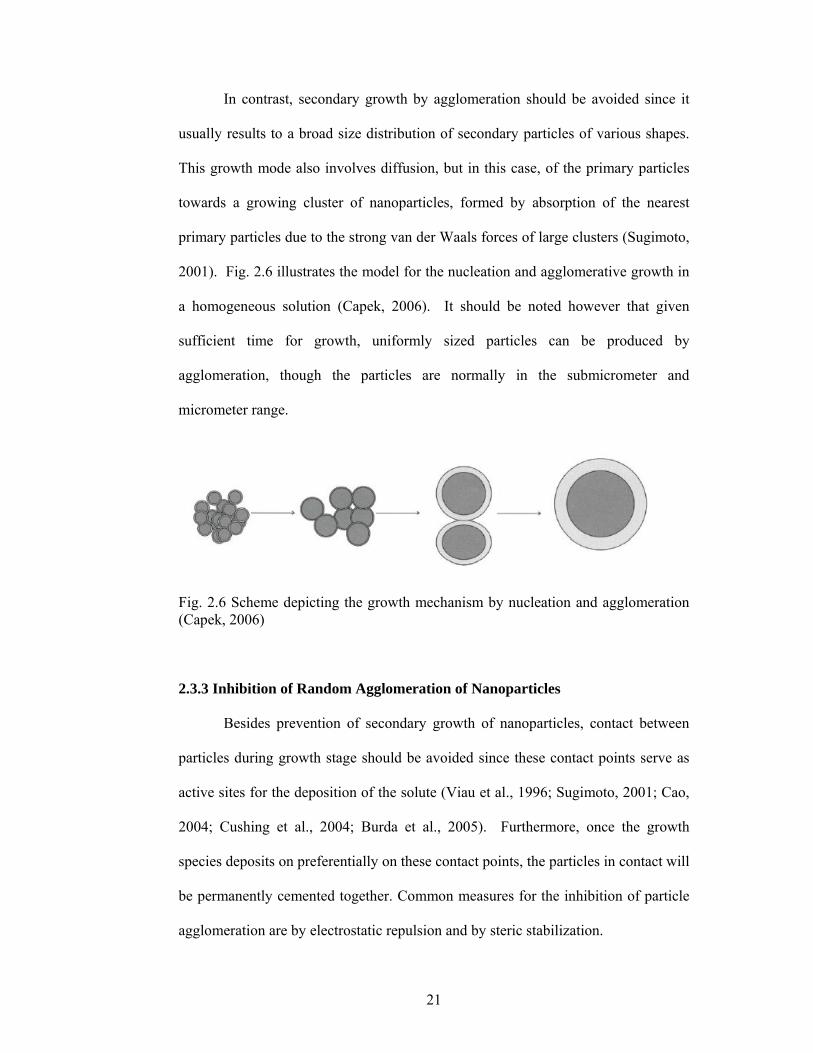
In contrast, secondary growth by agglomeration should be avoided since it
usually results to a broad size distribution of secondary particles of various shapes.
This growth mode also involves diffusion, but in this case, of the primary particles
towards a growing cluster of nanoparticles, formed by absorption of the nearest
primary particles due to the strong van der Waals forces of large clusters (Sugimoto,
2001). Fig. 2.6 illustrates the model for the nucleation and agglomerative growth in
a homogeneous solution (Capek, 2006). It should be noted however that given
sufficient time for growth, uniformly sized particles can be produced by
agglomeration, though the particles are normally in the submicrometer and
micrometer range.
Fig. 2.6 Scheme depicting the growth mechanism by nucleation and agglomeration (Capek, 2006)
2.3.3 Inhibition of Random Agglomeration of Nanoparticles
Besides prevention of secondary growth of nanoparticles, contact between
particles during growth stage should be avoided since these contact points serve as
active sites for the deposition of the solute (Viau et al., 1996; Sugimoto, 2001; Cao,
2004; Cushing et al., 2004; Burda et al., 2005). Furthermore, once the growth
species deposits on preferentially on these contact points, the particles in contact will
be permanently cemented together. Common measures for the inhibition of particle
agglomeration are by electrostatic repulsion and by steric stabilization.

22
Electrostatic repulsion makes use of the electric double layer, wherein
charged particles exert repulsive forces against each other as function of the zeta
potential and Debye length (Sugimoto, 2001; Cao, 2004). These repulsive forces
results from the chemisorption of charged species at the surfaces of the
nanoparticles. This can be accomplished by diluting the solution or by adjusting the
pH. Even so, electrostatic stabilization is limited by the following facts: (a) it is a
kinetic type of stabilization, thus, it is almost impossible to re-disperse agglomerated
nanoparticles; (b) it is only applicable to dilute systems; (c) it cannot be used on
electrolyte sensitive systems; and (d) it is difficult to apply to multiphase systems,
since different solids develop varying surface charge and electric potential in a given
condition (Cao, 2004).
A more typical measure against particle coagulation is by steric stabilization.
It is a widely applied method than electrostatic stabilization due to issues on the
stability of nanoparticles at very high or low pH (Burda et al., 2005) when
electrostatic stabilization is used and is generally accomplished by the addition of
protective agents like polymers, surfactants, and complexing agents, as adsorptive to
particles (Sugimoto, 2001). Also, protective agents not only prevent agglomeration,
but often act as growth inhibitors and shape controllers as well. Moreover, polymer
layer adsorbed on the surface of the nanoparticles also serves as diffusion barrier to
growth species resulting in a diffusion-limited growth (Cao, 2004). Table 2.4 gives
some of the common protective agents that were used in the synthesis of Co
nanoparticles.

23
Table 2.4 Some Protective Agents Used in the Synthesis of Co Nanoparticles Protective Agents References
Trialkylphosphine, PR3 Sun and Murray, 1999; Yang et al., 2006.
Trioctylphosphane oxide, TOPO Dinega and Bawendi, 1999; Puntes et al., 2001; Shukla et al., 2006; Cheng and Hight Walker, 2007.
Oleic acid, OA
Sun and Murray, 1999; Viau et al., 2001; Puntes et al., 2002; Luna et al., 2003; Shukla et al, 2006; Yang et al, 2006.
Lauric acid, LA Luna et al., 2003.
Sodium dodecylsulfosuccinate, SDS Rivas et al, 1999; Gibot et al., 2005. Didodecyldimethyl ammonium bromide, DDAB Chen et al., 1995; Ram, 2001.
Centrimethyl ammonium bromide, CTAB Gibot et al., 2005
1,2 propanediol Viau et al., 1994; Toneguzzo et al., 2000; Luna et al., 2004.
1,2 hexadecanediol Luna et al., 2003. Alkylphosphines molecules such as PR3 and TOPO due to their steric
bulkiness, in combination with the organic molecules of oleic acid, are generally
employed in the preparation of ε-Co by organometallic method. As mentioned,
these molecules were found to be responsible for changing the energetics of crystal
growth during synthesis in favor of the formation of the less dense ε-Co (Dinega and
Bawendi, 1999). In addition, by changing the mole ratio of these protective agents
in the solution, anisotropic Co nanoparticles can be produced (Puntes et al., 2001;
Shukla et al., 2006). On the other hand, cationic (SDS) and anionic (DDAB and
CTAB) surfactants are normally used in microemulsion and metal salt reduction
techniques to fabricate either a single phase FCC-Co or a mixture of both phases
(Chen et al., 1995; Rivas, 1999). Meanwhile, polyalchohols such as 1,2 propanediol
and 1,2 hexadecanediol can act simultaneously as solvent, protective agent, and
reductant during the fabrication of monodispersed Co nanoparticles by the polyol
24
process (Viau et al., 1994; Toneguzzo et al., 2000; Luna et al., 2004). Synthetic
routes for the preparation of Co nanoparticles such as organometallic route,
microemulsion, metal salt reduction, and polyol method will be described in detail in
the succeeding sections.
2.3.4 Reserve of Monomers
In the formation of monodispersed particles, two conflicting requirements
are present during growth stage: moderate supersaturation to avoid renucleation and
an ample concentration of monomers for particle growth (Cao, 2004). To resolve
this, a monomer reservoir, which regulates the release of metal ions, must be built.
This is accomplished by introducing complexing agents like EDTA, NTA, and citric
acid that shield a large concentration of multivalent metal cations, and thus
decreases the supersaturation of free metal ions in the solution (Sugimoto, 2001). In
addition to preventing concurrent nucleation during particle growth, complexing
agents also inhibits agglomeration of particles during this stage.
2.4 Liquid-Phase Synthesis of Cobalt and Other Magnetic Nanoparticles
Various synthetic routes have been exploited in the preparation of uniformly
sized and monodispersed Co nanoparticles. These methods are generally grouped
into two: physical and chemical methods. Physical methods make use of high-
energy treatment in gaseous and solid states to form magnetic nanoparticles (Gubin
et al, 2005). Examples are laser vaporization, arc discharge, chemical vapor
deposition, and low-energy beam cluster deposition, which utilize special
installations or apparatus during synthesis (Cao, 2004; Burda et al, 2005; Gubin et
al., 2005).