Syntheses and characterization of water-soluble ...
236
Louisiana State University LSU Digital Commons LSU Doctoral Dissertations Graduate School 2012 Syntheses and characterization of water-soluble phythalocyanines for diagnosis and treatment of cancer Benson Getenga Ongarora Louisiana State University and Agricultural and Mechanical College Follow this and additional works at: hps://digitalcommons.lsu.edu/gradschool_dissertations Part of the Chemistry Commons is Dissertation is brought to you for free and open access by the Graduate School at LSU Digital Commons. It has been accepted for inclusion in LSU Doctoral Dissertations by an authorized graduate school editor of LSU Digital Commons. For more information, please contact[email protected]. Recommended Citation Ongarora, Benson Getenga, "Syntheses and characterization of water-soluble phythalocyanines for diagnosis and treatment of cancer" (2012). LSU Doctoral Dissertations. 3756. hps://digitalcommons.lsu.edu/gradschool_dissertations/3756
Transcript of Syntheses and characterization of water-soluble ...

Louisiana State UniversityLSU Digital Commons
LSU Doctoral Dissertations Graduate School
2012
Syntheses and characterization of water-solublephythalocyanines for diagnosis and treatment ofcancerBenson Getenga OngaroraLouisiana State University and Agricultural and Mechanical College
Follow this and additional works at: https://digitalcommons.lsu.edu/gradschool_dissertations
Part of the Chemistry Commons
This Dissertation is brought to you for free and open access by the Graduate School at LSU Digital Commons. It has been accepted for inclusion inLSU Doctoral Dissertations by an authorized graduate school editor of LSU Digital Commons. For more information, please [email protected].
Recommended CitationOngarora, Benson Getenga, "Syntheses and characterization of water-soluble phythalocyanines for diagnosis and treatment of cancer"(2012). LSU Doctoral Dissertations. 3756.https://digitalcommons.lsu.edu/gradschool_dissertations/3756

SYNTHESES AND CHARACTERIZATION OF WATER-SOLUBLE
PHTHALOCYANINES FOR DIAGNOSIS AND TREATMENT OF CANCER
A Dissertation
Submitted to the Graduate Faculty of the
Louisiana State University and
Agricultural and Mechanical College
in partial fulfillment of the
requirement for the degree of
Doctor of Philosophy
in
The Department of Chemistry
by
Benson Getenga Ongarora
B.Sc., Moi University, 2005
December 2012

ii
Dedicated to my dear wife (Nancy Kemunto), my son (Braden Getenga) and my parents
(Margaret Bitutu and Peter Ongarora). This is a sign of my gratitude since I can never thank you
as much as necessary for your love, guidance, encouragement and constant prayers.

iii
ACKNOWLEDGEMENTS
I earnestly thank my advisor, Prof. M. Graҫa H. Vicente, for endlessly mentoring,
inspiring, supporting and encouraging me since I joined the group four years ago. I appreciate
your caring, considerate and optimistic approach to issues that gave me an opportunity to tap the
best concepts from you. Our countless discussions helped me appreciate the importance of the
project and thus its direction.
I would like to thank Prof. Steve Soper, Prof. Carol M. Taylor, Prof. George G. Stanley
and Prof. Jin-Woo Choi for being my advisory committee members. Thank you all for your time,
constant guidance and encouragement throughout the research period. Thanks for the patience as
you read my thesis.
Appreciation also goes to my lab mates: Haijun Wang and Elizabeth A. Okoth. Thanks a
lot to Daniel and Igor, who helped me with the purification work as undergraduate research
students. Thank you for your relentless efforts to make this work a success. I thank the past and
the current group members of Prof. Vicente and Prof. Kevin Smith: Hairong Li, Moses Ihachi,
Haijun Li, Raja Waruna, Timsy Uppal, Alecia McCall, Krystal Fontenot, Hillay Tanui, Edith
Amuhaya, Dinesh Bhupathiraju, and all for the team-work during my research.
I thank Dr. Frank R. Fronczek for the great job done on crystal structure resolution of the
compounds synthesized during my research work. I am also thankful to Dr. Dale Treleaven and
Dr. Thomas Weldegheorghis for lending a hand in NMR studies of the samples synthesized
during this course. Your efforts made it possible to publish this piece of work in recognizable
journals such as MedChemComm., J. Med. Chem. and Theranostics among others.
I am especially indebted to Dr. Robert Cook for allowing me to use the instruments in his
laboratory for photophysical studies. Special thanks to Prof. Carol Taylor for laboratory

iv
equipment and space. Similarly, appreciation goes to Dr. Inder Sehgal, Dr. Krystal Fontenot, Dr.
Xiaoke and Zehua Zhou for helping me with biological studies. Thanks too to Prof. Chang
Kwang Poo and Sujoy Dutta for helping me with biological experiments.
I would like to thank all my friends at LSU, and elsewhere, for your support and
encouragement. Your positive criticism in all aspects propelled me to greater heights every day.
In the criticisms, I found energy to conquer most of the challenges that I encountered.
The financial support of this research by the National Institutes of Health (NIH) grant
number R21 CA139385 is greatly acknowledged.
I would like to thank Dr. Samuel Lutta, Dr. Maurice Okoth, and Dr. Fredrick Segor, who
some years back recommended me to seek admission at LSU. Their strong commendation is
exceedingly valued. I also thank my brother, Vincent Ongarora, and my sister, Aska Ongarora,
for their continued support throughout the course. Your unconditional love and care is
incalculable.
I give my thanks to my wife, Nancy Kemunto and my son, Braden Getenga, for their
resolute love. Thank you for your support and encouragement. Even when challenges seemed
excruciating, your resilience kept me going. Without your shoulders, my effort could have been
futile and this work may not have been accomplished.
Most importantly, I thank God for this generous opportunity to study at LSU. Everything
was availed at the allotted time and the transition was smooth. The working environment was
wonderful and I have enjoyed good health all through. Thanks be to God, the Almighty.

v
TABLE OF CONTENTS
ACKNOWLEDGEMENTS....................................................................................................... iii
LIST OF ABBREVIATIONS.................................................................................................. viii
ABSTRACT ............................................................................................................................. xi
CHAPTER 1: INTRODUCTION ...............................................................................................1
1.1. Overview of Phthalocyanines ...........................................................................................1 1.2. Structure of Phthalocyanines ............................................................................................2
1.3. Synthesis of Phthalocyanines ............................................................................................3 1.3.1. Synthesis via Tetramerization of a Single Precursor ...................................................3
1.3.2. Synthesis via Tetramerization of Two or More Precursors .........................................9 1.4. Photophysical Properties of Phthalocyanines .................................................................. 11
1.4.1. Fluorescence Quantum Yield (Фf) ............................................................................ 13 1.4.2. Singlet Oxygen Quantum Yield (ФΔ) ....................................................................... 13
1.4.3. UV-vis Absorption Spectra ...................................................................................... 14 1.5. Applications of Phthalocyanine ...................................................................................... 15
1.5.1. Applications in Photodynamic Therapy .................................................................... 15 1.5.2. Applications in Bioimaging ..................................................................................... 17
1.6. References ...................................................................................................................... 19
CHAPTER 2: SYNTHESES AND BIOLOGICAL EVALUATION OF CATIONIC
TRIMETHYLAMINOPHENOXY-SUBSTITUTED ZINC(II)-PHTHALOCYANINES ........... 27 2.1. Background .................................................................................................................... 27
2.2. Synthesis ........................................................................................................................ 29 2.2.1. Synthesis of Phthalonitriles ...................................................................................... 29
2.2.2. Synthesis of Cationic ZnPcs ..................................................................................... 31 2.3. Spectroscopic and Photophysical Characterization .......................................................... 36 2.4. Cellular Studies .............................................................................................................. 42
2.5. Conclusions .................................................................................................................... 52 2.6. Experimental Section ...................................................................................................... 53
2.6.1. Chemistry ................................................................................................................ 53 2.6.2. Synthesis of Phthalocyanines and Their Precursors .................................................. 53
2.6.3. Phthalonitrile Molecular Structures .......................................................................... 67 2.6.4. Spectroscopic Studies .............................................................................................. 68
2.6.5. Cell Studies ............................................................................................................. 69 2.7. References ...................................................................................................................... 71
CHAPTER 3: SYNTHESES, CHARACTERIZATION AND BIOLOGICAL EVALUATION
OF PHTHALOCYANINE-PEPTIDE CONJUGATES FOR EPIDERMAL GROWTH FACTOR
RECEPTOR TARGETING IN COLON CANCER ................................................................... 74 3.1. Background .................................................................................................................... 74
3.2. Results and Discussion ................................................................................................... 76 3.2.1. Synthesis and Characterization................................................................................. 76
vi
3.2.2. Docking ................................................................................................................... 82 3.2.3. Cell Culture ............................................................................................................. 83
3.2.4. Mouse Studies ......................................................................................................... 96 3.3. Conclusion ................................................................................................................... 101
3.4. Experimental Section .................................................................................................... 102 3.4.1. General Chemistry ................................................................................................. 102
3.4.2. Peptide Synthesis and Conjugations ....................................................................... 103 3.4.3. Spectroscopic Studies ............................................................................................ 114
3.4.4. Computational Studies ........................................................................................... 114 3.4.5. Cell Studies ........................................................................................................... 115
3.4.6. In Vivo Uptake Studies .......................................................................................... 117 3.5. References .................................................................................................................... 118
CHAPTER 4: SYNTHESES, CHARACTERIZATION AND PHOTOPHYSICAL
EVALUATION OF REGIOMERICALLY PURE PHTHALOCYANINES FOR CANCER
IMAGING AND PHOTODYNAMIC THERAPY APPLICATIONS ...................................... 123 4.1. Background .................................................................................................................. 123
4.2. Synthesis of A2B2- and A3B-type Pcs ............................................................................ 124 4.2.1. Synthesis of Phthalonitriles .................................................................................... 125
4.2.2. Synthesis of Pcs ..................................................................................................... 128 4.3. Spectroscopic and Photophysical Characterization ........................................................ 131
4.4. Summary ...................................................................................................................... 136 4.5. Conclusions .................................................................................................................. 137
4.6. Experimental Section .................................................................................................... 137 4.6.1. Synthesis of Phthalonitriles .................................................................................... 138
4.6.2. Synthesis of Pcs ..................................................................................................... 139 2.6.3. Phthalonitrile Molecular Structures ........................................................................ 143
4.7. Spectroscopic Studies ................................................................................................... 144 4.8. References .................................................................................................................... 144
CHAPTER 5: SYNTHESES AND BIOLOGICAL EVALUATION OF PEGYLATED AND
CATIONIC ZINC(II)-PHTHALOCYANINES AND MONOCLONAL ANTI-
CARCINOEMBRYONIC ANTIGEN CONJUGATES FOR IMAGING AND TREATMENT
OF CANCER .......................................................................................................................... 147
5.1. Background .................................................................................................................. 147 5.2. Results and Discussion ................................................................................................. 148
5.2.1. Syntheses of Cationic ZnPcs .................................................................................. 148 5.2.2. Biological Evaluation of Cationic ZnPcs ................................................................ 154
5.2.3. Pc-Monoclonal Anti-Carcinoembryonic Antigen (AntiCEA) Conjugates ............... 164 5.2.4. Syntheses of Pcs for Conjugation to the AntiCEA .................................................. 166
5.2.5. Conjugation of Pcs to AntiCEA ............................................................................. 169 5.2.6. Preliminary Animal Studies ................................................................................... 172
5.3. Conclusions .................................................................................................................. 174 5.4. Methods and Materials ................................................................................................. 175
5.4.1. Syntheses ............................................................................................................... 175 5.4.2. Syntheses of Pcs and Their antiCEA Bioconjugates ............................................... 197
5.4.3. Cell Studies ........................................................................................................... 204
vii
5.4.4. Methods for Mouse Imaging .................................................................................. 206 5.5. References .................................................................................................................... 206
APPENDIX A: CHARACTERIZATION DATA FOR COMPOUNDS IN CHAPTER 2 ........ 210
APPENDIX B: BIOLOGICAL DATA FOR COMPOUNDS IN CHAPTER 3 ........................ 213
APPENDIX C: CHARACTERIZATION DATA FOR COMPOUNDS IN CHAPTER 4 ........ 217
APPENDIX D: CHARACTERIZATION DATA FOR COMPOUNDS IN CHAPTER 5 ........ 218
APPENDIX E: LETTERS OF PERMISSION ......................................................................... 221
VITA...........................................................................................................................................224

viii
LIST OF ABBREVIATIONS
σ Chemical shift
λex Excitation wavelength
br Broad
BBr3 Boron tribromide
Boc tert-Butyl carbamate
°C Degrees Celsius
CEA Carcinoembryonic antigen
CHCl3 Chloroform
CH3OH Methanol
CLE Confocal laser endomicroscopy
13C NMR Carbon 13 nuclear magnetic resonance
CRC Colorectal cancer
d Doublet
DBN 1,5-Diazobicyclo[4.3.0]non-ene
DCM Dichloromethane
DIEA N,N-Diisopropylethylamine
DIPA N,N-diisopropylamine
DMAE N,N-Dimethylaminoethanol
DMEM Dulbecco’s modified eagle’s medium
DMSO Dimethyl sulfoxide
DMF Dimethylformamide
EDCI 1-Ethyl-3-(3-dimethylaminopropyl)-carbodiimide hydrochloride
EGFR Epidermal growth factor receptor
ER Endoplasmic reticulum

ix
ESI Electrospray ionization
FBS Fetal bovine serum
FDA United States Food and Drug Administration
FT-IR Fourier transform infrared
h Hours
HATU 2-(1H-Azabenzotriazol-1-yl)-1,1,3,3-tetramethyluronium
hexafluorophosphate
HOBt N-Hydroxybenzotriazole
H2Pc Metal-free phthalocyanine
HPLC High Performance Liquid Chromatography
HRMS High resolution mass spectrometry
Hz Hertz
IC50 Inhibitory concentration 50%
IR Infrared
J/cm2 Joule per square centimeters
MALDI Matrix assisted laser desorption/ionization
MeI Methyl iodide
MeOH Methanol
MS Mass spectrometry
m/z Mass to charge ratio
nm Nanometer
nM Nanomolar
NMR Nuclear Magnetic resonance
OH Hydroxyl
ppm Parts per million

x
PBS Phosphate buffered saline
Pc Phthalocyanine
PDB Protein databank
PDT Photodynamic therapy
PEG Polyethylene glycol
PS Photosensitizer
rt Room temperature
RES Reticulo-endothelial-system
ROS Reactive oxygen species
s Singlet
SPS Solid-phase synthesis
t Triplet
TBTU 2-(1H-Benzotriazol-1-yl)-1,1,3,3-tetramethyluronium tetrafluoroborate
TEA Triethylamine
TFA Trifluoroacetic acid
THF Tetrahydrofuran
TIS Triisopropylsilane
TLC Thin layer chromatography
μL Microliter
μM Micromolar
UV-Vis Ultraviolet visible
ZnPc Zinc phthalocyanine
xi
ABSTRACT
Chapter 1 describes the general properties of phthalocyanines, synthesis of metallo-
phthalocyanines, their photophysical features and their uses. The concepts of PDT and targeted
therapeutics are also introduced.
Chapter 2 describes the syntheses, characterization, photophysical studies and biological
evaluation of cationic phthalocyanines. The trimethylaminophenoxy substituted phthalocyanines
were synthesized through statistical condensation method, which gave a statistical mixture of
isomers. Di-cationic phthalocyanines were found to be more cytotoxic. The amphiphilicity of the
phthalocyanines played an important role.
Chapter 3 covers the conjugation of phthalocyanines to peptides and is in pursuit of
targeted therapeutics. The conjugation of two peptides, EGFR L1 (six amino acid residues) and
EGFR L2 (twelve amino acid residues), gave conjugates with different charge, length, and
hydrophobicity. The bioconjugates were synthesized via SPS method using typical peptide
coupling agents. Cellular and animal studies are described for the conjugates.
Chapter 4 is a description of the syntheses and characterization of pure regiomeric
phthalocyanines. Previous chapters described, mostly, statistical mixture of Pcs. In this chapter,
strategy to the synthesis of monomeric isomers and their characterization is presented.
Chapter 5 describes the syntheses, characterization and cellular studies of a series of di-
cationic and pegylated phthalocyanines. Statistical condensation was used in the synthesis of
macrocycles. Phthalocyanines with cationic charge at close proximity and on α-substitution
position of the macrocycle were found to be more cytotoxic. In addition, Pc-antibody
bioconjugates are discussed. The biological studies are described for both cationic Pcs and Pc-
conjugates. Just like Chapter 3, this chapter is also in pursuit of targeted therapeutics.
1
CHAPTER 1
INTRODUCTION
1.1. Overview of Phthalocyanines
Phthalocyanines (Pcs), also known as azaporphyrin derivatives, are a class of synthetic
tetrapyrrolic compounds which are closely related to the naturally occurring porphyrin.1 The
structural difference between the Pc and porphyrin macrocycles is that Pc has four extended
benzo subunits and four nitrogen atoms at the meso position on the macrocycle; hence Pcs are
often referred to as tetra-benzotetraazaporphyrins.2 The Pcs are a unique set of organic pigments
that provide stable and strongly chromatic blues and greens. Pcs have strong absorbance at
longer wavelengths than porphyrins and often have improved photophysical and photochemical
properties.3 The first Pc was reported as a dark blue insoluble byproduct during the preparation
of o-cyanobenzamide from phthalimide and acetic acid by Braun and Tcherniac in 1907.4 Von
der Weid and Diesbach of Fribourg University, twenty years later, isolated Pc as an unexpected
stable blue material in reactions of o-dibromobenzene with copper cyanide in refluxing
pyridine.5
Since their discovery and identification (1900s), Pcs have been extensively used as dyes
and pigments in paint, printing, textile and paper industries, due to their intense blue-green
color.6 Owing to their increased stability, improved spectroscopic characteristics, diverse
coordination properties, and architectural flexibility, Pcs have surpassed porphyrins in a number
of applications.7 Most recently, Pcs have found high-tech applications in electrophotography and
ink-jet printing and as photoconducting agents in photocopying devices.8 In addition, their
novelty is rapidly growing in other fields where they are used as chemical sensors, liquid
crystals, semiconductors, functional polymers and molecular metals, among others.9 They have

2
also found use in photodynamic therapy (PDT). Most of the photosensitizers used in PDT are
tetrapyrrolic in nature; chlorin, porphyrin and bacteriochlorin. These cyclic tetrapyrrolic
derivatives have an inherent similarity to naturally occurring porphyrins present in living matter;
this probably gives them little or no toxicity in the absence of light.10,11
1.2. Structure of Phthalocyanines
The structure, charge and hydrophobicity of a photosensitizer determines its interactions
with its biological surroundings and in turn determines its cellular uptake, subcellular
localization and cytotoxicity.12
For instance, amphiphilic photosensitizers are often more
photodynamically active than hydrophobic or hydrophilic molecules.13
Amphiphilicity, the
element of having both hydrophobic and hydrophilic characteristics in different segments within
the same molecule, permits distinct portions to interact differently with their biological
environment and tend to enhance solubility, improve cellular uptake and intracellular targeting,
and modulate aggregation. Though, it should be noted that strong amphiphilic photochemical
internalization (PCI)-photosensitizers, including porphyrin, chlorin and phthalocyanine
derivatives are not substrates for breast cancer Resistance Protein (ABCG2) in multi-drug
resistance chemotherapeutic agents.14
A number of functional groups have been added to Pc framework via the benzene rings to
increase their utility. Functional groups such as alkyl chains, ethers, amines and thiols among
others, have been introduced to enhance solubility.15
Instituting quaternized and sulfonated
groups as substituents promotes solubility in aqueous media16,17
while organic functional groups
such as thio and aryloxo promotes solubility in organic solvents.18,19
The substitutions can be
made directly onto the Pc framework (Method S) or on the phthalonitrile precursor before
condensation to form the Pc ring.20
The use of substituted precursors leads to cleaner reactions in

3
terms of degree of substitution; for example, a mono-substituted precursor leads to a
tetrasubstituted Pc. Such substitutions can be carried out at any of the 16 available positions on
the Pc framework (Figure 1.1). While the number and position of the substituents obtained by
condensation is known, still constitutional isomers are obtained. Nevertheless, this method is
preferred for adding substituents to the framework, giving Pcs with improved properties and
desired chemical structures.5 The positions 1,4,8,11,15,18,22,25 are referred to as non-peripheral
or α- positions, while 2,3,9,10,16,17,23,24 are known as peripheral or β- positions.21
Figure 1.1: Potential sites for Pc substitution (numbering used traditionally for Pc
nomenclature).21
1.3. Synthesis of Phthalocyanines
1.3.1. Synthesis via Tetramerization of a Single Precursor
A number of derivatives of ortho-substituted benzene can serve as precursors in the
synthesis of Pc macrocycles (Figure 1.1). The precursors include phthalic anhydride, phthalic
acid, phthalonitrile, phthalimide, diiminoisoindoline, o-cyanobenzamide, o-dibromobenzene and
cyclohex-1-ene-1,2-dicarboxylic anhydride, among others. Phthalonitriles are popular for
laboratory syntheses due to better yields, while phthalic anhydride is used in mass production, as
it is relatively cheap.22
Phthalonitriles mostly require heating with a metal template in a high
boiling point solvent such as quinoline or N,N-dimethylaminoethanol (DMAE). The advantage

4
of phthalonitrile as a precursor is that it readily gives good yields of Pc complexes with most
metals except mercury and silver, while other precursors such as phthalimide and other phthalic
acid derivatives often give unreliable results.23
Scheme 1.1: Synthetic routes to metallophthalocyanines (MPcs) from various precursors.
Unsubstituted metal-free Pcs (H2Pcs) can be prepared using the Linstead method24
from
phthalonitrile in refluxing lithium, sodium or magnesium alkoxide solution. The Pc can then be
demetallated by adding a dilute acid to obtain H2Pc. Tomoda method, a simple route to the
synthesis of Pcs by heating phthalonitrile with catalytic amount of DBU or DBN, was reported in
the 1980s.25,26
This route may yield up to 70% metal-free and 80% metallated Pcs. Strong
organic bases such as DBU and DBN (Figure 1.2) generally promote the formation of Pcs in
higher yields, while weaker ones such as TEA and pyridine do not favor the formation of Pcs.

5
The use of these bases allows the reaction to proceed under milder conditions by promoting the
formation of the alkoxide ion (Scheme 1.2).
Figure 1.2: Structures of common organic bases used in Pc synthesis.
Tomoda et al. proposed that the strong base is a proton acceptor, therefore, generating an
alkoxide in the process (Scheme 1.2).25
The resulting alkoxide then acts both as the nucleophile
and reducing agent as shown in Scheme 1.3.27
The alkoxide reacts with cyano group of a
phthalonitrile, forming an alkoxyisoindoline intermediate, which rapidly tetracyclizes to form a
Pc.
Scheme 1.2: Formation of alkoxide anion (RO-) in preparation of Pcs.
25
The mechanism for the condensation of phthalonitriles to form Pcs (Scheme 1.3)
probably involves a stepwise polymerization of the precursors or reactive intermediates,
followed by coordination of the central metal ion (in case of MPcs) and finally ring closure to
form the macrocycle.28,29
The ring closure is driven by aromatization, thermodynamic stability
and inherent stabilization caused by metal coordination.
Metallated Pcs may also be prepared from metal-free Pcs through the addition of a metal
salt into a reaction. The only limitation of this method is that large metals cannot be added into
the cavity.30
Therefore, the metal salt must be added into a refluxing solution of the Pc or Pc
precursor (phthalonitrile) for successful insertion of the metal ion. The industrial manufacture of

6
Pc colorants is based on the methodology developed by Max Wyler at the ICI research center at
Blackley, Manchester.21
The method involves heating inexpensive phthalic anhydride in the
presence of a nitrogen source, such as urea and a catalyst such, as ammonium molybdate to
obtain a Pc macrocycle.
Scheme 1.3: Mechanism of formation of metallo-Pc initiated by alkoxide anion (Y-).
27
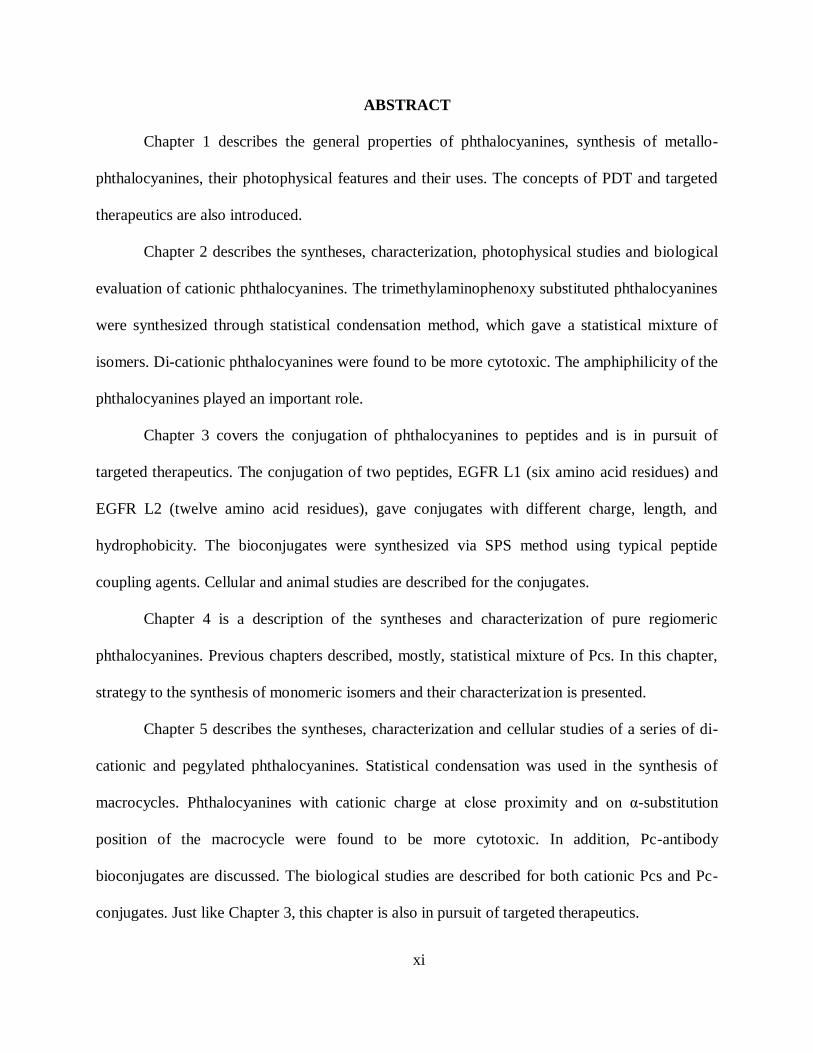
During cyclotetramerization of a 3-substituted phthalonitrile, a mixture of four isomers of
C4h, C2v, Cs and D2h symmetry is obtained (Figure 1.3).21
In this case, due to the close proximity
of the substituent to the core Pc ring, steric bulkiness of the substituents may be exploited to
direct the regioselectivity of the products formed. For example, Pcs with C4h symmetry can be
selectively31
or exclusively32,33
synthesized. The enrichment of the C4h isomer reduces the D2h
isomer.31
Electronic effects may also play a role in the formation of C4h isomer as the sterically
undemanding 3-methoxyphthalonitrile forms this isomer exclusively at room temperature.34
The
7
methoxy group (strong electron donor) may deactivate the ‘ortho’ nitrile towards nucleophilic
attack, leading to ‘meta’ nitrile selectivity.
Figure 1.3: Structures and symmetries of different Pc constitutional isomers resulting from 3-
substituted phthalonitriles.35
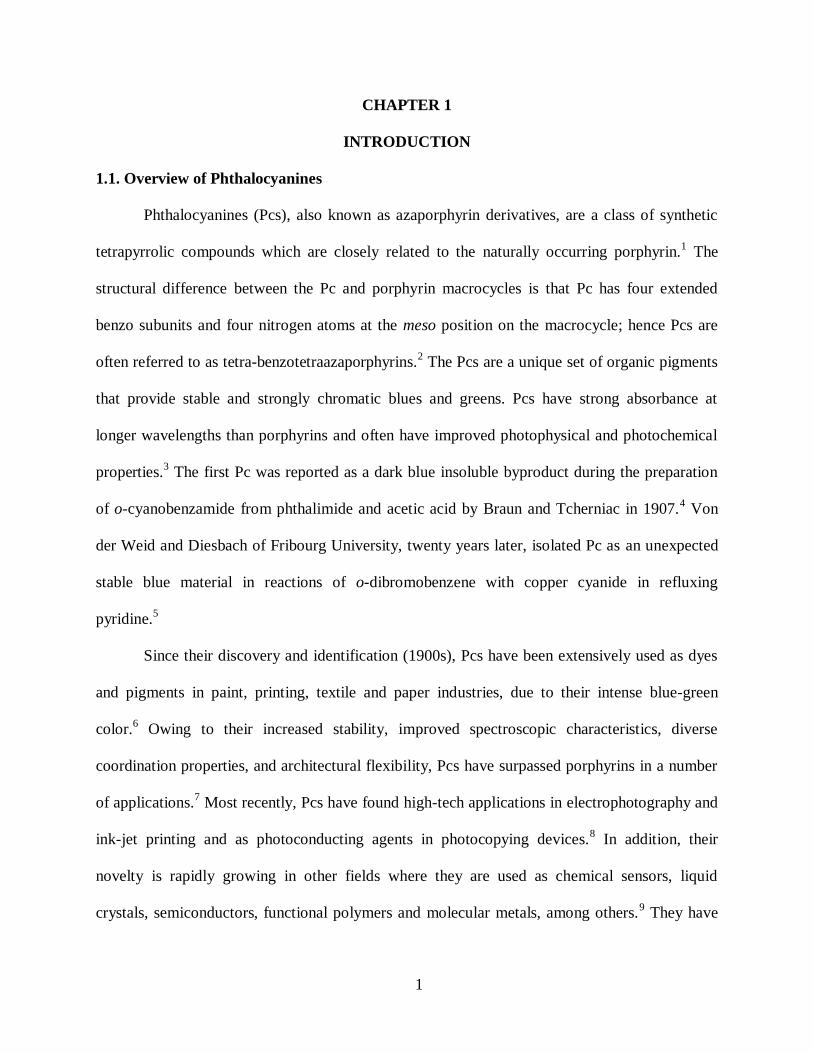
Similarly, statistical condensation of a 4-substituted phthalonitrile can lead to four
constitutional isomers: C4h, C2v, Cs and D2h (Figure 1.4). Modification of the properties of
substituents on the phthalonitrile and optimization of the reaction conditions can improve the
formation of one or two of the major isomers. Unlike the 3-substituted phthalonitriles, there is no
steric influence over the tetramerization reactions. Nonetheless, one case has been reported in
which mild conditions gave a non-statistical mixture of Pc at room temperature;36
the electronic
effect of the electron-rich alkoxy substituent may reduce the reactivity of the ‘para’ nitrile and
not the ‘meta’ nitrile, so that nucleophilic attack takes place regioselectively. The major
challenge in this case is the tedious chromatographic procedures.37-41
Figure 1.4: Structures and symmetries of different Pc constitutional isomers from 4-substituted
phthalonitriles.35

8
Bridged-Pcs or side-strapped Pcs, which may be obtained via bis-phthalonitriles, have
been synthesized previously. Suitable bis(3-phthalonitriles) are prepared from 2,2-dialkyl
propane-1,3-diols or chiral bis-naphthols, although many other bis(3-phthalonitriles) do not form
side-strapped Pcs.42
The synthesis of these Pcs require highly dilute conditions for the
cyclotetramerization of bis(3-phthalonitriles) or bis(4-phthalonitriles). This route results in D2h
symmetry Pcs.42-44
A chiral side-strapped Pc with D2h symmetry has also been synthesized from
bis(4-phthalonitrile) containing flexible linker (Scheme 1.4).45
A recent example is the synthesis
of 1,2-bis(3,4-dicyanophenoxymethyl)benzene from 1,2-bis(hydroxymethyl)benzene and 4-
nitrophthalonitrile.46
Scheme 1.4: Chiral side-strapped Pc with D2h symmetry containing flexible linker.45
Non-peripherally substituted Pcs (with substituents on 1,4,8,11,15,18,22,25 positions)
and peripheral Pcs (with substituents on 2,3,9,10,16,17,23,24 positions) have also been
synthesized from appropriate single precursors. Octa-substituted non-peripheral Pcs are attractive
because the substituents on the ring make them more soluble in organic solvents and the Pcs are
obtained as single isomers.47,48
In addition, alkoxy groups at non-peripheral positions cause a
large bathochromic shift of the Q-band into the IR region (above 750 nm).49,50
The octa-
substituted peripheral Pcs can be obtained by reacting 4,5-di-substituted phthalonitriles. If the
two substituents are identical, then regiomerically pure Pcs are produced. Pre-formed Pc
reactions may also be used to obtain the desired products. For example, aromatic methyl ether

9
cleavage can give octahydroxy-substituted Pcs.51,52
The free hydroxyl groups on Pcs can then
undergo alkylation51
or silylation52
. Other Pcs in which substituents form a bridge between 2:3,
9:10, 16:17, and 23:24 positions have been reported (Figure 1.5).45
Such Pcs form cyclic or
macrocyclic units, with macrocyclic ones acting as ligands for metal cations and may form
multiple metal ion arrays.53
Hexadeca-substituted Pcs (with substituents both at peripheral and
non-peripheral positions) have also been synthesized.48
Others have been synthesized by means
of introducing further functionality by reaction of substituents.54
Figure 1.5: Pc with substituents forming a bridge between 2:3, 9:10, 16:17, and 23:24
positions.45
1.3.2. Synthesis via Tetramerization of Two or More Precursors
The unsubstituted and many of the substituted Pcs reported in literature are symmetrical
compounds. However, the inherent symmetry is a limitation for many purposes.37
The aim of the
synthesis of Pcs with different substituents is to introduce different functional groups, which will
provide coexistent features such as improved solubility and reactivity at the same time.29,55-57
Many of the Pcs resulting from two or more different phthalonitriles is a statistical mixture of
Pcs. However, if the precursors are symmetrical, then product ratios may change significantly.
Various protocols for the tetramerization of two or more phthalonitriles have been
reported in the past. Kobayashi and coworkers, in the late 1980s, developed a method to
synthesize A3B-type Pcs, through ring expansion of a subphthalocyanine in the presence of

10
succinamide or diiminoisoindoline derivatives (Scheme 1.5).35
The ring expansion depends
highly on the reactants’ properties and reaction conditions. The best yield could be achieved
when a metal template is used and by selectively choosing the substituents on the precursors. For
example, subphthalocyanines without substituents or with electron-withdrawing groups, and
diiminoisoindoline derivatives with electron donating groups resulted in better yields.6,58
The
only disadvantage of this approach, in many cases, is the fragmentation of the subphthalocyanine
ring followed by statistical ring closure to form a mixture of all possible Pcs.59,60
Scheme 1.5: Selective synthesis of A3B-type Pc.60
Polymeric support in the synthesis of A3B-type Pcs (Scheme 1.6) was developed by
Leznoff and coworkers in 1982, where a mono-functionalized diiminoisoindoline precursor (B)
bound to solid polymer (P) reacts with another precursor (A).61-63
The soluble A4-type Pc and
unreacted precursor-A are washed off and the desired Pc is cleaved under mild conditions.
However, this is limited to easy on-off properties of the precursor bound to the solid support.
Scheme 1.6: Synthesis of A3B-type Pc on polymer support.61

11
Substituted Pcs (both symmetrical and unsymmetrical) resulting from two or more
phthalonitriles can also be synthesized by statistical condensation of appropriate precursors,
followed by chromatographic separation of the desired products. This may be achieved via
Tomoda synthesis, just as those obtained from single phthalonitriles. This method, by
optimization of reactant ratios and reaction conditions, may yield the desired compound in
reasonable amounts, but still gives six (Figure 1.6) differently substituted Pcs, not including
constitutional isomers.35
Modification of the properties of substituents on the phthalonitriles and
optimization of the reaction conditions can improve the formation of one or two of the major
isomers. The use of one of the phthalonitriles in excess is one such modification that may favor
the formation A3B Pcs. In other cases, half Pcs have been used in the preparation of A2B2 Pcs.64
Nevertheless, separation of constitutional isomers is often difficult, and involves tedious
chromatographic procedures.38-41
Figure 1.6: Six differently substituted Pcs formed during mixed condensation of two
differently substituted precursors, A and B.35
1.4. Photophysical Properties of Phthalocyanines
Photophysical processes are changes in the electronic states of a molecule and can affect
its chemical nature. The energy transfer process, which occurs when light of a specific

12
wavelength is absorbed, may result in a variety of physical changes, but the chemical integrity of
the molecule is retained. The absorbed light excites an electron from a lower (stable state) to a
higher molecular quantum state (unstable with respect to the ground). The simplified Jablonski
diagram (Figure 1.7) represents pathways of losing the energy to return to the ground state.65-67
Absorption occurs from singlet ground state, S0, to a vibrationally excited level of first
singlet excited state, S1, or sometimes to a second electronically excited state, S2. Through
collisions with solvent molecules, vibrational relaxation occurs and the S2-excited molecules
return to the first vibration level of S1, from which there are several possibilities: fluorescence,
phosphorescence or heat generation. Fluorescence is a radiative process, which occurs when S1-
excited molecules lose energy and return to ground state directly. The S1→S0 transition which
leads to fluorescence (F) has a very short time interval (10-8
to 10-5
sec).
Figure 1.7: Jablonski Diagram illustrating electronic states of a molecule and transitions
between the excited states and the ground state.65

13
Phosphorescence process is preceded by internal conversion (IC) and intersystem
crossing (ISC), which are non-radiative processes. Phosphorescence decay is comparable to
fluorescence, except for the electron spin transition into a "forbidden" triplet state (T1) instead of
the lowest singlet excited state. This transition is referred to as intersystem crossing. The decay
from electronic level T1 occurs with lower energy relative to fluorescence. If this transition
occurs within tissues, involved molecules may transfer energy to ground state molecular oxygen
(in triplet state) to generate singlet oxygen, as one of the reactive oxygen species (ROS), that is
capable of initiating oxidation of tissue. The concept of photodynamic therapy (PDT) is founded
on this feature.
1.4.1. Fluorescence Quantum Yield (Фf)
The fluorescence quantum yield (Фf) of a compound is a measure of the efficiency of its
molecules in the fluorescence process. It is the expression of the number of fluorescing
molecules to the number of absorbed photons. It can be determined using a comparative
method,39
and compared with ZnPc as reference in DMF solvent (Фf = 0.17).68-70
Other solvents,
such as DMSO and THF can also be used in fluorescence experiments, depending on the
solubility of the Pcs under study. Fluorescence measurements in this project, gave fluorescence
quantum yields ranging between 0.1 and 0.3 (in DMF solvent), which is in agreement with the
literature for this type of Pc macrocycle.69,70
1.4.2. Singlet Oxygen Quantum Yield (ФΔ)
The singlet oxygen quantum yield is the measure of the efficiency of Pcs in the
generation of singlet oxygen. The singlet oxygen quantum yield, ФΔ, value may be determined
by means of photochemical or photophysical methods. A photochemical method was used in this
study, in which a solution containing oxygen, a Pc and a singlet oxygen scavenger were used. A

14
scavenger is a sensitive compound that reacts quickly with singlet oxygen as soon as it is
produced. The Pc is irradiated with light and the decay of the scavenger is measured
spectroscopically. Some of the scavengers that may be used include guanine, furan and 1,3-
diphenylisobenzofuran (DPBF). In this study, the singlet oxygen quantum yields (Ф∆) were
determined in DMF solvent through a relative method, using ZnPc (Фf = 0.56) as reference and
DPBF as a scavanger.71
1.4.3. UV-vis Absorption Spectra
All monomeric H2Pcs and MPcs exhibit a characteristic UV-vis absorption spectrum,
which includes a Soret-band in the visible region at approximately 350 nm, and a major strong
Q-band in the near-IR region (670 – 750 nm), as shown in Figure 1.8.72
The Pcs with four
substituents at the α-position usually exhibit a bathochromic shift in their UV-vis absorption
spectra.73
They exhibit approximately a 15 nm red-shift of their Q-bands, and 20 nm red-shift of
their Soret-bands compared with the mono-substituted Pcs. Even within mono-substituted Pcs,
those which have the substituent at α-position, show approximately 3 nm red-shift in their Soret-
bands, and approximately 3 nm hypsochromic shift in their Q-bands compared with β-substituted
Pcs. This shows that both the number and the position of the substituents on the macrocycle
affect the absorption spectra of Pcs.
In addition, for the Pcs exhibiting narrow and intense Q-bands, and follow Beer-Lambert
law for both the Q-band and Soret-band in the concentration range 10-6
- 10-4
mol/L, it is usually
believed that no aggregation has occurred within this range.74
The typical molar extinction
coefficient of the Q-band of a Pc is in ca. 105 M
-1cm
-1. In this work, similar features were
observed, in addition to the Stokes Shifts in the range 2 – 10 nm, which is in agreement with
those reported in the literature.75,76

15
Figure 1.8: A typical absorption spectrum of a ZnPc in HPLC grade DMF solvent.
1.5. Applications of Phthalocyanine
Since their discovery and identification, Pcs have been extensively used as dyes and
pigments in paint, printing, textile and paper industries due to their intense blue-green
color.72,77,78
Most recently, Pcs have found high-tech applications in electrophotography and ink-
jet printing and as photoconducting agents in photocopying devices.29
In addition, their novelty
is rapidly growing in other fields where they are used as chemical sensors,79
liquid crystals,80
semiconductors,79,81
functional polymers,82
and molecular metals,83
among others.
1.5.1. Applications in Photodynamic Therapy
Pcs have also found use in the field of PDT, a therapeutic modality in which a dye used
as a photosensitizer is administered to the patient. Following a time interval during which the dye
localizes in the diseased tissue, the latter is exposed to light of appropriate wavelength and
destroyed. The destruction of the tissues is caused by the excitation of the dye in the presence of
oxygen molecules, which produces reactive oxygen species (ROS) (Figure 1.9).84-86

16
Figure 1.9: Treatment of cancer using PDT.86
In 1995, FDA approved Photofrin®, a porphyrin derivative, as a PDT photosensitizer.
However, it has synthetic reproducibility problems, long half-life in patients and low selectivity
for tumors.87,88
Therefore, benzoporphyrin derivatives, chlorins, purpurins and Pcs have emerged
as second generation photosensitizers, with Pcs having the most promising PDT applications in
the treatment of cancer due to their strong absorptions at wavelengths > 660 nm and generally
low dark toxicity and high stability.
Pcs have been used in photobiology and PDT since 1985,89
with derivatives such as ZnPc
(CGP55847), AlPcS4 (Photosense®) and Pc4 currently being used in clinical trials.88,90,91
The di-
substituted silicon-Pc, Pc4, with an axial alkylsilyl ligand bearing a terminal amine (Figure 1.10)
is in Phase I clinical trials for cancer treatment.92
Figure 1.10: Molecular structures of current Pcs under clinical investigation for PDT.
17
An ideal photosensitizer should be chemically pure and maintain a stable composition
throughout the treatment. It should have preference for tumor cells. Its dark toxicity should be
minimal but should have high phototoxicity. It should have a high 1O2 quantum yield and a large
absorption coefficient in the range 600 – 800 nm wavelength. It is also important that the
photosensitizer is rapidly cleared from the normal cells after treatment. The drugs should be
amphiphilic.10,12,88
Various hydrophilic groups such as carboxylic acids, phosphonic acid,
sulfonic acid, hydroxyl and quaternary ammonium salts have been added to the hydrophobic Pc
ring to achieve this.
In addition, cell-targeted therapeutics has received significant attention and seems to
define the future of PDT of cancers. Sibrian-Vasquez et al. recently reported the synthesis
and biological evaluation of cancer cell-targeted Pc-peptide conjugates with high
phototoxicity towards human carcinoma HEp2 cells.93
Positively charged macrocycles have
also demonstrated a potential to interact with negatively charged tumor cell plasma
membranes and bacterial surfaces, thus enhancing their cellular targeting ability.94,95
Cationic
PS have been observed to localize subcellularly within the mitochondria,96,97
lysosomes,98,76
ER9 and nuclei.
99 They also bind to anionic DNA and RNA,
100,101 which can enhance their
overall PDT efficacy. In Chapters 2 and 5, the syntheses of cationic Pcs as potential
candidates for PDT is described.
1.5.2. Applications in Bioimaging
Pcs have also been used as colorants or dyes.29,72,78
Nevertheless, till recently, not many
Pcs have been reported as fluorescent agents, appropriate for bioconjugation applications.102
Most Pcs are hydrophobic, and are inclined to aggregate in aqueous medium, or they do not have
a reactive group for bioconjugation purposes. La Jolla Blue (Figure 1.11) was the first

18
commercially available Pc dye. It has two axial polyethylene glycol moieties and two free
carboxylic acids for bioconjugation.103
The axial glycol moieties make the dye water soluble and
therefore, attractive as a biomarker. Different biomolecules such as peptides and proteins can
bind to Pc dyes; the dyes are, therefore, applied in bioimaging and bioanalytical fields.104-107
Another group of MPcs, which was synthesized by Renzoni, et al.,108
lacks the water soluble
axial groups described in La Jolla blue, but contains both water soluble groups and another
reactive group that is bound to the benzo-ring (Figure 1.11). The copper in this structure may
also be replaced by another metal, such as silicon, which will allow it to bear two axial ligands.
Figure 1.11: Structure of a) La Jolla Blue dyeTM 109
and b) Copper sulfophthalocyanine dye.108
The conjugation of Pcs with peptide ligands or antibodies directed at specific receptors
over-expressed in cancer cells, such as the human epidermal growth factor receptor (EGFR), is a
remarkable strategy for increasing their biological efficacy.110-114
EGFR is over-expressed in
various cancers, including small cancers (< 5 mm) and the flat, dysplastic and aberrant crypt foci,

19
which are believed to precede the development of cancer.115-117
In the development of selective
delivery of cytotoxic drugs to the tumor sites,118-124
two small peptides with sequences
LARLLT123
and YHWYGYTPQNVI124
have proved attractive due to their ready-availability,
low immunogenicity, ease of conjugation to other molecules, and a relatively superior EGFR-
targeting ability. Pcs conjugated to peptides via various linkers for colorectal cancer (CRC)
diagnostic applications have been evaluated in vitro and in vivo.125
Chapters 3 and 5 of this work
reports the syntheses, photophysical, and biological evaluation of Pc conjugates to either peptide
ligands or a monoclonal antibody, which can serve as bioimaging agents.
Polyethylene glycols (PEG) have been used as delivery vehicles126,127
and, in other cases,
may be covalently-bound128,129
to Pcs for improved delivery to target tissues. Pegylation of
photosensitizers increases their water-solubility, serum life, tumor accumulation, and also
reduces their uptake by the reticuloendothelial system.130,131
Investigations were carried out to
identify potential ZnPcs that may serve as photosensitizers with enhanced biological
effectiveness. In Chapter 4, the syntheses, characterization and biological evaluation of a new
series of regiomerically pure Pcs, containing at least a PEG group are described.
1.6. References
1. Allen, C. M.; Langlois, R.; Sharman, W. M.; La Madeleine, C.; van Lier, J. E.
Photochem. Photobiol. 2002, 76 (2), 208-216.
2. Dent, C. E.; Linstead, R. P.; Lowe, A. R. J. Chem. Soc., 1934, 1033-1039.
3. Leznoff, C.C.; Lever, A.B.P., Eds., Phthalocyanines: Properties and Applications, VCH
Publishing, New York 1996.
4. Byrne, G. T.; Linstead, R. P.; Lowe, A. R. J. Chem. Soc. (Resumed) 1934, 1017-1022.
5. de Diesbach, H.; von der Weid, E. Helv. Chim. Acta 1927, 10 (1), 886-888.
6. Sharman, W. M.; van Lier, J. E. Bioconj. Chem. 2005, 16 (5), 1166-1175.
7. Gelir, A.; Yılmaz, İ.; Yılmaz, Y. J. Phys. Chem. B 2006, 111 (2), 478-484.
20
8. Gregory, P. J. Porphyr. Phthalocyan. 2000, 4 (4), 432-437.
9. Şen, Z.; Gümüş, G.; Gürol, I.; Musluoğlu, E.; Öztürk, Z. Z. Sensors and Actuators B:
Chemical 2011, 160 (1), 1203-1209.
10. Sharman, W. M.; Allen, C. M.; van Lier, J. E. Drug Discovery Today 1999, 4 (11), 507-
517
11. Castano, A. P.; Demidova, T. N.; Hamblin, M. R. Photodiagnosis and Photodynamic
Therapy 2004, 1 (4), 279-293.
12. Macdonald, I. J.; Dougherty, T. J. J. Porphyr. Phthalocyan. 2001, 5 (2), 105-129.
13. Boyle, R. W.; Dolphin, D. Photochem. Photobiol. 1996, 64 (3), 469-485.
14. Selbo, P. K.; Weyergang, A.; Eng, M. S.; Bostad, M.; Mælandsmo, G. M.; Høgset, A.;
Berg, K. Journal of Controlled Release 2012, 159 (2), 197-203.
15. Dumoulin, F.; Durmuş, M.; Ahsen, V.; Nyokong, T. Coordination Chemistry Reviews
2010, 254 (23–24), 2792-2847.
16. Booysen, I.; Matemadombo, F.; Durmus, M.; Nyokong, T. Dyes Pigm. 2011, 89, 111-
119.
17. Masilela, N.; Nyokong, T. Dyes Pigm. 2010, 84, 242-248.
18. Nombona, N.; Nyokong, T. Dyes Pigm. 2009, 80, 130-135.
19. Modibane, D. K.; Nyokong, T. Polyhedron 2009, 28, 1475-1480.
20. Causey, P. W.; Dubovyk, I.; Leznoff, C. C. Can. J. Chem. 2006, 84 (10), 1380-1387.
21. Mckeown, N. B. The Porphyrin Handbook (Kadish, K. M.; Smith, K. M.; Guilard, R.,
Eds.), Academic Press: Boston 2003, 15, 61-124.
22. Yiru, P.; Fenghua, H.; Zhipeng, L.; Naisheng, C.; Jinling, H.; Inorg. Chem. Commum.
2004, 7, 967-970.
23. Bezerin, B.D. Coordination Compounds of Porphyrins and Phthalocyanines, Wiley, J. &
Sons, New York, NY, 1981.
24. Barrett, P. A.; Linstead, R. P.; Tuey, G. A. P. J. Chem. Soc. 1939, 1809-1820.
25. Tomoda, H.; Saito, S.; Ogawa, S.; Shiraishi, S. Chem. Lett. 1980, 1277-1280.
26. Tomoda, H.; Saito, S.; Shiraishi, S. Chem. Lett. 1983, 313-316.
27. Christie, R. M.; Deans, D. D. J. Chem. Soc., Perkins Trans. 1989, 2, 193-198.
28. Hurley, T. J.; Robinson, M.A.; Trotz, S, I. Inorg. Chem. 1967, 6, 389-392.
21
29. Leznoff, C. C. Phthalocyanines: Properties and Applications. Leznoff, C. C.; Lever, A.
B. P. Eds.; VCH Publishers (LSK) Ltd.: Cambridge 1989, 1, 1-54.
30. Britton, J.; Litwinski, C.; Durmuş, M.; Chauke, V.; Nyokong, T. J. Porphyr.
Phthalocyanines 2011, 15 (11,12), 1239-1249.
31. Hanack, M.; Schmid, G.; Sommerauer, M. Angew. Chem. 1993, 105, 1540; Angew.
Chem. Int. Ed. Engl. 1993, 32, 1422.
32. Leznoff, C. C.; Hu, M.; McArthur, C. R.; Qin, Y.; van Lier, J. Can. J. Chem. 1994, 72,
1990-1998.
33. Hu, M.; Brasseur, N.; Yildiz, S. Z.; van Lier, J. E.; Leznoff, C. C. J. Med. Chem. 1998,
41, 1789-1802.
34. Leznoff, C. C.; Hu, M. G.; Nolan, K. J. M. J. Chem. Soc., Chem. Commun. 1996, 1245-
1246.
35. Sharmam, W. M.; Van Lier, J. E. The Porphyrin Handbook (Kadish, K. M.; Smith, K. M.;
Guilard, R., Eds.), Academic Press: Boston 2003, 15, 1-60.
36. Leznoff, C. C.; D’Ascanio, A. M.; Yildiz, S. Z. J. Porphyr. Phthalocyan. 2000, 4 (1),
103-111.
37. Rodriguez-Morgade, M. S.; de la Torre, G.; Torres, T. The Porphyrin Handbook (Kadish,
K. M.; Smith, K. M.; Guilard, R., Eds.), Academic Press: Boston 2003, 15, 125-160.
38. Giuntini, F.; Nistri, D.; Chiti, G.; Fantetti, L.; Jori, G.; Roncucci, G. Tetra. Lett. 2003, 44,
515-517.
39. Brykina, G. D.; Uvarova, M. I.; Koval, Y. N.; Shpigun, O. A. J. Anal. Chem. 2001, 56,
940-944.
40. Uvarova, M. I.; Brykina, G. D.; Shpigun, O. A. J. Anal. Chem. 2000, 55, 910-925.
41. Wang, J.; Liu, H.; Xue, J. P.; Jiang, Z.; Chen, N. S.; Huang, J. L. Chinese Sci. Bull. 2008,
53, 1657-1664.
42. Leznoff, C. C.; Drew, D. M. Can J. Chem. 1996, 74, 307-318.
43. Drew, D. M.; Leznoff, C. C. Synlett. 1994, 623-624.
44. Kobayashi, N. J. Chem. Soc., Chem. Commun. 1998, 487.
45. Kobayashi, N.; Kobayashi, Y; Osa, T. J. Am. Chem. Soc. 1993, 115, 10994-10995.
46. Tolbin, A. Y.; Ivanov, A. V.; Tomilova, L. G.; Sefirov, N. S. Mendeleev Commun. 2002,
3, 96-97.
47. Mckeown, N. B.; Chambrier, I.; Cook, M. J. J. Chem. Soc., Perkin Trans. 1 1990, 1169-
1177.

22
48. Cook, M. J.; Dunn, A. J.; Howe, S. D.; Thomson, A. J.; Harrison, K. J. J. Chem. Soc.,
Perkin Trans. 1 1988, 2453-2458.
49. Cook, M. J.; Daniel, M. F.; Harrison, K. J.; Mckeown, N. B.; Thomson, A. J. J. Chem.
Soc., Chem. Commun. 1 1987, 1086-1088.
50. Kobayashi, N.; Sasaki, N.; Higashi, Y.; Ossa, T. Inorg. Chem. 1995, 34, 1636-1637.
51. Ruf, M.; Lawrence, A. M.; Noll, B. C.; Pierpont, C. G. Inorg. Chem. 1998, 37, 1992-
1999.
52. van der Pol, J. F.; Neeleman, E.; van Miltenburg, J. C.; Zwikker, J. W.; Nolte, R. J. M.;
Drenth, W. Macromolecules 1990, 23, 155-162.
53. Toupance, T.; Ahsen, V.; Simon, J. J. Am. Chem. Soc., Commun. 1994, 116, 5352-5361.
54. Kobayashi, N.; Sudo, K.; Osa, T. Bull. Chem. Soc. Jpn 1990, 63, 571.
55. Fernandez-Lazaro, F.; Maya, E. M.; Nicolau, M.; Torres, T. Advances in Porphrin
Chemistry. Golubtchikov, O. A., Ed.; ISUCT Press: St. Petersburg 1999, 279-299.
56. Torres, T. J. Porphyrins Phthalocyanines 2000, 4, 325-330.
57. de la Torre, G.; Claessens, C. g.; Torres, T. Eur. J. Org. Chem. 2000, 2821-2830.
58. Weitemeyer, A.; Kliesch, H.; Wohrle, D. J. Org. Chem. 1995, 60, 4900-4904.
59. Sastre, A.; delRey, B.; Torres, T. J. Org. Chem. 1996, 61, 8591-8597.
60. Sastre, A.; Torres, T.; Hanack, M. Tetra. Lett. 1995, 36, 8501-8504.
61. Leznoff, C. C. Can. J. Chem. 2000, 78, 167-183.
62. Hall, T. W.; Greenberg, S.; McArthur, C. R.; Khouw, B.; Leznoff, C. C. J. Chem. 1982,
6, 653-658.
63. Leznoff, C. C.; Hall, T. W. Tetra. Lett. 1982, 23, 3023-3026.
64. Oliver, S. W.; Smith, T. D. J.Chem. Soc., Perkin Trans. II 1987, (11), 1579-1582.
65. Jablonski, A. Z. Phys. (Zeitschrift für Physik A Hadrons and Nuclei) 1935, 94 (1), 38-48.
66. Atkins, P. W. Physical Chemistry (Atkins, P. W., 6th Eds) Oxford: Oxford University
Press 1998, 17.
67. Ishii, K.; Kobayashi, N. The Porphyrin handbook (Guilard, R.; Smith, K. M., Eds.) New
York: Elsevier Science 2003, 16, 102.
68. Zorlu, Y.; Dumoulin, F.; Durmus, M. Ahsen, V. Tetrahedron 2010, 66, 3248–3258.
69. Saka, E. T.; Durmus, M.; Kantekin, H. J. Organomet. Chem. 2011, 696, 913–924.
70. Fery-Forgues, S.; Lavabre, D. J. Chem. Educ. 1999, 76, 1260–1264.
23
71. Maree, M. D.; Kuznetsova, N.; Nyokong, T. J. Photochem. Photobiol. A. 2001, 140, 117–
125.
72. Robertson, J. M. J. Chem. Soc. 1936, 1195-1209.
73. Li, Y.; Pritchett, T. M.; Huang, J.; Ke, M.; Shao, P.; Sun, W. J. Phys. Chem. A. 2008, 112
(31), 7200-7207.
74. Stillman, M. J.; Nyokong, T. The Porphyrin handbook (Leznoff, C. C., Lever, A. B. P.,
Eds.) VCH: New York 1989, 1, 139-247.
75. Li, H.; Jensen, T. J.; Fronczek, F. R.; Vicente, M. G. H. J. Med. Chem. 2008, 51 (3), 502-
511.
76. Jiang, X.-J.; Yeung, S.-L.; Lo, P.-C.; Fong, W.-P.; Ng, D. K. P. J. Med. Chem. 2010, 54
(1), 320-330.
77. Robertson, J. M.; Woodward, I. J. Chem. Soc. 1937, 219-230.
78. Robertson, J. M.; Woodward, I. J. Chem. Soc. 1940, 36-48.
79. Guillaud, G.; Simon, J.; Germain, J. P. Coord. Chem. Rev. 1998, 178-180, 1433-1484.
80. Mckeown, N. B. Chem. & Industry 1999, 92-98.
81. Zhou, R; Josse, F.; Gopel, W.; Oztuk, Z. Z.; Bekaroglu, ӧ. Appl. Organomet. Chem.
1996, 10, 557-577.
82. Mckeown, N. B. J. Mater. Chem. 1999, 10, 1979-1995.
83. Achar, B. N.; Jayasree, P. K. Can. J. Chem. 1999, 77, 1690-1696.
84. Henderson, B. W.; Dougherty, T. J. Photochem. Photobiol. 1992, 55 (1), 145-157.
85. Dolmans, D. E. J. G. J.; Ananth, K.; John, S. H.; Kevin, R. F.; Joseph, N. G.; Jeffrey, P.
W.; Inne, H. M. B. R.; Rakesh, K. J.; Dai, F. Cancer Research 2002, 62, 4289–4294.
86. Josefsen, L. B.; Boyle, R. W. Metal-Based Drugs 2008, 1 - 24.
87. Berg, K.; Selbo, P. K.; Weyergang, A.; Dietze, A.; Prasmickaite, L.; Bonsted, A.;
Engesaeter, B. O.; Angell-Petersen, E.; Warloe, T.; Frandsen, N.; Hogset, A. J. Microsc.
2005, 218, 133 – 147.
88. Allison, R. R.; Downie, G. H.; Cuenca, R.; Hu, X. H.; Childs, C. J.; Sibata, C. H.
Photodiag. Photodyn. Ther. 2004, 1, 27 – 42.
89. Ben-Hur, E.; Rosenthal, I. Int. J. Radiat. Biol. 1985, 47, 145-147.
90. Huang, Z. Tech. Res. Treat. 2005, 4, 283 – 293.
91. Detty, M. R.; Gibson, S. L.; Wagner, S. J. J. Med. Chem. 2004, 47, 3897 – 3915.

24
92. Baron, E. D.; Malbasa, C. L.; Santo-Domingo, D.; Fu, P.; Miller, J. D.; Hanneman, K. K.;
Hsia, A. H.; Oleinick, N. L.; Colussi, V. C.; Cooper, K. D. Lasers in Surgery and
Medicine 2010, 42 (10), 728-735.
93. Sibrian-Vazquez, M.; Ortiz, J.; Nesterova, I. V.; Fernandez-Lazaro, F.; Sastre-Santos, A.;
Soper, S. A.; Vicente, M. G. H. Bioconjugate Chem. 2007, 18, 410 – 420.
94. Reddi, E.; Ceccon, M.; Valduga, G.; Jori, G.; Bommer, J. C.; Elisei, F.; Latterini, L.;
Mazzucato, U. Photochem. Photobiol. 2002, 75, 462-470.
95. Sol, V.; Branland, P.; Chaleix, V.; Granet, R.; Guilloton, M.; Lamarche, F.; Verneuil, B.;
Krausz, P. Bioorg. Med. Chem. Lett. 2004, 14, 4207-4211.
96. Jensen, T. J.; Vicente, M. G. H.; Luguya, R.; Norton, J.; Fronczek, F. R.; Smith, K. M. J.
Photochem. Photobiol. B: Biol. 2010, 100, 100-111.
97. Duan, W. B.; Lo, P. C.; Duan, L.; Fong, W. P.; Ng, D. K. P. Bioorg. Med. Chem. 2010,
18, 2672-2677.
98. Ricchelli, F.; Franchi, L.; Miotto, G.; Borsetto, L.; Gobbo, S.; Nikolov, P.; Bommer, J. C.
Reddi, E. Int. J. Biochem. Cell Biol. 2005, 37, 306-319.
99. Villanueva, A. J. Photochem. Photobiol. B: Biol. 1993, 18, 295-298.
100. Caminos, D. A.; Durantini, E. N. J. Photochem. Photobiol. A: Chem. 2008, 198, 274-281.
101. Fu, B. Q.; Zhang, D.; Weng, X. C.; Zhang, M.; Ma, H.; Ma, Y. Z.; Zhou, X. Chem. Eur.
J. 2008, 14, 9431-9441.
102. Luo, S.; Zhang, E.; Su, Y.; Cheng, T.; Shi, C. Biomaterials 2011, 32 (29), 7127-7138.
103. Devlin, R. F.; Dandliker, W. B.; Arrhenius, P. O. G. U.S. Patent 6,060,598, 2000.
104. Li, X. Y.; Ng, D. K. P. Tetra. Lett. 2001, 42, 305-309.
105. Hammer, R. P.; Owens, C. V.; Hwang, S. H.; Sayes, C. M.; Soper, S. A. Bioconj. Chem.
2002, 13, 1244-1252.
106. Ogunsipe, A.; Nyokong, T. J. Porphyr. Phthalocyanines 2005, 9, 121-129.
107. Walker, G. T.; Nadeau, J. G.; Linn, C. P.; Devlin, R. F.; Dandliker, W. B. Clin. Chem.
1996, 42, 9-13.
108. Schindele, D. C.; Pepich, B. V.; Renzoni, G. E.; Fearon, K. L.; Andersen, N. H.; Stanton,
T. H. U.S. Patent 5,494,793, 1996.
109. Devlin, R.; Studholme, R. M.; Dandliker, W. B.; Fahy, E.; Blumeyer, K.; Ghosh, S. S.
Clin. Chem. 1993, 39, 1939-1943.
110. Sharman, W. M.; van Lier, J. E.; Allen, C. M. Adv. Drug Delivery Rev. 2004, 56, 53-76
25
111. Savellano, M. D.; Hasan, T. Clin. Cancer Res. 2005, 11, 1658-1668
112. Hudson, R.; Boyle, R. W. J. Porphyrins Phthalocyanines 2004, 8, 954-975.
113. Pérez-Soler, R. HER1/EGFR The Oncologist 2004, 9, 58-67.
114. Meric-Bernstam, F.; Hung, M.-C. Clin. Cancer Res. 2006, 12, 6326-6330.
115. Spano, J.–P.; Lagorce, C.; Atlan, D.; Milano, G.; Domont, J.; Bnamouzig, R.; Attar, A.;
Benichou, J.; Martin, A.; Morere, J. –F.; Raphael, M.; Penault-Llorca, F.; Breau, J.–L.;
Fagard, R.; Khayat, D.; Wind, P. Ann. of Oncol. 2005, 16, 102-108.
116. Galizia, G.; Iieto, E.; Ferraraccio, F.; De Vita, F.; Castellano, P.; Orditura, M.;
Imperatore, V.; La Mura, A.; La Manna, G.; Pinto, M.; Catalano, G.; Pignatelli, C.;
Ciardiello, F. Ann. of Surg. Oncol. 2006, 13, 823-835.
117. Dougherty, U.; Sehdev, A.; Cerda, S.; Mustafi, R.; Little, N.; Yuan, W.; Jagadeeswaran,
S.; Chumsangsri, A.; Delgado, J.; Tretiakova, M.; Joseph, L.; Hart, J.; Cohen, E. E.;
Aluri, L.; Fichera, A.; Bissonnette, M. Clin. Cancer Res. 2008, 14, 2253-2262.
118. Loeffler-Ragg, J.; Schwentner, I.; Sprinzl, G. M.; Zwierzina, H. Expert Opin. Investig.
Drugs 2008, 17, 1517-1531.
119. Molema, G. Acta Biochim. Polonica 2005, 52, 301-310.
120. Dane, K. Y.; Chan, L. A.; Rice, J. J.; Daugherty, P. S. J. Immun. Meth. 2006, 309, 120-
129.
121. Frochot, C.; Stasio, B. D.; Vanderesse, R.; Belgy, M.-J.; Dodeller, M.; Guillemin, F.;
Viriot, M.-L.; Barberi-Heyob, M. Bioorganic Chem. 2007, 35, 205-220.
122. Song, S. X.; Liu, D.; Peng, J. L.; Sun, Y.; Li, Z. H.; Gu, J. R.; Xu, Y. H. Int. J. Pharmac.
2008, 363, 155-161.
123. Song, S.; Liu, D.; Peng, J.; Deng, H.; Guo, Y.; Xu, L. X.; Miller, A. D.; Xu, Y. FASEB J.
2009, 23, 1396-1404.
124. Li, Z.; Zhao, R.; Wu, X.; Sun, Y.; Yao, M.; Li, J.; Xu, Y.; Gu, J. FASEB J. 2005, 19,
1978-1985.
125. Ongarora, B. G.; Fontenot, K. R.; Hu, X.; Sehgal, I.; Satyanarayana-Jois, S. D.; Vicente,
d. G. H. J. Med. Chem. 2012, 55 (8), 3725-3738.
126. Arnida; Nishiyama, N.; Kanayama, N.; Jang, W-D.; Yamasaki, Y.; Kataoka, K. J.
Controlled Release 2006, 115, 2, 208-215.
127. Suzuki, T.; Oishi, M.; Nagasaki, Y. J. Photopoyml. Sci. and Technol. 2009, 22, 4, 547-
550.
128. Bai, M.; Lo, P-C.; Ye, J.; Wu, C.; Fong, W-P.; Ng Dennis, K. P. Org. & Biomol.
Chem. 2011, 9, 20, 7028-7032.

26
129. Li, H.; Fronczek, F. R.; Vicente, M. G. H. Tetra. Lett. 2011, 52, 6675-6678.
130. Fang, J.; Sawa, T.; Akaike, T.; Greish, K.; Maeda, H. Int. J. Cancer. 2004, 109, 1-8.
131. Ichikawa, K.; Hikita, T.; Maeda, N.; Takeuchi, Y.; Namba, Y.; Oku, N. Biol. Pharm.
Bull. 2004, 27, 443-444.

27
CHAPTER 2
SYNTHESES AND BIOLOGICAL EVALUATION OF CATIONIC
TRIMETHYLAMINOPHENOXY-SUBSTITUTED ZINC(II)-PHTHALOCYANINES
2.1. Background
Photofrin was the first PDT drug approved for the treatment of thousands of
patients worldwide since 1995. Nonetheless, it has some shortcomings ranging from being
a complex mixture of compounds to having a limited tissue selectivity and absorbing only
weakly in the red region of the spectrum (λmax = 630 nm),1 where light penetrates deeper
into tissues.2,3
Therefore, intense research in the last 20 years, has focused on the
developing PS with improved tumor-tissue selectivity and overall PDT efficiency. Pcs are
predominantly promising PS owing to their long wavelength absorptions in the infra-red
region of the spectrum (670 – 750 nm) with high extinction coefficients, high
photochemical stability and superior ability to generate singlet oxygen.4-7
The major
challenge in the use of the Pcs is the insolubility of the macrocycle in common organic
solvents.
Different water-solubilizing and/or bulky groups have been attached to either the
macrocycle periphery of Pcs or their central core, in order to improve their photophysical
features such as their quantum yields and biological interactions or photodynamic
efficacy.7 Of all the substituted Pcs, positively charged ones have received special
attention due to their strong interactions with negatively charged tumor cell plasma
membranes, thus enhancing their cellular targeting ability.8-11
Equally, cationic PS have
been observed to target vulnerable subcellular units such as the mitochondria,12-16
This chapter originally appeared in the Journal of MedChemComm.17
Reproduced with
permission of The Royal Society of Chemistry.

28
lysosomes,12,18,19
ER14,15
and nuclei.20
The photosensitizers can bind to anionic DNA and
RNA,21-24
therefore, largely boosting their PDT efficacy.
Substantial variations in the cytotoxicity, cellular uptake and photodynamic
capability of a series of porphyrins with similar cationic groups (-N(CH3)3+) have been
reported recently.15
The features of a series of octa-cationic pyridyloxy-Pcs bearing
different metal ions and axial ligands in human HEp2 cells have also been reported
before.19
In addition, a Pc bearing a single quaternary ammonium group (-NH3+) was
found to be ~20-fold more phototoxic than its corresponding tetra-ammonium Pc toward
HEp2 cells.25
Although all the cationic porphyrins in this series targeted cell mitochondria,
the mono-cationic was the most phototoxic, while the di-cationic accumulated the most
within HEp2 cells.
In this chapter, the synthesis of cationic Pcs which will add to the library of
photosensitizers with a potential to act as biomarkers or photosensitizing agents is reported.
Lowery reported a simple synthesis of silicon-dichlorophthalocyanine in 1965.26
He used
diiminoisoindoline as a starting material, which was reacted with silicon tetrachloride to
obtain 71% yield of the silicon Pc. A similar synthesis has been reported by Li, H. et al.19
A
direct way of synthesizing ZnPcs has also been reported, where zinc acetate acts as the source
of metal.16,19
The starting phthalonitrile was refluxed in n-pentanol using a small amount of
DBU as a catalyst to obtain 88% yield.
Throughout this chapter, statistical condensation of phthalonitriles to Pcs is the main
method of synthesis. Phthalonitriles were refluxed in DMAE using catalytic amounts of DBN
to obtain Pcs in reasonable yields. This method of synthesis is known as ‘Tomoda method’
and was discussed in chapter one. Apart from the octaamino-Pc, which was obtained as a pure

29
regiomeric Pc, all the other Pcs were mixtures of isomers. The cationic Pcs were achieved via
trimethylation of the 4-aminophenoxy-substituents on the Pc core. In general, the mono-, di-,
tetra- and octa-amino Pcs were synthesized and then trimethylated them to obtain
corresponding positively charged analogues. As part of the continued investigation of cationic
Pcs as potential photosensitizers, the quaternized Pcs were evaluated in vitro and the
preliminary results are described.
2.2. Synthesis
2.2.1. Synthesis of Phthalonitriles
The phthalonitriles used in the synthesis of Pcs were prepared according to the
procedures established in literature, with slight modifications.14,19
The mono-, di-, tetra- and
octa-cationic Pcs 2.5, 2.7, 2.12, 2.14, 2.16, 2.20, 2.22, 2.25 and 2.27 were synthesized
according to strategies shown in Schemes 2.1 – 2.5. The key precursors: 3(4)-(p-N-Boc-
aminophenoxy)phthalonitrile 2.3 and 2.10 (Scheme 2.1 and 2.2) and 4,5-di(p-N-Boc-
aminophenoxy)phthalonitrile 2.10 (Scheme 2.3) were all obtained in >80% yields from
commercially accessible 3-nitrophthalonitrile and 4-nitrophthalonitrile, or 4,5-
dichlorophthalonitrile and p-N-Boc-aminophenol in DMF at 80 ºC, in the presence of K2CO3,
following known methodology.27,28
Another important precursor 2,2-bis(2,3-dicyanophenoxy)
biphenyl 2.23 (Scheme 2.4 and 2.5), was obtained in 66% yield according to a known
literature procedure.29
The use of unprotected p-aminophenol in these reactions, gave lower
yields (60 – 70%) of the corresponding aminophenoxyphthalonitriles. This is due to the fact
that the unprotected amino groups are more polar and thus, the Pcs got stuck in the column.
The aminophenoxyphthalonitriles 2.2 and 2.9 were synthesized using unprotected p-

30
aminophenol, which was reacted with either 3-nitrophthalonitrile or 4-nitrophthalonitrile to
obtain the desire precursors.
These phthalonitriles, alongside commercially accessible 4-tert-butylphthalonitrile,
were used in the synthesis of cationic Pcs. The synthesis of mixture of isomers of Pcs, via
statistical condensation, was accomplished using 4-tert-butylphthalonitrile or 2,2-bis(2,3-
dicyanophenoxy) biphenyl 2.23. In order to enhance the solubility of Pcs – which are
infamous for their insolubility – 4-tert-butylphthalonitrile was used. The bulky tert-butyl
groups on the Pc macrocycle, boosts the hydrophilicity and decrease the aggregation affinity
of the Pc core. Notably, reduced aggregation may improve the uptake of the Pcs by the cells,
causing higher photodynamic activities.30
The molecular structures of four phthalonitriles crystals, which were grown from
dichloromethane for X-ray analyses, are shown in Figure 2.1. The dicyanophenyl group in
phthalonitrile 2.3 was essentially orthogonal to the central phenyl group and formed a dihedral
angle of 89.83(3)º with it. Its CO2N plane was tilted considerably less from the central ring
and formed a dihedral angle of 28.47(6)º with it. In phthalonitrile 2.10, the conformation was
similar, with the dicyanophenyl and central phenyl rings formed a dihedral angle of 86.23(4)º.
Its CO2N plane was almost coplanar with the central phenyl and had a dihedral angle 3(1)º.
The dicyanophenyl plane was nearly orthogonal to both phenyl rings connected to it through
O in phthalonitrile 2.18, with the dihedral angles being 79.22(2)º and 85.25(2)º. The tips of
the two CO2N planes out of the phenyl groups to which they were bonded were midway
between those seen in 2.3 and 2.10; 14.7(1)º and 14.9(1)º for this phthalonitrile. The tips of
the carbonyl O were in opposite directions in 2.18; one toward the Ph (CN)2 and the other
away from it. The central diphenyl group in diphthalonitrile 2.23 had a torsion angle of

31
74.5(4)º about the bond connecting the two rings. Its dicyanophenyl groups were tilted by
comparable amounts out of the phenyl groups they are bonded to, and formed dihedral angles
of 70.68(7)º and 67.60(7)º with them. The dicyanophenyl groups formed a dihedral angle of
7.7(4)º and the molecule had nearly a C2 symmetry.
2.3
2.10
2.9
2.18
2.23
Figure 2.1. X-ray structures of phthalonitriles 2.3, 2.9, 2.10, 2.18 and 2.23 obtained from
single crystals (N atoms are blue, O atoms red and H atoms green; H atoms are white in
2.23). Ellipsoids are drawn at the 50% probability level.
2.2.2. Synthesis of Cationic ZnPcs
In order to enhance the solubility of the precursor Pcs and the target cationic
ZnPcs, 4-tert-butylphthalonitrile was selected for use in the statistical condensation28,29,31

32
with the appropriate p-N-Boc-aminophenoxyphthalonitrile. A mixture of N-Boc-protected
phthalonitrile 2.3 and 3 equiv. 4-tert-butylphthalonitrile was reacted in the presence of
Zn(II) acetate and a catalytic amount of DBN in DMAE (Schemes 2.1). After refluxing the
reaction mixture for 5 h, a number of ZnPcs were obtained. The A4-type Pc was the major
product, followed by the A3B- and A2B2-types ZnPcs, as confirmed by TLC and MS
analyses. In order to purify the mixture, column chromatography using mixtures of hexane
and ethyl acetate for elution gave the subsequent N-Boc-protected A3B-type ZnPcs in 15-
20% yields and the A2B2-type ZnPcs in 19-25% yields. The deprotection of the Boc
groups under acidic conditions (using TFA/DCM) at room temperature, gave ZnPcs 2.4
and 2.6 in quantitatiive yield. The yields of ZnPcs 2.4 and 2.6 were low when unprotected
aminophenoxyphthalonitriles were used in the tetramerization reactions.
The free amino groups were quaternized using excess iodomethane and DIPA in
DMF at room temperature.15
The subsequent trimethylaminophenoxy-substituted ZnPcs
2.5 and 2.7 were obtained in 50-70% yields. The A3B- and A2B2-type ZnPcs 2.5 and 2.7
were obtained mixtures of regioisomers as has been reported in literature before.31-35
The
di-cationic ZnPcs 2.7 and 2.14 are particularly complex mixtures of up to 15 regioisomers
of both trans-ABAB and cis-AABB types. Due to their exceedingly similar retention times
on reversed-phase HPLC, isomers of these Pcs were not isolated. There are chances that
the distribution of isomers may slightly be different for the α- and β-substituted Pcs, due
to the higher steric hindrance resulting from the neighboring α-substituents during the
macrocyclization step as reported previously in literature.36
The chromatograms for the
cationic ZnPcs 2.7 and 2.14 obtained during reversed-phase HPLC using water/methanol
(50:50 → 0:100) were consistent with the expected mixtures of regioisomers.

33
Scheme 2.1. Synthesis of mono- and di-cationic α-trimethylphenoxy-substituted ZnPcs 2.5
and 2.7. Reagents and conditions: (a) K2CO3, DMF, 65 °C, 24 h (70%); (b) K2CO3, DMF, 80
°C, 3 h (80%); (c) 4-tert-butylphthalonitrile, Zn(OAc)2, DMAE, 140 °C, 5 h (15-20%); (d)
DCM/TFA, 0 °C, 4 h (quantitative); (e) CH3I, DIPA, DMF, 3 days, r.t. (50-70%).
The macrocyclization of 4-(p-N-Boc-aminophenoxy)phthalonitrile 2.10 under
similar conditions as described above, followed by acidic deprotection of N-Boc group
using TFA, gave tetra-amino ZnPc 2.15 as a mixture of regioisomers, in 20 % yield
(Scheme 2.2). The quaternization of amino groups using excess iodomethane gave ZnPc
2.16 in 82% yield.
Using a similar strategy, the di-amino ZnPc 2.19 was synthesized from 4,5-di(N-
Boc-phenoxyl)phthalonitrile 2.18 and 4-tert-butylphthalonitrile (Scheme 2.3). The A3B-
type ZnPc 2.19 was isolated in 9% yield after TFA deprotection of N-Boc groups. The
octa-amino ZnPc 2.21 was achieved in 50% yield from self condensation of phthalonitrile
2.18. The quaternization of the amino groups on ZnPcs 2.19 and 2.21 using a large excess
of iodomethane gave the subsequent cationic ZnPcs 2.20 and 2.22 in 50-90% yields.

34
Scheme 2.2. Synthesis of mono-, di- and tetra-cationic β-trimethylphenoxy-substituted ZnPcs
2.12, 2.14, and 2.16. Reagents and conditions: (a) K2CO3, DMF, 65 °C, 24 h (87%); (b)
K2CO3, DMF, 63 °C, 4 h (73%); (c) 4-tert-butylphthalonitrile, Zn(OAc)2, DMAE, 140 °C, 5 h
(9-50%); (d) DCM/TFA, 0 °C, 4 h (quantitative); (e) CH3I, DIPA, DMF, 3 days, r.t. (50-
90%).
All the Pcs synthesized in this Chapter are a mixture of isomers, as discussed in
Chapter 1, except Pc 2.21. In order to decrease the number of isomers, adjacent-
substituted di-aminophenoxy-Pcs 2.24 and 2.26 were synthesized (Schemes 2.4 and 2.5).
The diphthalonitrile 2.23, linked via the ortho positions of biphenyl, was synthesized
according to a literature procedure.29
The bis-phthalonitrile prevented the formation of the
trans-ABAB Pc species and reduced the number of probable regioisomers in the

35
cyclotetramerization reaction from fifteen to only three. The trimethylation of the amino
groups on ZnPcs 2.24 and 2.26 using excess of iodomethane gave the subsequent cationic
ZnPcs 2.25 and 2.27 in 80-90% yields.
Scheme 2.3. Synthesis of β-substituted di- and octa-cationic ZnPcs 2.20 and 2.22. Reagents
and conditions: (a) K2CO3, DMF, 63 °C, 24 h (83%); (b) 4-tert-butylphthalonitrile, Zn(OAc)2,
DMAE, 140 °C, 5 h (15-50%); (c) DCM/TFA, 0 °C, 4 h (quantitative); (d) CH3I, DIPA,
DMF, 3 days, r.t. (50-70%).
Scheme 2.4. Synthesis of cis-A2B2 α-substituted di-cationic ZnPc 2.25. Reagents and
conditions: (a) 3-(4-N-Boc-aminophenoxy)phthalonitrile, Zn(OAc)2, DMAE, 140 °C, 5 h
(13.9%); (b) DCM/TFA, 0 °C, 4 h (quantitative); (c) CH3I, DIPA, DMF, 3 days, r.t. (53.3%).

36
Scheme 2.5. Synthesis of cis-A2B2 β-substituted di-cationic ZnPc 2.27. Reagents and
conditions: (b) 4-(4-N-Boc-aminophenoxy)phthalonitrile, Zn(OAc)2, DMAE, 140 °C, 5 h
(11.4%); (b) DCM/TFA, 0 °C, 4 h (quantitative); (c) CH3I, DIPA, DMF, 3 days, r.t.
(58.3%).
2.3. Spectroscopic and Photophysical Characterization
The solubility in polar organic solvents such as DMSO, DMF, THF, and methanol
of all cationic ZnPcs 2.5, 2.7, 2.12, 2.14, 2.16, 2.20, 2.22, 2.25 and 2.27 was investigated.
They were all soluble in these solvents. Captivatingly, the solubility of these ZnPcs in
organic solvents was observed to reduce with increase in cationic charge, whereas their
solubilityin water increased with cationic charge (2.5 ~ 2.12 ~ 2.7 ~ 2.20 ~ 2.25 ~ 2.27 <
2.14 < 2.16 < 2.22). The tetra- and octa-cationic ZnPcs 2.16 and 2.22 precipitated after
quaternization reaction in DMF and DIPA and therefore, were easily isolated upon
exhaustive methylation. After removal of reaction solvent, the solids were washed with
acetone to remove the base and excess iodomethane. Only Pcs 2.14, 2.16 and 2.22 were
water-soluble: Pc 2.22 at 2.69 × 10⁻³
M, Pc 2.16 at 4.75 × 10⁻³
and Pc 2.14 at 4.03 × 10⁻³
M in distilled water. In addition, Pc 2.22 was highly hygroscopic. The other Pcs remained
aggregated in water, even after sonicating them. Nevertheless, all the Pcs remained soluble
when diluted from concentrated stocks in DMF or DMSO into PBS (final DMF or DMSO
concentration of 1%) at 10 µM concentrations.
The N-Methylated Pcs are known to be sensitive to heat and therefore, require
special handling.37
After the trimethylation reactions, the solvent and the base were

37
removed at temperatures < 50 °C to avoid loss of N-methyls and immediately followed by
their NMR and MS characterization. MS analyses revealed that the ZnPcs can be readily
N-demethylated; for example, the mass spectrum of ZnPc 2.22 displayed a large number
of fragments, dominated by a peak at m/z 1671.679 [M-8I-7CH3]+. N-Demethylation of
these cationic ZnPcs was also observed upon prolonged storage at room temperature.38
The ZnPcs were characterized by NMR, using mainly deuterated DMF solvent
since it dissolved most Pcs. The complexity of the 1H- and
13C-NMR spectra of ZnPcs 2.5,
2.7, 2.12, 2.14 and 2.16 (Appendix A.2 – A.6), suggested the presence of various
regioisomers (up to fifteen for the di-cationic ZnPcs), which was expected for the
cyclotetramerization reaction of two mono-substituted phthalonitriles, and also in
agreement with the observations from reversed-phase HPLC. The 1H-NMR of the N-Boc-
protected Pc precursors, gave two sets of signals were observed for the tert-butyl protons
on the macrocycle (centered at ~ 1.9 ppm) and the N-Boc group(s) (centered at ~ 1.5
ppm). Notably, the α-substituted N-Boc Pc-precursors had two sets of signals for the N-
Boc group (centered at 1.4 and 1.5 ppm), while the β-substituted N-Boc protected Pc
precursors had only one set centered at 1.6 ppm. The N-Boc precursors of Pcs 2.24, and
2.26 gave similar results. Equally, the mono- and di-cationic ZnPcs exhibited distinct
variations in their chemical shifts of the -N(CH3)3 protons, possibly due to macrocycle
distortion and/or hindered rotation. This is illustrated by the β-substituted ZnPc 2.12,
which had only one singlet for the N(CH3)3 protons at 3.98 ppm, while the α-substituted
ZnPc 2.5 (Figure 2.2) exhibited two singlets at 3.62 and 3.72 ppm. In the same way, the
di-cationic β-substituted ZnPc 2.20 (Figure 2.3) showed only one singlet for the N(CH3)3
protons at 3.96 ppm, while each of the di-cationic 2.7 and 2.14 had several signals.

38
Figure 2.2. 1H NMR spectrum of ZnPc 2.5 at 400 MHz (* denotes solvent).
Figure 2.3. 1H NMR spectrum of ZnPc 2.20 at 400 MHz (* denotes solvent).
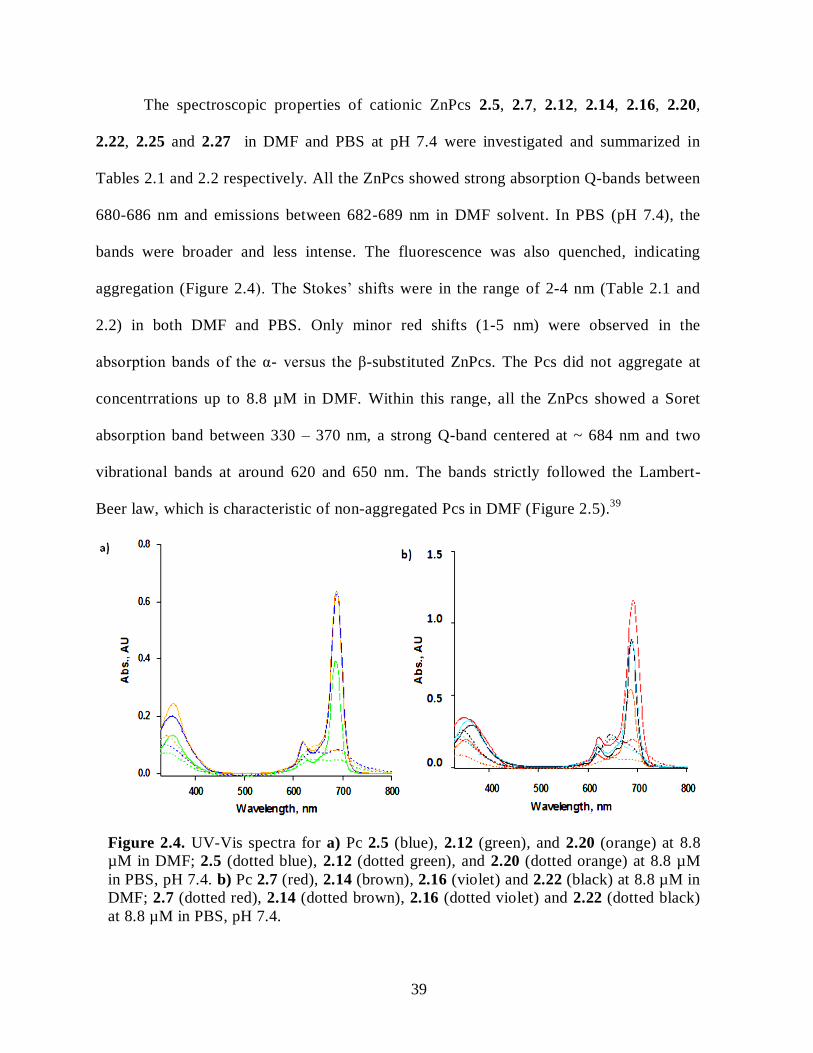
39
The spectroscopic properties of cationic ZnPcs 2.5, 2.7, 2.12, 2.14, 2.16, 2.20,
2.22, 2.25 and 2.27 in DMF and PBS at pH 7.4 were investigated and summarized in
Tables 2.1 and 2.2 respectively. All the ZnPcs showed strong absorption Q-bands between
680-686 nm and emissions between 682-689 nm in DMF solvent. In PBS (pH 7.4), the
bands were broader and less intense. The fluorescence was also quenched, indicating
aggregation (Figure 2.4). The Stokes’ shifts were in the range of 2-4 nm (Table 2.1 and
2.2) in both DMF and PBS. Only minor red shifts (1-5 nm) were observed in the
absorption bands of the α- versus the β-substituted ZnPcs. The Pcs did not aggregate at
concentrrations up to 8.8 µM in DMF. Within this range, all the ZnPcs showed a Soret
absorption band between 330 – 370 nm, a strong Q-band centered at ~ 684 nm and two
vibrational bands at around 620 and 650 nm. The bands strictly followed the Lambert-
Beer law, which is characteristic of non-aggregated Pcs in DMF (Figure 2.5).39
Figure 2.4. UV-Vis spectra for a) Pc 2.5 (blue), 2.12 (green), and 2.20 (orange) at 8.8
µM in DMF; 2.5 (dotted blue), 2.12 (dotted green), and 2.20 (dotted orange) at 8.8 µM
in PBS, pH 7.4. b) Pc 2.7 (red), 2.14 (brown), 2.16 (violet) and 2.22 (black) at 8.8 µM in
DMF; 2.7 (dotted red), 2.14 (dotted brown), 2.16 (dotted violet) and 2.22 (dotted black)
at 8.8 µM in PBS, pH 7.4.
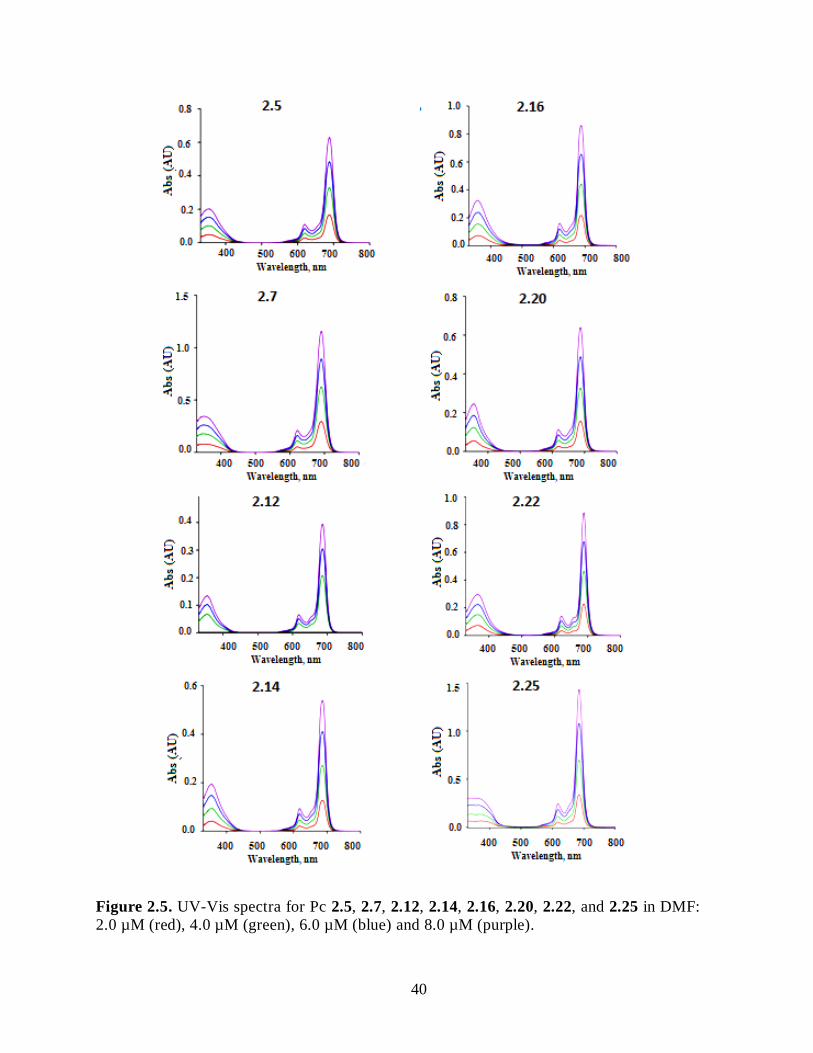
40
Figure 2.5. UV-Vis spectra for Pc 2.5, 2.7, 2.12, 2.14, 2.16, 2.20, 2.22, and 2.25 in DMF:
2.0 µM (red), 4.0 µM (green), 6.0 µM (blue) and 8.0 µM (purple).

41
The ZnPcs at 1000 µM concentrations in DMF showed no evidence for colloidal
solution formation, indicating that no large aggregates were formed.40
The fluorescence
quantum yields for the ZnPcs were determined in the same solvent and all compounds
had fluorescence quantum yields in the range 0.11-0.21 (Table 2.1), characteristic of this
type of compound.40-42
The determination of singlet oxygen quantum yields using ZnPc as the reference
and 1,3-diphenylisobenzofuran (DPBF) as the scavenger of singlet oxygen was
accomplished in DMF.43
The absorption decay of DPBF measured at 417 nm was used to
calculate the singlet oxygen quantum yields, within accuracy of ~ 10% (Table 2.1). The
mono-cationic ZnPc 2.5 (0.47) gave the highest quantum, yield while that of ZnPc 2.20
(0.16) was the lowest. This suggests that synthesized series of ZnPcs consists of efficient
producers of singlet oxygen and therefore, could find application as PDT
photosensitizers. The di-cationic ZnPc 2.14 may find use in PDT due to its high 1O2
quantum yields.
Table 2.1. Spectral properties of ZnPcs 2.5, 2.7, 2.12, 2.14, 2.16, 2.20, 2.22, 2.25 and
2.27 in DMF at room temperature. a: excitation at 640 nm; b: calculated using ZnPc (Фf =
0.17) as the standard; c: calculated using ZnPc (Ф∆ = 0.56) as the standard in DMF.
ZnPc Absorption
λmax (nm)
Emissiona
λmax (nm)
Stokes shift
(nm)
Φfb Φ∆
c
2.5 684 686 2 0.16 0.47
2.7 686 689 3 0.21 0.31
2.12 683 687 4 0.13 0.33
2.14 683 686 3 0.18 0.44
2.16 684 687 3 0.13 0.35
2.20 684 687 3 0.19 0.16
2.22 686 688 2 0.13 0.28
2.25 685 687 2 0.11 0.33
2.27 680 682 2 0.14 0.22
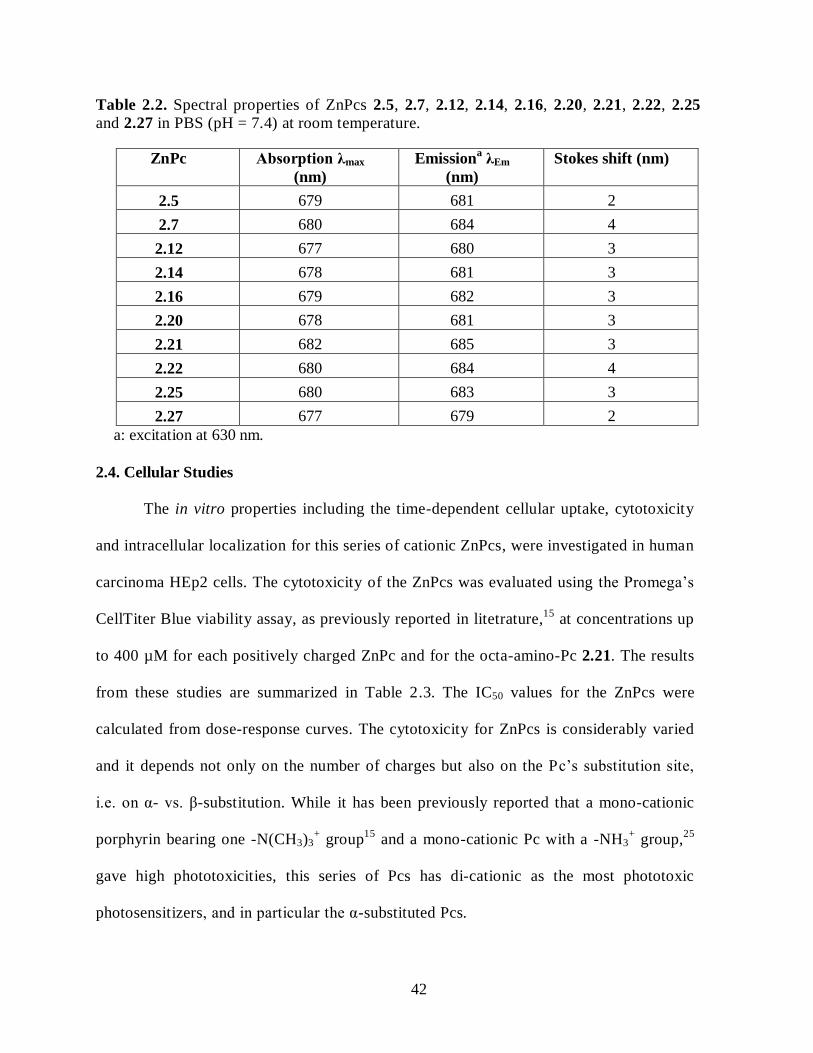
42
Table 2.2. Spectral properties of ZnPcs 2.5, 2.7, 2.12, 2.14, 2.16, 2.20, 2.21, 2.22, 2.25
and 2.27 in PBS (pH = 7.4) at room temperature.
ZnPc Absorption λmax
(nm)
Emissiona λEm
(nm)
Stokes shift (nm)
2.5 679 681 2
2.7 680 684 4
2.12 677 680 3
2.14 678 681 3
2.16 679 682 3
2.20 678 681 3
2.21 682 685 3
2.22 680 684 4
2.25 680 683 3
2.27 677 679 2
a: excitation at 630 nm.
2.4. Cellular Studies
The in vitro properties including the time-dependent cellular uptake, cytotoxicity
and intracellular localization for this series of cationic ZnPcs, were investigated in human
carcinoma HEp2 cells. The cytotoxicity of the ZnPcs was evaluated using the Promega’s
CellTiter Blue viability assay, as previously reported in litetrature,15
at concentrations up
to 400 µM for each positively charged ZnPc and for the octa-amino-Pc 2.21. The results
from these studies are summarized in Table 2.3. The IC50 values for the ZnPcs were
calculated from dose-response curves. The cytotoxicity for ZnPcs is considerably varied
and it depends not only on the number of charges but also on the Pc’s substitution site,
i.e. on α- vs. β-substitution. While it has been previously reported that a mono-cationic
porphyrin bearing one -N(CH3)3+ group
15 and a mono-cationic Pc with a -NH3
+ group,
25
gave high phototoxicities, this series of Pcs has di-cationic as the most phototoxic
photosensitizers, and in particular the α-substituted Pcs.

43
The compounds showed low dark cytotoxicity with calculated IC50 > 150 µM. The
mono- and di-cationic ZnPcs were phototoxic toward HEp2 cells at 1.5 J/cm2 light dose.
The most phototoxic were the di-cationic ZnPcs 2.7 ~ 2.25 > 2.27 ~ 2.14 > 2.20 with
determined IC50 of 2.7, 2.7, 12.1, 13.4 and 39.6 µM, respectively, followed by mono-
cationic ZnPc 2.5 with IC50 of 46.3 µM. The other Pcs showed IC50 > 100 µM at 1.5
J/cm2, including the mono-cationic 2.12 and the octa-amino-Pc 2.21. There was no
correlation between phototoxicity observed for the ZnPcs and the determined single
oxygen quantum yields, because in addition to 1O2 other ROS can be involved in the
observed photo-induced cytotoxicity, and their site(s) of generation will also determine the
mechanisms and efficacy of cell death. It is very interesting to note that the α-substituted
Pcs (i.e. 2.5, 2.7 and 2.25) were considerably more phototoxic (ca. 5-fold enhancement)
than their β-substituted analogs.
Additionally, there was no major variation in the phototoxicity of the di-cationic
ZnPcs 2.7 and 2.25, nor of ZnPcs 2.14 and 2.27, even if ZnPcs 2.7 and 2.14 were mixtures
of about 15 regioisomers, containing both the cis-A2B2 and trans-ABAB macrocycles,
while 2.25 and 2.27 were mixtures of 3 regioisomers of only the cis-A2B2 type. These
results suggest that the cis-A2B2 ZnPcs were the most phototoxic of this series. Moreover,
ZnPc 2.7 bearing the di-cationic charges on both adjacent and opposite benzene rings was
15-fold more phototoxic than ZnPc 2.20 bearing di-cationic charges on the same benzene
ring, further indicating the imortance of the α- vs. β-substitution on Pc phototoxicity.
Amongst all the ZnPcs investigated, 2.7 and 2.25 were the most phototoxic and to had the
highest dark cytotoxicity/phototoxicity ratio of > 120. This makes it the most promising
candidate for PDT applications.

44
Table 2.3. Dark and phototoxicity (at 1.5 J/cm2 light dose) of ZnPcs 2.5, 2.7, 2.12, 2.14,
2.16, 2.20, 2.22, 2.25 and 2.27 toward HEp2 cells using the Cell Titer Blue assay.
ZnPc Dark toxicity
IC50 (µM)
Phototoxicity
IC50 (µM)
Ratio
2.5 > 400 46.3 > 9
2.7 344 2.7 128
2.12 > 400 > 100 > 4
2.14 156 13.4 12
2.16 > 400 > 100 > 4
2.20 > 400 39.6 > 10
2.21 > 400 > 100 > 4
2.22 > 400 > 100 > 4
2.25 > 400 2.7 > 148
2.27 > 400 12.1 > 33
Considerable differences were also observed in the cellular uptake of this series of
ZnPcs, as shown in Figure 2.6. All the ZnPcs exhibited similar uptake patterns with rapid
accumulation within a short period followed by a plateau, which was reached 1-2 h after
Pc exposure. The octa-amino-Pc 2.21 accumulated the highest cellular uptake, possibly
due to its higher hydrophobicity compared with the other cationic ZnPcs. Of all the
postively charged ZnPcs, the di-cationic ZnPc 2.20 had the highest uptake values at all
time points investigated, while the tetra-cationic Pc 2.16 had the lowest uptake. From
these results, it can be concluded that the amphiphilicity of the cationic Pcs plays a
crucial role on the extent of their cellular uptake, which is in concurrence with previous
literature reports;15,25,44
in the porphyrin series, the di-cationic macrocycles were also
found to accumulate the most within HEp2 cells. The two positive charges on the β-
positions of a single isoindole unit in ZnPc 2.20 confers higher amphiphilicity to the Pc
compared with the regioisomeric mixtures in 2.7, 2.14, 2.25 and 2.27, which enhances
hydrophobic/hydrophilic interactions that lead to amplified cellular uptake.

45
Figure 2.6. Time-dependent uptake of cationic Pcs at 10 µM by HEp2 cells: Pc 2.5
(black), 2.7 (orange), 2.12 (brown), 2.14 (green), 2.16 (light-blue), 2.20 (red), 2.21
(purple), 2.22 (dark-green), 2.25 (blue) and 2.27 (pink).
The main sites of localization of the cationic ZnPcs within the cells were also
examined by fluorescence microscopy, upon exposure of HEp2 cells to 10 µM Pc for 6 h.
Figures 2.7 – 2.11 show the fluorescent patterns observed for each cationic ZnPc. The co-
localization investigations of the ZnPcs were accomplished using the organelle specific
fluorescent probes: ER Tracker Blue/White (for endoplasmic reticulum, ER), MitoTracker
Green (mitochondria), BODIPY Ceramide (golgi) and LysoSensor Green (lysosomes) to
evaluate the main sites of localization within the cells. The di-cationic ZnPc 2.7 localized
mainly in mitochondria, and to a lesser degree in the lysosomes and ER. The ZnPc 2.25

46
localized mostly in the ER and lysosomes, but not in mitochondria. In contrast, the tetra-
and octa-cationic Pcs 2.16 and 2.22 were largely located in mitochondria and to a lower
degree in the Golgi; it was not found in the ER.
The di-cationic ZnPcs 2.14 and 2.20 were found mostly in the lysosomes and
Golgi, respectively, and to a lesser degree in the ER. ZnPc 2.27 was also found mostly in
the Golgi and ER. Nevertheless, the mono-cationic ZnPcs 2.5 and 2.12 were found largely
in the lysosomes and Golgi, respectively, and were also localized in the ER. These results
exhibit very diverse subcellular distributions for these cationic ZnPcs. This is possibly due
their varied interactions with membranes in addition to other biological substrates, and
probably their diverse cellular uptake mechanisms.
It had been previously observed that a octa-cationic-Pcs localized intracellularly
mainly in the lysosomes,19
and that cationic porphyrins bearing up to four charges were
mainly found in mitochondria, ER and/or lysosomes.13-15
The high phototoxicity observed
for the ZnPcs 2.5, 2.7, 2.14, 2.20, 2.25 and 2.27 might possibly be, in part, due to their
localization in the ER; some of these Pcs were also found in the mitochondria and/or the
lysosomes. All these organelles are key targets for PDT-induced cell apoptosis.45-47
It is
interesting to note that the octa-amino Pc 2.21 was mainly found in mitochondria and
Golgi, and to a lesser degree in lysosomes. No localization was observed for ZnPc 2.21 in
the ER (Figure 2.12), in a similar case to the cationic ZnPcs 2.16 and 2.22. These
incredible results show that cationic ZnPcs are attaractive photosensitizers, which can be
tuned to obtain amphiphilic drug agents. Di-cationic Pcs, particulaly α-substituted ones,
have been shown to be promising PDT candidates. The subcellular localization of the
cationic Pcs is shown in Figures 2.7 – 2.11.

47
a) b)
Figure 2.7. Subcellular localization: a) Pc 2.5 in HEp2 cells at 10 µM for 6 h: (A) Phase
contrast, (B) Overlay of 2.5 and phase contrast, (C) ER tracker Blue/White fluorescence,
(E) MitoTracker Green fluorescence, (G) BoDIPY Ceramide, (I) LysoSensor Green
fluorescence, and (D, F, H, J) overlays of organelle tracers with compound fluorescence.
Scale bar: 10 m. b) Pc 2.7 in HEp2 cells at 10 µM for 6 h: (A) Phase contrast, (B)
Overlay of 2.7 and phase contrast, (C) ER tracker Blue/White fluorescence, (E)
MitoTracker Green fluorescence, (G) BoDIPY Ceramide, (I) LysoSensor Green
fluorescence, and (D, F, H, J) overlays of organelle tracers with compound fluorescence.
Scale bar: 10 m.
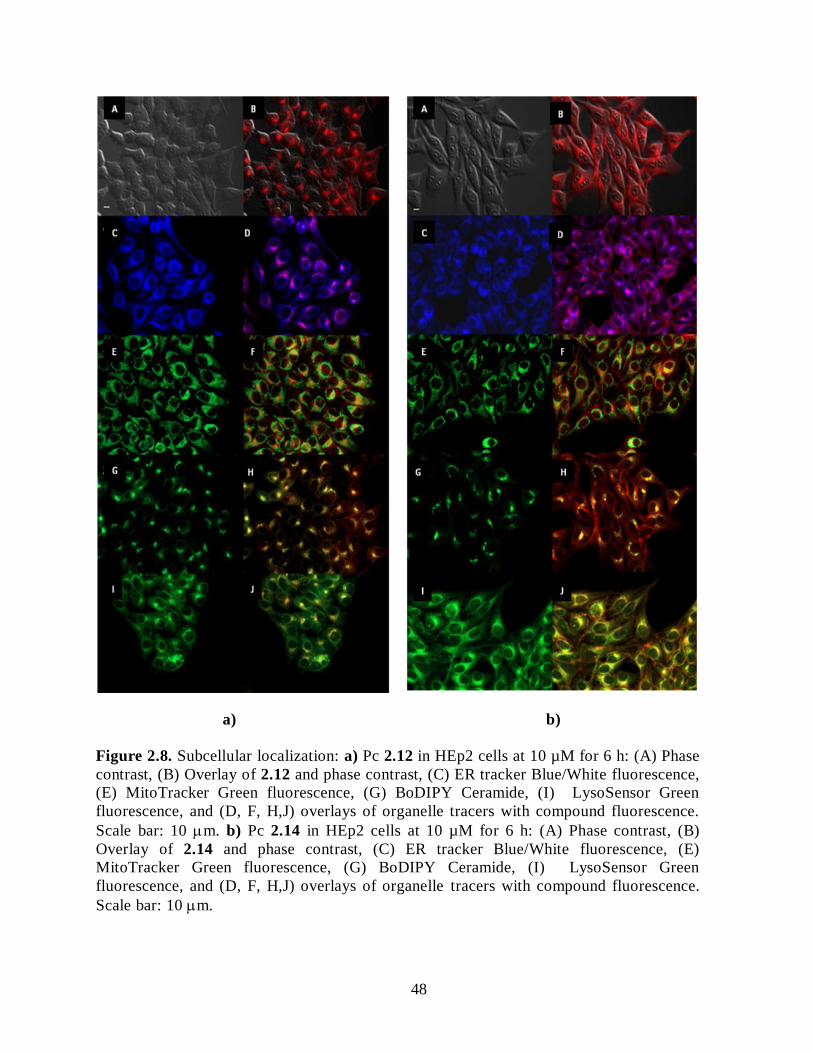
48
a) b)
Figure 2.8. Subcellular localization: a) Pc 2.12 in HEp2 cells at 10 µM for 6 h: (A) Phase
contrast, (B) Overlay of 2.12 and phase contrast, (C) ER tracker Blue/White fluorescence,
(E) MitoTracker Green fluorescence, (G) BoDIPY Ceramide, (I) LysoSensor Green
fluorescence, and (D, F, H,J) overlays of organelle tracers with compound fluorescence.
Scale bar: 10 m. b) Pc 2.14 in HEp2 cells at 10 µM for 6 h: (A) Phase contrast, (B)
Overlay of 2.14 and phase contrast, (C) ER tracker Blue/White fluorescence, (E)
MitoTracker Green fluorescence, (G) BoDIPY Ceramide, (I) LysoSensor Green
fluorescence, and (D, F, H,J) overlays of organelle tracers with compound fluorescence.
Scale bar: 10 m.
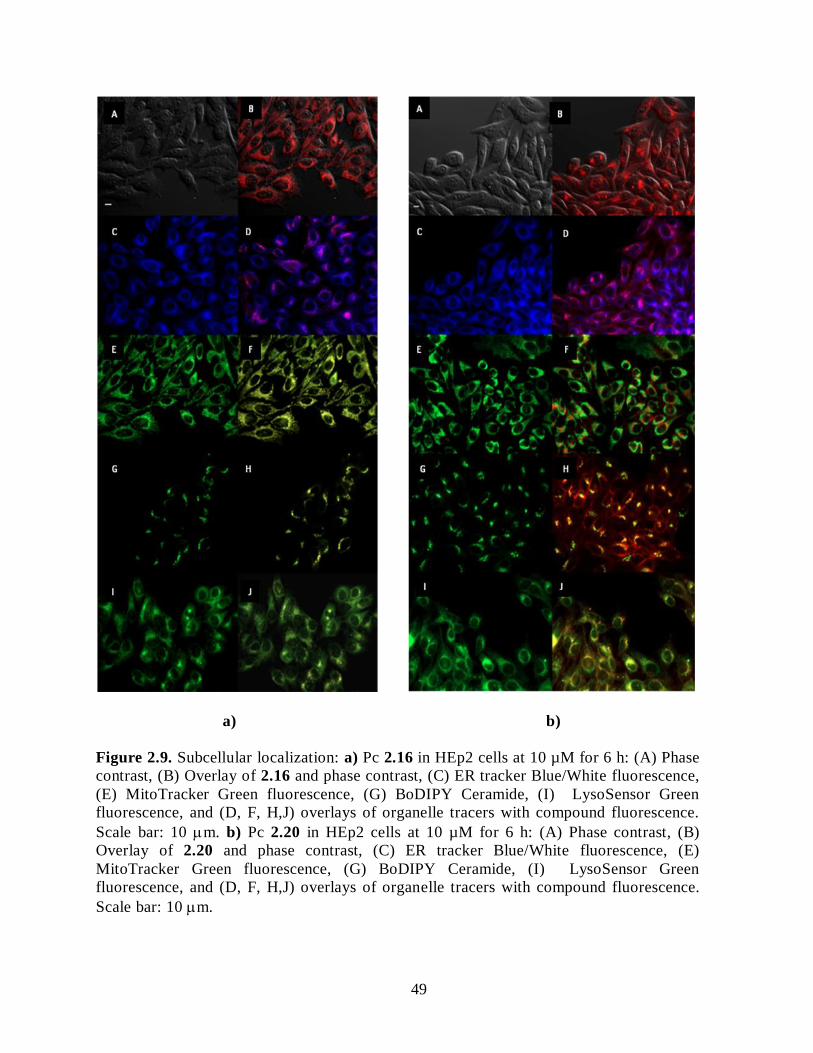
49
a) b)
Figure 2.9. Subcellular localization: a) Pc 2.16 in HEp2 cells at 10 µM for 6 h: (A) Phase
contrast, (B) Overlay of 2.16 and phase contrast, (C) ER tracker Blue/White fluorescence,
(E) MitoTracker Green fluorescence, (G) BoDIPY Ceramide, (I) LysoSensor Green
fluorescence, and (D, F, H,J) overlays of organelle tracers with compound fluorescence.
Scale bar: 10 m. b) Pc 2.20 in HEp2 cells at 10 µM for 6 h: (A) Phase contrast, (B)
Overlay of 2.20 and phase contrast, (C) ER tracker Blue/White fluorescence, (E)
MitoTracker Green fluorescence, (G) BoDIPY Ceramide, (I) LysoSensor Green
fluorescence, and (D, F, H,J) overlays of organelle tracers with compound fluorescence.
Scale bar: 10 m.

50
a) b)
Figure 2.10. Subcellular localization: a) Pc 2.21 in HEp2 cells at 10 µM for 6 h: (A)
Phase contrast, (B) Overlay of 2.21 and phase contrast, (C) ER tracker Blue/White
fluorescence, (E) MitoTracker Green fluorescence, (G) BoDIPY Ceramide, (I)
LysoSensor Green fluorescence, and (D, F, H,J) overlays of organelle tracers with
compound fluorescence. Scale bar: 10 m. b) Pc 2.22 in HEp2 cells at 10 µM for 6 h: (A)
Phase contrast, (B) Overlay of 2.22 and phase contrast, (C) ER tracker Blue/White
fluorescence, (E) MitoTracker Green fluorescence, (G) BoDIPY Ceramide, (I)
LysoSensor Green fluorescence, and (D, F, H,J) overlays of organelle tracers with
compound fluorescence. Scale bar: 10 m.

51
a) b)
Figure 2.11. Subcellular localization: a) Pc 2.25 in HEp2 cells at 10 µM for 6 h: (A)
Phase contrast, (B) Overlay of 2.25 and phase contrast, (C) ER tracker Blue/White
fluorescence, (E) MitoTracker Green fluorescence, (G) BoDIPY Ceramide, (I)
LysoSensor Green fluorescence, and (D, F, H,J) overlays of organelle tracers with
compound fluorescence. Scale bar: 10 m. b) Pc 2.27 in HEp2 cells at 10 µM for 6 h: (A)
Phase contrast, (B) Overlay of 2.27 and phase contrast, (C) ER tracker Blue/White
fluorescence, (E) MitoTracker Green fluorescence, (G) BoDIPY Ceramide, (I)
LysoSensor Green fluorescence, and (D, F, H,J) overlays of organelle tracers with
compound fluorescence. Scale bar: 10 m.

52
2.5. Conclusions
The syntheses and characterizations of a series of nine cationic ZnPcs are
described. All ZnPcs were synthesized by a one-step cyclotetramerization of one or two
phthalonitriles and consequently are mixtures of regioisomers, except for the octa-cationic
and symmetrical ZnPc 2.22. The positive charges conferred by the trimethylaminophenoxy
substituents and the presence of bulky tert-butyl groups in Pcs 2.5, 2.7, 2.12, 2.14 and
2.20 induced high solubility in polar organic solvents. In contrast, ZnPcs 2.25 and 2.27
were obtained using a biphenyl-linked diphthalonitrile and consequently consist of only
the cis-A2B2 Pc regioisomers. The cytotoxicity of this series of compounds was dependent
both on the number of charges, and on their site of substitution (α vs. β) on the Pc
isoindole units.
The amphiphilicity of the molecules strongly affected their uptake bby the cells;
the amphiphilic di-cationic ZnPc 2.20 accumulated the most within cells, it had reasonable
phototoxicity (IC50 = 39.6 µM at 1.5 J/cm2) and was preferentially locallized in the Golgi
apparatus. Of all the ZnPcs synthesized, the di-cationic α-substituted ZnPcs 2.7 and 2.25
exhibited the highest phototoxicity (IC50 = 2.7 µM at 1.5 J/cm2). The partial localization
of the ZnPcs in the ER, and the highest ratio (> 120) for their dark
cytotoxicity/phototoxicity, make them the most promising agents for PDT applications.
The tetra- and octa-cationic ZnPcs had very low cytotoxicities and were mainly
found in the mitochondria, suggesting a possibility for application as mitochondria
delivery vehicles for therapeutic agents. This Chapter presents a comprehensive study of
cationic ZnPcs, with attractive features that may be exploited in imaging or PDT. Most of
the Pcs synthesized here are soluble in polar organic solvents and aqueous media.
53
2.6. Experimental Section
2.6.1. Chemistry
All the reagents and solvents were obtained from commercial sources and used
directly without further purification. Silica gel 60 (230×400 mesh) and alumina neutral
(activity I, 50-200 µm) from Sorbent Technologies were used for column chromatography.
Sephadex G-100 and LH-20 were obtained from Amersham Biosciences. Analytical thin-layer
chromatography (TLC) was carried out using polyester backed TLC plates 254 (pre-coated,
200 μm) from Sorbent Technologies. NMR spectra were recorded on an AV-400 LIQUID
Bruker spectrometer (400 MHz for 1H, 100 MHz for
13C). Chemical shifts are reported in δ
(ppm) using the following deuterated solvents as internal references: Acetone-d6 2.05 ppm
(1H), 29.92 ppm (
13C); DMF-d7 8.03 ppm (
1H), 163.15 ppm (
13C); Pyridine-d5 7.58 ppm (
1H),
135.91 ppm (13
C); D2O 4.80 ppm (1H); THF-d8 3.58 ppm (
1H), 67.57 ppm (
13C); CD2Cl2 5.32
ppm (1H), 54.00 ppm (
13C); CDCl3 7.27 ppm (
1H), 77.23 ppm (
13C). The HPLC analyses were
performed on a Dionex system fitted with a P680 pump and UVD340U detector. Electronic
absorption spectra were measured on a PerkinElmer, Lambda 35 UV-Vis spectrometer and
emission spectra were measured on a Fluorolog® HORIBA JOBIN YVON (Model LFI-3751)
spectrofluorimeter. Dithranol matrix was used for MALDI-TOF mass spectra measurement on
a Bruker ProFlex III spectrometer; high-resolution ESI mass spectra (HRMS-ESI) were
obtained using an Agilent Technologies 6210 Time-of-Flight LC/MS spectrometer. Melting
points were obtained using MEL-TEMP electrothermal instrument.
2.6.2. Synthesis of Phthalocyanines and Their Precursors
Mono-N-Boc-amino-phthalonitrile 2.3. A 3-nitrophthalonitrile 2.1 (2 g, 11.6 mmol)
and 4-N-Boc-aniline (3.6 g, 17.0 mmol) mixture was dissolved in DMF (30 mL). Potassium

54
carbonate (2.5 g, 18.0 mol) was added to the solution in five portions and the mixture heated
to 80 °C for 3 h. The reaction mixture was cooled to room temperature, poured into ice-cold
water and filtered to obtain a solid. The solid was purified using alumina column
chromatography, eluted with DCM to afford a white solid (3.1 g, 80.0%), mp 165 – 166 °C.
1H NMR (acetone-d6): δ 8.58 (br, 1H, NH), 7.80 (t, J = 8.2 Hz, 1H, Ar-H), 7.70 -7.66 (m, 3H,
Ar-H), 7.25 – 7.14 (m, 3H, Ar-H), 1.48 (s, 9H, C(CH3)3). 13
C NMR (acetone-d6): δ 162.1,
153.7, 149.4, 138.6, 136.2, 128.1, 121.7, 121.5, 120.7, 117.4, 116.2, 113.8, 105.9 (Ar-C, CN),
80.2, 28.4 (C(CH3)3). HRMS-ESI: m/z 336.1340 [M+H]+, calcd. for [C19H18N3O3]
+ 336.1342;
353.1604 [M+H2O]+, calcd. for [C19H19N3O4]
+ 353.1376; 358.1163 [M+Na]
+, calcd. for
[C19H17N3O3Na]+ 358.1168.
Mono-α-amino-ZnPc 2.4. A mixture of 4-tert-butylphthalonitrile (770.0 mg, 4.1
mmol), phthalonitrile 2.3 (462.0 mg, 1.4 mmol) and zinc(II) acetate (509.4 mg, 2.8 mmol)
was dissolved in DMAE (6.0 mL). Catalytic amount of DBN was added and reaction refluxed
for 5 h. The solvent was removed and the residue purified by silica column chromatography
using hexane/ethyl acetate 4:1 for elution. The N-Boc protected ZnPc was isolated as a blue
solid (272 mg, 20.4%), mp > 250 oC.
1H NMR (acetone-d6): δ 9.51-8.07 (m, 11H, Ar-H),
7.78-7.23 (m, 5H, Ar-H), 1.86-1.82 (m, 27H, C(CH3)3), 1.51-1.48, 1.41 (m, 9H, C(CH3)3). 13
C
NMR (acetone-d6): δ 171.0 (C=O), 155.7, 155.0, 154.0, 153.9, 152.8, 151.9, 141.2, 139.3,
136.9, 135.6, 134.9, 134.8, 130.3, 127.7, 127.6, 127.3, 123.0, 122.4, 120.7, 120.5, 119.2,
119.0, 117.5, 117.5, 117.4, 117.3, 79.8, 79.7 (N-Boc-C(CH3)3), 60.6 (N-Ar-C), 36.5, 32.7,
32.5 (Ar-C, C(CH3)3), 28.7, 28.6 (N-Boc-C(CH3)3). MS (MALDI-TOF) m/z 952.389 [M+H]+,
calcd for C55H54N9O3Zn, 952.3641. The N-Boc group was removed using DCM/TFA, 1:1 (8
mL), and ZnPc 2.4 was obtained as a blue solid (180 mg, 14.7% overall yield), mp > 250 oC.
55
UV–Vis (DMF): λmax (log ε) 349 nm (5.09), 614 nm (4.82), 682 nm (5.58). 1H NMR (DMF-
d7): δ 9.58-9.29 (m, 7H, Ar-H), 8.41-8.28 (m, 4H, Ar-H), 7.28-7.24 (m, 2H, Ar-H), 6.69-6.63
(m, 2H, Ar-H), 4.65-5.05 (br, 2H, NH2), 1.80-1.65 (m, 27H, C(CH3)3). 13
C NMR (DMF-d7): δ
156.6, 155.2, 155.0, 154.9, 154.8, 154.7, 154.6, 154.6, 154.1, 154.1, 153.9, 152.9, 150.1,
148.9, 145.7, 145.0, 142.1, 142.1, 139.8, 139.7, 139.4, 137.4, 137.3, 137.0, 131.5, 128.5,
128.4, 128.3, 127.5, 123.2, 123.0, 121.4, 119.7, 119.6, 119.4, 118.4, 117.6, 116.5, 116.4, 32.3
(Ar-C, C(CH3)3). MS (MALDI-TOF) m/z 852.341 [M+H]+, calcd for C50H46N9OZn 852.312.
Mono-α-(trimethylamino)-ZnPc 2.5. Pc 2.4 (20 mg, 0.023 mmol), DIPA (0.2 mL,
1.44 mmol) and CH3I (0.5 mL, 8.0 mmol) were dissolved in dry DMF (0.3 mL) and the
mixture was stirred at 25 °C for 3 days and the excess solvents was removed. The solid was
dissolved in DCM (15 mL), washed with water (20 mL × 2) and the organic layer was
concentrated and purified on Sephadex G-100 column using DCM/methanol 5:1 for elution.
The product was obtained as a blue solid (18.2 mg, 75.8%), mp 204-206 oC. UV–Vis (DMF):
λmax (log ε) 351 nm (4.11), 620 nm (4.13), 684 nm (4.97). 1H NMR (acetone-d6): δ 9.47-9.16
(m, 6H, Ar-H), 8.85-7.82 (m, 8H, Ar-H), 7.50 (br, 2H, Ar-H), 3.72 (s, 4H, N-CH3), 3.62 (s,
5H, N-CH3), 1.80-1.71 (m, 27H, C(CH3)3). 13
C NMR (acetone-d6): δ 162.2, 156.0, 153.9,
150.4, 142.8, 140.3, 137.9, 130.9, 128.0, 123.2, 123.0, 122.8, 122.6, 119.9, 118.2, 117.7 (Ar-
C), 71.3 (N-Ar-C), 58.0, 57.9 (N-CH3), 36.5, 32.6 (C(CH3)3). MS (MALDI-TOF) m/z 894.434
[M-I]+, calcd for C53H52N9OZn 894.359.
Di-α-amino-ZnPc 2.6. A procedure related to that described for Pc 2.4 was used and
the purification via silica column chromatography using hexane/ethyl acetate 1:1 gave the N-
Boc protected ZnPc as a blue solid (76 mg, 19.4% yield), mp > 250 oC.
1H NMR (DMF-d7): δ
9.58-8.92 (m, 8H, Ar-H), 8.41-8.12 (m, 4H, Ar-H), 7.92-7.66 (m, 5H, Ar-H), 7.60-7.47 (m,

56
4H, Ar-H), 1.81-1.77 (m, 18H, C(CH3)3), 1.57, 1.51, 1.50, 1.46, 1.46, 1.42 (s, 18H, CH3). 13
C
NMR (acetone-d6): δ 169.5, 169.2, (C=O), 155.9, 155.7, 155.3, 155.0, 154.9, 154.7, 154.6,
154.4, 154.2, 154.0, 153.9, 153.8, 153.7, 153.5, 153.5, 153.3 153.0, 153.0, 152.9, 151.9,
151.6, 150.6, 142.0, 141.9, 141.4, 141.3, 141.0, 140.0, 139.9, 139.7, 139.5, 139.4, 139.2,
137.6, 137.3, 137.0, 136.7, 135.8, 135.6, 135.5, 135.0, 134.9, 130.4, 130.1, 129.7, 129.6,
129.2, 128.8, 128.6, 128.0, 127.6, 127.5, 127.3, 127.2, 123.7, 123.4, 123.3, 122.8, 122.7,
122.4, 122.1, 121.5, 121.3, 120.7, 120.1, 119.9, 119.4, 119.3, 119.1, 118.8, 118.4, 118.1,
117.6, 117.5, 117.4, 117.2 (Ar-C), 80.0, 79.8, 79.7 (N-Boc, C(CH3)3), 36.5, 36.4, 32.7, 32.5,
31.6, 31.4 (Ar-C, C(CH3)3), 28.9, 28.7, 28.6 (N-Boc, C(CH3)3). MS (MALDI-TOF) m/z
1102.455 [M]+, calcd for C62H58N10O6Zn 1102.383. The protected ZnPc was dissolved in
DCM/TFA, 1:1 (8 mL) and the solution was stirred for 2 h to afford Pc 2.6 (163.1 mg,
93.1%), mp > 250 oC. UV–Vis (DMF): λmax (log ε) 350 nm (4.55), 618 nm (4.31), 686 nm
(5.07). 1H NMR (DMF-d7): δ 9.57-8.99 (m, 6H, Ar-H), 8.41-8.16 (m, 4H, Ar-H), 7.93-7.69
(m, 2H, Ar-H), 7.35 (br, 4H, Ar-H), 6.82 (br, 4H, Ar-H), 1.83-1.67 (m, 18H, C(CH3)3). 13
C
NMR (DMF-d7): δ 156.2, 156.1, 155.6, 155.3, 155.1, 155.0, 154.8, 154.6, 154.5, 154.4, 154.1,
153.9, 153.5, 153.3, 153.2, 152.4, 150.9, 143.3, 142.3, 141.6, 140.2, 140.0, 139.8, 137.8,
137.6, 137.4, 132.5, 131.8, 131.5, 129.9, 129.2, 128.7, 128.5, 128.1, 123.9, 123.4, 122.2,
121.3, 120.0, 119.6, 119.5, 118.5, 118.1, 118.1, 117.5 (Ar-C), 32.6 (Ar-C, C(CH3)3). MS
(MALDI-TOF) m/z 903.352 [M+H]+, calcd for C52H43N10O2Zn 903.286.
Di-α-(trimethylamino)-ZnPc 2.7. ZnPc 2.6 (20 mg, 0.022 mmol), DIPA (0.15 mL,
1.07 mmol) and CH3I (0.2 mL, 3.21 mmol) mixture was dissolved in dry DMF (0.5 mL) and
stirred at room temperature for 3 days. Excess iodomethane was removed and the residue
purified as described above for ZnPc 2.5. The title compound 2.7 was isolated as a blue solid

57
(16.2mg, 58.9% yield), mp 195-197 oC. UV–Vis (DMF): λmax (log ε) 350 nm (4.64), 622 nm
(3.79), 686 nm (5.25). 1H NMR (acetone-d6): δ 9.55-9.36 (m, 4H, Ar-H), 9.04-8.93 (m, 1H,
Ar-H), 8.72-8.59 (m, 1H, Ar-H), 8.33-8.04 (m, 7H, Ar-H), 7.91-7.75 (m, 2H, Ar-H), 7.66-7.54
(m, 4H, Ar-H), 3.85-3.65 (m, 18H, N-CH3), 1.79-1.64 (m, 27H, C(CH3)3). 13
C NMR (acetone-
d6): δ 162.1, 161.7, 154.1, 153.7, 150.4, 143.0, 141.8, 140.5, 140.1, 138.1, 137.7, 132.1,
131.4, 130.3, 129.8, 128.2, 127.8, 123.8, 123.4, 123.0, 121.3, 119.8, 118.3, 117.7, (Ar-C),
66.3 (N-Ar-C), 57.9 (N-CH3), 36.4, 32.7, 32.3 (C(CH3)3). MS (MALDI-TOF) m/z 973.373
[M-2I-CH3]+, calcd for C57H53N10O2Zn
973.364.
Monoaminophenoxyphthalonitrile 2.9. A mixture of 4-nitrophthalonitrile (1 g, 5.8
mmol) and 4-aminophenol (0.7 g, 6.4 mmol) was dissolved in DMF (15 mL) and heated to
63°C. Then K2CO3 (2.63 g, 20 mmol) was added in six portions after every five minutes and
the mixture stirred 4 h under argon. It was cooled to room temperature and poured into ice-
cold water (500 mL). The filtered crude product (brown solid) was purified via silica column
chromatography using DCM/methanol (98:2). Organic solvents were removed to obtain a
yellow solid (1.0 g, 73.3%), mp 130 - 131°C. 1H NMR (d-CD2Cl2, 400 MHz): δ 7.70 (d, J =
8.6 Hz, 1H, Ar-H), 7.23 (t, J = 8.8 Hz, 2H, Ar-H), 6.87 (d, J = 7.8 Hz, 2H, Ar-H), 6.73 (d, J =
7.8, 2H, H-Ar), 3.86 (br, 2H, NH2). 13
C NMR (d-CDCl3, 100 MHz): δ 162.89, 145.32, 144.96,
135.36, 121.71, 120.98, 120.82, 117.31, 116.16, 115.84, 115.40, 107.96 (Ar-C, CN). MS
(MALDI-TOF) m/z 236.0813 [M+H]+, calcd for, C14H9N3O, 23.0818.
Mono-N-Boc-aminophenoxyphthalonitrile 2.10. A procedure related to that
described for phthalonitrile 2.3 was used the product obtained in 87.8% yield, mp 169-171 °C.
1H NMR (CD2Cl2): δ 7.73 (d, J = 8.7 Hz, 1H, Ar-H), 7.47 (d, J = 8.8 Hz, 2H, Ar-H), 7.27 (d, J
= 2.3 Hz, 1H, Ar-H), 7.23 (dd, J = 8.6, 1H, Ar-H), 7.03 (d, J = 8.6, 2H, Ar-H), 6.72 (br, 1H,

58
N-H), 1.51 (s, 9H, C(CH3)3). 13
C NMR (CDCl3): δ 162.2, 152.6, 148.5, 136.8, 135.4, 121.3,
121.2, 121.1, 117.5, 115.6, 115.2, 108.6 (Ar-C, CN), 80.7 (C=O), 28.0 (C(CH3)3). MS
(HRMS-ESI) m/z 336.1351 [M+H]+, calcd for C19H18N3O3 336.1348; 358.1189 [M+Na]
+,
calcd for C19H17N3O3Na 358.1162.
Mono-β-amino-ZnPc 2.11. A mixture of 4-tert-butylphthalonitrile (385 mg, 2.09
mmol), phthalonitrile 2.10 (231 mg, 0.69 mmol) and zinc(II) acetate (254.7 mg, 1.4 mmol)
was refluxed for 5 h, cooled and purified as described above for Pc 2.4 to afford a blue solid
(121.6 mg, 18.5%), mp > 250 oC.
1H NMR (acetone-d6): δ 9.31-8.55 (m, 8H, Ar-H), 8.40-8.12
(m, 4H, Ar-H), 8.10-7.85 (m, 2H, Ar-H), 7.75-7.60 (m, 2H, Ar-H), 1.95-1.87 (m, 27H,
C(CH3)3), 1.62 (d, J = 7.6, 9H, C(CH3)3). 13
C NMR (acetone-d6): δ 159.9, 159.8, 159.3, 159.2,
154.1, 154.0, 153.7, 153.4, 153.0, 152.7, 152.4, 139.2, 138.9, 138.8, 138.7, 138.4, 138.2,
137.1, 137.0, 136.8, 136.7, 136.4, 136.2, 127.3, 125.9, 124.0, 123.8, 123.6, 122.9, 122.6,
122.4, 121.9, 121.5, 121.3, 121.0, 120.8, 120.7, 119.6, 119.2, 112.2, 111.4, 110.8 (Ar-C), 80.2
(N-Boc-C(CH3)3), 55.5 (N-Ar-C), 36.4, 32.6 (Ar-C, C(CH3)3), 28.9 (N-Boc-C(CH3)3). MS
(MALDI-TOF) m/z 952.395 [M+H]+, calcd for C55H54N9O3Zn 952.364. The product was
dissolved in DCM/TFA, 1:1 (8 mL) and stirred for 2 h to afford product 2.11 (94.7 mg, 93.7
%), mp > 250 oC. UV–Vis (DMF): λmax (log ε) 349 nm (5.01), 610 nm (4.71), 677 nm (5.46).
1H NMR (Pyridine-d5): δ 10.02-9.70 (m, 6H, Ar-H), 9.63-9.41 (m, 1H, Ar-H), 8.44-7.96 (m,
4H, Ar-H), 7.47-7.39 (m, 2H, Ar-H), 7.18-7.10 (m, 2H, Ar-H), 5.09 (br, 2H, N-H), 1.72-1.65
(m, 27H, C(CH3)3). 13
C NMR (DMSO-d6): δ 160.6, 160.6, 160.3, 160.3, 152.4, 152.2, 152.0,
151.9, 151.8, 151.7, 151.6, 151.4, 151.1, 147.2, 147.0, 146.5, 146.4, 146.2, 145.0, 143.9,
139.6, 139.5, 138.2, 138.0, 137.9, 137.7, 135.8, 135.7, 135.6, 135.5, 135.4, 131.9, 131.7,
131.2, 130.1, 126.9, 126.6, 125.1, 123.5, 122.8, 122.0, 121.8, 121.5, 121.4, 120.9, 120.7,

59
119.7, 118.7, 118.3, 115.9, 115.6, 115.0, 109.6, 109.4, 108.5, 108.3, (Ar-C), 59.8 (N-Ar-C),
35.6, 31.4 (Ar-C, C(CH3)3). MS (MALDI-TOF) m/z 852.348 [M+H]+, calcd for C50H46N9OZn
852.312.
Mono-β-(trimethylamino)-ZnPc 2.12. ZnPc 2.11 (20 mg, 0.023 mmol), DIPA (0.2
mL, 1.44 mmol) and CH3I (0.5 mL, 8.0 mmol) were dissolved in dry DMF (0.3 mL). The
excess CH3I was removed and the resultant residue purified as described above to give a blue
solid (15.7 mg, 65.4%), mp 201-203 oC. UV–Vis (DMF): λmax (log ε) 355 nm (4.22), 618 nm
(3.90), 683 nm (4.80). 1H NMR (DMF-d7): δ 9.54-9.23 (m, 7H, Ar-H), 8.95 (br, 1H, Ar-H),
8.41-8.34 (m, 5H, Ar-H), 7.97-7.70 (m, 4H, Ar-H), 3.99 (s, 9H, N-3CH3), 1.82-1.76 (m, 27H,
C(CH3)3). 13
C NMR (DMF-d7): δ 160.2, 159.4, 157.9, 155.32, 154.8, 154.2, 154.1, 153.9,
143.7, 141.3, 140.1, 139.9, 137.7, 137.5, 132.5, 128.3, 125.3, 124.0, 123.8, 123.3, 122.3,
120.7, 120.3, 119.9, 115.9, 113.8, 113.6 (Ar-C), 71.3 (N-Ar-C), 57.3 (N-CH3), 32.6
(C(CH3)3). MS (MALDI-TOF) m/z 894.442 [M-I]+, calcd for C53H52N9OZn
894.359.
Di-β-amino-ZnPc 2.13. A procedure related to that described for Pc 2.11 was used
and purification via silica column chromatography using hexane/ethyl acetate 1:1 gave the
title ZnPc as a blue solid (98.0 mg, 25% yield), mp 214-216 oC.
1H NMR (DMF-d7): δ 9.67-
9.59 (m, 2H, Ar-H), 9.39-8.40 (m, 9H, Ar-H), 8.00-7.81 (m, 5H, Ar-H), 7.64-7.60 (m, 4H, Ar-
H), 1.88-1.82 (m, 18H, C(CH3)3), 1.61-1.59 (m, 18H, N-Boc-C(CH3)3). 13
C NMR (DMF-d7):
δ 164.9, 161.1, 161.0, 160.7, 154.5, 154.3, 153.9, 153.8, 153.6, 153.4, 153.3, 153.0, 152.8,
150.5, 141.2, 139.8, 138.7, 138.0, 139.7, 137.4, 136.8, 134.1, 128.3, 127.6, 126.2, 124.8,
123.1, 122.2, 121.9, 121.8, 121.6, 121.5, 121.3, 121.1, 120.9, 119.8, 112.3, 111.4, 110.9, (Ar-
C), 80.2 (C=O), 60.9 (N-Ar-C), 36.8, 32.7 (Ar-C, C(CH3)3), 29.0, 28.8 (N-Boc-C(CH3)3). MS
(MALDI-TOF) m/z 1103.463 [M+H]+, calcd for C62H59N10O6Zn 1103.391. The N-Boc-

60
protected ZnPc was dissolved in DCM/TFA, 1:1 (8 mL) and stirred for 2 h to obtain ZnPc
2.13 (73.8, 92.0% yield), mp > 250 oC. UV–Vis (DMF): λmax (log ε) 351 nm (4.90), 611 nm
(4.59), 679 nm (5.32). 1H NMR (DMSO-d6): δ 9.40-8.82 (m, 9H, Ar-H), 8.56-8.18 (m, 5H,
Ar-H), 7.87-7.60 (m, 4H, Ar-H), 7.28-6.77 (m, 7H, Ar-H), 5.20-5.00 (br, 3H, N-H), 1.82-1.77
(m, 18H, C(CH3)3). 13
C NMR (DMSO-d6): δ 160.7, 152.4, 152.2, 146.0, 139.6, 138.0, 135.4,
132.0, 131.8, 127.1, 123.8, 123.6, 121.5, 120.9, 118.8, 115.4, 114.9, 109.6, 108.3 (Ar-C),
35.6, 31.9, 31.5, 31.0, 30.7 (Ar-C, C(CH3)3). MS (MALDI-TOF) m/z 903.587 [M+H]+, calcd
for C52H43N10O2Zn 903.286.
Di-β-(trimethylamino)-ZnPc 2.14. ZnPc 2.13 (20 mg, 0.022 mmol), DIPA (0.15 mL,
1.07 mmol) and CH3I (0.2 mL, 3.21 mmol) were used to synthesize the title compound
following the same procedure described above for Pc 2.7. Product 2.14 was obtained as a blue
solid (14.6 mg, 53.1% yield), mp > 218-220 oC. UV–Vis (DMF): λmax (log ε) 355 nm (4.41),
618 nm (4.08), 683 nm (4.96). 1H NMR (DMF-d7): δ 9.60-9.9.06 (m, 9H, Ar-H), 8.36-8.24
(m, 6H, Ar-H), 7.66-7.57 (m, 4H, Ar-H), 7.40-7.37 (m, 1H, Ar-H), 7.05-7.02(m, 1H, Ar-H),
3.98-3.93 (m, 18H, N-6CH3), 1.78-1.71 (m, 18H, C(CH3)3). 13
C NMR (DMF-d7): δ 160.1,
158.1, 155.4, 154.0, 149.4, 143.7, 141.9, 140.4, 137.9, 136.4, 128.2, 125.3, 124.0, 123.1,
122.3, 122.1, 120.3, 119.9, 119.8, 115.1, 113.6, (Ar-C), 71.3 (N-Ar-C), 58.0 (N-CH3), 41.5,
32.5 (C(CH3)3). MS (MALDI-TOF) m/z 973.654 [M-2I-CH3]+, calcd for C57H53N10O2Zn
973.364.
Tetra-β-amino-ZnPc 2.15. A mixture of phthalonitrile 2.10 (0.5 g, 1.49 mmol) and
zinc(II) acetate (0.095 g, 0.5 mmol) was dissolved in DMAE (5.0 mL) and refluxed under
argon. Two drops of DBN were added and the solution refluxed for another 6 h. The solvent
was removed and the crude purified via alumina column chromatography using
61
DCM/methanol 95:5 for elution. The product was further purified via a second alumina
column using DCM/methanol 9:1 for elution to isolate a dark green solid (105.6 mg, 20.2%),
mp > 250 oC.
1H NMR (THF-d8): δ 9.12-8.66 (m, 12H, Ar-H), 7.93-7.68 (m, 8H, Ar-H), 7.46-
7.31 (br, 8H, Ar-H), 7.16 (br, 8H, Ar-H), 1.55 (s, 36H, C(CH3)3). 13
C NMR (THF-d8): δ
160.9, 154.6, 154.1, 153.2, 152.8, 141.5, 137.6, 137.1, 134.4, 124.9, 121.2, 120.6, 112.1,
111.5 (Ar-C), 79.9 (N-Boc-C(CH3)3), 62.9, 59.1, 45.9 (N-Ar-C), 28.87 (N-Boc, C(CH3)3). MS
(MALDI-TOF) m/z 1405.819 [M+H]+, calcd for C76H69N12O12Zn 1405.445. The solid was
dissolved in DCM/TFA, 1:1 and stirred at 0 C for 3 h. The solvent was removed and the
resulting residue was treated with 2 N NaOH (1 mL). The product was re-dissolved in 20 mL
DCM/methanol and washed with water (2 x 50 mL). The organic phase was concentrated to
obtain a green solid (72.4 mg, 96.1%), mp > 250 oC. UV-Vis (DMF): λmax (log ε) 352 nm
(4.63), 613 nm (4.31), 682 nm (5.01). 1H NMR (DMF-d7): δ 9.89 (br, 1H, Ar-H), 9.34-9.28
(m, 3H, Ar-H), 8.88-8.70 (m, 3H, Ar-H), 7.46-7.31 (m, 8H, Ar-H), 7.83 (br, 7H, Ar-H), 7.47
(br, 4H, Ar-H), 7.21 (br, 4H, Ar-H), 6.93 (br, 4H, Ar-H). 13
C NMR (DMF-d7): δ 160.0, 159.5,
155.2, 154.0, 147.5, 142.0, 137.3, 135.4, 134.9, 134.3, 131.6, 124.8, 122.5, 121.2, 120.0,
116.5, 111.4, 110.1 (Ar-C), 63.4, 59.2, 154.5, 46.3 (N-Ar-C), 28.9 (N-Boc, C(CH3)3). MS
(MALDI-TOF) m/z 1004.313 [M+H]+, calcd for C56H36N12O4Zn 1004.227.
Tetra-β-trimethylamino-ZnPc 2.16. ZnPc 2.15 (24.4 mg, 0.023 mmol) was
dissolved in DMF (0.4 mL). Methyl iodide (3 mL, 48.2 mmol) and DIPA (0.2 mL, 1.42
mmol) were added and the mixture was stirred at 25 °C for 3 days. Excess iodomethane was
removed, acetone added to triturate the product and then solution centrifuged to isolate title
compound as a blue-green solid (31.9 mg, 82.4%), mp 194-196 oC. UV–vis (DMF): λmax (log
ε) 358 nm (4.62), 620 nm (4.31), 684 nm (5.08). 1H NMR (DMF-d7): 9.49-9.32 (m, 2H, Ar-

62
H), 9.00-8.89 (m, 2H, Ar-H), 8.34 (br, 5H, Ar-H), 7.85-7.75 (m, 7H, Ar-H), 7.71-7.64 (m, 7H,
Ar-H), 7.53-7.47 (m, 6H, Ar-H), 4.07-4.01 (m, 36H, N-CH3). 13
C NMR (DMSO-d6): δ 158.2,
156.9, 153.1, 152.2, 151.8, 142.5, 142.3, 140.1, 139.9, 135.4, 134.9, 134.5, 133.5, 124.45,
124.3, 124.2, 123.0, 122.9, 122.7, 121.3, 121.1, 120.4, 120.1, 119.9, 119.5, 119.2, 119.1,
114.2, 112.8, 112.1 (Ar-C), 64.2 (N-Ar-C), 58.1, 56.8, 53.2 (N-CH3). MS (MALDI-TOF) m/z
1131.406 [M-4I-3CH3]+, calcd for C65H55N12O4Zn 1131.3761.
4,5-Di-N-Boc-amino-phthalonitrile 2.18. The compound was obtained by reacting
4,5-dichlorophthalonitrile and N-Boc-4-aniline in DMF and isolated in 82.6% yield, following
the procedure described above for phthalonitrile 2.3; mp 203-205 °C. 1H NMR (CDCl3): δ
7.47 (d, J = 8.8 Hz, 4H, Ar-H), 7.15 (s, 2H, Ar-H), 7.05 (d, J = 8.8 Hz, 4H, Ar-H), 6.66 (br,
2H, N-H), 1.51 (s, 18H, 2×C(CH3)3). 13
C NMR (CDCl3): δ 152.8, 152.2, 148.9, 136.9, 136.5,
121.0, 120.9, 120.5, 115.6, 115.01, 110.0, 101.5 (Ar-C, CN), 81.0 (C=O), 28.3 (C(CH3)3). MS
(ESI) m/z 565.2036 [M+Na]+, calcd for C30H30N4O6Na 565.2058.
Di-β-amino-ZnPc 2.19. A mixture of 4-tert-butylphthalonitrile (385 mg, 2.09 mmol),
phthalonitrile 2.18 (374 mg, 0.69 mmol) and zinc(II) acetate (254.7 mg, 1.4 mmol) was used
and a procedure related to that described for Pc 2.4 was followed to obtain a blue solid (81
mg, 10.1%), mp > 250 oC
1H NMR (DMF-d7): δ 9.56 - 9.24 (m, 7H, Ar-H), 9.12 - 9.02 (m,
1H, Ar-H), 8.91 – 8.83 (m, 2H, Ar-H), 8.42 – 8.31 (m, 3H, Ar-H), 7.89 – 7.79 (m, 4H, Ar-H),
7.52 – 7.40 (m, 4H, Ar-H), 1.85 -1.79 (m, 27H, C(CH3)3), 1.58 – 1.53 (m, 18H, Boc-
C(CH3)3). 13
C NMR (DMF-d7): δ 154.5, 154.2, 154.0, 153.3, 152.7, 152.2, 151.6, 151.4,
151.1, 150.6, 150.4, 139.6, 137.5, 137.3, 137.0, 135.6, 135.2, 128.5, 123.2, 121.0, 120.6,
120.4, 120.3, 119.7, 119.5, 119.4, 119.2, 115.5, 113.7, 80.2 (C=O), 80.0 (C=O), 32.6 (Ar-C,
C(CH3)3), 29.9 (C(CH3)3), 28.9 (C(CH3)3). MS (MALDI-TOF) m/z 1158.465 [M]+, calcd for

63
C66H66N10O6Zn 1158.446. The product was dissolved in DCM/TFA, 1:1 and for 2 h to obtain
the product as a blue solid (61 mg, 9.2% overall yield), mp > 250 oC. UV–vis (DMF): λmax
(log ε) 353 nm (4.98), 611 nm (4.65), 677 nm (5.43). 1H NMR (DMSO-d6): δ 9.34-9.13 (m,
6H, Ar-H), 9.07-8.97 (m, 1H, Ar-H), 8.74-8.71 (m, 1H, Ar-H), 8.31-8.26 (m, 1H, Ar-H), 8.16-
8.11 (m, 2H, Ar-H) 7.17-7.11 (m, 3H, Ar-H), 6.94-6.88 (m, 3H, Ar-H), 6.70-6.58 (br, 2H, Ar-
H), 4.93 (br, 4H, N-H), 1.79-1.71 (m, 27H, C(CH3)3). 13
C NMR (DMSO-d6): δ 152.9, 151.5,
147.1, 138.6, 136.2, 136.1, 133.8, 133.3, 127.6, 122.4, 121.1, 121.0, 120.1, 119.9, 118.8,
116.1, 115.8, 110.7, 32.3 (Ar-C, C(CH3)3). MS (MALDI-TOF) m/z 959.34 [M+H]+, calcd for
C56H51N10O2Zn 959.35.
Di-β-trimethylamino-ZnPc 2.20. A mixture of ZnPc 2.19 (20 mg, 0.023 mmol),
DIPA (0.2 mL, 1.44 mmol) and CH3I (1.0 mL, 16.0 mmol) was dissolved in dry DMF (0.4
mL) and stirred at 25 °C for 3 days. Excess iodomethane was removed and the residue
purified as described above for Pc 2.5. The product was isolated as a blue solid (19.5 mg,
72.0%), mp 190 oC (decomp). UV–vis (DMF): λmax (log ε) 357 nm (4.50), 619 nm (4.16), 684
nm (5.01). 1H NMR (DMF-d7): δ 9.56-9.23 (m, 9H, Ar-H), 8.45-8.28 (m, 7H, Ar-H), 7.60 (br,
3H, Ar-H), 3.96 (s, 18H, N-6CH3), 1.78-1.71 (m, 27H, C(CH3)3). 13
C NMR (DMF-d7): δ
159.8, 156.2, 155.5, 154.8, 154.1, 152.3, 149.0, 143.7, 140.3, 137.9, 137.1, 128.2, 123.9,
123.0, 119.8, 119.4, 119.1, 117.2, 116.3 (Ar-C), 71.3 (N-Ar-C), 58.0 (CH3), 32.6 (C(CH3)3).
MS (MALDI-TOF) m/z 1029.416 [M-2I-CH3]+, calcd for C61H61N10O2Zn 1029.427.
Octa-β-amino-ZnPc 2.21. A mixture of phthalonitrile 2.18 (0.745 g, 1.37 mmol) and
zinc(II) acetate (0.420 g, 2.29 mmol) was dissolved in DMAE (6.0 mL) under argon. Catalytic
amount of DBN was added and the solution was refluxed for 6 h. The solvent was removed
and the residue was purified on a Sephadex LH-20 column using methanol for elution. The

64
product was isolated as a green solid (462.0 mg, 59.0%), mp > 250 oC
1H NMR (DMSO-d6): δ
8.97 (s, 4H, Ar-H), 8.55 (s, 4H, Ar-H), 7.55 (s, 16H, Ar-H), 7.16 (s, 16H, Ar-H), 1.52 (s, 72H,
C(CH3)3). 13
C NMR (DMSO-d6): δ 154.6, 154.0, 151.7, 136.9, 135.9, 120.4, 120.0, 119.5,
115.3, (Ar-C), 79.8 (C=O), 63.1, 62.9, 59.4, 59.3 (N-Ar-C), 46.1, 28.9 (N-Boc, C(CH3)3). MS
(MALDI-TOF) m/z 2277.901 [M]+, C123H129N16O24Zn 2277.866. The compound was
dissolved in DCM/TFA, 1:1 and the solution was stirred for 2 h. The title product was isolated
as a green solid (246.4 mg, 84.8%), mp > 250 oC. UV–vis (DMF): λmax (log ε) 361 nm (4.62),
615 nm (4.22), 689 nm (5.06). 1
H NMR (DMSO-d6): δ 7.52 (br, 8H, Ar-H), 7.16-6.60 (m,
32H, Ar-H). 13
C NMR (DMSO-d6): δ 153.6, 152.3, 145.7, 134.5, 120.0, 119.8, 115.2, (Ar-C),
61.7, 57.7, 53.1, 45.3 (N-Ar-C). MS (MALDI-TOF) m/z 1432.383 [M]+, calcd for
C80H56N16O8Zn 1432.376.
Octa-β-trimethylamino-ZnPc 2.22. ZnPc 2.21 (18.0 mg, 0.0126 mmol) was
dissolved in DMF (8 mL). Methyl iodide (3 mL, 48.2 mmol) and DIPA (0.2 mL, 1.42 mmol)
were added and the mixture stirred at 25 °C for 3 days. Excess solvents were removed,
acetone (5 mL) added to triturate the product and the solution centrifuged to obtain the
product as a green solid (31.9 mg, 90.9%), mp 188-190 oC. UV–vis (DMF): λmax (log ε) 365
nm (4.57), 620 nm (4.24), 686 nm (5.17). 1H NMR (D2O): δ 7.96-7.47 (m, 40H, Ar-H), 3.80-
3.30 (m, 72H, N-CH3). 13
C NMR (D2O): δ 158.1, 152.1, 142.0, 136.01, 134.8, 122.7, 120.1,
118.2, 117.6, 116.3, 114.4, (Ar-C), 64.1 (N-Ar-C), 62.6, 58.0, 56.7, 53.1, 42.2, 16.2 (N-CH3).
MS (MALDI-TOF) m/z 1671.679 [M-8I-7CH3]+, calcd for C97H91N16O8Zn 1671.650.
Di-α-amino-ZnPc 2.24. A mixture of 2,2’-bis(2,3-dicyanophenoxy)biphenyl 2.2329
(302.3 mg, 0.69 mmol), phthalonitrile 2.3 (480.0 mg, 1.43 mmol) and zinc acetate (254.7 mg,
1.4 mmol) was dissolved in DMAE (5.0 mL). Catalytic amount of DBN was added and the
65
mixture refluxed at for 5 h. The solvent was removed and the residue purified via silica gel
column chromatography using ethyl acetate solvent for elution. Further purification via a
second silica column using hexane/ethyl acetate 1:1 for elution, gave a blue solid (112.2 mg,
13.9 %), mp > 250 oC.
1H NMR (DMF-d7): δ 9.53-9.07 (m, 5H, Ar-H), 8.41-8.06 (m, 4H, Ar-
H), 7.80-7.15 (m, 19H, Ar-H), 1.56 - 1.49 (m, 18H, C(CH3)3). 13
C NMR (DMF-d7): δ
161169.6, 168.0 (C=O), 159.0, 156.3, 156.2, 156.1, 154.9, 154.7, 154.6, 154.5, 154.4, 154.3,
154.2, 154.1, 154.0, 153.8, 153.6, 153.4, 153.0, 152.5, 152.4, 151.0, 150.8, 138.7, 137.4,
137.1, 136.6, 136.3, 135.5, 133.2, 132.0, 131.6, 131.3, 131.0, 130.8, 130.6, 130.3. 129.9,
129.3, 129.0, 128.9, 128.2, 126.5, 126.3, 125.7, 124.7, 124.2, 122.3, 122.2, 122.1, 121,6,
121.5, 121.3,121.2, 121.0, 120.9, 120.8, 119.7, 119.6, 119.2, 118.2, 118.1, 117.5, 117.0,
116.4, 112.9 (Ar-C), 80.3, 80.1, 80.0 (O-C(CH3)3), 28.94, 28.86 (C(CH3)3). MS (MALDI-
TOF) m/z 1173.440 [M+H]+, calcd for C66H49N10O8Zn 1173.303. The N-Boc-protected ZnPc
(85.06 mg, 0.073 mmol) was dissolved in a 1:1, mixture of DCM/TFA (6 mL) and the
solution was stirred at 0 C for 3 h. The work-up as described above, gave a blue-greenish
solid (65.4 mg, 92.1 %). UV-Vis (DMF): λmax (log ε) 336 nm (4.37), 624 nm (4.13), 691
(4.89) nm. 1H NMR (DMF-d7): δ 9.41-6.27 (m, 28H, Ar-H), 4.12 (br, 4H, NH2).
13C NMR
(DMF-d7): δ 159.0, 155.2, 155.0, 154.1, 153.0, 152.3, 150.9, 148.5, 146.5, 146.2, 142.8,
140.4, 133.1, 131.0, 129.9, 129.6, 129.3, 127.9, 126.3, 122.2, 122.0, 121.8, 121.1, 117.9,
117.3, 116.6, 116.3, 112.9 (Ar-C). MS (MALDI-TOF) m/z 973.210 [M+H]+, calcd for
C56H33N10O4Zn, 973.1978.
Di-α-(trimethylamino)-ZnPc 2.25. ZnPc 2.24 (20 mg, 0.021 mmol), DIPA (0.15 mL,
1.07 mmol) and CH3I (0.2 mL, 3.21 mmol) were added to dry THF (0.5 mL) and the mixture
stirred at 25 °C for 3 days. The reaction was treated as described above for ZnPc 2.22 to give

66
Pc 2.25 as a pale-green solid (14.7 mg, 53.3%), mp > 250 oC. UV–Vis (DMF): λmax (log ε)
337 nm (4.61), 613 nm (4.51), 685 nm (5.26). 1H NMR (DMF-d7): δ 9.52-9.36 (m, 3H, Ar-H),
8.79-8.63 (m, 1H, Ar-H), 8.44-8.36 (m, 2H, Ar-H), 8.30-8.18 (m, 6H, Ar-H), 8.10-7.95 (m,
2H, Ar-H), 7.78-7.72 (m, 5H, Ar-H), 7.58-7.55 (m, 2H, Ar-H), 7.33-7.06 (m, 7H, Ar-H), 3.95
(s, 8H, N-CH3), 3.85-3.81 (m, 10H, N-CH3). 13
C NMR (DMF-d7): δ 161.5, 160.0, 159.0,
154.5, 154.3, 153.8, 153.5, 153.2, 152.7, 151.0, 150.7 143.9, 143.2, 143.1, 142.7, 133.2,
132.4, 131.8, 131.2, 129.9, 129.3, 126.7, 126.5, 126.2, 124.2, 124.0, 123.6, 123.4, 122.1,
121.9 121.4, 121.0, 119.7, 118.5, 118.3, 112.9 (Ar-C), 66.29 (N-Ar-C), 58.1, 58.0 (N-CH3).
MS (MALDI-TOF) m/z 1045.304 [M-2I-CH3+2H]+, calcd for C61H45N10O4Zn
+ 1045.2917.
Di-β-amino-ZnPc 2.26. A mixture of 2,2’-bis(2,3-dicyanophenoxy)biphenyl 2.2329
(302.3 mg, 0.69 mmol), phthalonitrile 2.10 (480.0 mg, 1.43 mmol) and zinc acetate (254.7
mg, 1.4 mmol) was dissolved in DMAE (100.0 mL). Catalytic amount of DBN was added and
the reaction refluxed for 15 h. The product was purified as described above for 2.24 to give N-
Boc-protected title compound as a blue solid (94.6 mg, 11.4%), mp > 250 oC.
1H NMR
(DMF-d7): δ 9.59-9.54 (m, 2H, Ar-H), 9.26-9.06 (m, 2H, Ar-H), 8.67-8.26 (m, 3H, Ar-H),
810-8.05 (m, 1H, Ar-H), 7.98-7.14 (m, 19H, Ar-H), 1.59 - 1.51 (m, 18H, C(CH3)3). 13
C NMR
(DMF-d7): δ 169.6, 168.0 (C=O), 161.3, 161.2, 161.14, 161.06, 159.11, 159.07, 154.9, 154.5,
154.3, 154.0, 153.6, 153.1, 152.9, 152.8, 152.5, 151.6, 150.8, 15.7, 142.7, 142.4, 141.2, 137.9,
137.8, 137.4, 136.4, 133.6, 133.2, 131.3, 131.2, 130.8, 130.7, 130.3, 129.9, 129.4, 126.3,
126.2, 125.7, 125.0, 124.9, 124.8, 122.1, 121.7, 121.5, 121.3, 121.1, 120.9, 118.2, 112.9,
111.9 (Ar-C), 80.2 (O-C(CH3)3), 28.9, 28.8 (C(CH3)3). MS (MALDI-TOF) m/z 1173.419
[M+H]+, calcd for C66H48N10O8Zn 1173.303. The N-Boc-protected ZnPc (51.6 mg, 0.044
mmol) was dissolved in 6 mL of DCM/TFA (1:1) and stirred at 0 C for 3 h. The product was

67
isolated as a blue-greenish solid (38.2 mg, 89.2 %). UV-Vis (DMF): λmax (log ε) 350 nm
(4.29), 616 nm (3.99), 684 (4.72) nm. 1H NMR (DMF-d7): δ 9.84-6.34 (m, 28H, Ar-H), 4.30
(br, 4H, NH2). 13
C NMR (DMF-d7): δ 159.1, 156.2, 155.0, 154.3, 153.0, 150.9, 150.6, 148.8,
143.0, 142.2, 140.4, 134.2, 133.2, 131.2, 131.0, 130.9, 129.9, 129.6, 129.3, 126.2, 125.7,
125.4, 122.2, 122.0, 121.2, 116.9, 112.8, 109.8h (Ar-C). MS (MALDI-TOF) m/z 973.228
[M+H]+, calcd for C56H33N10O4Zn, 973.1978.
Di-β-(trimethylamino)-ZnPc 2.27. A mixture of ZnPc 2.26 (20 mg, 0.021 mmol),
DIPA (0.15 mL, 1.07 mmol) and iodomethane (0.2 mL, 3.21 mmol) was added to dry THF
(0.5 mL) and stirred at 25 °C for 3 days. The ZnPc 2.27 was isolated as a blue-green solid
(16.1 mg, 58.3%), mp > 250 oC. UV–Vis (DMF): λmax (log ε) 350 nm (4.72), 613 nm (4.48),
680 nm (5.23). 1H NMR (DMF-d7): δ 9.27-8.66 (m, 3H, Ar-H), 8.37-8.30 (m, 5H, Ar-H),
8.15-8.06 (m, 1H, Ar-H), 7.91-7.55 (m, 9H, Ar-H), 7.41-7.25 (m, 7H, Ar-H), 4.02-3.97 (m,
18H, N-CH3). 13
C NMR (DMF-d7): δ 159.9, 158.9, 158.4, 158.2, 154.4, 154.0, 153.6, 150.8,
143.9, 143.8, 141.8, 141.4, 136.2, 135.9, 135.6, 133.3, 131.6, 131.3, 131.0, 130.0, 129.3,
126.2, 125.3, 124.1, 122.5, 122.1, 121.1, 120.6, 120.2, 114.2, 113.8, 113.0 (Ar-C), 66.29 (N-
Ar-C), 58.1 (N-CH3). MS (MALDI-TOF) m/z 1312.435 [M]+, 1029.296 [M-2I-2CH3+H]
+,
calcd for C62H46N10I2O4Zn+ 1312.1084, C60H41N10O4Zn
+ 1029.2604.
2.6.3. Phthalonitrile Molecular Structures
X-ray structure analyses of phthalonitriles 2.3, 2.9, 2.10, 2.18 and 2.23 were based on
data collected at T=90K on either a Nonius KappaCCD diffractometer equipped with MoKα
radiation (compound 2.3) or a Bruker Kappa Apex-II CCD diffractometer with CuKα
radiation (compounds 2.10, 2.18 and 2.23). The crystals were grown by slow evaporation of
mixed solvents DCM/hexanes 5:1. The X-ray structures of these phthalonitriles confirm their

68
successful syntheses. Crystal data: 2.3, C19H17N3O3, Mr = 335.36, monoclinic space group
P21/c, a = 16.266(4), b = 11.114(3), c = 9.8401(16) Å, = 101.629(13)°, V = 1742.4(7) Å3, Z
= 4, Dx = 1.278 Mg m−3
, max = 30.0°, R = 0.047 for 5047 data and 232 refined parameters,
CCDC 810389; 2.10, C19H17N3O3, Mr = 335.36, orthorhombic space group Pca21, a =
10.139(2), b = 8.597(2), c = 20.157(5) Å, V = 1757.0(7) Å3, Z = 4, Dx = 1.268 Mg m
−3 , max =
68.1°, R = 0.032 for 2507 data and 233 refined parameters, CCDC 810390; 2.18, C30H30N4O6,
Mr = 542.58, triclinic space group P-1, a = 10.0348(5), b = 12.0728(6), c = 13.3158(10) Å,
= 110.460(5), = 102.622(4), = 101.132(4)°, V = 1409.38(15) Å3, Z = 2, Dx = 1.279 Mg
m−3
, max = 68.6°, R = 0.037 for 4972 data and 373 refined parameters, CCDC 810391. 2.23,
C28H14N4O2, 2.4(CH2Cl2), Mr = 642.25, triclinic space group P-1, a = 8.9371(4), b =
10.3208(5), c = 16.1899(7) Å, = 77.863(2), = 81.983(2), = 78.622(2)°, V = 1423.75(11)
Å3, Z = 2, Dx = 1.498 Mg m
−3 , max = 69.4°, R = 0.066 for 5068 data and 334 refined
parameters, CCDC 835347.
2.6.4. Spectroscopic Studies
The absorption spectra for the ZnPcs were measured on a PerkinElmer, Lambda 35
UV-Vis spectrometer. The solvents used in these measurements were HPLC grade. The stock
solutions of 0.1-1 mM of each ZnPc in DMF were prepared and successive dilutions were
obtained by spiking 20 – 250 µL of the corresponding stock solution into 10 or 18 mL of
DMF solvent. The emission spectra were recorded on a Fluorolog®
-HORIBA JOBIN YVON
(Model LFI-3751) spectrofluorimeter. The optical densities for the solutions used in emission
measurements ranged between 0.05 – 0.10 at excitation wavelengths. All the measurements
were performed within 2 h of solution preparation at 25 °C, using a 10 mm path length
spectrophotometric cell. The fluorescent quantum yields (Фf) were measured in DMF solvent

69
using a secondary standard method,33
and ZnPc (Фf = 0.17) used as reference.40,41,48
The
singlet oxygen quantum yields (Ф∆) were measured in DMF using a relative method,43
where
ZnPc (Фf = 0.56) served as reference and DPBF as a scavenger. The samples, both the stock
and dilutions, were prepared in the dark. The concentration of DPBF was kept at ~ 3.0 × 10⁻⁵
mol/l to avoid multiple reactions. The monitoring of DPBF absorption decay at 417 nm was
used to calculate the singlet oxygen quantum yields for the ZnPcs within ~ 10% accuracy
2.6.5. Cell Studies
The human carcinoma HEp2 cells used in this study were maintained in a 50:50
mixture of DMEM:AMEM (Invitrogen) supplemented with 5% FBS (Invitrogen), Primocin
antibiotic (Invitrogen) and 5% CO2 at 37 oC. By subculturing the cells twice weekly,
subconfluency of stocks was maintained. The 4th
to 15th passage cells were used for all the
measurements.
Time-Dependent Cellular Uptake: The HEp2 cells for cellular uptake experiments
were plated at 7500 cells per well in a Costar 96-well plate. They were then allowed to grow
for 48 h. The ZnPc stock solutions were prepared at 32 mM in DMSO. Subsequent dilution
gave 20 µM in medium (a 2X stock). Further dilution into the cells of the 96-well plate gave a
final concentration of 10 µM, with a maximum DMSO concentration of 1%. The uptake of the
ZnPcs was allowed to continue for 0, 1, 2, 4, 8, 12 and 24 h. The termination of the uptake
was achieved by removing the loading medium and washing the wells with PBS. The
concentration of the ZnPcs was calculated from standard curves using intrinsic fluorescence
as measured with a BMG FLUOstar plate reader fitted with a 355 nm excitation and a 650 nm
emission filter, as it has been previously described.15
The cells were measured using a
70
CyQuant cell proliferation assay (Invitrogen) as per manufactures instruction, and the uptake
was expressed in terms of nM compound per cell.
Dark Cytotoxicity: The plating of the HEp2 cells was performed as described above
for the uptake measurements. The ZnPcs were diluted into medium to a 400 µM
concentration. Then 2-fold serial dilutions were prepared to 50 µM, and the cells incubated
overnight. The cell toxicity was obtained using Promega’s Cell Titer-Blue Viability assay
according to manufacturer’s instructions. The untreated cells were considered 100% viable
while those treated with 0.2% saponin were considered 0% viable. The IC50 values were
calculated from dose-response curves, which were obtained using GraphPad Prism software.
Phototoxicity: The plating of the HEp2 cells was achieved as described above with
compounds concentration range from 6.25-100 µM. After overnight loading, the medium was
replaced with the medium containing 50 mM HEPES at pH 7.2. The cells were then exposed
to a NewPort light system with 175 W halogen lamp for 20 min and filtered through a water
film to provide approximately 1.5 J/cm2 light dose. The cells were cooled by placing the
culture on a 5 oC Echotherm chilling/heating plate (Torrey Pines Scientific, Inc.) and the plate
was incubated overnight. The cell viability was then calculated as described above for the
dark cytotoxicity.
Microscopy: The cells for microscopy were incubated in a glass bottom 6-well plate
(MatTek) and allowed to grow for 48 h. They were then exposed to 10 µM of each ZnPc
overnight. Organelle tracers from Invitrogen were used at the following concentrations:
LysoSensor Green 50 nM, MitoTracker Green 250 nM, ER Tracker Blue/white 100 nM, and
BODIPY FL C5 ceramide 1 µM. The organelle tracers diluted in medium and the cells were
incubated concurrently with ZnPcs and tracers for 30 minutes before washing 3 times with
71
PBS and microscopy. The microscopy images were obtained using a Leica DMRXA
microscope with 40× NA 0.8dip objective lens and DAPI, GFP and Texas Red filter cubes
(Chroma Technologies).
2.7. References
1. Han, G-F.; Wang, J-J.; Shim, Y. K. J. Photosci. 2001, 8 (2), 71-73.
2. Richter, A. M.; Cerruti-Sola, S.; Sternberg, E. D.; Dolphin, D.; Levy, J. G. J. Photochem.
Photobiol. B: Biology 1990, 5 (2), 231-244.
3. Stolik, S.; Delgado, J. A.; Pérez, A.; Anasagasti, L. J. Photochem. Photobiol. B, Biology
2000, 57 (2-3), 90-93.
4. Martins, J.; Almeida, L.; Laranjinha, J. Photochem. Photobiol. 2004, 80 (2), 267-273.
5. Ali, H.; van Lier, J. E. Chem. Rev. 1999, 99, 2379-2450.
6. Allen, C. M.; Sharman, W. M.; van Lier, J. E. J. Porphyrins Phthalocyanines 2001, 5,
161-169.
7. Ben-Hur, E.; Chan, W.-S. In The Porphyrin Handbook, K. M. Kadish, K. M. Smith, R.
Guilard, R. (Eds.), Academic Press: Boston 2003, 19, 1-35.
8. Wohrle, D.; Iskander, N.; Graschew, G.; Sinn, H.; Friedrich, E. A.; Maierborst, W.; Stern,
J.; Schlag, P. Photochem. Photobiol. 1990, 51, 351-356.
9. Reddi, E.; Ceccon, M.; Valduga, G.; Jori, G.; Bommer, J. C.; Elisei, F.; Latterini, L.;
Mazzucato, U. Photochem. Photobiol. 2002, 75, 462-470.
10. Sol, V.; Branland, P.; Chaleix, V.; Granet, R.; Guilloton, M.; Lamarche, F.; Verneuil, B.;
Krausz, P. Bioorg. Med. Chem. Lett. 2004, 14, 4207-4211.
11. Minnock, A.; Vernon, D. I. Schofield, J.; Griffiths, J.; Parish, J. H.; Brown, S. B. J.
Photochem. Photobiol. B: Biol. 1996, 32, 159-164.
12. Dummin, H.; Cernay, T.; Zimmermann, H. W. J. Photochem. Photobiol. B:Biol. 1997, 37,
219-229.
13. Kessel, D.; Luguya, R.; Vicente, M. G. H. Photochem. Photobiol. 2003, 78, 431-435.
14. Sibrian-Vazquez, M.; Nesterova, I. V.; Jensen, T. J.; Vicente, M. G. H. Bioconjugate
Chem. 2008, 19, 705-713.
15. Jensen, T. J.; Vicente, M. G. H.; Luguya, R.; Norton, J.; Fronczek, F. R.; Smith, K. M. J.
Photochem. Photobiol. B: Biol. 2010, 100, 100-111.

72
16. Duan, W. B.; Lo, P. C.; Duan, L.; Fong, W. P.; Ng, D. K. P. Bioorg. Med. Chem. 2010,
18, 2672-2677.
17. Ongarora, B. G.; Hu, X.; Li, H.; Fronczek, F. R.; Vicente, M. G. H. MedChemComm
2012, 3 (2), 179-194.
18. Ricchelli, F.; Franchi, L.; Miotto, G.; Borsetto, L.; Gobbo, S.; Nikolov, P.; Bommer, J. C.;
Reddi, E. Int. J. Biochem. Cell Biol. 2005, 37, 306-319.
19. Li, H.; Fronczek, F. R.; Vicente, M. G. H. J. Med. Chem. 2008, 51, 502-511.
20. Villanueva, A. J. Photochem. Photobiol. B: Biol. 1993, 18, 295-298.
21. McMillin, D. R.; Shelton, A. H.; Bejune, S. A.; Fanwick, P. E.; Wall, R. K. Coord. Chem.
Rev. 2005, 249, 1451-1459.
22. Caminos, D. A.; Durantini, E. N. J. Photochem. Photobiol. A: Chem. 2008, 198, 274-281.
23. Fu, B. Q.; Zhang, D.; Weng, X. C.; Zhang, M.; Ma, H.; Ma, Y. Z.; Zhou, X. Chem. Eur. J.
2008, 14, 9431-9441.
24. B. Chen, B.; Wu, S.; Li, A. X.; Liang, F.; Zhou, X.; Cao, X. P.; He, Z. K. Tetrahedron
2006, 62, 5487-5497.
25. Sibrian-Vazquez, M.; Ortiz, J.; Nesterova, I. V.; Fernández-Lázaro, F.; Sastre-Santos, A.;
Soper, S. A.; Vicente, M. G. H. Bioconjugate Chem. 2007, 18, 410-420.
26. Lowery, M. K.; Starshak, A. J.; Esposito, J. N.; Paul C. Krueger, P. C.; Kenney, M. E.
Inorg. Chem. 1965 4 (1), 128-128.
27. Wohrle, D.; Eskes, M.; Shigehara, K.; Yamada, A. Synthesis-Stuttgart 1993, 194-196.
28. Sharman, W. M.; van Lier, J. E. In The Porphyrin Handbook, K. M. Kadish, K. M. Smith,
R. Guilard, (Eds), Academic Press: Boston 2003, 15, 1-60.
29. Kobayashi, N.; Miwa, H.; Isago, H.; Tomura, T. Inorg. Chem. 1999, 38, 479-485.
30. Jiang, X.-J.; Yeung, S.-L.; Lo, P.-C.; Fong, W.-P.; Ng, D. K. P. J. Med. Chem. 2010, 54
(1), 320-330.
31. Rodriguez-Morgade, M. S.; de la Torre, G.; Torres, T. In The Porphyrin Handbook, K. M.
Kadish, K. M. Smith, R. Guilard, (Eds), Academic Press: Boston 2003, 15, 125-160.
32. Giuntini, F.; Nistri, D.; Chiti, G.; Fantetti, L.; Jori, G.; Roncucci, G. Tetrahedron Lett.
2003, 44, 515-517.
33. Brykina, G. D.; Uvarova, M. I.; Koval, Y. N.; Shpigun, O. A. J. Anal. Chem. 2001, 56,
940-944.
73
34. Uvarova, M. I.; Brykina, G. D.; Shpigun, O. A. J. Anal. Chem. 2000, 55, 910-925.
35. Wang, J.; Liu, H.; Xue, J. P.; Jiang, Z.; Chen, N. S.; Huang, J. L. Chinese Sci. Bull. 2008,
53, 1657-1664.
36. Rager, C.; Schmid, G.; Hanack, M. Chem. Eur. J. 1999, 5, 280-288.
37. Filippis, M. P.; Dei, D.; Fantetti, L.; Roncucci, G. Tetrahedron Lett. 2000, 41, 9143-9147.
38. Easson, M. W.; Fronczek, F. R.; Jensen, T. J.; Vicente, M. G. H. Bioorg. Med. Chem.
2008, 16, 3191-3208.
39. Hofman, J.-W.; van Zeeland, F.; Turker, S.; Talsma, H.; Lambrechts, S. A. G.; Sakharov,
D. V.; Hennink, W. E.; van Nostrum, C. F. J. Med. Chem. 2007, 50, 1485-1494.
40. Zorlu, Y.; Dumoulin, M. Durmus, H.; Ahsen, V. Tetrahedron 2010, 66, 3248-3258.
41. Saka, E. T.; Durmus, M.; Kantekin, H. J. Organomet. Chem. 2011, 696, 913-924.
42. Masilela, N.; Nyokong, T. J. Luminescence 2010, 130, 1787-1793.
43. Maree, D. M.; Kuznetsova, M.; Nyokong, T. Photochem. Photobiol. A: Chem. 2001, 140,
117-125.
44. Engelmann, F. M.; Mayer, I.; Gabrielli, D. S.; Toma, H. E.; Kowaltowski, A. J.; Araki, K.;
Baptista, M. S. J. Bioenerg. Biomembranes 2007, 39, 175-185.
45. Luo, Y.; Chang, C. K.; Kessel, D. Photochem. Photobiol. 1996, 63, 528-534.
46. Rao, R. V.; Hermel, E.; Castro-Obregon, S.; del Rio, G. Ellerby, L. M.; Ellerby, H. M.;
Bredesen, D. E. J. Biol. Chem. 2001, 276, 33869-33874.
47. Kessel, D. J. Porphyrins Phthalocyanines 2004, 8, 1009-1014.
48. Fery-Forgues, S.; Lavabre, D. J. Chem. Ed. 1999, 76, 1260-1264.

74
CHAPTER 3
SYNTHESES, CHARACTERIZATION AND BIOLOGICAL EVALUATION OF
PHTHALOCYANINE-PEPTIDE CONJUGATES FOR EPIDERMAL GROWTH
FACTOR RECEPTOR TARGETING IN COLON CANCER
3.1. Background
Colorectal cancer (CRC) is currently the second leading cause of cancer-related deaths
among both men and women in the US.1 It typically develops over several years from
adenomatous polyps to carcinoma. Routine colon screening, detection and removal of polyp
adenomas and early stage cancer reduces the incidence of CRC. However, most cancers are
detected at a stage where they may become terminal because they lack outward signs or
symptoms.2 The current methods of detection for CRC such as flexible sigmoidoscopy, standard
colonoscopy, radiography, and computer tomography (CT) colonoscopy frequently miss small
adenomas (< 5 mm) and flat lesions, the two early stages of CRC.2 Early detection of small
adenomas and flat lesions could prevent the development of the malignant tumors.
The new detection methods currently being employed to accomplish this goal include
chromoendoscopy, narrow band imaging, and blue light auto-fluorescence.3 Chromoendoscopy
utilizes an absorptive or contrast dye, such as methylene blue, to stain the mucosa for standard
white light colonoscopy, enhancing tissue characterization, differentiation, and diagnosis of
small adenomas.2,3
Narrow band imaging uses a blue and green filter to narrow the white
colonoscopic light to illuminate the mucosa, and blue light auto-fluorescence involves a UV light
source to generate mucosal auto-fluorescence. In addition, confocal laser endomicroscopy (CLE)
has been employed to image the mucosa, with fluorescein, acriflavine, or cresyl violet as the
This chapter originally appeared in Ongarora, B. G.; Fontenot, K. R.; Hu, X.; Sehgal, I.;
Satyanarayana-Jois, S. D.; Vicente, d. G. H., Phthalocyanine–Peptide Conjugates for Epidermal
Growth Factor Receptor Targeting. Journal of Medicinal Chemistry 2012, 55 (8), 3725-3738.4
Copyright (2012) American Chemical Society.
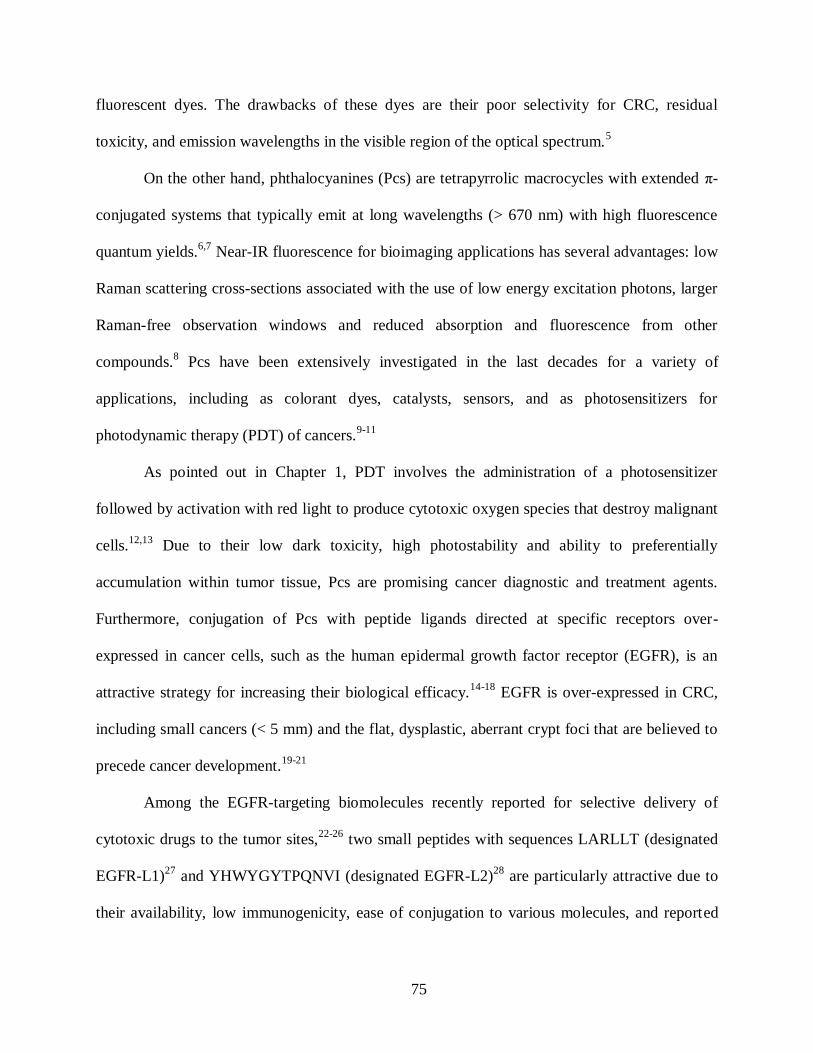
75
fluorescent dyes. The drawbacks of these dyes are their poor selectivity for CRC, residual
toxicity, and emission wavelengths in the visible region of the optical spectrum.5
On the other hand, phthalocyanines (Pcs) are tetrapyrrolic macrocycles with extended π-
conjugated systems that typically emit at long wavelengths (> 670 nm) with high fluorescence
quantum yields.6,7
Near-IR fluorescence for bioimaging applications has several advantages: low
Raman scattering cross-sections associated with the use of low energy excitation photons, larger
Raman-free observation windows and reduced absorption and fluorescence from other
compounds.8 Pcs have been extensively investigated in the last decades for a variety of
applications, including as colorant dyes, catalysts, sensors, and as photosensitizers for
photodynamic therapy (PDT) of cancers.9-11
As pointed out in Chapter 1, PDT involves the administration of a photosensitizer
followed by activation with red light to produce cytotoxic oxygen species that destroy malignant
cells.12,13
Due to their low dark toxicity, high photostability and ability to preferentially
accumulation within tumor tissue, Pcs are promising cancer diagnostic and treatment agents.
Furthermore, conjugation of Pcs with peptide ligands directed at specific receptors over-
expressed in cancer cells, such as the human epidermal growth factor receptor (EGFR), is an
attractive strategy for increasing their biological efficacy.14-18
EGFR is over-expressed in CRC,
including small cancers (< 5 mm) and the flat, dysplastic, aberrant crypt foci that are believed to
precede cancer development.19-21
Among the EGFR-targeting biomolecules recently reported for selective delivery of
cytotoxic drugs to the tumor sites,22-26
two small peptides with sequences LARLLT (designated
EGFR-L1)27
and YHWYGYTPQNVI (designated EGFR-L2)28
are particularly attractive due to
their availability, low immunogenicity, ease of conjugation to various molecules, and reported

76
superior EGFR-targeting ability. EGFR-L1 was selected from computational screening of an
EGFR peptide ligand virtual library, and shown to target EGFR both in vitro (in EGFR over-
expressing H1299 cells) and in vivo (in H1299 tumor-bearing mice following intravenous (iv)
administration).27
On the other hand, EGFR-L2 was identified from screening of a phage display
peptide library and also shown to bind to EGFR both in vitro (SMMC-7721 cells) and in vivo
(SMMC-7721 tumor bearing mice following iv injection).28
In the continuing pursuit for tumor-selective fluorescent imaging and PDT agents, a Pc
conjugated to a bifunctional nuclear localizing sequence and cell-penetrating peptide containing
32 amino acid residues, via either a short (5-atom) or a PEG (20-atom) linker, has been shown to
display higher fluorescence quantum yield and increased cellular uptake compared with non-
conjugated Pc.29
In this Chapter, the synthesis, photophysical, and biological evaluation of Pc
conjugates to either EGFR-L1 or EGFR-L2 peptide ligands is described.
3.2. Results and Discussion
3.2.1. Synthesis and Characterization
The Pc-peptide conjugates described in this Chapter were designed to specifically target
EGFR. The synthetic routes to conjugates 3.5, 3.6, 3.9 and 3.11 are shown in Schemes 1 and 2.
Pcs 3.1 and 3.7 were prepared by statistical condensation of 3- or 4-(p-N-Boc-aminophenoxy)-
phthalonitrile and 4-tert-butylphthalonitrile (in 1:3 ratio) in DMAE at 140 ºC for 5 h, and in the
presence of Zn(II) acetate and DBN, followed by TFA deprotection of the Boc groups, as
described in Chapter 1 and also in literature.30
Reaction of Pc 3.1 with diglycolic anhydride in
DMF gave the corresponding α-substituted carboxy-terminated Pc 3.2, in 86.6% yield, following
reported literature procedure.29,31
The coupling of Pc 3.2 with commercially available tert-butyl
protected PEG using HOBt, EDCI and DIEA, following by deprotection of the tert-butyl group

77
afforded the Pc 3.4 in 68.3% overall yield;31
lower yields were obtained when TBTU was used in
place of EDCI, due to a more difficult purification of the target Pc-PEG compounds. Solid-phase
conjugation of Pc 3.4 to the two peptide sequences LARLLT27
(EGFR-L1) and
GYHWYGYTPQNVI28
(EGFR-L2) using DIEA, HOBt and TBTU or HATU in DMF and at
room temperature, gave the targeted Pc-peptide conjugates 3.5 and 3.6 in 40-80% yields, after
cleavage from the solid support and reversed-phase chromatographic purification. A glycine
residue at the N-terminus of the EGFR-L2 peptide was meant to enhance the conjugation
reaction yields.31,32
Coupling reactions with Pc 3.3 gave traces of the product (MALDI-TOF).
Scheme 3.1: Synthesis of mono-peptide α-substituted ZnPc. Conditions: (a) 1,4-dioxane-2,6-dione, DMF, r.t., (86.6%). (b) DIEA, HOBt, TBTU, EGFR-L1/L2, DMF, 24 h, r.t., 40-79% (c) tert-butyl-12-amino-4,7,10-trioxadodecanoate, DIEA, HOBt, EDCI, DMF, 48 h, r.t., (76.5%). (d) TFA, dichloromethane, 4 h, (89.3%).

78
Reaction of Pc 3.7 with diglycolic anhydride in DMF gave the corresponding β-
substituted carboxy-terminated Pcs 3.8, in 92.2% yield, following the procedure for Pc 3.2
above. The coupling of Pc 3.8 with commercially available tert-butyl protected PEG using
HOBt, EDCI and DIEA, following by deprotection of the tert-butyl group afforded Pc 3.10 in
72.7% overall yield. Lower yields were also obtained when TBTU was used in place of EDCI,
just as in Pc 3.2 above. Solid-phase conjugation of Pcs 3.8 and 3.10 to the two peptides
EGFR-L1 and EGFR-L2 using DIEA, HOBt and TBTU or HATU in DMF and at room
temperature, gave the targeted Pc-peptide conjugates 3.9 and 3.11 in 35-84% yields, after
cleavage and purification. Reacting EGFR-L2 with Pc 3.10 gave traces Pc 3.12 (MALDI-TOF).
Scheme 3.2: Synthesis of mono-peptide β-substituted ZnPc. Conditions: (a) 1,4-dioxane-2,6-dione, DMF, r.t., (92.2%). (b) DIEA, HOBt, TBTU, EGFR-L1/L2, DMF, 24 h, r.t., 35-84% (c) tert-butyl-12-amino-4,7,10-trioxadodecanoate, DIEA, HOBt, EDCI, DMF, 48 h, r.t., (82.3%). (d) TFA, dichloromethane, 4 h, (88.3%).
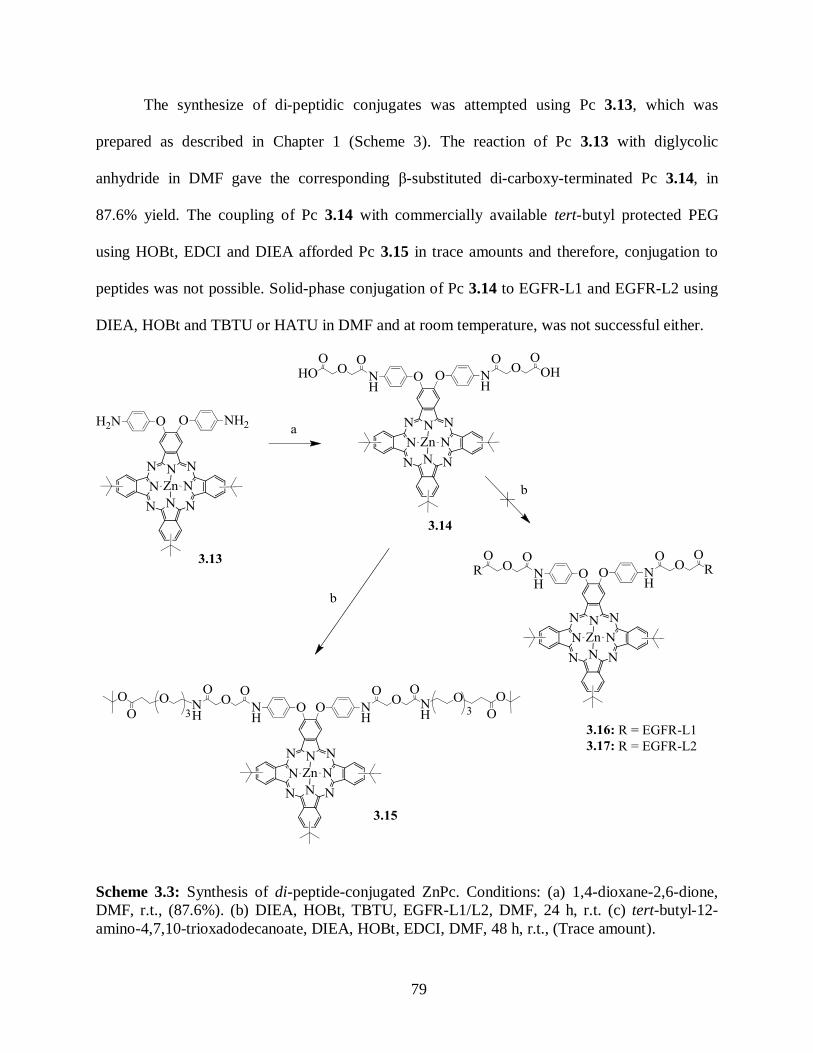
79
The synthesize of di-peptidic conjugates was attempted using Pc 3.13, which was
prepared as described in Chapter 1 (Scheme 3). The reaction of Pc 3.13 with diglycolic
anhydride in DMF gave the corresponding β-substituted di-carboxy-terminated Pc 3.14, in
87.6% yield. The coupling of Pc 3.14 with commercially available tert-butyl protected PEG
using HOBt, EDCI and DIEA afforded Pc 3.15 in trace amounts and therefore, conjugation to
peptides was not possible. Solid-phase conjugation of Pc 3.14 to EGFR-L1 and EGFR-L2 using
DIEA, HOBt and TBTU or HATU in DMF and at room temperature, was not successful either.
Scheme 3.3: Synthesis of di-peptide-conjugated ZnPc. Conditions: (a) 1,4-dioxane-2,6-dione,
DMF, r.t., (87.6%). (b) DIEA, HOBt, TBTU, EGFR-L1/L2, DMF, 24 h, r.t. (c) tert-butyl-12-
amino-4,7,10-trioxadodecanoate, DIEA, HOBt, EDCI, DMF, 48 h, r.t., (Trace amount).

80
A Pc macrocycle has previously been conjugated to a lysine-rich bifunctional peptide
sequence containing 32 amino acid residues, via a similar short (5-atom) and a long (20-atom)
PEG linker, and observed that the PEG linker increased cellular uptake into human HEp2 cells,
and decreased cytotoxicity of the Pc conjugate.29
On the other hand, the short linker Pc conjugate
showed higher fluorescence quantum yield, probably as a result of its lower conformational
flexibility compared with the PEG group. In the current work, a short (5-atom) and a low
molecular weight PEG (13-atom) linker between the Pc and the peptide ligand were investigated;
the smaller PEG group has the advantages of being commercially available and potentially less
flexible than the penta(ethylene glycol) previously used. In addition, the PEG linker is believed
to favor an extended conformation for conjugates 3.5 and 3.6 and 3.11,31
which might favor
EGFR target binding, and to increase their aqueous solubility compared with conjugate 3.9 (vide
infra).
EGFR over-expression has been found in a variety of human cancers, including breast,
ovarian, prostate, pancreatic, and colorectal;33
for this reason EGFR has been an important target
for cancer treatment.14-18
Monoclonal antibodies (mAbs), such as cetuximab and trastuzumab,
and tyrosine kinase inhibitors (TKIs), such as erlotinib and gefitinib, are HER1/EGFR-targeted
agents currently in clinical development, or already approved, for use in several countries.
Peptides EGFR-L1 and EGFR-L2 were designed to act as a substitute for the natural ligand EGF,
which has reported mitogenic and neoangiogenic activity, and has been shown to specifically
target EGFR over-expressing tumor cells both in vitro and in vivo.27,28
Advantages of using small
peptide ligands as target units include their easy synthesis and coupling to fluorophores, their
low immunogenicity and high binding affinity for the biological target. The EGFR-L1
conjugates have the potential of being used as dyes, as shown in the biological section.

81
All Pcs in this series were characterized by MS, NMR, UV-Vis and fluorescence
spectroscopy; MALDI-TOF was used to confirm the amino acid sequence in the Pc-peptide
conjugates. The spectroscopic properties for Pcs 3.4, 3.5, 3.6, 3.9, 3.10 and 3.11 are summarized
in Table 3.1 and Figure 3.1). All Pcs showed strong Q absorption bands between 677 - 680 nm in
DMF, and emissions between 680 - 683 nm in the same solvent, with fluorescence quantum
yields in the range 0.10-0.13 and Stokes’ shifts of 2 – 4 nm, characteristic of this type of
compound.29,30
All Pc-peptide conjugates were soluble in polar organic solvents, such as DMSO
and DMF, up to 1.0 mM concentrations, though, precipitation was observed upon dilution into
aqueous solutions. Cremophor EL, a non-ionic solubilizer and emulsifier was, therefore, added to
all Pc stock solutions used in the biological experiments. The cell studies were conducted in
PBS/DMSO/Cremophor (94:1:5) and the mice studies in PBS/DMSO/Cremophor (85:10:5).
a) b)
Figure 3.1. (a) Absorption spectra for Pc conjugates at 8.0 μM and, (b) Emission spectra for Pc
conjugates. Pc-conjugates 3.4 (blue), 3.5 (purple), 3.6 (red), 3.9 (tangerine), and 3.11 (turquoise) in
DMF solvent.

82
The solubility of the Pcs decreased in the order Pc-PEG (3.4 and 3.10) > Pc-EGFR-L1
(3.5 and 3.11) > Pc-EGFR-L2 (3.6) > Pc-EGFR-L2 (3.9), due to the high hydrophobicity of the
longer EGFR-L2 sequence (containing 11 hydrophobic amino acids and only two polar),
compared with EGFR-L1 (containing 4 hydrophobic amino acids, one polar and one cationic).
Indeed, the uncharged Pc conjugates 3.9 and 3.6 exhibited low solubility in polar protic solvents
such as methanol, compared with the positively charged Pc conjugates 3.5 and 3.11. The least
soluble was the Pc-EGFR-L2 conjugate 3.9 bearing a short 5-atom linker.
Table 3.1. Spectroscopic Properties of Pcs in DMF.
Pc Absorption (nm) Emissiona (nm) Stokes’ Shift ε (M
-1cm
-1)
1 фF
b
3.4 678 682 4 5.35 0.10
3.5 680 683 3 5.33 0.12
3.6 680 683 3 4.60 0.13
3.8 677 680 3 5.19 0.13
3.9 677 681 4 4.85 0.10
3.11 680 682 2 5.27 0.11
a Excitation at 670 nm.
b Calculated using ZnPc (Фf = 0.17) as the standard.
3.2.2. Docking
To model the interaction of peptides EGFR-L1 and EGFR-L2, docking studies were
carried out using Autodock.34,35
EGFR-L1 is known to bind to a pocket away from the EGF
binding pocket in EGFR,27
while EGFR-L2 binds to the EGF binding pocket.28
Hence, for
EGFR-L1 grid box for docking calculations were around Glu71, Asn134, Gly177. The low
energy docked structure (docking energy of -6.06 kcal/mol) of EGFR-L1 is shown in Figure
3.2a. The Leu4 backbone carbonyl and Thr6 side chain hydroxyl groups form hydrogen-bonding
interaction with EGFR. The RLLT sequence of the peptide acquired a β-turn conformation when
bound to the receptor EGFR.

83
Figure 3.2. Low energy docked structure of (i) EGFR-L1 and (ii) EGFR-L2 peptides with EGF
receptor. EGFR is shown in surface and the peptide is shown as dark sticks. The EGF binding
pocket is also shown.
The low energy docked structure of EGFR-L2 peptide is shown in Figure 3.2b. EGFR-L2
peptide binds to EGF binding pocket with docking energy of -5.96 kcal/mol. Tyr1 and Ile12
residues from the peptide formed hydrogen-bonding interactions with the EGFR stabilizing the
peptide-receptor interaction. Overall, the peptide did not have any particular secondary structure
as shown in the Figure 3.2b. Peptide was bound in the cavity of EGF binding pocket of EGFR.
These results indicate that both peptides EGFR-L1 and EGFR-L2 can bind to EGFR.
3.2.3. Cell Culture
Four cell lines with different EGFR expressions were used to investigate the cytotoxicity,
uptake and subcellular distribution of Pc-peptide conjugates 3.5, 3.6, 3.9 and 3.11: human
squamous cell carcinoma HEp2,29-32
human epidermoid carcinoma A431,36-38
cercopithecus
aethiops kidney Vero (as negative control),39
and human colorectal adenocarcinoma HT-29
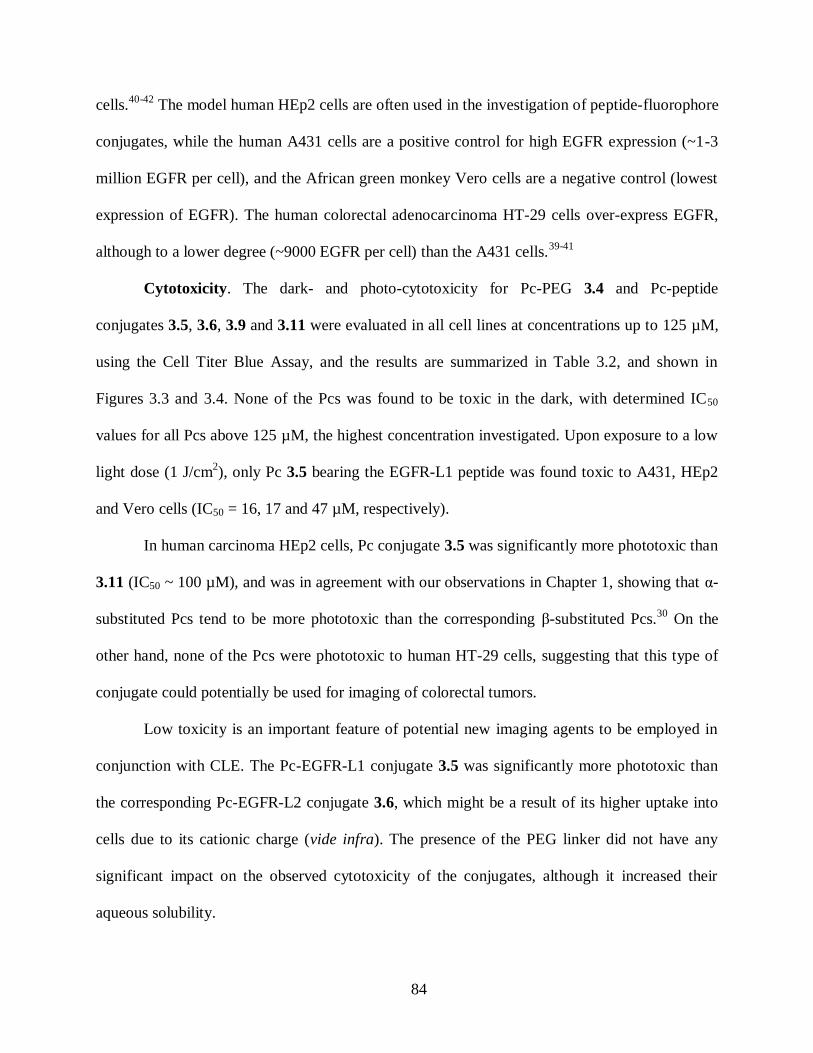
84
cells.40-42
The model human HEp2 cells are often used in the investigation of peptide-fluorophore
conjugates, while the human A431 cells are a positive control for high EGFR expression (~1-3
million EGFR per cell), and the African green monkey Vero cells are a negative control (lowest
expression of EGFR). The human colorectal adenocarcinoma HT-29 cells over-express EGFR,
although to a lower degree (~9000 EGFR per cell) than the A431 cells.39-41
Cytotoxicity. The dark- and photo-cytotoxicity for Pc-PEG 3.4 and Pc-peptide
conjugates 3.5, 3.6, 3.9 and 3.11 were evaluated in all cell lines at concentrations up to 125 µM,
using the Cell Titer Blue Assay, and the results are summarized in Table 3.2, and shown in
Figures 3.3 and 3.4. None of the Pcs was found to be toxic in the dark, with determined IC50
values for all Pcs above 125 µM, the highest concentration investigated. Upon exposure to a low
light dose (1 J/cm2), only Pc 3.5 bearing the EGFR-L1 peptide was found toxic to A431, HEp2
and Vero cells (IC50 = 16, 17 and 47 µM, respectively).
In human carcinoma HEp2 cells, Pc conjugate 3.5 was significantly more phototoxic than
3.11 (IC50 ~ 100 µM), and was in agreement with our observations in Chapter 1, showing that α-
substituted Pcs tend to be more phototoxic than the corresponding β-substituted Pcs.30
On the
other hand, none of the Pcs were phototoxic to human HT-29 cells, suggesting that this type of
conjugate could potentially be used for imaging of colorectal tumors.
Low toxicity is an important feature of potential new imaging agents to be employed in
conjunction with CLE. The Pc-EGFR-L1 conjugate 3.5 was significantly more phototoxic than
the corresponding Pc-EGFR-L2 conjugate 3.6, which might be a result of its higher uptake into
cells due to its cationic charge (vide infra). The presence of the PEG linker did not have any
significant impact on the observed cytotoxicity of the conjugates, although it increased their
aqueous solubility.

85
Figure 3.3. Dark toxicity of conjugates Pc 3.4 (blue), 3.5 (purple), 3.6 (red), 3.9 (tangerine), and
3.11 (turquoise) at 10 μM toward (i) A431, (ii) Vero, (iii) HEp2 and (iv) HT-29 cells, using the
Cell Titer Blue assay.
Figure 3.4. Phototoxicity of conjugates Pc 3.4 (blue), 3.5 (purple), 3.6 (red), 3.9 (tangerine), and
3.11 (turquoise) at 10 μM toward (i) A431, (ii) Vero, (iii) HEp2 and (iv) HT-29 cells, using the
Cell Titer Blue assay.
86
Table 3.2. Dark and photo cytotoxicity for Pc conjugates using the Cell Titer Blue assay.
Compound A431 cells
IC50 (µM)
Light/dark
Vero cells
IC50 (µM)
Light/dark
HEp2 cells
IC50 (µM)
Light/dark
HT-29 cells
IC50 (µM)
Light/dark
3.4 >100/>125 >100/>125 >100/>125 >100/>125
3.5 15.8/>125 47.0/>125 17.0/>125 >100/>125
3.6 >100/>125 >100/>125 >100/>125 >100/>125
3.9 >100/>125 >100/>125 >100/>125 >100/>125
3.11 >100/>125 >100/>125 >100/>125 >100/>125
Time-Dependent Uptake. The time-dependent cellular uptake for all Pcs was performed
at the non-toxic concentration of 10 μM in all cell lines, and the results are shown in Figure 3.5.
There were marked differences in the cellular uptake of the Pc-EGFR-L1 conjugates compared
with the Pc-EGFR-L2 conjugates, which might be due to their different overall charge, solubility
and tendency for aggregation. While the highly hydrophobic and uncharged Pc-EGFR-L2
conjugates 3.6 and 3.9 were poorly taken up by all cell lines, in particular by A431 and HT-29
cells which over-express EGFR, the positively charged Pc-EGFR-L1 conjugates 3.5 and 3.11
accumulated within cells to a much higher extent. Cells with higher EGFR expression showed
higher uptake of the Pc conjugates, about 4-fold increase in A431 vs Vero cells, and a 3- or 2-
fold increase in HT-29 colorectal and HEp2 cancer cells, respectively. This result shows that Pc
conjugates 3.5 and 3.11 can indeed target cancer cells over-expressing EGFR, in particular CRC
cells. Very different Pc uptake into Vero cells, with low expression of EGFR was observed; Pc
conjugate 3.11 accumulated the fastest, followed by 3.5 and precursor Pc-PEG 3.4.
The Pc-EGFR-L2 conjugates 3.9 and 3.6 were taken up by Vero cells to a much lower
extent than the Pc-EGFR-L1 conjugates 3.5, 3.6 and 3.11 bearing a PEG linker accumulated ~ 2-
fold higher than 3.9. These results show that the Pc macrocycle has a natural tendency to
accumulate within cells, with or without over-expression of EGFR, and that the PEG-containing

87
compounds tend to be taken up to a higher extent. The conjugation of the Pc to a small cationic
peptide sequence (EGFR-L1) changes the uptake kinetics, as seen in Figure 3.5b, and as
previously observed.32
In EGFR over-expressing cells, Pc conjugates 3.5 and 3.11 clearly were
taken up the most of all Pcs investigated. For example, in A431 cells, conjugates 3.5 and 3.11
accumulated ~15-fold more than Pc-PEG 3.4 and than the Pc-EGFR-L2 conjugates 3.6 and 3.9
(Figure 3.5a). Similarly in HT-29 and HEp2 cells, 3.5 and 3.11 were taken up to a higher extent
than Pcs 3.4, 3.6 and 3.9.
Figure 3.5. Time-dependent uptake of Pcs 3.4 (blue), 3.5 (purple), 3.6 (red) 3.9 (orange) and
3.11 (turquoise) at 10 μM by (i) A431, (ii) Vero, (iii) HEp2 and (iv) HT-29 cells.
These results indicate that the peptide sequence has a marked effect on the cell targeting
and uptake ability of this type of Pc conjugates. Autodock investigations showed that both

88
peptides EGFR-L1 and –L2 can bind to EGFR, EGFR-L2 to the EGF binding site and EGFR-L1
to an outside pocket, as previously reported.27,28
Although Pc-EGFR-L2 conjugates could
potentially bind to EGFR with high specificity and be retained at the cell surface rather than
internalized, their low uptake into Vero cells with low expression of EGFR suggests that their
low solubility and high tendency for aggregation are responsible for their observed low cellular
uptake. Indeed, the least soluble Pc 3.9 accumulated the least within cells compared with all Pcs
investigated. On the other hand, the Pc-EGFR-L1 conjugates bearing an arginine residue and
overall +1 charge were readily taken up by all cells, as previously observed for porphyrin-
peptide conjugates bearing 1 to 4 positively charged residues.43
Positively charged molecules
have been observed to have enhanced ability for crossing negatively charged plasma membranes,
in particular those containing arginine due to the unique ability of the protonated guanidinium
group to form bidentate hydrogen bonds.43-47
Table 3.3. Main subcellular sites of localization for Pc conjugates in human cells.
ZnPc A431 cells HEp2 cells HT-29 cells
3.4 Lyso, Golgi, Mito Lyso, Golgi Lyso
3.5 Lyso, Golgi, Mito,
ER
Lyso, Golgi, Mito,
ER
Lyso, Mito
3.6 Lyso, Golgi, Mito Lyso, Golgi, Mito Lyso, ER
3.9 Lyso, Golgi, Mito Lyso, Golgi, Mito Lyso, Golgi, Mito
3.11 Lyso, Golgi, Mito Lyso, Golgi, Mito Lyso, Golgi, Mito
Of all Pc-peptide conjugates investigated, 3.11 accumulated the fastest within all cell
lines, followed by 3.5, which was found in the highest amount within A431 and HT-29 cells, at
times > 8 h after Pc exposure. Due to its rapid and efficient uptake into cells and low
cytotoxicity, Pc-peptide 3.11 was chosen for further investigation in animal studies (vide infra).

89
Subcellular Localization. The preferential sites of intracellular localization of Pc-
peptide conjugates 3.5, 3.6, 3.9 and 3.11 and Pc-PEG 3.4 were evaluated using fluorescence
microscopy, in the three human cell lines over-expressing EGFR, i.e. A431, HT-29 and HEp2
cells. The results are summarized in Table 3.3 and shown in Figures 3.6 – 3.11 for conjugates
3.5, 3.6, 3.9 and 3.11. Co-localization experiments were performed using the organelle-specific
probes LysoTracker Green (lysosomes), ER Tracker Blue/White (ER), MitoTracker Green
(mitochondria) and BODIPY Ceramide (Golgi).
All conjugates localized in multiple sites within the cells. The Pc-EGFR-L1 conjugate
3.11 was found in the lysosomes, mitochondria and Golgi of all cell lines; in addition its
regioisomer 3.5 was also observed in the ER, which might in part explain its higher phototoxicity
compared with 3.11.48,49
Pc-EGFR-L2 conjugates 3.6 and 3.9 were also found in lysosomes,
Golgi and mitochondria. Lysosomal localization might result from an endocytic pathway of this
type of molecules, as previously observed.29,43
The potential fluorescence from the Pc conjugates on the plasma membrane was also
investigated, in order to detect any non-internalized EGFR-bound conjugate. However, no
fluorescence was detected by microscopy, indicating that the Pc conjugates do not localize on the
plasma membrane. No co-localization was observed with fluorescent probe 1-(4-
trimethylammoniumphenyl)-6-phenyl-1,3,5-hexatriene p-toluenesulfonate (TMA-DPH) that
specifically labels the plasma membrane. This result indicates that the Pc-EGFR-L2 conjugates
have poor EGFR targeting ability, probably because of their low solubility and high tendency for
aggregation. On the other hand, the Pc-EGFR-L1 conjugates 3.5 and 3.11 efficiently targeted
EGFR over-expressing cells and were internalized, to a level that is dependent on the degree of
EGFR expression.

90
a) b)
Figure 3.6. Subcellular localization of (a) Pc 3.5 in A431 cells at 10 µM for 6 h. (A) Phase
contrast, (B) Overlay of 3.5 fluorescence and phase contrast, (C) ER Tracker Blue/White
fluorescence, (E) MitoTrack green fluorescence, (G) BoDIPY Ceramide, (I) LysoSensor green
fluorescence, and (D, F, H, J) overlays of organelle tracers with 3.5 fluorescence. Scale bar: 10
m. (b) Pc 3.6 in A431 cells at 10 µM for 6 h. (A) Phase contrast, (B) Overlay of 3.6
fluorescence and phase contrast, (C) ER Tracker Blue/White fluorescence, (E) MitoTrack green
fluorescence, (G) BoDIPY Ceramide, (I) LysoSensor green fluorescence, and (D, F, H, J)
overlays of organelle tracers with 3.6 fluorescence. Scale bar: 10 m.

91
a) b)
Figure 3.7. Subcellular localization of (a) Pc 3.9 in A431 cells at 10 µM for 6 h. (A) Phase
contrast, (B) Overlay of 3.9 fluorescence and phase contrast, (C) ER Tracker Blue/White
fluorescence, (E) MitoTrack green fluorescence, (G) BoDIPY Ceramide, (I) LysoSensor green
fluorescence, and (D, F, H, J) overlays of organelle tracers with 3.9 fluorescence. Scale bar: 10
m. (b) Pc 3.11 in A431 cells at 10 µM for 6 h. (A) Phase contrast, (B) Overlay of 3.11
fluorescence and phase contrast, (C) ER Tracker Blue/White fluorescence, (E) MitoTracker
green fluorescence, (G) BODIPY Ceramide, (I) LysoSensor green fluorescence, and (D, F, H, J)
overlays of organelle tracers with 3.11 fluorescence. Scale bar: 10 µm.
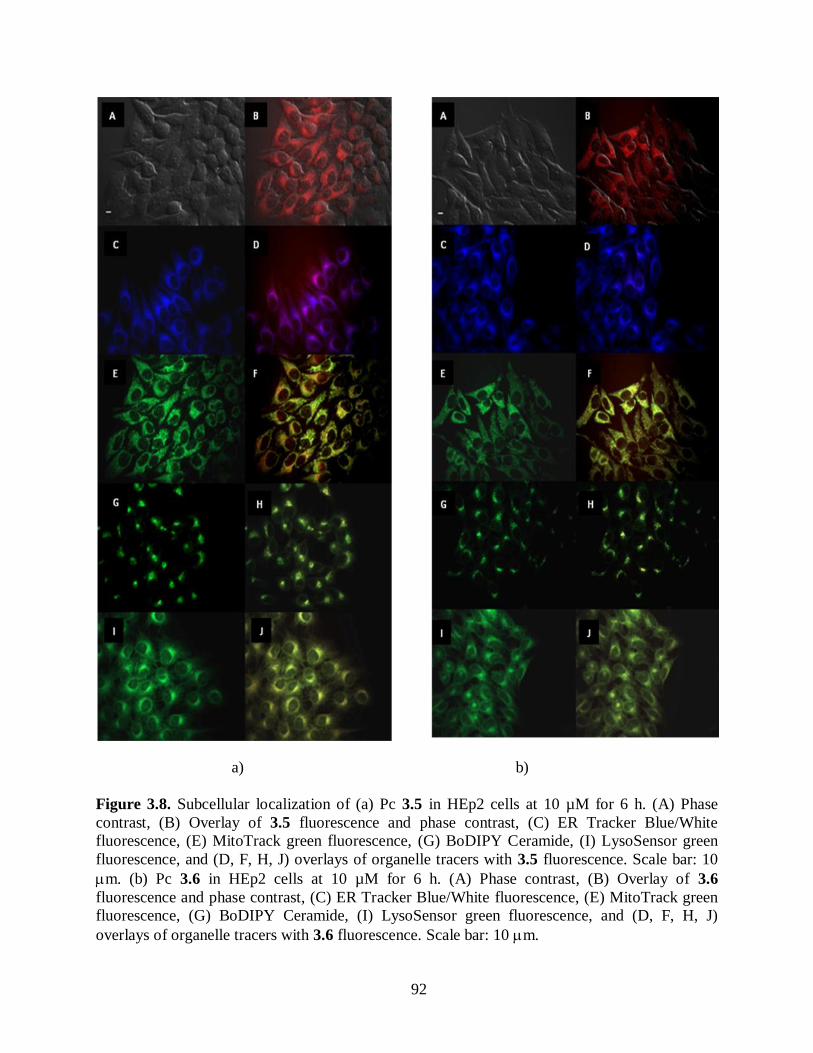
92
a) b)
Figure 3.8. Subcellular localization of (a) Pc 3.5 in HEp2 cells at 10 µM for 6 h. (A) Phase
contrast, (B) Overlay of 3.5 fluorescence and phase contrast, (C) ER Tracker Blue/White
fluorescence, (E) MitoTrack green fluorescence, (G) BoDIPY Ceramide, (I) LysoSensor green
fluorescence, and (D, F, H, J) overlays of organelle tracers with 3.5 fluorescence. Scale bar: 10
m. (b) Pc 3.6 in HEp2 cells at 10 µM for 6 h. (A) Phase contrast, (B) Overlay of 3.6
fluorescence and phase contrast, (C) ER Tracker Blue/White fluorescence, (E) MitoTrack green
fluorescence, (G) BoDIPY Ceramide, (I) LysoSensor green fluorescence, and (D, F, H, J)
overlays of organelle tracers with 3.6 fluorescence. Scale bar: 10 m.

93
a) b)
Figure 3.9. Subcellular localization of (a) Pc 3.9 in HEp2 cells at 10 µM for 6 h. (A) Phase
contrast, (B) Overlay of 3.9 fluorescence and phase contrast, (C) ER Tracker Blue/White
fluorescence, (E) MitoTrack green fluorescence, (G) BoDIPY Ceramide, (I) LysoSensor green
fluorescence, and (D, F, H, J) overlays of organelle tracers with 3.9 fluorescence. Scale bar: 10
m. (b) Pc 3.11 in HEp2 cells at 10 µM for 6 h. (A) Phase contrast, (B) Overlay of 3.11
fluorescence and phase contrast, (C) ER Tracker Blue/White fluorescence, (E) MitoTrack green
fluorescence, (G) BoDIPY Ceramide, (I) LysoSensor green fluorescence, and (D, F, H, J)
overlays of organelle tracers with 3.11 fluorescence. Scale bar: 10 m.

94
a) b)
Figure 3.10. Subcellular localization of (a) Pc 3.5 in HT-29 cells at 10 µM for 6 h. (A) Phase
contrast, (B) Overlay of 3.5 fluorescence and phase contrast, (C) ER Tracker Blue/White
fluorescence, (E) MitoTrack green fluorescence, (G) BoDIPY Ceramide, (I) LysoSensor green
fluorescence, and (D, F, H, J) overlays of organelle tracers with 3.5 fluorescence. Scale bar: 10
m. (b) Pc 3.6 in HT-29 cells at 10 µM for 6 h. (A) Phase contrast, (B) Overlay of 3.6
fluorescence and phase contrast, (C) ER Tracker Blue/White fluorescence, (E) MitoTrack green
fluorescence, (G) BoDIPY Ceramide, (I) LysoSensor green fluorescence, and (D, F, H, J)
overlays of organelle tracers with 3.6 fluorescence. Scale bar: 10 m.

95
a) b)
Figure 3.11. Subcellular localization of (a) Pc 3.9 in HT-29 cells at 10 µM for 6 h. (A) Phase
contrast, (B) Overlay of 3.9 fluorescence and phase contrast, (C) ER Tracker Blue/White
fluorescence, (E) MitoTrack green fluorescence, (G) BoDIPY Ceramide, (I) LysoSensor green
fluorescence, and (D, F, H, J) overlays of organelle tracers with 3.9 fluorescence. Scale bar: 10
m. (b) Pc 3.11 in HT-29 cells at 10 µM for 6 h. (A) Phase contrast, (B) Overlay of 3.11
fluorescence and phase contrast, (C) ER Tracker Blue/White fluorescence, (E) MitoTrack green
fluorescence, (G) BoDIPY Ceramide, (I) LysoSensor green fluorescence, and (D, F, H, J)
overlays of organelle tracers with 3.11 fluorescence. Scale bar: 10 m.
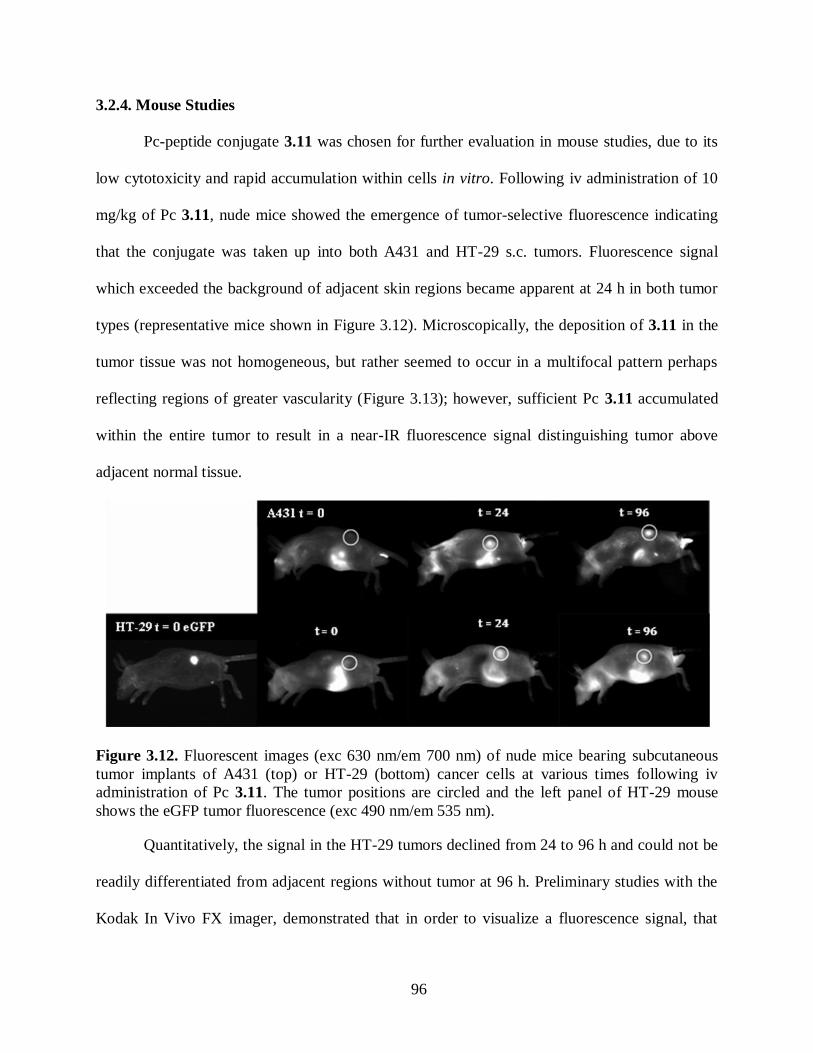
96
3.2.4. Mouse Studies
Pc-peptide conjugate 3.11 was chosen for further evaluation in mouse studies, due to its
low cytotoxicity and rapid accumulation within cells in vitro. Following iv administration of 10
mg/kg of Pc 3.11, nude mice showed the emergence of tumor-selective fluorescence indicating
that the conjugate was taken up into both A431 and HT-29 s.c. tumors. Fluorescence signal
which exceeded the background of adjacent skin regions became apparent at 24 h in both tumor
types (representative mice shown in Figure 3.12). Microscopically, the deposition of 3.11 in the
tumor tissue was not homogeneous, but rather seemed to occur in a multifocal pattern perhaps
reflecting regions of greater vascularity (Figure 3.13); however, sufficient Pc 3.11 accumulated
within the entire tumor to result in a near-IR fluorescence signal distinguishing tumor above
adjacent normal tissue.
Figure 3.12. Fluorescent images (exc 630 nm/em 700 nm) of nude mice bearing subcutaneous
tumor implants of A431 (top) or HT-29 (bottom) cancer cells at various times following iv
administration of Pc 3.11. The tumor positions are circled and the left panel of HT-29 mouse
shows the eGFP tumor fluorescence (exc 490 nm/em 535 nm).
Quantitatively, the signal in the HT-29 tumors declined from 24 to 96 h and could not be
readily differentiated from adjacent regions without tumor at 96 h. Preliminary studies with the
Kodak In Vivo FX imager, demonstrated that in order to visualize a fluorescence signal, that

97
signal needed to be at least 1.2-fold greater than adjacent regions of the mouse. The fluorescence
signal emission in the A431 tumor continued to increase to 96 h (Figure 3.14) suggesting
continued uptake of the Pc conjugate over a longer time period in cells over-expressing EGFR.
For purposes of comparison, the two tumor groups were not significantly different in tumor size
(A431= 133.3 ± 28.7 cm3 and HT-29 = 141.9± 21.4 cm
3 at 96 h). Neither tumor demonstrated
auto-fluorescence at the 630/700 nm spectra window at time 0 when compared with adjacent
skin surfaces.
Figure 3.13. Deposition of Pc 3.11 in the HT-29 tumor xenograph, 24 h following iv injection.
Images show (A) eGFP indicating HT-29 tumor regions, (B) Pc 3.11 fluorescence, and (C)
overlap of tumor and Pc deposition.
Figure 3.14. Emission signal of Pc 3.11 at 700 nm in the s.c. human tumor xenographs, over the
adjacent (background) skin regions, expressed as a percent. To visually distinguish tumors by
fluorescence, the tumor needs to be at least 120% of adjacent regions.

98
In vivo, tumor-associated fluorescence excitable at 630 and emitted at 700 nm was
detectable at 24 h. Correspondence of these wavelengths to the Pc conjugate spectra indicates
uptake of the conjugate by the two subcutaneous human tumor xenografts. While both HT-29
and A431 cells over-express EGFR, there is a vast difference in the degree of receptor
expression, with A431 ~ 200 times higher EGFR expression than HT-29.40-42
If the Pc conjugate
homed to the tumor tissue based solely on the presence of the EGFR ligand, then the comparable
levels of fluorescence observed from both tumors at 24 h would not have been expected.
Therefore, in addition to tumor attraction based on EGFR-peptide binding, our results suggest
significant tumor homing by the Pc macrocycle itself, in agreement with the in vitro results
(Figure 3.5b) and previous observations.9 The extended fluorescence-time within the A431
tumor over the HT-29 tumor suggests that with greater quantities of EGFR, comes longer
retention and/or greater capacity for selective uptake or re-uptake. At times prior to 24 h, there
was either weak or no signal, suggesting a prolonged time period of plasma circulation with
gradual tumor accumulation. A similar pattern of tumor uptake was recently described in a
xenograph breast cancer model imaged following administration of a chiral porphyrazine,50
which showed increasing signal over background up to 48 h post administration. On the other
hand, chlorin e6-HSA nanoparticles were recently used for PDT of HT-29 tumor xenograph,51
and shown to have higher tumor-targeting ability and accumulation than free chlorin e6 as a
result of their prolonged blood circulation. Two other chlorin derivatives, HPPH-
3Gd(II)ADTPA52
and TCPCSO3H53
were recently shown to accumulate within tumor-bearing
mice, reaching maximum accumulation levels at 24 h post-administration.
There was no signal detected in adjacent non-tumor regions indicating a high degree of
tumor selectivity; however, it was noted that normal gastrointestinal contents in the mice also

99
fluoresced at the near-IR spectral window required for this Pc-conjugate. This background
fluorescence is difficult to remove in mice since prolonged fasting is not feasible. For imaging of
colon or urogenital malignancies, it would likely be necessary to remove fecal material prior to
tumor detection.
In order to evaluate the in vivo stability of conjugate 3.11, the HT-29 tumors were
harvested at 24 and 96 h following iv injection and extracted using acetone/methanol mixture.
The UV-vis spectra of both the 24 and 96 h tumor extracts in methanol showed the characteristic
Q band absorption of the Pc (Figure 3.15), indicating that the Pc macrocycle has high stability in
vivo, allowing for prolonged and selective accumulation within tumor tissue. MALDI-TOF MS
indicated that at 24 h, intact conjugate 3.11 was still present in the tumor extract, while at 96 h
the major Pc species detected was Pc-PEG-LARL (Figures 3.16).
Figure 3.15. Absorption spectrum for Pc-conjugate 3.11 in methanol, extracted from HT-29 mice-
tumor.
This result suggests that the EGFR-L1 peptide in Pc 3.11 is slowly degraded within
tumor tissue by proteolytic enzymes, mainly losing the two terminal amino acids 96 h after iv
injection. This result is in agreement with previous observations that this type of peptide
conjugate can undergo metabolic degradation within tumor cells, with half-life ~ 24 h.54
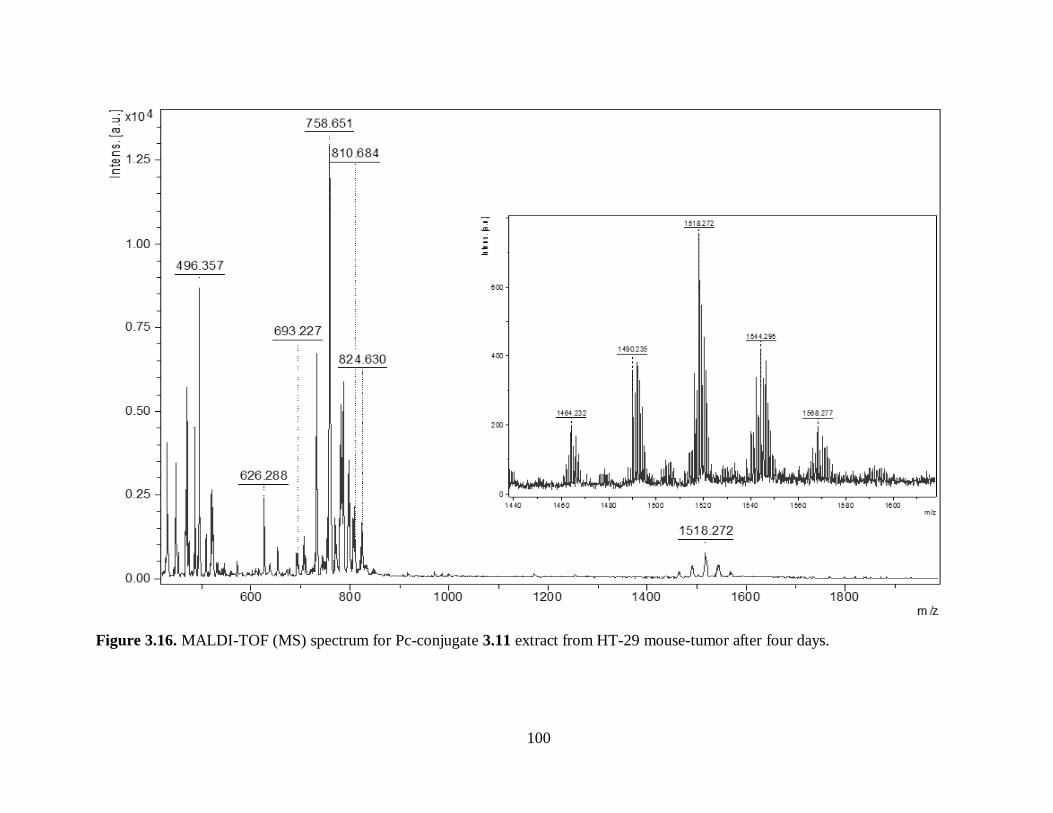
100
Figure 3.16. MALDI-TOF (MS) spectrum for Pc-conjugate 3.11 extract from HT-29 mouse-tumor after four days.

101
3.3. Conclusion
Four Pc-peptide conjugates (3.5, 3.6, 3.9 and 3.11) were designed and synthesized to
target EGFR, and investigated as potential florescence imaging agents for cancers over-
expressing EGFR, such as CRC. Two peptide ligands for EGFR containing 6 (LARLLT) and 13
(GYHWYGYTPQNVI) amino acid residues, were conjugated to the Pc via a short 5-atom, or a
13-atom PEG linker. The PEG group enhances the solubility of the Pc-peptide conjugates and
tends to increase their cellular uptake. Using Autodock both peptide ligands were found to bind
to EGFR, giving low energy (ca. - 6 kcal/mol) docking structures. The short EGFR-L1 peptide
conjugates 3.5 and 3.11 are positively charged and were efficiently internalized by all cell lines
(A431, HT-29, HEp2 and Vero cells), localizing preferentially in lysosomes, Golgi and
mitochondria. However, the 13-residue EGFR-L2 peptide produced highly hydrophobic Pc
conjugates 3.6 and 3.9 that poorly targeted EGFR and were poorly internalized. The amount of
Pc-EGFR-L1 conjugates, 3.5 and 3.11, taken up by cells was dependent on their degree of EGFR
expression. While 3.5 and 3.11, as well as Pc-PEG 3.4 also accumulated within the low EGFR
expressing Vero cells, increased uptake was observed with increasing EGFR expression in the
human cell lines (A431 > Ht-29 > HEp2). The observed uptake into low EGFR expressing cells
indicates that the Pc-PEG has a natural tendency to target and accumulate within cancer cells.
All conjugates were found to be non-toxic (IC50 > 100 µM) to both low- and over-
expressing EGFR cells, with exception of conjugate 3.5 that showed moderate phototoxicity
toward A431, HEp2 and Vero cells (IC50 = 16, 17 and 47 µM, respectively). None of the
conjugates were toxic towards human colorectal HT-29 cells (IC50 > 100 µM). This result, in
addition to the observed near-IR fluorescence emissions of all Pc conjugates at ca. 682 nm with
quantum yields in the range 0.10-0.13, and enhanced (~ 3-fold) uptake of 3.5 and 3.11 by cancer

102
cells, makes these Pc-EGFR-L1 conjugates highly promising fluorescent contrast agents for
CRC, and potentially other EGFR over-expressing cancers, in particular the least phototoxic
(IC50 > 100 µM at 1 J/cm2) β-substituted Pc-peptide conjugate 3.11.
Conjugate 3.11 was further investigated in nude mice bearing A431 and HT-29 human
tumor xenografts. Twenty four hours after iv administration of 3.11, a clearly near-IR
fluorescence signal (exc 630 nm/ em 700 nm) was seen over background adjacent tissues, in both
tumor types. While the fluorescence signal decreased in HT-29 tumors after 24 h, it continued to
increase in the A431 tumors up to 96 h, the longest time investigated. The MS analysis of tumor
extracts 96 h after iv injection of Pc-peptide 3.11 indicated partial degradation of the conjugate,
by proteolytic enzymes, mainly leading to the cleavage of the last two amino acids of EGFR-L1.
Our studies show that Pc-peptide conjugates can be used for near-IR fluorescence
imaging of cancers over-expressing EGFR, such as CRC. Due to the hydrophobic nature of the
Pc macrocycle, a low molecular PEG linker and a polar or charged peptide ligand are required
for adequate aqueous solubility and receptor targeting ability. In addition, a β-substituted Pc
macrocycle appears to be the most suitable for imaging applications due to its lower
phototoxicity compared with the corresponding α-substituted macrocycle.
3.4. Experimental Section
3.4.1. General Chemistry
All reagents and solvents were purchased from commercial sources and used directly
without further purification. Silica gel 60 (230×400 mesh) and C18 (200×400), both from
Sorbent Technologies, were used for column chromatography. Analytical thin-layer
chromatography (TLC) was carried out using polyester backed TLC plates 254 (precoated, 200
μm) from Sorbent Technologies. NMR spectra were recorded on AV-400 LIQUID Bruker

103
spectrometer (400 MHz for 1H, 100 MHz for
13C). The chemical shifts are reported in δ ppm
using the following deuterated solvents as internal references: Acetone-d6 2.05 ppm (1H), 29.92
ppm (13
C); DMF-d7 8.03 ppm (1H), 163.15 ppm (
13C); Pyridine-d5 7.58 ppm (
1H), 135.91 ppm
(13
C). HPLC analyses were carried on a Dionex system equipped with a P680 pump and
UVD340U detector. Photophysical (absorption) spectra were measured on a UV-VIS NIR
Scanning Spectrometer, using UV-3101PC SHIMADZU (Cell positioned)–CPS-260 lamp and
emission spectra were obtained on a Fluorolog® - HORIBA JOBINVYON (Model LFI-3751)
spectrofluorimeter. MALDI-TOF mass spectra were recorded on a Bruker ProFlex III mass
spectrometer using dithranol as the matrix or Bruker UltrafleXtreme (MALDI-TOF/TOF) using
4-chloro-α-cyanocinnamic acid as the matrix; high resolution ESI mass spectra were obtained on
an Agilent Technologies 6210 Time-of-Flight LC/MS. The melting points (mp) were determined
using MEL-TEMP electrothermal instrument. HPLC separation was carried out on a Waters
system including a 2545 quaternary gradient module pump, 2489 UV/Visible detector, and a
fraction collector III. Analytical HPLC was carried out using a XBridge C18 300Å, 5μm, 4.6 x
250 mm (Waters, USA) column using a stepwise gradient. Semipreparative HPLC was carried
out using a XBridge C18 300Å, 5 μm, 10 x 250 mm (Waters, USA) column using a stepwise
gradient. The solvent system for peptides consisted of millipure water and HPLC grade
acetonitrile, while it consisted of millipure water and HPLC grade methanol for the EGFR-L1
conjugates. Pcs 3.1, and 3.7 were synthesized as previously described.30
3.4.2. Peptide Synthesis and Conjugations
Applied Biosystems Pioneer, Peptide Synthesis System was used to synthesize peptide
sequences. Each peptide was synthesized using Fmoc-PAL-PEG-PS on 0.2 mmol scale using
Fmoc strategy of solid-phase peptide synthesis. A 4-fold excess of the L-Fmoc protected amino

104
acids were coupled using HOBt and TBTU as the coupling agents. The peptide sequences,
prepared using this methodology, were as follows: LARLLT and GYHWYGYTPQNVI.
Removal of the Fmoc group from the last amino acid was the final step for each synthesis. This
was followed by washing the peptide several times with DMF/DCM and dried under high
vacuum for 24 h. The Pc-peptide conjugates were synthesized as previously described.29
In summary, resin containing either GYHWYGYTPQNVI or LARLLT was dissolved in
DMF and soaked for 2 h. The Pcs were dissolved in DMF, the base and coupling reagents (HOBt
and TBTU) added to the Pc solutions. The activated mixture was transferred into the reaction
vessel containing the resin and left to shake for 4 days. The resin was washed under vacuum
several times using DMF, then methanol and finally DCM. A cleavage cocktail –
TFA/phenol/TIS/H2O (88:5:2:5) – was added with constant shaking for 4 h. The solution was
washed with TFA (2 × 2 mL) into a flask and concentrated under vacuum. Cold diethyl ether was
added to the residue and the mixture centrifuged. The Pc-EGFR-L1 conjugates were purified
using reverse-phase HPLC using a Waters system including a 2545 quaternary gradient module
pump, 2489 UV/Visible detector, and a fraction collector III. Analytical HPLC was carried out
using a XBridge C18 300Å, 5μm, 4.6 x 250 mm (Waters, USA) column using a stepwise
gradient. Semi-preparative HPLC was carried out a XBridge C18 300Å, 5 μm, 10 x 250 mm
(Waters, USA) column using a stepwise gradient. The solvent system consisted of millipure
water and HPLC grade methanol (30:70 → 0:100). The purity of the conjugates was > 95% as
obtained from HPLC.
ZnPc 3.2: A mixture of Pc 3.130
(80.0 mg, 0.096 mmol) and 1,4-dioxane-2,6-dione (18.0
mg, 0.16 mmol) was dissolved in DMF (1.0 mL) and the solution stirred overnight at room
temperature. Water (5.0 mL) was added to the solution to precipitate the product. The solid was

105
filtered under vacuum and washed with water and hexane. The solid was dried under vacuum for
2 days to afford the pure blue solid (80.4 mg, 86.6%), mp 235 – 236 °C. 1H NMR (Pyridine-d5):
δ 10.78-10.71 (s, 1H, -COOH), 10.17 - 9.41 (m, 7H, Ar-H), 8.44 - 8.23 (m, 6H, Ar-H), 8.01 -
7.71 (m, 3H, Ar-H), 6.04 (br, 1H, N-H), 4.55 (d, J = 12.4 Hz, 2H, CH2O), 4.47 (d, J = 10.5 Hz,
2H, CH2O), 1.73 – 1.59 (m, 27H, C(CH3)3). 13
C NMR (Pyridine-d5): δ 168.3, 168.2, 156.6,
155.9, 155.8, 154.7, 154.3, 154.0, 152.9, 150.6, 150.4, 150.1, 149.8, 142.4, 140.1, 140.0, 137.8,
137.7, 136.2, 136.0, 135.8, 135.5, 134.3, 134.8, 131.54, 128.46, 128.3, 124.8, 124.2, 124.0,
123.7, 123.4, 122.8, 122.5, 121.4, 120.6, 120.5, 120.4, 120.2, 119.4, 118.1, (Ar-C) 73.1, 70.5
(OCH2), 35.8, 32.4 (Ar-C, C(CH3)3). MS (MALDI-TOF) m/z 968.319 [M+H]+, calcd for
C54H50N9O5Zn 967.323. UV-vis (DMF): λmax (log ε) 346 nm (5.04), 614 nm (4.80), 680 nm
(5.50).
ZnPc 3.4: Pc 3.2 (30.0 mg, 0.032 mmol) was dissolved in DMF (400 µL). Et3N (4.0 mg,
0.041 mmol), HOBt (4.6 mg, 0.034 mmol) and tert-butyl-12-amino-4,7,10-trioxadodecanoate
(10.8 mg, 0.039 mmol) were added to the reaction mixture. EDCI (5.3 mg, 0.034 mmol) was
then added in one portion. The reaction solution was stirred for 3 days at room temperature,
diluted using ethyl acetate (10 mL) and washed subsequently with water (20 mL × 2). The
organic layer was dried over anhydrous sodium sulfate. The solvent was evaporated and the
crude product purified on silica column eluted with mixed solvents of DCM/methanol (98:2→
96:4) to afford a blue solid (30.0 mg, 76.5%). 1H NMR (DMF-d7): δ 9.60 - 9.01 (m, 7H, Ar-H),
8.45 - 8.15 (m, 5H, Ar-H), 8.00 – 7.77 (m, 3H, Ar-H), 7.63 – 7.49 (m, 2H, Ar-H), 4.27 – 4.15
(m, 4H, CH2O), 3.62 – 3.57 (m, 3H, CH2O), 3.54 – 3.47 (m, 9H, CH2O), 3.42 – 3.37 (m, 2H,
CH2O), 2.44 – 2.39 (m, 2H, CH2CO), 1.82 – 1.78 (m, 27H, C(CH3)3), 1.40 (s, 9H, C(CH3)3). 13
C
NMR (DMF-d7): δ 171.7, 170.5, 168.8, 168.7, 156.8, 156.2, 155.6, 155.5, 155.2, 155.1, 155.0,

106
154.7, 154.6, 154.4, 154.3, 154.20, 154.16, 154.0, 153.4, 153.3, 153.2, 152.4, 152.1, 152.04,
151.96, 142.3, 140.03, 139.98, 139.9, 139.6, 137.64, 137.57, 137.5, 137.2, 135.10, 135.06, 143.5,
131.7, 131.6, 130.1, 129.4, 128.7, 128.6, 128.4, 123.6, 123.5, 123.3, 122.6, 122.4, 122.3, 122.0,
120.3, 120.1, 120.0, 119.8, 119.6, 119.0, 118.9, 117.5 (Ar-C), 80.8 (O-C(CH3)3), 72.4, 72.1,
71.20, 71.18, 71.15, 71.1, 71.0, 70.5, 70.32, 70.30, 67.2 (OCH2), 39.64, 39.61, (COCH2), 32.7,
32.6 (Ar-C, C(CH3)3), 28.5 (N-Boc C(CH3)3). MS (MALDI-TOF) m/z 1170.497 [M-tBu+H]
+,
calcd for C63H66N10O9Zn 1170.431. The protected Pc 3.4 conjugate was dissolved in a mixture of
DCM/TFA (4 mL/4 mL) and stirred at 0° C for 3 h. The solvent was evaporated, the residue
treated with 2N NaOH (2 mL) and then extracted by ethyl acetate (15 mL). The product was
dried under vacuum to afford blue product (24.0 mg, 89.3%), mp 191 – 192 °C. 1H NMR (DMF-
d7): δ 10.15-10.13 (s, 1H, -COOH), 9.59 - 9.08 (m, 7H, Ar-H), 8.42 - 8.10 (m, 5H, Ar-H), 7.95 -
7.82 (m, 3H, Ar-H), 7.61 – 7.52 (m, 2H, Ar-H), 4.25 – 4.11 (m, 4H, CH2O), 3.79–3.57 (m, 12H,
CH2O), 3.41–3.37 (m, 2H, CH2O), 2.51–2.48 (m, 2H, CH2CO), 1.79 (s, 27H, C(CH3)3). 13
C
NMR (Pyridine-d5): δ 173.7, 170.5, 168.7, 156.9, 156.2, 155.4, 154.5, 153.7, 152.6, 145.6, 142.6,
140.2, 139.8, 137.6, 135.2, 134.6, 131.7, 128.7, 123.5, 122.7, 122.4, 120.0, 119.1, 117.7 (Ar-C),
72.5, 72.2, 71.3, 70.4, 67.8 (OCH2), 35.5 (COCH2), 32.6 (Ar-C, C(CH3)3). MS (MALDI-TOF)
m/z 1170.485 [M]+, calcd for C63H66N10O9Zn 1170.431. UV-vis (DMF): λmax (log ε) 349 nm
(4.90), 612 nm (4.61), 678 nm (5.35).
ZnPc conjugate 3.5: Resin (25.7 mg, 0.0052 mmol) containing LARLLT, was
transferred into a reaction vial. DMF was added (5:1, DMF/resin) and left to soak for 4 h, after
which it was washed four times with DMF. Pc 3.4 (10.0 mg, 0.010315 mmol) was weighed into
a 2.0 mL vial and DMF (200 μL) added. DIEA (6.4 µL, 0.036745 mmol) was added to the
solution and stirred for 1 h. Then HOBt (1.8 mg, 0.013321 mmol), HATU (4.0 mg, 0.010521

107
mmol) were added to the Pc solution. The mixture was added to the resin and left to shake for 4
days. The resin was washed under vacuum using DMF, followed by methanol and finally DCM.
A cleavage cocktail – TFA/phenol/TIS/H2O (88:5:2:5) – was added and shaken constantly for 4
h and the solution washed with TFA (2 × 2 mL) into a 50 mL flask under vacuum. Cold
diethylether was added to the residue and the mixture centrifuged. The precipitate was purified
using reverse-phase HPLC eluted by water/methanol (30:70 → 0:100) to afford a blue solid (7.6
mg, 79.2%), mp 151-152 °C. 1H NMR (DMF-d7): δ 10.18, 10.13 (s, 1H, N-H), 9.67-9.20 (m, 5H,
Ar-H), 8.55-8.45 (m, 3H, Ar-H), 8.25-8.15 (m, 2H, Ar-H), 8.13-8.05 (m, 1H, Ar-H), 7.97-7.86
(m, 5H, Ar-H), 7.85-7.79 (m, 2H, Ar-H), 7.61-7.47 (m, 5H, Ar-H), 7.20 (s, 1H, Ar-H), 7.13 (s,
1H, Ar-H), 4.39-4.01 (m, 26H, CH2O/CH2NH), 3.77-3.70 (m, 3H, CH2O), 3.56-3.50 (m, 12H,
CH2O), 3.43-3.31 (m, 3H, CH2O), 2.55-2.41 (m, 2H, CH2CO), 2.01-1.92 (m, 3H, CH2), 1.85-
1.71 (m, 27H, C(CH3)3/7H, CH2), 1.69-1.62 (m, 3H, CH2), 1.43-1.35 (m, 4H, CH2), 1.21-1.15
(m, 4H, CH2), 0.94-0.87 (m, 20H, CH3). 13
C NMR (DMF-d7): δ 175.5, 175.3, 174.10, 174.07,
173.7, 173.4, 170.5, 168.8, 168.7, 160.3, 159.9, 158.7, 156.8, 156.2, 155.6, 155.3, 155.1, 154.4,
152.4, 152.1, 140.0, 137.9, 137.6, 135.1, 134.5, 131.7, 128.6, 123.4, 122.6, 122.4, 120.0, 119.0,
117.5, 116.1 (Ar-C), 72.3, 72.0, 71.3, 71.2, 71.0, 70.9, 70.3, 68.2, 68.0, 66.3 (OCH2), 60.1, 55.2,
54.6, 54.0, 53.5. 51.8, 41.9, 41.3, 41.2, 39.5, 37.2 (CH2) 32.6 (Ar-C, C(CH3)3), 29.4, 26.5, 25.6,
25.5, 24.0, 23.8, 23.5, 22.3, 22.0, 21.8, 20.7, 17.5 (CH3). MS (MALDI-TOF) m/z 1837.907
[M+H]+, calcd for C94H125N20O15Zn 1837.892. MS-MS (MALDI-TOF-TOF) m/z 1839.90
[PcPEG-LARLLT+H]+, 1822.88 [PcPEG-LARLLT-NH2+H]
+, 1794.88 [PcPEG-LARLLT-
CONH2+H]+, 1723.042 [PcPEG-LARLL-NH2+H]
+, 1580.75 [PcPEG-LARL-CO+H]
+, 1339.56
[PcPEG-LA-NH2+H]+, 1268.52 [PcPEG-L-NH2+H]
+, 1240.53 [PcPEG-L-CO+H]
+, 1155.44
[PcPEG-NH2+H]+, calcd for C94H125N20O15Zn 1837.892, C94H124N19O15Zn 1822.882,
108
C93H124N19O14Zn 1794.887, C90H117N18O13Zn 1721.834, C83H106N17O11Zn 1580.755,
C72H83N12O10Zn 1339.565, C69H78N11O9Zn 1268.528, C68H78N11O8Zn 1240.533,
C63H67N10O8Zn 1155.444. UV-vis (DMF): λmax (log ε) 348 nm (4.79), 612 nm (4.56), 680 nm
(5.33).
ZnPc conjugate 3.6: Resin (60.0 mg, 0.0052 mmol) containing GYHWYGYTPQNVI
was transferred into a reaction vial. DMF was added (5:1, DMF/resin) and left to soak for one
hour, after which it was washed four times with DMF. Pc 3.4 (12.1 mg, 0.010315 mmol) was
weighed into a 2.0 mL vial and DMF (200 μL) added. Then HOBt (1.4 mg, 0.010315 mmol),
HATU (3.9 mg, 0.010315 mmol) and DIEA (5.39 μL, 0.030946 mmol) were added to the Pc
solution. The mixture was stirred for five minutes, transferred into the reaction chamber
containing the resin and left to shake for 3 days. The resin was washed under vacuum using
DMF (till DMF was clear), followed by methanol and finally DCM. A cleavage cocktail –
TFA/phenol/TIS/H2O (88:5:2:5) – was added and shaken constantly for 4 h. The solution was
then washed with TFA (2 × 2 mL) into a 50 mL flask under vacuum. Cold diethylether was
added to the residue and the mixture centrifuged. The precipitate was then sonicated in water and
centrifuged several times to give the title compound (11.5 mg, 40.5%, mp 208 – 209 °C). 1H
NMR (DMF-d7): δ 10.40, 10.35 (s, 1H, COOH), 9.51-9.20 (m, 6H, Ar-H), 8.45-8.10 (m, 10H,
Ar-H), 7.80-7.75 (m, 2H, Ar-H), 7.70-7.50 (m, 2H, Ar-H), 7.45-7.20 (m, 30H, Ar-H), 7.15-6.95
(m, 14H, Ar-H), 6.90-6.78 (m, 4H, Ar-H), 6.74-6.65 (m, 9H, Ar-H), 4.75-4.10 (m, 16H,
CH2O/CH2NH), 4.04-3.65 (m, 7H, CH2O/CH2NH), 2.25-2.04 (m, 6H, CH2CO), 2.01-1.75 (m,
21H, C(CH3)3/CH2), 1.43 (s, 4H, , CH2), 1.31 (s, 3H, CH2), 1.21-1.15 (m, 4H, CH2), 1.05-1.00
(m, 8H, CH2), 0.94-0.85 (m, 19H, CH3). MS (MALDI-TOF) m/z 2748.17 [M]+, calcd for
C140H165N29O27Zn 2748.1723. MS-MS (MALDI-TOF-TOF) m/z 2751.19 [PcPEG-
109
GYHWYGYTPQNVI]+, 2733.25 [PcPEG-GYHWYGYTPQNVI-NH2]
+, 2702.25 [Pc-PEG-
GYHWYGYTPQNVI-CONH2]+, 2165.86 [PcPEG-YHWYGYT-NH2-OH]
+, 1670.78 [PcPEG-
GYHW-CONH2]+, 1490.70. [PcPEG-GYH-CONH2]
+, 1346.53 [Pc-PEG-GY-CONH2]
+, 1226.34
[PcPEG-G]+, 1155.44 [PcPEG-NH2+H]
+, calcd for C140H165N29O27Zn 2748.17,
C140H164N28O27Zn 2733.16, C139H164N28O26Zn 2705.17, C115H123N21O19Zn 2165.86,
C90H95N17O12Zn 1669.66, C79H85N15O11Zn 1483.58, C73H78N12O10Zn 1346.53, C65H70N12O9Zn
1226.47, C63H67N10O8Zn 1155.44. UV-vis (DMF): λmax (log ε) 345 nm (3.84), 612 nm (4.25),
680 nm (4.60).
ZnPc 3.8: A mixture of Pc 3.730
(50.0 mg, 0.06 mmol) and 1,4-dioxane-2,6-dione (11.3
mg, 0.1 mmol) was dissolved in DMF (0.5 mL) and the solution stirred overnight at room
temperature. The mixture was purified as 3.2 above to afford the pure blue solid (53.5 mg,
92.2%), mp 249 – 250 °C. 1H NMR (Pyridine-d5): δ 10.84-10.77 (s, 1H, -COOH), 10.01 - 9.35
(m, 8H, Ar-H), 8.50 - 8.21 (m, 5H, Ar-H), 8.10 - 7.90 (m, 1H, Ar-H), 7.54 – 7.41 (m, 2H, Ar-H),
6.74 (br, 1H, N-H), 4.69 (d, J = 5.4 Hz, 2H, CH2O), 4.60 (d, J = 5.6 Hz, 2H, CH2O), 1.75 – 1.64
(m, 27H, C(CH3)3). 13
C NMR (Pyridine-d5): δ 173.9, 168.43, 168.38, 160.0, 159.7, 154.8, 154.7,
154.6, 154.5, 154.3, 153.9, 153.8, 153.5, 153.4, 153.0, 150.6, 150.4, 150.1, 140.8, 139.4, 139.2,
137.0, 136.8, 134.2, 134.0, 131.0, 127.7, 124.7, 122.0, 120.8, 120.7, 120.3, 119.8, 112.5, 111.6
(Ar-C) 72.5, 69.9 (OCH2), 35.8, 31.7 (Ar-C, C(CH3)3). MS (MALDI-TOF) m/z 968.314 [M+H]+,
calcd for C54H50N9O5Zn 968.323. UV-vis (DMF): λmax (log ε) 351 nm (4.86), 611 nm (4.58), 679
nm (5.33).
ZnPc conjugate 3.9: Resin (60.0 mg) containing 0.0052 mmol GYHWYGYTPQNVI
was transferred into a reaction vial. DMF was added (5:1, DMF/resin) and soaked for 2 h. The
resin was washed four times with DMF. Pc 3.8 (10.0 mg, 0.010315 mmol) was weighed into a

110
vial and DMF (200 μL) added. Then HOBt (1.4 mg, 0.010315 mmol), TBTU (3.3 mg, 0.010315
mmol) and DIEA (5.39 μL, 0.030946 mmol) were added to the Pc solution. The mixture was
stirred for 30 min, transferred into the vial containing the resin and left to shake for 3 days. The
resin was washed under vacuum using DMF (till DMF was clear), followed by methanol and
finally DCM. A cleavage cocktail – TFA/phenol/TIS/H2O (88:5:2:5) – was added and shaken
constantly for 4 h. The solution was then washed with TFA (2 × 2 mL) into a 50 mL flask under
vacuum. Cold diethylether was added to the residue and the mixture centrifuged. The precipitate
was then sonicated in water and centrifuged several times to give the title compound (9.2 mg,
35.0%), mp 211 – 212 °C. 1H NMR (DMF-d7): δ 9.51-9.20 (m, 5H, Ar-H), 8.45-8.10 (m, 9H,
Ar-H), 7.80-7.75 (m, 2H, Ar-H), 7.70-7.50 (m, 2H, Ar-H), 7.35-7.20 (m, 24H, Ar-H), 7.07-6.91
(m, 14H, Ar-H), 6.80-6.70 (m, 4H, Ar-H), 6.65-6.53 (m, 9H, Ar-H), 4.68-4.30 (m, 12H,
CH2NH), 4.24-3.65 (m, 4H, CH2O/CH2NH), 3.45-3.30 (m, 4H, CH2O/CH2NH), 2.25-2.04 (m,
2H, CH2CO), 2.01-1.75 (m, 21H, C(CH3)3/CH2), 1.33 (s, 5H, , CH3), 1.26 (s, 2H, CH2), 1.18-
1.10 (m, 4H, CH2), 1.00-0.94 (m, 8H, CH2), 0.85-0.75 (m, 18H, CH3). MS (MALDI-TOF) m/z
2545.04 [M]+, calcd for C131H148N28O23Zn 2545.0563. UV-vis (DMF): λmax (log ε) 351 nm
(4.44), 610 nm (4.07), 677 nm (4.87).
ZnPc 3.10: Pc 3.8 (30.0 mg, 0.032 mmol) was dissolved in DMF (400 µL). Et3N (4.0
mg, 0.041 mmol), HOBt (4.6 mg, 0.034 mmol) and tert-butyl-12-amino-4,7,10-
trioxadodecanoate (10.8 mg, 0.039 mmol) were added to the reaction solution and the solution
was stirred for 20 min. EDCI (5.3 mg, 0.034 mmol) was added to the reaction solution in one
portion. The reaction was then treated as 3.4 above to afford a blue solid (32.2 mg, 82.3%). 1H
NMR (Acetone-d6): δ 9.87 - 9.77 (m, 1H, Ar-H), 9.07 – 7.40 (m, 16H, Ar-H), 3.99 (s, 2H,
CH2O), 3.87 (s, 2H, CH2O), 3.58 – 3.54 (m, 2H, CH2O), 3.45 (s, 8H, CH2O), 3.38 (s, 2H,

111
CH2O), 3.22 (s, 2H, CH2O), 2.36 – 2.33 (m, 2H, CH2CO), 1.88 – 1.78 (m, 27H, C(CH3)3), 1.37
(s, 9H, C(CH3)3). 13
C NMR (DMF-d7): δ 171.8, 170.7, 169.3, 169.2, 162.4, 160.8, 160.4, 155.0,
154.8, 154.3, 154.2, 141.4, 140.0, 139.8, 137.6, 136.7, 136.4, 134.5, 128.6, 125.2, 123.4, 123.0,
121.4, 121.3, 120.9, 120.0, 112.8, 111.7 (Ar-C), 81.0 (O-C(CH3)3), 72.6, 72.4, 71.5, 71.43,
71.36, 71.3, 70.6, 67.8 (OCH2), 32.8 (Ar-C, C(CH3)3), 28.7 (N-Boc C(CH3)3). MS (MALDI-
TOF) m/z 1227.682 [M+H]+, 1170.495 [M-
tBu+H]
+, calcd for C67H75N10O9Zn 1227.501,
C63H66N10O9Zn 1170.431. The protected Pc conjugate was then deprotected as 3.4 above to
afford a blue solid (25.3 mg, 88.3%), mp 161 – 163 °C. 1
H NMR (DMF-d7): δ 10.42-10.33 (s,
1H, COOH), 9.57 - 9.32 (m, 6H, Ar-H), 9.09 - 8.75 (m, 1H, Ar-H), 8.55 - 8.20 (m, 4H, Ar-H),
8.15 - 8.00 (m, 2H, Ar-H), 7.99 – 7.81 (m, 1H, Ar-H), 7.65 – 7.50 (m, 2H, Ar-H), 4.36 (d, J = 7.2
Hz, 2H, CH2O), 4.28 (d, J = 5.1 Hz, 2H, CH2O), 3.65 – 3.57 (m, 12H, CH2O), 3.41 – 3.37 (m,
2H, CH2O), 2.55 – 2.48 (m, 2H, CH2O), 1.85 – 1.74 (m, 27H, C(CH3)3). 13
C NMR (DMF-d7): δ
173.7, 170.6, 169.2, 169.1, 160.64, 160.58, 160.25, 160.18, 155.3, 155.22, 155.16, 155.1, 155.0,
154.9, 154.8, 154.7, 154.3, 154.2, 1154.15, 154.11, 153.0, 153.9, 153.4, 153.3, 153.2, 153.1,
141.5, 141.4, 140.1, 140.0, 139.8, 137.7, 137.64, 137.55, 137.5, 136.5, 136.2, 134.8, 134.7,
134.6, 128.3, 128.2, 126.2, 125.0, 123.3, 123.2, 122.8, 122.0, 121.2, 121.11, 121.06, 120.8,
120.7, 119.9, 119.8, 112.7, 111.6, (Ar-C), 72.4, 72.1, 71.28, 71.25, 71.14, 71.10, 70.4, 68.3, 67.7
(OCH2), 39.7, 36.8 (COCH2), 32.6 (Ar-C, C(CH3)3). MS (MALDI-TOF) m/z 1170.508 [M]+,
calcd for C63H66N10O9Zn 1170.431. UV-vis (DMF): λmax (log ε) 350 nm (4.65), 610 nm (4.41),
676 nm (5.19).
ZnPc conjugate 3.11: Resin (25.7 mg, 0.0052 mmol) containing LARLLT, was
transferred into a reaction vial. DMF was added (5:1, DMF/resin) and left to soak for 4 h, after
which it was washed four times with DMF. Pc 3.10 (10.0 mg, 0.010315 mmol) was weighed into

112
a 2.0 mL vial and DMF (200 μL) added. DIEA (6.4 µL, 0.036745 mmol) was added to the
solution and stirred for 1 h. Then HOBt (1.8 mg, 0.013321 mmol), HATU (4.0 mg, 0.010521
mmol) were added to the Pc solution. The mixture was added to the resin and left to shake for 4
days. It was then cleaved and purified as described above for Pc 3.5 to afford a blue solid (8.1
mg, 84.4%, mp 167 – 168 °C). 1H NMR (DMF-d7): δ 10.40, 10.35 (s, 1H, N-H), 9.67-9.20 (m,
5H, Ar-H), 8.57-8.45 (m, 3H, Ar-H), 8.30-8.25 (m, 2H, Ar-H), 8.13-8.05 (m, 2H, Ar-H), 7.97-
7.86 (m, 3H, Ar-H), 7.85-7.79 (m, 2H, Ar-H), 7.61-7.47 (m, 5H, Ar-H), 7.18 (s, 1H, Ar-H), 7.12
(s, 1H, Ar-H), 4.37 (d, J = 7.6, 4H, CH2O), 4.29-4.21 (m, 9H, CH2NH), 3.77-3.70 (m, 16H,
CH2NH), 3.65-3.57 (m, 12H, CH2O), 3.54-3.43 (m, 2H, CH2NH), 3.37-3.29 (m, 3H, CH2NH),
2.61-2.56 (m, 2H, CH2CO), 2.01-1.92 (m, 2H, CH2), 1.91-1.71 (m, 27H, C(CH3)3/7H, CH2),
1.69-1.58 (m, 5H, CH2), 1.39-1.36 (m, 4H, CH2), 1.17-1.15 (m, 4H, CH2), 0.95-0.86 (m, 20H,
CH3). 13
C NMR (DMF-d7): δ 175.5, 175.3, 174.1, 174.0, 173.7, 173.6, 173.4, 170.6, 169.2,
169.1, 160.2, 159.9, 158.8, 154.6, 154.2, 153.7, 140.2, 139.8, 136.7, 136.3, 128.6, 128.4, 122.8,
122.2, 121.4, 120.9, 119.3, 116.3 (Ar-C), 72.4, 72.2, 71.3, 71.1, 71.0, 70.4, 68.2, 68.1, 66.3
(OCH2), 60.1, 55.2, 54.6, 54.0, 53.5. 51.8, 41.9, 41.34, 41.29, 39.7, 37.2 (CH2) 32.6 (Ar-C,
C(CH3)3), 29.4, 26.5, 25.7, 25.6, 25.5, 24.0, 23.8, 23.5, 22.4, 22.0, 21.8, 20.7, 17.6 (CH3). MS
(MALDI-TOF) m/z 1837.925 [M+H]+, calcd for C94H125N20O15Zn 1837.892. MS-MS (MALDI-
TOF-TOF) m/z 1839.90 [PcPEG-LARLLT+H]+, 1822.88 [PcPEG-LARLLT-NH2+H]
+, 1794.88
[PcPEG-LARLLT-CONH2+H]+, 1721.83 [PcPEG-LARLL-NH2+H]
+, 1580.75 [PcPEG-LARL-
CO+H]+, 1339.56 [PcPEG-LA-NH2+H]
+, 1268.52 [PcPEG-L-NH2+H]
+, 1240.53 [PcPEG-L-
CO+H]+, 1155.44 [PcPEG-NH2+H]
+, calcd for C94H125N20O15Zn 1837.892, C94H124N19O15Zn
1822.882, C93H124N19O14Zn 1794.887, C90H117N18O13Zn 1721.834, C83H106N17O11Zn 1580.755,
C72H83N12O10Zn 1339.565, C69H78N11O9Zn 1268.528, C68H78N11O8Zn 1240.533,

113
C63H67N10O8Zn 1155.444. UV-vis (DMF): λmax (log ε) 352 nm (4.79), 610 nm (4.52), 677 nm
(5.29).
ZnPc 3.14. A mixture of Pc 3.1330
(50 mg, 0.05 mmol) and 1, 4-dioxane-2, 6-dione (17.4
mg, 0.15 mmol) was dissolved in DMF (0.5 mL) and the solution stirred overnight at room
temperature. The reaction solution was evaporated to dry. The residue was dissolved in THF (1
mL) and water (20 mL) added to precipitate the product. The solid was filtered under vacuum,
and washed with water and hexane. The solid was dried under vacuum for 2 days to afford a blue
solid (52.1 mg, 87.6%). 1H NMR (d-Pyridine, 400 MHz): δ 10.74 (s, 2H, -COOH), 10.07 - 9.50
(m, 7H, Ar-H), 8.39 - 8.10 (m, 8H, Ar-H), 7.50 – 7.40 (m, 4H, Ar-H), 6.56 (br, 2H, N-H), 4.63
(d, J = 3.5 Hz, 4H, CH2O), 4.56 (d, J = 4.5 Hz, 4H, CH2O), 1.71 – 1.58 (m, 27H, C(CH3)3). MS
(MALDI-TOF) m/z 1191.360 [M+H]+, calcd for C64H59N10O10Zn 1191.371.
ZnPc 3.15. Pc 3.14 (20 mg, 0.017 mmol) was dissolved in DMF (500 µL). DIEA (26 mg,
0.2 mmol), HOBt (4.6 mg, 0.034 mmol) and TBTU (10.6 mg, 0.034 mmol) were added to the
reaction solution and the solution was stirred for 2 min. Tert-butyl-12-amino-4,7,10-
trioxadodecanoate (10.8 mg, 0.032 mmol) was added to the reaction solution in one portion. The
reaction solution was stirred for 72 h at room temperature. The reaction solution was poured into
20 mL of ice-cold water and filtered under gravity. The residue was dissolved in ethyl acetate
(10 mL). The organic solution washed subsequently with water (20 mL), saturated aqueous
NaHCO3 solution (20 mL) and water (20 mL). The organic layer was dried over anhydrous
sodium sulfate. The solvent was evaporated and the crude product purified by silica column (1
cm in height) with the elution of mixed solvents of methanol/dichloromethane (1/9), eluting the
first blue portion (mono-pegylated Pc). Methanol eluted the second portion (title compound) to

114
afford a blue solid in trace amounts. MS (MALDI-TOF) m/z 1711.720 [M+H]+, calcd for
C90H109N12O18Zn 1711.729.
3.4.3. Spectroscopic Studies
All absorption spectra were measured on UV-VIS NIR Scanning Spectrometer UV-
3101PC SHIMADZU (Cell positioned) equipped with a CPS-260 lamp. The DMF solvent used
was HPLC grade and it was the solvent of choice since it dissolved all the Pcs relatively good.
Stock solutions (1000 µM, 1.0 mL) of all Pcs were prepared and the dilutions were prepared by
spiking 20 – 80 µL of the corresponding stock solution into 10.0 mL of solvent. Emission spectra
were obtained on a Fluorolog®-HORIBA JOBINVYON (Model LFI-3751) spectrofluorimeter.
The optical densities of the solutions used for emission studies ranged between 0.04 – 0.05 at
excitation wavelengths. All experiments were carried out within 4 h of solution preparation at
room temperature (23-25 °C) with 10 mm path length spectrophotometric cell. The fluorescent
quantum yields (Фf) were determined using a secondary standard method.55
By comparison with
ZnPc (Фf = 0.17) as a reference, the values of fluorescence were obtained in DMF solvent.56
3.4.4. Computational Studies
Docking of EGFR-L1 and –L2 peptides to EGFR protein extracellular domain was
performed using AUTODOCK 4 software.34,35
EGFR crystal structure was obtained from a
protein databank (PDB code: 1nql).57
Solvent molecules were removed from the pdb file. Polar
hydrogen atoms were added to the structure. For EGFR-L1 peptide docking a grid box was
created with amino acid residue on EGFR Asn134 as center of the grid box, and for EGFR-L2
docking a grid box was created near EGF binding site on EGFR.27,28
A grid box with dimensions
of 128×128×128 Å3 was used for calculations. Three dimensional structures of peptide EGFR-L1
and EGFR-L2 were generated using InsightII (Accelrys Inc., Sandiego, CA). Structures were
115
subjected to 300 K and molecular dynamics (MD) followed by simulated annealing MD.58
The
final structure from simulated MD was energy minimized and used for docking studies. In
peptides EGFR-L1 and EGFR-L2 rotatable bonds were allowed to rotate during docking
calculations. For docking 50 runs with 10 million energy evaluations were carried out using
Lamarkian genetic algorithm. Docking calculations were performed on Linux cluster on high
performance supercomputers at LSU Baton Rouge. Docked structures were listed in increasing
order of energy, and low energy clusters were used as the most probable binding models.
Structures from low energy docking were displayed and analyzed using PyMol software.
3.4.5. Cell Studies
All tissue culture medium and reagents were purchased from Invitrogen (Carlsbad, CA).
Human carcinoma HEp2 cells, human epidermoid carcinoma A431, human colorectal
adenocarcinoma HT-29, and cercopithecus aethiops kidney Vero cells, were purchased from
ATCC. HT-29 cells were cultured and maintained in McCoy’s 5A Medium Modified
supplemented with 10% FBS and 1% antibiotic (Penicillin Streptomycin). HT-29 cells were
infected with a lentivirus containing the enhanced green fluorescent protein (eGFP; virus
purchased from Biogenova, Ellicott City, MD). Green fluorescent cells were sorted by flow
cytometry and expanded to generate a line termed “HT-29 eGFP”. Both A431 and Vero cells
were cultured and maintained in ATCC formulated DMEM supplemented with 10% FBS and
1% antibiotic (Penicillin Streptomycin). HEp2 cells were cultured and maintained in 50:50
ATCC formulated DMEM/Advanced MEM containing 10% FBS and 1% antibiotic (Penicillin
Streptomycin). The cells were split twice weekly to maintain a sub-confluent stock. All
compound solutions were filter-sterilized using a 0.22 μm syringe filter. A 32 mM stock solution
was prepared for each Pc by dissolving in DMSO containing 5% Cremophor EL (as a nonionic

116
emulsifier), to avoid compound precipitation upon dilution into media. From this solution, a 400
μM stock was also prepared in desired medium and filter-sterilized using a 0.22 μm syringe
filter.
Time-Dependent Cellular Uptake: HEp2 cells and A431 cells were plated at 7,500 per
well in a Costar 96 well plate and allowed to grow for 48 h. Vero cells were plated at 7,500 per
well in a Costar 96 well plate and allowed to grow for 24 h. HT-29 cells were plated at 7,500 per
well in a Costar 96 well plate and allowed to grow for 96 h. Pc stock solutions (32 mM) were
diluted to 10 μM Pc solutions in media and added to the cells at different time periods of 0, 1, 2,
4, 8, and 24 h. Uptake of the compounds was stopped by removing loading medium and washing
once with PBS. Cells were solubilized by adding 0.25% Triton X-100 in PBS. The Pc
concentration was determined by reading its fluorescence emission at 650/700 nm
(excitation/emission) using a BMG FLUOstar plate reader (Cary, NC). Cell number was
quantified using CyQuant reagent.
Dark Cytotoxicity: The cells were plated and allowed to grow as described above. Pc
stock solutions (32 mM) were diluted to concentrations of 25, 50, 100 and 125 μM in medium,
and added to cells for 24 h. The loading medium was removed and medium containing Cell Titer
Blue was added to determine the toxicity of the compounds (viable cells were measured
fluorescently at 570/615 nm); untreated cells were considered 100% viable and cells treated with
0.2% saponin as 0% viable.
Phototoxicity: The cells were plated and allowed to grow as described above. The Pc
stock solutions (32 mM) were diluted to concentrations of 6.25, 12.5, 25, 50 and 100 μM in
medium and added to cells for 24 h. The loading medium was removed and fresh medium was
added. The conjugates were exposed to light using a light system (Newport) at 1 J/cm2 for 20

117
min. The plates were chilled at 5 °C using a cooling block. Water was used as a filter for IR
radiation. The plates were then incubated for another 24 h followed by removing medium and
adding medium containing Cell Titer Blue to determine the toxicity of the compounds.
Microscopy: The cells were inoculated in a glass-bottom 6-well plate (MatTek) and
allowed to grow for 48 h. The cells were then exposed to 10 µM for each Pc for 6 h. Organelle
tracers were obtained from Invitrogen and used at the following concentrations: LysoSensor
Green 50 nM, MitoTracker Green 250 nM, ER Tracker Blue/white 100 nM, and BODIPY FL C5
ceramide 1 µM. Images were acquired using a Leica DMRXA microscope with 40× NA 0.8dip
objective lens and DAPI, GFP and Texas Red filter cubes (Chroma Technologies).
3.4.6. In Vivo Uptake Studies
For the animal studies, Nu/nu mice were purchased from Charles Rivers Laboratories at 6
weeks of age. After approximately 2 weeks of quarantine, mice were implanted with tumor cells
subcutaneously in the upper flank. For these injections, each cell line was cultured to
approximately 75% confluence, then dissociated with trypsin, and concentrated by
centrifugation. Since the two tumor lines were found to grow at different rates in nude mice, 1 x
106 A431 cells and 2 x 10
6 HT-29 eGFP cells were implanted in a volume of 100 µL. The
injection material consisted of 4 parts DMEM and 1 part MatriGel basement membrane matrix
(BD biosciences). Tumors were allowed to develop until palpable (approximately 6 days for
A431 cells and 9 days for HT-29 eGFP cells), after which mice were imaged for time = 0, then
injected through the tail vein with 20 µL of a 10 mM solution of Pc 3.11 in 10% DMSO and 5%
Cremophor EL in PBS, for a dose of ~ 10 mg/kg. The mice were then observed for acute adverse
responses to the injected Pc and returned to their box until imaged. Prior to imaging at selected
time points after Pc administration, mice were anesthetized with isoflurane gas to effect then

118
imaged individually for 30 s at excitation 630 nm and emission 700 nm (x630/m700) in a Kodak
In Vivo FX whole animal imager. All animal experiments were conducted by adherence to a
protocol approved by the LSU IACUC committee.
To quantify relative fluorescence within the image of the tumor region, a region-of-
interest (roi) was drawn around the tumor and the mean pixel intensity (mpi) of this roi was
divided by the mpi’s of 3 adjacent skin areas to obtain a percent of tumor fluorescence over
adjacent regions. In order to visually distinguish one roi as more fluorescent than adjacent skin, it
was found that the roi needed to be at least 120%.
At 24 and 96 h following iv injection of Pc 3.11, the HT-29 tumor tissue was harvested
from mice and flash frozen. The tissue was kept in 5 mL of acetone/methanol (5:1) at -20 °C
overnight, then crushed repeatedly using a mortar, filtered and the organic solvents removed
under reduced pressure. The residues were analyzed by MALDI-TOF and UV-Vis
spectrophotometry. Frozen sections of tumor were cut to 10 µm thickness and mounted on glass
slides. Tissues were immediately imaged for both eGFP indicating regions of HT-29 tumor and
near-IR indicating Pc fluorescence using Chroma 41017 (450-490 nm excitation, 500-550 nm
emission) and Omega Optical 140-2 (570-645 nm excitation, 668-723 nm emission) filter sets
respectively.
3.5. References
1. Cancer, A. C. S. D. G. C. a. R. What are the key statistics for colorectal cancer?
2. Kiesslich, R.; Goetz, M.; Vieth, M.; Galle, P. R.; Neurath, M. F. Nat. Clin. Pract. Oncol.
2007, 4, 480-490.
3. Van den Broek, F. J.; Fockens, P.; Dekker, F. Aliment. Pharmacol. Ther. 2007, 26, 91-99.
4. Ongarora, B. G.; Fontenot, K. R.; Hu, X.; Sehgal, I.; Satyanarayana-Jois, S. D.; Vicente, d.
G. H. Journal of Medicinal Chemistry 2012, 55 (8), 3725-3738.
119
5. Kantsevoy, S. V.; Adler, D. G.; Conway, J. D.; Diehl, D. L.; Farraye, F. A.; Kaul, V.;
Kethu, S. R.; Kwon, R. S.; Mamula, P.; Rodriguez, S. A.; Tierney, W. M.; Comm, A. T.
Gastrointestinal Endoscopy 2009, 70 (2), 197-200.
6. Leznoff, C. C.; Lever, A. B. P., Eds. In Phthalocyanines: Properties and Applications.
VCH: Weinheim, 1989-1996; vols 1-4.
7. Sharman, W. M.; Van Lier, J. E. In The Porphyrin Handbook, Kadish, K. M.; Smith, K.
M.; Guilard, R., Eds.; Academic Press: Boston, 2003, 15, 1-60.
8. Liu, T. M.; Chu, S. W.; Sun, C. K.; Lin, B. L.; Cheng, P. C.; Johnson, I. Scanning. 2001,
23, 249-254.
9. Ben-Hur, E.; Chan, W.-S. In The Porphyrin Handbook, Kadish, K. M.; Smith, K. M.;
Guilard, R., Eds.; Academic Press: Boston, 2003, 19, 1-35.
10. Erk, P.; Hengelsberg, H. In The Porphyrin Handbook, Kadish, K. M.; Smith, K. M.;
Guilard, R., Eds.; Academic Press: Boston, 2003, 19, 106-146.
11. Kimura, M.; Shirai, H. In The Porphyrin Handbook, Kadish, K. M.; Smith, K. M.; Guilard,
R., Eds.; Academic Press: Boston, 2003, 19, 151-173.
12. Dougherty, T. J.; Gomer, C. J.; Henderson, B. W.; Jori, G.; Kessel, D.; Korbelik, M.;
Moan, J.; Peng, Q. J. Natl. Cancer Inst. 1998, 90, 889-905.
13. Pandey, R. K. J. Porphyrins Phthalocyanines 2000, 4, 368-373.
14. Sharman, W. M.; van Lier, J. E.; Allen, C. M. Adv. Drug Delivery Rev. 2004, 56, 53-76
15. Savellano, M. D.; Hasan, T. Clin. Cancer Res. 2005, 11, 1658-1668
16. Hudson, R.; Boyle, R. W. J. Porphyrins Phthalocyanines 2004, 8, 954-975.
17. Pérez-Soler, R. The Oncologist 2004, 9, 58-67.
18. Meric-Bernstam, F.; Hung, M.-C. Clin. Cancer Res. 2006, 12, 6326-6330.
19. Spano, J.–P.; Lagorce, C.; Atlan, D.; Milano, G.; Domont, J.; Bnamouzig, R.; Attar, A.;
Benichou, J.; Martin, A.; Morere, J. –F.; Raphael, M.; Penault-Llorca, F.; Breau, J.–L.;
Fagard, R.; Khayat, D.; Wind, P. Ann. of Oncol. 2005, 16, 102-108.
20. Galizia, G.; Iieto, E.; Ferraraccio, F.; De Vita, F.; Castellano, P.; Orditura, M.; Imperatore,
V.; La Mura, A.; La Manna, G.; Pinto, M.; Catalano, G.; Pignatelli, C.; Ciardiello, F. Ann.
of Surg. Oncol. 2006, 13, 823-835.
21. Dougherty, U.; Sehdev, A.; Cerda, S.; Mustafi, R.; Little, N.; Yuan, W.; Jagadeeswaran, S.;
Chumsangsri, A.; Delgado, J.; Tretiakova, M.; Joseph, L.; Hart, J.; Cohen, E. E.; Aluri, L.;
Fichera, A.; Bissonnette, M. Clin. Cancer Res. 2008, 14, 2253-2262.

120
22. Loeffler-Ragg, J.; Schwentner, I.; Sprinzl, G. M.; Zwierzina, H. Expert Opin. Investig.
Drugs 2008, 17, 1517-1531.
23. Molema, G. Acta Biochim. Polonica 2005, 52, 301-310.
24. Dane, K. Y.; Chan, L. A.; Rice, J. J.; Daugherty, P. S. J. Immun. Meth. 2006, 309, 120-129.
25. Frochot, C.; Stasio, B. D.; Vanderesse, R.; Belgy, M.-J.; Dodeller, M.; Guillemin, F.;
Viriot, M.-L.; Barberi-Heyob, M. Bioorganic Chem. 2007, 35, 205-220.
26. Song, S. X.; Liu, D.; Peng, J. L.; Sun, Y.; Li, Z. H.; Gu, J. R.; Xu, Y. H. Int. J. Pharmac.
2008, 363, 155-161.
27. Song, S.; Liu, D.; Peng, J.; Deng, H.; Guo, Y.; Xu, L. X.; Miller, A. D.; Xu, Y. FASEB J.
2009, 23, 1396-1404.
28. Li, Z.; Zhao, R.; Wu, X.; Sun, Y.; Yao, M.; Li, J.; Xu, Y.; Gu, J. FASEB J. 2005, 19, 1978-
1985.
29. Sibrian-Vazquez, M.; Ortiz, J.; Nesterova, I. V.; Fernández-Lázaro, F.; Sastre-Santos, A.;
Soper, S. A.; Vicente, M. G. H. Bioconjugate Chem. 2007, 18, 410-420.
30. Ongarora, B. G.; Hu, X.; Li, H.; Fronczek, F. R.; Vicente, M. G. H. MedChemComm 2012,
3 (2), 179-194.
31. Sibrian-Vazquez, M.; Jensen, T. J.; Hammer, R. P.; Vicente, M. G. H. J. Med. Chem. 2006,
49, 1364-1372.
32. Sibrian-Vazquez, M.; Jensen, T. J.; Vicente, M. G. H. Org. Biomol. Chem. 2010, 8, 1160-
1172.
33. Rocha-Lima, C. M.; Soares, P. H.; Raez, L. E.; Singal, R. Cancer Control 2007, 14 (3),
295-304.
34. Morris, G. M.; Goodsell, D. S.; Halliday, R. S.; Huey, R.; Hart, W. E.; Belew, R. K.;
Olson, A. J. J. Comp. Chem. 1998, 19, 1639–1662.
35. Huey, R.; Morris, G. A.; Olson, A. J.; Goodsell, D. S. J. Comp. Chem. 2006, 28, 1145–
1152.
36. Gulli, L. F.; Palmer, K. C.; Chen, Y. Q.; Reddy, K. B. Cell Growth Diff. 1996, 7 (2), 173-
178.
37. Kawamoto, T.; Sato, J. D.; Le, A.; Polikoff, J.; Sato, G. H.; Mendelsohn, J. Proc. Nat.
Acad. Sc. USA 1983, 80 (5), 1337-1341.
38. Haigler, H.; Ash, J. F.; Singer, S. J.; Cohen, S. Proc. Nat. Acad. Sci. 1978, 75 (7), 3317-
3321.
121
39. Macfarla, D.; Sommervi, Rg. Archiv. Ges. Virusforsch. 1969, 27 (2-4), 379-385.
40. Pellegrini, R.; Centis, F.; Martignone, S.; Mastroianni, A.; Tagliabue, E.; Tosi, E.; Menard,
S.; Colnaghi, M. I. Cancer Immunol. Immunotherapy 1991, 34 (1), 37-42.
41. Magné, N.; Fischel, J. L.; Dubreuil, A.; Formento, P.; Poupon, M.-F.; Laurent-Puig, P.;
Milano, G. Br. J. Cancer 2002, 86, 1518–1523.
42. Giannopoulou, E.; Antonacopoulou, A.; Matsouka, P.; Kalofonos, H. P. Anticancer Res.
2009, 29 (12), 5077-5082.
43. Sibrian-Vazquez, M.; Jensen, T. J.; Fronczek, F. R.; Hammer, R. P.; Vicente, M. G. H.
Bioconjugate Chem. 2005, 16 (4), 852-863.
44. Futaki, S.; Suzuki, T.; Ohashi, W.; Yagami, T.; Tanaka, S.; Ueda, K.; Sugiura, Y.
Arginine-rich peptides. J. Biol. Chem. 2001, 276, 5836-5840.
45. Zuhorn, I. S.; Hoekstra, D. J. Memb. Biol. 2002, 189 (3), 167-179.
46. Rothbard, J. B.; Jessop, T. C.; Lewis, R. S.; Murray, B. A.; Wender, P. A. J. Am. Chem.
Soc. 2004, 126, 9506-9507.
47. He, J.; Haney, R. M.; Vora, M.; Verkhusha, V. V.; Stahelin, R. V.; Kutateladze, T. G. J.
Lipid Res. 2008, 49 (8), 1807-1815.
48. Rao, R. V.; Hermel, E.; Castro-Obregon, S.; del Rio, G.; Ellerby, L. M.; Ellerby, H. M.;
Bredesen, D. E. J. Biol. Chem. 2001, 276, 33869-33874.
49. Kessel, D. J. Porphyrins Phthalocyanines 2004, 8, 1009-1014.
50. Trivedi, E. R.; Harney, A. S.; Olive, M. B.; Podgorski, I.; Moin, K.; Sloane, B. F.; Barrett,
A. G. M.; Meade, T. J.; Hoffman, B. M. Proc. Nat. Acad. Sci. 2010, 107 (4), 1284–1288.
51. Jeong, H.; Huh, M.; Lee, S. J.; Koo, H.; Kwon, I. C.; Jeong, S. Y.; Kim, K. Theranostics
2011, 1, 230-239.
52. Spernyak, J. A.; White III, W. H.; Ethirajan, M.; Patel, N. J.; Goswami, L.; Chen, Y.;
Turowski, S.; Missert, J. R.; Batt, C.; Mazurchuk, R.; Pandey, R. K. Bioconjugate Chem.
2010, 21, 828-835.
53. Dabrowski, J. M.; Krzykawska, M.; Arnaut, L. G.; Pereira, M. M.; Monteiro, C. J. P.;
Simoes, S.; Urbanska, K.; Stochel, G. Chem. Med. Chem. 2011, 6 (9), 1715-1726.
54. Sibrian-Vazquez, M.; Jensen, T. J.; Vicente, M. G. H. J. Med. Chem. 2008, 51, 2915-2923.
55. Brykina, G. D.; Uvarova, M. I.; Koval, Y. N.; Shpigun, O. A. J. Anal. Chem. 2001, 56,
940-944.
56. Zorlu, Y.; Dumoulin, F.; Durmus, M.; Ahsen, V. Tetrahedron 2010, 66, 3248-3258.
122
57. Ferguson, K. M.; Berger, M. B.; Mendrola, J. M.; Cho, H.; Leahy, D. J., Lemmon, M. A.
Mol. Cell. 2003, 11, 507-517.
58. Sutcliffe, M. J. In NMR of Macromolecules: A Practical Approach. Roberts G. C. K., Ed.;
Oxford University Press: New York, 1993, 359–390.

123
CHAPTER 4
SYNTHESES, CHARACTERIZATION AND PHOTOPHYSICAL EVALUATION OF
REGIOMERICALLY PURE PHTHALOCYANINES FOR CANCER IMAGING AND
PHOTODYNAMIC THERAPY APPLICATIONS
4.1. Background
Pcs exhibit strong absorptions in the near-IR, a feature that has made them find multiple
applications in biology, medicine and materials science. They have found use as colorant dyes,
optical sensors, bioimaging agents, and as photosensitizers for the photodynamic therapy (PDT)
of cancers and the inactivation of bacteria and viruses.1-3
Photofrin, a derivative of
hematoporphyrin IX, has been used for nearly three decades in the PDT treatment of various
cancers, including lung, skin, cervical and bladder.4,5
Nevertheless, its persistence in healthy
tissues for long periods of time after systemic administration causes unwanted side-effects, such
as patient photosensitivity for several weeks post-PDT. This is what has caused great interest in
the search for new PDT drugs. In PDT, a photosensitizer is activated by light and produces
singlet oxygen and other reactive oxygen species (ROS) in situ, as discussed in Chapter 1. The
ROS produced destroy proximal cells via necrosis and/or apoptosis.6,7
Pcs are promising
photosensitizers because they are photochemically stable and produce ROS upon light activation.
Sulfonated Al(III)Pc or Photosense, and a Si(IV)Pc (Pc4) are in clinical trials for PDT.8-10
Addition of peripheral water-solubilizing substituents and/or axial ligands minimizes
aggregation and increases Pc solubility in aqueous media. Polyethylene glycol (PEG) may serve
as a delivery vehicle11-13
and, in some cases, can be covalently bound to Pcs14-16
for improved
delivery to target tissues. Pegylation of photosensitizers increases their water-solubility, serum
life, tumor accumulation, and also reduces their uptake by the reticuloendothelial system.17-20
As
a continuation of the investigation of Pcs as potential photosensitizers with enhanced biological
effectiveness, this Chapter describes the syntheses and characterization of a new series of

124
regiomerially pure Pcs, containing at least a PEG group. It is anticipated that pegylation of the
ZnPc macrocycle will increase solubility and biological efficacy. The Pcs described in this
Chapter can serve as biomarkers or photosensitizers for PDT. They are also single isomers as
opposed to those reported in earlier Chapters.
4.2. Synthesis of A2B2- and A3B-type Pcs
In Chapter 1, some of the protocols for the tetramerization of two or more phthalonitriles
that have been reported in the past were described. Kobayashi and coworkers developed a
method to synthesize A3B-type Pcs via ring expansion of a subphthalocyanine template.21
The
polymeric-support synthesis of A3B-type Pcs was developed by Leznoff and coworkers in 1982,
where a mono-functionalized diiminoisoindoline precursor bound to solid polymer support reacts
with another precursor to form A3B-type Pcs.22-24
Tomoda method – by optimization of reactant
ratios and reaction conditions – gives differently substituted Pcs, not including constitutional
isomers.21
The use of one of the phthalonitriles in excess is one such modification that may favor
the formation A3B-type Pcs.25
In some cases, half Pcs have been used in the preparation of A2B2-
type Pcs.26
Side-strapped Pcs have also been synthesized, with the aim of reducing the number of
isomers obtained in case of A2B2-type Pcs. These bridged Pcs may be obtained via bis-
phthalonitriles. Suitable bis(3-phthalonitriles) can be synthesized from 2,2-dialkyl propane-1,3-
diols or chiral bis-naphthols, although it has been reported that many other bis(3-phthalonitriles)
do not form side-strapped Pcs.27
A chiral side-strapped Pc with D2h symmetry has been
synthesized from bis(4-phthalonitrile) containing flexible linker.28
Another example is the
synthesis of 1,2-bis(3,4-dicyanophenoxymethyl)benzene, using 1,2-bis(hydroxymethyl)benzene
and 4-nitrophthalonitrile.29
In our synthetic strategy, a carefully designed a protecting group (1,2-
bis(bromomethyl)benzene) was reacted with mono-pegylated 2,3-dicyanohydroquinone to obtain

125
the target di-pegylated bis-phthalonitrile. The bis-phthalonitrile facilitated the formation of A2B2-
type Pc. The other product formed during this reaction led to the formation of A3B-type Pc,
following acidic deprotection of the precursor Pc.
4.2.1. Synthesis of Phthalonitriles
The synthesis of the regiomerically pure Pcs started with a reaction of 3-
nitrophthalonitrile and N-Boc-serinol. Mass spectrum and X-ray structure of the crude revealed
that the reaction did not yield the desired product, tert-butyl-(1,3-bis(2,3-
dicyanophenoxy)propan-2-yl)carbamate 4.2 (Scheme 4.1). Instead, it formed a bis-phthalonitrile
ether 4.3 (Figure 4.1). It was probably formed via nucleophilic attack of the nitro group by
hydroxyl group, and then a nucleophilic attack by the 3-hydroxyphthalonitrile on another 3-
nitrophthalonitrile to form ether 4.3.
Scheme 4.1. Synthetic strategy to tert-butyl-(1,3-bis(2,3-dicyanophenoxy)propan-2-yl)carbamate
4.2. Conditions and reagents, a: N-Boc-serinol, K2CO3, DMF, 65 °C, 24 h.
This led to new strategy where a mixture of 3-nitrophthalonitrile and 1,2-
bis(hydroxymethyl)benzene gave 3,3'-((1,2-phenylenebis(methylene))bis(oxy))diphthalonitrile,
4.4, which was characterized by NMR and MS (HRMS-ESI). Dimerization of the bis-
phthalonitrile in the presence of Zn(II) acetate and a catalytic amount of DBN in DMAE resulted
in trace amounts of Pc 4.5 (Scheme 4.2), which was characterized by MS (MALDI-TOF) m/z

126
peak at 844.177 (M)+, calcd for C48H28N8O4Zn 844.153. The formation of the macrocycle could
not be achieved in reasonable amounts by varying reaction conditions, such as temperature,
concentration and reaction time. This indicated that the formation of this type of side-strapped Pc
was difficult. Construction of a model of Pc 4.5 revealed that there was a lot of strain in the
molecule. This explained why the product was obtained in trace amounts.
Scheme 4.2. Synthetic strategy to 3,3'-[(1,2-phenylenebis(methylene))bis(oxy)]diphthalonitrile
4.4 and bis-phthalocyanine 4.5. Conditions and reagents: (a) 1,2-benzenedimethanol, K2CO3,
DMF, 65 °C, 24 h, 71.2% (b) Zn(OAc)2, DMAE, 140 °C, 5 h.
4.3
4.7
Figure 4.1. X-ray structures of phthalonitriles 4.3 and 4.7 from crystal structure determinations
(N atoms are blue, O atoms red and H atoms white).
The above strategy seemed promising but due to solubility issues and difficulties in the
macrocyclization, a new approach was sought. To enhance solubility, a mixture of 3-
nitrophthalonitrile and 3-cyclohexene-1,1-dimethanol was reacted and after tedious purification
of the crude, yellow crystals of mono-substituted adduct 4.7 were obtained (Scheme 4.3). When
the conversion of the mono-substituted adduct to di-substituted product 4.6 was attempted, the
bis-phthalonitrile ether 4.3 was formed – obtained from an earlier reaction (Scheme 4.1).

127
Scheme 4.3. Synthetic strategy to 3,3'-[(cyclohex-3-ene-1,1-diylbis(methylene))bis(oxy)]-
diphthalonitrile 4.6. Conditions and reagents: 3-cyclohexene-1,1-dimethanol, K2CO3, DMF, 65
°C, 24 h, 25%.
In Chapter 1, a review of the published syntheses of bridged-Pcs, or side-strapped Pcs
obtained from single phthalonitriles precursors, was presented. The synthesis of these Pcs is
usually carried out under dilute conditions for the cyclotetramerization of bis-phthalonitriles.
Suitable bis(3-phthalonitriles) are prepared from 2,2-dialkyl propane-1,3-diols or chiral bis-
naphthols, although not many bis(3-phthalonitriles) form side-strapped Pcs.27
This suggests that
the choice of precursor phthalonitriles is important in the syntheses of A2B2-type Pcs.
Therefore, in our synthesis of pegylated and regiomerically pure Pcs, a mixture of
phthalonitrile 4.8, synthesized according to a literature procedure,15
and 1,2-
bis(bromomethyl)benzene reacted to give the target di-pegylated bis-phthalonitrile 4.9 in 84.3%
yield (Scheme 4.4). The yield for this bis-phthalonitrile was higher compared with those
obtained in prior attempts. Its purification was relatively easy. In addition, it had a better
solubility in organic solvents, a feature that made it a suitable candidate for the synthesis of
regiomerically pure Pcs. The PEG groups on either side of the bis-phthalonitrile molecule
resulted in enhanced solubility of the Pcs described in this Chapter. This made it possible to use
column chromatography to purify the products.

128
The 1,2-bis(bromomethyl)benzene used in this synthesis was designed to introduce a 1,2-
dimethylbenzene protecting group that was later removed under acidic conditions to give the
desired product. The 1H NMR spectrum of bis-phthalonitrile 4.9 is shown in Figure 4.2.
Figure 4.2. 1H NMR spectrum of phthalonitrile 4.9 at 400 MHz (* denotes solvent).
4.2.2. Synthesis of Pcs
The methodology developed in this Chapter was specifically meant to afford A3B- and
A2B2-type regiomerically pure photosensitizers. Their synthetic route is shown in Scheme 4.4.
The condensation of phthalonitrile 4.9 and unsubstituted phthalonitrile in refluxing DMAE, and
in the presence of Zn(II) acetate and 1,5-diazabicyclo(4.3.0)non-5-ene (DBN) gave the protected
Pcs 4.10 and 4.11 in 5 – 7% yields. Reaction of Pcs 4.10 and 4.11 with concentrated H2SO4 gave
deprotected Pcs 4.12 and 4.13 respectively, in 95% and 40% yields.29,30
Pc 4.13 reacted with
3,3’-dimethylaminopropyl chloride hydrochloride to give Pc 4.14 in 50.0% yield.
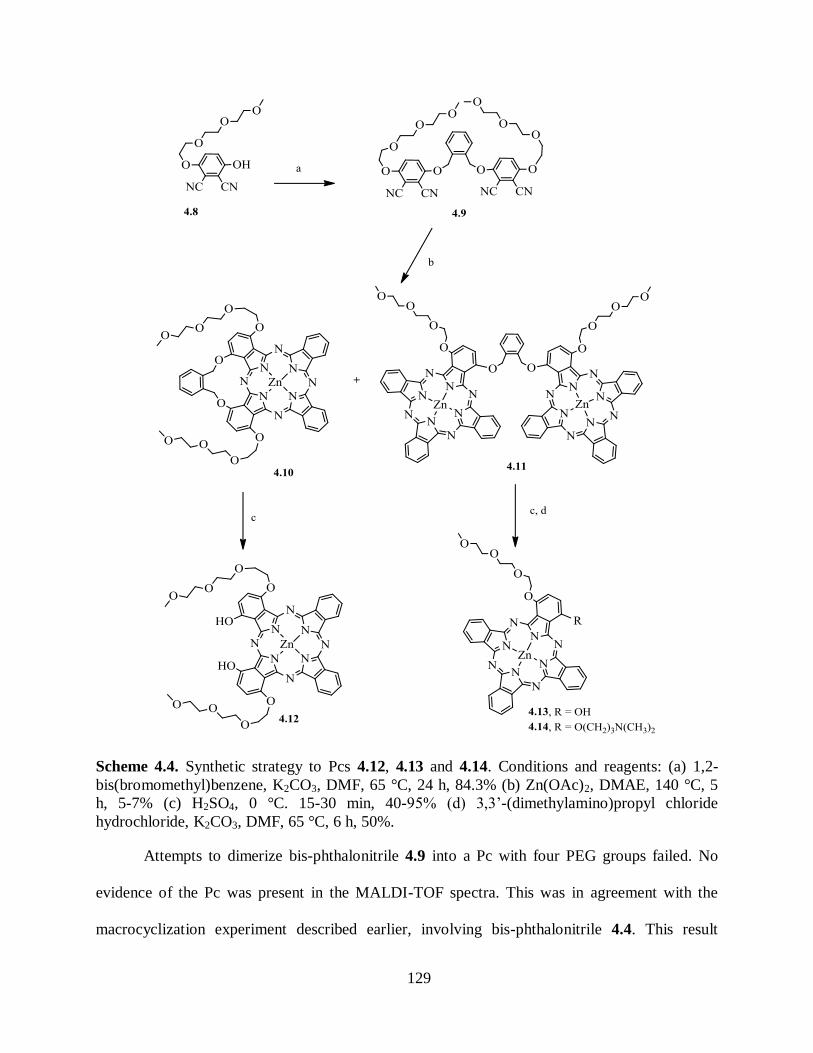
129
Scheme 4.4. Synthetic strategy to Pcs 4.12, 4.13 and 4.14. Conditions and reagents: (a) 1,2-
bis(bromomethyl)benzene, K2CO3, DMF, 65 °C, 24 h, 84.3% (b) Zn(OAc)2, DMAE, 140 °C, 5
h, 5-7% (c) H2SO4, 0 °C. 15-30 min, 40-95% (d) 3,3’-(dimethylamino)propyl chloride
hydrochloride, K2CO3, DMF, 65 °C, 6 h, 50%.
Attempts to dimerize bis-phthalonitrile 4.9 into a Pc with four PEG groups failed. No
evidence of the Pc was present in the MALDI-TOF spectra. This was in agreement with the
macrocyclization experiment described earlier, involving bis-phthalonitrile 4.4. This result

130
confirmed that the strain in this type of Pcs does not favor their formation. Although Pc 4.5 was
formed in traces, bis-phthalonitrile 4.9 failed to form a similar type of macrocycle. Instead, this
reaction gave A2B2-type Pc 4.10 and clamshell-type Pc 4.11 in 5.1 and 7.2% yields respectively.
Initial attempts to deprotect Pcs 4.10 and 4.11 at room temperature using
BCl3/pentamethylbenzene did not work.31
Metal-catalyst mediated deprotection of Pcs using
Palladium on carbon and hydrogen gas in THF did not work either. The anticipated
hydrogenolysis of the ‘benzylic ether’ did not occur. Instead, the palladium catalyst resulted in
decomposition of Pc 4.10, while Pc 4.11 was all recovered. The use of hydrobromic acid (HBr)
or acetic acid did not work either; it instead, removed Zn from the Pc core. Therefore, even the
deprotection experiments using H2SO4 (strong acid), which gave us the desired products, had to
be performed within a short duration to avoid the removal of the Zn metal.
Scheme 4.5. Strategy for the deprotection of benzyl groups under mild conditions.
It has been previously observed that a PEG group increases cellular uptake into human
HEp2 cells, and decreased cytotoxicity of the Pc macrocycles.32
In this Chapter, a low molecular
weight PEG (10-atom, triethylene glycol) on the Pc macrocycle as a solubilizing group was
investigated; this PEG group has the advantage of being commercially available and is also
relatively less flexible than the penta(ethylene glycol) previously reported. These Pcs have a
mono- or di-hydroxyl group(s), which may be used in further functionalization of the
macrocycles as illustrated in Scheme 4.4. Such functionalization of the Pcs is essential,
especially when coupling the photosensitizers to various biomolecules.

131
4.3. Spectroscopic and Photophysical Characterization
N-Methylated Pcs are sensitive to heat and therefore, the solvents used during the
synthesis and column chromatography of ZnPc 4.14 were removed at temperatures < 70 °C,
to avoid loss of N-methyls. The Pc was then immediately characterized by NMR and MS.
Although N-Demethylation in ZnPc 4.14 was not observed, MS analysis of previously
synthesized N-Methylated Pcs had shown N-Demethylation of ZnPcs upon prolonged storage
at room temperature.33
This observation may not be used to draw a conclusive observation,
but may suggest that N-demethylation is limited to benzylic N-methyls.
The Pcs were characterized by MS, NMR, UV-Vis and fluorescence spectroscopy;
MALDI-TOF was used to confirm the NMR data in deuterated DMF or acetone solvents. The
relative simplicity of the aromatic region of 1H-NMR spectra of ZnPcs 4.10, 4.11, and 4.14
suggested the regiomeric purity of the Pcs, compared with the ZnPcs synthesized in Chapters 2
and 3 (see Appendix C.1 and C.2 for 13
C NMR). Various regioisomers (up to fifteen for the di-
cationic ZnPcs) were expected from the cyclotetramerization reaction of two mono-substituted
phthalonitriles.33
The 1H NMR spectra of Pcs 4.10 and 4.11 are shown in Figures 4.3 and 4.4,
respectively. The 1,2-dimethylenebenzene protecting group had a peak at 6.42 (s, 4H, OCH2),
and other multiplets within the aromatic region for the benzene ring. Removal of the protecting
group under acidic conditions was confirmed by disappearence of these peaks from the 1H NMR
spectrum of ZnPc 4.11. MS spectrum of the deprotected ZnPc also agreed with the NMR
observations. In the 1H-NMR data of ZnPc 4.14 (Figure 4.5), the aromatic region remained
relatively simple in spite of the two different substituents added to the macrocycle. The two N-
methyls in ZnPc 4.14, have a peak at 2.53 ppm while the O-methyl peak is at 3.25 ppm. All the
chemical shifts of the PEG groups appeared between 3.5 – 5.2 ppm.

132
Figure 4.3 1H NMR spectrum of ZnPc 4.10 at 400 MHz (* denotes solvent).
Figure 4.4 1H NMR spectrum of ZnPc 4.11 at 400 MHz (* denotes solvent).
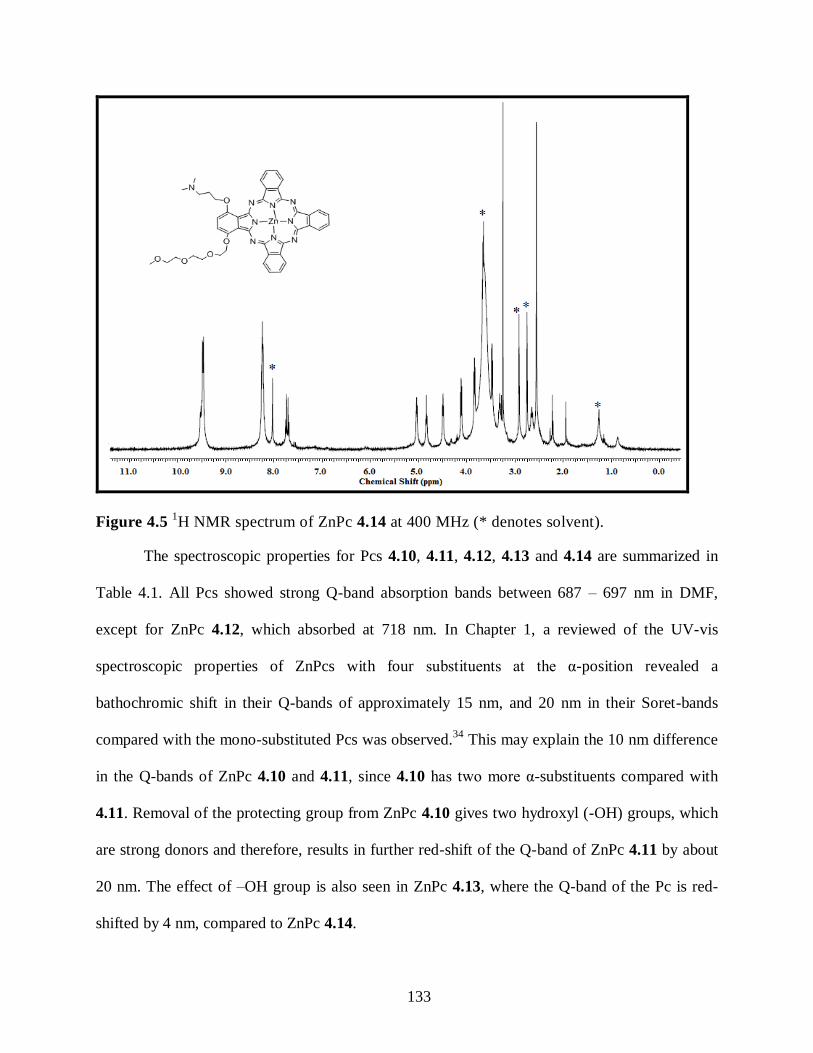
133
Figure 4.5 1H NMR spectrum of ZnPc 4.14 at 400 MHz (* denotes solvent).
The spectroscopic properties for Pcs 4.10, 4.11, 4.12, 4.13 and 4.14 are summarized in
Table 4.1. All Pcs showed strong Q-band absorption bands between 687 – 697 nm in DMF,
except for ZnPc 4.12, which absorbed at 718 nm. In Chapter 1, a reviewed of the UV-vis
spectroscopic properties of ZnPcs with four substituents at the α-position revealed a
bathochromic shift in their Q-bands of approximately 15 nm, and 20 nm in their Soret-bands
compared with the mono-substituted Pcs was observed.34
This may explain the 10 nm difference
in the Q-bands of ZnPc 4.10 and 4.11, since 4.10 has two more α-substituents compared with
4.11. Removal of the protecting group from ZnPc 4.10 gives two hydroxyl (-OH) groups, which
are strong donors and therefore, results in further red-shift of the Q-band of ZnPc 4.11 by about
20 nm. The effect of –OH group is also seen in ZnPc 4.13, where the Q-band of the Pc is red-
shifted by 4 nm, compared to ZnPc 4.14.

134
Table 4.1. Spectral properties of ZnPcs 4.10, 4.11, 4.12, 4.13 and 4.14 at room temperature. a:
excitation at 640 nm; b: calculated using ZnPc (Фf = 0.17) as the standard in DMF.
Pc Excitationa (nm) Emission (nm) Stokes’ Shift фF
b
4.10 697 700 3 0.12
4.11 687 697 10 0.23
4.12 718 722 4 0.10
4.13 694 696 2 0.14
4.14 690 693 3 0.21
Figure 4.6 UV-Vis spectra for Pc 4.10, 4.11, 4.12, 4.13 and 4.14 in DMF: 2.0 µM (red), 4.0
µM (green), 6.0 µM (blue) and 8.0 µM (purple).

135
All the Pcs exhibit UV-vis absorption spectra that are typical of monomeric species
(Figure 4.6). The bis-phthalocyanine 4.11 shows substantial broadening of the Q-band centering
at 687 nm and the Soret-band at 340 nm, which are characteristic of aggregation phenomena.
The observation of both a blue shifted Q-band peak at 635 nm in addition to a red shifted 680–
750 nm shoulder points to mixed dimer-types Pcs.35
Since the shapes of the absorption spectra of
ZnPc 4.11 remained unchanged by the concentration of the Pc, this is a sign of intramolecular
assembly of the Pc molecules – probably an open clamshell type assembly of the molecules.
The emissions observed ranged between 693 – 722 nm in DMF solvent. The Stoke’s
Shifts were characteristics of ZnPcs, except for Pc 4.11, which had a 10 nm shift. A similar shift
was reported for bis-phthalocyanine by Yoshiyama et al. in chloroform solvent.35
The
fluorescence quantum yields observed for our ZnPcs were in the range 0.10 – 0.23, also
characteristic of ZnPcs.33,35,36
The solubility of the ZnPcs 4.10, 4.11, 4.12, 4.13 and 4.14 in polar organic solvents
such as DMSO, DMF and THF was investigated and all were found to be soluble in these
solvents. The Pcs were also fairly soluble in common organic solvents, such as DCM and
ethyl acetate. None of the Pcs could dissolve in water, even upon sonication, except Pc 4.11.
However, all Pcs remained in aqueous solution when diluted from concentrated stocks in
DMSO/cremophor EL into PBS (final DMSO concentration of 1%, cremophor 5%) at 10 µM
concentrations. No aggregation of the Pcs was observed at up to 8.0 µM concentrations in
DMF. At this concentration, all the ZnPcs show a Soret absorption band between 330 – 370
nm, a strong Q band centered at ~ 684 nm and two vibrational bands at around 620 and 650
nm that strictly follow the Lambert-Beer law. This is characteristic of non-aggregated Pcs in
DMF (Figure 4.6).37
136
4.4. Summary
Photosensitizing drugs associated with different types of delivery vehicles have received
interest within the field of PDT of tumors.38
Pcs containing a PEG group on the macrocycle have
been shown to increase the Pc tumor-cell targeting ability32
They also express increased water
solubility and cell permeability. A series of Pcs with either a short spacer or a low molecular
weight PEG-linker have also been reported recently.15
A low molecular PEG-linker was added to
some of the Pcs to increase water solubility (by reducing the hydrophobicity originating from
tert-butyl groups) and/or increase cellular uptake.39
In our synthesis, the starting material – phthalonitrile 4.8 – was synthesized according to
the literature procedure.15
The summary of the synthetic strategy is shown in Scheme 4.4. The di-
pegylated, bis-phthalonitrile 4.9 was used in macrocyclization reaction, with a 30 molar equiv.
excess of phthalonitrile to give di-PEG-Pc 4.10 and bis-phthalocyanine 4.11, respectively. The
PEG group(s) on the Pcs significantly increased their solubility in organic solvents, which made
their purification and characterization relatively easy. The target mono- and di-pegylated
macrocycles were mono-hydroxylated Pc 4.12 and di-hydroxylated 4.13 respectively, and were
obtained via acidic cleavage of the protecting group, using concentrated sulfuric acid.29,30
The 1H
NMR spectra of our Pcs were relatively simple in the aromatic region compared to those
synthesized in Chapters 2 and 3, an indication of regiomerically pure macrocycles.
Synthesis of A3B-type and A2B2-type Pcs often gave us statistical mixtures of isomers in
our syntheses in Chapters 2, 3 and 5. By eliminating the tert-butyl groups from the macrocycle,
pure regiomeric isomers of the Pcs were synthesized. Such pure regiomeric Pcs, may result in
reproducible photosensitizers as opposed to Photofrin, an oligomer of up to eight porphyrin
units, which is not easily reproducible.

137
4.5. Conclusions
Five regiomerically pure Pcs 4.10, 4.11, 4.12, 4.13 and 4.14 were synthesized in this
study. They might find application as potential florescence imaging agents for cancers, or for
PDT applications. Due to the hydrophobic nature of the Pc macrocycle, pegylation of the
macrocycles significantly improved the solubility of the Pcs, making their purification possible.
The spectroscopic data for the bis-phthalocyanine was significantly different from the other Pcs.
It had a Stoke’s Shift of 10 nm, and it also had two strong Q-bands in the 600 – 700 nm region
(characteristic of clamshell-type Pcs).
4.6. Experimental Section
General. All reagents and solvents were purchased from commercial suppliers and used
directly without further purification. Analytical thin-layer chromatography (TLC) was carried
out using plastic backed TLC plates 254 (precoated, 200 μm) from Sorbent Technologies. Silica
gel 60 (230×400 mesh, Sorbent Technologies) was used for column chromatography. NMR
spectra were recorded on Liquid AV-400 Bruker spectrometer (400 MHz for 1H, 100 MHz for
13C). The chemical shifts are reported in δ ppm using the following deuterated solvents as
internal references: CD3COCD3 2.04 ppm (1H), 29.92 ppm (
13C); DMF-d7 8.03 ppm (
1H), 163.15
ppm (13
C). MALDI-TOF mass spectra were recorded on a Bruker UltrafleXtreme (MALDI-
TOF/TOF) using 4-chloro-α-cyanocinnamic acid (CCA) as the matrix while high resolution ESI
mass spectra were obtained on an Agilent Technologies 6210 Time-of-Flight LC/MS.
Absorption spectra were measured on a UV-Vis NIR scanning spectrophotometer using 10 mm
path length quartz cuvettes. Stock solutions (1.0 mM, 1.0 mL each) of each Pc in DMF solvent
(HPLC grade) were prepared and dilutions achieved by spiking 20 – 80 µL of each stock
solution into DMF to give a 10 mL final volume. Emission spectra were obtained on a

138
Fluorolog® - HORIBA JOBINVYON, Model LFI-3751 spectrofluorimeter. The optical densities
of the solutions used for emission studies ranged between 0.04 – 0.05 at excitation wavelengths.
All measurements were taken within 4 h of solution preparation and carried out at (25 °C).
4.6.1. Synthesis of Phthalonitriles
3,3'-((1,2-phenylenebis(methylene))bis(oxy))diphthalonitrile 4.4. A mixture of 3-
nitrophthalonitrile (0.9 g, 5.2 mmol) and 1,2-benzenedimethanol (360.6 mg, 2.61 mmol) was
dissolved in DMF (10 mL) and heated to 65 °C. Potassium carbonate, K2CO3 (2.07 g, 0.015 mol)
were added into solution in four portions after every five minutes. The reaction mixture was
stirred for 24 h under argon at the same temperature. It was left to cool to room temperature and
poured into ice-cold water (200 mL). This was then filtered, washed with water, dried to obtain
(0.722 g, 71.2%. The product was used without purification due to solubility issues. 1H NMR
(DMF-d7, 400 MHz): δ 7.96-7.88 (m, 4H, Ar-H), 7.75-7.72 (m, 4H, Ar-H), 7.54-7.52 (m, 2H,
Ar-H), 5.71 (s, 4H, CH2).
3,3'-((cyclohex-3-ene-1,1-diylbis(methylene))bis(oxy))-diphthalonitrile 4.6. A mixture
of 3-nitrophthalonitrile (0.935 g, 5.4 mmol) and 3-cyclohexene-1,1-dimethanol (371.2 mg, 2.61
mmol) was dissolved in DMF (7.0 mL) and heated to 65 °C. Potassium carbonate, K2CO3 (2.07
g, 0.015 mol) were added into solution in four portions after every five minutes. The reaction
mixture was stirred for 24 h under argon at the same temperature. It was then left to cool to room
temperature and poured into ice-cold water (200 mL). This was then filtered and washed with
water. The crude was characterized by MS (MALDI-TOF) m/z 395.1494 [M+H]+, calcd for,
C24H18N4O2, 395.1508. The tedious purification of the crude product using a silica column eluted
with DCM/methanol (99:1 → 98:2) gave the first fraction as white solid on concentration.
Recrystallization from acetone and slow evaporation gives yellow crystals of mono-substituted
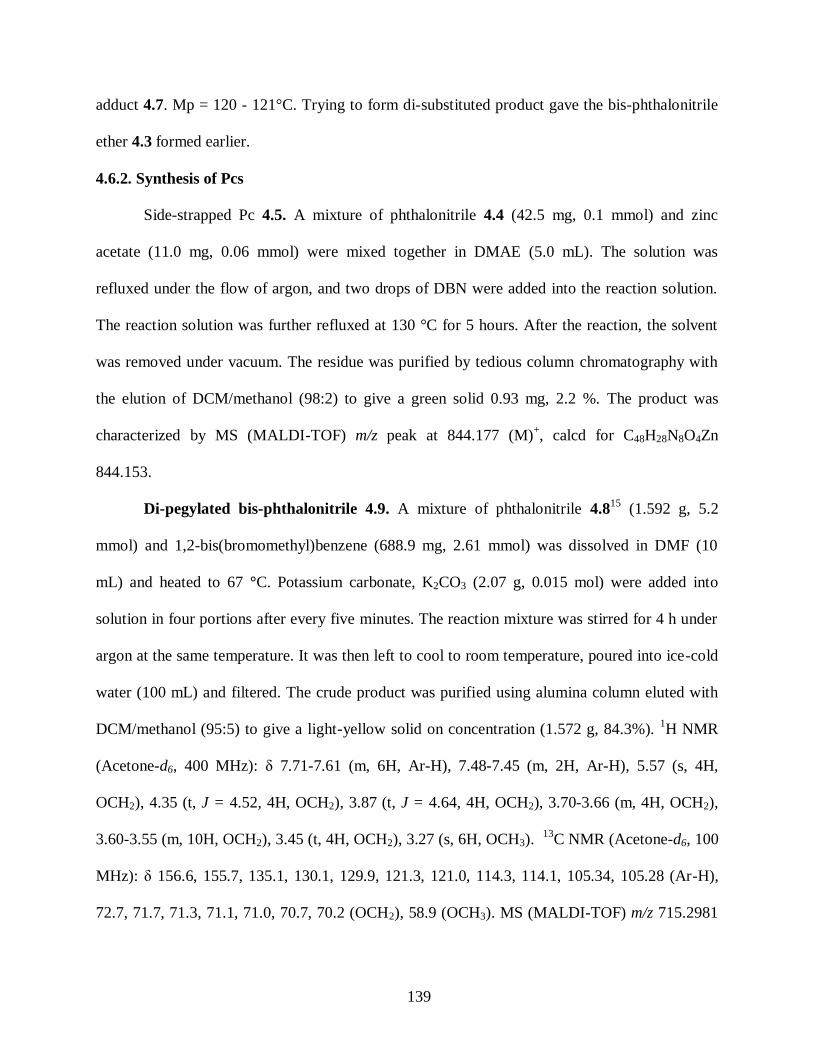
139
adduct 4.7. Mp = 120 - 121°C. Trying to form di-substituted product gave the bis-phthalonitrile
ether 4.3 formed earlier.
4.6.2. Synthesis of Pcs
Side-strapped Pc 4.5. A mixture of phthalonitrile 4.4 (42.5 mg, 0.1 mmol) and zinc
acetate (11.0 mg, 0.06 mmol) were mixed together in DMAE (5.0 mL). The solution was
refluxed under the flow of argon, and two drops of DBN were added into the reaction solution.
The reaction solution was further refluxed at 130 °C for 5 hours. After the reaction, the solvent
was removed under vacuum. The residue was purified by tedious column chromatography with
the elution of DCM/methanol (98:2) to give a green solid 0.93 mg, 2.2 %. The product was
characterized by MS (MALDI-TOF) m/z peak at 844.177 (M)+, calcd for C48H28N8O4Zn
844.153.
Di-pegylated bis-phthalonitrile 4.9. A mixture of phthalonitrile 4.815
(1.592 g, 5.2
mmol) and 1,2-bis(bromomethyl)benzene (688.9 mg, 2.61 mmol) was dissolved in DMF (10
mL) and heated to 67 °C. Potassium carbonate, K2CO3 (2.07 g, 0.015 mol) were added into
solution in four portions after every five minutes. The reaction mixture was stirred for 4 h under
argon at the same temperature. It was then left to cool to room temperature, poured into ice-cold
water (100 mL) and filtered. The crude product was purified using alumina column eluted with
DCM/methanol (95:5) to give a light-yellow solid on concentration (1.572 g, 84.3%). 1H NMR
(Acetone-d6, 400 MHz): δ 7.71-7.61 (m, 6H, Ar-H), 7.48-7.45 (m, 2H, Ar-H), 5.57 (s, 4H,
OCH2), 4.35 (t, J = 4.52, 4H, OCH2), 3.87 (t, J = 4.64, 4H, OCH2), 3.70-3.66 (m, 4H, OCH2),
3.60-3.55 (m, 10H, OCH2), 3.45 (t, 4H, OCH2), 3.27 (s, 6H, OCH3). 13
C NMR (Acetone-d6, 100
MHz): δ 156.6, 155.7, 135.1, 130.1, 129.9, 121.3, 121.0, 114.3, 114.1, 105.34, 105.28 (Ar-H),
72.7, 71.7, 71.3, 71.1, 71.0, 70.7, 70.2 (OCH2), 58.9 (OCH3). MS (MALDI-TOF) m/z 715.2981

140
[M+H]+, 737.2794 [M+Na]
+, 753.2525 [M+K]
+, calcd for, C38H43N4O10, 715.2974,
C38H43N4KO10, 737.2533.
Di-pegylated ZnPc 4.10. A mixture of phthalonitrile 4.9 (172.0 mg, 0.24 mmol),
phthalonitrile (845.6 mg, 6.60 mmol), and zinc acetate (220.0 mg, 1.20 mmol) were mixed
together in DMAE (13.0 mL). The solution was heated at 140 °C under the flow of argon, and
one drop of DBN was added to the reaction solution. The reaction solution was further refluxed
at 140 °C for 5 hours. After the reaction, the solvent was removed under vacuum. The residue
was dissolved in acetone and filtered under gravity to give a green viscous residue on
concentration. A silica column eluted by DCM/methanol (95:5) gave the Pcs as a green fraction.
A second silica column eluted by DCM/methanol (95:5) gave fraction green fraction. A third
silica column eluted by DCM/THF (3:1) gave Pc 4.10 as a green solid 12.7 mg, 5.1%. 1H NMR
(DMF-d7, 400 MHz): δ 9.28-9.17 (m, 4H, Ar-H), 8.19-8.11 (m, 4H, Ar-H), 8.02-7.95 (m, 2H,
Ar-H), 7.82-7.80 (m, 2H, Ar-H), 7.71-7.63 (m, 4H, Ar-H), 6.42 (s, 4H, OCH2), 4.95-4.48 (m,
4H, OCH2), 4.46 (t, J = 3.92, 4H, OCH2), 4.10 (t, J = 4.64, 4H, OCH2), 3.83 (t, J = 3.88, 4H,
OCH2), 3.65 (m, J = 4.64, 4H, OCH2), 3.54-3.42 (m, 4H, OCH2), 3.24 (s, 6H, OCH3). 13
C NMR
(DMF-d7, 100 MHz): δ 155.1, 154.6, 154.3, 154.1, 153.8, 152.6, 150.9, 140.0, 139.5, 135.4,
134.7, 133.6, 133.0, 132.9, 130.4, 130.3, 130.0, 129.8, 129.1, 128.2, 126.2, 124.1, 124.0, 123.8,
123.5, 123.4, 122.7, 121.5, 116.7 (Ar-C), 76.6, 72.8, 72.0 71.63, 71.57, 71.3, 71.2, 70.7, 70.4,
70.2 (OCH2), 59.0 (OCH3). MS (MALDI-TOF) m/z 1034.302 [M]+ calcd for, C54H50N8O10Zn,
1034.294. UV-vis (DMF): λmax (log ε) 340 (4.57), 629 (4.43), 697 (5.16) nm.
Deptrotected di-pegylated ZnPc 4.12. A mixture of Pc 4.10 (22.5 mg, 21.7 mmol) was
dissolved in H2SO4 (5.0 mL) at 0°C. The reaction mixture was stirred for 15 minutes at 0°C and
then poured into ice (50.0 mg), in a separatory funnel containing DCM/methanol (9:1, 50.0 mL).

141
To the mixture, 2N NaHCO3 (90.0 mL) was added and the product extracted from the organic
layer using DCM/methanol (9:1, 50.0 mL × 3) and washed with water (5 mL × 2). Organics were
removed under reduced pressure and the residue purified by column chromatography using
mixed solvents, DCM/methanol (98:2→ 95:5 → 9:1) to give deprotected di-pegylated bis-
phthalocyanine 4.12 as a green solid (19.2 mg, 95.0 %). 1H NMR (DMF-d7, 400 MHz): δ 9.29 (s,
4H, Ar-H), 8.17 (m, 4H, Ar-H), 7.75-7.51 (m, 4H, Ar-H), 5.06 (br, 4H, OCH2), 4.53-36 (br, 4H,
OCH2), 4.09 (t, J = 4.72, 4H, OCH2), 3.66 (t, J = 4.52, 4H, OCH2), 3.51-3.43 (m, 4H, OCH2),
3.26 (s, 6H, OCH3). 13
C NMR (DMF-d7, 100 MHz): δ 155.0, 154.2, 153.7, 151.5, 150.6, 149.8,
139.7, 139.4, 136.3, 130.0, 129.9, 124.0, 123.6, 123.2, 122.8, 119.8, 118.2 (Ar-C), 72.9, 72.8,
72.0 71.6, 71.33, 71.29, 70.7, (OCH2), 59.1, 59.0 (OCH3). MS (MALDI-TOF) m/z peak at
932.294 (M)+, calcd for C46H44N8O10Zn 932.247. UV-vis (DMF): λmax (log ε) 341 (4.86), 648
(4.63), 718 (5.23) nm.
Di-pegylated bis-phthalocyanine 4.11. This Pc was isolated during the first column
using DCM/methanol (95:5) as a greenish solid (28.2 mg, 7.2%). 1H NMR (DMF-d7): δ 9.11-
9.02 (m, 7H, Ar-H), 8.53-8.41 (m, 7H, Ar-H), 8.30-8.23 (m, 4H, Ar-H), 8.17-8.08 (m, 4H, Ar-
H), 7.93-7.90 (m, 2H, Ar-H), 7.82-7.77 (m, 4H, Ar-H), 7.46-7.44 (m, 2H, Ar-H), 7.01 (s, 4H,
OCH2), 6.87-6.84 (m, 2H, Ar-H), 4.65-4.55 (m, 8H, OCH2), 4.13-4.11 (m, 4H, OCH2), 3.89-3.86
(m, 4H, OCH2), 3.73-3.70 (m, 4H, OCH2), 3.55-3.52 (m, 4H, OCH2), 3.30 (s, 6H, OCH3). 13
C
NMR (DMF-d7, 100 MHz): δ 154.1, 153.5, 152.9, 152.4, 152.3, 151.8, 151.1, 150.6, 150.4,
140.4, 139.6, 139.4, 139.2, 139.0, 137.8, 130.2, 130.0, 129.2, 129.1, 129.4, 129.0, 128.2, 126.7,
126.3, 123.6, 123.34, 123.26, 123.0, 122.7, 119.2, 118.7, 117.4, 114.4 (Ar-C), 73.5, 72.9, 72.1,
72.0, 71.7, 71.6, 71.5, 71.4, 69.5 (OCH2), 59.1 (OCH3). MS (MALDI-TOF) m/z peak at

142
1614.396 (M)+, calcd for C86H66N16O10Zn2 1614.3717. UV-vis (DMF): λmax (log ε) 336 (4.93),
638 (5.01), 687 (4.98) nm.
A mixture of ZcPc 4.11 (22.5 mg, 13.9 mmol) was dissolved in H2SO4 (5.0 mL) at 0°C.
The reaction mixture was stirred for 30 minutes at 0°C and then poured into ice (50.0 mg), in a
separating funnel containing DCM/methanol (9:1, 50.0 mL). To the mixture, ~ 2N NaHCO3
(90.0 mL) added to attain a neutral pH. The product was extracted from the organic layer using
DCM/methanol (9:1, 50.0 mL × 3) and washed with water (5 mL × 2). Organics were removed
under reduced pressure and the residue purified using silica column chromatography with eluting
solvent system of DCM/ethyl acetate (1:2) to give a greenish solid (10.1 mg, 41.0 %). 1H NMR
(DMF-d7): δ 9.32 - 9.02 (m, 6H, Ar-H), 8.29-8.12 (m, 6H, Ar-H), 7.82-7.42 (m, 2H, Ar-H), 6.99
(br, 1H, OH), 5.11-4.97 (m, 2H, OCH2), 4.45-4.42 (m, 2H, OCH2), 4.12 (t, J = 4.76, 2H, OCH2),
3.68 (t, J = 3.52, 2H, OCH2), 3.48 (t, J = 4.68, 2H, OCH2), 3.30-3.27 (s, 3H, OCH3). 13
C NMR
(DMF-d7, 100 MHz): δ 154.4, 153.9, 152.9, 150.7, 139.3, 138.0, 130.3, 130.2, 129.4, 126.7,
123.8, 123.5, 123.4, 123.2, 123.0, 119.7, 117.7 (Ar-C), 72.9, 72.1, 71.7, 71.4 (OCH2), 59.1
(OCH3). MS (MALDI-TOF) m/z peak at 755.225 (M+H)+, calcd for C39H31N8O5Zn 755.1709.
UV-vis (DMF): λmax (log ε) 342 (4.71), 628 (4.49), 694 (5.19) nm.
3-(Dimethylamino)propyl substituted ZnPc 4.14. A procedure reported in literature
was used, with little modification, to furnish the desired product.40,41
A mixture of Pc 4.13 (18.1
mg, 0.024 mmol) and 3-(Dimethylamino)propyl chloride hydrochloride (4.7 mg, 0.030 mmol)
were mixed together in DMF (5.0 mL), the solution heated at 65 °C under argon, and K2CO3
(50.0 mg, 3.6 mmol) added to the reaction solution. The reaction solution was heated at the same
temperature for 6h. The solvent was removed under reduced pressure and the residue dissolved
in DCM/methanol (9:1, 5.0 mL). The mixture was diluted using ethyl acetate, washed with water
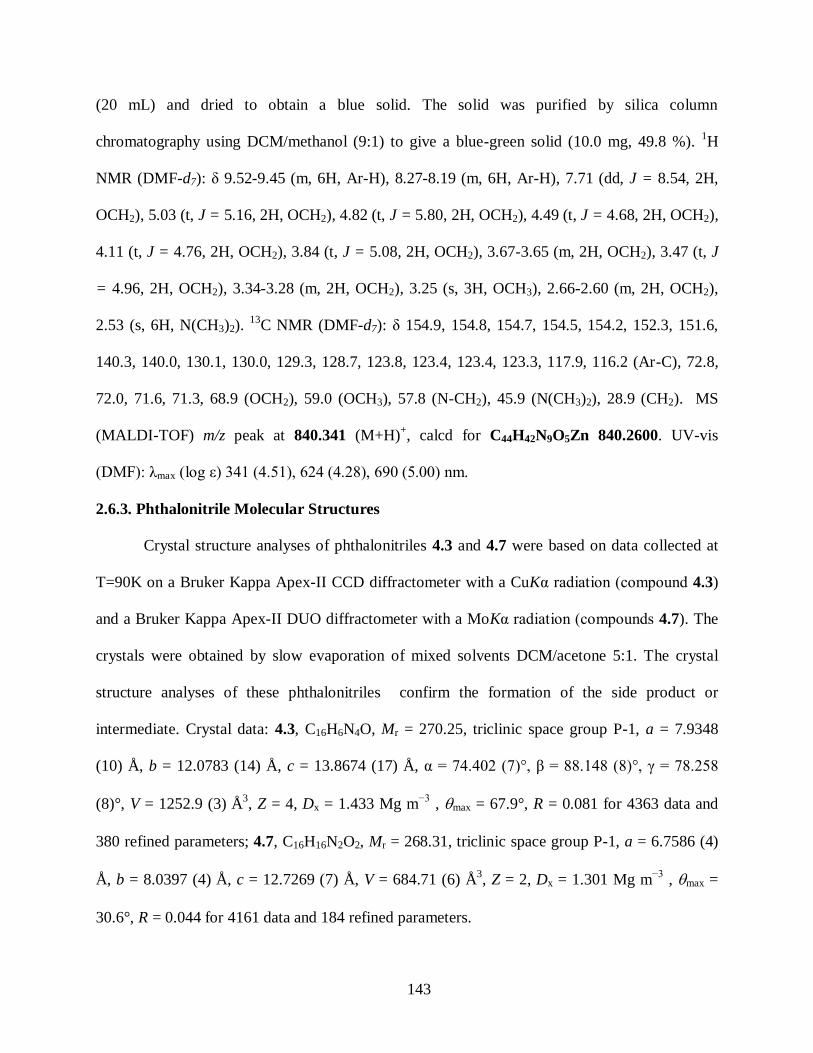
143
(20 mL) and dried to obtain a blue solid. The solid was purified by silica column
chromatography using DCM/methanol (9:1) to give a blue-green solid (10.0 mg, 49.8 %). 1H
NMR (DMF-d7): δ 9.52-9.45 (m, 6H, Ar-H), 8.27-8.19 (m, 6H, Ar-H), 7.71 (dd, J = 8.54, 2H,
OCH2), 5.03 (t, J = 5.16, 2H, OCH2), 4.82 (t, J = 5.80, 2H, OCH2), 4.49 (t, J = 4.68, 2H, OCH2),
4.11 (t, J = 4.76, 2H, OCH2), 3.84 (t, J = 5.08, 2H, OCH2), 3.67-3.65 (m, 2H, OCH2), 3.47 (t, J
= 4.96, 2H, OCH2), 3.34-3.28 (m, 2H, OCH2), 3.25 (s, 3H, OCH3), 2.66-2.60 (m, 2H, OCH2),
2.53 (s, 6H, N(CH3)2). 13
C NMR (DMF-d7): δ 154.9, 154.8, 154.7, 154.5, 154.2, 152.3, 151.6,
140.3, 140.0, 130.1, 130.0, 129.3, 128.7, 123.8, 123.4, 123.4, 123.3, 117.9, 116.2 (Ar-C), 72.8,
72.0, 71.6, 71.3, 68.9 (OCH2), 59.0 (OCH3), 57.8 (N-CH2), 45.9 (N(CH3)2), 28.9 (CH2). MS
(MALDI-TOF) m/z peak at 840.341 (M+H)+, calcd for C44H42N9O5Zn 840.2600. UV-vis
(DMF): λmax (log ε) 341 (4.51), 624 (4.28), 690 (5.00) nm.
2.6.3. Phthalonitrile Molecular Structures
Crystal structure analyses of phthalonitriles 4.3 and 4.7 were based on data collected at
T=90K on a Bruker Kappa Apex-II CCD diffractometer with a CuKα radiation (compound 4.3)
and a Bruker Kappa Apex-II DUO diffractometer with a MoKα radiation (compounds 4.7). The
crystals were obtained by slow evaporation of mixed solvents DCM/acetone 5:1. The crystal
structure analyses of these phthalonitriles confirm the formation of the side product or
intermediate. Crystal data: 4.3, C16H6N4O, Mr = 270.25, triclinic space group P-1, a = 7.9348
(10) Å, b = 12.0783 (14) Å, c = 13.8674 (17) Å, α = 74.402 (7)°, β = 88.148 (8)°, γ = 78.258
(8)°, V = 1252.9 (3) Å3, Z = 4, Dx = 1.433 Mg m
−3 , max = 67.9°, R = 0.081 for 4363 data and
380 refined parameters; 4.7, C16H16N2O2, Mr = 268.31, triclinic space group P-1, a = 6.7586 (4)
Å, b = 8.0397 (4) Å, c = 12.7269 (7) Å, V = 684.71 (6) Å3, Z = 2, Dx = 1.301 Mg m
−3 , max =
30.6°, R = 0.044 for 4161 data and 184 refined parameters.

144
4.7. Spectroscopic Studies
All absorption spectra were measured on UV-VIS NIR Scanning Spectrometer UV-
3101PC SHIMADZU (Cell positioned) equipped with a CPS-260 lamp. Stock solutions (1000
µM, 1.0 mL) of all Pcs were prepared in DMF (HPLC grade) and the dilutions achieved by
spiking 20 – 80 µL of the corresponding stock solution into DMF to a 10.0 mL final volume.
Emission spectra were recorded on a Fluorolog®-HORIBA JOBINVYON (Model LFI-3751)
spectrofluorimeter. The optical densities of the solutions used for emission studies were kept
between 0.04 – 0.05 (AU) at the excitation wavelengths for all the ZnPcs. All the measurements
were recorded within 3 h of preparation at 25 °C, using a 10 mm path length spectrophotometric
cell. The fluorescence quantum yields (Фf) were determined using a secondary standard
method.42
Unsubstituted ZnPc (Фf = 0.17) was used as a reference and the values of fluorescence
determined in DMF solvent.43
4.8. References
1. Ben-Hur, E.; Chan, W-S. In The Porphyrin Handbook, Kadish, K. M.; Smith, K. M.;
Guilard, R. (Eds.), Academic Press: Boston 2003, 19, 1-35.
2. Leznoff, C. C.; Lever, A. B. P. Eds. In Phthalocyanines: Properties and Applications. VCH:
Weinheim. 1989-1996; 1-4.
3. Jori, G.; Coppellotti, O. Anti-Infective Agents in Medicinal Chemistry 2007, 6, 2, 119-131.
4. Huang, Z. Tech. Cancer Res. Treatment 2005, 4, 283-293.
5. Brown, S. B.; Brown, E. A.; Walker, I. Lancet. Oncol. 2004, 5, 497-508.
6. Pandey, R. K. J. Porph. Phthal. 2000, 4, 368-373.
7. Dougherty, T. J.; Gomer, C. J.; Henderson, B. W.; Jori, G.; Kessel, D.; Korbelik, M.; Moan,
J.; Peng, Q. J. Natl. Cancer Inst. 1998, 90, 889-905.
8. Kinsella, T. J.; Baron, E. D.; Colussi, V. C.; Cooper K. D.; Hoppel, C. L.; Ingalls, S. T.;
Kenney, M. E.; Li, X.; Oleinick, N. L. Stevens, S. R.; Remick, S. C. Front. Oncol. 2011, 1,
14, 1-6.
9. Sokolov, V. V.; Chissov, V. I.; Yakubovskya, R. I.; Aristarkhova, E. I.; Filonenko, E, V.;
Belous, T. A.; Vorozhtsov, G. N.; Zharkova, N. N.; Smirnov, V. V.; Zhitkova, M. B.

145
Proceedings of SPIE (Photochemistry: Photodynamic Therapy and Other
Modalities) 1996, 2625, 281-287.
10. Baron, E. D.; Malbasa, C. L.; Santo-Domingo, D.; Fu, P.; Miller, J. D.; Hanneman, K. K.;
Hsia, A, H.; Oleinick, N. L.; Colussi, V. C.; Cooper, K. D. Lasers Surg. Med. 2010, 42, 10,
728–735.
11. Arnida; Nishiyama, N.; Kanayama, N.; Jang, W-D.; Yamasaki, Y.; Kataoka, K. J.
Controlled Release 2006, 115, 2, 208-215.
12. Gijsens, A.; Derycke, A.; Missiaen, L.; de Vos, D.; Huwyler, J.; Eberle, A.; de Witte, P. Int.
J. Cancer 2002, 101, 78-85.
13. Suzuki, T.; Oishi, M.; Nagasaki, Y. J. Photopoyml. Sci. and Technol. 2009, 22 (4), 547-550.
14. Bai, M.; Lo, P-C.; Ye, J.; Wu, C.; Fong, W-P.; Ng Dennis, K. P. Org. & Biomol.
Chem. 2011, 9 (20), 7028-7032.
15. Li, H.; Fronczek, F. R.; Vicente, M. G. H. Tetra. Lett. 2011, 52, 6675-6678.
16. Durmus, M.; Ayhan, M. M.; Gürek, A. G.; Ahsen, V. Dyes and Pigments 2008, 77, 570-577.
17. Fang, J.; Sawa, T.; Akaike, T.; Greish, K.; Maeda, H. Int. J. Cancer. 2004, 109, 1-8.
18. Ichikawa, K.; Hikita, T.; Maeda, N.; Takeuchi, Y.; Namba, Y.; Oku, N. Biol. Pharm. Bull.
2004, 27, 443-444.
19. Krueger, T.; Altermatt, H. J.; Mettler, D.; Scholl, B.; Magnusson, L.; Ris, H. B. Lasers Surg.
Med. 2003, 32, 61-68.
20. Rovers, J. P.; Saarnak, A. E.; de Jode, M.; Sterenborg, H. J.; Terpstra, O. T.; Grahn, M. F.
Photochem. Photobiol. 2000, 71, 211-217.
21. Sharmam, W. M.; Van Lier, J. E. The Porphyrin Handbook (Kadish, K. M.; Smith, K. M.;
Guilard, R., Eds.), Academic Press: Boston, 2003, 15, 1-60.
22. Leznoff, C. C. Can. J. Chem. 2000, 78, 167-183.
23. Hall, T. W.; Greenberg, S.; McArthur, C. R.; Khouw, B.; Leznoff, C. C. J. Chem. 1982, 6,
653-658.
24. Leznoff, C. C.; Hall, T. W. Tetra. Lett. 1982, 23, 3023-3026.
25. Li, H.; Fronczek, F. R.; Vicente, M. G. H. J. Organomet. Chem. 2009, 694 (11), 1607-1611.
26. Oliver, S. W.; Smith, T. D. J.Chem. Soc., Perkin Trans. II 1987, (11), 1579-1582.
27. Leznoff, C. C.; Drew, D. M. Can J. Chem. 1996, 74, 307-318.
28. Kobayashi, N.; Kobayashi, Y; Osa, T. J. Am. Chem. Soc. 1993, 115, 10994-10995.
146
29. Tolbin, A. Y.; Ivanov, A. V.; Tomilova, L. G.; Sefirov, N. S. Mendeleev Commun. 2002, 3,
96-97.
30. Tolbin, A. Y.; Pushkarev, V. E.; Nikitin, G. F.; Tomilova, L. G. Tetra. Lett. 2009, 50, 4848-
4850.
31. Okano, K.; Okuyama, K.-I.; Fukuyama, T.; Tokuyama, H. Synlett. 2008, 1977-1980.
32. Sibrian-Vazquez, M.; Ortiz, J.; Nesterova, I. V.; Fernández-Lázaro, F.; Sastre-Santos, A.;
Soper, S. A.; Vicente, M. G. H. Bioconj. Chem. 2007; 18: 410-420.
33. Ongarora BG, Hu X, Li H, Fronczek FR, Vicente MGH. Med. Chem. Commun. 2012, 3,
179-194.
34. Li, Y.; Pritchett, T. M.; Huang, J.; Ke, M.; Shao, P.; Sun, W. J. Phys. Chem. A. 2008, 112
(31), 7200-7207.
35. Yoshiyama, H.; Shibata, N.; Sato, T.; Nakamura, S.; Toru, T. Organic & Biomolecular
Chemistry 2008, 6 (24), 4498-4501.
36. Ongarora, B. G.; Fontenot, K. R.; Hu, X.; Sehgal, I.; Satyanarayana-Jois, S. D.; Vicente, M.
G. H. J. Med. Chem. 2012, 55, 3725-3738.
37. Hofman, J.-W.; van Zeeland, F.; Turker, S.; Talsma, H.; Lambrechts, S. A. G.; Sakharov, D.
V.; Hennink, W. E.; van Nostrum, C. F. J. Med. Chem. 2007, 50, 1485-1494.
38. Reddi, E. J. Photochem. and Photobiol. B: Bio. 1997, 37, 3, 189-195.
39. Ongarora, B. G.; Hu, X.; Verberne-Sutton, D.; Garno, J. C.; Vicente, M. G. J. Theranostics
2012, 2 (9), 850-870.
40. Chandrika, P. M.; Yakaiah, T. Gayatri, G.; Kumar, K. P.; Narsaiah, B.; Murthy, U. S. N.;
Rao, A. R. R. Eur. J.Med. Chem. 2010, 45, 78–84.
41. Merkas, S.; Litvic, M.; Cepanec, I.; Vinkovic, V. Molecules 2005, 10, 1429-1437
42. Brykina, G. D.; Uvarova, M. I.; Koval, Y. N.; Shpigun, O. A. J. Anal. Chem. 2001, 56, 940-
944.
43. Zorlu, Y.; Dumoulin, F.; Durmus, M.; Ahsen, V. Tetra. 2010, 66, 3248-3258.

147
CHAPTER 5
SYNTHESES AND BIOLOGICAL EVALUATION OF PEGYLATED AND CATIONIC
ZINC(II)-PHTHALOCYANINES AND MONOCLONAL ANTI-CARCINOEMBRYONIC
ANTIGEN CONJUGATES FOR IMAGING AND TREATMENT OF CANCER
5.1. Background
Pcs are promising second-generation photosensitizers with intense absorptions at
wavelengths (λmax) > 670 nm. They also have capacity to penetrate cellular membranes and can
produce ROS upon light activation. Some Pcs, such as Photosense, and a Si(IV)Pc, Pc4, have
been evaluated in clinical trials for PDT.1-3
These Pcs and other potential Pc-based
photosensitizers have tangential water-solubilizing substituents and/or axial ligands that can
minimize their aggregation or increase solubility the Pcs in aqueous media. The enhancing of
these features results in improved photodynamic activity of the photosensitizers. Polyethylene
glycol (PEG) groups have been investigated either as delivery vehicles,4-6
or as covalently
attached substituents7-9
for enhanced delivery to target tissues. Their covalent attachment to
photosensitizers is known to enhance water-solubility, serum life and tumor accumulation of
photosensitizers, but reduces their uptake by the reticuloendothelial system.10-15
Cationic photosensitizers are attractive for PDT applications16-23
and the
photoinactivation of virus and bacteria,24-26
due to their stronger interaction with the negatively
charged cell membranes. They also target biomolecules (e.g. DNA and RNA) within the cell
nucleus, which may result in effective photodamage and overall enhanced photodynamic
efficacy. In Chapter 2, di-cationic α-substituted ZnPcs were synthesized and found to be the most
phototoxic within a series of Pcs containing positively-charged trimethylaminophenoxy groups,
Part of this chapter was published in Journal of Theranostics: Ongarora, B. G.; Hu, X.;
Verberne-Sutton, D.; Garno, J. C.; Vicente, M. G. J. Theranostics 2012, 2 (9), 850-870.27
Reprinted with permission from IVY Spring.

148
in addition to being the most promising photosensitizers for PDT. In this Chapter, the syntheses
of a new series of di-cationic Pcs containing a PEG group or a diglycolic spacer between the
ZnPc and the positively charged quaternary ammonium groups is described. The synthesis of
pegylated ZnPcs, which were conjugated with monoclonal antiCEA for application in the
diagnosis of cancer is also described.
5.2. Results and Discussion
5.2.1. Syntheses of Cationic ZnPcs
The synthetic strategy to di-cationic ZnPcs 5.4, 5.6, 5.9, 5.11, 5.15, 5.17, 5.20, 5.22, 5.27
and 5.32 is shown in Schemes 5.1 – 5.4, starting from 3- or 4-nitrophthalonitrile (5.23 and 5.28).
The ZnPcs 5.1, 5.2, 5.12 and 5.13 were prepared according to procedures prescribed in Chapters
2 and 3. The nitrophthalonitriles reacted with p-N-Boc-aminophenol in DMF at 80 ºC under
basic conditions to give the corresponding p-(N-Boc-aminophenoxy)phthalonitriles. The
phthalonitrile was then heated at 140 ºC in DMAE and in the presence of zinc(II) acetate, 3
equiv. 4-tert-butylphthalonitrile and a catalytic amount of DBN, giving the Boc-protected α- or
β-substituted A3B-type ZnPcs in 15-20% yields. Deprotection of the Boc groups was achieved
using TFA. Reaction with diglycolic anhydride gave the α- and β- substituted ZnPcs 5.1 and
5.12 respectively, which were conjugated with commercially available tert-butyl-12-amino-
4,7,10-trioxadodecanoate, using HOBt, EDCI and TEA in DMF to produce pegylated ZnPcs 5.2
and 5.13 upon deprotection usning TFA.28
Reaction of ZnPcs 5.1 and 5.2 with 1,4-bis(N-Boc)-
triazaheptane using similar coupling reagents, followed by acidic Boc-deprotection gave ZnPcs
5.5 and 5.3, respectively, in 69-73% yields. Trimethylation of the amino groups was achieved
using excess methyl iodide and DIPA in DMF as described in Chapter 2, giving the respective
di-cationic ZnPcs 5.6 and 5.4 in 53-68% yields. Reaction of 5.1 with di-tert-butyl ester protected
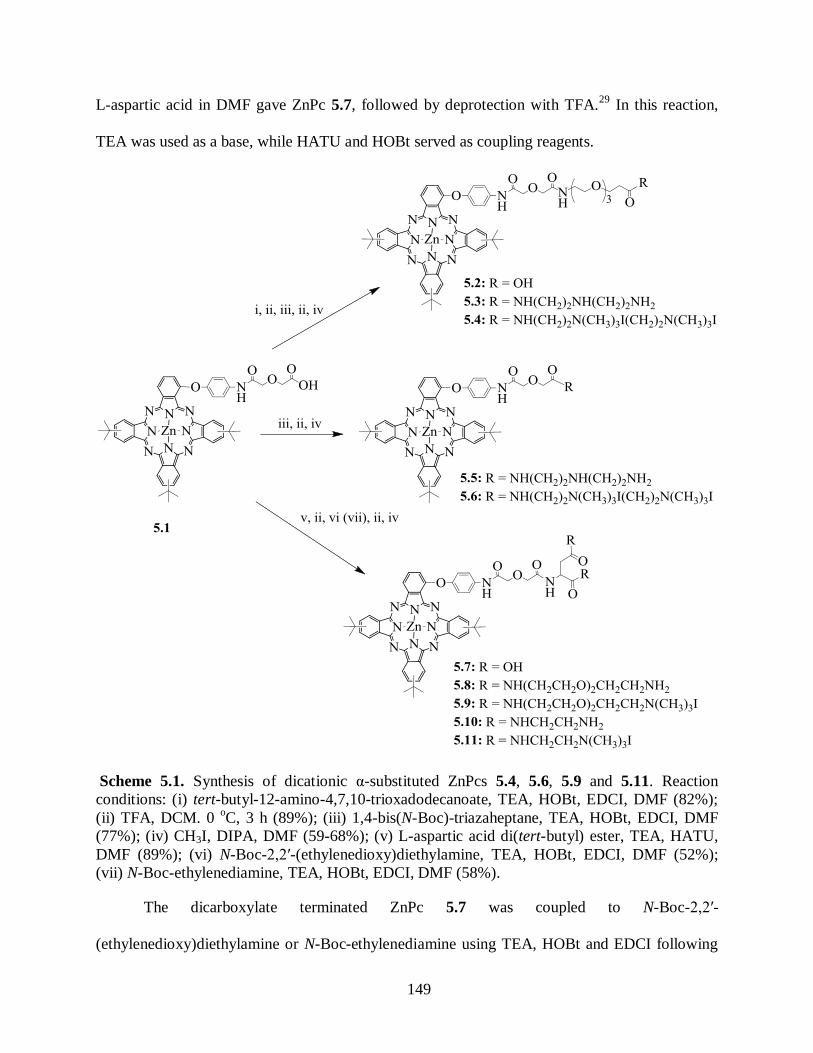
149
L-aspartic acid in DMF gave ZnPc 5.7, followed by deprotection with TFA.29
In this reaction,
TEA was used as a base, while HATU and HOBt served as coupling reagents.
Scheme 5.1. Synthesis of dicationic α-substituted ZnPcs 5.4, 5.6, 5.9 and 5.11. Reaction
conditions: (i) tert-butyl-12-amino-4,7,10-trioxadodecanoate, TEA, HOBt, EDCI, DMF (82%);
(ii) TFA, DCM. 0 oC, 3 h (89%); (iii) 1,4-bis(N-Boc)-triazaheptane, TEA, HOBt, EDCI, DMF
(77%); (iv) CH3I, DIPA, DMF (59-68%); (v) L-aspartic acid di(tert-butyl) ester, TEA, HATU,
DMF (89%); (vi) N-Boc-2,2′-(ethylenedioxy)diethylamine, TEA, HOBt, EDCI, DMF (52%);
(vii) N-Boc-ethylenediamine, TEA, HOBt, EDCI, DMF (58%).
The dicarboxylate terminated ZnPc 5.7 was coupled to N-Boc-2,2′-
(ethylenedioxy)diethylamine or N-Boc-ethylenediamine using TEA, HOBt and EDCI following

150
a similar protocol as that described for ZnPc 5.3 above, giving ZnPcs 5.8 and 5.10 respectively
after deprotection. The ZnPcs 5.8 and 5.10 were quaternized following the procedure described
above, to afford di-cationic ZnPcs 5.9 and 5.11 in 68 and 59% yields, respectively (Scheme 5.1).
Scheme 5.2. Synthesis of dicationic β-substituted ZnPcs 5.15, 5.17, 5.20 and 5.22. Reaction
conditions: (i) tert-butyl-12-amino-4,7,10-trioxadodecanoate, TEA, HOBt, EDCI, DMF (77%);
(ii) TFA, DCM. 0 oC, 3 h (83-91%); (iii) 1,4-bis(N-Boc)-triazaheptane, TEA, HOBt, EDCI,
DMF (80-89%); (iv) CH3I, DIPA, DMF (58-67%); (v) L-aspartic acid di(tert-butyl) ester, TEA,
HATU, DMF (89%); (vi) N-Boc-2,2′-(ethylenedioxy)diethylamine, TEA, HOBt, EDCI, DMF
(51%); (vii) N-Boc-ethylenediamine, TEA, HOBt, EDCI, DMF (62%).
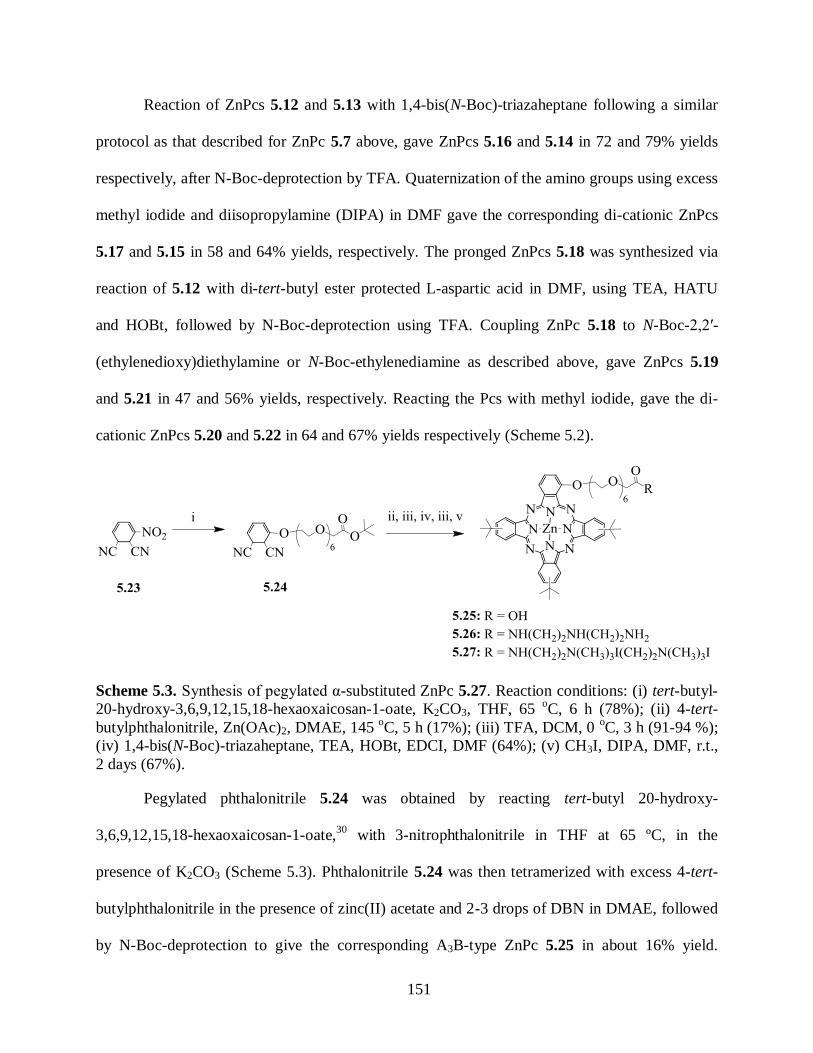
151
Reaction of ZnPcs 5.12 and 5.13 with 1,4-bis(N-Boc)-triazaheptane following a similar
protocol as that described for ZnPc 5.7 above, gave ZnPcs 5.16 and 5.14 in 72 and 79% yields
respectively, after N-Boc-deprotection by TFA. Quaternization of the amino groups using excess
methyl iodide and diisopropylamine (DIPA) in DMF gave the corresponding di-cationic ZnPcs
5.17 and 5.15 in 58 and 64% yields, respectively. The pronged ZnPcs 5.18 was synthesized via
reaction of 5.12 with di-tert-butyl ester protected L-aspartic acid in DMF, using TEA, HATU
and HOBt, followed by N-Boc-deprotection using TFA. Coupling ZnPc 5.18 to N-Boc-2,2′-
(ethylenedioxy)diethylamine or N-Boc-ethylenediamine as described above, gave ZnPcs 5.19
and 5.21 in 47 and 56% yields, respectively. Reacting the Pcs with methyl iodide, gave the di-
cationic ZnPcs 5.20 and 5.22 in 64 and 67% yields respectively (Scheme 5.2).
Scheme 5.3. Synthesis of pegylated α-substituted ZnPc 5.27. Reaction conditions: (i) tert-butyl-
20-hydroxy-3,6,9,12,15,18-hexaoxaicosan-1-oate, K2CO3, THF, 65 oC, 6 h (78%); (ii) 4-tert-
butylphthalonitrile, Zn(OAc)2, DMAE, 145 oC, 5 h (17%); (iii) TFA, DCM, 0
oC, 3 h (91-94 %);
(iv) 1,4-bis(N-Boc)-triazaheptane, TEA, HOBt, EDCI, DMF (64%); (v) CH3I, DIPA, DMF, r.t.,
2 days (67%).
Pegylated phthalonitrile 5.24 was obtained by reacting tert-butyl 20-hydroxy-
3,6,9,12,15,18-hexaoxaicosan-1-oate,30
with 3-nitrophthalonitrile in THF at 65 ºC, in the
presence of K2CO3 (Scheme 5.3). Phthalonitrile 5.24 was then tetramerized with excess 4-tert-
butylphthalonitrile in the presence of zinc(II) acetate and 2-3 drops of DBN in DMAE, followed
by N-Boc-deprotection to give the corresponding A3B-type ZnPc 5.25 in about 16% yield.

152
Pegylated ZnPc 5.25 was conjugated with 1,4-bis(N-Boc)-triazaheptane using TEA, HOBt and
EDCI, followed by N-Boc-deprotection to give ZnPc 5.26 in 58% yields. Reaction of ZnPc 5.26
with methyl iodide using the procedure described above gave the corresponding di-cationic ZnPc
5.27 in 67% yield.
Using a similar methodology, phthalonitrile 5.29 was obtained by reacting tert-butyl 20-
hydroxy-3,6,9,12,15,18-hexaoxaicosan-1-oate with 4-nitrophthalonitrile in THF at 65 ºC, in the
presence of K2CO3 (Scheme 5.4). Phthalonitrile 5.29 was tetramerized as described for ZnPc
5.25 above to give the corresponding A3B-type ZnPc 5.30 in about 15% yield. Conjugation of
the pegylated ZnPc 5.30 with 1,4-bis(N-Boc)-triazaheptane using TEA, HOBt and EDCI,
followed by TFA cleavage of N-Boc gave ZnPc 5.31 in 61% yields. Reaction of ZnPc 5.31 with
methyl iodide as described above gave di-cationic ZnPc 5.32 in 63% yield.
Scheme 5.4. Synthesis of pegylated β-substituted ZnPc 5.32. Reaction conditions: (i) tert-butyl-
20-hydroxy-3,6,9,12,15,18-hexaoxaicosan-1-oate, K2CO3, THF, 65 oC, 6 h (78%); (ii) 4-tert-
butylphthalonitrile, Zn(OAc)2, DMAE, 145 oC, 5 h (16%); (iii) TFA, DCM, 0
oC, 3 h (93-94 %);
(iv) 1,4-bis(N-Boc)-triazaheptane, TEA, HOBt, EDCI, DMF (61%); (v) CH3I, DIPA, DMF, r.t.,
2 days (63%).
All the synthesized di-cationic ZnPcs 5.4, 5.6, 5.9, 5.11, 5.15, 5.17, 5.20, 5.22, 5.27
and 5.32 were soluble in polar organic solvents, such as DMF, THF and methanol. None of
the cationic Pcs was water soluble; they remained aggregated in water, even after sonication.

153
Nevertheless, upon dilution from concentrated Pc stocks in DMF or DMSO into PBS (final
DMF or DMSO concentration of 1%) at 10 µM concentrations, the Pcs remained in aqueous
solution. Cationic ZnPcs may undergo N-demethylation upon prolonged storage at room
temperature, as observed for this type of Pcs in Chapter 2. The spectroscopic properties of
the ZnPcs in DMF are summarized in Table 5.1 and shown in Figure 5.1.
i) ii)
Figure 5.1. (i) Absorption and (ii) fluorescence spectra for Pc 5.4 (red), 5.6 (black), 5.9
(grey), 5.11 (light green), 5.15 (green), 5.17 (brown), 5.20 (purple), 5.22 (orange), 5.27
(pink), 5.32 (blue) at 8.0 and 0.5-0.8 µM concentrations, respectively, in DMF.
For concentrations < 10 µM, the ZnPcs did not aggregate in DMF. They all exhibited
strong Q absorptions and emissions in the near-IR between 679 – 686 nm in the same
solvent, with small Stokes’ shifts between 2 – 4 nm, as has been observed for this type of
macrocycle.31-33
The all had a Soret absorption between 330 – 360 nm. A strong Q-band
between 677 – 683 nm and a vibrational band at around 620 nm, that strictly followed the
Lambert-Beer law was also observed in for each Pc. There was no colloidal solution
formations observed for the ZnPcs at 1000 µM in DMF. This is indicative that large

154
aggregates were not formed at this concentration for this ZnPcs.32
The expected fluorescence
quantum yields ca. 0.09 – 0.23 for ZnPcs in DMF were observed.31-33
Table 5.1. Spectroscopic Properties of Pcs in DMF at 25 °C.
ZnPc Absorption λmax
(nm)
Emissiona λmax
(nm)
Stokes’ Shift log ε (M-1
cm-1
) фFb
5.3 680 684 4 5.52 0.23
5.4 679 683 4 5.32 0.15
5.5 680 684 4 5.19 0.19
5.6 679 682 3 5.23 0.21
5.7 679 682 3 5.17 0.13
5.8 680 683 3 5.20 0.14
5.9 680 683 3 5.01 0.14
5.10 680 683 3 5.23 0.13
5.11 679 682 3 5.19 0.09
5.14 677 680 3 5.28 0.15
5.15 677 680 3 5.30 0.14
5.16 677 679 2 5.19 0.20
5.17 676 679 3 5.31 0.15
5.18 677 680 3 5.28 0.10
5.19 677 681 4 5.27 0.11
5.20 677 680 3 5.01 0.11
5.21 677 680 3 5.19 0.12
5.22 677 680 3 4.99 0.11
5.25 681 684 3 5.34 0.19
5.26 683 686 3 5.31 0.21
5.27 682 685 3 5.28 0.18
5.30 676 680 4 5.14 0.19
5.31 678 681 3 5.35 0.18
5.32 677 680 3 5.26 0.17 a Excitation at 640 nm.
b Calculated using ZnPc (Фf = 0.17) as the standard in DMF.
5.2.2. Biological Evaluation of Cationic ZnPcs
The time-dependent cellular uptake, cytotoxicity and intracellular localization of the
ZnPcs, were investigated in human carcinoma HEp2 cells. The Promega’s Cell Titer Blue was

155
used in the evaluation of cytotoxicity viability assay, as reported previously in literature,20,29,34
at
concentrations up to 400 µM for all the cationic ZnPcs. Low toxicity in the dark (IC50 > 180
µM), especially for the branched dicationic Pcs 5.9, 5.11, 5.20 and 5.22 was observed, which
exhibited remarkably low dark toxicity (IC50 > 400 µM). This could be due to their low uptake
into cells as seen in Figure 5.2. Cationic ZnPcs 5.6, 5.27 and 5.32 may not suitable candidates for
imaging due to their relatively high dark toxicity at higher concentrations, although ZnPc 5.27
may be used for PDT; it has higher dark- to photoxicity IC50 ratio. Due to its low dark toxicity
and higher phototoxicity, cationinc ZnPc 5.11 may find application as a PDT agent. These results
also indicate that Pcs 5.20 and 5.22 may be useful as bioimaging dyes due to the low
phototoxicity observed. Table 5.2 summarizes the IC50 results obtained for the cationic ZnPcs.
Figure 5.2. Dark toxicity of Pc 5.4 (red), 5.6 (black), 5.9 (grey), 5.11 (light green), 5.13 (purple),
5.15 (green), 5.17 (brown square), 5.20 (light-blue), 5.22 (orange), 5.27 (pink), 5.32 (blue) at 10
μM in HEp2 cells.
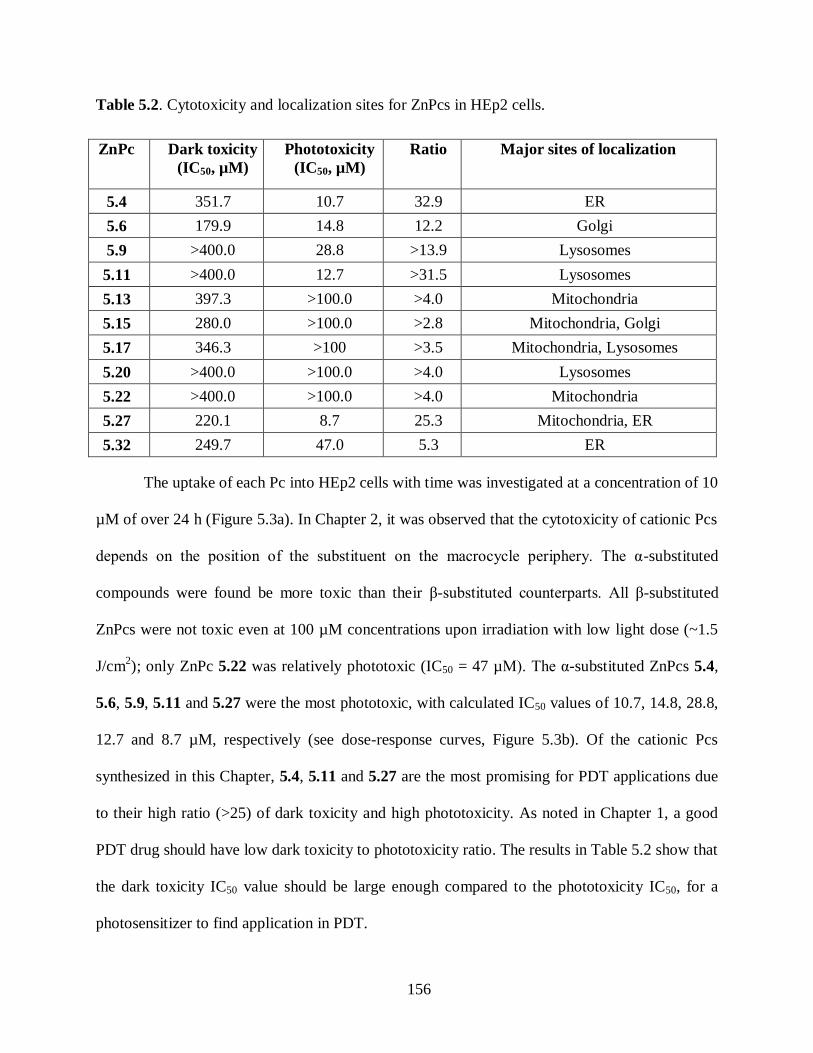
156
Table 5.2. Cytotoxicity and localization sites for ZnPcs in HEp2 cells.
ZnPc Dark toxicity
(IC50, µM)
Phototoxicity
(IC50, µM)
Ratio Major sites of localization
5.4 351.7 10.7 32.9 ER
5.6 179.9 14.8 12.2 Golgi
5.9 >400.0 28.8 >13.9 Lysosomes
5.11 >400.0 12.7 >31.5 Lysosomes
5.13 397.3 >100.0 >4.0 Mitochondria
5.15 280.0 >100.0 >2.8 Mitochondria, Golgi
5.17 346.3 >100 >3.5 Mitochondria, Lysosomes
5.20 >400.0 >100.0 >4.0 Lysosomes
5.22 >400.0 >100.0 >4.0 Mitochondria
5.27 220.1 8.7 25.3 Mitochondria, ER
5.32 249.7 47.0 5.3 ER
The uptake of each Pc into HEp2 cells with time was investigated at a concentration of 10
µM of over 24 h (Figure 5.3a). In Chapter 2, it was observed that the cytotoxicity of cationic Pcs
depends on the position of the substituent on the macrocycle periphery. The α-substituted
compounds were found be more toxic than their β-substituted counterparts. All β-substituted
ZnPcs were not toxic even at 100 µM concentrations upon irradiation with low light dose (~1.5
J/cm2); only ZnPc 5.22 was relatively phototoxic (IC50 = 47 µM). The α-substituted ZnPcs 5.4,
5.6, 5.9, 5.11 and 5.27 were the most phototoxic, with calculated IC50 values of 10.7, 14.8, 28.8,
12.7 and 8.7 µM, respectively (see dose-response curves, Figure 5.3b). Of the cationic Pcs
synthesized in this Chapter, 5.4, 5.11 and 5.27 are the most promising for PDT applications due
to their high ratio (>25) of dark toxicity and high phototoxicity. As noted in Chapter 1, a good
PDT drug should have low dark toxicity to phototoxicity ratio. The results in Table 5.2 show that
the dark toxicity IC50 value should be large enough compared to the phototoxicity IC50, for a
photosensitizer to find application in PDT.

157
a)
b)
Figure 5.3. (a) Time-dependent uptake at 10 μM, and (b) Phototoxicity of ZnPcs 5.4 (red), 5.6
(black), 5.9 (grey), 5.11 (light green), 5.13 (purple), 5.15 (green), 5.17 (brown), 5.20 (light blue),
5.22 (orange), 5.27 (pink), 5.32 (blue) in HEp2 cells.
It was remarkable to note that both of the most phototoxic ZnPcs (5.4 and 5.27) had a
PEG group. The two cationic charges were only separated by an ethylene group and the two
ZnPcs localized in the cell ER. It is reported in literature that pegylation of Pc macrocycles
158
favors intracellular localization in the ER,28
whereas the positive charges may favor their
localization at the plasma membrane, or subcellularly within mitochondria and lysosomes.34-37
The β-substituted ZcPcs 5.15 and 5.17 accumulated within HEp2 cells to a great extent
than the other Pcs. The fastest of all ZnPcs in terms of cellular uptake was Pc 5.17, although the
uptake slowed down to a plateau approximately 8 h post exposure. The PEG group in ZnPc 5.15
probably resulted in continued accumulation within cells up to 24 h post exposure. The di-
cationic Pcs (5.15 and 5.17) containing the two cationic charges in close proximity on the same
chain, exhibited increased uptake unlike the neutral Pc-PEG 5.13, or the cationic Pcs 5.9, 5.11,
5.20 and 5.22, which were branched.
With exception of 5.20, which was found mainly in the lysosomes (Table 5.2), all the
other cationic ZnPcs localized within multiple subcellular sites. Other ZnPcs (5.4, 5.6, 5.11 and
5.32) were localized at the plasma membrane. The most phototoxic compounds (5.4, 5.11 and
5.27) were all localized within the ER. The ER is an important organelle that is responsible for
the regulation of protein synthesis and stress responses, which in turn induces cell apoptosis in
PDT.38,39
The results in this Chapter show that the subcellular localization of the ZnPcs, and not
the extent of cellular uptake, or their charge distribution about the macrocycle determines their
photodynamic activity. This could be due to their different interactions with the subcellular units.
The fluorescence microscopy experiments were carried out, 6 h post exposure of HEp2 cells
(Figures 5.4 – 5.8). The following organelle specific fluorescent tracers for co-localization
experiments were used: ER Tracker Blue/White (ER), MitoTracker Green (mitochondria),
BODIPY Ceramide (Golgi) and LysoSensor Green (lysosomes). The results indicate that the α-
substituted ZnPcs were more toxic than the corresponding β-substituted ZnPcs in the dark. Upon
exposure of the ZnPcs to approximately 1.5 J/cm2 light dose, similar observation was made.
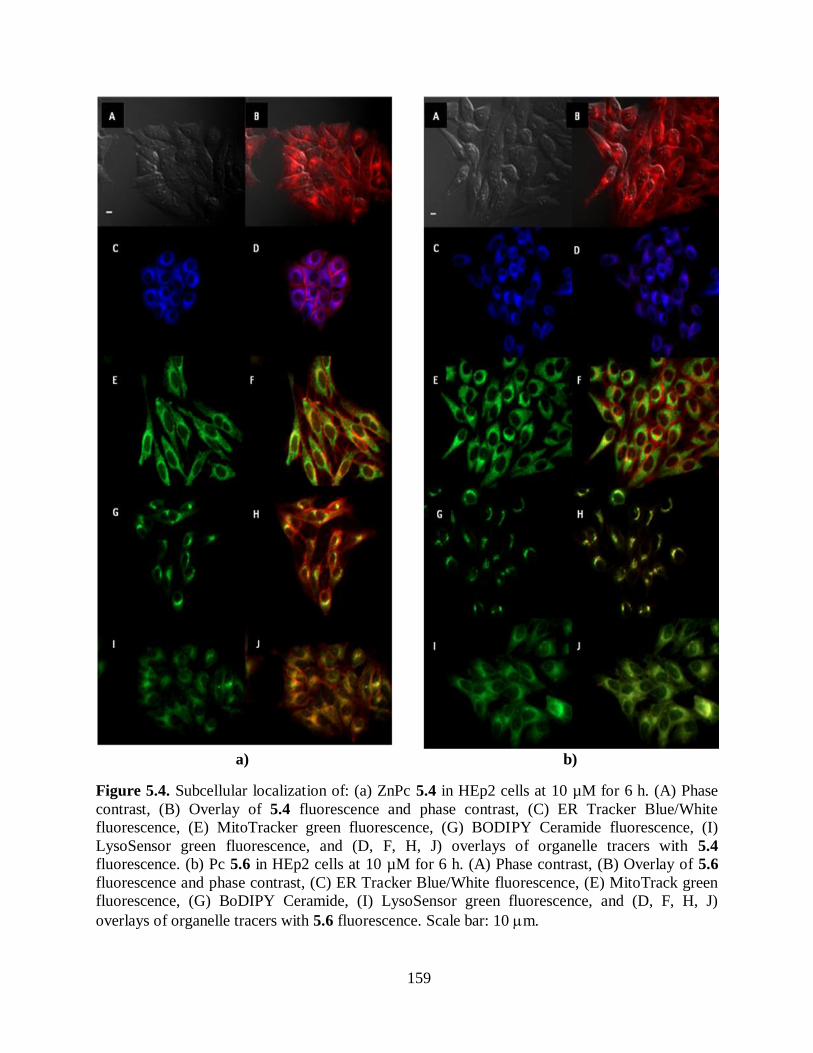
159
a) b)
Figure 5.4. Subcellular localization of: (a) ZnPc 5.4 in HEp2 cells at 10 µM for 6 h. (A) Phase
contrast, (B) Overlay of 5.4 fluorescence and phase contrast, (C) ER Tracker Blue/White
fluorescence, (E) MitoTracker green fluorescence, (G) BODIPY Ceramide fluorescence, (I)
LysoSensor green fluorescence, and (D, F, H, J) overlays of organelle tracers with 5.4
fluorescence. (b) Pc 5.6 in HEp2 cells at 10 µM for 6 h. (A) Phase contrast, (B) Overlay of 5.6
fluorescence and phase contrast, (C) ER Tracker Blue/White fluorescence, (E) MitoTrack green
fluorescence, (G) BoDIPY Ceramide, (I) LysoSensor green fluorescence, and (D, F, H, J)
overlays of organelle tracers with 5.6 fluorescence. Scale bar: 10 m.

160
a) b)
Figure 5.5. Subcellular localization of: (a) Pc 5.9 in HEp2 cells at 10 µM for 6 h. (A) Phase
contrast, (B) Overlay of 5.9 fluorescence and phase contrast, (C) ER Tracker Blue/White
fluorescence, (E) MitoTrack green fluorescence, (G) BoDIPY Ceramide, (I) LysoSensor green
fluorescence, and (D, F, H, J) overlays of organelle tracers with 5.9 fluorescence. (b) ZnPc 5.11
in HEp2 cells at 10 µM for 6 h. (A) Phase contrast, (B) Overlay of 5.11 fluorescence and phase
contrast, (C) ER Tracker Blue/White fluorescence, (E) MitoTracker green fluorescence, (G)
BODIPY Ceramide, fluorescence (I) LysoSensor green fluorescence, and (D, F, H, J) overlays of
organelle tracers with 5.11 fluorescence. Scale bar: 10 m.

161
a) b)
Figure 5.6. Subcellular localization of: (a) Pc 5.15 in HEp2 cells at 10 µM for 6 h. (A) Phase
contrast, (B) Overlay of 5.15 fluorescence and phase contrast, (C) ER Tracker Blue/White
fluorescence, (E) MitoTrack green fluorescence, (G) BoDIPY Ceramide, (I) LysoSensor green
fluorescence, and (D, F, H, J) overlays of organelle tracers with 5.15 fluorescence. (b) Pc 5.17 in
HEp2 cells at 10 µM for 6 h. (A) Phase contrast, (B) Overlay of 5.17 fluorescence and phase
contrast, (C) ER Tracker Blue/White fluorescence, (E) MitoTrack green fluorescence, (G)
BoDIPY Ceramide, (I) LysoSensor green fluorescence, and (D, F, H, J) overlays of organelle
tracers with 5.17 fluorescence. Scale bar: 10 m.

162
a) b)
Figure 5.7. Subcellular localization of: (a) Pc 5.20 in HEp2 cells at 10 µM for 6 h. (A) Phase
contrast, (B) Overlay of 5.20 fluorescence and phase contrast, (C) ER Tracker Blue/White
fluorescence, (E) MitoTrack green fluorescence, (G) BoDIPY Ceramide, (I) LysoSensor green
fluorescence, and (D, F, H, J) overlays of organelle tracers with 5.20 fluorescence. (b) Pc 5.22 in
HEp2 cells at 10 µM for 6 h. (A) Phase contrast, (B) Overlay of 5.22 fluorescence and phase
contrast, (C) ER Tracker Blue/White fluorescence, (E) MitoTrack green fluorescence, (G)
BoDIPY Ceramide, (I) LysoSensor green fluorescence, and (D, F, H, J) overlays of organelle
tracers with 5.22 fluorescence. Scale bar: 10 m.

163
a) b)
Figure 5.8. Subcellular localization of: (a) ZnPc 5.27 in HEp2 cells at 10 µM for 6 h. (A) Phase
contrast, (B) Overlay of 5.27 fluorescence and phase contrast, (C) ER Tracker Blue/White
fluorescence, (E) MitoTracker green fluorescence, (G) BODIPY Ceramide fluorescence, (I)
LysoSensor green fluorescence, and (D, F, H, J) overlays of organelle tracers with 5.27
fluorescence. (b) Pc 5.32 in HEp2 cells at 10 µM for 6 h. (A) Phase contrast, (B) Overlay of 5.32
fluorescence and phase contrast, (C) ER Tracker Blue/White fluorescence, (E) MitoTrack green
fluorescence, (G) BoDIPY Ceramide, (I) LysoSensor green fluorescence, and (D, F, H, J)
overlays of organelle tracers with 5.32 fluorescence. Scale bar: 10 m.

164
5.2.3. Pc-Monoclonal Anti-Carcinoembryonic Antigen (AntiCEA) Conjugates
Monoclonal antibodies (mAbs) are antibodies that are made by identical immune cells
that are all clones of a unique parent cell, and they have affinity for a specific substance.40
The
mAbs are artificially produced via a technique of cell fusion followed by selection; body cells
are obtained from a single cell in a culture medium. Monoclonal antibody therapy is the use of
mAbs to target specific cells or proteins.41,42
Several antibodies have been approved for the
treatment of cancer, either as unconjugated antibodies or for delivery of drugs to cancer cells.
Some of the monoclonal antibodies that have been approved by FDA for the treatment of various
types of cancer are show in Table 5.3.40
Table 5.3. Some of the antibodies approved by DFA for cancer treatment.
Monoclonal antibody Target Cancer
Alemtuzumab (Campath) Chronic lymphocytic leukemia
Bevacizumab (Avastin) Breast cancer, colon cancer, lung cancer
Cetuximab (Erbitux) Colon cancer, head and neck cancers
Gemtuzumab (Mylotarg) Acute myelogenous leukemia
Ibritumomab (Zevalin) Non-Hodgkin's lymphoma
Panitumumab (Vectibix) Colon cancer
Rituximab (Rituxan) Non-Hodgkin's lymphoma
Tositumomab (Bexxar) Non-Hodgkin's lymphoma
Many factors dictate the success of targeted therapeutics: affinity and specificity of the
ligand used, the density of the target molecule on the cell surface, localization of the drug within
the target tissue, and the rate at which the drug molecules enter the appropriate cell
compartments.43
In Chapter 2, two small peptides with sequences LARLLT44
and
YHWYGYTPQNVI45
are among the EGFR-targeting biomolecules, which have recently been
reported as potential ligands for selective delivery of cytotoxic drugs to the target sites. The

165
molecules are particularly attractive due to their availability, low immunogenicity, ease of
conjugation to various molecules, and reported superior EGFR-targeting ability. Monoclonal
antibodies have also been used in targeted therapeutics.46-49
Despite their large molecular weight
and relatively higher cost, monoclonal antibodies have attracted interest in targeted therapeutics
due to their unique specificity.
In this section, several ZnPcs were synthesized and conjugated to human
carcinoembryonic antigen (antiCEA). The conjugates were then investigated in mice bearing
colon tumors derived from HT-29 cell lines, as imaging agents. The CEA is most abundantly
expressed extracellular marker associated with human colorectal cancer or the precursor aberrant
crypti foci, and is used as serum marker of CRC in clinical medicine.50,51
The CEA antigen is
also non-internalizing and as a result was not expected to cause phototoxicity. The CEA is a
large protein and therefore, cannot be internalized – it has a molecular mass of about 150 kD.
The non-internalization of the CEA is important since the conjugate will be bound to the tumor
surface, resulting in enhanced fluorescence. The ZnPc derivatives conjugated to monoclonal
antiCEA investigated in here, are pegylated and/or cationic; this enhanced their water-solubility.
Solubility in water is a key factor since all the conjugation reactions were carried out at pH 7.4 in
PBS solution. Positively charged photosensitizers may also interact with negatively charged cell
membranes and the targeted surfaces.16-23
In Chapter 2, ZnPcs with tert-butyl groups, which minimized aggregation, were
synthesized. These groups introduced hydrophobicity to the macrocycles and thus reduced their
solubility in aqueous media. The removal of the tert-butyl groups from the Pc macrocycles
synthesized in this section resulted in enhanced solubility in aqueous medium. The synthesized
ZnPcs were conjugated to the CEA via carboxylic groups. The CEA has a several amino terminal
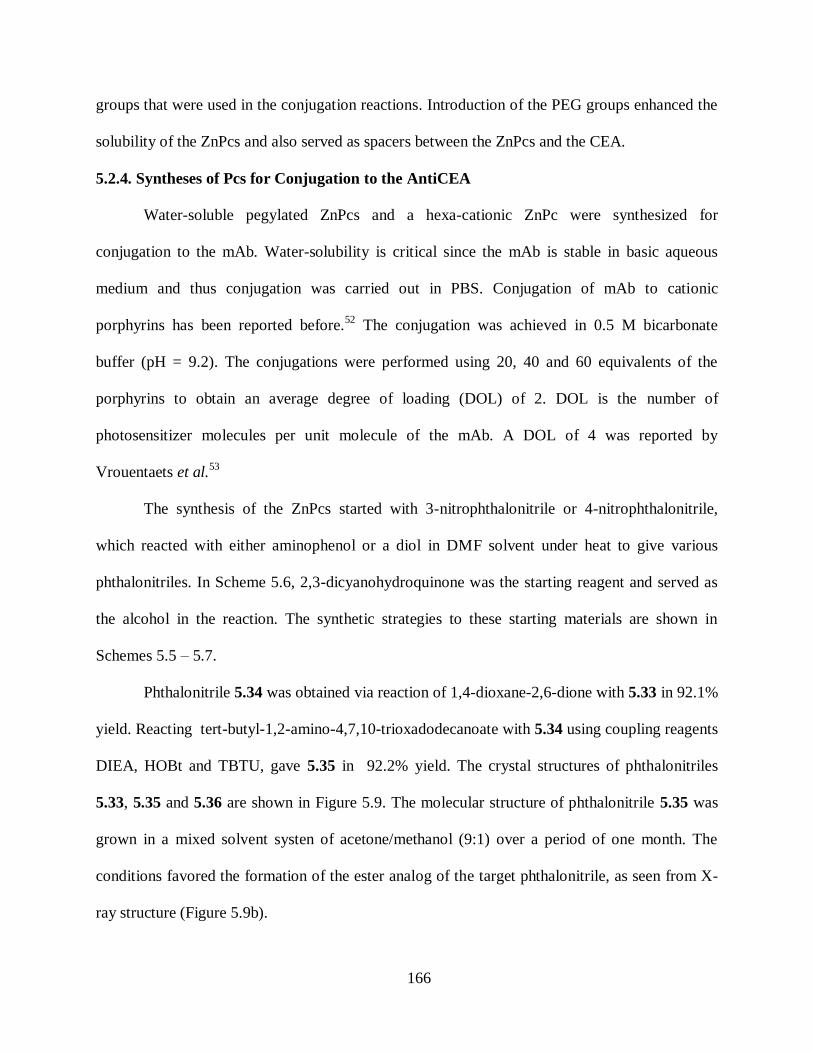
166
groups that were used in the conjugation reactions. Introduction of the PEG groups enhanced the
solubility of the ZnPcs and also served as spacers between the ZnPcs and the CEA.
5.2.4. Syntheses of Pcs for Conjugation to the AntiCEA
Water-soluble pegylated ZnPcs and a hexa-cationic ZnPc were synthesized for
conjugation to the mAb. Water-solubility is critical since the mAb is stable in basic aqueous
medium and thus conjugation was carried out in PBS. Conjugation of mAb to cationic
porphyrins has been reported before.52
The conjugation was achieved in 0.5 M bicarbonate
buffer (pH = 9.2). The conjugations were performed using 20, 40 and 60 equivalents of the
porphyrins to obtain an average degree of loading (DOL) of 2. DOL is the number of
photosensitizer molecules per unit molecule of the mAb. A DOL of 4 was reported by
Vrouentaets et al.53
The synthesis of the ZnPcs started with 3-nitrophthalonitrile or 4-nitrophthalonitrile,
which reacted with either aminophenol or a diol in DMF solvent under heat to give various
phthalonitriles. In Scheme 5.6, 2,3-dicyanohydroquinone was the starting reagent and served as
the alcohol in the reaction. The synthetic strategies to these starting materials are shown in
Schemes 5.5 – 5.7.
Phthalonitrile 5.34 was obtained via reaction of 1,4-dioxane-2,6-dione with 5.33 in 92.1%
yield. Reacting tert-butyl-1,2-amino-4,7,10-trioxadodecanoate with 5.34 using coupling reagents
DIEA, HOBt and TBTU, gave 5.35 in 92.2% yield. The crystal structures of phthalonitriles
5.33, 5.35 and 5.36 are shown in Figure 5.9. The molecular structure of phthalonitrile 5.35 was
grown in a mixed solvent systen of acetone/methanol (9:1) over a period of one month. The
conditions favored the formation of the ester analog of the target phthalonitrile, as seen from X-
ray structure (Figure 5.9b).
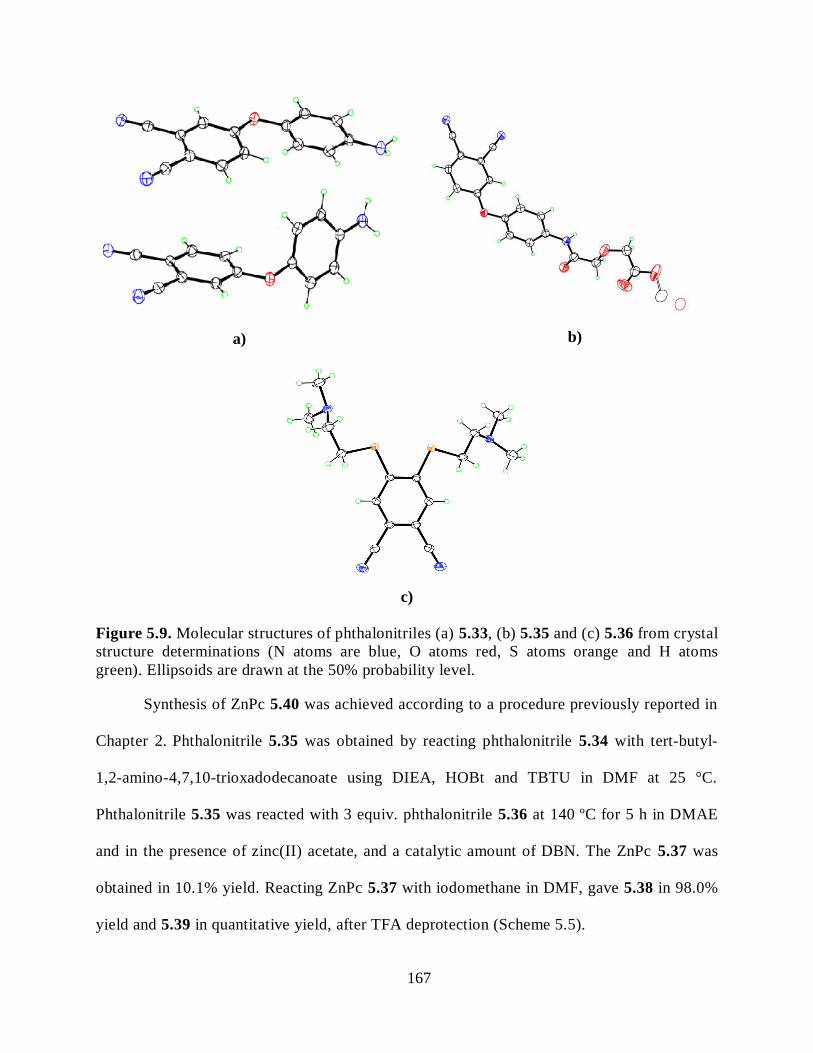
167
a)
b)
c)
Figure 5.9. Molecular structures of phthalonitriles (a) 5.33, (b) 5.35 and (c) 5.36 from crystal
structure determinations (N atoms are blue, O atoms red, S atoms orange and H atoms
green). Ellipsoids are drawn at the 50% probability level.
Synthesis of ZnPc 5.40 was achieved according to a procedure previously reported in
Chapter 2. Phthalonitrile 5.35 was obtained by reacting phthalonitrile 5.34 with tert-butyl-
1,2-amino-4,7,10-trioxadodecanoate using DIEA, HOBt and TBTU in DMF at 25 °C.
Phthalonitrile 5.35 was reacted with 3 equiv. phthalonitrile 5.36 at 140 ºC for 5 h in DMAE
and in the presence of zinc(II) acetate, and a catalytic amount of DBN. The ZnPc 5.37 was
obtained in 10.1% yield. Reacting ZnPc 5.37 with iodomethane in DMF, gave 5.38 in 98.0%
yield and 5.39 in quantitative yield, after TFA deprotection (Scheme 5.5).

168
Scheme 5.5. Synthesis of Pc-antiCEA conjugate 5.40. Conditions: (i) 1, 4-dioxane-2, 6-dione,
DMF, r.t., (92.1%). (ii) tert-butyl-1,2-amino-4,7,10-trioxadodecanoate, DIEA, HOBt, TBTU,
DMF, 48 h, r.t., (92.2%). (iii) phthalonitrile 5.36, zinc acetate, DBN, DMAE, 5 h, (10.1%) (iv)
iodomethane, DMF, 2 days, r.t., (98%). (v) TFA, dichloromethane, 4 h, (quantitative). (vi)
DIEA, HOBt, TBTU, monoclonal antibody, DMSO/NaHCO3.
Mono-pegylated phthalonitrile 5.42 was synthesized according to the literature
procedure,9 and used in macrocyclization reaction with phthalonitrile to give mono-PEG-Pc 5.43
(Scheme 5.6). Phthalonitrile 5.42 was mixed with 30 equiv. phthalonitrile in DMAE solvent, and
heated at 140 ºC for 5 h in the presence of zinc(II) acetate and a catalytic amount of DBN.
Purification of the crude product via column chromatography gave ZnPc 5.43 in 9.8% yield.
Reacting ZnPc 5.43 with tert-butyl 3-(2-(2-(2-iodoethoxy)ethoxy)ethoxy)propanoate gave ZnPc
5.44 in 74.9% overall yield, after TFA deprotection.

169
Scheme 5.6. Synthesis of Pc-antiCEA conjugate 5.45. Conditions: (i) 1-iodo-2-(2-(2-
methoxyethoxy)-ethoxy)ethane, K2CO3, DMF, 65 °C, 24 h (42%). (ii) phthalonitrile, zinc
acetate, DBN, DMAE, 5 h (9.8%). (iii) tert-butyl 3-(2-(2-(2-iodoethoxy)ethoxy)ethoxy)-
propanoate, K2CO3, DMF, 65 °C, 24 h (76.7%). (iv) TFA, dichloromethane, 4 h, (97.7%). (v)
DIEA, HOBt, TBTU, monoclonal antibody, DMSO/NaHCO3.
5.2.5. Conjugation of Pcs to AntiCEA
Monopegylated ZnPc 5.46 was prepared according to the procedure described earlier in
Chapter 3. Coupling ZnPcs 5.39, 5.44 and 5.46 with monoclonal antibody, antiCEA, using
DIEA, HOBt and TBTU, in DMSO/NaHCO3 gave Pc-conjugates 5.40, 5.45 and 5.47
respectively, which were purified using microspin columns. The mAb was reconstituted at 2
mg/mL in 0.1 M NaHCO3 solution. Then ZnPcs 5.39, 5.44 and 5.46 (1 mg each) were dissolved
in DMSO (50 µL) and DIPA (0.078 mg, 0.006 mmol) added. The mixture was stirred for 1 h,
after which HOBt (0.34 mg, 0.002 mmol) and TBTU (0.59 mg, 0.002 mmol) were added and the
reaction solutions stirred for 2 h. The reconstituted monoclonal antibody solution (500 µL) was
added into each activated Pc solution and the solutions were kept with frequent shaking at room
temperature for 1 hour. Then the solutions were kept at 4 C for 24 h, with occasional shaking.
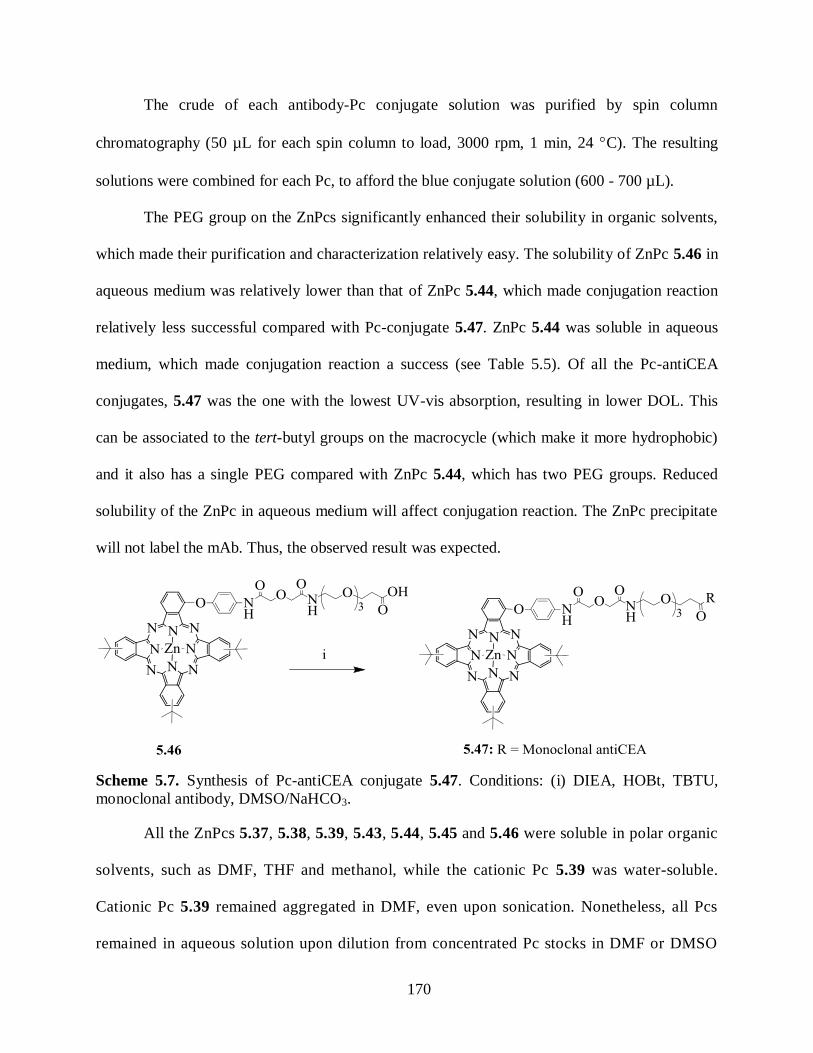
170
The crude of each antibody-Pc conjugate solution was purified by spin column
chromatography (50 µL for each spin column to load, 3000 rpm, 1 min, 24 C). The resulting
solutions were combined for each Pc, to afford the blue conjugate solution (600 - 700 µL).
The PEG group on the ZnPcs significantly enhanced their solubility in organic solvents,
which made their purification and characterization relatively easy. The solubility of ZnPc 5.46 in
aqueous medium was relatively lower than that of ZnPc 5.44, which made conjugation reaction
relatively less successful compared with Pc-conjugate 5.47. ZnPc 5.44 was soluble in aqueous
medium, which made conjugation reaction a success (see Table 5.5). Of all the Pc-antiCEA
conjugates, 5.47 was the one with the lowest UV-vis absorption, resulting in lower DOL. This
can be associated to the tert-butyl groups on the macrocycle (which make it more hydrophobic)
and it also has a single PEG compared with ZnPc 5.44, which has two PEG groups. Reduced
solubility of the ZnPc in aqueous medium will affect conjugation reaction. The ZnPc precipitate
will not label the mAb. Thus, the observed result was expected.
Scheme 5.7. Synthesis of Pc-antiCEA conjugate 5.47. Conditions: (i) DIEA, HOBt, TBTU,
monoclonal antibody, DMSO/NaHCO3.
All the ZnPcs 5.37, 5.38, 5.39, 5.43, 5.44, 5.45 and 5.46 were soluble in polar organic
solvents, such as DMF, THF and methanol, while the cationic Pc 5.39 was water-soluble.
Cationic Pc 5.39 remained aggregated in DMF, even upon sonication. Nonetheless, all Pcs
remained in aqueous solution upon dilution from concentrated Pc stocks in DMF or DMSO

171
solvents into 0.1 M NaHCO3 (final DMF or DMSO concentration of 1%) for 10 µM
concentrations.
The spectroscopic properties of the ZnPcs 5.38, 5.39, 5.43, 5.44 and 5.46 in DMF are
summarized in Table 5.4. All ZnPcs showed strong Q absorptions and emissions in the near-IR
between 679 – 686 nm in DMF, with small Stokes’ shifts between 2 – 4 nm, as is characteristic
of this type of macrocycle.31-33
All the ZnPcs show a Soret absorption between 330 – 360 nm, a
strong Q band between 678 – 696 nm and a vibrational band at around 620 nm, that strictly
follow the Lambert-Beer law. The ZnPcs had fluorescence quantum yields in the range 0.10 –
0.29 in DMF, as expected for this type of compounds.32,33
Table 5.4. Spectroscopic Properties of Pcs in DMF at 25 °C.
ZnPc Absorption
(nm)
Emissiona
(nm)
Stokes’ Shift log ε (M-1
cm-
1)
1
фFb
5.38 696 699 3 5.04 0.29
5.39 696 698 2 4.94 0.21
5.43 694 696 2 5.17 0.14
5.44 688 691 3 5.18 0.22
5.46 678 682 4 5.35 0.10
a Excitation at 640 nm.
b Calculated using ZnPc (Фf = 0.17) as the standard in DMF.
Table 5.5. Estimated payloads (ZnPc per unit antiCEA) for various conjugates.
ZnPc CCEA=[A280nm - (0.5 ×
AZnPc)]/εCEA
CZnPc = AZnPc/εZnPc CZnPc/ CCEA
5.40 2.560 × 10⁻⁷
1.918 × 10⁻⁶
7
5.45 2.970 × 10⁻⁷
2.816 × 10⁻⁶
9
5.47 1.454 × 10⁻⁶
2.199 × 10⁻⁶
2
The concentrations for the above conjugates were obtained using samples which had been
diluted five times. Therefore, the actual Pc concentrations are 3.8 × 10⁻⁵
, 5.6 × 10⁻⁵
and 4.2 × 10⁻⁵
M for Pc-antiCEA conjugates 5.40, 5.45 and 5.47 respectively. ZnPc 5.44 (5.0 × 10⁻⁵
M) was

172
used as the control. The ZnPc/CEA ratio was determined by the measurements of absorbance at
280 nm to estimate the concentration of antibody and absorbance at 353 nm, 337 nm and 338 nm
to estimate the concentration of Pc 5.39, 5.44 and 5.46 respectively. The molar antibody and
ZnPc concentrations were calculated by the formula CCEA=[A280nm - (0.5 × AZnPc)]/εCEA, CZnPc =
AZnPc/εZnPc according to the literature;47,52,54
with εCEA = 223,045 (M-1
cm-1
), εPc5.46 = 49,471 (M-
1cm
-1),
εPc5.39 = 40040 (M
-1cm
-1 and εPc5.44 = 48784 (M
-1cm
-1). The extinction coefficients of the
ZnPcs were determined by dissolving the non-conjugated ZnPcs in 0.1 M NaHCO3 containing
0.1% DMSO.
5.2.6. Preliminary Animal Studies
The ZnPc conjugate 5.45 with Pc concentrations of 5.6 × 10⁻⁵
M for Pc-antiCEA
conjugate, and ZnPc 5.44 (5.0 × 10⁻⁵
M) as a control, were used in the study. Both the conjugate
and the unconjugated ZnPc were both visible in the tumor at 1 h and diffused slightly by 6 h
(Figure 5.10 and 5.11 respectively). There was appreciable regional tissue retention of the Pc-
CEA conjugate 5.45 in the tumor at 24 h, while Pc alone showed dissipation. At 96 h post
injection, the dyes were not detectable, contrary to the observations made earlier in Chapter 3,
where Pc-EFGR-L1 conjugate 3.11 was used during in vivo studies. Of all the Pcs prepared, 5.45
was chosen for preliminary studies in mice due to the low DOL of ZnPc 5.47 and the apparently
lower fluorescence intensity of ZnPc 5.40.
After injection of Pc-antiCEA conjugate 5.45 and Pc 5.44 into a non-tumor bearing
mouse, both dyes were retained for a few hours, but diffused away within 24 hours (Figure 5.12).
This result suggests that the antiCEA in Pc-antiCEA conjugate 5.45 enhances the targeting
specificity after intratumoral injection. The result is in agreement with our previous observations
in Chapter 3, that peptide conjugate can enhance the targeting ability of photosensitizers.

173
Figure 5.10. Fluorescent images (exc 630 nm/em 700 nm) of nude mice bearing subcutaneous
tumor implants of HT-29 cancer cells taken at various times following intratumoral
administration of Pc-antiCEA conjugate 5.45.
Figure 5.11. Fluorescent images (exc 630 nm/em 700 nm) of nude mice bearing subcutaneous
tumor implants of HT-29 cancer cells taken at various times following intratumoral
administration of Pc 5.44 alone.

174
Figure 5.12. Fluorescent images (exc 630 nm/em 700 nm) of nude mice bearing no tumor
implants of cancer cells, taken at various times following intratumoral administration of Pc-
antiCEA conjugate 5.45 and Pc 5.44 in mice.
5.3. Conclusions
Ten dicationic ZnPcs were investigated in human carcinoma HEp2 cells for their
biological properties for possible in vivo applications. The ZnPcs were A3B-type, synthesized via
statistical condensation of two different phthalonitriles. The Pcs with the cationic charge non-
peripherally substituted on the ring were found to be more phototoxic (> 5-fold) than their
peripherally substituted counterparts. ZnPc 5.27 was more phototoxic (IC50 = 8.7 µM at 1.5
J/cm2) than 5.4 (IC50 = 10.7 µM), although their localization in the ER and favorable interaction
with important biological targets made them the most phototoxic among the series. In addition, a
PEG group on the macrocycle and/or the positive charges in close proximity are likely to boost
phototoxicity. Markedly, the β-substituted ZcPcs 5.15 and 5.17 accumulated the most within
HEp2 cells. It can be concluded that it is the position of the charge on the Pc macrocycle (α-
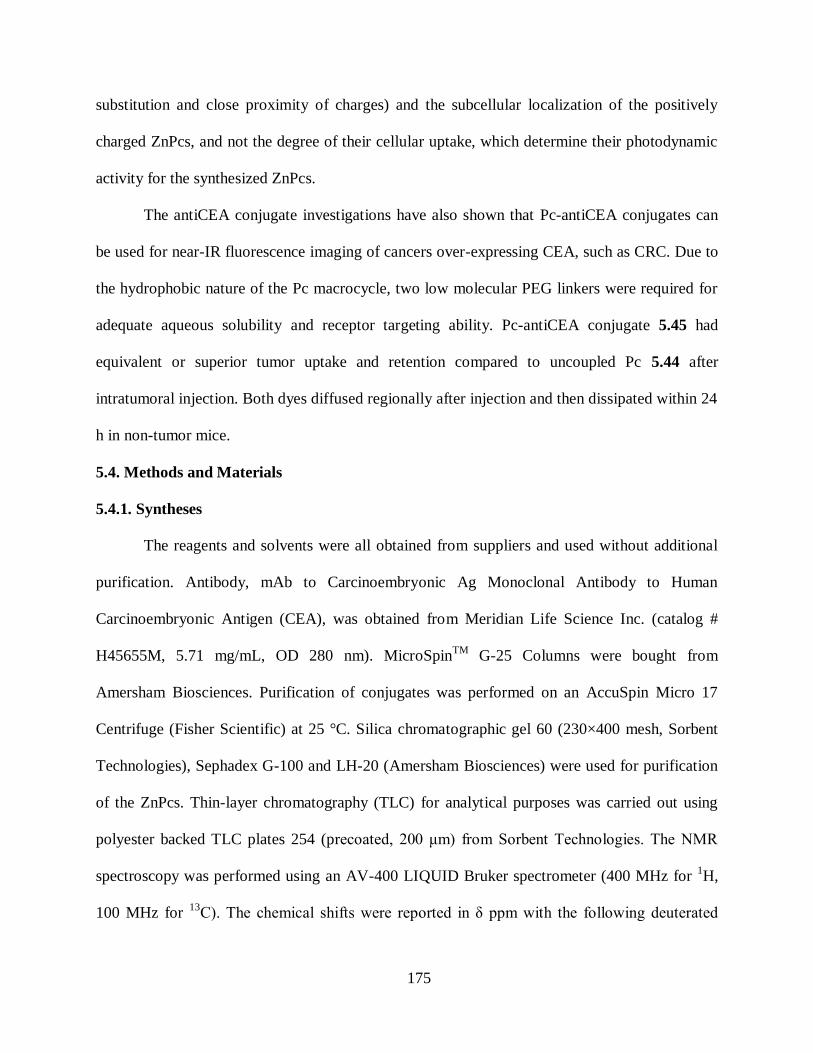
175
substitution and close proximity of charges) and the subcellular localization of the positively
charged ZnPcs, and not the degree of their cellular uptake, which determine their photodynamic
activity for the synthesized ZnPcs.
The antiCEA conjugate investigations have also shown that Pc-antiCEA conjugates can
be used for near-IR fluorescence imaging of cancers over-expressing CEA, such as CRC. Due to
the hydrophobic nature of the Pc macrocycle, two low molecular PEG linkers were required for
adequate aqueous solubility and receptor targeting ability. Pc-antiCEA conjugate 5.45 had
equivalent or superior tumor uptake and retention compared to uncoupled Pc 5.44 after
intratumoral injection. Both dyes diffused regionally after injection and then dissipated within 24
h in non-tumor mice.
5.4. Methods and Materials
5.4.1. Syntheses
The reagents and solvents were all obtained from suppliers and used without additional
purification. Antibody, mAb to Carcinoembryonic Ag Monoclonal Antibody to Human
Carcinoembryonic Antigen (CEA), was obtained from Meridian Life Science Inc. (catalog #
H45655M, 5.71 mg/mL, OD 280 nm). MicroSpinTM
G-25 Columns were bought from
Amersham Biosciences. Purification of conjugates was performed on an AccuSpin Micro 17
Centrifuge (Fisher Scientific) at 25 °C. Silica chromatographic gel 60 (230×400 mesh, Sorbent
Technologies), Sephadex G-100 and LH-20 (Amersham Biosciences) were used for purification
of the ZnPcs. Thin-layer chromatography (TLC) for analytical purposes was carried out using
polyester backed TLC plates 254 (precoated, 200 μm) from Sorbent Technologies. The NMR
spectroscopy was performed using an AV-400 LIQUID Bruker spectrometer (400 MHz for 1H,
100 MHz for 13
C). The chemical shifts were reported in δ ppm with the following deuterated

176
solvents as internal orientation: DMF-d7 8.03 ppm (1H), 163.15 ppm (
13C); CD3COCD3 2.04
ppm (1H), 29.92 ppm (
13C); THF-d8 3.58 ppm (
1H), 67.57 ppm (
13C); CDCl3 7.27 ppm (
1H),
77.23 ppm (13
C); DMSO-d6 2.50 ppm (1H), 39.51 ppm (
13C). MALDI-TOF mass spectra were
performedd on a Bruker UltrafleXtreme (MALDI-TOF/TOF) with 4-chloro-α-cyanocinnamic
acid as the matrix. The high resolution ESI mass spectra were recorded using Agilent
Technologies 6210 TOF LC/MS spectrometer. The UV-vis spectra were measured on a UV-vis
NIR scanning spectrophotometer; a 10 mm path length quartz cuvette was used. The stock
solutions (1.0 mM, 1.0 mL each) of all the ZnPcs in HPLC grade DMF solvent were diluted by
spiking 20 – 80 µL of each stock solution into DMF (10 mL) and their absorbances recorded.
Emissions were recorded on a Fluorolog® - HORIBA JOBINVYON, Model LFI-3751
spectrofluorimeter. The optical densities were kept within 0.04 – 0.05 at excitation wavelengths
for the solutions used in emission studies to minimize re-absorption by the photosensitizers. The
experiments were performed within 4 h after solution preparation between 23-25 °C. The ZnPcs
5.1, 5.2, 5.12 and 5.13 were synthesized as described previously in Chapters 2 and 3.
ZnPc 5.3. To a mixture of ZnPc 5.2 (20.0 mg, 0.017 mmol) in DMF (0.4 mL) were added
in the sequence: Et3N (3.3 mg, 0.032 mmol), HOBt (4.7 mg, 0.035 mmol), 1,4-bis-Boc-
triazaheptane (7 mg, 0.023 mmol), and EDCI (4.0 mg, 0.026 mmol). The mixture was stirred at
25 °C for 4 days, diluted with ethyl acetate (40 mL) and washed with water (2 × 20 mL). The
organic phase was dried over anhydrous Na2SO4 and the solvent removed under reduced
pressure. The crude product was purified by column chromatography using DCM/methanol for
elution, to afford a blue solid (20.2 mg, 81.8%). 1H NMR (DMSO-d6): δ 9.33-9.03 (m, 6H, Ar-
H), 8.30-8.07 (m, 5H, Ar-H), 7.84-7.44 (m, 5H, Ar-H), 7.20 (br, 1H, N-H), 6.79 (br, 1H, N-H),
4.14-3.98 (m, 4H, CH2O), 3.53-3.50 (m, 4H, CH2O), 3.44-3.38 (m, 12H, CH2NH), 3.36-3.22 (m,

177
2H, CH2NH), 3.00 (br, 2H, CH2NH), 2.31-2.20 (m, 2H, CH2CO), 1.80–1.76 (m, 27H, C(CH3)3),
1.37-1.34 (m, 18H, -OC(CH3)3). 13
CNMR (DMSO-d6): δ 171.0, 170.1, 168.9, 167.4, 167.3
(C=O), 155.6, 155.3, 154.7, 152.9, 152.6, 151.5, 150.8, 150.4, 150.2, 140.2, 138.1, 137.9, 137.6,
135.8, 135.2, 133.1, 132.4, 130.6, 128.3, 127.4, 127.0, 122.5, 122.0, 121.8, 121.5, 118.9, 118.6,
117.7, 117.4, 115.8 (Ar-C), 78.5, 77.5 (-OC(CH3)3), 70.6, 70.5, 70.4, 69.6, 69.5, 68.8, 66.7
(OCH2), 46.7, 46.2, 38.2, 36.1, 35.7, 35.6 (N-CH2), 31.8 (Ar-C(CH3)3), 28.2, 28.0 (O-C(CH3)3).
MS (MALDI-TOF) m/z 1455.650 [M]+, calcd for C77H93N13O12Zn 1455.636. The blue solid
(20.2 mg, 0.014 mmol) was dissolved in a 1:1 mixture of DCM/trifluoroacetic acid (TFA) (6
mL) and stirred at 0 C for 3 h. Solvent was removed and the residue treated with 2N NaOH (10
mL) to afford the title ZnPc as a blue solid (15.5 mg, 89.0 %). 1H NMR (DMF-d7): δ 9.59-9.07
(m, 6H, Ar-H), 8.41-8.32 (m, 4H, Ar-H), 8.12-8.06 (m, 1H, Ar-H), 7.92-7.85 (m, 2H, Ar-H),
7.60-7.53 (m, 2H, Ar-H), 6.96 (br, 1H, N-H), 4.23-4.10 (m, 4H, CH2O), 3.57-3.28 (m, 20H,
CH2O), 2.13-2.03 (m, 2H, CH2CO), 1.79-1.75 (m, 27H, C(CH3)3). 13
CNMR (DMF-d7): δ 171.2,
171.1, 170.4, 168.8, 168.7, 157.3, 156.8, 155.9, 155.7, 155.5, 155.4, 155.0, 154.8, 154.6, 154.3,
154.2, 153.9, 153.7, 152.9, 152.7, 152.3, 152.1, 142.6, 140.1, 139.8, 137.7, 137.4, 134.7, 134.3,
131.7, 131.5, 130.6, 128.50, 128.3, 124.0, 123.6, 123.4, 123.2, 122.6, 122.4, 120.7, 120.1, 120.0,
119.8, 119.6, 119.0118.3, 117.6, 117.1 (Ar-C), 72.4, 72.13, 72.08, 71.1, 71.0, 70.9, 70.24, 70.20,
68.3, 68.0 (O-C(CH3)3), 48.9, 48.7, 39.6, 39.3, 38.7, 37.5, 37.3, 36.8 (N-CH2), 32.7, 32.6 (m,
27H, C(CH3)3). MS (MALDI-TOF) m/z 1255.633 [M]+, calcd for C67H77N13O8Zn 1255.531. UV-
vis (DMF): λmax (log ε) 350 (5.00), 612 (4.77), 680 (5.52) nm.
ZnPc 5.4. ZnPc 5.3 (20.0 mg, 0.015 mmol), DIPA (0.015 mL, 0.107 mmol) and CH3I
(0.2 mL) were dissolved in dry DMF (0.5 mL), and the final solution stirred at 25 °C for 2 days.
The solvent was removed under reduced pressure and the resulting residue purified by Sephadex
178
G-100 using DCM/methanol to afford a blue solid (17.2 mg, 68.3%). 1H NMR (DMF-d7): δ
9.57-9.06 (m, 7H, Ar-H), 8.38-8.18 (m, 5H, Ar-H), 7.94-7.84 (m, 3H, Ar-H), 7.61-7.54 (m, 2H,
Ar-H), 4.29-4.13 (m, 8H, CH2O), 3.62-3.44 (m, 18H, CH2O/N-CH2/N-CH3), 3.28 (s, 9H, N-
CH3), 2.47-2.30 (m, 2H, COCH2), 1.78 (s, 27H, C(CH3)3). 13
C NMR (DMF-d7): δ 172.6, 170.5,
168.8, 168.7 (C=O), 157.1, 156.4, 155.8, 155.5, 155.3, 154.5, 154.2, 154.1, 153.9, 153.8, 153.5,
152.8, 152.7, 152.3, 142.7, 140.3, 140.2, 139.9, 137.8, 137.5, 134.9, 134.4, 131.4, 130.5, 129.7,
128.3, 128.1, 123.5, 123.3, 123.2, 123.1, 122.7, 122.5, 121.9, 120.4, 120.0, 119.8, 119.7, 118.9,
117.5 (Ar-C), 72.2, 72.0, 71.1, 71.0, 67.9 (CH2O), 64.6, 64.4, 58.6, 57.1, 54.3, 52.4 (N-CH3),
39.6, 37.3, 36.8 (N-CH2) 32.7, 32.6 (C(CH3)3). MS (MALDI-TOF) m/z 1493.711 [M-I+K]+,
1441.654 [M-I-CH3+H]+; calcd for C72H89IKN13O8Zn
+ 1493.493, C71H88IN13O8Zn
+ 1441.522.
UV–Vis (DMF): λmax (log ε) 348 (4.81), 611 (4.55), 679 (5.32) nm.
ZnPc 5.5. A procedure related to that described for ZnPc 5.3 was used: ZnPc 5.1 (40.0
mg, 0.04 mmol), DMF (0.5 mL), Et3N (5.2 mg, 0.051 mmol), HOBt (7.5 mg, 0.055 mmol), 1,4-
bis-Boc-triazaheptane (15.5 mg, 0.051 mmol) and EDCI (9.8 mg, 0.051 mmol). The protected
ZnPc was achieved as a blue solid (38.6 mg, 77.0%). 1H N MR (DMF-d7): δ 9.60-9.03 (m, 6H,
Ar-H), 8.40-8.20 (m, 5H, Ar-H), 7.96-7.79 (m, 3H, Ar-H), 7.61–7.50 (m, 2H, Ar-H), 6.73 (br,
1H, N-H), 4.26–4.12 (m, 4H, CH2O), 3.38–3.26 (m, 6H, CH2NH), 3.20–3.16 (m, 2H, CH2NH),
1.82–1.78 (m, 27H, C(CH3)3), 1.42–1.32 (m, 18H, -OC(CH3)3). 13
C NMR (DMF-d7): δ 170.4,
168.6 (C=O), 157.1, 156.8, 156.5, 156.2, 155.5, 155.4, 155.3, 155.2, 155.0, 154.6, 154.4, 154.3,
154.2, 154.1, 153.5, 152.5, 152.1, 142.3, 140.0, 139.9, 139.6, 137.6, 137.5, 137.2, 135.0, 134.5,
131.7, 130.1, 129.4, 128.6, 128.4, 123.6, 123.5, 122.7, 122.5, 122.0, 120.4, 120.1, 120.0, 119.8,
119.7, 119.0, 118.9, 117.5 (Ar-C), 79.9, 78.7 (-OC(CH3)3), 72.3, 72.0 (OCH2), 48.4, 48.2, 47.6,
40.0, 39.8, 38.4, 36.8 (N-CH2), 32.7, 32.6 (Ar-C(CH3)3), 28.9, 28.8 (O-C(CH3)3). MS (MALDI-
179
TOF) m/z 1053.438 [M-2Boc+H]+, calcd for C58H61N12O4Zn 1053.423. The blue solid (51.6 mg,
0.044 mmol) was dissolved in 1:1 DCM/TFA (6 mL) and stirred at 0 C for 3 h. The solvent was
evaporated and the residue treated with 2N NaOH (10 mL) to obtain a blue-greenish solid (38.2
mg, 89.2 %). 1H NMR (DMF-d7): δ 9.62-9.12 (m, 7H, Ar-H), 8.63-8.31 (m, 5H, Ar-H), 7.99–
7.88 (m, 3H, Ar-H), 7.65–7.58 (m, 2H, Ar-H), 4.29–4.17 (m, 4H, CH2O), 4.01 (br, 4H, NH2),
3.63–3.55 (m, 6H, CH2NH), 3.38–3.35 (m, 2H, CH2NH), 1.81 (s, 27H, C(CH3)3). 13
C NMR
(DMF-d7): δ 171.4, 168.6 ,168.5 (C=O), 161.2, 160.9, 160.6, 160.2, 157.1, 156.4, 155.9, 155.8,
155.6, 155.5, 154.9, 154.8, 154.7, 154.6,154.0, 153.8, 153.7, 153.6, 153.3, 152.7, 152.3, 142.8,
140.5, 140.3, 140.0, 138.0, 137.9, 137.6, 134.8, 134.3, 131.2, 130.5, 129.9, 128.1, 127.9, 123.4,
123.2, 122.9, 122.7, 122.5, 121.9, 120.3, 120.0, 119.8, 119.7, 119.6, 118.7, 117.4, 116.8 (Ar-C),
72.1, 71.8 (OCH2), 48.4, 46.0, 37.3, 36.7 (N-CH2), 32.7, 32.5 (Ar-C(CH3)3). MS (MALDI-TOF)
m/z 1053.433 [M+H]+, calcd for C58H61N12O4Zn 1053.423. UV-vis (DMF): λmax (log ε) 350
(4.66), 612 (4.42), 680 (5.19) nm.
ZnPc 5.6. A procedure related to that described for ZnPc 5.4 was used: ZnPc 5.5 (20.0
mg, 0.021 mmol), DIPA (0.015 mL, 0.107 mmol), CH3I (0.2 mL) and dry THF (0.5 mL). The
product was attained as a pale-green solid (14.7 mg, 53.3%). 1H NMR (DMF-d7): δ 9.56-9.06
(m, 6H, Ar-H), 8.36-8.24 (m, 4H, Ar-H), 7.96-7.80 (m, 4H, Ar-H), 7.58-7.51 (m, 2H, Ar-H),
4.34-4.13 (m, 8H, CH2O/N-CH2), 3.80-3.67 (m, 4H, N-CH2), 3.62-3.47 (m, 6H, N-CH3), 3.41-
3.27 (m, 9H, N-CH3), 1.79-1.71 (m, 27H, C(CH3)3). 13
C NMR (DMF-d7): δ 171.3, 168.7, 168.6,
168.4, 157.2, 156.7, 155.9, 155.8, 155.7, 155.6, 155.5, 155.43, 155.36, 155.1, 155.0, 154.9,
154.8, 154.7, 154.6, 154.5, 154.1, 154.0, 153.8, 153.7, 153.6, 153.5, 153.2, 152.7, 152.63,
152.55, 152.33, 152.27, 152.2, 142.8, 140.4, 140.3, 140.0, 137.9, 137.6, 134.7, 134.3, 133.4,
132.5, 131.8, 131.4, 130.6, 129.9, 128.3, 128.0, 123.4, 123.3, 123.2, 123.0, 122.6, 122.4, 120.5,

180
120.0, 119.9, 119.8, 119.7, 119.6, 119.5, 118.6, 117.3 (Ar-C), 72.0, 71.9, 71.8, 71.4 (CH2O),
66.9, 66.6, 64.9, 64.5, 58.6, 58.5, 57.1, 54.3, 52.40, 52.35 (N-CH3), 36.8, 36.7 (N-CH2) 32.7,
32.6 (C(CH3)3). MS (MALDI-TOF) m/z 1238.544 [M-I-CH3+2H]+, calcd for C62H71IN12O4Zn
1238.406. UV–Vis (DMF): λmax (log ε) 357 (4.72), 611 (4.46), 679 (5.23) nm
ZnPc 5.7. A procedure related to that described for ZnPc 5.3 was used: ZnPc 5.1 (50.0
mg, 0.05 mmol), DMF (0.8 mL), Et3N (6.2 mg, 0.061 mmol), HOBt (9.3 mg, 0.069 mmol),
aspartic acid di-tert-butyl ester hydrochloride (18 mg, 0.064 mmol) and EDCI (12.3 mg, 0.064
mmol). The crude was purified on a silica column chromatography eluted by DCM/methanol
(98/2), to give the di-ester ZnPc as a blue solid (0.052 g, 87.1%). 1H NMR (DMF-d7): δ 10.09,
10.05 (s, 1H, N-H), 9.63-9.28 (m, 6H, Ar-H), 9.19-9.01 (m, 1H, Ar-H), 8.47-8.20 (m, 5H, Ar-H),
7.97-7.79 (m, 3H, N-H), 7.62-7.47 (m, 2H, N-H), 4.55-4.45 (m, 1H, N-H), 4.28-4.19 (m, 4H,
CH2O), 2.96-2.67 (m, 3H, CH2), 1.81–1.77 (m, 27H, C(CH3)3), 1.45-1.36 (m, 18H, -OC(CH3)3).
13C NMR (DMF-d7): δ 170.9, 170.7, 170.4, 170.0, 168.7 (C=O), 156.8, 156.2, 155.6, 155.4,
154.5, 154.3, 154.1, 153.6, 152.5, 152.2, 142.3, 140.0,139.9, 139.6, 1137.5, 137.5, 137.2, 135.2,
134.6, 131.8, 130.2, 129.5, 128.8, 128.5, 123.7, 123.5, 123.3, 122.5, 122.3, 120.4, 120.1, 119.9,
119.7, 119.0, 117.6 (Ar-C), 82.4, 81.7 (-OC(CH3)3), 72.3, 71.9 (OCH2), 50.4, 38.4, 36.8 (N-
CH2), 32.7, 32.6 (Ar-C(CH3)3), 28.4, 28.3 (O-C(CH3)3). MS (MALDI-TOF) m/z 1083.625 [M-
2C4H9+H]+, calcd for C58H55N10O8Zn 1083.350. The solid (0.052 g, 0.044 mmol) was dissolved
in 1:1 DCM/TFA (8 mL) and stirred for 4 h at 0°C. The tert-butyl group was removed as
described for ZnPc 5.5 to give the product as a blue solid (34.3 mg, 82.3 %). (MALDI-TOF) m/z
1195.180 [M+Na]+, calcd for C58H54N10NaO8Zn 1105.332. UV-vis (DMF): λmax (log ε) 349
(4.68), 612 (4.41), 679 (5.17) nm.

181
ZnPc 5.8. A procedure related to that described for ZnPc 5.3 was used: ZnPc 5.7 (18.4
mg, 0.017 mmol), DMF (0.5 mL), Et3N (6.2 mg, 0.061 mmol), HOBt (5.7 mg, 0.042 mmol), N-
Boc-2,2′-(ethylenedioxy)diethylamine (9.4 mg, 0.038 mmol) and EDCI (6.5 mg, 0.042 mmol).
The crude was purified on a silica column eluted by DCM/methanol (95:5) to obtain a blue solid
(13.6 mg, 51.9 %). 1H NMR (DMF-d7): δ 9.59-9.08 (m, 6H, Ar-H), 8.50-8.27 (m, 5H, Ar-H),
7.99-7.74 (m, 5H, Ar-H), 7.61-7.53 (m, 2H, Ar-H), 6.65 (br, 1H, Ar-H), 4.77–4.71 (m, 1H,
NHCH(CH2)CO), 4.28–4.16 (m, 4H, CH2O), 3.48–3.36 (m, 14H, CH2O), 3.31–3.16 (m, 8H,
CH2O), 2.75–2.67 (m, 2H, CHCH2CO), 1.81–1.76 (m, 27H, C(CH3)3), 1.37 (s, 18H, OC(CH3)3).
13C NMR (DMF-d7): δ 171.90, 171.86, 171.35, 171.28, 170.3, 168.7, 168.6 (C=O), 157.1, 155.4,
155.3, 154.5, 153.6, 152.6, 142.4, 140.0, 137.6, 135.1, 134.6, 132.5, 131.8, 129.9, 128.7, 123.4,
122.6, 122.4, 120.1, 119.0, 117.6 (Ar-C), 78.7 (OC(CH3)3), 72.1, 71.9, 71.0, 70.95, 70.7, 70.4,
70.3 (CH2O), 51.1 (NHCH(CH2)CO), 41.2, 40.1, 38.4, 36.8 (CH2), 32.7, 32.6 (C(CH3)3), 28.9
(OC(CH3)3). MS (MALDI-TOF) m/z 1542.669 [M]+, calcd for C80H98N14O14Zn 1542.668. The
solid ZnPc (13.1 mg, 8.5 mmol) was dissolved in DCM/TFA (1:1) and stirred at 0°C for 3 h. The
solvent was evaporated and the residue treated with 2N NaOH (10 mL) to obtain a blue solid
(10.5 mg, 92.3%). 1H NMR (DMF-d7): δ 9.60-9.10 (m, 7H, Ar-H), 8.60-8.29 (m, 5H, Ar-H),
7.95-7.87 (m, 2H, Ar-H), 7.56–7.51 (m, 2H, Ar-H), 4.56 (br, 1H, NH), 4.21 (d, 9.48 Hz, 2H,
CH2O), 4.16 (d, 8.92 Hz, 2H, CH2O), 3.75–3.35 (m, 10H, CH2O), 3.16–2.95 (m, 9H, CH2O),
2.90–2.80 (m, 3H, CH2O), 2.90–2.80 (m, 3H, CH2O), 2.62-2.47 (m, 2H, CH2), 2.19 (br, 2H,
NH2), 1.80–1.74 (m, 27H, C(CH3)3). 13
C NMR (DMF-d7): δ 171.8, 171.3, 171.2, 170.2, 168.6,
168.5, 157.7, 157.4, 155.9, 155.6, 155.5, 155.0, 154.3, 154.2, 154.1, 154.0, 153.7, 152.4, 151.7,
142.4, 140.1, 139.8, 137.7, 137.3, 134.4, 134.1, 131.7, 130.8, 128.5, 123.7, 123.4, 123.1, 122.5,
122.3, 120.1, 120.0, 119.8, 117.6, 116.7 (Ar-C), 72.0, 71.8, 71.5, 71.0, 70.5, 70.4, 70.0 (N-CH),

182
51.2 (NHCH(CH2)CO), 40.9, 39.9, 39.8, 38.1, 36.8 (CH2), 32.7, 32.6 (C(CH3)3). MS (MALDI-
TOF) m/z 1343.610 [M+H]+, calcd for C70H83N14O10Zn 1343.571. UV-vis (DMF): λmax (log ε)
349 (4.70), 612 (4.45), 680 (5.20) nm.
ZnPc 5.9. A procedure related to that described for ZnPc 5.4 was used: ZnPc 5.8 (20.0
mg, 0.015 mmol), DIPA (0.015 mL, 0.107 mmol), CH3I (0.2 mL) and dry DMF (0.5 mL). The
product was attained as a blue solid (17.2 mg, 68.3%). 1H NMR (DMF-d7): δ 9.57-9.33 (m, 5H,
Ar-H), 9.20-9.05 (m, 1H, Ar-H), 8.52-8.28 (m, 4H, Ar-H), 7.95-7.84 (m, 4H, Ar-H), 7.61-7.52
(m, 2H, Ar-H), 4.31-4.11 (m, 4H, OCH2), 3.93 (br, 2H, NH), 3.71-3.40 (m, 27H, OCH2/N-CH3),
3.33-3.29 (m, 10H, N-CH3), 1.80-1.76 (m, 27H, C(CH3)3). MS (MALDI-TOF) m/z 1427.749 [M-
2I-H]+, calcd for C76H95N14O10Zn
+ 1427.665. UV–Vis (DMF): λmax (log ε) 348 (4.48), 612
(4.23), 680 (5.01) nm.
ZnPc 5.10. A procedure related to that described for ZnPc 5.3 was used: ZnPc 5.7 (18.4
mg, 0.017 mmol), DMF (0.5 mL), Et3N (6.2 mg, 0.061 mmol), HOBt (5.7 mg, 0.042 mmol), N-
Boc-ethylenediamine (6.1 mg, 0.038 mmol) and EDCI (6.5 mg, 0.042 mmol). The mixture was
stirred for 4 days at 25 °C. The solvent was evaporated and the residue treated with 2N NaOH
(10 mL) to obtain a blue solid (13.4 mg, 57.8 %). 1H NMR (DMF-d7): δ 9.59-9.21 (m, 6H, Ar-
H), 8.45-8.23 (m, 4H, Ar-H), 8.12-7.82 (m, 3H, Ar-H), 7.62–7.52 (m, 2H, Ar-H), 6.73-6.66 (m,
2H, Ar-H), 4.75-4.71 (m, 1H, NH), 4.28–4.18 (m, 4H, CH2O), 3.29–3.11 (m, 8H, CH2NH), 2.70-
2.65 (m, 2H, CH2CO), 1.81–1.77 (m, 27H, C(CH3)3), 1.41–1.34 (m, 18H, C(CH3)3). 13
C NMR
(DMF-d7): δ 172.1, 172.0, 171.5, 171.4, 170.3, 168.7, 168.6, 157.2, 157.1, 155.6, 155.4, 155.2,
154.4, 154.1, 153.7, 153.6, 152.6, 152.3, 142.3, 139.9, 139.7, 137.6, 137.2, 135.1, 134.6, 131.8,
130.1, 129.4, 128.6, 128.5, 123.5, 122.6, 122.4, 122.0, 120.1, 119.7, 119.1, 119.0, 117.7 (Ar-C),
78.8 (OC(CH3)3), 72.2, 71.9 (CH2O), 51.3, 51.2 (NHCH(CH2)CO), 41.0, 40.5, 40.4, 38.8, 36.8

183
(CH2), 32.7, 32.6 (C(CH3)3), 28.9 (OC(CH3)3). MS (MALDI-TOF) m/z 1166.466 [M-2Boc]+,
1189.469 [M-2Boc+Na]+, 1205.444 [M-2Boc+K]
+, calcd for C62H66N14O6Zn 1166.4581,
C62H66NaN14O6Zn 1189.4479, C62H66KN14O6Zn 1206.4218 respectively. The ZnPc (13.1 mg,
0.0096 mmol) was dissolved in a mixture of DCM/TFA (1:1) at 0 °C for 3h. The solvent was
evaporated and the residue treated with 2N NaOH (10 mL) to obtain a blue solid (10.1 mg,
90.1%). 1H NMR (THF-d8): δ 9.58-9.08 (m, 7H, Ar-H), 8.39-8.07 (m, 4H, Ar-H), 7.82-6.86 (m,
5H, Ar-H), 4.15-3.76 (m, 4H, CH2O), 3.57–3.20 (m, 8H, CH2NH), 2.28-2.13 (m, 2H, CH2CO),
1.80–1.72 (m, 27H, C(CH3)3). 13
C NMR (DMF-d7): δ 171.2, 171.0, 169.6, 168.2, 157.7, 155.8,
155.7, 155.0, 154.4, 153.9, 153.5, 151.6, 142..4, 140.1,139.8, 139.5, 137.7, 137.2, 133.4, 131.9,
130.4, 128.5, 128.3, 123.9, 123.4, 122.2, 121.9, 120.8, 120.4, 119.9, 119.8, 117.1, 116.6 (Ar-C),
71.7, 71.6 (CH2NH), 50.7 (NHCH(CH2)CO), 40.7, 40.2, 36.8, 36.7 (CH2), 32.8, 32.7, 32.6
(C(CH3)3). MS (MALDI-TOF) m/z 1166.503 [M-2Boc]+, calcd for C62H66N14O6Zn 1166.4581.
UV-vis (DMF): λmax (log ε) 349 (4.72), 613 (4.48), 680 (5.23) nm.
ZnPc 5.11. A procedure related to that described for ZnPc 5.4 was used: ZnPc 5.10 (20.0
mg, 0.017 mmol), DIPA (0.015 mL, 0.107 mmol), CH3I (0.2 mL) and dry THF (0.5 mL). After
purification, the title ZnPc was obtained (15.2 mg, 58.9%). 1H NMR (DMF-d7): δ 9.56-8.80 (m,
10H, Ar-H), 8.38-8.24 (m, 4H, Ar-H), 7.96-7.85 (m, 3H, Ar-H), 7.62-7.54 (m, 2H, Ar-H), 7.16
(d, 8.6Hz, 1H, Ar-H), 6.90 (d, 8.2Hz, 1H, Ar-H), 4.22-4.09 (m, 4H, OCH2), 3.38-3.29 (m, 8H, N-
CH2), 3.11-3.02 (m, 18H, N-CH3), 1.92-1.73 (m, 27H, C(CH3)3). 13
C NMR (d-DMF): δ 172.8,
172.7, 171.7, 170.8, 168.9, 168.8 (C=O), 157.9, 155.9, 155.7, 155.4, 154.9, 153.9, 153.8, 153.6,
144.2, 142.9, 140.4, 140.1, 138.0, 137.7, 134.7, 134.2, 128.7, 128.1, 123.4, 123.2, 122.8, 122.7,
119.8, 119.7, 119.5, 118.4, 117.3, 115.0 (Ar-C), 72.2, 71.9, 70.5, 65.4, 64.4 (N-CH2), 53.9, 53.6

184
(N-CH3), 32.7, 32.6 (C(CH3)3). MS (MALDI-TOF) m/z 1209.761 [M-3CH3-2I]+, calcd for
C65H73N14O6Zn+ 1209.513. UV–Vis (DMF): λmax (log ε) 348 (4.65), 612 (4.42), 679 (5.19) nm.
ZnPc 5.14. A procedure related to that described for ZnPc 5.3 was used: ZnPc 5.13 (20.0
mg, 0.017 mmol), DMF (0.4 mL), Et3N (3.2 mg, 0.032 mmol), HOBt (4.7 mg, 0.035 mmol), 1,4-
bis-Boc-triazaheptane (7 mg, 0.023 mmol) and EDCI (4.0 mg, 0.026 mmol). The crude was
purified as described above to obtain a blue solid (19.7 mg, 79.6%). 1H NMR (DMF-d7): δ 9.32-
8.67 (m, 8H, Ar-H), 8.35-8.30 (m, 4H, Ar-H), 8.15-8.04 (m, 2H, Ar-H), 7.94-7.82 (m, 2H, Ar-
H), 7.64-7.59 (m, 2H, Ar-H), 6.90 (br, 1H, N-H), 4.39 (d, J = 13.6, 2H, CH2O), 4.30 (d, J = 9.76,
2H, CH2O), 3.73-3.68 (m, 4H, CH2O), 3.62-3.56 (m, 14H, CH2O), 3.51-3.47 (m, 2H, CH2NH),
3.35-3.19 (m, 8H, CH2NH), 2.47-2.42 (m, 2H, CH2CO), 1.86–1.82 (m, 27H, C(CH3)3), 1.45-1.36
(m, 18H, -OC(CH3)3). 13
C NMR (DMF-d7): δ 172.4, 171.5, 170.6, 169.2, 169.1 (C=O), 161.0,
160.4, 157.1, 156.3, 154.4, 153.9, 139.1, 138.9, 136.7, 136.3, 133.7, 128.7, 125.3, 123.5, 122.8,
122.0, 121.5, 121.1, 120.8, 120.3, 115.0, 112.8, 111.6 (Ar-C), 79.9, 78.7 (O-C(CH3)3), 72.4,
72.20, 72.16, 71.3, 71.2, 71.12, 71.06, 70.4, 68.2, 67.9 (OCH2), 48.6, 48.3, 46.1 39.7, 38.9, 37.6,
37.5, 36.9, 36.6 (N-CH2), 32.6 (Ar-C(CH3)3), 29.0, 28.9 (O-C(CH3)3). MS (MALDI-TOF) m/z
1355.693 [M-tBu]
+, 1255.650 [M-2
tBu]
+; calcd for C72H85N13O10Zn 1355.583, C67H77N13O8Zn
1255.531. The blue solid (19.0 mg, 0.013 mmol) was dissolved in 1:1 DCM/TFA (6 mL) and
stirred at 0 C for 3 h. The crude product was treated as described for ZnPc 5.3 above to give a
blue solid (14.9 mg, 90.7 %). 1H NMR (DMF-d7): δ 9.56-8.89 (m, 8H, Ar-H), 8.39-8.31 (m, 4H,
Ar-H), 8.08-7.92 (m, 2H, Ar-H), 7.55-7.51 (m, 2H, Ar-H) 4.36 (d, J = 6.88, 2H, CH2O), 4.26 (d,
J = 6.64, 2H, CH2O), 3.56-3.25 (m, 24H, CH2O), 2.38-2.22 (m, 2H, CH2CO), 1.80-1.76 (m, 27H,
C(CH3)3). 13
CNMR (DMF-d7): δ 171.3, 170.6, 169.2, 169.1, 160.6, 160.3, 155.2, 155.1, 154.8,
154.0, 153.4, 141.5, 140.0, 139.8, 137.7, 136.5, 136.2, 135.1, 134.9, 134.7, 128.3, 125.1, 123.3,
185
122.8, 121.3, 120.7, 119.8, 115.0, 112.6, 111.5, 111.0 (Ar-C), 72.4, 72.2, 71.2, 71.1, 70.9, 70.3,
68.1 (O-C(CH3)3), 48.9, 48.1, 39.7, 39.3, 37.5, 37.3 (N-CH2), 32.6 (m, 27H, C(CH3)3). MS
(MALDI-TOF) m/z 1255.555 [M]+, calcd for C67H77N13O8Zn 1255.531. UV-VIS (DMF): λmax
(log ε) 351 (4.81), 612 (4.53), 677 (5.28) nm.
ZnPc 5.15. A procedure related to that described for ZnPc 5.4 was used: ZnPc 5.14 (20.0
mg, 0.015 mmol), DIPA (0.015 mL, 0.107 mmol), CH3I (0.2 mL) and dry DMF (0.5 mL). The
title ZnPc was attained as a blue solid (16.2 mg, 64.3%). 1H NMR (DMF-d7): δ 9.57-9.26 (m,
7H, Ar-H), 8.38-8.18 (m, 5H, Ar-H), 7.94-7.84 (m, 2H, Ar-H), 7.61-7.48 (m, 2H, Ar-H), 4.35-
4.23 (m, 8H, CH2O), 3.81-3.48 (m, 18H, CH2O/N-CH2/N-CH3), 3.46 (s, 9H, N-CH3), 2.47-2.30
(m, 2H, COCH2), 1.85-1.76 (m, 27H, C(CH3)3). 13
C NMR (DMF-d7): δ 173.0, 172.6, 172.4,
170.6, 169.2, 169.1 (C=O), 160.6, 160.2, 155.1, 154.9, 154.6, 154.0, 153.9, 153.2, 141.4, 140.0,
139.9, 137.6, 137.4, 136.5, 136.2, 134.9, 134.6, 129.5, 128.7, 128.4, 125.0, 123.3, 122.8, 121.3,
121.1, 120.7, 119.8, 115.0, 112.6, 111.5 (Ar-C), 72.4, 72.2, 71.2, 71.1, 70.3, 68.0 (CH2O), 64.6,
64.4, 58.6, 57.2, 55.9, 54.4, 52.5, 49.9, 48.0 (N-CH3), 43.2, 39.7, 37.5, 36.8 (N-CH2) 32.6
(C(CH3)3). MS (MALDI-TOF) m/z 1493.710 [M-I+K]+, calcd for C72H89IKN13O8Zn
+ 1493.493.
UV–Vis (DMF): λmax (log ε) 351 (4.84), 610 (4.54), 677 (5.30) nm.
ZnPc 5.16. A procedure related to that described for ZnPc 5.5 was used: ZnPc 5.12 (40.0
mg, 0.04 mmol), DMF (0.5 mL), Et3N (5.2 mg, 0.051 mmol), HOBt (7.5 mg, 0.055 mmol), 1,4-
bis-Boc-triazaheptane (15.5 mg, 0.051 mmol), and EDCI (9.8 mg, 0.051 mmol). The product
was obtained as a blue solid (44.4 mg, 88.6%). 1H NMR (DMF-d7): δ 9.42-9.24 (m, 6H, Ar-H),
8.78 (br, 1H, NH), 8.40-8.20 (m, 4H, Ar-H), 8.10-8.04 (m, 2H, Ar-H), 7.89-7.79 (m, 1H, Ar-H),
7.64–7.59 (m, 2H, Ar-H), 6.82-6.76 (m, 1H, N-H), 4.38 (d, J = 6.92 MHz, 2H, CH2O), 4.29 (d, J
= 9.68 MHz, 2H, CH2O), 3.47 (br, 4H, CH2NH), 3.38 (br, 2H, CH2NH), 3.25 (m, 2H, CH2NH),

186
1.87–1.83 (m, 27H, C(CH3)3), 1.48 (s, 9H, -OC(CH3)3), 1.41 (s, 18H, -OC(CH3)3). 13
CNMR
(DMF-d7): δ 170.6, 169.1 (C=O), 160.6, 160.5, 160.2, 160.1, 157.2, 156.6, 156.4, 154.8, 154.72,
154.65, 154.5, 154.3, 154.2, 154.1, 154.0, 153.9, 153.4, 152.8, 141.1, 139.8, 139.6, 137.4, 137.3,
137.2, 136.5, 136.2, 134.5, 134.3, 132.6, 129.8, 128.4, 128.3, 126.2, 125.0, 123.4, 123.3, 122.9,
122.0, 121.3, 121.1, 120.8, 120.7, 119.9, 119.7, 112.7, 111.5 (Ar-C), 80.0, 78.8 (-OC(CH3)3),
72.4, 72.1 (OCH2), 48.5, 48.3, 47.7, 40.1, 39.9, 38.7, 38.5, 36.8 (N-CH2), 32.7 (Ar-C(CH3)3),
29.0, 28.9 (O-C(CH3)3). MS (MALDI-TOF) m/z 1052.447 [M-2Boc]+, calcd for C58H60N12O4Zn
1052.415. The blue solid (44.4 mg, 0.035 mmol) was dissolved in DCM/TFA (1:1) and stirred at
0 C for 3 h. The solvent was evaporated and the remaing solid treated with 2N NaOH (10 mL)
to afford a blue-greenish solid (33.5 mg, 89.9 %). 1H NMR (DMF-d7): δ 9.55-9.24 (m, 7H, Ar-
H), 8.97-8.89 (m, 1H, Ar-H), 8.40-8.11 (m, 4H, Ar-H), 8.07 – 8.00 (m, 1H, Ar-H), 7.92 – 7.90
(m, 1H, Ar-H), 7.65–7.50 (m, 2H, Ar-H), 4.37 (d, J = 6.88 MHz, 2H, CH2O), 4.26 (d, J = 4.24
MHz, 2H, CH2O), 3.47 (br, 2H, CH2NH), 3.03–2.91 (m, 2H, CH2NH), 1.82-1.79 (m, 27H,
C(CH3)3). 13
C NMR (DMF-d7): δ 171.4, 169.2 ,169.1 (C=O), 160.6, 160.5, 160.2, 159.7, 155.2,
155.1, 154.8, 154.7, 154.3, 154.1, 154.0, 153.4,153.2, 141.4, 140.0, 139.8, 137.7, 137.5, 134.9,
134.7, 128.3, 128.2, 125.0, 123.3, 123.2, 122.8, 121.2, 121.1,120.7, 119.9, 119.8, 119.3, 116.4,
112.7, 111.5 (Ar-C), 72.3, 72.1, 72.0 (OCH2), 49.1, 48.7, 47.5, 47.0, 39.5, 38.7, 36.7 (N-CH2),
32.6 (Ar-C(CH3)3). MS (MALDI-TOF) m/z 1052.411 [M]+, calcd for C58H60N12O4Zn 1052.415.
UV-vis (DMF): λmax (log ε) 351 (4.73), 609 (4.43), 676 (5.19) nm.
ZnPc 5.17. A procedure related to that described for ZnPc 5.4 was used: ZnPc 5.16 (20.0
mg, 0.021 mmol), DIPA (0.015 mL, 0.107 mmol), CH3I (0.2 mL) and dry THF (0.5 mL). The
title ZnPc was obtained as a blue-green solid (16.1 mg, 58.3%). 1H NMR (DMF-d7): δ 9.56-9.19
(m, 6H, Ar-H), 9.03-8.77 (m, 2H, Ar-H), 8.39-8.27 (m, 3H, Ar-H), 8.01-8.86 (m, 3H, Ar-H),
187
7.58-7.45 (m, 4H, Ar-H), 4.41-4.27 (m, 8H, CH2O/N-CH2), 3.92-3.82 (m, 4H, N-CH2), 3.53 (s,
6H, N-CH3), 3.49 (s, 9H, N-CH3), 1.86-1.72 (m, 27H, C(CH3)3). 13
C NMR (DMF-d7): δ 171.4,
169.0, 168.6, 168.9, 160.5, 160.4, 160.1, 160.0, 155.9, 155.5, 155.3, 155.2, 155.1, 154.9, 154.8,
154.3, 154.0, 153.9, 153.8, 141.6, 140.2, 140.0, 137.8, 137.7, 137.6, 136.3, 136.0, 135.2, 135.0,
128.3, 128.12, 128.07, 125.1, 123.24, 123.15, 123.0, 122.8, 122.7, 121.3, 121.1, 120.6, 119.9,
119.8, 119.7, 112.8, 111.7 (Ar-C), 72.1, 71.9 (CH2O), 64.5, 58.7, 57.3, 54.5, 52.5 (N-CH3), 36.7
(N-CH2) 32.6 (C(CH3)3). MS (MALDI-TOF) m/z 1252.575 [M-I+2H]+, calcd for
C63H73IN12O4Zn 1252.421. UV–Vis (DMF): λmax (log ε) 351 (4.83), 610 (4.55), 676 (5.31) nm.
ZnPc 5.18. A procedure related to that described for ZnPc 5.3 was used: ZnPc 5.12 (50.0
mg, 0.05 mmol), DMF (0.8 mL), Et3N (6.2 mg, 0.061 mmol), HOBt (9.3 mg, 0.069 mmol),
aspartic acid di-tert-butyl ester hydrochloride (18 mg, 0.064 mmol) and EDCI (12.3 mg, 0.064
mmol). The protected ZnPc was obtained as a blue solid (0.056 g, 89.0%). 1H NMR (Acetone-
d6): δ 9.86-9.68 (m, 1H, N-H), 9.37-8.57 (m, 6H, Ar-H), 8.38-7.96 (m, 6H, Ar-H), 7.92-7.56 (m,
4H, Ar-H), 4.74 (br, 1H, N-H), 4.25 (s, 4H, CH2O), 2.82 (s, 1H, CH), 2.66 (s, 2H, CH), 1.94–
1.87 (m, 27H, C(CH3)3), 1.45 (s, 18H, -OC(CH3)3). 13
C NMR (Acetone-d6): δ 170.6, 170.4,
169.99, 169.95, 168.3, 168.23, 168.17 (C=O), 160.0, 159.9, 159.8, 159.4, 159.3, 159.2, 155.3,
155.1, 154.6, 154.4, 153.2, 1153.1, 153.03, 152.97, 139.4, 139.1, 139.0, 136.8, 135.9, 135.8,
135.4, 127.7, 124.3, 122.8, 122.4, 121.8, 121.1, 121.0, 120.5, 120.4, 119.5, 112.8, 112.6, 111.5
(Ar-C), 82.4, 81.7 (-OC(CH3)3), 72.4, 71.9 (OCH2), 50.1, 50.0, 38.4, 36.6 (N-CH2), 32.6 (Ar-
C(CH3)3), 28.4, 28.2 (O-C(CH3)3). MS (MALDI-TOF) m/z 1194.433 [M+H]+, 1138.332 [M-
C4H9]+, 1083.257 [M-2C4H9+H]
+, calcd for C66H70N10O8Zn 1194.467, C62H62N10O8Zn 1138.404,
C58H55N10O8Zn 1083.350. The solid (0.056 g, 0.047 mmol) was dissolved in DCM/TFA (1:1)
and stirred for 4 h at 0°C. The solvent was evaporated and the precipitate treated with 2N NaOH

188
(10 mL) to obtaiin a blue solid (42.1 mg, 83.0 %). MS (MALDI-TOF) m/z 1082.7 [M]
+,
1105.3315 [M+Na]+, calcd for C58H54N10O8Zn 1082.34, C58H54N10NaO8Zn 1105.7. UV-vis
(DMF): λmax (log ε) 351 (4.83), 610 (4.51), 677 (5.28) nm.
ZnPc 5.19. A procedure related to that described for ZnPc 5.3 was used: ZnPc 5.18 (18.4
mg, 0.017 mmol), DMF (0.5 mL), Et3N (6.2 mg, 0.061 mmol), HOBt (5.7 mg, 0.042 mmol), N-
Boc-2,2′-(ethylenedioxy)diethylamine (9.4 mg, 0.038 mmol) and EDCI (6.5 mg, 0.042 mmol).
The product was obtained as a blue solid (13.3 mg, 50.8 %). 1H NMR (DMF-d7): δ 9.52-9.15 (m,
6H, Ar-H), 8.81-8.54 (m, 2H, Ar-H), 8.42-8.34 (m, 3H, Ar-H), 8.17-8.05 (m, 4H, Ar-H), 7.97-
7.88 (m, 1H, Ar-H), 7.65–7.59 (m, 2H, Ar-H), 6.70 (br, 2H, Ar-H), 4.87 – 4.85 (m, 1H, N-H),
4.42 (d, 8.0 Hz, 2H, CH2O), 4.33 (d, 5.96 Hz, 2H, CH2O), 3.58–3.46 (m, 16H, CH2O), 3.42–3.37
(m, 4H, CH2NH), 3.25–3.19 (m, 4H, CH2NH), 2.83–2.78 (m, 2H, CH2CO), 1.86–1.83 (m, 27H,
C(CH3)3), 1.40–1.36 (m, 18H, OC(CH3)3). 13
C NMR (DMF-d7): δ 172.0, 171.4, 170.42, 170,40,
169.1, 169.0, 160.6, 160.5, 160.2, 160.1, 157.1, 154,73, 154.67, 154.4, 154.2, 154.0, 153.9,
153.4, 152.9, 141.2, 139.8, 139.6, 137.5, 137.3, 136.,5, 136.2, 134.6, 128.4, 125.1, 123.35,
123.25, 122.83, 122.79, 122.0, 121.3, 121.2, 121,1, 120.73, 120.67, 119.9, 1119.8, 112.8, 111.6
(Ar-C), 78.8 (OC(CH3)3), 72.2, 72.0, 71.1, 70.04, 70.01, 71.0, 70.8, 70.5, 70.4 (CH2O), 51.2
(NHCH(CH2)CO), 42.5, 41.2, 40.2, 38.5 (CH2), 32.6 (C(CH3)3), 28.9 (OC(CH3)3). MS (MALDI-
TOF) m/z 1544.802 [M]+, calcd for C80H98N14O14Zn 1544.669. The ZnPc (13.1 mg, 8.5 mmol)
was dissolved in DCM/TFA (1:1) and stirred at 0°C for 3 h. The solvent was evaporated and the
solid treated with 2N NaOH (10 mL) to give the title product (10.2 mg, 89.7%). 1H NMR (DMF-
d7): δ 9.54-9.23 (m, 7H, Ar-H), 9.00-8.77 (m, 1H, Ar-H), 8.39-8.29 (m, 3H, Ar-H), 8.09-7.94 (m,
3H, Ar-H), 7.47 – 7.42 (m, 2H, Ar-H), 4.66 (br, 1H, NH), 4.33 (d, 7.36 Hz, 2H, CH2O), 4.33 (d,
5.16 Hz, 2H, CH2O), 3.65–3.45 (m, 8H, CH2O), 3.25–3.14 (m, 8H, CH2O), 3.08-3.02 (m, 2H,

189
CH2NH), 2.98-2.91 (m, 2H, CH2NH), 2.87-2.80 (m, 2H, CH2NH), 2.72-2.58 (m, 2H, CH2CO),
2.34 (br, 2H, NH2), 2.13 (br, 2H, NH2), 1.80–1.73 (m, 27H, C(CH3)3). 13
C NMR (DMF-d7): δ
171.9, 171.5, 170.2, 170.17, 168.95, 168.87, 160.5, 160.0, 155.5, 155.4, 155.2, 155.1, 155.0,
154.8, 154.4, 154.1, 153.9, 153.3, 141.5, 140.0, 139.9, 137.7, 136.2, 135.2, 134.9, 132.5, 129.9,
128.5, 125.2, 123.3, 122.8, 122.7, 122.3, 122.0, 120.8, 120.1, 119.8, 113.3, 112.1 (Ar-C), 72.1,
72.0, 71.4, 71.1, 70.7, 70.52, 70.46, 70.3, 70.2, 70.1 (N-CH), 51.2 (NHCH(CH2)CO), 40.6, 40.2,
40.0, 39.9, 38.0, 36.8 (CH2), 32.6 (C(CH3)3). MS (MALDI-TOF) m/z 1343.588 [M+H]+,
1365.575 [M+Na]+, 1381.546 [M+K]
+ calcd for C70H83N14O10Zn 1343.5708, C70H82NaN14O10Zn
1365.5528, C70H82KN14O10Zn 1381.5267. UV-vis (DMF): λmax (log ε) 352 (4.77), 611 (4.50),
677 (5.27) nm.
ZnPc 5.20. A procedure related to that described for ZnPc 5.4 was used: ZnPc 5.19 (20.0
mg, 0.015 mmol), DIPA (0.015 mL, 0.107 mmol), CH3I (0.2 mL) and dry DMF (0.5 mL). The
ZnPc was a blue solid (16.2 mg, 64.3%). 1H NMR (DMF-d7): δ 9.56-9.27 (m, 7H, Ar-H), 9.06-
8.83 (m, 2H, Ar-H), 8.36-8.26 (m, 4H, Ar-H), 8.13-8.06 (m, 2H, Ar-H), 7.92-7.81 (m, 1H, Ar-
H), 7.52-7.44 (m, 2H, Ar-H), 4.38 (d, 8.0Hz, 2H), 4.28 (d, 6.0Hz, 2H), 3.94-3.90 (m, 5H, NH),
3.73-3.49 (m, 24H, OCH2), 3.34-3.23 (m, 18H, N-CH3), 1.78-1.64 (m, 27H, C(CH3)3). 13
C NMR
(DMF-d7): δ 172.2, 171.5, 170.5, 169.2 (C=O), 159.9, 159.1, 155.6, 155.1, 153.8, 141.8, 140.4,
140.2, 137.9, 136.3, 135.9, 135.2, 128.1, 124.9, 123.1, 122.9, 122.8, 121.0, 120.4, 119.7, 112.7,
111.6 (Ar-C), 72.2, 72.0, 71.0, 70.9, 70.8, 70.7, 70.4 (OCH2), 66.2, 65.65, 65.60 (NHCH2), 54.4
(N-CH3), 32.6 (C(CH3)3). MS (MALDI-TOF) m/z 1413.828 [M-2I-CH3]+, calcd for
C75H93N14O10Zn+ 1413.649. UV–Vis (DMF): λmax (log ε) 350 (4.51), 610 (4.26), 677 (5.01) nm.
ZnPc 5.21. A procedure related to that described for ZnPc 5.3 was used: ZnPc 5.18 (18.4
mg, 0.017 mmol), DMF (0.5 mL), Et3N (6.2 mg, 0.061 mmol), HOBt (5.7 mg, 0.042 mmol), N-

190
Boc-ethylenediamine (6.1 mg, 0.038 mmol) and EDCI (6.5 mg, 0.042 mmol). After stirring for
for 4 days at 25 °C followed by purification, the ZnPc was obtained as a blue solid (14.3 mg,
61.6 %). 1H NMR (DMF-d7): δ 9.52-9.14 (m, 6H, Ar-H), 8.80-8.33 (m, 4H, Ar-H), 8.20-8.10 (m,
3H, Ar-H), 7.65-7.61 (m, 2H, Ar-H), 6.79-6.76 (m, 2H, Ar-H) 4.83 (br, 1H, NH), 4.43 (d, 8.24
Hz, 2H, CH2O), (d, 5.76 Hz, 2H, CH2O), 3.39–3.25 (m, 4H, CH2NH), 3.24–3.16 (m, 4H,
CH2NH), 2.82-2.77 (m, 2H, CH2CO), 1.95-1.84 (m, 27H, C(CH3)3), 1.41 (s, 18H, C(CH3)3). 13
C
NMR (DMF-d7): δ 172.1, 171.6, 170.4, 169.1, 169.0, 160.6, 160.5, 160.2, 160.1, 157.3, 157.2,
154.7, 154.4, 154.2, 154.0, 153.9, 152.9, 141.2, 139.8, 137.5, 137.3, 136.2, 134.5, 128.4, 128.23
125.0, 123.2, 122.83, 122.79, 122.0, 121.3, 121.1, 120.7, 119.9, 119.7, 112.7, 111.6 (Ar-C),
78.91, 78.87 (OC(CH3)3), 72.3, 72.0 (CH2O), 51.3 (NHCH(CH2)CO), 41.1, 40.6, 40.5, 38.8, 36.8
(CH2), 32.7 (C(CH3)3), 29.0 (OC(CH3)3). MS (MALDI-TOF) m/z 1166.471 [M-2Boc]+,
1189.475 [M-2Boc+Na]+, 1205.448 [M-2Boc+K]
+, calcd for C62H66N14O6Zn 1166.4581,
C62H66N14NaO6Zn 1189.4479, C62H66KN14O6Zn 1206.4218 respectively. The ZnPc (14.3 mg,
0.0105 mmol) was dissolved in DCM/TFA (1:1) at 0 °C for 3h. The solvent was evaporatedand
the residue treated with 2N NaOH (10 mL) to obtaiin the title compound (11.1 mg, 91.2%). 1H
NMR (THF-d8): δ 9.80-9.36 (m, 8H, Ar-H), 9.01-8.8.97 (m, 1H, Ar-H), 8.43-8.37 (m, 3H, Ar-
H), 8.00–7.81 (m, 3H, Ar-H), 7.51 – 7.42 (m, 2H, Ar-H), 4.20-3.70 (m, 4H, CH2O), 3.47–3.10
(m, 8H, CH2NH), 2.08-1.93 (m, 2H, CH2CO), 1.75–1.65 (m, 27H, C(CH3)3). 13
C NMR (DMF-
d7): δ 171.8, 171.0, 170.4, 169.8, 168.8, 161.0, 160.4, 155.4, 154.9, 154.1, 141.6, 140.0, 137.6,
136.4, 135.9, 134.9, 134.6, 128.4, 125.2, 123.3, 122.7, 121.6, 121.1, 120.7, 119.8, 112.7, 111.3
(Ar-C), 72.0, 71.5 (CH2NH), 50.8 (NHCH(CH2)CO), 41.0, 40.1, 36.7 (CH2), 32.6, 32.3
(C(CH3)3). MS (MALDI-TOF) m/z 1166.534 [M-2Boc+2H]+, calcd for C62H66N14O6Zn
1166.4581. UV-vis (DMF): λmax (log ε) 352 (4.73), 610 (4.44), 677 (5.19) nm.

191
ZnPc 5.22. A procedure related to that described for ZnPc 5.4 was used: ZnPc 5.21 (20.0
mg, 0.017 mmol), DIPA (0.015 mL, 0.107 mmol), CH3I (0.2 mL) and dry DMF (0.5 mL). After
work-up, the title compound was achieved as a blue solid (17.4 mg, 67.4%). 1H NMR (DMF-d7):
δ 9.56-9.27 (m, 7H, Ar-H), 9.04-8.92 (m, 1H, Ar-H), 8.65-8.50 (m, 3H, Ar-H), 8.39-8.31 (m, 3H,
Ar-H), 7.92-7.90 (m, 1H, Ar-H), 7.54-7.47 (m, 2H, Ar-H), 4.47-4.31 (m, 4H, OCH2), 381-3.70
(m, 8H, CH2), 3.38-3.35 (m, 18H, N-CH3), 1.79-1.74 (m, 27H, C(CH3)3). 13
C NMR (Acetone-
d6): δ 172.6, 171.8, 170.9, 169.2, 155.5, 154.8, 154.0, 153.5, 153.0, 141.8, 140.3, 140.2, 137.7,
136.4, 136.0, 129.6, 128.8, 128.3, 126.2, 125.0, 123.2, 122.8, 121.1, 120.5, 119.6, 115.0, 112.8,
111.7 (Ar-C), 72.2, 72.1, 65.6 (N-CH2), 54.0 (N-CH3), 32.6 (C(CH3)3). MS (MALDI-TOF) m/z
1194.434 [M-4CH3-2I]+, calcd for C64H70N14O6Zn
+ 1194.489. UV–Vis (DMF): λmax (log ε) 350
(4.55), 610 (4.25), 677 (4.99) nm.
Phthalonitrile 5.24. To a mixture of 3-nitrophthalonitrile 5.23 (2.0 g, 11.5 mmol) and
tert-butyl 20-hydroxy-3,6,9,12,15,18-hexaoxaicosan-1-oate (4.99 g, 12.6 mmol) in THF (15
mL), K2CO3, (5.26 g, 40 mmol) was added in six portions every 5 min. The solution was heated
at 65 C for 6 h. The solids were removed and the product purified via silica chromatography. A
mixed solvent system of DCM/methanol (199:1 → 98:2) was used for elution. The product was
obtained as a brown-yellow oil (4.70 g, 78.3%). 1H NMR (d-CDCl3, 400 MHz): δ 7.64 (d, J =
8.1 Hz, 1H, Ar-H), 7.31 (d, J = 8.2 Hz, 1H, Ar-H), 4.27 (t, J = 4.4, 2H, OCH2), 3.96 (s, 2H,
OCH2), 3.87 (t, 2H, J = 4.5, OCH2), 3.70-3.58 (m, 20H, OCH2), 1.41 (s, 9H, C(CH3)3). 13
C
NMR (CDCl3): δ 169.65 (CH2C(O)OtBu), 161.41, 134.71, 125.34, 117.55, 113.09, 104.91 (Ar-
C), 116.77, 115.41, (CN), 81.49 (C(CH3), 71.11, 70.67, 70.54, 69.72, 69.21, 68.98 (OCH2),
28.09 (C(CH3)3). MS (MALDI-TOF) m/z 545.2232 [M+H+Na]+, calcd for, C18H36NaO9,
519.2257; m/z 545.2466 [M+H]+, calcd for, C26H37N2NaO9, 545.2475.

192
ZnPc 5.25. A combination of 4-tert-butylphthalonitrile (1.32 g, 7.16 mmol),
phthalonitrile 5.24 (475.0 mg, 1.42 mmol) and zinc(II) acetate (500 mg, 2.73 mmol) was stirred
in DMAE (35 mL). The solution was heated under the flow of argon and two drops of DBN were
added. The reaction solution was heated for 5 h. The solvent was evaporated and the residue
purified on a silica column eluted by DCM/methanol (97:3). Another silica column eluted by
chloroform, and then chloroform/methanol (99:1 → 98:2) gave a blue solid (273.6 mg, 16.9%).
1H NMR (DMF-d7): δ 9.63-8.92 (m, 6H, Ar-H), 8.47-8.05 (m, 3H, Ar-H), 7.85-7.62 (m, 3H, Ar-
H), 4.95-4.88 (m, 2H, CH2O), 4.49-4.39 (m, 2H, CH2O), 4.16-4.00 (m, 3H, CH2O), 3.88-3.44
(m, 19H, CH2O), 1.88–1.82 (m, 27H, C(CH3)3), 1.45, 1.38, 1.36 (s, 9H, -OC(CH3)3). 13
CNMR
(DMF-d7): δ 170.73, 170.66 (C=O), 158.1, 157.8, 157.4, 157.3, 157.2, 154.9, 154.8, 154.7,
154.5, 154.3, 154.1, 153.8, 153.7, 141.9, 141.8, 140.1, 139.9, 139.8, 137.9, 137.5, 137.2, 136.7,
137.2, 134.0, 131.6, 131.30, 131.26, 130.5, 128.9, 128.4, 126.9, 126.7, 126.4, 123.6, 123.4,
123.3, 122.9, 120.2, 120.1, 119.8, 119.7, 118.7, 117.0, 116.3, 114.8, 114.7, 114.6, 104.6 (Ar-C),
81.73, 81.68 (-OC(CH3)3), 72.1, 71.9, 71.7, 71.5, 71.44, 71.36, 71.3, 71.2, 70.9, 70.4, 70.0, 69.9,
69.62, 69.56, 68.9 (OCH2), 52.1, 45.9, 36.8 (N-CH2), 32.8, 32.7 (Ar-C(CH3)3), 28.6 (O-
C(CH3)3). MS (MALDI-TOF) m/z 1139.675 [M+H]+, calcd for C62H75N8O9Zn 1138.495. The
protected ZnPc (273.6 mg, 0.240 mmol) was dissolved in DCM/TFA (1:1) and the solution was
stirred at 0 C for 3 h. The solvent was removed and the resulting residue treated with 2 N NaOH
(15 mL). The product was extracted using 5:1, DCM/methanol (20 mL × 4) and the organic
phase washed with water (20 mL × 2) and dried over anhydrous sodium sulfate. The solvent was
removed under reduced pressure to afford the title ZnPc as a blue solid (243.7 mg, 93.7 %).
1HNMR (DMF-d7): δ 9.59-9.11 (m, 6H, Ar-H), 8.40-8.34 (m, 3H, Ar-H), 8.19-7.70 (m, 3H, Ar-
H), 5.00-4.94 (m, 2H, CH2O), 4.60-4.43 (m, 2H, CH2O), 4.19-4.06 (m, 2H, CH2O), 3.90-3.04

193
(m, 16H, CH2O), 1.83–1.78 (m, 27H, C(CH3)3). 13
CNMR (DMF-d7): δ 170.6 (C=O), 157.5,
157.1, 156.8, 155.9, 155.3, 155.0, 154.5, 153.8, 153.6, 142.5, 140.5, 140.2, 140.0, 138.3, 137.9,
137.6, 136.2, 132.5, 131.4, 130.4, 128.9, 128.5, 128.1, 127.2, 127.0, 123.9, 123.6, 123.1, 122.8,
120.7, 120.0, 119.8, 119.7, 119.5, 116.5, 116.1, 113.9 (Ar-C), 72.5, 72.0, 71.7, 71.5, 71.3, 71.2,
71.0, 70.5, 70.2, 69.7, 69.6, 68.9, 68.6 (OCH2), 52.1, 46.2, 36.8, 36.7 (N-CH2), 32.7, 32.6 (Ar-
C(CH3)3). MS (MALDI-TOF) m/z 1083.444 [M+H]+, calcd for C58H67N8O9Zn 1083.432. UV-vis
(DMF): λmax (log ε) 345 (4.77), 613 (4.57), 681 (5.34) nm.
ZnPc 5.26. A procedure related to that described for ZnPc 5.3 was used: ZnPc 5.25 (20.0 mg,
0.018 mmol), DMF (0.4 mL), Et3N (3.3 mg, 0.032 mmol), HOBt (4.7 mg, 0.035 mmol), 1,4-bis-
Boc-triazaheptane (7.0 mg, 0.023 mmol) and EDCI (4.0 mg, 0.026 mmol). After work-up and
purification the ZnPc was achieved as a blue solid (16.1 mg, 63.6%). 1H NMR (DMF-d7): δ 9.54-
9.20 (m, 5H, Ar-H), 9.06-8.84 (m, 1H, Ar-H), 8.47-8.35 (m, 3H, Ar-H), 7.82-7.76 (m, 2H, Ar-
H), 6.76-6.70 (m, 1H, Ar-H), 4.96-4.92 (m, 2H, COCH2O), 4.58-4.44 (m, 2H, CH2O), 4.19-4.10
(m, 1H, CH2O), 4.07-3.09 (m, 1H, CH2O), 3.88-3.72 (m, 5H, CH2O), 3.60-3.43 (m, 17H, CH2O),
3.34-3.28 (m, 6H, CH2NH), 3.20-3.18 (m, 2H, CH2NH), 1.86-1.82 (m, 27H, C(CH3)3), 1.46-1.39
(m, 18H, -OC(CH3)3). 13
C NMR (DMF-d7): δ 170.7, 175.1, 156.4, 154.8, 154.0, 139.8, 137.5,
131.8, 128.5, 123.4, 119.8, 116.4, 114.9, 114.7 (Ar-C), 79.9, 78.7 (O-C(CH3)3), 72.0, 71.71,
71.66, 71.5, 71.4, 71.3, 71.2, 71.0, 70.4, 69.9 (CH2O), 48.4, 48.2, 44.3 40.1, 39.9, 38.4, 36.8 (N-
CH2), 32.6 (Ar-C(CH3)3), 29.0, 28.8 (O-C(CH3)3). MS (MALDI-TOF) m/z 1367.708 [M]+,
1207.655 [M-2tBu+K]
+; calcd for C72H93N11O12Zn 1367.630, C62H78KN11O8Zn 1207.496. The
blue solid (16.1 mg, 0.0118 mmol) was dissolved in a 1:1 mixture of DCM/TFA (6 mL) and
stirred at 0 C for 3 h. The solvent was evaporated and the residue treated with 2N NaOH (10
mL) to give a blue solid (12.5 mg, 91.0 %). 1H NMR (DMF-d7): δ 9.56-8.95 (m, 7H, Ar-H),

194
8.52-8.31 (m, 3H, Ar-H), 8.13-8.03 (m, 1H, Ar-H), 7.83-7.70 (m, 1H, Ar-H), 5.02-4.83 (m, 2H,
COCH2O), 4.59-4.35 (m, 2H, CH2O), 4.19-4.00 (m, 2H, CH2O), 3.92-3.00 (m, 22H, CH2O), 1.79
(s, 27H, C(CH3)3). 13
C NMR (DMF-d7): δ 171.2, 170.9, 170.3, 157.3, 155.0, 154.4, 154.1, 154.0,
142.2, 140.3, 140.1, 138.0, 137.7, 131.6, 129.0, 128.3, 126.9, 123.6, 123.3, 119.8, 116.5, 115.0,
114.7 (Ar-C), 71.9, 71.6, 71.4, 71.3, 71.2, 71.1, 70.8, 70.6, 70.1, 69.6 (CH2O), 49.1, 48.0, 47.5,
47.0, 46.6, 46.3, 45.9, 45.8, 44.6, 44.3, 39.6, 38.8, 36.8 (N-CH2), 32.6 (Ar-C(CH3)3). MS
(MALDI-TOF) m/z 1167.520 [M]+, calcd for C62H77N11O8Zn 1167.525. UV-vis (DMF): λmax
(log ε) 346 (4.77), 615 (4.55), 683 (5.31) nm.
ZnPc 5.27. A procedure related to that described for ZnPc 5.4 was used: ZnPc 5.26 (20.0
mg, 0.017 mmol), DIPA (0.015 mL, 0.107 mmol), CH3I (0.2 mL) and dry DMF (0.5 mL). The
title compound was obtained as a blue solid (17.4 mg, 67.4%). 1H NMR (DMF-d7): δ 9.57-9.34
(m, 6H, Ar-H), 9.13-8.99 (m, 1H, Ar-H), 8.38-8.18 (m, 3H, Ar-H), 8.20-8.09 (m, 1H, Ar-H),
7.88-7.72 (m, 1H, Ar-H), 5.03-4.94 (m, 2H, COCH2), 4.65-4.36 (m, 2H, CH2O),4.15-3.51 (m,
28H, CH2O/N-CH2/N-CH3), 3.43 (s, 9H, N-CH3), 1.83-1.79 (m, 27H, C(CH3)3). 13
C NMR
(DMF-d7): δ 171.7, 170.5 (C=O), 157.5, 157.4, 155.1, 155.0, 154.8, 154.5, 154.1, 154.0, 142.3,
142.2, 142.1, 140.4, 140.0, 138.0, 137.7, 131.7, 128.4, 126.9, 123.6, 123.3, 119.9, 119.8, 116.5,
115.0, 114.8 (Ar-C), 72.1, 72.0, 71.8, 71.7, 71.4, 71.2, 71.0, 70.7, 70.5, 70.2 (CH2O), 64.5, 54.5,
53.5, 52.5, 52.2, 51.4, 48.2 (N-CH3), 43.3, 43.2, 36.8 (N-CH2) 32.7, 32.6 (C(CH3)3). MS
(MALDI-TOF) m/z 1404.705 [M-I+2H+K]+; calcd for C67H90IKN11O8Zn
+ 1404.495. UV–Vis
(DMF): λmax (log ε) 347 (4.75), 615 (4.51), 682 (5.28) nm.
Phthalonitrile 5.29. A procedure related to that described for ZnPc 5.24 was used: 4-
nitrophthalonitrile 5.28 (2.0 g, 11.5 mmol), tert-butyl 20-hydroxy-3,6,9,12,15,18-hexaoxaicosan-
1-oate (4.99 g, 12.6 mmol), THF (15 mL) and K2CO3, (5.26 g, 40 mmol). The resulting crude

195
was purified on a silica column eluted by DCM/methanol (98:2), to give brown oil (4.87 g,
81.2%). 1H NMR (d-CDCl3, 400 MHz): δ 7.64 (d, J = 8.8 Hz, 1H, Ar-H), 7.24 (s, 1H, Ar-H),
7.18 (d, J = 8.8 Hz, 1H, Ar-H), 4.15 (t, J = 3.5, 2H, OCH2), 3.91 (s, 2H, OCH2), 3.79 (t, 2H, J =
3.7, OCH2), 3.60-3.50 (m, 20H, OCH2), 1.36 (s, 9H, C(CH3)3). 13
C NMR (CDCl3): δ 169.48
(CH2C(O)OtBu), 161.95, 135.13, 119.81, 119.56, 117.01, 106.97 (Ar-C), 115.64, 115.20, (CN),
81.30 (C(CH3), 70.71, 70.50, 70.37, 70.29, 70.05 (OCH2), 28.12 (C(CH3)3). MS (MALDI-TOF)
m/z 545.2473 [M+H+Na]+, calcd for, C26H37N2NaO9, 545.2475.
ZnPc 5.30. A mixture of 4-tert-butylphthalonitrile (385 mg, 2.09 mmol), phthalonitrile
5.29 (273.4 mg, 0.69 mmol) and zinc(II) acetate (254.7 mg, 1.4 mmol) were stirred in DMAE
(35 mL). The solution was heated under a flow of argon in the presence of DBN. The reaction
was treated as ZnPc 5.25 to give blue solid (121.6 mg, 15.5%). 1HNMR (DMF-d7): δ 9.59-8.92
(m, 7H, Ar-H), 8.47-8.35 (m, 3H, Ar-H), 7.88-7.78 (m, 2H, Ar-H), 4.74-4.58 (m, 2H, CH2O),
4.19-4.00 (m, 4H, CH2O), 3.87-3.57 (m, 18H, CH2O), 1.83–1.75 (m, 27H, C(CH3)3), 1.42- 1.38
(s, 9H, -OC(CH3)3). 13
CNMR (DMF-d7): δ 170.7 (C=O), 158.4, 158.1, 155.0, 154.9, 154.8,
154.6, 154.4, 154.2, 154.0, 142.8, 141.8, 140.0, 137.6, 133.5, 132.9, 132.5, 132.2, 131.7, 131.3,
130.4, 128.9, 128.4, 124.8, 123.9, 123.33, 123.25, 122.9, 120.8, 120.2, 119.9, 119.2, 118.9,
109.4, 107.4, 104.2 (Ar-C), 81.7 (-OC(CH3)3), 71.74, 71.69, 71.5, 71.4, 71.33, 71.30, 70.8, 70.2,
69.8, 69.61, 69.57, 69.0 (OCH2), 52.1, 47.4, 45.5, 36.8 (N-CH2), 32.6 (Ar-C(CH3)3), 28.5 (O-
C(CH3)3). MS (MALDI-TOF) m/z 1138.454 [M]+, 1082.448.454 [M-C4H9]
+, calcd for
C62H74N8O9Zn 1138.487, C58H66N8O9Zn 1082.424. The solid (113.0 mg, 0.119 mmol) was
dissolved in DCM/TFA (1:1) and stirred at 0 C for 3 hours. The solvent was evaporated and the
solid treated with 2N NaOH (10 mL) to obtain a blue solid (94.7 mg, 93.7 %) was obtained.
1HNMR (DMF-d7): δ 9.59-9.09 (m, 7H, Ar-H), 8.36-8.24 (m, 3H, Ar-H), 7.89-7.70 (m, 2H, Ar-

196
H), 4.56-4.46 (m, 2H, CH2O), 3.90-3.04 (m, 24H, CH2O), 1.83–1.78 (m, 27H, C(CH3)3).
13CNMR (DMF-d7): δ 171.8 (C=O), 159.6, 158.2, 157.9, 157.1, 155.2, 155.0, 154.9, 154.6,
154.1, 154.0, 153.8, 153.6, 142.2, 141.9, 140.2, 141.1, 140.0, 137.8, 137.6, 134.4, 133.4, 133.0,
132.5, 131.6, 131.4 130.8, 130.4, 128.9, 128.4, 128.3, 128.1, 128.0, 126.3, 124.7, 124.6, 123.9,
123.2, 122.8, 120.7, 120.0, 119.9, 119.8, 119.1, 115.0, 107.5, 107.4, 107.2 (Ar-C), 71.7, 71.6,
71.5, 71.4, 71.3, 71.2, 71.0, 70.7, 70.5, 70.1, 69.8, 69.5, 68.9 (OCH2), 52.1, 47.4, 46.1, 40.9,
36.8, 36.5 (N-CH2), 32.6 (Ar-C(CH3)3). MS (MALDI-TOF) m/z 1083.428 [M+H]+, calcd for
C58H67N8O9Zn 1083.432. UV-vis (DMF): λmax (log ε) 351 (4.65), 609 (4.38), 676 (5.14) nm.
ZnPc 5.31. A procedure related to that described for ZnPc 5.3 was used: ZnPc 5.30 (20.0
mg, 0.018 mmol), DMF (0.4 mL), Et3N (3.2 mg, 0.032 mmol), HOBt (4.7 mg, 0.035 mmol), 1,4-
bis-Boc-triazaheptane (7.0 mg, 0.023 mmol), and EDCI (4.0 mg, 0.026 mmol). The ZnPc was
obtained as a blue solid (17.1 mg, 65.6%). 1H NMR (DMF-d7): δ 9.58-9.52 (m, 3H, Ar-H), 9.46-
9.22 (m, 4H, Ar-H), 8.96-8.88 (m, 1H, Ar-H), 8.45-8.38 (m, 3H, Ar-H), 7.82-7.76 (m, 2H, Ar-
H), 6.76-6.70 (m, 1H, Ar-H), 4.73-4.70 (m, 2H, COCH2O), 4.49-4.44 (m, 2H, CH2O), 3.89-3.82
(m, 4H, CH2O), 3.77-3.72 (m, 2H, CH2O), 3.69-3.58 (m, 14H, CH2O), 3.35-3.28 (m, 6H,
CH2NH), 3.20-3.18 (m, 2H, CH2NH), 1.82-1.80 (m, 27H, C(CH3)3), 1.45-1.36 (m, 18H, -
OC(CH3)3). 13
CNMR (DMF-d7): δ 170.7, 162.2, 157.1, 156.5, 154.9, 154.8, 154.7, 154.3, 154.2,
141.7, 139.9, 137.5, 133.4, 132.8, 132.1, 131.4, 130.4, 128.4, 123.4, 120.8, 119.9, 119.8, 119.2,
115.0, 113.3, 107.4, 107.2 (Ar-C), 79.9, 78.7 (O-C(CH3)3), 71.74, 71.68, 71.51, 71.48, 71.41,
71.37, 71.34, 71.30, 71.1, 70.8, 69.6 (OCH2), 48.4, 48.2, 48.0, 47.6, 47.4, 46.1 40.9, 40.1, 39.9,
38.4, 36.8 (N-CH2), 32.6 (Ar-C(CH3)3), 29.0, 28.8 (O-C(CH3)3). MS (MALDI-TOF) m/z
1267.606 [M-tBu]
+, calcd for C67H85N11O10Zn 1267.577. The solid (17.1 mg, 0.013 mmol) was
dissolved in DCM/TFA (1:1) and stirred at 0 C for 3 h. The solvent was evaporated and the

197
residue treated with 2N NaOH (10 mL) to give a blue solid (13.5 mg, 92.8 %). 1H NMR (DMF-
d7): δ 9.60-9.25 (m, 7H, Ar-H), 9.15-8.91 (m, 1H, Ar-H), 8.52-8.31 (m, 3H, Ar-H), 7.89-7.73 (m,
1H, Ar-H), 4.74-4.63 (m, 2H, COCH2O), 4.19-4.05 (m, 3H, CH2O), 3.92-3.45 (m, 29H, CH2O),
3.29-3.10 (m, 6H, CH2NH) 1.80 (s, 27H, C(CH3)3). 13
C NMR (DMF-d7): δ 171.6, 162.1, 160.2,
159.7, 155.0, 154.6, 154.4, 154.1, 153.9, 141.9, 140.1, 137.7, 133.1, 128.2, 124.7, 123.3, 119.8,
119.1, 107.2 (Ar-C), 71.72, 71.67, 71.6, 71.4, 71.3, 71.2, 71.0, 70.7, 69.6 (OCH2), 49.0, 46.5,
38.4, 37.4, 36.7 (N-CH2), 32.6 (Ar-C(CH3)3). MS (MALDI-TOF) m/z 1167.531 [M]+, calcd for
C62H77N11O8Zn 1167.525. UV-vis (DMF): λmax (log ε) 352 (4.90), 611 (4.61), 678 (5.35) nm.
ZnPc 5.32. A procedure related to that described for ZnPc 5.4 was used: ZnPc 5.31 (20.0
mg, 0.017 mmol), DIPA (0.015 mL, 0.107 mmol), CH3I (0.2 mL) and dry DMF (0.5 mL). A blue
solid was obtained (16.2 mg, 62.8%). 1H NMR (DMF-d7): δ 9.57-9.34 (m, 7H, Ar-H), 9.03-8.99
(m, 1H, Ar-H), 8.38-8.18 (m, 4H, Ar-H), 7.84-7.82 (m, 1H, N-H), 4.80-4.70 (m, 2H, COCH2),
4.35 (br, 2H, CH2O),4.15-3.51 (m, 28H, CH2O/N-CH2/N-CH3), 3.37 (s, 9H, N-CH3), 1.85-1.79
(m, 27H, C(CH3)3). 13
C NMR (DMF-d7): δ 171.7 (C=O), 162.0, 155.0, 154.5, 154.3, 153.9,
151.2, 142.1, 140.2, 137.7, 133.2, 128.3, 128.1, 124.6, 123.2, 119.7, 119.0, 107.5, 107.3, 107.1
(Ar-C), 71.8, 71.7, 71.4, 71.3, 71.2, 71.1, 71.0, 70.7, 69.6 (CH2O), 64.3, 58.6, 57.2, 55.9, 54.3,
52.4, 47.9 (N-CH3), 43.2, 36.7 (N-CH2) 32.6 (C(CH3)3). MS (MALDI-TOF) m/z 1493.721 [M]+,
1404.681 [M-I-H+K]+; calcd for C67H89I2N11O8Zn
+ 1493.428, C67H88IKN11O8Zn
+ 1404.479.
UV–Vis (DMF): λmax (log ε) 351 (4.81), 610 (4.50), 677 (5.26) nm.
5.4.2. Syntheses of Pcs and Their AntiCEA Bioconjugates
tert-Butyl-12-iodo-4,7,10-trioxadodecanoate. A slurry of p-TsCl (0.38 g, 2.0 mmol) and
pyridine (0.35 mL) was mechanically stirred in a three-neck, N2 flushed flask. The temperature
was maintained at 5 °C (ice-cold water bath), while tert-Butyl-12-hydroxy-4,7,10-

198
trioxadodecanoate (0.5 g, 1.8 mmol) was slowly added from an addition funnel. After the
addition was complete, the mixture was stirred for 15 minutes. The mixture was poured into ice-
cold water (10 mL) and washed with DCM (10 mL). The organic layer was washed with ice-cold
6N HCl (3 × 5 mL) and reduced to minimum under reduced pressure. The tosylate obtained was
used without further purification.32
To a solution of the above tosylate (700.0 mg, 1.62 mmol) in
dry acetone (10 mL) was added NaI (300.0 mg, 2.0 mmol) and the reaction heated (65 °C) for 20
h. On cooling to room temperature, the reaction mixture was filtered under vacuum and washed
with acetone. The filtrate was concentrated and the residue dissolved in 20.0 mL of DCM. The
solution was successively washed with 1N sodium thiosulfate solution and brine, and dried over
anhydrous sodium sulfate. The solvent was removed under vacuum and the product obtained as a
light yellow oil (623.8 mg, 99.2 %).9
Phthalonitrile 5.33. A mixture of 4-nitrophthalonitrile (1 g, 5.8 mmol) and 4-
aminophenol (0.7 g, 6.4 mmol) was dissolved in DMF (15 mL) and heated to 63°C. Potassium
carbonate, K2CO3 (2.63 g, 20 mmol) was added into solution in six portions after every five
minutes. The reaction mixture was stirred 4 h under argon at the same temperature. It was left to
cool to room temperature and poured into ice-cold water (500 mL). This was then filtered and
the crude product (brown) purified using a silica column eluted with DCM/methanol (98:2). The
solvent was removed to give a yellow solid (1.0 g, 73.3%), mp 130 - 131°C. 1H NMR (d-
CD2Cl2, 400 MHz): δ 7.70 (d, J = 8.6 Hz, 1H, Ar-H), 7.23 (t, J = 8.8 Hz, 2H, Ar-H), 6.87 (d, J =
7.8 Hz, 2H, Ar-H), 6.73 (d, J = 7.8, 2H, H-Ar), 3.86 (br, 2H, NH2). 13
C NMR (d-CDCl3, 100
MHz): δ 162.89, 145.32, 144.96, 135.36, 121.71, 120.98, 120.82, 117.31, 116.16, 115.84,
115.40, 107.96 (Ar-C, CN). MS (MALDI-TOF) m/z 236.0813 [M+H]+, calcd for, C14H9N3O,
23.0818.

199
Phthalonitrile 5.34. A mixture of Pn 5.33 (0.5 g, 2.13 mmol) and 1,4-dioxane-2,6-dione
(0.275 g, 2.37 mmol) was dissolved in DMF (1.5 mL) and stirred overnight at 25 °C. Then water
(5.0 mL) was added to the solution to precipitate the product. The solid was centrifuged and
washed with water and hexane. The solid was dried under vacuum for 2 days to afford the pure
yellow solid (688.7 mg, 92.1%), mp 176 – 177 °C). 1H NMR (CD3COCD3, 400 MHz): δ 9.68
(br, 1H, NH), 8.01 (d, J = 8.76 Hz, 1H, Ar-H), 7.86 (d, J = 9.00 Hz, 2H, Ar-H), 7.60 (d, J = 2.52
Hz, 1H, Ar-H), 7.42 (dd, J = 2.60 Hz, 1H, Ar-H), 7.20 (d, J = 9.00 Hz, 2H, Ar-H), 4.37 (s, 2H,
CH2O), 4.27 (s, 2H, CH2O). 13
C NMR (CD3COCD3, 100 MHz): δ 172.4, 168.8 (CO), 163.0,
150.6, 137.3, 136.9, 122.8, 122.5, 122.3, 122.0, 118.3, 109.5 (Ar-H), 116.5, 116.1 (CN), 72.5,
69.7 (CH2O). MS (MALDI-TOF) m/z 352.0800 [M+H]+, calcd for, C18H14N3O5, 352.0933.
Phthalonitrile 5.35. Phthalonitrile 5.34 (0.25 g, 0.712 mmol) was dissolved in DMF (8
mL). Et3N (90 mg, 0.912 mmol, 122.4 µL, 1 h), HOBt (102.4 mg, 0.757 mmol, 2 h) and tert-
butyl-12-amino-4,7,10-trioxadodecanoate (240.3 mg, 0.868 mmol) were added to the reaction
solution and the solution was stirred for 20 min. EDCI (117.9 mg, 0.757 mmol) was added to the
reaction solution in one portion. The reaction solution was stirred for 3 days at 25 °C. The
reaction solution was diluted using ethyl acetate (20 mL) and the organic solution washed
subsequently with water (30 mL × 2). The organic layer was dried over anhydrous sodium
sulfate. The solvent was evaporated and the crude was purified by silica column eluted by
DCM/chloroform (4:1), and then DCM/methanol (98:2) to afford yellowish oil (400.6 mg,
92.2%). 1H NMR (CD3COCD3, 400 MHz): δ 10.10 (br, 1H, NH), 8.02 (d, J = 8.76 Hz, 1H, Ar-
H), 7.88 (d, J = 8.96 Hz, 2H, Ar-H), 7.59 (d, J = 2.52 Hz, 1H, Ar-H), 7.44 – 7.40 (m, 1H, Ar-H),
7.19 (d, J = 8.96 Hz, 2H, Ar-H), 4.21 (d, J = 3.24, 2H, CH2O), 3.65 (t, J = 6.36, 2H, CH2O), 3.57
– 3.53 (m, 10H, CH2O), 3.45 (t, J = 5.52, 2H, CH2O), 2.43 (d, J = 6.32, 2H, CH2O), 1.42 (s, 9H,

200
C(CH3)3). 13
C NMR (CD3COCD3, 100 MHz): δ 171.3, 170.3, 168.7 (C=O), 163.0, 150.6, 137.6,
136.9, 128.2, 125.4, 122.8, 122.5, 122.4, 122.0, 120.1, 118.3, 110.3, 109.5 (Ar-H), 116.5, 116.1
(CN), 80.5 (CO), 72.6, 72.2, 71.1, 71.0, 70.2, 67.6 (CH2O), 39.6, 37.0 (CH2), 28.3 (C(CH3)3).
MS (MALDI-TOF) m/z 633.2551 [M+Na]+, calcd for C31H38N4NaO9 610.2536.
ZnPc 5.37. A mixture of 5.36 (1002.39 mg, 3.0 mmol), phthalonitrile 5.35 (610.26 mg,
1.0 mmol) and zinc acetate (254.7 mg, 1.4 mmol) were mixed together in DMAE (10.0 mL). The
solution was heated under the flow of argon, and two drops of DBN were added to the reaction
solution. The reaction solution was further heateed at 135 °C for 5 hours. After the reaction, the
solvent was removed under vacuum. The residue was purified by column chromatography
(neutral alumina, 10 cm, loaded by chloroform) with the elution of mixed solvents of
chloroform/DCM (95:5). A second column (sephadex G-100) eluted by DCM gave the title
compound as a green solid, dried at 85 °C under vacuum overnight (50.8 mg, 10.1%). 1H NMR
(d-DMF, 400 MHz): δ 9.25 – 8.83 (m, 9H, Ar-H), 8.25 – 8.22 (m, 1H, Ar-H), 7.89 – 7.54 (m,
3H, Ar-H), 4.34 (s, 2H, OCH2), 4.26 (s, 2H, OCH2), 3.65 – 3.57 (m, 12H, OCH2), 3.40 – 3.37
(m, 4H, OCH2), 3.03 – 2.99 (m, 12H, SCH2), 2.69 – 2.65 (m, 2H, CH2), 2.56 – 2.45 (m, 36H,
NCH2), 2.33 – 2.29 (m, 12H, NCH2), 1.43 – 1.41 (m, 9H, Boc- C(CH3)3). MS (MALDI-TOF)
m/z peak at 1621.551 (M-tBu+H)+, calcd for C75H96N16O9S6Zn 1621.519. UV-vis (DMF): λmax
(log ε) 371 (4.70), 631 (4.38), 701 (5.09) nm.
ZnPc 5.38 (40 mg, 0.0239 mmol) was then dissolved and stirred in DCM (1 mL) and
CH3I (2 mL) at 25 °C for 48 h. The solvent was removed under reduced pressure. The residue
was washed with hexanes several times. The residue was purified on C18 column (40-75 µm)
eluted by methanol/water (40:60 → 100:0) to give a green solid (20.3 mg, 33.7%). 1H NMR
(DMF-d7, 400 MHz): δ 9.56 – 9.28 (m, 6H, Ar-H), 8.37 – 8.32 (m, 1H, Ar-H), 7.95 – 7.81 (m,

201
4H, Ar-H), 7.55 – 7.51 (m, 2H, Ar-H), 4.39 – 4.20 (m, 24H, OCH2/NCH3), 4.26 (s, 4H, OCH2),
3.68 – 3.57 (m, 68H, OCH2/NCH3), 2.48 – 2.45 (m, 2H, CH2), 1.46 – 1.41 (m, 9H, Boc-
C(CH3)3). UV-vis (DMF): λmax (log ε) 376 (4.68), 625 (4.31), 696 (5.04) nm.
ZnPc 5.39. The Pc 5.38 was dissolved in a mixture of DCM/TFA (3 mL/3 mL) and the
solution was stirred at 0 C for 4 h. After the reaction, the solvent was removed using nitrogen
gas. The resulting residue was dissolved in acetone, cold ethyl ether added to precipitate the
product and then centrifuged to afford green solid in quantitative yield. 1H NMR (DMSO-d6, 400
MHz): δ 9.51 – 9.35 (m, 6H, Ar-H), 8.37 – 8.32 (m, 1H, Ar-H), 8.10 – 7.96 (m, 4H, Ar-H), 7.54
– 7.51 (m, 2H, Ar-H), 4.39 – 4.25 (m, 24H, OCH2/NCH3), 3.81 (s, 4H, OCH2), 3.72 – 3.57 (m,
68H, OCH2/NCH3), 2.55 – 2.52 (m, 2H, CH2). UV-vis (DMF): λmax (log ε) 378 (4.58), 625
(4.22), 696 (4.94) nm.
ZnPc 5.40. The monoclonal antibody was reconstituted at 2 mg/mL in 0.1 M NaHCO3
solution. Pc 5.39 (1 mg, 0.0005 mmol) was dissolved in DMSO (50 µL). DIEA (0.078 mg, 0.006
mmol), HOBt (0.34 mg, 0.002 mmol) and TBTU (0.59 mg, 0.002 mmol) were added to the
DMSO solvent and the reaction solution was stirred for 2 min. The reconstituted monoclonal
antibody solution (500 µL) was added into the activated phthalocyanine solution and the
combined solution was kept with shaking frequently at 25 °C for 1 hour. Then the solution was
kept at 4 C overnight. The crude antibody-Pc conjugate solution was purified by spin column
chromatography (50 µL for each spin column to load, 750 rcf, 1 min, 24 C). The resulting
solution was combined together to afford the blue conjugate solution (600 µL).
ZnPc 5.43. A mixture of phthalonitrile 5.42 (75.0 mg, 0.24 mmol), phthalonitrile (885.0
mg, 6.60 mmol), and zinc acetate (348.6 mg, 1.9 mmol) were mixed together in DMAE (10.0
mL). The solution was heated at 140 °C under the flow of argon, and one drop of DBN was

202
added to the reaction solution. The reaction solution was further heated at 140 °C for 5 hours.
After the reaction, the solvent was removed under vacuum. The residue was filtered under
gravity and purified by silica column chromatography with the elution of DCM/THF (3:1). The
product was eluted by acetone and concentrated to give a blue-green solid. Another silica column
eluted by DCM/ethyl acetate (1:2) gave the product as a green solid (17.8 mg, 9.8%). 1H NMR
(DMF-d7): δ 9.32 - 9.02 (m, 6H, Ar-H), 8.29-8.12 (m, 6H, Ar-H), 7.82-7.42 (m, 2H, Ar-H), 6.99
(br, 1H, OH), 5.11-4.97 (m, 2H, OCH2), 4.45-4.42 (m, 2H, OCH2), 4.12 (t, J = 4.76, 2H, OCH2),
3.68 (t, J = 3.52, 2H, OCH2), 3.48 (t, J = 4.68, 2H, OCH2), 3.30-3.27 (s, 3H, OCH3). 13
C NMR
(DMF-d7, 100 MHz): δ 154.4, 153.9, 152.9, 150.7, 139.3, 138.0, 130.3, 130.2, 129.4, 126.7,
123.8, 123.5, 123.4, 123.2, 123.0, 119.7, 117.7 (Ar-C), 72.9, 72.1, 71.7, 71.4 (OCH2), 59.1
(OCH3). MS (MALDI-TOF) m/z peak at 755.225 (M+H)+, calcd for C39H31N8O5Zn 755.171.
UV-vis (DMF): λmax (log ε) 342 (4.71), 628 (4.49), 694 (5.19) nm.
ZnPc 5.44. A mixture of Pc 5.43 (9.0 mg, 0.012 mmol) and tert-Butyl-12-iodo-4,7,10-
trioxadodecanoate (6.6 mg, 0.017 mmol) were mixed together in DMF (5.0 mL). The solution
was heated at 70 °C, and K2CO3 (25.0 mg, 1.8 mmol) was added to the reaction solution. The
reaction solution was heated for 5-6 hours. After the reaction, the solvent was removed under
reduced pressure. The residue was dissolved in ethyl acetate (10 mL), washed with water (10
mL) and dried to obtain a blue solid. The solid was purified by column chromatography with the
elution of DCM/methanol (95:5) to give a blue solid (9.2 mg, 76.7 %). 1
H NMR (DMF-d7): δ
9.40-9.35 (m, 6H, Ar-H), 8.26-8.20 (m, 6H, Ar-H), 7.62 (s, 2H, Ar-H), 4.94 (t, J = 4.52, 4H,
OCH2), 4.46 (t, J = 4.56, 4H, OCH2), 4.10 (t, J = 4.28, 4H, OCH2), 3.84-3.81 (m, 4H, OCH2),
3.67-3.62 (m, 6H, OCH2), 3.58-3.54 (m, 4H, OCH2), 3.24 (s, 3H, OCH3), 2.42 (t, J = 6.24, 2H,
CH2), 1.39 (s, 9H, tBu-C(CH3)3).
13C NMR (DMF-d7): δ 171.7 (C=O), 154.5, 154.3, 153.8,

203
151.55, 151.8, 139.9, 139.6, 130.3, 130.2, 128.7, 128.4, 123.9, 123.4, 117.3 (Ar-C), 80.8 (C=O),
72.8, 72.0, 71.6, 71.4, 71.3, 71.2, 70.8, 67.7 (OCH2), 59.0 (OCH3), 37.2 (CH2), 28.5 (C(CH3)3).
MS (MALDI-TOF) m/z peak at 1015.376 (M+H)+, 959.318 (M-
tBu+H)
+, calcd for
C52H55N8O10Zn 1014.325, C48H47N8O10Zn 959.271. The above product (9.2 mg, 9.1 mmol) was
subjected to DCM/TFA (1:1, 5 mL) treatment for 4 h to remove the tert-butyl protecting group.
After the reaction, the solvent was removed under reduced pressure (at 65 °C). The residue was
dissolved in DCM (1.0 mL), treated with cold diethyl ether (10 mL) and centrifuged to obtain a
blue solid. The solid was dried under vacuum for two days to give a blue solid (8.5 mg, 97.7 %).
1H NMR (DMF-d7): δ 9.39 (s, 6H, Ar-H), 8.23(s, 6H, Ar-H), 7.62 (s, 2H, Ar-H), 4.96 (br, 4H,
OCH2), 4.47 (s, 4H, OCH2), 4.10 (t, J = 4.72, 4H, OCH2), 3.85-3.81 (m, 4H, OCH2), 3.76-3.62
(m, 6H, OCH2), 3.60-3.56 (m, 2H, OCH2), 3.47-3.44 (m, 2H, OCH2), 3.24 (s, 3H, OCH3), 2.54
(t, J = 6.28, 2H, CH2). 13
C NMR (DMF-d7): δ 173.7 (C=O), 154.4, 139.8, 139.6, 130.2, 123.8,
123.5, 117.2 (Ar-C), 83.5 (C=O), 73.5, 72.8, 71.92, 71.89, 71.63, 71.61, 71.5, 71.4, 71.3, 71.2,
70.7, 67.7, 66.6 (OCH2), 59.0 (OCH3), 51.9 (CH2). MS (MALDI-TOF) m/z peak at 959.449
(M+H)+, 981.441 (M+Na)
+; calcd for C48H47N8O10Zn 959.271, C48H47N8NaO10Zn 981.253.
UV-vis (DMF): λmax (log ε) 335 (4.57), 619 (4.42), 688 (5.18) nm.
ZnPc 5.45. The monoclonal antibody was reconstituted at 2 mg/mL in 0.1 M NaHCO3
solution. Pc 5.44 (1 mg, 0.001 mmol) was dissolved in DMSO (50 µL). DIEA (0.078 mg, 0.006
mmol. 1.1 µL), HOBt (0.34 mg, 0.002 mmol) and TBTU (0.59 mg, 0.002 mmol) were added to
the DMSO solvent. The reaction solution was stirred for 2 h and added the monoclonal antiCEA
as described for conjugate 5.40 above. The crude antibody-Pc conjugate solution was purified by
spin column chromatography (50 µL for each spin column to load, 750 rcf (3000 rpm), 1 min, 24
C). The resulting solution was combined to afford the blue conjugate solution (600 µL).

204
ZnPc 5.47. The monoclonal antibody was reconstituted at 2 mg/mL in 0.1 M NaHCO3
solution. Pc 5.46 (1 mg, 0.001 mmol) was dissolved in DMSO (50 µL). DIEA (0.078 mg, 0.006
mmol. 1.1 µL), HOBt (0.34 mg, 0.002 mmol) and TBTU (0.59 mg, 0.002 mmol) were added to
the DMSO solvent. The reaction solution was stirred for 2 h and added the monoclonal antiCEA
as described for conjugate 5.40 above. The crude antibody-Pc conjugate solution was purified by
spin column chromatography (50 µL for each spin column to load, 750 rcf (8000 rpm), 1 min, 24
C). The resulting solution was combined to afford the blue conjugate solution (700 µL).
5.4.3. Cell Studies
The human carcinoma HEp2 cells used in this study were kept in a 50:50 mixture of
DMEM:AMEM (Invitrogen) complemented with 5% FBS (Invitrogen), Primocin antibiotic
(Invitrogen) and 5% CO2 at 37 oC. To sustain subconfluent stocks, the cells had to be subcultured
twice weekly. The cells used in all the studies were from the 4th to 15
th passage.
Time-Dependent Cellular Uptake: The incubation of the human carcinoma HEp2 cells
involved 7500 cells per well in a Costar 96-well plate and permitted to grow for 48 h. Each ZnPc
stock solution was prepared in DMSO at 32 mM and then diluted to 20 µM in medium (a 2X
stock). Finally, a concentration of 10 µM with a maximum DMSO concentration of 1% was
achieved via dilution into the 96-well plate. The cellular uptake was permitted to go on for 0, 1,
2, 4, 8, 12 and 24 h, after which it was halted. This was achieved by removing the loading
medium and washing the wells with PBS. The concentration of each compound was obtained
using standard curves via intrinsic fluorescence. The fluorescence was measured using a BMG
FLUOstar plate reader with a 355 nm excitation and a 650 nm emission filter. The cells were
measured and their uptake expressed in nM compound concentration per unit cell, following a
CyQuant cell proliferation assay (Invitrogen).

205
Dark Cytotoxicity: The plating of HEp2 cells was achieved as described above. The ZnPcs
were diluted to a final concentration of 400 µM in medium. Two-fold serial dilutions to 50 µM
were prepared and the cells were incubated overnight. The cell toxicity was calculated using
Promega’s Cell Titer Blue Viability assay according to the manufacturer’s directions. Cells that
were not treated were considered 100% viable, while those treated with 0.2% saponin were
considered to be nonviable (0% viability). The dose-response curves were used to calculate IC50
values for each ZnPc.
Phototoxicity: The plating of HEp2 cells was achieved as described above. The ZnPc
concentrations ranged between 6.25-100 µM. Following overnight loading, 50 mM HEPES pH
7.2 replaced the initial medium. A NewPort light system with a 175 W halogen lamp was used
to irradiate the cells for 20 min. The light was filtered through a water filter to provide
approximately 1.5 J/cm2 light dose required. The culture was kept on a 5
oC Echotherm
chilling/heating plate (Torrey Pines Scientific, Inc.) to keep the cells cool. Subsequent to the
light exposure, the plate was incubated overnight and the cell viability calculated as described for
the dark cytotoxicity.
Microscopy: The incubation of the cells was done in a glass bottom 6-well plate (MatTek)
and permitted to grow for 48 h. The cells were then exposed to 10 µM of each ZnPc for 6 h.
Tracers for different organelles were used at the shown concentrations: LysoSensor Green 50
nM, MitoTracker Green 250 nM, ER Tracker Blue/white 100 nM, and BODIPY FL C5 ceramide
1 µM. The cells were incubated concurrently with ZnPcs and then diluted with tracers for 30 min
before washing them 3 times using PBS. A Leica DMRXA microscope with a 40× NA 0.8dip
objective lens and DAPI, GFP and Texas Red filter cubes (Chroma Technologies) was used to
acquire microscopy images as described in Chapter 2.
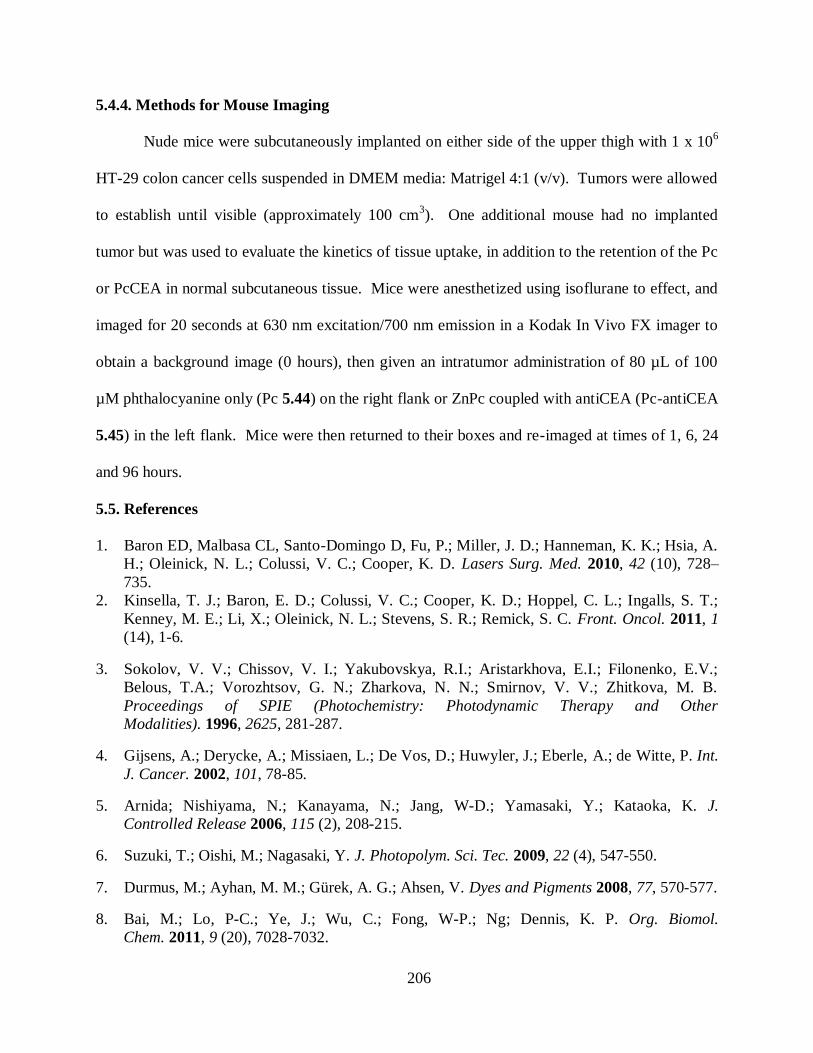
206
5.4.4. Methods for Mouse Imaging
Nude mice were subcutaneously implanted on either side of the upper thigh with 1 x 10⁶
HT-29 colon cancer cells suspended in DMEM media: Matrigel 4:1 (v/v). Tumors were allowed
to establish until visible (approximately 100 cm3). One additional mouse had no implanted
tumor but was used to evaluate the kinetics of tissue uptake, in addition to the retention of the Pc
or PcCEA in normal subcutaneous tissue. Mice were anesthetized using isoflurane to effect, and
imaged for 20 seconds at 630 nm excitation/700 nm emission in a Kodak In Vivo FX imager to
obtain a background image (0 hours), then given an intratumor administration of 80 µL of 100
µM phthalocyanine only (Pc 5.44) on the right flank or ZnPc coupled with antiCEA (Pc-antiCEA
5.45) in the left flank. Mice were then returned to their boxes and re-imaged at times of 1, 6, 24
and 96 hours.
5.5. References
1. Baron ED, Malbasa CL, Santo-Domingo D, Fu, P.; Miller, J. D.; Hanneman, K. K.; Hsia, A.
H.; Oleinick, N. L.; Colussi, V. C.; Cooper, K. D. Lasers Surg. Med. 2010, 42 (10), 728–
735.
2. Kinsella, T. J.; Baron, E. D.; Colussi, V. C.; Cooper, K. D.; Hoppel, C. L.; Ingalls, S. T.;
Kenney, M. E.; Li, X.; Oleinick, N. L.; Stevens, S. R.; Remick, S. C. Front. Oncol. 2011, 1
(14), 1-6.
3. Sokolov, V. V.; Chissov, V. I.; Yakubovskya, R.I.; Aristarkhova, E.I.; Filonenko, E.V.;
Belous, T.A.; Vorozhtsov, G. N.; Zharkova, N. N.; Smirnov, V. V.; Zhitkova, M. B.
Proceedings of SPIE (Photochemistry: Photodynamic Therapy and Other
Modalities). 1996, 2625, 281-287.
4. Gijsens, A.; Derycke, A.; Missiaen, L.; De Vos, D.; Huwyler, J.; Eberle, A.; de Witte, P. Int.
J. Cancer. 2002, 101, 78-85.
5. Arnida; Nishiyama, N.; Kanayama, N.; Jang, W-D.; Yamasaki, Y.; Kataoka, K. J.
Controlled Release 2006, 115 (2), 208-215.
6. Suzuki, T.; Oishi, M.; Nagasaki, Y. J. Photopolym. Sci. Tec. 2009, 22 (4), 547-550.
7. Durmus, M.; Ayhan, M. M.; Gürek, A. G.; Ahsen, V. Dyes and Pigments 2008, 77, 570-577.
8. Bai, M.; Lo, P-C.; Ye, J.; Wu, C.; Fong, W-P.; Ng; Dennis, K. P. Org. Biomol.
Chem. 2011, 9 (20), 7028-7032.

207
9. Li, H.; Fronczek, F. R.; Vicente, M. G. H. Tetra. Lett. 2011, 52, 6675-6678.
10. Hamblin, M. R.; Miller, J. L.; Rizvi, I.; Loew, H. G.; Hasan, T. Br. J. Cancer 2003, 89, 937-
943.
11. Rovers, J. P.; Saarnak, A. E.; de Jode, M.; Sterenborg, H. J.; Terpstra, O. T.; Grahn, M. F.
Photochem. Photobiol. 2000, 71, 211-217.
12. Krueger, T.; Altermatt, H. J.; Mettler, D.; Scholl, B.; Magnusson, L.; Ris, H. B. Lasers Surg.
Med. 2003, 32, 61-68.
13. Fang, J.; Sawa, T.; Akaike, T.; Greish, K.; Maeda, H. Int. J. Cancer 2004, 109, 1-8.
14. Savellano, M. D.; Hasan, T. Photochem. Photobiol. 2003, 77, 431-439.
15. Ichikawa, K.; Hikita, T.; Maeda, N.; Takeuchi, Y.; Namba, Y.; Oku, N. Biol. Pharm. Bull.
2004, 27, 443-444.
16. Wöhrle, D.; Iskander, N.; Graschew, G.; Sinn, H.; Friedrich, E. A.; Maier-Borst, W.; Stern,
J.; Schlag, P. Photochem. Photobiol. 1990, 51, 351-356.
17. Ball, D. J.; Mayhew, S.; Wood, S. R.; Griffiths, J.; Vernon, D. I.; Brown, S. B. Photochem.
Photobiol. 1999, 69, 390–396.
18. Duan, W.; Lo, P-C.; Duan, L.; Fong, W-P.; Ng; Dennis, K. P. Bioorg. Med. Chem. 2010, 18,
2672-2677.
19. Dummin, H.; Cernay, T.; Zimmermann, H. W. J. Photochem. Photobiol. B: Biol. 1997, 37,
219-229.
20. Li, H.; Jensen, T. J.; Fronczek, F. R.; Vicente, M. G. H. J. Med. Chem. 2008, 51 (3), 502-
511.
21. Marino, J.; Garcia, M. C. V.; Dicelio, L. E.; Roguin, L. P.; Awruch, J. Eur. J. Med. Chem.
2010, 45 (9), 4129-4139.
22. Chen, Z.; Zhou, S.; Chen, J.; Deng, Y.; Luo, Z.; Chen, H.; Hamblin, M. R.; Huang, M.
Chem. Med. Chem. 2010, 5 (6), 890-898.
23. Durmus, M.; Ahsen, V. J. Inorg. Biochem. 2010, 104 (3), 297-309.
24. Minnock, A.; Vernon, D. I.; Schofield, J.; Griffiths, J.; Parish, J. H.; Brown, S. B. J.
Photochem. Photobiol. B: Biol. 1996, 32, 159-164.
25. Mantareva, V.; Kussovski, V.; Angelov, I.; Wohrle, D.; Dimitrov, R.; Popova, E.; Dimitrov,
S. Photochem. Photobiol. Sci. 2011, 10, 91-102.
26. Tempesti, T. C.; Alvarez, M. G.; Durantini, E. N. Dyes and Pigments 2011, 91, 6-12.
27. Ongarora, B. G.; Hu, X.; Verberne-Sutton, D.; Garno, J. C.; Vicente, M. G. J. Theranostics
2012, 2 (9), 850-870.

208
28. Sibrian-Vazquez, M.; Jensen, T. J.; Vicente, M. G. H. J. Photochem. Photobiol B: Biol.
2007, 86, 9-21.
29. Sehgal, I.; Sibrian-Vazquez, M.; Vicente, M. G. H. J. Med. Chem. 2008, 51, 6014-6020.
30. Warnecke, A.; Kratz, F. Bioconj. Chem. 2003, 14, 377-387.
31. Hofman, J-W.; van Zeeland, F.; Turker, S.; Talsma, H.; Lambrechts, S. A. G.; Sakharov, D.
V.; Hennink, W. E.; van Nostrum, C. F. J. Med. Chem. 2007, 50, 1485-1494.
32. Zorlu, Y.; Dumoulin, F.; Durmuş, M.; Ahsen, V. Tetrahedron 2010, 66 (17), 3248-3258.
33. Masilela, N.; Nyokong, T. Dyes and Pigments 2010, 84 (3), 242-248.
34. Jensen, T. J.; Vicente, M. G. H.; Luguya, R.; Norton, J.; Fronczek, F. R.; Smith, K. M. J.
Photochem. Photobiol. B: Biol. 2010, 100 (2), 100-111.
35. Kessel, D.; Luguya, R.; Vicente, M. G. H. Photochem. Photobiol. 2003, 78, 431-435.
36. Sibrian-Vazquez, M.; Jensen, T. J.; Fronczek, F. R.; Hammer, R. P.; Vicente, M. G. H.
Bioconj. Chem. 2005, 16 (4), 852-863.
37. Sibrian-Vazquez, M.; Ortiz, J.; Nesterova, I. V.; Fernández-Lázaro, F.; Sastre-Santos, A.;
Soper, S. A.; Vicente, M. G. H. Bioconj. Chem. 2007, 18, 410-420.
38. Rao, R. V.; Hermel, E.; Castro-Obregon, S.; del Rio, G.; Ellerby, L. M.; Ellerby, H. M.;
Bredesen, D. E. J. Biol. Chem. 2001, 276 (36), 33869-33874.
39. Groenendyk, J.; Michalak, M. Acta Biochim. Pol. 2005, 52, 381-395.
40. Jadiya, S. S. Int. J. Pharm. 2012, 2 (3), 679-686.
41. Chames, P.; Regenmortel, M. V.; Weiss, E.; Baty, D. British Journal of Pharmacology
2009, 157, 220-233.
42. Scott, A. M.; Allison, J. P.; Wolchok, J. D. Cancer Immunity 2012, 12, 14.
43. Rihova, B. Folia Microbiol. 1995, 40 (4), 367-384.
44. Song, S.; Liu, D.; Peng, J.; Deng, H.; Guo, Y.; Xu, L. X.; Miller, A. D.; Xu, Y. FASEB J.
2009, 23, 1396-1404.
45. Li, Z.; Zhao, R.; Wu, X.; Sun, Y.; Yao, M.; Li, J.; Xu, Y.; Gu, J. FASEB J. 2005, 19, 1978-
1985.
46. Vrouenraets, M. B.; Visser, G. W. M.; Stewart, F. A.; Stigter, M.; Oppelaar, H.; Postmus, P.
E.; Snow, G. B.; van Dongen, G. A. M. S. Cancer Research 1999, 59 (7), 1505-1513.
47. Carcenac, M.; Larroque, C.; Langlois, R.; van Lier, J. E.; Artus, J.-C.; Pelegrin, A.
Photochem. Photobiol. 1999, 70 (6), 930-936.

209
48. Xu, P.; Chen, J.; Chen, Z.; Zhou, S.; Hu, P.; Chen, X.; Huang, M. PLoS ONE 2012, 7 (5),
e37051.
49. Stuchinskaya, T.; Moreno, M.; Cook, M. J.; Edwards, D. R.; Russell, D. A. Photochemical
& photobiological sciences: Official journal of the European Photochemistry Association
and the European Society for Photobiology 2011, 10 (5), 822-831.
50. Su, B.-B.; Shi, H.; Wan, J. World J. Gastroenterol. 2012, 18 (17), 2121-2126
51. Goldstein, M. J.; Mitchell, E. P. Cancer Invest. 2005, 23 (4), 338-351.
52. Hudson, R.; Carcenac, M.; Smith, K.; Madden, L.; Clarke, O. J.; Pelegrin, A.; Greenman, J.;
Boyle, R. W. Br. J. Cancer 2005, 92, 1442-1449.
53. Vrouenraets, M. B.; Visser, G. W. M.; Stewart, F. A.; Stigter, M.; Oppelaar, H.; Postmus, P.
E.; Snow, G. B.; van Dongen, G. A. M. S. Cancer Res. 1999, 59, 1505.
54. Kaushal, S.; McElroy, M. K.; Luiken, G. A.; Talamini, M. A.; Moossa, A. R.; Hoffman, R.
M.; Bouvet, M. J. Gastrointest. Surg. 2008, 12, 1938-1950.

210
APPENDIX A: CHARACTERIZATION DATA FOR COMPOUNDS IN CHAPTER 2
Figure A.1: 1H NMR spectrum of phthalonitrile 2.3 in d-DCM at 400 MHz (*denotes solvents).
Figure A.2: 1H NMR spectrum of ZnPc 2.4 in d-DMF at 400 MHz (*denotes solvents).

211
Figure A.3: 1H NMR spectrum of N-Boc protected ZnPc 2.6 in d-DMF at 400 MHz (*denotes
solvents).
Figure A.4: 1H NMR spectrum of ZnPc 2.11 in d-acetone at 400 MHz (*denotes solvents).

212
Figure A.5: 1H NMR spectrum of N-Boc protected ZnPc 2.13 in d-DMF at 400 MHz (*denotes
solvents).
Figure A.6: 1H NMR spectrum of N-Boc protected ZnPc 2.19 in d-DMF at 400 MHz (*denotes
solvents).

213
APPENDIX B: BIOLOGICAL DATA FOR COMPOUNDS IN CHAPTER 3
Figure B.1. Subcellular localization of Pc 3.4 in A431 cells at 10 µM for 6 h. (a) Phase contrast,
(b) Overlay of 3.4 fluorescence and phase contrast, (c) ER Tracker Blue/White fluorescence, (e)
MitoTrack green fluorescence, (g) BoDIPY Ceramide, (i) LysoSensor green fluorescence, and
(d, f, h, j) overlays of organelle tracers with 3.4 fluorescence. Scale bar: 10 m.

214
Figure B.2. Subcellular localization of Pc 3.4 in HEp2 cells at 10 µM for 6 h. (a) Phase contrast,
(b) Overlay of 3.4 fluorescence and phase contrast, (c) ER Tracker Blue/White fluorescence, (e)
MitoTrack green fluorescence, (g) BoDIPY Ceramide, (i) LysoSensor green fluorescence, and
(d, f, h, j) overlays of organelle tracers with 3.4 fluorescence. Scale bar: 10 m.

215
Figure B.3. Subcellular localization of Pc 3.4 in HT-29 cells at 10 µM for 6 h. (a) Phase
contrast, (b) Overlay of 3.4 fluorescence and phase contrast, (c) ER Tracker Blue/White
fluorescence, (e) MitoTrack green fluorescence, (g) BoDIPY Ceramide, (i) LysoSensor green
fluorescence, and (d, f, h, j) overlays of organelle tracers with 3.4 fluorescence. Scale bar: 10
m.

216
Figure B.4. Subcellular fluorescence of Pcs in A431 cells at 10 µM for 6 h. (a) Phase contrast,
(b) Pc 3.4, (c) Pc 3.9, (d) Pc 3.6, (e) Pc 3.5, (f) Pc 3.11. Scale bar: 10 µm.
Figure B.5. Subcellular fluorescence of Pcs in HEp2 cells at 10 µM for 6 h. (a) Phase contrast,
(b) Pc 3.4, (c) Pc 3.9, (d) Pc 3.6, (e) Pc 3.5, (f) Pc 3.11. Scale bar: 10 µm.
Figure B.6. Subcellular fluorescence of Pcs in HT-29 cells at 10 µM for 6 h. (a) Phase contrast,
(b) Pc 3.4, (c) Pc 3.9, (d) Pc 3.6, (e) Pc 3.5, (f) Pc 3.11. Scale bar: 10 µm.

217
APPENDIX C: CHARACTERIZATION DATA FOR COMPOUNDS IN CHAPTER 4
Figure C.1. 13
C NMR spectrum of ZnPc 4.10 in d-DMF at 100 MHz (*denotes solvents).
Figure C.2. 13
C NMR spectrum of ZnPc 4.12 in d-DMF at 100 MHz (*denotes solvents).

218
APPENDIX D: CHARACTERIZATION DATA FOR COMPOUNDS IN CHAPTER 5
Figure D.1. 1H NMR spectrum of N-Boc protected 5.5 in d-DMF at 400 MHz (*denotes
solvents).
Figure D.2. 1H NMR spectrum of N-Boc protected 5.8 in d-DMF at 400 MHz (*denotes
solvents).

219
Figure D.3. 1H NMR spectrum of N-Boc protected 5.10 in d-DMF at 400 MHz (*denotes
solvents).
Figure D.4. 1H NMR spectrum of N-Boc protected 5.16 in d-DMF at 400 MHz (*denotes
solvents).

220
Figure D.5. 1H NMR spectrum of N-Boc protected 5.21 in d-DMF at 400 MHz (*denotes
solvents).

221
APPENDIX E: LETTERS OF PERMISSION

222
223
224
VITA
Benson G. Ongarora was born in Kisii, Kenya, to Mr. Peter Ongarora Omari and Mrs.
Margaret Bitutu Ongarora. He attended Geteri Primary School from 1988-1995. He then enrolled
at Moi Gesusu – High School for his secondary school education. He attended Moi University –
Kenya, from 2001 – 2005, and earned his Bachelors of Science in chemistry in December of
2005. In Fall 2008, he was granted an opportunity to join Graduate School Doctoral program at
Louisiana State University (LSU) in the Department of Chemistry. He joined Prof. M. Graҫa H.
Vicente research group in the Spring of 2009. Benson is currently a candidate for the Doctor of
Philosophy in organic chemistry, which will be awarded to him during the December 2012
Commencement at LSU, Baton Rouge, Louisiana.


![Syntheses and characterization of [4]Ferrocenophane](https://static.fdocuments.in/doc/165x107/620f50ac26394025b262d763/syntheses-and-characterization-of-4ferrocenophane.jpg)


![Syntheses, Characterization and biological Activity of 4 ... … · Syntheses, Characterization and biological Activity of 4-{[(Z)-(2-methoxyphenyl) methylidene] amino} ... All complexes](https://static.fdocuments.in/doc/165x107/5ecce93a63134f68651a6edb/syntheses-characterization-and-biological-activity-of-4-syntheses-characterization.jpg)