Synoptic Disturbances over the Equatorial South...
47
Synoptic Disturbances over the Equatorial South China Sea and Western Maritime Continent during Boreal Winter C.-P. Chang, Patrick A. Harr, and Hway-Jen Chen Department of Meteorology Naval Postgraduate School Monterey, California 24 March 2004 _______________________________________ Corresponding author: Dr. C.-P. Chang, Department of Meteorology, Naval Postgraduate School, Code MR/Cp, Monterey, California 93943. E-mail: [email protected] .
Transcript of Synoptic Disturbances over the Equatorial South...

Synoptic Disturbances over the Equatorial South China Sea
and Western Maritime Continent during Boreal Winter
C.-P. Chang, Patrick A. Harr, and Hway-Jen Chen Department of Meteorology Naval Postgraduate School
Monterey, California
24 March 2004
_______________________________________ Corresponding author: Dr. C.-P. Chang, Department of Meteorology, Naval Postgraduate School, Code MR/Cp, Monterey, California 93943. E-mail: [email protected].

Abstract
During boreal winter, the Maritime Continent is a region of deep cumulus
convection and heavy precipitation systems that play a major role in several global- and
regional-scale processes. Over the western part of this region, the synoptic-scale Borneo
vortex and northeast cold surge and the intraseasonal Madden Julian Oscillation (MJO)
contribute to the variability in deep convection. This work studies the impact on deep
convection due to interactions among these three different motion systems. Furthermore,
the role of the unique topography of the region is examined with respect to the variability
in the synoptic-scale cold surge and Borneo vortex.
On the synoptic scale, interaction of northeast winds with local topography and
dynamic response to the change in latitude contribute to turning of the winds and
localized patterns of deep convection. In days without a Borneo vortex, deep convection
tends to be suppressed over the South China Sea and Borneo and enhanced downstream
over the landmasses on the western and southern peripheries of the equatorial South
China Sea. The pattern is reversed in days with a vortex. The presence of a cold surge
enhances this contrast. The surge also interacts with the Borneo vortex, in that the vortex
is strengthened and the vortex center shifts from over the South China Sea to be located
over the western coast of Borneo.
The frequency of cold surges and vortex days is reduced during periods when the
MJO is present. Composites of large-scale circulation and outgoing longwave radiation
are used to show that often the MJO-related circulation patterns oppose the synoptic-scale
cold surge and vortex circulations. Thus, a primary impact of the MJO is to inhibit weak
2

cold surge events, which then produces a secondary impact on the Borneo vortex via
interactions between the cold surge winds and the vortex.
3
1. Introduction
Much of the most active deep cumulus convection and heaviest precipitation
occur during boreal winter over the region of Borneo, Malay Peninsula, Sumatra, and
other large Indonesian islands. The latent heat release in this region forms a part of the
Maritime Continent heat source that plays a major role in several global- and regional-
scale processes. The heat source interacts directly with the strong East Asian baroclinic
system affecting the East Asian jet (Chang and Lau, 1982), which in turn may influence
weather in North America (Yang et al. 2002). Recent analysis also suggested that a flare-
up of this heat source may lead to downstream wave-train propagation, which may be
related to storm development over Europe ten days later (Thorpe et al. 2002). In an
atmospheric general circulation model study, Neale and Slingo (2003) demonstrated that
the tendency of a dry bias in the Maritime Continent region is a major source for
systematic errors over both tropical Indian and Pacific oceans and extratropical North
America and Northeast Europe. They concluded that the Maritime Continent plays a
critical role in the global circulation and emphasized the need for better representation of
convective organization over this region of complex land–sea terrains.
This area is surrounded by a wide range of topographic features with varying
orientations that can have strong influences on the distribution of the deep convective
systems. This region is also subject to significant large-scale disturbances that vary over
a wide range of time scales. Over intraseasonal time scales, the Madden-Julian
Oscillation (MJO) often has peak amplitude during the Boreal winter over the Maritime
Continent (Madden and Julian 1972). The MJO causes alternating periods of large-scale
4

active and inactive convective phases with a periodicity of 30-60 days as it propagates
eastward through the equatorial South China Sea and Maritime Continent regions.
On synoptic time scales, northeasterly cold surges (Chang et al. 1983, Chu and
Park 1984, Lau and Chang 1987, Wu and Chan 1995, Zhang et al. 1997) often dominate
the low-level circulation patterns over the equatorial South China Sea. The cold surge
spreads equatorward around the eastern edge of low-level anticyclones located over
eastern Asia. The strongest cold surges extend over the South China Sea. Here, the
primary impact is due to the strengthening of northeast winds near the surface that
progress rapidly southward as the orientation of the regional topography (Fig. 1) acts to
restrict the flow such that it is channeled toward the equator. Although cold surge winds
are typically dry, they are moistened by the over-water trajectory (Johnson and Houze
1987) and have been associated with enhanced upper-tropospheric outflow over the
Maritime Continent, which is related to an enhanced east Asian local Hadley Cell (Lau
and Chang 1987). Furthermore, the gradient of planetary vorticity together with the
blocking and deflection due to topographic influences contribute to an eastward turn in
the winds as they cross the equator. This often acts to enhance the Australian monsoon
trough and may contribute to tropical cyclogenesis (Holland 1984, McBride 1995).
Typically, about one to two cold surges occur per month and may last from a few
days to one week or more (Ramage 1971, Lau and Chang 1987, Zhang et al. 1997, Chang
et al. 2003a). This leads to a regional oscillation in the northeast monsoon winds that
occurs at a higher frequency than the one-to-two month oscillation of the MJO. Also, the
MJO is primarily reflected as an oscillation in zonal wind and convection as part of the
global-scale eastward movement.
5

Synoptic-scale disturbances are also found to occur in the vicinity of the island of
Borneo (Cheang 1977, Chen et al. 1986, Lau and Chang 1987, Johnson and Houze 1987,
Chang et al. 2003a). Over this region, the low-level basic-state background vorticity is
cyclonic due to the mean northeasterly wind maximum over the South China Sea and the
equatorial westerlies associated with the Asian winter monsoon. Therefore, perturbations
in this basic state often amplify into synoptic-scale cyclonic circulations. These
disturbances are often found southeast of the primary region of cold-surge northeasterly
winds. Often, the circulation is present as a quasi-stationary, low-level cyclonic
circulation, which is a persistent feature of the boreal winter climatology (Johnson and
Houze 1987, see Fig. 10.2). Although the circulation may not be completely closed on the
east side over the island, it is often referred to as the Borneo vortex and is often
associated with deep convection and intense latent heat release. The variability and life
cycle of the Borneo vortex has an important impact on circulation and convection
throughout the equatorial South China Sea.
Because of the regional and global impacts of the intense deep convection and
associated energy source over the Maritime Continent, it is important to understand the
relationships among the primary factors that impact the region. Although the three
circulation systems defined above do not vary over the same space and time scales, they
may interact to have a profound impact on the variability in deep convection over the
Maritime Continent (Johnson and Priegnitz 1981). Furthermore, the three circulation
systems differ greatly in their origin. While the MJO originates over the equatorial
Indian Ocean (Madden and Julian 1994), cold surges originate over the midlatitude
regions of eastern Asia (Ramage 1971) and the Borneo vortex develops locally over the
6

southern South China Sea (Cheang 1977). Despite these differences in origin, and spatial
and temporal scales, it is hypothesized in this study that interactions among these
circulations greatly impact the regional character of deep convection over the Maritime
Continent. The physical mechanisms that govern the interactions between the synoptic-
scale cold surge and Borneo vortex are examined initially. Then, the impact of the large-
scale, slowly-varying MJO on the synoptic-scale circulations is identified.
Satellite and low-level wind analyses are used in this study to identify the
interactions among the primary circulation systems and define the convective and
circulation patterns that result from the interactions. The data and methodology are
defined in Section 2. Section 3 contains the mean boreal winter fields in convection and
circulation as they relate to the primary synoptic-scale circulation patterns. In Section 4,
the variability in the Borneo vortex is defined with respect to cold surges and the MJO.
Also, relationships between the MJO and cold surges are examined. Results are
summarized in Section 5.
2. Data and Method
The main data used in this study are the three-hourly Geostationary
Meteorological Satellite (GMS) black-body temperature (Tbb) at 1º x 1º grids, and the
once daily (00 UTC) NCEP/NCAR Reanalysis winds at 925 hPa at 2.5º x 2.5º grids, for
21 boreal winters (December 1980 – February 2001). The domain of the study is shown
in Fig. 1, which includes the southern South China Sea and the surrounding landmasses.
Convection in this area is represented by a convective index (CI), defined as follows:
CI=250–Tbb, if Tbb < 250 K
CI=0, if Tbb ≥ 250 K.
7

This definition is based on the use of GMS data in the Global Energy and Water Cycle
Experiment (GEWEX) Asian Monsoon Experiment (GAME), which was adapted from
Nita (1983). Missing data over periods of 48 hours or less are interpolated. Missing data
period over 48 hours, which occur between 00 UTC 20 – 12 UTC, 24 January 1984, and
between 00 UTC 26 May – 12 UTC 29 June 1984, were replaced with the long-term
mean values at the respective calendar date. For each day the CI values for 00 UTC and
12 UTC are averaged to remove the diurnal cycle.
Composites of the daily CI and NCEP/NCAR 925 hPa wind and divergence
within the 21 winters are used to represent the effects on convection by the motion
systems. The CI and divergence fields sometimes show significant discrepancies. Due to
the lack of wind observations over ocean areas and the lower resolution of the wind
analysis over the complex terrain, we deem the divergence field to be less reliable than
the CI field.
The composites are produced according to several categories: the presence of a
Borneo vortex, the presence and strength of cold surges, and the presence and phase of
the MJO. A Borneo vortex is identified whenever there is a closed counterclockwise
circulation on the 925 hPa wind field within the area of 107.5ºE-117.5ºE, 2.5ºS-7.5ºN
(rectangular box in Fig. 1) and that there is at least one wind report exceeding 2 m s-1 in
the four corner points of the 2.5º x 2.5º grid square within which the circulation center is
located. A cold surge index is chosen as the averaged 925 hPa meridional wind between
110ºE-117.5E along 15ºN (horizontal bar in Fig. 1). A cold surge event occurs when this
index exceeds 8 m s-1. The definition of MJO phases are given in Section 4b, which is
8
defined by using the Outgoing Longwave Radiation (OLR) data and the 850 hPa winds
from the NCEP/NCAR Reanalysis.
A band pass filter is used to separate motions of different scales. Because of the
stationary tendency of the Borneo vortices, the synoptic spatial-scale disturbances have
time scale of a few days to a week or more. This overlaps with the life cycle of a cold
surge, which ranges from one to two weeks. Therefore, we use the band pass window of
2-15 days to represent these two types of motions fields together. The MJO fields are
represented by the band pass window of 30-60 days.
3. Boreal Winter Mean Fields
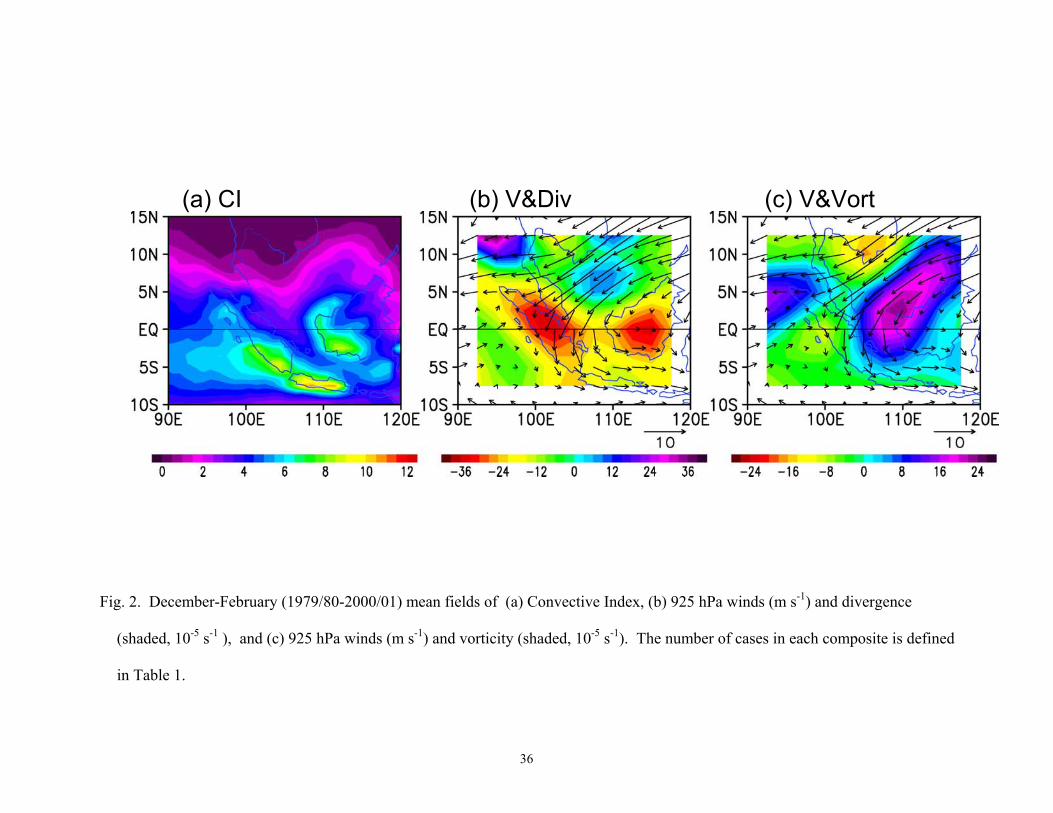
During the northern winter, deep convection is concentrated over the large islands
of the Maritime Continent (Fig. 2a). Maximum convection occurs over Java, which is
connected to the convection maximum over Sumatra with an extension into the eastern
Indian Ocean as part of the intertropical convergence zone (ITCZ) south of the equator.
There is a lack of deep convection north of 5oN, which is due to 925 hPa
divergence in the northeasterly monsoon flow (Fig. 2b). This is different from boreal fall
when strong convection occurs off the Vietnamese coast north of 10ºN as a result of the
low level convergence produced by the northeast onshore winds (Chang et al. 2003b,
2004). The winter mean northeast winds are stronger than fall, but the air is cooler and
drier (Johnson and Houze 1987), and the SST in the northern and middle South China
Sea is significantly lower. Thus, deep convection is less likely to develop until the air
reaches the southern South China Sea after it is transformed by substantial surface
sensible and latent heat fluxes (Johnson and Zimmerman 1986). As the low-level,
northeast winds extend south of the South China Sea they are deflected to the west and
9

south due to blocking and deflection by the terrain (Fig. 1) of the Malay Peninsula and
Sumatra1. Over the northern portion of the domain, the westerly deflection results in
easterly winds that extend into the Bay of Bengal. To the south, the deflection results in
northerly winds that cross the equator and turn eastward over near equatorial southern
latitudes. This counterclockwise turning of the 925 hPa winds is a result of the
conservation of potential vorticity and the deflection of the terrain (Lim and Chang
1981).
The two primary regions of low-level convergence (Fig. 2b), are associated with
the maxima in deep convection (Fig. 2a). The convergence center near Sumatra is related
to the interaction of the northeasterly monsoon flow with the terrain of the Malay
Peninsula. However, the convergence center over Borneo is shifted east of the primary
northeasterly wind belt and is in the region of the counterclockwise turning of the winds
that cross the equator. Coincident with the convergence center over Borneo is a
maximum in 925 hPa relative vorticity (Fig. 2c). In addition to the curvature contribution
to the vorticity maximum, shear vorticity results due to the interaction between the
northeasterly monsoon flow and the terrain of Borneo.
In general, the area of deep convection over the equatorial Maritime Continent
started like a V-shape pattern and shrinks from December to January to February (Figs.
3a-c). The region of minimum convection marches southward through the southern
1 With a height in the range of 1000-1500 m, a mean wind speed of 5-10 m s-1 and a
Brunt-Visala frequency of 7.5 x 10⁻³ s-1, the nondimensional Froude number as defined
by Smith (1989) is on the order of 0.7 to 2.1. For mountain ridges that face the wind, the
flow characteristics is mostly in a partial blocking regime (Smith 1989, see Fig. 5).
10

portion of the South China Sea and crosses into the Southern Hemisphere by February,
which effectively separates the convective maximum over Borneo from the maximum
over Sumatra. The southward extension of the convective minimum coincides with the
intensification of the divergence over the South China Sea (Figs. 3d-f) associated with the
strengthening of the northeast monsoon flow. Furthermore, the reduction in deep
convection over Sumatra in January is related with the reduced 925 hPa convergence
(Fig. 3e) and the increased drying influence of the strengthening northeast winds that
flow toward Sumatra. The drying does not impact the convection center over Borneo as
significantly since the northeast monsoon flow is nearly parallel to the Borneo coastline
particularly north of 4°N (Fig. 1). Along this northern portion of the northwest Borneo
coast, Ekman pumping can increase moisture convergence as the strengthening northeast
winds contribute to the shear and curvature vorticity of the counterclockwise circulation
around Borneo. Between 2°N-4°N a substantial part of the western Borneo coastline
faces northward (Fig. 1), as a result the blocking of strengthened northeast winds causes a
direct increase in moisture convergence.
4. Borneo Vortex and Deep Convection
Centers of counterclockwise circulations at 925 hPa during the 21 boreal winters
of 1979/80-2000/01 have been identified (Fig. 4) based on the streamline analysis of
unfiltered daily 0000 UTC NCEP/NCAR Reanalysis wind fields. The distribution of the
circulation centers is summarized by isopleths produced by an analysis of the number of
circulation centers in 2.5ox2.5o grid squares. The maximum occurrence of vortex centers
is oriented in a northeast-southwest region along the west coast of Borneo with a
maximum of more than 120 centers over the 21 seasons near 1.5oN, 111oE. Of the total
11

1895 days in the 21 boreal winter seasons, 628 days (nearly 1/3) have one or more vortex
centers in the western Borneo-southern South China Sea region between 5oS-10oN and
105oE-115oE. Hereafter, these days will be labeled as “vortex cases” while the remaining
1267 days will be labeled “no-vortex cases”.
a) Cold Surges
Previous studies (e.g., Cheang 1977, Johnson and Priegnitz 1981, Lau and Chang
1987) related episodes of enhanced deep convection over the equatorial South China Sea
to synoptic-scale disturbances such as the Borneo vortex and northeasterly cold surges.
To investigate relationships between the Borneo vortex and northeasterly cold surges,
each of the 1895 days is also labeled as a “surge” or “no-surge” day based on an area-
averaged northeasterly 925 hPa wind in a rectangular box defined over the area 5oN-
10oN, 107oE-115oE. The distribution of the surge and vortex daily classifications is given
in Table 1. For all December-February seasons, cold surges occur in 20% of the days and
a Borneo vortex occurs in 33% of the days; the frequency of both is highest in December
and lowest in February.
The impacts of the two synoptic-scale circulations are examined separately using
925 hPa wind data that have been filtered to highlight variations over a period range of 2-
15 days. Composite maps (Fig. 5) of convective index, 925 hPa winds and divergence are
constructed for days classified as vortex, no-vortex, surge, and no-surge as defined by the
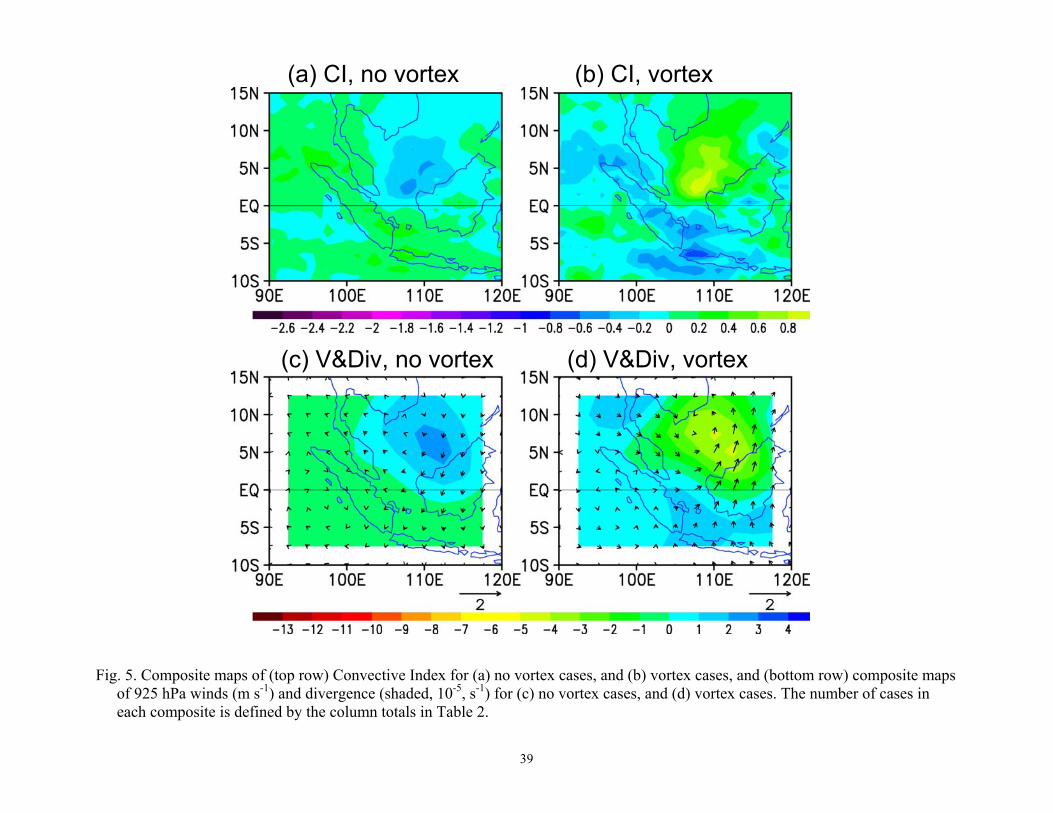
column totals in Table 1. During no-vortex days, there is reduced deep convection over
the southern South China Sea while convection is enhanced to the west, southwest, and
south of the South China Sea (Fig. 5a). The reduced convection over the southern South
China Sea corresponds to increased 925 hPa divergence (Fig. 5c) in that region while
12
areas of increased convection that ring the southern South China Sea correspond to
increased low-level convergence. During vortex days, enhanced convection (Fig. 5b) and
increased low-level convergence (Fig. 5d) are found over the southern South China Sea
while surrounding regions experience reduced convection. Therefore, during vortex days
the patterns of convection and 925 hPa divergence are nearly identically opposite to
pattern of no-vortex days. Apparently, the presence of the Borneo vortex and deep
convection acts to intercept transport of low-level moisture by the northeasterly monsoon
flow such that convection downstream over the Malay Peninsula-Sumatra-Java region is
reduced and there is anomalous low-level divergence (Fig. 5d).
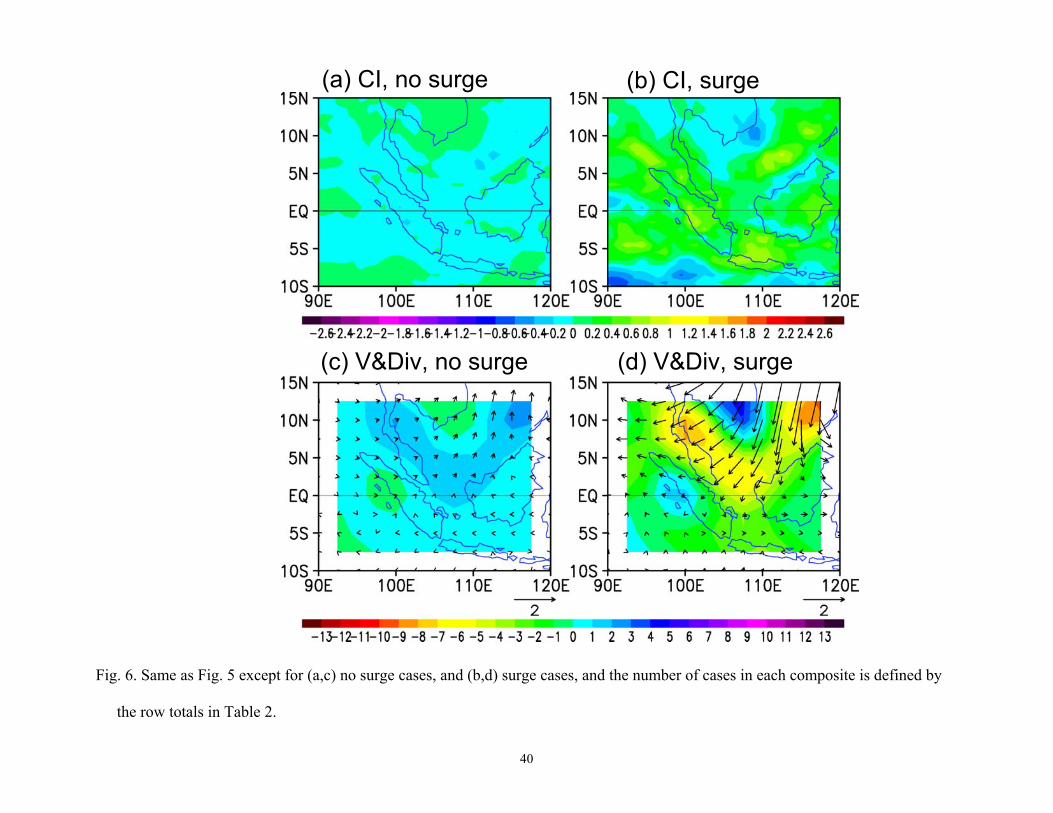
The composite convective index and divergence patterns for the surge and no-
surge days exhibit well-recognized patterns of variability. During no-surge days, deep
convection (Fig. 6a) and 925 hPa convergence (Fig. 6c) are located over Indochina while
reduced convection and low-level divergence are found over most of the remaining
equatorial South China Sea region. During surge days, a near opposite pattern occurs
with reduced convection (Fig. 6b) and low-level divergence over Indochina and enhanced
convection and convergence over the remainder of the region (Fig. 6d), which is in
agreement with previous studies of the influence of northeasterly surges on deep
convection over the equatorial South China Sea (e.g., Lau and Chang 1987). During
surge events, deep convection occurs in association with the blocking of the low-level
winds by the terrain, which contributes to a shift of the convection pattern downstream of
the maximum in 925 hPa convergence. The shift is less when the convection pattern is
compared with 850 hPa convergence because there is less blocking of winds at higher
elevations. The low-level convergence during surge days (Fig. 6d) takes on a V-shaped
13

pattern on the windward side of the Malay Peninsula and Borneo. This pattern results
from the blocking of the surge winds by the terrain (Fig. 1) and its location is different
from the V-shaped divergence pattern associated with the monthly mean fields (Fig. 3),
where maximum convergence centers are located over land areas.
Composite maps of convective index and divergence are also constructed for the
combination of vortex and surge days as defined in Table 2. When there is no surge, the
convection (Figs. 7a,b) and divergence (Figs. 7e,f) patterns are weaker than during surge
cases (Figs. 7c,d and Figs. 7g,h). The presence of the vortex during no-surge days (Fig.
7b) results in a region of enhanced convection near the western tip of Borneo near 2.5oN,
108oE. The increased convection due to the vortex without surge (Fig. 7b) is less than the
vortex-only increase in convection (Fig. 5b), which reflects the presence of surge days in
the vortex-only composite. During surge cases, the impact of the Borneo vortex or its
absence is amplified. It was shown above (Fig. 6b) that surge cases result in a reduction
of convection over the southern South China Sea and an increase over the near-equatorial
regions. This pattern is amplified during cases when a surge occurs but there is no
Borneo vortex (Fig. 7c). Convection is severely reduced over the southern South China
Sea region with compensating increases in convection in surrounding equatorial regions.
The maximum divergence (Fig. 7g) is associated with the strong 925 hPa northeasterly
flow over the southern South China Sea.
Convection over the southern South China Sea is strongest during the
combination of surge and vortex cases (Fig. 7d). The presence of the Borneo vortex
results in the restriction of the region of low-level divergence, which is due to the
enhanced northeasterly cold surge flow, to the Indochina Peninsula (Fig. 7h).
14

Subsequently, a large region of enhanced low-level convergence covers the southern
South China Sea in association with the Borneo vortex circulation. Furthermore,
convection is reduced to the west of the equatorial South China Sea region as the low-
level moisture transport is intercepted by the Borneo circulation.
The enhancement of deep convection over the southern South China Sea during
cases of a cold surge and a Borneo vortex is sensitive to the strength of the cold surge
(Fig. 8). Surge intensity is classified into weak, moderate and strong categories for surge
index between 8-10 m s-1 (Figs. 8a,d), 10-12 m s-1 (Figs. 8b,e), and greater than 12 m s-1
(Figs. 8c,f), respectively. As the intensity of the cold surge increases, the area covered by
increased convective index values plus the amplitude of the convective index increases
over the southern South China Sea. The increased deep convection with surge intensity
results from two processes. Increased northeast winds results in increased moisture
convergence near the coastal area of Borneo. Additionally, the increased shear vorticity
due to the stronger northeast winds contributes to a stronger Borneo vortex.
The impact of the presence of the vortex during strong surge events (Figs. 8b,e
and 8d,f) can be examined by contrasting convection, wind, and divergence patterns of
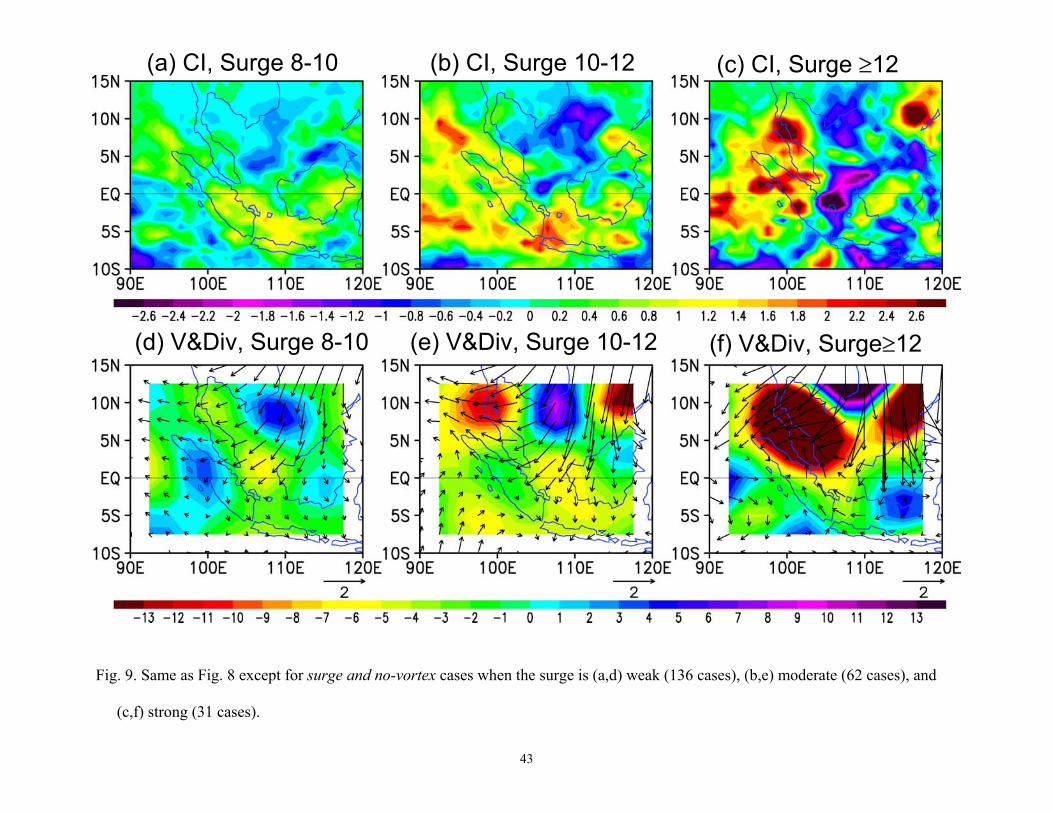
these surge and vortex cases with cases of strong surges but no vortex (Fig. 9). Without
the presence of the vortex, deep convection throughout the southern South China Sea and
along the Borneo coastline is severely reduced (Figs. 9a,b). However, convection over the
Malay Peninsula and Sumatra is increased. This is due to the lack of the
counterclockwise turning of the wind over the equatorial region (Figs. 9c,d), which
results in reduced low-level convergence along the western Borneo coastline. Because
there is no vortex to induce the clockwise turning, there is increased interaction between
15

the northeast winds and the terrain of the Malay Peninsula and Sumatra, which
contributes to increased low-level convergence and deep convection over those areas.
A final assessment of the interactions between the Borneo vortex and cold surges
is to compare the location of the vortex center in the composite constructed from cases
that only contain a vortex but no surge (Fig. 7f), all vortex cases with and without a surge
(Figs. 5d) and the composite of vortex and surge cases (Figs. 7h). The number of cases in
each composite is defined by the last column in Table 2. When a vortex is present
without a surge, there is a cyclonic turning of the winds over the southern South China
with no closed circulation center. In the all vortex composite (Fig. 5d), which contains
151 surge cases and 477 no-surge cases (Table 2), there is a closed cyclonic circulation
centered over the southern South China Sea. In the vortex and surge composite (Fig. 7h),
the center of the vortex is shifted to be oriented along the western Borneo coastline.
Although the presence of the surge acts to increase the strength of the vortex, the surge
results in a shift of the vortex center from being located over the southern South China
Sea to be near the Borneo land mass. Chang et al. (2003a) explained the rare formation
of the equatorial typhoon Vamei during December 2001 as a result of the interaction
between a strong cold surge and a Borneo vortex. They reasoned that while the cold surge
and Borneo vortex events are both common during the boreal winter, the shift of the
vortex center such that much of the cyclonic circulation lies over land contributes to the
fact that it is extremely rare for the vortex to intensify and organize as a tropical cyclone.
b) Madden-Julian Oscillation
During the boreal winter, a significant amount of the variability of the large-scale,
slowly-varying patterns of deep convection is due to the MJO. Therefore, the MJO-scale
16
patterns of deep convection may have an impact on the synoptic-scale Borneo vortex.
Spatial patterns and temporal coefficients from a singular-value decomposition (SVD)
methodology (Bretherton et al. 1992) that was applied to 30-60 day band pass filtered
anomalous 850 hPa winds and outgoing longwave radiation (OLR) during the period
December-February 1979-December-February 2001 are used to identify MJO cases.
Periods of MJO activity are defined when temporal coefficients associated with the two
leading SVD modes (not shown) exhibit a phase relationship such that mode 2 leads
mode 1 by 90 degrees and the coefficient amplitudes are large enough to be statistically
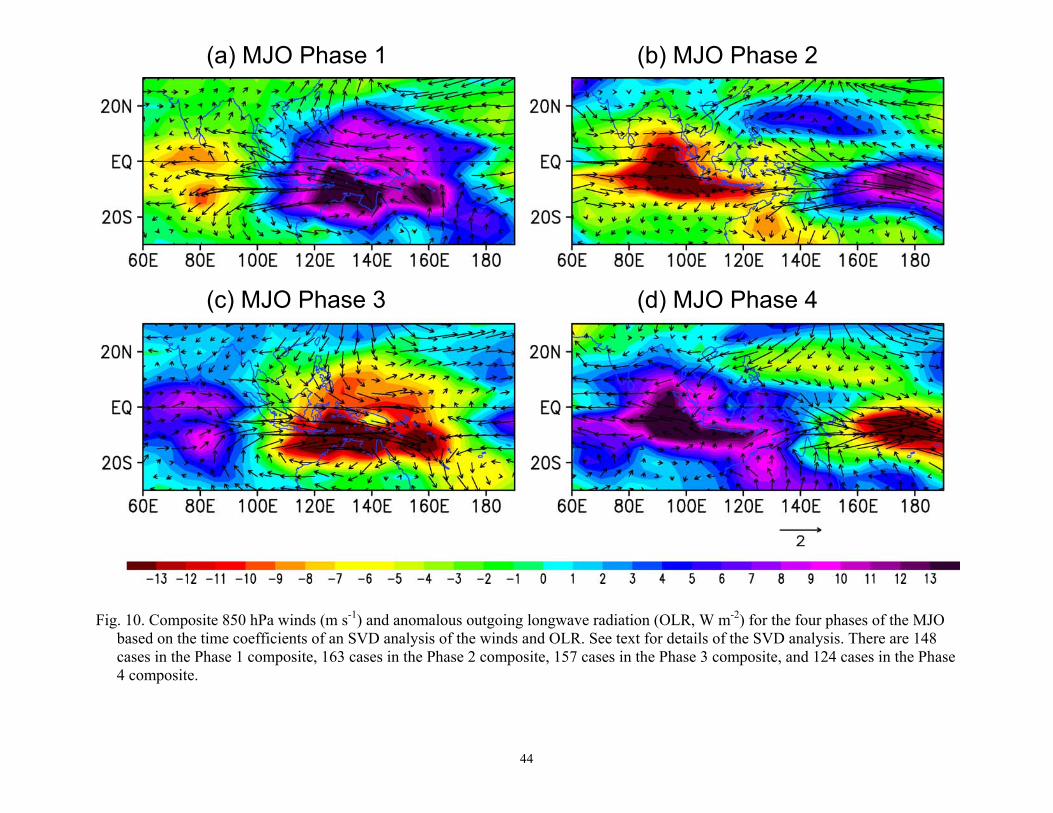
significant. Furthermore, the MJO activity is classified into four phases (Fig. 10) that are
based on the phase relationship between the two temporal coefficient series. During
phase 1 (Fig. 10a), the reduced convection regime of the MJO has passed through the
Maritime Continent region where equatorial easterly anomalies exist between 80oE-
150oE. During phase 2 (Fig. 10b), the Maritime Continent area is in a transition from the
reduced convection portion of the MJO, which has moved eastward, to the approaching
active convective portion of the MJO. Increased convection and low-level westerlies
exist immediately west and south of the Malay Peninsula, Sumatra, and Java. During
phase 3 (Fig. 10c), the enhanced convective portion of the MJO is centered over the
eastern portion of the Maritime Continent. Low–level westerly anomalies exist
throughout the region. Furthermore, the Australian monsoon trough is very well defined
and there are increased 850 hPa northeasterly winds throughout the South China Sea.
Finally, phase 4 (Fig. 10d) is a transition phase when the active convection portion of the
MJO has moved to the equatorial western Pacific and the reduced convection portion is
17
approaching the Maritime Continent from the west. Low-level equatorial westerly
(easterly) anomalies are found to the east (west) of the Maritime Continent.
Because of the relationships between the presence of the Borneo vortex and cold
surges defined by the composite patterns in Fig. 7, it is important to identify the
relationship between the MJO and cold surges. In particular, Rossby-type responses that
are manifest in the subtropical circulations flanking the MJO-induced enhanced or
reduced convection are associated with large-scale meridional wind patterns. These
meridional winds may act to re-enforce or weaken a cold-surge event. In general, cold
surges occur less frequently during MJO periods (Table. 3). During MJO periods, more
cold surges occur during MJO phases 3 and 4 than during phases 1 and 2. The chance of
a cold surge during MJO phases 1 and 2 (15%) is almost one half that of phase 3 and 4
(28%) and no-MJO days (29%). This contrast is consistent with the anomalous 30-60 day
850 hPa wind patterns (Fig. 10), in that there are anomalous southerly winds during MJO
phases 1 and 2 over the South China Sea that apparently inhibit the development of cold
surges. Of the 138 cold surges that occur during MJO periods, 85 (62%) were classified
as weak surges. Of the 85 weak surges, 53 (65%) occurred during MJO phases 3 and 4.
Of the 53 moderate and strong surges that occurred during the MJO, 29 (55%) occurred
during MJO phases 3 and 4. The nearly equal split in moderate and strong surges
between MJO phases 1,2 and 3,4 compared to the larger number of weak surges that
occur during phases 3 and 4 compared to phases 1 and 2 indicates that weak surges are
inhibited during MJO phases 1 and 2.
Nearly twice as many vortex cases occur during no-MJO periods than MJO
periods (Table 4). Although the largest number of vortex cases during MJO periods
18

occur during MJO phase 2 (Table 4), the increase in cases during phase 2 is only
statistically larger than the number of cases during phase 4.
During the MJO phase 1, the composite Borneo vortex case (Figs. 11a,e) is
similar to the composite of vortex cases with no surge (Figs. 7b,f). That is, there is a
broad area of counter-clockwise turning of the low-level winds over the southern South
China Sea with no closed circulation. Convection is increased over the southern South
China Sea and reduced over the equatorial Southern Hemisphere, Malay Peninsula, and
Sumatra. The similarity of the vortex and MJO phase 1 composite with the vortex and no
surge pattern (Figs. 7b,f) indicates that during MJO phase 1 the Borneo vortex most
likely occurs without a surge. This is consistent with the anomalous 30-60 day
subtropical ridge over the western North Pacific with southerly anomalies over the South
China Sea in Fig. 10a.
During the MJO phase 2, deep convection over the southern South China Sea and
the low-level wind pattern associated with the Borneo vortex (Figs. 11b,f) are more
organized than during MJO phase 1. The circulation pattern indicates some influence of
cold surges in the composite as there are northeasterly winds over the southern South
China Sea and the circulation center is located along the west coast of Borneo. However,
the magnitude of the northeast winds over the southern South China Sea is much less in
the vortex and MJO phase 2 composite (Figs. 11b,f) than the vortex and surge composite
(Figs. 7d,h). Although weak, the northeast winds over the southern South China Sea in
the composite Borneo vortex based on 2-15 day bandpass filtered data (Figs. 11b,f)
during periods of MJO phase 2 are opposite to the 30-60 day bandpass filtered southwest
winds over the region (Fig. 10b). This may be attributed to two possibilities. One is that
19

the MJO phase 2 is a transition phase between the inactive convection (phase 1) portion
of the MJO and the active phase (phase 3). Therefore, the 30-60 day wind pattern may
not be as stable throughout the period as the dominant active and inactive convection
phases. Individual synoptic-scale cold-surge events may not be influenced as much by
the transition MJO phase. Secondly, the anomalous strong 30-60 day subtropical ridge
over the western North Pacific has moved eastward and northward (Fig. 10b) such that
the MJO-scale opposition to potential synoptic-scale cold surges may be reduced.
However, the reduced magnitude of the winds in the vortex-MJO phase 2 composite does
indicate that the overall influence of the surge is reduced by the MJO phase 2
circulations, which again suggests that the MJO phase 2 influence may be to inhibit weak
cold surges or reduce the intensity of strong cold surges, which is similar to the above
discussion with respect to the distribution of cold surge cases during MJO periods (Table
3). Because, vortex composite patterns associated with MJO phase 1 and 2 (Figs. 10a,b)
are not very different from composites of vortex-only (Figs. 7b,f) and vortex-surge (Figs.
7d,h) cases, phases 1 and 2 of the MJO primarily influences the Borneo vortex via
reduction of the influence of cold surges.
During the MJO phase 3, the MJO enhanced convection and equatorial westerlies
have extended throughout the Maritime Continent region (Fig. 10c). During this phase,
the composite structure of the Borneo vortex (Figs. 11c,g) exhibits some fundamental
differences from the MJO phase 1 and 2 composites and from all previous vortex-no
surge (Figs 7b,f) and vortex-surge composites (Figs 7d,h). During the MJO phase 3, the
cyclonic circulation of the vortex seems to be more linked to cyclonic horizontal shear
associated with equatorial westerly winds rather than northeasterly winds that extend
20

through the southern South China Sea. Consequently, the center of the vortex is located
over the southern South China Sea (Fig. 11g) as is the maximum in deep convection (Fig.
11c). Although there is some indication that the MJO phase 3 may be related to increased
cold surge frequency (Table 3), the composite vortex-MJO phase 3 pattern indicates that
the Borneo vortex may be more influenced by the increased equatorial westerlies
associated with the enhanced MJO-scale convection over the eastern portion of the
Maritime continent (Fig. 10c).
Again, the structure of the vortex and MJO phase 4 composite (Figs. 11d,h) is
fundamentally different than composites constructed based on the presence of the vortex
or the vortex and surge. During MJO phase 4, the composite vortex structure is very
weak with cyclonic shear present only over the extreme western South China Sea and
Malay Peninsula. Southwesterly anomalies exist over the primary region of the southern
South China Sea and reduced deep convection spreads northeastward along the west
coast of Borneo. The 30-60 day composite winds over the South China Sea during MJO
phase 4 are primarily easterly (Fig 10d), which suggests that there is less penetration of
northeasterly winds into the southern South China Sea on the MJO scale during phase 4.
This may also be related to the reduced-convection branch of the MJO that is beginning
to extend over the southern South China Sea. Enhanced MJO-scale downward motion
and low-level diffluence (Fig 10d) may contribute to reduced vortex frequency and less
influence of cold surges over the equatorial regions.
During periods of no-MJO activity, the composite vortex patterns of convection,
winds, and divergence (not shown) are very similar to the composites of all vortex cases
(Figs. 5 b,d), with the magnitude of the anomalies slightly enhanced . This is consistent
21

with the above results in that a majority of vortex cases occur during no-MJO periods
(Table 4) and that the number of cold surges is reduced during MJO periods (Table 3).
Therefore, the Borneo vortex during the no-MJO periods should be similar to the overall
composite that contains the representation.
The relationships among the MJO, cold surges, and the Borneo vortex are
summarized by comparing the relative vortex frequency during periods of no surge, weak
surges, moderate surges, and strong surges during MJO periods, no-MJO periods, and the
total number of cases (Fig. 12). It is clear that the presence of the MJO is associated with
fewer numbers of vortex cases. Furthermore, the occurrence of vortex cases during
periods of weak surges is most reduced during the MJO, which is consistent with the
analyses above.
5. Summary and Conclusions
During boreal winter, patterns of deep convection over the equatorial South China
Sea vary in response to several circulations that vary on synoptic and intraseasonal time
scales. This study has documented large-scale patterns of convection, low-level winds,
and divergence over the equatorial South China Sea with respect to interactions among
the synoptic scale Borneo vortex and northeasterly cold surge and the intraseasonal MJO
during the boreal winter. When no Borneo vortex is present, the cool and dry northeast
monsoon winds produce subsidence over the southern South China Sea (Johnson and
Priegnitz (1981), where convection is suppressed. Further downstream, the northeast
winds interact with terrain over the landmasses on the western and southern peripheries
of the equatorial South China Sea (e.g., Malay Peninsula, Sumatra, and Java), which
becomes the active areas for deep convection.
22

The presence of the Borneo vortex results in a deflection of the low-level winds
and convergence to the west coast of Borneo, such that the primary area of deep
convection occurs more upstream near the west coast of Borneo and over the southern
South China Sea. Convection over the land masses downstream from the surge is
suppressed.. This results in a pattern of deep convection that is nearly directly opposite
to the pattern when no Borneo vortex is present.
The presence of a cold surge enhances this pattern. The locations of convection
during surge cases with a vortex and surge cases without a vortex are similar to those in
the respective no surge cases, however the magnitude of deep convection is much
stronger. Furthermore, the strength and position of the Borneo vortex is sensitive to the
presence of a cold surge. The size and magnitude of the area of deep convection near
western Borneo during the presence of a vortex with a cold surge increases with
increasing strength of the cold surge. Although the presence of a vortex in conjunction
with a strong cold surge results in the largest and most intense region of deep convection
over the west coast of Borneo, the strong northeast winds result in a shift of the vortex
center such that much of the vortex lies over Borneo rather than over the southern South
China Sea. For this reason, the development and organization of the vortex into a
tropical cyclone is rare (Chang et al. 2003a).
While the presence of a surge acts to increase the strength of the Borneo vortex,
the frequency of surges is reduced during periods when the MJO is present. Often the
MJO-scale circulation pattern directly opposes the cold surge wind pattern. Therefore,
weak surges may be more inhibited during periods when the MJO-scale circulations are
strong. Primarily due to the impact of the MJO on cold surge intensity and frequency,
23

66% of the vortex cases occur during non-MJO periods. During periods when the active
convection portion of the MJO is over the Maritime Continent, the occurrence of the
Borneo vortex may be more related to the cyclonic shear to the north of anomalous
equatorial westerlies rather than the northeasterly monsoon winds. During MJO periods,
the Borneo vortex is least likely to be present when the inactive convective portion of the
MJO extends to the Maritime Continent with large-scale low-level diffluence that acts to
restrict the impact of cold surges on convection in the southern South China Sea.
Over the southern South China Sea, it has been found that the cold surge often
acts to enhance the Borneo vortex plus shift the location of the vortex toward the western
coast of Borneo. The interaction with the cold surge winds and topography of the
Maritime Continent is a major factor in the relationship between the cold surge and
Borneo vortex. Although the MJO consists of broad-scale, slowly varying alternating
periods of enhanced and reduced convection over the Maritime Continent, it primarily
impacts the Borneo vortex when the MJO circulation features interrupt the synoptic-scale
cold surge influence over the southern South China Sea. A secondary effect of the MJO
occurs when the enhanced convection regime of the MJO is moving eastward of the
Maritime Continent and there is strong cyclonic shear associated with the enhanced
equatorial westerlies. Therefore, complex relationships among the three primary
circulation features and the Maritime Continent topography over the equatorial South
China Sea contribute to the variability in convection patterns over a variety of space and
time scales.
24

Acknowledgments.
This work is supported by the Office of Naval Research, Marine Meteorology Program,
and by the National Science Foundation under Grant ATM0101135.
25

References
Bretherton, C. S., C. Smith, and J. M. Wallace, 1992: An intercomparison of methods for
finding coupled patterns in climate data. J. Climate, 5, 541-560.
Chang, C.-P., P. A. Harr, J. McBride, and H. H. Hsu, 2004: Maritime Continent
monsoon: Annual cycle and boreal winter variability. East Asian Monsoon. C.-P.
Chang, Ed., World Scientific, in press.
_______, and K. M. Lau, 1982: Short-term planetary-scale interactions over the tropics
and midlatitude during northern winter. Part I: Contrasts between active and inactive
Periods. Mon. Wea. Rev., 110, 933-946
______, C. H. Liu, and H. C. Kuo, 2003a: Typhoon Vamei: An equatorial tropical
cyclone formation. Geophys. Res. Let., 30, 50 1-4.
______, J. E. Millard and G. T. J. Chen, 1983: Gravitational character of cold surges
during winter MONEX. Mon. Wea. Rev., 111, 293-307.
______, Z. Wang, J. Ju and T. Li, 2003b: On the relationship between western Maritime
Continent monsoon rainfall and ENSO during northern winter. J. Climate, 17, 665-
672.
Cheang, B. K., 1977: Synoptic features and structures of some equatorial vortices over
the South China Sea in the Malaysian region during the winter monsoon of December
1973. Pure Appl. Geophys., 115, 1303-1333.
Chen, G. T. J., T.E. Gerish, and C.-P. Chang, 1986: Structure variations of the synoptic-
scale cyclonic disturbances near Borneo during the WMONEX period. Papers
Meteor. Res., 9, 117-135.
26

Chu, P.-S., and S.-U. Park, 1984: Regional circulation characteristics associated with a
cold surge event over East Asia during Winter MONEX. Monthly Weather Review:
Vol. 112, No. 5, pp. 955–965.
Holland, G. J., 1984: On the climatology and structure of tropical cyclones in the
Australian Southwest Pacific Region. Aus. Meteor. Mag., 32, 17-31.
Johnson, R. H., and R. A. Houze, Jr., 1987: Precipitating cloud systems of the Asian
monsoon. Monsoon Meteorology. C.-P. Chang and T.N. Krishnamurti Eds., Oxford
University Press, No. 7, 298-353.
_______, and D. L. Priegnitz, 1981: Winter monsoon convection in the vicinity of North
Borneo. Part II: Effects on large-scale fields. Mon. Wea. Rev. 109, 1615–1628.
_______, and J. R. Zimmerman, 1986: Modification of the boundary layer over the South
China Sea during a Winter MONEX cold surge event. Mon. Wea. Rev., 114, 2004–
2015.
Lau, K.-M., and C.-P. Chang, 1987: Planetary Scale Aspects of Winter Monsoon and
Teleconnections. Monsoon Meteorology. C.-P. Chang and T. N. Krishnamurti, Eds.,
Oxford University Press, 161-202.
Lim, H., and C.-P. Chang, 1981: A theory for midlatitude forcing of tropical motions
during winter monsoon. J. Atmos. Sci., 38, 2377-2392.
Madden, R. A. and P. R. Julian, 1972: Description of global-scale circulation cells in the
tropics with a 40-50 day period. J. Atmos. Sci., 29, 827-836.
Madden, R. A. and P. R. Julian, 1994: Observations of the 40-50 day tropical oscillation-
A review. Mon. Wea. Rev., 122, 814-837.
27

McBride, J. L., 1995: Tropical cyclone formation. Global perspective on tropical
cyclones. R. L. Elsberry, Ed., Technical Document No. 693, World Meteorological
Organization, 63-105.
Neale, R. and J. Slingo, 2003: The Maritime Continent and its role in the global climate:
A GCM study. J. Climate, 16, 834-848.
Nitta, T., 1983: Observational study of heat sources over the eastern Tibetan Plateau
during the summer monsoon. J. Meteor. Soc. Japan, 61, 606-618.
Ramage, C. S., 1971: Monsoon Meteorology. Acad. Press, 296pp.
Smith, R. B., 1989: Hydrostatic airflow over mountains, Advances in Geophysics,
Academic Press, 31. 1-41.
Thorpe, A., M. Shapiro, and R. Langland, 2002: Presentation of THORPex Project to
WMO/CAS, February 13, 2002, Oslo. (URL:
http://www.mmm.ucar.edu/uswrp/powerpoint/thorpex/v3_document.htm).
Wu, M.C, and J. C. L Chan, 1995: Surface features of winter monsoon surges over South
China. Mon. Wea. Rev: 123, 662–680.
Yang, S., K.-M. Lau, and K.-M. Kim, 2002: Variations of the East Asian jet stream and
Asian–Pacific–American winter climate anomalies, J. Climate, 15, 306-325.
Zhang, Y., K. R. Sperber, and J. S. Boyle, 1997: Climatology and interannual variation of
the East Asian winter monsoon: Results from the 1979–95 NCEP–NCAR Reanalysis.
Mon. Wea. Rev.,125, 2605–2619.
28

Table 1. The distribution of days with respect to the presence of a surge and a vortex over
the southern South China Sea.
Total Days No Surge Days
Surge Days No Vortex Days
Vortex Days
December 651 443 208 356 295 January 651 532 119 465 186 February 593 540 53 446 147
DJF 1895 1515 380 1267 628
29
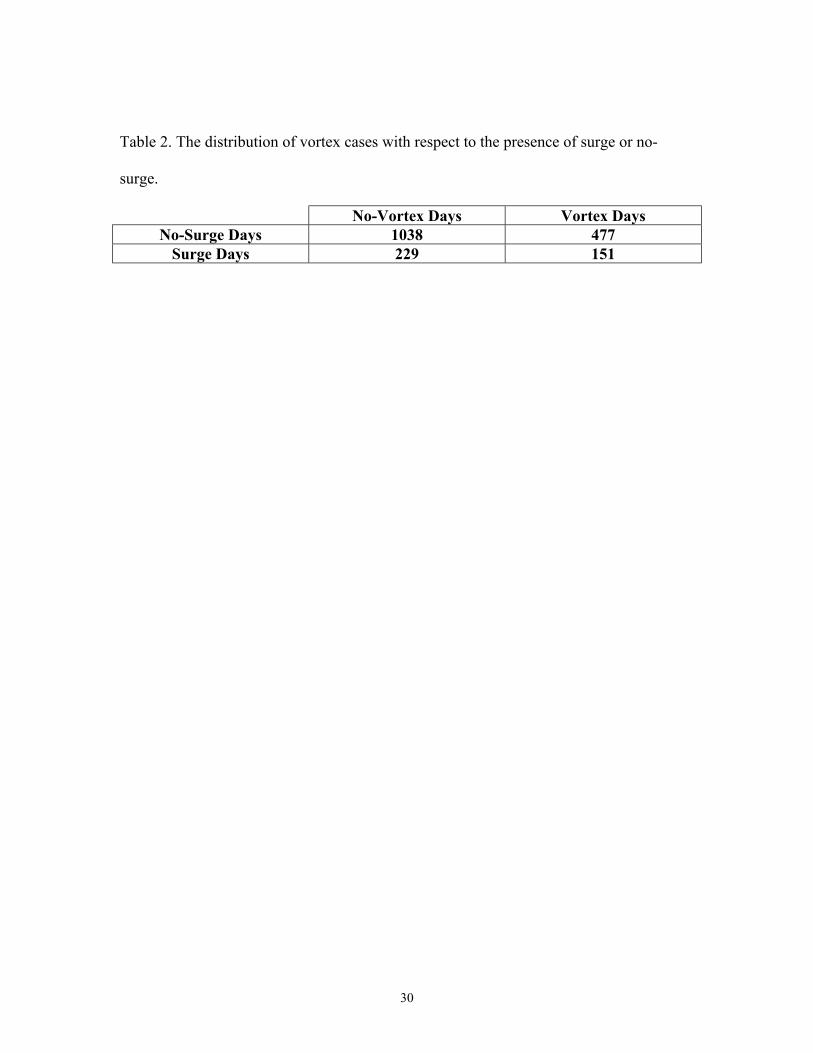
Table 2. The distribution of vortex cases with respect to the presence of surge or no-
surge.
No-Vortex Days Vortex Days No-Surge Days 1038 477
Surge Days 229 151
30

Table 3. The number of surge cases with respect to the MJO and the phase of the MJO.
No-MJO Days
MJO Days
MJO Phases 1-2
MJO Phases 3-4
Number of No-Surge Days 845 670 381 289
Number of Surge Days 242 138 56 82
Percentage of Surge Days 29% 21% 15% 28%
31
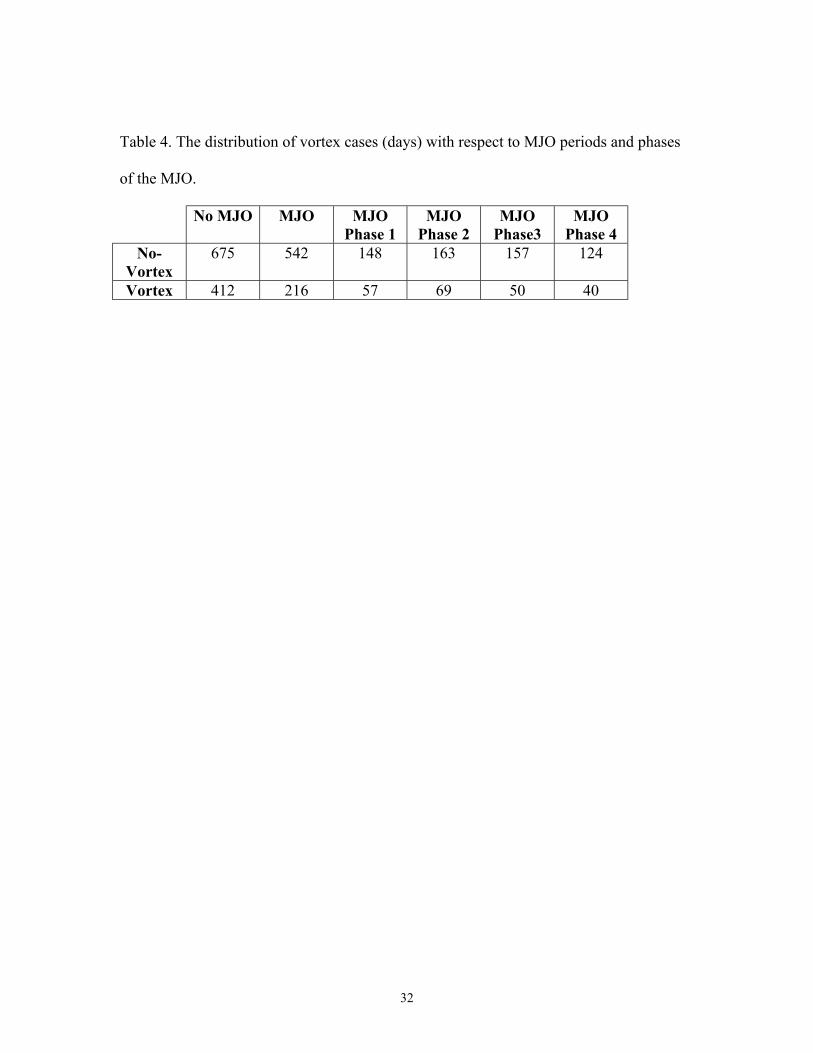
Table 4. The distribution of vortex cases (days) with respect to MJO periods and phases
of the MJO.
No MJO MJO MJO Phase 1
MJO Phase 2
MJO Phase3
MJO Phase 4
No-Vortex
675 542 148 163 157 124
Vortex 412 216 57 69 50 40
32

List of Figures
Fig. 1. Domain of the study and smoothed topography (m). The rectangular box is the
area within which the Borneo vortex is identified. The black horizontal bar is the area
for the surge index. See text for details.
Fig. 2. December-February (1979/80-2000/01) mean fields of (a) Convective Index, (b)
925 hPa winds (m s-1) and divergence (shaded, 10-5 s-1 ), and (c) 925 hPa winds
(m s-1) and vorticity (shaded, 10-5 s-1). The number of cases in each composite is
defined in Table 1.
Fig. 3. Individual monthly means (1979/80-2000/01) for (top row) convective index and
(bottom row) 925 hPa winds (m s-1) and divergence (shaded, 10-5 s-1) for (left column)
December, (middle column) January, and (right column) February. The number of
cases in each composite is defined in Table 1.
Fig. 4. Analyzed Borneo vortex center locations based on streamlines of unfiltered 925
hPa winds.
Fig. 5. Composite maps of (top row) Convective Index for (a) no vortex cases, and (b)
vortex cases, and (bottom row) composite maps of 925 hPa winds (m s-1) and
divergence (shaded, 10-5, s-1) for (c) no vortex cases, and (d) vortex cases. The
number of cases in each composite is defined by the column totals in Table 2.
Fig. 6. Same as Fig. 5 except for (a,c) no surge cases, and (b,d) surge cases, and the
number of cases in each composite is defined by the row totals in Table 2.
Fig. 7. Same as Fig. 5 except for (a,e) no surge and no vortex cases, (b,f) no surge and
vortex cases, (c,g) surge and no vortex cases, and (d,h) surge and vortex cases. The
number of cases in each composite is defined by each cell in Table 2.
33
Fig. 8. Composite maps of (top row) convective index and (bottom row) 925 hPa winds
(m s-1) and divergence (shaded, 10-5 s-1) for surge and vortex cases when the surge is
(a,d) weak (surge index between 8-10 m s-1, 76 cases); (b,e) moderate (surge index
between 10-12 m s-1, 41 cases); and (c,f) strong (surge index greater than 12 m s-1, 34
cases).
Fig. 9. Same as Fig. 8 except for surge and no-vortex cases when the surge is (a,d) weak
(136 cases), (b,e) moderate (62 cases), and (c,f) strong (31 cases).
Fig. 10. Composite 850 hPa winds (m s-1) and anomalous outgoing longwave radiation
(OLR, W m-2) for the four phases of the MJO based on the time coefficients of an
SVD analysis of the winds and OLR. See text for details of the SVD analysis. There
are 148 cases in the Phase 1 composite, 163 cases in the Phase 2 composite, 157 cases
in the Phase 3 composite, and 124 cases in the Phase 4 composite.
Fig. 11. Composite maps of (top row) convective index and (bottom row) 925 hPa winds
(m s-1) and divergence (shaded, 10-5 s-1) for MJO and vortex cases when the MJO is in
(a,e) Phase 1, (b,f) Phase 2, (c,g) Phase 3, and (d,h) Phase 4 based on the time
coefficients of the highest two modes of a SVD analysis of anomalous 850 hPa winds
and OLR. There are 57 cases in the Phase 1 composite, 69 cases in the Phase 2
composite, 50 cases in Phase 3 composite, and 40 cases in the Phase 4 composite.
Fig. 12. Summary of the percentage of days with no surge (No-S), weak surge (8-10),
moderate surge (10-12), and strong surge (≥12) that also contain a vortex for all days,
no-MJO days, and MJO days.
34
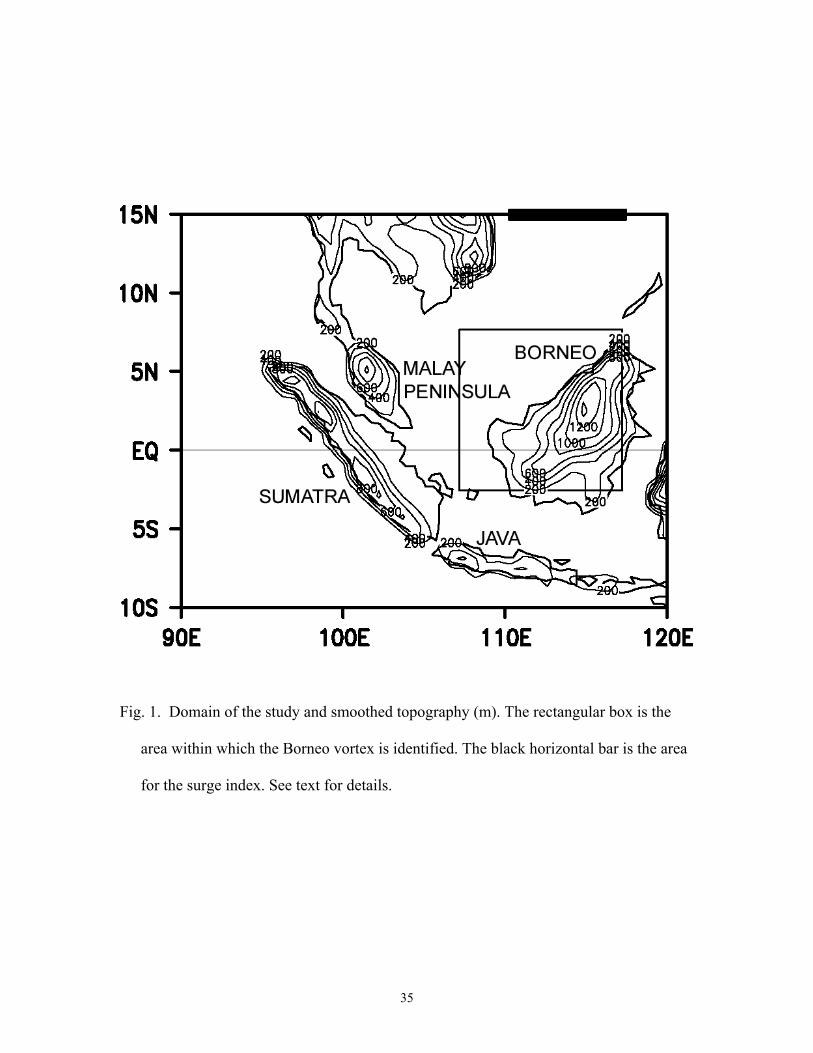
Fig. 1. Domain of the study and smoothed topography (m). The rectangular box is the
area within which the Borneo vortex is identified. The black horizontal bar is the area
for the surge index. See text for details.
35
(c) V&Vort (b) V&Div (a) CI
Fig. 2. December-February (1979/80-2000/01) mean fields of (a) Convective Index, (b) 925 hPa winds (m s-1) and divergence
(shaded, 10-5 s-1 ), and (c) 925 hPa winds (m s-1) and vorticity (shaded, 10-5 s-1). The number of cases in each composite is defined
in Table 1.
36

(e) V&Div, Jan (f) V&Div, Feb
(b) CI, Jan (c) CI, Feb
(d) V&Div, Dec
(a) CI, Dec
Fig. 3. Individual monthly means (1979/80-2000/01) for (top row) convective index and (bottom row) 925 hPa winds (m s-1) and divergence (shaded, 10-5 s-1) for (left column) December, (middle column) January, and (right column) February. The number of cases in each composite is defined in Table 1.
37

Fig. 4. Analyzed Borneo vortex center locations based on strreamlines of unfiltered 925 hPa winds.
38
(d) V&Div, vortex (c) V&Div, no vortex
(b) CI, vortex (a) CI, no vortex
Fig. 5. Composite maps of (top row) Convective Index for (a) no vortex cases, and (b) vortex cases, and (bottom row) composite maps of 925 hPa winds (m s-1) and divergence (shaded, 10-5, s-1) for (c) no vortex cases, and (d) vortex cases. The number of cases in each composite is defined by the column totals in Table 2.
39
40
(a) CI, no surge (b) CI, surge
(c) V&Div, no surge (d) V&Div, surge Fig. 6. Same as Fig. 5 except for (a,c) no surge cases, and (b,d) surge cases, and the number of cases in each composite is defined by
the row totals in Table 2.

(b) CI, no S, vortex (c) CI, S, no vortex (d) CI, S, vortex (a) CI, no S, no vortex
(h) CI, S, vortex (g) CI, S, no vortex (f) CI, no S, vortex (e) V&Div, no S, no vortex
Fig. 7. Same as Fig. 5 except for (a,e) no surge and no vortex cases, (b,f) no surge and vortex cases, (c,g) surge and no vortex cases,
and (d,h) surge and vortex cases. The number of cases in each composite is defined by each cell in Table 2.
41

(f) V&Div, Surge≥12 (e) V&Div, Surge 10-12 (d) V&Div, Surge 8-10
(c) CI, Surge≥12 (b) CI, Surge10-12 (a) CI, Surge 8-10
Fig. 8 Composite maps of (top row) convective index and (bottom row) 925 hPa winds (m s-1) and divergence (shaded, 10-5 s-1) for
surge and vortex cases when the surge is (a,d) weak (surge index between 8-10 m s-1, 76 cases); (b,e) moderate (surge index
between 10-12 m s-1, 41 cases); and (c,f) strong (surge index greater than 12 m s-1, 34 cases). 42
(f) V&Div, Surge≥12 (e) V&Div, Surge 10-12 (d) V&Div, Surge 8-10
(c) CI, Surge ≥12 (b) CI, Surge 10-12 (a) CI, Surge 8-10
Fig. 9. Same as Fig. 8 except for surge and no-vortex cases when the surge is (a,d) weak (136 cases), (b,e) moderate (62 cases), and
(c,f) strong (31 cases).
43
(a) MJO Phase 1 (b) MJO Phase 2
(d) MJO Phase 4 (c) MJO Phase 3
Fig. 10. Composite 850 hPa winds (m s-1) and anomalous outgoing longwave radiation (OLR, W m-2) for the four phases of the MJO based on the time coefficients of an SVD analysis of the winds and OLR. See text for details of the SVD analysis. There are 148 cases in the Phase 1 composite, 163 cases in the Phase 2 composite, 157 cases in the Phase 3 composite, and 124 cases in the Phase 4 composite.
44

(a) CI, Phase 1 (b) CI, Phase 2 (c) CI, Phase 3 (d) CI, Phase 4
(h) V&Div, Phase 4 (g) V&Div, Phase 3 (f) V&Div, Phase 2 (e) V&Div, Phase 1
Fig. 11. Composite maps of (top row) convective index and (bottom row) 925 hPa winds (m s-1) and divergence (shaded, 10-5 s-1) for MJO and vortex cases when the MJO is in (a,e) Phase 1, (b,f) Phase 2, (c,g) Phase 3, and (d,h) Phase 4 based on the time coefficients of the highest two modes of a SVD analysis of anomalous 850 hPa winds and OLR. There are 57 cases in the Phase 1 composite, 69 cases in the Phase 2 composite, 50 cases in Phase 3 composite, and 40 cases in the Phase 4 composite.
.
45

Fig. 12. Summary of the percentage of days with no surge (No-S), weak surge (8-10),
moderate surge (10-12), and strong surge (≥12) that also contain a vortex for all days,
no-MJO days, and MJO days.
46

With a height in the range of 3000 m, a mean wind speed of 10 m s-1 and a Brunt-Visala
frequency of 7 x 10⁻³ s-1, the nondimensional Froude number as defined by Smith
(1989) is on the order of 1 to 2. For elongated mountain ridges that cross the prevailing
wind, the flow characteristics is in a partial blocking regime (Smith 1989, see Fig. 5) with
rising motion
47