SYNERGISTIC CAPTURE MECHANISMS FOR ALKALI A ULFUR …
49
SYNERGISTIC CAPTURE MECHANISMS FOR ALKALI AND SULFUR SPECIES FROM COMBUSTION DOE/PC/90285--T2 DE92 008705 4,.,, ,. QuarterlyReportNo.3 for the period March- May 1991 "-,, DOE Grant Number DE-FG22-90PC90285 .. Prepared by T.W. Peterson, F.Shadman, J.O.L. Wendt and Baochun Wu Department of Chemical Engineering, University of Arizona, Tucson, AZ 85721 Submitted to Felixa Eskey, Pittsburgh Energy Technology Center, U.S. Department of Energy, P.O.Box 10940 Pittsburgh, PA 15236-0940 January 10, 1992. DIgTRIBLITtOI",IOF "'""j at,,J'"_ DOCUMENT IS I.JNLIMITED
Transcript of SYNERGISTIC CAPTURE MECHANISMS FOR ALKALI A ULFUR …

SYNERGISTIC CAPTURE MECHANISMS FOR ALKALI AND SULFURSPECIES FROM COMBUSTION
DOE/PC/90285--T2
DE92 008705
4,.,, ,.QuarterlyReportNo. 3
for the period March- May 1991 "-,,
DOE Grant Number DE-FG22-90PC90285 ..
Prepared by
T.W. Peterson, F.Shadman, J.O.L. Wendt and Baochun WuDepartment of Chemical Engineering,
University of Arizona,Tucson, AZ 85721
Submitted to
Felixa Eskey,Pittsburgh Energy Technology Center,
U.S. Department of Energy,P.O.Box 10940
Pittsburgh, PA 15236-0940
January 10, 1992.
DIgTRIBLITtOI",IOF "'""jat,,J'"_DOCUMENT IS I.JNLIMITED

,I
INTRODUCTION
Coal conversion and utilization processes, such as coal combustion, gasification
and their related pollution control, have received considerable attention in recent years.
Part of the reason is that the energy crisis and crude oil market instability make it
necessary to seek for another fossil fuel instead. Coal is certainly an ideal one because
of its huge storage on the earth and availability world wide.
There are still problems causing concern on the use of coal; for examples,
efficiency and pollution. Alkali compounds cause serious fouling and slugging problems
during the combustion process in pulverized coal burner and fluidized bed combustion,
and will also cause corrosive problem to the furnace and the heat exchange surface as
well. The fine aerosols and particles generated by the vaporizing and re-condensing of
alkali compounds can also cause health problem. The recent interest of the alkali
compounds control is in pressurized fluidized bed combustion (PFBC) and hot gas
combined cycle, which is considered to be the most promising and efficient way of
utilizing the fossil fuel like coal. The alkali compounds cause hot corrosion generally
corroding the turbine blades by attacking and destroying the protective oxide laye_
normally present on the metal surface at high temperature, which will shorten the life
time of high temperature gas turbine and increase the manufacturing expense
dramatically.

Sodium and potassium exclusively represent !he alkali metals in coal. In general,
sodium occurs predominantly in association with organic matter in low rank lignite and
subbituminous coals (Neville and Sarofim,1985). In high rank bituminous coals, sodium
is found primarily in the mineral grains as halite (NAC1)and to some extent as a lattice
substituent in the aluminosilicate mineral illite, a layered clay related to muscovite
(Gluskoter and Ruch, 1971). In contrast, potassium is rarely observed as the halide in
coals of ali ranks. It was found that potassium occurs almost exclusively in the mineral
illite in coals ranking from subbituminous to anthracite, but it is also present in a
noncrystalline environment in lower rank subbituminous and lignite coals (Spiro et al.
1986). In selected United States coals, sodium content varies from 30 parts per milliori
by weight to nearly one weight percent of the dry coal, while potassium varies from 30
parts per million to over two percent by weight (Harvey and Ruch.1986).
The vapor pressure of alkalies in the flue gas during the combustion is mainly
determined by the form of sodium and potassium in the coal. Sodium chloride is readily
vaporized above 800°C because of its low melting point and high volatility. The
organically bound sodium and potassium, significant in low rank coals, is also easilye"
volatilized during the combustion. On the other hand, it is expected that alkali associated
with aluminosilicate minerals is not as readily volatilized due to its stability and low
vapor pressure at combustion temperatures. Experiments showed that most of the
organically bound sodium and sodium chloride were found to be volatilized in the frame,
while the sodium associated wita silica-rich grains was retained in the residual ash
(Neville and Sarofim, 1989). Since most of the potassium in high-rank coals occurs in

the non-volatile aluminosilicate mineral illite, it is expected that little of this potassium
will be vaporized during the combustion. Several ash samples from combustors, gasifiers
and auxiliary equipment to determine the form of potassium after conversion of a high
rank coal were analyzed (Spiro. 1986). The results showed that the potassium is present
primarily as a noncrystalline aluminosilicate glass melt. The XANES features of this
' material were found to be identical to those obtained by pyrolysis of pure illite atl
] 1000°C, suggesting that most of the potassium is not vaporized. It can, however, belii released to the vapor phase by exchanging reaction with sodium (Jacson and Duffin.|| 1963). The alkali metal in ash from six different coals was explored through a 17 kw
I downflow coal combustor and Wendt et al., 1990).laboratory pulverized (aallagher
i The interaction of alkali with other minerals, existing in the coal, during thecombustion and gasification process is quite complex and is not quite understood yet. It
is considered that the form of alkali during and after combustion as with the non-alkaliIJ
| mineral matter, is the result of several processes that takes piace sequentially orm
lisimultaneously. Those processes include phase changes and chemical reactions,
vaporization, chemical reaction in the vapor phase, nucleation of vapors and t,,e reaction
of vapors with condensed phase materials such as the mineral matter in ash and
equipment surfaces (O'Gorman and Walker, 1973; Sarofim et al., 1977; Quann e_ al.,
1982; Raask, 1985). The interactions of alkali compounds with carbon and minerals at
high temperature are also investigated (Shadman and Punjak, 1989)
i
, , , ,, i , ii ''I , i , ,, , '

The gas phase reaction of alkali vapor with sulfur oxides also affects the alkali
chemistry. The majority of sulfur in coal is usually associated with iron and other n,,etals
in minerals such as pyrite, marcasite and pyrrhotite (Raask, 1985). During the
combustion, most of the sulfur is oxidized to gaseous SQ and SO3 which then can react
with other species, including alkali compounds. Alkali chlorides and oxides react rapidly
with sulfur dioxide and sulfur trioxide at the temperature below l l00°C to form alkali
sulfates (Reid, 1981). The thermodynamic calculations of Halstead and Raask (1969)
suggest that the sulfation proceeds through a series of gas phase reactions. The alkali
sulfates are also known as one of the major corrosive sources to the gas turbine. The
formation of sulfates
can also occur at lower temperature without a gaseous intermediate. The formation of
solid NaaSO4 was observed by heating coal impregnated with sodium chloride to a
temperature of 475 K in air (Daybell and Pringle, 1958).
One of the major concerns is the relatively high concentration of alkali compound
vapor in the gas phase. In application a low concentration is preferred for low risk of
fouling and slugging and lc w corrosive to the equipments and heat exchange surface. In"'2
some application like PFBC and combined cycle, a extremely low concentration of alkali
vapor is required. The current industrial gas turbi:;e specification limit for alkali metal
compounds in the combustion gas entering a turbine is equivalent to 0.024 ppm. An
effective way for the removal of alkali vapor are by adsorption an:t reaction on solid
sorbents. Various sorbents are tested in fixed-bed filter through which the hot flue gas
passes. A series sorbents were tested under different temperature, superficial gas velocity

and residence time in order to develop a suitable sorbent for alkali sorption (Lee and
Johnson, 1980). An adsorption mechanism of activated bauxite capturing the alkali
chlorides is suggested with the present of water vapor, and both chemical fixation by clay
minerals in the bauxite and physical adsorption are suggested without water (Lee et al.,
1986). A well defined fundamental study was conducted by Luthra and Leblanc (1984)
by using a thermo-gravimetric analyzer (TGA) concluding that the mechanism for alkali
capture by alumina and bauxite was physical adsorption. In the present of water vapor,
emathlite was found to be superior for alkali removal (Mulik et al., 1980 and 1983;
Bachovchin et aL., 1986). Shadman and Punjak (1988) investigated the fundamentals of
alkali adsorption on kaolinite, bauxite and emathlite both experimentally and theoretically,
and suggested that the alkali capturing process is not a simple physical condensation, but
a complex combination of several diffusion steps and reactions. Bauxite and kaolinite
react with NaC1 and water vapor to form nephelite and carnegieite and release HC1.
However, emathlite reacts to form albite and HCL vapor. Later works further showed
the match of theoretical model with experimental data (Shadman and Uberoi, 1989). The
in-situ capturing of alkali compounds by fine powder sorbents during the pulverized coal
combustion is also important (Klinzing et al., 1986). Kaolinite and bauxite as in-situ
additives for alkali removal were tested in our laboratory scale pulverized coal
combustion system (Wendt et al., 1988).
Due to the generation of a wide variety of pollutants during coal combustion,
research on the development of a multi-function sorbent for adsorbing SO2 and alkali
compounds simultaneously is ongoing at the University of Arizona. The current workiiII
:' nIl_

focuses on the thermodynamic behavior of the reacting system for alkali adsorption
especially in gas phase. The temperature and pressure effects on sodium species and on
the system are intensively investigated under the simulated flue gas composition
condition. The interaction of sulfur dioxide with sodium chloride vapor and some other
system elements is also explored.

EXPERIMENTAL SETUP AND PROCEDURE
EXPERIMENTAL SETUP
Several factors are considered in the design of the experimental setup. First a
stable easy control source of alkali vopor is needed. Second a certain temperature range
of interest must be realized. And the third a continuous weight change must be
monitorable in order to obtain "kineticdata from experiment. The experimental setup here
is based on a thermogravimetric system. A schematic diagram of this system is given in
Figure 1. It consists of four main components: a gas preparation section, a quartz
reactor, an electronic microbalance to monitor alkali delivery and a movable electric
furnace. A detail description of each of them is given below.
1. Gas Preparat.ion Section
The purposes of this section is that a simulated flue gas from coal combustion
furnaces is created which contains 80% of Nitrogen, 15% of carbon dioxide, 3% of
oxygen and 2 % of water vapor by volume. One ultra-high-pure (UHP) nitrogen cylinder
of 220 cubic feet connects with two other cylinders of carbon dioxide and compressed air
to form a desired mixture which will flow through a saturator to pick up some water
vapor. In order to prevent water vapor condensation on the wall of its flowing tube,
another UHP nitrogen is introduced after the saturator. Then the desired gas composition
is obtained. To protect the balance mechanism and have a stable operation, an UHP
nitrogen is used to purge the microbalance. A flow element is introduced to each
cylinder for individual control of the flow rate by changing the pressure of upstream of
the element. The saturator, consisting of a gas washer and a heater, operates at 50°C,
which is higher than room temperature, to be certain that it is at saturation.
2. Electronic Microbalance
A Cahn 2000 Electrobalance is used here, which can give a very sensitive in-situ
monitoring of weight lose and gain during experiments. The output of the balance is as
a 0-10 mv signal to a Houston Instruments strip chart recorder from the electrobalance
controller. A preset chart speed allowed the weight to be monitored as a function of
time. The sample itself was placed in a platinum basket that is suspended from the
balance by a platinum wire. Mechanical and electronic taring of the balance allowed i(
to be calibrated prior to each experiment.
The Cahn 2000 balance consists of a balance beam mounted to, sapported by and
pivoting about the center of a taut ribbon; a torque motor coil located in a permanent
magnetic field and also mounted to the taut ribbon; sample suspension fixtures; a beam
p,_sition sensor system; and controls, circuitry and indicators. The principle of this
balance is that the weights to be measured are applied in a downward direction from the
sample side of the beam. Counterweights are applied downward from the opposite side
of the beam. The forces, created by the weights, acting from both sides of the beam
produce a torque about the axis of rotation. An electric current flowing in the torque
motor coil also produces a torque about the axis of rotation, as does the taut ribbon.
When the beam is at its horizontal reference position as detected by the beam position
sensing system, and when the torque from the torque motor is equal and opposite to the

sum of the taut ribbon torque and the torques due to the forces acting from both sides of
the beam, then the beam is said to be balanced. When the beam is balanced, the electric
current flowing in Lhetorque motor coil is a direct measure of the combination of forces
applied from both sides of the beam and the torque from the ribbon. The current is
monitored by a Cahn 2000 Controller and output to a chart recorder, during calibration,
a direct readout of the weight change can be obtained from the chart recorder. The
,R 'balance is designed for weight up to 2.5 grams and is sensitive to weight changes as _mah
as 0.1 microgram.
3. Reactor System
This system consists of a quartz reactor and a high temperature furnace. A
Lindberg model 54459 single zone electric furnace is used to heat the reactor. It was
mounted in a vertical position with one opening at the top that allowed it to be raised so
that it enclosed the lower portion of the reactor. To allow vertical motion of the furnace,a_.
| four wheels were mounted on it and aligned to ride in vertical steel channel tracks.
i Raising and lowering was accomplished a operatedof the furnace with hand winch. This
i configuration allowed the furnace to be preheated and then raised so that the reactor could
i be heated to the operating temperature in one rapid step. Likewise, lowering the furnace
allowed rapid termination of the experiment at any time. The furnace temperature, witha range up to 1200°C, was controlled with a separate PID Eurotherm controller connected
to a platinum/platinum-13% rhodium thermocouple. The temperatures of source and
reaction zone during experiments are monitored by two chromel/alumel thermocouples.

Due to its high reactivity, sodium chloride can react with most inorganic materials
at high temperature, for example pure quartz, which is most commonly used material for
making high temperature reactors. Also sodium chloride is very easy to condense on just
about any surface especially under 800°C. Because of those, a number of factors are
under consideration in the design of the quartz reactor. First, a stable unique source is
a must to maintain the sodium chloride constant concentration; Second, the source
temperature must be lower than that of sorbent in order to prevent large condensation of
alkali on the sorbent; Third, the temperatures of source and reaction zone are easy to
control and to change within interesting temperature range. Two configurations of design
are considered here. Figure 2 shows details of reactor designs. The ideal configuration
is that the source be located at the bottom of the reactor while the sorbent be suspended
above it. A very small amount of UHP nitrogen is introduced right above the source,
between the source and sorbent, to dilute the vapor concentration of alkali compound
under the saturation (Fig.2 a). The other configuration of reactor design (Fig.2 b) is that
the source pan is put in the horizontal arm of the reactor heated by a separate tape heater
controlled by a variable transformer. The sorbent is suspended in the main reactor
assembled with the balance. The advantages of this reactor is that it is easy to control
, the temperature of source and sorbent separately, and it is easy to change the temperature
of reaction zone.
EXPERIMENTAL PROCEDURE
Experiments will be conducted by first preparing the samples. The selected
sorbent, like kaolinite and bauxite, weighing about 40 mg is pressed to become pellet of
10

approximately 300 micrometer thickness. Tile pellet then is devolatilized under nitrogen
at 900°C for two hours. And then the sorbent is place in a platinum basket suspended
on the bMance. A typical experiment begins by placing about one gram of sodium
chloride in a quartz container in the bottom or horizontal leg depending on the reactor
used, then reverse the flow and let the reactor temperature of both source and sorbent
reach the preset temperature and also prevent initial sodium vapor reaching the sorbent
while the concentration is not uniform, waiting until everything is stabilized, turn the
flow to normal and start the reaction.
r'
ll

THERMODYNAMIC ANALYSIS
FUNDAMENTAL OF CALCULATION
The theoretical thermodynamic properties for a chemical system can be obtained
by the knowledge of chemical equilibrium compositions of the system. These properties
cre very useful here for designing and setting up the experiment, and are also very useful
for predicting and evaluating the experimental results. There are two equivalent
formulations to describe the chemical equilibrium -equilibrium constants and
minimization of free energy. Comparing with each other of these two formulations, the
disadvantages of the equilibrium constants are more bookkeeping, numerical difficulties
with use of components, more difficulty in testing for presence of some condensed
species, and more difficult in extending the generalized method for nonideal equations of
state. For these reasons, the free-energy minimization formulation is used. The
condition for equilibrium may be stated in terms of any of several thermodynamic
functions such as the minimization of the Gibbs free energy or Helmholtz free energy or
the maximization of entropy. The function chosen mostly depends on what parameters
are used for the characterization of a thermodynamic state. The Gibbs free energy is, .2
most easily minimized in as much as temperature and pressure are its natural variables.
Similarly, the Helmholtz free energy is most easily minimized if the thermodynamic state
is characterized by temperature and volume (or density). So as the maximization of
entropy by temperature and entropy. Since the system here is characterized by
temperature and pressure, the Gibbs free energy is used.
J
In the system here, a simulated flue gas and sodium chloride are considered. A
theoretical distribution of sodium in products was calculated by assuming equilibrium
conditions. This was done by using a computer program developed at NASA Lewis
Research Center which has been widely accepted since 1962. The program uses the
assumptions that ali the gases are ideal and that the interactions among phases can be
neglected. The ideal gas law is assumed to be correct even when small amounts of
condensed species are present. These condensed species are assumed to occupy ai
negligible volume and exert a negligible pressure compared to the gaseous species.II
There are large number of species in various phases were involved. Altogether
197 chemical species were considered in flue gas-NaC1 system, 231 species in flue gas-
NaC1-SO 2 system. There are listed in Table 1. and Table 2. respectively. In the
products, species mole fraction less than 10E-8 are considered trace species, and therefore
are not counted as products.
Table 3. gives the initial system feed compounds and their weight percentage.
RESULTS AND DISCUSSION
In the equilibrium calculations here, a temperature range from 700°C to 1500°C
is used. A pressure range from 1 atm to 10 atm was also involved in order to explore
the thermodynamic properties of the pressured systems and the possible applications in
the PFBC. The gas composition used here is maintain 80% of nitrogen, 3 % of oxygen,
15 % of carbon and 2 % of water vapor in ali the calculation except in the flue gas-NaC1-

SO,.. systems where nitrogen is 79.9 % and SO2 is 0.1%, and the rests remain the same.
NaC1 is put inside the systems as a solid fuel.
Table 4. gives a typical result of the equilibrium calculation for the flue gas-NaC1
systems. The first important result is the distribution of products, which shows what the
final possible compounds are at equilibrium. Mole fraction of the products after
equilibrium is another one which tells quantitatively tl,e amount of each product in the
system. The equilibrium result under selected temperatures at one atm is shown in Figure
3. The horizontal axis, the number reference to Table 3, indicates the compounds or the
products of the system after equilibrium. We can see very clearly the major products of
mole fraction up to the order of percentage level are CO2, H20, Na, NaC1 so!ld, liquid
and gas, 02 and Na2C12, all of which except the last one-Na2C12 are the initial feed
materials. NA2CL2 is the chemical reaction product which is not negligible especially
at high temperature like above 1400°C. A more detail analysis of the compound will be
discussed later. The other products have the concentration from 0.01 part per million
(ppm), like Na2(OH) 2 0.013 ppm and N20 0.018 ppm, to few hundred ppm, like He1
257.5 ppm and NO 310.3 ppm and NaOH 259 ppm. The gas phase composition of the
same system is given in Figure 4 which indicates that the main change of the gas phase
composition is caused by the phase change of the sodium chloride which mostly depends
on temperature at a certain pressure, a minor contribution, is from the Na2C12and some
other gases make their change in the ppm level.
Sodium species is of the most interest of this work. Figure 5 shows the
distribution of sodium species in the three phases. We can see that almost all the sodium
chloride will stay in the solid phase under the temperature of 1000°C. With the
temperature over 1100°C, there is no solid phase. Liquid phase will be the major form
of sodium species under 1200°C, and gas phase will play a significant part beside liquid
phase of temperature above 1200°C. At 1500°C, as high as 35 percent of sodium species
is in the gas phase, which makes up the sodium concentration inside the gas phase as high
as 11 percent. The compounds and their percentage in these three phase are shown in
Figure 6. The distributions of sodium species under different temperatures are given in
Figure 7. The x-axis again is the sodium compounds while y-axis gives the percentages
of integrated form of all the compounds left to the compound pointed on the x-axis. At
1500°C, sodium chloride in gas phase is about 27 percent of the total sodium species
inside the system, Na, C127.5 %, the other species in the vapor phase Na,NaO,NaOH and
Na2OH2. have the concentration of 5 ppm, 0.2 ppm, 259 ppm and 0.02 ppm, the
condensed phase of sodium chloride liquid makes its contribution up to about 65.4%.
The fraction of each species in the vapor phase decreases rapidly with the decrease of
temperature, like sodium chloride is about 9% at 1400°C, a drop of 18% from that at
1500°C, and Na2C12has similar behavior (see also Fig.6). The total fraction of sodium
species in the vapor phase is 34.8% at 1500°C, 11.5% at 1400°C, 3.1% at 1300°C, and
the rest is from 0.3 % at 1200°C to a few ppm at 900°C. The effect of temperature on
the formation of NaC1 and Na2C12vapor is given in Figure 8. The Y-axis gives the mole
percentage of NaC1 and Na2C12 in the gas phase. We can see a very strong effect of
tem _erature on both NaC1 and Na2C12concentrations in the gas phase when temperature
15

over 1200°C especially for temperature above 1300°C. Tile concentration of sodium
chloride from 11% at T=1500°C drops to about 4% at T= 1400°C, 1.3% at 1300°C and
0.3% at 1200°C. The concentrations drop to the order of magnitude of ppm level at
temperature lower than 1100°C. Meanwhile, Na2C12concentration changes at the same
tendency, from 2.9% at 1500°C to 1.3% at 1400°C, about 0.4% at 1300°C, and 0.1%
at 1200°C and than ppms at the temperature lower than 1100°C. The results show the
strong effect of temperature and also the production of significant amount of Na,..C12
vapor as one of the major sodium species in the gas phase, which means the Na2C12 is
not negligible. The ratio of Na22C12 to NaC1 is about 13% at temperature 700°C, a
linear increase with the temperature is observed in the temperature range of 700-1100°CI '
and a maximum of 43.67% is reached at l l00°C, and the ratio drops again almost
linearly with the increase of the temperature to a value of a little more than 26% at
1500°C (see Fig. 9). Overall, a significant portion of Na2C12is produced in this thermo-
equilibrium system, which suggests that Na,.C12 should be considered in the exploring of
the mechanism of the sodium chloride adsorption in which most of the works done before
did not consider the contribution of Na2C12.
¢'.
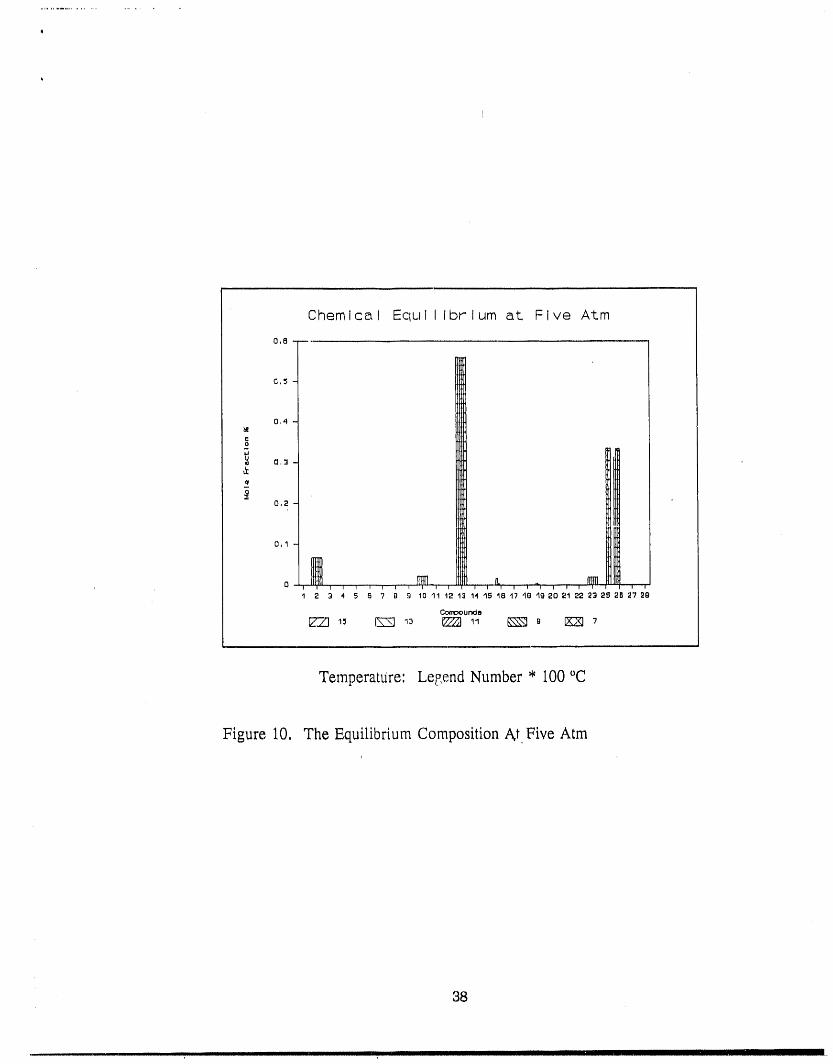
The system behavior under the pressure is another major part of this work, which
will give us some of the ideal of equilibrium properties which is not so easy to obtain by
experiment and also expensive. The calculation results presented below show some very
interesting points. The equilibriums at pressure 5 atm and 10 atm are given in Figure 10
and 11 respectively. Comparing with the equilibrium at 1 atm (Figure 3), the main
difference is the NaC1 and Na2C12mole fractions in which the later is much higher. And
16

with the increase of the pressure of system, the concentrations of NaC1and Na2Cl2will
drop very rapidly (Figure 12 and 13), at 1500°C, NaC1 concentration from 8.7 mole
percen_ at 1 atm drops to 3.9% of mole fraction at 2 atm and 2.6% at 3 atm, and at
pressure higher than that, the concentration drop tends to be slow and close to a constant
of 0.8% at pressure of 10 atm and higher. It is hard to see the change of concentration
of NaC1 at lower temperature because of the scale difference, a scale up result at 900°C
is given in Figure 14. We can see a surprising similar change pattern of concentration
vs, pressure to that at high temperature of 1500°C, and in fact, this change is similar in
all the temperature range except their absolute values are different with different
temperature. We also :_otice that at pressure over 6 atm, the concentration of NaC1 ii
very low therefore no measurements are needed for absorption of NaC1 for most of
PFBC-combine cycle applications.
The concentration of NaaC1a decreases with the increase of pressure as well
(Figure 13), from 2.3% at 1500°C at 1 atm to 1.1% at 2 atm at the same temperature
and also tends to a constant of 0.2% at 10 atm or higher. This is exactly the same
change form with that of NaC1 vs. pressure, which further shows the conce_.trationsofq,
both in the system is closely related and also shows their companionship which indicates
that the mechanism of the formation of Na2C12is proportion to NaC1concentration. Both
NaC1and Na2C12concentration drop will directly affect thecomposition and concentration
of sodium species in the gas phase (see Figure 15). The reason for increasing of pressure
resulting in a decrease of sodium species in the gas phase is that higher pressure will
17
II

rnake the sodtum more likely to stay in the condensed phases of solid or liquid (figure
16). Condensed phases play a major part at high pressure.
The other major effect of pressure is the formation of Na2CO3(2)at 1 and 2 atm,
the product appears at temperature range of 800 to 1100°C and concentration from 0.07
ppm to about half ppm at 1atm and from 0.07 ppm to about 1 ppm at 2 atm. At 3 atm,
there is no Na2CO3(2)at 800°C and at pressure over 4 atm, a liquid NazCO3is formed
at temperature 1200°C beside Na2CO3(2), the concentration from 0.05 ppm at 4 atm to
1.5 ppm at 10 atm.
The globe thermodynamic equilibrium calculationof the system under the pressure
shows that the increase of the pressure can decrease the concentration of sodium species
in the gas phase dramatically. Under the high pressure, for example pressure higher than
10 atm, and low temperature, lower than 900°C, the akali vapor concentration in the gas
phase is not significant.
The presence of sulfur species in the system does not effect the sodium species in
the gas phase significantly. In fact, it does not affect the formation of NaC1and Na2C12
at all (see Figure 17). The distribution of sodium species (Figure 18) is the same with or
without sulfur dioxide except some of the minor change in the Na and NaO
concentration, a minor reduction of them creates sodium sulfates. Because of the
concentrations of Na and NaO are not significant, the formation of sodium sulfates is not
significant. It is in the PPB level. The effects of temperature and pressure to the sodium
18
!

species on the system are the same to that without SO2 as far as the major contribution
of sodium species in tlm gas phase is NaCI and Na2C12,
.t
19

CONCLUSION
The study so far includes two parts, One part is about the design of an
experiment setup. The other part is about the thermodynamic equilibrium calculation and
sodium species distribution. The following results are obtained:
1. The experimental system is setup and some of the experiments are
underway.
2, The global thermodynamic equilibrium calculation of the system shows that
temperature and pressure have a very strong effect on the sodium species concentration
in the gas phase. The increase of the former will increase the sodium species
concentration and the increase of the latter will decrease the concentration.
3. At pressure higher than 10 atm and temperature lower than 900°C, the
formation of sodium species in the gas phase is not significant.
4. The sulfur species does not affect the sodium species in the vapor phase
very much.
An extensive experimental work is planned to explore the absorption of sodiumt
species in the gas phase and the interactions of sodium and SO2 with' calcium based
sorbents and aluminum-silica based sorbents, and between sorbents themself.
20

REFERENCES
i
Daybell, G.N, and Pringle, W.J,S., Fuel, 37,283, 1985.
Gallagher, N,B., Bool, L,E. and Wendt, J,O.L, Combus. Sci. Tech,, Vol. 74,211-221,
1990
Gluskoter, H.J. and Ruth,R.R., Fuel, 50, 65, 1971.
Halstead, W.D. and Raask, E,, J. Inst, Fuel, 42, 344, 1969 '
_" Harvey, R.D. and Ruth, R,R., ACS Symposium Series, ISSN 0097-6156, 301,
1986.
Jackson, P,J,, and Duffin, H C., Conf. Mechanism of Cm'osion by Fuel Impuritiesl
Marchwood U.K., Butterworth, London. 427, 1963.
-" Lee, S H.D and Johnson I. J Eng, Power, 102,397, 1980.I , 0 } 'l
I Lee, S.H.D. and Henry, S.D., ANL-FE-86-7; Argonne National Labtory; Argonne, IL,
: 1986
Mulik, P.R. et al, DE-AC21-81MC16327, Pittsburgh, PA, 1983
Neville, M. and Sarofim, A.F., Fuel, 64(3), 384, 1985
O'Oorman, J.V. and Walker, P.L., Fuel, 52, 71, 1973
Punjak, W.A.;Uberoi, M, and Shadman, F., AICHE J., 35(7), 1989
Punjak, W.A. and Shadman, F., Energy and Fuel, 2, 702, 1988.
ii Rizeq, R.G., and Shadman, F,, Chem, Eng, Commun, 81, 1989.Quann, R.M. et al, Enviro. Sci. Tech., 16, 776, 1982.
1!1 Raask, E., Mineral Imperities in Coal Combustion, Hemisphere, New York, 1985.
Reid, W.T., Chemistry of Coal Utilization, New York, 1981.
i,I

Sarofim, A,F, et al, Com. Sci. and Tech,, 16, 187, 1977.
Shadman, F. and Punjak, W,A,, Combustion Inst., Tucson, 1986,
Spiro, C,L et al, ACS National lVIeeting, 34(2), 1989.
22


SOUI'C@
a. b.
" Figure 2. The Configuration of Reactor Designs
24

Table i, Mole Fractions Of Simulated Flue Gas - NaCI
Equilibrium AT One Atm
Mole Fraction
Number Compound Temperature °C ' _,',
1500 1300 ii00 900 _,
i CO 2 15E-06 6 15E-08 5 30E-lO 5 52E°13
2 CO2 6 82E-02 6 69E-02 6 67E-02 6 67E-02
3 CI 6 23E-06 2 40E-07 4 03E-09 6 76E-II
4 CIO 2 36E-08 1 3!E-09 3 26E-II 9 47E-13
5 C12 1 46E-08 5 58E-I0 1 07E-II i 27E-12
6 HCf 2 58E-04 3 35E-05 2 80E-06 4 71E-07
7 HOCI 1 26E-08 1 44E-09 9 20E-II i 04E°II
8 HO2 3 66E-08 8 23E-09 i 05E-09 5 34E-II
9 H2 2 69E-07 1 14E-08 i 71E-lO 4 15E-13
I0 H20 2 19E-02 2 17E-02 2 17E-02 2 17E-02
ii NO 3 10E-04 9 87E-05 2 12E-05 2 30E-06
12 NO2 5 63E-07 3 89E-07 2 21E-07 9 82E-O8
13 N2 5 71E-01 5 60E-OI 5 59E-01 5 59E-01
14 N20 1 84E-08 6 75E-09 1 65E-09 2 20E-lO
2.5
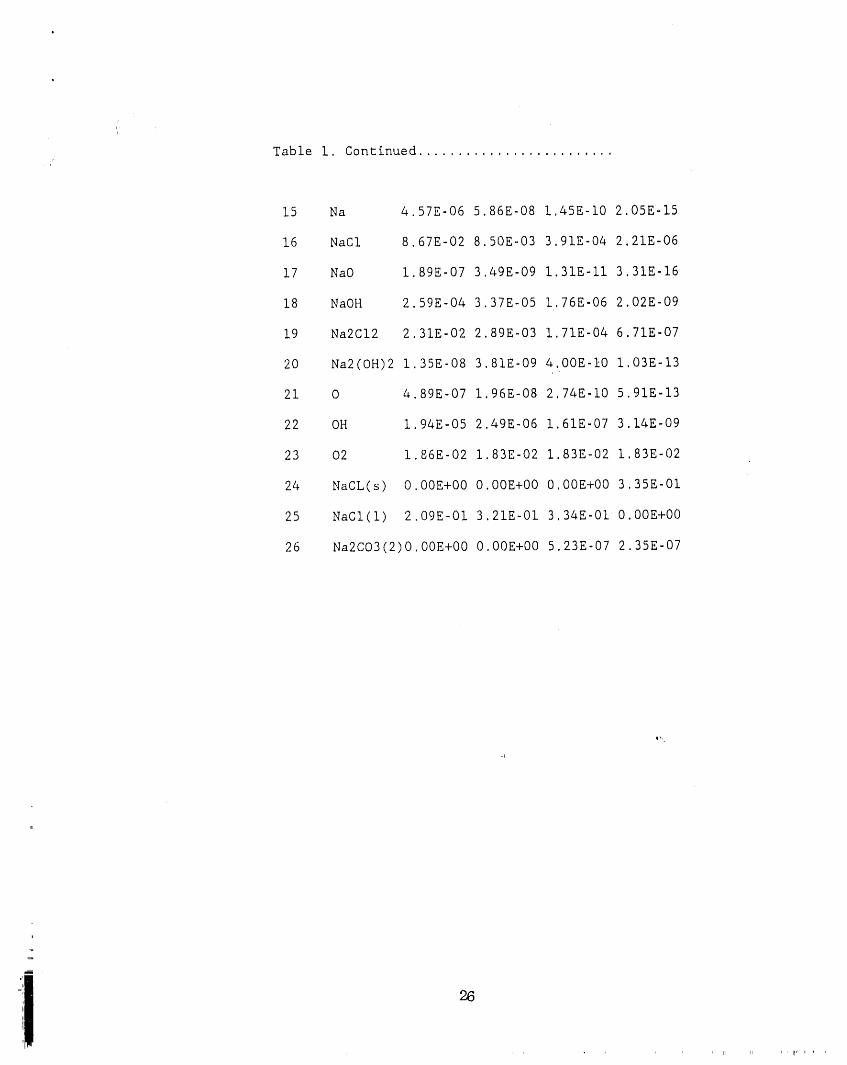
Table i. Continued ............ .............
15 Na 4 57E-06 5 86E-08 1 45E-I0 2 05E-15
16 NaCI 8 67E-02 8 50E-03 3 91E-04 2 21E-06
17 NaO 1 89E-07 3 49E-09 i 31E-II 3 31E-16
18 NaOH 2 59E-04 3 37E-05 1.76E-06 2 02E-09
19 Na2CI2 2 31E-02 2 89E-03 i 71E-04 6 71E-07
20 Na2(OH)2 1 35E-08 3 81E-09 4.00E-lO 1 03E-13
21 O 4 89E-07 1 96E-08 2 74E-I0 5 91E-13
22 OH 1 94E-05 2 49E-06 1 61E-07 3 14E-09
23 02 1 86E-02 i 83E-02 1 83E-02 i 83E-02
24 NaCL(s) 0 00E+O0 000E+O0 000E+00 3 35E-01
25 NAC1(1) 2 09E-01 3 21E-OI 3 34E-01 0 00E+00
26 Na2CO3(2)0 00E+O0 000E+O0 5 23E-07 2 35E-07
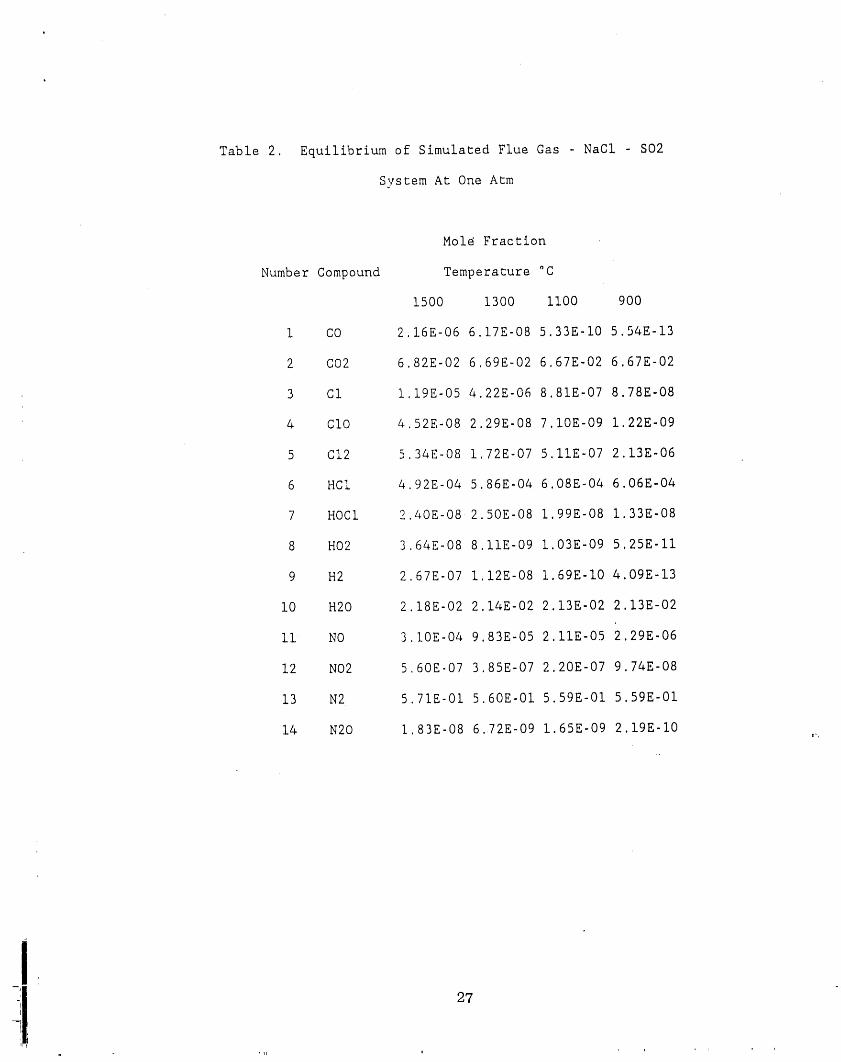
Table 2, Equilibrium of Simulated Flue Gas NaCI - SO2
System At One Atm
L
Mol_ Fraction
Number Compound Temperature °C
1500 1300 ii00 900
i CO 2 16E-06 6 17E-08 5.33E-I0 5 54E-13
2 C02 6 82E-02 6 69E-02 6,67E-02 6 67E-02
3 CI i 19E-05 4 22E-06 8.81E-07 8 78E-08
4 CIO 4 52E-08 2 29E-08 7 10E-09 1 22E-09
5 C12 5 34E-08 1 72E-07 5 lIE-07 2 13E-06
6 HCI 4 92E-04 5 86E-04 6 08E-04 6 06E-04
7 HOCI 2 40E-08 2 50E-08 1 99E-08 1 33E-08
8 HO2 3 64E-08 8 lIE-09 1 03E-09 5 25E-II
9 H2 2 67E-07 1 12E-08 1 69E-I0 4 09E-13
i0 H20 2 18E-02 2 14E-02 2 13E-02 2 13E-02
ii NO 3 IOE-04 9 83E-05 2 lIE-05 2 29E-06
12 NO2 5 60E-07 3 85E-07 2.20E-07 9 74E-08
13 N2 5 71E-OI 5 60E-OI 5.59E-01 5 59E-01
14 N20 1 83E-08 6.72E-09 1.65E-09 2.19E-I0
I

Table 2. Continued .............................
15 Na 2 39E-06 3 34E-09 6 64E-13 1 58E-18
16 NAC]. 8 67E-02 8 50E-03 3 91E-04 2 21E-06
17 NaO 9 82E-08 1 98E-I0 5 95E-14 2 54E-19
18 NaOH 1 35E-04 1 90E-06 7 93E-09 1 54E-12
19 Na2CI2 2 31E-02 2 89E-03 i 71E-04 6 72E-07
20 Na2SO4 2 63E-05 7 71E-07 5 71E-09 2 56E-12
21 0 4 87E-07 1 95E-08 2 73E-I0 5 88E-_3
22 OH 1 93E-05 2 46E-06 1 59E-07 3 10E-09
23 02 1 85E-02 1 82E-02 i 82E-02 1 82E-02
24 S02 i 28E-04 i 19E-05 2 88E-07 2 52E-09
25 SO3 7 37E-07 2 40E-07 2 98E-08 2 80E-09 _
26 NaCl(s) 0 00E+O0 000E+O0 000E+00 3 34E-01
27 NAC1(1) 2 09E-OI 3 21E-OI 3 33E-01 0 00E+00
28 Na2SO4(i)0 00E+00 000E+00 3 05E-04 3 05E-04
29 Na2SO4(1)I 57E-04 2 90E-04 000E+O0 0 00E+O0

Table 3, Initial Reactants Feed In The System
Compound Weight (%) State Temperature (K)
Nz 80 gas 298.15
Oz 3 gas 298,15
COs 15 gas 298.15
H20 2 gas 298.15
NaCI I00 solid 298,15

Table 4. Species Being Considered In The Equilibrium In a
Simulated Flue Gas - NaCI System At One Atm
THERHO
REACTANTSN 2.0000 0,0000 0.0000 0.0000 0,0000 _O.O00OO0 0.00 G 298.150 0
I 0 2,0000 0,0000 0,0000 0.0000 0,0000 3,000000 0,00 G 298,150 0
i _ 1.00000 2.0000 0,0000 0.0000 0.0000 15.000000 0,00G 298,150 02.00000 l,oooo 0,0000 0,0000 0.0000 2.000000 0.00G 29B.150 0
HA 1,0oooCL 1.oooo o.oooo o,ooo0 0,ooooloo.oooooo o,ooS 298.150 FOSPECIES BEING CONSIDERED IN'TH(S S?STER .....J 3178 C dl216g CCL J12/68 CCL2 J 6170 CCL3' Pl2/Bl CCL4
CN RUB 79 CHCL P 6/81 CHCL2 J12/72 CH2 PI2/BI CH2CL2121673/61 FORMALDEHYDE L _/B5 FORMIC ACID J 6/69 CH3 PI2/BI CH3CL L 9/B5 HYDROXYHETHYLENE
L 9/85 METHYLOXIDE L 5/84 CH# L 9/85 HETHANOL J 6/69 CN J12/70 NON RADJ 6/66 CNN RAO J 9/65 CO J12/65 COCL J 6/61 COCL2 J 9/65 C02J12/69 C2 J12/GB C2CL2 L10/87 C2Ct.4 L10/87 C2CL6 J 3/67 C2H RADRUB 79 C2HCL J 3/61 ACETYLENE BUR 84 KETENE BUR B4 C2H3 RAD BUR 84 METHYL CYANIDEBUR 84 CH3CO RAD BUR 84 CH2CHO RAD L _IB5 ETHYLENE BUR 84 ACETALDEHYDE L 4/85 ACETIC ACIDL #lP5 (FORMIC ACID)2 PIOIB3 ETHYL RAD BUR S4 ETHYL OXIDE RAD L 5184 ETHANE BUR 84 AZOHETHAHEBUR 84 ETHANOL BUR B4 DIHETHYL ETHER J 3/67 CNC RAD J 3/61 CYANOGEN J 9/66 CCO R_DJ12/69 C3 086161 C3H3 RAD BUR 84 CYCLOPROPENE BUR 84 PROPYNE BUR B4 ALLEHE
44 C.3H5RAD BUR B4 CYCLOPROPANE L _IB5 PROPYLENE L 9145 PROPYLENE OXIDE L 9185 I-PROPYL RAD_U_IB5 N-PROPYL RAD L 4185 PROPANE L IIB_ 1-PROPANOL J 6/68 CARBON SUBOXIDE J12/69 C4BUR 84 BUTADIYNE BUR 64 BUTAN-IEN-3YN PI0/45 CYCLOBUTADIENE BUR B4 2-BUTYNE P 4/84 1,3-BUTADIENEBUR 84 2-BUTENE TRANS BUR 84 2-BUTENE CIS BUR B_ ISOBUTENE BUR 84 I-BUTENE L 4/85 (ACETIC ACID)2L 91BB S-BUTYL RAD PI0183 N-BUTYL RAD L 9185 T-BUTYL RAD L 4/85 ISOBUTANE L 4185 U-BUTANEJ 3161 CARBON SUBNITRID J12/69 C5 PI0/85 CYCLOPENTADIENE P12/92 CYCLOPENTANE P12/52 I-PENTENE910/83 N-PENTYL RAD l 5/B7 T-PENTYL RAD PIO/B5 CI-L_C(CH3)2CH3 PIOIB5 PENTANE PI0/85 ISOPENTANEBUR 84 HEXATRIYNE LI2/B4 PHENYL RAD LI2/B4 PHENOXYRAD L12/84 BENZENE L12/84 PHENOLBUR 84 CYCLOHEXENE PIO/B3 N-HEXYL RAD L 3/86 BENZALDEHYDE PI0/84 TOLUENE L 6/87 CRESOLP12/52 1-HEPTENE PI0/83 N-HEPTYL RAD P _/81 N-HEPTANE P12/52 I-OCTEHE PIO/B3 N-OCTYL RADP 4/85 OCTANE P _IB5 ISO-OCTANE PIOIB3 N-NONYL RAD BUR 84 NAPTHLENE BUR 84 AZULENEPI0183 N-DECYL RAD L12144 O-BIPHENYL RAD LI2/B_ BIPHENYL L 6188 JET-A(G; L 6/87 BIBENZYLJ 6/72 CL J 6/66 CLCN J 6/61 CLO J 3/61 CL02 J 9/65 Ct2J12/65 CL20 J 3/77 H L12/69 HCN J12/70 HCO RAD J 9/64 HCLJL2170 HHCO RUB 7B HNO RUB 78 HN02 RUS 78 HN03 J 3179 HOCLJ 9/78 H02 J 3/77 H2 J12/65 H2N2 J 3/79 H20 L 3/B5 H202J 3177 N J12/70 NCO RUB 7B NH RUB 7B MH2 J 6/77 HH3RUB 78 NH20H RUB 7B NO RUS 7B NOCL RUB 7B NO2 RUB 74 NO2CL
, J12/64 NO3 ,J 3/77 H2 RUS 7a N2H2 RUS 7B NH2N02 RUS 74 N2H_
; RUB7B N2o RuB7a I_o3 RuB78 N204 RUB7B N2o5 Rus7B H3' RUB 78 N3H J 6/62 J3/66 NACN J12/64 NACL J 3/63 NAHJ J12/67 HAO J12/70 NAOH J 6/62 NA2 J3/66 NA2C2N2 J12/64 NA2CL2
K10/74 NA20 J12/70 NA202H2 J 3177 0 J 6177 OH J 3/77 02' ," J 6161 03 J 3/78 C(GR) PIO/80 BENZENE(L) PIO/BO TOLUENE(L) PIOI80 OCTANE(L)
614B JET-A(L) L 31Bl H20(S) J 3/79 H20(L) BAR73 NM4CL(A) BAR?3 NH4CL(B)_ 6/62 NA(S) J 6/62 NA(L) J 3166 NACN(S) J 3/66 NACN(L) J 9164 NACL(S)J 9164 NACL(L) J12/70 NAOH(A) J12170 NAOH(L) J 6/63 NA02(S) J 3166 NA2C03(1)
3/66 NA2C03(2) J 3166 NA2CO3(L) J 616B NA20(C) J 6/68 NA20(A) J 616B NA20(L)6/68 NA202(A) J 6/68 NA202(B}
4'.'.i
.I

Chemical Eclui I ibr ium at One Atm
o B
0 5
o 4
8
dc oa
2
t? 2
0,1
.......o,, m,! ....o,,1 3 4 5 6 7 8 9 10 11 12 1) 14 15 16 17 18 1'9 20 21 22 23 24 25 26
Corrc_ounds
Temperature: Legend Number * 100 °C
Figure 3. Chemical Equilibrium at Different., Temperature
31

Gas Phase Composition at One Atm
09
_,FI 11!
0,7
0 6
0,5 -
O,4-r,
0,3
0 2
0"1 _o ...... , , iN,, , , , _ ., fL.... _,_2 3 4 5 6 ? 8 9 10 11 1_ 13 14 15 18 17 t8 19 20 21 22 23
Comoonent s
Temperature: Legend Number * 100 °C
Figure 4. Gas Phase Composition at Equilibrium ,,.
32
II ,, ! ,

Dist_r but. ion of Na in three phasesat. PrQ@@ur@ P=I AT_
1 I....
09 __
O 8x
i o.7 \\
0,6 -
Bo o5
0. ,i
o
,_ 0.3u
ga. 0 2
,_,
[1.1
i i i
700 8o0 goo 100o 1100 IaO0 1300 14o0 15o0
Ternoer atur e C
1. Gas Phase; 2. Liquid Phase; 3. Gas Phase
Figure 5. The Temperature Effect On The Distribution of ,.Sodiun Species In Different Phases
33
!

Soclium Species In Equi i brlurn
0, 34
032
0,3
O,2B
0,26
0 24 -
0.22 -
c 02 -
0.18
o la
O. 1,1012
01
0,08 Ii
006
0.04
0 1 r I I ' I I INa NaCI NaO NaOH Na2CL2 Na2OH2 NaCICe') N,aCLC I) Na2CO3(2)
Compound8
Temperature: Legends Number * 100 °C
Figure 6. Sodium Species Distribution AT One Atm Pressure
34
,!

The D Is'trlbut. lon of Sodium Speclesa_ On,o At.m
0,9 -
0,8 -
n,7
_Q 0,8
g" 0,5
0.4
0.'I
o,_ j._N& }_'CI Ha0 IlaO;I IlaOCI 2 Ile20ft2 flaCL(a) HelCL_ I) Na2OOg(2)
_unda0 15 + 14 O 13 & 11 X 9
Temperature: Symbol Number *100 °C
Figure 7. The Integrated Form Of Sodium Distribution
35

NaCL and N_2CL2 Vs, Temper'at.ureat O_ Atm
O, "_1 ,_
0,1
0,0_1
0,00
L_ 0,07
c 0,08
O, 05
0,04
O,03
0,02
O, 01 ___-_=_'_To -- cp ,, cp, q_ _,4500 1400 4_00 4200 1400 '1000 g00 800 700
Tearer ur_ B_gr ee 0
c] NmCL + N_2GL_
Figure 8. The Effect Of Temperature On NaC1 And NazC12
f,
36

Rat. lo of' NaCL Lo Na2CL2 at. One Atm
0,44
0,42 -
0,4-
0, 38 - .,"
0.38 - /0. _,1 -
0,32 //_//J
0,3
0,_18 ,i,
0, 280,_4
0, 10
0, 18
13,"14
0, '1@
1_00 '14 t300 1Z"430 '1'1 0 '10 900 000 700
Tattler at. ur e De_e_ 0
Figure 9. The Effect Of Temperature On Na2C12/NaCL
i
37
Chem l carl Eclul I Ibr'lum a,t F lye Atm
0,8
0,4,
n._
0,2
0,1
o ,I! ....... __ , n. .'_ ; ' ' '_'o'_' '7'ot 3 4 _ 6 ? a 9 to 11 t t3 14 '1 48 t7 'le 4 a 2 _ 232g aB 2
_unde
Temperature: LegendNumber* 100°C
Figure 10. The EquilibriumCompositionAt Five Atm,J
38
I

Chemical Equl I lbrlum at. Ten Atm
O,g
O,g -
0,7 -
0,8 -
_ 13,5 -
Q,4 -
a,3 -
0,2 -
°_ _ _MAIN CC_I°OI'_ N7_
Temperature: Legend * 100 °C
Figure 11. Equilibrium Calculation At Tem Atm ,,..,
39

Q
Pressure Effect on Sodium Vapor
0,09
O,OB -
0,07 -
0,06 -,
°c 0.05
0,04
2
o,o3 \
0,02
0 , ..... r = ......... _. T" ' T -........I 2 3 "4 5 6 7 9 B t0
Pr'cesur e _,tm0 15 + 14 o 13 a 12 × 11
Temperature: Symbol Number * 100 °C
Figure 12. Pressure Effect On NaC1 Vapor Generation
, 40
r'

Na2CI2 Vs, Pre£sure .,
0,026
0,024
0,012_
O. 02
0.018
0,0'16
_, 0,0_4
o,oI_
0,01 -0,008
0.006
O. 004
O.O0_
0I 2 3 4 5 6 "_ 8 9 10
I:_r"QQQUre Atm
0 15 + 14 0 13 & 12 X 11
Temperature: Symbol Number * 100 °C
Figure 13. The Effect Of Pressure On the Formation of Na,.C12

NaCL Vapor V,s Pressure at 900 C
2,4
2,2-_
2-
I.B
1,6
dr"
I_ I,_
o, 4 __0,2
o _ I I I I I I i ''1 2 3 4 5 6 '7 9 9 10
I:_ _e eur'e _,tm0 9O0 C + "700 C
Figure 14. The Effect Of Pressure On NaC1 At 900 °C

Gas Phase Composition at Ten Atm
0,9
0,8-
0,7-
0,6-
0,5
0,4
0,3
0,2
0,1_ ! glm IN
2 _ 4 s B 7 e 9 to _'_ I'2 1'3 _4 1; Is _, I; _'9 _o 2'I 22 a'_
MAIN B'OMI_NENTS
Temperature: Legend * 100 °C
Figure 15. Gas Phase Composition At Equilibrium At Ten Atm

Sodlum Specles In Equl lbrium a,t IO At.m
1-....
0,9-
o,8
0,7
o_ 0,1_
u.
20.4 -
0.3 -
0._ -
0.'1 -
n 17_.i. _i i i i i i iNaCL i4_O t'_CH He2CL2 N_2OH2 NaCLCa_) I_Ct._I_Na2CO_2")s2CO3CI_)
So_ 1um Comoound
Temperature' Legend Number * 100 °C
Figure 16. Temperature Effect On Sodium Species Distribution
,-i4

Chem lca, I Equi I lbr-lum wll:h S02 at. I At.m
0,8 !
0,_
0,4
gtj
:t0,2-
0,1 -
o,,_,,,T,,,°I _ o __110 '1t4 2/ _ l I I i J ! I l I I I I ! I 1'1 2 3 4 5 6 7 g g '1 43 '14 _15 'lB 47 '18 49 20 24 22 23 24 2_ 26 27 2e 2D
C.omoou r_:lo
Temperature: Legend Number * 100 °C
Figure 17. Chemical Equilibrium At One Atm With SO2
45
ii

Sod i um Di str- 1but. ] or-i w l t.h S02 at. '1 Atm
0,8
O,B
0,7
0,4
0,t -
0 I I
a NaCL He0 HaOH Na2CL2 I,_2_,O_i NacLCQ::) NeCLC I::)t_2SO4CI)Ia2SO4l:I:_
Sod Ium Corr_ound
o 15 + 14 o 13 ,¢ 11 ' x 10
Temperature' Symbol Number * 100 °C
Figure 18, The Equilibrium Distribution Of Sodium Species.i