
Synchrophasors Intiatives in India Dec 13 - wrldc.org Initiatives in India Decmber 2013... ·...
184
Transcript of Synchrophasors Intiatives in India Dec 13 - wrldc.org Initiatives in India Decmber 2013... ·...


DECEMBER - 2013 POSOCO
Synchrophasors - Initiative in India
Power System Operation Corporation Limited(A wholly owned subsidiary of POWERGRID)
B-9, Qutab Institutional Area, Katwaria Sarai,New Delhi-110016
In i t ia t ive in India
(December-2013)
Synchrophasors

DECEMBER - 2013POSOCO
Synchrophasors - Initiative in India

DECEMBER - 2013 POSOCO
Synchrophasors - Initiative in India
EXECUTIVE SUMMARY 1
ACKNOWLEDGEMENT 5
DISCLAIMER 6
CHAPTER 1 : BACKGROUND 7
1.1. Introduction 7
1.2. Objective of this Report 8
1.3. Chapter-wise overview. 9
1.4. Literature survey 9
CHAPTER 2 : OVERVIEW OF SYNCHROPHASOR PROJECTS 13
CHAPTER 3 : ARCHITECTURE OF SYNCHROPHASOR PROJECT 15
3.1. Eastern Region 15
3.2. North Eastern Region 16
3.3. Northern Region 18
3.4. Southern Region 19
3.5. Western Region 20
CHAPTER 4 : NATIONAL LEVEL INTEGRATION OF SYNCHROPHASORS 21
4.1. National WAMS Project Architecture 21
4.2. WAMS Infrastructure at NLDC 23
4.3. ERLDC PDC Integration 23
4.4. NERLDC PDC Integration 23
4.5. NRLDC PDC Integration 23
4.6. SRLDC PDC Integration 23
4.7. WRLDC PDC Integration 24
CHAPTER 5 : USE OF SYNCHROPHASOR DATA -CASE STUDIES 25
5.1. Fault Detection, Classification and Analysis 25
5.1.1. Transmission Line Fault 27
5.1.2. Faults occurring at Power station & Grid Sub-station 33
5.1.3. Tripping due to lack of protection co-ordination / Instrument Error 42
5.1.4. High Impedance Fault 49
5.1.5. Detection of faults cleared by back up protections 60
5.2. Low Frequency Oscillation 67
5.2.1. Detection of Low Frequency Oscillations using Synchrophasor Measurements 68
5.2.2. Analysis of Low frequency oscillations 69
5.2.3. Inter-Area Oscillations Observed in the Grid 69
TABLE OF CONTENTS
(iii)

DECEMBER - 2013POSOCO
Synchrophasors - Initiative in India
5.2.4. Inter-Plant Oscillations Observed in the Grid 74
5.2.5. Inter and Intra-Plant Oscillations Observed in the Grid 75
5.3. Detection of Coherent Group of Generators 88
5.3.1. Coherency observed in NEW grid during Bus fault at Parli S/s on 03-03-2013. 88
5.4. Island Detection and Resynchronization in the Grid 89
5.4.1. Islanding of NR Grid from Rest of the NEW Grid on 30-07-2012 90
5.4.2. Islanding of NR, ER and NER Grid from Rest of the NEW Grid on 31-07-2012 91
5.4.3. Islanding of NER Grid from Rest of the NEW Grid on 29-09-2013 92
5.5. Dynamic Model Validation Using Synchrophasor data 97
5.5.1. Validation of Electrode Current limitation characteristics of HVDC Talcher-Kolar. 97
5.5.2. Model Validation of Frequency Control of HVDC 100
5.5.3. Validation of Angular Separation calculated from EMS & measured from PMU 103
5.5.4. Cross validation of DR, Offline simulation and Synchrophasor measurements 103
5.6. Visualization of PSS testing . 108
5.6.1. PSS tuning at Karcham Wangtoo HEP on 11-12 April 2013 108
5.7. Monitoring during Natural Disasters 110
5.7.1 Monitoring during Phailin cyclone in Odisha 110
5.7.2 Monitoring during fog condition in Northern Region 114
CHAPTER 6 : EXPERIENCE ON UTILIZATION OF SYNCHROPHASOR TECHNOLOGY 119
6.1. Utilization of Synchrophasor data in real-time 119
6.2. Suggestions for Improved Visualization and Situational Awareness in real time 123
6.3. Visualization Improvement for faster event detection 128
6.4. Utilization of Synchrophasor data in offline mode 130
CHAPTER 7 : IMPLEMENTATION EXPERIENCE & INTEGRATION CHALLENGES 131
7.1. Implementation Experience in a Multi-vendor System 131
7.2. Communication Challenges in Integrating PMU 134
7.3. Synchrophasor data in Multi Cast 136
7.4. Challenges in handling of Synchrophasor data 136
7.5. Phasor Data recording and Exchange in COMTRADE Format 140
7.6. Phasor Event Data Exchange in COMFEDE Standard. 140
7.7. Compliance to IEEE C37.244 PDC Guide 140
7.8. Synchrophasor Data Storage related Experience and Challenges 140
7.9. Integration with SCADA State Estimator/EMS challenges 141
7.10. Challenges in Usage of Synchrophasor event Analysis 142
CHAPTER 8 : WAY FORWARD 143
REFERENCES 145
Appendix-A. 149
Appendix-B. 152
Appendix-C. 155
Appendix-D. 169
(iv)

DECEMBER - 2013 POSOCO
Synchrophasors - Initiative in India
LIST OF TABLES
Table 2-1 : Project Details 13
Table 5-1 : Sequence of events during multiple tripping due to CT failure at Hassan S/s 34
Table 5-2 : SOE from Balia Sub-station 42
Table 5-3 : O/V Setting of 400 kV lines from Ballia S/s 43
Table 5-4 : Overvoltage Stage 1 Protection of various lines from Bhadrawati and Chandrapur S/s 46
Table 5-5 : Sequence of events during high impedance fault in SR Grid 52
Table 5-6 : Sequence of Event during tripping of NAPS units 53
Table 5-7 : Summary of PMU Typical Delays and typical ranges 66
Table 5-8 : Fault clearance time based on DR and PMU 66
Table 5-9 : Cases analyzed using Synchrophasor (April’13 – Nov’13) 67
Table 5-10 : Low frequency oscillation observed during tripping at Budhipadar, Sterlite and IBTPS 71
Table 5-11 : Mode observed during the oscillation 73
Table 5-12 : Mode observed during the oscillation 74
Table 5-13 : Dominant Modes observed during the 213-241 Seconds 85
Table 5-14 : Dominant Modes observed during the 253-280 Seconds 86
Table 5-15 : Low frequency Oscillation observed in Indian grid 87
Table 5-16 : Major Mode observed after the combined analysis of several PMU of NEW grid 96
Table 7-1 : Vendor Distribution 131
Table 7-2 : Average Latency observed with different communication channels and PMUs 135
Table A-1 : Phasor Measurement Unit Details 149
Table A-2 : Phasor Data Concentrator System 150
Table A-3 : Historian details 150
Table A-4 : Visualization features 151
Table B-1 : Location of PMUs in Eastern region 152
Table B-2 : Location of PMUs in North Eastern Region 152
Table B-3 : Location of PMUs in Northern region 153
Table B-4 : Location of PMUs in Southern region 153
Table B-5 : Location of PMUs in Western region 154
Table B-6 : Location of PDCs all over India 154
Table D-1 : Project cost implication for each region 169
(v)

DECEMBER - 2013POSOCO
Synchrophasors - Initiative in India
LIST OF FIGURES
Figure 3-1 : Architecture of PMU pilot project in Eastern region 15
Figure 3-2 : Location of PMUs in Eastern region 16
Figure 3-3 : Architecture of PMU pilot project in North Eastern region 17
Figure 3-4 : Geographical Locations of PMUs in North Eastern region 17
Figure 3-5 : Architecture of PMU pilot project in Northern Region 18
Figure 3-6 : Geographical locations of PMU pilot project in Northern Region 18
Figure 3-7 : Architecture of PMU pilot project in Southern region 19
Figure 3-8 : Geographical locations of PMU 19
Figure 3-9 : Architecture of PMU project in Western region 20
Figure 3-10 : Geographical locations of PMUs in Western region 20
Figure 4-1 : National WAMS Project Architecture in India 21
Figure 4-2 : Geographical Locations of PMUs in India 22
Figure 5-1 : Connectivity diagram showing PMUs at Dehgam, Sugen, Boisar and Bhadrawati Sub-stations. 27
Figure 5-2 : Frequency and ROCOF from Various PMUs in Western Region 28
Figure 5-3 : Voltages from the PMU at Dehgam end. 28
Figure 5-4 : Zero Sequence voltage from the PMU at Dehgam end. 28
Figure 5-5 : Current plot of 400 kV Dehgam-Gandhar II circuit from the PMU at Dehgam end. 29
Figure 5-6 : Frequency plot obtained from the PSS/E Simulation for L-G Fault on 400 kV Sami Dehgam 1. 29
Figure 5-7 : Bhadrawati Phase voltage during the fault on 400 kV Ranchi-Sipat-I. 30
Figure 5-8 : Bhadrawati Zero sequence voltage during the fault on 400 kV Ranchi-Sipat-I. 30
Figure 5-9 : Bhadrawati Raipur II Current plot during the fault on 400 kV Ranchi-Sipat-I. 30
Figure 5-10 : DR of 400 kV Ranchi Sipat 1 from Sipat end during the fault. 31
Figure 5-11 : Phase voltage of Dadri bus from PMU during three phase fault. 31
Figure 5-12 : Current of HVDC Dadri I/C from PMU during three phase fault. 32
Figure 5-13 : DR of 400 kV Dadri –Muradnagar Ckt from Dadri end during three phase fault 32
Figure 5-14 : Schematic Diagram of Affected Area during CT failure at Hassan S/s 32
Figure 5-15 : SLD of Hassan sub-station. 33
Figure 5-16 : 400kV Somanhalli bus voltage from PMU during the CT failure at Hassan S/s. 33
Figure 5-17 : Negative and Zero sequence current for 400 kV Somanhalli-Salem Line from Somanhalli PMU 34
Figure 5-18 : DR of 400kV Hassan-Mysore line-2 (Hassan end). 35
Figure 5-19 : Fault time line. 35
Figure 5-20 : Schematic Diagram of LANCO S/s and its connectivity with nearby system. 36
Figure 5-21 : Frequency Measured from Sugen and Raipur during fault at LANCO. 36
Figure 5-22 : Voltage plot from the Raipur PMU during B phase to ground fault at LANCO. 36
Figure 5-23 : Voltage from DR of 400 kV LANCO -Sipat line from LANCO. 36
Figure 5-24 : Current from the PMU at Raipur for Raipur-Bhadrawati 1 Ckt during B phase to ground fault at LANCO. 37
Figure 5-25 : Current from DR of 400 kV LANCO -Sipat line from LANCO. 37
Figure 5-26 : PMU Voltage from the Raipur end during Y-B phase to ground fault at LANCO. 37
Figure 5-27 : Voltage from DR of 400 kV LANCO-Korba from LANCO. 37
Figure 5-28 : Current in Raipur-Bhadrawati 1 (Raipur end) during Y-B phase to ground fault at LANCO. 37
Figure 5-29 : Current in 400 kV LANCO -Korba line from LANCO. 37
Figure 5-30 : Schematic Diagram of the Area affected during multiple tripping at Mamidapalli. 38
Figure 5-31 : SLD of 400/220 kV Mamidapalli s/s 38
Figure 5-32 : 400 kV Ramagundam bus voltage during fault at Mamidapalli S/s. 39
Figure 5-33 : Negative and Zero sequence current at 400 kV Gooty-Neelamangla line from PMU. 39
Figure 5-34 : Frequency change due to ICTs tripping at Mamidapalli resulting in Load Loss. 39
Figure 5-35 : SCADA diagram displaying the Area affected. 40
(vi)

DECEMBER - 2013 POSOCO
Synchrophasors - Initiative in India
Figure 5-36 : SLD of Vijayawada TPS 40
Figure 5-37 : 400 kV Ramagundam bus voltage during tripping of Vijaywada TPS. 41
Figure 5-38 : Negative & zero sequence current of 400 kV Ramagundam-Nagarjuna Sagar-II during tripping of Vijaywada TPS. 41
Figure 5-39 : Frequency during the tripping of Vijaywada TPS 41
Figure 5-40 : SLD of 765 kV Bus at Ballia. 42
Figure 5-41 : SLD of 400 kV Bus at Ballia. 42
Figure 5-42 : 400 kV Bus voltage of Ballia station in northern region from PMU during multiple tripping. 43
Figure 5-43 : 400 kV Bus voltage of Ballia station in northern region while charging 125 Mvar Bus Reactor. 43
Figure 5-44 : PMU plot of phase Voltages of Ballia sub-station during restoration sequence. 44
Figure 5-45 : PMU plot of phase Voltages of Ballia sub-station while charging 240 Mvar Bus Reactor at 765 kV level. 44
Figure 5-46 : PMU plot of phase Voltages of Ballia sub-station during repetative attempts to charge 765 kV Ballia-Lucknow Line. 44
Figure 5-47 : PMU plot of phase Voltages of Ballia sub-station after succesful charging of 765 kV Ballia-Lucknow Line. 44
Figure 5-48 : Schematic Diagram of Bhadrawati and Near By area. 45
Figure 5-49 : Frequency and WR Demand from SCADA during multiple tripping. 45
Figure 5-50 : Zero sequence Voltage plot of Bhadrawati from Bhadrawati PMU 46
Figure 5-51 : Voltage plot of Bhadrawati from PMU along with the sequence of event during the occurrence 46
Figure 5-52 : Current plot of Bhadrawati-Raipur II Circuit from Bhadrawati PMU with the sequence of event during 47
the occurrence
Figure 5-53 : Current plot of Bhadrawati-Raipur III Circuit from Bhadrawati PMU with the sequence of event during 47
the occurrence.
Figure 5-54 : Frequency and df/dt plot from PMU describing the sequence of events during the occurrence. 47
Figure 5-55 : Bongaigaon Positive sequence voltage and positive sequence current of 400 kV Bongaigaon-Balipara-I & II Ckts. 48
Figure 5-56 : Connectivity diagram of Srisailam Hydro power station and its interconnection. 50
Figure 5-57 : Rate of change of frequency observed from various PMUs during high impedance fault. 50
Figure 5-58 : 400 kV Vijayawada bus voltage during high impedance fault. 51
Figure 5-59 : Negative and zero sequence current of 400 kV Vijaywada-VTPS-I from PMU during high impedance fault. 51
Figure 5-60 : PMU Plot of phase voltages of different station during 13:24 – 13:33 Hrs on 9-4-2013 53
Figure 5-61 : PMU Plot of phase voltages of different station during the fault at 13:26 Hrs 54
Figure 5-62 : Schematic Diagram of Omkareshwar and Near By area. 54
Figure 5-63 : Phase Voltages from Itarsi PMU during the fault at 13:47 Hrs. 55
Figure 5-64 : Positive sequence voltage from various PMUs during the fault at 13:47 Hrs 55
Figure 5-65 : DR of 220 kV Itarsi - Barwaha from Barwaha end which shows that fault was in R phase initially. 56
Figure 5-66 : Continuation of Figure 5-64 DR indicating the phase to phase fault appeared after 1 second resulting 56
in tripping of line in zone 1.
Figure 5-67 : Frequency observed at various nodes during the fault on 220 kV Itarsi Barwaha at 13:47 Hrs 56
Figure 5-68 : Phase Voltages from Itarsi PMU during the fault at 14:06 Hrs and tripping of Units on over frequency. 57
Figure 5-69 : Positive sequence Voltages from various PMUs during the fault at 14:06 Hrs and tripping of Units on over frequency. 57
Figure 5-70 : DR of 220 kV Itarsi - Barwaha from Barwaha end while charging of line from Barwaha which shows that fault 57
star ted in R phase initially.
Figure 5-71 : Continuation of Figure 5-70 DR indicating the phase to phase fault appeared after 1 second resulting 58
in tripping of line of zone 1.
Figure 5-72 : Frequency observed by various PMU during the fault on 220 kV Itarsi Barwaha at 14:06 Hrs. 58
Figure 5-73 : Connectivity Diagram of Udipi power station 59
Figure 5-74 : 400 kV Narendra bus voltage 59
Figure 5-75 : SLD of 400/220kV Bihar Sharif S/S 61
Figure 5-76 : 400kV Farakka Bus voltage 61
Figure 5-77 : DR of HV side of 315MVA ICT-II at Bihar Sharif overcurrent relay 62
Figure 5-78 : Line Current of 400 kV Farakka-Durgapur-I from Farakka PMU 62
Figure 5-79 : Frequency observed from Farakka PMU during ICTs tripping at Biharsharif 63
Figure 5-80 : Schematic diagram of the affected portion. (Islanded portin is shown with dotted lines). 70
Figure 5-81 : Frequency and ROCOF observed during the Incidence from Raipur PMU. 70
Figure 5-82 : Oscillation in Frequency from various PMUs in the NEW Grid. 71
Figure 5-83 : Mode Shape of 0.53 Hz. 71
(vii)

DECEMBER - 2013POSOCO
Synchrophasors - Initiative in India
Figure 5-84 : Voltage and Frequency plot of Farakka PMU along with the OMS result 72
Figure 5-85 : Oscillation as observed from the SCADA data in Voltage of DVC 72
Figure 5-86 : Frequency from PMU from Western, Northern and Eastern region of Indian Grid. 73
Figure 5-87 : Mode shape of 0.49 Hz Frequency from the analysis of various PMU 73
Figure 5-88 : Voltage, Real power and Reactive power observed from Gajuwaka PMU 73
Figure 5-89 : Oscillation observed in frequency at different location in WR. 74
Figure 5-90 : 1.03 Hz Mode shapeof the oscillation observed. 74
Figure 5-91 : Low Frequency oscillations in Dadri Frequency 75
Figure 5-92 : Zoomed view of Frequency Plots 76
Figure 5-93 : PMU plot of Dadri phase voltages 76
Figure 5-94 : Grid connectivity diagram of Paricha thermal power plant 77
Figure 5-95 : Frequency and ROCOF observed during the event from different PMU in NR. 77
Figure 5-96 : Phase Voltage observed during the event showing oscillation. 77
Figure 5-97 : Oscillation observed in the frequency and ROCOF. 78
Figure 5-98 : Modal Analysis of Oscillation performed by the OMS Engine. 78
Figure 5-99 : Connectivity Diagram of 400 kV Chabra station 79
Figure 5-100 : PMU plot of frequency and modal analysis. 79
Figure 5-101 : Zoom view of PMU plot of frequency and modal analysis. 79
Figure 5-102 : Single Line Diagram of NER Grid during the time of incidence. 80
Figure 5-103 : Oscillation in Frequency observed from NER PMUs. 80
Figure 5-104 : FFT Analysis on Frequency at different nodes of NER 81
Figure 5-105 : FFT of 400 kV Bongaigaon phase voltage. 81
Figure 5-106 : FFT of current of 132 kV Badarpur – Khleihriat S/C. 81
Figure 5-107 : 0.96 Hz with damping of 0.77 %. 82
Figure 5-108 : 0.94 Hz with damping of -0.35 %. 82
Figure 5-109 : 1.95 Hz with damping of 5.65 %. 82
Figure 5-110 : NER Grid view prior to the LFO observation i.e. 23:34 Hrs. 83
Figure 5-111 : R-phase currents of few Lines of NER Grid. 83
Figure 5-112 : R-phase voltages (in p.u.) of few nodes of NER Grid. 83
Figure 5-113 : During 12-128 seconds data window considered for analysis 84
Figure 5-114 : Mode shape of 1.0058 Hz. 84
Figure 5-115 : During 137-200 seconds data window considered for analysis 84
Figure 5-116 : Mode shape of 1.0074 Hz. 84
Figure 5-117 : During 213-241 seconds data window considered for analysis 85
Figure 5-118 : Mode shape of 0.9958 Hz 85
Figure 5-119 : During 253-280 seconds data window considered for analysis 85
Figure 5-120 : Mode shape of 0.9627Hz. 85
Figure 5-121 : AGTPP unit-wise MVAR from SCADA. 86
Figure 5-122 : Loktak unit-wise MVAR from SCADA 86
Figure 5-123 : Doyang unit-wise MVAR from SCADA 86
Figure 5-124 : Frequency plots during bus fault at 400 kV Parli Substation illustrating the antiphase swinging of Western region 89
machines with Northern Region.
Figure 5-125 : Frequency plots during bus fault at 400 kV Parli Substation illustrating the antiphase swinging of Western 89
region machines with Northern Region.
Figure 5-126 : Frequency plots during bus fault at 400 kV Parli Substation illustrating the antiphase swinging of Western region 90
machines with Northern Region.
Figure 5-127 : Phase angle difference during the islanding of NR from rest of the NEW grid on 30th July 2012. 91
Figure 5-128 : Phase angle difference during the islanding of NR, ER & NER from rest of NEW grid on 31th July 2012. 91
Figure 5-129 : Connectivity diagram of North-Eastern Regional Grid with NEW grid prior to islanding 92
Figure 5-130 : Angular Separation between Positive Sequence Voltages of NER PMUs w.r.t. Bhadrawati PMU (in WR) 93
along with NER Grid
Figure 5-131 : Positive Sequence voltages at Bongaigaon, Balipara, Agartala (When NER Grid Islanded) 93
(viii)
DECEMBER - 2013 POSOCO
Synchrophasors - Initiative in India
Figure 5-132 : Voltages at Bongaigaon showing significant dip in R-phase voltage at Bongaigaon 94
(Voltage input to PMU at Bongaigaon was from line CVT of 400 kV Balipara – Bongaigaon II).
Figure 5-133 : Angular Separation between Positive Sequence Voltages of NER PMUs w.r.t. 94
Bhadrawati PMU along with NER Grid Frequency (At time of resynchronization with NEW Grid).
Figure 5-134 : Positive Sequence Voltage at Bongaigaon, Balipara, Agartala (At time of resynchronization with NEW Grid) 95
Figure 5-135 : Frequency of NER and NEW grid (At time of resynchronisation with NEW Grid) 96
Figure 5-136 : HVDC Talcher-Kolar schematic Diagram 98
Figure 5-137 : HVDC Current reduction charecteristics 98
Figure 5-138 : Frequency profile of SR grid during the event 99
Figure 5-139 : NEW Grid frequency for the incident 99
Figure 5-140 : Schematic Diagram of WR and SR Grid Connectivity via HVDC Bhadrawati and PMU Location. 100
Figure 5-141 : SR frequency, WR frequency and HVDC power flow during 14:21 to 14:47 hrs. 101
Figure 5-142 : SR frequency, WR frequency and HVDC power flow during 14:49 to 15:19 hrs. 102
Figure 5-143 : SR frequency, WR frequency and HVDC power flow during 15:25 to 15:44 hrs. 102
Figure 5-144 : SR frequency, WR frequency and HVDC power flow during 16:04 to 16:25 hrs. 102
Figure 5-145 : EMS estimated and PMU measured angular difference between Korba and Kalwa over a day 103
Figure 5-146 : Korba Bus Voltage during Y phase to earth fault on 400 kV Korba -Batapara line. 104
Figure 5-147 : 400 kV Korba-Batapara Circuit Real and Reactive power during Y phase to ear th fault on400 kV Korba -Batapara line. 104
Figure 5-148 : Korba-Bhatapara Circuit Current during Y phase to earth fault on 400 kV Korba -Batapara line. 104
Figure 5-149 : Korba Unit 6 Current from PMU at Korba during Y phase to earth fault on 400 kV Korba -Batapara line. 104
Figure 5-150 : Korba Unit 6 Real and Reactive Power during Y phase to ear th fault on 400 kV Korba -Batapara line. 104
Figure 5-151 : Frequency observed from different PMU during Y phase to ear th fault on 400 kV Korba -Batapara line. 104
Figure 5-152 : Voltage from DR of Korba-Bhatapara Circuit from Korba end during Y phase to earth fault on 400 kV Korba -Batapara line. 105
Figure 5-153 : Current from DR of Korba-Bhatapra Circuit from Korba end during Y phase to earth fault on 400 kV Korba -Batapara line. 105
Figure 5-154 : Korba Bus Voltage during Y phase to earth fault on 400 kV Korba -Batapara line. 106
Figure 5-155 : Korba-Batapara Circuit Real and Reactive power during Y phase to earth fault on 400 kV Korba -Batapara line. 106
Figure 5-156 : Korba-Batapara Circuit Current during Y phase to earth fault on 400 kV Korba -Batapara line. 106
Figure 5-157 : Korba Unit 6 Current during Y phase to earth fault on 400 kV Korba -Batapara line. 106
Figure 5-158 : Korba Unit 6 Real and Reactive Power during Y phase to ear th fault on 400 kV Korba -Batapara line. 106
Figure 5-159 : Korba Unit 6 Real and Reactive Power during Y phase to ear th fault on 400 kV Korba -Batapara line. 106
Figure 5-160 : Voltage plot from DR of Korba-Bhatapara Circuit from Korba end during Y phase to earth fault on 400 kV Korba -Batapara line. 107
Figure 5-161 : Current plot from DR of Korba-Bhatapara Circuit from Korba end during Y phase to earth fault on 400 kV Korba -Batapara line. 107
Figure 5-162 : P & Q of Korba-Unit-VI using offline study. 108
Figure 5-163 : Screenshot of PMU data display at NRLDC on 23-August 2012 at 19:02 hrs 109
Figure 5-164 : R phase to Neutral voltage of Wangtoo 400 kV Bus 110
Figure 5-165 : Odhisha Demand met during 03-Oct 2013 to 17-Oct-2013. 111
Figure 5-166 : Talcher PMUPositive sequence voltage, frequency & df/dt plots (17:00 to 18:00 hrs) 111
Figure 5-167 : Positive sequence voltage, frequency plots of Talcher PMU (18:00 to 19:00 hrs) 112
Figure 5-168 : Positive sequence voltage, frequency & df/dt plots of Talcher PMU (19:00 to 20:00 hrs) 112
Figure 5-169 : Positive sequence voltage, frequency & df/dt plots of Talcher PMU (22:00 to 23:00 hrs) 112
Figure 5-170 : Positive sequence voltage, frequency & df/dt plots of Talcher PMU (23:00 to 00:00 hrs) 113
Figure 5-171 : Positive sequence voltage, frequency & df/dt plots of Talcher PMU (00:00 to 01:00 hrs) 113
Figure 5-172 : Positive sequence voltage, frequency & df/dt plots of Talcher PMU (01:00 to 02:00 hrs) 113
Figure 5-173 : Positive Sequence Voltage plots of Meerut and Hissar PMU (20:50-21:50 hrs) 115
Figure 5-174 : Positive Sequence Voltage plots of Meerut and Hissar PMU (01:00-02:00 hrs) 115
Figure 5-175 : Positive Sequence Voltage plots of Meerut and Hissar PMU (02:15-03:15 hrs) 116
Figure 5-176 : Positive Sequence Voltage plots of Meerut and Bassi PMU (Failed Autoreclose attempts of 400 kV Meerut-Muzaffarnagar) 116
Figure 5-177 : Positive Sequence Voltage plots of Moga and Bassi PMU (successful Autoreclose attempts of 765 kVMoga-Bhiwani) 117
Figure 6-1 : Frequency Controller testing on Bhadrawati HVDC monitored using the Synchrophasor 120
Figure 6-2 : Current and MW plots of 400 kV Meerut-Muzaffarnagar line during sudden reduction in power at Tehri Unit-III 121
Figure 6-3 : Current and MW plots of 400 kV Ramagundam-N’Sagar line during sudden reduction in power at Ramagundam Unit-IV 121
(ix)

DECEMBER - 2013POSOCO
Synchrophasors - Initiative in India
Figure 6-4 : Oscillation observed in Farakka PMU on 20-11-2013 at 1244 hrs 121
Figure 6-5 : Oscillation and coherent group of generators observed from various PMU in Western Grid on 28-11-2013 122
Figure 6-6 : Voltage, Current, frequency & rate of change of frequency plots 122
Figure 6-7 : 400 kV bus voltage of Bina substation 123
Figure 6-8 : 400 kV Satna bus voltage. 123
Figure 6-9 : Voltage of 132 kV and 400 kV Bus on actual scale 124
Figure 6-10 : Voltage of 132 kV and 400 kV Buses on p.u. scale. 124
Figure 6-11 : Visualization of measured currents for three different voltage level lines. 125
Figure 6-12 : Visualization of measured currents for three different lines in per unit. 125
Figure 6-13 : Visualization of measured currents for three different circuits on a logarithmic scale. 126
Figure 6-14 : Angular visualization available at operator console 126
Figure 6-15 : Angular variation of NR with respect to ER 127
Figure 6-16 : Contour visualization of WR MAP using PMU and SCADA data 129
Figure 6-17 : Contour visualization of All India with angular differences 129
Figure 7-1 : ROCOF from three different PMU vendors located in Western Regional Grid for tripping in Eastern Regional Grid 132
Figure 7-2 : Time Quality Flags in C37.118 Data Frame showing an unlocked clock status 133
Figure 7-3 : Time Quality Flags in C37.118 configuration frame showing normal, locked clock 133
Figure 7-4 : Fraction of Second (FOS) drift 134
Figure 7-5 : Korba and Bhadrawati Reported Angle as per C37.118 Standard 137
Figure 7-6 : Angle difference between Korba and Bhadrawati 138
Figure 7-7 : Reported Angles plot for missing Bhadrawati PMU data 138
Figure 7-8 : Angular difference between Bhadrawati and KSTPS in case of Missing Bhadrawati PMU data 138
Figure 7-9 : Reported Angles plot for missing KSTPS PMU data 139
Figure 7-10 : Angular difference between Bhadrawati and KSTPS in case of Missing KSTPS PMU data 139
Figure C-1 : Geographical locations of PMUs and Communication status 155
Figure C-2 : Visualization of Frequency at WRLDC 156
Figure C-3 : Visualization of Voltage magnitudes at WRLDC 156
Figure C-4 : Visualization of Current magnitudes at WRLDC 157
Figure C-5 : Visualization of low frequency dominant modes 157
Figure C-6 : Geographical location of PMUs and communication status 158
Figure C-7 : Visualization of phase angle differences 158
Figure C-8 : Visualization of system frequency from all PMUs 159
Figure C-9 : Visualization of voltage magnitudes 159
Figure C-10 : Visualization of low frequency modes 160
Figure C-11 : Visualization of Phase angle differences 161
Figure C-12 : Visualization of frequency plot 161
Figure C-13 : Visualization of df/dt trend 162
Figure C-14 : MW flow of Sasaram-Biharsharif-II 162
Figure C-15 : Geographical location of PMUs and Communication status 163
Figure C-16 : Visualization of Angular differences 163
Figure C-17 : Visualization of frequency 164
Figure C-18 : Visualization of df/dt 164
Figure C-19 : Visualization of positive sequence voltage 165
Figure C-20 : Visualization of positive sequence currents 165
Figure C-21 : Visualization of MW flows 166
Figure C-22 : Visualization of MVAR flows 166
Figure C-23 : Visualization of low frequency modes 167
Figure C-24 : Visualization of Angular differences 167
Figure C-25 : Visualization of df/dt 168
Figure C-26 : Visualization of Frequency 168
Figure D-1 : Eastern Region pilot project distribution of costs 169
Figure D-2 : North Eastern Region pilot project distribution of costs 169
Figure D-3 : Southern Region pilot project distribution of costs 170
Figure D-4 : Western Region pilot project distribution of costs 170
(x)

DECEMBER - 2013 POSOCO
Synchrophasors - Initiative in India
AGC Automatic Generation Control
API Application Program Interface
ATC Available Transmission Capability
AVR Automatic Voltage Regulator
CAPEX Capital Expenditure
CEA Central Electricity Authority
CERC Central Electricity Regulatory Commission
COI Centre of Inertia
CT Current Transformer
CTU Central Transmission Utility
CVT Capacitor Voltage Transformer
DR Disturbance Recorder
DSA Dynamic Security Assessment
DT Direct Trip
EHC Electro Hydraulic Control
EMS Energy Management System
ERLDC Eastern Region Load Dispatch Centre
FOS Fraction of Second
FRC Frequency Response Characteristic
GD Grid Disturbance
GI Grid Incidence
GIS Gas Insulated Substation
GPS Global Positioning System
GT Generator Transformer
HEP Hydro Electric Plant
HIF High Impedance Fault
HTLS Hankel Total Least Squares method
HVDC High Voltage Direct Current transmission
ICCP Inter Control Centre Protocol
ICT Interconnecting Transformer
IDMT Inverse Definite Minimum Time
IEC International Electrotechnical Commission
IEEE Institute of Electrical and Electronics Engineers
LDC Load Dispatch Centre
LFO Low Frequency Oscillations
LG Line-Ground
LL Line-Line
LLG Line-Line-Ground
LLL Line-Line-Line (3-phase)
NERLDC North-Eastern Region Load Dispatch Centre
NLDC National Load Dispatch Centre
NRLDC Northern Region Load Dispatch Centre
OMS Oscillation Monitoring System
PDC Phasor Data Concentrator
PDH Plesiochronous Digital Hierarch
PMU Phasor Measurement Unit
POSOCO Power System Operation Corporation Ltd
PSS Power System Stabilizer
PT Potential Transformer
RLDC Regional Load Dispatch Centre
ROCOF Rate of Change of Frequency
RTU Remote Terminal Unit
SCADA Supervisory Control and Data Acquisition
SLD Single Line Diagram
SOE Sequence of Events
SPS Special Protection Schemes
SRLDC Southern Region Load Dispatch Centre
ST Station Transformer
STFT Short Time Fourier Transform
SVC Static VAR Compensator
TCSC Thyristor Controlled Series Capacitor
TPS Thermal Power Station
TTC Total Transmission Capability
TVE Total Vector Error
UDP User Datagram Protocol
UHV Ultra High Voltage
UI Unscheduled Interchange
ULDC Unified Load Dispatch and Communication
UMPP Ultra Mega Power Plant
URTDSM Unified Real Time Dynamic State Measurement
WAMS Wide Area Measurement System
WRLDC Western Region Load Dispatch Centre
ABBREVIATIONS
(xi)

DECEMBER - 2013POSOCO
Synchrophasors - Initiative in India
(xii)

Synchrophasors - Initiative in India
DECEMBER - 2013 POSOCO1
Introduction
State, Regional and National Load Despatch Centers as mandated by the Electricity Act 2003 carry out the
supervision and control of Indian electricity grid. The grid operators at Load Despatch Centres monitor and supervise
system parameters and tie line flows with neighboring control areas and ensure integrated operation of the power
grid within their jurisdiction.
The complexity of Indian power system is increasing rapidly due to factors like demand growth, increasing
machine size, long distance power haulage, integration of renewable energy sources, increased competition in
electricity market and Large seasonal load variations. The skewed availability of energy resources vis-à-vis the
load pockets over large geographical regions in the country results in transmission of power over long distances.
The power grids are expected to operate closer to their limits in order to maximize utilization of the network. In
such a scenario, the role of the system operator has become very critical and a judiciary balance has to be struck
between the market and margins towards security of the interconnected system.
The decision of system operator in SLDCs, RLDCs and NLDC greatly depends on the data or information available
to them in real time. The existing SCADA or EMS systems acquire analog and digital information such as voltage,
frequency, active and reactive power flows and circuit breaker status through RTUs/SAS spread throughout the
system. This information is updated once every 4-10 seconds at respective LDCs. This information is not presently
time synchronized. Lack of a coordinated accurate time stamp for recorded data makes any reconstruction of a
timeline difficult and is time consuming. In addition, the lack of coordinated time stamping of data may cause the
recorded data to be suspect when it is used to reconstruct a timeline of events among Disturbance Recorders
(DR) and Event Loggers (EL) records.
The stress on the grid due to power flows is reflected by the angular separation between the nodes. SCADA/EMS
calculates these angles through state estimation methods which is not instantaneous and may not be accurate
due to time skewed data. The low resolution data acquisition also limits the transient analysis of events. In order
to overcome these limitations, an emerging new technology known as synchrophasor technology is increasingly
being used all over the world. Synchrophasors technology enhances the visibility and situational awareness and
is popularly known as Wide Area Measurements System (WAMS) in Power Systems. Wide area monitoring
through high speed communication helps in securing the system in minimum amount of time.
Synchrophasor technology comprise of Phasor Measurement Units (PMUs), Phasor Data Concentrators (PDCs),
Historian, communication network, real time visualization and offline toolboxes with following distinct features:-
� Phasor measurement units report the power system data 25 to 50 times in a second with synchronized
time stamp. This is much faster as compared to existing conventional technology.
� Phasor data concentrator collects the time synchronized data from PMUs and time aligns this data. Apart
from time aligning the data, PDC also checks data and time sync quality feed this data to Historian.
EXECUTIVE SUMMARY

Synchrophasors - Initiative in India
2 DECEMBER - 2013POSOCO
� Historian archives the PMU data for a period of few years depending on the storage capacity. The data can
be retrieved in user readable format and can be used for post-disturbance and forensic analysis. This data
can also be exported or imported to required standard format.
� Communication networks consist of high speed wide band communication infrastructure (optical fibres)
from substation to control centres.
� Real time visualizations include trend graphs of voltages, currents, frequency, angular separation between
nodes, MWs, MVARs and rate of change of frequency. Based on these trends, alarms can be raised for
decision making.
� Offline toolboxes consist of Signal Analysis Methods, Oscillation Monitoring Systems and Voltage Stability
Analysis etc.
Being the new evolving technology, Synchrophasors initiative in India was taken up by Power System Operation
Corporation Ltd. (POSOCO) in pilot manner in the year 2010 by installing 4 PMUs in Northern Region. Since then,
many other pilot projects have been taken up and implemented in other Regions also. Subsequently all these pilot
projects have been integrated and formed into a national level synchrophasors project which is under operation
with data availability from about 60 PMUs.
Overview of Synchrophasor pilot projects in India
As stated above, PMUs were installed on pilot basis in order to gain experience in Synchrophasor technology and
identify the challenges that may result prior to large scale deployment of PMUs in India. The PMUs installed in all
the five regions of the Indian grid were at strategically selected locations like generating stations, load centre
substation and interconnecting substations and as stated above a total of sixty PMUs have been installed in India.
All PMUs are ultimately integrated through respective Regional PDCs installed at Regional Load Dispatch Centres
to Central PDC installed at National Load Dispatch Centre, New Delhi.
Apart from the Pilot projects some PMUs are also installed as a demo project by different vendors and are also
reporting to National Load Despatch Centre through Regional PDCs. Futher MSETCL has also installed few PMUs
in Maharashtra under a separate project.
As regards to PDCs, it is stated that under the regional pilot schemes one Central PDC at NLDC, 5 Regional PDC
at respective RLDCs, 4 Local PDCs in Eastern Region and one Lab PDC at WRLDC are installed in India. At present
total 11 PDCs are functional and this is expected to grow with further concentration of PMUs in All India Grid.
Application of Synchrophasor data available through pilot project
The availability of Synchrophasors has considerably enhanced the wide area visualization and situational awareness
of power system behaviour under steady state as well in transient/dynamic conditions. The availability of
Synchrophasor data at control center has become first-hand information for grid operator to view and analyze any
transient phenomenon occurring in the grid. Various events that went un-noticed with present SCADA system can
now be detected and analyzed, opening up a completely new era in power system monitoring and control. There
is a paradigm shift in monitoring the grid after the commissioning of Synchrophasor pilot projects. Now-a-days
control centre operator first observes the signature of events through PMUs data and then refers to SCADA
system for the details of the events. Since the commissioning of Synchrophasor pilot projects in India, the

Synchrophasors - Initiative in India
DECEMBER - 2013 POSOCO3
synchrophasor data available at the Regional & National Load Despatch Centre has been utilized for real time
visualization and also for post-dispatch analysis in offline mode.
Grid event analysis at the Load Dispatch Centres in India hitherto was conventionally carried out with the help of
protection relay flags, Disturbance Records (DR) / Event Logger Records (EL) forwarded by the respective
transmission substations as well as the analogue data and SCADA Sequence of Events (SoE) Records, from wide
area SCADA/EMS and operator log book records. However challenges are posed in grid event analysis on
account of issues such as non-availability / healthiness / failure of recording instruments, human inhibitions in
data sharing, jurisdiction of the control centre over the station, time synchronization, portability/compatibility of
station DR/EL records with visualization software at the control centre, latency and skewedness in SCADA data,
and the challenges in the enforcement of regulations provided for grid event recording and data sharing. The
availability of synchrophasors has become an effective tool for analysis of grid events and facilitated preparation
of an accurate ‘first information report’ of an event occurring in the grid.
Apart from post fault analysis, synchrophasor data has been utilized for monitoring & analysis of oscillations,
computation of Frequency Response Characteristic, validation of correct operation of protection system, island
detection & re-synchronization of grid, dynamic model validation, visualization of special events such as HVDC
Frequency Controller Testing, Power System Stabilizer Testing, Turbine Valving and monitoring of cyclones. An
overview of the application of synchrophasors data in real-time and offline arrived on the basis of a number of
case studies captured in different RLDCs/NLDC since July 2012 is presented in the table below:
Application Description Reference No.ofin Present CaseDocument Studies
� Fault detection, classification and analysis
- Faults in Transmission Line,
power station/grid substation
- Tripping due to lack of protection Section 5.1 15
co-ordination/Instrument error.
- Faults involving high impedance
- Faults cleared by back up protections
� Low frequency Oscillation
- Inter Area Oscillation
- Inter Plant Oscillation Section 5.2 9
- Inter & Intra Plant Oscillation
� Detection of coherent group of generators Section 5.3 1
� Island Detection & Resynchronization to Grid Section 5.4 3
� Dynamic Model Validation Section 5.5 4
� PSS testing of hydro power station Section 5.6 1
� Monitoring during National disaster Section 5.7 2
Analysis of
faults / Grid
incidents
Detection and
analysis of
oscillations in the
power system
Post-dispatch
analysis of grid
operation
Enhancing
situational
awareness

Synchrophasors - Initiative in India
4 DECEMBER - 2013POSOCO
Challenges
Synchrophasor technology has many advantages, however implementing it on a large scale also poses many
challenges. In India, the project was first started on a pilot basis to obtain initial experience of the technology and
now it is being scaled up in the upcoming scheme known as Unified Real Time Dynamic State Measurement
Scheme (URTDSM Scheme). During the execution of pilot projects many challenges were faced, which include:
� Selecting locations for PMU placements
� Type of architecture required
� Setting up of standards and compliances
� Ensuring interoperability of PMUs
� Availability and setting up of communication infrastructure
� Developing tools for in-depth post facto analysis
� Event Detection
� Developing lucid visualizations for system operators
� Integration of Synchrophasor technology with SCADA
� Cyber Security Management & Compliance
Way-forward
Initial experience with Synchrophasor pilot project has been extremely beneficial and the analysis carried out
using Synchrophasor data is highly rewarding. It will be more beneficial to install PMUs throughout the country on
all EHV and UHV substations.
Currently, the PMUs are installed on the pilot/ demo basis. The pilot/demo projects have been extremely beneficial
in obtaining the knowledge of difficulties involved in installation and communication of PMUs. With this platform,
India is now fairly ready for large scale deployment of PMUs across the country. Under URTDSM scheme being
implemented by POWERGRID, it is envisaged to deploy around 1700 PMUs throughout All India Grid with aim of
enhanced visibility to the operator. Along-with advanced applications are also under development and efforts are
going on at a fast pace to attain maximum benefits using synchrophasor data.

Synchrophasors - Initiative in India
DECEMBER - 2013 POSOCO5
ACKNOWLEDGEMENT
The motivation, encouragement and support provided by Ministry of Power, Government of India, in deployment of
synchrophasors technology in India are gratefully acknowledged.
POSOCO is grateful to the Central Electricity Regulatory Commission for its pioneering role in recognizing the need
for synchrophasor and being considerate in approvingand providing funds for the synchrophasor pilot project in
India.
The technical assistance and guidance provided by the Central Electricity Authority and Power Grid Corporation of
India Limited, particularly during finalization of the technical specifications of the synchrophasor pilot project, are
duly acknowledged. POSOCO is thankful to the management and operating personnel of the concerned grid sub-
stations in the different regions for coordinating the commissioning of PMUs at their substations. Availability of
the wide band communication is very important in making any synchrophasor project operational. Availability of
communication channels at the desired nodes was one of the deciding factors for PMU placement in India. With
the concerted efforts and support of the Regional Transmission Groups and Telecommunication Department of
POWERGRID, the communication channels between some of the critical nodes could be arranged and these
efforts and support are also duly acknowledged.
Cooperation and support extended by all the esteemed members of the Regional Power Committees and other
stakeholders is also gratefully acknowledged.
POSOCO would like to thank researchers, scientists, engineers and institutions working on Synchrophasors/
Smar t Grid across the globe. The technical literature developed by them provided a solid foundation for the
initiatives taken in India. Special thanks to Prof. Arun Phadke (Virginia Tech University), Dr. Ken Mar tin,
Mr. Mahendra Patel (PJM), Prof. Anjan Bose (Washington State University), Dr. Vahid Madani (PGE, USA), Dr.
Prabha Kundur (KPSS, USA), Prof Venkatasubramanian (Washington State University), Dr N. D. R. Sarma (ERCOT
Texas), Prof A.M. Kulkarni (IIT-Bombay), Prof S. Soman (IIT-Bombay), Prof S.C. Srivastav (IIT-Kanpur), and Dr.
Nilanjan Senroy (IIT-Delhi) for sharing their knowledge and experience during various interactions with system
operators.
The herculean effor ts put in by all the persons/engineers,vendors and application developers involved in
conceptualizing, commissioning, designing applications and utilizing the synchrophasor technology as well as in
documenting the experience in different phases is acknowledged.
This report is a culmination of collective efforts and contribution of a large number of engineers within POSOCO/
POWERGRID. The valuable contribution by each and every one of them is highly appreciated and acknowledged.

Synchrophasors - Initiative in India
6 DECEMBER - 2013POSOCO
Precautions have been taken by Power System Operation Corporation (POSOCO) to ensure the accuracy of data/
information and the data/information in this repor t is believed to be accurate, reliable and complete. However,
before relying on the information material from this report, users are advised to ensure its accuracy, currency,
completeness and relevance for their purposes, and, in this respect, POSOCO shall not be responsible for any
errors or omissions. All information is provided without warranty of any kind.
POSOCO disclaims all express, implied, and statutory warranties of any kind to user and/or any third par ty,
including warranties as to accuracy, timeliness, completeness, merchantability, or fitness for any par ticular
purpose. POSOCO have no liability in tor t, contract, or otherwise to user and/or third party. Further, POSOCO shall,
under no circumstances, be liable to user, and/or any third party, for any lost profits or lost opportunity, indirect,
special, consequential, incidental, or punitive damages whatsoever, even if POSOCO has been advised of the
possibility of such damages.
By reading this repor t, the users/reader confirm about their awareness and agreement to this disclaimer and
associated terms referred elsewhere.
Copyright Information
This report has been compiled by POSOCO and is a result of contribution in some or other form of many experts, engineers, power
system professionals. Hence, this report is being published for the benefit of power system fraternity. Information in this report can
be used without obtaining the permission of Power System Operation Corporation. However, the material used from this report
should be duly acknowledged by way of citing the name of report, publishing month and name of Power System Operation
Corporation.
DISCLAIMER

Synchrophasors - Initiative in India
DECEMBER - 2013 POSOCO7
1.1. Introduction
The Indian electricity grid is among one of the largest power grids in the world. It has installed capacity of 229 GW
as on Oct. 2013 and comprises of five regional grids namely Nor thern, Eastern, North Eastern, Western and
Southern grids. Among these the first four are operating synchronously as N-E-W grid while southern grid is
connected asynchronously with the N-E-W grid through HVDC system. Southern grid is also likely to be synchronized
with N-E-W grid in first quarter of year 2014.
Operation of the Indian power grid is monitored and coordinated through the National Load Dispatch Centre
(NLDC) and five regional load dispatch centres (RLDCs), thir ty-three state load dispatch centres (SLDCs) and
several sub-load dispatch centres. Each control center has been provided with SCADA/EMS system which provides
necessary data visualization to the grid operators.
To complement visualization and to enhance situational awareness to the grid operators in control center,
synchrophasors projects have recently been deployed. The endeavor star ted with a pilot project in Northern
Region in the year of 2010 with four Phasor Measurement Units (PMUs) and one Phasor Data Concentrator
(PDC). Subsequently more pilot projects were taken up in all the regions and consequently the number of PMUs
has now increased to sixty and the Regional projects were further integrated at NLDC. Thus within a span of two-
three years the synchrophasors initiatives resulted in a national level project and have helped in understanding
and harnessing the benefits of this technology.
With the help of Synchrophasor technology, system operators are now able monitor the magnitude and angle of
each phase of the three phase voltage/current, frequency, rate of change of frequency and angular separation at
every few millisecond interval (say 40 milliseconds) in the Load Despatch Centre. Thus the transient / dynamic
behavior of the power system can be observed in near real-time at the control centre which hitherto was possible
only in offline mode in the form of substation Disturbance Records or through offline dynamic simulations performed
on network models.
With the interconnection of regional grids, the angular separations over a wide area are one of the key indicators
to assess the stress in the power system. The larger the phase angle difference between the source and sink,
greater is the power flow between those points. Hence greater phase angle differences imply larger stress across
that interface and larger stress could move the grid closer to instability. Angular separation could provide valuable
insights into the health of the synchronous interconnection. Relative phase angles across the system at the
BACKGROUND
1

Synchrophasors - Initiative in India
8 DECEMBER - 2013POSOCO
starting time of the disturbance can provide information about initial system loading conditions. They also provide
a very important indicator of how the system reacted to the disturbance. In case of oscillations, relative phase
angles can be analyzed to understand the nature and shape of the oscillations, and to provide knowledge of how
different parts of the system oscillate relative to each other. This information allows an assessment of what parts
of the system swinging coherently, and in what parts of the system would out-of-step conditions be more likely
to occur.
The initial experience in India with Synchrophasors was documented in the report titled “SYNCHROPHASORS
INITIATIVE IN INDIA” published in June 2012.
Previous edition of the report has covered following aspects in detail:
� Features of Pilot and demo projects in different regions
� Availability of online and offline applications
� Various case studies for each application
� Further analytics to be done
� Road map and suggestions for the future
1.2. Objective of this Report
Since the publishing of first edition of report on “Synchrophasors Initiatives in India”, in June-2012, the implementation
and experiences of Synchrophasor technology in India has progressed to a level of confidence. Since then, new
pilot projects have been implemented, integration at national level has been carried out, many availability of
synchrophasors data during grid incidences and events have enhanced the confidence of the grid operators.
In order to document further experiences and to benefit the power system fraternity world-wide, a working group
was formed by Power System Operation Corporation Ltd, India for compilation of the experience with Synchrophasors
technology in India in the form of second report. The working group is comprised of members from Regional/
National Load Despatch Centres of India to enumerate the experience and challenges in implementing the various
pilots and challenges experienced during execution.
This report attempts to compile the experience of the pilot/demo/complementary projects undertaken in Northern,
Eastern, North Eastern, Western and Southern Regional power system in India. This report covers the following
aspects:
� To comprehensively present the features available in the present pilot projects installed in all regions.
� Pilot projects Implementation and integration experience at POSOCO.
� Document the case studies for each application using Synchrophasors.
� To discuss the applications available and used in real time as well as offline analysis
� Way Forward for the Synchrophasor assisted grid operations
This report describes the currently available features in Synchrophasor pilot projects in India, associated benefits
achieved, use of Synchrophasor data in grid operation and POSOCO experience and challenges faced during
integration.
Document the case studies for each application using Synchrophasors.

Synchrophasors - Initiative in India
DECEMBER - 2013 POSOCO9
Further the project data and costs mentioned in the report are indicative and only approximate and not necessarily
the actual cost implication to the POSOCO/POWERGRID. Challenges mentioned in this report are based on the
experience and not necessarily the compulsory challenges for every utility around the world and including India.
1.3. Chapter-wise overview
Chapter-1iIntroduces the Indian Electricity Grid with its structure and the objective of the report. It also gives a brief
glimpse of the previous edition of the report. The literature survey carried out before and during the implementation
of the projects is documented in this chapter.
Chapter-2 gives the project details in all the five regions of Indian power system. Details of PMU, PDC, Historian
and Real time Dashboard are listed in tabular form to give a one shot view of the project across all five regions of
the Indian Power System.
Chapter-3 describes the architecture of the synchrophasor project in all the regions.
Chapter-4 details the national level integration of the synchrophasor project in India. The location of PMUs across
the country is depicted in this chapter. It also includes the architecture of the project at national level.
Chapter-5 illustrates an compendious list of case studies of grid incidences/events wherein PMU data was found
helpful. Variety of case studies such as fault detection and classification, Low frequency oscillation, detection of
coherent groups, island detection and resynchronization, Dynamic model validation and visualization of PSS
testing are discussed in this chapter.
Chapter-6 describes the experience with the utilization of the PMU data both in offline and online mode is discussed
in this chapter.
Chapter-7 describes the challenges faced during the installation and commissioning in multivendor system. It also
describes the challenges faced in analysing the data obtained from PMUs.
Chapter-8 gives the introduction to way forward in Synchrophasor technology for POSOCO/POWERGRID.
1.4. Literature survey
Though the Synchrophasor technology in India has not achieved deep penetration, the rate at which it is gaining
momentum is really promising. In the coming years there will be wide spread increase in number of PMUs
installed all across the country. The first-hand experience of the Synchrophasor technology was really enriching
and effor ts are going on to attain maximum benefits from PMUs. It is expected that, once the reliability and
confidence in utilization of the PMU data is attained it will slowly replace the conventional SCADA systems. Indian
Power System scenario is very complex mainly due to geographical reasons. The concentration of generators and
loads in the country dictates the construction of the transmission network. Ever since the invention of PMUs, it
has become a key research topic for improving the power system operation. India, in the quest of attaining
maximum availability and reliability, has taken the Synchrophasor technology very seriously and the experiences
in its implementation are very well documented in this second Synchrophasor report.

Synchrophasors - Initiative in India
10 DECEMBER - 2013POSOCO
It is well known fact that, Proof of Concept (PoC) validation and pilot/demonstration is very much required to be
carried out before implementing the Synchrophasor technology on large scale. The pilot projects are being carried
out on the basis of many research results and utility experiences on Synchrophasor technology all across the
world. This report includes some of the results which were also presented in some of the conferences. It includes
the benefits derived from the data obtained from PMUs in the Indian Power Grid. Many interesting case studies
were observed which are presented in references.
1.4.1. Fundamental understanding of Synchrophasor technology
Before star ting the project it was extremely necessary to understand the fundamentals of the Synchrophasor
technology. The preliminary understanding regarding PMUs and few of its applications is explained very
comprehensively in. [B1-B2]. Since the tolerable frequency band in Indian grid is from 49.7 Hz to 50.2 Hz, it is
extremely necessary to determine the correct value of phasor at off nominal frequencies, where small deviation in
frequency may cause large errors in measurements.
1.4.2. Initial experiences from around the world
The pre-execution experiences regarding the PMU installation and its use across the world were deliberated in
[B3] were very useful in understanding the challenges and preparedness required. Due to high resolution data of
PMU of around 25 samples per second as followed in India and the ability to measure additional quantities like
angles, ROCOF and sequence components, the amount of data required to be transmitted by the PMUs to the
PDCs is huge. As the number of PMU increases this data size also increases exponentially. The overheads added
from each PMU further increases the size. One method to address this problem as mentioned in [B3] is to have
intermediate PDC installed transmitting data to main PDC which will at least reduce the overheads to be transmitted.
Diverse requirements from the stakeholders, hinders the customization of the technology.
Before installation on a large scale, pilot projects were carried out and the locations were to be decided. Optimal
placement techniques are explored in many research papers in order to increase the observability of the system.
The [B4] discusses various possible locations where PMU should be placed. It describes the selection of PMU
locations based on three selection criteria viz. Criteria based selection, selection by topology analysis and selection
by dynamic analysis. In order to attain varied experiences and to attain at least partial observability, PMUs were
installed in India on the basis of certain thumb rules mentioned in the previous report and other literature. Currently,
the PMUs are installed at generating stations, load centers, HVDC links, interregional lines stations and critical
intermediate substations.
1.4.3. Communication
In order to make effective use of PMUs, the communication required between PMUs and the PDCs to which they
report must be reliable. The IEEE standards C37.118 [B42], introduces the concept of frames for transmitting data
from PMU to PDC. The bandwidth of the communication channel should be decided from the communication
traffic in the utility environment. [B5] shares the experience of PMUs communication in Utility environment. A free
version of PMU connection tester available from Grid Protection Alliance (GPA) was really helpful for testing the
PMU configuration on sites.

Synchrophasors - Initiative in India
DECEMBER - 2013 POSOCO11
1.4.4. Offline applications
The process of application development from the Synchrophasor data is also needed to be developed simultaneously
along with the installation. Due to the time stamping of the data, the analysis based on PMU data is fairly
accurate. Various possible offline applications are listed in [B6]. Effor ts are going on to achieve each of the
application in Indian power systems. The experiences of Synchrophasor technology in case of faults were discussed
in the earlier edition of this report also. PMU helps in identifying the type of faults. The behavior of the voltage and
currents for LG, LL, LLG and three phase faults are different. The nature of faults can be identified from the PMU
measurements easily. The applicability of PMUs in identifying the location of faults is also explored. The number
of PMUs installed in the Indian power system at present are very less. The effective use of the information derived
from such less number of PMUs needs to be explored. [B7] throws some light on how useful information can be
derived from such a small percentage of PMUs in the system. The same reference also explains the detection of
line outage using Phasor angle measurements. Although the methods are not implemented yet, but possibilities
for including them in the system is high. Some case studies depicting the detection of approximate location of
faults are discussed in this report.
The most important benefit of WAMS is that it gives real time angle difference between the nodes. Conventionally,
the angle difference is calculated using state estimation techniques or offline power flow techniques. The angle
difference gives the indication of stresses on the system. The measurement of node angles faced the problem of
angle wrapping. This introduced erroneous result in calculation of angular difference. This problem was addressed
in [B8]. The previous edition of the report focused on stability assessment based on angular difference between
the nodes.
The increasing stresses on the power system have witnessed the problem of low frequency oscillations in the
power systems. Low frequency oscillations may occur due to small changes in the system or can be due to a
fault in the remote location. These oscillations which were difficult to monitor earlier can be very well monitored
using the PMU measurements. Numerous mathematical techniques for analysis of low frequency oscillations are
discussed in the literature. The simple frequency domain technique such as Fourier transform in the form of FFT
can be used for initial analysis of the signals. Techniques such as STFT and wavelet transform which give the
instant of the fault or any ambient change were used in [B9-B10]. PMUs helped in analyzing low frequency
oscillations in Indian Grid also. The references [R5-R6] describes the experiences of low frequency oscillations in
Indian grid and their analysis. These LFOs were confirmed by multiple mathematical techniques such as Matrix
Pencil, Prony analysis and HTLS. [B18] explores the possibility of performing Matrix Pencil, HTLS and Prony
analysis on real time basis. This paper also explores the modulation scheme for HVDC to damp out interarea
oscillations when the OMS detect poorly damped oscillation.
The PMUs were also helpful in detecting islanding conditions in the system. Detection of island formation is one
of the most critical case in Indian power system since the Indian power system is largely interconnected. [B13-
B14] discusses few methods of islanding detection. [B13] Mentions the passive methods based on voltage,
frequency and rate of change of frequency and the active methods based on forced frequency shifting, reactive
power fluctuation etc. for islanding detection. Generally as of now, the passive methods have helped in detection
of islands. Few of the case studies are presented in this report related to islanding detection are offline in nature.

Synchrophasors - Initiative in India
12 DECEMBER - 2013POSOCO
1.4.5. Real time applications
The application of PMU during real time is the desired goal of the project. The PMUs must be able to create
situational awareness of the system in real time in order to make the operator to take preventive actions. In [B15],
it is clearly deducible that most of the blackout events occur due to lack of situational awareness. Legible
visualizations need to be developed in order to make the operator aware of the situations. The [B26] discuss
different types of visualizations which help the operator to understand the data. The common types of visualization
are the trend graph, polar plots etc. In order to depict small signal analysis output data on the visualizations, online
oscillation monitoring tools are essential. Effor ts are still going on to provide better easily understandable
visualizations for the operators regarding the condition of the power system.
Synchrophasor technology is a step towards smart grid in transmission system. It is required to be implemented
on a large scale to increase the observability of the system. The variety of case studies analyzed using PMU data
provide a platform for research and understanding more about power system. With new applications continuously
being identified and researched upon, Synchrophasor prove to be a promising technology for improving the reliability
in the power system.

Synchrophasors - Initiative in India
DECEMBER - 2013 POSOCO13
The Synchrophasor initiatives in India star ted with the implementation of a very simple project consisting of 4
PMUs and 1 PDC along with data historian and operator console in May 2010 in Northern Region. Subsequently,
other pilot projects were taken up in different regions. Later on these all projects were integrated at National level
by providing a PDC at National level in National Load Despatch Center located at Delhi. Details of the projects are
given below in Table 2-1.
Table 2-1 : Project Details
Sl. No. Description Details Pertaining to
ER NER NR SR WR NLDC
1 Project Type Pilot Pilot Pilot Pilot Pilot Pilot
2 Number ofPMUs 8 6 8 6 11 18
Installed
ERLDC,Kolkata
BinaguriS/s
3 PDC Biharshariff NERLDC, NRLDC, SRLDC, WRLDC, NLDC, Locations S/s Shillong New Delhi Bengaluru Mumbai New Delhi
RourkelaS/s
Sasaram
S/s
2.1. Phasor Measurement Units (PMU)
PMUs installed under these projects provide time stamped synchronized measurements to Phasor Data
Concentrators (PDCs) installed at Control Center at a reporting rate of 10, 25 and 50 frames/second. Most of the
PMUs installed at EHV substations are reporting in IEEE C37.118-2005 protocol combination of either One/Two
sets of Voltage or one/two sets of Current signals. The major features of Phasor measurement units installed in
different regions are given in Appendix-A, Table A-1.
OVERVIEW OF SYNCHROPHASOR PROJECTS
2

Synchrophasors - Initiative in India
14 DECEMBER - 2013POSOCO
2.2. Phasor Data Concentrators (PDC)
The Phasor Data Concentrators receives data from various PMUs, aligns the received data and forwards the
aggregated data to real time applications. The major features of Phasor Data Concentrators installed at different
Control Centers are given in Appendix-A, Table A-2.
2.3. Data Historians
The data historian systems have been provided to archive the Synchrophasor data for later retrieval and analysis.
Since all projects have been taken independently, all have separate data historians. The features available in the
historian installed at different control centers are tabulated in Appendix-A, Table A-3.
2.4. Data Visualisation
Visualization is used for showing data to the control room operators in a comprehensible way and has been
extended to Control Rooms of the respective control center. This is used for real time monitoring through
Synchrophasor data. Features of operator dashboard available in different control centers are given in Appendix-A,
Table A-4.

Synchrophasors - Initiative in India
DECEMBER - 2013 POSOCO15
3.1. Eastern Region
The WAMS pilot project of ERLDC consists of installation of PMUs with GPS system initially at eight substations
of Eastern Region. The Phasor data from these locations will be monitored at ERLDC. The critical PMUs are also
integrated with the station PDC. The PDC at ERLDC shall forward PMU data to PDC installed at NLDC and also to
the visualization unit and data archival server. The schematic architecture of the Project is shown Figure 3-1 and
PMU geographical locations are shown in Figure 3-2.
Figure 3-1 : Architecture of PMU pilot project in Eastern region
ARCHITECTURE OF SYNCHROPHASOR PROJECT
3

Synchrophasors - Initiative in India
16 DECEMBER - 2013POSOCO
3.2. North Eastern Region
M/s SEL has installed PMUs at selected eight locations in North Eastern Region. SEL 700G PMU model has been
installed at all locations. The installed PMUs are being used as measurement class, reporting 12 phasors and 4
analogs with reporting rate of 25 frames/sec. The most of communication links are having a bandwidth of 2Mbps,
offering good speed for transfer of data between PMUs and PDC. The architecture of PMU pilot project in NER is
shown in Figure 3-3. Synchrophasor data is being transferred from PMUs to PDC through various routers, firewall and
LAN switches. The received data from PMUs are not only presented to NERLDC Control room, visualization is
extended to RPC, SLDCs and NLDC.
Figure 3-2 : Location of PMUs in Eastern region

Synchrophasors - Initiative in India
DECEMBER - 2013 POSOCO17
Figure 3-3 : Architecture of PMU project in North Eastern region
The Geographical locations of PMUs in North Eastern region are shown in Figure 3-4.
Figure 3-4 : Geographical locations of PMUs in North Eastern Region

Synchrophasors - Initiative in India
18 DECEMBER - 2013POSOCO
3.3. Northern Region
PMU pilot project implemented in Northern region has fourteen PMUs. The locations of PMUs were selected in view
of observability of dynamics of NR and availability of communication links. Through existing wideband communication
links the PMUs are reporting to PDC placed in NRLDC. The synchrophasor application consists of historian,
visualization of events, alarm alerts and visualizations in real time. It also consists of visualization of low frequency
dominant modes existing in the system. Architecture of PMU pilot project in Northern region is shown in Figure 3-
5 and PMU Geographical locations are shown in Figure 3-6.
Figure 3-5 : Architecture of PMU pilot project in Northern region
Figure 3-6 : Geographical Locations of PMU pilot project in Northern region

Synchrophasors - Initiative in India
DECEMBER - 2013 POSOCO19
3.4. Southern Region
PMU pilot project in southern Region involves installation of six PMUs and the associated application software.
The PMUs are installed by M/s SEL and this project has been successfully completed by 31st March 2013. An
additional four PMUs were also installed by M/s SEL under the Northern region PMU project (NLDC project). The
communication link from PMUs to PDC is fiber optic, other than PMU in Narendra which is using VSAT link of
KPTCL. PMUs were spread all over southern region communicating with PDC at SRLDC. The schematic architecture
of the Project is shown Figure 3-7.
Figure 3-7 : Architecture of PMU pilot project in Southern region
The geographical locations of PMUs in southern region is shown in Figure 3-8.
Figure 3-8 : Geographical locations of PMU

Synchrophasors - Initiative in India
20 DECEMBER - 2013POSOCO
3.5. Western Region
The architecture of pilot project in western region is shown in Figure 3-9. M/s Kalkitech in collaboration with
National Instruments (NI), USA has installed PMUs (NI -cRIO-9024) in selected eleven locations under WR PMU/
PDC Interim Pilot Project. M/s. SEL has installed four PMUs under NLDC project, One PMU (Siprotec 6MD85) is
installed by Independent Power Producer(IPP). SYNC 4000 PDC is installed to align and aggregate the all fifteen
PMUs data. eDna (M/s. Instep) Visualization and historian software is installed at WRLDC to store data as well as
operator console visualization. The communication link connecting PMUs and PDC is mostly provided by
POWERGRID. These communications links are having a bandwidth ranging from 64Kbps to 2Mbps depending
upon location and feasibility. All the PMUs transfer the Synchrophasor data to PDC in IEEE C37.118-2011 standard.
Figure 3-9 : Architecture of PMU project in Western region
The Geographical locations of PMUs in western region are shown in Figure 3-10.
Figure 3-10 : Geographical locations of PMUs in Western region
Rajkumar
Typewritten Text

Synchrophasors - Initiative in India
DECEMBER - 2013 POSOCO21
4.1. National WAMS Project Architecture
At the National level one central PDC is installed at National Load Despatch Centre (NLDC), Delhi. This Central
PDC is integrated with the PDCs installed at five regional control centres through dedicated 2 Mbps optical fiber
communication links. The architecture of pilot project taken up at National Load Dispatch Center for all India
Synchrophasor data integration is shown in Fig 4-1. In addition to above 6 numbers of PDCs, one at National and
five at regional control Centres, 4 nos of local PDCs are also installed in Eastern Region and one Lab PDC also
installed at Western Region control Centre. Hence at present total 11 numbers of PDCs are functional in India
(details of PDCs and locations are given in Appendix B, Table B-6).
Figure 4-1 : National WAMS Project Architecture in India
There are Fifty seven PMUs installed by RLDCs / NLDC under different Pilot Projects, apart from these, three more
PMUs are installed by IPPs. PMUs installed in a region are reporting to PDC (Phasor Data Concentrator) of that
region. At NLDC PMUs data are available through regional PDCs. PMU measures the Voltage Phasors, Current
Phasors, Frequency, Rate of change of frequency etc The inputs given to the PMUs are 110 Volt from the secondary
side of PT/CVT of 400 KV/220 KV/132 KV buses and 1 ampere three phase current inputs from CTs of the selected
feeders (list of the PMUs and feeders in given in Appendix-B) PMUs are GPS clock synchronized and reporting to
NATIONAL LEVEL INTEGRATION OF SYNCHROPHASORS
4

Synchrophasors - Initiative in India
22 DECEMBER - 2013POSOCO
respective Regional PDCs at 25 Frames/Second i.e. every control center is updating Phasor data every 40 milli
seconds, with the integration of Regional PDC to National PDC has facilitated all India level monitoring.
Apart from the Pilot projects some of the PMUs are also installed by the vendors as a demo project. These demo
project PMUs are also integrated with the Regional PDCs alongside the PMUs of Pilot projects. MSETCL also
installed few PMUs in Maharashtra EHV network. Geographical locations of PMUs are shown in Figure 4-2.
Figure 4-2 : Geographical Locations of PMUs in India
Synchrophasors - Initiative in India
DECEMBER - 2013 POSOCO23
Before the integration and up-scaling of regional projects to National level it was not possible to analyse the
impact of an event occurred in one region on the far situated substations located in other regions. After the
availability of all regional PMUs data at National Control Center it became possible to visualise the grid wide
impact of any grid event.
4.2. WAMS Infrastructure at NLDC
Under the project one PDC, one Historian along-with SAN storage (installed at NLDC) and eighteen nos. of PMU
was envisaged, which are installed at selected locations all over the India. Details of the SEL supplied PDC and
Historian are attached as appendix-A. Currently all five regional PDCs are integrated with Central PDC at NLDC.
NLDC PDC (SEL - 5073) is receiving data at 25 frames per second from all regional PDCs. The communication
links between Regional PDCs and NLDC PDC are 2 Mbps each.
Historian installed at NLDC is expected to handle large volume of time stamped measurement data and typically
used for saving and retrieving phasor data. Historian is connected with the SAN storage (9 TB) to store the
historical data. Data from historian can be retrived in csv or COMTRADE (ASCII & Binary) formats.
The visualizations for system operators are custom made and these consoles are made in historian. Historian
quickly translates Synchrophasor data into visual information through trend and dial displays. SEL-5078-2 performs
modal analysis on received event data from PDC and the results are stored. The data from historian not only
improvises system operator decision also helps system planners to improve system models.
4.3. ERLDC PDC Integration
At present Jamshedpur, Ranchi, Farakka and Talcher PMUs (Under NRLDC phase-II PMU project) are reporting to
NLDC PDC directly. A dedicated 2Mbps communication link has been provided by POWERTEL from ERLDC, Kolkata
to NLDC, New Delhi. As per future plan all these PMUs will be reporting to ERLDC PDC and subsequently all PMUs
data including 8 PMUs under ERLDC WAMS Pilot project will report to NLDC PDC through ERLDC PDC.
4.4. NERLDC PDC Integration
All Eight PMUs installed in NER have integrated to NLDC PDC through NER PDC in C37.118 protocol, these two
PDCs are connected through a 2 Mbps Communication Channel.
4.5. NRLDC PDC Integration
At present all the Fourteen (14) PMUs installed in Northern Region are integrated to NLDC PDC through NRLDC
PDC in C37.118 protocol.
4.6. SRLDC PDC Integration
Presently Ten (10) PMUs are installed in Southern Region under the Pilot project and are repor ting to PDC at
SRLDC which have been integrated with PDC at NLDC. The communication link is a dedicated 2 Mbps link from
SRLDC to NLDC.
Some PMUs under demo project are also installed in Southern Region and are integrated with PDC installed at
SRLDC. These PMU are also reporting to NLDC.

Synchrophasors - Initiative in India
24 DECEMBER - 2013POSOCO
4.7. WRLDC PDC Integration
All PMUs reporting at WRLDC are reporting to NLDC PDC through a dedicated 2 mbps communication link in
C37.118 protocol. Currently Sixteen WR PMUs are integrated with NLDC PDC through WRLDC PDC. During initial
stage of integration, data with WRLDC to NLDC used to be frequently interrupted. The inherent peculiarity of WR
Synchrophasor project is the varying nature of communication channels from bandwidth range starting from
64kbps to 2 Mbps in between PMU locations to WRLDC PDC, in addition the initial memory allocation for input
buffer was only 100MB, due to low buffer size and slow communication channels, few data frames were discarded
at PDC level. After rigorous exercises, by increasing the input buffer size at WRLDC PDC to 500MB, the data
interruption problem has been solved since then.
Some PMUs under demo project are also installed in Western Region and are integrated with PDC installed at
WRLDC. All these PMUs are also reporting to NLDC.

DECEMBER - 2013 POSOCO25
Synchrophasors - Initiative in India
One of the greatest advantages of synchrophasor measurement is availability of time synchronized data obtained
from various grid stations spread across a wide geographical area covering thousands of square kilometers. The
synchrophasor data is being extensively used for real time and post event analysis.This chapter envisages the use of
the synchrophasor data for event detection and event analysis for the purpose of development of analytics and tools
to monitor the event. The whole chapter has been divided into various categories of analysis for which the data was
used. This was followed by the collective knowledge from all the NLDC/RLDCs kept in form of inferences derived, key
points and statistics.
Various grid events have been analyzed using the synchrophasor data along with other data like Station Disturbance
recorder (DR), Event logger (EL), SCADA Sequence of Event (SOE) etc. These events can be broadly classified in
the following categories:
1. Fault detection, classification and analysis
2. Low Frequency Oscillation
3. Detection of Coherent Group of Generators
4. Islanding Detection and their resynchronization with the grid
5. Dynamic Model Validation Using Synchrophasor data
6. Visualization of PSS testing.
7. Monitoring of Natural disasters.
These are the major categories of various types of events in the Indian grid which are analyzed with the help of
Synchrophasor data. Each category consists of various case studies from different regions which are discussed in
section ahead. These case studies have helped in identifying the protection system/controller issues present in system
and accordingly taking corrective measures.
5.1. Fault Detection, Classification and Analysis
Fault detection, localization, recovery and its analysis is the focal point of research in field of power systems since the
establishment of electricity transmission and distribution systems. Main objectives of any fault analysis are to provide
information to understand the reasons that has led to the interruption, performance of protective equipments and
remedial actions taken to avoid its occurrence in future. There are two methods to analyze any fault in power
system which are as follows:
USE OF SYNCHROPHASOR DATA -CASE STUDIES
5

26 DECEMBER - 2013POSOCO
Synchrophasors - Initiative in India
1. Field measurement based fault Analysis: Any disturbance is associated with abnormal changes in current,
voltage, power and power angle. These perturbations in the electrical parameters can be captured by recording
devices with high sampling rate. These measurement help in finding the type of faults, elements affected by
the fault, fault current and its characteristic, protections operated, mal-operation or failure of protection
system, fault clearing time, fault location and distance etc.
2. Offline simulation based fault analysis: Fault analysis from this approach is cumbersome activity and
time consuming. This type of fault analysis is performed to visualize the large event like grid disturbance
and blackout. It helps in finding the large scale shor tcomings in the system and give insight to the
planners to plan the course of action to safeguard the system. This type of analysis first requires a very
reliable sequence of event from the various measurements.
Field measurements for any fault are available in basically three forms:
1. Disturbance recorder (DR): Disturbance recorders or Numerical Relay outputs give insight into the measurement
aspect of the fault along with the protection. It allows the user to look into the measured electrical parameters
and electrical protection with progress of time. DRs are basically meant to analyse the response of individual
elements of power system.
2. Event logger (EL): Event logger (ELs) is basically a logging device for any sub-station or set of equipment
which aligns the different operation from the set list of devices (Relay, CB, Isolator, CT, and PT) and aligns the
signal with time synchronization. This will create a sequence of event (SOE) for any fault /trippings in the sub-
station.
3. Data Acquisition System (DAS): This is a fixed time interval data of the field measurement like current,
voltage, power etc. for operator visualization.
In recent years Phasor measurement Unit (PMU) has evolved as a very important tool for power system engineer to
analyze any disturbance/event in the grid. A combination of PMU data along with SOE from SCADA and EL & DR from
Sub-station has given a good insight into the fault analysis in the power system. It has considerably reduced the time
consumed for analysis and helped in characterizing the event.
This section describes various fault analysis case studies observed in Indian Power system and their analysis based
on PMU data along with DR/EL/SOE. From the Voltage and current magnitude, angular difference, sequence voltage
and current magnitude, frequency and rate of change of frequency 40 ms data plots, it is possible to find out the type
of fault, fault duration, successful/ un-successful auto-reclosure and operation/ mis-operation of protection system
The cases in this section have been categorized as:
1. Faults in Transmission line, Power station / Grid sub-station
2. Tripping due to lack of Protection co-ordination / Instrument Error.
3. Fault involving High Impedance
4. Faults cleared by back up protection

DECEMBER - 2013 POSOCO27
Synchrophasors - Initiative in India
5.1.1. Transmission Line Fault
Transmission line faults consist of 85-87% of the total number of faults occurring in power system. Transmission line
faults are classified as single line-to-ground faults, Line-to-line faults, Double line-to-ground faults and three phase
faults. Following case studies discuss the various type of faults occurring in transmission lines and their characterisation
using synchrophasor data :
5.1.1.1. LG Fault on 400 kV Sami Dehgam circuit-1 and Unsuccessful Auto reclosure
Date and Time : 03-05-2013 16:21
Data Used for Event Analysis : Dehgam, Sugen, Boisar, Sugen PMU
Overview: This case study discusses a single phase to earth fault on a transmission line, detection of unsuccessful
auto-reclosure and fault location based on frequency and rate of change of frequency.
Event Description: B-phase to earth fault had occurred on 400 kV Sami- Dehgam Circuit-1. Auto reclosure was not
successful due to persistent fault which led to tripping of line. Figure 5-1 shows the fault location and the connectivity
of the various sub-stations along one of the path whose PMU data was used for analysis.
Analysis: As observed from the Figure 5-1 and Figure 5-2, the frequency and rate of change of frequency vary
depending on the electrical location of fault. The electrical location is the impedance path between the fault location
and various sub-stations. More is the electrical distance between the fault location and PMU installed, lesser is the
variation in frequency and ROCOF. It can be observed that the change in frequency and ROCOF during the fault is
highest at Dehgam which is the nearest PMU and it decreases with increase in electrical distance of the PMU location
[B46].
Figure 5-1: Connectivity diagram showing PMUs at Dehgam, Sugen, Boisar and Bhadrawati Sub-stations.

28 DECEMBER - 2013POSOCO
Synchrophasors - Initiative in India
Figure 5-2: Frequency and ROCOF from Various PMUs in Western Region
Figure 5-3: Voltages from the PMU at Dehgam end
Figure 5-4: Zero Sequence voltage from the PMU at Dehgam end

DECEMBER - 2013 POSOCO29
Synchrophasors - Initiative in India
From Figure 5-3 it can be observed that the voltage drop is highest in B-phase indicating fault in B-phase. The
duration of fault clearance was calculated from the zero sequence voltage shown at Figure 5-4. Two faults are
observed within a time gap of one second as the line auto reclosed for a persistent fault.
Figure 5-5: Current plot of 400 kV Dehgam-Gandhar II circuit from the PMU at Dehgam end
In the Current plot from PMU for 400 kV Dehgam-Gandhar II as shown in Figure 5-5, current in the faulty phase has
increased while in the remaining two phases there is an increment in Y phase, while small dip is ovserved in R phase.
As discussed in respect to Figure 5-2, fault can be localized based on excursion in frequency and ROCOF. The fault
was simulated in the PSS/E using dynamic simulation and the frequency variation during the fault was plotted which
is shown at figure 5.6. Hence it can be observed that similar results were obtained from Offline simulation studies
which were observed with synchrophasor data. The frequency change is maximum near to the fault and gradually
decreases with increase in electrical distance from the fault. Such type of characteristic will help in locating the source
of the fault in the grid.
Figure 5-6: Frequency plot obtained from the PSS/E Simulation for L-G fault on 400 kV Sami Dehgam 1

30 DECEMBER - 2013POSOCO
Synchrophasors - Initiative in India
5.1.1.2. LL Fault on 400 kV Ranchi Sipat 1 circuit
Date and Time : 09-06-2013 19:07
Data Used for Event Analysis : Bhadrawati PMU
Overview: This case study discusses a phase to phase fault on a transmission line.
Event Description: R-phase to Y-phase to phase fault had occurred on 400 kV Ranchi-Sipat circuit 1.
Analysis: Voltage plot from Bhadrawati (Figure 5-7) shows that dip was observed in R and Y phase indicating phase
to phase fault while the zero sequence voltage (Figure 5-8) has decreased by marginal amount indicating no ground
was involved.
Figure 5-7: Bhadrawati Phase voltage during the fault on 400 kV
Ranchi-Sipat-I
Figure 5-8: Bhadrawati Zero sequence voltage during the fault on
400 kV Ranchi-Sipat-I
Figure 5-9: Bhadrawati Raipur II Current plot during the fault on 400 kV Ranchi-Sipat-I

DECEMBER - 2013 POSOCO31
Synchrophasors - Initiative in India
Figure 5-10: DR of 400 kV Ranchi Sipat 1 from Sipat end during the fault
From the current plot of 400 kV Raipur Bhadrawati 2 circuit from Bhadrawati shown in Figure 5-9 it can be observed
that the current in one of the faulty phase has decreased while in other increased. The increment is not substantial as
fault was being monitored by PMU installed at a bus which was far from location of fault. DR of 400 kV Ranchi-Sipat
circuit 1 shown at Figure 5-10 indicates occurrence of a phase to phase fault.
This case study helped in fault characterisation of LL fault on transmission line using synchrophasor data.
5.1.1.3. Three Phase Fault on 400 kV Dadri-Muradnagar Ckt
Date and Time : 24-09-2013 02:32 Hrs
Data Used for Event Analysis : Dadri PMU
Overview:This case study discusses an unbalanced three phase fault.
Event Description: Complete outage of Dadri Thermal station occurred due to failure of a 11 kV Distribution transformer
which was located underneath 400 kV Dadri – Muradnagar line, just 4 kilometers outside the powerstation The failure
of distribution transformer in turn caused a 3 phase fault in 400 kV Dadri-Muradnagar line. The line tripped on
operation of distance protection Zone-1 with 3-phase fault indication.
Analysis: Voltage of 400 kV Dadri bus obtained from Synchrophasor at Dadri is shown at Figure 5-11 and Current in
HVDC Dadri interconnector is shown at Figure 5-12. It can be observed that the voltage has dipped to a very low value
and recovered after the tripping of the faulty line. From DR shown at figure 5-13, it can be observed that fault was
initially involving Y & B phases which got converted to three phase fault. From DR it was observed that the fault
clearing time was 160 ms, and the fault current was of the order of 37 kA peak (26 kA rms).While the fault should
ideally have been cleared within 100 milliseconds, the adjacent section viz, 400 kV Muradnagar-Panki has a Fixed
Series Capacitor (FSC) at Muradnagar end which necessitated a delay in Zone-I timings at Dadri end.

32 DECEMBER - 2013POSOCO
Synchrophasors - Initiative in India
Figure 5-11: Phase voltage of Dadri bus from PMU during three phase fault
Figure 5-12: Current of HVDC Dadri I/C from PMU during three phase fault
Figure 5-13: DR of 400 kV Dadri –Muradnagar Ckt from Dadri end during three phase fault

DECEMBER - 2013 POSOCO33
Synchrophasors - Initiative in India
Three phase faults are a rare event and that too close to a large generating substation. This incident brings out the
need for PMUs to be located at generator terminals to identify the dynamic behavior of generators under a
condition of fault in the power system.
5.1.2. Faults occurring at Power station & Grid Sub-station
Fault at or near a power station or a grid sub-station is always of high severity as it involves tripping of several
elements. Such faults occur mainly due failure of switchyard equipment’s or due to failure of jumpers. Faults which
involve complete station outage or multiple tripping are analyzed in detail using available measurements and remedial
actions are taken to avoid reoccurrence.
5.1.2.1. Multiple tripping of 400 kV lines due to failure of current transformer at Hassan substation
Date and Time : 10-03-2013 15:04 Hrs
Data Used for Event Analysis : Somanhalli PMU, DR,EL of Hassan substation & Udupi power station
Event Description: Current transformer installed in the tie bay of 400 kV Hassan-Mysore line-2 failed which in turn led
to tripping of four 400 kV transmission lines i.e., 400 kV Mysore-Hassan line-1 & 2 and 400 kV Udupi-Hassan line-1
& 2. Tripping of evacuating lines from Udupi power station led to generation loss of 800 MW. The loss of generation
led to over-loading 400 kV Hiryur-Neelmangla, 400 kV Gooty-Somanahalli and 400 kV Gooty-Neelamangala lines.
Figure 5-14 and Figure 5-15 shows the schematic diagram of area and the SLD of the Hassan 400 kV Sub-station
respectively.
Analysis: Figure 5-16 shows the 400 kV bus voltage recorded by synchrophasor installed at 400 kV Somanhalli sub-
station. The voltage plot indicates occurrence of two successive faults in Y phase with a time gap of nearly 1 second
between the two faults.
Figure 5-14: Schematic Diagram of Affected Area during
CT failure at Hassan S/sFigure 5-15: SLD of Hassan sub-station
The voltage drop was prominent in Y-Phase in both the cases which indicated a Y-Phase to earth fault. This in-turn
indicated failure of Y – phase current transformer at Hassan substation. From the negative sequence and zero sequence
current plot of 400 kV line Somanhalli-Salem line shown at Figure 5-17, it was inferred that the first and second fault were
cleared in 240 ms and 320 ms respectively i.e., there was delayed clearance of fault. A time gap of nearly 1 second was
observed between occurrences of the two faults.

34 DECEMBER - 2013POSOCO
Synchrophasors - Initiative in India
Figure 5-16: 400 kV Somanhalli bus voltage from PMU during CT failure at Hassan S/s
Figure 5-17: Negative and Zero sequence current for 400 kV Somanhalli-Salem Line from Somanhalli PMU
Table 5-1: Sequence of events during the multiple tripping due to CT failure at Hassan S/s

DECEMBER - 2013 POSOCO35
Synchrophasors - Initiative in India
From the sequence of events (Table 5-1) it was observed that all the Main breakers connected to 400 kV Bus-2
had opened within 50 ms of occurrence of the fault due to operation of busbar protection for Bus-2. This was a
desired operation as the faulty CT comes in the zone of busbar protection of 400 kV bus-2.
Figure 5-18: DR of 400kV Hassan-Mysore line-2 (Hassan end) Figure 5-19: Fault time line
It can be observed from disturbance recorder data of 400 kV Hassan-Mysore line-2 shown at Figure 5-18, that the
voltage dip in Y-Phase occurred at 15:04:24.080 hrs and the rise in current at 15:04:23.889 hrs i.e., there is a 240 ms
delay in operation of distance relay. Direct trip command was sent from Hassan end to 400 kV Udipi and 400 kV
Mysore which resulted in tripping of breakers of 400 kV Hassan-Mysore line-1 & 2 and 400 kV Hassan-Udipi line
from remote ends. This was not a desired protection operation and needed further analysis.
In both the cases it was observed that there was delayed operation of distance protection of 400kV Hassan-Mysore
line-2 which had led to delayed clearance of fault. The delayed operation of distance protection relay has been taken
up with the relay manufacturer. The wrong configuration in Bus-bar protection scheme had led to the initiation of direct
trip command to the other ends which was later rectified.
It can be observed that this was a case of high resistance fault so the zero sequence Current will be low. Here PMU
data helps in knowing about delayed clearance of fault & multiple faults in Y-Phase and Un-successful auto re-close of
breaker.
5.1.2.2. LG and LLG Fault at LANCO Sub-Station
Date and Time : 02-04-2013 20:20 and 20:23 Hrs
Data Used for Event Analysis : Raipur PMU, DR from LANCO S/s, EL and SOE from LANCO S/s
Overview: This case study describes the Single phase to ground and Double phase to ground fault which occurred at
the same sub-station.
Event Description: Heavy wind condition had caused a tin cladding sheet to fall on the B Phase of GT bay and ST bay
which resulted in earth fault. Due to this Unit#1 at LANCO thermal power station tripped on operation of differential
protection of GT-1. During the incidence ST-2 had tripped on REF protection. Generation loss of 268 MW was observed
due to tripping of Unit 1 of LANCO. The connectivity diagram of the affected area is shown at figure 5-20.

36 DECEMBER - 2013POSOCO
Synchrophasors - Initiative in India
Figure 5-20: Schematic Diagram of LANCO S/s and its connectivity
with nearby system
Figure 5-21: Frequency Measured from Sugen and
Raipur during fault at LANCO
Analysis: From the PMU data (Figure 5-21) it was observed that the two faults had occured at LANCO sub-station:
1. At 20:20 Hrs : B Phase to Ground fault
2. At 20:23 Hrs: Y-B phase to ground fault
It can be observed from the DR of 400kV LANCO-Sipat line (LANCO end) that voltage of B phase was nearly zero
during the fault (Figure 5-23 ). Heavy voltage dip was also observed in 400 kV bus voltage obtained from Raipur PMU
which was nearest to LANCO station shown in Figure 5-22. The current plot from Raipur PMU shown at Figure 5-24
indicates that the current had increased in B-phase while the current in one healthy phase had increased i.e. in R phase
and had decreased in the other healthy phase i.e. Y phase . This is also reflected in the DR of LANCO-Sipat Line which
is shown at Figure 5-25. From DR the fault clearing time was observed to be 82 ms while from PMU it was 120 ms.
In case of second fault which is LL-G fault , DR of 400 kV LANCO-Korba line(Figure 5-26) shows that voltage of faulty
phase has decreased which is also observed from the Raipur PMU shown in Figure 5-27. While the current has
shown a very unique charactristic as observed from PMU i.e. current of one faulty phase has increased while the other
has decreased as shown at Figure 5-28. From D.R shown at figure 5.29, it can be observed that current of faulty
phases are in phase opposition by 180o i.e. IY= - I
B . The fault got cleared in 79 ms as observed fom DR while PMU it
was observed to be cleared in 80 ms.
Figure 5-22: Voltage plot from the Raipur PMU during B phase to
ground fault at LANCO
Figure 5-23: Voltage from DR of 400 kV LANCO - Sipat
line from LANCO

DECEMBER - 2013 POSOCO37
Synchrophasors - Initiative in India
Figure 5-24: Current from the PMU at Raipur for Raipur-Bhadrawati 1
Ckt during B phase to ground fault at LANCO
Figure 5-25: Current from DR of 400 kV LANCO -Sipat line
from LANCO
Figure 5-26: PMU Voltage from the Raipur end during Y-B phase to
ground fault at LANCO
Figure 5-27: Voltage from DR of 400 kV LANCO-Korba
from LANCO
Figure 5-28: Current in Raipur-Bhadrawati 1 (Raipur end) during
Y-B phase to groung fault at LANCOFigure 5-29: Current in 400 kV LANCO -Korba line from LANCO

38 DECEMBER - 2013POSOCO
Synchrophasors - Initiative in India
This case study also explained the validation of PMU data with the help of Disturbance recorder files.
5.1.2.3. Multiple tripping at 400/220 kV Mamidapalli substation
Date and Time : 03-08-2013 05:26 hrs
Data Used for Event Analysis : PMU data, D.R, E.L of all station involved in the incident
Overview: This event led to complete outage of a vital 400 kV grid station in Andhra Pradesh. There was load loss in
grid due to tripping of ICTs at Mamidapalli sub-station.
Event Description: All connected lines and ICTs tripped at 400/220 kV Mamidapalli (Hyderabad) sub-station of
APTRANSCO. The triggering incident was failure of R-phase current transformer in 400 kV Khammam line-1 Main bay
and failure of B-phase bus post insulator in Srisailam-2 Main bay at Mamidapalli substation. Blocking of Bus-bar
protection had occurred due to improper time delay setting of CT supervision relay. This had led to delayed clearance
of fault during the 2nd fault and led to complete station outage. The schematic network diagram and single line diagram
of 400 kV Mamidapalli sub-station is shown in Figure 5-30 and 5-31 respectively.
Figure 5-30: Schematic Diagram of the Area affected during multiple
tripping at Mamidapalli
Figure 5-31: SLD of 400/220kV Mamidapalli s/s
Analysis: From Figure 5-32 it can be observed that a fault had occurred in R-Phase at 5:26:58.640 hrs. This fault
got timely cleared in 120 milli seconds (approx). Now 840ms after occurrence of 1st fault in R-phase, a second
fault is observed in B-Phase and there was a delayed clearance of fault i.e., in 920 ms (approx). The R-phase fault
was sensed by distance protection relays at Mamidapalli and Khammam end and the R-Pole breaker (Main and
Tie breakers) were tripped at both ends through operation of distance protection at 5:26:58.789 hrs and this in turn
cleared the fault. The fault in R phase CT in Khammam-1 bay resulted in a 2nd fault in B-Phase bus post insulator
of 400 kV Srisailam Line-2 bay.

DECEMBER - 2013 POSOCO39
Synchrophasors - Initiative in India
Figure 5-32: 400 kV Ramagundam bus voltage during fault at
Mamidapalli S/s
Figure 5-33: Negative and Zero sequence current at 400 kV Gooty -
Neelamangla from PMU
Figure 5-34: Frequency change due to ICTs tripping at Mamidapalli resulting in Load loss
On further analysis of SOE/DR/EL it was found that there was operation of bus bar CT supervision relay which in
turn blocked the bus bar protection of 400 kV Bus-1 at Mamidapalli. Due to blocking of bus bar protection, the fault
could not be isolated and the connected lines and ICTs continued to feed the fault. The fault was sensed at remote
ends (Srisailam, Ghanapur, Khammam) by Zone-2 of distance protection and this resulted in tripping of all the
connected 400 kV lines to Mamidapalli sub-station from remote ends after zone-2 time delay i.e. 500 milli
seconds. The backup over current and earth fault protections at LV side of ICTs which have an IDMT characteristics
operated and tripped the ICTs after 1000 milli seconds after of occurrence of the 2nd fault. The fault got cleared
after tripping of all the connected elements at 400/220 kV Mamidapalli sub-station. The time delay setting of Bus
bar CT supervision relay at 400 kV Mamidapalli sub-station was reviewed and corrected. ICTs tripping resulted in
load loss leading to rise in frequency as displayed in Figure 5-34.
In this case validation of protection settings was done with synchrophasor data. The delayed clearance of fault was
due to blocking of bus-bar protection which had occurred due to incorrect setting of CT supervision relay.

40 DECEMBER - 2013POSOCO
Synchrophasors - Initiative in India
5.1.2.4. Tripping of running units at Vijayawada TPS
Date and Time : 04-10-2013 14:55 Hrs
Data Used for Event Analysis : Ramagundam PMU
Overview: Running units-2, 3, 4, 5 & 6 at Vijayawada TPS (connected at 220kV) tripped at 14:55 hrs on 4-10-2013
(Unit-1 was under shutdown).The generation loss was 900MW and change in frequency was 0.25 Hz.
Event Description:Both the 220 kV buses at Vijayawada TPS had tripped due to failure of equipment connected to 220
kV Bus-1 & 220 kV Bus-2. This in turn had led to complete tripping of all elements. The schematic network diagram
and single line diagram of 220 kV Vijaywada sub-station is shown in Figure 5-35 and 5-36 respectively.
Figure 5-35 : SCADA diagram displaying the Area affected
Figure 5-36: SLD of Vijayawada TPS

DECEMBER - 2013 POSOCO41
Synchrophasors - Initiative in India
Figure 5-37: 400 kV Ramagundam bus voltage during tripping at
Vijayawada TPS
Figure 5-38: Negative & zero sequence current of 400 kV
Ramagundam-Nagarjuna Sagar-II during tripping of Vijayawada TPS
Figure 5-39: Frequency during the tripping of Vijaywada TPS
From synchrophasor data of Ramagundam shown in Figure 5-37 and 5-38, it can be observed that two faults had
occurred, 1st in B-Phase which was immediately followed by a fault in R-Phase. Both the faults were timely cleared.
The triggering incident was failure of B phase CT in 220 kV VTPS-Narsaraopeta line at VTPS end. It was informed by
sub-station representative that CT failure had also occurred in 220 kV VTPS-Podili line at VTPS end. The 220 kV
Nasaraopeta line is connected to 220 kV bus-2 and 220 kV Podili line to 220 kV Bus-1 at VTPS. Bus-bar protection of
both the buses acted due to failure of above CTs. This in turn led to outage of complete Vijayawada thermal station.
The frequency dip due to generation loss is shown in Figure 5-39.
In this case it can be observed that how PMU data helped in multiple faults detection. Detection of first fault in B-phase
and second in R-phase helped in validating the multiple failure of equipment at Vijayawada Thermal station.

42 DECEMBER - 2013POSOCO
Synchrophasors - Initiative in India
5.1.3. Tripping due to lack of protection co-ordination/Instrument Error
In electrical grid, several times tripping may occur due to mis-operation of protection system which could be due to
incorrect or inadvertent settings in protection relay, lack of protection co-ordination/Instrument error in measuring
equipment, inherent relay characteristics & due to human error while carrying out protection testing. Few case studies
based on the above are discussed in the following section.
5.1.3.1. Multiple tripping of 400 kV lines at 400kV Ballia Station
Date and Time : 20-05-2013 18:01 Hrs
Data Used for Event Analysis : Ballia PMU, DR/EL from Ballia ,SOE from SCADA
Overview: All connected 400 kV lines at Ballia sub-station tripped on operation of overvoltage protection. The event of
multiple tripping was analyzed using the PMU data from Ballia sub-station. The results were also compared with the
station DR, EL and SCADA SOE.
Event Description:, During charging of 765kV Ballia-Lucknow line, multiple tripping of 400 kV lines occurred at 400
kV Ballia station on operation of overvoltage stage-1 and due to direct trip command received from remote end. Figure
5-40 and 5-41 shows the 765 kV and 400 kV Single line diagram of Ballia Sub-station. Table 5-2 shows the SOE for
the event and table 5-3 shows the implemented Over-voltage stage-1 protection setting at Ballia sub-station.
Figure 5-40: SLD of 765 kV Bus at Ballia Figure 5-41: SLD of 400 kV Bus at Ballia
Table 5-2: SOE from Ballia Sub-station
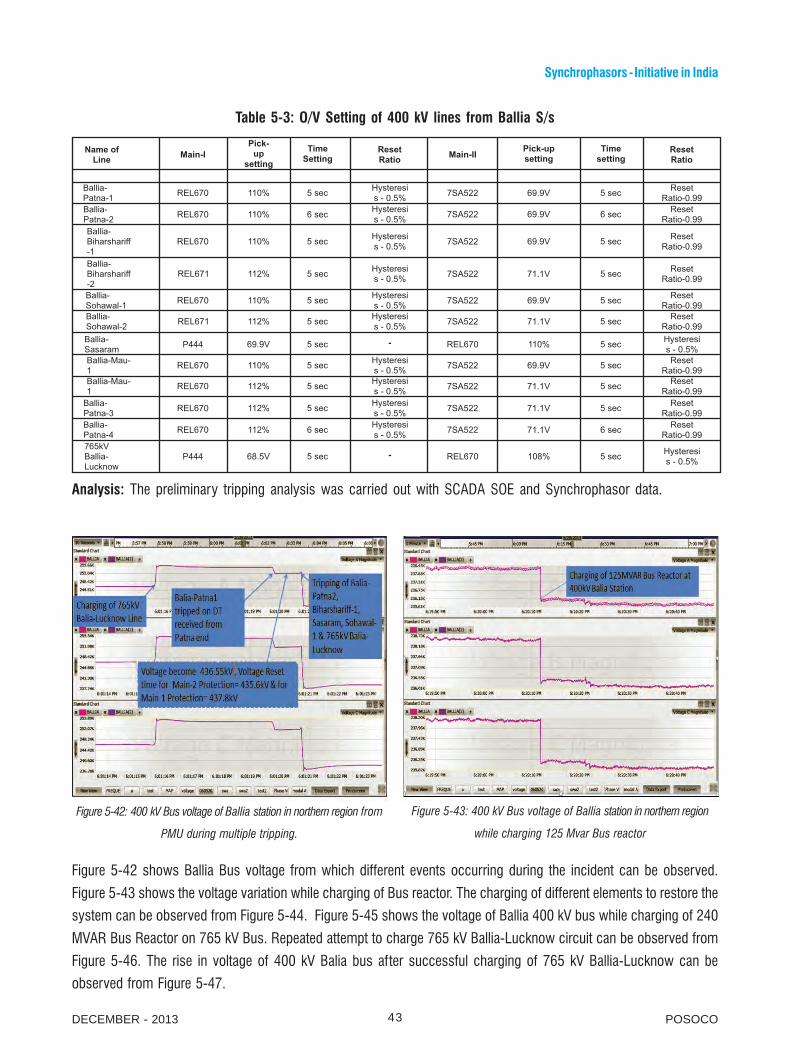
DECEMBER - 2013 POSOCO43
Synchrophasors - Initiative in India
Table 5-3: O/V Setting of 400 kV lines from Ballia S/s
Analysis: The preliminary tripping analysis was carried out with SCADA SOE and Synchrophasor data.
Figure 5-42: 400 kV Bus voltage of Ballia station in northern region from
PMU during multiple tripping.
Figure 5-43: 400 kV Bus voltage of Ballia station in northern region
while charging 125 Mvar Bus reactor
Figure 5-42 shows Ballia Bus voltage from which different events occurring during the incident can be observed.
Figure 5-43 shows the voltage variation while charging of Bus reactor. The charging of different elements to restore the
system can be observed from Figure 5-44. Figure 5-45 shows the voltage of Ballia 400 kV bus while charging of 240
MVAR Bus Reactor on 765 kV Bus. Repeated attempt to charge 765 kV Ballia-Lucknow circuit can be observed from
Figure 5-46. The rise in voltage of 400 kV Balia bus after successful charging of 765 kV Ballia-Lucknow can be
observed from Figure 5-47.

44 DECEMBER - 2013POSOCO
Synchrophasors - Initiative in India
Figure 5-44: PMU plot of phase Voltages of Ballia S/s during
restoration sequence
Figure 5-45: PMU plot of phase Voltages of Ballia S/s while charging
240 Mvar Bus reactor at 765 kV Level
Figure 5-46: PMU plot of phase Voltages of Ballia sub-station during
repetitive attempts to charge 765 kV Ballia-Lucknow line
Figure 5-47: PMU plot of phase Voltages of Ballia sub-station after
successfull charging of 765 kV Ballia-Lucknow line
This case study has given an insight into the event in the sub-station where PMU is located. The crux of this
event is how the synchrophasor data helps in monitoring of real time restoration. It can be observed that event
detection can be accelerated during grid operation. Also it helped in rapid analysis of the event which usually
takes a lot of time.
5.1.3.2. Multiple tripping of Lines from Bhadrawati and nearby Sub-station on Overvoltage.
Date and Time : 19-07-2013 16:55 Hrs
Data Used for Event Analysis : Bhadrawati, Satna, Boisar, Dehgam, Sugen PMU; SOE from SCADA
Overview: This case study is similar to previous case study as here also all the lines tripped on overvoltage
according to their O/V setting. The uniqueness lies in the fact that overvoltage appeared due to tripping of HVDC
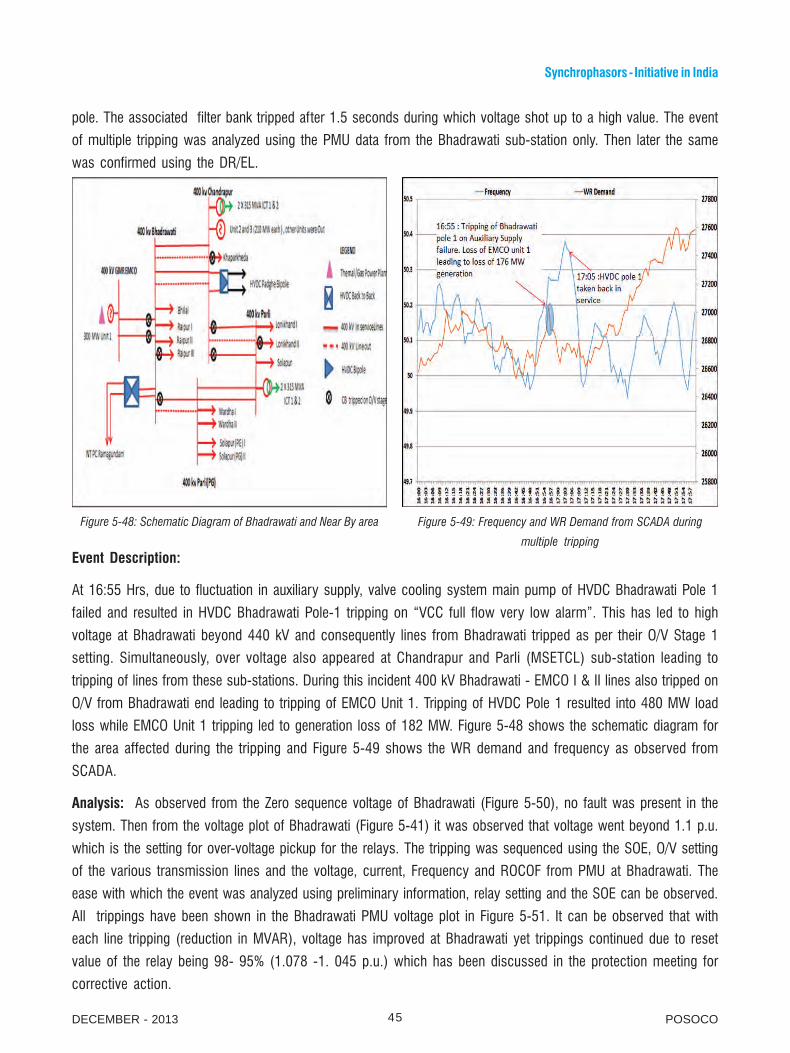
DECEMBER - 2013 POSOCO45
Synchrophasors - Initiative in India
pole. The associated filter bank tripped after 1.5 seconds during which voltage shot up to a high value. The event
of multiple tripping was analyzed using the PMU data from the Bhadrawati sub-station only. Then later the same
was confirmed using the DR/EL.
Figure 5-48: Schematic Diagram of Bhadrawati and Near By area
Event Description:
At 16:55 Hrs, due to fluctuation in auxiliary supply, valve cooling system main pump of HVDC Bhadrawati Pole 1
failed and resulted in HVDC Bhadrawati Pole-1 tripping on “VCC full flow very low alarm”. This has led to high
voltage at Bhadrawati beyond 440 kV and consequently lines from Bhadrawati tripped as per their O/V Stage 1
setting. Simultaneously, over voltage also appeared at Chandrapur and Parli (MSETCL) sub-station leading to
tripping of lines from these sub-stations. During this incident 400 kV Bhadrawati - EMCO I & II lines also tripped on
O/V from Bhadrawati end leading to tripping of EMCO Unit 1. Tripping of HVDC Pole 1 resulted into 480 MW load
loss while EMCO Unit 1 tripping led to generation loss of 182 MW. Figure 5-48 shows the schematic diagram for
the area affected during the tripping and Figure 5-49 shows the WR demand and frequency as observed from
SCADA.
Analysis: As observed from the Zero sequence voltage of Bhadrawati (Figure 5-50), no fault was present in the
system. Then from the voltage plot of Bhadrawati (Figure 5-41) it was observed that voltage went beyond 1.1 p.u.
which is the setting for over-voltage pickup for the relays. The tripping was sequenced using the SOE, O/V setting
of the various transmission lines and the voltage, current, Frequency and ROCOF from PMU at Bhadrawati. The
ease with which the event was analyzed using preliminary information, relay setting and the SOE can be observed.
All trippings have been shown in the Bhadrawati PMU voltage plot in Figure 5-51. It can be observed that with
each line tripping (reduction in MVAR), voltage has improved at Bhadrawati yet trippings continued due to reset
value of the relay being 98- 95% (1.078 -1. 045 p.u.) which has been discussed in the protection meeting for
corrective action.
Figure 5-49: Frequency and WR Demand from SCADA during
multiple tripping

46 DECEMBER - 2013POSOCO
Synchrophasors - Initiative in India
Table 5-4: Overvoltage Stage 1 Protection of various lines from Bhadrawati and Chandrapur S/s
Figure 5-50: Zero sequence Voltage plot of Bhadrawati from Bhadrawati PMU
Figure 5-51: Voltage plot of Bhadrawati from PMU along with the sequence of event during the occurrence
Circuit O/V Setting S-1 Status Tripping issue
400 kV Bhadrawati-Parli(PG) 1 1.1 p.u. 5 Sec Tripped No
400 kV Bhadrawati-Parli(PG) 2 1.1 p.u. 7 Sec Out No
400 kV Bhadrawati- EMCO I 1.1 p.u. 5 Sec Tripped No
400 kV Bhadrawati- EMCO II 1.1 p.u. 7 Sec Tripped No
400 kV Bhadrawati- Chandrapur 1 1.1 p.u. 5 Sec No tripping No
400 kV Bhadrawati- Chandrapur 2 1.1 p.u. 6 Sec Out to Control H/V No
400 kV Bhadrawati- Chandrapur 3 1.1 p.u. 7 Sec No tripping No
400 kV Bhadrawati- Chandrapur 4 1.1 p.u. 8 Sec Out to Control H/V No
400 kV Bhadrawati- Raipur 1 1.1 p.u. 6 Sec No Tripping No
400 kV Bhadrawati- Raipur 2 1.1 p.u. 7 Sec No tripping No
400 kV Bhadrawati- Raipur 3 1.1 p.u. 5 Sec Tripped Tripped 8 sec later
400 kV Bhadrawati- Bhilai 1.1 p.u. 5 Sec No tripping Not in Order
400 kV Chandrapur-Parli 1 1.1 p.u. 5 Sec Tripped No
400 kV Chandrapur-Parli 2 1.1 p.u. 6 Sec Out No
400 kV Chandrapur-Parli 3 1.1 p.u. 7 Sec Tripped No
400 kV Chandrapur-Khaparkheda 1.1 p.u. 5 Sec Tripped No
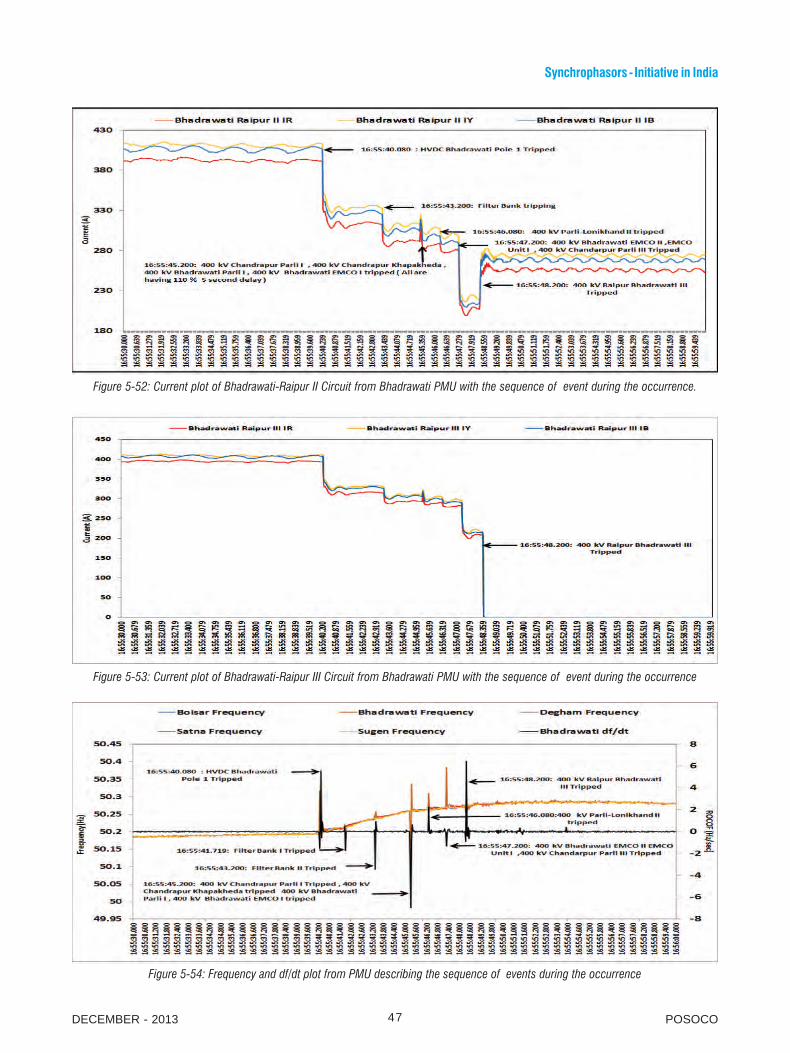
DECEMBER - 2013 POSOCO47
Synchrophasors - Initiative in India
Figure 5-52: Current plot of Bhadrawati-Raipur II Circuit from Bhadrawati PMU with the sequence of event during the occurrence.
Figure 5-53: Current plot of Bhadrawati-Raipur III Circuit from Bhadrawati PMU with the sequence of event during the occurrence
Figure 5-54: Frequency and df/dt plot from PMU describing the sequence of events during the occurrence
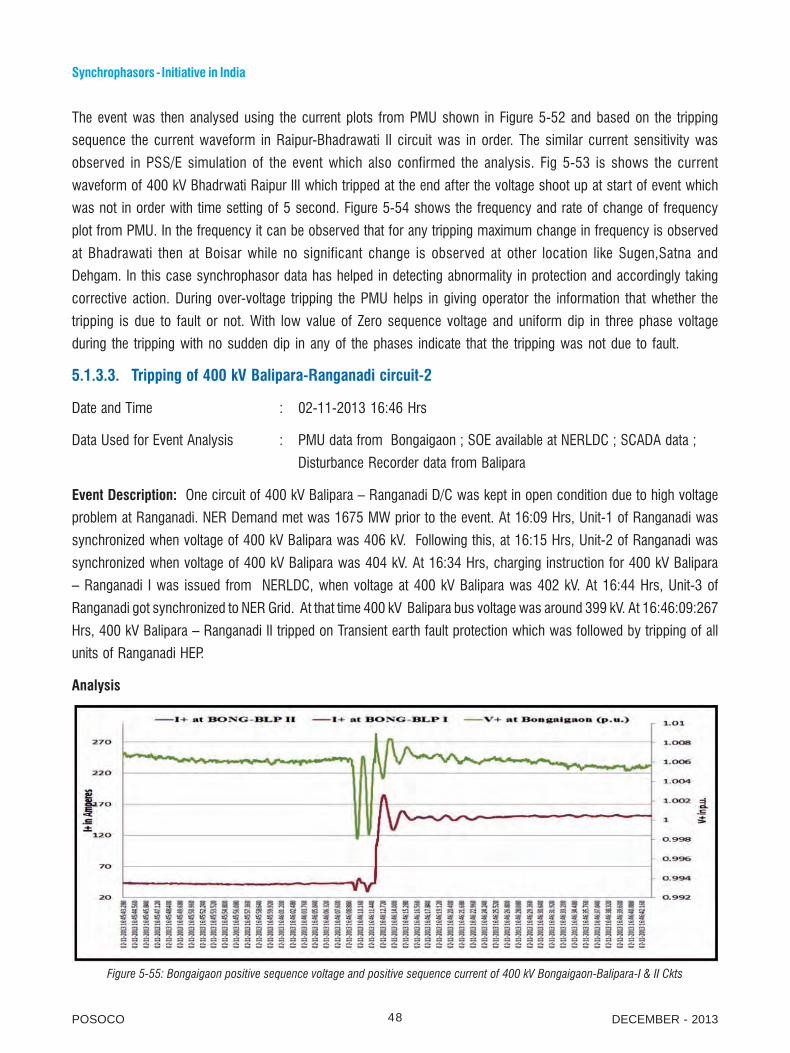
48 DECEMBER - 2013POSOCO
Synchrophasors - Initiative in India
The event was then analysed using the current plots from PMU shown in Figure 5-52 and based on the tripping
sequence the current waveform in Raipur-Bhadrawati II circuit was in order. The similar current sensitivity was
observed in PSS/E simulation of the event which also confirmed the analysis. Fig 5-53 is shows the current
waveform of 400 kV Bhadrwati Raipur III which tripped at the end after the voltage shoot up at start of event which
was not in order with time setting of 5 second. Figure 5-54 shows the frequency and rate of change of frequency
plot from PMU. In the frequency it can be observed that for any tripping maximum change in frequency is observed
at Bhadrawati then at Boisar while no significant change is observed at other location like Sugen,Satna and
Dehgam. In this case synchrophasor data has helped in detecting abnormality in protection and accordingly taking
corrective action. During over-voltage tripping the PMU helps in giving operator the information that whether the
tripping is due to fault or not. With low value of Zero sequence voltage and uniform dip in three phase voltage
during the tripping with no sudden dip in any of the phases indicate that the tripping was not due to fault.
5.1.3.3. Tripping of 400 kV Balipara-Ranganadi circuit-2
Date and Time : 02-11-2013 16:46 Hrs
Data Used for Event Analysis : PMU data from Bongaigaon ; SOE available at NERLDC ; SCADA data ;
Disturbance Recorder data from Balipara
Event Description: One circuit of 400 kV Balipara – Ranganadi D/C was kept in open condition due to high voltage
problem at Ranganadi. NER Demand met was 1675 MW prior to the event. At 16:09 Hrs, Unit-1 of Ranganadi was
synchronized when voltage of 400 kV Balipara was 406 kV. Following this, at 16:15 Hrs, Unit-2 of Ranganadi was
synchronized when voltage of 400 kV Balipara was 404 kV. At 16:34 Hrs, charging instruction for 400 kV Balipara
– Ranganadi I was issued from NERLDC, when voltage at 400 kV Balipara was 402 kV. At 16:44 Hrs, Unit-3 of
Ranganadi got synchronized to NER Grid. At that time 400 kV Balipara bus voltage was around 399 kV. At 16:46:09:267
Hrs, 400 kV Balipara – Ranganadi II tripped on Transient earth fault protection which was followed by tripping of all
units of Ranganadi HEP.
Analysis
Figure 5-55: Bongaigaon positive sequence voltage and positive sequence current of 400 kV Bongaigaon-Balipara-I & II Ckts

DECEMBER - 2013 POSOCO49
Synchrophasors - Initiative in India
From the PMU data, it can be seen that possible fault got cleared in around 2.3 seconds. The positive sequence
voltage shows that voltage dip is very low which was indicating towards a high resistive nature fault (Figure 5-55).
But the current signature did not suggest any fault in system. After further investigation it was found that there
was no physical fault in the system. It was instead a snag in CT core used as input to Main 2 relay on 400 kV
Balipara – Ranganadi II line that caused disproportionate current flow from CT secondary and pickup of residual
earth fault element of numerical distance protection relay.
This relay has IDMT characteristic and picks-up only after imbalance current exceeds 200 A. The disproportionate
current flow was sensed as similar to High-impedance earth fault and hence TEF operated. It was observed from DR
prints from relay that there was imbalance in currents (>200 A) among 3 phases of 400 kV Balipara – Ranganadi II (R
phase – 186 A, Y and B phase – 392 A). However, the secondary input as sensed in other relay was only 65 A, as it
was from a different core of the CT and so it did not operate.
It is clear that this event is very unique in nature where Main-II relay at Balipara end picked-up due to imbalance in CT
secondary input and not due to physical fault. The same was later informed to the sub-station for correction.
So it can be observed how PMU helped in determining the instrument failure and taking fast corrective action. There
have been several cases where tripping on overvoltage occurred even the voltage was within threshold. In those cases
PMU helped in finding such issues and CVTs were replaced. Also various cases of non auto reclosure action have
been corrected during single phase fault.
5.1.4. High Impedance Fault
High impedance faults (HIF) represent one of the most difficult protection problems in power system. By definition
high impedance fault does not draw enough current to cause the conventional protective device to operate as it fails to
establish a permanent return path. High impedance faults produce current levels in the 0 to 50 ampere range. In
general they involve either small change in current (Resulting impedance is high) or small change in voltage while
large change in current (impedance value is still high as voltage has not changed significantly). This section describes
various case studies involving such faults.
5.1.4.1. Multiple tripping of 400 kV lines, ICT’s and generating units in southern grid.
Date and Time : 29-03-2013 13:48 hrs
Data Used for Event Analysis : Somanhalli PMU, DR,EL
Overview: This incident led to tripping of fifteen 400 kV lines, ten Inter connecting transformers and two generating
units in southern region which started with high resistance fault. Tripping of 400 kV lines weakend the transmission
system and tripping of ICTs had led to load loss and over voltage condition in certain area of southern grid. The
affected area is shown in the Figure 5-55 schematic diagram.
Event Description: Fault had occurred in Srisailam hydro station which is a Gas insulated station. The high resistance
fault could not be detected by distance protection relays. Due to absence of backup earth fault protection at remote
ends the fault could not be cleared by line protection and this led to operation of ICT back up protection at few grid
stations. During this event few mis-operation of protections were also observed which had led to tripping of Units at
Vijayawada & Kothagudam Thermal station. The fault was cleared when 400 kV Kurnool-Srisailam line got tripped.

50 DECEMBER - 2013POSOCO
Synchrophasors - Initiative in India
Figure 5-56: Connectivity diagram of Srisailam Hydro power station and its Interconnection
Analysis: The df/dt plots, voltage plots for drop at respective buses, zero & negative sequence current data plots
were observed for determining the possible nearest location of fault. From Figure 5-57, it can be observed that
highest df/dt was recorded at 400 kV Vijaywada. It can be inferred from Figure 5-58 and 5-59 that the fault
persisted for 21 seconds.
In this event it was found that distance protection zone-2/zone-3 did not sense the gradually developing a high
resistance fault. Further the fault could not be cleared due to non-availability of directional earth fault protection
provided in 400 kV lines for sensing of any un-cleared faults beyond reach of zone-3 of distance relays. The
backup over current and earth fault protection of interconnecting transformers (ICT) at different grid sub-stations
sensed the fault and started tripping ICTs. The tripping of ICTs in turn led to Overvoltage condition in grid. This led
to tripping of 400kV lines at 400 kV Hyderabad and 400 kV Srisailam on over voltage protection. The 400 kV
Srisailam – Kurnool line tripped from both ends due to over voltage. This finally stopped the fault feed from other
buses in the grid and finally led to clearance of fault.
Figure 5-57: Rate of change of frequency observed from various PMUs during high impedance fault

DECEMBER - 2013 POSOCO51
Synchrophasors - Initiative in India
Figure 5-58: 400 kV Vijayawada bus voltage during high impedance fault
Figure 5-59: Negative and zero sequence current of 400 kV Vijayawada-VTPS-I from PMU during high impedance fault

52 DECEMBER - 2013POSOCO
Synchrophasors - Initiative in India
Table 5-5: Sequence of events during high impedance fault in SR grid
From sequence of events shown in Table 5-5, it was observed that fault got cleared after lines connected to Srisailam
opened. This increased the possibility of occurrence of fault at Srisailam bus. Srisailam Hydro station had also informed
occurrence of fault in the 400 kV Kurnool section inside the Gas Insulated Substation at srisailam.
The remedial actions taken to avoid re-occurrence of the event was enabling of directional earth fault protection for all 400 kV
lines, provision of sensitive bus bar protection at Gas Insulated Substation (GIS) to detect any slow developing and high
resistance fault in GIS bus. Incorrect relay settings and mis-operation of relay which had led to tripping of Units at two
generating stations were reviewed and rectified.
This case study shows that how PMU helps in analyzing the slowly developing high resistance fault was observed
from the voltage, negative and zero sequence current plots. The rate of change of frequency plot helped to identify the
possible nearest location of fault.
5.1.4.2. Tripping at Narora Atomic Power Station
Date and Time : 09-04-2013 13:32 hrs
Data Used for Event Analysis : Agra, Dadri, Ballia, Hissar, Merrut PMU, DR,EL
Overview: This case study is to show how synchrophasor has helped in analyzing the event which involved tripping
of nuclear power plant due to high impedance fault in the system. This has helped in sensitizing the issue that how a
small event can result into the cascaded tripping due to lack of electrical clearance.

DECEMBER - 2013 POSOCO53
Synchrophasors - Initiative in India
Event Description: All the evacuating lines from NAPS tripped resulting into poisoning out of nuclear station of
Narora. Total generation loss during the event was around 335 MW. Prior to incident 220 kV NAPS- Simbholi line
was under shut down at NAPS end and all other power evacuation lines were in service. The sequence of events
which led to tripping of NAPS Unit-1 & 2 at 13:32 hours on 9th April 2013 is shown in Table 5-6
Table 5-6: Sequence of Event during tripping of NAPS units
Analysis: It can be observed from the PMU Voltage and Current plots in Figure 5-60 and Figure 5-61 respectively
that this is a case of high impedance fault. From the patrolling of site it was found that due to lack of electrical
clearance tree branches were in contact with conductor resulting in flashover creating a high impedance fault.
The fault persisted for longer duration of time. As these faults were not sensed by the Zone 1/Zone 2 protection
from both the ends resulted in circulation of negative phase sequence (NPS) current in 6.6 KV auxiliary equipment
leading to tripping of motors and in turn outage of units. As observed when the voltage dip increased, lines tripped
as the fault was cleared when it entered in zone 1 protection. It can be observed from the SOE that one of the lines
tripped on zone 5 which is reverse protection operation after 2.5 second.
Figure 5-60: PMU Plot of phase voltages of different station during 13:24 – 13:33 Hrs on 09-04-2013

54 DECEMBER - 2013POSOCO
Synchrophasors - Initiative in India
Figure 5-61: PMU Plot of phase voltages of different station during the fault at 13:26 Hrs
5.1.4.3. Tripping Omkareshwar HPS
Date and Time : 02-09-2013 13:47 and 14:06 Hrs
Data Used for Event Analysis : Itarsi,Satna,Dehgam,Raipur,Bhadrawati,Sugen PMU, DR/EL/SOE
Overview: This case study is unique in the sense that it involves the high impedance arcing type fault, delayed fault
clearance, oscillation observed in the grid and finally tripping of all the running unit of a generating plant. Here the fault
characteristic is different from previous studied cases as voltage drop is insignificant while current was gradually
increasing.
Event Description: All the eight units at Omkareshwar HPS were running prior to the event. At 13:47 Hrs, R phase fault
appeared in the 220 kV Itarsi-Barwaha ckt. But the line did not trip immediately as the fault was of resistive nature. This
line tripped when the fault also appeared in Y phase after 1 second from Barwaha and Itarsi end in Zone 1.During this
fault, 220 kV Omkareshwar-Barwaha which sensed the fault and tripped the line in earth fault protection from OSP
end. This line remained out and Omkareshwar was left with 220 kV Omkareshwar-Chhegaon and 220 kV Omkareshwar-
Nimrani circuit for 390 MW power evacuation. Figure 5-62 shows the affected portion of the grid.
Figure 5-62: Schematic Diagram of Omkareshwar and Near By area

DECEMBER - 2013 POSOCO55
Synchrophasors - Initiative in India
After this first trial charging attempt of 220 kV Itarsi-Barwaha line from Barwaha end at 14:06 Hrs was taken and
similar phenomenon was observed again. This time 220 kV Omkareshwar-Nimrani Line (tapped at Barwaha)
tripped from Omkareshwar on earth fault trip as the fault was being observed by the Omkareshwar end relay. After
tripping of this line whole 390 MW power was being evacuated by the 220 kV Omkareshwar-Chhegaon line. At
14:07 Hrs, 220 kV Omkareshwar- Chhegaon line tripped from Cheggaon end. With this all outgoing feeder from
Omkareshwar were out leading to tripping of all eight units on over frequency.
Analysis: From Figure 5-63 it can be observed that during the fault voltage of faulty R phase of Itarsi PMU dipped
initially by 4 kV only. After 1 second duration it dipped again by 4 kV along with 6 kV dip in Y phase. The similar
characteristic was observed in the DR of 220 kV Barwaha–Itarsi from Barwaha end indicating similar characteristic
as observed in PMU voltage displaced in Figure 5-64. The current as observed from DR was high but due to small
dip in voltage the fault impedance did not enter the zone 1 of the relay. Later as the fault appeared in Y phase also,
then the line tripped on phase to phase indication in zone 1 and the same is shown at Figure 5-65. The sub-
stations were informed for revising the resistive reach of zone 1. During this only 220 kV OSP-Barwaha line tripped
from OSP after sensing the fault as transient earth fault. It can also be observed from the Figure 5-64 that the
voltage drop during fault is higher at a location which is closer to the fault and decreases as we move away from
the fault.
Figure 5-63: Phase Voltages from Itarsi PMU during the fault at 13:47 Hrs
Figure 5-64: Positive sequence voltage from various PMUs during the fault at 13:47 Hrs

56 DECEMBER - 2013POSOCO
Synchrophasors - Initiative in India
Figure 5-65: DR of 220 kV Itarsi - Barwaha from Barwaha end which shows that fault was in R phase initially
Figure 5-66: Continuation of Figure 5-65 DR indicating the phase to phase fault appeared after 1 sec. resulting in tripping of linein zone 1
Figure 5-67: Frequency observed at various nodes during the fault on 220 kV Itarsi-Barwaha at 13:47 Hrs

DECEMBER - 2013 POSOCO57
Synchrophasors - Initiative in India
Figure 5-68: Phase voltages from Itarsi PMU during the fault at 14:06 Hrs and tripping of Units on over frequency
Figure 5-69: Positive sequence voltages from various PMUs during the fault at 14:06 Hrs and tripping of Units on over frequency
Figure 5-70: DR of 220 kV Itarsi - Barwaha from Barwaha end while charging of line from Barwaha which shows
that fault started in R phase initially

58 DECEMBER - 2013POSOCO
Synchrophasors - Initiative in India
Figure 5-71: Continuation of Figure 5-70 DR indicating the phase to phase fault appeared after 1 sec. resulting in tripping of line in zone 1
Figure 5-72: Frequency observed by various PMUs during the fault on 220 kV Itarsi Barwaha at 14:06 Hrs
While trial charging this line from Barwaha end, again the similar phenomenon was observed. From Figure 5-68 it
can be observed that the voltage of Faulty R phase of Itarsi PMU dipped initially by 3 kV only. After 1 second
duration it dipped again by 3 kV along with 5 kV dip in Y phase. The similar characteristic was observed in the DR
of 220 kV Barwaha–Itarsi from Barwaha end shown in Figure 5-70. The current as observed from DR was high but
due to small dip in voltage the fault impedance did not enter the zone 1 of the relay. Later as the fault appeared in
Y phase also then the line tripped on Phase to phase indication in zone 1 displayed in Figure 5-71. At the same
time 220 kV OSP-Nimrani line which was sensing the fault tripped on Transient earth fault protection operation.
With this the Omkareshwar hydel power plant was left with only one 220 kV feeder which got overloaded and

DECEMBER - 2013 POSOCO59
Synchrophasors - Initiative in India
oscillations were observed in the WR grid. (Figure 5-72) The resistive reach in zone- 1 for this line was suggested
for revision to avoid re-occurrence of the problem.
5.1.4.4. Disturbance in Karnataka system due to Resistive nature of fault
Date and Time : 18-09-2013 15:59 Hrs
Data Used for Event Analysis : Narendra PMU, KPTCL report
Overview: This case study involves resistive fault which persisted for 5 second before getting cleared.
Event Description: Tripping of transmission lines and generation loss had occurred in Karnataka’s 220 kV system.
The triggering incident was reported to be fault in 220 kV Kemar- Varahi line-3. 220 kV Kemar-Varahi line-3, 220 kV
UPCL-Kemar line-1 & 2, 400kV Hassan-UPCL line-1 & 2, running unit-2 at Udipi power station tripped during the
incident. The generation loss at Udupi power station was 350 MW. The network connectivity of affected portion is
shown in Figure 5-73.
Figure 5-73: Connectivity Diagram of Udipi Power Station
Analysis: From PMU voltage plot in Figure 5-74, it can be observed that a high resistance fault had star ted at
15:59:50.400 hrs. After nearly 5 seconds, dip in voltages of all the phases was observed i.e. at 15:59:55.800 hrs.
Figure 5-74: 400 kV Narendra bus voltage

60 DECEMBER - 2013POSOCO
Synchrophasors - Initiative in India
There was snapping of Y-Phase jumper of 220 kV Kemar-Varahi line-3. 220 kV Kemar-Varahi line-3 tripped at
Varahi end on operation of distance protection, zone-2. It tripped in zone-2 time as there is no provision of carrier
aided protection. The line tripped at Kemar end on operation of directional earth fault relay. At UPCL 220 kV UPCL-
Kemar line-2 tripped on operation of directional earth fault relay. The Unit 2 at Udupi Power station tripped on
operation of back up earth fault protection (51N) of generator transformer. 220 kV UPCL-Kemar line-2 had sensed
the fault and had tripped on earth fault protection. 400 kV Hassan-UPCL line-2 sensed fault in zone-1 and auto
reclosed from Hassan end. This line tripped 400 ms after auto reclose due to Zone-2 operation. 400 kV Hassan-
UPCL line-1 tripped on operation of Zone-2 protection. With this the fault was isolated from the system.
Various remedial actions have been performed based on the combined analysis of PMU data, SCADA data, DR/EL and
SOE which include:
1. Running Unit-2 tripped at Udupi power station on operation of back up earth fault protection of Generator
transformer. It was observed that the relay was having definite time instead of IDMT characteristics which has
been rectified.
2. 400 kV Hassan-UPCL line-1 & 2 tripped from Hassan end on operation of distance protection Zone-1 and
Zone-2 protections respectively for a fault in 220 kV Kemar-Varahi line-3. The resistive reach of relay was
reduced to prevent over-reach.
3. Review of protection co-ordination will be done at UPCL as 220 kV lines from UPCL tripped for a fault in 220
kV Kemar-Varahi line-3
This section explains how PMU has helped in identification of High Impedance fault analysis in the system. It also
helped in finding the duration of the faults which persist for larger duration. Earlier such analysis used to take a
significant amount of time and it was difficult to deduce the exact SOE. With PMU such analysis becomes very fast
facilitating corrective actions to be taken in minimum possible time.
5.1.5. Detection of faults cleared by back up protections
5.1.5.1. Tripping of all three 315 MVA ICTs at Biharsharif Substation
Date and Time : 25-06-2013 at 12:13 hrs
Data Used for Event Analysis : Farakka PMU
Overview:
This case study presents the tripping analysis of all three 315MVA ICTs at Bihar sharif S/S.
Event description: At 12:13 hrs, 220 kV Fatuah-Patna (PG) ckt tripped on Y phase to ground fault at a distance of
9.6 km from Patna (PG) end. Also, all the three 315 MVA, 400/220 kV ICTs at Bihar Sharif (PG) tripped on operation
of back up HV side Over Current protection. Around 240 MW of load loss occurred in areas adjoining Biharsharif
due to outage of all 220 kV & 132 kV lines from Bihar Sharif sub-station. The schematic diagram of Biharsharif sub-
station is shown in Figure 5-75.

DECEMBER - 2013 POSOCO61
Synchrophasors - Initiative in India
Figure 5-75: SLD of 400/220 kV Biharsharif S/s
Analysis: The sequence of events was initiated due to Y phase to ground fault (as reported) in 220 kV Patna-
Fatuha S/C (Zone-II from Fatuah; 9.6 km from Patna). However, the single phase to ground fault can be corroborated
only from sequence plots. From the PMU plot of 3-phase Farakka voltages (Figure 5-76) it can be observed that
the highest initial voltage dip was observed in Y-phase indicating the presence of Y phase fault.
Figure 5-76: 400 kV Farakka Bus voltage
The fault was isolated properly at Patna (PG) end, but there was a delayed clearance/non-clearance at Fatuah
end. It is also evident that the fault was not cleared from Biharsharif (BSEB) end. Consequently, HV side over-
current protection got triggered for all the three 400/220 kV ICTs at Biharsharif (PG) end which isolated the fault.
The fault persistence time of 700 to 750 ms was observed in DR of Biharsharif ICT II shown in Figure 5-77 which
tripped at the end. It can inferred that Biharsharif (BSEB) end of 220kV Biharsharif-Fatuha D/C did not clear the
fault from Biharsharif(BSEB) end which is possibly due to the fact that fault was in Zone-III from Biharsharif(BSEB)

62 DECEMBER - 2013POSOCO
Synchrophasors - Initiative in India
end while the ICTs isolated the fault in about 700ms to 750 ms. However, Distance protection relays at Biharsharif
(BSEB) end may have picked up(Zone-III timer started) which needs to be confirmed.From PMU plots of voltage
and current shown in Figure 5-76 and Figure 5-78, fault clearance time appears to be of the order of 680 ms to 760
ms. Persistence of the fault for such a high duration confirms delayed operation/non-operation of Distance protection
at Fatuah (BSEB) end along with non-clearance of the fault from Biharsharif end.
Figure 5-77: DR of HV side of 315 MVA ICT-II at Biharsharif overcurrent relay
Figure 5-78: Line Current of 400 kV Farakka-Durgapur-I from Farakka PMU

DECEMBER - 2013 POSOCO63
Synchrophasors - Initiative in India
From the DR outputs as shown in Figure 5-77, it was observed that ICT-II took the longest time to trip i.e. around
700 ms. Hence, considering a further delay of 2 cycles associated with complete isolation(opening of main & tie
bays), from the DR outputs it can be concluded that the fault was cleared in about 750 ms. Hence the fault
clearance from DR plots corroborates that obtained from PMU plots.Frequency plot as shown in figure 5-79 starts
increasing after the tripping which indicates that load was lost due to ICT tripping.
Figure 5-79: Frequency observed from Farakka PMU during ICT tripping at Bihar Sharif
On the basis of case studies discussed and experience gained over the fault analysis and detection, the section
can be summarized in various aspects of case studies like location of fault, type of fault, clearing time and
characterization.
Fault location: Any fault occurring in the system will have its effect at all the locations and the effect will decrease with
distance from the location of the fault. Bus frequencies will be different at different location following a disturbance
however this will happen only during the first stage of dynamics lasting only a few seconds or milliseconds and after
that the frequency will be uniform in the system. Furthermore, the differences between individual bus frequencies will
not be a function of local power imbalance but they will be a function of the electrical distance from the disturbance.
During transient state the frequency of the bus which is nearest to the fault will have more variation compared to other
locations. Similarly the rate of change of frequency (ROCOF) will also be following the same trend. The Frequency
deviation and ROCOF near to fault will be quite high during the initial stages while low for other locations. [B46]
Classification of Fault: Based on the observation from various case studies in this section, characteristic for
various type of faults have been identified based on user experience. This will help in the event detection formulation
and will speed up the event analysis.
A. Single Phase to Ground Fault (L-G fault):
1. Maximum Voltage dip in faulty Phase can be observed in the nearby PMU data.
2. Increase in current of faulty phase is observed in the nearby PMU. (Observed in most of the
cases)
3. Zero sequence voltage will be high during the fault.

64 DECEMBER - 2013POSOCO
Synchrophasors - Initiative in India
4. In one of the healthy phases,current increases while in other it decreases as observed from
nearest PMU. (Observed in most of the cases)
B. Phase to Phase Fault (L-L fault)
1. Maximum Voltage dips are observed in faulty phases in PMU data.
2. Currents in the faulty phases will be almost equal and opposite to each other. (Based on user
experience, may vary)
3. The current in the healthy phase will be almost zero.
4. Zero sequence voltage and current will not be significant.
C. Double Phase to Ground Fault (L-L-G fault)
1. Maximum Voltage dips are observed in faulty phases in PMU data.
2. Zero sequence voltage and current will be significant in such fault.
D. Three phase fault (Symmetrical fault)
1. All the three phase voltages will have dip which is near to zero.
2. The fault current will be very high in all the three phases.
E. Resistive Nature of Fault
1. Phase voltages and positive sequence voltage will have small dip as observed in PMU data will
be low( 3-6 kV)
2. The zero sequence and negative sequence current will also be low. They will gradually rise to
higher values till the fault is cleared.
3. In some cases, even the current was high but voltage dip may be very low which depends on the type
of path and its varying nature with arcing.
Fault Recovery Time: PMU data helps in knowing about the total fault recovery time. The minimum value during fault
indicates the time after which fault start recovering due to tripping of source feeding the fault.It helps user in knowing
about how much time the fault was present in the system.
The limitation in determining the actual fault clearing time using the synchrophasor measurement can be explained in
terms of the philosophy adopted by PSS/E [B47] in respect of Dynamic Voltage violations for a typical fault which is
reproduced below:
“The voltage recovery may have primary voltage criteria (i.e., voltage to recover above threshold V1 faster than t
1
seconds after fault clearing) and secondary voltage criteria (i.e., voltage to recover above threshold V2 faster than t
2
seconds after fault clearing). The voltage dip check will be based on voltage threshold V3 and time t
3 (seconds). Once
voltage has recovered above threshold V3, it should not dip below that value for longer than t
3.”
So, Let us consider
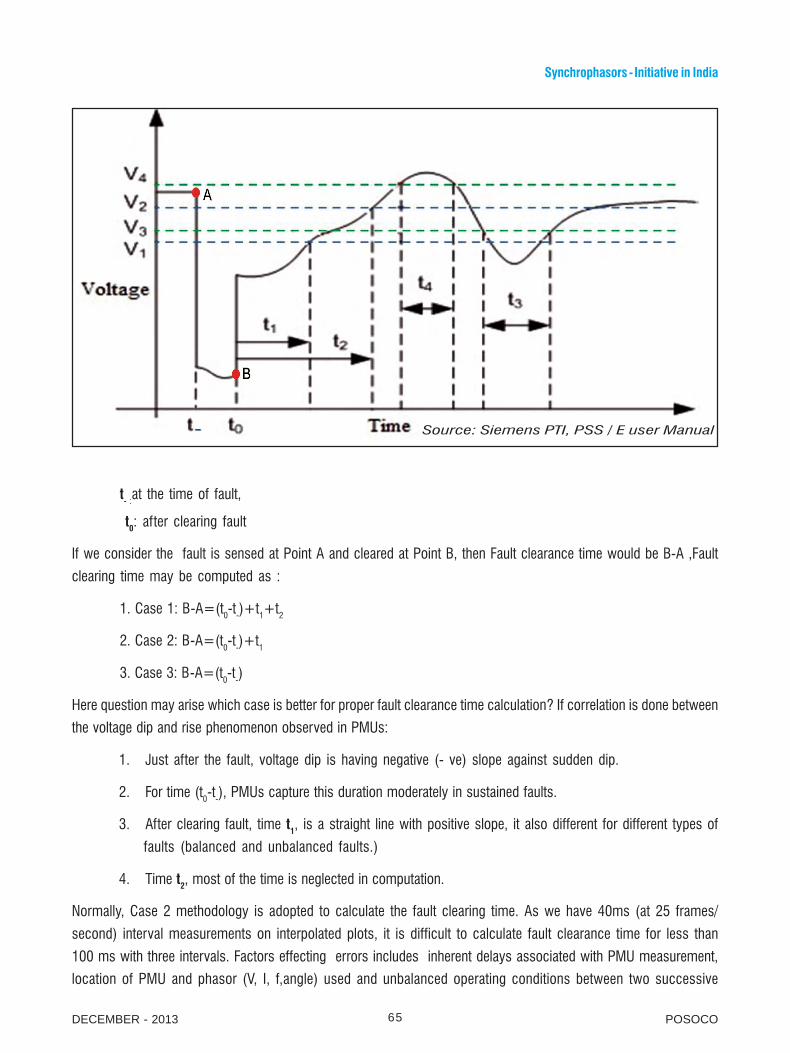
DECEMBER - 2013 POSOCO65
Synchrophasors - Initiative in India
t- :
at the time of fault,
t0: after clearing fault
If we consider the fault is sensed at Point A and cleared at Point B, then Fault clearance time would be B-A ,Fault
clearing time may be computed as :
1. Case 1: B-A=(t0-t
-)+t
1+t
2
2. Case 2: B-A=(t0-t
-)+t
1
3. Case 3: B-A=(t0-t
-)
Here question may arise which case is better for proper fault clearance time calculation? If correlation is done between
the voltage dip and rise phenomenon observed in PMUs:
1. Just after the fault, voltage dip is having negative (- ve) slope against sudden dip.
2. For time (t0-t
-), PMUs capture this duration moderately in sustained faults.
3. After clearing fault, time t1, is a straight line with positive slope, it also different for different types of
faults (balanced and unbalanced faults.)
4. Time t2, most of the time is neglected in computation.
Normally, Case 2 methodology is adopted to calculate the fault clearing time. As we have 40ms (at 25 frames/
second) interval measurements on interpolated plots, it is difficult to calculate fault clearance time for less than
100 ms with three intervals. Factors effecting errors includes inherent delays associated with PMU measurement,
location of PMU and phasor (V, I, f,angle) used and unbalanced operating conditions between two successive
Source: Siemens PTI, PSS / E user Manual

66 DECEMBER - 2013POSOCO
Synchrophasors - Initiative in India
measurements, however, it would be appropriate to consider computed time moderately for faults cleared say for
more than 150-200 ms or more.
So there is need to maintain number of case studies where PMU data and DR data has been used for fault clearing
time measurement, till that time, PMU based fault clearance time calculation can be used only for interpretation
of whether fault is sustained or cleared immediately; of course other A/R operation can be validated. Table 5-7
shows the fault clearance time using the DR and PMU data.
Table 5-7: Summary of PMU Typical Delays and typical ranges [B42]
In such direction, an attempt is made to baseline fault clearance time using the DR and PMU data, details are
given in Table 5-8.
Table 5-8: Fault clearance time based on DR and PMU
As observed from the Table 5.8 that fault clearing time observed from DR and PMU shows that , for a 100 ms fault
clearance time the PMU shows the recovery in voltage/current after either 80 ms or 120 ms . This is completely valid
till the fault is on transmission line , as the source feeding to fault will be both ends of the line.
While in case of a fault which involves multiple elements (like bus fault) voltage recovery starts even with the first
element tripping which is feeding the fault. So in such cases fault recovery time should be used after which last
recovery of voltage has occurred.
Sl.No Cause of Delay Typical Range of Delay
1 Sampling window (delay ½ of window) 17 ms to100 ms
2 Measurement filtering 8 ms to 100 ms
3 PMU processing 0.005 ms to 30 ms
4 PDC processing & alignment 2 ms to 2+ s
5 Serializing output 0.05 ms to 20 ms
6 Communication system I/O 0.05 ms to 30 ms
7 Communication distance 3.4 μs/km to 6 μs/km
8 Communication system buffering and error correction 0.05 ms to 8 s
9 Application input 0.05 ms to 5 ms
Fault clearing Time taken for Maximum Time taken for full
Event Time from DR voltage dip after which recovery of voltage
(millisecond) voltage starts recovering from PMU Data (ms)
from PMU Data (ms)
Case study 5.1.2.2 (L-G) 82 120 160
Case study 5.1.2.2 (LL-G) 79 80 120
Case study 5.1.1.1 (L-G) 75 80 120
Case study 5.1.1.1 (A/R) 84 80 120
Case study 5.1.1.3 (LLL) 167 80 240
Case study 5.1.1.2 (LL) 147 40 200

DECEMBER - 2013 POSOCO67
Synchrophasors - Initiative in India
So to know the operational time of protection: During line tripping if both ends relay operated in 100 ms then PMU
should show us 80 ms-120 ms (for sampling rate of 25 sample/sec). While beyond this we need to check for the
relay operation. In case of fault with multiple source feed, the last recovery point in voltage/current could be taken
as recovery time while the first recovery assures that protection action has initiated.
During the last 8 months i.e. (April’13-Nov’13) the total GD (as per CEA grid standard 2010) analyzed in different
region with the help of synchrophasor data are listed in table 5-9.
Table 5-9: Cases analyzed using Synchrophasor (April’13 – Nov’13)
It can be observed that how extensively the PMUs were used in analyzing various events in the electrical grid and
how WAMS helped in resolving various issues observed in the system in an accelerated manner.
5.2. Low Frequency Oscillation
Power system is a typical case of a large nonlinear system with lots of oscillation modes. These include electro-
mechanical oscillations, Control modes and Sub Synchronous Resonance (SSR) etc.In this paper only the electro-
mechanical oscillations have been considered. The root cause of electrical power oscillations is the unbalance
between power demand and available power at a particular operating point. The change in the electromechanical
torque of a synchronous machine following a perturbation can be split into two components as shown in eq. (1).
The component Ks .Δδ is called the synchronizing torque T
s and determines the torque change in phase with rotor
angle perturbation Δδ. The component Kd.Δω is called damping torque T
d and determines the torque change in
phase with speed variation. Ks and K
d are called synchronizing torque coefficient and damping torque coefficient
respectively. Rotor angle stability depends on both components of torque. Lack of synchronizing torque causes
non-oscillatory instability or monotonic instability in the system and lack of damping torque result in oscillatory
instability in the system.
Rotor angle stability is of two types which are small signal stability (small disturbance in the power system) and
transient stability (large disturbance in the power system). Small signal stability is the ability of power system to
be in steady state after a small disturbance. The instability due to this is mainly attributed to insufficient damping
torque. While transient stability is associated with the ability of power system to maintain synchronism when
subjected to large disturbances like line fault, bus fault, generator outage etc. The instability arising due to this is
result of insufficient synchronizing torque.
Small signal instability is due to insufficient damping torque leading to low frequency electromechanical oscillations
in system which is oscillatory in nature. If there are N generators in a system, then total number of such LFO
modes would be N-1. During Low Frequency oscillations, mechanical kinetic energy is exchanged between
synchronous generators of the inter-connected system through tie lines. Most of these oscillatory modes in
normal power system state are well damped. However, they get excited during any small disturbance in the
ΔTe = K
s .Δδ + K
d.Δω = T
s + T
d ..................................... (1)
NR NER WR SR ER
75 24 36 15 88

68 DECEMBER - 2013POSOCO
Synchrophasors - Initiative in India
system and lead to oscillation in power system parameters like rotor velocity, rotor angle, voltage, currents power
flow etc. Due to oscillation in parameters, protection equipment may undesirably operate leading to cascade
tripping in power system. Therefore, it is necessary to detect such modes and initiate corrective actions to ensure
system reliability and security. Among these parameters the rotor velocity of the generators and the power flow in
the network are most important. The rotor velocity variation causes fatigue to the mechanical parts of turbine-
generator system. The power flow oscillations may amount to the entire rating of a power line, when they are
superimposed on the stationary line flow and would limit the transfer capability by requiring increased safety
margins.
The low frequency oscillation classification is in general dependent on the power system for which it has to be
used based on Eigenvalue analysis based on the system model. This helps in monitoring the variables which will
be participating globally or alone. The participation factor of each variable in one of the oscillatory modes helps in
deciding the classification of modes. In general low frequency oscillation can be basically of four different types
as given below:
1. Inter-Area Mode (0.1 Hz-0.7 Hz): Inter-area modes are associated with swinging of a group of generators
in one part of the system with group of generators in other parts due to weak interconnecting lines
between two power systems. There are also referred as global mode.
2. Local mode (0.7 Hz -2.5 Hz): It is either due to oscillation of one generator against the remaining of the
system (very similar to the one-machine infinite-bus system) or oscillation of one generator against
another, both located close to each other (two generators in the same power plant).
3. Control Mode: These are in system due to poor design of controllers of AVR, HVDC, SVC, AGC etc. These
are also referred as regulating mode.
4. Torsional Mode (10 Hz-40 Hz): These modes are associated with the turbine-generator shaft system and
associated rotational components.
The ranges define may overlap on other depending of power system but in general this is accepted in power
system fraternity.
5.2.1. Detection of Low Frequency Oscillations using Synchrophasor Measurements
With the current SCADA system, power system operators are not able to identify LFOs in the system due to inherent
slow updating rates i.e. once in every 4 -15 Seconds (analog values). The oscillation at generator level i.e. intra-plant
or local mode was assumed as it appeared as hunting in the generators while the inter-area modes were not visible to
system operators by any means apart from simulation studies. The SCADA data reporting rate is comparatively slow
which are not useful in detecting the oscillation or the changes going in the system in sub-seconds.
With advent in the technology, faster data processing and time synchronized phasor measurements availability at
a reporting rate of 25-50 frames/second from Phasor measurement unit (PMU), now operator is able to visualize
such oscillations in the system. Tools and techniques are also in development to detect the source of such
oscillation and to analyze them in real time and take corrective action before they create fur ther complexities in
the system. The detection of LFOs and their history is of great help in planning and implementation of damping

DECEMBER - 2013 POSOCO69
Synchrophasors - Initiative in India
controllers of HVDC, TCSC etc. At present PMUs have enabled the operator to visualize such LFOs whose source
can be tracked with placement of optimum number of PMUs giving complete observability of system.
In this section various case study on low frequency oscillations is being discussed in detail. Along with that a
statistical table is included at the end of the section which summarizes these oscillations and their characteristic.
5.2.2. Analysis of Low frequency oscillation
Low frequency oscillation detection as a stability aspect comes under the Small signal stability. Basically there are two
methods to analyze such stability which are linear analysis of system using eigenvalue approach on system model
and measurement based analysis. There are various software available for small signal stability on power system
model. Analysis based on Eigenvalue Analysis technique is carried out through linearization of the nonlinear differential
equations that represent the power system around an operating point. This approach is very comprehensive and is
based on complete modeling of the Power System elements and gives all the modes in the system.
While the measurement based techniques (Response based) is based on spectral analysis of measured data from the
field directly gives the low frequency oscillation modes existing in the system. This is fur ther classified as frequency
domain and time domain analysis on the measured data. The frequency domain techniques have an advantage of
indicating the margin of stability and details of damping and its measure. The frequency domain techniques are based
on eigenvalues of the system for determination of the margin of stability. The time domain techniques determine
whether the system is stable or unstable, but not the degree of stability. Therefore, for power system planners and
system operators dealing with pre-dispatch issues (before real time operation), knowledge of the degree of stability,
possible low frequency modes and the extent of damping of each of these modes is required so that the operators can
prepare operational and contingency plans. There are several methods out of which Fast Fourier Transform, Matrix
Pencil method, Wavelet Transform method, Henkel’s Total Least Square (HTLS), ERA method are prominent [B
17].
In linear analysis methods, mode shape is very important as it gives the relative activity of state variables in each
mode. They are obtained from the right eigenvectors and the larger the magnitude of the element, more is the
observabilty of state variable. The generator having the largest magnitude of mode shape has the largest activity in the
mode of interest. The mode shape indicates which generators are active and how they swing against each other.
Moreover, mode shapes also helpto determine the optimum location for installing power oscillation dampers(PODs).
It is expected that by installing a PSS at the generator having the largest magnitude in the modeshape (at the mode of
interest), a more signicant damping than installingat the other generators can be established.
5.2.3. Inter-Area Oscillation Observed in the Grid
5.2.3.1. 0.5 Hz Oscillation in the NEW Grid due to Tripping at Buddhipadar, Sterlite and IBTPS
Date and Time : 13-04-13 22:02 Hrs
Data Used for Event Analysis : Raipur and Sugen PMU, DR and EL of the Sterlite, Korba (E) and
Buddhipadar S/s
Overview: Low frequency oscillation with mode frequency of 0.5 Hz (0.45 Hz-0.55 Hz) was observed during the
disturbance at Buddhipadar, Sterlite and IBTPS. .

70 DECEMBER - 2013POSOCO
Synchrophasors - Initiative in India
Event Description: Weather was stormy with heavy rain in Chhattisgarh & Orissa states in the N-E-W grid. Figure
5-80 shows the system that was affected during this incident. In the beginning 220 kV Buddhipadar-Tarkera line 1
tripped on fault followed by tripping of 220 kV Buddhipadar-Tarkera line 2 on over current protection. This led to the
par t of Orissa system comprising generation of IBTPS power station (2*230 MW), 600 MW unit of Sterlite,
Vedanta CPP (9*135 MW) and Bhusan steel CPP (2*120 MW) getting connected to Western grid. After this at
22:01:49 Hrs 220 kV Raigarh –Buddhipadar circuit tripped. This has resulted in overloading of 220 kV Korba(E) –
Buddhipadar 2 & 3 circuits. At 22:02:38 Hrs oscillation started in the system which was observed at various
locations in the NEW grid. This may be due to the connection of an islanded part of system (Generation Rich
Island) with the rest of the system through only two lines i.e. 220 kV Buddhipadar-Korba (E) 2 & 3. At 22:04:39 Hrs
220 kV Korba (E)-Buddhipadar 2 & 3 tripped resulting in complete islanding of Buddhipadar, IBTPS and Sterlite Area
which further collapsed. The event is shown with the help of PMU data from Raipur in Figure 5-81.
Figure 5-80: Schematic diagram of the affected portion.(Islanded portion is shown with dotted lines)
Figure 5-81: Frequency and ROCOF observed during the Incidence from Raipur PMU. The circle marked
in plot indicate the oscillations in the grid

DECEMBER - 2013 POSOCO71
Synchrophasors - Initiative in India
Analysis: Severe oscillations were observed in all the parameters from the PMU at Raipur, Sugen, Bassi, Agra and
Karcham for 60 seconds. Frequency plot of all the five locations as described above is shown in Figure 5-82. These
oscillations were analyzed using various nonlinear techniques to find the various modes of oscillation. It was found
that 0.51 Hz mode was dominant present in system at all the location as shown by Figure 5-83. The mode shape can
be described as the Machines near Sugen oscillated in 90o phase shift with Machines near Raipur. While NR
machines near Agra, Bassi oscillated with an angle 42o while Karcham wangtoo at 20o w.r.t Raipur.
Figure 5-82: Oscillation in Frequency from various PMUs
in the NEW Grid
Figure 5-83: Mode Shape of 0.53 Hz
Table 5-10: Low frequency oscillation observed during tripping at Budhipadar, sterlite and IBTPS
Cause: Prior to oscillation WR-ER inter-regional lines have tripped and generators-load (later formed island and
collapsed) at the boundary of WR-ER got disconnected from ER and were connected to WR only through only two
220 kV Lines (Korba (E) - Buddhipadar 2 & 3). The overloading of these lines and their inability to transfer MVAR
may have resulted in limit hitting of AVR of the generators in the weakly connected system resulting in Inter-area
oscillation.
5.2.3.2. 0.5 Hz Oscillation in the NEW Grid due to DSTPS (DVC) Unit forced outage.
Date and Time : 23-09-13 14:34 Hrs
Data Used for Event Analysis : PMU at Farakka, Talcher ,Sugen, APL Mundra, Karcham Wangtoo, Dadri
Overview: Low frequency oscillation with mode frequency of 0.49 Hz (0.45-0.55 Hz) was observed in the NEW
grid during the forced outage of DSTPS Unit 2.
Event Description: On 23.09.13, at 14:34 hrs, while taking DSTPS Unit-I (500 MW) out of service due to low
demand, low frequency oscillations were observed in PMUs of NEW Grid. The Unit was generating approx. 310
MW at the time of incident.
Method Frequency Damping Ratio (%) Energy
Matrix Pencil 0.5137 0.5394 0.2640
ERA 0.5137 0.5451 0.2684
HTLS 0.5138 0.5346 0.2653

72 DECEMBER - 2013POSOCO
Synchrophasors - Initiative in India
Analysis: The PMU plot of frequency in Figure 5-84 shows that oscillation persisted for 110 seconds. Since
oscillations persisted for more than a minute, so these were also captured in the SCADA Data from DSTPS as
shown in Figure 5-85. Initially it was found that oscillation is of 0.49 Hz which is Inter-Area in nature from the OMS
engine. So the data from various NEW Grid PMUs were analyzed. Figure 5-86 shows the oscillation observed from
different region’s PMUs. While Figure 5-87 shows that the mode shape of 0.49 Hz which was dominant during the
oscillation with a damping of less than 3 % (Table 5-11).
Figure 5-84: Voltage and Frequency plot of Farakka PMU along with the OMS result
Figure 5-85: Oscillation as observed from the SCADA data in Voltage of DVC

DECEMBER - 2013 POSOCO73
Synchrophasors - Initiative in India
Figure 5-86: Frequency from PMU from Western, Northern and
Eastern region of Indian Grid
Figure 5-87: Mode shape of 0.49 Hz Frequency from the analysis of
various PMU
Table 5-11 : Mode observed during the oscillation
5.2.3.3. 0.2 Hz Oscillation in the SR Grid while taking Simhadri Unit 2 in service
Date and Time : 22-10-13 19:29 Hrs
Data Used for Event Analysis : Gajuwaka, Vijaywada
Overview: Low frequency oscillation is also observed in the SR grid. This case presents a situation when LFO
appeared while synchronizing a generating unit in the grid.
Event Description: On 22.10.13, at 19:29 hrs, while taking Simhadri Unit-2 (500 MW) in service, low frequency
oscillations were observed in PMUs of SR Grid.
Analysis: The PMU plot of frequency in figure 5-88 shows that oscillations were observed in voltage, real and
reactive power from Gajuwaka PMU. Along with that it was also observed in Vijayawada PMU.
Figure 5-88: Voltage, Real power and Reactive power observed from Gajuwaka PMU
Frequency Damping Ratio (%) Energy
0.4925 0.6431 0.4105

74 DECEMBER - 2013POSOCO
Synchrophasors - Initiative in India
The voltage signal was analysed using multiple signal Prony analysis with singular value decomposition so as to
remove the errors due to singularity. Thus it helps in identifying the major mode and removing the modes with low
contribution near to major modes. In the analysis it was found that major mode is 0.2 Hz which is an inter-area mode.
5.2.4. Inter-Plant Oscillation Observed in the Grid
5.2.4.1. Inter-Plant oscillation at Omkareshwar Hydel Power station
Date and Time : 02-09-2013 14:06 Hrs
Data Used for Event Analysis : Itarsi, Satna, APL Mundra, Bhadrawati PMU
Overview: Low frequency oscillation with mode frequency of 1.02-1.03 Hz was observed in the WR grid when 350
MW Omkareshwar Hydel power station evacuating through by only one 220 kV circuit during contingency.
Event Description: This case is the continuation of the Omkareshwar case study discussed in Fault Analysis
section. When the Omkareshwar (OSP) hydel power evacuations was through a single feeder i.e. 220 kV OSP-
Chhegaon, this line got overloaded due to 350 MW power transfer. With this oscillations were observed in WR grid
for duration of 15 second and got damped out.
Figure 5-89: Oscillation observed in frequency at different location in WR Figure 5-90 : 03 Hz Mode shape of the oscillation observed
Table 5-12: Mode observed during the oscillation
Method Frequency Damping Ratio (%) Energy
Prony 1.0301 1.8611 0.09655
Matrix Pencil 1.0255 1.6494 0.0969
HTLS 1.0266 1.5044 0.0743

DECEMBER - 2013 POSOCO75
Synchrophasors - Initiative in India
Analysis:
It can be observed that Low frequency oscillation of 1.02- 1.03 Hz was observed at various locations in WR grid
during the event. From mode shape it can be inferred that this mode is localized near Itarsi only. The damping of
the oscillation is less than 3 % which is of concern. The tuning of PSS at Omkareshwar HPS may be required and
NHDC has been requested to kindly look into the matter.
5.2.5. Inter and Intra-Plant Oscillation Observed in the Grid
5.2.5.1. Oscillation at Dadri Thermal Power station
Date and Time : 01-01-2013 18:37 Hrs
Data Used for Event Analysis : NEW Grid PMUs
Overview: Low Frequency oscillation has been observed in Indian system on several occasions. This case study
present low frequency oscillation observed at only one location. No oscillation was observed in rest of the system
as observed in the PMU installed across the different region of NEW grid. This indicated that this is a case of local
mode of oscillation.
Event Description: Low frequency oscillations were observed in Dadri frequency at 18:37:30 hrs to 18:37:49 hrs
on 1st January 2013. Persistence oscillations were observed for more than 18 seconds.
Analysis: Figure 5-91 shows the frequency plot and it can be seen that low frequency oscillations were observed
only at Dadri PMU. The mode that was observed is 1.67 Hz which is in the range of Intra-plant oscillation which
was present only in Dadri Frequency signal. Figure 5-92 shows the zoomed view of the oscillation which is of
growing nature. Figure 5-93 shows the voltage variation at Dadri during the event.
During this case all over India data was collected for oscillation and once again it was found that it was localized
only to Dadri as no oscillations were reported from any other generators. During investigation, it was learnt that
there was an event of malfunctioning of EHC governor of 490 MW Unit-5 at Dadri TPS stage-2. It was further
clarified that low frequency oscillation was on account of testing of the valve control system on 490MW Unit-5 at
Dadri TPS and same unit was hunting from 350 MW to 470MW. The oscillation frequency was 1.66 Hz.
Figure 5-91: Low Frequency oscillations in Dadri Frequency

76 DECEMBER - 2013POSOCO
Synchrophasors - Initiative in India
Figure 5-92: Zoomed view of Frequency Plots
Figure 5-93: PMU plot of Dadri phase voltages
5.2.5.2. Blackout at Paricha Thermal Power Station
Date and Time : 11-04-2013 01:45 Hrs
Data Used for Event Analysis : Bassi, Kanpur, Hisar, Balia, Agra, Meerut, Karcham PMU
Overview: This case study presents how bottleneck in transmission and overloading in transmission line results
in oscillation at generating plant and further their tripping.
Event Description: Paricha Stage-I, II & III (2× 110 + 2× 210 + 2×250 = 1140 MW) has been commissioned
and evacuated through existing network of Stage-I & II. At the time of event Paricha thermal power station was
being evacuating through five 220 kV circuits i.e. 220 kV Paricha-Orai T/C, 220 kV Paricha-Bharthana S/C and 220
kV Paricha-Banda S/C as shown in Figure 5-89. 220 kV Orai-Kanpur circuit was out which resulted in transmission
bottleneck as now four 220 kV circuits (220 kV Paricha-Orai T/C and 220 kV Paricha-Bharthana) were connected
to Mainpuri. Now in this scenario, any tripping at 220 kV Mainpuri will affect all these four circuits. At 01:45 hrs,

DECEMBER - 2013 POSOCO77
Synchrophasors - Initiative in India
B-phase CT at Manipuri (UP) of 220 kV Mainpuri-Harduaganj line bursted and during this 220 kV Orai-Mainpuri line
also tripped. With this the 220 kV Paricha-Orai T/C of no use and it resulted in power evacuation of Stage II and
Stage III (810 MW Generation) through two circuits i.e. 220 kV Paricha-Bharthna-Safai-Mainpuri and 220 kV
Paricha-Banda ckt. Oscillations were observed in system and Units tripped resulting in blackout of Paricha.
Figure 5-94: Grid connectivity diagram of Paricha thermal power plant
Analysis :
Figure 5-95: Frequency and ROCOF observed during the event from different PMUs in NR
Figure 5-96: Phase Voltage observed during the event showing oscillation
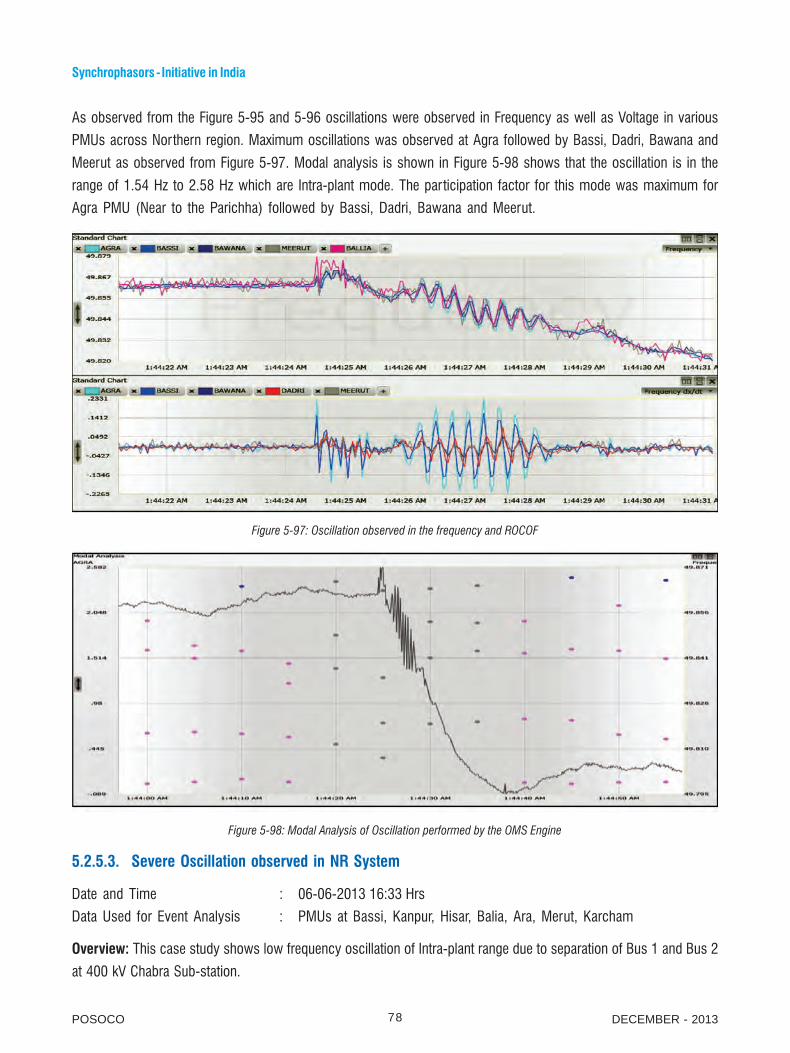
78 DECEMBER - 2013POSOCO
Synchrophasors - Initiative in India
As observed from the Figure 5-95 and 5-96 oscillations were observed in Frequency as well as Voltage in various
PMUs across Northern region. Maximum oscillations was observed at Agra followed by Bassi, Dadri, Bawana and
Meerut as observed from Figure 5-97. Modal analysis is shown in Figure 5-98 shows that the oscillation is in the
range of 1.54 Hz to 2.58 Hz which are Intra-plant mode. The participation factor for this mode was maximum for
Agra PMU (Near to the Parichha) followed by Bassi, Dadri, Bawana and Meerut.
Figure 5-97: Oscillation observed in the frequency and ROCOF
Figure 5-98: Modal Analysis of Oscillation performed by the OMS Engine
5.2.5.3. Severe Oscillation observed in NR System
Date and Time : 06-06-2013 16:33 Hrs
Data Used for Event Analysis : PMUs at Bassi, Kanpur, Hisar, Balia, Ara, Merut, Karcham
Overview: This case study shows low frequency oscillation of Intra-plant range due to separation of Bus 1 and Bus 2
at 400 kV Chabra Sub-station.

DECEMBER - 2013 POSOCO79
Synchrophasors - Initiative in India
Event Description: At 16:33 hrs 400 kV Chabra-Bhilwara line reportedly tripped and due to only one tie breaker
availabilitybetween 400 kV Bus 1 & 2 at Chabra S/s, both buses got separated. The bus configuration during the
event is shown in Figure 5-99. Large fluctuations in MW output of Kawai machine were observed and reported by
shift personal at Kawai (From 800 MW to 350 MW).
Figure 5-99: Connectivity Diagram of 400 kV Chabra station
Analysis: These oscillations were captured in the synchrophasor data as shown in Figure 5-100. The oscillations
were of growing magnitude and lasted for 22 seconds. The probable reason of oscillation is the wheeling of power
through longer route. The total line length of 400 kV Kawai-Chabra-Hindaun-Heerapura ckt is 513 km. through
which power was wheeling. It can be observed from PMU that frequency measured at Bassi was oscillating
against rest of the PMU frequency in NR as shown in Figure 5-101.
Figure 5-100: PMU plot of frequency and modal analysis Figure 5-101: Zoom view of PMU plot of frequency and modal
analysis

80 DECEMBER - 2013POSOCO
Synchrophasors - Initiative in India
The OMS shows that oscillations were in the range of intra plant oscillation (1.9 Hz - 2.4 Hz). This may be due to
limit hitting of generators near Bassi.
5.2.5.4. Oscillations in NER Grid
Date and Time : 03-08-2013 at 22:31 Hrs
Data Used for Event Analysis : PMU data from Bongaigaon, Balipara, Sarusajai, Agartala, Imphal,
SOE available at NERLDC
Event Description: From 22:31:50 Hrs to 22:34:04 Hrs on 03-August-2013, Low Frequency Oscillations were
observed in NER Grid in all the PMUs of NER. The duration of this low frequency oscillation is around 3 minutes.
Figure 5-102: Single Line Diagram of NER Grid during the time of incidence
Figure 5-103: Oscillation in Frequency observed from NER PMUs

DECEMBER - 2013 POSOCO81
Synchrophasors - Initiative in India
Analysis: The Synchrophasor data was analyzed using Fast Fourier transform and Matrix pencil method to find
the Individual mode, damping and mode shape.
1. FFT Analysis : From the PMU data, oscillations could be observed in the PMU in NER. To ascertain the probable
source of this persistent oscillation, fast fourier transform (FFT) analaysis was done on frequency, phase voltages and
currents measured from the PMU. From the FFT plots of frequency in Figure 5-104, it can be seen that the relative
amplitude (or energy) is maximum at Imphal and Agartala. The maximum energy is at 0.96 Hz, which is indicative of
Inter-Plant oscillation.
Figure 5-104: FFT Analysis on Frequency at different nodes of NER
Further analysis was performed on phase voltages of all PMUs of NER and line currents of 132kV Badarpur-
Khleihriat S/C, 132 kV Badapur-Kumarghat S/C, 132 kV Dimapur – Imphal S/C, which indicate two modes of
oscillation at 0.96 Hz and 1.91 Hz, with 0.96 Hz being the dominant mode as shown in Figure 5-105 & 5-106.
Figure 5-105: FFT of 400 kV Bongaigaon phase voltage Figure 5-106: FFT of current of 132 kV Badarpur – Khleihriat S/C

82 DECEMBER - 2013POSOCO
Synchrophasors - Initiative in India
2. Matrix Pencil Analysis:
Figure 5-107: 0.96 Hz with damping of 0.77 % Figure 5-108: 0.94 Hz with damping of -
0.35 %
Figure 5-109: 1.95 Hz with damping of
5.65 %
The matrix pencil was used for modal analysis on frequency and it was found that two Inter-plant modes with
frequency 0.96 and 0.94 Hz and one Intra-plant mode of 1.95 Hz was observed. Out of these 0.96 Hz was having
positive damping while 0.94 Hz is having negative damping. Such nearness of modes occurs due to modal
resonance. From the Figure 5-107 & 5-108 it can be observed that generators near to Agartala, Sarusujai and
Imphal participate in the oscillation. 1.95 Hz oscillation was observed only at Imphal as shown in Figure 5-109
which indicate source of oscillation is located there.
5.2.5.5. Oscillations in NER Grid Resulting in tripping of Generating units and lines
Date and Time : 11-08-2013 at 23:35 Hrs
Data Used for Event Analysis : PMU data from Misa, Badarpur, NEHU, Imphal, Agartala ; SOE available at
NERLDC ; SCADA data
Overview: This event showcases how a small perturbation like switching of reactor can result in small signal
instability in the grid. It also emphasizes the importance of PSS tuning of generator’s AVR.
Event Description: Oscillation started in NER grid at 23:33:10 Hrs which was having low magnitude. At 23:35:07
Hrs, 63 Mvar Bus-Reactor II at 400 kV Silchar(PG) was taken into service to improve voltage profile following
which low frequency oscillations started growing as observed in PMU data of all available nodes of NER upto
23:37:47 Hrs. The total duration of LFO observed in the grid was 268 seconds. It was informed that heavy
oscillations were observed in Doyang HEP of NEEPCO with generation and flow of outgoing feeders from Doyang
varying rapidly. Due to severe oscillations at Doyang HEP, Unit-2 of Doyang HEP (Generation = 23 MW) tripped at
23:36 Hrs along with 132 kV Doyang – Dimapur II line. Oscillations were also observed at Loktak HEP of NHPC,
with variation of generation and rapid variation in outgoing feeders from Loktak. After observing these oscillations,
Manipur manually reduced its drawal to around 50 MW (reduction by15 MW) and Loktak also reduced its generation
to prevent overloading of lines from Loktak.

DECEMBER - 2013 POSOCO83
Synchrophasors - Initiative in India
Figure 5-110: NER Grid view prior to the LFO observation i.e. 23:34 Hrs
In the Figure 5-110 shows the schematic diagram of NER grid where yellow circle indicates the generation
participation in the oscillation as per the preliminary investigation while red square indicates the PMU location in
the NER grid. Blue circle in the figure indicate the place where the 63 Mvar Bus reactor was switched on which
excited the LFOs.
Figure 5-111: R-phase currents of few Lines of NER Grid Figure 5-112: R-phase voltages (in p.u.) of few nodes of NER Grid
The PMU plots ( Figure 5-111 & 5-112) indicate that three events had occurred during the events which are as:
1. At 23:33:10:740: Either a reactor is switched off / Capacitor bank switching / Line charged
2. At 23:35:07.920: 63 MVAR Bus Reactor at Silchar was switched on.
3. At 23:37:09.440: Doyang Unit 2 tripped along with 132 kV Doyang Dimapur II.
Analysis: From the PMU data, oscillations could be observed in all 4 PMUs of NER at that time. As it was
observed that the oscillations initiated due to change in reactive power, so best signal to analyze such oscillation

84 DECEMBER - 2013POSOCO
Synchrophasors - Initiative in India
would be voltage. From Different PMUs of NER voltage data was first converted to p.u. based on base voltage and
then analyzed. The data was analysed for the sequence of events as above and is presented below :
Figure 5-113: During 12-128 Seconds data window
considered for analysisFigure 5-114: Mode shape of 1.0058 Hz
From the analysis of first 12-128 seconds as shown in Figure 5-113 it was found that 1.0058 Hz which is Inter-
plant mode is present in the system. The damping of this Inter-plant mode was almost zero during the period.
Imphal was having the highest energy followed by Badarpur, Balipara and Misa. Generators in the vicinity of
Imphal (Loktak HEP, Doyang HEP) were oscillating.
Figure 5-115: During 137-200 Seconds data window considered
for analysis
Figure 5- 116: Mode shape of 1.0074 Hz
During the analysis of period after 63 Mvar reactors switching it was found that 1.0074 Hz mode which is Inter-
plant (or Local mode) mode was having the highest energy and its damping is negative. The 2nd harmonic of this
mode i.e. 2.0156 Hz was also present with low energy content negative damping. This mode is Intra-plant
nature. From the mode shape shown in Figure 5-116, it is observed that Generators near Balipara and Imphal
were oscillating at 126 deg apart.

DECEMBER - 2013 POSOCO85
Synchrophasors - Initiative in India
Figure 5-117: During 213-241 Seconds data window considered for
analysis
Figure 5-118: Mode shape of 0.9958 Hz
Table 5-13: Dominant Modes observed during the 213-241 Seconds
When the oscillation started growing up as shown in Figure 5-117, two Intra-plant modes (1.9740 Hz and 1.9774
Hz) and two Inter-plant modes (0.9958 Hz and 0.9979 Hz) are being observed in the system as given in Table 5-
13 . Their frequencies are very nearby suggesting the strong resonance /mode coupling phenomenon. Modal
resonance has resulted in increase in damping of one mode while other mode becomes unstable with negative
damping. Similar behavior is true for the 2nd harmonics of these modes. With the switching of reactor, LFOs in the
system got excited resulting in growing nature of oscillations. At some point of time, the modes which are very
near to each other move closer and has shown a strong resonance leading to unstablising of one mode while
stabilizing other mode. This has resulted in unstable system leading to growing oscillation.
Figure 5-119: During 253-280 Seconds data window considered for
analysis
Figure 5-120: Mode shape of 0.9627 Hz
Frequency Damping (%) Energy
0.9958 1.4589 0.6203
0.9729 -0.1670 0.2851
1.9774 0.4950 0.2826
1.9470 -0.1909 0.0685

86 DECEMBER - 2013POSOCO
Synchrophasors - Initiative in India
Table 5-14: Dominant Modes observed during the 253-280 Seconds
In the final stage shown in Figure 5-119, the damping of modes has improved and with this oscillations has
damped out in the system. The damping resulted from the change in system condition which has resulted in
moving the modes away from the resonance.
Figure 5-121: AGTPP unit-wise Mvar from SCADA Figure 5-122: Loktak unit-wise Mvar from SCADA
Figure 5-123: Doyang unit-wise Mvar from SCADA
Based on above analysis, it is certain that LFO got excited at 23:33:10:740 which may be due to either reactor/
capacitor switching or line charging. At this moment Inter-plant modes in the range 0.9 Hz-1.1 Hz got excited and
Frequency Damping (%) Energy
0.9627 0.9109 0.6157
0.9964 -0.1357 0.0373
1.9164 0.9092 1.0167
1.9637 0.1785 0.1578

DECEMBER - 2013 POSOCO87
Synchrophasors - Initiative in India
persisted in the system. This may be due to the sudden change in reactive power which has resulted in voltage
rise/dip at different location in the system and several generators were trying to modulate their AVRs to adjust the
change in their terminal voltages. But due to their improper/absence of PSS tuned exciter or manual control mode
of AVRs, the LFOs did not damp out and persisted in the system.
The rise in amplitude as observed is sudden which indicate that a system can collapse very fast when the PSS of
generators are not tuned properly or their AVRs are in manual control mode. The Inter-plant modes in the range 0.9 Hz-
1.1 Hz and intra-plant mode in the range 1.8 Hz-2 Hz were observed in the system. Interestingly it can be observed
that modes and their harmonic are having similar nature of magnitude increment with time as observed from Table 5-
13 and 5-14.
From Figures 5-121, 5-122 & 5-123, it can be observed that even within the same plant, some generators were
absorbing MVARs while some were generating near to Imphal. After the switching of reactor, wide variation in
Mvar can be seen at Loktak, AGTPP and Doyang. With tripping of generators and lines, the oscillations subsided.
This case study signifies the importance of small signal stability studies and Model updation of small generators
for study and planning purposes. Model validation of turbine and governor of such generators is very much
required for offline and real time dynamic assessment.
In the Table 5-15, Low frequency oscillation observed in the NEW grid and SR grid has been tabulated.
Table 5-15 Low frequency Oscillations observed in Indian grid

88 DECEMBER - 2013POSOCO
Synchrophasors - Initiative in India
5.3. Detection of Coherent Group of Generators
Generator Coherency is a phenomenon in power system where certain generators tend to swing together after a
disturbance. These generators are collectively referred to as a group of coherent generators. A coherent group of
generators can be aggregated to form a single equivalent generator model that has the same effect on system
dynamic modes as the original generator set. The process of aggregation removes the high frequency, inter-
generator modes from the aggregated model and the generator [R2]. Transient stability or large disturbance rotor
angle stability is concerned with the ability of the power system to maintain synchronism when subjected to a
severe disturbance, such as a short circuit on a transmission line. Instability that occurs in the form of increasing
angular swings of some generators leading to their loss of synchronism with respect to others. The rotor angles
of all the generators swing together in a synchronous frame of reference prior to the occurrence of disturbance.
This means the angular difference between any two generators is approximately constant over a period of time.
The disturbance on the system causes drift in the rotor angle of some generators and hence these generators
move away from the rest of the generators in the system and form different groups. Generators belonging to a
cer tain coherent group are to have similar response curves with each other after a system disturbance. The
generators in each group are known as coherent generators. After the removal of the disturbance, the affected
generators will again swing back to synchronism with the rest of the generators.
Multi-machine equations can be written similar to the one-machine system connected to the infinite bus. Following
any disturbance the difference of rotor angles of the coherent machines remains constant in time and if they have
equal velocity and acceleration as described by the following equations:
During disturbances weak tie lines interconnecting two systems may lead to formation of group of generators
oscillating against each other. Generators among each group may have similar rotor angle waveforms. These
generators are considered to be coherent. To avoid an impending disturbance, certain out of step relays have to be
set to accomplish system separation or adaptive islanding and as such these groups must be identified.
5.3.1. Coherency observed in NEW grid during Bus fault at Parli S/s on 03-03-2013.
As shown in Figure 5-124 during a bus fault at 400 kV Parli substation in Western Region, generators in western
part of the Western grid were in anti-phase with generators in Northern region. This anti-phase swinging was in
system for three seconds after which they again reached to the equilibrium point. The mode which was the found
during the analysis was 0.5 Hz and it can be observed from Figure 5-125 that the Northern Region and Western
Region generators were swinging in phase opposition.

DECEMBER - 2013 POSOCO89
Synchrophasors - Initiative in India
Figure 5-124: Frequency plots during bus fault at 400 kV Parli Substation illustrating the antiphase swinging of Western region machines
with Northern Region
Figure 5-125: Frequency plots during bus fault at 400 kV Parli Substation illustrating the antiphase swinging of Western region machines
with Northern Region
5.4. Island Detection and Resynchronization in the Grid
Islanding detection and its re-synchronization with the grid is an important event that can be monitored and
detected using wide area measurement system. During a synchronous operation the phase angle difference
measured from the PMUs between different nodes will be constant and will vary according to power transfer
between source and sync and other parameter like load generation balance, voltage etc. During islanded condition
the phase angle difference between nodes in two different islands will vary and their variation will depend on the
differential frequency of the two islands.

90 DECEMBER - 2013POSOCO
Synchrophasors - Initiative in India
From the experience it has been observed that phase angle difference between PMU in two different islands will
be the saw tooth and the saw tooth wave frequency would be the differential frequency. If the frequency difference
is quite large then the sawtooth frequency will depend on the reporting rate of PMU. In case both the grid are
running at same frequency then the phase angle difference will be same and will not be having any sawtooth.
For example Figure 5-126 shows the islanding of one portion from the other. Frequency of the two islands (Island
1 with Bhadrwati and island 2 with Balipara and Agar tala) were different from each other after the loss of
synchronization. The angle between the positive sequence voltage between the two islands shows that prior to
loss of synchronization angle was constant. But as the synchronization is lost the angle start increasing. After
360o the angle was continuously increasing which was again wrapped in (0o-360o) for convenience. This resulted
in sawtooth waveform of the angle.
PD = 1/ (Time difference between peak adjacent peak points of saw tooth)
FD = frequency difference in between the two islands during the adjacent peak
Figure 5-126: Frequency plots during bus fault at 400 kV Parli Substation illustrating the antiphase swinging of Western region machines
with Northern Region
It can be observed from the Figure 5-126 that the frequency of the sawtooth for the angle difference between two
islands is equal to the frequency difference between two islands.
5.4.1. Islanding of NR Grid from Rest of the NEW Grid on 30-07-2012
Date and Time : 30-07-2012 02:33 Hrs
Data Used for Event Analysis : PMU at Kanpur and Jabalpur

DECEMBER - 2013 POSOCO91
Synchrophasors - Initiative in India
Figure 5-127: Phase angle difference during the islanding of NR from rest of the NEW grid on 30th July 2012
Figure 5-127 shows that the NR grid got islanded from the rest of the system on 30th July’12. The ambular
difference plot is made in offline mode during post dispatch analysis. As observed in the Figure 5-127, first phase
angle difference has increased between Kanpur and Jabalpur and sawtooth wave form represents that two
systems has islanded.
5.4.2. Islanding of NR, ER and NER Grid from Rest of the NEW Grid on 31-07-2012
Date and Time : 31-07-2012 13:00 Hrs
Data Used for Event Analysis : PMU at Kanpur and Jabalpur
Figure 5-128: Phase angle difference during the islanding of NR, ER and NER from rest of NEW grid on 31th July 2012
Figure 5-128 shows that the NR, ER and NER grid got islanded from the rest of the NEW grid on 31st July’12 The
ambular difference plot is made in offline mode during post dispatch analysis. As observed in the Figure 5-128,
first phase angle difference has increased between Kanpur and Jabalpur and sawtooth wave form represents that
two systems has islanded.

92 DECEMBER - 2013POSOCO
Synchrophasors - Initiative in India
5.4.3. Islanding of NER Grid from Rest of the NEW Grid on 29-09-2013
Date and Time : 29-09-2013 16:25
Data Used for Event Analysis : PMU data from Bongaigaon, Balipara, Agartala, Bhadrawati, Raipur,
Jabalpur ; SOE available at NERLDC ; SCADA data ; Disturbance Recorder
data from Bonagaigaon
Overview: This case study is unique in the sense that after the deployment of the Pilot project in the all the regions,
this being the first event of islanding that has been analyzed using synchrophasor data.
Event Description: 220 kV BTPS-Salakati D/C lines were under planned shutdown. NER Grid was connected to rest
of NEW Grid through 400 kV Balipara – Bongaigaon D/C lines and was exporting around 240 MW to NEW Grid as
shown in Figure 5-129. Demand met of NER prior at that time was 1057 MW.
Figure 5-129: Connectivity diagram of North-Eastern Regional grid with NEW grid prior to islanding
At 16:25:08:360 Hrs, 400kV Balipara – Bongaigaon I tripped and at 16:25:09:440 Hrs 400 kV Balipara – Bongaigaon
II tripped, which led to isolation of NER Grid from rest of NEW Grid.The schematic diagram of NER grid is shown in
figure 5.129. With the isolation from NEW grid, NER grid formed a generation rich island. To stabilize the frequency
which was increasing, Unit-1 of Ranganadi HEP (Gen: 110 MW) was tripped as per NERLDC instruction at
16:32:39:370 Hrs while Palatana GTG-I got tripped at 16:26 Hrs (Gen: 59 MW) and while AGTPP generation
reduced from 75 MW to 57 MW. This has resulted in load generation balance and frequency was stabilized.
Separation of NER Grid from rest of NEW Grid, as well as fault clearing can be clearly observed from PMU plots of
NER w.r.t. WR Grid (Connected to NEW Grid) in Figure 5-130 , 5-131 & 5-132.
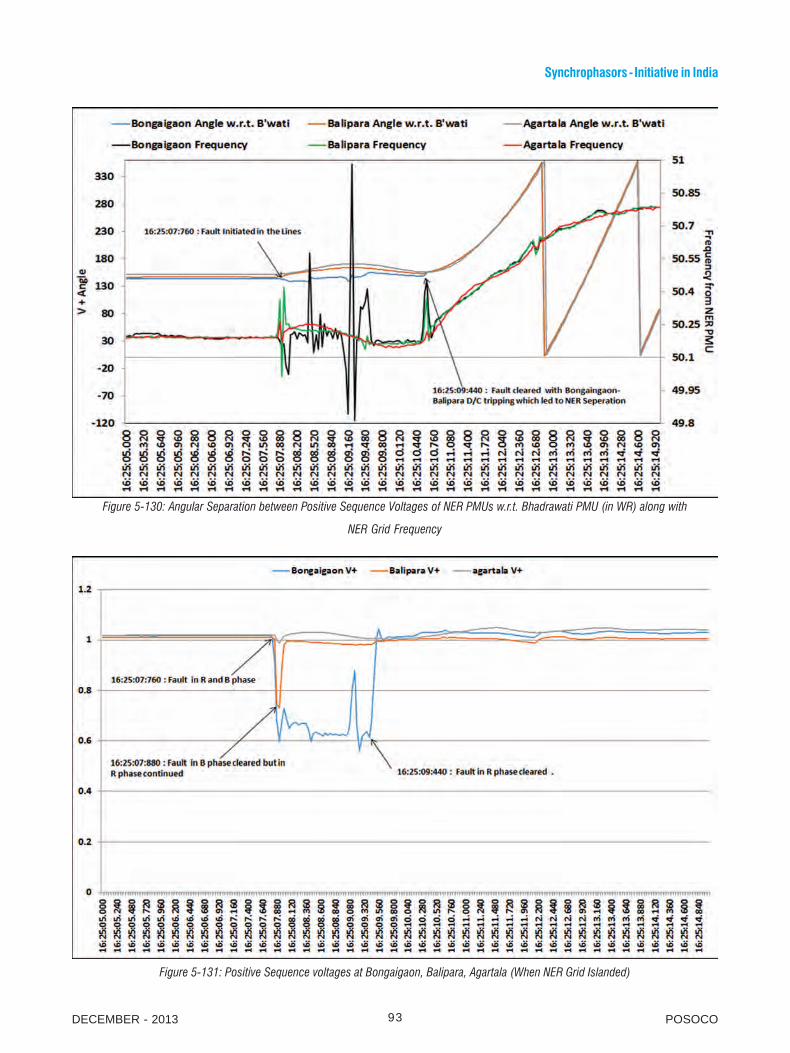
DECEMBER - 2013 POSOCO93
Synchrophasors - Initiative in India
Figure 5-130: Angular Separation between Positive Sequence Voltages of NER PMUs w.r.t. Bhadrawati PMU (in WR) along with
NER Grid Frequency
Figure 5-131: Positive Sequence voltages at Bongaigaon, Balipara, Agartala (When NER Grid Islanded)

94 DECEMBER - 2013POSOCO
Synchrophasors - Initiative in India
Figure 5-132: Voltages at Bongaigaon showing significant dip in R-phase voltage at Bongaigaon (Voltage input to PMU at Bongaigaon was
from line CVT of 400kV Balipara – Bongaigaon II)
The synchronization at 16:34:48 Hrs appears to be rough synchronization where frequency difference between
NER Grid and rest of NEW Grid was around 0.344 Hz as shown in Figure 5-133. This resulted in heavy power
inrush to NER Grid (around 160 MW). Also this synchronization resulted in vibrations (hunting) of machines, and
also wide changes in MVAR absorption/injection of units resulting in tripping of several units. The swing in voltage
in NER PMUs can be seem in Figure 5-134. All units of AGTPP at 16:34:49.162 Hrs tripped following synchroniza-
tion and Generation of STG-I of Palatana came down by around 25 MW which later tripped at 16:39 Hrs. Tripping
of generators were also reported in Tripura system (Gen Loss: 42 MW) and Assam system (Gen Loss: 53 MW).
Net loss of generation was 380 MW in NER Grid
Figure 5-133: Angular Separation between Positive Sequence Voltages of NER PMUs w.r.t. Bhadrawati PMU along with NER Grid
Frequency (at the time of resynchronization with NEW Grid)

DECEMBER - 2013 POSOCO95
Synchrophasors - Initiative in India
Figure 5-134: Positive Sequence Voltage at Bongaigaon, Balipara, Agartala (at the time of resynchronization with NEW Grid)
Analysis: From the PMU data, it was possible to uniquely identify the event, the fault clearing times (may not be
exactly accurate as PMU data are available at every 40 ms whereas stipulated fault clearing time on 400 kV is 100
ms) and the oscillations that developed in the system as a result of this rough synchronisation process. The PMU
data was analysed further which showed that the synchronisation resulted in Inter-area oscillations of around
0.53 Hz in the system and hence is very dangerous in nature.The R phase voltage of bongaigaon was low for
considerable amount of time as the PMU voltage input is taken from the line CVT.
From the relay indication of 400 kV Balipara-Bongaigaon II, R Phase fault was observed at both Bongaigaon and
Balipara ends. Auto-reclosure was successful on this circuit at Balipara end. It appears that while 1 phase (R-phase)
may have tripped at Bongaigaon end, other 2-phases (Y and B) were still connected. From the phase voltage plots at
Bongaigaon, significant sag in voltage of R-phase is found for a long duration. This seems to be a case of persistent
earth-fault on R-phase but is yet to be confirmed as the magnitude of voltage on R-phase was quite low (around 0.1
– 0.2 p.u.) Another reason could be due to the induced voltage on this phase from other two charged phases even
after the fault was cleared. Since voltage inputs to PMU at Bongaigaon were from line CVT of 400kV Bongaigaon
– Balipara II, it could not be confirmed from PMU measurements. Also data of this line from Balipara end was not
available at the time of event which could have given a clearer picture.
Frequency of Agartala, Balipara, Bongaigaon, Bhadrawati, Sugen and Mundra was analyzed for LFO observed during
synchronization as shown in Figure 5-135. It was confirmed that 0.53 Hz mode (Inter-area mode) was present with
high energy content as given in Table 5-16.

96 DECEMBER - 2013POSOCO
Synchrophasors - Initiative in India
Figure 5-135: Frequency of NER and NEW grid (at the time of resynchronisation with NEW Grid)
Table 5-16: Major Mode observed after the combined analysis of several PMU of NEW grid
This being the first case study when islanding at regional level occurred and survived after the pilot project of
synchrophasor has been commissioned in all the regions. The synchrophasor has given lots of insight into the
islanding of the grid which are as following:
1. All the constituents and all Control room operators must be well informed about any planned outage prior
to that, and must also be aware of the grid conditions and connectivity so that they do not undertake any
rough operation which could be dangerous. In this particular case, NER Grid was exporting (as is usually
the case for most of the year) and if the demand of NER have been on higher side, it might have resulted
in collapse of entire grid of NER.
2. Proper care to be taken while synchronization of two islands, one with low and other with high inertia.
3. The rough synchronization was as a result of some snag in the synchroscope at Bongaigaon. Thiswas a
serious issue as NER Grid was connected to rest of the NEW Grid through only one in feed point (Bongaigaon)
Method Frequency Damping Ratio (%) Energy
Matrix Pencil 0.5374 10.264 6.4912

DECEMBER - 2013 POSOCO97
Synchrophasors - Initiative in India
and hence any such issues could be very harmful to the entire grid. The snag was rectified later; however
the incident highlights the need for healthiness of equipment at important substations to avert any mishap.
4. The PMU inputs at site should be as per stipulated and not be modified due to site constraints. Had the
voltage input at Bongaigoan PMU been from Bus PT of 400kV Bus at Bongaigaon, it could have given a
better understanding of the event. It is learnt that due to some constraints at site this input was taken from
line CVT.
5. It would be helpful for all the RLDC to at least have one PMU data from other Region. This will help in any such
cases resulting in separation.
6. Exciter / PSS tuning of generators in NER, especially in Southern Part of NER Grid is required as frequently
LFO are being observed.
5.5. Dynamic Model Validation Using Synchrophasor data
In power system, dynamic Modelling and its validation are very important tasks. The first question that is being
raised by the utility is “Why there is a need to validate the dynamic modelling validation of various elements in the
power system?”. The answer to the question is that these models form the foundation of all the power system
simulation studies for contingency planning during pre-dispatching, in real time system operation and future
planning for grid strengthening. So, periodic system model validation in actual operation is a need for planners and
operators. It is required to ensure that the power system models are accurate and up to date from time to time.
These tasks need to be performed regularly in order to keep up with ongoing changes and additions in the grid.
These models are also being used in the Control Centre for state estimator. If the model is not updated the output
of state estimator will be having a large error.
One of the efficient ways to validate the model is during the disturbances. Disturbances present great opportunities
for model verification and identification of necessary model improvements. As during these condition the control
variable associated with the model will function which affect the response of the equipment in respect to the
disturbance.
This section presents the case studies involving the model validation of Electrode Current limiting characteristic of
HVDC bipole, SPS associated with HVDC, Frequency controller of HVDC, data validation from PMU/DR/Offline
simulation for a fault.
5.5.1. Validation of Electrode Current limitation characteristics of HVDC Talcher-Kolar.
Date and Time : 09-05-2013 04:11
Data Used for Event Analysis : Somanahalli, Bhadrawati, Raipur, Dehgam, Itarsi PMU
Overview: Southern Grid in Indian power system is asynchronously connected with the rest of the Indian grid
through two back to HVDC and one Bipolar HVDC Line. The Talcher-Kolar bipolar HVDC connect Talcher Sub-
station (Converter) in Orissa to Kolar Sub-station (Kolar) in Karnataka. This case study validates the electrode
current limitation characteristic as well as the SPS action. Connectivity of the bipolar HVDC links is shown in
Figure 5-136.

98 DECEMBER - 2013POSOCO
Synchrophasors - Initiative in India
Figure 5-136: HVDC Talcher-Kolar schematic Diagram
Event Description: HVDC Talcher-Kolar Pole -1 blocked due to External feeder Protection due to bus fault due to
failure of 400 kV Bus-1 sectionalizer CT and tripping of Bus 1A, IIb and IIa at Kolar. Pole-2 came on Metallic return
mode and then to Ground return mode. Power flow came down from 1857 MW to 1040 MW then to 153 MW.
Frequency increased to 49.80 Hz from 49.93 Hz then came down to 49.43 Hz.
The behavior of southern region frequency NEW grid frequency was compared with the current reduction
characteristics of HVDC bipole after tripping of one HVDC pole without changing over to metallic return. The
current characteristic of HVDC link is shown in Figure 5-137.
Figure 5-137: HVDC Current reduction charecteristics

DECEMBER - 2013 POSOCO99
Synchrophasors - Initiative in India
Figure 5-138 shows the current reduction after tripping of one HVDC pole without changing over to metallic return
in SR grid. As per the current reduction characteristics, the power flow on HVDC pole-2 slowly reduced for 1745
MW to 1230 MW at the rate of 7.35 MW/Sec i.e.14.7 Amps/Sec in 70 seconds. Before going into ground return
mode the power flow on pole-2 reduced from 1230 MW to 153 MW at the rate of 56.66 MW/Sec i.e. 13.33 Amps/
sec in 19 seconds.
Figure 5-138: Frequency profile of SR grid during the event
Figure 5-138 shows the Southern region frequency profile recorded at 400kV Somanhalli substation during tripping
of HVDC Talcher-Kolar Pole-1.
Figure 5-139: NEW Grid frequency for the incident

100 DECEMBER - 2013POSOCO
Synchrophasors - Initiative in India
Figure 5-139 shows the NEW grid frequency for the above mentioned incident. It can be observed that the frequency
increased after blocking of pole-1. This is due to the power which was being send to SR grid from Talcher TPS
through HVDC Pole was now available as the excess power in NEW grid. This resulted in increasing of NEW grid
frequency from 50 Hz to 50.2 Hz in the first 70 seconds. After that frequency ramped up to 50.43 Hz in next 19
seconds. After that SPS action resulted in units tripping which led to fall in frequency of NEW grid. The frequency
characteristic is in accordance with the HVDC action which validates the current characteristic of the electrode.
5.5.2. Model Validation of Frequency Control of HVDC
Date and Time : 22-11-2013 14:22-16:20 Hrs
Data Used for Event Analysis : Somanahalli, Bhadrawati, Raipur, Dehgam, Itarsi PMU
Overview: This case study is the model validation of frequency control and frequency limit function of HVDC
.Frequency control in HVDC can be used during the synchronization of two grids. Keeping in view the synchronization
of SR grid with NEW grid, a test for confirming the functioning of frequency control in HVDC Bhadrawati back to
back link was performed on 22nd Nov 2013. This HVDC connects SR grid with WR grid of NEW grid. Here Bhadrawati
West side is in converter mode while the south side in inverter mode. From South Bus of Bhadrawati 400 kV
Bhadawati-Ramagundam D/C are for importing the power to Ramagundam from where it is sent to the Southern
grid.
Background: Frequency control is superimposed on power control. The power flow through the DC link is therefore
guided by the combination of two types of controller. Frequency controller can further be of two types: Target frequency
controller and frequency limit function controller.
In target frequency controller, the target frequency is set as reference and the HVDC link tries to achieve the target
frequency by regulating the flow. In frequency limit function controller, the frequency is made to remain within a
band. When the frequency is within the band, the HVDC is in power controller mode and the power flow through
the link is constant. When the frequency tries to violate the band limits, the HVDC frequency limit function
controller tries to bring it within the band by regulating the flow on the DC link. Various tests have been performed
to validate the action of HVDC controller. Figure 5-140 shows the network connectivity of HVDC bhadrawati.
Figure 5-140: Schematic Diagram of WR and SR Grid Connectivity via HVDC Bhadrawati and PMU Location

DECEMBER - 2013 POSOCO101
Synchrophasors - Initiative in India
HVDC Performance under Various Test its validation: The case study is an example of model validation application
of the PMU. The frequency controllers were set for changing the frequency of the SR grid. PMUs are available at
Bhadrawati (WR Grid) and Ramagundam (SR Grid) end. At Ramagundam end the PMU is connected at Ramagundam
- Bhadrawati 1 circuit. So the power measured at Ramagundam end of this line is equivalent to half of the power
that is coming from Bhadrawati HVDC. The tests at frequency control and frequency limit at HVDC were performed
in four stages.
Test 1: This test was performed to achieve the target frequency at a frequency target higher than nominal frequency
(50 Hz) in Southern Grid. The target frequency for the SR grid was set as 50.16 Hz. Prior to the test the frequency
of SR grid was 49.95 Hz.
Figure 5-141: SR frequency, WR frequency and HVDC power flow during 14:21 to 14:47 hrs
As can be seen from Figure 5-141, as soon as the test star ted, the power flow through the HVDC link pole 1
deviated from its scheduled power of 300MW. Power flowed from Bhadrawati to Ramagundum and measurement
is from Ramagundam end in SR region. This action was due to the controller which tried to bring the frequency of
SR grid to the target frequency. Once the target frequency was reached, the SR system was tending to further
increase the frequency, but the HVDC link reduced the inflow of power so as to reduce the frequency and bring it
back to 50.16 Hz.
Test 2: This test was performed to achieve the target frequency at a frequency target lower than nominal frequency
(50 Hz) in Southern Grid. The target frequency for the SR grid was set as 49.96 Hz. Prior to the test the frequency
of SR grid was around 50.15 Hz. From Figure 5-142 it can be observed that the HVDC power is in accordance to
keep the SR grid frequency at target frequency.
Test 3: This test was to perform the frequency limit control in which the controller will act if the frequency of the
SR grid goes out of the band. The band of frequency was set at 49.9 Hz -50.1 Hz. While conducting the test, pole
2 tripped at 15:26 Hrs as observed in Figure 5-143. The other pole could not take the total power so the power

102 DECEMBER - 2013POSOCO
Synchrophasors - Initiative in India
reduced to half. Further when the frequency remained within the band the frequency limit function controller did
not respond and the flow through the HVDC link remained constant.
Figure 5-142: SR frequency, WR frequency and HVDC power flow during 14:49 to 15:19 hrs
Figure 5-143: SR frequency, WR frequency and HVDC power flow during 15:25 to 15:44 hrs
Test 4: The band of frequency within which the frequency was to be maintained was 49.7 Hz – 49.9 Hz. The test
started at 16:04 hrs. During the test frequency in southern grid higher than the band selected for frequency control.
The HVDC controller acted to bring the frequency back within the range as observed from the Figure 5-144.
Figure 5-144: SR frequency, WR frequency and HVDC power flow during 16:04 to 16:25 hrs

DECEMBER - 2013 POSOCO103
Synchrophasors - Initiative in India
So, the frequency control function of HVDC was tested and analyzed in real time using the synchrophasor data. It
can be observed how synchophasor has given an insight into the functioning of controller whose action is within
second and its impact of frequency and power.
5.5.3. Validation of Angular Separation calculated from EMS and measured from PMU
Synchrophasor data gives the real time angular difference between the two nodes in the grid while the EMS gives the
angular difference based on state estimation. State estimation is yet to be perfected due to constraint related to
topology and communication issues. At present State estimation is performed based on the available data to the
SCADA and the angular difference between two nodes were calculated and compared with PMU data as shown in
Figure 5-145.
Figure 5-145: EMS estimated and PMU measured angular difference between Korba and Kalwa in a day
As observed from the figure the duration for which most of the data were available, the EMS estimated angle is
well in coherence with the synchrophasor measured angle. This has helped in further improving the state estimator.
5.5.4. Cross validation of DR, Offline simulation and Synchrophasor measurements
This case study presents the model validation of synchrophasor measurement, disturbance recorder for a single
phase to earth fault on transmission line. The line selected here is 400 kV Korba-Bhatapara whose Korba end CT
is connected with PMU along with the Unit 6 GT H/V side. Two events are analyzed here on the same circuit for
single phase to earth fault. Along with that Unit 6 response was also analysed using Synchrophasor data and
offline study for the fault.
Event 1: Y phase to earth fault on 400 kV Korba-Bhatapara ckt on 03-10-2013 (A/R was blocked by the Main 2
Relay due to logic problem)

104 DECEMBER - 2013POSOCO
Synchrophasors - Initiative in India
PMU PLOTS:
Figure 5-146: Korba Bus Voltage during Y phase to earth fault on
400 kV Korba -Batapara line
Figure 5-147: 400 kV Korba-Batapara Circuit Real and Reactive
power during Y phase to earth fault on 400 kV Korba -Batapara line
Figure 5-148: Korba-Bhatpara Circuit Current during Y phase to
earth fault on 400 kV Korba -Batapara line
Figure 5-149: Korba Unit 6 Current from PMU at Korba during Y
phase to earth fault on 400 kV Korba -Batapara line.
Figure 5-150: Korba Unit 6 Real and Reactive Power during Y phase
to earth fault on 400 kV Korba -Batapara line
Figure 5-151: Frequency observed from different PMU during Y
phase to earth fault on 400 kV Korba -Batapara line

DECEMBER - 2013 POSOCO105
Synchrophasors - Initiative in India
DR PLOTS:
Figure 5-152: Voltage from DR of Korba-Bhatapara Circuit from Korba end during Y phase to earth fault on 400 kV Korba -Batapara line
Figure 5-153: Current from DR of Korba-Bhatapara Circuit from Korba end during Y phase to earth fault on 400 kV Korba -Batapara line
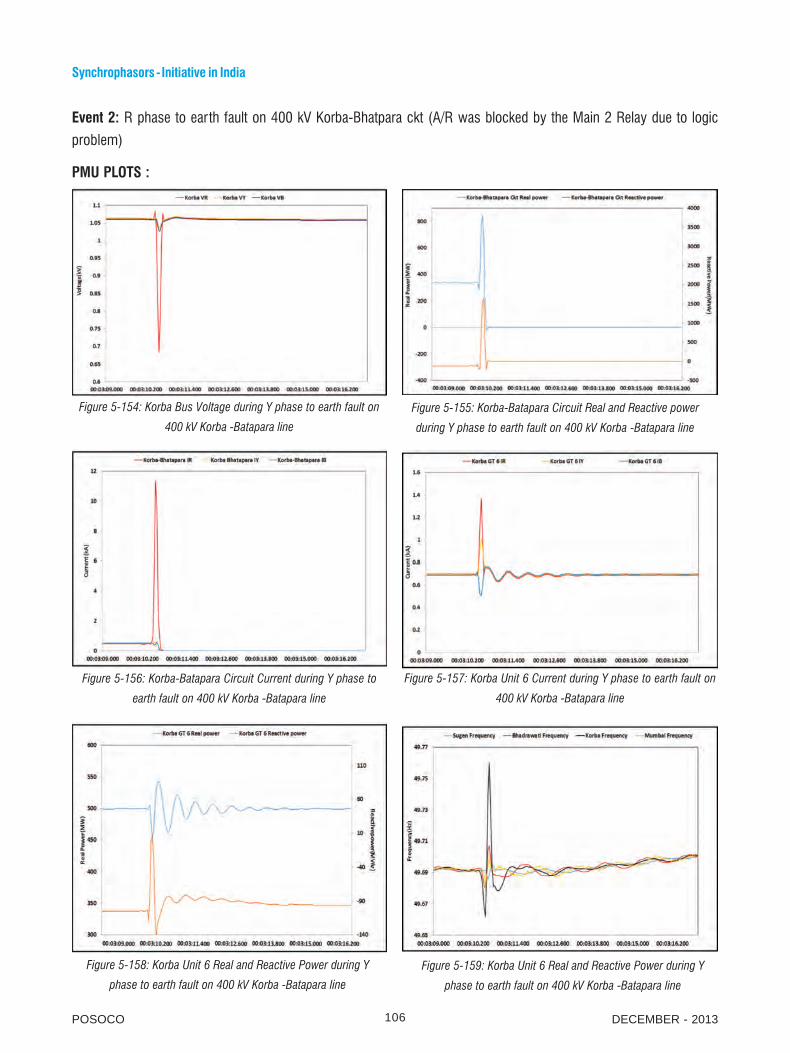
106 DECEMBER - 2013POSOCO
Synchrophasors - Initiative in India
Event 2: R phase to earth fault on 400 kV Korba-Bhatpara ckt (A/R was blocked by the Main 2 Relay due to logic
problem)
PMU PLOTS :
Figure 5-154: Korba Bus Voltage during Y phase to earth fault on
400 kV Korba -Batapara line
Figure 5-155: Korba-Batapara Circuit Real and Reactive power
during Y phase to earth fault on 400 kV Korba -Batapara line
Figure 5-156: Korba-Batapara Circuit Current during Y phase to
earth fault on 400 kV Korba -Batapara line
Figure 5-157: Korba Unit 6 Current during Y phase to earth fault on
400 kV Korba -Batapara line
Figure 5-158: Korba Unit 6 Real and Reactive Power during Y
phase to earth fault on 400 kV Korba -Batapara line
Figure 5-159: Korba Unit 6 Real and Reactive Power during Y
phase to earth fault on 400 kV Korba -Batapara line

DECEMBER - 2013 POSOCO107
Synchrophasors - Initiative in India
DR PLOTS :
Figure 5-160: Voltage plot from DR of Korba-Bhatapara Circuit from Korba end during Y phase to earth fault on 400 kV Korba -Batapara line
Figure 5-161: Current plot from DR of Korba-Bhatapara Circuit from Korba end during Y phase to earth fault on 400 kV Korba -Batapara
line

108 DECEMBER - 2013POSOCO
Synchrophasors - Initiative in India
Offline Study Result from PSS/E for Unit -6 Response:
Figure 5-162: P & Q of Korba-Unit-VI using offline study
Analysis: Based on the synchrophasor data (Figure 5-146 to 5-151 & 5-154 to 5-159), DR data (Figure 5-152,
5-153, 5-160 & 5-161) and offline study (Figure 5-162), validation was done through three different sources,
details are given below:
From above table the Fault current is validated using PMU and DR of the same line. Along with that the fault
clearance time is also validated. The generator 6 response on which PMU is connected at HV side is also similar
to what has been observed from the offline model for the fault study in PSS/E. The auto-reclosure for this line was
not observed as seen from PMU/DR.
5.6. Visualization of PSS testing.
5.6.1 PSS tuning at Karcham Wangtoo HEP on 11-12 April 2013
This section describe a case study where PMU has helped in detecting the oscillation in real time and giving a
clue that the PSS requiresto be tuned,subsequently the PMU helped in visualizing the online performance test of
PSS at archam Wangtoo HEP.

DECEMBER - 2013 POSOCO109
Synchrophasors - Initiative in India
Figure 5-163: Screenshot of PMU data display at NRLDC on 23-August 2012 at 19:02 hrs
Oscillations were observed on 23rd August 2012 (at 19:02 hrs) and 24th August 2012 (04:08 hrs) in the NEW grid.
The oscillations on 23rd August 2012 coincided with the forced outage of 400 kV Wangtoo-Abdullapur – ckt-1 & 2
(carrying 2x500 MW) and 400 kV Panchkula-Abdullapur- ckt-2 (carrying 392 MW). The antecedent generation in
the Jhakri-Baspa-Wangtoo complex was 3000 MW (Jhakri: 1600 MW, Wangtoo: 1100 MW and Baspa: 300 MW).
The screen shot of the oscillations observed on the PMU data display at NRLDC is shown in figure 5.163. The
oscillations subsided after manual reduction of generation in the complex.
Testing of PSS of generator at Karcham: The performance of PSS on the generating units of Wangtoo HEP was
tested in time domain using the following two methods:
1. Performance of unit running with and without PSS in service was monitored for a voltage step change of ~
3% to the AVR.
2. Performance of the running units with and without PSS in service was monitored for a perturbation created
by switching of one of the evacuating lines from Wangtoo HEP. The PLCC on the line being switched was kept
off during the test so that the line is opened only from one end and it remains connected from the remote end.
Line switching test recorded in real time:The generation at Baspa HEP and Wangtoo HEP is evacuated through 400
kV Wangtoo-Jhakri D/C and 400 kV Wangtoo-Abdullapur D/C lines. Critical operating conditions were created by
opening both circuits of 400 kV Wangtoo - Jhakri D/C resulting in Karcham Wangtoo HEP being connected radially
only through Karcham Wangtoo – Abdullapur 400kV D/c (quad) line.
Since at the time of testing Baspa HEP generation was Nil, the running Units # 2 & # 4 at Wangtoo HEP were
loaded to 275 MW each (limited availability of water inflows). Thus in the antecedent conditions 400 kV Wangtoo
– Abdullapur D/C (quad) line was carrying 550 MW. Under this condition, the system was perturbed by manual
tripping of one circuit of 400 kV Karcham Wangtoo – Abdullapur D/C lines (from 400 kV Wangtoo end) such that

110 DECEMBER - 2013POSOCO
Synchrophasors - Initiative in India
the entire 550 MW being generated by the running units is evacuated through the remaining line. The tests were
carried with and without PSS on the running units. PSS response both at the time of tripping of the line and at the
time of reclosing of the line was monitored.
The plot of R phase voltage-neutral voltage of 400 kV Wangtoo bus (with and without PSS in service on both the
running units) immediately after the tripping of 400 kV Wangtoo Abdullapur-I as recorded through the PMU at Wangtoo
is shown in below Figure 5-164.
Figure 5-164: R phase to Neutral voltage of Wangtoo 400 kV Bus
The PSS performance test results prima facie indicate that the damping of oscillations is better when PSS is in
service.
5.7. Monitoring of Natural disasters
5.7.1 Monitoring during Phailin Cyclone in Odisha
Date and Time : 12.10.2013, 21:26 Hrs
Data Used for Event Analysis : Talcher PMU
Overview: During this event PMU data helped in observing important tripping in Eastern region and southern
region which enabled the operator to have better situational awareness.
Event Description: At 21:26 hrs, very severe Cyclone Phailin categorized as very very severe cyclone had landfall
near Gopalpur in Odisha on 12.10.2013 night with a wind speed of 200 km / hr. causing severe damage to the
distribution network of SOUTHCO & CESU as well as transmission network of OPTCL in the southern & central region
of the State. Distribution network of NESCO had also been affected due to heavy rainfall and flood. Twenty six (26)
sub-stations and fourty five (45) EHT lines had gone out of service.
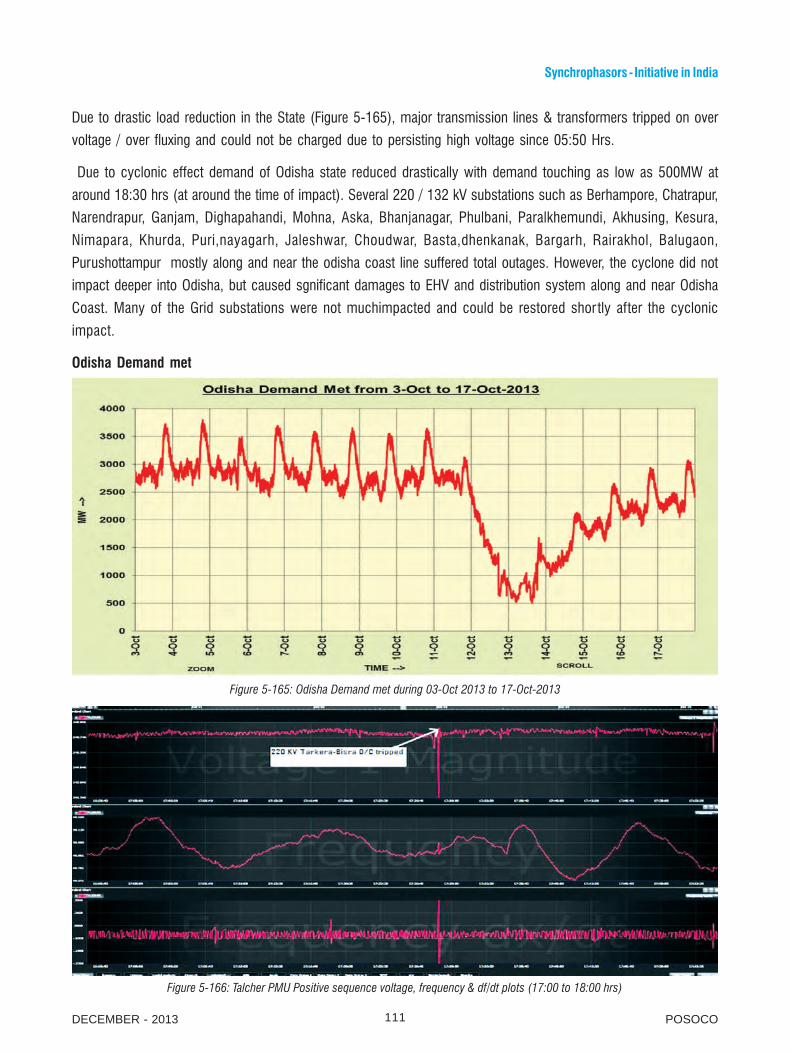
DECEMBER - 2013 POSOCO111
Synchrophasors - Initiative in India
Due to drastic load reduction in the State (Figure 5-165), major transmission lines & transformers tripped on over
voltage / over fluxing and could not be charged due to persisting high voltage since 05:50 Hrs.
Due to cyclonic effect demand of Odisha state reduced drastically with demand touching as low as 500MW at
around 18:30 hrs (at around the time of impact). Several 220 / 132 kV substations such as Berhampore, Chatrapur,
Narendrapur, Ganjam, Dighapahandi, Mohna, Aska, Bhanjanagar, Phulbani, Paralkhemundi, Akhusing, Kesura,
Nimapara, Khurda, Puri,nayagarh, Jaleshwar, Choudwar, Basta,dhenkanak, Bargarh, Rairakhol, Balugaon,
Purushottampur mostly along and near the odisha coast line suffered total outages. However, the cyclone did not
impact deeper into Odisha, but caused sgnificant damages to EHV and distribution system along and near Odisha
Coast. Many of the Grid substations were not muchimpacted and could be restored shor tly after the cyclonic
impact.
Odisha Demand met
Figure 5-165: Odisha Demand met during 03-Oct 2013 to 17-Oct-2013
Figure 5-166: Talcher PMU Positive sequence voltage, frequency & df/dt plots (17:00 to 18:00 hrs)

112 DECEMBER - 2013POSOCO
Synchrophasors - Initiative in India
Figure 5-167: Positive sequence voltage, frequency plots of Talcher PMU (18:00 to 19:00 hrs)
Figure 5-168: Positive sequence voltage, frequency & df/dt plots of Talcher PMU (19:00 to 20:00 hrs)
Figure 5-169: Positive sequence voltage, frequency & df/dt plots of Talcher PMU (22:00 to 23:00 hrs)
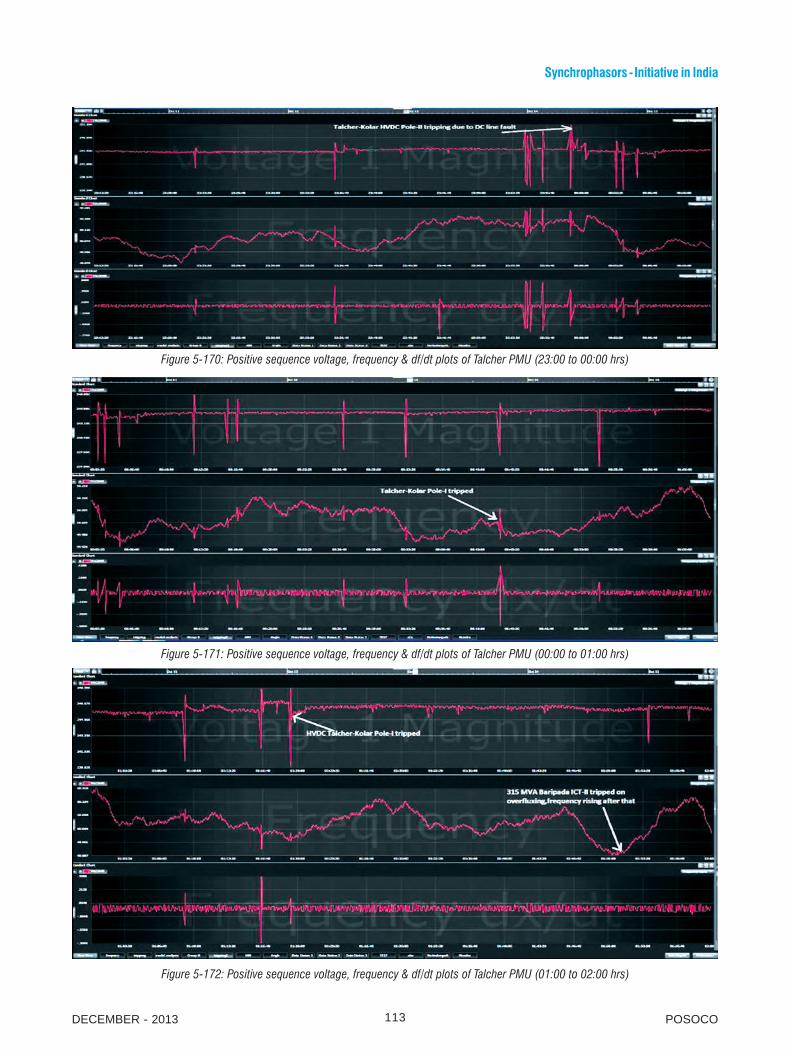
DECEMBER - 2013 POSOCO113
Synchrophasors - Initiative in India
Figure 5-170: Positive sequence voltage, frequency & df/dt plots of Talcher PMU (23:00 to 00:00 hrs)
Figure 5-171: Positive sequence voltage, frequency & df/dt plots of Talcher PMU (00:00 to 01:00 hrs)
Figure 5-172: Positive sequence voltage, frequency & df/dt plots of Talcher PMU (01:00 to 02:00 hrs)

114 DECEMBER - 2013POSOCO
Synchrophasors - Initiative in India
Analysis: Talcher PMU plots were taken on hourly basis. These plots are stamped with various tripping mentioned
with the screen shots which improved situational awareness of the power system. Fig. 5-171 & Fig. 5-172 depicting
tripping of HVDC Talcher-Kolar pole II & Talcher-Kolar Pole I respectively. Fig. 5-172 Talcher PMU plot shows an
increase of frequency from 50.25 HZ to 50.41 HZ and further reduced to 49.57 HZ which depicted an SPS operation
due to tripping of Talcher-Kolar HVDC poles. In fig. 5-172 HVDC Talcher-Kolar Pole II & Pole I charging attempt taken
at 01:09 hrs & 01:16 hrs respectively on 13.10.2013. Finally HVDC Talcher-Kolar bipole got tripped at 01:19 hrs.
Immediately after the tripping of HVDC Talcher-Kolar Bipole, in order to avoid further fall in frequency, SR constituents
were advised to regulate the generation/Load.
5.7.2 Monitoring during fog condition in Northern Region
Date and Time : 17.12.2013, 18.12.2013 (Early Morning hours)
Data Used for Event Analysis : Meerut & Hissar PMU
Overview: During this event PMU data helped in observing important trippings in Northern Region which enabled the
operator to have better situational awareness.
Event Description: Northern Region power system has witnessed several incidents of multiple transmission lines
outage due to transient faults caused by line insulator flashover under dense fog conditions in the region during past
several years. This phenomenon has aggravated in recent years and can be attributed to all around increase in
pollution level. These trippings have the potential to cause blackout / brownout in large parts of the grid for several
hours.
It has been observed that such trippings mostly occur during mid-night and early morning hours (from 03:00 hrs to
08:00 hrs) when the atmospheric temperature is minimum and relative humidity is very high and conditions are
favourable for fog formation. Detailed investigation of the flashovers indicate that under dense foggy atmospheric
conditions, break down strength of the surface of the porcelain insulator reduces due to deposit of pollutant (soil dust,
fertilizer deposits, industrial emissions, fly ash and construction activities, etc) over it. Depending on the proximity to
highways and traffic, the wear of vehicles tyres also produces a slick, tar-like carbon deposit on the insulator surface.
Exhaust from the diesel vehicles also contribute in this phenomenon. In this event 18 lines (of 765 kV, 400 kV & 220
kV) tripped in Northern Region on transient fault due to dense fog conditions. The tripping of lines in midnight raised
an alarming situation and posed a serious threat to Grid Security. These trippings were mainly concentrated in areas
of Punjab, Haryana & western U.P.

DECEMBER - 2013 POSOCO115
Synchrophasors - Initiative in India
Figure 5-173 : Positive Sequence Voltage plots of Meerut and Hissar PMU (20:50-21:50 hrs)
Figure 5-174: Positive Sequence Voltage plots of Meerut and Hissar PMU (01:00-02:00 hrs)

116 DECEMBER - 2013POSOCO
Synchrophasors - Initiative in India
Figure 5-175 : Positive Sequence Voltage plots of Meerut and Hissar PMU (02:15-03:15 hrs)
Figure 5-176: Positive Sequence Voltage plots of Meerut and Bassi PMU (Failed Autoreclose attempts of 400 kV Meerut-Muzaffarnagar)

DECEMBER - 2013 POSOCO117
Synchrophasors - Initiative in India
Figure 5-177: Positive Sequence Voltage plots of Moga and Bassi PMU (successful Autoreclose attempts of 765 kV Moga-Bhiwani)
Analysis: Meerut and Hissar PMU plots were taken on hourly basis. These plots are stamped with various tripping
mentioned with the screen shots which improved situational awareness of the power system. Figure 5-173, Figure 5-
176 depicting tripping.Trippings occurred at Meerut, Muzaffarnagar, Muradnagar, Roorkee, Kaithal and
Pankisubstations.Tripping of lines was being monitored closely and efforts were being made to gradually restore the
system. Several instances of Auto Recloses were also captured in the event. Northern Region constituents were
advised to regulate the generation/Load.

118 DECEMBER - 2013POSOCO
Synchrophasors - Initiative in India

DECEMBER - 2013 POSOCO119
Synchrophasors - Initiative in India
EXPERIENCE ON UTILIZATION OF SYNCHROPHASOR TECHNOLOGY
Synchrophasor data has come out as an effective tool both for monitoring the grid in real time and for post event
analysis in offline mode. Synchrophasor Pilot projects taken up at all five RLDC’s and NLDC have raised visualization
and the level of understanding of the power system at the control centers within few months of its commissioning. It
has also enhanced situational awareness in real-time.
A number of real time events that have been detected using Synchrophasors would have gone un-noticed due to non-
availability of high resolution data in the conventional SCADA system. It has enabled the system operator to take
actions and mitigate the effects in real time. These monitoring are based on the standard visualization provided to the
system operator. The visualizations include voltage and current magnitude, angular difference, oscillation monitoring
engine, frequency and rate of change of frequency. Post event analysis has become effective as synchrophasor data
has given a new dimension to the analyst in finding more about the sequence of event and taking future preventive
action so that such event should be avoided. Currently various analytics module using synchrophasor data are being
developed based on the operator experience such as event detection and classification engine.
This section is on the collective information the user experience on the utilization of the synchrophasor data in
real time as well as offline mode.
6.1. Utilization of Synchrophasor data in real-time
The availability of Synchrophasor data at control center has become first-hand information for a grid operator to
view and analyze any transient phenomenon occurring in the grid. The system operator could also visualize the
cause of the disturbance from the typical ‘signature’ from trending of various power system parameters.The data
from the PMUs is very extensive and effective tools are required to use these data in real time grid operation. At
present there is a large difference in the extent of utilization of synchrophasor in real time when compared with its
offline utilization. The visualization of synchrophasor data at load dispatch center at regional and national level has
helped the operator in finding various issues related to system operation in real time. Some of the events were
monitored based on the following:
1. Excursion in Voltage and Current
2. Voltage and Current pattern
3. Angular separation
4. Oscillation observed in various power system parameters
5. Rate of change of frequency.
6

120 DECEMBER - 2013POSOCO
Synchrophasors - Initiative in India
6.1.1. Events detected in real time:
PMUs have helped in real time monitoring of grid and visualization of events and helped operator in taking real time
action to improve the reliability of the grid.
6.1.1.1. Testing of damping controller at Bhadrawati HVDC B/B station
Figure 6-1 shows the synchrophasor voltage, current and frequency trend recorded during testing of damping
controller at HVDC Bhadrawati sub-station. The event was being monitored at Western region load dispatch center
by observing the synchrophasor units installed in AC bus at HVDC Bhadravati substation. The detailed analysis of
the event is discussed in section 5.5.2. The changes in voltage, current, frequency were being monitored in real
time. The voltage being monitored is of 400 kV Bhadravati Bus and currents are for 400 kV Bhadravati-Raipur #
2&3 respectively. A sudden drop in the current was observed due to tripping of one of the HVDC pole which was
immediately confirmed from the sub-station.
Figure 6-1 : Frequency Controller testing on Bhadrawati HVDC monitored using the Synchrophasor
6.1.1.2. Sudden reduction of generation
Figure 6-2 & 6-3 shows the sudden reduction in generation which were observed for 2 minutes at Unit#3 at Tehri
hydro station in Northern region and for 1 minute in unit#4 at Ramagundam Thermal station in Southern region.
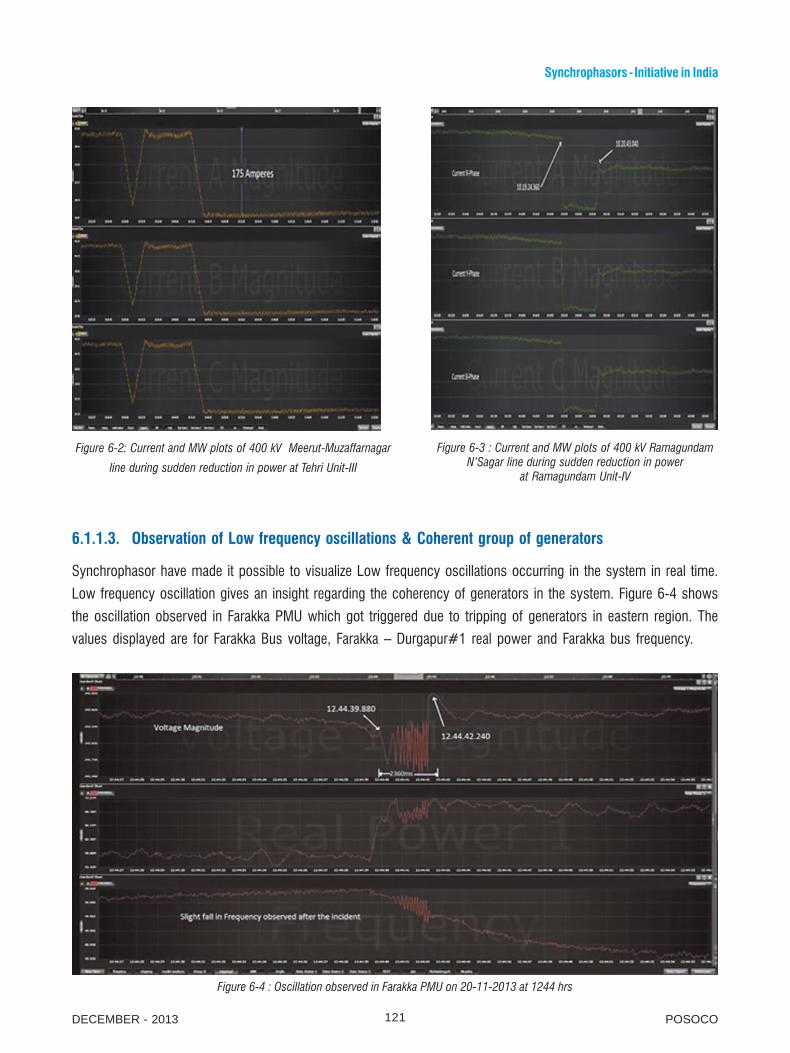
DECEMBER - 2013 POSOCO121
Synchrophasors - Initiative in India
Figure 6-2: Current and MW plots of 400 kV Meerut-Muzaffarnagar
line during sudden reduction in power at Tehri Unit-III
Figure 6-3 : Current and MW plots of 400 kV RamagundamN’Sagar line during sudden reduction in power
at Ramagundam Unit-IV
6.1.1.3. Observation of Low frequency oscillations & Coherent group of generators
Synchrophasor have made it possible to visualize Low frequency oscillations occurring in the system in real time.
Low frequency oscillation gives an insight regarding the coherency of generators in the system. Figure 6-4 shows
the oscillation observed in Farakka PMU which got triggered due to tripping of generators in eastern region. The
values displayed are for Farakka Bus voltage, Farakka – Durgapur#1 real power and Farakka bus frequency.
Figure 6-4 : Oscillation observed in Farakka PMU on 20-11-2013 at 1244 hrs

122 DECEMBER - 2013POSOCO
Synchrophasors - Initiative in India
Figure 6-5 : Oscillation and coherent group of generators observed from various PMU in Western Grid on 28-11-2013
Figure-6-5 shows the coherent group of generators located in eastern and western part of Western Grid. The event
which triggered the swinging of generators in these two areas is yet to be identified but for the system operator
having such a plot in real time gives enough warning that the system is being exposed to inherent stress. This
helps avoiding any nasty ‘surprises’. This plot reflects the stressed condition of lines connecting the eastern and
western part of the western grid.
6.1.1.4. Detection of fault
Figure 6.6 shows the detection of R-phase to earth fault in 220 kV Damoh-Tiamagarh transmission.
Figure 6-6 : Voltage, Current, frequency & rate of change of frequency plots

DECEMBER - 2013 POSOCO123
Synchrophasors - Initiative in India
6.1.1.5. Detection of non-operation of auto reclose in a transmission line
Figure 6-7 and 6.8 shows the 400 kV bus voltage of Bina and Satna substations respectively. It can be observed
that a transient fault had occurred in B-phase of 400 kV Indore-Indore (PG) line-1. The line did not auto-reclose
after 1 sec which is the dead time of auto reclose cycle. The transient fault was followed by tripping of 765 kV
Seoni-Bina on operation of over voltage protection.
Figure 6-7 : 400 kV bus voltage of Bina substation Figure 6-8 : 400 kV Satna bus voltage
6.2. Suggestions for Improved Visualization and Situational Awareness in real time
Synchrophasor Technology has facilitated the system operators in better situational awareness in real time grid
operation and offline post facto analysis. Although low lying fruits of Synchrophasor technology have been extracted
in different ways, still there is a big scope for improvements in the field of visualization and situational awareness.
At present some basic challenges are being faced by system operators are base lining of the system parameters,
automatic event triggering based on the set parameters and alarming etc. In this section a broad overview of all
the challenges being faced is presented.
6.2.1. Base lining of Voltage and Current plots for different voltage levels
Presently the Synchrophasors units have been installed mostly at 400kV buses at various EHV grid stations and
two units at 765 kV & 132 kV voltage level. The simultaneous visualization of all voltage levels in the same trend
chart may not be able to visualize the event properly. At present visualization of voltage magnitudes of different
voltage levels may not be more useful due to large difference in voltage levels. These voltage level on same plot
will not reflect any disturbances at lower kV voltage.

124 DECEMBER - 2013POSOCO
Synchrophasors - Initiative in India
Figure 6-9 : Voltage of 132 kV and 400 kV Bus on actual scale
Figure 6-10 : Voltage of 132 kV and 400 kV Buses on p.u. scale.
Figure 6-9 & 6-10 depict the need for normalized voltage based visualization. The dynamics or switching events
observed in the lower voltage level will not be clear as the amplitude will not be reflected due to linear scaling as
shown in Figure 6-9. However when plotted on per unit (p.u.) scale as shown in Figure 6-10, the dynamics in 132
kV level can also be observed with same severity as observed at 400kV level. This helps in finding out the
sensitivity of any change in the system.
With rapidly upgrading Indian power system where in the near future a huge backbone of 765 kV network is
expected and with the planned addition of many more PMUs, with few on 765 kV level, accurate and prompt
visualization of all these different voltage level PMUs need to addressed.

DECEMBER - 2013 POSOCO125
Synchrophasors - Initiative in India
Similar to voltage visualization, a similar problem is expected with the current visualization scales wherein a high
value of current of any one monitored feeder may cause the scale to become quite high resulting in hiding the
sensitivity on lines having lower current level. The same can be solved by either selecting different MVA base for
different voltage level or having logarithmic plots.
Figure 6-11 : Visualization of measured currents for three different voltage level lines.
Figure 6-11 depicts a case where three circuits currents which are on three different voltage level. It can be easily
observed that the effect of any event can be visualized only on the feeder having a higher value of current. To
resolve this, current need to be represented in per unit equivalent. In order to address the issue, there is a need to
establish a base MVA value for all the voltage levels. Figure-6-12 shows the currents in per unit (p.u.), where
Base MVA for 400 kV is assumed as 500 MVA and for 132 kV as 20 MVA.
Figure 6-12 : Visualization of measured currents for three different lines in p.u.

126 DECEMBER - 2013POSOCO
Synchrophasors - Initiative in India
Another way may be visualizing the measured current on logarithmic scale. Figure 6-13 shows the plots of current
in logarithmic scale.
Figure 6-13 : Visualization of measured currents for three different circuits on a logarithmic scale.
6.2.2. Base lining of Angular difference between two distinct nodes
The essence of PMU measurement is the simultaneous angular difference between distinct nodes in the grid.
Angle measurements are relatively new in practice, the larger the phase angle difference between the source and
sink, the greater the power flow between those points. Greater phase angle differences imply larger static stress
across that interface; larger stress could move the grid closer to instability.Currently Real time Angle difference is
calculated at PDC and being displayed to real time operator.
Figure 6-14 : Angular visualization available at operator console

DECEMBER - 2013 POSOCO127
Synchrophasors - Initiative in India
Figure 6-14 shows the angular difference plot which is available at operator console. There is a need for base
lining of angular information so as to identify the alert state of operation based on angular separation. The angular
difference between various corridors varies based on the different events occurring in the system. PMUs pairs
need to be base lined which will help in defining the upper and lower limit for monitoring of these angles during
normal operation. This will act as a real tool for system operator to monitor the system stress.
By looking at the angular variation for three NR buses (Agra, Meerut & Moga) with respect to an ER bus (Farakka)
on a typical day, a trend is seen emerging. As is seen in Fig 6-15, during off-peak hours a high angular separation
is seen and during the morning and evening peak the angular separation reduces due to more hydro generation
availablity in NR.
Figure 6-15 : Angular variation of NR with respect to ER
This implies that in the cases of Inter regional flows (and flow across critical flow gates), it is possible to set limits
for the angles under different contingencies beyond which the system can be treated as ALERT mode and suitable
action can be initiated by the system operator.
6.2.3. Alarms based on event detection in real time
Synchrophasor has given ability to system operator to look into the event with information having milli-second accuracy.
For analyzing this fast rate data, better visualization is necessary for the system operator to sense any transient
phenomenon occurring in the system. For instance, the reaction time required for an operator to see changes in
phasor measurements and to take action may be too long. Additionally, the change may be so slight that it may be
unnoticeable to the naked eye. For these reasons, it is more efficient to automatically detect system events and
disturbances using synchronized phasor measurements.

128 DECEMBER - 2013POSOCO
Synchrophasors - Initiative in India
The main challenge in feasibility of real-time automatic analytics and detection of power system disturbances is
interpreting huge chunk of synchronized data. Data mining tools to detect and classify events is the need of the
hour and research in this area is in progress throughout the globe. Automation in terms of developing simple
analysis tools would minimize the effor t put in manual tasks. Various alarms need to be integrated with the
visualization for the operator based on real time signal processing of the synchrophasor data. These alarms
should be based on the threshold provided by the operator for event detection. At present only the alarms have
been developed which get triggered when the parameters crosses the set threshold values.
The alarms can be based either on the set limit violation of any parameter or based on event detection. There is a
need to define certain threshold based on empirical observation of actual system events and evaluation of the
characteristics which a signal would exhibit before or during a disturbance. At the end of section 5.1 several type
of event have been characterized and based on this event detection algorithm and tools are under development to
identify different types of event.Few criteria which have been used for event detection application are as follows:
1. Voltage angle deviation: Voltage Angle deviation of ± 2-10o change over 1 second (25 samples)
will capture any tripping in the system or any changes in the load – generation balance. Voltage
angle is one of the main signal which helps in visualizing the stress on the grid. The analysis of
such angular deviation will provide insight into stability or alert signal for the operator.
2. Change in instantaneous voltage magnitude: If the voltage magnitude changes by 4-10 kV in
adjacent sample (4-10 kV in 1 sample) then this indicate transient conditions like faults, tripping,
etc.
3. Change in Voltage Magnitude for larger duration: This is to capture the faults which are present
for more than 200 ms. So a voltage change of 4-10 kV for 10 samples indicate clearing of fault by
back up protections.
4. Instantaneous Frequency: It is one of the best indicators to locate fault in the system. If frequency
varies by more than 0.4 Hz in adjacent sample then this could give an indication of the transient
condition like tripping or fault in the system.
5. Frequency change: If the frequency change in one second is around 0.1 Hz then this could give
an indication of load – generation imbalance in system.
6. Rate of change of frequency: A sudden change in ROCOF i.e. 0.02 Hz/sec in either direction
indicates an event in the system.
6.3. Visualization Improvement for faster event detection
It is essential to have good situational awareness through advance visualisation techniques. In such direction a
contour map for depicting the voltage profile throughout the Western Region is being developed in offline is shown
at Figure 6-16.

DECEMBER - 2013 POSOCO129
Synchrophasors - Initiative in India
Figure 6-16 : Contour visualization of WR MAP using PMU and SCADA data
A similar map is available at NLDC/NRLDC too which displays Voltage contour throughout the country with angular
difference between key nodes is shown in Figure-6-17. With the gradual increase in number of PMUs the contour
shall be fine-tuned with more data being made available giving a system operator an overview of the voltages and
angular difference across the country.
Figure 6-17 : Contour visualization of all India with angular differences

130 DECEMBER - 2013POSOCO
Synchrophasors - Initiative in India
6.4. Utilization of Synchrophasor data in offline mode
Synchrophasor data has given a lot of insight into the system dynamics as discussed in the chapter 5. The
utilization of synchrophasor data in offline mode can be summarized in following points:
1. Fault classification
2. Fault recovery time and delayed clearance of fault
3. Characterization of fault nature based on DR and Synchrophasor data
4. Fault location
5. Low frequency oscillation and its analysis
6. Coherent group formation in the Indian grid
7. Benchmarking, validation and fine-tuning of dynamic models in system.
8. Validation of offline and EMS results with Synchrophasor measurements and EMS.
Along with the above availability of synchrophasor data has helped in faster analysis of the events. Synchrophasor
has helped in characterization of event as the time synchronized data can be aligned to find the root cause of the
event.

DECEMBER - 2013 POSOCO131
Synchrophasors - Initiative in India
The experience with Synchrophasors projects execution has been a roller coaster ride full of exhilaration and
excitement. Though the Synchrophasors data is presently available only from a few locations in the Indian grid,
yet it has dramatically raised visualization and the level of understanding of the power system at the control centre
within few months of its commissioning. It has now become an indispensable part of the data resource available
at the load dispatch centre. The three years of experience has revealed several challenges that need to be
addressed during the full-fledged project. These challenges and difficulties have been discussed below:
7.1. Implementation Experience in a Multi-vendor System
The Synchrophasor technology around the globe has moved from its nascent stage to the next level where it is
experimented with different protocols, is being discussed for a better Phasor estimation and communication. Thus
it can be said that synchrophasor technology is still evolving. Further, advanced applications based on Phasors at
a central level vis-à-vis a distributed architecture is also being discussed aggressively.
The C37.118 standard has upgraded from 2005 version to 2011 and the guide for PDC has been published i.e.
IEEEC37.244-2013 during the last couple of years. Equivalent IEC standard i.e, IEC 61850-90-5, is also picking up the
market and with most of the Substation Automation systems moving in this direction, this standard is expected to gain
more momentum. It is under these situations the Integration with Multi-Vendor system supporting different protocols
becomes a challenge. Typical vendor distribution in pilot projects is given in Table 7-1.
Table 7-1 Vendor Distribution
7.1.1 Multi-vendor PMU integration
A major challenge in using PMU data for application development is IEEE C37.118 data formats, supporting both
integer and floating point. Different vendors are using different algorithms for phasor estimation and reporting with
SI. No. PMU Vendor Quantity Installed
1 National Instruments 11
2 Siemens 10
3 SEL 39
IMPLEMENTATION EXPERIENCE & INTEGRATION CHALLENGES
7

132 DECEMBER - 2013POSOCO
Synchrophasors - Initiative in India
in the IEEE C37.118 standards provision. In turn precision in number of digits after decimal points used by different
vendors for df/dt is in the range of three to ten. POSOCO has installed PMUs from multiple vendors. An analysis of
the rate of change of frequency (ROCOF), as observed, from three different vendors is illustrated in Fig 7-1. It can
be observed that all three have different level of accuracy and making alarms based on such different behaviour is
difficult, unless these values are normalized to a common scale.
Figure 7-1 : ROCOF from three different PMU vendors located in Western Regional Grid for tripping in Eastern Regional Grid
With multiple utilities installing PMUs for a large scale system (1800 PMUs as envisaged in proposed Unified Real
Time Dynamic System Monitoring in India), it is evident that implementer would have to source products from different
vendors/suppliers. Unlike with protective relays, where different relay products with different operating characteristics
and performance are sometimes preferred to avoid the same-mode failure, a PMU system requires a consistent
performance from all installed PMU units to meet its application requirements. For example, measured power
angles from different units must be within allowed error tolerance. Otherwise, the performance of the system will
be affected.
7.1.2. PMU Sync Errors and Troubleshooting
It has been observed that a good number of PMUs are out of synchronization for various reasons like GPS Antenna
position misalignment, non-visibility of satellites and problems in GPS receivers.
When the PMU has lost synchronization lock with GPS time source, it is required to detect a loss of time synchronization
that would cause the TVE to exceed the allowable limit, or within 1 min of an actual loss of synchronization, whichever
is less (IEEE Std C37.118.2-2011[B42], 4.5). In this case a flag in the PMU data output (STAT word Bit 13) should be
asser ted until the data acquisition is resynchronized to the required accuracy level. When the PDC detects a
synchronization error in the incoming PMU input, then the PDC reads bit 13 of status word of incoming PMU Data
frame, if it is set to 1, PDC displays incoming PMU as Sync Error.

DECEMBER - 2013 POSOCO133
Synchrophasors - Initiative in India
In addition to the STAT word Bit 13, IEEE Std C37.118.1-2011[B41] specifies further signals intended to describe
the time quality of the synchronization source. Each of the PMU output messages defined (Configurations 1, 2,
and 3, Header, and Data) have a time quality field of 4 bits. This field allows the PMU to state the quality of the
time source from clock locked, 1 ns to 10s uncertainty (estimated worst-case error), or clock failure. Figure 7-2
illustrates theclock unlocked with four time quality bits.
Figure 7-2 : Time Quality Flags in C37.118 Data Frame showing an unlocked clock status
Also, the Data message STAT word has two bits to indicate the length of time the clock has been unlocked. This
varies from locked to unlocked for more than 10s, 100s, or more than 1000s.
Even though a clock may be unlocked for over 1000s, a quality oscillator is able to maintain better that 1 μs accuracy
over this period. This field indicates the uncertainty in the measurement time at the time of measurement and
indicates time quality at all times, both when locked and unlocked, and unknown when the clock is starting up.
Further, In below Figure 7-3 , Time Synchronization status word bit is set 1, indicating the synchronisation is lost,
however the unlocked time is best quality, and the time quality flags also showing clock is locked. This may be
due to improper time stamping in the PMU or GPS problem.
Figure 7-3 : Time Quality Flags in C37.118 Configuration frame showing normal, locked clock

134 DECEMBER - 2013POSOCO
Synchrophasors - Initiative in India
7.1.3. Sync Error due to Fraction of Second Drift
An interesting case found in one of the PMUs is a constant drift in the Fraction of Second (FOS), due to which the
quality of data was getting invalid. The time base in this PMU was noted to be 1000000 (as per relevant standards).
If a PMU is configured to report at 25 samples per second, then the FOS in C37.118 data frame is expected to
arrive as 0, 40000, 80000,….., 920000, 960000 (25 values for 1 second). But the time that was coming from the
PMU were 30, 40030, 80030, 920030, 960030 that was having a constant drift of 30 microseconds.
The PDC installed at WRLDC works in data sorting based on absolute time and expects an accuracy of 1 microsecond
or better in the PMU time stamps. If the accuracy in time stamp is less that 1 microsecond, the corresponding PMU
data will be flagged as “Data sort on arrival” instead of “Data sort on time stamp”, as per IEEE C37.118 standard. This
might be what has led to tagging the quality of the data arrived to be flagged as Unreliable.
Figure 7-4 : Fraction of Second (FOS) drift
7.2. Communication Challenges in Integrating PMU
It is an established fact that success of any WAMS implementation is primarily dependent on availability of a
dedicated and reliable communication system. The problem is compounded due the fact that PMUs are required
to be installed at generating stations & sub stations at remote locations and geographically spread over large
area. During the execution of pilot PMU projects in India at RLDCs/NLDC, establishing communication links/
channels between geographically remote substations having PMUs and regional control centers has been the
biggest challenge. Due to this, location of some of the PMUs either have to be re-located to different substation
having communication feasibility or use of corporate Wide Area Network where communication path is shared
with other applications thus compromising data reliability/latency. Data update rate adopted for all the projects is
25 samples per second (40 msec per sample). For such high rate of reporting, in general, dedicated fibre channel
are required for reliability of real time data. However, at some locations, implementation of fibre optic network is
still going on. Hence, PMUs at such locations have to be relocated to the sub stations where fibre optic
communication is already available or third party leased lines have been taken to integrate PMUs.

DECEMBER - 2013 POSOCO135
Synchrophasors - Initiative in India
However, major part of Synchrophasor data is being received at Regional Control Centers is through communication
system installed under ULDC scheme in year 2000. At that time, PDH technology was used for communication
equipment. In PDH, channels are separated by using hardware which uses G.703 and V.35 interface. But present
equipment used for networking system uses Ethernet interface. To solve this mismatch in interfaces, converters from
G.703 to Ethernet and V.35 to Ethernet converters were used. These converters require external power supply. Due to
this, though the converters could solve the issue of different interfaces but became a weak point due to need of
external power supply. In most of EHV substations Reliable Auxiliary power supply is available at 220V DC level, but
most of media converters are available at 230V AC or 48V DC Supply, in order to use reliable power supply to
interfacing equipment small universal supply adapters were used in most of the locations. Typically Universal Power
Supply modules having a capability to take inputs voltage range of 24VDC to 350VDC and 100 to 240V AC.
In some locations Optical to Ethernet converters are used, wherever the third party leased lines only the feasible
option.
Table 7-2 : Average Latency observed with different communication channels and PMUs
Each PMU Vendor is having different number of signals to be transmitted to PDC, an average latency of 600-700
ms latency is observed over 64 kbps channel, minimum of 512 kbps channels are recommended for PMU data
transmission.
Vendor 5 is has 1.5-1.6 times of latency over same communication channel due to latest version of Protocol
implementation for almost same number of signals.
Adequacy of communication infrastructure is one of the biggest challenges in executing the Synchrophasors
projects. In India, the availability of communication between the EHV substation and the Regional Load Despatch
Centre was one of the deciding factors for identifying the location of PMUs. Wherever Fiber optic links are available,
they have been used to transfer PMU’s data from respective station to control centre. Optical Fibre is being laid on
existing transmission lines all over the India to facilitate communication from EHV substations to Control centers
for Synchrophasors, Special protection schemes implementation, Grid Security Exper t System (GSES)
implementation, RTU data and voice connectivity etc.
1. Vendor 1 12 8 2 22 625 350 300
2. Vendor 2 6 32 2 40 - - 50
3. Vendor 3 12 - 2 14 - - 50
4. Vendor 4 18 4 2 24 - - 160
5. Vendor 5 13 3 2 18 - - 150
Phasor Analog Frequency Total 64 kbps 512 kbps 2 Mbps
Composition of Signals
Average Latency on
Communication Bandwidth
(in ms)SI. No. PMU Make

136 DECEMBER - 2013POSOCO
Synchrophasors - Initiative in India
7.3. Synchrophasor data in Multi Cast
In existing projects, Synchrophasor streams are being transmitted using unicast packets to pre-defined receivers,
i.e Control Center PDCs as in these cases PMUs are reporting to only one PDC. However, in cases where PMU
measurement data is also required to transmitted to multiple PDCs simultaneously, unicast may over load
communication channels with multiple packets of same data. For such scenarios, multicasting is more suitable
method of data transmission.
Hence, it is preferable that PMUs also support multicasting. However, multicasting may also be implemented
through networking devices described in [B19] or Synchrophasors stream splitter given in [W6] in case PMUs are
not able to send data in multicast mode.
7.4. Challenges in handling of Synchrophasor data
Microsoft excel is used for plotting and analysing of Synchrophasor data. The versatility of XLS/XLSX would allow
it to continue to be the end applications for management presentation / analysis for some time. There is a
limitation with excel that only 35000 data points can be plotted. There is a need for data normalization to reduce
the data content over raw data extracted from Historians to screen the interested event data, robust algorithms are
needed to screen event data, after that, plotting of data to describe the event for analysis purpose.
7.4.1. Reliability of Synchrophasor data
Even with a healthy PMU in place, there had been instances of data losses due to communication link issues
between PMU and control center and synchronization loss at PMU, due to communication loss there is complete
loss of data from one or more location or sometimes intermittent data loss for shorter period, for example, an
application running all repor ted Synchrophasor data like OMS and Angle monitoring applications need to detect
such scenario, and have the capability to either discard un reliable data or handle these situations to avoid wrong
interpretations from results.
Sometimes data from PMU is being reported even after synchronization loss and time stamp error drift is more
than 1 minute, in such cases Application need to have intelligence to handle such type of situations
There are also some PMUs that don’t report any data to control center if its GPS synchronization is lost. The
common practice adopted at the PDC is to re-transmit the last received data, rather than making the measurement
null, to Historian and Visualisation. But then, the data needs to be read along with its quality information (13 Bit
STAT word) for its validity.
The invalid data handling is also tricky in case of applications like OMS, where this is treated as a discontinuous
signal and in turn making the solution not converging for an entire window length. Again, this is also posing a
challenge in Angle unwrapping calculations where if the invalid data is not handled would give rise to a wrapped
signal, giving an impression of Oscillation or Grid event.
7.4.2. Computation Challenges at Historian within 20ms
It is expected that, historian shall be able to do calculation on incoming data stream from PDC(phasor, analog
measurements), currently PMU to PDC reporting rate is 25 frames/seconds, so every 40 msec, there is a new
measurement available at PDC or historian , hence before arrival of next measurement, calculation output should

DECEMBER - 2013 POSOCO137
Synchrophasors - Initiative in India
be available to visualization or other application. So it is recommended to have execution speed better than 20
msec or better for 25 frames/second and for 50 frames/second system execution speed should be 10 msec or
better.
7.4.3. Calculation of Sequence Components at PDC level
Some of PMUs are reporting only three phase voltages and currents and some of the PMUS are reporting three
phases as well as positive sequence quantities but not reporting other sequence components to PDC. One of the
option is to calculate sequence components of voltages and currents at PDC. As long as number of PMUs are not
more, this option is acceptable but with deployment of large number of PMUs calculating components at PMUs
will be preferable option.
7.4.4. Synchrophasor Angle Measurement Unwrapping
In order to assess stress on grid, anglular difference between two distinct nodes is used. In similar lines angle
measurements from PMUs is used for monitoring grid condition. Synchrophasor supporting IEEE C37.118 standards
are reported over a range of ±π radians or ±180 degrees, hence they “wrap” at the end of the range limits which
is a discontinuous signal and need to be addressed properly. These discontinuities result in faulty analysis of grid
instabilities, especially when considering the angle difference between two separate locations on the grid.
Subtraction of two discontinuous angles results in a discontinuous signal.
If weare dealing with 4-5 PMUs Calculation of Angle difference using commonly available unwrapping algorithms
can solve the problem, but the problem becomes significant while dealing with missing data frames and handling
few thousands of PMUs. To illustrate the issue two distinct nodes are selected, and their reported absolute angles
are shown in Figure 7-5, and their angular difference is shown in Figure 7-6. Here the angle is converted in
between 0-360 degrees, still it need to be unwrapped using commonly available unwrapping algorithms.
Figure 7-5 : Korba and Bhadrawati reported Angles as per C37.118 Standard

138 DECEMBER - 2013POSOCO
Synchrophasors - Initiative in India
Figure 7-6 : Angle difference between Korba and Bhadrawati
Figure 7-7 : Reported Angles plot for missing
Bhadrawati PMU data
Figure 7-8 : Angular difference between Bhadrawati and KSTPS
in case of Missing Bhadrwati PMU data
It happens quite often that, sometime PDC may not receive some frames for various reasons, during this time
angle difference between two distinct nodes is illustrated below:

DECEMBER - 2013 POSOCO139
Synchrophasors - Initiative in India
Figure 7-9 : Reported Angles plot for missing
KSTPS PMU data
Figure 7-10 : Angular difference between Bhadrawati and KSTPS in
case of Missing KSTPS PMU data
Figure 7-7 and Figure 7-9 shows the reported angles from Bhadrawati and KSPTS (Korba) PMUs, and it can also
be seen that a few samples are missed in Bhadrawati PMU in first case and in later case, few samples are
missed in KSTPS PMU. Figure 7-8 and Figure 7-10 shows the Bhadrawati and KSPTS (Korba) PMUs angular
difference for the both cases. In both cases the error in angle difference is observed around 7.6º. Even though
there is no event, the angular difference plot shows an angle dip, it can create a wrong interpretation.
There were quite few attempts to solve the issue. The algorithms suggested in [B8] takes advantage of sequentially
measured data;it adds the difference from previous sample in the present unwrapped angle to create a smooth
angle stream which continuously increases or decreases depending upon frequency.
Solving the wrapping problem opens a wide scope for real time PMU applications while being helpful in offline
analysis as well as it is expected that, unwrapping algorithms should run in real time.
Further, selecting reference angle for calculation of relative angles is a complex issue; however following approaches
can be deployed based on operator experience:
1) Calculate Center of Inertia (COI), take nearby PMU as reference Angle.
2) Check df/dt for typical event; take nearby PMU Angle having highest df/dt PMU as reference.
3) Take generation rich area PMU angle as reference and calculate other load rich area relative angles.
7.4.5. Availability of APIs for Custom Application Development
The interfaces used by executable application modules to activate and interact with functions in the other executable
application modules are commonly referred as Application Program Interface (API), APIs to Historians and PDC are
required to develop custom availability reports for typical PMUs and stastical analysis on PMU Synchronization
loss and PMU communication availability etc.

140 DECEMBER - 2013POSOCO
Synchrophasors - Initiative in India
Currently C #, C++, .Net and Java API are very much required to develop applications related to event detection,
event analysis, Detection of cascading events and other third party applications.
PDC and Historian vendors needs to provide stable API so that external will have the freedom to change the
internals of the application without effecting interfaces to external applications.
7.5. Phasor Data recording and Exchange in COMTRADE Format
Nowadays it is widely accepted by many utilities all over world to exchange the synchrophasor data in COMTRADE
format for typical events. Schema for using the COMTRADE format for recorded phasor data is already released
its second edition by IEEE standards in association with IEC called as IEC 60255-24/IEEE C37.111 -2013[B43].
It still a question faced by utilities , whether PDC should generate recorded phasor data for power system events
or Historian should provide retrieval data for typical event from Historian.
However, it is advised have capability at both historian and PDC, to have run time event detection and localisation
algorithms.
7.6. Phasor Event Data Exchange in COMFEDE Standard.
IEEE Std C37.239-2010[B40] COMFEDE standard in India is not yet popularly adopted in Substation Automation
Systems, extension of this standard to Phasor domain is very much essential. This standard defines a common
format for the data files needed for the exchange of various types of power network events in order to facilitate
event data integration and analysis from multiple data sources and from different vendor devices. Since each
source of data may use a different proprietary format, a common data format is necessary to facilitate the
exchange of such data between applications. This will facilitate the use of proprietary data in diverse applications
and allow users of one proprietary system to use digital data from other systems. COMFEDE format is able to, at
least, hold the information related to:
1) Sequence of events (SOE) reports.
2) Fault summary reports.
3) IEC 61850 Logs.
Information from these reports can be stored natively in the COMFEDE format or be translated via a tool into
COMFEDE format.
Synchrophasors data are being widely reported in IEEE C37.118 standard, it is very much essential to combine
phasor data along with SOE and Fault summary reports and IEC 61850 logs to reconstruct timeline following a
disturbance event. Many PDCs and historians need to have a capability to either to export are retrive the phasor
data in COMFEDE format to facilitate event data integration and analysis from multiple data sources.
7.7. Compliance to IEEE C37.244 PDC Guide
IEEE Std C37.244.2013 [B45] guide has defined PDC functions to applied on Synchrophasor streams. Although all
functions are not mandatory and are voluntary in nature, it is advised to have following minimum functions to be
made compulsory for the national wide consistency implementation of WAMS technology.
1) Data aggregation

DECEMBER - 2013 POSOCO141
Synchrophasors - Initiative in India
2) Data forwarding
3) Data transfer protocol support and conversion
4) Data format and coordinate conversion
5) Data latency calculation
6) Reporting rate conversion (downsizing)
7) Output data buffering
8) Configuration
9) Phase and magnitude adjustment
10) Performance monitoring
11) Redundant and duplicate data handling
12) Data re-transmission request
13) Cyber security
7.8. Synchrophasor Data Storage related Experience and Challenges
Huge volume of synchrophasor data gets accumulated at the control center over a period of time. Presently installed
historian storage capacity is in the range of 4Tb to 10 Tb at control center level. With more number of PMUs being
planned to be installed, the capacity of historian needs to be increased and proper mechanisms need to be devised for
storage of data. Big data and data centre type technologies may need further feasibility studies are required. However
event based data storage is still a considerable option till permanent discontinuation of Existing SCADA.
Synchrophasor technology is dealing with time series data with high reporting rate. The amounts of data pushed
into database every second and to be retrieved are high. Historian software provides an algorithm for compressed
storage and quick retrieval of stored past values. One of the main challenges is on the resolution needed for the
retrieved data. For a data window of 5 mins, millisecond resolution of data would be desirable. For a data window
more than an hour, the data resolution may be in seconds and zooming in would require a resolution to be changed
to millisecond range.
7.9. Integration with SCADA State Estimator/EMS challenges
Some of the important characters of WAMS compared with SCADA are:
� High precision
� Synchronized measurements
� Fast rates of data communications;
� New metering types including bus voltage angle measurements and branch current angle
measurements.
In order to get the advantages of WAMS data for good visualization and State Estimation in SCADA, it is necessary
to integrate the same. Possibly till the complete SCADA is migrated to PMU measurements, these two technologies
will mutually co-exist. There are various ways to integrate WAMS data to SCADA and some are as under:
� ICCP

142 DECEMBER - 2013POSOCO
Synchrophasors - Initiative in India
� IEC 690870-5-104
� FTP of Text/COMTRADE file
� Integration at Database level
Integration at ICCP level and IEC 104 level would fall under standards whereas FTP and DB integration are crude
method non-standards compromising security considerations. Also integration through latter method can be
considered for temporary period. For integration of WAMS with SCADA at ICCP or IEC 104 level. Modified IEC 104
integration through site adaption can be done with IEC 104 to IEC 101 conversion where SCADA supports only IEC
101.
Some of the important considerations related to Integration over IEC 60870-5-101/104 with SCADA:
1) Down sampling of phasor data to a level compatible to SCADA, i.e. Two (2) to ten (10) seconds
(Indian conditions – as per the present specifications).
2) Normally Analog measured are reported without time tag, but it can also report with time tag supported
in new gateways, if PDC supports Analog points with Time tag output, Time stamp mismatch problem
can be addressed.
3) Angle measurements from PMU are reported in -180 degrees to +180 degrees, need careful addressing
while down sampling in PDC and using in SCADA based applications.
4) The SCADA applications like State Estimation should be capable for phasor measurement input as
initial condition during solution
7.10. Challenges in Usage of Synchrophasor event Analysis
The availability of Synchrophasor data improves the ability to perform root cause analysis and enables thorough
and accelerate after-the-fact analysis following the various events that require reporting or operational analysis.
The resolution of the synchrophasor data is sufficient to reveal the details of dynamic system response and the
synchronized time stamps enable the easy determination of the true sequence of events.
Zero sequence, and negative sequence voltages and currents, phase angle differences between different nodes
etc. can be made available. But visualization of the available data is of key importance here, since to the real-time
operator only the necessary data must be made available. Remaining data may be useful for post-event analysis.
For example, in case of North-Eastern region, where PMUs are located at nodes at different voltage levels (400kV,
220kV, 132 kV), it is felt necessary to view the voltage data as L-L voltage on p.u. so that in case of any event or
in general it is possible to superimpose voltages of all the nodes which enhance visibility in real-time as also
enable faster post-event analysis. Choosing to view the voltage data as Line-Line instead of phase voltage is
preferred since in the Grid Code, the limiting voltages are specified in terms of L-L voltages and operators are more
accustomed to seeing voltages in those terms. Again limits are specified in p.u. of voltages based on different
voltage levels.

DECEMBER - 2013 POSOCO143
Synchrophasors - Initiative in India
With sixty numbers of PMUs installed throughout the country, the visibility of the power system state at sub-
seconds level has enhanced to a fair level. As discussed throughout this report in the case studies of using data
form the PMUs, it is evident that PMUs are extremely helpful in understanding the system to a greater detail
especially during transient and stressed conditions. During the implementation of these pilot projects, in a number
of cases the availability of communication has remained a constraint in locating the PMUs at desirable locations.
PMUs located at following strategic locations might have given more inner view of grid behavior:-
1. Wind energy generation complex.
2. At generating stations.
In view of the likely synchronisation of SR Grid with NEW grid forming it to be a synchronously operated system
of 125GW at present level, it is extremely necessary to develop high amount of confidence in synchrophasor
technology. Some of the immediate area of applications could be as under
� Real time monitoring of Frequency Response Characteristics (FRC) of control area
� Control Area load and Generation Dynamics for effective modelling in offline simulations
� Net Drawls/injections calculations of Control area using PMU data
� Enhancing State estimation with PMU input as initial condition
� Oscillation Monitoring
� Load angle gradient across the entire country
As more synchrophasor measurements are available, the applications can also be extended to the area of Operational
Planning and to have a realistic assessment of the transfer capability of the network.
For ensuring safety, security of Indian power system and steps towards intelligent and self-healing grid deployment
of WAMS technology has been envisaged in report of working group of power for 11th plan.
Power Grid Corporation of India Ltd. is coming up with a full fledge project named”Unified Real Time Dynamic
State Measurement” (URTDSM), for deployment of WAMS technology over wide scale in Indian EHV Grid, which
WAY FORWARD
8

144 DECEMBER - 2013POSOCO
Synchrophasors - Initiative in India
involves installation of PMUs, PDCs and fibre optic communication infrastructure. Project aims for installing about
1700 nos Phasor Measurement Units and 30 Phasor Data Concentrators in Indian power system. It is envisaged
to develop following analytics under URTDSM in association with IIT, Mumbai:-
1. Line Parameter Estimation
2. Online vulnerability Analysis of Distance relays
3. Linear/Dynamic State Estimator
4. CT/CVT Calibration
5. Supervision of Zone-3 distance protection
6. Control Schemes for improving system security
DECEMBER - 2013 POSOCO145
Synchrophasors - Initiative in India
Published Papers
R1. S.K. Soonee, S.R. Narasimhan, R.K. Porwal, S. Kumar, R.Kumar, V. Pandey, “Application of phase anglemeasurement for real time security monitoring of Indian Electric Power System- An Experience”, SC C2-107, CIGRE Session 2008, August 2008
R2. V. K. Agrawal, P. K. Agarwal, R. K. Porwal, R. Kumar, Vivek Pandey T. Muthukumar, Suruchi Jain "OperationalExperience of the First Synchrophasor Pilot Project in Northern India" CBIP- 5th International Conference onPower System Protection and Automation, 6-9 Dec 2010.
R3. P. Pentayya, Abhimanyu Gartia, Samit Kurmar Saha, Rajkumar A, Chandan Kumar, “Synchrophasor basedApplication Development in Western India”, In IEEE PES ISGT Asia Conference, Bangalore, 10-13 November2013.
R4. T. Muthu Kumar, P. R. Raghuram, S.P. Kumar, “Operational experience of synchrophasor pilot project inSouthern India”, IEEE PES ISGT Asia 2013, Bangalore, India 10-13 November 2013
R5. P. Pentayya, Abhimanyu Gar tia, Rajkumar A, Chandan Kumar, “Comparative Analysis of Low FrequencyOscillations Using PMU and CPR-D Relay- A Case Study”, In 5th International Conference of Power andEnergy System Conference, Kathmandu, 28-30 October 2013.
R6. P. Pentayya, Abhimanyu Gartia, Pushpa Seshadri, Rajkumar A, Chandan Kumar, “Low Frequency Oscillationsin Indian Grid”, In 5th International Conference of Power and Energy System Conference, Kathmandu, 28-30October 2013.
R7. R. K. Pandey, P. Pentayya, Abhimanyu Gar tia, Rajkumar A, Chandan Kumar, “Operational ReliabilityEnhancement with PMUs in Indian Power Network”, In IEEE CATCON Conference, Kolkata, 6-8 December2013.
R8. P. Pentayya, P. Mukhophadhaya, S. Banerjee, M K Thakur, “A simple and efficient approach for optimalplacement of PMU” in NPSC 2010
R9. Rajiv Kumar Porwal, V. V. Sharma, Vivek Pandey, T. Muthukumar "Application of Synchrophasors in GridEvent Analysis" CIGRE Symposium, Lisbon, April 2013.
R10. V.K. Agrawal, P.K. Agarwal and Harish Rathour “Application of PMU Based Information in Improving thePerformance of Indian Electricity Grid” 17th NATIONAL POWER SYSTEMS CONFERENCE, 12th-14th December,2012, Department of Electrical Engineering, Indian Institute of Technology (BHU), Varanasi – 221005 UttarPradesh, INDIA.
R11. V.K. Agrawal, P.K. Agarwal and Rajesh Kumar “Experience of Commissioning of PMUs Pilot Project in theNorthern Region of India” 16th NATIONAL POWER SYSTEMS CONFERENCE, 15th-17th DECEMBER, 2010,Department of Electrical Engineering, University., College of Engineering., Osmania University, Hyderabad,A.P, INDIA.
R12. V.K. Agrawal and P.K. Agarwal “Challenges faced and Lessons Learnt in Implementation of firstSynchrophasors Project in the Northern India”, GRIDTECH 2011, 19-20 April 2011, New Delhi, India.
R13. V.K. Agrawal and P.K. Agarwal “Synchrophasors Measurements A Paradigm Shift in Power System SCADA”IEEE SPONSORED NATIONAL CONFERENCE ON ELECTRICAL POWER & ENERGY SYSTEMS, 20/21-Sep-2013, Ghaziabad, India
REFERENCES

146 DECEMBER - 2013POSOCO
Synchrophasors - Initiative in India
R14. V.K. Agrawal, P.K. Agarwal and Harish Rathour “Experience of Up-scaling and Integration of Regional LevelSynchrophasors Pilot Projects to a National Level Project” GIGRE SC D2 Colloquium, 13-15 November2013Mysore, Karnataka, INDIA.
Bibliography
B1. A. G. Phadke, J. S.Thorpe, “Synchronized phasor measurements and their applications”, Springer 2008.
B2. A.G. Phadke, “Synchronized phasor measurement in power system”, Computer Applications in Power,IEEE, vol. 6, no. 2, pp. 10,15, April 1993.
B3. Y Hu, D.Novosel,”Challenges in Implementing a Large Scale PMU System”, International conference onPower System Technology, 2006.
B4. Midwest ISO, “Midwest ISO PMU Placement Approach Whitepaper”, Version 1, 18 August 2010
B5. K. Narendra, T. Weekes, “Phasor Measurement Unit Communication Experience in a Utility Environment”,Conference on Power Systems Winnipeg, Cigre, Oct 19-21, 2008.
B6. Midwest ISO, “Synchrophasor Integration into Planning and operational reliability processes”, Version 1, 12March 2010.
B7. Tate J. E., Overbye T. J., “Line outage detection using phasor angle”, IEEE transactions on power systems,2007.
B8. OSIsoft, LLC (San Leandro, CA), “Unwrapping Angles from Phasor Measurement Units”, US Patent:US8497512B1 June 2013.
B9. J. C-H. Peng, N. C. Nair, “Effects of sampling in monitoring Power System Oscillations using Online PronyAnalysis”, Australasian Universities Power Engineering Conference, 2008.
B10. M. Balabin, K. Gorner, Y. Li, I. Naumkin and C. Rehtanz, “Evaluation of PMU performance during transients”.Power System Technology (POWERCON), 2010
B11. Khatib A. R., Nuqui R.F, Ingram M.R, Phadke A. G, “Real time estimation of security of voltage collapseusing synchronized phasor measurements”, IEEE Power Engineering Society General Meeting, 2004 vol.,no., pp 582-588
B12. Chenine M, Vanfretti L, Bengtsso S, Nordstroum L, “Implementation of an experimental wide-area monitoringplatform for development of synchronized phasor measurement applications,” Power and Energy SocietyGeneral Meeting, 2011 IEEE , vol., no., pp.1,8, 24-29 July 2011
B13. N. Strath, “Islanding Detection in Power Systems”, Dissertation, Lund University, Sweden
B14. A. Mazloomzadeh, M. Cintuglu, O. Mohammed, “Islanding detection using synchronized measurements insmart micro grids”, IEEE 2013.
B15. US-Canada Power system outage task force, final report on August 14 2003 black out in USA and Canada,pp -104-107, April 2004.
B16. Gardner R, “A wide area perspective on power system operation and dynamics,” PhD dissertation, VirginiaPolytechnic Institute, 28 March 2008.
B17. Venkatasubramanian Mani, Liu Xing, Liu Guoping, Zhang Qiang and Sherwood Michael, “Overview ofwide area stability monitoring algorithms in power systems using Synchrophasors”, 2011 American controlconference, San Fransisco, June 29-July 01, 2011.
B18. G. Liu, J. Quintero, Venkatsubramanian M.V, “Oscillation monitoring system based on wide areasynchrophasors in Power systems”, Bulk Power System Dynamics and Control – VII. Revitalizing OperationalReliability, 2007 iREP Symposium, pp. 1,13 ,19-24 Aug. 2007.

DECEMBER - 2013 POSOCO147
Synchrophasors - Initiative in India
B19. Cisco, “PMU networking in IP multicast”, 2012 [Available at www.cisco.com/en/US/prod/collateral/routers/ps10967/ps10977/whitepaper_c11-697665.pdf]
B20. Jaime De La Ree, Virgilio Centono, James S. Thorp, A. G. Phadke, “Synchronized Phasor MeasurementApplications in Power Systems”, IEEE Transactions on Smart Grid, vol 1, no. 1 pp. 20-27, June 2010.
B21. D. Novosel, Khoi V., “Benefits of PMU technology for various applications”, International council on LargeElectric Systems – Cigre 7th symposium on Power System Management 2006.
B22. T. Hashiguchi, H. Ukai, Y. Mitani, M. Watanabe, O. Saeki and M. Hojo, “Power System Dynamic Performancemeasured by Phasor Measurement Unit”, IEEE PowerTech 2007.
B23. I. Kamwa, R. Grondin, “PMU configuration for system dynamic performance measurement in large multiareapower systems”, Power Systems, IEEE transactions, vol 17, no. 2, pp. 385,394, May 2002.
B24. Verma S.C, Nakachi Y, Wazawa Y, Kosaka Y, Kobayashi T, Omata K, Takabayashi Y, “Short circuit currentestimation using PMU measurements during normal load variation,” Innovative Smart Grid Technologies(ISGT Europe), 2012 3rd IEEE PES International Conference and Exhibition, vol. 1, no. 5, pp 14-17, Oct. 2012.
B25. Q Jiang, X Li, B Wong, “PMU based fault location using voltage measurements in large transmissionnetworks,” Power Delivery, IEEE Transactions, vol. 27, no. 3, pp 1644,1652, July 2012.
B26. T. Overbye, C. DeMarco, M Venkatasubramanian, “Using PMU data to increase situational awareness”,PSERC Publication, Sept. 2010.
B27. Powalko M, Komarnicki P, Rudion K, Styczynski Z, “Improving power system observability with PMUs”,Science and Technology, 2011 EPU-CRIS International Conference, Vol. 1, no. 6, pp. 16, Nov 2011.
B28. Adamiak Mark, Premerlani William and Kasztenny Dr. Bogdan “Synchrophasors: Definition, Measurement,and Application”, retrived on December 11,2013 [Avaliable at www.gedigitalenergy.com/SmartGrid/Sep06/Synchrophasors_Paper.pdf]
B29. California ISO Five Year Synchrophasor Plan - 2011, retrieved on December,11,2013, [Available atwww.caiso.com/Documents/FiveYearSynchrophasorPlan.pf]
B30. K. Seethalekshmi, Singh S.N. and Srivastava S.C. Wide-Area Protection and Control: Present Status andKey Challenges , National Power Systems Conference (NPSC), 2008.
B31. Lawrence Berkeley National Laboratory, Real Time Grid Reliability Management, California EnergyCommission, 2008, retrived on December 11, 2013 [Avaliable at www.energy.ca.gov/2008publications/CEC-500-2008-049/CEC-500-2008-049.PDF]
B32. Mills-Price Michael and Flerchinger Bill, Smart Anti-Islanding Using Synchrophasor Measurements, successstory, NASPI, retrived on December 11, 2013 [Avaliable at www.naspi.org/File.aspx?fileID=572]
B33. NASPI Guidelines for Siting Phasor Measurement Units. NASPI, June- 2011, retrived on December 11,2013.[Avaliable at www.diva- portal.org/smash/get/diva2:482602/FULLTEXT01.pdf]
B34. NERC Real-Time Application of Synchrophasors for Improving Reliability - 2010, retrived on December11,2013 [www.nerc.com/docs/oc/rapirtf/RAPIR%20final%20101710.pdf].
B35. Parashar Manu, Dyer Jim and Bilke Terry, “EIPP Real-Time Dynamics Monitoring System”, retrived onDecember 11,2013 [Avaliable at www.certs.lbl.gov/pdf/eipp-r t.pdf]
B36. Prasertwong K, Mithulananthan N. and Thakur D, “Understanding low frequency oscillation in powersystems”, IJEEE, UK, June 2009

148 DECEMBER - 2013POSOCO
Synchrophasors - Initiative in India
B37. David G. Hart, David Uy, Vasudev Gharpure, Damir Novosel, Daniel Karlsson, Mehmet Kaba, “PMUs – Anew approach to power network monitoring”, [White paper] retrived on December 11,2013 [Avaliable atwww.05.abb.com]
B38. IEEE Std C37.118™-2005, IEEE Standard for Synchrophasors for Power Systems.
B39. IEEE Std C37.242™-2013, Guide for Synchronization, Calibration, Testing, and Installation of PhasorMeasurement Units (PMU) for Power System Protection and Control.
B40. IEEE Std C37.239™-2010, IEEE Standard for Common Format for Event Data Exchange (COMFEDE) forPower Systems.
B41. IEEE Std C37.118.1™-2011, IEEE Standard for Synchrophasor Measurements for Power Systems.
B42. IEEE Std C37.118.2™-2011, IEEE Standard for Synchrophasor Data Transfer for Power Systems.
B43. IEC 60255-24/IEEE C37.111 -2013, IEEE/IEC Measuring relays and protection equipment Part 24: Commonformat for transient data exchange (COMTRADE) for power systems.
B44. IEEE Std C37.238™-2011, IEEE Standard Profile for Use of IEEE 1588™ Precision Time Protocol in PowerSystem Applications
B45. IEEE Std C37.244™-2013, IEEE Guide for Phasor Data Concentrator Requirements for Power SystemProtection, Control, and Monitoring.
B46. J. Machowski, J.W. Bialek, J.R. Bumby, “Power system dynamics-stability and control”, October, 2008,second edition, wiley publication.
B47. Siemens, PSS/E user manual, version 32.0
B48. P. Kundur, “Power system stability and control”, McGraw Hill Inc., New York, 1994.
Websites
1. “Tennessee Valley Authority (TVA) free PMU connection Tester Program”,www.phasors.pnl.gov
2. www.naspi.org
3. “Washington State University GridStat”, www.gridstat.net/trac
4. “Electricity Infrastructure Operations Center (EIOC)”, www.eioc.pnnl.gov/research/synchrophasor.stm
5. “Bonneville Power Administration Transmission, Services”, www.transmission.bpa.gov/orgs/opi/system_news/index.shtm
6. “Grid Protection Alliance”, www.gridprotectionalliance.org
7. www.selinc.com/synchrophasors
8. www.gedigitalenergy.com/multilin/index.htm
9. http://www.macrodyneusa.com
10. LinkedIn Group: Synchrophasors and WAMS
11. Yahoo Group: group.yahoo.com/group/RLDCs_SystemOperation_India

DECEMBER - 2013 POSOCO149
Synchrophasors - Initiative in India
S.No. Description Details pertaining to
ERLDC NERLDC NRLDC SRLDC WRLDC NLDC
1 Make/Model Siemens Phase-I: SEL-700G NI cRIO SEL-700GSyprotec SEL-700G SEL 451, -90246MD85 SEL-487B
Phase-II:SEL-700G
2 AC current input 1A 1A 1A 1A 1A 1A
3 AC Voltage input 110V 110V 110V 110V 110V 110V
4 Measurement Voltage & Voltage & Voltage & Voltage & Voltage & Voltage &Current Current Current Current Current Current
phasors, phasors, phasors, phasors, phasors, phasors,MW,MVAR, MW,MVAR, MW,MVAR, MW,MVAR, MW,MVAR, MW,MVAR,Frequency Frequency Frequency Frequency Frequency Frequencyand df/dt and df/dt and df/dt and df/dt and df/dt and df/dt
5 Sequence Positive Positive Positive Positive, Positive, Positivevoltages and sequence sequence sequence negative negative sequencecurrents of voltage of voltage of voltage and zero and zero of voltage
and current and current and current sequence sequence and currentof voltage of voltages,
and current positivesequenceof current
6 Number of 8 8 8 8 8 8digital inputs
7 No. of Analog 1 set of 1 set of 2 set of 1 set of 1 set of 2 set ofinputs 3 Ph 3 Ph 3 Ph 3 Ph 3 Ph 3 Ph
Voltages & Voltages Voltages Voltages Voltages Voltages2 sets of & 2 sets of & 2 sets of & 2 sets of & 2 sets & 2 sets
3 Ph 3 Ph 3 Ph 3 Ph of 3 Ph of 3 PhCurrents Currents Currents Currents Currents Currents
8 Communication C37.118- C37.118- C37.118- C37.118- C37.118- C37.118-Protocol 2005 2005 2005 2005 2011 2005
9 Data repor ting 10/25/50 10/25/50 10/25/50 10/25/50 10/25/50 10/25/50rate (Frames/Sec)
10 Time reference IRIG-B IRIG-B IRIG-B IRIG-B MCX IRIG-Bsource interface
of GPS
11 GPS accuracy ±1 μs ±100 ns ±100 ns ±100 ns ±100ns ±100 ns
12 Local data storage No No No No No No
Appendix-ATable A-1: Phasor Measurement Unit Details

150 DECEMBER - 2013POSOCO
Synchrophasors - Initiative in India
Table A-2: Phasor Data Concentrator System
Sl.No Description ERLDC NERLDC NRLDC SRLDC WRLDC NLDC
1 Make/Model Siguard- SEL-5073 SEL-3378 SEL-5073 Kalkitech SEL-5073PDP ver3.0 SYNC 4000
2 No. of PMUs that 100 200 20 200 100 200can be integratedto PDC
3 Data Transmission TCP&UDP TCP&UDP TCP&UDP TCP&UDP TCP&UDP TCP&UDP(TCP or UDP)
4 Protocol C37.118- C37.118- C37.118- C37.118- C37.118- C37.118-Suppor ted 2005 and 2005 2005 2005 2005 and 2005
2011 2011
5 Other Protocols ICCP,OPC IEC-60870- IEC-60870- IEC-60870- IEC-60870- IEC-60870-Suppor ted 5-104,OPC 5-104 5-104 5-104,OPC 5-104,OPC
6 Facility to Monitor Yes Yes Yes Yes Yes YesInput and outputTraffic
7 Support of dual No Yes Yes Yes No Yescommunicationchannels forindividual PMU
Table A-3: Historian Details
Sr.No Description ERLDC NERLDC NRLDC SRLDC WRLDC NLDC
1 Make/Model Siemens SEL-5078-2 SEL-5078-2 SEL-5078-2 eDna, SEL-Sigurad Instep 5078-2
PDP
2 Web services No Yes Yes Yes Yes Yessupport
3 Data storage 1.8 TB 2 TB 2TB 1.6 TB 4 TB 9 TBCapacity
4 History Data Yes Yes Yes Yes Yes Yesvisualization
5 Availability of APIs No No No No C, .NET & NoVB
6 Data protocol IEEE IEEE IEEE IEEE IEEE IEEEfrom PDC C37.118 C37.118 C37.118 C37.118 C37.118 C37.118
7 Alarms Yes Yes Yes Yes Yes Yes
8 Play back feature Yes No No No Yes No

DECEMBER - 2013 POSOCO151
Synchrophasors - Initiative in India
Table A-4: Visualization Features
Sl. No. Description ERLDC NERLDC NRLDC SRLDC WRLDC NLDC
1 Frequency Yes Yes Yes Yes Yes Yes
2 Rate of change Yes Yes Yes Yes Yes Yesof frequency
3 Delta Frequency Yes Yes Yes Yes Yes Yes
4 Phasor magnitude Yes Yes Yes Yes Yes Yes
5 Phasor angle Yes Yes Yes Yes Yes Yes
6 Sequence Yes Yes Yes Yes Yes Yescomponents
7 Angular separation Yes Yes Yes Yes Yes Yes
8 MW Yes Yes Yes Yes Yes Yes
9 MVAR Yes Yes Yes Yes Yes Yes
10 Digital Yes Yes Yes Yes Yes Yes
11 Modal analysis information Yes Yes Yes Yes Yes Yes
12 Screen Refresh rate 1sec 1sec 1sec 1sec 1sec 1sec
13 Historical/Real Time Trend Yes Yes Yes Yes Yes Yes
14 Trend period 10 sec to 1 sec to 1 sec to 1 sec to 1 sec to 1 sec to1 month 1 year 1 year 1 year 1 year 1 year
15 Contour plots Yes Yes Yes Yes No Yes
16 LFO modes trending Yes Yes Yes Yes Yes Yes
17 Event/Alarm Display Yes Yes Yes Yes Yes Yes
18 Polar Chart Yes Yes Yes Yes Yes Yes
Visualizationof parameter

152 DECEMBER - 2013POSOCO
Synchrophasors - Initiative in India
Appendix-BTable B-1: Location of PMUs in Eastern region
SEL
S.No. PMU Location PMU Make Current Feeders Voltage Measuredconnected to PMU by PMU
1 Binaguri Purnea-3, Tala-3 Bus Selection PT
2 Biharshariff Balia-1, Kahalgaon-1 Bus Selection PT
3 Patna Balia-1, Barh -1 Bus Selection PT
4 Rourkela Raigarh-2 , Talcher-1 Bus Selection PT
5 Jeypore Bolangir, Indravati Bus Selection PT
6 Durgapur Maithon-2, Jamshedpur Bus Selection PT
7 Rengali Talcher-2, Baripada Bus Selection PT
8 Sasaram Biharsharif-2 , Allahabad Bus Selection PT
9 Farakka Durgapur-1, Kahalgaon-1 400 kV Bus 1, 2
10 Talcher Rengali-2, Meramundalli-1 400 kV Bus 1, 2
11 Ranchi Sipat-1, Maithon-1 400 kV Bus 1, 2
12 Jamshedpur Rourkela-1, Maithon-1 400 kV Bus 1, 2
Siemens
Table B-2: Location of PMUs in North Eastern Region
S.No. PMU Location PMU Make Current Feeders Voltage Measuredconnected to PMU by PMU
1 Balipara Misa-1, Bongaigaon-1 400 kV Bus-1
2 Sarusajai Samaguri-2, Agia-2 220 kV Bus-1
3 Badarpur Kumarghat , Khleirihat 132 kV Kumarghat,Khleirihat CVT
4 Imphal Dimapur, Loktak-2 132 kV Main Bus PT
5 Agar tala B J Nagar-1, RCNagar-1 132 kV Main Bus PT
6 NEHU Sumer, Khlerihat 132 kV Main Bus PT
7 Bongaigaon Balipara-1, Balipara-2 400 kV Balipara-2 Line CVT
8 Misa Dimapur-2, Kopili-2 220 kV Dimapur-2 &Kopili-2 CVT
SEL

DECEMBER - 2013 POSOCO153
Synchrophasors - Initiative in India
Table B-3: Location of PMUs in Northern region
S.No. PMU Location PMU Make Current Feeders Voltage Measuredconnected to PMU by PMU
1 DADRI Inter-connecting lines Dadri 400 kV Bus 1AC and HVDC S/s
2 KANPUR Ballabgarh-1 400 kV Bus 1
3 MOGA Bhiwadi-1 400 kV Bus 1
4 AGRA - 400 kV Bus-1, 2
5 VINDHYACHAL Singrauli-1 400 kV Bus 1
6 HISSAR Bawana 400 kV Bus-1, 2
7 BASSI Agra-1, Agra-2 400 kV Bus-1, 2
8 K'WANGTOO Abdullapur 1, Abdullapur2 400 kV Bus-1, 2
9 KISHENPUR Moga-1, Moga-2 400 kV Bus-1, 2
10 MEERUT Muzaffarnagar, Koteshwar 400 kV Bus-1, 2
11 BALIA HVDC interconnector(AC) I,II 400 kV Bus-1, 2
12 RIHAND HVDC interconnector(AC) I,II 400 kV Bus-1, 2
13 BAWANA Mandola, Mahendragarh 400 kV Bus-1, 2
14 MOHINDERGARH Dhanonda 1, Bhiwani 1 400 kV Bus-1, 2
SEL
Table B-4: Location of PMUs in Southern region
S.No. PMU Location PMU Make Current Feeders Voltage Measuredconnected to PMU by PMU
1 Ramagundam Nagarjunsagar-2, Chandrapur-1 400 kV Bus-1
2 Somanhalli Salem, Gooty 400 kV Bus-1
3 Narendra Guttur-1,Kaiga-1 400 kV Bus-1
4 Vijaywada Nellore-1,VTPS-1 400 kV Bus-1
5 Sriperumbadur Chitoor, Kolar 400 kV Bus-1
6 Trichur Palakkad-1,Bus-1 extension CT 400 kV Bus-1
7 Gazuwaka Vijaywada,Shimhadri-1 400 kV Bus-1, 2(South Bus)
8 Gooty Raichur-1,Nelmangala 400 kV Bus-1, 2
9 Tirunlelveli Trivendrum-1,Udumalpet-2 400 kV Bus-1, 2
10 Kolar Hoody-1,Sriperumbdur 400 kV Bus-1, 2
SEL
SIEMENS
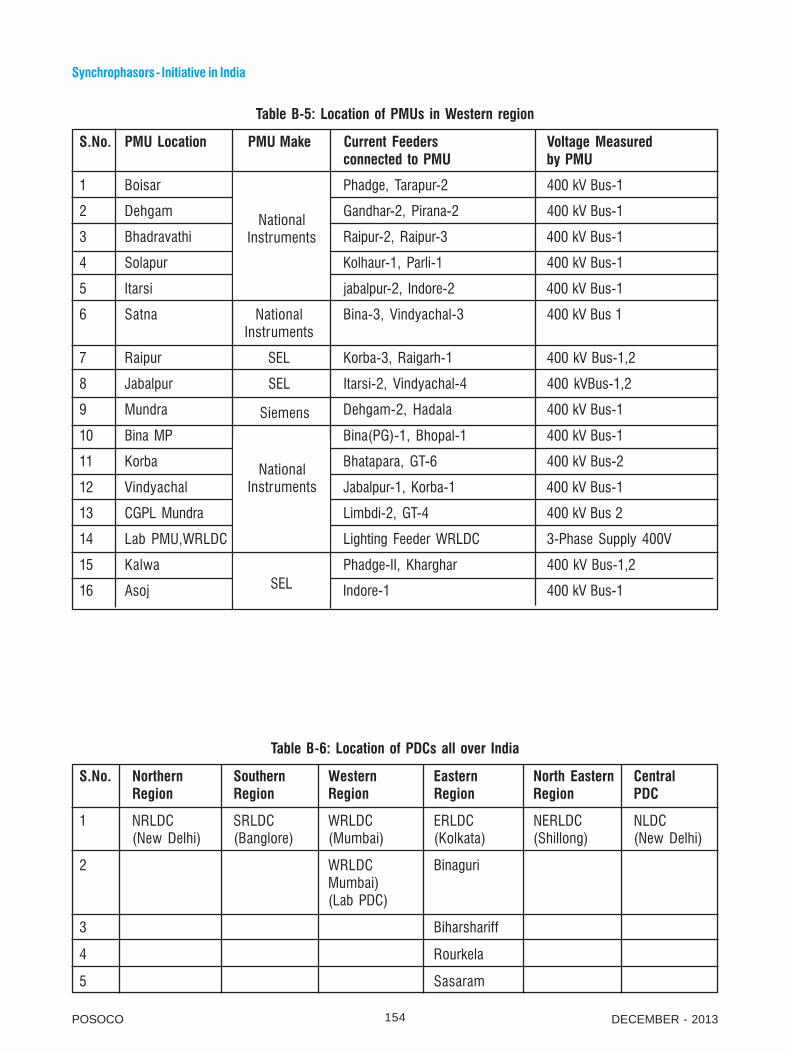
154 DECEMBER - 2013POSOCO
Synchrophasors - Initiative in India
Table B-5: Location of PMUs in Western region
S.No. PMU Location PMU Make Current Feeders Voltage Measuredconnected to PMU by PMU
1 Boisar Phadge, Tarapur-2 400 kV Bus-1
2 Dehgam Gandhar-2, Pirana-2 400 kV Bus-1
3 Bhadravathi Raipur-2, Raipur-3 400 kV Bus-1
4 Solapur Kolhaur-1, Parli-1 400 kV Bus-1
5 Itarsi jabalpur-2, Indore-2 400 kV Bus-1
6 Satna National Bina-3, Vindyachal-3 400 kV Bus 1Instruments
7 Raipur SEL Korba-3, Raigarh-1 400 kV Bus-1,2
8 Jabalpur SEL Itarsi-2, Vindyachal-4 400 kVBus-1,2
9 Mundra Dehgam-2, Hadala 400 kV Bus-1
10 Bina MP Bina(PG)-1, Bhopal-1 400 kV Bus-1
11 Korba Bhatapara, GT-6 400 kV Bus-2
12 Vindyachal Jabalpur-1, Korba-1 400 kV Bus-1
13 CGPL Mundra Limbdi-2, GT-4 400 kV Bus 2
14 Lab PMU,WRLDC Lighting Feeder WRLDC 3-Phase Supply 400V
15 Kalwa Phadge-II, Kharghar 400 kV Bus-1,2
16 Asoj Indore-1 400 kV Bus-1
Table B-6: Location of PDCs all over India
S.No. Northern Southern Western Eastern North Eastern CentralRegion Region Region Region Region PDC
1 NRLDC SRLDC WRLDC ERLDC NERLDC NLDC(New Delhi) (Banglore) (Mumbai) (Kolkata) (Shillong) (New Delhi)
2 WRLDC BinaguriMumbai)(Lab PDC)
3 Biharshariff
4 Rourkela
5 Sasaram
NationalInstruments
SEL
Siemens
NationalInstruments

DECEMBER - 2013 POSOCO155
Synchrophasors - Initiative in India
Appendix-C
C.1 Operator Console Displays
Various customized displays have been made for providing situational awareness on the grid at each
control center. These displays include frequency, df/dt, sequence voltages, sequence currents, phase
voltages, phase currents and low frequency modes existing in the system.
C.1.1 Western Region
The displays for system operator were developed in eDna Historian visualization software. Customized
displays such as trend displays and dial displays are developed for system operators. The Figures (C1-C5)
shown below are used as visualizations for system operators. Visualization has the option to check the
reliability of the data received from PMUs. Below the visualization trend there is an option to retrieve the
current and historical data immediately. The retrieved data can be expor ted to excel sheet for fur ther
analysis. In visualizations positive sequence, negative sequence and zero sequences of voltages and
currents can be seen to detect what type of fault has been happened. There is also a trend in visualizations
displaying individual signals measured by individual PMU. In OMS visualization the dominant low frequency
mode can be seen. The dominant modes frequency and damping ratios are displayed in this window. The
df/dt trend and frequency trend helps in detecting events happened in the system.
Figure C-1 : Geographical locations of PMUs and Communication status

156 DECEMBER - 2013POSOCO
Synchrophasors - Initiative in India
Figure C-2 : Visualization of Frequency at WRLDC
Figure C-3 : Visualization of Voltage magnitudes at WRLDC

DECEMBER - 2013 POSOCO157
Synchrophasors - Initiative in India
Figure C-4 : Visualization of Current magnitudes at WRLDC
Figure C-5 : Visualization of low frequency dominant modes

158 DECEMBER - 2013POSOCO
Synchrophasors - Initiative in India
C.1.2 North Eastern Region
Situational awareness can be improvised by viewing synchronized measurements in real-time. Visualizations
for operator console helps in analyzing data and location of events either in real time or offline. These
visualizations are user configurable and can be exploited for optimized power system analysis. All the
displays are made in historian SEL-5073.
Figure C-6 : Geographical location of PMUs and communication status
Figure C-7 : Visualization of phase angle differences

DECEMBER - 2013 POSOCO159
Synchrophasors - Initiative in India
Figure C-8 : Visualization of system frequency from all PMUs
Figure C-9 : Visualization of voltage magnitudes

160 DECEMBER - 2013POSOCO
Synchrophasors - Initiative in India
Figure C-10 : Visualization of low frequency modes
C.1.3 Eastern Region
The offline/online status of PMUs and PDCs can be seen in Communication UI. In SIGUARD PDP UI, which
is used for observation and analysis, there are following components:
PSS Curve: A curve which shows the status of entire power system being monitored. Siemens has got their
own formula for calculation of this PSS factor, which is mainly based upon the limits defined for measuring
channels like V, I, f.
It is here one can see older time period data, can select a particular time slice and save it to permanent
archives, can simulate changed limiting values, can play the older real time data.
All the other elements like alarm/event, maps, chart, phasors will get displayed according to the time range
selected in PSS curve.
Alarm/Event list: This list shows the alarms/events about limit violations, PMU communication, time sync
error, application events like Islanding, etc.
Map: The map shows an overview of entire power system graphically. The limits violations are displayed as
change of colours, Power swing recognitions or Islanding detection are also displayed as change of colours
(application not yet verified by ERLDC).
Chart: In this area, one can plot any analog/Phasor measurands as well as calculated values. There is a list
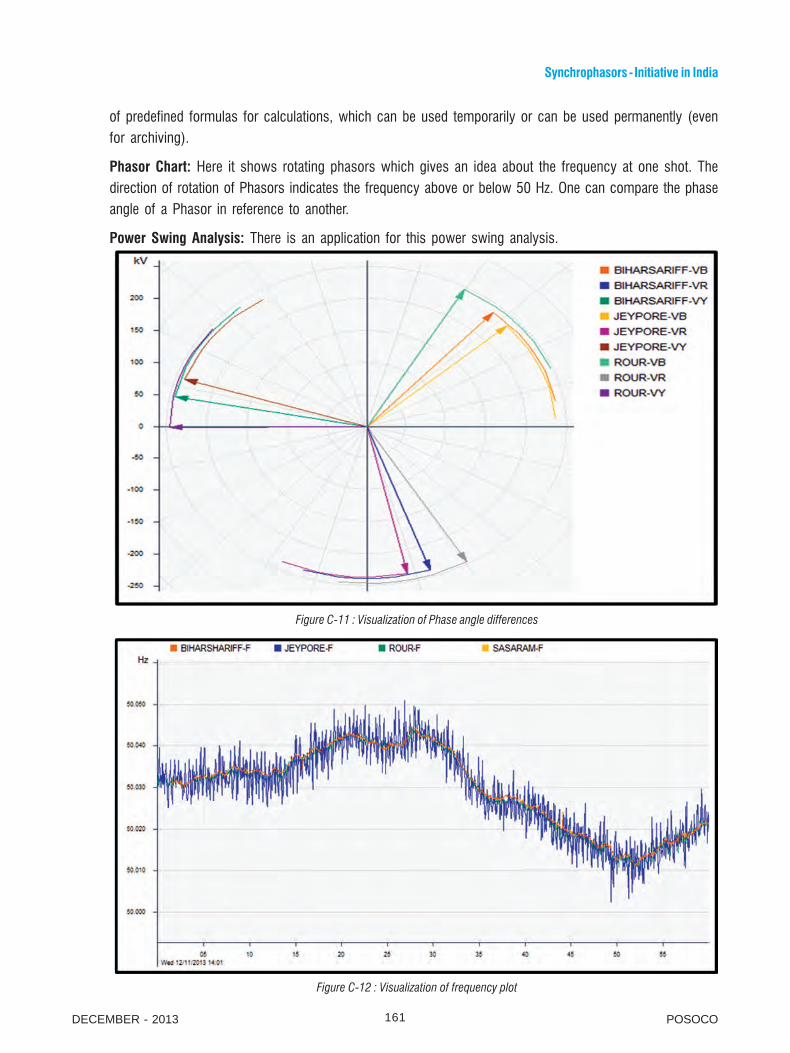
DECEMBER - 2013 POSOCO161
Synchrophasors - Initiative in India
of predefined formulas for calculations, which can be used temporarily or can be used permanently (even
for archiving).
Phasor Chart: Here it shows rotating phasors which gives an idea about the frequency at one shot. The
direction of rotation of Phasors indicates the frequency above or below 50 Hz. One can compare the phase
angle of a Phasor in reference to another.
Power Swing Analysis: There is an application for this power swing analysis.
Figure C-11 : Visualization of Phase angle differences
Figure C-12 : Visualization of frequency plot
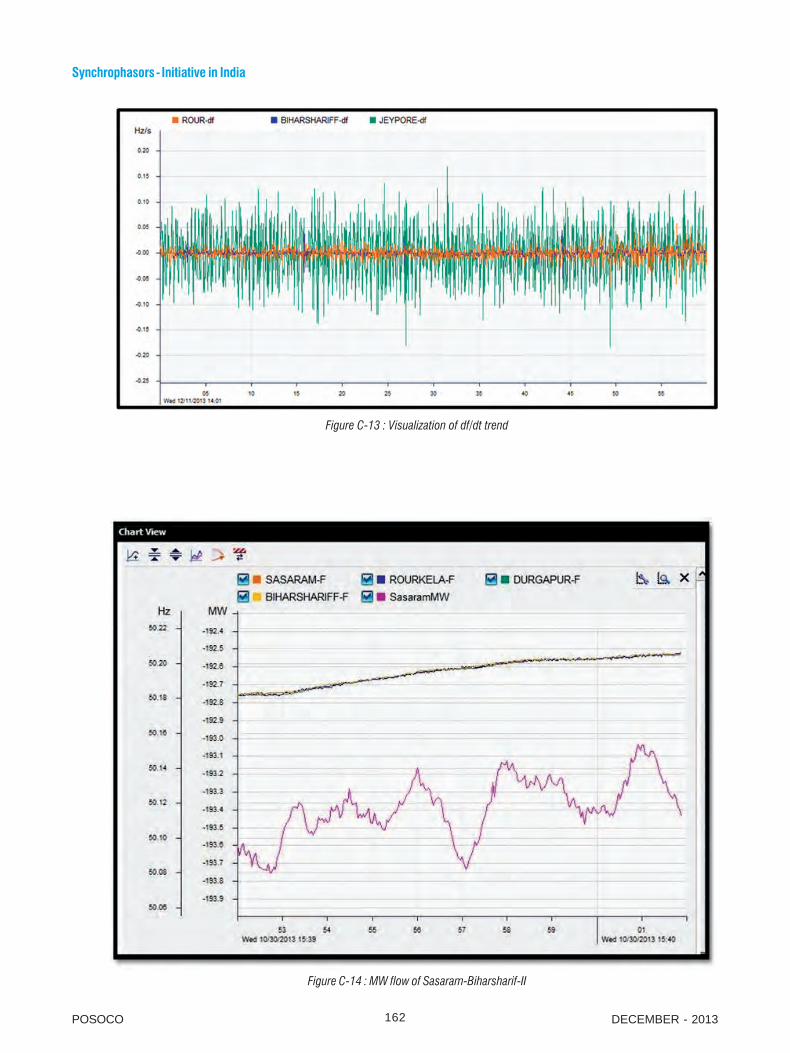
162 DECEMBER - 2013POSOCO
Synchrophasors - Initiative in India
Figure C-13 : Visualization of df/dt trend
Figure C-14 : MW flow of Sasaram-Biharsharif-II

DECEMBER - 2013 POSOCO163
Synchrophasors - Initiative in India
C.1.4 Southern Region
Figure C-15 : Geographical location of PMUs and Communication status
Figure C-16 : Visualization of Angular differences

164 DECEMBER - 2013POSOCO
Synchrophasors - Initiative in India
Figure C-17 : Visualization of frequency
Figure C -18 : Visualization of df/dt

DECEMBER - 2013 POSOCO165
Synchrophasors - Initiative in India
Figure C -19 : Visualization of positive sequence voltage
Figure C-20: Visualization of positive sequence currents

166 DECEMBER - 2013POSOCO
Synchrophasors - Initiative in India
Figure C-21: Visualization of MW flows
Figure C-22: Visualization of MVAR flows

DECEMBER - 2013 POSOCO167
Synchrophasors - Initiative in India
Figure C-23: Visualization of low frequency modes
C.1.5 Northern Region
For ensuring security and reliability of the system angular difference calculations in real time play a vital
role. PMUs can measure phasor angles which can be exploited for calculations of angular differences. The
figures shown below are variety of displays have been used for visualization of system behavior in real
time.
Figure C-24: Visualization of Angular differences

168 DECEMBER - 2013POSOCO
Synchrophasors - Initiative in India
Figure C-25: Visualization of df/dt
Figure C-26: Visualization of Frequency

DECEMBER - 2013 POSOCO169
Synchrophasors - Initiative in India
Appendix-D
D.1 Cost analysis of Synchrophasor Project
The total cost of the pilot projects in all the regions is approximately around 5 to 6 Crores. However, cost ofeach pilot project differs due to the varying quantity of PDC and PMUs. Approximate cost of project in eachregion is given in Table D-1.
Table D-1: Project cost implication for each region
Sr. No. Details pertaining to Project cost in Rs.(Approx.)
1 WRLDC 72 Lakhs
2 ERLDC 120 Lakhs
3 SRLDC 68 Lakhs
4 NERLDC 101 Lakhs
5 NRLDC 95 Lakhs
6 NLDC 115 Lakhs
The major portion of the project cost is attributed to PMUs. Incremental PMU (per PMU unit) cost is in therange of around 3-8 % of the individual pilot project is due to variations in Voltage and Current channels. Thecost of communication and other logistics costs are excluded in the calculation. For all the pilot projects theportion of cost towards PMUs (excluding other logistics) is approximately 42% of total projects cost.
Per unit cost of PDC, in general, is in the range of 3-10% of the total cost in individual pilot project. As thenumber of PDCs is less, the PDC cost is around 11% of the total project cost. The absolute cost mayremain more or less constant as the number of PDCs is not likely to increase. Historian and the Visualization(H&V) cost is around 3-22 % of the total cost in individual pilot project. Percentage costwise distribution ofvarious regional pilot projects is given below :
Figure D-1: Eastern Region pilot projectDistribution of costs
Figure D-2: North Eastern Region pilot projectDistribution of costs
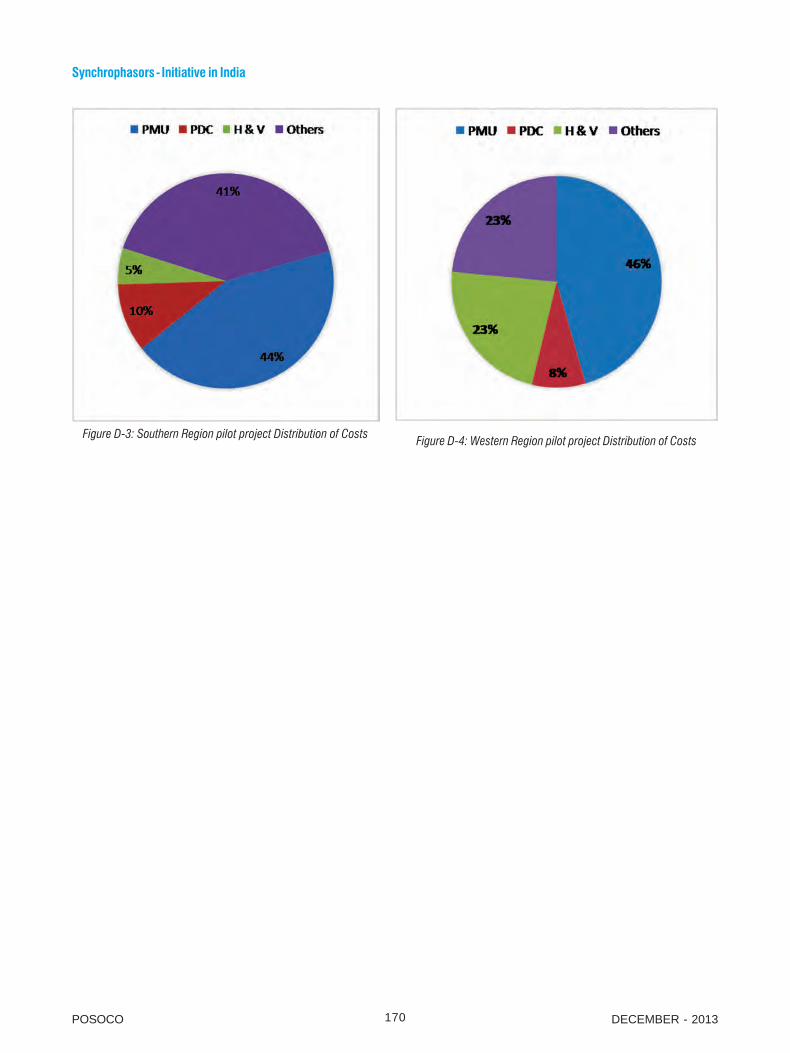
170 DECEMBER - 2013POSOCO
Synchrophasors - Initiative in India
Figure D-3: Southern Region pilot project Distribution of CostsFigure D-4: Western Region pilot project Distribution of Costs


![á F] - vaillant.pl · 3e DHW 10c 5 2 12d 3 12d 3c 10c 3 12d 12 12a 9j 8e 9h BUS BUS BUS BUS BUS BUS BUS BUS BUS BUS BUS 8c 8f BUS 12d (S9) 8b 3f2 10c 9a FS2 12k2 9c 2 4 33 9k2 12d](https://static.fdocuments.in/doc/165x107/5c69bd9909d3f21a048b9235/a-f-3e-dhw-10c-5-2-12d-3-12d-3c-10c-3-12d-12-12a-9j-8e-9h-bus-bus-bus-bus.jpg)


