Tufted Puffin Monitoring Study at Haystack Rock, Cannon Beach ...

Osaka University
Title Synchronized oscillatory discharges of mitral/tufted cells andolfactory information processing in the MOB.
Author(s) Kashiwadani, Hideki
Citation
Issue Date
Text Version ETD
URL http://hdl.handle.net/11094/42430
DOI
Rights

Ph. D. Thesis
Synchronized oscillatory discharges of
mitral/tufted cells and olfactory
information processing in the MOB.
Hideki Kashiwadani
Department of Biophysical Engineering
Faculty of Engineering Science Osaka University
Toyonaka, Osaka 560-8531, Japan.
1

Abstract
Central olfactory system integrates signals derived from
numerous types of odorant receptors that are expressed by sensory
neurons in the olfactory epithelium. Individual glomeruli in the
mammalian main olfactory bulb (MOB) represent a single or, at
most, a few types of odorant receptor (s) . Signals from different
types of receptors are sorted out into different glomeruli. How
does the neuronal circuit in the olfactory bulb contribute to
the combination and integration of signals received by different
glomeruli? Here I examined electrophysiologically whether there were functional interactions between mitral/tufted cells
(M/T cells) associated with different glomeruli in the MOB. First, I made simultaneous recordings of extracellular
single-unit spike responses of M/T cells and oscillatory local
field potentials (OLFPs) in the dorsomedial region of the MOB
in urethane-anesthetized rabbits. Using periodic artificial
inhalation, the olfactory epithelium was stimulated with a
homologous series of n-fatty acids or n-aliphatic aldehydes. The
odor-evoked spike discharges of M/T cells tended to phase-lock
to the OLFP, suggesting that spike discharges of many cells occur
synchronously during odor stimulation. Second, I made
simultaneous recordings of spike discharges from pairs of MIT
cells located 300-500 gm apart, and then I performed cross-
correlation analyses of their spike discharges in response to
odor stimulation. About 27% of cell pairs, which have distinct molecular receptive ranges, exhibited synchronized oscillatory
discharges when olfactory epithelium was stimulated with one or a mixture of odorant (s) that were effective in activating both
cells. The results suggest that the neuronal circuit in the
olfactory bulb causes synchronized spike discharges of specific
pairs of M/T cells associated with different glomeruli and the synchronization of odor-evoked spike discharges may contribute
to the temporal binding of signals derived from different types
of odorant receptor.
2
Contents
Chapter 1. -General Introduction- 5
Chapter 2. -Materials and Methods- 12
2-1. Animal preparation 13
2-2. Odor stimulation 15
2-3. Recording 17
2-4. Phase-Frequency histogram analysis 18
2-5. Cross-Correlation analysis 20
2-6. Fitting of Gabor functions 21
Chapter 3. -Experiment 1- 23
3-1. Introduction to experiment 1 24
3-2. Spike discharges of M/T cells are
phase-locked to the OLFPs 25
Chapter 4 . -Experiment 2- 28
4-1. Introduction to experiment 2 29
4-2. Simultaneous recordings of M/T cells
innervating with different glomeruli 29
4-3. Cross-correlation analysis 32
4-4. MRR properties and cross-correlograms 34
3
Chapter 5. -General Discussion- 37
5-1. Comparison to previous reports 38
5-2. Did the pairs of M/T cell recorded
innervate different glomeruli? 38
5-3. Possible long range synchronization of M/T
cells 39
5-4. Synchronous firing of M/T cells and
olfactory cortical neurons 40
5-5. Possible mechanisms to control the
synchronization in the MOB 42
5-6. Tuning specificity enhancement by lateral
inhibition 43
5-7. Comparison to insect olfactory system 44
References 46
Acknowledgment 55
4

Chapter 1.
-General Introduction-
5
Olfactory system is characteristic in that its sensory
input is mediated by a variety of odor molecules. It has been
estimated that more than 400,000 chemical compounds are odorous
to human nose (Hamauzu 1969) . Gas-chromatographic studies have
shown that an object emits a specific combination of odor
molecules, and that different objects emit different
combinations of odor molecules. For example, the fruit of peach
emits a specific combination of dozens of odor molecules
including benzaldehyde and T -decalactone (Fig. 1) . Each of the
odor molecules cannot be perceived as "peach" by itself. However,
when these odor molecules are mixed in proper concentration, we
perceive them as "peach odor". Thus, the olfactory nervous
system needs to integrate information carried in a selective
combination of odor molecules in order to perceive the "olfactory
image" of objects. How does the brain recognize various kinds
of odor molecules? What is the neuronal mechanism for the
integration of information from various odor molecules?
Odor molecules are received by odorant receptors expressed
on the sensory neurons in the olfactory epithelium of the nasal
cavity. To cope with a vast variety of odor molecules, the
mammalian olfactory system has developed up to 1000 types of
odorant receptors (Buck and Axel 1991; Lancet and Ben-Arie 1993;
Mombaerts 1999; Sulliavn et al. 1996) . One odor molecule can bind
to several different odorant receptors, and one odorant receptor
can bind to several different odor molecules (Malnic et al. 1999;
Zhao et al. 1998) . This suggests that a specific combination of
odor molecules emitted from an object may activate a specific
combination of odorant receptors. The olfactory system may
generate the "olfactory image" of object by integrating and/or
comparing the information derived from the specific combination
6

Prunus Persica Batsch (Peach)
Fig. 1 Various kind of odor molecules emitted from the peach fluit. A, a picture of peach (Prunus Persica Batsch). B, 8 odorous compounds emitted from the peach fluit. Except the 8 compoundes above, peach fluits emit various
kinds of odorous compounds such as hydrocarbons (ethylene, limonene, etc.), alcohols (ethanol, benzyl alcohol, etc.), acids (acetic acids, hexanoic aicds, etc.), aldehydes (heptanal, turfura, etc.), ketons (2-undecanonde, 2-pyrone, etc.),
lactones ( y-octalactone, y-dodecalactone etc.), esters (isopentyl acetate, benzyl acetate, etc.) and so on.
of odorant receptors.
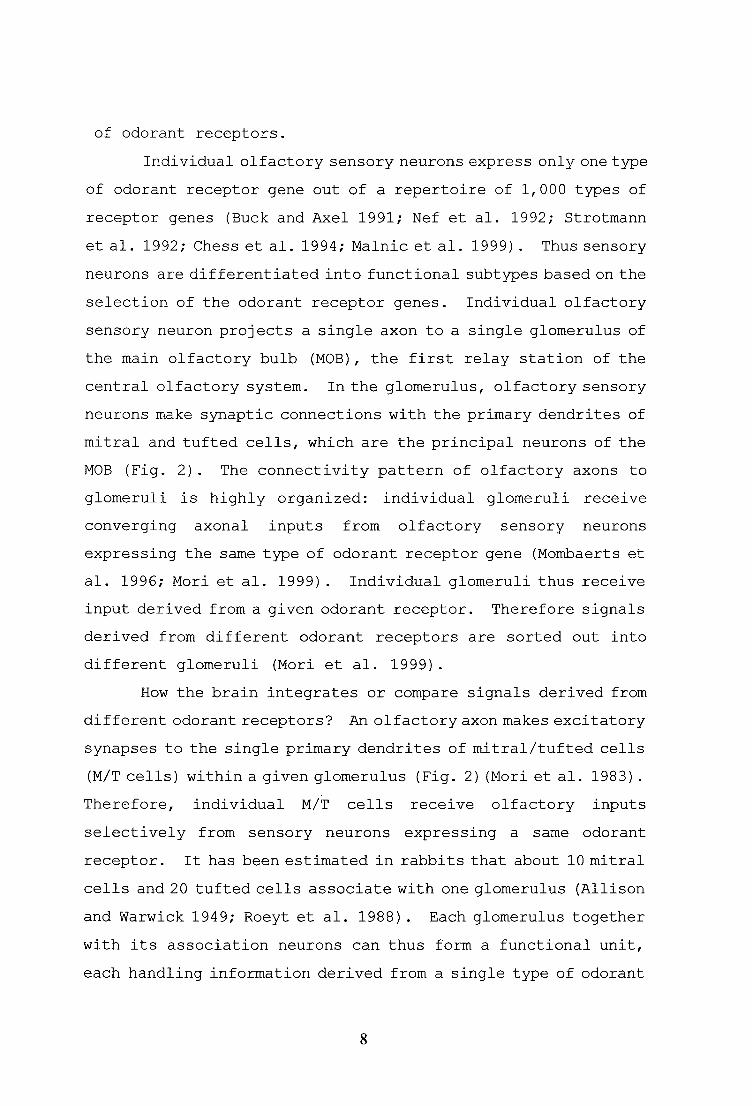
Individual olfactory sensory neurons express only one type
of odorant receptor gene out of a repertoire of 1,000 types of
receptor genes (Buck and Axel 1991; Nef et al. 1992; Strotmann
et al. 1992; Chess et al. 1994; Malnic et al. 1999). Thus sensory
neurons are differentiated into functional subtypes based on the
selection of the odorant receptor genes. Individual olfactory
sensory neuron projects a single axon to a single glomerulus of
the main olfactory bulb (MOB), the first relay station of the
central olfactory system. In the glomerulus, olfactory sensory
neurons make synaptic connections with the primary dendrites of
mitral and tufted cells, which are the principal neurons of the
MOB (Fig. 2). The connectivity pattern of olfactory axons to
glomeruli is highly organized: individual glomeruli receive
converging axonal inputs from olfactory sensory neurons
expressing the same type of odorant receptor gene (Mombaerts et
al. 1996; Mori et al. 1999). Individual glomeruli thus receive
input derived from a given odorant receptor. Therefore signals
derived from different odorant receptors are sorted out into
different glomeruli (Mori et al. 1999).
How the brain integrates or compare signals derived from
different odorant receptors? An olfactory axon makes excitatory
synapses to the single primary dendrites of mitral/tufted cells
(M/T cells) within a given glomerulus (Fig. 2)(Mori et al. 1983).
Therefore, individual M/T cells receive olfactory inputs
selectively from sensory neurons expressing a same odorant
receptor. It has been estimated in rabbits that about 10 mitral
cells and 20 tufted cells associate with one glomerulus (Allison
and Warwick 1949; Roeyt et al. 1988). Each glomerulus together
with its association neurons can thus form a functional unit,
each handling information derived from a single type of odorant
8

Fig. 2 An over view of the basic neuronal circuit of the mammalian main olfactory system. Olfactory sensory neurons which express the san odorant receptor gene converge their axons onto a few defined glomeruli and make synaptic connections on dendrites of mitral/tufted cells (1V cells) and periglomerular cells. Individual MIT cell project a single primary dendrite to a single glomerulus. M/T cells form dendrodendritic reciprocal synapses with granule cells win the external plexiform layer (EPL), and with periglomerular cells in the glomeruli. White arrows indicate excitatory synapses whereas black ones indicate inhibitory synapses. Oscillatory local field potentials were recorded from EPL (Rec and single unit discharges of M/T cells were recorded from deep EPL or MCL (Rec. B and Rec. C). GCL, granule cell layer; GL, glomerular is er; LOT, lateral olfactory tract; MCL, mitral cell layer; OE, olfactory epithelium; OM, odor molecules; ONL, olfactory nerve layer; OR, odorar receptor.

receptor. It has been suggested that local neuronal circuits
within the MOB mediate interactions among different glomerular
units.
There are two types of GABAergic interneurons in the MOB,
granule cells and periglomerular cells (Fig. 2, Ribak et al. 1977) .
Granule cells make dendrodendritic reciprocal synapses with MIT
cells, thus forming neuronal circuits that may mediate
interactions among M/T cells. The dendrodendritic reciprocal
synapses consist of the M/T-to-granule excitatory synapse and
the granule-to-M/T inhibitory synapse. Thus activation of a MIT
cell may activate granule cells via the dendrodendritic
excitatory synapses, which then results in inhibition of
neighboring M/T cells via the dendrodendritic inhibitory
synapses. This lateral inhibition has been suggested to enhance
tuning specificity of M/T cells to molecular features of odorants
(Yokoi et al. 1995) .
Another possible function of the local neuronal circuit
might be to meditate the synchronized firing of M/T cells. It
has been reported that odor stimulation elicits robust
oscillatory local field potentials (OLFPs) in the mammalian MOB.
It has been suggested that M/T cells may be tightly coupled with
the mechanisms for generating the OLFPs (Adrian 1950; Bressler
1987; Bressler and Freeman 1980; Mori et al. 1992; Mori and Takagi
1977) . M/T cells project their axons to olfactory cortical
neurons (Shepherd and Greer 1990) . If the axons of M/T cells
representing different odorant receptors converge onto target
neurons in the cortex, the cortical neurons can function as a
combination detector whose activity represents the simultaneous
activation of the several types of odorant receptors. The
synchronized firing of the M/T cells during odor stimulation may
effectively drive the target cortical neuron because of the
10

temporal summation of the excitatory synaptic inputs from the
M/T cells.
Synchronous firing of M/T cells in the MOB in response to
odor stimulation has already been suggested by the previous
studies (Baumgarten et al. 1962, Mori and Takagi 1977, Eeckman
and Freeman 1990) . However, no systematic study has so far been
reported regarding the synchronous firing of M/T cells. In the
present study, to examine whether specific pairs of M/T cells
representing different odorant receptors show synchronized spike
responses when they are co-activated by one or a mixture of odor
molecules, I performed the following two experiments.
1. Simultaneous recordings of spike discharges of M/T cell
in response to odor stimulation and the OLFP. Detailed analysis
was made on the temporal relationship between the time of spike
discharges of M/T cells and the phase of the OLFPs.
2. Pair recordings of M/T cells innervating different
glomeruli (thus representing different odorant receptors) .
Cross-correlation analysis was done to test whether the pairs
of M/T cells showed synchronized spike responses during specific
odor stimulation.
11

Chapter 2.
-MATERIALS AND METHODS-
12

2-1. Animal Preparation
Experiments were performed on 17 young adult male rabbits
weighing 1. 8-2. 5 kg (Japanese white, Nihon SLC) . Each animal was
anesthetized with an intravenous injection (from caudal
auricular vein) of 30% urethane (1.3 g/kg). Tracheotomy was
performed for double cannulation (Onoda and Mori 1980). A glass
canula was inserted caudally into the trachea for animal's
spontaneous respiration. A flexible polyethylene tube was
inserted rostrally into the postnasal cavity through the larynx
for controlling the nasal airflow. Animals were then mounted on
a stereotaxic instrument (Narishige, SN-3).
To minimize the pulsation of the brain, a drainage of the
cerebrospinal fluid was routinely performed at the atlanto-
occipital membrane as followed: after the exposure of the
atlanto-occipital membrane, a small hole was opened and a twisted
cotton string was inserted through the hole to touch the
cerebrospinal fluid. The bone overlying the dorsal surface of
the olfactory bulb was widely removed with a dental drill, and
the dura was cut and reflected to expose the olfactory bulb. The
surface of the olfactory bulb was covered with a mixture of
vaseline and mineral oil to reduce drying and cooling.
A small hall was opened in the bone and dura overlying the
anterolateral part of the frontal neocortex for inserting a
bipolar stimulating electrode into the lateral olfactory tract
(LOT) running at the surface of the anterior piriform cortex.
The final position of the stimulation electrode was determined
by monitoring the LOT-evoked field potentials in the MOB
(Phillips et al. 1963). The stimulation electrode was then
anchored to the skull with dental cement (Fig. 3).
13

Animal Preparation
recording from the MOB
nasal turbinate LOT stimulation
spontaneous
respiration
odor
artificial inhalation
Fig. 3 Animal preparation. After tracheotomy, double canulation was performed:
caudal one for respiration and rostral one for artificial inhalation. Orange arrows
indicate the flow of odor-containing air during artificial inhalation. Right blue indi-
cates the nasal cavity. A mitral/tufted cells in the MOB is illustrated in red.

2-2. Odor stimulation
A homologous series of normal- (n-) fatty acids (carbon
chain length: 2-9) and n- aliphatic aldehydes (carbon chain
length: 3-10) were used for odor stimulation (Fig. 4). Each
chemical was diluted to 2x10⁻² (vol/vol) in odorless mineral oil
(Aldrich). Two milliliter of each diluted solution was stored
in a glass test tube sealed with a screw cap. For odor stimulation,
the test tube was uncapped and then placed in front of the animal' s
nose.
The polyethylene tube inserted rostrally into the
postnasal cavity was connected to a vacuum pump for artificial
inhalation; the vacuum pump periodically generated negative
pressure in the nasal cavity, which caused airflow from the
nostril into the nasal cavity. To prevent animals from closing
the nostril, a flexible polyethylene tube was inserted into the
nostril (Fig. 3). The rate of the artificial inhalation was set
as once per 1.5 sec and the duration of one inhalation was 500
msec. By placing the odor-containing test tube in front of the
nostril tube, odor-contained air was inhaled into the nasal
cavity. Each odor application lasted at least 5 sec covering 3
cycles of the artificial inhalation. To remove the odor-
containing air leaked outside the nostril, an air exhauster was
placed at a distance of 15 cm from the animal's nose.
15

Panel of stimulus odor molecules
Acetic acid (C(2)COOH)
COOH
Propionic acid
(C(3)COOH)
Butyric acid
(C(4)COOH)
Valerie acid
(C(5)COOH)
Caproic acid
(C(6)COOH)
Enanthic acid
(C(7)COOH)
Caprylic acid (C(8)COOH)
Pelargonic acid
(C(9)COOH)
COOH
\A COOH
COOH
COOH
MA COOH
\AAA COOH
COOH
Propionic aldehyde
(C(3)CHO)
Butyric aldehyde (C(4)0110)
Valeric aldehyde
(C(5)CHO)
Caproic aldehyde
(C(6)CHO)
Enanthic aldehyde
(C(7)CHO)
Caprylic aldehyde (C(8)0110)
Pelargonic aldehyde (C(9)0110)
Capric aldehyde (C(10)CHO)
CHO
CHO
CHO
\AA CHO
MACHO
\AAA CHO
AAAA CHO
CHO
Fig. 4 The panel of odor molecules. normal (n)- Aliphatic acids (number of carbon atoms: 2-9) and n-aliphatic aldehydes (number of carbon atoms: 3-10) were used. When the olfactory epithelium was stimulated with these odor molecules, mitralltufted cells in the dorsomedial region of the MOB showed burst spike responses.

2-3. Recording
OLFPs and extracellular single-unit discharges were
recorded from the dorsomedial region of the MOB by glass
micropipettes filled with 2M NaCl. DC resistance of the
micropipettes was 1 - 2 MS2 for the recording of OLFP and 3 - 5
MC2 for the recording of single-unit discharge. Electrical
stimulation of the lateral olfactory tract was performed using
a rectangular pulse with 100ps duration (Phillips et al. 1963).
OLFPs were recorded from the external plexiform layer of the MOB.
Single unit discharges of the M/T cells were recorded from the
deep portion of the external plexiform layer or the mitral cell
layer (Fig. 2). For simultaneous recording of OLFPs and
single-unit discharges of a M/T cell, I used two glass
micropipettes separated -100 gm. For simultaneous recording
from two M/T cells, the tips of two micropipettes were separated
300 - 500 gm apart. The action potentials and OLFPs were
differentially amplified using bandpass filters in the range of
150 Hz - 3 kHz and 5 - 300 Hz, respectively. The recorded signals
were stored in the computer (PowerMac 7300, Apple computer) via
AD converter Micro 1401 with Spike 2 software (Cambridge
Electronic Design, Cambridge) and further off-line analyses were
performed.
17
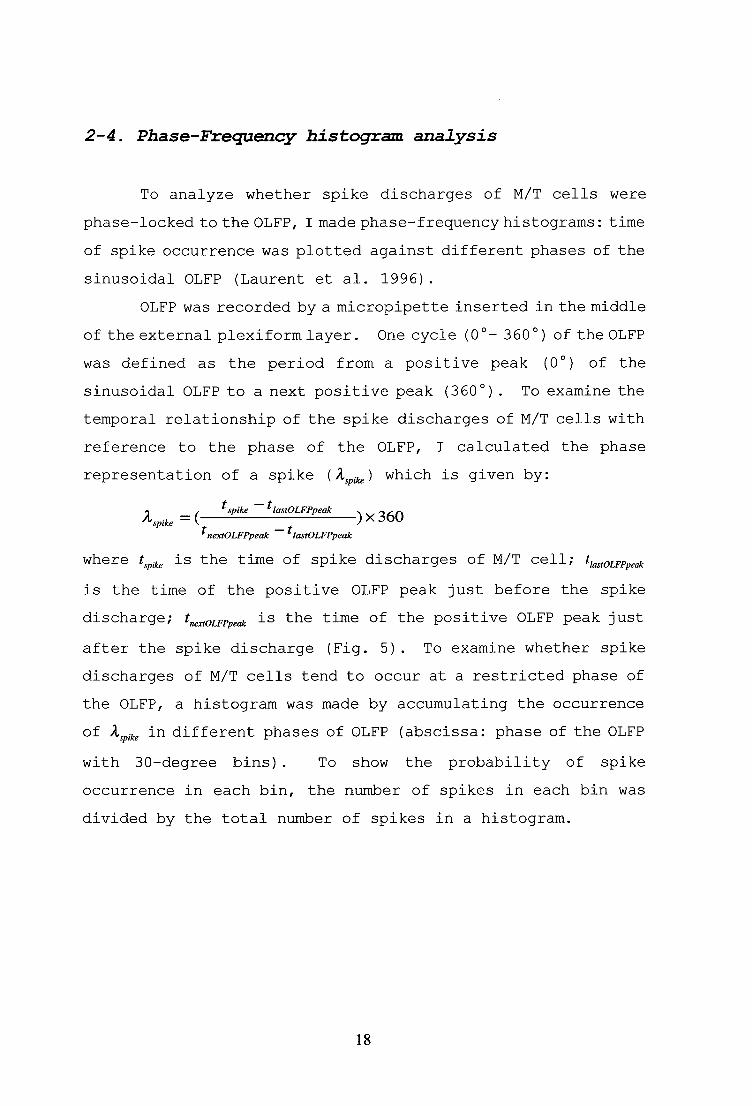
2-4. Phase-Frequency histogram analysis
To analyze whether spike discharges of M/T cells were
phase-locked to the OLFP, I made phase-frequency histograms : time
of spike occurrence was plotted against different phases of the
sinusoidal OLFP (Laurent et al. 1996).
OLFP was recorded by a micropipette inserted in the middle
of the external plexiform layer. One cycle (0°- 360°) of the OLFP
was defined as the period from a positive peak (0°) of the
sinusoidal OLFP to a next positive peak (360°). To examine the
temporal relationship of the spike discharges of M/T cells with
reference to the phase of the OLFP, I calculated the phase
representation of a spike (,spike) which is given by:
t spt.ke — tlastOLFPpeak A' spike ) x 360
s
P tnextOLFPpeak — tlastOLFPpeak
where tvik, is the time of spike discharges of M/T cell; tlastOLFPpeak
is the time of the positive OLFP peak just before the spike
discharge; tmxt0/..Fk is the time of the positive OLFP peak just
after the spike discharge (Fig. 5). To examine whether spike
discharges of M/T cells tend to occur at a restricted phase of
the OLFP, a histogram was made by accumulating the occurrence
of A.spike in different phases of OLFP (abscissa: phase of the OLFP
with 30-degree bins). To show the probability of spike
occurrence in each bin, the number of spikes in each bin was
divided by the total number of spikes in a histogram.
18
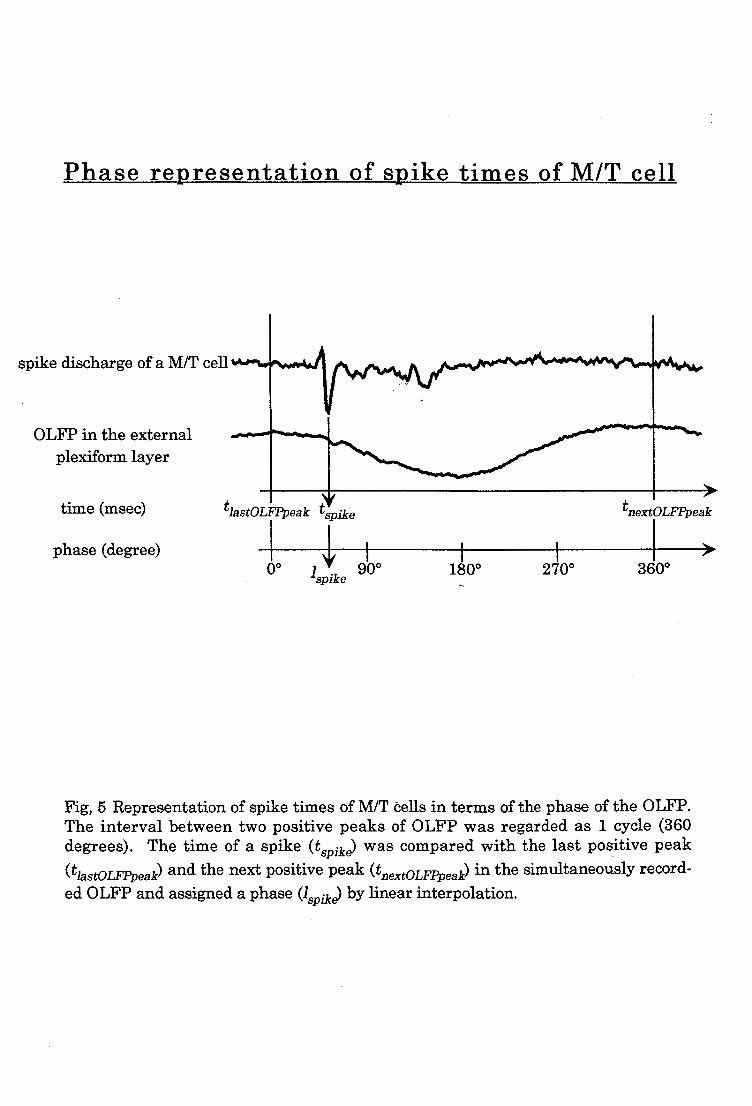
Phase representation of spike times of M/T cell
spike discharge of a M/T cell
OLFP in the external
plexiform layer
time (msec) tlastOLFPpeak t pike tnextOLFPpeak
phase (degree) 00 1spike 90° 180° 270° 360°
Fig, 5 Representation of spike times of M/T cells in terms of the phase of the OLFP. The interval between two positive peaks of OLFP was regarded as 1 cycle (360
degrees). The time of a spike (tspike) was compared with the last positive peak
and thenextpositivepeak (t (tlastOLF.Ppeak)anextOLFPpeak) in the simultaneously record- ed OLFP and assigned a phase (./spike) by linear interpolation.

2-5. Cross-correlation analysis
To examine the synchrony of spike discharges of a pair of
M/T cells, cross-correlation histograms were computed using a
standard method (Perkel et al. 1967). Briefly, spike times of
cell B with reference to the spike times of cell A were measured
and plotted on a histogram. If the two cells show completely
synchronized firing, the time lag between spikes of cell A and
those of cell B is 0 msec. Thus, the cross-correlogram computed
for the completely synchronized spike trains show a clear center
peak. If the spikes of cell A occur independently to the spikes
of cell B, the cross-correlogram does not show a central peak
and is flat. The correlograms were calculated for time shifts
ranging from -50 msec to +50 msec with a temporal resolution of
2 msec. I accumulated recordings obtained from at least 3 trials
of odor application, each trial consisting of at least 3
artificial inhalations.
20

2-6. Fitting of Gabor functions
As shown in Fig. 9 and 10, the cross-correlograms that were
computed for spike responses of M/T cells often showed a clear
central peak and smaller satellite peaks at regular intervals
(about 30 msec) . To quantify the strength of the cross-
correlation, a standard Gabor function (damped sinusoid) was
therefore fitted to each cross-correlogram (Konig 1994) . A Gabor
function is given by:
F(t) = A-exp[(It —91 )2 0. ]
• cos[2irv(t — 0)] + C
where A is the center peak amplitude; C is the offset of the
correlogram modulation; 0 is the phase shift; a is the decay
constant; v is the sinusoid frequency (see Fig. 6) . Each of the
five parameters was independently substituted and the Gabor
function that fit the correlogram with the lowest X2 value is
selected (Konig 1994) .
The Gabor function that fit to the cross correlograms had
a variable offset (C) . Therefore, the relative modulatory
amplitude (RMA) defined as the ratio of the center peak amplitude
(A) over the offset of correlogram modulation (C) was calculated
for assessing the strength of correlation (RMA=A/C, Engel et al.
1990) . Spike responses were considered synchronous when the RMA
exceeded 0.3.
21

Parameters of Gabor Function
s F(t)= A • expE(it -Oil—•co12.7rv(t - 0)] + C
a
Fig. 6 Fitting a Gabor function (red) to a cross-correlogram (gray). Gabor function is the product of the sinusoidal function and the damping function. Each five parameters (C , A, 0, a, v) were independently substi-tuted and the fit with the lowest x2 value is selected as optimal. a indicate the decay constant of a function, therefore the bigger a is, the slower the degree of damping of the function is. A, the center peak amplitude; C, the offset of the correlogram modulation; 0, the phase shift; v, the sinusoid frequency.

Chapter 3.
-Experiment 1-
23

3-1. Introduction to experiment 1
Odor stimulation elicits sinusoidal (30-80 Hz) OLFPs in
the mammalian MOB (Adrian 1950; Bressler 1987; Bressler and
Freeman 1980; Mori et al. 1992; Mori and Takagi 1977) . Each type
of odor molecules elicits OLFP in specific areas of the MOB. For
example, short chain n-fatty acids such as propyonic acid elicit
OLFPs at restricted regions of the dorsomedial area in the MOB
(Mori et al. 1992) .
Then, how the odor-induced OLFPs were generated in the MOB?
Secondary dendrites of M/T cells make dendrodendritic reciprocal
synapses with granule cells in the external plexiform layer of
the MOB (Fig. 2) . The reciprocal synapses are thought to mediate
the OLFP and the synchronized oscillatory activity among many
M/T cells (Rall and Shepherd 1968; Rall et al. 1966; Shephered
and Greer 1990) . It has been proposed the mechanisms eliciting
OLFP as follows. Odor-induced activation of M/T cells causes
excitation of many granule cells via M/T-to-granule
dendrodendritic excitatory synapses. Because the
dendrodendritic synapses are located in the external plexiform
layer (Fig. 2) , the depolarization of granule cell dendrites
accompanies the negative extracellular potential in the external
plexiform layer. Activation of granule cells, in turn, inhibits
many M/T cells simultaneously via granule-to-M/T dendrodendritic
inhibitory synapses. When the M/T cells are suppressed,
excitatory input to the granule cells subsides. This results in
disfacilitation of granule cells followed by a cessation of the
inhibition of M/T cells. M/T cells are activated again if
excitatory input from olfactory sensory neurons is continued
(Mori and Takagi 1977; Rall et al. 1966; Shepherd and Greer 1990) .
Previously it was reported that odor-induced spike
24
responses of mitral cells tended to occur just before the positive
peak of the odor-induced OLFPs that were recorded in the granule
cell layer (Mori and Takagi 1977) . However, the temporal
relationship between the spike discharges of mitral cells and
the phase of the OLFPs has not yet been examined quantitatively.
To examine whether the spike discharges occur at restricted
phases of the OLFP during odor stimulation, I performed following
two experiments:
1. Simultaneous recordings of OLFP and spike discharges of M/T
cells in response to odor stimulation.
2. Quantitative analysis of the temporal relationship between
the time of spike discharges of M/T cells and the phase of the
OLFPs.
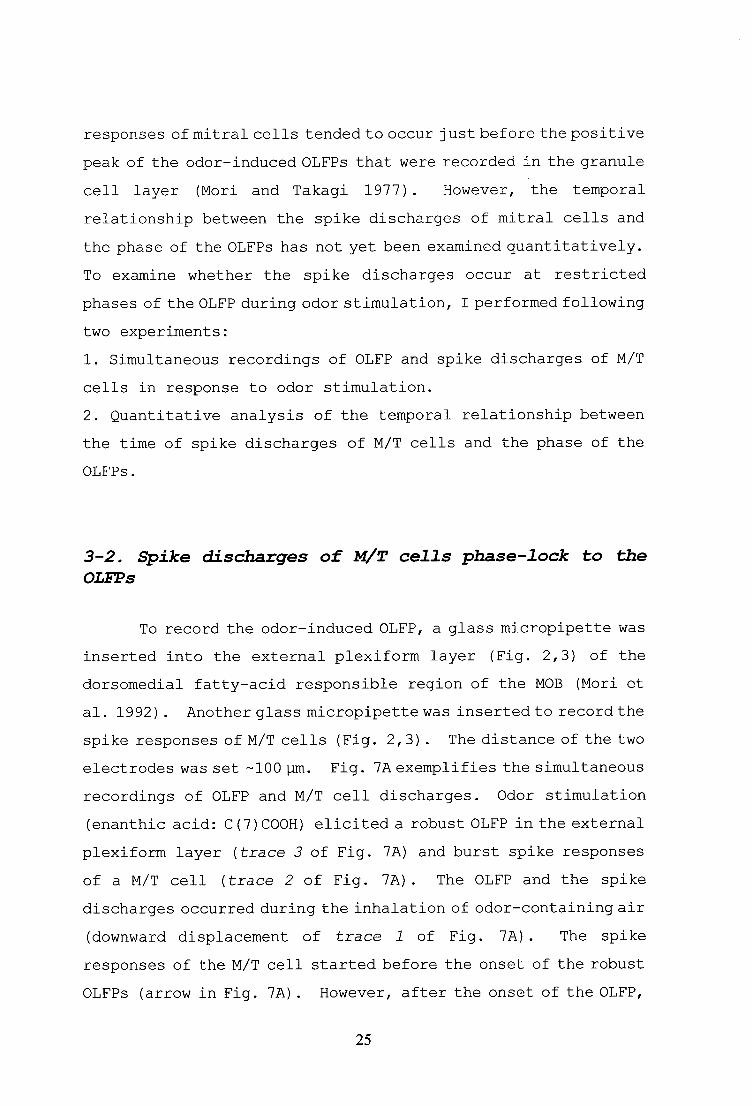
3-2. Spike discharges of MIT cells phase-lock to the OLFPs
To record the odor-induced OLFP, a glass micropipette was
inserted into the external plexiform layer (Fig. 2,3) of the
dorsomedial fatty-acid responsible region of the MOB (Mori et
al. 1992) . Another glass micropipette was inserted to record the
spike responses of M/T cells (Fig. 2,3) . The distance of the two
electrodes was set -100 pm. Fig. 7A exemplifies the simultaneous
recordings of OLFP and M/T cell discharges. Odor stimulation
(enanthic acid: C (7) COOH) elicited a robust OLFP in the external
plexiform layer (trace 3 of Fig. 7A) and burst spike responses
of a M/T cell (trace 2 of Fig. 7A) . The OLFP and the spike
discharges occurred during the inhalation of odor-containing air
(downward displacement of trace 1 of Fig. 7A) . The spike
responses of the M/T cell started before the onset of the robust
OLFPs (arrow in Fig. 7A) . However, after the onset of the OLFP,
25

Fig. 7 Spike discharges of M/T cells phase-locked to OLFP. A: Simultaneous recordings o. single-unit spike responses of a M/T cell (trace 2) and OLFP (trace 3) during odor stimulation. In this case, enanthic acid was applied to the nostril. A monitor for artificia inhalation is shown in trace 1; the downward displacement indicates inhalation. Arrov denotes the onset of the OLFP. B and C. Phase-frequency histograms of spike discharp occurrence plotted against different phases of the sinusoidal OLFP. Each cycle of OLFI was divided into 12 different phases at 30 degree intervals starting from peak of positivit, as 0 degree. Upper diagrams in B and C indicate one cycle of OLFP. In B, one cycle o OLFP lasted about 26.6 msec and thus each time bins corresponded to about 2.22 msec Spike discharges of the M/T cell occurred mostly in the falling phase of the OLFP. C. Aver age histogram obtained from 11 cells.

spikes of M/T cells occurred in correlation of oscillatory phases
of the OLFP. Such a correlation has been observed in all M/T cells
examined (n=15) .
Next, I examined in detail the temporal relationship
between the spikes of M/T cells and the phase of the OLFP (Fig.
5) . One cycle of the sinusoidal OLFP was divided into 12 phases
and the spike probability of M/T cells in each phase of the OLFPs
was examined. Fig. 7B exemplified a phase-frequency histogram.
About 91% of spike discharges, which were found during the section
robust OLFPs were elicited, occurred during the phases between
0 degree and 180 degree, the falling phase of the OLFPs. The
highest spike probability was observed in the phase between 60
to 90 degrees of the OLFP (Fig. 7B) .
The preferential occurrence of spike responses during the
falling phase of the OLFPs was observed in 11 (about 73%) out
of 15 cells examined. In other 4 cells, spike discharges occurred
independently to the phase of the OLFPs. Fig. 7C shows an
averaged histogram calculated from the data accumulated from the
11 M/T cells. Spikes of M/T cells occurred preferentially during
the phases between 0 to 180 degrees of the OLFPs, most frequently
between 60 to 90 degrees. Above results indicated that spike
responses of many M/T cells was phase-locked to OLFPs during odor
stimulation. Thus, it is suggested that many M/T cells fire
synchronously during odor stimulation.
27

Chapter 4.
-Experiment 2-
28

4-1. Introduction to experiment 2
The results in Experiment 1 together with previous reports
(e. g. Adrian 1950; Bressler and Freeman 1980; Bressler 1987;
Mori and Takagi 1977) suggest that many M/T cells may show
synchronized spike discharges during odor stimulation. However
the phase locking of spikes to OLFP does not necessarily indicate
spike synchronization because M/T cells show diverse temporal
patterns. To examine the synchronous spike discharges more
directly and quantitatively, I made simultaneous recordings from
pairs of M/T cells and examined the degree of the synchronization
using cross-correlation analysis of their spike discharges.
Specific questions asked here are,
1. Do pairs of M/T cells exhibit synchronized spike discharges
in response to odor stimulation?
2. Do M/T cells representing different types of odorant
receptors show synchronized spike responses?
4-2. Simultaneous recordings of MIT cells innervating
different glomeruli
Using a micropipette, I recorded the spike activity of a
mitral/tufted cell in the dorsomedial region of the MOB. Then
another micropipette was inserted at a distance within 300-500
pm from the first micropipette and recorded spike activity from
another M/T cell. Previous studies with horseradish peroxidase
labeling showed that cell bodies of almost all pairs of M/T cells
innervating a given glomerulus are separated at a distance less
than that of an averaged diameter of a glomerulus (Buonviso et
al. 1991; Royet et al. 1988, 1989) . In rabbit, the average
diameter of a glomerulus is about 190 pm (Allison and Warwick
29

1949) . Thus, two M/T cells located at a distance more than 300
pm (about 1.6 times greater than the average diameter) most
probably innervate different glomeruli. Mitral cells extend
their secondary dendrites tangentially about 850 pm (Mori et al.
1983) so that a pair of mitral cells that are located within 500
pm apart most probably overlap their dendritic field. Based on
the above estimation, I aimed to record from two M/T cells located
between 300-500 pm apart.
I first examined the response specificity of the pair of
M/T cells that was simultaneously recorded and assessed the
molecular receptive range (MRR) of each cell (Imamura et al. 1992,
Mori and Yoshihara 1995) . MRR of a M/T cell reflects strongly
the odor-response specificity of the receptor that is represented
by the glomerulus that the M/T cell innervates (Mori and Yoshihara
1995) . Therefore, if the MRRs of two M/T cells differ, the two
M/T cells presumably receive olfactory axon input from different
glomeruli. Figure 8 shows an example of simultaneous recording
of two M/T cells in the dorsomedial region. When the nasal
epithelium was stimulated with caproic acid (C (6) -COOH) (trace
1 of Fig. 8) , both cells showed burst spike discharges (trace
3 and 4 of Fig. 8) during the inhalation of odor-containing air
(downward displacement of trace 2 of Fig. 8) . Observation with
a faster sweep of the traces (Fig. 8B) demonstrated that the two
cells tended to fire synchronously (indicated by arrows) during
the late portion of the burst discharges.
30

A
1
2
3
500 msec
B 1
A A n A A
V / I 2 ., ' '
100 msec
Fig. 8 Simultaneous recording of spike responses of two M/T cells (trace 3 and trace 4). A: Thick bar in trace 1 indicate the period of odor stimulation (caproic acid). Monitor for artificial inhalation is shown in trace 2. During the odor-contained air was inhaled into the nostril, both cells showed burst spike responses. B: Traces of spike discharges during the period indicated by the bracket under trace A4 are shown with a faster sweep speed. Spike discharges of these two M/T cells tended to synchronized (arrows) during inhalation of the odor-containing air.
4-3. Cross-correlation analysis
To quantify the synchrony of spike discharges of M/T cells
that were simultaneously recorded, I performed cross-correlation
analysis to spike trains of pairs of M/T.
Fig. 9 shows an example of the results obtained from
simultaneous recordings of two M/T cells. MRR of one cell (S12-2)
covered C(3)- and C(4)-fatty acids (COOH) (enclosed by a broken
line), while that of the other cell (S12-1) covered C(2)- to
C(5)-COOH and C(3)- to C(5)-aliphatic aldehydes (CHO) (enclosed
by a solid line) (Fig. 9A). Stimulation of the olfactory
epithelium with C(3)-COOH or C(4)-COOH elicited burst spike
responses of both cells.
A cross-correlogram calculated for spike trains evoked by
C(3)-COOH showed a clear center peak around +3 msec, indicating
synchronization. The cell S12-2 fired frequently between 2 msec
before and 8 msec after the spike of S12-1. In addition to the
center peak, the cross-correlogram had two satellite peaks at
-25 msec and +28 msec , indicating that synchronized firing of
the two cells occurred periodically (about 36 Hz). It should be
noted that the synchronized oscillatory spike discharges
appeared only during the inhalation of odor-containing air.
There was no apparent correlation in the spontaneous discharges
of the cells (Fig. 9C).
32

Fig. 9 MRR (A) and cross-correlograms (B and C) of a pair of simultaneously recorded M/T cells (S12-1 and S12-2). A: MRRs of the two cells were overlapped at C(3)- and C(4)-COOH. B: A cross-correlogram computed for spike discharges evoked by C(3)-COOH. Abscissa indicates the time lag of spike occurrence of cell S12-2 with reference to S12-1. The central
peak indicates synchronization. C: A cross-correlogram computed for spike discharges recorded before odor stimulation.

4-4. MRR properties and cross-correlograms
In Fig. 9, the MRR of one cell (S12-1) completely covered
the MRR of the other cell (S12-2) . Therefore, the MRRs of the
two cells were different in size but show an intensive overlap.
Next, I recorded the pairs of which MRRs were only partially
overlapped or not overlapped.
An example obtained from a pair with partially overlapped
MRRs is shown in Fig. 10A. In this case, the MRR of S07-1 covered
C(2)-, C(3)-, C(4)-, C(5)-, C(6)-COOHandC(3)-, C(4)-CHO whereas
the MRR of S07-2 covered C (5) -, C (6) -COOH and C (5) -, C (6) -CHO.
Thus, when the nasal epithelium was stimulated with C (5) -COOH
or C (6) -COOH, both cells showed spike responses. The cross-
correlogram for C (5) -COOH stimulation had a center peak at about
-5 msec , indicating synchronization of spikes of both cells with
a mean time lag of 5 msec (Fig. 10A) . C (6) -COOH stimulation also
induced simultaneous activation of both cells but the
synchronization was weaker than that for C (5) -COOH stimulation
(data not shown) .
Fig. 10B demonstrates an example obtained from a pair of
M/T cells whose MRR were not overlapped. Cell S26-1 was activated
by C (5) -CHO and cell S26-2 was activated by C (7) -CHO and C (8) -CHO.
Hence, I could not activate both cells simultaneously with a
single chemical compound in the panel of n-fatty acid and n-
aliphatic aldehydes. Therefore a mixture of C (5) -CHO and
C (7) -CHO was applied to the nose to activate both cells
simultaneously. The top correlogram in Fig. 10B showed a robust
synchronization of spike discharges with a mean time lag of 2
msec during the odor stimulation.
In this study, I recorded 195 pairs of M/T cells from the
dorsomedial region of the rabbit MOB. In 37 out of them, both
34

Fig. 10 MRR properties and cross-correlograms of M/T cell pairs. A: A pair of M/T cells (507-1 and S07-2) having distinct but partially overlapping MRRs (right column). The cross-correlogram was computed for spike discharges elicited by C(5)-COOH (top panel of left column). B: Cross-correlogram (left column) computed for spike trains in response to a mix-ture of C(5)-CHO and C(7)-CHO in a pair of M/T cells (S26-1 and S26-2) without overlapping MRRs (right column). Lower panels of left column in A and B are cross-correlograms comput-ed for spike trains recorded before odor stimulation.

of the pairs were activated simultaneously with one or mixture
of odor molecules. A clear synchronization (RMA>0.3, see
MATERIALS AND METHODS and Fig. 6) of spike discharges was observed
in 10 pairs (270). Cross-correlograms obtained from other 27
pairs did not show any clear peaks and the RMAs were smaller than
0.3, indicating that odor stimulation (short carbon chain n-
fatty acids or aldehydes) did not induce the synchronized spike
discharges of pairs. In all 10 pairs except for one in which the
determination of MRR was not completed, the MRR of one cell
differed significantly from that of the other cell. In 3 pairs
including the pair shown in Fig. 9A, the MRR of one cell was much
larger and completely involved that of the other cell. In 4 pairs
of M/T cells, the two cells showed distinct but partially
overlapping MRRs as exemplified in Fig. 10A. In two pairs of M/T
cells, there was no overlap of MRRs (e.g., cell pair shown in
Fig. 10B) .
In all 10 pairs analyzed, the temporal nature of
synchronization was evident: the synchronization was elicited
only during the inhalation of odor molecules which activate both
cells and no synchronization was observed during the period
before the odor stimulation (Fig. 9C and bottom panels of Fig.
10A and 10B) . These results indicate that when M/T cells receive
weak or no sensory inputs, spike discharges of M/T cells do not
show synchrony, but once strong sensory inputs come into the MOB,
synchronized spike discharges occur among specific
combination (s) of M/T cells.
36

Chapter 5.
-General Discussion-
37

Present study showed that spike discharges of many M/T
cells phase-locked to the OLFP during odor stimulation. This
suggests that many M/T cells fire synchronously. Present results
also revealed that 10 out of 37 M/T cell pairs located in the
dorsomedial region of the MOB, which receive olfactory inputs
from different glomeruli, fired synchronously when the effective
odorant for both cells were applied.
5-1. Comparison to the previous reports
Previous studies described the relationship between the
spike timing of M/T cells and the phases of odor-induced OLFPs
(Baumgarten et al. 1962; Mori and Takagi 1977). The membrane
potentials of mitral cells oscillated with frequency consisting
with that of OLFP (Mori and Takagi 1977). The depolarization of
mitral cell membrane is followed by a positive peak of the OLFP
recorded in the granule cell layer. It is suggested that the
activation of mitral cell leads to the depolarization of granule
cell dendrites through the dendrodendritic synapses. Present
study extended the previous study and quantitatively analyzed
the time lag between mitral cell spike discharges and OLFPs that
indicate depolarization of granule cell dendrites.
5-2. Did the pairs of MIT cell recorded innervate different glomeruli?
Because the tips of the two recording microelectrodes were
more than 300 gm apart, simultaneously recorded M/T cells
presumably innervate different glomeruli. This idea is
38
supported by the observation that in all pairs, the MRR of one
cell differed significantly from that of the other cell. The
present results thus suggest that in specific pairs of M/T cells
associated with different glomeruli, activation of both cells
induces synchronized oscillatory spike discharges during odor
stimulation. In view of the evidence that different glomeruli
represent different odorant receptors, the results described
above suggest that pairs of M/T cells each receiving different
odorant receptor inputs show synchronized spike discharges when
both receptors are activated by one or a mixture of odor molecules.
5-3. Possible long range synchronization of M/T cells
Dendrodendritic reciprocal synapses between M/T cells and
granule cells are thought to be responsible for the synchronized
firings of M/T cells. According to the previous report, M/T cells
extend their secondary dendrites tangentially about 850 pm (Mori
et al 1983) , and form extensive dendrodendritic synaptic
connections with granule cells. Thus two mitral cells located
within 1.7 mm (850 pm X2) apart, can synchronize their spike
discharges through synaptic interactions via granule cells. In
addition to the secondary dendrites bridging mediated by granule
cells, there is a possible pathway to mediate the synchronized
activity of M/T cells. Mitral cells have several axon
collaterals in the MOB and make synaptic connections with granule
cells (Fig. 2) . Average length of axon collaterals of mitral
cells is about 1400 pm (Kishi et al. 1984) . Therefore, the axon
collaterals can propagate the rhythmic activities of M/T cells
to granule cells that are located at long distances.
39

5-4. Synchronous firing of M/T cells and olfactory cortical neurons
I showed that odor stimulation induced the synchronous
firing of the M/T cells. Possible function of synchronized spike
discharges of the M/T cell is not yet clear. Based on the
observations in other sensory systems (e.g. Murthy and Fetz 1996;
Singer 1993, 1999; Singer and Gray 1995; Usrey and Reid 1999) ,
however, it can be speculated that synchronous spike responses
of M/T cells may provide a basis for the integration of signals
derived from different odorant receptors at the level of
olfactory cortex (Kashiwadani et al. 1999; Mori et al. 1999) .
If axons of two M/T cells converge on the same target neuron in
the olfactory cortex (Fig. 11) , the synchronization of spike
discharges may greatly increase the probability of driving the
target cortical neuron because of temporal summation of synaptic
inputs from the two cells. OLFPs with similar frequencies have
been reported in the olfactory cortex (Bressler and Freeman 1980;
Bressler et al. 1987) , suggesting that synchronized outputs of
M/T cells may drive the cortical neurons effectively. Therefore,
synchronization of spike discharges of M/T cells may contribute
to combining signals derived from different odorant receptors
at the level of the olfactory cortex. Extension of the present
study to include analysis of olfactory cortical neurons, thus,
might provide us with a clue for understanding cellular
mechanisms for the integration and decoding in the olfactory
cortex of odor information.
40

Fig. 11 Summary diagrams. About 1/4 of M/T cell pairs showed synchronized oscillatory discharges by odor stimulation. The syn-chronized oscillatory spike responses among M/T cells may be mediated by dendrodendritic reciprocal synapses between M/T cell and inhibitory local inter neurons (granule cells and periglomerular cells). If the M/T cells showing synchronized spike responses project their axons onto the same target cortical neurons, synchronized spikes can drive the target neurons effectively and this cortical neuron might play as a combination detector cells.
5-5. Possible mechanisms to control the synchronization
in the MOB
Synchronized spike responses of MIT cells are presumably
mediated by dendrodendritic reciprocal synapses between M/T
cells and inhibitory interneurons such as granule cells and/or
periglomerular cells. Interestingly, most of the modulatory
centrifugal inputs terminate in the granule cell layer and
glomerular layer of the MOB (Shepherd and Greer 1990) . Thus, the
centrifugal fibers can indirectly affect the local synaptic
interactions between the inhibitory neurons and M/T cells.
A subset of pyramidal neurons in the olfactory cortex
project back mainly to the granule cells. These feedback inputs
are thought to effect the activity of granule cells (Nicoll 1971) .
Therefore, olfactory cortical neuron may control the activity
of the granule cells and thus influence the synchronized spike
discharges of M/T cells. In addition to the modulatory inputs
from olfactory cortex, other modulatory inputs derived from
non-olfactory regions to the MOB may be influenced to the
synchronization of M/T cells. These inputs arise from three
sources: locus coeruleus (noradrenergic) , raphe nuclei
(serotonergic) , and hind limb of the nucleus of the diagonal band
(cholinergic and GABAergic) (Shepherd and Greer 1990; Zaborszky
et al. 1986) . For example, noradrenergic input from locus
coeruleus terminates mainly on the granule cells (McLean et al.
1989) . The nature of the physiological actions of noradrenergic
input in the MOB is still controversy (Jahr and Nicoll 1982; Jiang
et al. 1993; McLennan 1971; Salmoiraghi et al. 1964) , however,
it might also control the activity of granule cells, and thus
the synchronized firing of the M/T cells. Interestingly,
noradrenergic inputs are necessary for olfactory memories
(Pissonnier et al. 1985; Sullivan et al. 1989) , it is possible
42

that modulation of synchronization of M/T cells by noradrenergic
inputs might play some important role for formation of olfactory
memories.
5-6. Tuning specificity enhancement by lateral
inhibition
In this thesis, I focused on the synchronized oscillatory
firing as the functional interaction among M/T cells. Besides
the synchronous firing, another type of functional interaction
among M/T cells has been known in the MOB: the tuning specificity
enhancement by lateral inhibition (Yokoi et al. 1995).
Using a panel of odor molecules with systematic variation
in molecular structure, Mori and his colleagues reported that
M/T cells show spike responses to a range of odor molecules with
similar molecular structure (Imamura et al. 1992; Katoh et al.
1993; Mori et al. 1992). They also reported that inhibitory
responses of M/T cells were elicited by odor molecules that have
structures similar to those of excitatory odor molecules (Katoh
et al. 1993, Yokoi et al. 1995). Because the inhibitory responses
are suppressed by the GABAA receptor antagonist bicuculline in
the external plexiform layer, the inhibitory effect seems to be
mediated by the GABAergic granule cells (Yokoi et al. 1995). Thus,
M/T cells associated with one glomerulus receive lateral
inhibition from the M/T cells associating with neighboring
glomeruli via dendrodendritic reciprocal synapses. These
results suggest that the synaptic interaction may enhance the
tuning specificity to odor molecules.
If one glomerulus is strongly activated while another
glomerulus is faintly activated, the contrast of the strength
of inputs is enhanced by the lateral inhibition. On the contrary,
43

if two glomeruli are strongly and simultaneously activated, M/T
cells associated with the glomeruli may fire synchronously, as
shown in the present study.
5-7. Comparison to insect olfactory system
The neuronal circuit in the insect olfactory system
resembles that of mammal's (Hildebrand and Shepherd 1997).
Olfactory sensory neurons in the antennae project their axons
to the glomeruli in the antennal lobe (possible analogue of the
olfactory bulb). Projection neurons in the antennal lobe receive
inputs from olfactory sensory neurons in several (10-20)
glomeruli and project their axons to the mushroom body (possible
analogue of the olfactory cortex). In the antennal lobe,
projection neurons receive dendrodendritic synaptic input from
the local inhibitory GABAergic neurons called local neurons.
Laurent and his colleagues have examined the olfactory
system of locusts and bees (Laurent and Naraghi 1994; Laurent
and Davidowitz 1994; Laurent et al. 1996; Wehr and Laurent 1996;
Macleod and Laurent 1996; Stopfer et al. 1997). When the odor
stimulation is applied to the antennae, robust 20-30 Hz
oscillatory field potential is induced in the mushroom body (but
not in the antennal lobe) (Laurent and Naraghi 1994; Laurent and
Davidowitz 1994). The spike responses of the projection neurons
were synchronized and phase-locked to the OLFP in the mushroom
body (Laurent et al. 1996; Laurent and Davidowitz 1994; Wehr and
Laurent 1996). Because the synchronized activity is abolished
by picrotoxin (an antagonist of the GABAA receptor) injected into
the antennal lobe, the underlying mechanism may involve GABAergic
inhibitory neurons (Macleod and Laurent 1996; Stopfer et al.
44
1997). Therefore, the mechanisms mediating the synchronized
activity of the principal neurons might be similar across the
phyla.
Interestingly, applying picrotoxin to the antennal lobe
impairs the discrimination of odor molecules with similar
molecular structures (Stopfer et al. 1997), raising the
possibility that synchronized activity of projection neurons
might play a key role for the discrimination between odors. In
this paper, however, they cannot exclude the possibility that
the change of the tuning specificity of projection neurons by
picrotoxin injections may be more effective than
desynchronization. Nevertheless, the ideas that synchronized
activity of projection neurons may play an important role for
integration of signals derived from numerous odorant receptors
and for formation of olfactory image of object are still likely.
Therefore it is important to further examine whether the
synchronized spike activities of M/T cells contribute to the
central integration of signals derived from numerous odorant
receptors in the mammalian olfactory system.
45

REFERENCES
ADRIAN, E. D. The electrical activity of the mammalian olfactory
bulb. Electroencephalogr. Clin. Neurophysiol. 2: 377-388,
1950.
ALLISON, A. C. AND WARWICK, R. T. T. Quantitative observations
on the olfactory system of the rabbit. Brain 72: 186-197, 1949.
BAUMGARTEN, R. VON., GREEN, J. D., AND MANCIA, M. Slow waves in
the olfactory bulb and their relation to unitary discharge.
Electroencephalogr. Clin. Neurophysiol. 14: 621-634, 1962.
BOEKOFF, I., TAREILUS, E., STROTMANN, J., AND BREER, H. Rapid
activation of alternative second messenger pathways in
olfactory cilia from rats by different odorants. EMBO J. 9:
2453-2458, 1990.
BRESSLER, S. L. Relation of olfactory bulb and cortex I. Spatial
variation of bulbocortical interdependence. Brain Res. 409:
285-293, 1987.
BRESSLER, S. L. AND FREEMAN, W. J. Frequency analysis of
olfactory system EEG in cat, rabbit, and rat.
Electroencephalogr. Clin. Neurophysiol. 50: 19-24, 1980.
BUCK, L. AND AXEL, R. A novel multigene family may encode odorant
receptors: a molecular bases for odor recognition. Cell 65:
175-187, 1991.
BUONVISO, N., CHAPUT, M. A., AND SCOTT, J. W. Mitral cell-to
glomerulus connectivity: an HRP study of the orientation of
mitral cell apical dendrites. J. Comp. Neurol. 307: 57-64,
1991.
46

CHESS, A., SIMON, I., CEDAR, H., AND AXEL, R. Allelic
inactivation regulates olfactory receptor gene expression.
Cell 78: 823-834, 1994.
EECKMAN, F. H. AND FREEMAN, W. J. Correlations between firing
and EEG in the rat olfactory system. Brain Research 528: 238-244,
1990.
ENGEL, A. K., KONIG, P., GRAY, C. M., AND SINGER, W.
Stimulus-dependent neuronal oscillation in cat visual cortex:
inter-columnar interaction as determined by cross-correlation
analysis. Eur. J. Neurosci. 2: 588-606, 1990.
GRAY, C. M., KONIG, P., ENGEL, A. K., AND SINGER, W. Oscillatory
responses in cat visual cortex exhibit inter-columnar
synchronization which reflects global stimulus properties.
Nature 338: 334-337, 1989.
Hamauzu, Y. Odor perception measurement by the use of odorless
room. Sangyo Kogai 5: 718-23, 1969.
HILDEBRAND, J. G. AND SHEPHERD G. M. Mechanisms of olfactory
discrimination: converging evidence for common principles
across phyla. Ann. Rev. Neurosci. 20: 595-631, 1997.
IMAMURA, K., MATAGA, N., AND MORI, K. Coding of odor molecules
by mitral/tufted cells in rabbit olfactory bulb. I. Aliphatic
compounds. J. Neurophysiol. 68: 1986-2002, 1992.
JAHR, C. E. AND NICOLL, R. A. Noradrenergic modulation of
dendrodendritic inhibition of the olfactory bulb. Nature 297:
227-228, 1982.
JIANG, M., GRIFF, E. R., ZIMMER, L. A., ENNIS, M., AND SHIPLEY,
M. T. Locus coeruleus increases perithreshold sensor-evoked
excitation of mitral cells. AChemS 15.
47

KASHIWADANI, H., SASAKI, Y. F., UCHIDA, N, AND MORI, K.
Synchronized oscillatory discharges of mitral/tufted cells with
different molecular receptive ranges in the rabbit olfactory
bulb. J. Neurophysiol. 82: 1786-1792, 1999.
KATOH, K., KOSHIMOTO, H., TANI, A., AND MORI, K. Coding of odor
molecules by mitral/tufted cells in rabbit olfactory bulb. II.
Aromatic compounds. J. Neurophysiol. 70: 2161-2175, 1993.
KISHI, K., MORI, K., AND OJIMA, H. Distribution of local axon
collaterals of mitral, displaced mitral, and tufted cells in
the rabbit olfactory bulb. J. Comp. Neurol. 225: 511-526, 1984.
KONIG, P. A method for the quantification of synchrony and
oscillatory properties of neuronal activity. J. Neurosci.
Method. 54: 31-37, 1994.
LANCET, D. AND BEN-ARIE, N. Olfactory receptors. Curr. Biol.
3: 668-674, 1993.
LAURENT, G. Dynamical representation of odors by oscillating and
evolving neural assemblies. Trends Neurosci. 19: 489-496,
1996.
LAURENT, G., WEHR, M., and DAVIDOWITZ, H. Temporal
Representation of Odors in an Olfactory Network. J. Neurosci.
16: 3837-3847, 1996.
LAURENT, G. AND DAVIDOWITZ, H. Encoding of olfactory information
with oscillating neural assemblies. Science 265: 1872-1875,
1994.
LAURENT, G. AND NARAGHI, M. Odor-induced oscillations in the
mushroom bodies of the locust. J. Neurosci. 14: 2993-3004,
1994.
48

MACLEOD, K. AND LAURENT, G. Distinct mechanisms for
synchronization and temporal patterning of odor-encoding neural
assemblies. Science 274: 976-979, 1996.
MALNIC, B., HIRONO, J., SATO, T., AND BUCK, L. B. Combinatorial
receptor codes for odors. Cell, 96: 713-723, 1999.
MASTRONARDE, D. N. Correlated firing of cat retinal ganglion
cells. I. Spontaneously active inputs to X- and Y cells. J.
Neurophysiol. 49: 303-324, 1983.
MCLEAN, J. H., SHIPLEY, M. T., NICKELL, W. T., ASTON-JONES, G.,
AND REVHER, C. K. Chemoanatomical organization of the
noradrenergic input form locus coeruleus to the olfactory bulb
of the adult rat. J. Comp. Neurol. 285: 339-49, 1989.
MCLENNAN, H. The pharmacology of inhibition of mitral cells in
the olfactory bulb. Brain Res. 29: 177-184, 1971.
MEISTER, M., LAGNADO, L., AND BAYLOR, D. A. Concerted signaling
by retinal ganglion cells. Science, 270: 1207-1210, 1995.
MOMBAERTS, P., WANG, F., DULAC, C., CHAO, S. K., NEMES, A.,
MENDELSOHN, M., EDMONDSON, J. AND AXEL, R. Visualizing an
olfactory sensory map. Cell 87: 675-686, 1996.
MOMBAERTS, P. Molecular biology of odorant receptors in
vertebrates. Annu. Rev. Neurosci. 22: 487-509, 1999.
MORI, K., KISHI, K., AND OJIMA, H. Distribution of dendrites of
mitral, displaced mitral, tufted, and granule cells in the
rabbit olfactory bulb. J. Comp. Neurol. 219: 339-355, 1983.
MORI, K AND TAKAGI, S. F. Inhibition in the olfactory bulb:
dendrodendritic interaction and their relation to the induced
49

waves . In : Food Intake and Chemical Senses, edited by K. Katsuki,
M. Sato, S. F. Takagi, and Y. Oomura. Tokyo: Univ. of Tokyo Press,
1977, p. 33-43.
MORI, K., MATAGA, N., AND IMAMURA, K. Differential specificities
of single mitral cells in rabbit olfactory bulb for a homologous
series of fatty acid odor molecules. J. Neurophysiol. 67:
786-789, 1992.
MORI, K., NAGAO, H, AND YOSHIHARA, Y. The olfactory bulb: coding
and processing of odor molecule information. Science 286:
711-715, 1999.
MORI, K. AND YOSHIHARA, Y. Molecular recognition and olfactory
processing in the mammalian olfactory system. Prog. Neurobiol.
45: 585-619, 1995.
MURTHY, V. N. AND FETZ, E. E. Synchronization of neurons during
local field potential oscillations in sensorymotor cortex of
awake monkeys. J. Neurophysiol. 76: 3968-3982, 1996.
NEF, P., HERMANS-BORGMEYER, I., ARTIERES-PIN, H., BEASLEY, L.,
DIONNE, V. E., AND HEINEMANN, S. F. Spatial pattern of receptor
expression in the olfactory epithelium. Proc. Natl. Acad. Sci.
U.S.A. 89: 8948-52, 1992.
NEUENSCHWANDER, S. AND SINGER, W. Long-range synchronization of
oscillatory light responses in the cat retina and lateral
geniculate nucleus. Nature 379: 728-733, 1996.
NICOLL, R. A. Pharmacological evidence for GABA as the
transmitter in granule cell inhibition in the olfactory bulb.
Brain Res. 35: 137-149, 1971.
ONODA, N. AND MORI, K. Depth distribution of temporal firing
patterns in olfactory bulb related to air intake cycles. J.
50

Neurophysiol. 44: 29-39, 1980.
PERKEL, D. H., GERSTEIN, G. L., AND MOORE, G. P. Neuronal spike
trains and stochastic point processes: II. simultaneous spike
trains. Biophysical J. 7: 419-440, 1967.
PHILLIPS, C. G., POWELL, T. P. S., AND SHEPHERD, G. M. Response
of mitral cells to stimulation of the lateral olfactory tract
in rabbit. J. Physiol. 168: 65-88, 1963.
PINCHING, A. J. AND POWELL, T. P. S. The neuropil of the glomeruli
of the olfactory bulb. J. Cell Sci. 9: 347-377, 1971.
PINCHING, A. J. AND POWELL, T. P. S. The neuropil of the
periglomerular region of the olfactory bulb. J. Cell Sci. 9:
379-409, 1971.
PISSONNIER, D., THIERY, J. C., FABRES-NYS, C., POINDRON, P., AND
KEVERNE, E. B. The importance of olfactory bulb noradrenalin
for maternal recognition in sheep. Physiol. Behay. 35:
361-363, 1985.
RALL, W. AND SHEPHERD, G. M. Theoretical reconstruction of field
potentials and dendrodendritic synaptic interactions in
olfactory bulb. J. Neurophysiol. 31: 884-915, 1968.
RALL, W., SHEPHERD, G. M. REESE, T. S., AND BRIGHTMAN, M. W.
Dendrodendritic synaptic pathway for inhibition in the
olfactory bulb. Exp. Neurol. 14: 44-56, 1966.
ROYET, J. P., SOUCHIER, C., JOURDAN, F., AND PLOYE, H.
Morphometric study of the glomerular population in the mouse
olfactory bulb: numerical density and size distribution along
the rostrocaudal axis. J. Comp. Neurol. 270: 559-568, 1988.
ROYET J. P., JOURDAN, F., PLOYE, H., AND SOUCHIER, C.
51
Morphometric modifications associated with early sensory
experience in the rat olfactory bulb: II. Stereological study
of the population of olfactory glomeruli. J. Comp. Neurol. 289:
594-609, 1989.
REED, R. R. Signaling pathways in odorant detection. Neuron 8:
205-209, 1992.
RESSLER, K. J., SULLIVAN, S. L., AND BUCK, L. B. Information
coding in the olfactory system: evidence for a stereotyped and
highly organized epitope map in the olfactory bulb. Cell 79:
1245-1255, 1994.
RIBAK, C. E., VAUGHN, J. E., SAITO, K., BARBER, R., AND ROBERTS,
E. Glutamate decarboxylase localization in neurons in the
olfactory bulb. Brain Res. 126: 1-18, 1977.
ROYET, J. P., SOUCHIER, C., JOURDAN, F., AND PLOYE, H.
Morphometric study of the glomerular population in the mouse
olfactory bulb: numerical density and size distribution along
the rostrocaudal axis. J. Comp. Neurol. 270: 559-568, 1988.
ROYET, J. P., JOURDAN, F., PLOYE, H., AND SOUCHIER, C.
Morphometric modifications associated with early sensory
experience in the rat olfactory bulb: II. stereological study
of the population of olfactory glomeruli. J. Comp. Neurol. 289:
594-609, 1989.
ROYET J. P., DISTEL, H., HUDSON, R., AND GERVAIS, R. A re-
estimation of the number of glomeruli and mitral cells in the
olfactory bulb of rabbit. Brain Res. 788: 35-42, 1998.
SALMOIRAGHI, G. C., BLOOM, F. E., AND COSTA, E. Adrenergic
mechanisms in rabbit olfactory bulb. Am. J. Physiol. 207:
1417-1424, 1964.
52

SHEPHERD, G. M. Discrimination of molecular signals by the
olfactory receptor neuron. Neuron 13: 771-790, 1994.
SHEPHERD, G. M. AND GREER, C. A. Olfactory bulb. In: The
Synaptic Organization of the Brain. edited by G. M. Shepherd.
New York: Oxford University Press, 1990, p. 139-169.
SINGER, W. Synchronization of cortical activity and its putative
role in information processing and learning. Annu. Rev. Physiol.
55: 349-374, 1993.
SINGER, W. Neuronal synchrony: a versatile code for the
definition of relations? Neuron 24: 49-65, 1999.
SINGER, W. AND GRAY, C. M. Visual feature integration and the
temporal correlation hypotheses. Annu. Rev. Neurosci. 18:
555-586, 1995.
STOPFER, M., BHAGAVAN, S., SMITH, B., AND LAURENT, G. Impaired
odour discrimination on desynchronization of odour-encoding
neural assemblies. Nature 390: 70-74, 1997.
STROTMANN, J., WANNER, I., KRIEGER, J., RAMING, K., AND BREER,
H. Expression of odorant receptors in spatially restricted
subsets of chemosensory neurons. Neuroreport 3: 1053-1056,
1992.
SULLIVAN, R. M., WILSON, D. A., AND LEON, M. Norepinephrine and
learning-induced plasticity in infant rat olfactory system. J.
Neurosci. 9: 3998-4006, 1989.
SULLIVAN, S. L., ADAMSON, M. C. RESSLER, K. J., KOZAK, C. A.,
AND BUCK, L. B. The chromosomal distribution of mouse odorant
receptor genes. Proc. Natl. Acad. Sci. USA 93: 884-888, 1996.
TS'O, D. AND GILBERT C. The organization of chromatic and spatial
interactions in the primate striate cortex. J. Neurosci. 8:
53

1712-1727, 1988.
USREY, W. M. AND REID, R. C. Synchronous activity in the visual
system. Annu. Rev. Physiol. 61: 435-456, 1999.
VASSAR, R., CHAO, S. K., SITCHERAN, R., NUNEZ, J. M., VOSSHALL,
L. B., AND AXEL, R. Topographic organization of sensory
projections to the olfactory bulb. Cell 79: 981-991, 1994.
WEHR, M AND LAURENT, G. Odor encoding by temporal sequences of
firing in oscillating neural assemblies. Nature 384: 162-166,
1996.
YOKOI, M., MORI, K., AND NAKANISHI, S. Refinement of odor
molecule tuning by dendrodendritic synaptic inhibition in the
olfactory bulb. Proc. Natl. Acad. Sci. USA. 92: 3371-3375,
1995.
ZABORSZKY, L., CARLSEN, J., BRASHEAR, H. R., AND HEIMER, L.
Cholinergic and GABAergic afferents to the olfactory bulb in
the nucleus of the horizontal limb of the diagonal band. J.
Comp. Neurol. 243: 488-509, 1986.
ZHAO, H., IVIC, L., OTAKI, J. M., HASHIMOTO, M., MIKOSHIBA, K.,
AND FIRESTEIN S. Functional expression of a mammalian odorant
receptor. Science 279: 237-242, 1998.
54

ACKNOWLEDGMENTS
I am very grateful to Prof. Fujio Murakami, Dr. Nobuhiko
Yamamoto and Prof. Kensaku Mori (RIKEN) for giving me a chance
to investigate the olfactory system in the Brain Science
Institute, RIKEN, for consistent encouragement and for helpful
advice to complete this thesis. I wish to great thank to Dr.
Yoichi Oda, Prof. Ichiro Fujita and Prof. Takashi Kurahashi for
critical reading of this thesis. I would like to express my
thanks to Dr. Yasnory F. Sasaki and Dr. Naoshige Uchida for their
helpful advice, collaboration and critical discussion. I also
thank Drs. Hiroshi Nagao, Lillia Masuda-Nakagawa, Masahiro
Yamaguchi, Harald von Campenhausen, Harumi Saito (RIKEN) and Drs.
Wen-Jie Song, Hironobu Katsumaru, Hiroaki Kobayashi, Ryuichi
Shirasaki (Osaka University) fora number of helpful suggestions,
and Ms. Keiko Aijima for her excellent technical assistance.
Finally I thank my father Prof. Hiroyuki Kashiwadani and my mother,
Harumi Kashiwadani for their continuous encouragement.
55