
SYARAHAN PERDANA 2011 - Penerbit UTHMpenerbit.uthm.edu.my/pdf/syarahan_perdana_siri_3.pdf ·...
91
SYARAHAN PERDANA 2011 WATER POLLUTION : THE NEVER ENDING STORY
Transcript of SYARAHAN PERDANA 2011 - Penerbit UTHMpenerbit.uthm.edu.my/pdf/syarahan_perdana_siri_3.pdf ·...
SYARAHAN PERDANA 2011
WATER POLLUTION : THE NEVER ENDING STORY


SYARAHAN PERDANA 2011
WATER POLLUTION : THE NEVER ENDING STORY
Ab. Aziz Abdul Latiff Professor in Environmental Engineering
Faculty of Civil and Environmental Engineering Universiti Tun Hussein Onn Malaysia (UTHM)
Malaysia
2011

© Penerbit UTHM First Edition 2011 All Rights reserved. No part of this publication may be reproduced, stored in a retrieval system, or transmitted, electronic, mechanical photocopying, recording or otherwise, without the prior permission in writing of the Publisher, nor be otherwise circulated in any form of binding or cover other than that in which it published and without a similar condition being imposed on the subsequent purchaser. Perpustakaan Negara Malaysia Cataloguing—in—Publication Data Ab. Aziz Abdul Latif
Water Pollution : the never ending story / Ab.Aziz Abdul Latif. Syarahan Perdana 2011 ISBN 978-967-5457-60-9 1. Water—Pollution. 2. Water quality management. I. Title. II. Series. 363.739409595
Terbitan : Pejabat Penerbit Universiti Tun Hussein Onn Malaysia 86400 Parit Raja, Batu Pahat Johor Darul Ta’zim Tel : 07-453 7454 / 7051 Faks : 07-453 6145 Laman Web : http://penerbit.uthm.edu.my/ E-mel : [email protected]

CONTENT PAGE
1 INTRODUCTION TO WATER 1.0 Water 1 1.1 Distribution of Earth’s water 1 1.2 Groundwater 3 1.2.1 Fresh Groundwater 4 1.2.2 Saline Groundwater 4 1.3 Water in Glaciers and Icecaps 6 1.4 Brackish Water 7 1.5 Saline Water 8 1.6 Hydrologic Cycle 8
2 WATER CHARACTERISTICS 2.0 Water Characteristics 10 2.1 Microbial Aspects 10 2.2 Biological Characteristics 10 2.3 Chemical Characteristics 11 2.4 Physical Characteristics 11 2.5 Water Use and Water Quality Deterioration 11
3 WATER POLLUTION 3.0 Introduction to Water Pollution 15 3.1 Sources of Water Pollution 15 3.1.1 Point Sources 15 3.1.2 Non Point Sources 16 3.2 Mesurement of Water Pollutants 17 3.2.1 Dissolve Oxygen 17 3.2.2 Temperature 18 3.2.3 Turbidity 18 3.2.4 pH 19 3.2.5 Total Suspended Solids (TSS) 19 3.2.6 Conductivity 20 3.2.7 Hardness 20 3.2.8 Coliform Bacteria 20 3.2.9 Biological Oxygen Demand 20 3.3 Types of Water Pollutant 21 3.3.1 Biological Pollutants 21 3.3.2 Chemical Pollutants 21 Nutrients 21 Oil 22 Radioactive Waste 22

3.3.3 Sediments as Physical Pollutants 22 3.4 Eutrophication 24 3.5 Groundwater Pollution 26 3.6 Global Water Pollution 28 4 EFFECT OF WATER POLLUTION 4.0 Effect Of Water Pollution to Human Health 29 4.1 Physical Pollutants 29 4.1.1 Heat 29 4.2 Chemical Pollutants 30 4.2.1 Heavy Metal Pollution 30 4.2.2 Other Polluting Chemicals 31 4.2.3 Oil Leaks 32 4.2.4 Radioactive Waste 33 4.2.5 Insecticide 34 4.2.6 Industrial Chemicals 34 4.2.7 By-Product Pollutants 35 4.3 Biological Pollutants 36 4.4 Waterborne Diseases 36 4.4.1 Minamata Disease 39 4.4.2 Itai-itai Disease 41 5 WATER SUPPLY 5.0 Introduction to Water Supply 42 5.1 Aeration 43 5.2 Flocculation 43 5.3 Sedimentation 44 5.4 Filtration 45 5.5 Disinfection 46 5.6 Advanced Drinking Water Treatment 46
6 WASTEWATER 6.0 Introduction to Wastewater 49 6.1 Wastewater 49 6.1.1 Domestic Wastewater (Sewage) 49 6.1.2 Industrial Wastewater 50 6.2 BOD Pollution Load 50 6.3 Municipal Wastewater 51 6.4 Onsite Sewage Systems 52 6.5 Municipal Wastewater Treatment 54 6.5.1 Primary Treatment 54
(Screening, Grit Removal and Settling) 6.5.2 Secondary Treatment 54 6.5.3 Activated Sludge Bacteria 55 6.5.4 Tertiary Treatment 56

6.5.5 Disinfection 57 6.6 Methods of Secondary Wastewater Treatment 59 6.6.1 The Suspended Microorganisms Process 59 6.6.2 The Attached Growth Process 59 6.6.3 Trickling Filter 60 6.6.4 Rotating Biological Contactor (RBC) 61
7 WATER QUALITY MANAGEMENT 7.0 Introduction 62 7.1 Water Quality Index (WQI) 62 7.2 River Classification in Malaysia 63 7.3 WQI Formula And Calculation 64 7.4 How Not to Drink Contaminated Water 68 7.5 Best Management Practices (BMPs) to 69
Protect the Water Quality 7.5.1 Wastewater Discharges 69
7.5.2 Wise Use of Fertilizers 70 7.5.3 Wise Applications of Pesticides 70 7.5.4 Prevent Erosion in Plantation and 70 Landscaping Practices 7.5.5 Control of Vehicle Wash Wastewater 70 7.5.6 Animal Waste Disposal 70 7.5.7 Use and Dispose of Household Chemicals Safely 70 7.6 CONCLUSION 71
PREFACE
This booklet provides the useful information and insight on earth water inventory, water characteristics, water pollution, effect of water pollution, water supply, wastewater and water quality management. As we know, water is life to every living thing on this planet. So, it is the duty of everyone to protect the water. Allah says in the Quran: “Have not those who disbelieve known that the heavens and the earth were joined together as one united piece, then We parted them? And We have made from water every living thing. Will they not then believe?” (21:30).
Modern science has proven that water is the basic component of life. Every cell in living things is built based on water. Scientists have also proven that water is a necessary and active substance used in changes and reactions which occur inside the body. Since life depends on water, it is the only fluid which every living thing needs. Some needs large amount of water to survive since they live in it, but there are some which needs little amount such as micro-organisms. They all need water no matter how large or small they may be, starting with micro-organisms to the largest living animals on earth.
The main component of the human and animal body is water. So too are the plants. It is proven by scientific analysis showing the body of an adult human from the age of 15 years and upwards contains approximately 71% of water. As for the children, their bodies contain 93% of water.
Water also covers 71% of the earth’s surface. About 97% of water of earth’s water is saline is in the ocean. Only 3% of total amount of water is fresh water is found as surface and groundwater. From this 3%, 68.7 % of it is locked up in the icecaps and glaciers, 30.1% as groundwater and merely 0.3% as surface water in rivers, lakes and streams. This 3% of water assessable to us as fresh water is the portion that 6 billion lives depends on. Since the amount of water available is scarce and human activities had polluted much of the water, something has to be done to alleviate the problem. The advent of industries has much contributed to water pollution. Industrial water pollution has impacted many of the rivers throughout the world. This has caused unprecedented impact upon human livelihood as rivers are source of life through its water resource as well as aquatic animals that live in it. Pollution of water bodies especially rivers and lakes will have long term damaging effect of the life of people. People will suffer from chronic diseases such as cancer which resulted from using water contaminated with all kinds of hazardous chemicals thrown into the rivers by the pollution makers. Toxic chemicals such as polychlorinated-biphenyls (PCB) and heavy metals are dumped into rivers indiscriminately in the past and even today in some countries. This situation has produced a lot of polluted rivers, lakes and water bodies across the world thus creating a never ending story of water pollution.

BIOGRAPHICAL SKETCH
Background He was born on the 20th April 1958 in Gemencheh, Negeri Sembilan. He attended Sekolah Datuk Abdullah, Gemencheh in 1965 for his primary education and then was offered a place in a boarding school, Sekolah Datuk Abdul Razak (SDAR) Tanjung Malim in 1971 which later moved to Seremban in 1972. He attended SDAR until he completed his Malaysian Certficate of Education (MCE) in 1976. He was briefly registered as Form Six student in SDAR in 1977. Later that year he was offered a scholarship by the Ministry of Education to study in the United Kingdom to do ‘A Levels’ at Lytham St. Annes College of Further Education in the United Kingdom. After completing the A Levels studies, he was offered by University of Salford to read Civil Engineering from which he graduated in 1982. He later enrolled into Post Graduate Certificate in Education (PGCE) in Malayan Teachers College in Penang for one year (1982 to 1983) as required by Ministry of Education. Upon completion, he was posted to Politeknik Kuantan in September 1983. He worked at the polytechnic until 1991 when he was offered the post-graduate scholarship to further his study at Masters level at UTM in 1991. Upon graduation of his Masters degree in 1993, he was posted to Politeknik Batu Pahat which was later converted to Pusat Latihan Staf Politeknik(PLSP) in 1993 then to ITTHO (1996) and was later to KUiTTHO (2001). In February 2007 KUiTTHO was given the full university status and renamed Universiti Tun Hussein Onn Malaysia (UTHM). Until now he has 28 years of working experience in engineering and technical education. Teaching and Management He had taught numerous engineering courses such as fluid mechanics, hydraulics, environmental engineering, environmental management, solid waste management, water supply engineering, water resource engineering and wastewater engineering both at undergraduate and post-graduate levels. He was appointed the Civil Engineering Head of Department in 1995 during PLSP time. He remained in that post for 12 straight years until 2007. He earned the Associate Professorship in 2001.
Ab. Aziz bin Abdul Latiff Professor in Environmental Engineering Faculty of Civil and Environmental Engineering Universiti Tun Hussein Onn Malaysia (UTHM) Malaysia

In April 2007 he was appointed to the post of Deputy Dean (Academic and International) in FKAAS. He was appointed as the Dean of Centre for Diploma Studies, Universiti Tun Hussein Onn Malaysia (UTHM) in August 2009. Later on that year he obtained his full Professorship. Research Malaysia is still in the process of developing best practices in water and wastewater treatment especially high strength wastewater produced by the industries. This is the reason for him to focus his research in this area. He is active in wastewater engineering research especially in anaerobic treatment of high strength wastewater such as POME (Palm Oil Mill Effluent). He is also active in river water quality research group. Currently he has modeled three main rivers in Batu Pahat, Johor, using QUAL2E. Other than that, he is also involved in the remediation of contaminated soil by phytoremediation. He had successfully supervised 70 undergraduate final year projects, 15 Master students (by research) and 2 Master students (by coursework). Another 5 students are currently being supervised in the same program. He is also currently supervising 3 PhD candidates. Until 2009, he has conducted 21 research projects amounting nearly RM900,000.00 which he was the leader of 12 of those projects. His work in research paid off as he won 5 research awards (2 silver and 3 bronze medals) to date. He was awarded the 2005 University Research Award for his contribution in research at the university, national and international level and Special Research Award for winning an international award for one of the projects. He had also been awarded the Excellent Service Award by the university in the year 1999 and 2004. Publications From the research he had conducted, he has managed to publish over 85 articles in local and international publications (journals and conference proceedings). Apart from writing academic research papers, he has also written several books, teaching modules and e-learning module in water and environmental engineering. His first book titled Civil Engineering Studies was published in 2003 which is used as text book in all technical schools in Malaysia. He was involved as editor and reviewer in a number journals such as Journal of Science and Technology UTHM and international journals such as Journal of Water Science and Technology (published by International Water Association), International Journal of Environment and Waste Management (IJEWM) and International Journal of Environmental Engineering (IJEE). Both IJEWM and IJEE are published by Inderscience Publishers in Switzerland. Future Research Undertakings He will continue to strive and work hard in to elevate the university standing both locally and internationally. He would pursue his research in his main field of interest, water and wastewater treatment. The problems of acid contamination in

Batu Pahat river system which is the main source of water supply has not been solved even after more than ten years it first occurred. The water quality problem in Batu Pahat river system is aggravated by the presence of high concentration of three metals namely ferrum (Fe), manganese (Mn) and aliminium (Al). Adding to these problems are the effluent discharges from industries in Batu Pahat. The effluent discharges had lowered the quality of receiving streams around the industrial area which in turn affected the quality of Sungai Batu Pahat whose water quality index is already in the medium range. Another area that he would be concentrating is the treatment of high strength wastewater resulted from manufacturing of palm oil. The Palm Oil Mill Effluent (POME) has strength of up 50,000 mg/l of COD. The conventional treatment of using anaerobic ponds had achieved the required discharge standard stipulated in the Environmental Quality Act 1974 but anaerobic ponds are not the preferred method because of the uncontrolled gas emission. Advanced treatment using UASB or HUASB or any other advanced treatment method has to be introduced. He hoped to contribute a lot more in his field of expertise in the coming years for Malaysia to become a developed nation by the year 2020.

ACKNOWLEDGEMENT The author would like to express his utmost gratitude to the Vice Chancellor, Deputy Vice Chancellors, Deans of Faculties and other University’s Senior Officers for the support he had received throughout his career in the university. He would also like to thank his family, especially his wife and his five children for their uncompromising sacrifice and support.

1 WATER POLLUTION : THE NEVER ENDING STORY
CHAPTER 1
INTRODUCTION TO WATER
1.0 Water Water is the most precious natural resources supporting the existence of life on earth. It comprises seventy percent of the surface of the earth. No life would ever exist on earth without water. Unfortunately human is disregarding the importance of keeping water clean. Human is creating so much activity to support life that water has become more and more polluted by the day. Water pollution has become a major concern of most people in the world. More and more people are affected by the phenomenon. Water pollution originated from activities created by human and it is very common in the third world countries. Thousands of people are made sick and died everyday throughout the world because of water pollution. Thousands of rivers, streams and lakes are polluted. The pollution undoubtedly reached the seas. It affected life in the sea water especially on the coastal areas. 1.1 Distribution of Earth Water Water distribution on earth is shown in Figure 1.1. It is distributed on and before the surface. Water distributed on the surface is called surface water whilst below it is called groundwater. About 97% of water of earth’s water (saline) is in the ocean as shown in the left hand side bar in Figure 1.1. Three percent of fresh water is found as surface and groundwater is shown in the middle bar. 68.7 % of it is locked up in the icecaps and glaciers, 30.1% as groundwater and merely 0.3% as surface water in rivers, lakes and streams. This 3% of water assessable to us as fresh water is the portion that 6 billion lives depends on.
Figure 1.1 : Distribution of Earth’s Water (Source : USGS)

2 WATER POLLUTION : THE NEVER ENDING STORY
Estimation of the amount of water distributed on earth is shown in Table 1.1 below. The oceans which make up of 97% of earth’s water carry 1,340 million cubic kilometres of water. This is equivalent to 500 billion olympic size swimming pools (2500 m3 per pool). The consumable fresh water only consists of fresh groundwater (10.5 million km3), fresh water lakes (91,000 km3), swamps (11,470 km3) and rivers a mere 2,120 km3. This is the amount of water that supports life on earth which includes the human, animals and the plant kingdom.
Table 1.1 : Estimate of Global Water Distribution
Water source Water
volume, in cubic miles
Water volume, in cubic
kilometers
Percent of freshwater
Percent of
total water
Oceans, Seas, & Bays 321,000,000 1,338,000,000 -- 96.5
Ice caps, Glaciers, & Permanent Snow 5,773,000 24,064,000 68.7 1.74
Ground water 5,614,000 23,400,000 -- 1.7
Fresh 2,526,000 10,530,000 30.1 0.76
Saline 3,088,000 12,870,000 -- 0.94
Soil Moisture 3,959 16,500 0.05 0.001
Ground Ice & Permafrost 71,970 300,000 0.86 0.022
Lakes 42,320 176,400 -- 0.013
Fresh 21,830 91,000 0.26 0.007
Saline 20,490 85,400 -- 0.006
Atmosphere 3,095 12,900 0.04 0.001
Swamp Water 2,752 11,470 0.03 0.0008
Rivers 509 2,120 0.006 0.0002
Biological Water 269 1,120 0.003 0.0001
Source: Igor Shiklomanov's chapter "World fresh water resources" in Peter H. Gleick (editor), 1993, Water in Crisis: A Guide to the World's Fresh Water Resources (Oxford
University Press, New York).

3 WATER POLLUTION : THE NEVER ENDING STORY
1.2 Groundwater 1.2.1 Fresh Groundwater
Groundwater is formed when rain falls to the ground. Some of it flows along the surface to streams or lakes, some of it is used by plants, some evaporates and returns to the atmosphere, and some sinks into the ground. This can be demonstrated by pouring a glass of water onto a pile of sand. Where does the water go? The water moves into the spaces between the particles of sand.
Groundwater is thus water that is found underground flowing in the cracks and spaces in soil, sand and rock (Figure 1.2). Groundwater is stored in the ground and moves slowly through the layers of soil, sand and rocks called aquifers. Aquifers are water bearing typically consist of gravel, sand, sandstone, or fractured rock, like limestone. These materials are permeable because they have large connected spaces that allow water to flow through. Groundwater flows depends on the size of the spaces in the soil or rock and how well the spaces are connected.
Figure 1.2 : Position of Groundwater (Source : Macmillan, 1994)
The space where water fills the aquifer is called the saturated zone (or saturation zone). At the top of the saturation zone is the water table. When water table is located at the soil surface, the ground is said to be waterlogged. Water table may also found hundreds of feet below ground especially in arid regions.
Groundwater can be found almost everywhere. The water table may be deep or shallow; and may rise or fall depending on many factors. Heavy rains or melting snow may cause the water table to rise, or heavy pumping of groundwater supplies may cause the water table to fall.

4 WATER POLLUTION : THE NEVER ENDING STORY
1.2.2 Saline Groundwater The amount of salt in a given water sample is termed as salinity. It usually is referred to in terms of total dissolved solids (TDS) and is measured in milligrams of solids per liter (mg/L). TDS concentration in any water greater than 1,000 mg/L commonly is considered saline. This can considered as upper limit of freshwater is based on the suitability of water for human consumption. Although water with TDS greater than 1,000 mg/L is used for domestic supply in areas where water of lower TDS content is not available, water containing more than 3,000 mg/L is generally too salty to drink. The U.S. Environmental Protection Agency (USEPA) has established a guideline (secondary maximum contaminant level) of 500 mg/L for dissolved solids. Ground water with salinity greater than seawater (about 35,000 mg/L) is referred to as brine. 1.3 Water in Glaciers and Icecaps
Glaciers are frozen water body found in mountains of temperate countries. Even though it is rarely seen, (shown in Figure 1.3), they are a big item when we talk about the world's water supply. Almost 10 percent of the world's land mass is currently covered with glaciers, mostly in places like Greenland, Arctic and Antarctica. Glaciers are important features in the hydrologic cycle and affect the volume, variability, and water quality of runoff in areas where they occur. But a lot of the glaciers has been lost as many are already melted due the global warming
Looking at another way, glaciers are just frozen rivers of ice flowing downhill. Glaciers begin life as snowflakes. When the snowfall in an area far exceeds the melting that occurs during summer, glaciers start to form. The weight of the accumulated snow compresses the fallen snow into ice. These "rivers" of ice are tremendously heavy, and if they are on land that has a downhill slope the whole ice patch starts to slowly grind its way downhill. These glaciers can vary greatly in size, from a football-field sized patch to a river a hundreds of miles long. Icecaps are permanent form of ice which covers the North Pole and South Pole (Figure 1.4 and 1.5). But unfortunately the icecaps are getting thinner because of global warming.

5 WATER POLLUTION : THE NEVER ENDING STORY
Figure 1.3 : A Glacier
Figure 1.4 : Icecaps in the North Pole
Glacier

6 WATER POLLUTION : THE NEVER ENDING STORY
Figure 1.5 : Icecaps in the South Pole 1.4 Brackish Water Brackish water is formed from the result of the mixing of seawater and fresh water. This usually occurs in the estuaries (Figure 1.6), or it may occur in brackish fossil aquifers. Brackish water is water that has more salinity than fresh water, but not as much as seawater.
Figure 1.6 : Brackish water in an estuary
Brackish water
Saline seawater

7 WATER POLLUTION : THE NEVER ENDING STORY
The word brackish comes from the Middle Dutch root "brak," meaning "salten" or "salty". Certain human activities can produce brackish water, in particular certain civil engineering projects such as dikes and the flooding of coastal marshland to produce brackish water pools for freshwater prawn farming. Brackish water is also the primary waste product of the salinity gradient power process. Because brackish water is hostile to the growth of most terrestrial plant species, without appropriate management it is damaging to the environment. Backish water contains between 0.5 and 30 grams of salt per litre more often expressed as 0.5 to 30 parts per thousand (ppt or %). Thus, brackish covers a range of salinity regimes and is not considered a precisely defined condition. It is characteristic of many brackish surface waters that their salinity can vary considerably over space and/or time. 1.5 Saline Water Saline water is water that contains a significant concentration off dissolved salts (Nacl). Concentration is usually expressed in parts per million (ppm) of salt. Water that is saline contains significant amount of dissolved salts. In this case, the concentration is the amount (by weight) of salt in water, as expressed in "parts per million" (ppm). Water is categorized as saline when it has a concentration of 30,000 ppm to 50,000 ppm of dissolved salts (Table 1.2), then one percent (10,000 divided by 1,000,000) of the weight of the water comes from dissolved salts. The salinity concentration level used by United States Geological Survey classifies saline water in three categories. Slightly saline water contains around 1,000 to 3,000 ppm. Moderately saline water contains roughly 3,000 to 10,000 ppm. Highly saline water has around 10,000 to 35,000 ppm of salt. Seawater has a salinity of roughly 35,000 ppm, equivalent to 35 g/L. Normally, moderately or highly salinated water is of little use to humans. Humans cannot drink salinated water directly, nor is it suitable for irrigating crops.
Table 1.2 : Water Salinity
Water salinity based on dissolved salts in parts per million (ppm)
Fresh water Brackish water Saline water Brine
< 0.5 0.5 – 30,000 30,000 – 50,000 > 50000
The most saline water on earth is found in the Dead Sea. The salinity of the Dead Sea had ranged between 300,000 and 400,000 parts per million (ppm). This means the Dead Sea is 10 times more saline than the open ocean. Due to the salinity, crystals of salts are easily formed on the beach of the Dead Sea (Figure 1.7) and man can float on the surface (Figure 1.8) due to buoyancy created by the density of the Dead Sea water of 1400 kg/m3. Crystals of salts are even formed on our body if we dipped into the saline water and left it to dry.

8 WATER POLLUTION : THE NEVER ENDING STORY
Figure 1.7 : Salt crystals formed naturally on the Dead Sea beach.
(Source : http://www.atlastours.net/atlas_tours.jpg)
Figure 1.8 : Man floating on the surface of Dead Sea reading magazine
1.6 Hydrologic Cycle Hydrologic cycle described the transportation of water through the atmosphere, on and inside the ground as shown in Figure 1.9. The hydrologic cycle starts with the evaporation of water from the surface of the oceans, lakes and rivers. As moist air is lifted, it cools and water vapour condenses to form clouds. Moisture in the form of clouds is transported around the globe until it returns to the surface as precipitation. Once the water reaches the ground, the water will either evaporate back into the atmosphere or penetrate the ground surface and become groundwater. Groundwater travels underground following the slope of the gradient and released back into streams, rivers, lakes or the ocean. Some is

9 WATER POLLUTION : THE NEVER ENDING STORY
released back into the atmosphere through transpiration of the living plants. The balance of water that remains on the earth's surface is runoff, which empties into lakes, rivers and streams and is carried back to the oceans, where the cycle begins again.
Figure 1.9 : The hydrologic cycle (Source : http://www.centerforlakewashingtonstudies.com)

10 WATER POLLUTION : THE NEVER ENDING STORY
CHAPTER 2
WATER CHARACTERISTICS
2.0 Water Characteristics
Water characteristics is a technical term that is based upon the characteristics of water in relation to guideline values of what is suitable for human consumption and for all usual domestic purposes, including personal hygiene. Components of water quality include microbial, biological, chemical, and physical aspects.
2.1 Microbial Aspects
Microbes are microorganisms which are present in water. Some types of microbes can be dangerous to human as well as animals (pathogenic) but some are actually helping us for example in the treatment of wastewater. Drinking water should not include microorganisms that are known to be pathogenic. It should also not contain bacteria that would indicate excremental pollution, the primary indicator of which are coliform bacteria that are present in the feces of warm-blooded organisms. Chlorine is the usual disinfectant, as it is readily available and inexpensive. Unfortunately, it is not fully effective, as currently used, against all organisms.
2.2 Biological Characteristics
Parasitic protozoa and helminthes are also important biological indicators of water quality. Species of protozoa is introduced into water supply through human or animal fecal contamination. Some species of the protozoa are pathogenic. Most common among the pathogenic protozoans are Entamoeba and Giardia. It is difficult to detect the presence of protozoa in water supply since coliforms cannot be used as direct indicators because of the greater resistance of these protozoans to inactivation by disinfection. Drinking water sources that are not likely to be contaminated by fecal matter should be used where possible due to the lack of good indicators for the presence or absence of pathogenic protozoa. A single mature larva or fertilized egg of parasitic roundworms and flatworms can cause infection when transmitted to humans through drinking water. The measures currently available for the detection of helminths in drinking water are not suitable for routine use.

11 WATER POLLUTION : THE NEVER ENDING STORY
2.3 Chemical Characteristics
Pure water does not contain any chemical elements and compounds. Chemical contamination of water sources may be due to certain industries and agricultural practices, or from natural sources. When toxic chemicals are present in drinking water, there is the potential that they may cause either acute or chronic health effects. Chronic health effects are more common than acute effects because the levels of chemicals in drinking water are seldom high enough to cause acute health effects. Since there is limited evidence relating chronic human health conditions to specific drinking-water contaminants, laboratory animal studies and human data from clinical reports are used to predict adverse effects.
2.4 Physical Characteristics
The turbidity, color, taste, and odor of water can be monitored. Turbidity should always be low, especially where disinfection is practiced. High turbidity can inhibit the effects of disinfection against microorganisms and enable bacterial growth. Drinking water should be colorless, since drinking-water coloration may be due to the presence of colored organic matter. Organic substances also cause water odor, though odors may result from many factors, including biological activity and industrial pollution. Taste problems relating to water could be indicators of changes in water sources or treatment process. Inorganic compounds such as magnesium, calcium, sodium, copper, iron, and zinc are generally detected by the taste of water, and contamination with the oxygenated fuel additive MTBE has affected the taste of some water.
2.5 Water Use and Water Quality Deterioration Water is an essential element to life and the activities associated with life. Water is being used in all aspects of living whether human, animal and even plants. In the early civilisation, water is particularly used for rural and agricultural use. As civilisation developed, has led to a shift in the pattern of water use from rural/agricultural to urban/industrial, generally according to the following sequence: drinking and personal hygiene, fisheries, navigation and transport, livestock watering and agricultural irrigation, hydroelectric power, industrial production (e.g. pulp and paper, food processing), industrial cooling water (e.g. fossil fuel and nuclear power plants), recreational activities and wildlife conservation. Fortunately, the water uses with the highest demands for quantity often have the lowest demands for quality. Drinking water, by contrast, requires the highest quality water but in relatively small quantities. The increase of industrialisation and the growth of large urban centres have been accompanied by increases in the pollution stress on the aquatic environment. Since ancient times, water in rivers, lakes and oceans has also been considered as a convenient receiver of wastes. This use (or abuse) conflicts with almost all other uses of water and most seriously with the use of freshwater for drinking, personal hygiene and food processing. The use of water by human activities has created significant impacts on the quality of the aquatic environment (Table 2.1). These activities include hydrological changes such as

12 WATER POLLUTION : THE NEVER ENDING STORY
storing water in reservoirs or transferring water from one drainage area to another. Human use of water for almost all purposes results in the deterioration of water quality and generally limits the further potential use of the water. The major types and the extent of deterioration in freshwater quality are summarized in Table 2.2.
Table 2.1 : Common Water Uses
Water Uses Consuming Contaminating Domestic use Yes Yes Livestock watering Yes Yes Irrigation Yes Yes Aquaculture Yes Yes Commercial fisheries Yes Yes Forestry and logging No1 Yes Food processing Yes Yes Textile industry Yes Yes Pulp and paper industry Yes Yes Mining Yes Yes Water transportation No Yes Hydroelectric power generation
No No2
Nuclear power generation Yes Yes Recreation No Yes
1 Water availability may be altered due to changes caused in run-off regimes 2 Thermal characteristics of the water body may be altered
Table 2.2 : Freshwater quality deterioration at global level
Parameters Rivers Lakes Reservoirs Groundwaters
Pathogens xxx x2 x2 x Suspended solids xx oo x oo Decomposable organic matter xxx x xx x Eutrophication x xx xxx oo Nitrate as a pollutant x o o xxx Salinisation x o o xxx Heavy metals xx xx xx xx5 Organic micro-pollutants xx x xx xxx5 Acidification x xx x o Changes to hydrological regimes xx xx xx x
(Source: Modified from Meybeck and Helmer, 1996) Radioactive and thermal wastes are not considered here.
xxx Globally occurring, or locally severe deterioration xx Important deterioration x Occasional or regional deterioration o Rare deterioration oo Not relevant

13 WATER POLLUTION : THE NEVER ENDING STORY
1 This is an estimate. At the regional level, these ranks may vary greatly according to
the degree of economic development and the types of land use 2 Mostly in small and shallow water bodies 3 Other than that resulting from aquatic primary production 4 Algae and macrophytes 5 From landfills and mine tailings 6 Water diversion, damming, over-pumping, etc. Strategies have to be developed and implemented to resolve the conflicts between quality deterioration and water use as follows: • The quality of water and of the aquatic environment is determined and water-use
procedures that prevent deterioration are adopted. • Wastes are treated before discharge to a water body in order to control pollution. • Unsatisfactory water is treated before use in order to meet specific water quality
requirements. The materials in the form of particulates, dissolved and volatile, solid and liquid which render are all the result of human activities. These materials eventually reach water and causing the water to be polluted. Dissolved materials, liquid and solid and many particulates are discharged directly to water bodies, while the particulate and volatile materials that pollute the atmosphere are picked up by rain and then deposited on land or in water. Some sources and the polluting material released are listed in Table 2.3.
Table 2.3 : Sources and significance of pollutants resulting from human activities
Sources Bacteria Nutrients Trace metals
Pesticides and
herbicides
Industrial organic micro-
pollutants
Oils and greases
Atmospheric transport x xxxG xxG xxG
Point Sources Urban sewage xxx xxx xxx x xxx Industrial effluent x xxxG x xxxG x
Diffuse Sources Agriculture xx xxx x xxxG Urban waste and run-off xx xx xxx xx xx x
Industrial waste disposal x xxx x xxx x
Dredging x xxx x xxx x Navigation and harbours x x xx x xxx
Internal recycling xxx xx x x
(Source: Modified from Meybeck and Helmer, 1996)

14 WATER POLLUTION : THE NEVER ENDING STORY
x Low local significance xx Moderate local or regional significance xxx High local or regional significance G Global significance

15 WATER POLLUTION : THE NEVER ENDING STORY
CHAPTER 3
WATER POLLUTION
3.0 Introduction to Water Pollution Water pollution is an undesirable change in the condition of water. Water become contaminated with harmful substances as products of human activities Water pollution is the second most important environmental issue next to air pollution. Any change in the physical, chemical and biological properties of water that has a harmful effect on all living things is water pollution. Water pollution affects all the major water bodies of the world such as lakes, rivers, oceans and groundwater. Polluted water is unfit for drinking and for other water uses such as domestic, agriculture and industrial uses. The effects of water pollution are harmful to human beings, plants, animals, fish and birds. Polluted water also contains viruses, bacteria, intestinal parasites and other harmful microorganisms, which can cause waterborne diseases such as diarrhoea, dysentery, and typhoid. Water pollution is disturbing the entire ecosystem. When an ecosystem is disturbed, the entire environment will feel the effect. It is of prime importance that the effect of water pollution is understood by all quarters of system that is in operation. The industries being the major contributor to air and water pollutions must be regulated with the most stringent laws, acts, procedures and orders as to be sure that all pollution causing materials are dealt with utmost precaution to avoid disaster that is threatening to human lives. 3.1 Sources of Water Pollution There are many specific causes of water pollution, but before we discuss them let us identify the main sources first. 3.1.1 Point Source Point Source pollution (Figure 3.1) is that the one which can be traced to the entrance point of the pollutant to the effected water body. Storm water discharges from municipal and industrial wastewater treatment plants along with smaller scale treatment plants are generally included as point source pollution. Runoffs from these areas carry oxygen-consuming wastes and toxins such as metals, chlorine, and ammonia contaminating water supplies. Residents directly at the point of discharge as well as those downstream are affected by the release of these pollutants.

16 WATER POLLUTION : THE NEVER ENDING STORY
Figure 3.1 : An outfall of polluted water into the river is an example of point source
3.1.2 Non-Point Sources Nonpoint source pollution (Figure 3.2) occurs when rainfall runs over land or through the ground, picks up pollutants, and deposits them into rivers, lakes, wetlands, and coastal waters or introduces them into groundwater. Some of the primary activities that generate nonpoint source pollution include farming and grazing activities, timber harvesting, new development, construction, and recreational boating. Manure, pesticides, fertilizers, dirt, oil, and gas produced by these activities are examples of nonpoint source pollutants. Even individual households contribute to nonpoint source pollution through improper chemical and pesticide use, landscaping, and other household practices.
Figure 3.2 : Agriculture runoff is one source of non point pollution (Source : http://en.wikipedia.org/wiki/Nonpoint_source_pollution)

17 WATER POLLUTION : THE NEVER ENDING STORY
Figure 3.3 : Examples of point and non-point sources of pollution (Source : Pearson Prentice Hall Inc, 2005)
3.2 Measurements of Water Pollutants
3.2.1 Dissolve Oxygen
Oxygen is critical to the survival of aquatic plants and animals, and a shortage of dissolved oxygen is not only a sign of pollution, it is harmful to fish. Some aquatic species are more sensitive to oxygen depletion than others, but some general guidelines to consider when analyzing test results are:
5–6 ppm, Sufficient for most species <3 ppm, Stressful to most aquatic species <2 ppm, Fatal to most species
Because of its importance to the fish’s survival, aqua-culturists, or “fish farmers,” and aquarists use the dissolved oxygen test as a primary indicator of their system’s ability to support healthy fish.
The oxygen found in water comes from many sources, but the largest source is oxygen absorbed from the atmosphere. Wave action and splashing allows more oxygen to be absorbed into the water. A second major source of oxygen is aquatic plants, including algae; during photosynthesis plants remove carbon dioxide from the water and replace it with oxygen.

18 WATER POLLUTION : THE NEVER ENDING STORY
All plant and animal waste eventually decomposes, whether it is from living animals or dead plants and animals. In the decomposition process, bacteria use oxygen to oxidize, or chemically alter, the material to break it down to its component parts. Some aquatic systems may undergo extreme amounts of oxidation, leaving no oxygen for the living organisms, which eventually leave or suffocate. Therefore the level of oxygen in water can indicate the extent of pollution of that water.
3.2.2 Temperature
Elevated temperature typically decreases the level of dissolved oxygen (DO) in water. The decrease in levels of DO can harm aquatic animals such as fish, amphibians and copepods. Thermal pollution may also increase the metabolic rate of aquatic animals, as enzyme activity, resulting in these organisms consuming more food in a shorter time than if their environment were not changed. An increased metabolic rate may result in fewer resources; the more adapted organisms moving in may have an advantage over organisms that are not used to the warmer temperature. As a result, food chains of the old and new environments may be compromised. Some fish species will avoid stream segments or coastal areas adjacent to a thermal discharge. Biodiversity can be decreased as a result. High temperature limits oxygen dispersion into deeper waters, contributing to anaerobic conditions. This can lead to increased bacteria levels when there is ample food supply. Many aquatic species will fail to reproduce at elevated temperatures.
3.2.3 Turbidity
There are various parameters influencing the cloudiness of the water. Some of these are phytoplankton, sediments from erosion, re-suspended sediments from the bottom (frequently stir up by bottom feeders like carp), waste discharge, algae growth, urban runoff and others.
The suspended particles absorb heat from the sunlight, making turbid waters become warmer, and so reducing the concentration of oxygen in the water (oxygen dissolves better in colder water). Some organisms also can’t survive in warmer water. The suspended particles scatter the light, thus decreasing the photosynthetic activity of plants and algae, which contributes to lowering the oxygen concentration even more. As a consequence of the particles settling to the bottom, shallow lakes fill in faster, fish eggs and insect larvae are covered and suffocated, gill structures get clogged or damaged.
The main impact is merely esthetic: nobody likes the look of dirty water. But also, it is essential to eliminate the turbidity of water in order to effectively disinfect it for drinking purposes. This adds some extra cost to the treatment of surface water supplies. The suspended particles also help the attachment of heavy metals and many other toxic organic compounds and pesticides.

19 WATER POLLUTION : THE NEVER ENDING STORY
3.2.4 pH
pH is a measure of how acidic/basic water is. The range goes from 0 - 14, with 7 being neutral. pHs of less than 7 indicate acidity, whereas a pH of greater than 7 indicates a base. pH is really a measure of the relative amount of free hydrogen and hydroxyl ions in the water. Water that has more free hydrogen ions is acidic, whereas water that has more free hydroxyl ions is basic. Since pH can be affected by chemicals in the water, pH is an important indicator of water that is changing chemically. pH is reported in "logarithmic units," like the Richter scale, which measures earthquakes. Each number represents a 10-fold change in the acidity/alkalinity of the water. Water with a pH of 5 is ten times more acidic than water having a pH of 6.
Pollution can change water’s pH, which in turn can harm animals and plants living in the water. For instance, water coming out of an abandoned coal mine can have a pH of 2, which is very acidic and would definitely affect any fish crazy enough to try to live in it! By using the logarithm scale, this mine-drainage water would be 100,000 times more acidic than neutral water -- so stay out of abandoned mines.
3.2.5 Total Suspended Solids (TSS)
TSS are solid materials, including organic and inorganic, that are suspended in the water. These would include silt, plankton and industrial wastes. High concentrations of suspended solids can lower water quality by absorbing light. Waters then become warmer and lessen the ability of the water to hold oxygen necessary for aquatic life. Because aquatic plants also receive less light, photosynthesis decreases and less oxygen is produced. The combination of warmer water, less light and less oxygen makes it impossible for some forms of life to exist.
Suspended solids affect life in other ways. They can clog fish gills, reduce growth rates, decrease resistance to disease, and prevent egg and larval development. Particles that settle out can smother fish eggs and those of aquatic insects, as well as suffocate newly-hatched larvae. The material that settles also fills the spaces between rocks and makes these microhabitats unsuitable for various aquatic insects. Suspended solids can result from erosion from urban runoff and agricultural land, industrial wastes, bank erosion, bottom feeders (such as carp), algae growth or wastewater discharges.
Prevention methods include protection of the land in our watershed from erosion by use of conservation tillage measures and giving urban runoff time to settle out before reaching our surface waters.
20 WATER POLLUTION : THE NEVER ENDING STORY
3.2.6 Conductivity
Conductivity can be used as a measure of total dissolved solids (TDS). These solids are usually composed of the sulfate, bicarbonate, and chlorides of calcium, magnesium, and sodium. The TDS measurement differs from the total solids measurement in that total solids also includes suspended material that is not dissolved. Conductivity is also a good measure of salinity in water. The measurement detects chloride ions from the salt. Salinity affects the potential dissolved oxygen levels in the water. The greater the salinity, the lower the saturation point.
3.2.7 Hardness
Hardness is the term used for the calcium and magnesium carbonate dissolved in water as Ca++, Mg++ and HCO3- (bicarbonate) ions. There are two measures of water hardness, hardness and alkalinity. Hardness measures the amount of positive calcium and magnesium ions; alkalinity measures the negative bicarbonates ions. Both measures are usually given in calcium carbonate, ie. scale, equivalent unit (abbreviated as CaCO3). This means when one unit of precipitates out of the water, hardness and alkalinity measured in CaCO3 units go down by one unit each. There are no health hazards associated with water hardness, so it is not subject to regulation. However hard water causes scale, as well as scumming and reduce lathering of soaps. Very soft waters, exposed to air or heat, become acidic and corrosive, and can harshen the taste of vegetables, tea or coffee. 3.2.8 Coliform Bacteria
Coliform is a family of bacteria commonly found in plants, soil, and animals including humans. If coliform bacteria are present in the water supply it is an indication that the water supply may be contaminated with sewage or other decomposing waste. Usually coliform bacteria are found in greater abundance on the surface film of the water or in the sediments on the bottom.
Fecal coliform, found in the lower intestines of humans and other warm-blooded animals, is one type of coliform bacteria. The presence of fecal coliform in a water supply is a good indication that sewage has polluted the water. Testing can be done for fecal coliform specifically or for total coliform bacteria which include all coliform bacteria strains and may indicate fecal contamination.
3.2.9 Biological Oxygen Demand (BOD)
Biological Oxygen Demand (BOD) is a measure of the oxygen used by microorganisms to decompose this waste. If there is a large quantity of organic waste in the water supply, there will also be a lot of bacteria present working to decompose this waste. In this case, the demand for oxygen will be high (due to all the bacteria) so the BOD level will be high. As the waste is consumed or dispersed through the water, BOD levels will begin to decline.
Microorganisms such as bacteria are responsible for decomposing organic waste. When organic matter such as dead plants, leaves, grass clippings, manure, sewage, or even food waste is present in a water supply, the bacteria will begin the process of breaking down this
21 WATER POLLUTION : THE NEVER ENDING STORY
waste. When this happens, much of the available dissolved oxygen is consumed by aerobic bacteria, robbing other aquatic organisms of the oxygen they need to live.
3.3 Types of Water Pollutants
3.3.1 Biological Pollutants
Each year, many millions of people become ill as a result of bacterial contamination in drinking water. Other examples of biological pollutants include viruses, protozoa, and parasitic worms. These infectious agents enter the environment from human and animal wastes, and they cause a variety of serious diseases. The United States Environmental Protection Agency (USEPA) uses the number of coliform bacteria per 100 milliliters of a water sample in order to determine the severity of biological pollution in water. The EPA recommends that drinking water contain zero colonies per 100 milliliters, and that swimming water contain no more than 200 colonies per 100 milliliters.
3.3.2 Chemical Pollutants
There are thousands of chemicals released into receiving water each day. But the most common is heavy metals which represent common type of chemical pollution in water. can be found naturally in bedrock and sediment or they may be introduced into water from industrial sources and household chemicals. Heavy metals harm humans through direct ingestion of contaminated water or through accumulation in the tissues of other organisms that are eaten by humans. The following are some common heavy metals found in water:
Mercury (Hg): Enters the environment through the leaching of soil due to acid rain, coal burning, or industrial, household, and mining wastes. Causes damage to nervous system, kidneys, and vision.
Lead (Pb): Sources include paint, mining wastes, incinerator ash, water from lead pipes and solder, and automobile exhaust. Causes damage to kidneys, nervous system, learning ability, ability to synthesize protein, and nerve and red blood cells.
Cadmium (Cd): Sources include electroplating, mining, and plastic industries, as well as sewage. Causes kidney disease.
Arsenic (As): Enters the environment through herbicides, wood preservatives, and mining industry. Causes damage to skin, eyes, gastrointestinal tract, and liver. May also cause cancer.
Aluminum (Al): Enters the environment through leaching due to acid deposition. Causes anaemia and loss of bone strength, and may also contribute to dementia and Alzheimer’s disease.
Nutrients, are chemicals that an organism or plants needs to live and grow or a substance used in an organism's metabolism which must be taken in from its environment. In water, nutrients constitute a second category of chemical water pollutants. Two common plant nutrients, nitrogen and phosphorus which are found in animal wastes, agricultural runoff, and sewage could contaminate surface water especially lakes and rivers. When these nutrients enter a body of water in large quantities, they cause eutrophication. Because eutrophication significantly lowers the levels of dissolved oxygen in water, many species of fish can no longer survive. In addition, consuming water that contains excess levels of

22 WATER POLLUTION : THE NEVER ENDING STORY
nitrates may reduce the bloodstream’s oxygen-carrying capacity, leading to a number of undesirable health effects for humans.
Oil, another chemical pollutant, is introduced into aquatic environments through leaks from oil tankers or dumping down storm drains. Cooking oil and industrial oils are also discharged into the environment every day. Each year, humans discharge approximately three to six million metric tons of oil into the ocean. In 1989, the oil tanker Exxon Valdez spilled eleven million gallons of oil into Alaskan waters. Over 300,000 birds and 2,500 otters were killed, and the total environmental damage amounted to a cost of over fifteen billion dollars.
Radioactive waste, is another type of chemical water pollutant. Examples include radioactive isotopes of iodine, radon, uranium, cesium, and thorium. These chemicals enter aquatic ecosystems through discharge from nuclear power plants, processing of uranium and other ores, nuclear weapons production, and natural sources. The harmful effects of radioactive waste when ingested through drinking water include genetic mutations, miscarriages, birth defects, and certain cancers.
3.3.3 Sediments as Physical Pollutants
One type of most common physical pollutant is sediment. Sediments is loose particles of rocks, clay, silts and other soil particles that settle at the bottom of a body of water. Sediment can come from soil erosion or from the decomposition of plants and animals. Wind, water and ice help carry these particles to rivers, lakes and streams.
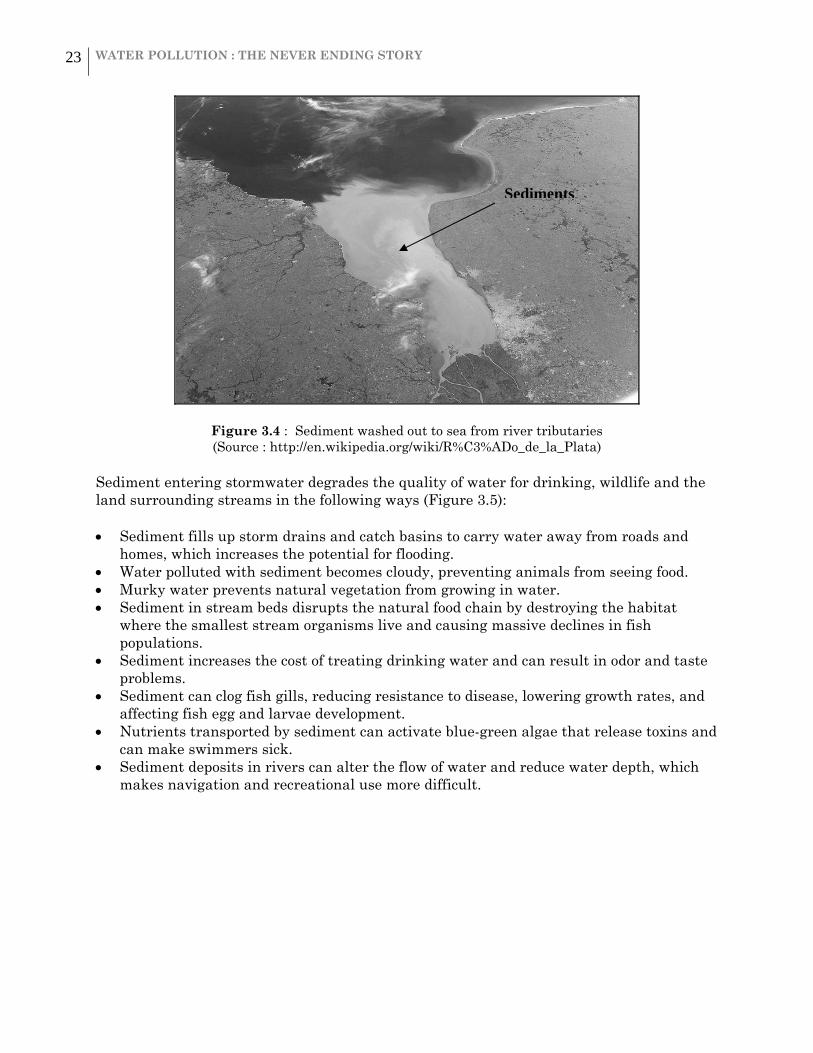
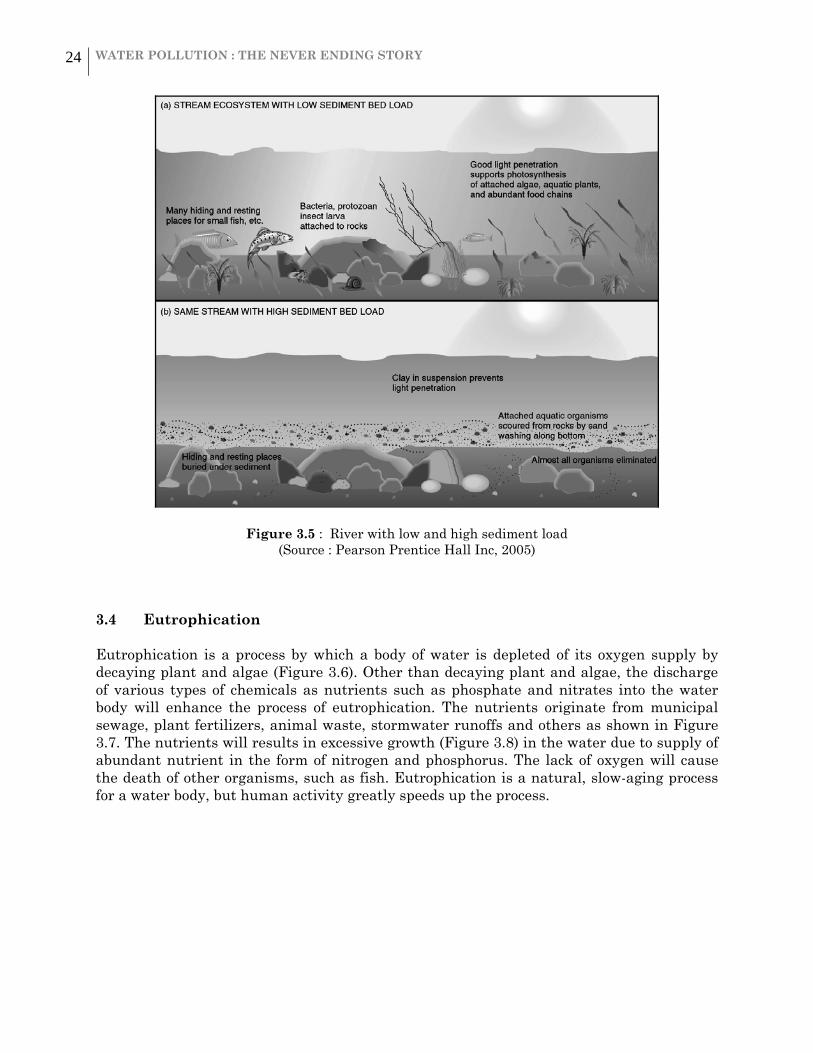
Solid fragments of inorganic or organic material that do not dissolve in water, represents the most significant source of water pollution, physical or otherwise. Sources of sediment include erosion, deforestation, and agricultural and hydroelectric projects. Sediments (Figure 3.4) choke and fill lakes, reservoirs, harbors, and other aquatic environments, reducing photosynthesis and disrupting aquatic food webs. Sediment may also carry pesticides, bacteria, and other harmful substances, and it can destroy the feeding and spawning grounds of fish. Figure 18 show the extent of sediment pollution at an estuary and Figure 19 depicts the impact of sediment in the water. As can be seen the water is flourish with aquatic plant and animals but as soon as sediments are deposited, it has wiped out the entire aquatic plant and animals. This is due to the lack of food, shelter and light when sediments have inundated them all.
23 WATER POLLUTION : THE NEVER ENDING STORY
Figure 3.4 : Sediment washed out to sea from river tributaries (Source : http://en.wikipedia.org/wiki/R%C3%ADo_de_la_Plata)
Sediment entering stormwater degrades the quality of water for drinking, wildlife and the land surrounding streams in the following ways (Figure 3.5):
Sediment fills up storm drains and catch basins to carry water away from roads and homes, which increases the potential for flooding.
Water polluted with sediment becomes cloudy, preventing animals from seeing food. Murky water prevents natural vegetation from growing in water. Sediment in stream beds disrupts the natural food chain by destroying the habitat
where the smallest stream organisms live and causing massive declines in fish populations.
Sediment increases the cost of treating drinking water and can result in odor and taste problems.
Sediment can clog fish gills, reducing resistance to disease, lowering growth rates, and affecting fish egg and larvae development.
Nutrients transported by sediment can activate blue-green algae that release toxins and can make swimmers sick.
Sediment deposits in rivers can alter the flow of water and reduce water depth, which makes navigation and recreational use more difficult.
Sediments
24 WATER POLLUTION : THE NEVER ENDING STORY
Figure 3.5 : River with low and high sediment load (Source : Pearson Prentice Hall Inc, 2005)
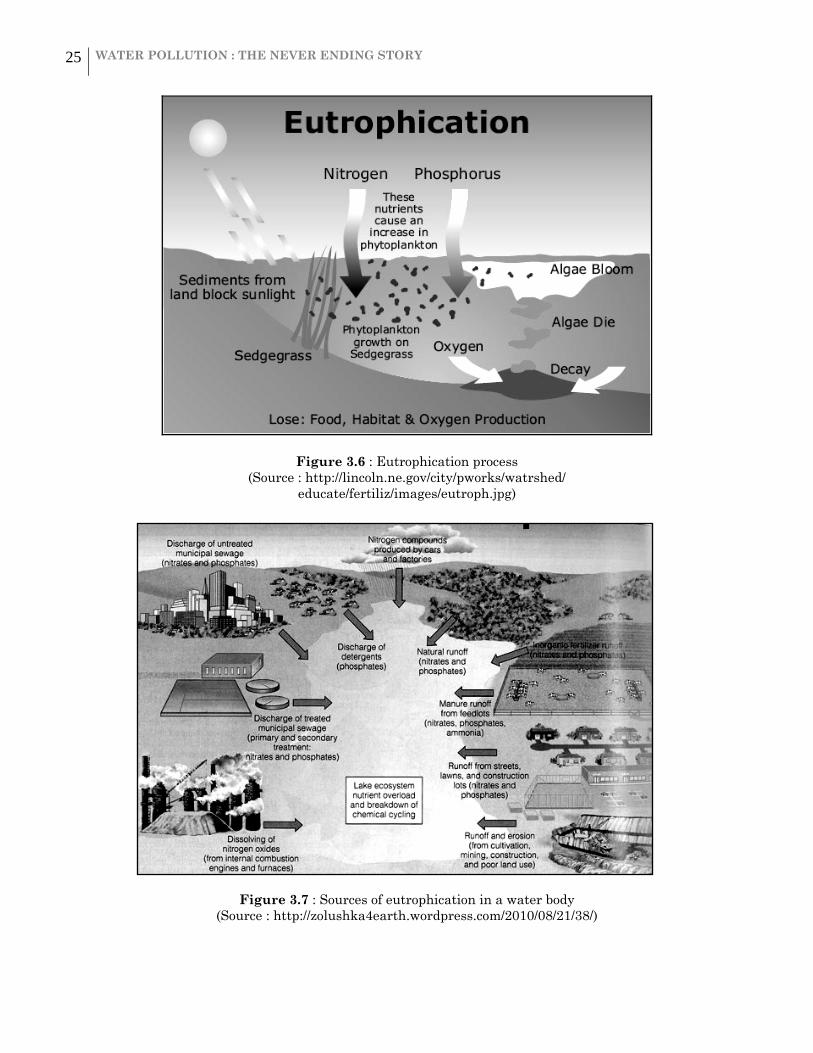
3.4 Eutrophication Eutrophication is a process by which a body of water is depleted of its oxygen supply by decaying plant and algae (Figure 3.6). Other than decaying plant and algae, the discharge of various types of chemicals as nutrients such as phosphate and nitrates into the water body will enhance the process of eutrophication. The nutrients originate from municipal sewage, plant fertilizers, animal waste, stormwater runoffs and others as shown in Figure 3.7. The nutrients will results in excessive growth (Figure 3.8) in the water due to supply of abundant nutrient in the form of nitrogen and phosphorus. The lack of oxygen will cause the death of other organisms, such as fish. Eutrophication is a natural, slow-aging process for a water body, but human activity greatly speeds up the process.
25 WATER POLLUTION : THE NEVER ENDING STORY
Figure 3.6 : Eutrophication process (Source : http://lincoln.ne.gov/city/pworks/watrshed/
educate/fertiliz/images/eutroph.jpg)
Figure 3.7 : Sources of eutrophication in a water body (Source : http://zolushka4earth.wordpress.com/2010/08/21/38/)
26 WATER POLLUTION : THE NEVER ENDING STORY
Figure 3.8 : Excessive growth of filamentous algae on the surface of water (Source : http://theviewspaper.net/the-menace-of-eutrophication/)
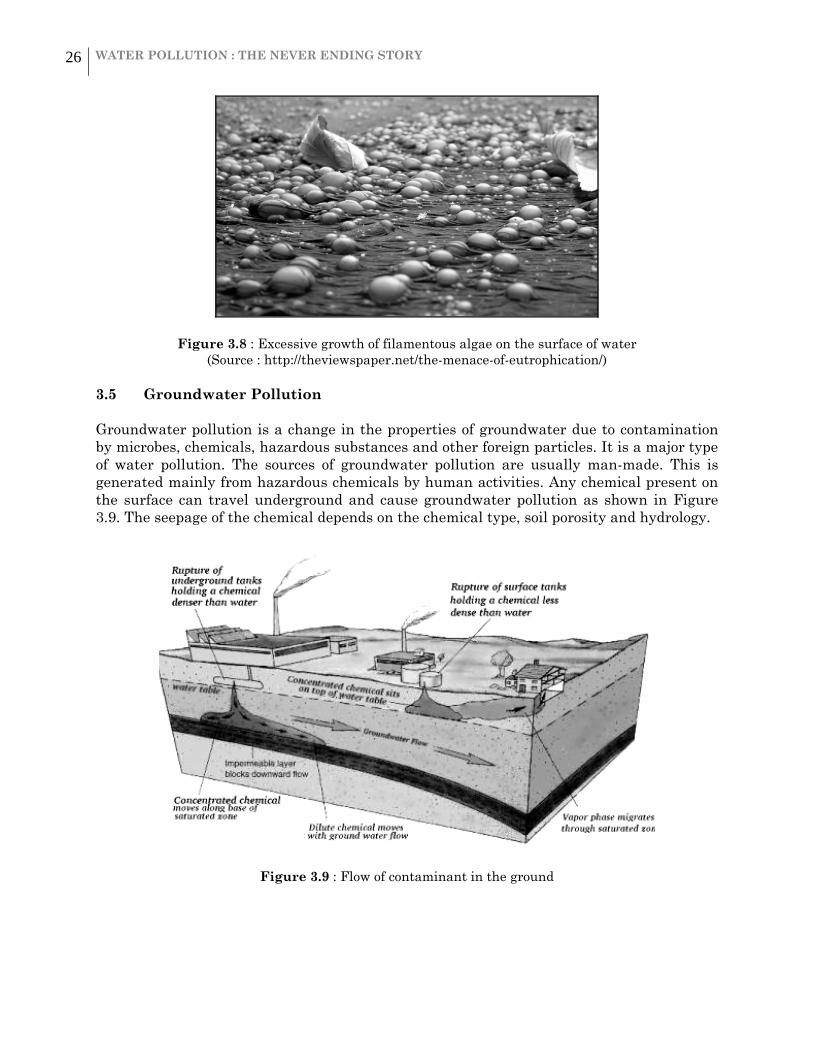
3.5 Groundwater Pollution Groundwater pollution is a change in the properties of groundwater due to contamination by microbes, chemicals, hazardous substances and other foreign particles. It is a major type of water pollution. The sources of groundwater pollution are usually man-made. This is generated mainly from hazardous chemicals by human activities. Any chemical present on the surface can travel underground and cause groundwater pollution as shown in Figure 3.9. The seepage of the chemical depends on the chemical type, soil porosity and hydrology.
Figure 3.9 : Flow of contaminant in the ground
27 WATER POLLUTION : THE NEVER ENDING STORY
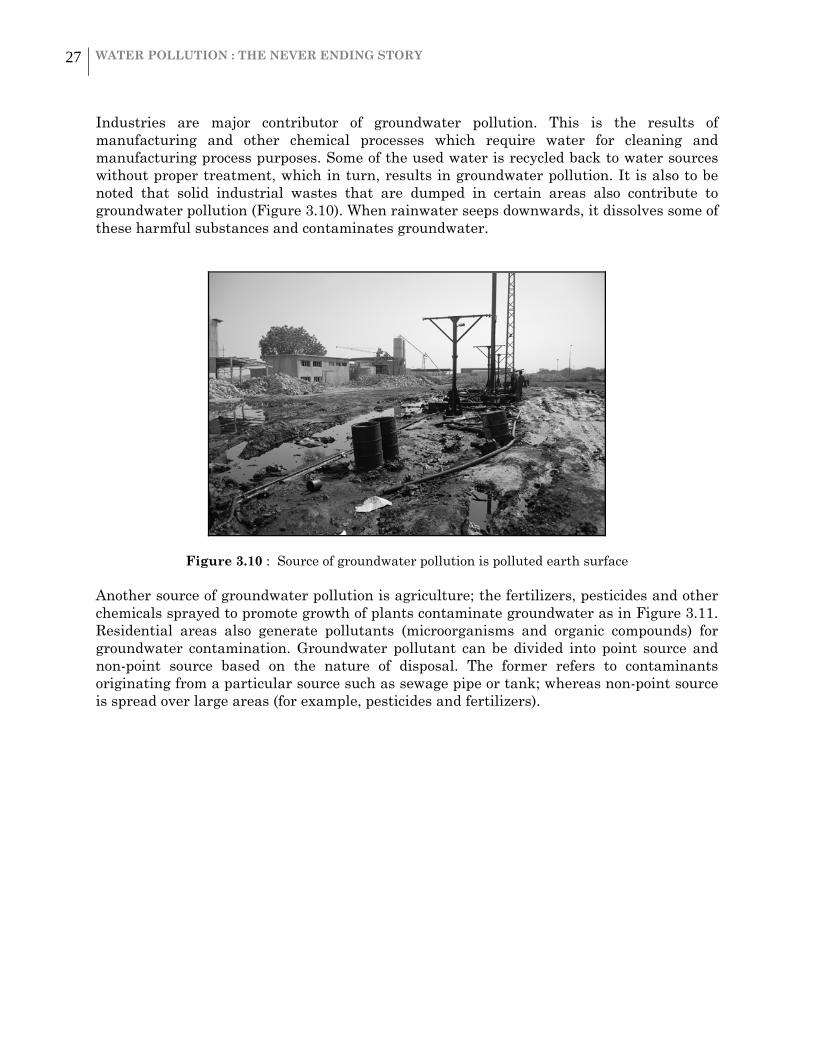
Industries are major contributor of groundwater pollution. This is the results of manufacturing and other chemical processes which require water for cleaning and manufacturing process purposes. Some of the used water is recycled back to water sources without proper treatment, which in turn, results in groundwater pollution. It is also to be noted that solid industrial wastes that are dumped in certain areas also contribute to groundwater pollution (Figure 3.10). When rainwater seeps downwards, it dissolves some of these harmful substances and contaminates groundwater.
Figure 3.10 : Source of groundwater pollution is polluted earth surface Another source of groundwater pollution is agriculture; the fertilizers, pesticides and other chemicals sprayed to promote growth of plants contaminate groundwater as in Figure 3.11. Residential areas also generate pollutants (microorganisms and organic compounds) for groundwater contamination. Groundwater pollutant can be divided into point source and non-point source based on the nature of disposal. The former refers to contaminants originating from a particular source such as sewage pipe or tank; whereas non-point source is spread over large areas (for example, pesticides and fertilizers).

28 WATER POLLUTION : THE NEVER ENDING STORY
Figure 3.11 : Spraying of insecticides and pesticides which pollute the groundwater
(Source : http://www.waterencyclopedia.com/)
Groundwater pollution cannot be prevented completely. As there are varied sources, it is not always practical to prevent the contamination of groundwater. However, there is no doubt that individuals can contribute in many ways to reduce groundwater pollution. Some of the basic tips are proper disposal of waste, waterproof storage of household chemicals (paints, medicines, detergents) and agricultural chemicals to avoid leaching, etc. Proper installation of septic systems along with regular cleaning will reduce groundwater contamination. It is very difficult and costly to treat contaminated groundwater. Hence, it is better to minimize the risk of groundwater pollution. Public awareness programs about the importance of groundwater and ways to minimize its contamination should be implemented. 3.6 Global Water Pollution Water pollution has spread on the global scale uncontrollably. Many parts of the world are experiencing water crisis due to the polluted water resources especially the developing countries. The industrial growth has affected the water quality in many countries causing irreparable damage. It will need billion of dollars to repair the damage done on the environment especially the rivers. Many of the world’s rivers are in the state of permanent damage especially those in the developing countries where industrial effluents are discharge into streams and eventually rivers without any proper treatment.

29 WATER POLLUTION : THE NEVER ENDING STORY
CHAPTER FOUR
EFFECT OF WATER POLLUTION
4.0 Effect Of Water Pollution to Human Health Human infectious diseases are among the most serious effects of water pollution, especially in developing countries, where sanitation may be inadequate or non-existent. Waterborne diseases occur when parasites or other disease-causing microorganisms are transmitted via contaminated water, particularly water contaminated by pathogens originating from excreta. These include typhoid, intestinal parasites, and most of the enteric and diarrheal diseases caused by bacteria, parasites, and viruses. Among the most serious parasitic diseases are amoebiasis, giardiasis, ascariasis, and hookworm. 4.1 Physical Pollutants 4.1.1 Heat
Heat is another physical water pollutant. Excessive heat in water results when large quantities of water are used for cooling of electric power plants. Each year, almost half of the water withdrawn in the United States is used for such cooling. Thermal pollution in water lowers dissolved oxygen levels and makes aquatic species more susceptible to disease, parasites, and toxic chemicals (Figure 4.1). Thermal shock occurs when an organism adapted to a certain temperature range is suddenly exposed to a temperature outside of that range. Thermal pollution results in death for many aquatic species.
Figure 4.1 : Thermal pollution load from a factory(Source : http://www.tutorvista.com/biology/effects-of-thermal-pollution)

30 WATER POLLUTION : THE NEVER ENDING STORY
4.2 Chemical Pollutants 4.2.1 Heavy Metal Pollution Lead, Mercury, cadmium, arsenic, and aluminium are found naturally in the earth, but just because they’re natural chemical elements do not mean they are harmless. They are heavy metals with a long history of industrial and personal use and just as long a history of harming human health. Table 4.1 below lists the common health effect of excessive ingestion of these metals.
Table 4.1 : Many other health effects of these metals are well-known.
Metal Common Health Effects (some occur only at high exposure levels)
Lead
Behavioral problems High blood pressure, anaemia Kidney damage Memory and learning difficulties Miscarriage, decreased sperm production Reduced IQ
Mercury
Blindness and deafness brain damage Digestive problems Kidney damage Lack of coordination Mental retardation
Arsenic
Breathing problems Death if exposed to high levels Decreased intelligence Known human carcinogen: lung and skin cancer nausea, diarrhoea, vomiting Peripheral nervous system problems
Cadmium
Adversely affects bone remodelling and periodontal-disease-related bone loss Breathing in high levels of cadmium for a prolonged period of time may cause damage to the lungs and eventually death Cadmium and cadmium compounds are known to be human carcinogens Prolonged inhalation of cadmium oxide can result in lung dysfunction and emphysema
Aluminium
Damage to the central nervous system Dementia Loss of memory (Alzheimer) Listlessness Severe trembling (Parkinson disease)

31 WATER POLLUTION : THE NEVER ENDING STORY
Certain type of metal is highly toxic to humans, and we need to do everything we can to minimize our exposure to it. Heavy metals earned their name because of their high molecular weights, which makes them denser and heavier than other metals. Examples of heavy metals are arsenic, chromium, cadmium, copper, lead and mercury. When ingested, inhaled or absorbed through the skin, these heavy metals can have serious health consequences. Over time, they can cause diseases and cancers of the major organs, anemia, and brain and nerve damage. Because they bio-accumulate, even tiny doses of heavy metals can be poisonous over time. Bioaccumulation occurs when a chemical stays in the body for long periods of time because the body can’t excrete or metabolize it. Toxic materials such as DDT (DichloroDiphenyTrichloroethane) also accumulate through the food chain as shown in Figure 4.2 below. DDT is one of the most well-known synthetic pesticides. It is a chemical with a long, unique, and controversial history. In this food chain diagram, human at the end of the food chain will have higher dose of the DDT and this of course will have a consequence effect. Usually men are always at the end of the food chain.
Figure 4.2 : Bioaccumulation of DDT (DichloroDiphenyTrichloroethane)
(Source : http://openlearn.open.ac.uk/) 4.2.2 Other Polluting Chemicals Addictives like Cyanide is always used in electroplating industry, cyanide is highly toxic of particular concern is the delayed potential for these chemicals to produce cancer, as in the cases of lung cancer and mesothelioma caused by asbestos, liver cancer caused by vinyl chloride, and leukaemia caused by benzene cadmium in fertilizer derived from sewage sludge can be absorbed by crops. If these crops are eaten by humans in sufficient amounts, the metal can cause diarrhoea and, over time, liver and kidney damage. Lead can get into water from lead pipes and solder in older water systems; children exposed to lead in water can suffer mental retardation.

32 WATER POLLUTION : THE NEVER ENDING STORY
4.2.3 Oil Leaks
Oil is another chemical pollutant, is introduced into aquatic environments through leaks from oil tankers or dumping down storm drains. Each year, humans discharge approximately three to six million metric tons of oil into the ocean. In 1989, the oil tanker Exxon Valdez spilled eleven million gallons of oil into Alaskan waters. Over 300,000 birds and 2,500 otters were killed, and the total environmental damage amounted to a cost of over fifteen billion dollars.
Figure 4.5 : Oil spill in the ocean (Source : http://library.thinkquest.org/CR0215471/oil_spills.htm)
Oil pollution is very bad for the ocean and environment. Thirty seven million gallons of oil are accidentally spilled into the ocean every year by tankers (Figure 4.5). Even more oil gets into the ocean from non-accidental sources. Sixty million gallons of oil end up in the ocean every year. That’s a lot of oil! The oil “glues” birds’ feathers together (Figure 4.6), clogs fishes gills, and blocks out sunlight (making it harder for plants underwater to go through photosynthesis). Oil pollution also slows down coral reefs growing and their reproduction. Coral reefs are also very sensitive to oil, especially crude oil.

33 WATER POLLUTION : THE NEVER ENDING STORY
Figure 4.6 : Seabird covered in oil (Source : http://cunhaenvirosci.wikispaces.com/Ocean+Pollution)
4.2.4 Radioactive Waste Another type of chemical water pollutant is radioactive waste (Figure 4.7). Examples include radioactive isotopes of iodine, radon, uranium, cesium, and thorium. These radioactive chemicals enter aquatic ecosystems through discharge from nuclear power plants, processing of uranium and other ores, nuclear weapons production, and natural sources. The harmful effects of radioactive waste when ingested through drinking water include genetic mutations, miscarriages, birth defects, and certain cancers.
Figure 4.7 : Barrels of low level radioactive waste (Source : http://pdfresh.com/ebook/learn-about-radioactive-
waste-disposal-to-protect-people-and-environment.htm

34 WATER POLLUTION : THE NEVER ENDING STORY
4.2.5 Insecticide Another type of pollutant that had entered the environment is the persistent organic pollutants (POPs) which are common ingredients in many commercial products during World War II as the demand for manufactured products surged. POPs found widespread use in agricultural to protect crops from insects and disease-causing organisms. Some of the insecticide chemicals used include DDT (DichloroDiphenylTrichloroethane), dechlorane, dieldrin and HCH (HexaChlorocycloHexane). It was soon discovered that organic chemical pesticides were linked to numerous health effects in people as a result of their lingering presence in the food chain. These chemicals are accumulated in the food chain. Health effects associated with POPs include birth defects, immune and respiratory system disorders and hormonal disorders. Most of these chemicals have since been banned in the United States, though the use of DDT continues in tropical environments as a means to prevent insects from spreading diseases to humans. 4.2.6 Industrial Chemicals Industrial chemicals as in Figure 4.8 are important ingredients in the manufacturing of many products which we use daily in our life. These chemicals are mostly toxic to the human health. Industrial organic chemical pollutants fall within the "intentionally produced" category of pollutants because of their use in industrial products. These materials contain chemical pollutants called PCBs (PolyChlorinated Biphenyls), that carry the heat and acid-resistant properties needed in products used for electrical or automotive purposes. PCBs are used in products such as electrical transformers, hydraulic fluids, paint additives and lubricants. Under certain conditions, products made with PCBs can distill pollutants into the air and soil and ultimately contaminate the atmosphere and food supplies. Some of the PCBs are released into the receiving water especially when the river flow next to the industrial zone (Figure 4.9) and remain in the water polluting aquatic creatures such as fish which we take in as our food. In effect, industrial pollutants maintain their chemical properties over long periods of time, which enables them to linger and accumulate in air and soil environments.
Figure 4.8 : Industrial chemicals

35 WATER POLLUTION : THE NEVER ENDING STORY
Figure 4.9 : An example of industrial activity which contributed pollution to adjacent tiver
PCBs have been demonstrated to cause a variety of adverse health effects. PCBs have been shown to cause cancer in animals. PCBs have also been shown to cause a number of serious non-cancer health effects in animals, including effects on the immune system, reproductive system, nervous system, endocrine system and other health effects. Studies in humans provide supportive evidence for potential carcinogenic and non-carcinogenic effects of PCBs. The different health effects of PCBs may be interrelated, as alterations in one system may have significant implications for the other systems of the body. The potential health effects of PCB exposure are discussed in greater detail below. 4.2.7 By-Product Pollutants By-product pollutants are the "unintentionally produced" category of organic chemical pollutants since they appear as by-products of other processes. One such by-product is dioxins. The manufacture of plastic, or PVC materials and treatments used on paper and textiles, produces dioxins, a category of organic chemical pollutants. Dioxins are produced typically in the form of gases. These gases escaped into the air and caused air pollution. Some of these gases can also settle in water and soil environments and bind with soil and water molecules. When this happens, marine animals as well as those that eat plants can accumulate organic chemical pollutants in their bodies. Their effects within the food chain become more pronounced in animals that eat other animals. Since these materials accumulate inside living organisms, the highest concentrations of pollutants develop at the top of the food chain. By-product pollutants also result from the combustion of certain materials, such as trash, medical waste, municipal waste and even cigarette smoke. Studies have shown that exposure to dioxins can cause cancer or other non-cancer health effects. Probable routes of exposure to dioxins are inhalation, ingestion, and skin exposure. A nursing baby may also be exposed to dioxins through its mother's milk. Studies have

36 WATER POLLUTION : THE NEVER ENDING STORY
shown that exposure to dioxins has caused chloracne, liver toxicity, skin rashes, nausea, vomiting, and muscular aches and pains. The immune system also appears to be very sensitive to dioxin toxicity. 4.3 Biological Pollutants Biological pollutants are living pollutant in the form of bacteria and viruses. Although some of these microorganisms are useful to humans, but what we are concern is the pathogenic microorganisms which caused disease to be spread. Each year, millions of people become ill as a result of bacterial contamination in drinking water. Other examples of biological pollutants include viruses, protozoa, and parasitic worms. These infectious agents enter the environment from human and animal wastes, and they cause a variety of serious diseases. The United States Environmental Protection Agency (USEPA) uses the number of coliform bacteria per 100 milliliters of a water sample in order to determine the severity of biological pollution in water. The EPA recommends that drinking water contain zero colonies per 100 milliliters, and that swimming water contain no more than 200 colonies per 100 milliliters. 4.4 Waterborne Diseases Table 4.1, 4.2 and 4.3 below list the probable diseases associated with various microbial agents. The diseases are all waterborne diseases.
Table 4.1 : Protozoal Infections Disease and
Transmission Microbial Agent Sources of Agent in Water Supply
Amoebiasis(hand-to-mouth)
Protozoan (Entamoeba histolytica) (Cyst-like appearance)
Sewage, non-treated drinking water, flies in water supply
Cryptosporidiosis (oral)
Protozoan (Cryptosporidium parvum)
Collects on water filters and membranes that cannot be disinfected, animal manure, seasonal runoff of water.
Cyclosporiasis Protozoan parasite (Cyclospora cayetanensis) Sewage, non-treated drinking water
Giardiasis (oral-fecal) (hand-to-mouth)
Protozoan (Giardia lamblia) Most common intestinal parasite
Untreated water, poor disinfection, pipe breaks, leaks, groundwater contamination, campgrounds where humans and wildlife use same source of water. Beavers and muskratscreate ponds that act as reservoirs for Giardia.
Microsporidiosis Protozoan phylum (Microsporidia), but closely related to fungi
The genera of Encephalitozoon intestinalis has been detected in groundwater, the origin of drinking water [3]
(Source : http://en.wikipedia.org/wiki/Waterborne_diseases)

37 WATER POLLUTION : THE NEVER ENDING STORY
Table 4.2 : Parasitic Infections (Kingdom Animalia)
Disease and Transmission Microbial Agent Sources of Agent in Water Supply
Schistosomiasis(immersion)
Members of the genus Schistosoma
Fresh water contaminated with certain types of snails that carry schistosomes
Dracunculiasis(Guinea Worm Disease)
Dracunculus medinensis Stagnant water containing larvae
Taeniasis Tapeworms of the genus Taenia
Drinking water contaminated with eggs
Fasciolopsiasis Fasciolopsis buski Drinking water contaminated with encysted metacercaria
Hymenolepiasis(Dwarf Tapeworm Infection)
Hymenolepis nana Drinking water contaminated with eggs
Echinococcosis(Hydatid disease) Echinococcus granulosus Drinking water contaminated with feces
(usually canid) containing eggs
Ascariasis
Ascaris lumbricoides
Drinking water contaminated with feces (usually canid) containing eggs
(Source : http://en.wikipedia.org/wiki/Waterborne_diseases)
Table 4.3 : Bacterial Infections
Disease and Transmission Microbial Agent Sources of Agent in Water Supply
Botulism
Clostridium botulinum
Botulism is an acute poisoning resulting from ingestion of food containing toxins produced by the bacillus Clostridium botulinum. This bacterium can grow only in an anaerobic atmosphere, such as that found in canned foods; botulism is then almost always caused by preserved foods that have been improperly processed. Person to person transmission of botulism does not occur.

38 WATER POLLUTION : THE NEVER ENDING STORY
Campylobacteriosis
Most commonly caused byCampylobacter jejuni
Drinking water contaminated with feces
Cholera
Spread by the bacterium Vibrio cholerae
Drinking water contaminated with the bacterium
E. coli Infection
Certain strains of Escherichia coli (commonly E. coli)
Water contaminated with the bacteria
M. marinuminfection Mycobacterium marinum
Naturally occurs in water, most cases from exposure in swimming pools or more frequently aquariums; rare infection since it mostly infects immunocom promise dindividuals
Dysentery
Caused by a number of species in the genera Shigella and Salmonella with the most common being Shigella dysenteriae
Water contaminated with the bacterium
Legionellosis (two distinct forms: Legionnaires’ disease and Pontiac fever)
Caused by bacteria belonging to genus Legionella (90% of cases caused by Legionella pneumophila)
Contaminated water: the organism thrives in warm aquatic environments.

39 WATER POLLUTION : THE NEVER ENDING STORY
Leptospirosis
Caused by bacterium of genusLeptospira
Water contaminated by the animal urine carrying the bacteria
Otitis Externa(swimmer’s ear)
Caused by a number of bacterialand fungal species.
Swimming in water contaminated by the responsible pathogens
Salmonellosis Caused by many bacteria of genus Salmonella
Drinking water contaminated with the bacteria. More common as a food borne illness.
Typhoid fever
Salmonella typhi
Ingestion of water contaminated with feces of an infected person
Vibrio Illness Vibrio vulnificus, Vibrio alginolyticus, and Vibrio parahaemolyticus
Can enter wounds from contaminated water. Also got by drinking contaminated water or eating undercooked oysters.
(Source : http://en.wikipedia.org/wiki/Waterborne_diseases) 4.4.1 Minamata Disease Minamata disease was first identified in 1956 in Minamata, Japan. Minamata is a fishing port, was also the home of Nippon Chisso Hiryo Co., a manufacturer of chemical fertilizer, carbide, and vinyl chloride. The factory discharged methyl mercury which had contaminated fish and shellfish in the sea where the chemicals were discharged. The methylmercury bioaccumulated within the food chain, from plankton and other microorganisms up to fish and shellfish. The contaminated fish and shell fish were consumed by the people living in the area which had resulted in illness in the local inhabitants and caused birth defects in their children. The sometimes fatal disease was the first whose cause was recognized as industrial pollution of seawater. It aroused worldwide concern and stimulated the development of the environmental movement. (E.Britannica, 1999). In the early 1950s, Minamata Bay residents began to exhibit symptoms of neurological illness, such as uncontrollable trembling, loss of motor control, and partial paralysis. Children also began to be born with Minamata disease, exhibiting symptoms similar to cerebral palsy (impaired neurological development and seizures). By the late 1950s, scientists from Japan's Kumamoto University strongly suspected that methylmercury was the cause of Minamata disease. Agonizing effect of the Minamata disease are shown here in Figures 4.3 and 4.4 respectively.

40 WATER POLLUTION : THE NEVER ENDING STORY
Figure 4.3 : An agonizing effect of the Minamata disease (Source : http://www.socialmedicine.org/2010/04/05/
environmental-health/minamata-disease)
Figure 4.4 : Physical defect associated with metal pollution (Source : http://en.academic.ru/dic.nsf/enwiki/3809743)
Minamata disease broke out again in 1965, this time along the banks of the Agano River in Niigata Prefecture. The polluting factory (owned by Showa Denko) employed a chemical process using a mercury catalyst very similar to that used by Chisso in Minamata. As in Minamata, from the autumn of 1964 to the spring of 1965, cats living along the banks of the Agano River had been seen to go mad and die. Before long patients appeared with identical symptoms to patients living on the Shiranui Sea, and the outbreak was made public on 12 June 1965. Researchers from the Kumamoto University Research Group and Hajime Hosokawa (who had retired from Chisso in 1962) used their experience from
41 WATER POLLUTION : THE NEVER ENDING STORY
Minamata and applied it to the Niigata outbreak. In September 1966 a report was issued proving Showa Denko's pollution to be the cause of this second Minamata disease. 4.4.2 Itai-itai Disease
The symptoms of Itai-Itai disease were first observed in 1913 and characterized between 1947 and 1955; it was 1968, however, before the Japanese Ministry of Health and Welfare officially declared that the disease was caused by chronic cadmium poisoning in conjunction with other factors such as the stresses of pregnancy and lactation, aging, and dietary deficiencies of vitamin D and calcium. The name arose from the cries of pain, "itai-itai" (ouch-ouch) by the most seriously stricken victims, older Japanese farm women. Although men, young women, and children were also exposed, 95% of the victims were post-menopausal women over 50 years of age. They usually had given birth to several children and had lived more than 30 years within 2 mi (3 km) of the lower stream of the Jinzu River near Toyama.
The disease started with symptoms similar to rheumatism, neuralgia, or neuritis. Then came bone lesions, osteomalacia, and osteoporosis, along with renal disfunction and proteinuria. As it escalated, pain in the pelvic region caused the victims to walk with a duck-like gait. Next, they were incapable of rising from their beds because even a slight strain caused bone fractures. The suffering could last many years before it finally ended with death. Overall, an estimated 199 victims have been identified, of which 162 had died by December 1992.
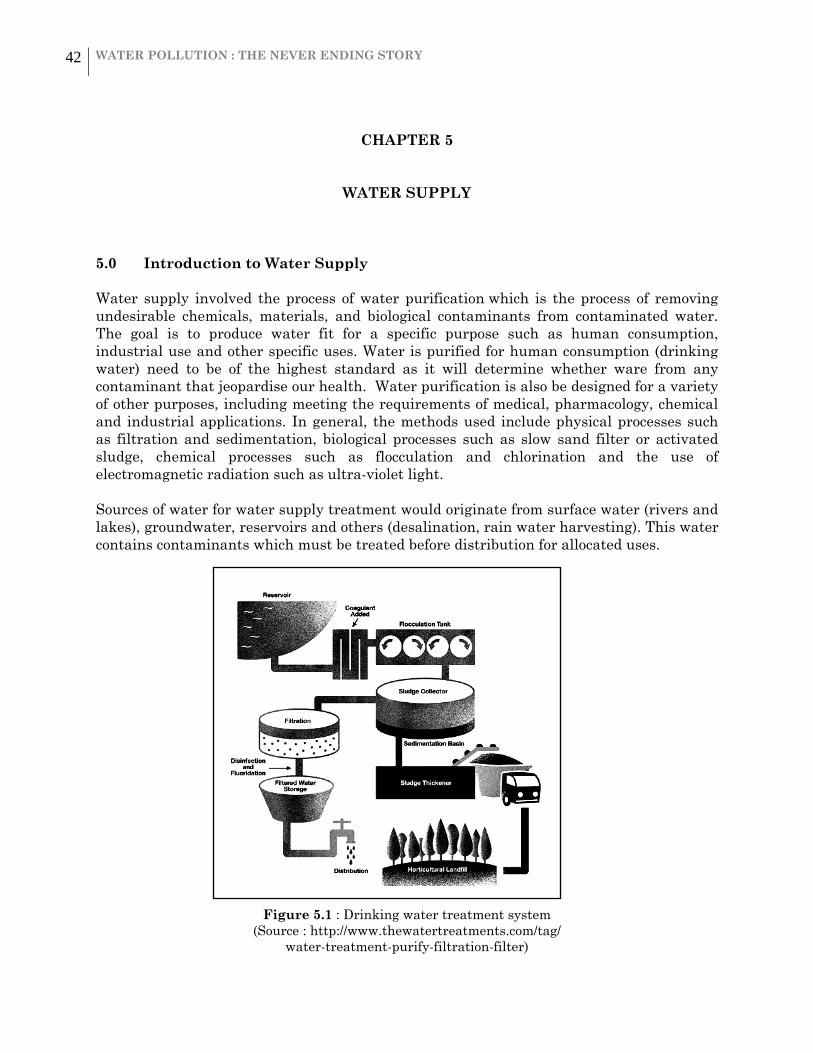
42 WATER POLLUTION : THE NEVER ENDING STORY
CHAPTER 5
WATER SUPPLY 5.0 Introduction to Water Supply Water supply involved the process of water purification which is the process of removing undesirable chemicals, materials, and biological contaminants from contaminated water. The goal is to produce water fit for a specific purpose such as human consumption, industrial use and other specific uses. Water is purified for human consumption (drinking water) need to be of the highest standard as it will determine whether ware from any contaminant that jeopardise our health. Water purification is also be designed for a variety of other purposes, including meeting the requirements of medical, pharmacology, chemical and industrial applications. In general, the methods used include physical processes such as filtration and sedimentation, biological processes such as slow sand filter or activated sludge, chemical processes such as flocculation and chlorination and the use of electromagnetic radiation such as ultra-violet light. Sources of water for water supply treatment would originate from surface water (rivers and lakes), groundwater, reservoirs and others (desalination, rain water harvesting). This water contains contaminants which must be treated before distribution for allocated uses.
Figure 5.1 : Drinking water treatment system (Source : http://www.thewatertreatments.com/tag/
water-treatment-purify-filtration-filter)
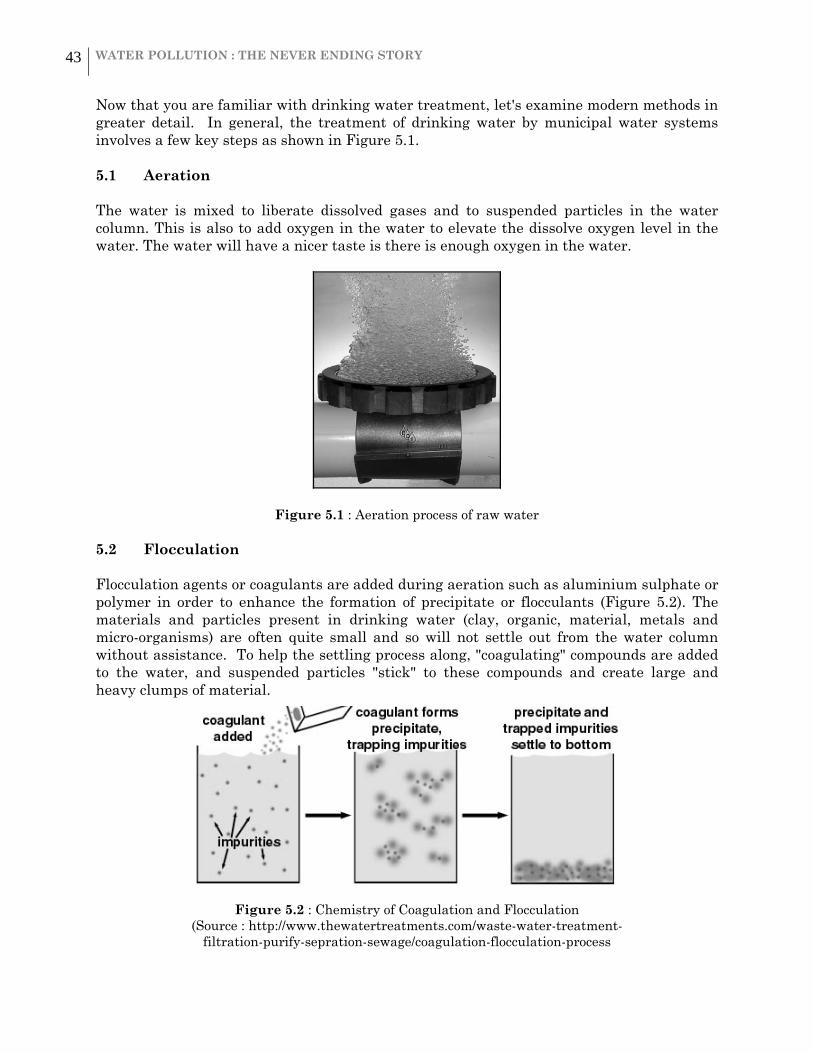
43 WATER POLLUTION : THE NEVER ENDING STORY
Now that you are familiar with drinking water treatment, let's examine modern methods in greater detail. In general, the treatment of drinking water by municipal water systems involves a few key steps as shown in Figure 5.1. 5.1 Aeration The water is mixed to liberate dissolved gases and to suspended particles in the water column. This is also to add oxygen in the water to elevate the dissolve oxygen level in the water. The water will have a nicer taste is there is enough oxygen in the water.
Figure 5.1 : Aeration process of raw water 5.2 Flocculation Flocculation agents or coagulants are added during aeration such as aluminium sulphate or polymer in order to enhance the formation of precipitate or flocculants (Figure 5.2). The materials and particles present in drinking water (clay, organic, material, metals and micro-organisms) are often quite small and so will not settle out from the water column without assistance. To help the settling process along, "coagulating" compounds are added to the water, and suspended particles "stick" to these compounds and create large and heavy clumps of material.
Figure 5.2 : Chemistry of Coagulation and Flocculation (Source : http://www.thewatertreatments.com/waste-water-treatment-
filtration-purify-sepration-sewage/coagulation-flocculation-process

44 WATER POLLUTION : THE NEVER ENDING STORY
5.3 Sedimentation The water is left undisturbed to allow the heavy clumps of particles and coagulants to settle out. Sedimentation basin is best located next after the flocculation basin. This is to ensure that the flocs have the chance to begin to settle immediately without having to travel far as this would break away the flocs. The amounts of flocs settled would depend very much on the retention time provided. The retention time must be long enough for most of the flocs can be settled. The retention time of the water must therefore be balanced against the cost of a larger basin. The minimum clarifier retention time is normally 4 hours. A deep basin will allow more floc to settle out than a shallow basin. As flocs settled to the bottom of the basin, a layer of sludge is formed on the floor of the tank. This layer of sludge must be removed and treated. The amount of sludge that is generated is significant, often 3 to 5 percent of the total volume of water that is treated. The cost of treating and disposing of the sludge can be a significant part of the operating cost of a water treatment plant. The tank may be equipped with mechanical cleaning devices that continually clean the bottom of the tank or the tank can be taken out of service when the bottom needs to be cleaned. Sedimentation in operation is shown in Figure 5.3 whilst Figure 5.4 showing the cross-section of a sedimentation tank.
Figure 5.3 : A picture of the sedimentation tank in operation (Source : http://www.coffeyville.com/Water.htm)
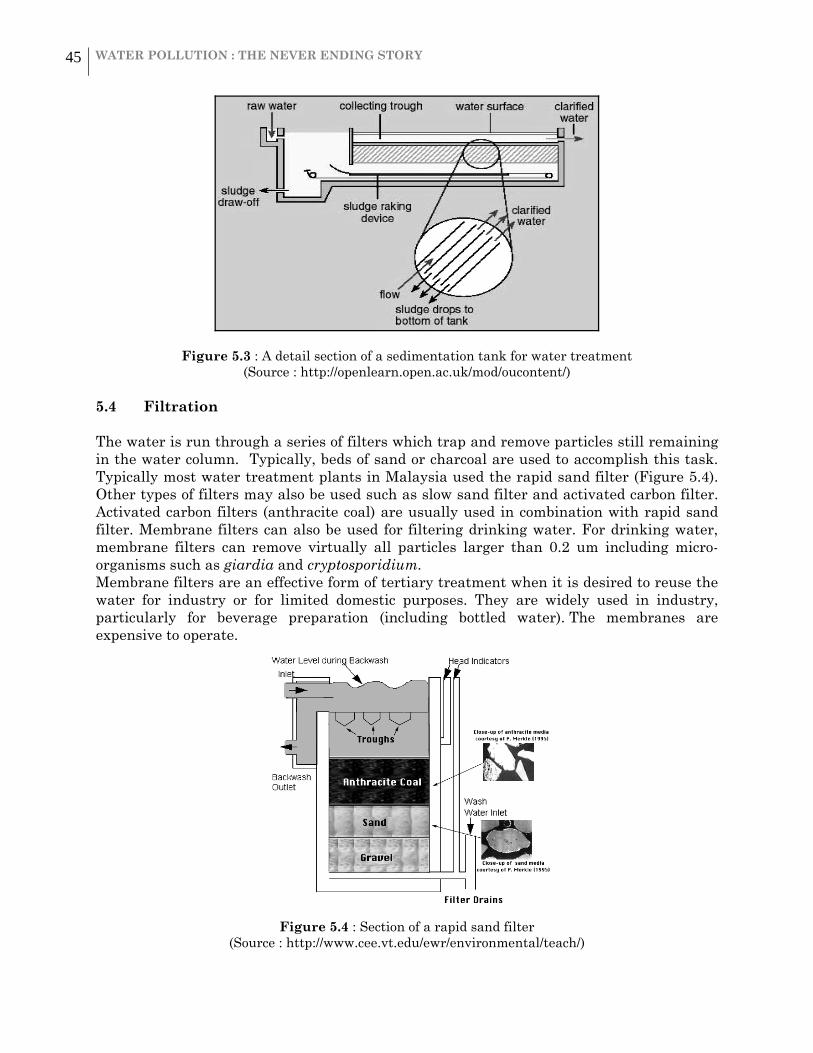
45 WATER POLLUTION : THE NEVER ENDING STORY
Figure 5.3 : A detail section of a sedimentation tank for water treatment (Source : http://openlearn.open.ac.uk/mod/oucontent/)
5.4 Filtration The water is run through a series of filters which trap and remove particles still remaining in the water column. Typically, beds of sand or charcoal are used to accomplish this task. Typically most water treatment plants in Malaysia used the rapid sand filter (Figure 5.4). Other types of filters may also be used such as slow sand filter and activated carbon filter. Activated carbon filters (anthracite coal) are usually used in combination with rapid sand filter. Membrane filters can also be used for filtering drinking water. For drinking water, membrane filters can remove virtually all particles larger than 0.2 um including micro-organisms such as giardia and cryptosporidium. Membrane filters are an effective form of tertiary treatment when it is desired to reuse the water for industry or for limited domestic purposes. They are widely used in industry, particularly for beverage preparation (including bottled water). The membranes are expensive to operate.
Figure 5.4 : Section of a rapid sand filter (Source : http://www.cee.vt.edu/ewr/environmental/teach/)

46 WATER POLLUTION : THE NEVER ENDING STORY
5.5 Disinfection Disinfection is accomplished both by filtering out harmful microbes and also by adding disinfectant chemicals in the last step in purifying drinking water. Water is disinfected to kill any pathogens which pass through the filters. The water, now largely free of particles and microorganisms, is treated to destroy any remaining disease-causing pathogens. The water is now safe to drink and is sent to pumping stations for distribution to homes and businesses. There are various methods of disinfection. Chlorination is the most common method of disinfection (Figure 5.5). Other than chlorine, ultra violet light can also be used. It is very effective at inactivating cysts, in low turbidity water. UV light's disinfection effectiveness decreases as turbidity increases, a result of the absorption, scattering, and shadowing caused by the suspended solids. The main disadvantage to the use of UV radiation is that, it leaves no residual disinfectant in the water; therefore, it is sometimes necessary to add a residual disinfectant after the primary disinfection process. This is often done through the addition of chloramines. When used in this manner, chloramines provide an effective residual disinfectant with very few of the negative aspects of chlorination.
Figure 5.5 : Chlorine tank to supply chlorine to disinfect water supply 5.6 Advanced Drinking Water Treatment
Membrane filtration is now fast becoming a common technology used to treat potable drinking water in developed countries and is also rapidly gaining acceptance throughout the world as an effective and economical water treatment method (Figure 5.6 and 5.7). The application continues to grow, as the membranes are now increasingly cost effective with better performance characteristics.
Furthermore, with the ever-increasing load of a variety of pollutants in our surface water such as endocrine disrupting chemicals, eco-hazard, carcinogens etc, and also the ever-increasing demand for high water quality by the consumers, the use of membrane filtration technology is expected to become popular and will be the future water treatment technology.

47 WATER POLLUTION : THE NEVER ENDING STORY
Figure 5.6 : Water supply treatment system using membrane as contaminant remover
(Source : http://www.puncakniaga.com.my).
Figure 5.7 : Set of membrane filter (http://www.puncakniaga.com.my).
There are many benefits in using membrane filtration for potable water production when compared to the conventional treatment method as listed below:
The Membrane Filtration system is reliable to consistently produce very high quality and crystal clear filtered water. This is achievable as the pore size of the membrane filtration media is very small, in the range of microns instead of millimetres or centimetres.

48 WATER POLLUTION : THE NEVER ENDING STORY
Membrane Filtration is able to remove suspended solids without the need to use
chemicals. With less chemical consumption, the associated health risks that are always related to chemical use in water treatment process such as aluminium is eliminated.
The chemical-free waste arising from non-useable of chemicals in the treatment process will not pollute the environment and can be discharged directly to local water bodies and waterways without further treatment.
Membrane filtration can remove microorganisms in water such as protozoa, bacteria and viruses as the pore size of the membrane is very much smaller than these microorganisms. In fact, it can effectively and completely remove chlorine-resistant pathogenic protozoan cysts and oocysts of Cryptosporidium and Giardia. The effective removal of these microorganisms makes the water very safe for consumption.
The chemical consumption required for disinfection especially chlorine will be substantially reduced as most of the microorganism will be removed at the filtration stage.
The membrane filtration water treatment system is of modular design and compact. Thus, it will require small footprint and does not require large space, which will lead to cheaper development cost if built in land-starved urban areas. Furthermore, it can be easily expanded corresponding to the water supply demand.
The system can be easily integrated into simple automation and remote control system and makes its operation simple. (http://www.puncakniaga.com.my).

49 WATER POLLUTION : THE NEVER ENDING STORY
CHAPTER SIX
WASTEWATER
6.0 Introduction to Wastewater
Wastewater is a term applied to any type of water that has been utilized in some capacity that negatively impacts the quality of the water. Common examples of wastewater include water that is discharged from households, office and retail buildings, and manufacturing plants. Wastewater may also refer to any water that is utilized in an agricultural facility and is no longer considered fit for human consumption.
The most common example of wastewater is liquid sewage. Discharged from homes and businesses alike, sewage usually contains a mixture of human waste, food remnants, water used in washing machines, and any other items that may have found their way into the sewage system. Many municipalities operate wastewater treatment plants that help to purify the sewage and recycle the water for other uses, such as watering lawns. The plant may employ many different devices to recycle the wastewater, including filters and chemical treatments.
6.1 Wastewater Wastewater is any water that has been adversely affected in quality by anthropogenic influence. It comprises liquid waste discharged by domestic residences, commercial properties, industry, and/or agriculture and can encompass a wide range of potential contaminants and concentrations. In the most common usage, it refers to the municipal wastewater that contains a broad spectrum of contaminants resulting from the mixing of wastewaters from different sources. 6.1.1 Domestic Wastewater (Sewage) It is correctly the subset of wastewater that is contaminated with feces or urine, but is often used to mean any waste water. "Sewage" includes domestic, municipal, or industrial liquid waste products disposed of, usually via a pipe or sewer or similar structure, sometimes in a cesspool emptier. The physical infrastructure, including pipes, pumps, screens, channels etc. used to convey sewage from its origin to the point of eventual treatment or disposal is termed sewerage.

50 WATER POLLUTION : THE NEVER ENDING STORY
6.1.2 Industrial Wastewater Industrial wastewater is the by-product of industrial activities in the production of any product. Some industrial facilities generate ordinary domestic sewage that can be treated by municipal facilities. Industries that generate wastewater with high concentrations of conventional pollutants (e.g. oil and grease), toxic pollutants (e.g. heavy metals, volatile organic compounds) or other non-conventional pollutants such as ammonia, need specialized treatment systems. Some of these facilities can install a pre-treatment system to remove the toxic components, and then send the partially-treated wastewater to the municipal system. Industries generating large volumes of wastewater typically operate their own complete on-site treatment systems.
Sources of industrial wastewater are; Agricultural waste Iron and steel industry Mines and quarries Food industry Complex organic chemicals industry Nuclear industry Water treatment
6.2 BOD Pollution Load
The discharge of domestic sewage, in the form of treated sewage and partially treated sewage, remained the largest contributor of organic pollution load with an estimated biochemical oxygen demand (BOD) load of 883,391.08 kg/day. The estimated BOD loading contributed by other major sectors were agro-based and manufacturing industries (76,790.77 kg/day) and pig farming (213,215.00 kg/day). Table 1 indicates the total BOD load in kg/day discharged from sewage treatment plants throughout Malaysia in 2006. (IWK Report, 2006)
Table 6.1: Malaysia: Total BOD Load (kg/day) from Sewage Treatment Plants
State No. of STP
Total PE Flow
(m3/day) BOD Load (kg/day)
Selangor 2,563 5,908,450 1,329,401 332,350.31
Perak 1,343 1,300,430 292,597 73,149.19
Johor 1010 1,198,417 269,644 67,410.96
Negeri Sembilan 928 931,458 209,578 52,394.51
Kedah 755 556,637 125,243 31,310.83
Melaka 725 570,192 128,293 32,073.30
Pulau Pinang 650 2,149,001 483,525 120,881.31
Pahang 486 314,830 70,837 17,709.19

51 WATER POLLUTION : THE NEVER ENDING STORY
WP Kuala Lumpur
299 2,571,877 578,672 144,668.08
Terengganu 224 75,184 16,916 4,229.10
Perlis 36 16,156 3,635 908.78
WP Labuan 32 39,265 8,835 2,208.66
WP Putrajaya 9 72,833 16,387 4,096.86
Total 9,060 15,704,730 3,533,563 883,391.08 (Source: IWK Report, 2006)
Note : STP = Sewage Treatment Plant PE = Population Equivalent
6.3 Municipal Wastewater Wastewater generated from residences, hotels, commercial premises and institutions such as school and colleges are termed as municipal wastewaters. Municipal wastewaters are waterborne solids (5%) and liquids (95%) discharged to the sewers and represent the wastewater of community life. In composition wastewater includes dissolved and suspended organic solids, which are "putrescible" or biologically decomposable. Domestic wastewater also contains countless numbers of living organisms - bacteria and other microorganisms whose life activities cause the process of decomposition. Process of decomposition needs the presence of oxygen for the micro-organisms to work. This condition is called aerobic decomposition. When decay proceeds under aerobic conditions, that is, in the presence of dissolved oxygen, offensive conditions are avoided and the treatment process is greatly accelerated. But, when decay proceeds under anaerobic conditions, that is, in the absence of dissolved oxygen in the wastewater, offensive conditions result and odours and unsightly appearances are produced. The overall philosophy of wastewater sanitation involving the removal, control and treatment of a wastewater in an area that is isolated or remote from the center of activity is important. Over the years wastewater treatment management practices have evolved into a technically complex body of knowledge based on past practice and applied engineering and environmental sciences. The intelligent application of these fundamentals goes a long way toward assuring us that the environment will be maintained in a safe and acceptable condition. There are two general treatment objectives with respect to wastewater: Reducing or minimizing the public health hazards of a wastewater. These are general
treatment measures aimed at preventing pathogens and other potentially harmful components from finding their way back to the consumer.
Eliminating, reducing or minimizing the deteriorative impact of a wastewater on the receiving water quality and its environment.

52 WATER POLLUTION : THE NEVER ENDING STORY
A sharp distinction must be made between the term "wastewater disposal" and "wastewater treatment". All wastewater has to be disposed of. Some wastewater is subjected to various types of treatment before disposal, but some wastewater receives no treatment before disposal. Generally a stream of wastewater has to undergo treatment before releasing to the environment. 6.4 Onsite Sewage Systems
Onsite wastewater treatment is applicable whenever the premise cannot be connected to the main sewer for it is situated far away from any cluster of homes, offices, shops etc. Onsite sewage systems are effective at treating household sewage if designed and installed properly in appropriate soil and maintained regularly. In typical onsite sewage systems, the wastewater from toilets and other drains flows from a house or any other single premise into a tank that separates the solids and scum from the liquid. The tank is called the septic tank. It consists of two chambers. Wastewater flows into the chambers and anaerobic and anoxic bacteria help break down the solids into sludge (Figure 6.1). The sludge will build up at the bottom and needs to be pumped out as build up of sludge will reduce the working volume and thus the retention time. The degree of treatment will depend on the strength of wastewater coming in into the tank as well as the hydraulic retention time provided. The liquid then flows out of the tank into a network of pipes buried in a disposal field of gravel and soil. The pipes are perforated as to allow the partially treated wastewater to be released into the disposal field (Figure 6.2). The soil, gravel and naturally occurring bacteria in the soil filter and cleanse the wastewater.
Figure 6.1 : Schematic diagram of a septic tank
(Source : http://greenarrowenvironmental.com/images/Septic%20Tank.jpg)

53 WATER POLLUTION : THE NEVER ENDING STORY
Figure 6.2 : Schematic diagram of an individual septic tank system installed to a house
(Source : http://www.1goodhomeinspection.com/blog/ 2008/07/31/how-does-my-septic-system-work/)
Onsite systems have to properly designed, planned, constructed or maintained in order for the system to operate at optimum capacity. Onsite sewage systems can fail due to poor maintenance and untreated wastewater can be carried to nearby waterbodies threatening human health, causing excessive algal growth and harming aquatic life. If your onsite system is not properly located on your property or does not have an appropriate depth of suitable soil, the system may not fully treat the wastewater. The wastewater can seep down into the ground water polluting drinking water supplies or rise to the surface and flow over land into nearby waterbodies. If you don't have your septic tank pumped out regularly, the solids and scum can flow into the drainfield and plug it up. If the drainfield gets clogged, untreated wastewater can rise to the surface threatening your family's and neighbors' health, reducing the value of your property and creating odours and the need for costly repairs. Heavy use of strong disinfectants can kill the beneficial bacteria in the soil around your disposal field and reduce the natural cleansing function of your system. Finally, if you use too much water in your home, wastewater can be flushed out too quickly and solids can flow into the drainfield, causing it to plug. The less you flush or pour down your drains, the better your system will work.
A failing onsite sewage system will have one or more of the following signs: unusually green or spongy grass over the system; toilets, showers and sinks back up or take a long time to drain; sewage surfacing on your lawn or in a nearby ditch; sewage odours around your yard, especially after rain.

54 WATER POLLUTION : THE NEVER ENDING STORY
6.5 Municipal Wastewater Treatment 6.5.1 Primary Treatment (Screening, Grit Removal and Settling) Primary treatment involves screening, grinding and sedimentation/clarification, to remove the floating and settleable solids found in raw wastewater. When raw wastewater enters the treatment plant it is typically coarse screened to remove large objects, ground to reduce the size of the remaining solids, and then flows to primary sedimentation tanks. Then the wastewater is passed through grit chamber which provide ample retention time for the grits to settle as grits would damage pumps if not removed from the wastewater. The sedimentation tanks as shown in Figure 6.3 provide sufficient capacity to establish quiescence in the wastewater, allowing solids with a higher specific gravity than water to settle and those with a lower specific gravity to float. Well-designed and well-operated primary treatment should remove 50 to 70% of the suspended solids and 25 to 40% of the BOD. Free oil, grease and other floating material are removed by skimmers from the surface of the primary sedimentation tanks. Typical detention time in the primary sedimentation tanks is only 1.5 to 2.5 hours. Chemical flocculants/polymers are frequently added to the primary sedimentation tanks to increase solids removal. Solids removed during primary treatment are dewatered and disposed of as part of the sludge treatment.
Figure 6.3 : Primary treatment tank (settling of coarse materials) (Source : http://lincoln.ne.gov/city/pworks/waste/
wstwater/treat/images/secondarylg.jpg) 6.5.2 Secondary Treatment Secondary treatment of wastewater usually involved the use of physical, chemical or biological process. But usually secondary treatment involves biological process which is the most economical of the three processes. One such secondary treatment is accomplished by a biological process called aerobic, suspended growth, activated sludge treatment (Figure 6.4). Activated sludge secondary treatment typically accounts for 30 to 60% of total plant energy consumption. Effluent from primary treatment is treated in large reactors or basins. In these reactors, an aerobic bacterial culture (the activated sludge) is maintained,

55 WATER POLLUTION : THE NEVER ENDING STORY
suspended in the liquid contents. Hydraulic detention time in the secondary reactors ranges from 6 to 8 hours. The secondary process removes organic material that is either colloidal in size or dissolved.
Figure 6.4 : An activated sludge process in the secondary treatment of wastewater
(Source : http://www.brighthub.com/environment/science-environmental/articles/66157.aspx)
Removal of BOD in secondary treatment is usually 70 to 85% of the BOD entering with the primary effluent. Aerobic conditions are produced and maintain by injection of dispersed air, or by injection of pure oxygen dispersed by mechanical agitation. The aerobic bacteria metabolize the organic carbon in the wastewater, producing carbon dioxide, nitrogen compounds and a biological sludge. Treated effluent from the aeration basins flows to secondary clarification. A portion of the sludge from the clarifier is recycled to the aeration basins/reactors and the rest is withdrawn, or "wasted". The recycled sludge will help to enhance the organic removal as the bacteria contained in the recycled sludge are already acclimatized to the condition inside the reactor. The remaining sludge is wasted as waste sludge and is dewatered and disposed of by various methods. The clarified effluent from secondary treatment is disinfected and discharged. 6.5.3 Activated Sludge Bacteria There are numerous types of bacteria involved in the aerobic degradation of the pollutants in the water. The bacteria will use the organic pollutants as nutrients and oxygen to metabolise. The metabolism will cause the bacteria to reproduce and result in the increase of bacterial population. The most common are shown in Figures 6.5 and 6.6 which include rotifer, paramecium, cilia and flagella. Numerous other types are also found such as nematodes, amoeba and fungi.

56 WATER POLLUTION : THE NEVER ENDING STORY
Figure 6.5 : Rotifer (left) and paramecium (right) (Source : http://www.brighthub.com/environment/science-environmental/articles/66157.aspx)
Figure 6.6 : Cilia and Flagella (Source : Pearson Prentice Hall, 2005) 6.5.4 Tertiary Treatment Tertiary treatment or advanced wastewater treatment is specifically important. It is becoming more common as discharge permits increasingly call for the removal of specific contaminants (nutrients) such as phosphate and compounds of nitrogen which are not normally removed during conventional secondary treatment. Removal of nutrients (particularly nitrogen) prior to discharge requires additional treatment. The presence of nutrients will encourage algal growth in the receiving waters, reducing dissolved oxygen and causing aquatic animals to die including fish and produced odour. This phenomenon of algal and other aquatic plants growth is called eutrophication. The air activated sludge secondary treatment process can be combined with anoxic processing for removing nitrogen from the wastewater. The anoxic zone is a section of the aeration basin where no aeration is provided. The purpose of the anoxic zone is to provide an environment for nitrification-denitrification to occur. Nitrification is the biological conversion of ammonia to nitrites and nitrates. Denitrification is the biological conversion of nitrate to nitrogen gas. When nitrogen gas is formed, it rises through the wastewater and is released into the atmosphere. The purpose for incorporating the nitrification-denitrification process is to reduce the amount of nitrates, which would otherwise be in the
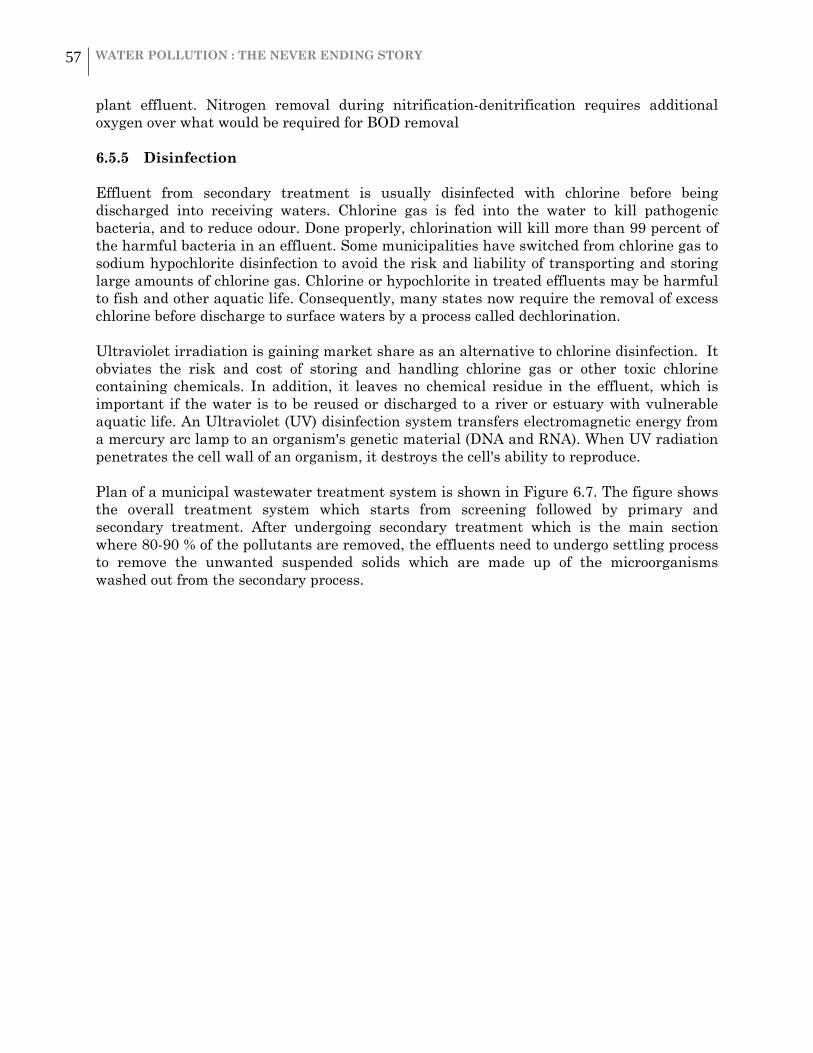
57 WATER POLLUTION : THE NEVER ENDING STORY
plant effluent. Nitrogen removal during nitrification-denitrification requires additional oxygen over what would be required for BOD removal 6.5.5 Disinfection Effluent from secondary treatment is usually disinfected with chlorine before being discharged into receiving waters. Chlorine gas is fed into the water to kill pathogenic bacteria, and to reduce odour. Done properly, chlorination will kill more than 99 percent of the harmful bacteria in an effluent. Some municipalities have switched from chlorine gas to sodium hypochlorite disinfection to avoid the risk and liability of transporting and storing large amounts of chlorine gas. Chlorine or hypochlorite in treated effluents may be harmful to fish and other aquatic life. Consequently, many states now require the removal of excess chlorine before discharge to surface waters by a process called dechlorination. Ultraviolet irradiation is gaining market share as an alternative to chlorine disinfection. It obviates the risk and cost of storing and handling chlorine gas or other toxic chlorine containing chemicals. In addition, it leaves no chemical residue in the effluent, which is important if the water is to be reused or discharged to a river or estuary with vulnerable aquatic life. An Ultraviolet (UV) disinfection system transfers electromagnetic energy from a mercury arc lamp to an organism's genetic material (DNA and RNA). When UV radiation penetrates the cell wall of an organism, it destroys the cell's ability to reproduce. Plan of a municipal wastewater treatment system is shown in Figure 6.7. The figure shows the overall treatment system which starts from screening followed by primary and secondary treatment. After undergoing secondary treatment which is the main section where 80-90 % of the pollutants are removed, the effluents need to undergo settling process to remove the unwanted suspended solids which are made up of the microorganisms washed out from the secondary process.

58 WATER POLLUTION : THE NEVER ENDING STORY
Figure 6.7 : Plan of a municipal wastewater treatment system (Source : Pearson, 2000)

59 WATER POLLUTION : THE NEVER ENDING STORY
6.6 Methods of Secondary Wastewater Treatment 6.6.1 The Suspended Microorganisms Process In the Activated Sludge Process, the microorganisms are suspended in the wastewater. As the microorganisms move about within the wastewater, they are able to remove organic materials for food. Microorganisms are collected and recycled during the Activated Sludge Process, causing the treatment plant microorganism population to be significantly larger than the microorganism population that would occur naturally in a stream or lake. The increased population is able to remove the large amount of organic material that is present in the wastewater. Mixing is accomplished through injection of air through diffusers located near the bottom of the aeration tank or through mechanical agitation with propeller type mixing devices. The Activated Sludge Process performs well as long as the system is designed and operated correctly. However, the process requires constant operator supervision, laboratory testing and monitoring to assure performance, and consistent maintenance of mechanical equipment. The process also produces a large amount of waste sludge that must be stabilized and disposed of (up to 0.65 lbs. of sludge for each lb. of BOD treated), and requires a great deal of energy to process the wastewater. The Activated Sludge System is very inefficient for lower than design flows and is not tolerant of shutdown periods or highly varying flows or food loadings. The overall operational cost of the Activated Sludge Process can be very high as compared to attached growth systems. 6.6.2 The Attached Growth Process The second type of aerobic biological treatment system is called "Attached Growth Biological Treatment" and deals with microorganisms that are fixed in place on a solid surface. This "attached growth type" aerobic biological treatment process creates an environment that supports the growth of those types of microorganisms that prefer to remain attached to a solid material. The material that the microorganisms attach themselves to is called "media." This media can be any solid material that the microorganisms are able to attach to, either natural or synthetic. The natural material used in wastewater treatment will be stone or rock, while the synthetic material is usually plastic or textile fibers. This treatment process is designed to support a significantly larger population of microorganisms than can be supported by the natural environment of a stream or lake. Because the microorganisms are fixed in place in this type of process, their food must be brought to them. Here are the common ways to accomplish this task:

60 WATER POLLUTION : THE NEVER ENDING STORY
6.6.3 Trickling Filter In the Trickling Filter Process, the wastewater is spread over the microorganisms and is allowed to "trickle down" through the microorganism-covered media. A trickling filter is a secondary treatment process, and therefore follows primary treatment. Primary treatment removes settleable and floatable solids; so by the time the wastewater reaches the trickling filter it contains mostly colloidal and dissolved solids. The purpose of the trickling filter is to remove these colloidal and dissolved solids through the aerobic biological decomposition process.
Figure 6.8 : Trickling filter
Figure 6.9 : Schematic diagram of a trickling filter (Source : http://www.rpi.edu/dept/chem-eng/Biotech-
Environ/FUNDAMNT/streem/trickfil.jpg)
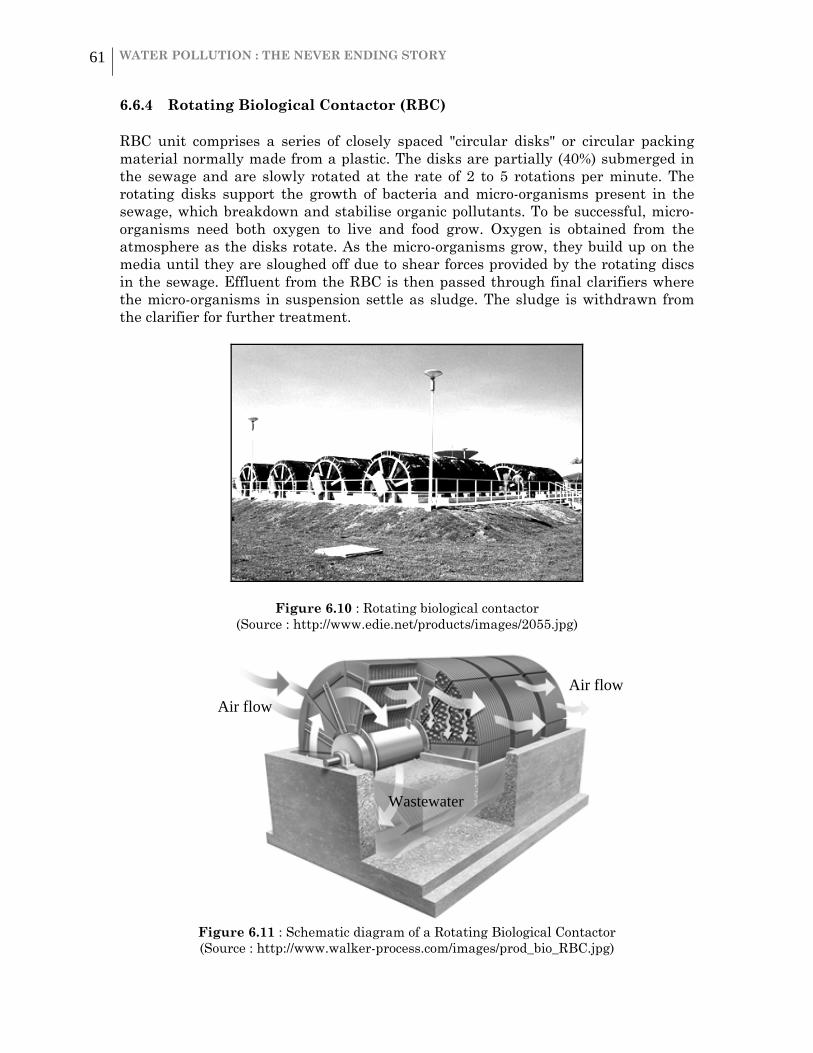
61 WATER POLLUTION : THE NEVER ENDING STORY
6.6.4 Rotating Biological Contactor (RBC)
RBC unit comprises a series of closely spaced "circular disks" or circular packing material normally made from a plastic. The disks are partially (40%) submerged in the sewage and are slowly rotated at the rate of 2 to 5 rotations per minute. The rotating disks support the growth of bacteria and micro-organisms present in the sewage, which breakdown and stabilise organic pollutants. To be successful, micro-organisms need both oxygen to live and food grow. Oxygen is obtained from the atmosphere as the disks rotate. As the micro-organisms grow, they build up on the media until they are sloughed off due to shear forces provided by the rotating discs in the sewage. Effluent from the RBC is then passed through final clarifiers where the micro-organisms in suspension settle as sludge. The sludge is withdrawn from the clarifier for further treatment.
Figure 6.10 : Rotating biological contactor (Source : http://www.edie.net/products/images/2055.jpg)
Figure 6.11 : Schematic diagram of a Rotating Biological Contactor (Source : http://www.walker-process.com/images/prod_bio_RBC.jpg)
Air flow Air flow
Wastewater

62 WATER POLLUTION : THE NEVER ENDING STORY
CHAPTER 7
WATER QUALITY MANAGEMENT
7.0 Introduction The Department of Environment (DOE), Malaysia, has started monitoring river water quality since 1978. They initially established water quality baselines and subsequently to detect water quality changes and identifies pollution sources. Samples had been regularly taken at predetermined stations for in-situ and laboratory analysis and data interpretation in terms of physico-chemical and biological characteristics. Assessment of water quality is based on the Water Quality Index (WQI). WQI consists of parameters such as Dissolved Oxygen (DO), Biochemical Oxygen Demand (BOD), Chemical Oxygen Demand (COD), Ammoniacal Nitrogen (NH3-N), Suspended Solids (SS) and pH. The WQI serves as a basis for environmental appraisal of a watercourse in relation to pollution load categorization and designation of classes of beneficial uses as provided for under the Interim National Water Quality Standards for Malaysia (INWQS). (Department of Environment, 2005). INWQS is divided into 5 classes, Class 1 being the cleanest and Class V being the most polluted. 7.1 Water Quality Index The Department of Environment (DOE) used Water Quality Index (WQI) to evaluate the status of the river water quality. The WQI serves as the basis for environment assessment of a watercourse in relation to pollution load categorization and designation of classes of beneficial uses as provided for under the National Water Quality Standards for Malaysia (NWQS). In 2006, a total of 1,064 water quality monitoring stations located within 146 river basins were monitored. Out of these 1,064 monitoring stations, 619 (58%) were found to be clean, 359 (34%) slightly polluted and 86 (8%) polluted. Stations located upstream were generally clean, while those downstream were either slightly polluted or polluted. In terms of river basin water quality, 80 river basins (55%) were clean, 59 (40%) slightly polluted and 7 (5%) were polluted. The major pollutants were Biochemical Oxygen Demand (BOD), Ammoniacal Nitrogen (NH3-N) and Suspended Solids (SS). In 2006, 22 river basins were categorized as being polluted by BOD, 41 river basins by NH3-N and 42 river basins by SS. High BOD was contributed largely by untreated or partially treated sewage and discharges from agro-based and manufacturing industries. The main sources of NH3-N were

63 WATER POLLUTION : THE NEVER ENDING STORY
domestic sewage and livestock farming, whilst the sources for SS were mostly earthworks and land clearing activities. (DOE Report, 2007) Analysis of heavy metals in 5,613 water samples revealed that almost all samples complied with Class III, National Water Quality Standards for arsenic (As), mercury (Hg), cadmium (Cd), chromium (Cr), lead (Pb) and zinc (Zn), except iron (Fe) with 83 percent compliance. Figure 1 shows the trend of water quality in river basins. Intensified enforcement efforts and good environmental management practices could also have contributed to the water quality improvement. (WEPA, 2011 – Water Environment Partnership in Asia)
Figure 7.1 : The status of river water quality in Malaysia for year 1990 – 2006 (Source : DOE Report, 2007)
7.2 River Classification in Malaysia In Malaysia, the Department of Environment (DOE) developed a Water Quality Index system (WQI) to analyze trends in water quality of rivers in our country based on 6 parameters which is DO, BOD, COD, SS, AN and pH. WQI, in common with many other indices systems, relates a group of water quality parameters to a common scale and combines them into a single number in accordance with a chosen method or model of computation. The main objective of the WQI system is to use it as a preliminary means of assessment of a water body for compliance with the standards adopted for five designated classes of beneficial uses. The desired used of WQI to an assessment of water quality trends for management purposes even though it is not meant specially as an absolute measure of the degree of pollution or the actual water quality. The river classification based on the DOE-WQI is given in the Table 7.1. Rivers are usually classified according to their beneficial uses as shown in Table 7.3. The

64 WATER POLLUTION : THE NEVER ENDING STORY
Interim National Water Quality Standard (INWQS) for the identified beneficial uses were derived from water quality criteria. Table 7.4 shows the classification based on INWQS and the parameters involved.
Table 7.1 : Classification WQI-DOE
WQI-DOE Value /Score
Condition
90-100 Very Good 75-90 Good 45-75 Average 20-45 Polluted 0-20 Very Polluted
7.3 WQI Formula and Calculation Water Quality Index (WQI) is calculated by using the following formula; WQI = (0.22* SlDO) + (0.19*SIBOD) + (0.16*SICOD) + (0.15*SIAN) + (0.16 * SISS) + (0.12 * SIpH) where; SIDO = Sub Index DO (% saturation) SIBOD = Sub Index BOD SICOD = Sub Index COD SIAN = Sub Index NH3-N SISS = Sub Index SS SIpH = Sub Index pH The calculation of sub index properties for each parameter in order to obtain the WQI value are shown below and the value of WQI should be within the range of 0 ≤ WQI ≤ 100 best fit equations for the estimation of various sub index values Sub Index for DO (In % saturation) SIDO = 0 for x ≤ 8 SIDO = 100 for x ≥ 92 SIDO = -0.395 + 0.030x2 - 0.00020x3 for 8 < x < 92 Sub Index for BOD SIDOD = 100.4 - 4.23x for x ≤ 5 SIDOD = 108(e-0.055x) - 0.1x for x > 5 Sub Index for COD SICOD = -1.33x + 99.1 for x ≤ 20 SICOD = 103(e-0.0157x) - 0.04x for x > 20 Sub Index for NH3-N SIAN = 100.5 - 105x for x ≤ 0.3 SIAN = 94(e-0.573x) – 5(x – 2) for 0.3 < x < 4

65 WATER POLLUTION : THE NEVER ENDING STORY
SIAN = 0 for x ≥ 4 Sub Index for SS SISS = 97.5(e-0.00676x) + 0.05x for x ≤ 100 SISS = 71(e-0.0061x) + 0.015x for 100 < x < 1000 SISS = 0 for x ≥ 1000 Sub Index for pH SIpH = 17.02 - 17.2x + 5.02x2 for x < 5.5 SIpH = -242 + 95.5x - 6.67x2 for 5.5 ≤ x < 7 SIpH = -181 + 82.4x - 6.05x2 for 7 ≤ x < 8.75 SIpH = 536 - 77.0x + 2.76x2 for x ≥ 8.75
Table 7.2 : DOE Water Quality Classification Based On Water Quality Index
SUB INDEX & WATER QUALITY INDEX
INDEX RANGE
CLEAN SLIGHTLY POLLUTED POLLUTED
Biochemical Oxygen Demand(BOD) 91 - 100 80 - 90 0 - 79
Ammoniacal Nitrogen(NH3-N) 92 - 100 71 - 91 0 - 70
Suspended Solids(SS) 76 - 100 70 - 75 0 - 69
Water Quality Index(WQI) 81 - 100 60 - 80 0 - 59
The Department of Environment (DOE) initiated the development of Receiving Water Quality criteria for Malaysia in 1985 which aimed at developing a water quality management approach for the long term water quality of the nation's water resources. The Water Quality Consultancy Group of the Institute of Advanced Studies, University of Malaya was commissioned in 1985 to undertake Phase I Study for the development of water quality criteria and standards for Malaysia. The study recommended that Malaysian rivers be classified according to the six classes and described in Table 7.2.
Table 7.3 : Class and uses of water in the previous table is described below
CLASS BENEFICIAL USES
Class I Conservation of natural environment. Water Supply I - Practically no treatment necessary. Fishery I - Very sensitive aquatic species.
Class IIA Water Supply II - Conventional treatment. Fishery II - Sensitive aquatic species.
Class IIB Recreational use body contact.
Class III Water Supply III - Extensive treatment required. Fishery III - Common,of economic value and tolerant species;livestock drinking.

66 WATER POLLUTION : THE NEVER ENDING STORY
Class IV Irrigation
Class V None of the above.
(Source : DOE, Malaysia)
Table 7.4 : Interim National Water Quality Standards For Malaysia (INWQS)
PARAMETER UNIT CLASS
I IIA IIB III IV V
Ammoniacal Nitrogen mg/l 0.1 0.3 0.3 0.9 2.7 > 2.7
Biochemical Oxygen Demand
mg/l 1 3 3 6 12 > 12
Chemical Oxygen Demand
mg/l 10 25 25 50 100 > 100
Dissolved Oxygen mg/l 7 5 - 7 5 - 7 3 - 5 < 3 < 1
pH - 6.5 - 8.5 6 - 9 6 - 9 5 - 9 5 - 9 -
Colour TCU 15 150 150 - - -
Electrical Conductivity* µS/cm 1000 1000 - - 6000 -
Floatables - N N N - - -
Odour - N N N - - -
Salinity % 0.5 1 - - 2 -
Taste - N N N - - -
Total Dissolved Solid mg/l 500 1000 - - 4000 -
Total Suspended Solid mg/l 25 50 50 150 300 >300
Temperature °C - Normal + 2 °C
- Normal + 2 °C
- -
Turbidity NTU 5 50 50 - - -
Faecal Coliform** count/100 ml
10 100 400 5000 (20000)
a
5000 (20000)
a
-
Total Coliform count/100 ml
100 5000 5000 50000 50000 > 50000
(Source : DOE, Malaysia) Notes * = At hardness 50 mg/l CaCO3 # = Maximum (unbracketed) and 24-hour average (bracketed) concentrations N = Free from visible film sheen, discolouration and deposits

67 WATER POLLUTION : THE NEVER ENDING STORY
Table 7.5 below shows the discharge standards for sewage and industrial effluents. The limit are indicated as Standard A and B. Standard A being discharge point is at the upstream of water intake point for water supply whilst Standard B indicating otherwise. The main parameters considered are temperature, pH, BOD5, COD and suspended solids. The other parameters are also compulsory but not always tested.
Table 7.5 : Environmental Quality (Sewage and Industrial Effluents)
Regulations, 1979. Maximum Effluent Parameter Limits Standards A and B.
No. Parameter Units Standard A B
1 Temperature oC 40 40
2 pH - 6.0 - 9.0 5.5 - 9.0
3 BOD5 @ 20oC mg/l 20 50 4 COD mg/l 50 100 5 Suspended Solids mg/l 50 100 6 Mercury mg/l 0.005 0.05 7 Cadmium mg/l 0.01 0.02 8 Chromium, Hexalent mg/l 0.05 0.05 9 Arsenic mg/l 0.05 0.10
10 Cyanide mg/l 0.05 0.10 11 Lead mg/l 0.10 0.5 12 Chromium, Trivalent mg/l 0.20 1.0 13 Copper mg/l 0.20 1.0 14 Manganese mg/l 0.20 1.0 15 Nickel mg/l 0.20 1.0 16 Tin mg/l 0.20 1.0 17 Zinc mg/l 1.0 1.0 18 Boron mg/l 1.0 4.0 19 Iron (Fe) mg/l 1.0 5.0 20 Phenol mg/l 0.001 1.0 21 Free Chlorine mg/l 1.0 2.0 22 Sulphide mg/l 0.50 0.50 23 Oil and Grease mg/l Not detectable 10.0
1. Standard A for discharge upstream of drinking water take-off 2. Standard B for inland waters
The pollutant limits for drinking water is more stringent and is shown in Table 7.4. All the limits must not be exceeded at any time. Any indication of the standard being exceeded the supply of drinking water must be stopped immediately

68 WATER POLLUTION : THE NEVER ENDING STORY
Table 7.6 : Malaysia: National Guidelines for Raw Drinking Water Quality (Revised December 2000)
Parameter Symbol Benchmark
Sulphate SO4 250 mg/l Hardness CaCO3SO 500 mg/l Nitrate NO3SO 10 mg/l
Coliform - Must not be
detected in any 100 ml sample
Manganese Mn 0.1 mg/l Chromium Cr 0.05 mg/l Zinc Zn 3 mg/l Arsenic As 0.01 mg/l Selenium Se 0.01 mg/l Chloride Cl 250 mg/l Phenolics - 0.002 mg/l TDS - 1000 mg/l Iron Fe 0.3 mg/l Copper Cu 1.0 mg/l Lead Pb 0.01 mg/l Cadmium Cd 0.003 mg/l Mercury Hg 0.001 mg
Within the past century, the extensive use of chemicals in agriculture and big industry has polluted every source of water on the planet. Traces of toxic synthetic chemicals can even be found in polar icecaps and the Arctic Ocean. Despite our intelligence, we’re literally destroying our water supply of the most essential elements of life!
7.4 How Not to Drink Contaminated Water
According to the USEPA, there are over 700 chemicals in our drinking water, and that includes “clean” sources such as wells and springs. These chemicals are not easily filtered by the conventional or non-conventional water treatment systems that are done by the authorities. Of all the dangerous chemicals found in drinking water, chlorine and fluoride are two of the most prominent. In fact, both of these chemicals are added intentionally during water treatment to provide disinfection (addition of chlorine) and to strengthen the teeth (addition of fluoride). The byproducts that result from the chlorination of water, such as trihalomethanes, are actually a much larger concern than the chlorine itself. These byproducts don’t break down easily and tend to accumulate in the body faster than the detoxification system can handle. They’ve been linked to cancer, are known to damage the heart, lungs, kidneys, and

69 WATER POLLUTION : THE NEVER ENDING STORY
nervous system, and are lethal to the beneficial bacteria in the intestines that are crucial to immunity and digestion.
Many of the toxic chemicals found in drinking water are dangerous in very small quantities. As such, it’s nearly impossible to identify them based on taste, and this increases the need to be sure that your drinking water is properly filtered.
The best line of defense against polluted water is by installation of water filtration system right in our own house. The best type of filtration is the combination of reverse osmosis and activated carbon. This combination is commonly combined into a single filtration unit that can be connected to the sink or refrigerator. One problem with filtering drinking water is that it filters it too well and removes the natural minerals and trace elements along with the chemicals. Many experts believe that drinking this type of water will cause these essential materials to be pulled out of our body. But on the other hand, the minerals that we take in with our food are ample to replace the one we lost in the filtration system.
Figure 7.2 : A set of home water purification system
7.5 Best Management Practices (BMPs) to Protect the Water Quality These are some of the urban BMPs that can be implemented to help reduce pollution in our local water bodies:
7.5.1 Wastewaters Discharges All wastewaters (domestic and industrial) should be directed to
wastewater treatment plants. Effluent of wastewater treatment plants for domestic and industrial
wastes should conform to discharge standards as stipulated in the EQA 1974.
Small and medium industrial wastewaters should have proper treatment before discharge into water bodies.

70 WATER POLLUTION : THE NEVER ENDING STORY
7.5.2 Wise Use of Fertilizers
Apply at the right time and in the right amounts. Fertilizer with slow release nitrogen is better for the environment. Get a soil test to see what your soil needs. If more fertilizer is applied than the grass can utilize, it can wash into
nearby streams and lakes.
7.5.3 Wise Application of Pesticides Identify the pest, disease, or cause of the problem. Learn when and where pesticides are needed. Select chemicals that are the least toxic or that break down quickly. Always READ the label before mixing and applying pesticides.
7.5.4 Prevent Erosion in Plantation and Landscaping Practices
Erosion and Sediment Control - using practices to conserve and reduce the amount of sediment reaching water bodies, overall protecting agricultural land and water quality
Soil washed away by rain can pollute streams and lakes. Protect soil by planting groundcover vegetation or using by mulch. Gardens and construction sites with areas of bare soil, especially on
sloped land are prone to erosion.
7.5.5 Control of Vehicle Wash Wastewater Use a commercial car wash. Waste water from these businesses does not
enter the storm drains and is sent to a water treatment facility. If washing your car at home, pull you vehicle onto the grass before you
start washing. This will help water the yard as well as keep the soapy water from running straight into the storm drain.
7.5.6 Animal Waste Disposal Animal waste contain nutrients and managing all nutrient inputs helps
ensure reducing nutrient run off which will cause eutrophication in water bodies.
Animal waste can carry disease carrying organisms. Dispose of animal waste properly by engaging contactors so that it be
done properly to reduce water pollution.
7.5.7 Use and Dispose of Household Chemicals Safely Never pour chemicals such as paint or oil onto the yard or directly into
storm drains, or the next rain will take the chemicals directly to your local stream.
See if there is a household chemical collection centre near you and drop off chemicals there if possible. These centres provide safe, environmental friendly disposal and are usually free.
Look for alternative cleaning products that are less hazardous to the environment.

71 WATER POLLUTION : THE NEVER ENDING STORY
7.6 Conclusion Everybody should be aware of the different problems occurring in our nature, especially in different bodies of water? Water pollution is the caused of the undisciplined actions and irresponsibility of the people. Water pollution can affect our health badly and seriously that cause such sicknesses and diseases that will badly affect the health. Everybody knows how important water is. Water is essential to the body. Neither human nor any every living thing can survive without water. And so therefore, water should be protected and saved. Prevention of waters from being polluted is the target. Best management practices (BMPs) for water should be planned, drafted and implemented to save rivers, seas and oceans, and other bodies of water because we will also bare the burden of this problem. There will come the time when people are competing just to get sufficient, fresh and clean water, and the time where clean water is insufficient to the people and animals, and the time where the sources of water are diminishing or until the time where there are totally no sources of water. And so, lets be disciplined and responsible enough to save, protect and conserve not only sources of water but also the mother nature because it provides and helps in everybody’s daily lives. Let’s just realize how important the mother nature is. It is the only source of living. Let not destroy it nor pollute it. Let’s act for a change. Please help save and conserve the mother nature, especially the different bodies of water. Absolutely, there are many simple ways in how everybody can help. Change ourselves before we construct changes in our nature. The stories of water pollution will go on forever thus creating The Never Ending Stories of water pollution.
72 WATER POLLUTION : THE NEVER ENDING STORY
References 1. American Waterworks Association; (2004). Water Treatment Plant Design.
McGraw Hill Pub. 2. Davis, M.L. and Cornwell, D., (2006). Introduction to Environmental
Engineering. McGraw Hill Pub. 3. Davis, M.L. and Davis, M., (2010). Water and Wastewater Engineering.
McGraw Hill Pub. 4. Edzwalk, J.; (2010). Water Quality and Treatment : A Handbook on Drinking
Water; McGraw Hill Pub. 5. Eckenfelder, J., Ford, D.L., Englande, Jr., (2008). Industrial Water Quality;
McGraw Hill Pub. 6. Gleick P.H., (1993). Water in Crisis: A Guide to the World's Fresh Water
Resources (Oxford University Press, New York). 7. Metcalf and Eddy, Inc., (2002). Wastewater Engineering : Treatment and
Reuse. McGraw Hill Pub. 8. Rubin, E., (2000). Introduction to Engineering and the Environment.
McGraw Hill Pub. 9. Tsubaki, T., and Irukayama, K., (1977). Minimata Disease. Methylmercury
Poisoning in Minamata and Niigata, Japan. Amsterdam: Elsevier Scientific Publishers.
10. Ui, J., (1992). Industrial Pollution in Japan. Tokyo: United Nations University Press. Available at http://www.unu.edu/unupress/unupbooks.
11. World Health Organization (1990). Methyl Mercury. Environmental Health Criteria 101. Geneva: Author.
73 WATER POLLUTION : THE NEVER ENDING STORY
Suggested Further Reading 1. A.A.Abdul Latiff; A.T. Abd. Karim, S. Mohd. Badri; Pencemaran Sungai
Oleh Sisa Industri (Kajian Kes Sungai Batu Pahat); Jurnal ITTHO; 1997. 2. A.T. Abd. Karim, A.A.Abdul Latiff, P.P. Chua Rawatan Air Sisa Tekstil
Menggunakan Lagun Berudara; Jurnal ITTHO; 1997. 3. Z. Ibrahim, A.A.Abdul Latiff, M. R. Jahidin; Pelepasan Efluen Searah
Dengan Aliran Dalam Saluran Terbuka (Kajian Makmal); Jurnal ITTHO; 1998.
4. Katimon, M.A.Kassim, J. Sohaili, F. Othman, A.A.Abdul Latiff, A.T. Abd. Karim; Impact of Agricultural Drainage on Stream Water Quality; Jurnal Teknologi UTM, No. 31 1999.
5. Z. Ibrahim, A.A.Abdul Latiff, S.S Izzat, S. Raman; Cross Flow Effluent Discharge in Diverging Flowing Ambients; Jurnal Sains & Teknologi KUiTTHO; 2003.
6. A.R. Suderlan, M.K. Yusof, A. Muda and A.A.Abdul Latiff; Aktiviti Perindustrian dan Kesannya Ke Atas Sungai Merlimau, Melaka; Jurnal Sains & Teknologi, KUiTTHO, 2003.
7. M. R. Jalil, A.H. Mohd. Kassim, A.A.Abdul Latiff; Application of Correlation Surface Technique in Estimating Groundwater Movement Near a Dumping Site in Kg. Kelichap, Batu Pahat; Journal of Physical Science; Vol. 16(2), 15-23, 2004.
8. M.A Fullazzaky, A.H.A.Gany and A.A.Abdul Latiff; Sustainable Domestic Wastewater Treatment by Single Activated Sludge of Nitrification-Denitrification Type; Submitted to Jurnal Teknologi UTHM 2007.
9. A. A. Abdul Latiff, A. T. Abdul Karim, Yung-Tse Hung, N.Hashim and A. Muhamad; Study of Metals Pollution in Sembrong River, Johor, Malaysia; International Journal of Environment Engineering (IJEE), Vol. 1 No. 2 : 384-404 (2009).
10. Z. Ibrahim, A.A.Abdul Latiff, A.H.Abdul Halim, N.Abu Bakar, and S. Subramaniam; Experimental Studies on Mixing in a Salt Wedge Estuary;
11. Z. Ibrahim, A.A.Abdul Latiff, N.B.Hashim, H.Halim, N.H. Mokhtar Kamal and N. F. Haron; Experimental Investigation on the Behaviour of Cross-flow Thermal Effluent Discharge in Free Surface Flow; Malaysian Journal of Civil Engineering 21(1) : 82-97(2009)
12. M.A.Fulazzaky, N.S.Mohamed Sunar; A.A.Abdul Latiff and A.H. Mohd.Kassim; Empirical Models of Biosand Filter to Calculate the Design Parameters; IWA Journal of Water Science and Technology : Water Supply (WST :Water Supply) May 2009.
13. M.A.Fulazzaky, N.S.Mohamed Sunar; A.A.Abdul Latiff and A.H. Mohd.Kassim; Robust Model to Remove Organic Matter From Rainwater; ASCE Journal of Environmental Engineering, 2008.
14. M.A.Fulazzaky, A.A.Abdul Latiff and N.I.Ahmat Nor; Cascade Anaerobic Ponds to Remove Organic Pollutant and Minerals From Palm Oil Mill Effluent; Journal of Water Environment Research (WER), 2008.
15. Z.Ahmad, Z.Ujang, G.Olsson and A. A.Abdul Latiff ; Evaluation of Hybrid Membrane Bioreactor (MBR) For Palm Oil Mill Effluent (POME) Treatment; International Journal of Integrated Engineering (IJEE), June 2009.
74 WATER POLLUTION : THE NEVER ENDING STORY
16. A.A.Abdul Latiff, A.T.Abd. Karim and A.S.Abd. Halim; Phytoremediation of
Metals in Industrial Sludge by Cyperus Kyllingia-Rasiga, Asystassia Intrusa and Scindapsus Pictus Var Argyaeus Species; International Journal of Integrated Engineering (IJEE), June 2009.
17. S.A. Habeeb, A.A.Abdul Latiff, Z.Daud and Z.Ahmad; A Review on Granules Initiation and Development Inside UASB Reactor anf the main factors Affecting Granules Formation; International Journal of Energy and Environment; Vol.2, 2011.
18. S.A. Habeeb, A.A.Abdul Latiff, and Z.Ahmad; A Review on Properties of the Digestion Process in the Up-Flow Anaerobic Sludge Bed (UASB) Reactor; Canadian Journal of Environmental, Construction and Civil Engineering, Vol.1., No. 3, pp.59-70, July 2010.
19. L.A.Q.Tunji, A.A.Abdul Latiff, D.Tjhajanto and S.Akib; The Effectiveness of Groundwater Recharges Well to Mitigate Flood; International Journal of the Physical Sciences; Vol.6(1), pp.8-14, 2011
20. R.M.S. Radin Mohamed, A.A.Abdul Latiff, A.H. Mohd. Kassim and M. Mohamed; Modelling of Heavy Metal in Sg. Bekok Using QUAL2E; International Conference on Managing Rivers in the 21st Century (Rivers ’04); USM; Sept. 2004.
21. A.A.Abdul Latiff, M.B. Ridzuan, A.T. Abd. Karim and Y. Doraisamy; Heavy Metal Removal From Domestic Sludge by Brassica Juncea and Ipomoea Aquatica; Brunei International Conference of Engineering and Technology; BIT; 17-18 August 2005.
22. A.A.Abdul Latiff, M.B. Ridzuan, A.T. Abd. Karim and Y. Doraisamy; Determination of Heavy Metals in Domestic Sludge and Its Treatment by Phytoremediation; Drinking Water and Wastewater Treatment Technologies Conference; Sapporo Japan; June 2005. (accepted as poster presentation).
23. A.A.Abdul Latiff , R.M.S. Radin Mohamed, A.H. Mohd. Kassim and N.I.Ahmat Nor; Presentation of QUAL2E Model of Heavy Metal in Sg. Bekok, Johor, Malaysia; International Conference in Answering the Challenges in Today’s Civl Engineering (Organizer : Universitas Trisakti); Ritz Carlton; Jakarta; Indonesia; 25-26 January 2006
24. N.I.Ahmat Nor, A.H.Mohd Kassim and A.A.Abdul Latiff, ANN in Hydrology for Prediction of Watershed Runoff ; International Conference in Answering the Challenges in Today’s Civl Engineering (Organizer : Universitas Trisakti); Ritz Carlton; Jakarta; Indonesia; 25-26 January 2006
25. A.A.Abdul Latiff and S.Ngah Jidin; Treatment of Palm-Oil Mill Effluent Using Up-Flow Anaerobic Sludge Blanket Reactor; 7th IWA Specialized Conference on Small Water and Wastewater Systems; Merida, Mexico; March 2006. (poster presentation).
26. A.A.Abdul Latiff and S.Ngah Jidin; Determination of Optimum Organic Loading in Treating Palm-Oil Mill Effluent Using Up-Flow Anaerobic Sludge Blanket Reactor; International Seminar in Civil and Infra-Structure Engineering (ISCIE’06); UiTM; 13-14 June 2006
27. A.T.Abd. Karim, M.R.Taha and A.A.Abdul Latiff; Solidification of Lead Contaminated Residual Soil; ISSMGE 5th International Congress on Environmental Geotechnics; Cardiff, Wales, UK, 26th-30th June 2006.
28. A.A.Abdul Latiff, S.Ngah Jidin and Wong S.C.; Effect of pH in UASB Reactor Treating POME; International Conference on Decentralized Water

75 WATER POLLUTION : THE NEVER ENDING STORY
and Wastewater Systems; Murdoch University, Perth, Western Australia; 10-12 July 2006.
29. A.T.Abd. Karim, M.R.Taha and A.A.Abdul Latiff; Leaching Behavior of Lead, Chromium, Copper, Zinc, Arsenic and Cadmium in Solidified/Stabilized Contaminated Residual Soil; International Conference on Remediation and Management of Contaminated Land : Focus on Asia (Brownfield Asia 2006); Berjaya Times SQ, KL; 5-7 Sept. 2006.
30. A.A.Abdul Latiff, A.T. Abd. Karim, N.H.Hashim, A.Muhamad; Contamination by Al, Fe and Mn in Sembrong River, Batu Pahat, Johor due to Pyrite Oxidation in Acid Sulfate Soils; International Conference on Remediation and Management of Contaminated Land : Focus on Asia (Brownfield Asia 2006); Berjaya Times SQ, KL; 5-7 Sept. 2006.
31. Z.Ibrahim, A.A.Abdul Latiff, A.H.Abd Halim and N.Abu Bakar; A Laboratory Investigation on Mixing in a Salt Wedge Estuary : A Presence of Deep Channel; 2nd South East Asian Natural Resources and Environmental Management Conference (SANREM2006); LeMeridian Hotel Kota Kinabalu; Universiti Malaysia Sabah; 21-23 November 2006
32. A.A.Abdul Latiff, Z.Ibrahim and S.N.H.Mohd Imran; Indiustrial Effluent Quality Surrounding Sri gading Industrial Zone, Batu Pahat, Johor; 2nd South East Asian Natural Resources and Environmental Management Conference (SANREM2006); LeMeridian Hotel Kota Kinabalu; Universiti Malaysia Sabah; 21-23 November 2006
33. A.A.Abdul Latiff, A. T. Abdul Karim, M. B. Ridzuan and A. S. Ahmad; Metals Uptake From Industrial Sludge by Asystassia Intrusa; International Conference on Science and Technology (ICSTIE 2006); University Technology MARA; 8-9 December 2006.
34. A.A.Abdul Latiff, A. T. Abdul Karim, N.Hashim and A. Muhamad; The Pollution of Sembrong River, Batu Pahat; International Conference on Science and Technology (ICSTIE 2006); University Technology MARA; 8-9 December 2006.
35. R. Seswoya, A.R.Othman, R.N.R.Idris, Z.D.M.Basri and A.A. Abdul Latiff, Reducing River Pollution by Means of Sand Filtration. Case Study : Small-Scale Chicken Processing Wastewater; 2nd International Conference on Managing Rivers in the 21st Century : Solutions Towards Sustainable River Basins; Crowne Plaza, Kuching, 6-8 June 2007.
36. A.A.Abdul Latiff, N.H.Hashim, A.Muhamad, A.T. Abd. Karim and R.M.S.R.Mohamed; QUAL2E Modeling of Metal Pollutants in Sembrong River, Batu Pahat; 2nd International Conference on Managing Rivers in the 21st Century : Solutions Towards Sustainable River Basins; Crowne Plaza, Kuching, 6-8 June 2007.
37. M.A.M.Razi, A.A.Abdul Latiff and M.N.Meskam; Metal Concentration and Its Relation to the Flow Rate in Parit Karjo, Batu Pahat, Johor; 2nd International Conference on Managing Rivers in the 21st Century : Solutions Towards Sustainable River Basins; Crowne Plaza, Kuching, 6-8 June 2007.
38. Z.Ibrahim, A.A.Abdul Latiff, S.Subramaniam, S.Omar and N.S.M.Arshad; An Experimental Study on the Effect of Resisting Structures Along the River Banks to Mixing in Saline-Wedge Estuary; 2nd International Conference on Managing Rivers in the 21st Century : Solutions Towards Sustainable River Basins; Crowne Plaza, Kuching, 6-8 June 2007.
76 WATER POLLUTION : THE NEVER ENDING STORY
39. N.S.M.Sunar; A.H.M.Kassim, A.A.Abdul Latiff and M.R.Jalil; Improvement
of Rainwater Quality by Using Biosand Filtration System : Utilizing Rainwater for Non-Portable Domestic Uses; 2nd International Conference on Managing Rivers in the 21st Century : Solutions Towards Sustainable River Basins; Crowne Plaza, Kuching, 6-8 June 2007.
40. N.S.M.Sunar, A.H.M.Kassim, A.A.Abdul Latiff, M.R.Jalil; Water Quality Improvement by Using Bio-Sand Filtration in Rainwater Harvesting System; 2nd Regional Conference on Ecological Modeling for Sustainable Development (ECOMOD-USM), 28-30 August 2007, Gurney Hotel, Penang.
41. M.R.Jalil, A.H.M.Kassim, A.A.Abdul Latiff, N.S.M.Sunar; Application of Geostatistical Analysis for a Studty on Contaminants Concentration Distribution in Groundwater for an Area Near Solid Waste Dumping Site; 2nd Regional Conference on Ecological Modeling for Sustainable Development (ECOMOD2007-USM), 28-30 August 2007, Gurney Hotel, Penang.
42. D.Tjahjanto, A.A.Abdul Latiff, N.I.A.Nor, A.Wibowo, M.A.M.Razi; Sensor System of an Automatic Water Level Control Gate for Controlling Wetlang Area; International Seminar on Wetland and Sustainability (ISWS2007-UIA), Puteri Pan Pacific, Johor Bahru, 21-23 August 2007
43. A.A.Abdul Latiff, N.A.Badroldin, M.A.Fulazzaky and A.T.Abdul Karim; Efficiency of Hybrid Upflow Anaerobic Sludge Blanket (HUASB) Reactors in Treating Palm Oil Mill Effluent (POME); Ist International Conference on Technologies and Strategic Management of Sustainable Biosystems (IOBB and Murdoch University); Fremantle Esplanade Hotel, Perth, Western Australia; 6-9 July 2008.
44. A.A.Abdul Latiff , M.A. Fulazzaky, D. Tjahjanto and Z.Zahari; Acid Sulfate Soil Effects On Bekok River Water Quality, Batu Pahat, Malaysia; International Conference 2008 : Sustainable Environmental Technology and Sanitation for Tropical Region (Institut Teknologi Sepuluh Nopember (ITS), Surabaya); JW Marriot Surabaya; 18-19 November 2008.
45. Z.Ahmad, Z. Ujang and A.A.Abdul Latiff; Biomass Characteristics and Effect on Fouling in a Hybrid Membrane Reactor for Palm Oil Mill Effluent; International Conference 2008 : Sustainable Environmental Technology and Sanitation for Tropical Region (Institut Teknologi Sepuluh Nopember (ITS), Surabaya); JW Marriot Surabaya; 18-19 November 2008.
46. A. A. Abdul Latiff, L. A. Qayoom Tunji and D. Tjahjanto; Urban Stormwater Runoff Mitigation Method Using Artificial Recharge On Groundwater; International Conference on Water Resources (ICWR 2009); Bayview Hotel, Langkawi; 26 – 27 May 2009.
47. M.A.Fulazzaky, A.H. Mohd Kassim and A.A.Abdul Latiff, Empirical Models of Bio-sand Filter to Remove Pollutants from Rainwater to Properly Secure the Family Water Storage in Anticipating of Climate Change; 60th IEC Meeting of ICID and 5th Asian Regional Conference, Vigyan Bhawan, New Delhi, 5-11 December 2009.
48. A.A.Abdul Latiff and T.H.Chan; Impact of Industrial Effluent Discharge on Water Quality Surrounding Sri Gading Industrial Zone, Batu Pahat, Malaysia; International Conference on Sustainable Development for Water and Wastewater Treatment (Muwarec-YK09); Hyatt Yogyakarta (Universitas Gadjah Mada), 14-15 December 2009.
77 WATER POLLUTION : THE NEVER ENDING STORY
49. M.B. Ridzuan, Z. Daud, Z.Ahmad and A.A.Abdul Latiff; A Preliminary
Study on River Water Quality in Bekok River, Johor, Malaysia; International Conference on Sustainable Development for Water and Wastewater Treatment (Muwarec-YK09); Hyatt Yogyakarta (Universitas Gadjah Mada), 14-15 December 2009.
50. A.A.Abdul Latiff , N.A.Badroldin, M.A.Fulazzaky and A.TA.Karim; Determination of Efficiency and Removal Constants of HUASB Treating POME; International Conference on Environmental Management and Technology (ICEMT2010); Le Meridian Amman, Jordan, 1-3 November 2010.
51. A.R. Othman, R. Zawawi, A.A.Abdul Latiff; Baffled Aerated Facultative Tank for On-Site Household Sewage Treatment; Envirotech Proceeding; UTM; 1994.
52. M.I. Mohd. Masirin; A.A.Abdul Latiff, A. Abdul Aziz; Smart Partnership : Present and Future; Education National Seminar Proceeding, ITTHO; 1998.
53. Z. Ibrahim, A.A.Abdul Latiff, A.T. Abd. Karim, S. Raman; Study on Effluent Discharge in Diverging Open Channel Flow; Proceeding Rivers ‘99 Conference USM; 1999.
54. F. Othman, A. Katimon, M.A. Kassim, J. Sohaili, A.T. Abd. Karim, A.A. Abdul Latiff; River Acidification from Agricultural Land (Case Study); Proceeding Rivers ‘99 Conference USM; 1999.
55. A.A.Abdul Latiff, A.T. Abd. Karim, Z. Daud, Z. Ibrahim; Water Quality Modelling of Sungai Semberong Using QUAL2E (Preliminary Study); Proceeding Rivers ‘99 Conference USM; 1999
56. A.T. Abd. Karim, A.A.Abdul Latiff, Z. Ibrahim; Managing Nonpoint Source Pollution Through Best Management Practices; Proceeding Rivers ‘99 Conference USM; 1999.
57. A.A.Abdul Latiff, A.T. Abd. Karim, Z. Ibrahim; Sediment Transport and Water Quality of Sungai Batu Pahat; Proceeding Rivers ‘99 Conference USM; 1999.
58. A.A.Abdul Latiff, A.T. Abd. Karim, Z. Daud and Z. Ibrahim; River Quality Modeling Using QUAL2E; Proceeding World Day for Water Seminar 2001; 23-24 Mac 2001
59. R.M.S. Radin Mohamed, A.A.Abdul Latiff, A.H.Mohd. Kassim, A.T.Abd. Karim; Heavy Metal Pollution of Sungai Bekok, Johor; Environment 2003, USM, April 2003.
60. A.A.Abdul Latiff, R.M.S. Radin Mohamed, A.T.Abd. Karim; Modeling of Heavy Metal in Sg. Bekok Using QUAL2E; PPB Colloquium; Mei 2003.
61. A.T.Abd. Karim, A.A.Abdul Latiff; Treating Hexavalent Chromium Contaminated Soil by Solidification/Stabilization; PPB Colloquium; Mei 2003
62. A.A.Abdul Latiff, R.M.S. Radin Mohamed, A.H.Mohd. Kassim, A.T.Abd. Karim and M.R. Said; Pollution of Pb, Cd, Cr, Se, Fe, Mn and Al in Sungai Bekok, Johor; EnTech 2003; UNIMAS; 29 Jul – 1 Ogos 2003.
63. A.A. Abdul Latiff, Z. Ibrahim, A. M. Jaafar, T.W. Ting; Pollution From Road Surface Runoff in Western and Southern Johore; NARED 2003; UNIMAS; 24-27 Sept. 2003.
64. A.T. Abdul Karim, M.R. Taha and A.A. Abdul Latiff; Variation of pH of Soils Stabilized With Ash and Cement; NARED 2003; UNIMAS; 24-27 Sept. 2003.
78 WATER POLLUTION : THE NEVER ENDING STORY
65. A.A.Abdul Latiff, M.B. Ridzuan, A.T. Abd. Karim and Y. Doraisamy;
Phytoremediation of Heavy Metals in Domestic Sludge Using Kangkung; Persidangan AWAM 2004; USM; July 2004.
66. M. R. Jalil, A.H. Mohd. Kassim, A.A.Abdul Latiff; Application of Correlation Surface Technique in Estimating Groundwater Movement, Regional Conference on Ecological and Environmental Modeling (ECOMOD); USM, 2004.
67. A.T.Abd Karim, M.R.Taha and A.A.Abdul Latiff; pH Enhancement and Buffering Capacity of Stabilized Residual Soil; 01122004; UKM; December 2004.
68. A.T. Abd. Karim, A.A. Abdul Latiff, M. R. Taha, L M. Amin; Chromium Adsorption in Kaolinite and Meta Sedimentary Residual Soils; National Civil Engineering Conference; KUiTTHO; 19-20 December 2005.
69. A.A.Abdul Latiff, A. T. Abdul Karim, M. B. Ridzuan, A. S. Ahmad, Penyerapan Cr, Cu dan Ni daripada Enapcemar Industri Oleh Vitex Pubescens Secara Phytoremediation; National Civil Engineering Conference; KUiTTHO; 19-20 December 2005.
70. A.A.Abdul Latiff, M. B. Ridzuan, C. H. Siang, Investigation of Road Surface Runoff Quality Along the Batu Pahat – Kluang Expressway; National Civil Engineering Conference; KUiTTHO; 19-20 December 2005.
71. A.A.Abdul Latiff , N. H. Hashim, A. Muhamad; Kajian Perbandingan Pencemaran Sebatian PAHs Di dalam Air Permukaan.; National Civil Engineering Conference; KUiTTHO; 19-20 December 2005.
72. A.H. Mohd. Kassim, A.A.Abdul Latiff, M. B. Ridzuan, N. S. Mohamed Sunar; Improvement of Physical Physical Rainwater Quality by Using Biosand Filtration in a Rainwater Harvesting System; National Civil Engineering Conference; KUiTTHO; 19-20 December 2005.
73. A.A.Abdul Latiff, N. Ngah Jidin; Penilaian Kecekapan Reaktor UASB Merawat COD dan BOD Dalam POME; National Civil Engineering Conference; KUiTTHO; 19-20 December 2005.
74. A. A. Abdul Latiff, A. T. Abdul Karim, M. B. Ridzuan, A. S. Ahmad; The Phytoremediation of Cromium (Cr), Copper (Cu) and Nickel (Ni) in Industrial Sludge by Vitex Pubescens; Conference on Natural Resources in the Tropics (UNIMAS); Hilton Kuching; 6-8 June 2006.
75. D.Djahjanto, M.F.T.Baharuddin, N.I.Ahmat Nor, A.A.Abdul Latiff and A.Madun; Water Availability and Storm Water Control Using Artificial Recharge on Groundwater; National Conference on Water for Sustainable Development Towards Developed Nation By 2020; Guoman Port Dickson; 13-14 July 2006.
76. A.A.Abdul Latiff, S.N.Mohd. Imran and Z.Ibrahim; Evaluation of Effluent Quality Surrounding Sri Gading Industrial Zone, Batu Pahat, Johor; Persidangan AWAM 2007; Langkawi; 29-31 Mei 2007.
77. R.Rosli, A.T.Abdul Karim and A.A.Abdul Latiff; Physico-Chemical Characteristics of RECESS Soft Soil; Seminar on Geotechnical Engineering (SGE2007); UTHM; December 2007.
78. N.A.Badroldin, A.A.Abdul Latiff, A.T.Abdul Karim and M.A.Fulazzaky; Treatment of POME Using HUASB Reactor; National Seminar On Civil Engineering Research (SEPKA 2007), Universiti Teknologi Malaysia; Goodhope Hotel Skudai; 11-12 Disember 2007.

79 WATER POLLUTION : THE NEVER ENDING STORY
79. M.A.Fullazaky, A.T.Abd.Karim, A.A.Abdul Latiff and A.A.Abdul Samad;
Role of UTHM for Supporting the Biodiversity and Biotechnology National Program in Malaysia; 2007.
80. N.A.Badroldin, A.A.Abdul Latiff, A.T.Abdul Karim and M.A.Fulazzaky; POME Treatment Using HUASB Reactors : Impact on COD Removal and Organic Loading Rate; Engineering Post Graduate Conference (EPC2008); UKM; 21-22 Oct 2008.
81. R.Rosli, A.T.Abdul Karim, A.A.Abdul Latiff and M.R.Taha; Adsorption Properties of As, Pb and Cd Soft Soil and Meta Sedimentary Residual Soil; Engineering Post Graduate Conference (EPC2008); UKM; 21-22 Oct 2008.
82. Z.Zahari, A.A.Abdul Latiff, M.A Fulazzaky and D.Tjahjanto; Parit Ngamarto Drainage Effects on Bekok River Water Quality; Engineering Post Graduate Conference (EPC2008); UKM; 21-22 Oct 2008.
83. L.A.Q.Tunji, A.A.Abdul Latiff and D.Tjahjanto; Determination of the Effectiveness of Recharge Well on Groundwater to Mitigate Flood in Flat Area; National Seminar on Hydrology and Environment; UTHM; 23-24 June 2010.
84. S.A.Habeeb, A.A.Abdul Latiff, Z.Daud and Z.Ahmad; Review Paper : The Role of Operational Parameters on the Performance of Upflow Anaerobic Sludge Blanket (UASB) Reactor; UTHM; 23-24 June 2010.
85. S.A.Habeeb, A.A.Abdul Latiff, Z.Daud and Z.Ahmad; Biological Treatment of palm Oil Mill Effluent Using Mesophilic Hybrid UASB Reactor; IASTED Environmental Engineering Conference, Calgary, Canada; 4-5 July 2011.