SY2010-2011 School Climate Survey, Oxon Hill...
35
Prince George’s County Public Schools 14201 School Lane · Upper Marlboro · MD 20772 www.pgcps.org RESEARCH REPORT SY2010-2011 School Climate Survey, Oxon Hill MS Prepared by Carole Portas Keane, Ph.D. Kola K. Sunmonu, Ph.D. DIVISION OF PERFORMANCE MANAGEMENT DEPARTMENT OF RESEARCH AND EVALUATION Phone: 301-780-6807 Fax: 301-952-6147 William R. Hite, Jr., Ed.D., Superintendent of Schools Lisa D. Price, PMP, CGPM, Performance Officer Kola K. Sunmonu, Ph.D., Director of Research and Evaluation BOARD OF EDUCATION: Verjeana M. Jacobs, Chair ● Donna Hathaway Beck, Vice Chair ● Henry P. Armwood, Jr. ● Carolyn M. Boston ● Edward Burroughs, III ● Patricia Eubanks ● Peggy Higgins ● Rosalind A. Johnson ● Amber P. Waller ● Jonathan Harris, II, Student Member ● William R. Hite, Jr., Ed.D., Superintendent of Schools and Secretary/Treasurer June 2011
Transcript of SY2010-2011 School Climate Survey, Oxon Hill...

Prince George’s County Public Schools 14201 School Lane · Upper Marlboro · MD 20772
www.pgcps.org
RESEARCH REPORT
SY2010-2011
School Climate Survey,
Oxon Hill MS
Prepared by
Carole Portas Keane, Ph.D.
Kola K. Sunmonu, Ph.D.
DIVISION OF PERFORMANCE MANAGEMENT
DEPARTMENT OF RESEARCH AND EVALUATION
Phone: 301-780-6807
Fax: 301-952-6147
William R. Hite, Jr., Ed.D., Superintendent of Schools
Lisa D. Price, PMP, CGPM, Performance Officer
Kola K. Sunmonu, Ph.D., Director of Research and Evaluation
BOARD OF EDUCATION: Verjeana M. Jacobs, Chair ● Donna Hathaway Beck, Vice Chair ●
Henry P. Armwood, Jr. ● Carolyn M. Boston ● Edward Burroughs, III ● Patricia Eubanks ●
Peggy Higgins ● Rosalind A. Johnson ● Amber P. Waller ● Jonathan Harris, II, Student Member ●
William R. Hite, Jr., Ed.D., Superintendent of Schools and Secretary/Treasurer
June 2011

i
Table of Contents
OXON HILL MS........................................................................................................................... 1
Introduction ......................................................................................................................................1
How to Interpret the Data ................................................................................................................1
TABLES
Table 1–Summary of Survey Participation, SY2011 .................................................................2
Table 2–Percent with Positive Perceptions by Characteristics of Effective Schools
and Stakeholder Group, Oxon Hill MS, and All PGCPS Middle
Schools, SY2011 ......................................................................................................3
Table 3–Percent with Positive Perceptions by Characteristics of Effective Schools
and Stakeholder Group, Oxon Hill MS, SY2011 and SY2009 ...............................4
Table 4–Percent of Oxon Hill MS Eighth-Grade Students with Positive
Perceptions by Survey Items, SY2011 and SY2009 ................................................5
Table 5–Percent of Oxon Hill MS Parents with Positive Perceptions by Survey
Items, SY2011 and SY2009 .....................................................................................8
Table 6–Percent of Oxon Hill MS Teachers/Paraprofessionals with Positive
Perceptions by Survey Items, SY2011 and SY2009 ..............................................11
Table 7–Distribution of Oxon Hill MS Students’ Responses on Survey Items,
SY2011 and SY2009..............................................................................................16
Table 8–Distribution of Oxon Hill MS Parents’ Responses on Survey Items,
SY2011 and SY2009..............................................................................................21
Table 9–Distribution of Oxon Hill MS Teachers/Paraprofessionals’ Responses on
Survey Items, SY2011 and SY2009 ......................................................................26
SY2011 School Climate Survey - Oxon Hill MS
1
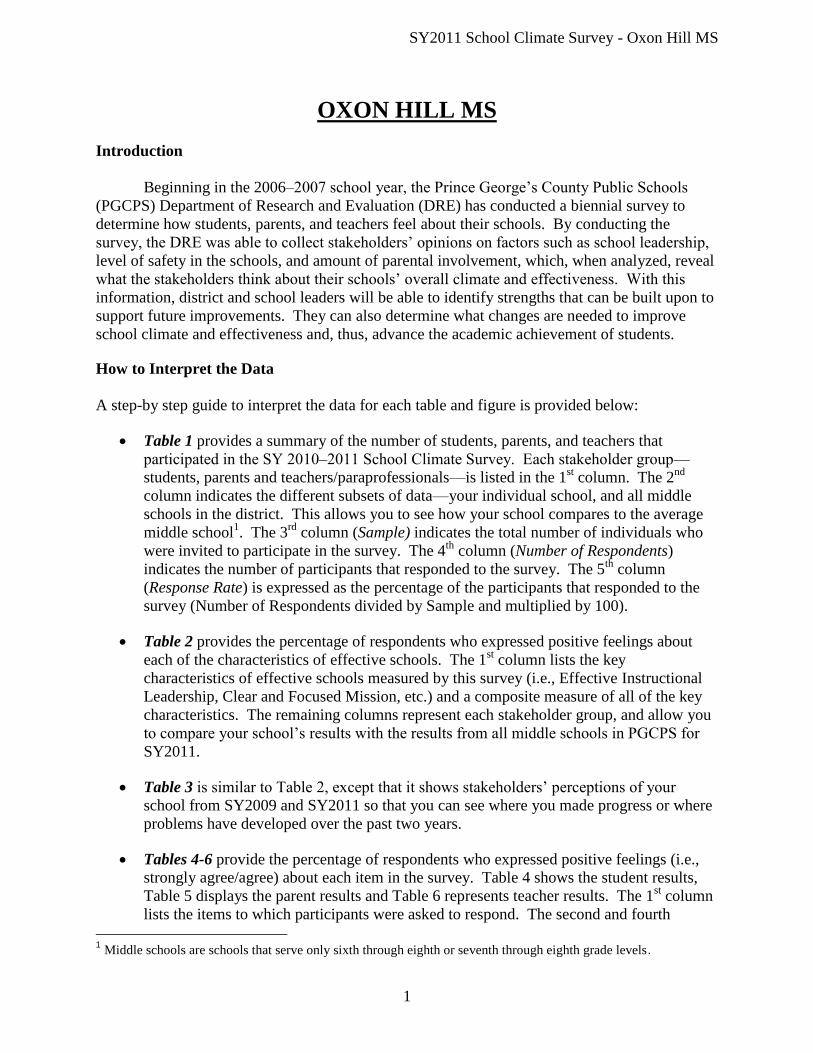
OXON HILL MS
Introduction
Beginning in the 2006–2007 school year, the Prince George’s County Public Schools
(PGCPS) Department of Research and Evaluation (DRE) has conducted a biennial survey to
determine how students, parents, and teachers feel about their schools. By conducting the
survey, the DRE was able to collect stakeholders’ opinions on factors such as school leadership,
level of safety in the schools, and amount of parental involvement, which, when analyzed, reveal
what the stakeholders think about their schools’ overall climate and effectiveness. With this
information, district and school leaders will be able to identify strengths that can be built upon to
support future improvements. They can also determine what changes are needed to improve
school climate and effectiveness and, thus, advance the academic achievement of students.
How to Interpret the Data
A step-by step guide to interpret the data for each table and figure is provided below:
Table 1 provides a summary of the number of students, parents, and teachers that
participated in the SY 2010‒2011 School Climate Survey. Each stakeholder group—
students, parents and teachers/paraprofessionals—is listed in the 1st column. The 2
nd
column indicates the different subsets of data—your individual school, and all middle
schools in the district. This allows you to see how your school compares to the average
middle school1. The 3
rd column (Sample) indicates the total number of individuals who
were invited to participate in the survey. The 4th
column (Number of Respondents)
indicates the number of participants that responded to the survey. The 5th
column
(Response Rate) is expressed as the percentage of the participants that responded to the
survey (Number of Respondents divided by Sample and multiplied by 100).
Table 2 provides the percentage of respondents who expressed positive feelings about
each of the characteristics of effective schools. The 1st column lists the key
characteristics of effective schools measured by this survey (i.e., Effective Instructional
Leadership, Clear and Focused Mission, etc.) and a composite measure of all of the key
characteristics. The remaining columns represent each stakeholder group, and allow you
to compare your school’s results with the results from all middle schools in PGCPS for
SY2011.
Table 3 is similar to Table 2, except that it shows stakeholders’ perceptions of your
school from SY2009 and SY2011 so that you can see where you made progress or where
problems have developed over the past two years.
Tables 4-6 provide the percentage of respondents who expressed positive feelings (i.e.,
strongly agree/agree) about each item in the survey. Table 4 shows the student results,
Table 5 displays the parent results and Table 6 represents teacher results. The 1st column
lists the items to which participants were asked to respond. The second and fourth
1 Middle schools are schools that serve only sixth through eighth or seventh through eighth grade levels.
SY2011 School Climate Survey - Oxon Hill MS
2
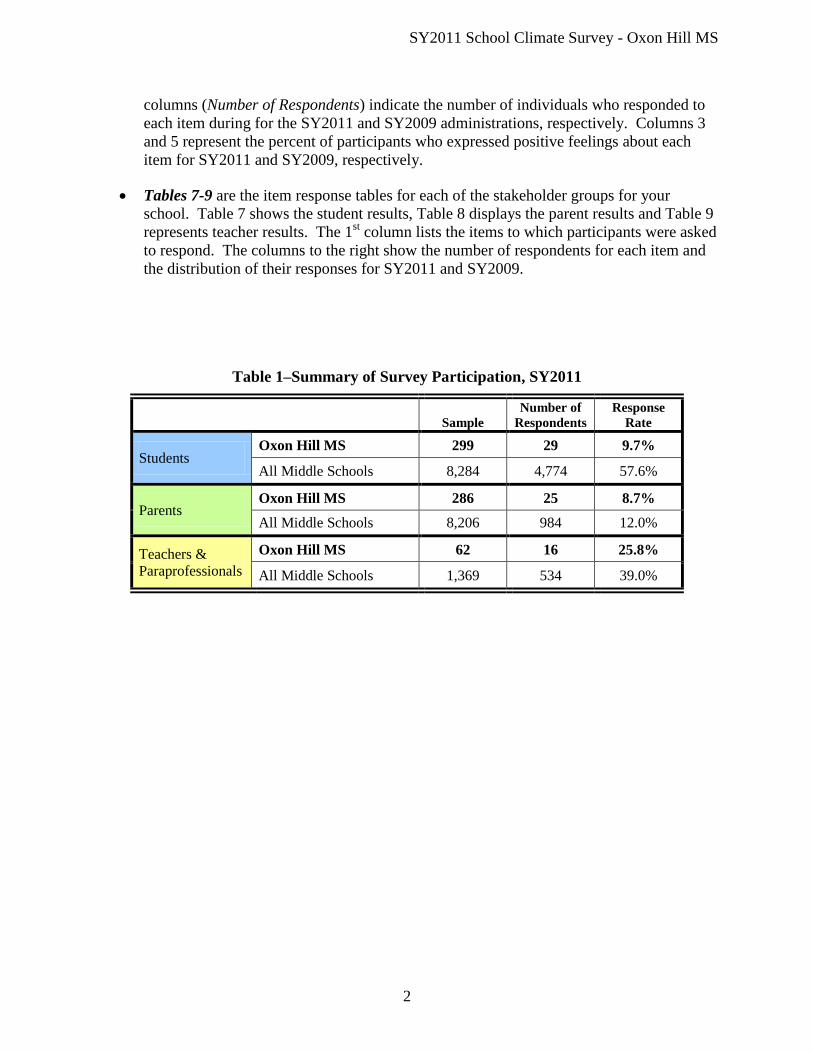
columns (Number of Respondents) indicate the number of individuals who responded to
each item during for the SY2011 and SY2009 administrations, respectively. Columns 3
and 5 represent the percent of participants who expressed positive feelings about each
item for SY2011 and SY2009, respectively.
Tables 7-9 are the item response tables for each of the stakeholder groups for your
school. Table 7 shows the student results, Table 8 displays the parent results and Table 9
represents teacher results. The 1st column lists the items to which participants were asked
to respond. The columns to the right show the number of respondents for each item and
the distribution of their responses for SY2011 and SY2009.
Table 1–Summary of Survey Participation, SY2011
Sample
Number of
Respondents
Response
Rate
Students Oxon Hill MS 299 29 9.7%
All Middle Schools 8,284 4,774 57.6%
Parents Oxon Hill MS 286 25 8.7%
All Middle Schools 8,206 984 12.0%
Teachers &
Paraprofessionals
Oxon Hill MS 62 16 25.8%
All Middle Schools 1,369 534 39.0%
SY2011 School Climate Survey - Oxon Hill MS
3
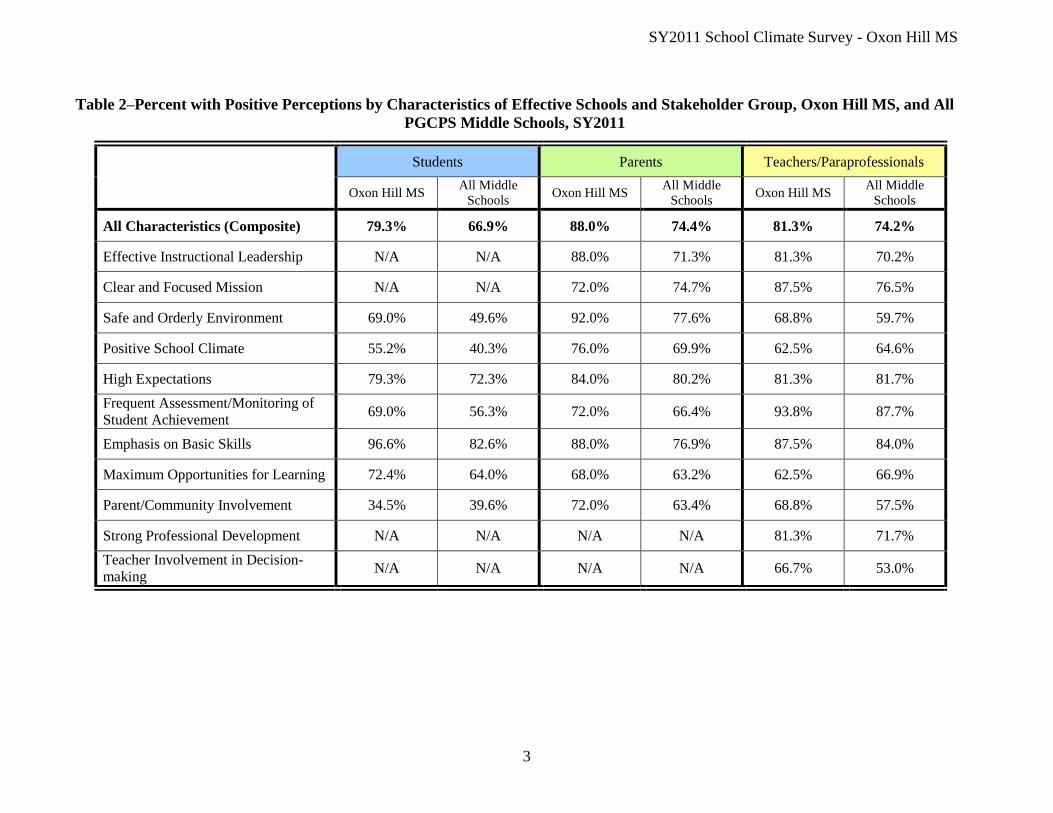
Table 2–Percent with Positive Perceptions by Characteristics of Effective Schools and Stakeholder Group, Oxon Hill MS, and All
PGCPS Middle Schools, SY2011
Students Parents Teachers/Paraprofessionals
Oxon Hill MS All Middle
Schools Oxon Hill MS
All Middle
Schools Oxon Hill MS
All Middle
Schools
All Characteristics (Composite) 79.3% 66.9% 88.0% 74.4% 81.3% 74.2%
Effective Instructional Leadership N/A N/A 88.0% 71.3% 81.3% 70.2%
Clear and Focused Mission N/A N/A 72.0% 74.7% 87.5% 76.5%
Safe and Orderly Environment 69.0% 49.6% 92.0% 77.6% 68.8% 59.7%
Positive School Climate 55.2% 40.3% 76.0% 69.9% 62.5% 64.6%
High Expectations 79.3% 72.3% 84.0% 80.2% 81.3% 81.7%
Frequent Assessment/Monitoring of
Student Achievement 69.0% 56.3% 72.0% 66.4% 93.8% 87.7%
Emphasis on Basic Skills 96.6% 82.6% 88.0% 76.9% 87.5% 84.0%
Maximum Opportunities for Learning 72.4% 64.0% 68.0% 63.2% 62.5% 66.9%
Parent/Community Involvement 34.5% 39.6% 72.0% 63.4% 68.8% 57.5%
Strong Professional Development N/A N/A N/A N/A 81.3% 71.7%
Teacher Involvement in Decision-
making N/A N/A N/A N/A 66.7% 53.0%

SY2011 School Climate Survey - Oxon Hill MS
4
Table 3–Percent with Positive Perceptions by Characteristics of Effective Schools and Stakeholder Group, Oxon Hill MS, SY2011
and SY2009
Students Parents Teachers/Paraprofessionals
SY2011 SY2009 SY2011 SY2009 SY2011 SY2009
All Characteristics (Composite) 79.3% 100.0% 88.0% 69.4% 81.3% 65.4%
Effective Instructional Leadership N/A N/A 88.0% 58.1% 81.3% 57.7%
Clear and Focused Mission N/A N/A 72.0% 77.4% 87.5% 65.4%
Safe and Orderly Environment 69.0% 100.0% 92.0% 72.6% 68.8% 57.7%
Positive School Climate 55.2% 50.0% 76.0% 58.1% 62.5% 61.5%
High Expectations 79.3% 100.0% 84.0% 74.2% 81.3% 65.4%
Frequent Assessment/Monitoring of
Student Achievement 69.0% 100.0% 72.0% 59.7% 93.8% 69.2%
Emphasis on Basic Skills 96.6% 100.0% 88.0% 70.5% 87.5% 76.9%
Maximum Opportunities for Learning 72.4% 100.0% 68.0% 54.1% 62.5% 53.8%
Parent/Community Involvement 34.5% 50.0% 72.0% 54.1% 68.8% 53.8%
Strong Professional Development N/A N/A N/A N/A 81.3% 69.2%
Teacher Involvement in Decision-
making N/A N/A N/A N/A 66.7% 50.0%
SY2011 School Climate Survey - Oxon Hill MS
5
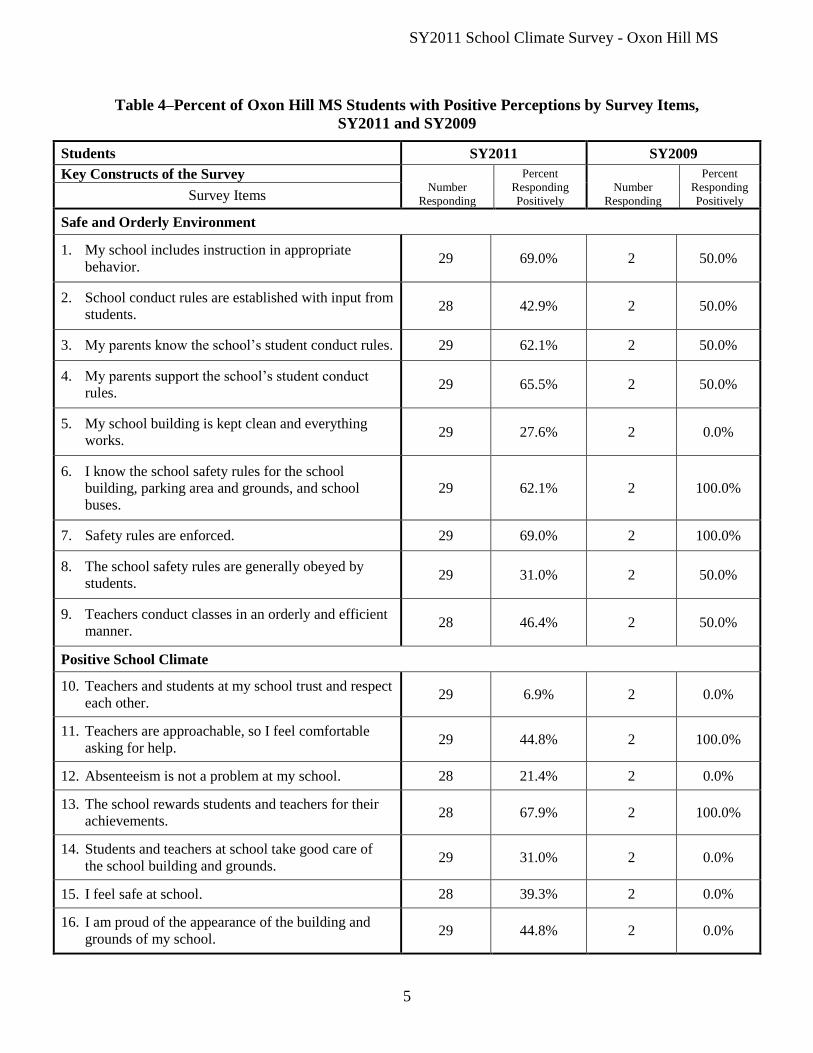
Table 4–Percent of Oxon Hill MS Students with Positive Perceptions by Survey Items,
SY2011 and SY2009
Students SY2011 SY2009
Key Constructs of the Survey Number
Responding
Percent
Responding
Positively
Number
Responding
Percent
Responding
Positively Survey Items
Safe and Orderly Environment
1. My school includes instruction in appropriate
behavior. 29 69.0% 2 50.0%
2. School conduct rules are established with input from
students. 28 42.9% 2 50.0%
3. My parents know the school’s student conduct rules. 29 62.1% 2 50.0%
4. My parents support the school’s student conduct
rules. 29 65.5% 2 50.0%
5. My school building is kept clean and everything
works. 29 27.6% 2 0.0%
6. I know the school safety rules for the school
building, parking area and grounds, and school
buses.
29 62.1% 2 100.0%
7. Safety rules are enforced. 29 69.0% 2 100.0%
8. The school safety rules are generally obeyed by
students. 29 31.0% 2 50.0%
9. Teachers conduct classes in an orderly and efficient
manner. 28 46.4% 2 50.0%
Positive School Climate
10. Teachers and students at my school trust and respect
each other. 29 6.9% 2 0.0%
11. Teachers are approachable, so I feel comfortable
asking for help. 29 44.8% 2 100.0%
12. Absenteeism is not a problem at my school. 28 21.4% 2 0.0%
13. The school rewards students and teachers for their
achievements. 28 67.9% 2 100.0%
14. Students and teachers at school take good care of
the school building and grounds. 29 31.0% 2 0.0%
15. I feel safe at school. 28 39.3% 2 0.0%
16. I am proud of the appearance of the building and
grounds of my school. 29 44.8% 2 0.0%

SY2011 School Climate Survey - Oxon Hill MS
6
Students SY2011 SY2009
Key Constructs of the Survey Number
Responding
Percent
Responding
Positively
Number
Responding
Percent
Responding
Positively Survey Items
17. Teachers care about their students as individuals. 29 44.8% 2 50.0%
18. My teachers like teaching the subjects they teach. 29 51.7% 2 50.0%
19. I am proud to be a student at this school. 29 51.7% 2 50.0%
High Expectations
20. My teachers encourage me to do my best on
assigned work and tests. 29 72.4% 2 100.0%
21. My teachers expect all students to do well in school. 29 79.3% 2 100.0%
22. My teachers challenge me to learn as much as I can. 29 79.3% 2 100.0%
Frequent Assessment/Monitoring of Student Achievement
23. My teachers keep track of how I am doing in my
school work. 29 62.1% 2 50.0%
24. The grades I get are a good indication of my ability
and effort. 29 44.8% 2 100.0%
25. My teachers tell me how I am doing on my tests and
assigned school work. 29 48.3% 2 100.0%
26. My teachers keep my parents informed about my
progress in my classes. 29 48.3% 2 50.0%
Emphasis on Basic Skills
27. The things I learn in my English class are important. 29 65.5% 2 100.0%
28. The things I learn in my social studies class are
important. 29 82.8% 2 50.0%
29. The things I learn in my mathematics class are
important. 29 79.3% 2 100.0%
30. The things I learn in my science class are important. 29 79.3% 2 100.0%
31. I will be able to make good use of what I learn in
English class. 29 86.2% 2 100.0%
32. I will be able to make good use of what I learn in
social studies class. 28 67.9% 2 50.0%
33. I will be able to make good use of what I learn in
mathematics class. 28 85.7% 2 100.0%
34. I will be able to make good use of what I learn in
science class. 29 72.4% 2 100.0%

SY2011 School Climate Survey - Oxon Hill MS
7
Students SY2011 SY2009
Key Constructs of the Survey Number
Responding
Percent
Responding
Positively
Number
Responding
Percent
Responding
Positively Survey Items
Maximum Opportunities for Learning
35. My school offers a variety of elective classes such
as music, art, foreign languages, and vocational
education.
29 69.0% 2 100.0%
36. My homework assignments are challenging. 28 39.3% 2 50.0%
37. Classes are seldom interrupted by activities,
announcements, or other people. 29 44.8% 2 50.0%
38. In my classes I have the opportunity to work on
lessons with other students. 28 50.0% 2 100.0%
39. The material presented in class is often interesting. 29 37.9% 2 100.0%
40. The way the teachers present the material in my
classes makes the subjects interesting. 29 31.0% 2 50.0%
41. The way my textbooks and workbooks present
information helps me learn the course material. 29 48.3% 2 50.0%
42. The school provides many extracurricular activities. 29 48.3% 2 100.0%
43. I am getting what I need from this school. 29 31.0% 2 100.0%
44. My teachers know their subject areas well. 28 64.3% 2 100.0%
45. My teachers can explain material in a way that I can
understand. 29 58.6% 2 100.0%
46. My teachers are well prepared. 29 48.3% 2 100.0%
Parent/Community Involvement
47. My parents actively support school events. 29 24.1% 2 0.0%
48. My parents are aware of what happens at school. 28 50.0% 2 50.0%

SY2011 School Climate Survey - Oxon Hill MS
8
Table 5–Percent of Oxon Hill MS Parents with Positive Perceptions by Survey Items,
SY2011 and SY2009
Parents SY2011 SY2009
Key Constructs of the Survey Number
Responding
Percent
Responding
Positively
Number
Responding
Percent
Responding
Positively Survey Items
Effective Instructional Leadership
1. The principal and assistant principals know enough
about the school to provide effective leadership 25 84.0% 58 44.8%
2. Free and open communication occurs among
parents, faculty, and administration 24 62.5% 59 52.5%
3. Decisions about instruction are made using
information from parents and the community 25 56.0% 60 33.3%
4. The principal and teachers show leadership in
promoting quality instruction 25 68.0% 59 50.8%
5. The principal and teachers make good instruction
the most important school priority 25 80.0% 58 46.6%
6. The principal is an effective leader for improving
classroom instruction 25 64.0% 59 39.0%
Clear and Focused Mission
7. The school has a written plan that clearly indicates
what the school is trying to achieve 25 68.0% 58 58.6%
8. The school's written plan is developed with
participation by teachers and parents 25 56.0% 57 38.6%
9. Parents and students are aware of school purposes
and goals 25 64.0% 60 68.3%
10. Teachers inform students of what they are expected
to learn 25 84.0% 62 71.0%
Safe and Orderly Environment
11. Students are informed of how they are expected to
behave in school and at school activities 25 96.0% 61 77.0%
12. Students are disciplined in a fair and consistent
manner 25 68.0% 60 48.3%
13. Parents are involved in and support school
disciplinary practices 25 64.0% 62 43.5%
14. The school buildings and grounds are clean and
well maintained 25 80.0% 59 66.1%
15. Students are taught to act in a safe and responsible
manner 24 79.2% 60 66.7%
SY2011 School Climate Survey - Oxon Hill MS
9
Parents SY2011 SY2009
Key Constructs of the Survey Number
Responding
Percent
Responding
Positively
Number
Responding
Percent
Responding
Positively Survey Items
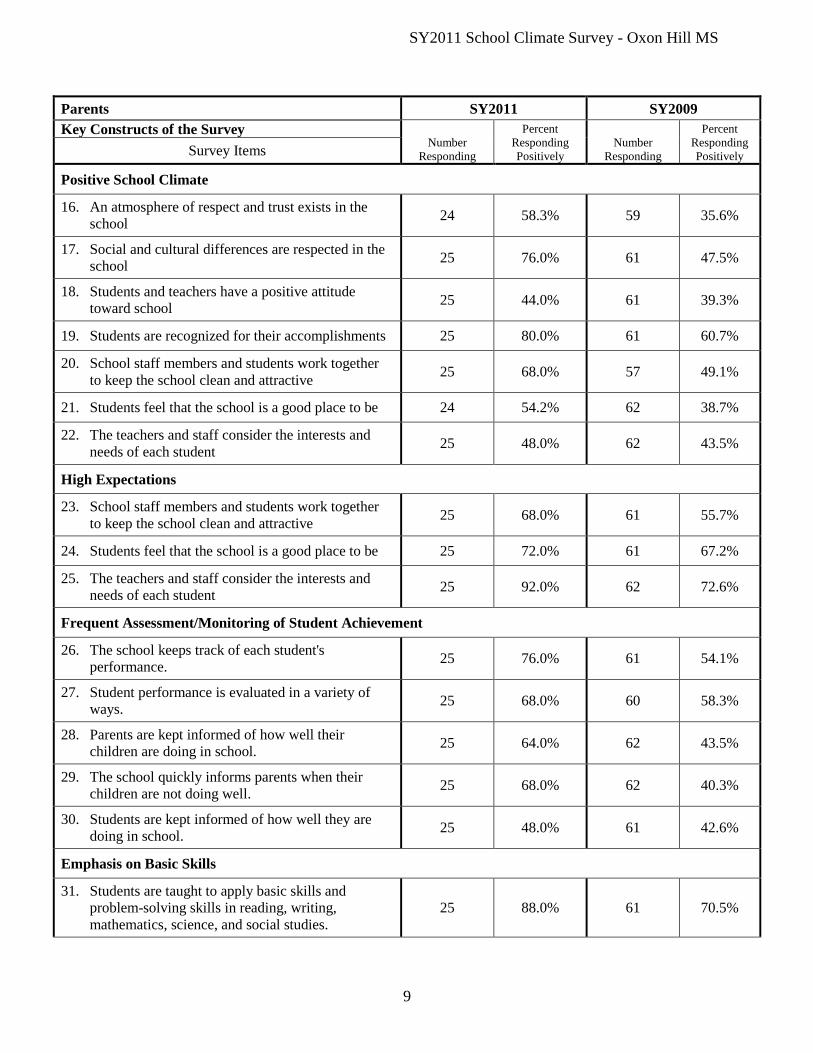
Positive School Climate
16. An atmosphere of respect and trust exists in the
school 24 58.3% 59 35.6%
17. Social and cultural differences are respected in the
school 25 76.0% 61 47.5%
18. Students and teachers have a positive attitude
toward school 25 44.0% 61 39.3%
19. Students are recognized for their accomplishments 25 80.0% 61 60.7%
20. School staff members and students work together
to keep the school clean and attractive 25 68.0% 57 49.1%
21. Students feel that the school is a good place to be 24 54.2% 62 38.7%
22. The teachers and staff consider the interests and
needs of each student 25 48.0% 62 43.5%
High Expectations
23. School staff members and students work together
to keep the school clean and attractive 25 68.0% 61 55.7%
24. Students feel that the school is a good place to be 25 72.0% 61 67.2%
25. The teachers and staff consider the interests and
needs of each student 25 92.0% 62 72.6%
Frequent Assessment/Monitoring of Student Achievement
26. The school keeps track of each student's
performance. 25 76.0% 61 54.1%
27. Student performance is evaluated in a variety of
ways. 25 68.0% 60 58.3%
28. Parents are kept informed of how well their
children are doing in school. 25 64.0% 62 43.5%
29. The school quickly informs parents when their
children are not doing well. 25 68.0% 62 40.3%
30. Students are kept informed of how well they are
doing in school. 25 48.0% 61 42.6%
Emphasis on Basic Skills
31. Students are taught to apply basic skills and
problem-solving skills in reading, writing,
mathematics, science, and social studies.
25 88.0% 61 70.5%

SY2011 School Climate Survey - Oxon Hill MS
10
Parents SY2011 SY2009
Key Constructs of the Survey Number
Responding
Percent
Responding
Positively
Number
Responding
Percent
Responding
Positively Survey Items
32. The school provides learning activities to help
students with special needs or interests. 25 60.0% 59 57.6%
Maximum Opportunities for Learning
33. Teachers spend as much time as needed on
instruction. 25 40.0% 60 33.3%
34. There are few disruptions to instruction in the
school 25 56.0% 60 25.0%
35. Field trips and other activities are used
appropriately to support instruction 25 60.0% 59 44.1%
36. School courses are varied to meet the different
needs, interests, and abilities of students 24 66.7% 60 48.3%
37. Students have enough opportunities to learn with
and from each other 25 64.0% 60 46.7%
38. Teachers are adequately prepared for their teaching
fields 25 76.0% 61 47.5%
Parent/Community Involvement
39. Parents and parent groups have a voice in school
policies 25 56.0% 59 37.3%
40. Parents and parent groups actively participate in
school activities 25 68.0% 61 34.4%
41. Parents and school staff members often share
information about students' progress and plans 24 62.5% 59 40.7%
42. Parents are encouraged to support the instructional
activities of the school 25 72.0% 59 55.9%
43. Parents have opportunities to get involved in the
development of school budgets 25 56.0% 59 37.3%
44. The school gives parents news about their
children's accomplishments 25 60.0% 61 55.7%

SY2011 School Climate Survey - Oxon Hill MS
11
Table 6–Percent of Oxon Hill MS Teachers/Paraprofessionals with Positive Perceptions by
Survey Items, SY2011 and SY2009
Teachers/Paraprofessionals SY2011 SY2009
Key Constructs of the Survey Number
Responding
Percent
Responding
Positively
Number
Responding
Percent
Responding
Positively Survey Items
Effective Instructional Leadership
1. Administrators know the school and district
curriculum. 16 75.0% 26 50.0%
2. Communication between the faculty and
administration is frequent and effective. 16 56.3% 26 50.0%
3. Instructional decisions for the school are based on
input from the community, teachers, and
administrators.
16 43.8% 26 46.2%
4. The principal is involved in the instructional
process. 16 62.5% 26 61.5%
5. The principal and teachers make instructional
effectiveness the highest priority in the school. 16 81.3% 26 57.7%
6. The principal provides leadership in the
improvement of the instructional program. 16 81.3% 26 61.5%
7. Administrators complete fair and meaningful
evaluations of each employee. 16 62.5% 26 34.6%
8. The principal encourages teachers to participate in
leadership roles. 15 66.7% 26 61.5%
Clear and Focused Mission
9. The school has a plan for the year that includes
goals and objectives. 15 86.7% 26 69.2%
10. The school plan is developed with participation by
teachers and community members. 16 75.0% 26 46.2%
11. Important social trends are considered in school
planning. 16 56.3% 26 38.5%
12. Teachers and students know the school's purpose
and goals. 16 62.5% 26 57.7%
13. The goals of teachers are consistent with school
and district goals. 16 75.0% 26 53.8%
14. Teachers communicate instructional goals to
students. 16 93.8% 26 69.2%
15. The school plan is revised, monitored, and
reviewed periodically. 15 66.7% 26 46.2%

SY2011 School Climate Survey - Oxon Hill MS
12
Teachers/Paraprofessionals SY2011 SY2009
Key Constructs of the Survey Number
Responding
Percent
Responding
Positively
Number
Responding
Percent
Responding
Positively Survey Items
Safe and Orderly Environment
16. School conduct rules and procedures are taught
along with other skills. 16 56.3% 26 65.4%
17. Disciplinary procedures are implemented in a fair
and consistent manner. 16 37.5% 26 46.2%
18. Parents are involved in and support the school's
disciplinary procedures. 16 18.8% 26 38.5%
19. The physical plant is clean and well maintained. 16 75.0% 25 76.0%
20. Appropriate safety principles are taught and
practiced. 16 62.5% 26 61.5%
Positive School Climate
21. An atmosphere of respect and trust exists in the
school. 16 43.8% 26 34.6%
22. Social and cultural differences are respected in the
school. 16 81.3% 26 53.8%
23. Teachers have a positive attitude toward their
school. 16 56.3% 26 42.3%
24. Students have a positive attitude toward their
school. 16 43.8% 26 42.3%
25. Teacher attendance is high. 16 43.8% 26 38.5%
26. Student attendance is high. 16 43.8% 26 69.2%
27. Teachers are recognized for their accomplishments. 16 75.0% 25 40.0%
28. Students are recognized for their accomplishments. 16 68.8% 26 57.7%
29. Teachers, students, and administrators assume
responsibility, as appropriate, for the physical
appearance of the school.
16 50.0% 26 50.0%
30. The school physical facilities contribute to a
positive school climate. 16 68.8% 26 65.4%
High Expectations
31. Classroom learning expectations are high,
appropriate, and achievable. 16 81.3% 26 61.5%
32. Expectations are communicated to faculty, support
staff, students, and parents. 16 81.3% 26 61.5%

SY2011 School Climate Survey - Oxon Hill MS
13
Teachers/Paraprofessionals SY2011 SY2009
Key Constructs of the Survey Number
Responding
Percent
Responding
Positively
Number
Responding
Percent
Responding
Positively Survey Items
33. All students, regardless of social or cultural
differences, are expected to work toward high
standards.
16 87.5% 25 64.0%
34. Expectations for students are based on knowledge
of students and their previous performance. 16 75.0% 26 57.7%
35. High academic expectations are consistently
maintained over time. 16 81.3% 26 50.0%
Frequent Assessment/Monitoring of Student Achievement
36. Student performance is regularly evaluated. 16 81.3% 26 65.4%
37. Student performance is evaluated in a variety of
ways. 16 75.0% 26 57.7%
38. Assessment data are used to improve the school's
curriculum. 16 81.3% 25 64.0%
39. Student progress is regularly reported to parents. 16 81.3% 26 69.2%
40. Student assessment data are monitored, and
instruction is modified to promote student learning. 16 87.5% 26 73.1%
41. Students are regularly informed of their progress. 16 68.8% 25 64.0%
Emphasis on Basic Skills
42. Basic skills in this school include grade-appropriate
skills within content areas, critical/higher-order
thinking skills, and problem-solving skills.
16 87.5% 26 76.9%
43. Students are taught to apply basic skills. 16 75.0% 26 73.1%
44. Students are tested for both basic knowledge and
performance capabilities. 15 73.3% 26 73.1%
45. Elective subjects are integrated into the school
curriculum. 16 81.3% 25 72.0%
46. The integration of basic skills development into
instruction is consistently monitored. 16 68.8% 26 50.0%
Maximum Opportunities for Learning
47. Instruction time is used efficiently, so that students
cover the expected curriculum content with
satisfactory understanding and retention.
16 68.8% 26 50.0%
48. Classroom disruptions to instruction are kept to a
minimum. 16 18.8% 26 42.3%
SY2011 School Climate Survey - Oxon Hill MS
14
Teachers/Paraprofessionals SY2011 SY2009
Key Constructs of the Survey Number
Responding
Percent
Responding
Positively
Number
Responding
Percent
Responding
Positively Survey Items
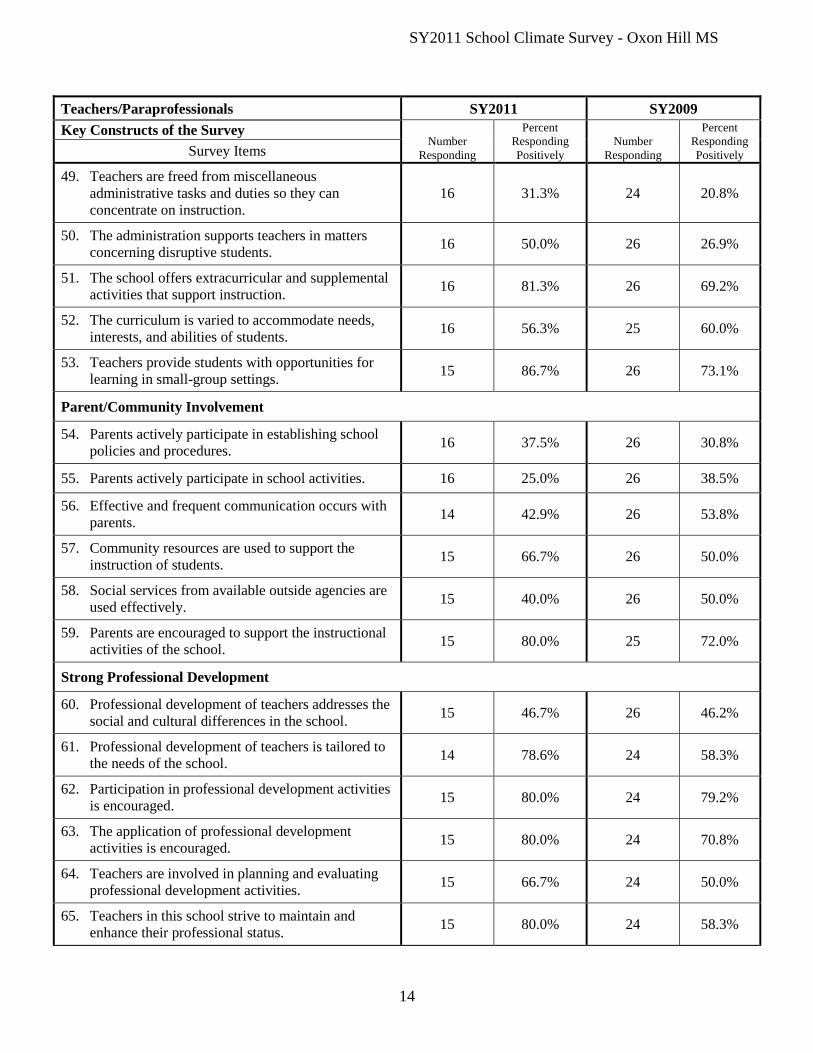
49. Teachers are freed from miscellaneous
administrative tasks and duties so they can
concentrate on instruction.
16 31.3% 24 20.8%
50. The administration supports teachers in matters
concerning disruptive students. 16 50.0% 26 26.9%
51. The school offers extracurricular and supplemental
activities that support instruction. 16 81.3% 26 69.2%
52. The curriculum is varied to accommodate needs,
interests, and abilities of students. 16 56.3% 25 60.0%
53. Teachers provide students with opportunities for
learning in small-group settings. 15 86.7% 26 73.1%
Parent/Community Involvement
54. Parents actively participate in establishing school
policies and procedures. 16 37.5% 26 30.8%
55. Parents actively participate in school activities. 16 25.0% 26 38.5%
56. Effective and frequent communication occurs with
parents. 14 42.9% 26 53.8%
57. Community resources are used to support the
instruction of students. 15 66.7% 26 50.0%
58. Social services from available outside agencies are
used effectively. 15 40.0% 26 50.0%
59. Parents are encouraged to support the instructional
activities of the school. 15 80.0% 25 72.0%
Strong Professional Development
60. Professional development of teachers addresses the
social and cultural differences in the school. 15 46.7% 26 46.2%
61. Professional development of teachers is tailored to
the needs of the school. 14 78.6% 24 58.3%
62. Participation in professional development activities
is encouraged. 15 80.0% 24 79.2%
63. The application of professional development
activities is encouraged. 15 80.0% 24 70.8%
64. Teachers are involved in planning and evaluating
professional development activities. 15 66.7% 24 50.0%
65. Teachers in this school strive to maintain and
enhance their professional status. 15 80.0% 24 58.3%
SY2011 School Climate Survey - Oxon Hill MS
15
Teachers/Paraprofessionals SY2011 SY2009
Key Constructs of the Survey Number
Responding
Percent
Responding
Positively
Number
Responding
Percent
Responding
Positively Survey Items
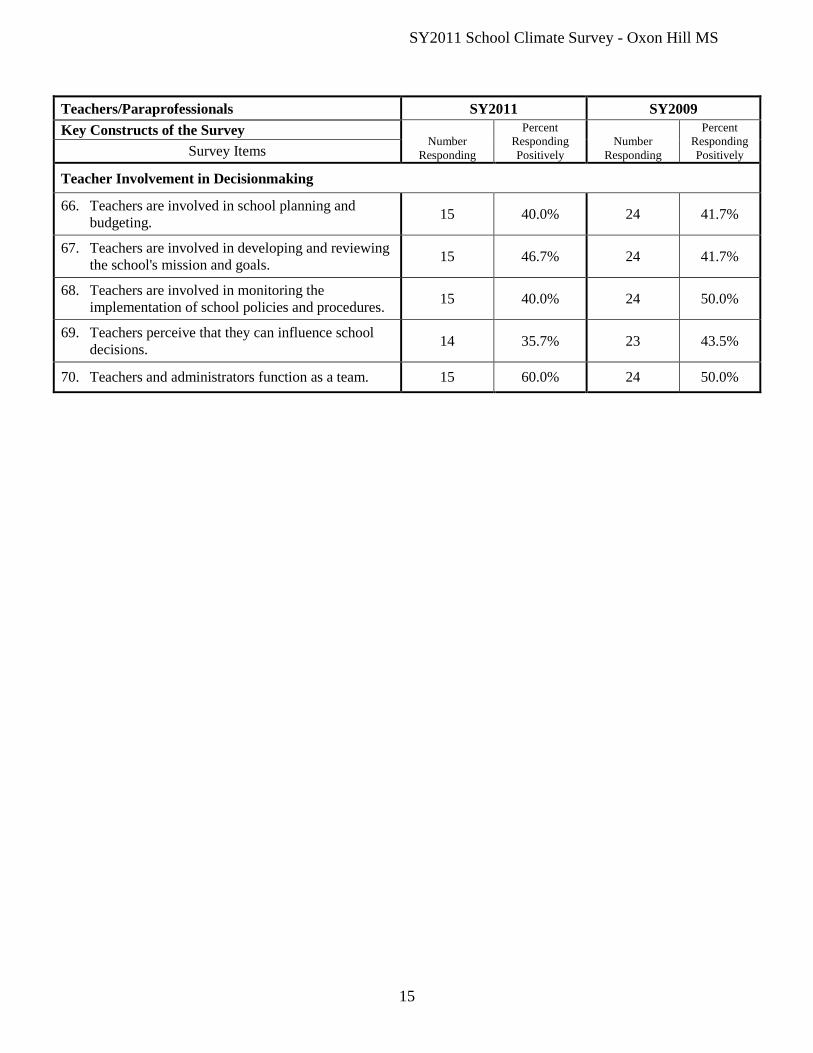
Teacher Involvement in Decisionmaking
66. Teachers are involved in school planning and
budgeting. 15 40.0% 24 41.7%
67. Teachers are involved in developing and reviewing
the school's mission and goals. 15 46.7% 24 41.7%
68. Teachers are involved in monitoring the
implementation of school policies and procedures. 15 40.0% 24 50.0%
69. Teachers perceive that they can influence school
decisions. 14 35.7% 23 43.5%
70. Teachers and administrators function as a team. 15 60.0% 24 50.0%

SY2011 School Climate Survey - Oxon Hill MS
16
Table 7–Distribution of Oxon Hill MS Students’ Responses on Survey Items, SY2011 and SY2009
Students SY2011 SY2009
Key Constructs of the Survey
Number
Percent
Number
Percent
Survey Items Strongly
Agree Agree Neutral Disagree
Strongly
Disagree
Strongly
Agree Agree Neutral Disagree
Strongly
Disagree
Safe and Orderly Environment
1. My school includes instruction in
appropriate behavior. 29 20.7% 48.3% 20.7% 10.3% 0.0% 2 0.0% 50.0% 50.0% 0.0% 0.0%
2. School conduct rules are
established with input from
students.
28 10.7% 32.1% 32.1% 17.9% 7.1% 2 0.0% 50.0% 0.0% 0.0% 50.0%
3. My parents know the school’s
student conduct rules. 29 13.8% 48.3% 24.1% 10.3% 3.4% 2 0.0% 50.0% 50.0% 0.0% 0.0%
4. My parents support the school’s
student conduct rules. 29 17.2% 48.3% 27.6% 6.9% 0.0% 2 0.0% 50.0% 50.0% 0.0% 0.0%
5. My school building is kept clean
and everything works. 29 0.0% 27.6% 17.2% 31.0% 24.1% 2 0.0% 0.0% 50.0% 50.0% 0.0%
6. I know the school safety rules for
the school building, parking area
and grounds, and school buses.
29 31.0% 31.0% 20.7% 13.8% 3.4% 2 0.0% 100.0% 0.0% 0.0% 0.0%
7. Safety rules are enforced. 29 24.1% 44.8% 27.6% 3.4% 0.0% 2 0.0% 100.0% 0.0% 0.0% 0.0%
8. The school safety rules are
generally obeyed by students. 29 3.4% 27.6% 34.5% 20.7% 13.8% 2 0.0% 50.0% 50.0% 0.0% 0.0%
9. Teachers conduct classes in an
orderly and efficient manner. 28 10.7% 35.7% 32.1% 17.9% 3.6% 2 0.0% 50.0% 50.0% 0.0% 0.0%
SY2011 School Climate Survey - Oxon Hill MS
17
Students SY2011 SY2009
Key Constructs of the Survey
Number
Percent
Number
Percent
Survey Items Strongly
Agree Agree Neutral Disagree
Strongly
Disagree
Strongly
Agree Agree Neutral Disagree
Strongly
Disagree
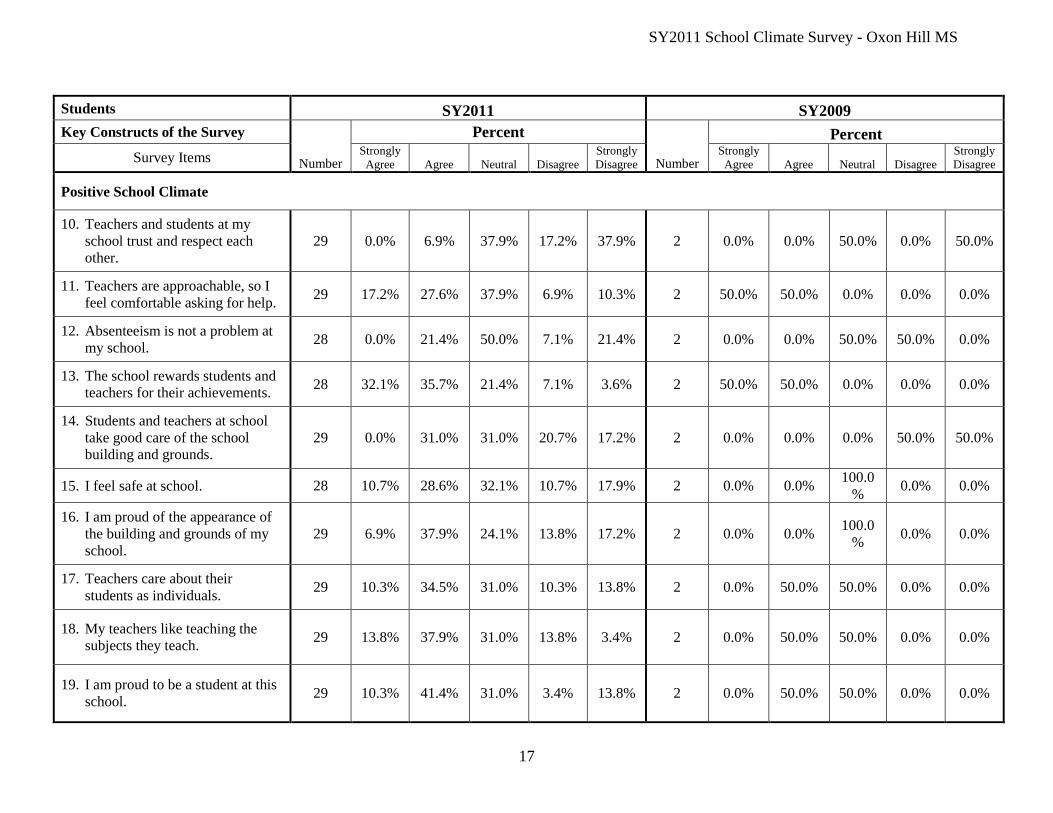
Positive School Climate
10. Teachers and students at my
school trust and respect each
other.
29 0.0% 6.9% 37.9% 17.2% 37.9% 2 0.0% 0.0% 50.0% 0.0% 50.0%
11. Teachers are approachable, so I
feel comfortable asking for help. 29 17.2% 27.6% 37.9% 6.9% 10.3% 2 50.0% 50.0% 0.0% 0.0% 0.0%
12. Absenteeism is not a problem at
my school. 28 0.0% 21.4% 50.0% 7.1% 21.4% 2 0.0% 0.0% 50.0% 50.0% 0.0%
13. The school rewards students and
teachers for their achievements. 28 32.1% 35.7% 21.4% 7.1% 3.6% 2 50.0% 50.0% 0.0% 0.0% 0.0%
14. Students and teachers at school
take good care of the school
building and grounds.
29 0.0% 31.0% 31.0% 20.7% 17.2% 2 0.0% 0.0% 0.0% 50.0% 50.0%
15. I feel safe at school. 28 10.7% 28.6% 32.1% 10.7% 17.9% 2 0.0% 0.0% 100.0
% 0.0% 0.0%
16. I am proud of the appearance of
the building and grounds of my
school.
29 6.9% 37.9% 24.1% 13.8% 17.2% 2 0.0% 0.0% 100.0
% 0.0% 0.0%
17. Teachers care about their
students as individuals. 29 10.3% 34.5% 31.0% 10.3% 13.8% 2 0.0% 50.0% 50.0% 0.0% 0.0%
18. My teachers like teaching the
subjects they teach. 29 13.8% 37.9% 31.0% 13.8% 3.4% 2 0.0% 50.0% 50.0% 0.0% 0.0%
19. I am proud to be a student at this
school. 29 10.3% 41.4% 31.0% 3.4% 13.8% 2 0.0% 50.0% 50.0% 0.0% 0.0%

SY2011 School Climate Survey - Oxon Hill MS
18
Students SY2011 SY2009
Key Constructs of the Survey
Number
Percent
Number
Percent
Survey Items Strongly
Agree Agree Neutral Disagree
Strongly
Disagree
Strongly
Agree Agree Neutral Disagree
Strongly
Disagree
High Expectations
20. My teachers encourage me to do
my best on assigned work and
tests.
29 41.4% 31.0% 20.7% 3.4% 3.4% 2 0.0% 100.0% 0.0% 0.0% 0.0%
21. My teachers expect all students
to do well in school. 29 37.9% 41.4% 13.8% 6.9% 0.0% 2 50.0% 50.0% 0.0% 0.0% 0.0%
22. My teachers challenge me to
learn as much as I can. 29 34.5% 44.8% 13.8% 3.4% 3.4% 2 50.0% 50.0% 0.0% 0.0% 0.0%
Frequent Assessment/Monitoring of Student Achievement
23. My teachers keep track of how I
am doing in my school work. 29 20.7% 41.4% 27.6% 10.3% 0.0% 2 0.0% 50.0% 50.0% 0.0% 0.0%
24. The grades I get are a good
indication of my ability and
effort.
29 24.1% 20.7% 37.9% 13.8% 3.4% 2 50.0% 50.0% 0.0% 0.0% 0.0%
25. My teachers tell me how I am
doing on my tests and assigned
school work.
29 13.8% 34.5% 31.0% 10.3% 10.3% 2 50.0% 50.0% 0.0% 0.0% 0.0%
26. My teachers keep my parents
informed about my progress in
my classes.
29 10.3% 37.9% 24.1% 17.2% 10.3% 2 50.0% 0.0% 50.0% 0.0% 0.0%
Emphasis on Basic Skills
27. The things I learn in my English
class are important.
28. The things I learn in my social
studies class are important. 29 34.5% 48.3% 13.8% 0.0% 3.4% 2 0.0% 50.0% 50.0% 0.0% 0.0%
29. The things I learn in my
mathematics class are important. 29 48.3% 31.0% 17.2% 3.4% 0.0% 2 50.0% 50.0% 0.0% 0.0% 0.0%

SY2011 School Climate Survey - Oxon Hill MS
19
Students SY2011 SY2009
Key Constructs of the Survey
Number
Percent
Number
Percent
Survey Items Strongly
Agree Agree Neutral Disagree
Strongly
Disagree
Strongly
Agree Agree Neutral Disagree
Strongly
Disagree
30. The things I learn in my science
class are important. 29 31.0% 48.3% 13.8% 3.4% 3.4% 2 50.0% 50.0% 0.0% 0.0% 0.0%
31. I will be able to make good use
of what I learn in English class. 29 24.1% 62.1% 13.8% 0.0% 0.0% 2 50.0% 50.0% 0.0% 0.0% 0.0%
32. I will be able to make good use
of what I learn in social studies
class.
28 25.0% 42.9% 25.0% 7.1% 0.0% 2 0.0% 50.0% 50.0% 0.0% 0.0%
33. I will be able to make good use
of what I learn in mathematics
class.
28 32.1% 53.6% 10.7% 3.6% 0.0% 2 50.0% 50.0% 0.0% 0.0% 0.0%
34. I will be able to make good use
of what I learn in science class. 29 31.0% 41.4% 10.3% 17.2% 0.0% 2 50.0% 50.0% 0.0% 0.0% 0.0%
Maximum Opportunities for Learning
35. My school offers a variety of
elective classes such as music,
art, foreign languages, and
vocational education.
29 31.0% 37.9% 13.8% 6.9% 10.3% 2 50.0% 50.0% 0.0% 0.0% 0.0%
36. My homework assignments are
challenging. 28 7.1% 32.1% 50.0% 3.6% 7.1% 2 0.0% 50.0% 50.0% 0.0% 0.0%
37. Classes are seldom interrupted by
activities, announcements, or
other people.
29 20.7% 24.1% 41.4% 3.4% 10.3% 2 50.0% 0.0% 50.0% 0.0% 0.0%
38. In my classes I have the
opportunity to work on lessons
with other students.
28 3.6% 46.4% 39.3% 10.7% 0.0% 2 50.0% 50.0% 0.0% 0.0% 0.0%
39. The material presented in class is
often interesting. 29 6.9% 31.0% 44.8% 10.3% 6.9% 2 0.0% 100.0% 0.0% 0.0% 0.0%

SY2011 School Climate Survey - Oxon Hill MS
20
Students SY2011 SY2009
Key Constructs of the Survey
Number
Percent
Number
Percent
Survey Items Strongly
Agree Agree Neutral Disagree
Strongly
Disagree
Strongly
Agree Agree Neutral Disagree
Strongly
Disagree
40. The way the teachers present the
material in my classes makes the
subjects interesting.
29 3.4% 27.6% 41.4% 13.8% 13.8% 2 0.0% 50.0% 50.0% 0.0% 0.0%
41. The way my textbooks and
workbooks present information
helps me learn the course
material.
29 6.9% 41.4% 34.5% 13.8% 3.4% 2 0.0% 50.0% 50.0% 0.0% 0.0%
42. The school provides many
extracurricular activities. 29 10.3% 37.9% 34.5% 13.8% 3.4% 2 50.0% 50.0% 0.0% 0.0% 0.0%
43. I am getting what I need from
this school. 29 6.9% 24.1% 37.9% 20.7% 10.3% 2 50.0% 50.0% 0.0% 0.0% 0.0%
44. My teachers know their subject
areas well. 28 10.7% 53.6% 17.9% 14.3% 3.6% 2 50.0% 50.0% 0.0% 0.0% 0.0%
45. My teachers can explain material
in a way that I can understand. 29 3.4% 55.2% 27.6% 6.9% 6.9% 2 0.0% 100.0% 0.0% 0.0% 0.0%
46. My teachers are well prepared. 29 10.3% 37.9% 27.6% 20.7% 3.4% 2 0.0% 100.0% 0.0% 0.0% 0.0%
Parent/Community Involvement
47. My parents actively support
school events. 29 0.0% 24.1% 41.4% 27.6% 6.9% 2 0.0% 0.0% 50.0% 50.0% 0.0%
48. My parents are aware of what
happens at school. 28 10.7% 39.3% 21.4% 14.3% 14.3% 2 50.0% 0.0% 50.0% 0.0% 0.0%

SY2011 School Climate Survey - Oxon Hill MS
21
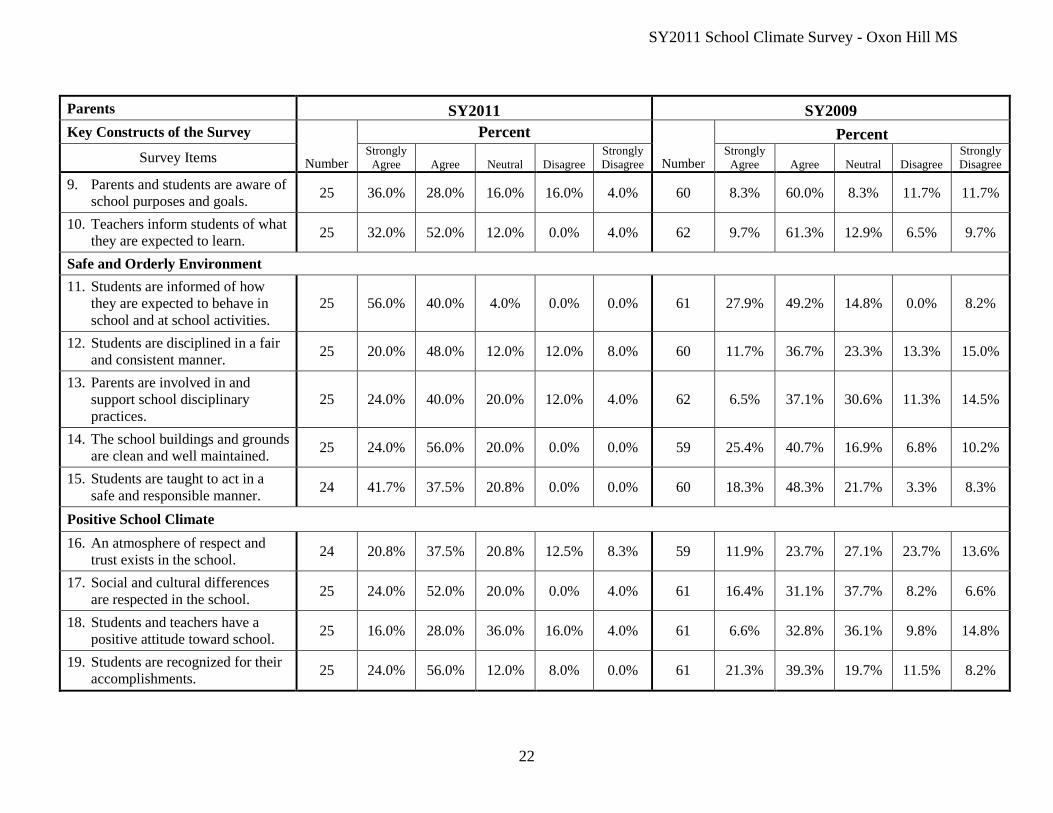
Table 8–Distribution of Oxon Hill MS Parents’ Responses on Survey Items, SY2011 and SY2009
Parents SY2011 SY2009
Key Constructs of the Survey
Number
Percent
Number
Percent
Survey Items Strongly
Agree Agree Neutral Disagree
Strongly
Disagree
Strongly
Agree Agree Neutral Disagree
Strongly
Disagree
Effective Instructional Leadership
1. The principal and assistant
principals know enough about the
school to provide effective
leadership.
25 28.0% 56.0% 12.0% 4.0% 0.0% 58 13.8% 31.0% 36.2% 5.2% 13.8%
2. Free and open communication
occurs among parents, faculty,
and administration.
24 20.8% 41.7% 33.3% 0.0% 4.2% 59 16.9% 35.6% 23.7% 13.6% 10.2%
3. Decisions about instruction are
made using information from
parents and the community.
25 20.0% 36.0% 36.0% 8.0% 0.0% 60 1.7% 31.7% 31.7% 23.3% 11.7%
4. The principal and teachers show
leadership in promoting quality
instruction.
25 24.0% 44.0% 32.0% 0.0% 0.0% 59 10.2% 40.7% 27.1% 10.2% 11.9%
5. The principal and teachers make
good instruction the most
important school priority.
25 24.0% 56.0% 16.0% 4.0% 0.0% 58 6.9% 39.7% 31.0% 10.3% 12.1%
6. The principal is an effective
leader for improving classroom
instruction.
25 24.0% 40.0% 28.0% 8.0% 0.0% 59 8.5% 30.5% 35.6% 13.6% 11.9%
Clear and Focused Mission
7. The school has a written plan that
clearly indicates what the school
is trying to achieve.
25 36.0% 32.0% 16.0% 12.0% 4.0% 58 8.6% 50.0% 25.9% 3.4% 12.1%
8. The school's written plan is
developed with participation by
teachers and parents.
25 20.0% 36.0% 24.0% 20.0% 0.0% 57 8.8% 29.8% 31.6% 19.3% 10.5%
SY2011 School Climate Survey - Oxon Hill MS
22
Parents SY2011 SY2009
Key Constructs of the Survey
Number
Percent
Number
Percent
Survey Items Strongly
Agree Agree Neutral Disagree
Strongly
Disagree
Strongly
Agree Agree Neutral Disagree
Strongly
Disagree
9. Parents and students are aware of
school purposes and goals. 25 36.0% 28.0% 16.0% 16.0% 4.0% 60 8.3% 60.0% 8.3% 11.7% 11.7%
10. Teachers inform students of what
they are expected to learn. 25 32.0% 52.0% 12.0% 0.0% 4.0% 62 9.7% 61.3% 12.9% 6.5% 9.7%
Safe and Orderly Environment
11. Students are informed of how
they are expected to behave in
school and at school activities.
25 56.0% 40.0% 4.0% 0.0% 0.0% 61 27.9% 49.2% 14.8% 0.0% 8.2%
12. Students are disciplined in a fair
and consistent manner. 25 20.0% 48.0% 12.0% 12.0% 8.0% 60 11.7% 36.7% 23.3% 13.3% 15.0%
13. Parents are involved in and
support school disciplinary
practices.
25 24.0% 40.0% 20.0% 12.0% 4.0% 62 6.5% 37.1% 30.6% 11.3% 14.5%
14. The school buildings and grounds
are clean and well maintained. 25 24.0% 56.0% 20.0% 0.0% 0.0% 59 25.4% 40.7% 16.9% 6.8% 10.2%
15. Students are taught to act in a
safe and responsible manner. 24 41.7% 37.5% 20.8% 0.0% 0.0% 60 18.3% 48.3% 21.7% 3.3% 8.3%
Positive School Climate
16. An atmosphere of respect and
trust exists in the school. 24 20.8% 37.5% 20.8% 12.5% 8.3% 59 11.9% 23.7% 27.1% 23.7% 13.6%
17. Social and cultural differences
are respected in the school. 25 24.0% 52.0% 20.0% 0.0% 4.0% 61 16.4% 31.1% 37.7% 8.2% 6.6%
18. Students and teachers have a
positive attitude toward school. 25 16.0% 28.0% 36.0% 16.0% 4.0% 61 6.6% 32.8% 36.1% 9.8% 14.8%
19. Students are recognized for their
accomplishments. 25 24.0% 56.0% 12.0% 8.0% 0.0% 61 21.3% 39.3% 19.7% 11.5% 8.2%

SY2011 School Climate Survey - Oxon Hill MS
23
Parents SY2011 SY2009
Key Constructs of the Survey
Number
Percent
Number
Percent
Survey Items Strongly
Agree Agree Neutral Disagree
Strongly
Disagree
Strongly
Agree Agree Neutral Disagree
Strongly
Disagree
20. School staff members and
students work together to keep
the school clean and attractive.
25 24.0% 44.0% 20.0% 12.0% 0.0% 57 7.0% 42.1% 35.1% 10.5% 5.3%
21. Students feel that the school is a
good place to be. 24 20.8% 33.3% 33.3% 12.5% 0.0% 62 8.1% 30.6% 37.1% 12.9% 11.3%
22. The teachers and staff consider
the interests and needs of each
student.
25 20.0% 28.0% 32.0% 16.0% 4.0% 62 8.1% 35.5% 29.0% 9.7% 17.7%
High Expectations
23. School staff members set high,
but appropriate and achievable,
goals for students.
25 16.0% 52.0% 24.0% 8.0% 0.0% 61 11.5% 44.3% 27.9% 4.9% 11.5%
24. Students and parents know what
the school expects of them. 25 28.0% 44.0% 20.0% 8.0% 0.0% 61 19.7% 47.5% 19.7% 4.9% 8.2%
25. All students, regardless of social
or cultural differences, are
expected to work toward high
standards.
25 32.0% 60.0% 8.0% 0.0% 0.0% 62 25.8% 46.8% 17.7% 1.6% 8.1%
Frequent Assessment/Monitoring of Student Achievement
26. The school keeps track of each
student's performance. 25 24.0% 52.0% 20.0% 0.0% 4.0% 61 11.5% 42.6% 26.2% 9.8% 9.8%
27. Student performance is evaluated
in a variety of ways. 25 16.0% 52.0% 28.0% 0.0% 4.0% 60 13.3% 45.0% 30.0% 3.3% 8.3%
28. Parents are kept informed of how
well their children are doing in
school.
25 32.0% 32.0% 16.0% 16.0% 4.0% 62 11.3% 32.3% 21.0% 17.7% 17.7%
29. The school quickly informs
parents when their children are
not doing well.
25 28.0% 40.0% 8.0% 20.0% 4.0% 62 19.4% 21.0% 24.2% 14.5% 21.0%

SY2011 School Climate Survey - Oxon Hill MS
24
Parents SY2011 SY2009
Key Constructs of the Survey
Number
Percent
Number
Percent
Survey Items Strongly
Agree Agree Neutral Disagree
Strongly
Disagree
Strongly
Agree Agree Neutral Disagree
Strongly
Disagree
30. Students are kept informed of
how well they are doing in
school.
25 24.0% 24.0% 32.0% 16.0% 4.0% 61 16.4% 26.2% 26.2% 16.4% 14.8%
Emphasis on Basic Skills
31. Students are taught to apply basic
skills and problem-solving skills
in reading, writing, mathematics,
science, and social studies.
25 32.0% 56.0% 12.0% 0.0% 0.0% 61 14.8% 55.7% 16.4% 3.3% 9.8%
32. The school provides learning
activities to help students with
special needs or interests.
25 32.0% 28.0% 28.0% 12.0% 0.0% 59 13.6% 44.1% 22.0% 10.2% 10.2%
Maximum Opportunities for Learning
33. Teachers spend as much time as
needed on instruction. 25 20.0% 20.0% 28.0% 24.0% 8.0% 60 10.0% 23.3% 30.0% 18.3% 18.3%
34. There are few disruptions to
instruction in the school. 25 16.0% 40.0% 16.0% 8.0% 20.0% 60 3.3% 21.7% 33.3% 23.3% 18.3%
35. Field trips and other activities are
used appropriately to support
instruction.
25 16.0% 44.0% 20.0% 16.0% 4.0% 59 5.1% 39.0% 18.6% 15.3% 22.0%
36. School courses are varied to meet
the different needs, interests, and
abilities of students.
24 16.7% 50.0% 16.7% 16.7% 0.0% 60 10.0% 38.3% 26.7% 10.0% 15.0%
37. Students have enough
opportunities to learn with and
from each other.
25 16.0% 48.0% 28.0% 4.0% 4.0% 60 8.3% 38.3% 31.7% 8.3% 13.3%
38. Teachers are adequately prepared
for their teaching fields. 25 16.0% 60.0% 16.0% 4.0% 4.0% 61 11.5% 36.1% 23.0% 14.8% 14.8%

SY2011 School Climate Survey - Oxon Hill MS
25
Parents SY2011 SY2009
Key Constructs of the Survey
Number
Percent
Number
Percent
Survey Items Strongly
Agree Agree Neutral Disagree
Strongly
Disagree
Strongly
Agree Agree Neutral Disagree
Strongly
Disagree
Parent/Community Involvement
39. Parents and parent groups have a
voice in school policies. 25 16.0% 40.0% 28.0% 16.0% 0.0% 59 5.1% 32.2% 37.3% 11.9% 13.6%
40. Parents and parent groups
actively participate in school
activities.
25 24.0% 44.0% 20.0% 12.0% 0.0% 61 3.3% 31.1% 34.4% 19.7% 11.5%
41. Parents and school staff members
often share information about
students' progress and plans.
24 25.0% 37.5% 12.5% 25.0% 0.0% 59 8.5% 32.2% 25.4% 16.9% 16.9%
42. Parents are encouraged to support
the instructional activities of the
school.
25 28.0% 44.0% 24.0% 4.0% 0.0% 59 10.2% 45.8% 25.4% 10.2% 8.5%
43. Parents have opportunities to get
involved in the development of
school budgets.
25 20.0% 36.0% 28.0% 8.0% 8.0% 59 3.4% 33.9% 25.4% 16.9% 20.3%
44. The school gives parents news
about their children's
accomplishments.
25 20.0% 40.0% 20.0% 16.0% 4.0% 61 16.4% 39.3% 11.5% 16.4% 16.4%

SY2011 School Climate Survey - Oxon Hill MS
26
Table 9–Distribution of Oxon Hill MS Teachers/Paraprofessionals’ Responses on Survey Items, SY2011 and SY2009
Teachers/Paraprofessionals SY2011 SY2009
Key Constructs of the Survey
Number
Percent Percent
Survey Items Strongly
Agree Agree Neutral Disagree
Strongly
Disagree Number Strongly
Agree Agree Neutral Disagree
Strongly
Disagree
Effective Instructional Leadership
1. Administrators know the school
and district curriculum. 16 31.3% 43.8% 18.8% 6.3% 0.0% 26 15.4% 34.6% 30.8% 7.7% 11.5%
2. Communication between the
faculty and administration is
frequent and effective.
16 6.3% 50.0% 18.8% 18.8% 6.3% 26 11.5% 38.5% 15.4% 15.4% 19.2%
3. Instructional decisions for the
school are based on input from
the community, teachers, and
administrators.
16 0.0% 43.8% 31.3% 12.5% 12.5% 26 11.5% 34.6% 26.9% 7.7% 19.2%
4. The principal is involved in the
instructional process. 16 25.0% 37.5% 25.0% 12.5% 0.0% 26 11.5% 50.0% 23.1% 7.7% 7.7%
5. The principal and teachers make
instructional effectiveness the
highest priority in the school.
16 43.8% 37.5% 6.3% 12.5% 0.0% 26 19.2% 38.5% 15.4% 15.4% 11.5%
6. The principal provides
leadership in the improvement of
the instructional program.
16 25.0% 56.3% 12.5% 6.3% 0.0% 26 15.4% 46.2% 23.1% 7.7% 7.7%
7. Administrators complete fair and
meaningful evaluations of each
employee.
16 12.5% 50.0% 37.5% 0.0% 0.0% 26 11.5% 23.1% 38.5% 15.4% 11.5%
8. The principal encourages
teachers to participate in
leadership roles.
15 40.0% 26.7% 13.3% 13.3% 6.7% 26 11.5% 50.0% 11.5% 11.5% 15.4%

SY2011 School Climate Survey - Oxon Hill MS
27
Teachers/Paraprofessionals SY2011 SY2009
Key Constructs of the Survey
Number
Percent Percent
Survey Items Strongly
Agree Agree Neutral Disagree
Strongly
Disagree Number Strongly
Agree Agree Neutral Disagree
Strongly
Disagree
Clear and Focused Mission
9. The school has a plan for the
year that includes goals and
objectives.
15 20.0% 66.7% 6.7% 6.7% 0.0% 26 15.4% 53.8% 26.9% 0.0% 3.8%
10. The school plan is developed
with participation by teachers
and community members.
16 12.5% 62.5% 12.5% 12.5% 0.0% 26 15.4% 30.8% 23.1% 19.2% 11.5%
11. Important social trends are
considered in school planning. 16 6.3% 50.0% 18.8% 25.0% 0.0% 26 11.5% 26.9% 26.9% 15.4% 19.2%
12. Teachers and students know the
school's purpose and goals. 16 25.0% 37.5% 18.8% 6.3% 12.5% 26 15.4% 42.3% 19.2% 19.2% 3.8%
13. The goals of teachers are
consistent with school and
district goals.
16 25.0% 50.0% 18.8% 6.3% 0.0% 26 19.2% 34.6% 23.1% 19.2% 3.8%
14. Teachers communicate
instructional goals to students. 16 50.0% 43.8% 6.3% 0.0% 0.0% 26 23.1% 46.2% 19.2% 11.5% 0.0%
15. The school plan is revised,
monitored, and reviewed
periodically.
15 6.7% 60.0% 33.3% 0.0% 0.0% 26 11.5% 34.6% 38.5% 11.5% 3.8%
Safe and Orderly Environment
16. School conduct rules and
procedures are taught along with
other skills.
16 6.3% 50.0% 12.5% 18.8% 12.5% 26 15.4% 50.0% 11.5% 15.4% 7.7%
17. Disciplinary procedures are
implemented in a fair and
consistent manner.
16 0.0% 37.5% 18.8% 25.0% 18.8% 26 19.2% 26.9% 19.2% 15.4% 19.2%
18. Parents are involved in and
support the school's disciplinary
procedures.
16 6.3% 12.5% 37.5% 18.8% 25.0% 26 11.5% 26.9% 23.1% 23.1% 15.4%

SY2011 School Climate Survey - Oxon Hill MS
28
Teachers/Paraprofessionals SY2011 SY2009
Key Constructs of the Survey
Number
Percent Percent
Survey Items Strongly
Agree Agree Neutral Disagree
Strongly
Disagree Number Strongly
Agree Agree Neutral Disagree
Strongly
Disagree
19. The physical plant is clean and
well maintained. 16 31.3% 43.8% 18.8% 0.0% 6.3% 25 16.0% 60.0% 12.0% 0.0% 12.0%
20. Appropriate safety principles are
taught and practiced. 16 18.8% 43.8% 12.5% 25.0% 0.0% 26 11.5% 50.0% 23.1% 11.5% 3.8%
Positive School Climate
21. An atmosphere of respect and
trust exists in the school. 16 0.0% 43.8% 18.8% 12.5% 25.0% 26 15.4% 19.2% 23.1% 15.4% 26.9%
22. Social and cultural differences
are respected in the school. 16 25.0% 56.3% 6.3% 12.5% 0.0% 26 26.9% 26.9% 26.9% 15.4% 3.8%
23. Teachers have a positive attitude
toward their school. 16 12.5% 43.8% 18.8% 25.0% 0.0% 26 23.1% 19.2% 23.1% 19.2% 15.4%
24. Students have a positive attitude
toward their school. 16 6.3% 37.5% 12.5% 25.0% 18.8% 26 19.2% 23.1% 26.9% 23.1% 7.7%
25. Teacher attendance is high. 16 0.0% 43.8% 31.3% 18.8% 6.3% 26 11.5% 26.9% 23.1% 23.1% 15.4%
26. Student attendance is high. 16 6.3% 37.5% 37.5% 12.5% 6.3% 26 19.2% 50.0% 26.9% 3.8% 0.0%
27. Teachers are recognized for their
accomplishments. 16 6.3% 68.8% 12.5% 12.5% 0.0% 25 12.0% 28.0% 36.0% 8.0% 16.0%
28. Students are recognized for their
accomplishments. 16 18.8% 50.0% 12.5% 12.5% 6.3% 26 19.2% 38.5% 30.8% 11.5% 0.0%
29. Teachers, students, and
administrators assume
responsibility, as appropriate, for
the physical appearance of the
school.
16 12.5% 37.5% 43.8% 6.3% 0.0% 26 11.5% 38.5% 34.6% 3.8% 11.5%
30. The school physical facilities
contribute to a positive school
climate.
16 12.5% 56.3% 12.5% 12.5% 6.3% 26 15.4% 50.0% 23.1% 0.0% 11.5%

SY2011 School Climate Survey - Oxon Hill MS
29
Teachers/Paraprofessionals SY2011 SY2009
Key Constructs of the Survey
Number
Percent Percent
Survey Items Strongly
Agree Agree Neutral Disagree
Strongly
Disagree Number Strongly
Agree Agree Neutral Disagree
Strongly
Disagree
High Expectations
31. Classroom learning expectations
are high, appropriate, and
achievable.
16 31.3% 50.0% 18.8% 0.0% 0.0% 26 23.1% 38.5% 23.1% 15.4% 0.0%
32. Expectations are communicated
to faculty, support staff,
students, and parents.
16 31.3% 50.0% 6.3% 12.5% 0.0% 26 26.9% 34.6% 19.2% 7.7% 11.5%
33. All students, regardless of social
or cultural differences, are
expected to work toward high
standards.
16 12.5% 75.0% 6.3% 6.3% 0.0% 25 24.0% 40.0% 20.0% 8.0% 8.0%
34. Expectations for students are
based on knowledge of students
and their previous performance.
16 18.8% 56.3% 18.8% 6.3% 0.0% 26 19.2% 38.5% 26.9% 11.5% 3.8%
35. High academic expectations are
consistently maintained over
time.
16 18.8% 62.5% 18.8% 0.0% 0.0% 26 19.2% 30.8% 26.9% 15.4% 7.7%
Frequent Assessment/Monitoring of Student Achievement
36. Student performance is regularly
evaluated. 16 18.8% 62.5% 18.8% 0.0% 0.0% 26 19.2% 46.2% 19.2% 11.5% 3.8%
37. Student performance is
evaluated in a variety of ways. 16 12.5% 62.5% 25.0% 0.0% 0.0% 26 19.2% 38.5% 26.9% 11.5% 3.8%
38. Assessment data are used to
improve the school's curriculum. 16 37.5% 43.8% 18.8% 0.0% 0.0% 25 24.0% 40.0% 20.0% 8.0% 8.0%
39. Student progress is regularly
reported to parents. 16 25.0% 56.3% 18.8% 0.0% 0.0% 26 23.1% 46.2% 23.1% 7.7% 0.0%

SY2011 School Climate Survey - Oxon Hill MS
30
Teachers/Paraprofessionals SY2011 SY2009
Key Constructs of the Survey
Number
Percent Percent
Survey Items Strongly
Agree Agree Neutral Disagree
Strongly
Disagree Number Strongly
Agree Agree Neutral Disagree
Strongly
Disagree
40. Student assessment data are
monitored, and instruction is
modified to promote student
learning.
16 25.0% 62.5% 6.3% 6.3% 0.0% 26 19.2% 53.8% 19.2% 7.7% 0.0%
41. Students are regularly informed
of their progress. 16 12.5% 56.3% 18.8% 12.5% 0.0% 25 12.0% 52.0% 20.0% 12.0% 4.0%
Emphasis on Basic Skills
42. Basic skills in this school
include grade-appropriate skills
within content areas,
critical/higher-order thinking
skills, and problem-solving
skills.
16 12.5% 75.0% 12.5% 0.0% 0.0% 26 23.1% 53.8% 19.2% 3.8% 0.0%
43. Students are taught to apply
basic skills. 16 18.8% 56.3% 25.0% 0.0% 0.0% 26 30.8% 42.3% 23.1% 3.8% 0.0%
44. Students are tested for both basic
knowledge and performance
capabilities.
15 20.0% 53.3% 20.0% 6.7% 0.0% 26 30.8% 42.3% 26.9% 0.0% 0.0%
45. Elective subjects are integrated
into the school curriculum. 16 6.3% 75.0% 18.8% 0.0% 0.0% 25 16.0% 56.0% 20.0% 4.0% 4.0%
46. The integration of basic skills
development into instruction is
consistently monitored.
16 6.3% 62.5% 25.0% 6.3% 0.0% 26 11.5% 38.5% 30.8% 19.2% 0.0%
Maximum Opportunities for Learning
47. Instruction time is used
efficiently, so that students cover
the expected curriculum content
with satisfactory understanding
and retention.
16 6.3% 62.5% 18.8% 12.5% 0.0% 26 19.2% 30.8% 23.1% 26.9% 0.0%

SY2011 School Climate Survey - Oxon Hill MS
31
Teachers/Paraprofessionals SY2011 SY2009
Key Constructs of the Survey
Number
Percent Percent
Survey Items Strongly
Agree Agree Neutral Disagree
Strongly
Disagree Number Strongly
Agree Agree Neutral Disagree
Strongly
Disagree
48. Classroom disruptions to
instruction are kept to a
minimum.
16 6.3% 12.5% 43.8% 12.5% 25.0% 26 11.5% 30.8% 15.4% 30.8% 11.5%
49. Teachers are freed from
miscellaneous administrative
tasks and duties so they can
concentrate on instruction.
16 0.0% 31.3% 31.3% 25.0% 12.5% 24 12.5% 8.3% 29.2% 20.8% 29.2%
50. The administration supports
teachers in matters concerning
disruptive students.
16 0.0% 50.0% 25.0% 12.5% 12.5% 26 11.5% 15.4% 42.3% 15.4% 15.4%
51. The school offers extracurricular
and supplemental activities that
support instruction.
16 18.8% 62.5% 18.8% 0.0% 0.0% 26 7.7% 61.5% 23.1% 3.8% 3.8%
52. The curriculum is varied to
accommodate needs, interests,
and abilities of students.
16 12.5% 43.8% 25.0% 18.8% 0.0% 25 12.0% 48.0% 28.0% 8.0% 4.0%
53. Teachers provide students with
opportunities for learning in
small-group settings.
15 13.3% 73.3% 13.3% 0.0% 0.0% 26 23.1% 50.0% 23.1% 3.8% 0.0%
Parent/Community Involvement
54. Parents actively participate in
establishing school policies and
procedures.
16 6.3% 31.3% 18.8% 31.3% 12.5% 26 3.8% 26.9% 42.3% 15.4% 11.5%
55. Parents actively participate in
school activities. 16 6.3% 18.8% 37.5% 31.3% 6.3% 26 3.8% 34.6% 23.1% 26.9% 11.5%
56. Effective and frequent
communication occurs with
parents.
14 21.4% 21.4% 50.0% 0.0% 7.1% 26 15.4% 38.5% 15.4% 30.8% 0.0%

SY2011 School Climate Survey - Oxon Hill MS
32
Teachers/Paraprofessionals SY2011 SY2009
Key Constructs of the Survey
Number
Percent Percent
Survey Items Strongly
Agree Agree Neutral Disagree
Strongly
Disagree Number Strongly
Agree Agree Neutral Disagree
Strongly
Disagree
57. Community resources are used
to support the instruction of
students.
15 13.3% 53.3% 26.7% 6.7% 0.0% 26 11.5% 38.5% 19.2% 26.9% 3.8%
58. Social services from available
outside agencies are used
effectively.
15 6.7% 33.3% 46.7% 6.7% 6.7% 26 11.5% 38.5% 34.6% 7.7% 7.7%
59. Parents are encouraged to
support the instructional
activities of the school.
15 20.0% 60.0% 20.0% 0.0% 0.0% 25 28.0% 44.0% 28.0% 0.0% 0.0%
Strong Professional Development
60. Professional development of
teachers addresses the social and
cultural differences in the
school.
15 6.7% 40.0% 40.0% 6.7% 6.7% 26 19.2% 26.9% 26.9% 26.9% 0.0%
61. Professional development of
teachers is tailored to the needs
of the school.
14 14.3% 64.3% 21.4% 0.0% 0.0% 24 33.3% 25.0% 25.0% 16.7% 0.0%
62. Participation in professional
development activities is
encouraged.
15 26.7% 53.3% 13.3% 6.7% 0.0% 24 37.5% 41.7% 16.7% 0.0% 4.2%
63. The application of professional
development activities is
encouraged.
15 26.7% 53.3% 13.3% 6.7% 0.0% 24 33.3% 37.5% 29.2% 0.0% 0.0%
64. Teachers are involved in
planning and evaluating
professional development
activities.
15 13.3% 53.3% 26.7% 6.7% 0.0% 24 29.2% 20.8% 29.2% 12.5% 8.3%

SY2011 School Climate Survey - Oxon Hill MS
33
Teachers/Paraprofessionals SY2011 SY2009
Key Constructs of the Survey
Number
Percent Percent
Survey Items Strongly
Agree Agree Neutral Disagree
Strongly
Disagree Number Strongly
Agree Agree Neutral Disagree
Strongly
Disagree
65. Teachers in this school strive to
maintain and enhance their
professional status.
15 40.0% 40.0% 20.0% 0.0% 0.0% 24 29.2% 29.2% 33.3% 0.0% 8.3%
Teacher Involvement in Decisionmaking
66. Teachers are involved in school
planning and budgeting. 15 6.7% 33.3% 26.7% 26.7% 6.7% 24 20.8% 20.8% 20.8% 12.5% 25.0%
67. Teachers are involved in
developing and reviewing the
school's mission and goals.
15 0.0% 46.7% 33.3% 13.3% 6.7% 24 16.7% 25.0% 20.8% 16.7% 20.8%
68. Teachers are involved in
monitoring the implementation
of school policies and
procedures.
15 6.7% 33.3% 40.0% 13.3% 6.7% 24 16.7% 33.3% 16.7% 16.7% 16.7%
69. Teachers perceive that they can
influence school decisions. 14 7.1% 28.6% 35.7% 14.3% 14.3% 23 17.4% 26.1% 13.0% 17.4% 26.1%
70. Teachers and administrators
function as a team. 15 0.0% 60.0% 13.3% 13.3% 13.3% 24 16.7% 33.3% 16.7% 8.3% 25.0%