Swine Farm Permit modifications - NC
21
SWINE FARM PERMIT MODIFICATIONS Associated with the Align RNG Proposed Project December 22, 2020 DRAFT Environmental Justice Report North Carolina Department of Environmental Quality
Transcript of Swine Farm Permit modifications - NC

SWINE FARM PERMIT MODIFICATIONS
Associated with the Align RNG Proposed Project
December 22, 2020
DRAFT Environmental Justice Report North Carolina Department of Environmental Quality

DRAFT Environmental Justice Report Swine Farm Permit Modifications
December 22, 2020
P a g e | 1
1 Draft Environmental Justice (EJ) Report
The Draft EJ Report is an initial look at the demographics and socioeconomics of a facility’s surrounding community area. This includes information within a radius determined by the North Carolina Department of Environmental Quality (Department or DEQ) regarding race and ethnicity (decennial census year), poverty status, per capita income, and ability to speak English (most current American Community Survey (ACS) census range), the current North Carolina Department of Commerce county tier, and presence of Native American territory. The Draft EJ Report does not include a reconnaissance of the community.
A Draft EJ report will be prepared at the beginning of the permit application process when requested by the appropriate Division Director. This report will be distributed to interested community members (if known) and posted to the DEQ website with the relevant permit application before the close of the public comment period. The primary goal is to encourage EJ Report comments and suggestions from the surrounding community, industry, and environmental groups throughout the comment period.
It is important to keep in mind, that based on the data available, the following limitations of this evaluation: census data is from 2010 and may be outdated; the more recent American Community Survey data through 2018 are estimates; the U.S. EPA’s EJSCREEN does not provide all of the data categories that were used in this analysis so the census tract and county data cannot be compared to the radius evaluating the facility boundary; and census tracts can be large areas that do not identify exact locations of each population.
The Department has prepared this overview of the demographic and socioeconomic data of the communities surrounding the four animal feeding operations that have applied for modifications to their existing animal waste management permits, associated with the Align RNG, LLC facility to foster communication prior to the Division of Water Resource's final action on the permit modifications.
DRAFT Environmental Justice Report Swine Farm Permit Modifications
December 22, 2020
P a g e | 2
2 Environmental Justice Evaluation Environmental justice is the fair treatment and meaningful involvement of all people regardless of race, color, national origin, or income, with respect to the development, implementation, and enforcement of environmental laws, regulations, and policies (US EPA). This evaluation examines the demographic and environmental conditions in Sampson and Duplin Counties, as well as census tracts 903, 908.01, 9710, and 9701, and the one-mile buffer around the property boundary of the proposed Align RNG, LLC facility. Finally, the demographics of the entire state of North Carolina are also considered as they compare to both the county and local census tract and radius settings.
The Department has assessed the permit modification applications and the composition of the communities surrounding the facility as proposed in the permit application. Accordingly, this Draft Environmental Justice Report includes:
• Overview of the permit modifications submitted by four animal feeding operations • Study of area demographics [determined by utilizing the US EPA Environmental Justice
tool (EJSCREEN) https://ejscreen.epa.gov/mapper/ and current, available census data. http://factfinder.census.gov/faces/nav/jsf/pages/index.xhtml]
• Comparison of local area demographics to both county and statewide census data • County health assessment • Surrounding sensitive receptors • Local industrial sites (using the NCDEQ Community Mapping System
https://ncdenr.maps.arcgis.com/apps/webappviewer/index.html?id=1eb0fbe2bcfb4cccb3cc212af8a0b8c8).
Demographics (including race and ethnicity, poverty status, and per capita incomes) for Sampson and Duplin counties will be compared to the local (census tracts and project radius) level data to identify any disparities surrounding the project area. Using standard environmental justice guidelines from the EPA and National Environmental Policy Act (NEPA) documentation, the following conditions will be flagged as potential communities of concern:
• 10% or more in comparison to the county or state average
• 50% or more minority
• 5% or more in comparison to the county or state average for poverty
DRAFT Environmental Justice Report Swine Farm Permit Modifications
December 22, 2020
P a g e | 3
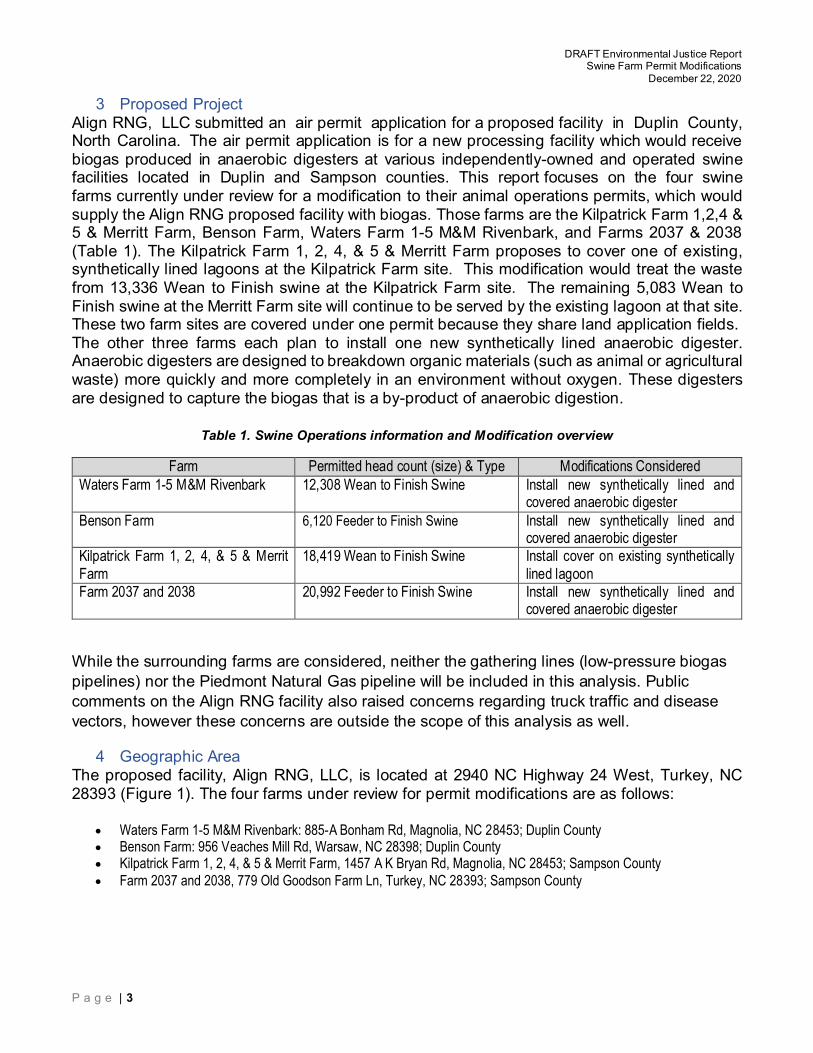
3 Proposed Project Align RNG, LLC submitted an air permit application for a proposed facility in Duplin County, North Carolina. The air permit application is for a new processing facility which would receive biogas produced in anaerobic digesters at various independently-owned and operated swine facilities located in Duplin and Sampson counties. This report focuses on the four swine farms currently under review for a modification to their animal operations permits, which would supply the Align RNG proposed facility with biogas. Those farms are the Kilpatrick Farm 1,2,4 & 5 & Merritt Farm, Benson Farm, Waters Farm 1-5 M&M Rivenbark, and Farms 2037 & 2038 (Table 1). The Kilpatrick Farm 1, 2, 4, & 5 & Merritt Farm proposes to cover one of existing, synthetically lined lagoons at the Kilpatrick Farm site. This modification would treat the waste from 13,336 Wean to Finish swine at the Kilpatrick Farm site. The remaining 5,083 Wean to Finish swine at the Merritt Farm site will continue to be served by the existing lagoon at that site. These two farm sites are covered under one permit because they share land application fields. The other three farms each plan to install one new synthetically lined anaerobic digester. Anaerobic digesters are designed to breakdown organic materials (such as animal or agricultural waste) more quickly and more completely in an environment without oxygen. These digesters are designed to capture the biogas that is a by-product of anaerobic digestion.
Table 1. Swine Operations information and Modification overview
Farm Permitted head count (size) & Type Modifications Considered Waters Farm 1-5 M&M Rivenbark 12,308 Wean to Finish Swine Install new synthetically lined and
covered anaerobic digester Benson Farm 6,120 Feeder to Finish Swine
Install new synthetically lined and covered anaerobic digester
Kilpatrick Farm 1, 2, 4, & 5 & Merrit Farm
18,419 Wean to Finish Swine Install cover on existing synthetically lined lagoon
Farm 2037 and 2038 20,992 Feeder to Finish Swine Install new synthetically lined and covered anaerobic digester
While the surrounding farms are considered, neither the gathering lines (low-pressure biogas pipelines) nor the Piedmont Natural Gas pipeline will be included in this analysis. Public comments on the Align RNG facility also raised concerns regarding truck traffic and disease vectors, however these concerns are outside the scope of this analysis as well.
4 Geographic Area The proposed facility, Align RNG, LLC, is located at 2940 NC Highway 24 West, Turkey, NC 28393 (Figure 1). The four farms under review for permit modifications are as follows:
• Waters Farm 1-5 M&M Rivenbark: 885-A Bonham Rd, Magnolia, NC 28453; Duplin County • Benson Farm: 956 Veaches Mill Rd, Warsaw, NC 28398; Duplin County • Kilpatrick Farm 1, 2, 4, & 5 & Merrit Farm, 1457 A K Bryan Rd, Magnolia, NC 28453; Sampson County • Farm 2037 and 2038, 779 Old Goodson Farm Ln, Turkey, NC 28393; Sampson County

DRAFT Environmental Justice Report Swine Farm Permit Modifications
December 22, 2020
P a g e | 4
Figure 1. Facility location (Align RNG, LLC) with the four swine facilities applying for permit modifications.
Regional Setting The four swine facilities are located in Duplin and Sampson counties in four census tracts. Both Sampson and Duplin counties are designated as Tier 1 counties. Tier 1 counties encompass the 41 most distressed counties based on average unemployment rate, median household income, percentage growth in population, and adjusted property tax per capita. The swine facilities are located in two census tracts in Duplin County – census tracts 902 (Benson Farm) and 908.01 (Waters Farm), and two in Sampson County – census tracts 9701 (Farms 2037 &2038) and 9710 (Kilpatrick Farm) (Figure 2). Census tracts are small, relatively
Kilpatrick Farm Waters Farm
Farms 2037 & 2038
Benson Farm

DRAFT Environmental Justice Report Swine Farm Permit Modifications
December 22, 2020
P a g e | 5
permanent statistical subdivisions of a county with a unique numeric code (US Census Bureau). According to the North Carolina Commission of Indian Affairs, Sampson County is identified as an area where the State-recognized Coharie Tribe resides.
Figure 2. Census tracts of Sampson and Duplin counties, highlighting the four included in this report.
Sampson County
Duplin County

DRAFT Environmental Justice Report Swine Farm Permit Modifications
December 22, 2020
P a g e | 6
Table 2. Regional Setting - Race and Ethnicity
North Carolina Duplin County Sampson County Estimate Percent Estimate Percent Estimate Percent Total: 9,535,483 100.00 58,505 100.00 63,431 100.00 Not Hispanic or Latino: 8,735,363 91.61 46,446 79.39 52,991 83.54
White alone 6,223,995 65.27 30,959 52.92 33,754 83.54 Black or African American alone 2,019,854 21.18 14,640 25.02 16,948 26.72
American Indian and Alaska Native alone 108,829 1.14 173 0.30 1,130 1.78
Asian alone 206,579 2.17 135 0.23 217 0.34
Native Hawaiian and Other Pacific Islander alone 5,259 0.06 28 0.05 43 0.07
Some other race alone 15,088 0.16 46 0.08 81 0.13 Two or more races: 155,759 1.63 465 0.79 818 1.29 Hispanic or Latino: 800,120 8.39 12,059 20.61 10,440 16.46
Source: US Census Bureau, 2010 Census All bolded and orange cells indicate a difference that is greater than 10% when compared to the state.

DRAFT Environmental Justice Report Swine Farm Permit Modifications
December 22, 2020
P a g e | 7
Table 3a. Local Setting – Race and Ethnicity
Subject Census Tract 902, Duplin County, North
Carolina
Census Tract 908.01, Duplin County, North
Carolina
Census Tract 9701, Sampson County,
North Carolina
Census Tract 9710, Sampson County,
North Carolina Estimate Percent Estimate Percent Estimate Percent Estimate Percent Total: 4,341 100.00 3,220 100.00 7,110 100.00 5,429 100.00 Not Hispanic or Latino: 3,293 75.86 1,920 59.63 5,362 75.41 4,159 76.61 White alone 2,138 49.25 930 28.88 3,388 47.65 1,941 35.75 Black or African American alone 1,087 25.04 940 29.19 1,838 25.85 2,116 38.98
American Indian and Alaska Native alone 15 0.35 9 0.28 51 0.72 25 0.46
Asian alone 10 0.23 3 0.09 10 0.14 13 0.24 Native Hawaiian and Other Pacific Islander alone
4 0.09 3 0.09 5 0.07 3 0.06
Some other race alone 2 0.05 9 0.28 8 0.11 2 0.04 Two or more races: 37 0.85 26 0.81 62 0.87 59 1.09 Hispanic or Latino: 1,048 24.14 1300 40.37 1,748 24.59 1270 23.39 Source: US Census Bureau, 2010 Census All bolded and orange cells indicate a difference that is greater than 10% when compared to the state. All bolded and blue cells indicate a difference that is greater than 10% when compared to the county and state.
Table 3b. Local Setting; one-mile radius – Race and Ethnicity
Subject Waters Farm Project
Area- 1-mile Buffer
Benson Farms Project Area-
1-mile Buffer
Kilpatrick Farm Project Area-
1-mile Buffer
Farms 2037 and 2038 Project Area- 1-mile Buffer
Estimate Percent Estimate Percent Estimate Percent Estimate Percent Total: 25 100.00 114 100.0 103 100.00 407 100.00 Not Hispanic or Latino: 12 50.00 91 20.0 74 72.00 337 83.00 White alone 6 24.00 51 45.0 43 42.00 189 46.00 Black or African American alone 6 25.00 38 33.0 29 29.00 145 36.00 American Indian and Alaska Native alone
0 0.00 1 1.0 1 0.00 1 0.00
Asian alone 0 0.00 0 0.0 0 0.00 1 0.00 Native Hawaiian and Other Pacific Islander alone
0 0.00 0 0.0 0 0.00 1 0.00
Some other race alone 10 42.00 19 16.0 23 22.00 54 13.00 Two or more races: 0 0.00 2 2.0 2 2.00 5 1.00 Hispanic or Latino: 13 50.00 23 20.0 29 28.00 70 17.00 Total Minority 76.00 55.0 58.00 54.00 Source: US Census Bureau, 2010 Census; obtained through EJSCREEN All bolded and orange cells indicate a difference that is greater than 10% when compared to the state. All bolded and blue cells indicate a difference that is greater than 10% when compared to the county and state.

DRAFT Environmental Justice Report Swine Farm Permit Modifications
December 22, 2020
P a g e | 8
Table 4. Poverty Status – Regional Setting
Subject
North Carolina Duplin County
Total Below poverty level Percent below poverty level Total Below poverty level Percent below
poverty level
Estimate Margin of Error +/- Estimate Margin of
Error +/- Estimate Margin of Error
+/- Estimate Margin of
Error +/- Estimate Margin of Error +/- Estimate Margin of
Error +/-
Population for whom poverty status is determined 9,881,292 1,522 1,523,949 15,319 15.4% 0.2 58382 253 14,056 1,394 24.1% 2.4 AGE
Under 18 years 2,258,876 1,607
498,013
7,632 22.0% 0.3
14,023
193
5,260
716 37.5%
5 18 to 64 years 6,092,009 1,103 884618 9,282 14.5% 0.2 34336 161 7,431 809 21.6% 2.4 65 years and over 1,530,407 995 141,318 2,705 9.2% 0.2 10023 171 1365 284 13.6% 2.8 SEX Male 4,779,533 2,237 669,307 8,648 14.0% 0.2 28491 161 6434 830 22.6% 2.9 Female 5,101,759 2,244 854,642 8,676 16.8% 0.2 29891 194 7,622 778 25.5% 2.6 RACE/ETHNICITY White 6,829,742 8,193 823,258 11,150 12.1% 0.2 41366 454 8,964 1,275 21.7% 3 Black or African American 2,096,490 5,812 493,496 8,392 23.5% 0.4 14158 373 3,842 618 27.1% 4.2 American Indian and Alaska Native 117,702 1,595 29,577 1,585 25.1% 1.3 131 117 0 29 0.0% 23.2 Asian 275,301 1,983 32,712 2,356 11.9% 0.9 160 72 7 11 4.4% 6.7 Native Hawaiian and Other Pacific Islander 6,414 671 1,246 264 19.4% 4.2 46 53 0 29 0.0% 45.4 Some other race 302,934 7,911 89,305 5,371 29.5% 1.5 1551 472 902 423 58.2% 18.4 Two or more races 252,709 6,223 54,355 2,369 21.5% 0.8 970 364 341 208 35.2% 17.3 Hispanic or Latino origin (of any race) 915,426 901 260,607 5,682 28.5% 0.6 12871 29 5,805 1,024 45.1% 7.9 All individuals below: 50 percent of poverty level 663,550 10,829 5254 932 125 percent of poverty level 2,034,827 19,447 19381 1,727 150 percent of poverty level 2,526,688 21,681 24374 1,483 185 percent of poverty level 3,227,889 24,339 29218 1,609 200 percent of poverty level 3,513,670 25,035 31004 1,650

DRAFT Environmental Justice Report Swine Farm Permit Modifications
December 22, 2020
P a g e | 9
Subject
North Carolina Sampson County
Total Below poverty level Percent below poverty level Total Below poverty level Percent below
poverty level
Estimate Margin of Error +/- Estimate Margin of
Error +/- Estimate Margin of Error
+/- Estimate
Margin of Error
+/- Estimate
Margin of Error
+/- Estimate
Margin of Error
+/- Population for whom poverty status is determined 9,881,292 1,522 1,523,949 15,319 15.4% 0.2 62,674 313 15,084 1,262 24.1% 2.0 AGE
Under 18 years 2,258,876 1,607
498,013
7,632 22.0% 0.3
15,366
169
5,607
642 36.5% 4.1 18 to 64 years 6,092,009 1,103 884618 9,282 14.5% 0.2 36,772 233 8,300 756 22.6% 2.0 65 years and over 1,530,407 995 141,318 2,705 9.2% 0.2 10,536 170 1,177 270 11.2% 2.6 SEX Male 4,779,533 2,237 669,307 8,648 14.0% 0.2 30,696 278 6,912 660 22.5% 2.1 Female 5,101,759 2,244 854,642 8,676 16.8% 0.2 31,978 137 8,172 864 25.6% 2.7 RACE/ETHNICITY White 6,829,742 8,193 823,258 11,150 12.1% 0.2 40,561 877 7,928 1,090 19.5% 2.6 Black or African American 2,096,490 5,812 493,496 8,392 23.5% 0.4 15,692 420 5,473 720 34.9% 4.4 American Indian and Alaska Native 117,702 1,595 29,577 1,585 25.1% 1.3 1,198 272 187 103 15.6% 9.0 Asian 275,301 1,983 32,712 2,356 11.9% 0.9 372 18 101 91 27.2% 24.0 Native Hawaiian and Other Pacific Islander 6,414 671 1,246 264 19.4% 4.2 0 29 0 29 - ** Some other race 302,934 7,911 89,305 5,371 29.5% 1.5 3,020 780 992 509 32.8% 12.3 Two or more races 252,709 6,223 54,355 2,369 21.5% 0.8 1,831 495 403 237 22.0% 9.9 Hispanic or Latino origin (of any race) 915,426 901 260,607 5,682 28.5% 0.6 12,187 92 4,790 817 39.3% 6.7 All individuals below: 50 percent of poverty level 663,550 10,829 5,598 887 125 percent of poverty level 2,034,827 19,447 18,830 1,385 150 percent of poverty level 2,526,688 21,681 23,188 1,278 185 percent of poverty level 3,227,889 24,339 28,055 1,293 200 percent of poverty level 3,513,670 25,035 30,086 1,314 Source: American Community Survey 5-year Estimates (2014-2018) All bolded and orange cells indicate a difference that is greater than 5% when compared to the state.

DRAFT Environmental Justice Report Swine Farm Permit Modifications
December 22, 2020
P a g e | 10
Table 5a. Poverty Status – Local Setting; Duplin County
Subject
Census Tract 902, Duplin County, North Carolina Census Tract 908.01, Duplin County, North Carolina
Total Below poverty level Percent below poverty level Total Below poverty level Percent below
poverty level
Estimate Margin of Error +/- Estimate Margin of
Error +/- Estimate Margin of Error
+/- Estimate Margin of
Error +/- Estimate Margin of Error +/- Estimate Margin of
Error +/-
Population for whom poverty status is determined 4,493 565 1,116 383 24.8% 7.5 3,035 455 899 480 29.6% 13.2
AGE Under 18 years 1,280 335 513 244 40.1% 13.4 932 306 460 315 49.4% 21.9 18 to 64 years 2,533 362 513 172 20.3% 6.8 1,796 263 381 194 21.2% 10.3 65 years and over 680 114 90 48 13.2% 7.3 307 94 58 33 18.9% 11.1 SEX Male 2,204 304 557 220 25.3% 8.7 1,421 229 350 212 24.6% 13.4 Female 2,289 354 559 228 24.4% 8.5 1,614 323 549 317 34.0% 14.7 RACE/ETHNICITY White 1,740 237 112 61 6.4% 3.4 1,914 424 658 435 34.4% 17.1 Black or African American 1,315 468 620 338 47.1% 19.2 805 200 213 148 26.5% 15.6 American Indian and Alaska Native 29 51 0 12 0.0% 57.1 91 114 - 12 0.0% 30.9
Asian - 12 0 12 - - - 12 - 12 - - Native Hawaiian and Other Pacific Islander - 12 0 12 - - - 12 - 12 - -
Some other race 135 96 37 44 27.4% 29.8 158 145 21 28 13.3% 20.9 Two or more races 60 46 2 6 3.3% 11.8 67 84 7 10 10.4% 21.8 Hispanic or Latino origin (of any race) 1,376 447 382 220 27.8% 13.5 1,446 477 684 470 47.3% 20.6
All individuals below: 50 percent of poverty level 698 322 407 365 125 percent of poverty level 1,713 571 1,159 509 150 percent of poverty level 1,951 608 1,390 515 185 percent of poverty level 2,361 581 1,614 527 200 percent of poverty level 2,475 583 1,785 523 Source: American Community Survey 5-year Estimates (2014-2018) All bolded and orange cells indicate a difference that is greater than 5% when compared to the state. All bolded and blue cells indicate a difference that is greater than 5% when compared to the state and the county.

DRAFT Environmental Justice Report Swine Farm Permit Modifications
December 22, 2020
P a g e | 11
Table 5a. Poverty Status – Local Setting; Sampson County
Subject
Census Tract 9701, Sampson County, North Carolina Census Tract 9710, Sampson County, North Carolina
Total Below poverty level Percent below poverty level Total Below poverty level Percent below
poverty level
Estimate Margin of Error +/- Estimate Margin of
Error +/- Estimate Margin of Error +/- Estimate Margin of
Error +/- Estimate Margin of Error +/- Estimate Margin of
Error +/- Population for whom poverty status is determined 7,069 600 1,823 596 25.8% 8 4941 506 1279 503 25.9% 8.6
AGE Under 18 years 1,794 320 581 264 32.4% 15 1,144 313 382 287 33.4% 20.3 18 to 64 years 4,185 442 1,220 414 29.2% 9 2877 412 741 284 25.8% 8.0 65 years and over 1,090 207 22 25 2.0% 2.4 920 174 156 93 17.0% 9.4 SEX Male 3,656 411 881 352 24.1% 9 2700 374 680 327 25.2% 9.9 Female 3,413 406 942 366 27.6% 10 2241 283 599 262 26.7% 10.1 RACE/ETHNICITY White 4,664 661 898 615 19.3% 12 2483 393 699 393 28.2% 13.1 Black or African American 1,692 296 605 287 35.8% 16 2168 280 564 340 26.0% 14.0 American Indian and Alaska Native 1 3 0 17 0.0% 100 97 113 0 12 0.0% 29.4
Asian 16 19 0 17 0.0% 77 0 12 0 12 - - Native Hawaiian and Other Pacific Islander 0 17 0 17 - ** 0 12 0 12 - -
Some other race 502 341 305 272 60.8% 39 120 165 0 12 0.0% 24.9 Two or more races 194 188 15 22 7.7% 14 73 70 16 31 21.9% 35.9 Hispanic or Latino origin (of any race) 1,848 457 823 432 44.5% 21 1197 371 392 334 32.7% 22.4
All individuals below: 50 percent of poverty level 996 450 277 202 125 percent of poverty level 2667 618 1421 507 150 percent of poverty level 2911 619 1717 568 185 percent of poverty level 3564 598 2044 616 200 percent of poverty level 3723 640 2361 597 Source: American Community Survey 5-year Estimates (2014-2018) All bolded and orange cells indicate a difference that is greater than 5% when compared to the state. All bolded and blue cells indicate a difference that is greater than 5% when compared to the state and the county.
DRAFT Environmental Justice Report Swine Farm Permit Modifications
December 22, 2020
P a g e | 12
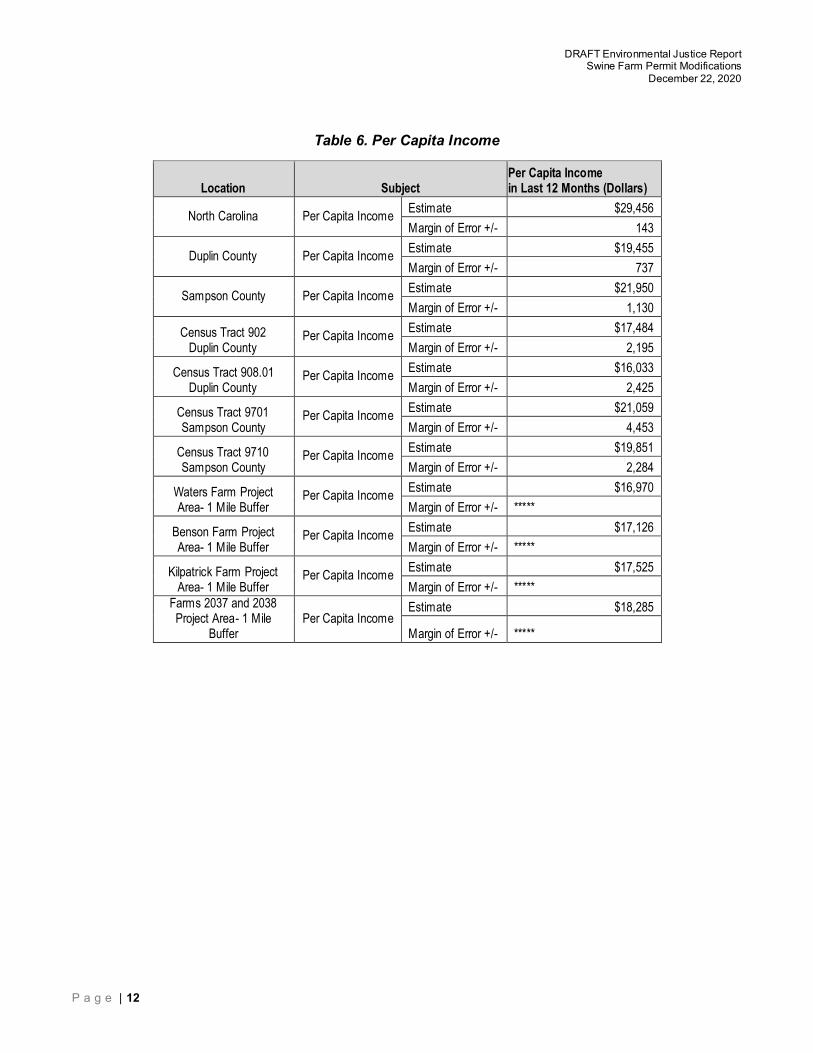
Table 6. Per Capita Income
Location Subject Per Capita Income in Last 12 Months (Dollars)
North Carolina Per Capita Income Estimate $29,456 Margin of Error +/- 143
Duplin County Per Capita Income Estimate $19,455 Margin of Error +/- 737
Sampson County Per Capita Income Estimate $21,950 Margin of Error +/- 1,130
Census Tract 902 Duplin County
Per Capita Income Estimate $17,484 Margin of Error +/- 2,195
Census Tract 908.01 Duplin County
Per Capita Income Estimate $16,033 Margin of Error +/- 2,425
Census Tract 9701 Sampson County
Per Capita Income Estimate $21,059 Margin of Error +/- 4,453
Census Tract 9710 Sampson County
Per Capita Income Estimate $19,851 Margin of Error +/- 2,284
Waters Farm Project Area- 1 Mile Buffer
Per Capita Income Estimate $16,970 Margin of Error +/- *****
Benson Farm Project Area- 1 Mile Buffer
Per Capita Income Estimate $17,126 Margin of Error +/- *****
Kilpatrick Farm Project Area- 1 Mile Buffer
Per Capita Income Estimate $17,525 Margin of Error +/- *****
Farms 2037 and 2038 Project Area- 1 Mile
Buffer Per Capita Income
Estimate $18,285
Margin of Error +/- *****

DRAFT Environmental Justice Report Swine Farm Permit Modifications
December 22, 2020
P a g e | 13
5 Limited English Proficiency (LEP) Per the Safe Harbor Guidelines, should an LEP Group be identified during the permit application process, written translations of vital documents for each eligible LEP language group that constitutes 5% or includes 1,000 members (whichever is less) of the population of persons eligible to be served or likely to be affected or encountered. If there are fewer than 50 persons in a language group that reaches the 5% trigger, then DEQ will not translate vital written materials, but instead will provide written notice in the primary language of the LEP language group of the right to receive competent oral interpretation of those written materials, free of cost. The safe harbor provisions apply to the translation of written documents only. Safe harbor guidelines are per the US EPA guidance for LEP persons, and implemented by DEQ when deemed appropriate. The population of Spanish-speakers that speak English “less than very well” is greater than 5% in all four census tracts analyzed (Table 7).
Table 7. Limited English Proficiency
Language Spoken at Home
Census Tract 902, Duplin County
Census Tract 908.01, Duplin County
Census Tract 9701, Sampson County
Census Tract 9710, Sampson County
Estimate Margin of Error Percent Estimate Margin
of Error Percent Estimate Margin of Error Percent Estimate Margin of
Error Percent
Total: 3,969 424 100 2,729 381 100 6,755 635 100 4,702 591 100
Speak only English 2,668 314 67.2% 1,602 319 58.7% 5,352 507 79.2% 3,635 443 77.3% Spanish or Spanish Creole: 1,288 444 32.5% 1,106 368 40.5% 1,396 454 20.7% 1,067 516 22.7%
Speak English "very well" 486 240 12.2% 500 279 18.3% 539 196 8.0% 445 309 9.5% Speak English less than "very well" 802 266 20.2% 606 180 22.2% 857 336 12.7% 622 297 13.2%

DRAFT Environmental Justice Report Swine Farm Permit Modifications
December 22, 2020
P a g e | 14
6 County Health
The University of Wisconsin Population Health Institute, in collaboration with the Robert Wood Johnson Foundation, calculated a County Health Rankings system for all the States in the United States (www.countyhealthrankings.org).This ranking is based on health outcomes (such as lifespan and self-reported health status) and health factors (such as environmental, social and economic conditions). According to this 2020 report, out of all 100 counties in North Carolina (with 1 indicating the healthiest), Sampson County ranks 82nd in health factors and 77th in health outcomes. Duplin County ranks 87th in health factors and 56th in health outcomes.
Figure 3. County Health Rankings for Health Factors in North Carolina provided by University of Wisconsin Public Health Institute.

DRAFT Environmental Justice Report Swine Farm Permit Modifications
December 22, 2020
P a g e | 15
7 Local Sensitive Receptors The Environmental Protection Agency suggests that sensitive receptors include, but are not limited to, hospitals, schools, daycare facilities, elderly housing, and convalescent facilities. These are areas where the occupants may be more susceptible to the adverse effects of exposure to toxic chemicals, pesticides, and other pollutants. Extra care must be taken when dealing with contaminants and pollutants in close proximity to areas recognized as sensitive receptors. For instance, children and the elderly may have a higher risk of developing asthma from elevated levels of certain air pollutants than a healthy individual aged between 18 and 64. Within a one-mile radius of each of the four swine facilities, the following potential sensitive receptors were identified through EJSCREEN and Google Maps:
• Mount Pleasant Baptist Church • Six Runs Baptist Church • A total of 209 households
Additional sensitive receptors may be identified during the permit application process, such as through receipt of public comment.
Kilpatrick Farm Waters Farm
Benson Farm Farms 2037 & 2038
39 households
33 households 130 households 2 Churches
7 households

DRAFT Environmental Justice Report Swine Farm Permit Modifications
December 22, 2020
P a g e | 16
8 Local Industrial Sites Within the one-mile buffer of Benson Farm (in Duplin County, Census Tract 902), there are 7 permitted animal feeding operations (as of December 21, 2020).
Figure 5. Permitted facilities and incidents with the one-mile radius surrounding Benson Farm.

DRAFT Environmental Justice Report Swine Farm Permit Modifications
December 22, 2020
P a g e | 17
Figure 6. Permitted facilities and incidents with the one-mile radius surrounding Kilpatrick Farm Within the one-mile buffer of Kilpatrick Farm (in Sampson County/Census Tract 9710), there are 4 permitted animal feeding operations (as of December 21, 2020).

DRAFT Environmental Justice Report Swine Farm Permit Modifications
December 22, 2020
P a g e | 18
Figure 7. Permitted facilities and incidents with the one-mile radius surrounding Waters Farm
Within the one-mile buffer of Waters Farm (in Duplin County, Census Tract 908.01), there are 2 air quality permit sites, and 10 permitted animal feeding operations (as of December 21, 2020).

DRAFT Environmental Justice Report Swine Farm Permit Modifications
December 22, 2020
P a g e | 19
Figure 8. Permitted facilities and incidents with the one-mile radius surrounding Farms 2037 and 2038. Within the one-mile buffer of Farms 2037 and 2038 (in Sampson County, Census Tract 9701), there are 3 permitted animal feeding operations, 1 air quality permitted facility, 1 permitted NPDES waste water treatment facility, 1 hazardous waste site, and 1 reported above ground storage tank incident (as of December 21, 2020).

DRAFT Environmental Justice Report Swine Farm Permit Modifications
December 22, 2020
P a g e | 20
9 Conclusion The Draft EJ Report is an initial evaluation of the demographics and socioeconomics of the community area surrounding a proposed facility or permit modification. This includes information within a one-mile radius on race and ethnicity (decennial census year), poverty, per capita income, and ability to speak English (most current ACS census range), current NC Department of Commerce county tier designation, and presence or absence of American Indian Tribal areas. The Draft EJ Report does not include a reconnaissance of the community. The proposed Align RNG, LLC [gathering (or however it is described in the AQ EJ report] facility and four farms reviewed in this report are located in an area designated with moderate health factors and outcomes in comparison to other areas of the state.
The study area displays higher percentages of African-American and Hispanic residents as compared to the state, and in some cases, the county as well. The study area also exhibits higher poverty levels than the state, and the county in some instances. One potential LEP language group (Spanish) meets the 5% threshold for Safe Harbor Guidelines. Extra attention will also be given to ensure language data is accurate and translation or interpretation services will be considered for essential documents and for the planned public meeting. Finally, the list of sensitive receptors will be consulted while considering additional outreach options that may best fit this community’s needs.
Based on this Draft EJ Report, DEQ will provide the following outreach and opportunities for meaningful involvement:
1) Publish the notice for soliciting public comments and information on the scheduled public meeting in newspapers in both Sampson and Duplin counties
2) Translate the public notice into Spanish and publish the notice on the DEQ Website 3) Create a one-page flyer describing the project using language that is easy–to-understand 4) Create both an English and Spanish dedicated voicemail line to receive public comments
by phone 5) Evaluate and implement, as appropriate, alternative methods to reach the Spanish-
speaking community, such as advertising on Spanish language radio stations and social media?
6) Consult with local community organizations on best outreach methods 7) Provide project information to and consultation with the Coharie Indian Tribe 8) Announce reminders through social media


![swine flu kbk-1.ppt [Read-Only]ocw.usu.ac.id/.../1110000141-tropical-medicine/tmd175_slide_swine_… · MAP of H1 N1 Swine Flu. Swine Influenza (Flu) Swine Influenza (swine flu) is](https://static.fdocuments.in/doc/165x107/5f5a2f7aee204b1010391ac9/swine-flu-kbk-1ppt-read-onlyocwusuacid1110000141-tropical-medicinetmd175slideswine.jpg)