Swift Parrot Breeding Season Survey Report 2008/09
26
Threatened Species Section Biodiversity Conservation Branch Department of Primary Industries, Parks, Water and Environment Swift Parrot Breeding Season Survey Report 2008/09
Transcript of Swift Parrot Breeding Season Survey Report 2008/09

Threatened Species Section Biodiversity Conservation Branch Department of Primary Industries, Parks, Water and Environment
Swift Parrot Breeding Season Survey Report 2008/09

2
Executive Summary The swift parrot, Lathamus discolor, is an endangered migratory species which breeds exclusively in Tasmania each year, often in areas of high economic value. The distribution of swift parrots during the breeding season is highly variable from year to year, so that monitoring and conservation planning for this species can be a challenging task. The primary factor that drives this variability appears to be the flowering patterns of Eucalyptus globulus and Eucalyptus ovata, which provide the primary food resource for breeding swift parrots. Spatial and temporal patchiness in flowering may create dramatic changes in the quality and/or availability of breeding habitat each year. A large proportion of the swift parrot population may therefore be concentrated around areas of abundant flowering. These breeding sites are used intermittently, which appears to be related to whether the site is flowering. This may only occur every few years which creates difficulties in identifying important sites (Webb, 2008) The surveys carried out in the 2008/09 breeding season were focussed on the Wielangta area in the southern east coast of Tasmania. The methods used were based on those developed in the 2007/08 season by Webb (2008). The surveys confirmed the link between swift parrot presence and that of eucalypt flowering (which was more profuse towards the southern and central parts of the area) and areas mapped with forest senescence. Nests were found in aggregations with some of them in similar areas as in previous years. All nests were found in trees >80cm DBH and in close proximity to Eucalyptus globulus flowering. Intensive nest searching at selected sites indicated high densities which could potentially have been present in other areas not surveyed with the same amount of effort. As eucalyptus flowering varies spatially and temporally, these surveys are a snapshot of how swift parrots used habitats in the Wielangta area in this season alone.
The surveys and existing mapping highlight the great abundance of resources important to swift parrot breeding in the Wielangta area. Refinement of mapping (particularly that of E. globulus distribution) will allow more accurate identification of important habitats in the area.
Brief assessments of swift parrot abundance were carried out outside the Wielangta area in areas where they have been found in previous breeding seasons. These surveys located large numbers of swift parrots and intense flowering events in the south of the Tasman Peninsula and the North of Bruny Island, with two nests found opportunistically on Tasman Peninsula and in the Meehan Range.
Front Cover Photo: David James

3
Table of Contents Executive Summary ............................................................................................................................................... 2
1. Background ....................................................................................................................................................... 4
2. Aims .................................................................................................................................................................. 4
3. Methods ............................................................................................................................................................ 6 Study area ............................................................................................................................................................. 6 Five minute surveys .............................................................................................................................................. 6 Nest Searches........................................................................................................................................................ 7 Opportunistic observations .................................................................................................................................. 9 Regional scouting surveys. .................................................................................................................................... 9
4. Results ............................................................................................................................................................ 10 Five minute surveys ............................................................................................................................................ 10 Nest searches ...................................................................................................................................................... 17 Opportunistic observations. ............................................................................................................................... 17 Regional scouting surveys. .................................................................................................................................. 22 Nests outside the Wielangta area. ...................................................................................................................... 23
5. Discussion ....................................................................................................................................................... 24 Swift parrot abundance. ..................................................................................................................................... 24 Swift parrot nesting ............................................................................................................................................ 24 Regional Scouting Surveys .................................................................................................................................. 25
6. Acknowledgements ........................................................................................................................................ 25
7. References ...................................................................................................................................................... 26
4
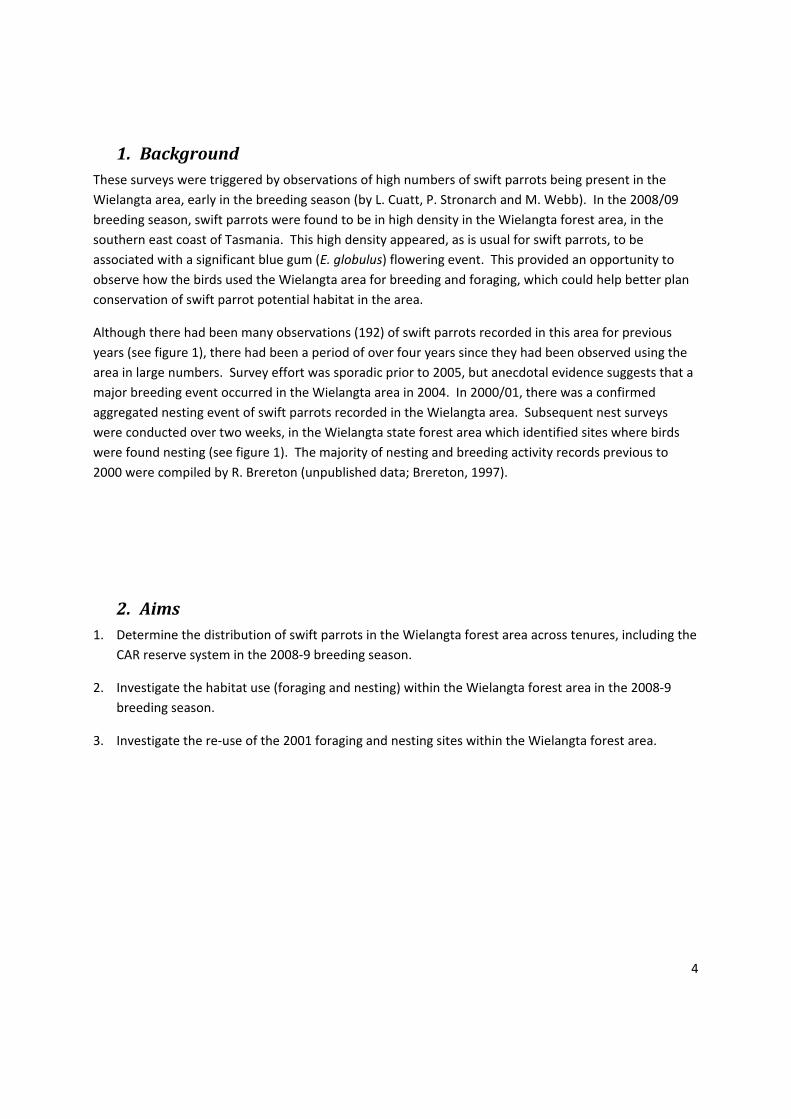
1. Background These surveys were triggered by observations of high numbers of swift parrots being present in the Wielangta area, early in the breeding season (by L. Cuatt, P. Stronarch and M. Webb). In the 2008/09 breeding season, swift parrots were found to be in high density in the Wielangta forest area, in the southern east coast of Tasmania. This high density appeared, as is usual for swift parrots, to be associated with a significant blue gum (E. globulus) flowering event. This provided an opportunity to observe how the birds used the Wielangta area for breeding and foraging, which could help better plan conservation of swift parrot potential habitat in the area.
Although there had been many observations (192) of swift parrots recorded in this area for previous years (see figure 1), there had been a period of over four years since they had been observed using the area in large numbers. Survey effort was sporadic prior to 2005, but anecdotal evidence suggests that a major breeding event occurred in the Wielangta area in 2004. In 2000/01, there was a confirmed aggregated nesting event of swift parrots recorded in the Wielangta area. Subsequent nest surveys were conducted over two weeks, in the Wielangta state forest area which identified sites where birds were found nesting (see figure 1). The majority of nesting and breeding activity records previous to 2000 were compiled by R. Brereton (unpublished data; Brereton, 1997).
2. Aims 1. Determine the distribution of swift parrots in the Wielangta forest area across tenures, including the
CAR reserve system in the 2008‐9 breeding season.
2. Investigate the habitat use (foraging and nesting) within the Wielangta forest area in the 2008‐9 breeding season.
3. Investigate the re‐use of the 2001 foraging and nesting sites within the Wielangta forest area.

5
Figure 1 shows the Wielangta area with swift parrot records available before the start of the current surveys. Records include nests and breeding activity from 2001 (NVA) and previous years (unpublished) along with observations of swift parrots recorded on the Natural Values Atlas (NVA). The NVA records from previous years are supplemented by observations from early in the 2008 breeding season (by L. Cuatt, P. Stronarch and M. Webb).

6
3. Methods The methods used for this survey were based on those developed by Webb (2008) to assess the habitat use by swift parrots in the Southern Forests for the 2007/08 season. The method used by Webb (2008) was based on 5 minute counts of numbers of swift parrots and 2 hour searches for nests and breeding activities. One difference between the two surveys is that while Webb (2008) surveyed plots twice, the current survey only surveyed each point once. Another difference was the nest searches were carried out earlier because the breeding activity seemed to peak earlier than in 2007/08 (Webb 2008) and other years. Relying on calls or sightings means that not all swift parrots present are detected. The probability of detecting swift parrots (in 5 minute surveys) or active nests (in 2 hour searches) is increased when there are several (birds or nesting pairs) as opposed to one. Therefore, results should not be interpreted as definitive numbers, only indications of relative numbers. In particular, two hours is not enough survey time to confirm the absence of nests (Webb, 2008).
Study area The study targeted an area between Orford and Marion Bay, and up to 10 kilometres inland from the coast (Figure 1).
The study area is defined as the polygon encapsulating the survey points (see figure 5).
The survey area is the area within the study area where swift parrots could potentially be observed during the survey, consisting of the sum of circles of 200m radius of 5 minute surveys.
Five minute surveys Five‐minute surveys for the presence of swift parrots and the level of E. globulus and/or E. ovata flowering were carried out at 126 sites on public and private land by three observers working separately over a period between 27/10/2008 and 13/12/2008 (see figures 2 & 4). All sites were at least 500m apart and were selected by targeting areas of mature forest but also to:
• cover the area as evenly as possible (which was only partially achieved due to a bias towards locations with relatively easy access).
• get a representation from all the tenures within the study area (e.g. public, reserve, private).
Sites were only surveyed under suitable conditions to detect swift parrots (i.e. little or no wind and no heavy rain). The observers who conducted the surveys were David James, Shaun Thurstans and Alan Wiltshire.

7
The following information was collected at each site:
• GPS coordinate (GDA)
• Number of swift parrots seen or heard within 200m of the site that were stationary (i.e. not flying over) for at least some of the survey period.
• Stand age, where 1 =plantation, regrowth or mature with no hollows, 2 = retained vegetation in production forest (eg. Wildlife Habitat Clumps, Wildlife Habitat Strips, Streamside Reserves), paddock trees or remnants with no hollows, 3 = retained vegetation in production forest, paddock trees or remnants with senescent trees, 4 =sparse/scattered senescent trees over regrowth or mature, 5 = senescent forest (may have regrowth element).
• Presence/absence of E. globulus or E. ovata.
• Flowering intensity of up to 20 E. globulus (0=virtually none, 1=light, 2= moderate, 3=heavy, 4=very heavy).
• Forest community type (as per Harris and Kitchener, 2005).
Nest Searches Two hour surveys for active swift parrot nests were conducted at a selection of sites where observers had observed breeding activity and/or senescent trees. It is important to recognise that site selection was haphazard rather than in a standardised statistical format, so that the results of these searches should be treated as pointers rather than conclusive.
The sites were theoretically bounded by a 200m radius from a central point, within which movement occurred to record nests precisely. The primary objective of nest searches was to confirm that swift parrots were breeding in the study area. A secondary objective was to ascertain what density of nests was apparent in a small subset of the study area, to give an indication of the potential density in other parts of the study area. This approach led to a concentration of searches in an area around Mount Walter. Of the 29 surveys carried out, 15 were in the Mount Walter area, with the remainder in other parts of the study area. The surveys were carried out from 12/11/2008 to 17/12/2008.

8
The following information was collected at most nest sites: As developed by Webb, Holdsworth and Webb (in prep.)
(Not recorded at some nests found early in the survey period.)
• GPS coordinate (GDA)
• Nest tree > Species > Diameter at Breast Height (DBH) > Number of potential hollows observed from all angles from the ground using
binoculars (with an estimated entrance size of 4 cm or greater) > Fire scars (0= none, 1= burnt bark, 2= damage to vascular cambium, 3 = large
hollow in base of tree) > Presence/absence of major branching > Presence/absence of dead limbs > 15cm diameter > Percentage of dead branches (1= 0‐5%, 2=5‐20%, 3=20‐50%, 4= >50%) > Visual tree health (1= healthy, 2 = generally healthy with some dieback, 3 =
showing clear signs of senescence, 4 = advanced senescence, 5 = dead and standing)
> Tree form (1 = apically dominant or rounded crown, 2 = distinct gaps in crown, 3 = dead limbs penetrating a disjunct crown, 5 = dead limbs penetrating almost dead crown, 6 = dead stag)
• Aspect (N, NE, E, SE, S, SW ,W, NW)
• Topographic position (gully, lower slope, mid slope, upper slope, ridge)
• Ground slope (1 = 0‐5°, 2 = 6‐10°, 3 = 11‐15°, 4 = >15°)
The following attributes were extracted from GIS layers for each site (courtesy of Forestry Tasmania):
• Mature forest density (% crown density) (PI type data)
• Level of forest senescence (SenCode eucalypt senescence layer1)
• Tenure
1 SenCode is a map of senescence developed through aerial photography, assessing tree crown attributes using features described by Jacobs (1955) such as shrinking crowns, bayonet branches and missing branches (Commonwealth of Australia and State of Tasmania 1996).

9
Opportunistic observations Several observations of active nests and breeding activity were recorded during the time between the conduct of five minute surveys and two hour nest searches. This supplemented the information from the discrete surveys and provided an impression of breeding and density of nests in other areas within the study area.
Regional scouting surveys. Brief surveys were carried out in other areas of south eastern Tasmania previously recorded as having high densities of swift parrots. The objective of these surveys was to assess where else the species may have been breeding outside the Wielangta area in the 2008‐09 season.

10
4. Results
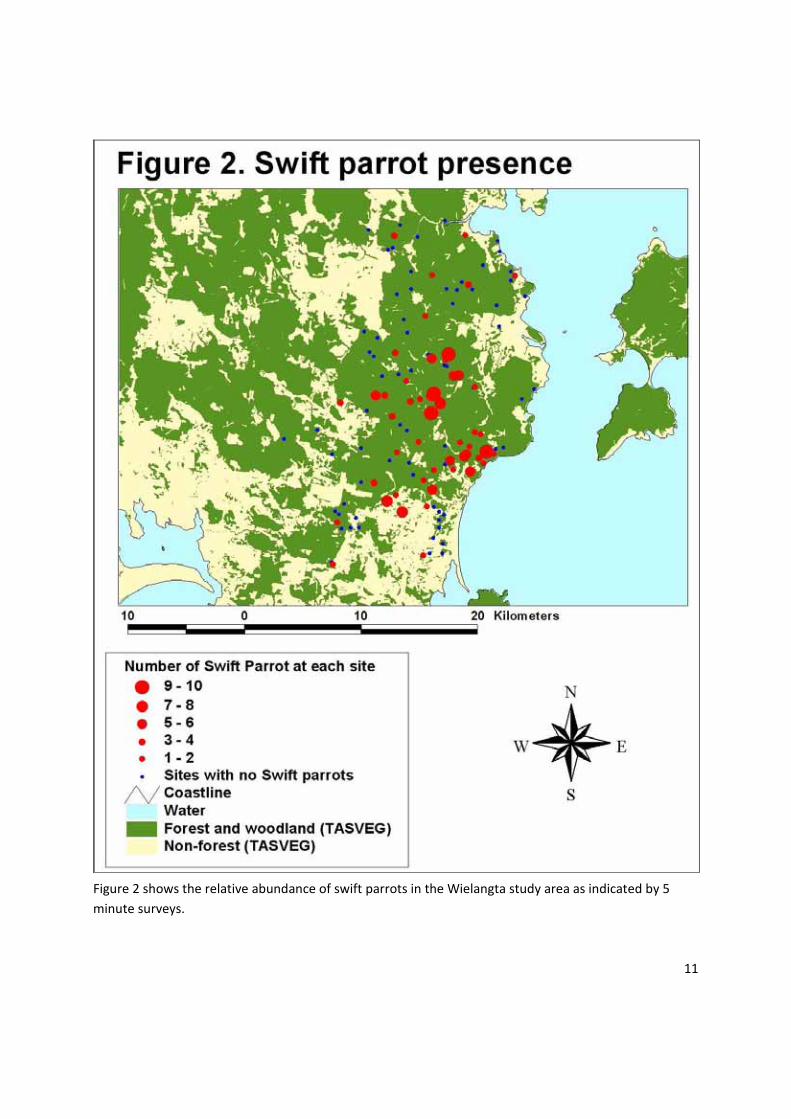
Five minute surveys A total of 187 swift parrot observations were recorded at 54 of the 126 sites visited. The mean number of birds per site, where they were observed was 3.5 with a range of 1 – 10 (see figure 2). E. globulus was recorded at 100 of the 126 sites, of which 53% (n=53) were found to have flowering. E. ovata was only recorded at one site, alongside E. globulus, and was not flowering. Swift parrots were found at 66% (n=35) of those sites with flowering and 27% (n=20) of those sites where flowering was absent (n=74). All of these sites (n=20) supported senescent trees and 30% (n=6) were classified as senescent forest.
Table 1 summarises the presence of swift parrots in relation to stand age and presence of flowering.
No. of sites % of sites swift No. of sites with flower % of sites with flower Stand No. of swift parrots parrots (given swift parrot (given swift parrot age sites recorded recorded presence) presence)
1 2 2 100% 1 50% 2 8 4 50% 4 100% 3 21 5 24% 5 100% 4 75 32 43% 17 53% 5 21 12 57% 6 50%
Total 126 54 43% 33 60%
Table 1 shows the classification of stand age at sites, as recorded on the ground, which are also indicated in figure 3. The table indicates the bias in the selection of survey sites towards sites with senescent trees (stand ages 4 & 5). This was a reflection of the aim to capture breeding activities of the species, which are associated with hollow bearing trees. Of note in sites of stand age 4 and 5 is the relatively lesser proportion of sites with flowering given swift parrot presence. This indicates that a greater proportion of swift parrots at those sites were using the forest for non‐foraging activities and/or foraging on lerps and leaf galls. Senescent forest (stand age 5) did have a greater proportion of sites with swift parrots present when compared with forest that had only scattered senescent trees (stand age 4), which may indicate that senescent forest was more attractive to the breeding parrots.
11
Figure 2 shows the relative abundance of swift parrots in the Wielangta study area as indicated by 5 minute surveys.

12
Figure 3 indicates the stand age of sites visited as recorded on the ground (as shown in table 1). Senescent forest (stand age 5) seems to be concentrated in the centre of the area, while the majority of sites had some scattered senescent trees (stand age 4). The small number of sites with none or few senescent trees possibly reflects a bias in the selection of sites.

13
Figure 4 indicates a close association with swift parrot presence and E. globulus flowering, which was more profuse towards the south and central parts of the study area. As eucalypt flowering varies spatially and temporally, these surveys are a snapshot of how swift parrots used habitats in the Wielangta area in this season alone.

14
Tables 2, 3 & 4 show information relating to the 5 minute surveys and the representation of attribute classes in the study area and the survey area.
In these tables, the ‘total areas’ and ‘% of study area’ columns illustrate the proportions of different classes in the study area (see figure 5). The number of surveys is shown for each class, and converted to
area surveyed by multiplying the number of surveys by the area of a 5 minute survey (∏ x [200m]2 = 12.57 hectares). These areas surveyed are then expressed as
> percentage of the extent of each class present in the study area (with the total figure being the percentage of the whole study area) &
> percentage of the total survey area (which can be compared with the ‘% of study area’ for an assessment of how well the proportions were sampled)
Table 2: Mature forest density
Mature forest density
Total areas (ha)
% of study area
(45983 ha) No. of surveys
Area surveyed
(ha)
% of area of class surveyed
% of survey area
No. swift parrots
Mature Forest (20‐100%) 21595 47% 100 1257 5.8% 79% 151
Mature Forest (5‐20%) 4891 11% 13 163 3.3% 10% 13
Regrowth, non‐forest, plantation 19497 42% 13 163 0.8% 10% 23
Total 45983 100% 126 1583 3.4% 100% 187
Table 2 shows data for the study area as represented by PI type forest data (photo interpreted forest type), simplified into three categories: mature crown densities 20‐100%, 5‐20%, and all other areas. It is evident that the surveys (which covered only 3.4% of the study area) were biased towards areas with greater crown density of mature forest and away from regrowth forest and non‐forest.
15
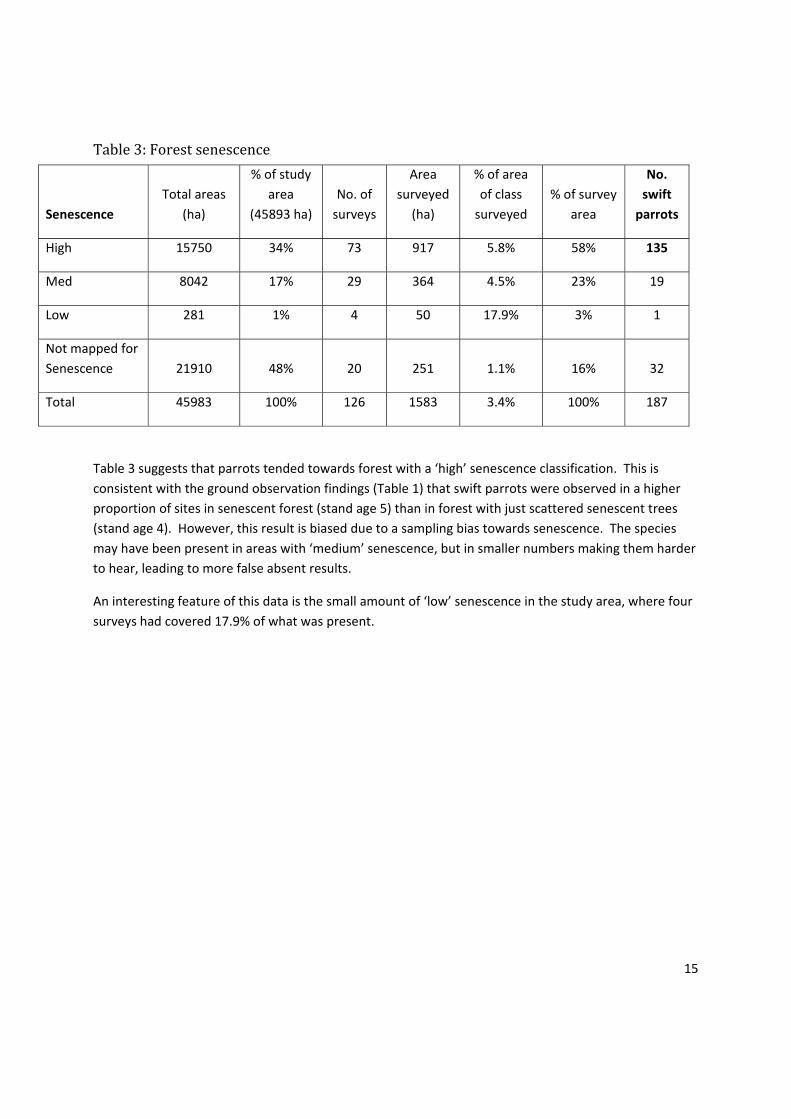
Table 3: Forest senescence
Senescence Total areas
(ha)
% of study area
(45893 ha) No. of surveys
Area surveyed
(ha)
% of area of class surveyed
% of survey area
No. swift parrots
High 15750 34% 73 917 5.8% 58% 135
Med 8042 17% 29 364 4.5% 23% 19
Low 281 1% 4 50 17.9% 3% 1
Not mapped for Senescence 21910 48% 20 251 1.1% 16% 32
Total 45983 100% 126 1583 3.4% 100% 187
Table 3 suggests that parrots tended towards forest with a ‘high’ senescence classification. This is consistent with the ground observation findings (Table 1) that swift parrots were observed in a higher proportion of sites in senescent forest (stand age 5) than in forest with just scattered senescent trees (stand age 4). However, this result is biased due to a sampling bias towards senescence. The species may have been present in areas with ‘medium’ senescence, but in smaller numbers making them harder to hear, leading to more false absent results.
An interesting feature of this data is the small amount of ‘low’ senescence in the study area, where four surveys had covered 17.9% of what was present.

16
Figure 5. Swift parrot observations, nests and breeding activity on tenure.
Figure 5 illustrates the study area polygon (as referred to in tables 2, 3 and 4) with land tenure, roads and the results from the 5 minute surveys and the 2 hour searches.

17
Table 4: Tenure
Tenure Total areas
(ha)
% of study area
(45896 ha) No. of surveys
Area surveyed
(ha)
% of area of class surveyed
% of survey area
No. swift parrots
Private Land 30665 67% 61 767 2.5% 48% 56
Private Reserve 1225 3% 6 75 6.2% 5% 5
Public Land 5347 12% 21 264 4.9% 17% 47
Public Reserve 8659 19% 38 478 5.5% 30% 79
Total 45896 100% 126 1583 3.4% 100% 187
Table 4 indicates that swift parrots occurred mainly on public land, both reserved and unreserved.
Nest searches The locations of nests and breeding activity recorded from the two hour nest searches and opportunistic observations (combined) are illustrated in figure 6.
Fourteen nests were found through the 2‐hour searches at five of the 15 sites including the Mount Walter area, with breeding activities recorded at two other sites (both stand age 4). At the Mount Walter area, (classified as stand age 5 on the ground, but not mapped for senescence in the SenCode layer), the effort was concentrated, with 7 nests found from 15 two hour searches. The selection of survey sites with hollow bearing trees led to a bias in the stand age of sites searched for nests (see Table 5).
Table 5. Stand age of 2 hour searches (excluding Mount Walter sites) Stand age
No. of sites
No. of sites with nests found
No of nests found.
3 1 0 0 4 8 2 4 5 5 2 3
Opportunistic observations. A further 18 nests and 12 breeding activity records were gained opportunistically within the study area. These figures include 8 nests and one breeding activity record from the Mount Walter area.

18
In total, 32 nests were found and 14 breeding activity records observed in the study area (see figure 6). Of this total 16 nests and one breeding activity record were from the Mount Walter area, which had a density of 1.4 nests per hectare (see figure 6).
Of 26 nests where data was recorded:
• 17 E. obliqua nest trees were found in wet E. obliqua and dry E. obliqua forest as well as dry E. pulchella forest (DBH range 0.8m ‐1.91m).
• 6 E. globulus nest trees were found in dry E. globulus, dry E. obliqua and dry E. pulchella forests (DBH range 1.0m – 1.4m).
• 3 E. regnans nest trees were found in wet E. obliqua forest (DBH range 1.27m – 1.8m).
The number of potential hollows in each nest tree ranged from 1 to 12, with 62% (n=16) having 5 or more potential hollows.

19
The nests and breeding activity from these surveys are shown in figure 6 along with those from 2001 and before. They illustrate the aggregations of nests and the close relationship of nesting and areas mapped as senescent forest by SenCode.

20
Tables 6, 7, 8 & 9 show the distribution of 46 nests and breeding activity sites from both 2 hour searches and opportunistic observations and the proportions of attribute classes in terms of the entire study area.
Table 6. Nests and mature forest density.
Mature density Total areas (ha) % of study area (45983 ha)
No. of nests/breeding activity
Mature Forest (20‐100%) 21595 47% 40
Mature Forest (5‐20%) 4891 11% 4
Regrowth, non forest, plantation 19497 42% 2
Total 45983 100% 46
The data in Table 6 suggest that forest with mature density of 20 – 100% is utilised for nesting more often than densities 5‐20% and non‐mature categories. Note that this study did not sample the areas with a valid representation of the densities available so this is only a suggestion.
Table 7. Nests and Senescence
Senesence Total areas (ha) % of study area (45983 ha)
No. of nests/breeding activity
High 15750 34% 27
Med 8042 17% 6
Low 281 1% 0
Not mapped for Senesence. 21910 48% 13
Total 45983 100% 46
Table 7 indicates ‘high’ and ‘med’ senescence areas capturing 71% of nests. Again with a sampling bias, this result is only a suggestion. The data here, particularly that for areas not mapped for senescence, is highly skewed by the nests found at Mount Walter, which was sampled much more intensively than other areas (11 were in areas not mapped for senescence, 4 in high senescence and 1 in medium senescence).

21
Table 8. Nests excluding Mt. Walter and Senesence
Senesence Total areas
(ha) % of study area (45895 ha)
No. of nests/breeding activity
High 15750 34% 23
Med 8041 17% 5
Low 280 0% 0
Not mapped for S 21910 47% 1
Total 45983 100% 29
Table 8 excludes those nests at Mount Walter. The proportion of nests in areas of high and medium senescence is 96%, including 79% in the high category.
Table 9. Nests and Tenure
Tenure Total areas (ha) % of study area (45895 ha)
No. of nests/breeding activity
Private Land 30665 66% 6
Private Reserve 1225 2% 0
Public Land 5347 11% 27
Public Reserve 8658 18% 13
Total 45895 100% 46
Table 9 Including those breeding records on private land – a total of 33 (71%) were outside reserves.

22
Regional scouting surveys.
Table 10. Scouting surveys.
Region Minutes Surveying
Equivalent. No. of 5min Observations
Average No. of swift parrots per
5min Blue Gum Flowering
Bruny Island North 65 13 13.85 very heavy Tinderbox 15 3 9.00 heavy Tasman Peninsula 55 11 2.83 heavy flowering in south Maria Island 75 15 1.07 light Bruny Island South 225 45 0.51 patchy Summerleas Rd 120 24 0.13 very light & patchy Channel Area 305 61 0.08 light, maybe early Forestier Peninsula 30 6 0.00 patchy Southern Forests 75 15 0.00 none Craigow Hill 120 24 0.00 none Total time spent: 1085 minutes = 18 hours and 5 mins
Table 11. Wielangta surveys.
Region
Minutes Surveying
Equivalent. No. of 5min Observations
Average No. of swift parrots per
5min Blue Gum Flowering
Wielangta 635 127 1.49 Concentrated in south
(see figure 4)
Figure 7 and Table 10 show the results of the scouting surveys carried out in areas outside the Wielangta area, which were very brief in regards to time spent. The scouting surveys indicate that there were congregations of swift parrot nesting activities associated with E. globulus flowering at southern Tasman Peninsula and North Bruny Island. The latter area had particularly dense concentrations, with over 50 individuals observed at each of two sites. There was also heavy flowering on the Tinderbox peninsula, which has limited nesting habitat but is accessible to swift parrots nesting on nearby Bruny Island. Some lighter flowering events were evident on South Bruny Island and Maria Island, which supported small numbers of presumably breeding swift parrots. Other areas including Craigow Hill in the Meehan Range, the Southern Forests, Forestier Peninsula, the Channel area and Summerleas Road in Ferntree were all found to have very few or no swift parrots and very light or no E. globulus flowering.

23
Nests outside the Wielangta area. Two nests were found outside the Wielangta area.
One nest was confirmed in an area near Roaring Beach on the Tasman Peninsula (‘RB’ on figure 7). This area had a large number of birds and good flowering resources throughout the south of the Tasman Peninsula. It was likely more nests were in the area but limited time prevented further surveying.
One nest was found at Rocky Tom, in the Meehan Range (‘RT’ on figure 7). This area had very patchy and light flowering, while at nearby Craigow Hill, there was no E. globulus flowering (see Table 6). This nest is probably an example of nesting outside of major aggregations.

24
5. Discussion The surveys in 2008/09 supported the knowledge that the Wielangta area is an important breeding location for swift parrots. Despite several years passing with little breeding activity in the Wielangta area, probably more than half of the total breeding population used this area in 2008/09. These surveys also confirmed the presence and concentration of important resources for swift parrot breeding in the Wielangta area and the usefulness of some existing spatial datasets in mapping these resources.
Swift parrot abundance. The results of the 5 minute surveys of swift parrots suggest a strong relationship between the presence of swift parrots with flowering E. globulus and senescent forest in the Wielangta area.
The strong relationship of swift parrot numbers and E. globulus flowering is well documented (e.g. Mallick et al 2004; Brereton et al, 2004; Webb, 2008). The observation that 100 of 126 sites contained E. globulus highlights the fact that this area provides a large amount of foraging resources for breeding swift parrots, especially as the sites were deliberately biased towards senescent forest, not the presence of blue gums.
The relationship between swift parrots and senescent forest is also well documented and is most likely due to senescent trees providing nesting habitat for the species (Brown 1989; Brereton 1997; Webb 2008). This relationship was strongly evident with senescent trees present in 100% of the sites where swift parrots were present but where E. globulus flowering was absent. The SenCode layer indicates large areas of senescent forest present and therefore a large amount of potential nesting habitat in the Wielangta area, useful for swift parrots when nearby E. globulus flowering occurs.
Swift parrot nesting This survey of swift parrot nesting confirms the common occurrence of nesting aggregations, revisiting of areas for nesting, selection of nest trees with DBH > 80cm, and a link with E. globulus flowering.
Many nests were found in close proximity to others, confirming aggregated nesting by swift parrots. This was evident even though the limited surveying resources and time‐intensive nature of surveying for nests means that only a fraction of the nests used in the area were detected. The density of nests detected at the Mount Walter site was 1.4 nests per hectare.
The mapping of all nesting records in the area indicates the occurrence of nesting aggregations in several breeding seasons including the re‐use of certain areas (see figure 6). No actual nests from 2001 or before were confirmed to be re‐used, but others were found within 100m of previous records, reflecting the results from Webb, Holdsworth and Webb (in prep). It was, however, difficult to confirm specific trees and hollows were those in previous records.
The following areas included records of swift parrot breeding for two or three seasons:

25
• Mount Walter and Mount Rueben
• Nelsons Tier
• Blue Gum Spur and Cone Hill &
• Wielangta Hill
The pre‐2001 records of nests at the Three Thumbs, in the north, suggests the distribution of nests can change in accordance with different flowering events.
The minimum Diameter at Breast Height (DBH) of swift parrot nest trees was 80cm, consistent with Webb, Holdsworth & Webb (in prep.) and the significant correlation of tree diameter with the number of hollows in eucalypts (Lindenmeyer et al. 2000). The number of potential hollows was greater or equal to five per nest tree in 62% of cases, is similar to that found by Webb, Holdsworth and Webb (in prep.), and obviously an important indicator of tree use for nesting by swift parrots.
The relationship with nesting and the presence of E. globulus flowering has been well established (Mallick et al 2004). This study supports this with nesting more prevalent in the southern and central parts of the study area where flowering was intense.
Regional Scouting Surveys The surveys carried out in areas outside the Wielangta area were very brief but provide an indication of where there were other congregations of swift parrot nesting activities associated with E. globulus flowering at southern Tasman Peninsula and northern Bruny Island. It is important, though, to be aware that while the Wielangta area did support a major proportion of the swift parrot population it was not the whole population.
6. Acknowledgements Many thanks go to the ecologists that carried out the surveys on this study, David James, Shaun Thurstans and Alan Wiltshire. Many thanks also to Phil Bell, Clare Hawkins and Matt Webb for assistance in the writing and reviewing of this report and Amy Koch for invaluable input. There is appreciation of the work by Ruiping Gao and Simon Grove from Forestry Tasmania in providing data and maps. Thanks too to Winston Smith from TASVEG, for GIS assistance.

26
7. References Brereton, R., Mallick, S.A., and Kennedy, S.J. 2004. Foraging preferences of Swift Parrots on Tasmanian Blue‐gum: tree size, flowering frequency and flowering intensity. Emu 104, 377‐383. Brereton, R. 1997. Management Prescriptions for the Swift Parrot in Production Forest. Report to the Tasmanian RFA Environment and Heritage Technical Committee. Brown, P.B. 1989. The Swift Parrot Lathamus discolor: A report on its ecology, distribution and status, including management considerations. Report to the Department of Lands Parks and Wildlife. Commonwealth of Australia and State of Tasmania 1997. Tasmanian Regional Forest Agreement. An agreement between The Commonwealth of Australia and The State of Tasmania. Harris, S. and Kitchener, A. 2005. From Forest to Fjaeldmark: Descriptions of Tasmania's Vegetation. Department of Primary Industries, Water and Environment, Printing Authority of Tasmania. Hobart. Jacobs, M. R. 1955. Growth habits of the eucalypts. Forestry and Commonwealth Timber Bureau, Canberra. Koch, A. & Baker, S. in prep. Assessing the use of aerial photographs for estimating hollow availability. Lindenmeyer, D.B., Cunningham, R.B., Pope, M.L., Gibbons, P. & Donnelly, C. F. 2000. Cavity sizes and types in Australian eucalypts from wet and dry forest types – a simple rule of thumb for estimating size and number of cavities. Forest Ecology and Management. 137, pp 139 – 150.
Mallick, S., James, D., Brereton, R., and Plowright, S. 2004. Blue‐gums Eucalyptus globulus in north‐west Tasmania: an important food resource for the endangered Swift Parrot Lathamus discolor. Victorian Naturalist. 101, 36‐46. Webb, M. Holdsworth, M. & Webb, J. in prep. Nesting requirements of the endangered Swift parrot Lathamus discolor.
Webb, J. 2007. Characteristics of Swift Parrot (Lathamus discolor) nesting habitat. Swifts across the strait.
Webb, M. 2008. Swift parrot Breeding Season Survey Report – 2007/2008. Threatened Species Section, Biodiversity Branch, Tasmanian Department of Primary Industries and Water. Viewed 10 Feb 2009 at http://www.dpiw.tas.gov.au/inter.nsf/Attachments/LJEM‐7GKVQQ?open