SWEDRES-SVARM 2004 · often resistant to ampicillin, streptomycin, tetracycline and...
48
Swedish Veterinary Antimicrobial Resistance Monitoring SVARM 2004
Transcript of SWEDRES-SVARM 2004 · often resistant to ampicillin, streptomycin, tetracycline and...

Swedish Veterinary Antimicrobial Resistance Monitoring
SVARM2004

© Statens Veterinärmedicinska Anstalt,National Veterinary Institute
Uppsala, Sweden
Printed by Elanders Berlings, Malmö, SwedenISSN
Produced by SVAGraphic production by Björn Lundquist AB, Malmö, Sweden
Photographs by Bengt Ekberg, SVA
Preface .............................................................................................4
Summary ..........................................................................................6
Sammanfattning ...............................................................................7
Use of antimicrobials .........................................................................8
Resistance in zoonotic bacteria ......................................................12Salmonella ..........................................................................................................12
Campylobacter ...................................................................................................15
Resistance in indicator bacteria ......................................................17Escherichia coli ...................................................................................................17
Enterococcus .....................................................................................................20
Resistance in animal pathogens ......................................................28Pig ......................................................................................................................28
Cattle ..................................................................................................................29
Horse ..................................................................................................................30
Dog .....................................................................................................................33
Cat ......................................................................................................................37
Appendix 1: Demographic data .......................................................38
Appendix 2: Materials and methods, use of antimicrobials ..............40
Appendix 3: Materials and methods, resistance monitoring ............41
Appendix 4: Antimicrobial agents licensed ......................................45
Appendix 5: References ..................................................................46

S VA R M 2 0 0 4 3
EditorsBjörn Bengtsson, Christina Greko and Märit PringleDepartment of Antibiotics, National Veterinary Institute (SVA)SE-751 89 UppsalaSweden
AuthorsBjörn Bengtsson, Anders Franklin, Christina Greko and Märit PringleDepartment of Antibiotics, SVAKristina OdensvikApoteket AB (National Corporation of Swedish Pharmacies)
SVARM laboratory working groupMaria Finn, Margareta Horn af Rantzien, Annica Landén and Verena RehbinderDepartment of Antibiotics, SVA
SVARM advisory committee Björn Bengtsson, Anders Franklin, Christina Greko and Märit Pringle, Department of Antibiotics, SVAViveka Båverud, Department of Bacteriology, SVA Desirée Jansson, Department of Pigs, Poultry and Ruminants, SVAGudrun Orava, Department of Information, SVAIvar Vågsholm, Zoonosis Center, SVAKristina Odensvik, Apoteket AB
Text and tables may be cited and reprinted only with reference to this reportSuggested citation: SVARM 2004, Swedish Veterinary Antimicrobial Resistance Monitoring. The National Veterinary Institute (SVA), Uppsala, Sweden, 2005. www.sva.se, ISSN 1650-6332.
This report is available at www.sva.seReprints can be ordered fromDepartment of AntibioticsNational Veterinary InstituteSE-751 89 UppsalaSwedenPhone: +46 (0) 18 67 40 00Fax: +46 (0) 18 30 91 62e-mail: [email protected]
SVARM 2004
Swedish Veterinary Antimicrobial Resistance Monitoring

4 S VA R M 2 0 0 4
Preface
THIS IS THE THIRD SWEDISH REPORT combining results from the monitoring of antimicrobial resistance and anti-microbial usage in both veterinary and human medicines: SVARM and SWEDRES. We are convinced that collabora-tion and joint efforts between human and veterinary medi-cines are essential in order to counteract the threat that anti-microbial resistance poses to both human and animal health. According to the Zoonosis Directive that was implemented in the EU in 2003, surveillance of antimicrobial resistance shall not only comprise zoonotic organisms such as Salmonella and Campylobacter but should also include indicator bacteria such as E. coli and enterococci. The indicator bacteria constitute a reservoir of resistance genes that may be transferred to patho-genic bacteria.
The overall aim of a national antibiotic strategy is to contain antibiotic resistance and thereby preserve the possi-bility of effective antibacterial treatment when it is needed. It is thus evident that resistance rates and trends need to be measured. For the same reason monitoring antibiotic use is important. However, surveillance systems in themselves do not solve the problem with antibiotic resistance and data must be used for action. Our hope is that this report will provide important knowledge for professional organisations, therapeutic committees and other bodies when policy deci-sions, guidelines, interventions and research strategies are made up.

S VA R M 2 0 0 4 5
Acknowledgements
THE WORK WITH SVARM has involved several people who in various ways have made this report possible. We would like to express our gratitude to all those who have contributed and in particular to:
Meat inspection personnel from the National Food Administration and abattoir staff for collecting samples from slaughtered animals for the study on indicator bacteria.
Personnel at the Department of Bacteriology, SVA, and in particular Viveca Båverud, Erik Eriksson and Ingrid Hansson, for fruitful discussions on animal pathogens and zoonotic bacteria.
Colleagues at SVA for valuable discussions, advice and constructive criticisms of manuscripts.
Tack
ARBETET MED SVARM har involverat många personer som på olika sätt gjort det möjligt att sammanställa denna rapport. Vi vill tacka alla de som bidragit och särskilt följande personer:
Köttbesiktningspersonal från Livsmedelsverket, och annan personal vid slakterier, för insamling av prov från slaktdjur för undersökningen av indikatorbakterier.
Personal vid Avdelningen för Bakteriologi, SVA, och särskilt Viveca Båverud, Erik Eriksson och Ingrid Hansson för diskussioner om djurpatogener och zoonosbakterier.
Kollegor vid SVAs värdefulla diskussioner, råd och konstruktiv kritik av manuskript.

6 S VA R M 2 0 0 4
THIS FIFTH REPORT FROM SVARM shows that the situa-tion regarding antimicrobial resistance in bacteria of animal origin is stable. Resistance does occur but viewed from an international perspective the prevalences are low. Likewise, data in the corresponding report covering human medicine, SWEDRES (http://www.strama.org or http://www.smitt-skyddsinstitutet.se) indicate a favourable situation.
The total amount of antimicrobials used for animals has declined since the mid 90s but the figures are roughly unchanged from year 2000. Over the last five years, the sales of pleuromutilins has decreased by more than 50%, which coincides with increased efforts to tackle swine dysentery, the disease for which these drugs are mainly used. It is likely that the intensive work to control this disease has resulted in a reduced need of antimicrobials.
The use of fluoroquinolones for animals has increased. In particular, the use of tablets for dogs and cats was 80% higher in year 2004 compared to 1995. The number of dogs has increased far less since 1998 (13%). No obvious scientific veterinary reasons for this development can be pinpointed. The proportion of multiresistant Escherichia coli and Staphylococcus intermedius from diagnostic submissions from dogs is high. The current trend in use of fluoroquinolones for dogs and cats is a concern. It may lead to an increase in resist-ance, and ultimately to an increased number of cases where no antimicrobials are available for treatment.
Multiresistant Salmonella Typhimurium DT104 was isolated in three Swedish cattle herds year 2004. However, this year no other resistance was found. Resistance in Salmonella from Swedish animals is rare and the situation has been stable since the late 70s, when monitoring began. The prevalence of resistance in each year’s material is greatly influenced by the occurrence of multiresistant isolates of S. Typhimurium. The phage types that often harbour multire-sistance are uncommon among food-producing animals, probably a result of the strategies in the Swedish Salmonella control programme.
Campylobacter spp. from broiler chickens were mostly identified as C. jejuni. Resistance among the isolates was rare. Similar levels of resistance are described in Campylobacter isolates from humans infected in Sweden.
Resistance in indicator bacteria, i.e. Escherichia coli and Enterococcus spp. from healthy broiler chickens, has been stable since monitoring began year 2000 and levels are gener-ally low in an international perspective. Among E. coli, resist-ance is rare but a substantial proportion of enterococci are resistant to narasin, bacitracin, macrolides or tetracycline. Notably, resistance to tetracycline has declined. Resistance to some antimicrobials might be a consequence of co-selec-tion as in both E. coli and Enterococcus, there are indications of linked resistance genes. Thereby use of one antimicrobial
could select for resistance also to other substances.Indicator bacteria are monitored as resistance in the
normal gut flora reflects the antimicrobial selective pressure in animal populations. These bacteria can form a reservoir of resistance genes that can be transferred to bacteria that cause disease in animals or humans. If harmonised methodology is used, resistance in indicator bacteria can be compared on an international level.
Vancomycinresistant enterococci (VRE) were only obtained from occasional samples from chickens with the standard method used in European monitoring programmes. With a more sensitive method, using media supplemented with vancomycin, VRE were however isolated in a larger proportion of samples than in previous years. Since the start of monitoring year 2000, the proportion of positive samples from chickens has gradually increased. Although occurrence of VRE is low in an international perspective, the increase is cause for concern since the genes that code for resistance to vancomycin might be transferred to enterococci causing nosocomial infections in humans.
Escherichia coli from diagnostic submissions were often resistant to ampicillin, streptomycin, tetracycline and trimethoprim-sulphonamides, irrespective of source (pigs, calves, horses, dogs and cats). For the animal species included, the proportion of multiresistance ranged from 7% to 29%. Interestingly, among isolates from horses gentamicin resistance only occurred in multiresistant isolates. The gynae-cological use of gentamicin in horses may co-select for resist-ance to other antimicrobials. In E. coli from pigs, there are indications of increasing resistance to ampicillin and trimeth-oprim-sulphonamides, but an opposite trends in tetracycline resistance was also observed.
Data on resistance in other animal pathogens are also presented. Acquired resistance was not common in Staphylococcus hyicus from pigs, in Rhodococcus equi from horses, nor in Pasteurella multocida from dogs. In Streptococcus zooepidemicus from horses, susceptibility to penicillin was uniform, but resistance to trimethoprim-sulphonamides was common. For at least three decades most Staphylococcus intermedius from dogs have been resistant to penicillins. Many isolates were also resistant to clindamycin, erythromycin, fusidic acid, streptomycin or tetracycline. More than one third of the isolates were multiresistant and one fifth were resist-ant to at least five antimicrobials. Resistance to macrolides, fluoroquinolones, gentamicin or streptomycin only occurred in multiresistant isolates. Hitherto, no methicillin resistant coagulase-positive staphylococci have been confirmed from Swedish animals. In view of the high proportions of resistance among canine staphylococci the treatment options would be very limited, should such resistance emerge.
Summary

S VA R M 2 0 0 4 7
Sammanfattning
ÅRETS SVARM-RAPPORT visar att läget är stabilt när det gäller antibiotikaresistens hos bakterier från djur. Resistens förekommer, men i ett internationellt perspektiv är nivåerna låga. Även SWEDRES, motsvarande rapport från human-sjukvården, redovisar ett i huvudsak gynnsamt läge (http://www.strama.org eller http://www.smittskyddsinstitutet.se).
Den totala förbrukningen av antibiotika till djur har minskat sedan 90-talet men är från år 2000 och framåt i stort sett oförändrad. Försäljningen av pleuromutiliner har minskat med mer än 50 % under de senaste fem åren vilket sannolikt är en följd av ökade ansträngningar att bekämpa svindysenteri, en sjukdom som ofta behandlas med dessa antibiotika.
Förbrukningen av fluorokinoloner till djur har ökat. Framförallt var användningen av tabletter till hund och katt 80 % högre år 2004 jämfört med 1995. Antalet hundar har bara ökat med 13 % sedan 1998. Det finns inga uppenbara veterinärmedicinska skäl till en ökad användning. Andelen multiresistenta Escherichia coli och Staphylococcus intermedius i kliniska prover från hundar är hög. En ökad förbrukning av fluorokinoloner till hund och katt är därför oroande eftersom den kan leda till ökande resistens och till att det för vissa sjuk-domsfall inte längre finns några behandlingsalternativ.
Multiresistenta Salmonella Typhimurium DT104 isole-rades från prover tagna i tre svenska nötkreatursbesättningar år 2004. Dessa var de enda resistenta salmonellaisolaten under året. Resistens bland Salmonella från svenska djur är ovanlig och läget har varit stabilt sedan övervakningen började på sjuttiotalet. Förekomsten av resistens under enskilda år påverkas i stor utsträckning av andelen multiresi-stenta S. Typhimurium i materialet. De fagtyper som ofta bär på multiresistens är ovanliga hos livsmedelproducerande djur i Sverige vilket troligen är ett resultat av det svenska salmo-nellakontrollprogrammet.
Majoriteten av Campylobacter spp. från slaktkyckling identifierades som C. jejuni. Resistens var ovanlig bland isolaten. Låg andel resistenta isolat har även rapporterats för Campylobacter från människor som infekterats i Sverige.
Förekomsten av resistens hos indikatorbakterier, Escherichia coli och Enterococcus spp., från friska slaktkyck-lingar har varit i stort sett oförändrad sedan övervakningen började år 2000. Nivåerna är i huvudsak låga i ett interna-tionellt perspektiv. Resistens är ovanlig hos E. coli, men en betydande andel enterokocker är resistenta mot narasin, baci-tracin, makrolider eller tetracyklin. Anmärkningsvärt är att tetracyklinresistens har minskat. I materialet finns indikatio-ner på att kopplad resistens förekommer. Resistens mot vissa antibiotika kan därför vara en följd av ko-selektion, vilket innebär att användning av ett antibiotikum kan selektera för resistens även mot andra substanser.
Indikatorbakterier undersöks eftersom resistens i den normala tarmfloran speglar antibiotikatrycket i en djur-population. Bakterierna kan också utgöra en reservoar av resistensgener som kan överföras till bakterier som orsakar sjukdomar hos människor eller djur. Om harmoniserade metoder används kan dessutom förekomst av resistens hos indikatorbakterier jämföras internationellt.
Vankomycinresistenta enterokocker (VRE) påvisades i ett fåtal prov från kycklingar med den standardmetod som används i Europeiska övervakningsprogram. Med en käns-ligare metod, där odlingsmedier innehållande vancomycin används, isolerades däremot VRE från en större andel prov än tidigare år. Andelen positiva prov har gradvis ökat sedan övervakningen påbörjades år 2000. Förekomsten av VRE är låg jämfört med andra länder men eftersom generna som orsakar vankomycinresistens kan överföras till enterokocker som ger nosokomiala infektioner hos människor är ökningen oroande.
Escherichia coli från kliniska prov var ofta resistenta mot ampicillin, streptomycin, tetracyklin och trimetoprim-sulfo-namider, oavsett ursprung (grisar, kalvar, hästar, hundar och katter). Andelen multiresistens varierade mellan 7 och 29 %. Hos E coli från hästar fanns gentamicinresistens bara hos multiresistenta isolat. Därför är det möjligt att användningen av gentamicin för gynekologiskt bruk till hästar ko-selekterar för resistens mot andra substanser. Hos E. coli från grisar finns det indikationer på att resistens mot såväl ampicillin som trimetoprim-sulfonamider ökar, medan trenden för tetracyklinresistens var den motsatta.
Hos andra djurpatogener, som Staphylococcus hyicus från grisar, Rhodococcus equi från hästar och Pasteurella multocida från hundar, var förvärvad resistens ovanlig. Alla Streptococcus zooepidemicus från hästar var känsliga för penicillin, men resistens mot trimetoprim-sulfonamider var vanlig. Däremot var majoriteten Staphylococcus intermedius från hundar resi-stenta mot penicillin liksom de varit under de senaste 30 åren. Många isolat var resistenta också mot klindamycin, erytromycin, fusidinsyra, streptomycin eller tetracyklin. Mer än en tredjedel var multiresistenta och en femtedel var resi-stenta mot minst fem antibiotika. Resistens mot makrolider, fluorokinoloner, gentamicin eller streptomycin förkom bara hos multiresistenta isolat. Hittills har meticillinresistenta koagulas-positiva stafylokocker inte isolerats från svenska djur. Eftersom resistens är utbredd bland stafylokocker från hundar skulle en spridning av meticillinresistens kraftigt begränsa behandlingsmöjligheterna.

8 S VA R M 2 0 0 4
Use of antimicrobials
THROUGH AN INITIATIVE of SVA and Apoteket AB (the National Corporation of Swedish Pharmacies), statistics on total sales of antibiotics for use in animals in Sweden are avail-able since 1980. For a review of the figures from 1980-2000 as well as references to publications on which that review is based, see SVARM 2000. Up to and including the year 2002, data presented are sales from wholesalers to pharmacies. From 2003, the basis for the statistics has been changed to sales from pharmacies.
Material includedIn Sweden, antimicrobials for use in animals are only avail-able on veterinary prescription and all pharmaceuticals are dispensed by pharmacies. In 1986, the Feedstuffs Act restricted the use of antibiotics for veterinary medicinal purposes, i.e. their use as growth promoters was banned.
Drug statistics are based on sales figures provided by Apoteket AB and represent the total amount of antimicrobi-als authorised for veterinary use sold, calculated to kg active substance. These figures include antimicrobial formula-tions for systemic, intramammary and obstetric use, and intestinal anti-infectives, for all animal species (food produc-ing animals, pets and horses etc). Up to and including year 2002, the source for the statistics has been sales of drugs from wholesalers to pharmacies. From year 2003, the statistics are based on the amount of drugs dispensed by pharmacies. As the pharmacies stock a limited amount of veterinary drugs, the figures from wholesalers’ statistics should be comparable
to the figures of antimicrobials dispensed. In both cases, statistics represent an approximation on the actual usage of antimicrobials, assuming that the amount sold is also used during the observation period.
Drugs authorised for human use but prescribed for animals are not included. Such drugs are prescribed primarily in small animal medicine. Details on animal numbers are found in Appendix 1 and on methodology in Appendix 2.
Overall use of antimicrobialsThe total use of antimicrobials is presented in Table AC I. The potency of the different antimicrobials is not equal and therefore each substance group should be evaluated sepa-rately. Nonetheless, the total figures may indicate trends in the material. The total amount used has decreased since the mid 90s, but was roughly unchanged during year 2000-2002. In year 2003 and 2004, the figures have been some-what lower that in year 2000 (7% and 6% lower, respec-tively). As noted above, from year 2003 the source of the statistics has been changed to amounts dispensed but it is unlikely that the change of source would result in changes of the observed magnitude. Changes in the number of animals may affect trends in statistics on use of antimicrobials. In year 2004, the number of dairy cows was 6% lower than in year 2000, while the number of slaughtered pigs and broilers were roughly unchanged (3 and 1% increase, respectively). Almost the entire difference in the sum of total use between year 2000 and 2004 derives from a decrease in use of prod-
Table AC I. Yearly sales of antimicrobial drugs for veterinary use expressed as kg active substance (sales statistics from Apoteket AB).
ATCvet code Antimicrobial class 1980 1984 1988 1992 1996 2000 2001 2002 2003 2004
QJ01AA, QG01A Tetracyclinesa 9 819 12 955 4 691 8 023 2 698 1 754 1 453 1 415 1 307 1 329
QJ01B Amfenicols 47 49 35 - - - - - - -
QJ01CE, QJ01R, QJ51 Penicillin G-and Vb 3 222 4 786 7 143 7 446 8 818 8 254 8 414 8 179 7 579 7 814
QJ01CA, QJ01CR Aminopenicillins 60 714 655 837 835 852 752 767 870 875
QJ01D, QJ51CA Other betalactams incl. cephalosporins
9 2 - - - 315 474 676 832 928
QA07AA, QJ01G, QJ01R, QJ51R
Aminoglycosidesa 5 274 5 608 3 194 2 139 1 164 797 770 753 645 606
QA07AB, QJ01E Sulphonamides 6 600 4 325 3 072 2 362 2 198 2 338 2 485 2 477 2 326 2 462
QJ01E Trimethoprim & derivatives 134 186 250 284 339 390 414 414 381 406
QJ01F Macrolides & lincosamides 603 887 1 205 1 710 1 649 1 352 1 510 1 412 1 124 1 095
QJ01MA Fluoroquinolones - - - 147 173 156 182 185 184 187
QJ01XX92, QJ01XX94 Pleuromutilins - - 124 268 1 142 871 841 988 744 387
QJ01MB Quinoxalinesc 6 250 9 900 7 164 4 917 1 098 - - - - -
QJ01XX91 Streptogramins - 8 800 1 088 1 275 525 - - - - -
QP51AA, QJ01BA Other substancesd 861 1 637 1 567 1 634 - - - - - -
Feed additivese 8 380 700 - - - - - - - -
Total 41 259 50 549 30 189 31 043 20 639 17 079 17 295 17 266 15 992 16 089
a Includes drugs marketed with special marketing authorisation for years 2000-2004; b Calculated as benzyl-penicillin; c years 1980-1984 sold as feed additives, thereafter on veterinary prescription at therapeutic dosages; d Mainly nitroimidazoles; e Feed additives other than quinoxalines and streptogramins: avoparcin, baci-tracin, nitrovin, oleandomycin and spiramycin.

S VA R M 2 0 0 4 9
ucts intended for medication via feed or water (967 kg [Table AC III] of 990 kg [Table AC I]). As that type of products are mainly used in pigs, and as the pig population is unchanged, at least part of the observed decrease in total consumption is a true decrease in incidence of use. By contrast, the observed decrease in use of penicillin may well to a large extent reflect the lower number of dairy cows, as injectable products are widely used for treatment of mastitis.
The use of specific antimicrobial classes is commented under ‘Use for systemic treatment of individual animals’ or ‘Use for treatment of groups or flocks’, as appropriate.
In chickens, ionophoric antibiotics are given to control coccidiosis. These substances are currently classified as feed additives, and are not included in the overall statistics based on sales from pharmacies. However, the sales of these prod-ucts, based on data from feed mills, are discussed under the section on group treatment (see Table AC III).
Use for systemic treatment of individual animalsIn table AC II, the sales of products for use in individual
animals, excluding topical, intrauterine and intramammary use are presented. The use of most groups has decreased or been relatively unchanged over the last five years. A large part of the injectables is probably used for treatment of bovine mastitis. Therefore, some of the decrease in for example penicillins may be explained by a decreasing number of dairy cows. It should be noted, however, that many of the drugs of concern are also used in horses. Annual changes in the number of horses (increases or decreases) can therefore have an influence on the figures. In the fall of 2004, number of horses in Sweden was estimated to 271 000 (Swedish Board of Agriculture and Statistics Sweden, www.sjv.se, last accessed 2005-03-16). Unfortunately, there are no reliable figures on number of horses previous years so any interpretation of trends in sales of drugs of this category must be made with great caution.
The use of cephalosporins for veterinary use is almost three times as high in year 2004 compared to year 2000. The vast majority of the sales of cephalosporin for oral use in dogs. Drugs of this class were introduced on the Swedish market for use in pets in 1997, but before that time oral cephalosporins
authorised for use in humans were prescribed off-label for use in dogs. In 1998, 73% of the total number of prescriptions of cephalosporins for dogs and cats were off-label prescription of products authorised for humans (Odensvik et al., 2001). As drugs authorised for humans are not included in the statistics in this report, the increasing trend partly reflects an increased prescription to pets of drugs authorised for veterinary use instead of off-label prescription of drugs of the same class authorised for humans. However, considering the magnitude of the increase, it is probable that there is also a true increase in the incidence of use of this class of drugs.
The use of fluoroquinolones for individual treatment has increased by 21% over the last five years. Sales of injectable products, used mainly for treatment of cattle and pigs, consti-tute approximately 70% of the figures on sales of fluoroqui-nolones for individual use and the remainder of the sales are tablets for use in small animals. Seen over a ten years period, a remarkable increase (80%) in sales of products intended for use in pets is noted, while the sales of injectables has been comparatively stable. The increased use of fluoroquinolones for treatment of dogs and cats is of concern, as these drugs are used for treatment of critical conditions in both animals and man. The trends in use of different types of fluoroquinolones are further commented under ‘Sales of fluorquinolones over 10 years’.
The use of products for individual use from the classes ‘aminoglycosides’ and ‘macrolides and lincosamides’ has declined by 27 and 28%, respectively, over the last five years. For aminoglycosides , this trend is mainly explained by a decreased used of combinations of procaine-penicillin and dihydrostreptomycin (ATCvet code QJ01R). This is in line with current policy recommendations. For the group of macrolides and lincosamides, the decrease mainly derives from a declining use of injectable macrolides for use in cattle and pigs, while the lincosamides, that only comprise tablets for use in pets, show a less prominent decrease.
Use for treatment of groups or flocksOf special interest when considering the risk for develop-ment of resistance is the consumption of antimicrobials intended for group or flock medication. Of the total sales of
Table AC II. Yearly sales of antimicrobial drugs authorised for individual treatment expressed in kg active substance. Intramammaries (QJ51) and formula-tions for dermatological use (QD06), as well as local treatment of the genito-urinary tract (QG01) are not included (sales statistics from Apoteket AB).
ATCvet code Antimicrobial class 1996 1997 1998 1999 2000 2001 2002 2003 2004
QA07A Intestinal anti-infectivesa 863 706 649 607 587 614 594 594 586
QJ01A Tetracyclines 596 663 656 695 634 623 628 606 611
QJ01Cc Penicillinsb 9 560 9 530 9 287 9 424 9 037 9 095 8 894 8 406 8 644
QJ01D Cephalosporins - 53 133 245 315 474 676 832 928
QJ01E Sulfonamides & trimethoprim 2 033 2 107 2 335 2 376 2 336 2 478 2 483 2 280 2 427
QJ01F Macrolides & lincosamides 675 652 645 559 531 522 477 430 382
QJ01Gc Aminoglycosides 650 617 535 528 474 454 460 367 344
QJ01M Fluoroquinolones 147 147 150 144 150 169 178 177 180
QJ01X Pleuromutilins 73 65 64 52 56 48 49 77 32a Drugs marketed with special marketing authorisation are included from year 2000; b Procaine-penicillin calculated as benzyl-penicillin; c Includes QJ01R, combinations.

10 S VA R M 2 0 0 4
FLUOROQUINOLONES ARE USED for treatment of critical conditions in both animals and man. Emergence of infec-tions caused by bacteria with acquired resistance to this group is therefore a concern. Internationally, particular attention has been paid the use of fluoroquinolones in food producing animals and its potential implications for human health through spread of zoonotic bacte-ria. Use of these drugs in dogs and cats has attracted little attention. However, such use can be consid-erable, as pointed out in last year’s SVARM report (SVARM 2003) and also by Heuer et al. (2005).
The overall sales of fluoroquinolones for use in animals were of similar magnitude in year 2004 compared with figures from year 1995 (Figure AC I). Between years 1995 and 1999, the use decreased by 22% but between years 2000 and 2004, it increased again by 20%. In year 1995, products for mixing into feed or water (group medication), injectables, or tablets were 16, 70 and 15%, respectively, of the total sales of fluoro-
quinolones. The corresponding figures for year 2004 were 4, 67 and 29%. This reflects the fact that the trends in use differ considerably between different product-types. The use of products for group medication has decreased substantially, the use of injectables is subject to some vari-
ation, and as to the use of tablets it has increased markedly (Figure AC II).
Fluoroquinolone-tablets are authorised for oral use in dogs and cats. The first products of this type were authorised for sales on the Swedish market in 1989. The use of this subset has increased by 80% between 1995 and 2004, and the increase is almost linear (R2 0.99; Figure AC I and II). The number of dogs in year 1998 was estimated to around 800,000; and in year 2004 to 900,000; an
increase by 13%. The number of cats that were cared for in year 2004 was estimated to 1,200,000; reliable estimates for previous years are missing (Hedhammar, 2004; Egenvall et al, 1999). On a weight basis, the combined dog and cat population is about 3% of the total population exposed
Sales of fluoroquinolones over 10 years
0
20
40
60
80
100
120
140
160
180
200
Oral, feed or water
InjectionOral, tablets
04030201009998979695
Kg
activ
e su
bst
ance
Figure AC I. Sales of fluoroquinolones for veterinary use (QJ01MA) from year 1995 to 2004 (kg active substance), divided by intended route of administration of the products.
antimicrobials for animals, the proportion of drugs author-ised for treatment of groups of animals via feed or water has decreased steadily over the years and is today but 11% of the total sales, measured as kg active substance Table AC I and III). Only four classes of antimicrobials of this type remain on the market. All groups show a declining trend since at least the mid 90s. The products included in the groups are mainly used in pigs. The number of pigs slaughtered has decreased by 10% over the last 10 years but has over the last five years remained comparatively stable (4% increase between years 2000 and 2004; see Appendix 1 for demographics).
A gradual decrease in sales of pleuromutilins can be noted. Over the last five years, the sales of this class have decreased by 56%, with a particularly remarkable drop from year 2003 to 2004 (47%). Pleuromutilins (tiamulin, valnemulin) are only authorised for use in pigs, with swine dysentery as the main indication. The decreased use of pleuromutilins coincides with increased efforts to tackle swine dysentery. In year 2000 a programme for certifying breeding herds as free from swine dysentery was launched, and from year 2002 the tracing of infected herds was intensified. Sampling within
eradication programmes has also been intensified. Increases in use of pleuromutilins in occasional years, such as seen in year 2002, may be related to a temporary, but extensive, use within eradication programmes. It is probable that these combined efforts have resulted in a decreased need to treat swine dysentery, as reflected by the declining sales figures.
The observed decrease in use of tetracyclines is confounded by an increased use of doxycycline within that group. Doxycycline has a higher bioavbailability, and the dose is lower (250 ppm when mixed in feed) compared with that for, e.g. chlortetracycline (1000 ppm when mixed in feed). The use of doxycycline has increased steadily over the last five years. When the sales figures are corrected for the lower dose of doxycycline, the use of tetracyclines has decreased by 48% between years 1996 and 2000 but only by 7% between years 2000 and 2004. From year 2003 to 2004 the dose corrected use increased by 17%.
Coccidiostats of the ionophore group are used as feed additives to control coccidiosis in the production of chickens for slaughter. Since the late 80s, narasin is by far the most widely applied substance.

S VA R M 2 0 0 4 11
Table AC III. Yearly sales of antimicrobial drugs authorised for group treatment and ionophoric anticoccidials sold expressed as kg active substance. Based on sale statistics from Apoteket AB and from the Board of Agriculture.
ATCvet code Antimicrobial class 1980 1984 1988 1992 1996 2000 2001 2002 2003 2004
QJ01A Tetracyclinesa 9 270 12 300 4 177 7 461 2 089 1 111 822 777 695 712
QJ01C Penicillins - - 186 9 - - - - - -
QJ01F Macrolides & lincos-amides
308 607 751 1 139 975 821 988 935 694 713
QJ01M Fluoroquinolones - - - 10 27 7 13 7 8 7
QJ01M Quinoxalinesb 6 250 9 900 7 164 4 917 1 098 - - - -
QJ01XX91 Streptograminsb - 8 800 1 088 1 275 525 - - - -
QJ01XX92, QJ01XX94
Pleuromutilins - - 101 229 1 069 815 793 939 667 355
QP51AA Nitroimidazoles 791 1 440 1 557 1 563 - - - - - -
Feed additivesc 8 380 700 - - - - - - - -
QP51AH Ionophoric antibiotics (coccidiostats)d
390 7 900 6 991 8 267 11 643 9 368 10 019 8 439 10 920 10 486
a Drugs marketed with special marketing authorisation are included from year 2000; b Years 1980-1984 sold as feed additives, thereafter on veterinary prescription at therapeutic dosages; c Feed additives other than quinoxalines and streptogramins: avoparcin, bacitracin, nitrovin, oleandomycin and spiramycin;. d From 1999 regulated and classified as feed additives (dir 70/524/EEC). Figures from 1999 and onwards are from the Feed Control of the Board of Agriculture (www.sjv.se).
(assuming that the average weights of dogs and cats are 25 and 5 kg, respectively, and counting dogs, cats, cattle, sows and slaughter pigs). As noted above, in year 2004, 29% of the total sales of fluoroquinolones for animal use were products intended for use in dogs and cats. Thus, the expo-sure of dogs and cats to fluoroquinolones by far exceeds the exposure of food-producing animals in Sweden.
Assuming that the cat population has not increased much more than the dog population, there has been a true and substantial increase in the exposure of dogs and cats to fluoroquinolones. This is likely to be true especially for dogs as more than 70% of the prescriptions for dogs and cats combined were for dogs (figures from 1998, Odensvik et al, 2001). There are no apparent scientific veterinary reasons for this recorded increase. Over the last years, several new products contain-ing fluroroquinolones for use mainly in dogs have been launched on the Swedish market. It is probable that the increase of sales for dogs and cats reflects an active marketing, rather than a true change in need for the products.
Multiresistant bacteria such as Escherichia coli are frequently isolated from, e.g., urinary tract infections. During 2001-2004, 11% of the E. coli isolated from
urinary samples from dogs were multiresistant. For almost half of these (5% of the total number), resistance to fluo-roquinolones (defined as MICs >0.25 mg/L) was included in the pattern. The increased use of fluoroquinolones for individual treatment of dogs and cats is of concern, as it may lead to an increase in the number of cases where no veterinary antimicrobials are available for treatment.
A further cause for concern is a potential zoonotic transfer of resistant bacteria. Companion animals are in close contact with people, and in Sweden, 19 and 22% of the households were estimated to have dogs or cats, respectively (Hedhammar, 2004). Thus, a large proportion of the human popula-tion is directly exposed on a daily basis to companion animals and their microflora. The extent to which transfer
of (resistant) bacteria between the animals and their owners occurs is not known, nor is its potential impact on human health. Nonetheless, both the Swedish and the Danish statistics (Heuer et al, 2005) indicate that when the use of fluoroquinolones and its potential impact on animal and human health is scrutinized, the use for companion animals should not be neglected.
0
25
50
75
100
125
150
175
200
Oral, feed or water
InjectionOral, tablets
04030201009998979695
Ind
exed
sal
es
Figure AC II. Indexed sales of fluoroquinolones for veterinary use (QJ01MA) from year 1995 to 2004 by intended route of administration of the products.

12 S VA R M 2 0 0 4
THE MONITORING PROGRAM encompasses zoonotic bacte-ria from animals in Sweden. This year, data on antimicrobial susceptibility of Salmonella enterica and of Campylobacter jejuni and hippurate-negative thermophilic Campylobacter spp. are presented. More information regarding infections with these bacteria in Sweden is available in the yearly report, Zoonoses in Sweden.
SalmonellaIsolates includedAny finding of Salmonella in animals is notifiable in Sweden and confirmation at SVA of at least one isolate from each incident is mandatory. From these isolates, one from each animal species (warm-blooded, both wild and domesticated) involved in each notified incident year 2004 are included in the material, for more details see Appendix 3.
In Sweden, monitoring of antimicrobial susceptibility among Salmonella of animal origin has been performed regu-larly since 1978. Although the antimicrobials included in the test panels have varied, microdilution methods have been
used in all these surveys. For comparison, data from previous years are therefore presented together with data for 2004.
Note that some microbiological cut-off values defining resistance (breakpoints) used in SVARM 2000-2002 have been changed. To facilitate comparisons when data from these reports are presented, levels of resistance have been recalculated using the current cut-off values.
Results and commentsA total of 68 isolates are included in the material (Table S I). This year only isolates of subspecies I (enterica) were found, 49 were S. Typhimurium, 7 S. Dublin and 10 isolates were other serovars. Two isolates were not possible to serotype. The distributions of the MICs for the 68 isolates are given in Table S II and S III.
More than half of the isolates were from cats (32%) and cattle (21%) (Table S I). All isolates from cats were Typhimurium and the 41% that were phage typed were all DT40. This is a common phage type among non-migratory small birds and cats get infected eating birds easily caught at bird feeders during late winter. The S. Typhimurium isolates
Resistance in zoonotic bacteria
Table S I. Number of isolates of Salmonella enterica included year 2004 presented by serovar and source.
Subspecies I Cattle Pig Poultry Dog Cat Horse Wildlife Total
Cubana 1 1
Dublin 4 3 7
Düsseldorf 1 1
Enteritidis phage type 1 1 1
Enteritidis phage type 9a 1 1
Hadar 1 1
Mbandaka 1 1
Oritamerin 1 1
Roodepoort 1 1
Tennessee 1 1
Typhimurium DT 9 1 1
Typhimurium DT 40 5 1 9 15
Typhimurium DT 41 1 1 2
Typhimurium DT 93 1 1
Typhimurium DT 104 3 3
Typhimurium DT 120 1 1
Typhimurium DT 146 2 2
Typhimurium DT 193 1 1
Typhimurium DT 195 1 1
Typhimurium NST 1 1 4 2 8
Typhimurium not phage typed 13 1 14
Worthington 1 1
Non serotypeable 1 1 2
Total 14 7 6 3 22 8 8 68
Percent of total 21 10 9 4 32 12 12

S VA R M 2 0 0 4 13
from cats were susceptible to all antimicrobials tested. Four of the S. Typhimurium isolates from cattle were
multiresistant; three were DT104 and one DT120. These four isolates were from three farms with connections through trade of calves. Isolates from all three farms had an identical resistance pattern and an identical pulsed-field gel electro-phoresis (PFGE) banding pattern, including the DT120. A close relationship between these two phage types has been described in a study from the UK where multiresistant isolates of DT120 and DT104 had identical PFGE patterns (Lawson et al., 2002). In contrast, susceptible isolates of the two phage types analysed with PFGE differed from multire-sistant isolates of the same phage type. A probable explana-tion is that the multiresistant DT120 is a variant developed from the multiresistant DT104. Restrictions were put on the herds, according to the Swedish Salmonella control programme (Zoonoses in Sweden, 2003).
The low level of resistance among Salmonella enterica, as well as in the subset S. Typhimurium, year 2004 agrees
with the results for previous years (SVARM 2000 to 2003). Further, among S. Typhimurium, levels of resistance have been stable, the only apparent trend is a lower level of resist-ance to streptomycin since 1999 compared to the preceding period (Table S IV).
It is apparent that the occurrence of multiresistant isolates, i.e. resistant to at least three antimicrobials, in each year’s material greatly influences the prevalence of resistance. Among S. Typhimurium, five isolates were multiresistant in 1999, two isolates in each of the years 2000 and 2001 and four isolates in year 2004. These isolates were DT104, DT120 or DT193.
The material in the years 1997 to 2004 consists of one isolate from each notified incident of Salmonella in Sweden, including those detected in food-producing animals in the Salmonella control programme. From a public health perspective, the prevalence of resistance in Salmonella from food-producing animals is of greater importance than resist-ance in isolates from wild animals or pets. Therefore a subset
Table S II. Distribution of MICs for all Salmonella enterica (n=68) from animals in 2004.
SubstanceResistance
(%)
Distribution (%) of MICsa (mg/L)
≤0.03 0.06 0.12 0.25 0.5 1 2 4 8 16 32 64 128 256 512 1024 2048 >2048
Ampicillin 6 2.9 76.5 14.7 5.9
Ceftiofur 0 1.5 19.1 76.5 2.9
Chloramphenicol 6 22.1 69.1 2.9 2.9 2.9
Enrofloxacin 0 44.1 41.2 14.7
Florfenicol 4 91.2 2.9 1.5 4.4
Gentamicin 0 63.2 36.8
Nalidixic acid 0 82.4 14.7 2.9
Neomycin 0 98.5 1.5
Streptomycin 6 4.4 51.5 36.8 1.5 5.9
Sulphamethoxazole 6 4.4 30.9 35.3 23.5 5.9
Tetracycline 6 11.8 82.4 5.9
Trimethoprim 0 16.2 80.9 2.9
a The white fields denote range of dilutions tested for each substance. MICs above the range are given as the concentration closest to the range. MICs equal to or lower than the lowest concentration tested are given as the lowest tested concentration. Bold vertical lines indicate cut-off values defining resistance.
Table S III. Distribution of MICs for the subset Salmonella Typhimurium (n=49) from animals in 2004.
SubstanceResistance
(%)
Distribution (%) of MICsa (mg/L)
≤0.03 0.06 0.12 0.25 0.5 1 2 4 8 16 32 64 128 256 512 1024 2048 >2048
Ampicillin 8 77.6 14.3 8.2
Ceftiofur 0 14.3 85.7
Chloramphenicol 8 18.4 73.5 4.1 4.1
Enrofloxacin 0 42.9 42.9 14.3
Florfenicol 6 91.8 2.0 6.1
Gentamicin 0 65.3 34.7
Nalidixic acid 0 89.8 6.1 4.1
Neomycin 0 100.0
Streptomycin 8 55.1 36.7 8.2
Sulphamethoxazole 8 2.0 18.4 40.8 30.6 8.2
Tetracycline 8 91.8 8.2
Trimethoprim 0 18.4 79.6 2.0
a The white fields denote range of dilutions tested for each substance. MICs above the range are given as the concentration closest to the range. MICs equal to or lower than the lowest concentration tested are given as the lowest tested concentration. Bold vertical lines indicate cut-off values defining resistance.

14 S VA R M 2 0 0 4
of the 299 isolates from food-producing animals years 1997-2004 is presented in Table S V. In the whole material only 25 isolates (8%) were resistant to any of the antimicrobials tested and nine isolates (3%) were multiresistant. All multiresist-ant isolates were S. Typhimurium, five DT104 and two of each DT193 and DT120. These isolates were resistant to ampicillin, streptomycin, tetracycline and sulphonamides. In addition, the DT104 and DT120 isolates were resistant to chloramphenicol.
In light of this, the overall situation of antimicrobial resist-ance in Salmonella is most favourable. As a result of the strate-gies in the Swedish Salmonella control programme, the spread of multiresistant clones has been contained. Furthermore there is no indication of spread of such clones among the notified incidents in wild animals as only one of the 83 Salmonella enterica isolates tested since 1997 was multiresist-ant.
Table S IV. Occurrence of resistance (%) and source of isolates in Salmonella Typhimurium from animals 1978 to 2004.
Substance
Cut-off value (mg/L)
Resistance (%)
1978-86(n=117)
1987-88a, b
(n=8)1989-92(n=79)
1993-96(n=87)
1997-99(n=151)
2000(n=46)
2001(n=31)
2002(n=31)
2003(n=49)
2004(n=49)
Ampicillin >8 2 0 3 8 7 2 6 0 0 8
Ceftiofur >2 - - - - - 0 0 0 0 0
Cephalotin >16 - - 1 0 2 - - - - -
Chloramphenicol >16 4c 0c 3c 6c 5c 2c 6c 0 0 8
Enrofloxacin >0.25 - - 1 1 1 0 0 0 0 0
Florfenicol >16 - - - - - 2 6 0 0 6
Gentamicin >8 - - 0 0 0 0 0 0 0 0
Nalidixic acid >16 - - - - - 4 3 3 0 0
Neomycin >8 0 0 4 0 1 0 3 0 0 0
Streptomycin >32 78 12 25 13 11 4 6 0 2 8
Sulphamethoxazole >256 - - - - - 2 6 0 2 8
Tetracycline >8 14 0 3 7 7 2 6 0 0 8
Trimethoprim >8 - - - - - 0 0 0 0 0
Trim/sulph. >0.5/9.5 0 0 1 1 5 - - - - -
Percent of isolates from:
Cattle, sheep, pigs, poultry 100 100 59 55 34 57 39 36 12 33
Horses, cats, dogs - - 15 22 41 37 38 32 82 61
Wildlife - - 26 23 25 7 23 32 6 6
a Only isolates from cattle; b 1988 includes isolates to September, isolates from October-December 1988 given under 1989; c Cut-off value defining resistance >8 mg/L.
Table S V. Distribution of MICs for all Salmonella enterica (n=299) from food-producing animals years 1997-2004. Due to change of panel design year 2000 some substances have only been tested for 172 isolates.
Substance
Resis-tance(%)
Distribution (%) of MICsa (mg/L)
≤0.25 0.5 1 2 4 8 16 32 64 128 256 512 1024 >1024
Ampicillin 3 4.3 66.9 25.1 0.7 3.0
Ceftiofur 0b 5.2 23.8 66.9 4.1
Chloramphenicol 2 16.7 64.9 16.1 2.3
Enrofloxacin 1 99.0 1.0
Florfenicol 2b 76.2 20.9 1.2 1.7
Gentamicin 0 59.2 17.7 23.1
Nalidixic acid 2b 54.1 33.1 11.0 0.6 1.2
Neomycin 0 72.2 26.8 1.0
Streptomycin 7 0.3 2.3 24.4 33.4 32.4 4.3 1.7 1.0
Sulphamethoxazole 4b 36.0 51.2 9.3 3.5
Tetracycline 3 13.0 58.2 23.7 1.7 2.0 1.3
Trimethoprim 0b 14.0 70.3 14.5 0.6 0.6
a The white fields denote range of dilutions tested for each substance. MICs above the range are given as the concentration closest to the range. MICs equal to or lower than the lowest concentration tested are given as the lowest tested concentration. Bold vertical lines indicate cut-off values defining resistance; b 172 isolates tested.

S VA R M 2 0 0 4 15
CampylobacterIsolates includedFrom the Swedish Campylobacter control programme year 2004 a total of 100 isolates from broiler chickens were randomly selected for susceptibility testing.
Isolates were identified as Campylobacter jejuni or as hippurate-negative thermophilic Campylobacter spp. Antimicrobials included in the test panels and concentration
ranges are given in Table Camp I. For details on methodol-ogy, including sampling strategy, see Appendix 3.
Results and commentsThe majority of the isolates were identified as C. jejuni (94%) and only 6% were classified as hippurate-negative thermophilic Campylobacter spp. As the isolates are obtained within the framework of the Swedish Campylobacter control programme, it can be assumed that the material is representa-
Table S VI. Distribution of MICs for the subset Salmonella Typhimurium (n=121) from food-producing animals years 1997-2004. Due to change of panel design year 2000 some substances have only been tested for 70 isolates.
SubstanceResistance
(%)
Distribution (%) of MICsa (mg/L)
≤0.25 0.5 1 2 4 8 16 32 64 128 256 512 1024 >1024
Ampicillin 7 0.8 60.3 30.6 0.8 7.4
Ceftiofur 0b 28.6 68.6 2.9
Chloramphenicol 6 17.4 73.6 3.3 5.8
Enrofloxacin 0 100.0
Florfenicol 4b 91.4 2.9 1.4 4.3
Gentamicin 0 58.7 18.2 23.1
Nalidixic acid 1b 51.4 30.0 17.1 1.4
Neomycin 0 76.0 24.0
Streptomycin 8 0.8 12.4 38.8 39.7 3.3 2.5 2.5
Sulphamethoxazole 7b 40.0 42.9 10.0 7.1
Tetracycline 7 5.8 60.3 24.0 2.5 5.0 2.5
Trimethoprim 0b 21.4 62.9 15.7
a The white fields denote range of dilutions tested for each substance. MICs above the range are given as the concentration closest to the range. MICs equal to or lower than the lowest concentration tested are given as the lowest tested concentration. Bold vertical lines indicate microbiological cut-off values defining resist-ance; b 70 isolates tested.
Table Camp I. Distribution of MICs for Campylobacter jejuni from chickens (n=94) 2004. Data for 2001 (n=43) and 2002 (n=84) are given for comparison (SVARM 2002).
Substance Year
Resis-tance(%)
Distribution (%) of MICsa (mg/L)
≤0.03 0.06 0.12 0.25 0.5 1 2 4 8 16 32 64 128 >128
Ampicillin
-04 5 6.4 7.4 46.8 26.6 4.3 3.2 3.2 2.1
-02 10 7.1 3.6 21.4 44.0 10.7 3.6 4.8 4.8
-01 2 2.3 11.6 46.5 30.2 7.0 2.3
Enrofloxacin
-04 5 25.5 53.2 13.8 2.1 3.2 2.1
-02 0 27.4 63.1 7.1 2.4
-01 2 51.2 44.2 2.3 2.3
Erythromycin
-04 0 3.2 7.4 48.9 34.0 3.2 3.2
-02 0 6.0 26.2 47.6 17.9 2.4
-01 0 2.3 14.0 62.8 16.3 4.7
Gentamicin
-04 0 5.3 58.5 35.1 1.1
-02 0 29.8 52.4 17.9
-01 0 67.4 27.9 4.7
Nalidixic acid
-04 5 9.6 27.7 52.1 5.3 3.2 2.1
-02 0 14.3 51.2 31.0 3.6
-01 5 23.3 72.1 4.7
Tetracycline
-04 0 95.7 1.1 3.2
-02 1 96.4 2.4 1.2
-01 0 95.3 2.3 2.3
a The white fields denote range of dilutions tested for each substance. MICs above the range are given as the concentration closest to the range. MICs equal to or lower than the lowest concentration tested are given as the lowest tested concentration. Bold vertical lines indicate cut-off values defining resistance.

16 S VA R M 2 0 0 4
tive of Campylobacter prevalent in broiler chickens in Sweden.The distribution of the MICs for the C. jejuni isolates is
given in Table Camp I. Overall, levels of antimicrobial resist-ance among C. jejuni were low. This year 5% resistance to ampicillin, enrofloxacin and nalidixic acid was found. All five isolates resistant to nalidixic acid were also resistant to enrofloxacin but none of them were resistant to ampicillin. Occurrence of resistance differs numerically from year 2001 and 2002 but differences are not statistically significant. The only resistance found among the six isolates of hippurate-negative thermophilic Campylobacter spp. was one isolate resistant to nalidixic acid and enrofloxacin.
A low level of resistance, as in Campylobacter spp. from
broiler chickens in Sweden, is also seen in isolates from humans infected within the country. In two studies on isolates from Swedish human Campylobacter infections acquired in Sweden, the level of resistance was as low as for the Swedish chicken isolates. Erythromycin resistance was neither found among the human isolates nor the chicken isolates. However, in isolates from infections acquired abroad, the occurrence of both fluoroquinolone and tetracycline resistance was very high (39-95%) and a few percent of these isolates were erythromycin resistant (Österlund et al., 2003; Rönner et al., 2004). A similar situation, both in isolates from poultry and humans, is described in Norway (NORM/NORM-VET, 2003).

S VA R M 2 0 0 4 17
THE PREVALENCE of acquired resistance to antimicrobials among bacteria of the normal enteric microflora can serve as an indicator of the selective pressure exerted by use of anti-microbial agents in exposed populations. Although these bacteria are unlikely to cause diseases, they form a reservoir of transferable resistance determinants from which resist-ance genes can spread to bacteria that cause infections in animals or humans. Thus, surveillance of resistance among indicator bacteria in the normal enteric microbiota from healthy animals can be of great value to detect trends and to follow effects of interventions. In SVARM, Escherichia coli and Enterococcus spp. from healthy animals serve as indicator bacteria. The report for year 2004 presents data on isolates from broiler chickens. Indicator bacteria from this animal species were previously studied in SVARM years 2000, 2001 and 2002.
Of special interest in monitoring antimicrobial suscepti-bility among indicator bacteria is the occurrence of specific patterns of resistance. Such patterns, or phenotypes, can indicate that resistance genes are located on the same genetic element. The danger of such elements is evident as a single transfer event conveys resistance to several antimicrobials to the recipient bacterium (co-transfer). Thereby, use of one antimicrobial can select for resistance to other unrelated anti-microbials (co-selection). In SVARM 2004, analyses of asso-ciations between resistance to different antimicrobials were performed on the combined data for years 2000, 2001, 2002 and 2004. To this end, the Chi-Square test or the Fischer Exact test was used for statistical inference on the likelihood that isolates resistant to one antimicrobial also were resist-ant to another. The Chi-Square test was used for analysis of
differences in occurrence of resistance between years 2000, 2001, 2002 and 2004.
Some microbiological cut-off values defining resist-ance (breakpoints) used in SVARM 2000-2002 have been changed. To facilitate comparisons when data from these reports are presented, levels of resistance have been recalcu-lated using the current cut-off values. For a summary of cut-off values used see Appendix 3.
Isolates includedEscherichia coli and Enterococcus spp. were isolated from ceacal content from broiler chickens sampled at slaughter. Each isolate originates from a unique flock but not always from a unique production site. Antimicrobials included in the test panels and concentration ranges used are given in Table EC IV and ENT VII. For details on methodology, including sampling strategy, see Appendix 3.
Escherichia coliThe material includes 300 isolates of E. coli from broiler chickens. Isolates were obtained from 89% of 337 samples cultured, a similar isolation frequency as in SVARM 2000, 2001 and 2002.
The majority of isolates (85%) were sensitive to all 13 antimicrobials tested but 44 isolates were resistant to at least one substance. Resistance to sulphonamides, tetracycline, streptomycin, nalidixic acid or ampicillin were the most common traits (4-9%) (Table EC I). Neomycin or enro-floxacin resistance was less common (2-3%) and only one isolate was resistant to trimethoprim. No isolate was resistant
Resistance in indicator bacteria
Table EC I. Occurrence of resistance (%) among isolates of Escherichia coli from chickens, 2004. Previous data from SVARM are given for comparison.
Substance
Cut-off value (mg/L)
Resistance (%)95% confidence interval inside brackets
ChickensPigs2003
n=303
Cattle2000
n=2932004
n=3002002
n=3062001
n=2962000
n=274
Ampicillin >8 4 (2.1-6.9) 4 (2.3-7.2) 3 (1.2-5.3) 5 (2.6-8.0) 3 (1.6-6.0) 0 (0.0-1.3)
Apramycin >32 - - 0 (0.0-1.2) 0 (0.0-1.2) 0 (0.0-1.3) 0a (0.0-1.2) 0 (0.0-1.3)
Ceftiofur >2 0 (0.0-1.2) 0 (0.0-1.2) 0 (0.0-1.2) 0 (0.0-1.3) 0 (0.0-1.2) 0 (0.0-1.3)
Chloramphenicol >16 0 (0.0-1.2) 0 (0.0-1.2) 0 (0.0-1.2) <1 (0.1-2.6) <1 (0.1-2.4) 0 (0.0-1.3)
Enrofloxacin >0.25 2 (0.9-4.8) 3 (1.6-5.9) <1 (0.1-2.4) 4 (1.8-6.6) <1 (0.1-2.4) <1 (0.0-1.9)
Florfenicol >16 0 (0.0-1.2) 0 (0.0-1.2) 0 (0.0-1.2) 0 (0.0-1.3) 0 (0.0-1.2) 0 (0.0-1.3)
Gentamicin >8 0 (0.0-1.2) <1 (0.0-1.8) <1 (0.0-1.9) <1 (0.0-2.0) 0 (0.0-1.2) 0 (0.0-1.3)
Nalidixic acid >16 5 (2.8-8.1) 5 (2.5-7.6) 2 (0.6-3.9) 4 (2.3-7.5) 1 (0.2-2.9) <1 (0.1-2.4)
Neomycin >8 3 (1.6-6.1) 2 (0.7-4.2) <1 (0.0-1.9) <1 (0.1-2.6) 1 (0.2-2.9) 0 (0.0-1.3)
Streptomycin >32 5 (2.8-8.1) 4 (1.8-6.3) 2 (1.0-4.8) 4 (2.3-7.5) 10 (6.8-13.8) 5 (2.9-8.3)
Sulphamethoxazole >256 9 (6.0-12.8) 10 (6.7-13.7) 12 (8.4-16.1) 12 (8.1-16.0) 9 (6.0-12.7) 1 (0.4-3.5)
Tetracycline >8 6 (3.6-9.3) 6 (3.3-8.8) 4 (2.4-7.4) 8 (4.8-11.5) 12 (8.2-15.7) 1 (0.4-3.5)
Trimethoprim >8 <1 (0.0-1.8) <1 (0.0-1.8) 1 (0.2-2.9) <1 (0.1-2.6) 4 (2.3-7.2) 0 (0.0-1.3)
a 220 isolates tested.

18 S VA R M 2 0 0 4
to chloramphenicol, florfenicol, ceftio-fur or gentamicin. Twenty-four isolates (8%) were resistant to more than one antimicrobial and 16 isolates (5%) were multiresistant, i.e. were resistant to three or more of the antimicrobials tested (Table EC II).
Among the 1176 isolates from years 2000, 2001, 2002 and 2004, resist-ance to some antimicrobials was often associated with increased occurrence of resistance to other substances (Table EC III). For several pairs of antimicro-bials the association was statistically significant (P<0.001) (Table EC III).
Three percent (40/1176) of the isolates from years 2000, 2001, 2002 and 2004 were multiresistant (Table EC II). The most prevalent traits in these isolates were resistance to sulphonamides, tetracycline, strepto-mycin, or nalidixic acid. Twenty-eight multiresistant isolates (70%) were resistant to both sulphonamides and tetracycline in combination with other traits. In 20 isolates (50%), resistance to sulphonamides and tetracycline was combined with resistance to strepto-mycin and in 15 isolates (38%) with
Table EC II. Number of Escherichia coli resistant to three or more antimicrobials, presented by year and resistance phenotype, chickens 2004. ”R” in shaded fields indicates resistance. Previous data from SVARM are included.
Year Resistance patterna
2004n=300
2002n=306
2001n=296
2000n=274 Su Tc Sm Nal Ef Am Tm Cm Nm Gm
1 R R R R R R
2 1 R R R R R R
1 R R R R R R
4 3 1 R R R R R
1 R R R R R R
2 R R R R
1 R R R R
1 1 1 R R R
1 R R R R
1 R R R R R
1 R R R
1 1 1 R R R
1 R R R R
1 R R R
1 R R R R
1 R R R
1 R R R R
1 R R R R
1 R R R R
1 1 R R R
1 R R R R
1 R R R
2 R R R
1 R R R
16 9 6 9
(5%) (3%) (2%) (3%) Total number of multiresistant isolates
a Su: sulphonamides; Tc: tetracycline; Sm: streptomycin; Nal: nalidixic acid; Ef: enrofloxacin; Am: ampicillin; Tm: trimethoprim; Cm: chloramphenicol; Nm: neomycin; Gm: gentamicin.
Table EC III. Association between resistance traits in Escherichia coli isolated from chickens years 2000, 2001, 2002 and 2004 (n=1176). For each substance the first line gives the resistance rates for susceptible isolates (S) and the second line rates for resistant isolates (R).
Single substance susceptibility
Resistance (%)a
n Am Ce Cm Ef Ff Gm Nal Nm Sm Su Tc Tm
AmpicillinS 1130 0.0 0.0 0.1 2.5 0.0 0.3 3.9 1.5 3.5 9.9 5.3 0.5R 46 100.0 0.0 2.2 2.2 0.0 0.0 4.3 4.3 10.9 26.1b 19.62 2.2
CeftiofurS 1176 3.9 0.0 0.2 2.5 0.0 0.3 3.9 1.6 3.8 10.5 5.9 0.6R 0 0.0 - 0.0 0.0 0.0 0.0 0.0 0.0 0.0 0.0 0.0 0.0
ChloramphenicolS 1174 3.8 0.0 0.0 2.4 0.0 0.3 3.8 1.6 3.7 10.4 5.8 0.6R 2 50.0 0.0 100.0 50.0 0.0 0.0 50.0 0.0 100.0 100.0 50.0 0.0
EnrofloxacinS 1147 3.9 0.0 0.1 0.0 0.0 0.3 1.5 1.3 3.3 10.3 5.1 0.4R 29 3.4 0.0 3.4 100.0 0.0 0.0 100.0b 13.8b 24.1b 20.7 34.5b 6.9
FlorfenicolS 1176 3.9 0.0 0.2 2.5 0.0 0.3 3.9 1.6 3.8 10.5 5.9 0.6R 0 0.0 0.0 0.0 0.0 - 0.0 0.0 0.0 0.0 0.0 0.0 0.0
GentamicinS 1173 3.9 0.0 0.2 2.5 0.0 0.0 3.9 1.6 3.8 10.4 5.8 0.6R 3 0.0 0.0 0.0 0.0 0.0 100.0 0.0 0.0 33.3 66.7 33.3 0.0
Nalidixic acidS 1130 3.9 0.0 0.1 0.0 0.0 0.3 0.0 0.3 2.3 9.2 4.0 0.4R 46 4.3 0.0 2.2 63.0b 0.0 0.0 100.0 34.8b 41.3b 43.5b 52.2b 6.5
NeomycinS 1157 3.8 0.0 0.2 2.2 0.0 0.3 2.6 0.0 2.3 9.4 4.7 0.5R 19 10.5 0.0 0.0 21.1b 0.0 0.0 84.2b 100.0 94.7b 78.9b 78.9b 5.3
StreptomycinS 1131 3.6 0.0 0.0 1.9 0.0 0.2 2.4 0.1 0.0 8.3 4.1 0.5R 45 11.1 0.0 4.4 15.6b 0.0 2.2 42.2b 40.0b 100.0 66.7b 51.1b 2.2
SulphametoxazoleS 1052 3.2 0.0 0.0 2.2 0.0 0.1 2.5 0.4 1.4 0.0 2.9 0.1R 124 9.7b 0.0 1.6 4.8 0.0 1.6 16.1b 12.1b 24.2b 100.0 31.5b 4.8b
TetracyclineS 1107 3.3 0.0 0.1 1.7 0.0 0.2 2.0 0.4 2.0 7.7 0.0 0.3R 69 13.0b 0.0 1.4 14.5b 0.0 1.4 34.8b 21.7b 33.3b 56.5b 100.0 5.8b
TrimethoprimS 1169 3.8 0.0 0.2 2.3 0.0 0.3 3.7 1.5 3.8 10.1 5.6 0.0R 7 14.3 0.0 0.0 28.6b 0.0 0.0 42.9b 14.3 14.3 85.7b 57.1b 100.0
a Am: ampicillin; Ce: ceftiofur; Cm: chloramphenicol; Ef: enrofloxacin; Ff: florfenicol; Gm: gentamicin; Nal: nalidixic acid; Nm: neomycin; Sm: streptomycin; Su: sulphametoxazole; Tc: tetracycline; Tm: trimethoprim, b Association between resistance traits statistically significant, p<0.001.

S VA R M 2 0 0 4 19
Table EC IV. Distribution of MICs for Escherichia coli from broiler chickens year 2004 (n=300). Data from SVARM years 2000 (n=274), 2001 (n=296) and 2002 (n=306) are given for comparison.
Substance Year
Resis-tance(%)
Distribution (%) of MICsa (mg/L)
≤0.03 0.06 0.12 0.25 0.5 1 2 4 8 16 32 64 128 256 512 1024 2048 >2048
Ampicillin
-04 4 0.3 4.0 55.0 35.7 1.0 0.3 3.7
-02 4 1.0 9.2 65.0 20.6 0.7 3.6
-01 3 0.3 5.7 47.6 43.2 0.3 2.7
-00 5 1.8 23.4 69.3 0.7 4.7
Apramycin
-02 0 0.3 1.0 26.5 54.6 17.6
-01 0 0.7 30.1 59.1 10.1
-00 0 0.4 2.6 25.2 55.1 16.8
Ceftiofur
-04 0 1.0 15.0 69.0 15.0
-02 0 13.7 68.0 17.6 0.7
-01 0 16.9 72.0 11.1
-00 0 11.3 74.5 14.2
Chloram-phenicol
-04 0 8.7 72.0 19.3
-02 0 1.6 70.3 27.8 0.3
-01 0 1.7 64.2 34.1
-00 <1 27.0 72.3 0.7
Enrofloxacin
-04 2 19.3 62.3 13.3 2.7 1.7 0.3 0.3
-02 3 20.9 68.6 6.2 1.0 2.6 0.7
-01 <1 33.4 63.9 1.0 1.0 0.7
-00 4 19.3 75.2 1.1 0.7 2.2 1.5
Florfenicol
-04 0 53.0 46.7 0.3
-02 0 0.7 50.3 47.1 2.0
-01 0 1.4 49.0 49.0 0.7
-00 0 13.9 85.0 1.1
Gentamicin
-04 0 17.3 70.0 12.0 0.3 0.3
-02 <1 1.3 26.1 55.9 14.7 1.6 0.3
-01 <1 0.3 16.2 51.0 27.7 4.4 0.3
-00 <1 14.6 52.2 30.7 2.2 0.4
Nalidixic acid
-04 5 1.0 24.3 67.0 2.7 3.0 0.7 1.3
-02 5 20.3 69.6 5.6 0.3 1.0 1.3 2.0
-01 2 8.4 52.4 35.8 1.7 0.7 1.0
-00 4 23.7 66.8 5.1 1.1 3.3
Neomycin
-04 3 88.0 7.0 1.7 3.3
-02 2 1.3 36.3 52.0 8.5 0.3 1.3 0.3
-01 <1 1.4 52.0 40.9 5.4 0.3
-00 <1 1.1 51.5 40.5 6.2 0.7
Streptomycin
-04 5 0.3 29.3 57.3 7.3 0.7 1.3 2.0 1.3 0.3
-02 4 1.6 44.4 48.7 1.6 0.7 1.3 1.3 0.3
-01 2 2.0 56.4 35.8 3.4 1.0 0.7 0.7
-00 4 2.9 59.9 32.1 0.7 0.7 0.7 1.1 1.8
Sulphamethoxazole
-04 9 54.0 25.3 8.7 3.0 0.7 8.3
-02 10 64.7 25.5 9.8
-01 12 64.2 23.0 1.0 11.8
-00 12 32.5 54.4 1.5 11.7
Tetracycline
-04 6 1.7 41.0 50.3 1.0 6.0
-02 6 1.0 31.0 49.7 11.8 1.0 0.3 5.2
-01 4 22.3 62.8 10.1 0.3 0.3 4.1
-00 8 5.1 59.9 27.0 0.4 0.4 7.3
Trimethoprim
-04 <1 20.7 50.3 26.0 2.3 0.3 0.3
-02 <1 0.7 23.2 58.5 14.7 2.6 0.3
-01 1 1.7 20.6 59.5 15.9 1.0 0.3 1.0
-00 <1 2.6 8.0 55.5 32.1 1.1 0.7
≤0.03 0.06 0.12 0.25 0.5 1 2 4 8 16 32 64 128 256 512 1024 2048 >2048
a The white fields denote range of dilutions tested for each substance. MICs above the range are given as the concentration closest to the range. MICs equal to or lower than the lowest concentration tested are given as the lowest tested concentration. Bold vertical lines indicate microbiological cut-off values defining resistance.

20 S VA R M 2 0 0 4
resistance to nalidixic acid. Thirteen isolates (33%) had all four traits in their resistance phenotype.
Overall, frequencies of resistance are low in an interna-tional perspective and have been stable over the four years studied (Table EC I). Nor is there any statistically significant increase in the occurrence of multiresistant isolates (Table EC II). Sulphonamide resistance was the most common trait, which could be a consequence of the occasional use of this substance to treat coccidiosis in broiler chickens. A direct selection pressure cannot explain resistance to the other substances as they are used in small amounts only (tetracy-clines and fluoroquinolones) or not at all (aminoglycosides and ampicillin). The observed association between sulphona-mide resistance and other resistance traits (Table EC III), however, implies that use of sulphonamides might co-select for resistance to other substances.
EnterococcusThe material includes 306 isolates from broiler chickens. Enterococcus faecium (53%) was the predominant species followed by E. faecalis (16%), E. hirae (11%) and E. durans (9%) (Table ENT I). Other species of enterococci isolated were E. mundtii (<1%). About ten percent of the isolates could not be typed to species level.
All enterococciNarasin resistance was by far the most common trait (81%) (Table ENT II). Resistance to bacitracin, tetracycline or erythromycin was considerably less common (18-25%) and only occasional isolates were resistant to neomycin, strepto-mycin and vancomycin. No isolate was resistant to ampicil-lin, avilamycin, chloramphenicol or gentamicin. Flavomycin and virginiamycin are not included in the overall compari-son as the inherent susceptibility to these substances differs between species of enterococci.
Three isolates of vancomycin-resistant enterococci (VRE) were obtained on direct culture. All three were E. faecium and had MIC of vancomycin >128 mg/L, in addition they were resistant to narasin and erythromycin. However, all samples were also cultured selectively using media supple-mented with vancomycin (see Appendix III for details). From these cultures, VRE were obtained from 115 of 321 samples (36%). All isolates were E. faecium with MIC of vancomycin >128 mg/L and were resistant to narasin. The majority, 88% (101/115), were resistant also to erythromycin. In all 31 isolates tested by PCR, the vanA gene was detected. Further, the vast majority of isolates had an identical pattern on subtyping using the PhenePlateTM system (see Appendix III for details).
Table ENT I. Prevalence of enterococci in samples of caecal content from broiler chickens, 2004. Species not identified as Enterococcus faecalis, E. faecium or E. hirae are given as “other species”. Previous data from SVARM are given for comparison.
YearNo. of samples
culturedPercent positive
cultures
No. of isolates tested for antimicrobial
susceptibility
Enterococcus species isolatedNo. of isolates (percent of total No. of isolates inside brackets)
E. faecalis E. faecium E. hirae Other species
2004 321 95% 306 48 (16%) 163 (53%) 34 (11%) 61 (20%)
2002 351 95% 332 57 (17%) 189 (57%) 45 (14%) 41 (12%)
2001 324 93% 302 49 (16%) 204 (68%) 27 (9%) 22 (7%)
2000 317 82% 261 47 (18%) 151 (58%) 28 (11%) 35 (13%)
Table ENT II. Occurrence of resistance (%) among isolates of Enterococcus spp. broiler chickens, 2004. Previous data from SVARM are given for comparison.
Substance
Cut-off value(mg/L)
Percent resistant95% confidence interval inside brackets
ChickensPigs2003
n=315
Cattle2000
n=2772004
n=3062002
n=3322001
n=3022000
n=261
Ampicillin >8 0 (0.0-1.2) 0 (0.0-1.1) <1 (0.0-1.8) 0 (0.0-1.4) <1 (0.0-1.8) 0 (0.0-1.3)
Avilamycin >16 0 (0.0-1.2) <1 (0.0-1.7) 0 (0.0-1.2) 0 (0.0-1.4) 0 (0.0-1.2) <1 (0.0-2.0)
Bacitracina >32 25 (20.4-30.4) 22 (17.9-27.2) 16 (12.3-20.9) 20 (14.9-24.9) 3 (1.5-5.8) <1 (0.1-2.6)
Chloramph. >16 0 (0.0-1.2) - - - 3 (1.1-4.9) -
Erythromycin >4 18 (13.5-22.4) 20 (16.3-25.5) 21 (16.1-25.5) 19 (14.6-24.5) 13 (9.8-17.6) 3 (1.0-5.1)
Gentamicin >512 0 (0.0-1.2) 0 (0.0-1.1) 0 (0.0-1.2) 0 (0.0-1.4) 2 (0.7-4.1) 0 (0.0-1.3)
Narasin >2 81 (75.9-85.0) 72 (66.8-76.8) 75 (69.6-79.6) 72 (65.8-77.0) 3 (1.5-5.8) 1 (0.4-3.7)
Neomycin >1024 <1 (0.0-1.8) 0 (0.0-1.1) 0 (0.0-1.2) 0 (0.0-1.4) 4 (1.8-6.2) <1 (0.0-2.0)
Streptomycin >1024 <1 (0.1-2.3) 1 (0.3-3.1) <1 (0.1-2.4) 2 (0.9-4.9) 5 (3.2-8.5) <1 (0.1-2.6)
Tetracycline >8 20 (15.9-25.2) 27 (22.4-32.2) 31 (25.6-36.3) 37 (30.9-43.0) 30 (24.5-34.9) 5 (3.1-8.8)
Vancomycin >16 1 (0.2-2.8) <1 (0.0-1.7) 0 (0.0-1.2) 0 (0.0-1.4) 0 (0.0-1.2) 0 (0.0-1.3)
a MIC in U/mL.

S VA R M 2 0 0 4 21
Enterococcus faecalisMost isolates of E. faecalis (77%) were resistant to at least one antimicrobial. Resistance to tetracycline (46%) or nara-sin (35%) were the most prevalent traits but resistance to bacitracin (29%) or erythromycin (25%) was also common (Table ENT III). Resistance to streptomycin, flavomycin or neomycin was less frequent (2-4%). No isolate was resist-ant to ampicillin, avilamycin, chloramphenicol gentamicin or vancomycin. Twenty-four isolates (50%) were resistant to more than one antimicrobial and six isolates (13%) were multiresistant (Table ENT IV).
Among the 201 isolates from years 2000, 2001, 2002
and 2004, resistance to some substances was associated with increased occurrence of resistance to other substances (Table EC V). The association between resistance traits was statistically significant (p<0.001) for bacitracin-tetracycline, bacitracin-erythromycin, narasin-erythromycin and narasin-flavomycin (Table EC V).
Enterococcus faeciumThe majority of E. faecium (96%) were resistant to at least one of the antimicrobials tested. The most prevalent trait was narasin (93%) followed by bacitracin (32%), tetracycline (16%) and erythromycin (10%) (Table ENT III). Occasional
Table ENT III. Occurrence of resistance (%) among Enterococcus faecalis, E. faecium and E. hirae from broiler chickens, presented by bacterial species and source of isolates, 2004. Previous data from SVARM are given for comparison. Cut-off values defining resistance are given in Table ENT II.
Substance
E. faecalis E. faecium E. hirae
Chickens Pigs Cattle Chickens Pigs Cattle Chickens Pigs Cattle
2004n=48
2002n=57
2001n=49
2000n=47
2003n=87
2000n=22
2004n=163
2002n=189
2001n=204
2000n=151
2003n=71
2000n=71
2004n=34
2002n=45
2001n=27
2000n=28
2003n=124
2000n=127
Ampicillin 0 0 0 0 0 0 0 0 <1 0 0 0 0 0 0 0 <1 0
Avilamycin 0 2 0 0 0 0 0 0 0 0 0 1 0 0 0 0 0 0
Bacitracin 29 35 31 23 0 0 32 24 15 20 13 1 0 2 4 7 0 0
Chloramph. 0 - - - 9 - 0 - - - 0 - 0 - - - 0 -
Erythromycin 25 26 41 30 25 5 10 11 15 12 18 6 27 40 22 25 4 0
Flavomycin 4 2 6 11 3 14 NR NR NR NR NR NR NR NR NR NR NR NR
Gentamicin 0 0 0 0 7 0 0 0 0 0 0 0 0 0 0 0 0 0
Narasin 35 39 45 43 1 0 93 78 80 79 3 1 91 87 89 89 2 2
Neomycin 2 0 0 0 12 0 0 0 0 0 0 0 0 0 0 0 <1 0
Streptomycin 4 7 4 9 16 5 0 0 0 1 0 0 0 0 0 4 2 0
Tetracycline 46 58 67 60 63 14 16 25 27 38 15 6 3 7 4 7 14 <1
Vancomycin 0 0 0 0 0 0 2 <1 0 0 0 0 0 0 0 0 0 0
Virginiamycin NRa NR NR NR NR NR 2 11 11 8 2 1 3 7 52 11 0 0
a Not relevant as susceptibility in some species of Enterococcus is inherently low.
Table ENT IV. Number of isolates of Enterococcus faecalis (left panel) and E. faecium (right panel) resistant to three or more antimicrobials, presented by year and resistance phenotype, broiler chickens 2004. ”R” in shaded fields indicates resistance. Previous data from SVARM are given for comparison.
E. faecalis E. faecium
Year Resistance patterna Year Resistance patterna
2004n=48
2002n=57
2001n=49
2000n=47 Na Tc Em Ba Sm Fl Nm
2004n=163
2002n=189
2001n=204
2000n=151 Na Tc Em Ba Sm Vi Va
3 7 2 R R R R 1 R R R R R
1 2 2 R R R R R 1 2 R R R R
1 R R R R 2 1 1 R R R R
1 1 3 1 R R R 5 5 5 R R R
1 R R R R 2 2 2 R R R R
1 1 R R R 3 3 5 9 R R R
1 1 R R R 3 7 5 R R R
1 1 1 1 R R R 2 2 1 R R R
3 1 R R R 3 1 R R R
1 R R R R 2 R R R
1 R R R 1 3 R R R
2 5 R R R 1 1 R R R
1 R R R R 1 R R R
6(13%)
10(18%)
17(35%)
14(30%)
Total number of multiresistant isolates 12(7%)
23(12%)
21(10%)
26(17%)
Total number of multiresistant isolates
a Na: narasin; Tc: tetracycline; Em: erythromycin; Ba: bacitracin; Sm: streptomycin; Fl: flavomycin; Nm: neomycin; Vi: virginiamycin; Va: vancomycin.

22 S VA R M 2 0 0 4
IN SVARM, SAMPLES COLLECTED for isolation of indica-tor bacteria from healthy animals are, in addition to direct culture, also cultured on media supplemented with vanco-mycin. This is to increase the sensitivity to detect vancomy-cin-resistant enterococci (VRE). Since the start of SVARM year 2000, only four isolates of VRE, all from broiler chickens, have been obtained on direct culture but when using supplemented media VRE have been isolated from an increasing proportion of samples from broiler chickens (Figure ENT 1). In contrast, VRE have not been found in samples from pigs (n=1440) or cattle (n=317) even after culture on vancomycin-supplemented media.
In many parts of the world VRE have become important causes of nosocomial infections in humans but such infec-tions are still uncommon in Sweden (Goossens et al. 2003, SWEDRES 2003). The increased proportion of Swedish broiler chickens carrying VRE is undesired since these bacteria might be transferred to humans through the food chain. The genes that confer acquired vancomycin-resistance may then be transferred to enterococci colonizing humans (Bonten et al. 2001).
In the mid-90s it was shown that the growth promoter avoparcin, a glycopeptide like vancomycin, selected for VRE in the intestinal tract of exposed animals (Aarestrup
1995, Klare et al. 1995, Bager et al. 1997). Thus, reservoirs of VRE in food-producing animals were created. These findings led to a discontinuation of avoparcin use in the EU in 1997 but by that time VRE were common among broiler chickens and pigs in many European countries where avoparcin had been used. After the ban on avoparcin, the prevalence of VRE among animals has decreased but these bacteria are still endemic among food-producing animals
in many European countries (Bonten et al. 2001).
In Sweden, avoparcin has not been used since the early 80s and consequently VRE were not isolated from broiler chickens in investigations from the mid 90s (Greko 1996, Quednau et al. 1996, Greko & Lindblad 1996). The appearance and increased occurrence of these bacteria in the last years is therefore puzzling.
All 224 isolates of VRE obtained from broilers within the framework of SVARM have been Enterococcus
faecium. The majority have the same antibiogram, includ-ing resistance to vancomycin, narasin, flavomycin and low level resistance to erythromycin (MIC 8-16 mg/L) (Table ENT X). All 79 isolates investigated by PCR carried the vanA gene. Moreover, the vast majority of isolates have an identical phenotype when tested by the PhenePlateTM system and most isolates examined by PFGE have a pattern differing by only +/- one band. These findings
Vancomycin-resistant enterococci (VRE) in Swedish broiler chickens
No.
of s
amp
les/
isol
ates
0
50
100
150
200
250
300
350
VRE isolated
Samples cultured
2004200220012000
Fig ENT 1. Number of samples cultured on vancomycin supplemented media and number of samples were VRE were isolated. Caecal samples from broiler chickens cultured within SVARM.
isolates were resistant to vancomycin or virginiamycin. No isolate was resistant to ampicillin, avilamycin, chlorampheni-col, gentamicin, neomycin or streptomycin. Eighty-one isolates (50%) were resistant to more than one antimicrobial and 12 were multiresistant (7%) (Table ENT IV).
Among the 707 isolates from years 2000, 2001, 2002 and 2004 resistance to some antimicrobials was associated with increased occurrence of resistance to other substances, but only the association tetracycline-virginiamycin was statisti-cally significant at p<0.001 (Table ENT IV).
Enterococcus hiraeMost isolates (97%) were resistant to at least one antimicro-bial. Resistance to narasin was the most prevalent trait (91%) but resistance to erythromycin was also common (27%)
(Table ENT III). Of the other antimicrobials tested, occa-sional isolates were resistant to tetracycline or virginiamycin. No isolate was multiresistant.
Comments in relation to previous yearsOccurrence of resistance among enterococci was about the same as in years 2000, 2001 and 2002. Narasin resistance is by far the most prevalent trait in all species of enterococci and seems to have increased in E. faecium (p<0.001). The common occurrence of this resistance trait is a consequence of the widespread use of narasin as coccidiostat in broiler chicken production.
Among E. faecalis and E. faecium resistance to erythromy-cin, tetracycline or bacitracin is also common. The propor-tion of erythromycin resistant isolates has been stable over

S VA R M 2 0 0 4 23
the years studied, whereas tetracycline resistance seems to be declining in both species as well as in E. hirae. Among E. faecium the decline is statistically significant (p<0.001). In contrast, the proportion of bacitracin resistant E. faecium has increased significantly (p<0.001).
Macrolides or tetracyclines are used in small amounts only in Swedish broiler production and virginiamycin and baci-tracin have not been used since the 90s respectively the 80s (SVARM 2000). Therefore, occurrence of these resistance traits cannot be a consequence of a direct selection pressure but might be a remnant of past use. As resistance to narasin appears to be associated with resistance to bacitracin and to flavomycin in E. faecalis, co-selection by use of narasin could be of importance for retaining these resistance traits.
Notably, only three isolates of VRE were obtained on
direct cultures but such bacteria were isolated from 36% of 321 samples cultured selectively using media containing vancomycin. This shows that direct cultures underestimate the occurrence of VRE, as these bacteria apparently occur in the gut of a substantial proportion of broiler chickens, albeit in low numbers and as a minor constituent of the spectrum of enterococci.
The proportion of broiler chickens colonised with VRE has increased substantially since the first studies performed within the framework of SVARM, probably due to spread of an E. faecium clone carrying van-A (see “Vancomycin resist-ant enterococci (VRE) in Swedish broiler chickens”). The increase is puzzling since avoparcin, the growth promoter known to select for VRE, has not been used in Sweden since the early 80s.
strongly indicate clonality, which is in contrast to the situ-ation in e.g. Denmark where several different clones of VRE are found among broiler chickens (Aarestrup 2000, Hammerum et al. 2000, Heuer et al. 2002b, Johnsen et al. 2005). The clonality and occurrence of VRE on farms recently taken into use, makes it unlikely that the bacteria are remnants from the early 80s but suggest that a clone of VRE was introduced and spread in recent years.
To elucidate the epidemiology of VRE in Swedish broiler chickens, studies in collaboration with The Swedish Poultry Meat Association were undertaken. One objec-tive was to investigate if bacteria are spread through feed or from parental flocks via hatch-eries. In samples collected at these sites year 2002 VRE were not isolated, however (unpublished). The findings agree with results from Denmark and Norway (Borgen et al. 2000b, Heuer et al. 2002b) and show that VRE are not continuously present in feed, in flocks of parent birds or in hatcheries but does not exclude that bacteria on some occasion might have been present and thus introduced.
Further studies year 2003 showed that VRE could be isolated from pooled faecal samples from 18% of 106 production flocks (unpublished). In addition, the study showed that a flock was likely to be positive for VRE if the
bacteria were isolated from the preceding flock raised in the same house. Apparently, VRE persist in the environment in the absence of a selection pressure exerted by avoparcin, which is in agreement with studies from Denmark and Norway (Borgen et al. 2000a, Heuer et al. 2002a, Heuer et al. 2002b).
VRE are seldom isolated on direct culture from Swedish broiler chickens and most likely constitute a small fraction of the intestinal micro-flora. Moreover, the proportion of farms where VRE occur, 18%, is small in an international perspec-tive. In e.g. Denmark and Norway studies have shown that VRE occur in the major-ity of broiler flocks, 74 and 96% respec-tively, raised on farms where avoparcin was used until the late 90s (Heuer et al. 2002a, Sörum et al. 2004). Nevertheless, further studies of the
epidemiology of VRE among Swedish broiler chickens are needed.
In Sweden, isolates from chickens carry the vanA gene, whereas human isolates mainly carry the vanB gene (SWEDRES 2004). This is a strong indication that at present, enterococci from Swedish broiler chickens not are a likely source of genes coding for vancomycin resistance in enterococci causing human nosocomial infections.
Table ENT X. Resistance pattern of vancomycin resistant Enterococcus faecium isolated using vancomycin supplemented media within SVARM years 2000, 2001, 2002 and 2004. Cut-off values defining resistance (mg/L) are given inside brackets.
No. of iso-lates %
Resistance patterna
Va(>128)
Na(>2)
Em(>4)
Fl(>32)
Ba(>32)
Vi(>8)
Tc(>8)
200 89 R R R R
11 5 R R R
7 3 R R R R
1 <1 R R R R R
1 <1 R R R R
1 <1 R R R
1 <1 R R R R
1 <1 R R R R
1 <1 R R R
a Va: vancomycin; Na: narasin; Em: erythromycin; Fl: flavomycin; Ba: baci-tracin; Vi: virginiamycin; Tc: tetracycline.

24 S VA R M 2 0 0 4
Table ENT V. Association between resistance traits in Enterococcus faecalis isolated from broiler chickens years 2000, 2001, 2002 and 2004 (n=201). For each substance the first line gives the resistance rates for susceptible isolates (S) and the second line rates for resistant isolates (R).
Single substance susceptibility n
Resistancea (%)
Am Av Ba Cm Em Fl Gm Na Nm Sm Tc Va
AmpicillinS 201 0.0 0.5 29.9 0.0 30.4 5.5 0.0 40.3 0.5 6.0 57.7 0.0R 0 0.0 0.0 0.0 0.0 0.0 0.0 0.0 0.0 0.0 0.0 0.0 0.0
AvilamycinS 200 0.0 0.0 30.0 0.0 30.5 5.5 0.0 40.5 0.5 6.0 57.5 0.0R 1 0.0 100.0 0.0 0.0 0.0 0.0 0.0 0.0 0.0 0.0 100.0 0.0
BacitracinS 141 0.0 0.7 0.0 0.0 22.7 7.8 0.0 38.3 0.7 3.6 47.5 0.0R 60 0.0 0.0 100.0 0.0 48.3b 0.0 0.0 45.0 0.0 11.7 81.7b 0.0
ChloramphenicolS 48 0.0 0.0 29.2 0.0 25.0 4.2 0.0 35.4 2.1 4.2 45.8 0.0R 0 0.0 0.0 0.0 0.0 0.0 0.0 0.0 0.0 0.0 0.0 0.0 0.0
ErythromycinS 140 0.0 0.7 22.1 0.0 0.0 6.4 0.0 27.9 0.0 2.1 54.3 0.0R 61 0.0 0.0 47.5b 0.0 100.0 3.3 0.0 68.9b 1.6 14.8 65.6 0.0
FlavomycinS 190 0.0 0.5 31.6 0.0 31.1 0.0 0.0 37.4 0.5 6.3 59.5 0.0R 11 0.0 0.0 0.0 0.0 18.2 100.0 0.0 90.9b 0.0 0.0 27.3 0.0
GentamicinS 201 0.0 0.5 29.9 0.0 30.4 5.5 0.0 40.3 0.5 6.0 57.7 0.0R 0 0.0 0.0 0.0 0.0 0.0 0.0 0.0 0.0 0.0 0.0 0.0 0.0
NarasinS 120 0.0 0.8 27.5 0.0 15.8 0.8 0.0 0.0 0.8 2.5 63.3 0.0R 81 0.0 0.0 33.3 0.0 51.9b 12.4b 0.0 100.0 0.0 11.1 49.4 0.0
NeomycinS 200 0.0 0.5 30.0 0.0 30.0 5.5 0.0 40.5 0.0 5.5 57.5 0.0R 1 0.0 0.0 0.0 0.0 100.0 0.0 0.0 0.0 100.0 100.0 100.0 0.0
SteptomycinS 189 0.0 0.5 28.0 0.0 27.5 5.8 0.0 38.1 0.0 0.0 57.7 0.0R 12 0.0 0.0 58.3 0.0 75.0 0.0 0.0 75.0 8.3 100.0 58.3 0.0
TetracyclineS 85 0.0 0.0 12.9 0.0 24.7 9.4 0.0 48.2 0.0 5.9 0.0 0.0R 116 0.0 0.9 42.2b 0.0 34.5 2.6 0.0 34.5 0.9 6.0 100.0 0.0
VancomycinS 201 0.0 0.5 29.9 0.0 30.4 5.5 0.0 40.3 0.5 6.0 57.7 0.0R 0 0.0 0.0 0.0 0.0 0.0 0.0 0.0 0.0 0.0 0.0 0.0 0.0
a Am: ampicillin; Av: avilamycin; Ba: bacitracin; Cm: chloramphenicol; Em: erythromycin; Fl: flavomycin; Gm: gentamicin; Na: narasin; Nm: neomycin; Sm: strepto-mycin; Tc: tetracycline; Va: vancomycin, b Association between resistance traits statistically significant, p<0.001.
Table ENT VI. Association between resistance traits in Enterococcus faecium isolated from broiler chickens years 2000, 2001, 2002 and 2004 (n=707). For each substance the first line gives the resistance rates for susceptible isolates (S) and the second line rates for resistant isolates (R).
Single substance susceptibility n
Resistancea (%)
Am Av Ba Cm Em Gm Na Nm Sm Tc Va Vi
AmpicillinS 706 0.0 0.0 22.4 0.0 12.0 0.0 82.3 0.0 0.1 26.1 0.6 8.2R 1 100.0 0.0 0.0 0.0 0.0 0.0 100.0 0.0 0.0 0.0 0.0 0.0
AvilamycinS 707 0.1 0.0 22.4 0.0 12.0 0.0 82.3 0.0 0.1 26.0 0.6 8.2R 0 - - 0.0 0.0 0.0 0.0 0.0 0.0 0.0 0.0 0.0 0.0
BacitracinS 549 0.2 0.0 0.0 0.0 13.5 0.0 80.0 0.0 0.2 27.7 0.7 8.6R 158 0.0 0.0 100.0 0.0 7.0 0.0 90.5 0.0 0.0 20.3 0.0 7.0
ChloramphenicolS 163 0.0 0.0 31.9 0.0 9.8 0.0 93.3 0.0 0.0 16.0 1.8 1.8R 0 0.0 0.0 0.0 - 0.0 0.0 0.0 0.0 0.0 0.0 0.0 0.0
ErythromycinS 622 0.2 0.0 23.6 0.0 0.0 0.0 82.2 0.0 0.0 24.4 0.0 8.0R 85 0.0 0.0 12.9 0.0 100.0 0.0 83.5 0.0 1.2 37.7 4.7 9.4
GentamicinS 707 0.1 0.0 22.4 0.0 12.0 0.0 82.3 0.0 0.1 26.0 0.6 8.2R 0 0.0 0.0 0.0 0.0 0.0 - 0.0 0.0 0.0 0.0 0.0 0.0
NarasinS 125 0.0 0.0 12.0 0.0 11.2 0.0 0.0 0.0 0.8 20.8 0.0 3.2R 582 0.2 0.0 24.6 0.0 12.2 0.0 100.0 0.0 0.0 27.2 0.7 9.3
NeomycinS 707 0.1 0.0 22.4 0.0 12.0 0.0 82.3 0.0 0.1 26.0 0.6 8.2R 0 0.0 0.0 0.0 0.0 0.0 0.0 0.0 0.0 0.0 0.0 0.0 0.0
SteptomycinS 706 0.1 0.0 22.4 0.0 11.9 0.0 82.4 0.0 0.0 26.1 0.6 8.1R 1 0.0 0.0 0.0 0.0 100.0 0.0 0.0 0.0 100.0 0.0 0.0 100.0
TetracyclineS 523 0.2 0.0 24.1 0.0 10.1 0.0 81.1 0.0 0.2 0.0 0.8 6.1R 184 0.0 0.0 17.4 0.0 17.4 0.0 85.9 0.0 0.0 100.0 0.0 14.1b
VancomycinS 703 0.1 0.0 22.5 0.0 11.5 0.0 82.2 0.0 0.1 26.2 0.0 8.3R 4 0.0 0.0 0.0 0.0 100.0 0.0 100.0 0.0 0.0 0.0 100.0 0.0
VirginiamycinS 649 0.2 0.0 22.7 0.0 11.9 0.0 81.4 0.0 0.0 24.4 0.6 0.0R 58 0.0 0.0 19.0 0.0 13.8 0.0 93.1 0.0 1.7 44.8b 0.0 100.0
a Am: ampicillin; Av: avilamycin; Ba: bacitracin; Cm: chloramphenicol; Em: erythromycin; Gm: gentamicin; Na: narasin; Nm: neomycin; Sm: streptomycin; Tc: tetra-cycline; Va: vancomycin; Vi: virginiamycin, b Association between resistance traits statistically significant, p<0.001.

S VA R M 2 0 0 4 25
Table ENT VII. Distribution of MICs for Enterococcus faecalis from broiler chickens year 2004 (n=48). Data for years 2000 (n=47), 2001 (n=49) and 2002 (n=57) are given for comparison (SVARM 2000, 2001 and 2002).
Substance Year
Resis-tance (%)
Distribution (%) of MICsa (mg/L)
≤0.12 0.25 0.5 1 2 4 8 16 32 64 128 256 512 1024 >1024
Ampicillin
-04 0 2.1 20.8 72.9 4.2
-02 0 1.8 3.5 89.5 5.3
-01 0 4.1 10.2 79.6 6.1
-00 0 8.5 70.2 19.1 2.1
Avilamycin
-04 0 6.3 81.3 12.5
-02 2 5.3 78.9 14.0 1.8
-01 0 2.0 2.0 57.1 36.7 2.0
-00 0 2.1 80.9 14.9 2.1
Bacitracinb
-04 29 2.1 12.5 31.3 22.9 2.1 2.1 27.1
-02 35 1.8 1.8 14.0 42.1 5.3 35.1
-01 31 2.0 2.0 8.2 26.5 16.3 14.3 30.6
-00 23 8.5 2.1 4.3 23.4 36.2 2.1 23.4
Chloramph.
-04 0 41.7 54.2 4.2
-02 -
-01 -
-00 -
Erythromycin
-04 25 33.3 25.0 16.7 8.3 8.3 2.1 6.3
-02 26 24.6 7.0 36.8 5.3 8.8 1.8 1.8 14.0
-01 41 8.2 28.6 8.2 12.2 2.0 10.2 4.1 26.5
-00 30 10.6 21.3 27.7 10.6 4.3 4.3 4.3 17.0
Flavomycin
-04 4 60.4 31.3 2.1 2.1 4.2
-02 2 1.8 68.4 28.1 1.8
-01 6 2.0 67.3 20.4 4.1 2.0 4.1
-00 11 6.4 63.8 12.8 4.3 2.1 2.1 8.5
Gentamicin
-04 0 2.1 6.3 66.7 18.8 6.3
-02 0 3.5 31.6 50.9 12.3 1.8
-01 0 2.0 6.1 10.2 49.0 28.6 4.1
-00 0 2.1 6.4 36.2 44.7 10.6
Narasin
-04 35 25.0 33.3 6.3 16.7 16.7 2.1
-02 39 3.5 26.3 22.8 8.8 33.3 5.3
-01 45 12.2 18.4 10.2 4.1 10.2 24.5 14.3 6.1
-00 43 4.3 19.1 21.3 6.4 6.4 14.9 23.4 2.1 2.1
Neomycin
-04 2 2.1 2.1 12.5 39.6 29.2 12.5 2.1
-02 0 1.8 19.3 40.4 33.3 5.3
-01 0 4.1 2.0 18.4 32.7 16.3 18.4 8.2
-00 0 6.4 6.4 17.0 31.9 34.0 4.3
Streptomycin
-04 4 6.3 64.6 25.0 4.2
-02 7 3.5 45.6 40.4 3.5 7.0
-01 4 4.1 24.5 53.1 12.2 2.0 4.1
-00 9 2.1 2.1 8.5 51.1 27.7 8.5
Tetracycline
-04 46 22.9 29.2 2.1 12.5 10.4 14.6 8.3
-02 58 1.8 1.8 24.6 8.8 1.8 3.5 19.3 29.8 8.8
-01 67 2.0 22.4 6.1 2.0 22.4 14.3 30.6
-00 60 2.1 25.5 12.8 12.8 21.3 25.5
Vancomycin
-04 0 6.3 75.0 18.8
-02 0 8.8 71.9 19.3
-01 0 14.3 73.5 12.2
-00 0 19.1 68.1 12.8
Virginiamycin
-04 NRc 2.1 2.1 12.5 33.3 47.9 2.1
-02 NR 1.8 1.8 8.8 28.1 57.9 1.8
-01 NR 2.0 2.0 8.2 14.3 22.4 42.9 8.2
-00 NR 4.3 2.1 6.4 8.5 19.1 48.9 10.6
≤0.12 0.25 0.5 1 2 4 8 16 32 64 128 256 512 1024 >1024
a The white fields denote range of dilutions tested for each substance. MICs above the range are given as the concentration closest to the range. MICs equal to or lower than the lowest concentration tested are given as the lowest tested concentration. Bold vertical lines indicate cut-off values defining resistance; b MIC in U/mL, see Appendix 3 for details; c Not relevant as susceptibility in E. faecalis is inherently low.

26 S VA R M 2 0 0 4
Table ENT VIII. Distribution of MICs for Enterococcus faecium from broiler chickens year 2004 (n=163). Data for years 2000 (n=151), 2001 (n=204) and 2002 (n=189) are given for comparison (SVARM 2000, 2001 and 2002).
Substance Year
Resis-tance(%)
Distribution (%) of MICsa (mg/L)
≤0.12 0.25 0.5 1 2 4 8 16 32 64 128 256 512 1024 >1024
Ampicillin
-04 0 10.4 18.4 19.0 38.0 11.7 2.5
-02 0 4.8 21.7 29.1 27.5 12.7 4.2
-01 <1 15.7 19.6 24.0 25.0 10.8 4.4 0.5
-00 0 5.3 19.2 19.9 23.8 23.8 7.9
Avilamycin
-04 0 0.6 3.7 45.4 38.0 10.4 1.8
-02 0 1.6 10.6 52.4 30.7 4.8
-01 0 1.5 4.9 26.0 61.3 6.4
-00 0 0.7 4.0 32.5 57.0 6.0
Bacitracinb
-04 32 21.5 3.7 3.7 9.8 19.6 9.8 18.4 13.5
-02 24 1.6 19.6 3.7 4.8 11.1 21.2 13.8 24.3
-01 15 2.0 21.6 2.9 3.9 21.1 21.6 12.3 14.7
-00 20 2.0 10.6 4.6 4.0 25.8 22.5 10.6 19.9
Chloramph.
-04 0 1.8 65.6 31.3 1.2
-02
-01
-00
Erythromycin
-04 10 37.4 43.6 6.7 2.5 3.1 4.3 2.5
-02 11 0.5 20.6 11.6 46.6 9.5 3.7 1.1 1.1 5.3
-01 15 9.3 17.2 33.3 16.7 8.8 2.9 0.5 11.3
-00 12 2.6 19.9 20.5 31.8 13.2 0.7 2.0 9.3
Flavomycin
-04 NRc 0.6 4.9 2.5 1.8 4.9 85.3
-02 NR 1.6 2.6 3.7 3.2 3.7 4.8 80.4
-01 NR 2.0 6.4 2.0 4.9 1.5 2.0 81.3
-00 NR 0.7 4.0 3.3 2.6 1.3 2.0 86.1
Gentamicin
-04 0 1.2 3.7 32.5 54.0 8.6
-02 0 0.5 0.5 20.1 49.2 25.9 3.7
-01 0 0.5 1.0 6.4 22.1 51.5 17.6 1.0
-00 0 6.6 33.1 51.0 9.3
Narasin
-04 93 3.1 1.8 1.8 35.0 55.2 3.1
-02 78 0.5 2.6 3.7 6.3 9.0 36.5 39.7 1.6
-01 80 0.5 0.5 2.9 8.3 7.8 26.0 48.5 5.4
-00 79 0.7 6.6 3.3 9.9 23.2 53.6 2.6
Neomycin
-04 0 1.2 16.6 45.4 27.0 9.2 0.6
-02 0 10.6 34.4 36.0 15.9 2.6 0.5
-01 0 1.5 15.2 30.9 33.3 14.2 4.4 0.5
-00 0 9.3 45.7 27.2 11.3 4.6 2.0
Streptomycin
-04 0 50.3 48.5 0.6 0.6
-02 0 0.5 9.0 42.3 46.6 1.6
-01 0 0.5 0.5 15.2 47.1 34.3 2.5
-00 <1 0.7 14.6 59.6 21.9 2.6 0.7
Tetracycline
-04 16 60.1 20.9 0.6 2.5 2.5 4.9 6.7 1.8
-02 25 1.6 17.5 52.4 1.6 1.6 0.5 5.8 7.4 11.6
-01 26 2.0 4.4 50.5 13.7 1.0 2.0 3.9 8.3 14.2
-00 38 0.7 6.0 47.0 6.0 1.3 1.3 8.6 10.6 18.5
Vancomycin
-04 2 89.0 7.4 1.8 1.8
-02 <1 76.2 18.5 4.2 0.5 0.5
-01 0 78.9 12.7 8.3
-00 0 79.5 14.6 4.6 1.3
Virginiamycin
-04 2 16.6 41.7 28.2 4.3 7.4 1.8
-02 11 18.5 27.5 29.1 0.5 13.2 10.6 0.5
-01 11 11.3 31.9 26.5 8.3 11.3 9.8 1.0
-00 8 11.3 29.1 31.1 4.0 16.6 6.6 1.3
≤0.12 0.25 0.5 1 2 4 8 16 32 64 128 256 512 1024 >1024
a The white fields denote range of dilutions tested for each substance. MICs above the range are given as the concentration closest to the range. MICs equal to or lower than the lowest concentration tested are given as the lowest tested concentration. Bold vertical lines indicate microbiological cut-off values defining resist-ance; b MIC in U/mL, see Appendix 3 for details; c Not relevant as susceptibility in E. faecium is inherently low.

S VA R M 2 0 0 4 27
Table ENT IX. Distribution of MICs for Enterococcus hirae from broiler chickens year 2004 (n=34). Data for years 2000 (n=28) 2001 (n=27) and 2002 (n=45) are given for comparison (SVARM 2000, 2001 and 2002).
Substance Year
Resis-tance(%)
Distribution (%) of MICsa (mg/L)
≤0.12 0.25 0.5 1 2 4 8 16 32 64 128 256 512 1024 >1024
Ampicillin
-04 0 70.6 17.6 11.8
-02 0 51.1 33.3 8.9 6.7
-01 0 51.9 22.2 14.8 7.4 3.7
-00 0 28.6 10.7 17.9 39.3 3.6
Avilamycin
-04 0 5.9 14.7 44.1 17.6 17.6
-02 0 6.7 8.9 75.6 8.9
-01 4 14.8 70.4 11.1 3.7
-00 0 3.6 39.3 57.1
Bacitracinb
-04 0 11.8 20.6 14.7 11.8 11.8 29.4
-02 2 2.2 20.0 15.6 13.3 22.2 24.4 2.2
-01 4 11.1 18.5 11.1 11.1 7.4 37.0 3.7
-00 7 32.1 14.3 7.1 17.9 7.1 14.3 7.1
Chloramph.
-04 0 55.9 44.1
-02
-01
-00
Erythromycin
-04 26 70.6 2.9 26.5
-02 40 8.9 48.9 2.2 40.0
-01 22 7.4 59.3 11.1 7.4 14.8
-00 25 21.4 35.7 7.1 3.6 7.1 25.0
Flavomycin
-04 NRc 2.9 11.8 35.3 11.8 5.9 2.9 5.9 23.5
-02 NR 4.4 4.4 48.9 24.4 2.2 15.6
-01 NR 11.1 55.6 7.4 3.7 22.2
-00 NR 17.9 25.0 3.6 3.6 50.0
Gentamicin
-04 0 8.8 47.1 35.3 2.9 5.9
-02 0 2.2 33.3 46.7 6.7 6.7 4.4
-01 0 18.5 59.3 7.4 14.8
-00 0 25.0 17.9 25.0 21.4 10.7
Narasin
-04 91 5.9 2.9 32.4 52.9 5.9
-02 87 2.2 6.7 4.4 44.4 42.2
-01 89 3.7 7.4 18.5 63.0 7.4
-00 89 7.1 3.6 32.1 50.0 7.1
Neomycin
-04 0 23.5 32.4 32.4 2.9 2.9 5.9
-02 0 8.9 37.8 28.9 17.8 4.4 2.2
-01 0 3.7 29.6 33.3 18.5 7.4 3.7 3.7
-00 0 7.1 21.4 14.3 14.3 17.9 17.9 7.1
Streptomycin
-04 0 64.7 32.4 2.9
-02 0 2.2 13.3 68.9 8.9 6.7
-01 0 3.7 66.7 18.5 11.1
-00 4 17.9 35.7 21.4 21.4 3.6
Tetracycline
-04 3 35.3 61.8 2.9
-02 7 2.2 4.4 73.3 13.3 2.2 2.2 2.2
-01 4 3.7 25.9 66.7 3.7
-00 7 7.1 82.1 3.6 3.6 3.6
Vancomycin
-04 0 97.1 2.9
-02 0 95.6 4.4
-01 0 88.9 11.1
-00 0 89.3 10.7
Virginiamycin
-04 3 8.8 52.9 11.8 23.5 2.9
-02 7 64.4 2.2 26.7 6.7
-01 52 3.7 37.0 7.4 33.3 18.5
-00 11 7.1 60.7 3.6 17.9 10.7
≤0.12 0.25 0.5 1 2 4 8 16 32 64 128 256 512 1024 024
a The white fields denote range of dilutions tested for each substance. MICs above the range are given as the concentration closest to the range. MICs equal to or lower than the lowest concentration tested are given as the lowest tested concentration. Bold vertical lines indicate microbiological cut-off values defining resist-ance; b MIC in U/mL, see Appendix 3 for details; c Not relevant as susceptibility in E. hirae is inherently low.

28 S VA R M 2 0 0 4
Pig
Isolates includedIsolates of Escherichia coli for the years 1992-2004 are from diagnostic submissions of samples from the gastro-instestinal tract (intestinal content, faecal samples or mestenteric lymph nodes), while data from 1989-91 include all E. coli isolated from pigs, irrespective of type of material cultured. Isolates of Staphylococcus hyicus are from diagnostic submissions of samples from skin, joints and other organ systems.
The investigated samples were from all parts of Sweden. No information on the indications for sampling was avail-able, but the vast majority are likely to derive from herds with clinical problems. For E. coli, the number of isolates included differ somewhat from what has been reported in previous reports from SVARM because some duplicate isolates have been excluded this year. Data are probably biased towards problem herds, where antimicrobials have been used previ-ously and may not be representative for all cases of diarrhoea. Any assessment of trends is based on the assumption that this bias is inherent throughout the observation period.
Escherichia coliResistance to ampicillin, streptomycin, tetracycline or trimethoprim-sulphonamide was common in E. coli isolated from diagnostic submissions (Table Pig I). Over the last years, an apparent increase in prevalence of resistance to ampicillin or trimethoprim-sulphonamide and a decrease in resistance to tetracycline can be observed (Figure Pig I).
Among isolates from the 70s and early 80s, resistance to ampicillin was 6 and 7%, respectively (Franklin, 1976; Franklin, 1984). From 1995-1999, the figures ranged from 8-10% but thereafter, there has been an apparent increase in resistance (P=0.0001, Chi-square for trend; Figure Pig I).
During 2001-2004, 82% of the isolates that were resistant to ampicillin were also resistant to at least two other antimicro-bials (multiresistance). Ampicillin resistance was frequently associated with resistance to streptomycin (63%), tetracycline (46%) or trimethoprim-sulphonamides (68%) (P<0.000001 in all cases, Chi-square). It appears that the genes encoding ampicillin resistance are frequently carried together with other resistance genes, and co-selection by other antimicro-bials is thereby likely to contribute to the maintenance and spread of this resistance trait.
Trimethoprim-sulphonamide was introduced for use in pigs in Sweden in 1974. By that time, no resistance to trimethoprim was observed in E. coli from diarrhoeic piglets (Franklin, 1976). In the beginning of the 80s, the frequency of resistance to trimethoprim-sulphonamides was 10% (breakpoint for resistance >8 mg/L; Franklin, 1984) and over the 90s, the figures on prevalence of resistance have mostly been below 15% (range of yearly figures from 1993-2000: 11-16%). As seen in Figure Pig I, there has been a gradual increase in prevalence of resistance from 15% in year 2000 to 27% in year 2004 (P=0.00002, Chi-square for trend).
Over the last five years (2000-2004), the prevalence of resistance to tetracycline has decreased slightly (P=0.01, Chi-square for trend), a trend that is possibly associated with a decrease in tetracycline exposure as discussed in the previous report from SVARM (SVARM 2003).
Resistance to three or more of the tested antimicrobials (multiresistance) was common (15%) among isolates from years 2001-2004 (n=1321), and of these, 17 were resistant to more than four antimicrobials (1% of the total number of isolates). Resistance to ampicillin, streptomycin, tetracycline, trimethoprim-sulphonamides was commonly included in the multiresistance patterns. Resistance to these antimicrobials was also demonstrated in E. coli isolated from healthy pigs
Resistance in animal pathogens
Table Pig I. Occurrence of resistance (%) among Escherichia coli from pigs during different years and distribution of MICs for the isolates from 2004. Isolates are from diagnostic submissions of faecal samples or samples taken post mortem from the gastro-intestinal tract.
Substance1989-91n=248
1992-94n=431
1995-97n=1244
1998-00n=1074
2001-03n=935
2004n=386
Distribution (%) of MICsa (mg/L)
≤0.12 0.25 0.5 1 2 4 8 16 32 >32
Ampicillin 6 10 9 11 17 22 9.6 46.4 20.2 2.1 21.8
Ceftiofur - - - - 0d <1 40.9 52.1 5.7 1.0 0.3
Enrofloxacin 1c 7 5 6 6 6 90.9 2.6 3.1 0.3 3.1
Florfenicol - - - - <1d 0 2.6 44.8 49.5 3.1
Gentamicin 1 1 <1 1 1 <1 89.9 8.5 1.3 0.3
Neomycin 17 14 9 6 5e 4 91.2 4.9 1.0 0.5 2.3
Streptomycin 44 44 32 30 30 28 16.3 31.3 15.8 8.8 27.7
Tetracycline 28 35 31 33 30 27 25.9 31.6 11.1 4.4 26.9
Trim/Sulph.b 17 15 13 14 19 27 69.2 2.1 1.0 0.5 27.2
a The white fields denote range of dilutions tested for each substance. MICs above the range are given as the concentration closest to the range. MICs equal to or lower than the lowest concentration tested are given as the lowest tested concentration. Bold vertical lines indicate cut-off values defining resistance; b Concentra-tion of trimethoprim given, tested in concentration ratio 1/20 (trimethoprim/sulphametoxazole); c 227 isolates tested; d 688 isolates tested; e 926 isolates tested.
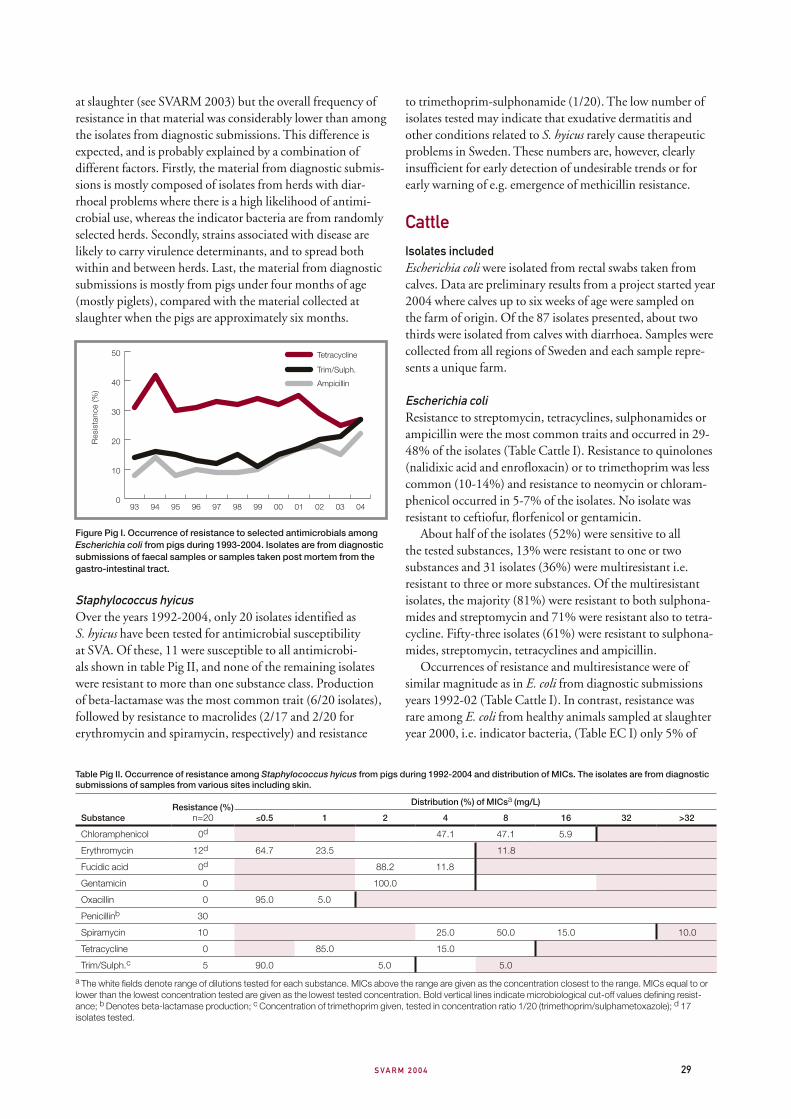
S VA R M 2 0 0 4 29
at slaughter (see SVARM 2003) but the overall frequency of resistance in that material was considerably lower than among the isolates from diagnostic submissions. This difference is expected, and is probably explained by a combination of different factors. Firstly, the material from diagnostic submis-sions is mostly composed of isolates from herds with diar-rhoeal problems where there is a high likelihood of antimi-crobial use, whereas the indicator bacteria are from randomly selected herds. Secondly, strains associated with disease are likely to carry virulence determinants, and to spread both within and between herds. Last, the material from diagnostic submissions is mostly from pigs under four months of age (mostly piglets), compared with the material collected at slaughter when the pigs are approximately six months.
Figure Pig I. Occurrence of resistance to selected antimicrobials among Escherichia coli from pigs during 1993-2004. Isolates are from diagnostic submissions of faecal samples or samples taken post mortem from the gastro-intestinal tract.
Staphylococcus hyicusOver the years 1992-2004, only 20 isolates identified as S. hyicus have been tested for antimicrobial susceptibility at SVA. Of these, 11 were susceptible to all antimicrobi-als shown in table Pig II, and none of the remaining isolates were resistant to more than one substance class. Production of beta-lactamase was the most common trait (6/20 isolates), followed by resistance to macrolides (2/17 and 2/20 for erythromycin and spiramycin, respectively) and resistance
to trimethoprim-sulphonamide (1/20). The low number of isolates tested may indicate that exudative dermatitis and other conditions related to S. hyicus rarely cause therapeutic problems in Sweden. These numbers are, however, clearly insufficient for early detection of undesirable trends or for early warning of e.g. emergence of methicillin resistance.
Cattle
Isolates includedEscherichia coli were isolated from rectal swabs taken from calves. Data are preliminary results from a project started year 2004 where calves up to six weeks of age were sampled on the farm of origin. Of the 87 isolates presented, about two thirds were isolated from calves with diarrhoea. Samples were collected from all regions of Sweden and each sample repre-sents a unique farm.
Escherichia coliResistance to streptomycin, tetracyclines, sulphonamides or ampicillin were the most common traits and occurred in 29-48% of the isolates (Table Cattle I). Resistance to quinolones (nalidixic acid and enrofloxacin) or to trimethoprim was less common (10-14%) and resistance to neomycin or chloram-phenicol occurred in 5-7% of the isolates. No isolate was resistant to ceftiofur, florfenicol or gentamicin.
About half of the isolates (52%) were sensitive to all the tested substances, 13% were resistant to one or two substances and 31 isolates (36%) were multiresistant i.e. resistant to three or more substances. Of the multiresistant isolates, the majority (81%) were resistant to both sulphona-mides and streptomycin and 71% were resistant also to tetra-cycline. Fifty-three isolates (61%) were resistant to sulphona-mides, streptomycin, tetracyclines and ampicillin.
Occurrences of resistance and multiresistance were of similar magnitude as in E. coli from diagnostic submissions years 1992-02 (Table Cattle I). In contrast, resistance was rare among E. coli from healthy animals sampled at slaughter year 2000, i.e. indicator bacteria, (Table EC I) only 5% of
Res
ista
nce
(%)
0
10
20
30
40
50 Tetracycline
Ampicillin
Trim/Sulph.
040302010099989796959493
Table Pig II. Occurrence of resistance among Staphylococcus hyicus from pigs during 1992-2004 and distribution of MICs. The isolates are from diagnostic submissions of samples from various sites including skin.
SubstanceResistance (%)
n=20
Distribution (%) of MICsa (mg/L)
≤0.5 1 2 4 8 16 32 >32
Chloramphenicol 0d 47.1 47.1 5.9
Erythromycin 12d 64.7 23.5 11.8
Fucidic acid 0d 88.2 11.8
Gentamicin 0 100.0
Oxacillin 0 95.0 5.0
Penicillinb 30
Spiramycin 10 25.0 50.0 15.0 10.0
Tetracycline 0 85.0 15.0
Trim/Sulph.c 5 90.0 5.0 5.0
a The white fields denote range of dilutions tested for each substance. MICs above the range are given as the concentration closest to the range. MICs equal to or lower than the lowest concentration tested are given as the lowest tested concentration. Bold vertical lines indicate microbiological cut-off values defining resist-ance; b Denotes beta-lactamase production; c Concentration of trimethoprim given, tested in concentration ratio 1/20 (trimethoprim/sulphametoxazole); d 17 isolates tested.

30 S VA R M 2 0 0 4
these isolates were multiresistant (SVARM 2000). The lower levels of resistance among indicator E. coli are probably due to the age of the sampled animals. Carriage of resistant E. coli in calves is inversely related to the age of the animals (Hoyle et al., 2004, Khachatryan et al., 2003). The indicator bacte-ria were mostly obtained from animals aged 6-12 months whereas the isolates from 2004 were from calves up to six weeks of age. The isolates from diagnostic submissions, 1992-02, were also mostly from younger animals.
Khachatryan et al. (2003) speculated that the high carriage rate of resistant E. coli in young calves is not only due to high antimicrobial selective pressure in this age group but partly an effect of a linkage between resistance genes and genes confer-ring adaptation to colonise neonatal intestines. These authors showed that even in the absence of antimicrobial selective pressure, E. coli resistant to sulphonamides, tetracycline and streptomycin had an advantage to colonise the gut of neona-tal calves compared to strains without these resistance traits. Interestingly about one fourth of the isolates from 2004 presented here had this resistance phenotype. The common occurrence of the resistance phenotype could be due to selec-tive pressure and co-selection since all three substances are used as therapeutics in calves. It is intriguing, however, that adaptation to colonise neonatal intestines might be the main selector for resistance in these young calves.
It has been suggested that occurrence of resistance is more common in E. coli from diarrhoeic than from healthy calves (Gunn et al., 2003). This could be another explanation for the difference in occurrence of resistance as indicator bacteria year 2000 were isolated from healthy animals, whereas two thirds of the calves sampled 2004 had diarrhoea. Likewise, isolates from diagnostic submissions 1992-02 were probably mostly from diseased calves.
Horse
Isolates includedIsolates of Escherichia coli are from the genital tract of mares, while isolates of Streptococcus zooepidemicus and Rhodococcus equi are from the respiratory tract of horses. For the two first of these bacterial species, the number of isolates tested has increased during the study period.
All isolates are from diagnostic submissions and exclusion of repeat isolates from the same individual or horses in the same stable was not possible. The southern part of Sweden is probably underrepresented in the materials. Further, data are likely to be biased towards treatment failures and recurrent infections. Any assessment of trends relies on the assumption that these biases are inherent throughout the study period.
Escherichia coliIn E. coli from horses, the percentage of resistance to the tested antimicrobials was of the same magnitude as in previ-ous years (Table Horse I). The two most common traits were resistance to streptomycin and to the combination trimethoprim-sulphonamide. Interestingly, only one isolate of 48 from the years 1992-1994 was classified as resistant to trimethoprim-sulphonamides but thereafter, the frequency of resistance has mostly been above 15%. The yearly frequen-cies of resistance vary considerably, but moving averages (3 year periods) indicate an increasing trend (Figure Horse I). Oral formulations of trimethoprim-sulphonamides for use in horses were introduced on the Swedish market in the late 80s, and it is possible that the current proportions of resist-ance reflect an increased use of this antimicrobial combina-tion. The figures on resistance should, however, be inter-preted with caution as the number of isolates tested each year
Table Cattle I. Occurrence of resistance and distribution of MICs among Escherichia coli from faecal samples from calves, 2004. For comparison, occur-rence of resistance among isolates from diagnostic submissions of faecal samples or samples taken post mortem from the gastro-intestinal tract 1992-02 are given (SVARM 2003).
Substance
Resistance(%) Distribution (%) of MICsa (mg/L)
1992-02n=220
2004-05n=87 ≤0.03 0.06 0.12 0.25 0.5 1 2 4 8 16 32 64 128 256 512 1024 2048 >2048
Ampicillin 24 29 8.0 47.1 16.1 28.7
Ceftiofur 0b 0 1.1 34.5 55.2 8.0 1.1
Chloramph. 9c 5 1.1 11.5 75.9 6.9 4.6
Enrofloxacin 10 10 17.2 65.5 3.4 3.4 5.7 2.3 1.1 1.1
Florfenicol 0b 0 75.9 21.8 2.3
Gentamicin 1 0 23.0 71.3 5.7
Nalidixic acid - 14 1.1 37.9 46.0 1.1 1.1 3.4 3.4 5.7
Neomycin 8 7 87.4 3.4 2.3 1.1 5.7
Streptomycin 42 48 16.1 26.4 2.3 6.9 12.6 18.4 8.0 9.2
Sulphamethox. - 41 39.1 17.2 2.3 41.4
Tetracycline 31 37 37.9 24.1 1.1 1.1 1.1 34.5
Trimethoprim 11d 10 26.4 43.7 18.4 1.1 10.3
a The white fields denote range of dilutions tested for each substance. MICs above the range are given as the concentration closest to the range. MICs equal to or lower than the lowest concentration tested are given as the lowest tested concentration. Bold vertical lines indicate cut-off values defining resistance; b 16 isolates tested; c 204 isolates tested; d Trimethoprim-Sulphonamide tested (concentration ratio1/20), cut-off value defining resistance >4 mg/mL.

S VA R M 2 0 0 4 31
has increased considerably and the bias inherent to diagnostic materials may not be equal during the study period.
Figure Horse I. Occurrence of resistance to trimethoprim-sulphonamide in Escherichia coli from the genital tract of mares during 1992-2004. Bars represent yearly percentage of isolates with MICs of trimethoprim-sulphonamides above 4 mg/L (resistant) and the solid line is the ‘3 year moving averages’ of these percentages. The figures above the bars represent number of isolates tested that year.
For years 2001-2004, significant associations were observed for all possible dual combinations of resistance to ampicil-lin, gentamicin, neomycin, streptomycin, tetracycline and trimethoprim-sulphonamides (Chi-square, P<0.0001 in all cases). The most common combination was resistance to both streptomycin and trimethoprim-sulphonamides (14% of the isolates). Combined resistance to ampicillin, strep-tomycin, tetracycline and trimethoprim-sulphonamides was observed in 3% of the total number of isolates. The number of isolates resistant to gentamicin was low (14/642 isolates) but interestingly, all these were multiresistant and 10 were resistant to five or six antimicrobials (Table Horse II). In addition to gentamicin resistance, all 14 were resist-ant to streptomycin and ampicillin and 9 of these isolates also to both tetracycline and trimethoprim-sulphonamides. Gentamicin is frequently used in equine stud practice in extenders for semen and in solutions for uterine douching, and it is possible that this gynaecological use selects for the type of multiresistant E. coli described in Table Horse II.
Of the tested antimicrobials, the by far most commonly used drug for systemic treatment of horses is the combination of trimethoprim-sulphonamides. It is probable that this use co-selects for resistance to other antimicrobials, considering the strong association between resistance traits and multire-sistance.
Table Horse II. Resistance patterns of all gentamicin resistant isolates of Escherichia coli (n=14) from the genital tract of mares, years 2001-2004.
Number of iso-lates
Genta-micin
Strepto-mycin
Ampi-cillin
Trim/Sulph.
Tetra-cycline
Neo-mycin
Enrofloc-xacin
6 R R R R R R S
3 R R R R R S S
1 R R R R S R S
2 R R R R S S S
1 R R R S R S S
1 R R R S S R S
Streptococcus zooepidemicusIn year 2004, almost half (49%) of the S. zooepidemicus tested for susceptibility were resistant to the combination trimethoprim-sulphonamides (Table Horse III). The propor-tions of resistance increased during the 90s, after which the figures decreased until year 2003 (37%). Data for years to come will demonstrate whether the increase from year 2003 to 2004 represents a change in this trend compared with the years 2000-2003. As noted under E. coli above, trimetho-prim-sulphonamides are commonly prescribed for horses and the use has increased over the 90s. However, the appar-ent decrease in resistance from year 2000 is not paralleled by a decrease in usage of these drugs. Therefore, it is probable that other factors also influence the observed trends.
Streptococcus zooepidemicus has a low inherent susceptibil-ity to aminoglycosides, and assessment of resistance to these antimicrobials is therefore not relevant. Resistance to other antimicrobials was rare in year 2004, as in previous years.
Table Horse I. Occurrence of resistance among Escherichia coli from horses during different years and distribution of MICs for the isolates from 2004. Iso-lates are from diagnostic submissions of samples from the female genital tract.
Substance
Years,% resistant isolates Distribution (%) of MICsa (mg/L)
1992-94n=48
1995-97n=216
1998-00n=222
2001-03n=457
2004n=188 ≤0.12 0.25 0.5 1 2 4 8 16 32 >32
Ampicillin 15 17 10 9 10 4.3 48.4 35.6 1.6 10.1
Ceftiofur - - - 0c 1 26.1 65.4 7.4 0.5 0.5
Enrofloxacin 8 3 3 2d 3 96.8 0.5 2.1 0.5
Florfenicol - - - 0c 0 2.1 46.3 50.0 1.6
Gentamicin 0 3 6 2 2 91.5 6.4 0.5 1.6
Neomycin 4 5 5 3e 5 92.6 2.1 1.1 0.5 3.7
Streptomycin 31 24 21 19 21 10.1 55.3 11.2 2.7 20.7
Tetracycline 6 5 9 6 10 24.5 58.0 6.4 1.6 9.6
Trim/Sulph.b 2 15 17 17 20 78.2 1.1 1.1 19.7
a The white fields denote range of dilutions tested for each substance. MICs above the range are given as the concentration closest to the range. MICs equal to or lower than the lowest concentration tested are given as the lowest tested concentration. Bold vertical lines indicate cut-off values defining resistance; b Concentra-tion of trimethoprim given, tested in concentration ratio 1/20 (trimethoprim/sulphametoxazole); c 353 isolates tested; d 456 isolates tested; e 455 isolates tested.
Res
ista
nce,
%
0
5
10
15
20
25
04040201009998979695949392
20 20
8
3981 96
88
67
167
101166
187188

32 S VA R M 2 0 0 4
Rhodococcus equiRhodococcus equi has inherently a low susceptibility to many antimicrobials (Table Horse IV). Classification of resistance levels is therefore not relevant for most of the antimicrobials tested. Only for erythromycin and the aminoglycosides (e.g. gentamicin), the susceptibility is such that the MIC ranges of R. equi are below concentrations that can be obtained during
therapy. Erythromycin and lately gentamicin has been used for therapy in combination with rifampin. Currently, there are no indications of emerging resistance to erythromycin or gentamicin as only occasional isolates with resistance to either of the first two substances have been recorded over the years 1992-2004.
Table Horse III. Occurrence of resistance (%) among Streptococcus zooepidemicus from horses during different years and distribution of MICs for the iso-lates from 2004. The isolates are from diagnostic submissions of samples from the respiratory tract.
Substance
Distribution (%) of MICsa (mg/L)
1992-94n=218
1995-97n=402
1998-00n=409
2001-03n=505
2004n=185 ≤0.12 0.25 0.5 1 2 4 8 16 32 >32
Ampicillin 0 <1 0 0 0 100.0
Enrofloxacin - - - NR NR 0.5 1.1 51.9 46.5
Florfenicol - - - 1d 2 84.9 11.9 1.6 1.6
Gentamicin NRc NR NR NR NR 2.7 5.9 50.8 40.5
Neomycin NR NR NR NR NR 0.5 1.6 1.6 33.0 63.2
Penicillin 0 <1 0 0 0 98.9 1.1
Spiramycin <1 1 0 1 1 98.4 1.1 0.5
Streptomycin NR NR NR NR NR 2.2 1.6 50.8 45.4
Tetracycline 4 3 4 5 3 42.7 43.8 9.7 0.5 3.2
Trim/Sulph.b 1 11 57 36 49 38.4 8.1 3.8 0.5 49.2
a The white fields denote range of dilutions tested for each substance. MICs above the range are given as the concentration closest to the range. MICs equal to or lower than the lowest concentration tested are given as the lowest tested concentration. Bold vertical lines indicate cut-off values defining resistance; b Concentra-tion of trimethoprim given, tested in concentration ratio 1/20 (trimethoprim/sulphametoxazole); c Not relevant as the inherent susceptibility is such that the MIC range is above concentrations that can be obtained during therapy; d 370 isolates tested.
Table Horse IV. Occurrence of resistance (%) and distribution of MICs among Rhodococcus equi isolated from diagnostic submissions of samples from the respiratory tract of horses during the years 1992-2004.
Substance 1992-2004Number
of isolates
Distribution (%) of MICsa (mg/L)
≤0.12 0.25 0.5 1 2 4 8 16 32 >32
Ampicillin NRc 186 2.7 34.4 38.7 24.2
Chloramphenicol NR 157 0.6 14.6 60.5 26.8
Enrofloxacin NR 177 5.1 32.8 42.4 19.8
Erythromycin 2 157 92.4 5.1 0.6 1.9
Gentamicin 1 187 98.9 0.5 0.5
Neomycin 2 187 97.9 0.5 0.5 0.5 0.5
Penicillin NR 186 0.5 4.8 94.6
Spiramycin NR 187 4.8 7.5 16.6 41.2 29.9
Streptomycin 3 177 86.4 7.3 2.8 0.6 2.8
Tetracycline NR 187 2.7 5.9 42.2 49.2
Trim/Sulph.b NR 187 9.6 18.7 22.5 18.7 30.5
a The white fields denote range of dilutions tested for each substance. MICs above the range are given as the concentration closest to the range. MICs equal to or lower than the lowest concentration tested are given as the lowest tested concentration. Bold vertical lines indicate cut-off values defining resistance; b Concentra-tion of trimethoprim given, tested in concentration ratio 1/20 (trimethoprim/sulphametoxazole); c Not relevant as the inherent susceptibility is such that the MIC range is above concentrations that can be obtained during therapy.

S VA R M 2 0 0 4 33
Dog
Isolates includedIsolates of Escherichia coli are from urine samples, submit-ted either as urine or as dip-slide cultures. Staphylococcus intermedius are from skin samples and Pasteurella multocida are from respiratory tract samples. Data may contain repeat isolates from the same patient.
For all data, it is probable that there is a bias towards isolates from dogs with recurrent disease or from therapeutic failures. In years 1993 and 2002, 79% and 45% of the urine samples, respectively, were referred to SVA by animal hospi-tals and the remainder from smaller animal clinics. It is prob-able that the bias is stronger among samples submitted from animal hospitals that receive more referral cases, than among animal clinics. The fact that the proportion of samples has changed over time must be borne in mind when interpreting the data.
Escherichia coliThe proportion of E. coli resistant to the tested antimicrobi-als was of similar magnitude as in previous years (Table Dog I). Resistance against ampicillin, enrofloxacin, streptomycin, tetracycline or the combination trimethoprim-sulphona-mides occurred in 12-18% of the isolates.
In Sweden, aminopenicillins are commonly used for treat-ment of infections in dogs, including uncomplicated cysti-tis. Of all prescriptions of antimicrobials for dogs in 1998, 47% were beta-lactam antibiotics, mostly aminopenicillins (Odensvik et al., 2001). The high proportion of resistance to ampicillin (18%) among isolates from urine is in line with this selective pressure.
The percentages of resistance to fluoroquinolones are high throughout the study period (9-12%). The cut-off value (>0.25 mg/L) chosen for this study is low compared to break-points recommended by, e.g., NCCLS (2002). Using the NCCLS break-point (>1mg/L), the proportion of isolates classified as resistant have ranged from 4-6% in the study periods shown in Table Dog I. The sales of fluoroquinolone tablets for dogs or cats have increased considerably over the last decade, much more than the dog population.
Multiresistance was observed in 11% of the isolates from years 2001-2004. Of these, 26% (26/98) were resistant to five or more antimicrobials. Resistance to streptomycin was the most common trait among multiresistant isolates (88/98 isolates), followed by resistance to ampicillin, tetracycline or to trimethoprim-sulphonamides (80, 77 and 72 isolates out of 98, respectively). The association between all possible dual combinations of these antimicrobials was strong (P<0.0001 in all cases, Chi-square). Simultaneous resistance to all these four antimicrobials was observed in 5% of all isolates. These figures emphasise the need for culture and subsequent test-ing for susceptibility before treatment of recurrent or non-responding urinary tract infections in dogs.
The interpretation of data from retrospective studies of diagnostic submissions can be problematic, as the informa-tion available on sampled animals is often limited, and it may be difficult to assess the degree to which case selection is biased. The need for close examination of the origin of samples was exemplified in a study (Hagman & Greko, in press) where data were stratified according to the type of clinic that the samples were submitted from (animal hospitals as defined by the criteria of the Swedish animal hospital asso-ciation, and smaller animal clinics). The proportion of resist-ance to ampicillin and streptomycin was significantly lower (P=0.009 and P=0.008, respectively) in isolates from animal clinics than from the animal hospitals (Figure Dog I).
In humans, significantly higher resistance proportions among E. coli isolated from complicated urinary tract infec-tions, as opposed to uncomplicated cases, has been shown (Kerrn and others, 2002). In dogs, a higher proportion of staphylococci isolated from recurrent cases of pyoderma were resistant to antimicrobials, compared with first-time cases (Holm and others, 2002). In the present study, it is probable that a higher proportion of animals investigated at animal hospitals suffered from complicated urinary tract infections as compared with those attending animal clinics. The former group is more likely to have been exposed to previous antimi-crobial treatment that may have selected for resistant bacterial strains both at the site of infection, and in the commensal flora of the animal.
Table Dog I. Occurrence of resistance among Escherichia coli from dogs during different years and distribution of MICs for the isolates from 2003. The isolates are from diagnostic submissions of urinary tract samples.
Substance
Years, % resistant isolates Distribution (%) of MICsa (mg/L)
1992-94n= 245
1995-97n=296
1998-00n=418
2001-03n=621
2004n=247 ≤0.12 0.25 0.5 1 2 4 8 16 32 >32
Ampicillin 18 18 18 18 19 3.2 43.7 32.0 2.4 18.6
Enrofloxacin 9 9 10 9 12 86.2 1.6 3.3 2.4 6.5
Gentamicin 2 1 2 2 1 87.0 10.9 0.8 0.8 0.4
Nitrofurantoin 3 3 1 2 1 96.8 2.0 1.2
Streptomycin 16 18 15c 15 13 7.3 56.3 22.3 1.6 12.6
Tetracycline 16 14 12 11d 13 34.4 42.9 7.7 1.6 13.4
Trim/Sulph.b 9 8 11 11e 17 77.3 2.4 2.4 0.8 17.0
a The white fields denote range of dilutions tested for each substance. MICs above the range are given as the concentration closest to the range. MICs equal to or lower than the lowest concentration tested are given as the lowest tested concentration. Bold vertical lines indicate cut-off values defining resistance; b Concentra-tion of trimethoprim given, tested in concentration ratio 1/20 (trimethoprim/sulphametoxazole); c 417 isolates tested; d 617 isolates tested; e 620 isolates tested.

34 S VA R M 2 0 0 4
TO COMPARE THE PROPORTIONS of resistance and resist-ance phenotypes of Escherichia coli from different sources, data from this and previous SVARM reports were compiled (for materials included see footnote of Table Comp I). Where applicable, data from 2001-2004 have been combined to obtain larger numbers of isolates.
For the analysis of resistance phenotypes, only antimi-crobials tested all years for all animal species and types of isolates were included. For E. coli from faecal samples from calves, from mastitis and for the indicator bacteria, trimeth-oprim and sulphonamides were tested separately. In the tables, data on resistance to trimethoprim are given under the heading trimethoprim-sulphonamides.
With the exception of isolates from mastitis in cattle, the frequencies of resistance among the animal pathogens are considerably higher than among the indicator bacte-ria (Table Comp I). This difference is expected, and is probably explained by a combination of differ-ent factors. The material from diagnostic submis-sions is mostly composed of isolates from diseased animals where there is a high probability of previ-ous antimicrobial use, which is not the case for
the indicator bacteria that are from healthy animals from randomly selected herds. Further, strains associated with diarrhoea are likely to carry virulence determinants and to spread between animals. The frequencies of resistance in isolates from mastitis in cattle are only slightly higher than those of indicator bacteria, and are notably lower than in E. coli from other types of diagnostic submissions. This prob-ably reflects that the mastitis isolates derive from acute cases that were not recently treated.
The proportion of multiresistant isolates, i.e. with resist-ance to at least three antimicrobials, among isolates from diagnostic submissions ranged from 7% (horses) to 29% (calves) (Table Comp II). Interestingly, in calves only 16%
Table Comp I. Comparison of resistance (%) among Escherichia coli isolated from different sources.a
Substance
Animal pathogens Indicator bacteria
Pig
Cattle
Horse Dog Cat Pig Cattle ChickenFaecal Mastitis
Ampicillin 18 29 7 9 18 25 3 0 4
Enrofloxacin 6 10 2 2 10 11 <1 0 2
Gentamicin 1 0 0 2 2 4 0 0 0
Streptomycin 29 48 9 18 15 17 9 5 5
Tetracycline 29 37 5 7 12 15 8 1 6
Trim/ Sulph. 21 10b 3b 18 13 13 2b 0b 0b
a Data from several years have been compiled from this and previous SVARM reports. Animal pathogens are all diagnostic submissions; pigs: gastro-intestinal tract, years 2001-2004 (n=1321), faecal salmpes from calves, years 2004-2005 (n=87), cattle mastitis (clinical), years 2001-2002 (n=169), horse, female genital tract years 2001-2004 (n=642), dog, urine, years 2001-2004 (n=868), cat, urine, years 2001-2004 (n=190); Indicator bacteria are from intestine of healthy animals, pigs year 2003 (n=303), cattle year 2000 (n=293), chicken year 2004 (n=400), for cut-off values see appendix III; b figure given is for trimethoprim tested without sulphonamides.
Comparison of resistance in Escherichia coli from different sources
Staphylococcus intermediusMost isolates of S. intermedius produce beta-lactamases and are thereby resistant to penicillin (Table Dog II). The percentages have remained around 80% since at least the late 70s (Franklin, 1978). As mentioned above, beta-lactam antibiotics are commonly prescribed for dogs and it is prob-able that this selective pressure contributes to the stable maintenance of resistance to penicillinase sensitive penicil-lins. Resistance in occasional isolates to cephalotin or oxacil-lin is probably due to methodological errors or to high levels of beta-lactamase production, and not to the presence of the mecA gene. The current routine at SVA is to retest all isolates for which the MIC of oxacillin is >2 mg/L at lower tempera-tures (33-34° C) and with 2% NaCl added to the broth. If a high MIC is confirmed, the genotype is examined with PCR for the mecA gene. Hitherto, no mecA carrying coagulase-positive staphylococci have been found.
Res
ista
nce,
%
0
5
10
15
20
25
Hospitals
Clinics
Trim-sulph.TetracyclineStreptomycinEnrofloxacinAmpicillin
Figure Dog 1. Proportion (%) of resistance to selected antimicrobials in Escherichia coli isolated from pyometra and from urine samples divided according to type of referring clinic (animal clinics or animal hospitals). Sampling period was April 2002-March 2003 (Hagman & Greko, in press).

S VA R M 2 0 0 4 35
Table Comp II. Proportion (%) of Escherichia coli by source and resistance phenotype. Isolates are from diagnostic submissions years 2001-2004 except calves where the material is from 2004-2005. ”R” in shaded fields indicates resistance.
Proportion (%) Resistance phenotype
Pig(n=1321)
Calf(n=87)
Horse(n=642)
Dog(n=868)
Cat(n=190) Sm Am Tc T-Sa Ef Gm
0.3 0.6 2.6 R R R R R R
0.8 1.1 0.2 2.1 0.5 R R R R R
0.1 1.4 0.2 R R R R R
3.0 3.4 1.4 2.0 R R R R
0.1 R R R R R
0.2 0.6 0.5 R R R R
0.2 0.1 R R R R
0.5 R R R R R
0.5 0.1 R R R R
0.7 0.2 R R R R
0.1 R R R R
0.4 0.3 R R R R
0.1 R R R R R
0.1 R R R R
0.1 0.2 0.5 0.5 R R R R
5.7 4.6 3.7 6.9 4.7 Sum resistant to 4 or more of the antimicrobials above
9.5 24.1 3.4 4.4 4.2 Resistant to 3 of the antimicrobials above
13.0 4.6 10.7 5.9 16.8 Resistant to 2 of the antimicrobials above
25.9 13.8 10.1 12.8 12.6 Resistant to 1 of the antimicrobials above
45.9 52.9 72.0 70.0 61.6 Susceptible to all of the antimicrobials above
a For isolates from calves, the resistance phenotypes given are for trimethoprim tested without sulphonamides.
of the these isolates were resistant to more than three of the included antimicrobials while the corresponding figure for the other animal species ranged from 38-61% with the highest figure for dogs. Among the multiresistant isolates from calves, 76% showed combined resistance to ampicil-lin, streptomycin and tetracycline. This pattern was also
common among the multiresistant isolates from other animal species, with frequencies ranging from 40-71%. Further studies are needed to reveal whether, in E. coli from different animals species, similar or identical mobile genetic elements determine the resistance phenotypes described in Table Comp II.
Resistance to macrolides (erythromycin) and lincosa-mides, fusidic acid, streptomycin and tetracycline was common in 2004, as in previous years. In 1978, resistance to erythromycin was still rare (<2%; Franklin, 1978), indicating a substantial increase over the last 20 years. In year 2004, 34 of the 47 isolates (72%) that were resistant to erythromycin were also resistant to clindamycin (ML –phenotype). It is probable that use of clindamycin selects for this phenotype.
In year 2004, 38% of the isolates were multiresistant, and 21% were resistant to at least 5 antimicrobials. Combined resistance to penicillin, erythromycin and streptomycin was part of the resistance phenotype of all of the isolates that were resistant to at least 5 antimicrobials (Table Dog III), and of 10 out of 12 resistant to 4 antimicrobials. Resistance to erythromycin (mostly with cross-resistance to clindamycin), enrofloxacin, gentamicin or streptomycin only occurred in multiresistant isolates. Many of the samples included are
likely to be from cases of pyoderma that have been treated on one or several occasions before sampling (recurrent cases). Previous antimicrobial exposure has a strong influence on the occurrence of multiresistance, as shown by Holm et al. (2002).
Pasteurella multocidaResistance to the antimicrobials to which Pasteurella multoc-ida is inherently susceptible was rare. Susceptibility to peni-cillinase-sensitive penicillins, indicated by ampicillin suscep-tibility, was uniform among isolates from years 2002-2004. The isolates included were from the respiratory tract of dogs. As P. multocida is part of the normal flora of, e.g. tonsils, their association with disease in the sampled dogs is uncertain but the results are of relevance for human medicine as this type of bacteria is a common cause of infections associated with dog-bites.

36 S VA R M 2 0 0 4
Table Dog III. Resistance phenotypes of Staphylococcus intermedius from canine skin, year 2004 (n=159). ”R” in shaded fields indicates resistance.
Number of isolates
Percent of total
Resistance phenotypea
Pc Sm Em Cl Tc Fu TS Ef Gm
1 1 R R R R R R R
6 4 R R R R R R
7 4 R R R R R
1 1 R R R R R R
8 5 R R R R R
2 1 R R R R R
1 1 R R R R R
1 1 R R R R R R R
4 3 R R R R R
1 1 R R R R R R
1 1 R R R R R R
33 21 Resistance to 5 or more antimicrobials
12 8 Resistance to 4 antimicrobials
16 10 Resistance to 3 antimicrobials
12 8 Resistance to 2 antimicrobials
55 36 Resistance to 1 antimicrobial
21 13 Susceptible to all of the antimicrobials above
a Pc: penicillin; Sm: streptomycin; Em: erythromycin; Cl: clindamycin; Tc: tetracycline; Fu: fusidic acid; TS: trimethoprim-sulphonamide; Ef: enrofloxacin; Gm: gen-tamicin.
Table Dog IV. Occurrence of resistance among Pasteurella multocida from dogs and distribution of MICs for the isolates from 2002-2004. The isolates are from diagnostic submissions of samples from the respiratory tract.
Substance
Resistance, % Distribution (%) of MICsa (mg/L)
2002-04n=231 ≤0.12 0.25 0.5 1 2 4 8 16 32 >32
Ampicillin 0 98.3 1.3 0.4
Enrofloxacin 4 93.9 2.2 1.3 2.6
Gentamicin NRb 14.7 18.2 32.0 4.8 30.3
Tetracycline 1 85.7 9.5 3.5 1.3
Trim/Sulph.c 4 87.9 5.2 3.0 3.9
a The white fields denote range of dilutions tested for each substance. MICs above the range are given as the concentration closest to the range. MICs equal to or lower than the lowest concentration tested are given as the lowest tested concentration. Bold vertical lines indicate cut-off values defining resistance; b Not relevant as the inherent susceptibility is such that the MIC range is above concentrations that can be obtained during therapy; c Concentration of trimethoprim given, tested in concentration ratio 1/20 (trimethoprim/sulphametoxazole).
Table Dog II. Occurrence of resistance among Staphylococcus intermedius from dogs during different years and distribution of MICs for the isolates from 2004. The isolates are from diagnostic submissions of samples from canine skin.
Substance
Years, % resistant isolates Distribution (%) of MICsa (mg/L)
1992-94n=304
1995-97n=322
1998-00n=433
2001-03n=382
2004n=159 ≤0.12 0.25 0.5 1 2 4 8 16 32 >32
Cephalothin <1 <1 0 1 2 97.5 1.3 0.6 0.6
Clindamycin 12 20 21 18 21 74.8 3.8 21.4
Enrofloxacin - - - 2f 3 54.7 38.4 3.8 1.9 1.3
Erythromycin 21 28 27 24 30 67.3 2.5 0.6 29.6
Fusidic acid 9 14 20e 20g 27 68.6 4.4 27.0
Gentamicin <1 <1 <1 0 1 98.1 0.6 0.6 0.6
Nitrofurantoin 1 1 <1 1 0 99.4 0.6
Oxacillin 1 2 1 2 2 96.9 0.6 2.5
Penicillinb 79 80 80 80 80
Streptomycin - - - 22f 31 61.6 7.5 30.8
Tetracycline 24 12 28 25h 29 69.2 1.3 0.6 28.9
Trim/Sulphc 1 2 1 3 10 57.9 28.9 3.1 1.9 8.2
a The white fields denote range of dilutions tested for each substance. MICs above the range are given as the concentration closest to the range. MICs equal to or lower than the lowest concentration tested are given as the lowest tested concentration. Bold vertical lines indicate microbiological cut-off values defining resist-ance; b Denotes beta-lactamase production; c Concentration of trimethoprim given, tested in concentration ratio 1/20 (trimethoprim/sulphametoxazole); e 421 isolates tested; f 273 isolates tested; g 346 isolates tested; h 381 isolates tested.

S VA R M 2 0 0 4 37
Cat
Isolates includedIsolates of E. coli are from urine samples, submitted either as urine or as dip-slide cultures. Data may contain repeat isolates from the same patient.
It is likely that there is a bias towards isolates from cats with recurrent disease or from therapeutic failures. The number of isolates tested each year is small, but has increased during the study period. The criteria for submission may have changed, and any inferences on trends must be made with caution.
Escherichia coliThe proportions of resistance to ampicillin, tetracycline and trimethoprim-sulphonamide were above 10%. The figures presented for year 2004 are lower than for the previous years. However, the number of isolates tested each year is small and differences should be interpreted with caution.
In years 2001-2004, 10% of the isolates were multire-sistant and 4% were resistant to at least five antimicrobials. Five percent of the isolates were simultaneously resistant to ampicillin, streptomycin, tetracycline and trimethoprim-sulphonamides. Resistance to both ampicillin and strepto-mycin was common (14%), as was resistance to tetracyclines and streptomycin (9%) and ampicillin and trimethoprim-sulphonamides (8%). The two drug classes most commonly prescribed for cats are beta-lactam antibiotics (mostly aminopenicillins) and tetracyclines (Odensvik et al., 2002). It is probable that the exposure to these drugs co-selects for resistance to other antimicrobials such as streptomycin.
Urinary tract infections in cats are usually treated with aminopenicillins or fluoroquinolones. In years 2001-2004, 6% of the isolates were resistant to both ampicillin and enrofloxacin. The cut-off value (>0.25 mg/L) chosen for this report is low compared to the breakpoints recommended by, e.g., NCCLS (2002). However, for all isolates that were resistant to both ampicillin and enrofloxacin, the MIC of the
latter drug was >1 mg/L. The high level of co-resistance for the two drug classes preferred for treatment, and of multire-sistance, shows that in some cases the choice of antimicrobials is severely limited and must be based on culture and suscepti-bility tests.
Table Cat I. Occurrence of resistance among Escherichia coli from cats during different years and distribution of MICs for the isolates from 2004. The isolates emanate from diagnostic submissions of urine samples.
Substance
Years, % resistant isolates Distribution (%) of MICsa (mg/L)
1992-97n=61
1998-00n=74
2001-03n=135
2004n=55 ≤0.12 0.25 0.5 1 2 4 8 16 32 >32
Ampicillin 26 34 27 18 61.8 18.2 1.8 18.2
Enrofloxacin 5 8 13 5 90.9 3.6 3.6 1.8
Gentamicin 0 3 5 0 87.3 12.7
Nitrofurantoin 2 2 1 2 98.2 1.8
Streptomycin 25 18 21 9 10.9 52.7 21.8 5.5 9.1
Tetracycline 28 16 16 13 36.4 41.8 7.3 1.8 12.7
Trim-Sulph.b 7 10 13 13 85.5 1.8 12.7
a The white fields denote the range of dilutions tested for each substance. MICs above the range are given as the concentration closest to the range. MICs equal to or lower than the lowest concentration tested are given as the lowest tested concentration. Bold vertical lines indicate microbiological cut-off values defining resist-ance; b Concentration of trimethoprim given, tested in concentration ratio 1/20 (trimethoprim/sulphametoxazole).

38 S VA R M 2 0 0 4
STATISTICS on animal numbers and agricultural holdings with animals are provided by Statistics Sweden in collabora-tion with the Board of Agriculture. Figures are based either on total census or on samples of the populations. The count-ing is made in June and/or December. Statistics is published annually as a Yearbook of Agricultural Statistics and also on the Internet via the websites for Statistics Sweden (www.scb.se) or the Board of Agriculture (www.sjv.se). Specific sources are given in footnotes to the tables below.
The number of animals and holdings counted at the time of census are given in Table AP1 I and II, and the number of
animals slaughtered on an annual basis is given in Table AP1 III. In addition, the volume slaughtered (expressed in tonnes) is given in Table AP1 IV.
The total number of food producing animals, with the exception of sheep and beef cattle, has decreased notably over the last two decades and the herd size has increased (Table AP1 I). The changes in total number of animals were for each species reflected in the number of animals slaughtered (Table AP1 III). The number of broiler chickens slaughtered decreased by about 7% between 2003 and 2004.
Appendix 1: Demographic data
Table AP1 I. Number of livestock (in thousands) from 1980-2004.a The figures represent census figures from counts of all, or samples of the populations in the given years.
Animal Species 1980 1985 1990 1995 2000d 2002d 2003d 2004d
Cattle
Dairy cows 656 646 576 482 428 417 403 404
Beef cows 71 59 75 157 167 169 168 172
Other cattle >1 year 614 570 544 596 589 553 529 539
Calves <1 year 595 563 524 542 500 498 511 514
Total, cattle 1 935 1 837 1 718 1 777 1 685 1 637 1 612 1 629
Pigs
Boars & sows 290 260 230 245 206 211 207 195
Fattening pigs >20 kgb 1 254 1 127 1 025 1 300 1 146 1 096 1 128 1 095
Piglets <20kgc 1 170 1 113 1 009 769 566 574 568 528
Total, swine 2 714 2 500 2 264 2 313 1 918 1 881 1 903 1 818
Sheep
Ewes and rams 161 173 161 195 198 198 211 220
Lambs 231 252 244 266 234 229 240 246
Total, sheep 392 425 405 462 432 427 451 466
Laying hens
Hens 5 937 6 548 6 392 6 100 5 670 4 732 4 497 4 995
Chickens reared for laying 2 636 2 159 2 176 1 812 1 654 1 537 1 509 1 625
Total, hens 8 573 8 708 8 568 7 912 7 324 6 269 5 906 6 085
a Source: Yearbook of Agricultural Statistics, Sweden 1981, 1986, 1991, 1996 and Statistical Messages JO 20 SM 0402. For 1980 and 1985 only cattle and sheep at premises with more than 2 ha counted; b Before 1995, the figure denotes pigs above 3 months of age; c Before 1995, the figure denotes pigs below 3 months of age; d The numbers are based on counting in June.

S VA R M 2 0 0 4 39
Table AP1 II. Number of holdings with animals of different types, 1980-2004.a
Animal Species 1980 1985 1990 1995 2000 2002 2003 2004
Cattle
Dairy cows 44 100 30 100 25 900 17 700 12 700 11 300 9 700 9 100
Beef cows 12 400 10 300 10 900 17 100 13 900 13 100 12 600 13 000
Other cattle >1 yeara 63 200 52 700 42 700 39 200 30 500 27 800 26 400 26 300
Calves <1 year 62 300 52 000 42 000 36 500 27 700 25 200 24 900 24 100
Sheep, excluding lambs 10 100 10 500 9 700 10 000 8 000 7 400 7 600 8 200
Pigs 26 100 19 900 14 300 10 800 4 800 4 000 3 700 3 200
Laying hens 23 600 17 500 12 900 9 600 5 700 5 300 5 400 5 400
Chickens reared for laying 5 100 2 700 1 900 1 400 700 800 700 800
a Source: Yearbooks of Agricultural Statistics, Sweden 1981, 1986, 1991, 1996, 2002 and Statistical Messages, JO 20 SM 0402.
Table AP1 III. Number of animals slaughtered (in thousands) at slaughterhouses, 1980-2004.a
Animal Species 1980 1985 1990 1995 2000 2002 2003 2004
Cattle
Cattle >1 year 574 584 523 502 490 472 454 457
Calves < 1 year 130 138 70 46 39 34 32 34
Total, cattle 704 722 593 548 529 506 486 491
Pigs 4 153 4 283 3 659 3 763 3 251 3 282 3 304 3 365
Sheep 302 328 280 145 202 197 192 193
Chickens (broiler) 40 466 36 410 38 577 60 300 68 617 77 383 74 742 69 628
a Sources: For 1980-1995: Yearbooks of Agricultural Statistics, Sweden 1981, 1986, 1991 and 1996 except for chickens where figures were supplied by the National Food Administration, and for 2000-2004 Statistical messages JO 48 SM 0302 and 0502 (all animal species).
Table AP1 IV. Quantity of livestock slaughtered (in 1000 tonnes) at slaughterhouses, 1990-2004.a
Animal Species 1990 1995 2000 2002 2003 2004
Cattle
Cattle >1 year 138.4 140.1 145.4 142.3 136.3 137.7
Calves < 1 year 5.4 3.2 4.4 4.2 4.1 4.6
Total, cattle 143.8 143.3 149.8 146.5 140.4 142.3
Pigs 289.2 308.8 277.0 283.8 287.5 293.7
Sheep 4.9 3.5 3.9 3.9 3.7 3.8
Chickens (broiler) 44.0 74.2 89.9 101.4 97.9 91.2
a Sources: For years 1990 and 1995 Yearbooks of Agricultural Statistics, Sweden 1991 and 1996 except for chickens where figures were supplied by the National Food administration, and for 2000-2003 Statistical messages JO 48 SM 0302 and 0502 (all animal species).

40 S VA R M 2 0 0 4
Appendix 2: Materials and methods, use of antimicrobialsSource for the statisticsAntimicrobial drugs used in veterinary medicine in Sweden are only available on veterinary prescription. Furthermore, antimicrobial drugs have to be dispensed through pharma-cies, which in turn are supplied solely by two drug whole-salers. Sales statistics are available from Apoteket AB (The National Corporation of Swedish Pharmacies).
From year 2003, statistics on drug sales is based on elec-tronic records of amount of drugs dispensed at or from pharmacies, i.e. sales statistics. Data for previous years are the amount of antimicrobial products sold from the whole-salers to the pharmacies. Wholesalers’ data have a very high degree of completeness. This is explained by the fact that the wholesalers represent the entire drug distribution network, i.e., there are no other sources of antimicrobials for use or prescription by veterinarians. As the pharmacies stock a limited amount of drugs, the current prescription based statistics is judged to be comparable with previous, wholesaler based statistics.
Sweden has a long tradition in drug consumption statis-tics. Apoteket AB, former Apoteksbolaget AB, has since 1976 monitored the consumption of drugs for use in humans mainly by using wholesalers’ statistics. In the case of drugs for animal use, SVA and Apoteket AB have collaborated over the years and data on the total use of antimicrobials for animals in Sweden are available since 1980. For a review of the figures from 1980-2000 as well as references to publica-tions on which that review is based, see SVARM 2000. From year 2003, Apoteket AB has the formal responsibility to gather such data. Further, the Board of Agriculture has been appointed competent governmental authority and will, from 2006, report statistics per animal species (food producing animals).
Classification of drugsVeterinary medicinal drugs are classified according to the Anatomical Therapeutic Chemical veterinary classification system (ATCvet) (WHO, Guidelines for ATCvet classifica-tion). The system is based on the same main principles as the ATC classification system for substances used in human medicine. In both the ATC and ATCvet systems, drugs are divided into groups according to their therapeutic use. First, they are divided into 15 anatomical groups, classified as QA-QV in the ATCvet system (without Q in the system for human drugs), on basis of their main therapeutic use. Thereafter subdivision is made according to therapeutic main groups, which is followed by a further division in chemical/therapeutic subgroups.
Antimicrobials are classified in the QJ group - general anti-infectives for systemic use. However, antimicrobials can also be found in other groups such as QA (alimentary
tract and metabolism), QD (dermatologicals), QG (genito-urinary system) and QS (sensory organs) depending on the therapeutic use.
Inclusion criteriaAll veterinary antibacterial drugs authorised for use in animals except dermatologicals, ophtalmologicals and otologicals (i.e., ATCvet codes QA, QG and QJ) were included. Veterinary drugs are preparations authorised for use in animals. Human drugs may be authorised not only for humans, but for animals as well. This latter category is not included in the statistics. However, no such drugs are author-ised for use in the major food producing animal species, and the volume sold is very limited.
Drugs with antibacterial activity can also be found in other groups, notably among the antiprotozoals (QP51). Of these, the nitroimidazoles were included earlier but no such substances are presently authorised for use in animals. Sulfaclozine is licensed for treatment of coccidiosis only and has therefore not been included. The ionophoric antibiotics are presently regulated as feed additives and not sold through pharmacies and are therefore not included in the wholesalers’ statistics. However, the Board of agriculture collects figures on sales of ionophores from the feed mills as a part of the feed control system. As the source differs, data on ionophores are given only in Table AC III.
Distribution of veterinary medicines in SwedenMarketing of drugs in Sweden is regulated by the Medicinal Products Act, which applies both to human and veterinary drugs. According to the Act, a medicinal product may not be sold until it has been granted marketing authorisation by the Medical Products Agency (MPA). The MPA has issued provi-sions concerning authorisation, distribution and prescription of veterinary medicinal products.
The state-owned Apoteket AB has exclusive rights regard-ing retail sales of medicines in Sweden. Apoteket AB operates according to guidelines set out in an agreement with the State. According to the Act only pharmacies run by Apoteket AB are permitted to sell drugs. This implies that veterinarians in Sweden are not permitted to sell drugs, although they may for practical reasons hand over medicines for emergency use. Veterinarians are, however, under no conditions permitted to make a profit from dispensing medicines.

S VA R M 2 0 0 4 41
Appendix 3: Materials and methods, resistance monitoring
Sampling strategyZoonotic bacteria
SalmonellaIsolates of Salmonella from warm-blooded animals (wild and domesticated) are included. Salmonellosis in animals is a notifiable disease in Sweden. It is mandatory that at least one isolate from each notified incident, including incidents detected in the Swedish Salmonella control programme, is confirmed at SVA. The first isolate from each food animal species in each notified incident is included in the material presented in SVARM. The same inclusion criteria are also used for isolates from other warm blooded animal species, unless the epidemiological situation in a particular year is judged unusual. In year 2004, Salmonella was isolated from a total of 32 cats and of these isolates; the first 20 consecu-tive isolates were tested and thereafter every fifth isolate (total number of isolates 22).
Campylobacter sppCampylobacter spp. was isolated from cloacal swabs from healthy broiler chickens sampled at slaughter as part of a Swedish Campylobacter programme (started in 2001). During year 2004, 400 flocks were positive for Campylobacter. From these, 112 isolates, each representing one flock were randomly selected for susceptibility testing. The isolates were stored in -70°C until testing. At subculture, 12 isolates did not grow and consequently, 100 isolates were finally included.
Indicator bacteriaIndicator bacteria, Escherichia coli and Enterococcus spp., were isolated from intestinal content (caecum) of healthy broiler chickens sampled at slaughter.
Five abattoirs for chickens participated in the collection of samples. These abattoirs are geographically separated and accounted for 92% of the total slaughter volume in Sweden during 2002. The number of samples collected at each abat-toir was proportional to the respective annual slaughter volume.
Sampling was performed weekly, with exceptions for holi-days and summer vacations, by meat inspection staff or abat-toir personnel. Each sample collected from chickens repre-sents a unique flock, but not necessarily a unique production site. By these measures, bacterial isolates included are from randomly selected healthy individuals of Swedish flocks.
Animal pathogensIsolates of animal pathogens included, except E. coli from calves, emanate from routine bacteriological examinations of clinical submissions or post-mortem examinations at SVA.
Isolates included from pigs are E. coli from the gastro-intestinal tract (gut content, faecal samples or mesenteric lymph nodes), and Staphylococcus hyicus from skin and various other sites. From calves, E. coli isolated from faecal swabs from calves younger than six weeks are included. The sampling was perfomed as a part of a project where both healthy and diarrhoeic calves were sampled. From horses, E. coli from the genital tract of mares, and Streptococcus zooepi-demicus and Rhodococcus equi from the respiratory tract are included. From dogs and cats E. coli isolated from samples of urine are included and from dogs also Staphylococcus interme-dius isolated from skin samples, Pseudomonas aeruginosa from samples from the ear canal and Pasteurella multocida from samples from the respiratory tract.
Isolation and identification of bacteriaZoonotic bacteria
SalmonellaSalmonella were isolated and identified at the Dept. of Bacteriology, SVA or at regional laboratories in accord-ance with standard procedures. All samples within official control programmes are cultured according to the procedures detailed by the Nordic Committee on Food Analysis (NMKL Nr 71 5th ed., 1999). Confirmatory identification and sero-typing of isolates was performed at the Dept. of Bacteriology, SVA according to the standard procedures of Kaufmann and White. The Dept. of Bacteriology, SVA is accredited for isola-tion, identification and serotyping of Salmonella.
Salmonella Typhimurium and S. Enteritidis were phage-typed by the Swedish Institute for Infectious Disease Control (SMI), Stockholm using the Colindale scheme.
CampylobacterCampylobacter spp. from chickens was isolated and identi-fied at SVA according to standard procedures. Samples were cultured for thermophilic Campylobacter spp. using a modi-fied NMKL method (NMKL Nr 119, 1990) using Preston enrichment broth and Preston selective agar, and incubation at 42°C. Identification was based on colony morphology, microscopic appearance including motility and the following phenotypic characteristics: production of oxidase, catalase, hippurate hydrolysis reaction and indoxyl-actetate reaction (Nachamkin, 1999). With these tests, hippurate-positive C. jejuni can be identified whereas other isolates are described as hippurate-negative thermophilic Campylobacter spp. The Dept. of Bacteriology, SVA is accredited for isolation and identification of Campylobacter spp.

42 S VA R M 2 0 0 4
Indicator bacteriaEscherichia coliApproximately 0.5 g of ceacal content was diluted in 4.5 mL phosphate buffered saline (PBS, pH 7.2). After thorough mixing, 0.1 mL of this suspension was spread on MacConkey agar. After incubation overnight at 37°C, one lactose positive colony with morphology typical for E. coli was sub-cultured on horse-blood agar (5% v/v), after which the isolate was tested for production of tryptofanase (indole) and ß-glucuro-nidase (p-nitrophenyl-ß-D- glucopyranosiduronic acid, PGUA). Only lactose-positive isolates with typical morphol-ogy and positive reactions in both tests were selected for susceptibility tests.
EnterococciCeacal content was diluted as described for E. coli and cultured both on solid media without selective antibiotics and on selective plates with vancomycin (16 mg/L).
Culture without selective antibiotics: Of the diluted intestinal content, 0.1 mL was spread onto Slanetz-Bartley (SlaBa) agar. The plates were incubated for 48 h at 37°C. One colony, randomly chosen, was sub-cultured on bile-esculin agar and blood agar (37°C, 24 h). Colonies with morphology consistent with enterococci, and with a positive reaction on bile-esculin agar were tested for antimicrobial susceptibility and identified to species level according to Devriese et al. (1993) by use of the following biochemical tests: mannitol, sorbitol, arabinose, saccharose, ribose, raffinose and methyl-α-D-glucopyranoside.
Selective culture for vancomycin resistant enterococci: Diluted caecal content (0.1 mL) was also cultured on SlaBa with vancomycin (16 mg/L). From plates showing growth of colonies typical for enterococci, at least one colony of each morphological type was sub-cultivated on bile-esculin agar and blood agar (37°C, for 24 h). Identification of presump-tive enterococci was performed as above.
For every fourth consecutive enterococcal isolate with MICs of vancomycin above >128 mg/L, the resistance geno-type was confirmed with PCR for the vanA- and vanB-genes (Dutka-Malen et al., 1995). Vancomycin resistant isolates were subtyped with the PhenePlateTM system (PhPlate Microplate Techniques AB, Stockholm, Sweden).
Animal pathogensAnimal pathogens, except E. coli from calves, were isolated and identified at the Dept. of Bacteriology, SVA with accred-ited methodology, following standard procedures.
Isolation and identification of E. coli from calves was performed at the Dept. of Pigs, Poultry and Ruminants.
Susceptibility testing
The Dept. of Antibiotics or the Dept. of Bacteriology with accredited methodology performed antimicrobial suscep-tibility tests using dilution methods in cation adjusted Mueller-Hinton broth (CAMBH). For bacteria other than Campylobacter spp the tests were performed following the standards for microdilution of the National Committee of Clinical Laboratory Standards (NCCLS, 2002). The micro-dilution panels used, VetMICTM, are produced at the Dept. of Antibiotics, SVA. Different panels were used depending on the bacterial species tested and the original purpose of the investigation (monitoring or clinical diagnostics).
For Campylobacter spp. there are currently no accepted standards for broth dilution susceptibility tests. The micro-dilution method described by NCCLS was adapted for Campylobacter spp. Each well in the microdilution panels was inoculated with 100 µl CAMBH with an inoculum density of approximately 106 CFU/ml. The panels were incubated in 37°C for 48 hours in a microaerophilic atmosphere.
Minimum inhibitory concentration (MIC) was recorded as the lowest concentration of the antimicrobial that inhibits bacterial growth. An isolate was regarded as resistant to a specific antimicrobial when its MIC was distinctly higher than those of inherently susceptible strains of the bacterial species in question. In other words, microbiological cut-off values were used to define resistance. Where appropriate, the breakpoints suggested by NCCLS (2002) for animal patho-gens were also taken into consideration. The cut-off values used for defining resistance are shown in Table AP3 I.
Bacitracin values in this report are given in units/mL. In an attempt to convert unit/mL to mg/L we discovered that there appears to be some confusion in the matter. The bacitracin compound used in SVARM is obtained from Sigma and meets the standards set by the United States Pharmacopoeia (USP), stating that one unit is equivalent to 26 µg of the US standard. However, according to the International Standard Preparations, one international unit is equivalent to 13.51 µg. On the other hand, if the bacitracin is of a very high degree of purity, though unstable, it correspond to 66 (-70) units/mg, that is, one unit is equivalent to approx-imately 15 µg. Feedingstuff grade of bacitracin correspond to 42-50 units/mg (one unit=20-24 µg) (Otten et al., 1975).

S VA R M 2 0 0 4 43
Quality assurance system
The Dept. of Antibiotics and Dept. of Bacteriology are accredited according to SS-EN ISO/IEC 17025 by the Swedish Board for Accreditation and Conformity Assessment (SWEDAC) to perform antimicrobial susceptibility tests with microdilution methods. The Dept. of Bacteriology is also accredited for isolation and identification of animal pathogens, Salmonella and Campylobacter according to the same standard.
For susceptibility tests of zoonotic and indicator bacteria, Escherichia coli ATCC 25922, Enterococcus faecalis ATCC 29212 and Campylobacter jejuni CCUG 11284 (analogue to Campylobacter jejuni ATCC 33560) were included as qual-ity controls. Relevant control strains were also included and evaluated at least once weekly for animal pathogens.
The Dept. of Antibiotics participates in several profi-ciency tests for antimicrobial susceptibility testing. These are arranged either as national or international studies. Likewise, the Dept. of Bacteriology participates in proficiency tests concerning isolation and identification of Salmonella spp. and general clinical veterinary bacteriology and susceptibility tests.
Data handlingRecords on Salmonella and animal pathogens such as source of cultured sample, identification results, antimicrobial susceptibility etc. are routinely registered in an Oracle data-base at SVA. From this, relevant data were extracted to an Access database.
For indicator bacteria, data on animal species, date of sampling, abattoir and herd or flock of origin were recorded in an Access database on arrival of samples, and the results of culture identification and susceptibility tests were recorded on completion of testing.
Calculations and analysis of data were performed in the computer programs Access, Excel, Minitab or the module Statcalc in EpiInfo.
Concerning confidence limitsWhen the prevalence of antimicrobial resistance is close to zero, e.g. when one out of 120 isolates is resistant, the ques-tion arises how to calculate the prevalence of resistance and its confidence intervals. In the example, the prevalence could be estimated to 0.83% while the 95% confidence interval is trickier. The normal approximation to the binomial distribu-tion would give a lower confidence of -0.8% and an upper confidence limit of 2.5%. The lower limit is nonsensical and indicates the unsuitability of the normal approximation in this case.
There are several ways out of the dilemma; one is to calcu-late the exact binomial confidence limits, which would be possible in some cases (small number of isolates). Another alternative is to run Monte-Carlo simulations based on the beta-distribution which is possible but quite laborious for a huge set of data since each prevalence estimate has to be
simulated 10 000 times. Finally the relationship between the F-distribution, the beta-distribution and the binomial distribution can be used. This gives the formulae that enable calculations of the confidence interval (Rao, 1965). Using this approach, the confidence intervals in the example would be 0.021% and 4.6%.
In conclusion, the normal approximation to the binomial distribution might be unsuitable when the prevalence is close to 0% or close to 100% since the approximation might lead to confidence intervals lower than 0% or higher than 100%. Moreover, when the prevalence of resistance is less than 5% using the link between the F-distribution and the binomial distribution yield different confidence intervals compared to those obtained from the normal approximation and should accordingly be preferred.

44 S VA R M 2 0 0 4
Table AP3 I. Cut-off values (mg/L) defining resistance used for antimicrobial susceptibility testing of bacteria. Isolates with MIC higher than the given values are considered resistant.
Substance Cam
pyl
ob
acte
r
Ent
ero
cocc
us
(indi
cato
r)
Esc
heri
chia
co
li(in
dica
tor)
Esc
heri
chia
co
il(p
atho
gen;
pig
, hor
se)
Esc
heri
chia
co
il(p
atho
gen;
cat
tle)
Esc
heri
chia
co
il(p
atho
gen;
dog
, cat
)
Pas
teur
ella
mul
toci
da
Rho
do
cocc
us e
qui
Sal
mo
nella
Sta
phy
loco
ccus
hyi
cus
Sta
phy
loco
ccus
inte
rmed
ius
Str
epto
cocc
us z
oo
epid
emic
us
Ampicillin >16 >8 >8 >8 >8 >8 >8 >8 >8
Apramycin >32
Avilamycin >16
Bacitracina >32
Ceftiofur >2 >2 >2 >2
Cephalothin >16 >2
Chloramphenicol >16 >16 >16 >16 >16
Clindamycin >4
Enrofloxacin >1 >0.25 >0.25 >0.25 >0.25 >0.25 >0.25 >0.5
Erythromycin >16 >4 >4 >4 >4
Flavomycin >32
Florfenicol >16 >16 >16 >16 >16
Fusidic acid >4 >4
Gentamicin >8 >512 >8 >8 >8 >8 >8 >8 >4 >4
Nalidixic acid >16 >16 >16 >16
Narasin >2
Neomycin >1024 >8 >8 >8 8 >8
Nitrofurantoin >32 >32
Oxacillin >1 >1
Penicillin c c >1
Spiramycin >32 >16
Streptomycin >1024 >32 >32 >32 >32 >32 >32 >32
Sulphamethoxazole >256 >256 >256
Tetracycline >8 >8 >8 >8 >8 >8 >8 >8 >8 >8 >8
Tiamulin
Trimethoprim >8 >8 >8
Trimethoprim & sulphamethoxazoleb >4 >4 >4 >0.5 >2 >2 >4
Tylosin
Vancomycin >16
Virginiamycin >8
a MIC in U/mL; b Concentration of trimethoprim given, tested with sulphamethoxazole in concentration ration 1/20; c ß-lactamase production.

S VA R M 2 0 0 4 45
ANTIMICROBIAL AGENTS licensed for therapy in veterinary medicine in Sweden year 2004 are listed in Table AP4 I.
Only substances licensed for systemic, oral, intrauterine or
intramammary use are included (ATCvet codes QJ, QG, QA and QP). Data from FASS VET. 2004. For explanation of ATCvet code, see Appendix 2.
Appendix 4: Antimicrobial agents licensed
Table AP4 I. Antimicrobial agents authorised for therapeutic use in cattle, sheep, pigs, poultry, horses, dogs and cats in Sweden, 2004. Routes of administra-tion are indicated.a
Antimicrobial agent ATCvet code
Animal species
Cattle Sheep Pigs Poultry Horses Dogs Cats
Tetracyclines
Doxycycline QJ01A A02 O O O
Oxytetracycline QJ01A A06, QG51A A01 I O U I O U I O U O O O
ß-lactams, penicillins
Ampicillin QJ01C A01 O O O O O
Amoxicillin QJ01C A04 I I I O O
Penicillin G, potassium QJ01C E01 I I I
Penicillin G, procaine QJ01C E09 I I I I I I
Penicillin G, penetamathydroiodide QJ01C E90 I
Amoxicillin/Clavulanic acid QJ01C R02 I I O I O
ß-lactams, cephalosporins
Cephalexin QJ01D A01 O
Cefadroxil QJ01D A09 O O
Ceftiofur QJ01D A90 I
Sulphonamides /Trimethoprim
Sulphadiazine/Trimethoprim QJ01E W10 I I I I O O O
Sulphadoxine/Trimethoprim QJ01E W13 I I I
Sulphonamides
Formosulphatiazole QA07A B90 O O O O O O
Sulphaclozin QP51A G04 O
Macrolides
Spiramycin QJ01F A02 I
Tylosin QJ01F A90 I I O O I I
Lincosamides
Clindamycin QJ01F F01 O O
Pirlimycin QJ51F F90 M
Aminoglycosides
Gentamicin QJ01G B03 I U I I
Dihydrostreptomycin (DHS) QA07A A90 O U O U O U O U O O
Fluoroquinolones
Enrofloxacin QJ01M A90 I I O I O I O
Danofloxacin QJ01M A92 I I
Marbofloxacin QJ01M A93 O O
Orbifloxacin QJ01M A95 O
Pleuromutilins
Tiamulin QJ01X X92 I O
Combinations
Penicillin G, procaine/DHS QJ01R A01, QJ51R C23 I M I I I I I
Penicillin G, benzatin/DHS QJ51R C24 M
Penicillin G, ester/Framycetin QJ51R C25 M
Penicillin G, ester/DHS QJ51R C25 M
a O = oral; I = injection; U = intrauterine; M = intramammary.

46 S VA R M 2 0 0 4
Aarestrup, FM. Characterization of glycopeptide-resistant Entero-
coccus faecium (GRE) from broilers and pigs in Denmark: Genetic evidence that persistence of GRE in pig herds is associated with coselection by resistance to macrolides. J Clin Microbiol. 2000, 38:2774-2777.
Aarestrup, FM. Studies of glycopeptide resistance among Enterococ-
cus faecium isolates from conventional and ecological poultry farms. Microb Drug Resist. 1995, 1: 255-257.
Bager, F., Madsen, M., Christensen, J. and Aarestrup, FM. Avoparcin used as growth promoter is associated with the occurrence on van-comycin-resistant Enterococcus faecium on Danish poultry and pig farms. Prev Vet Med. 1997, 31:95-112.
Bonten, MJM., Willems, R. and Weinstein, RA. Vancomycin-resistant enterococci: why are they here, and where do they come from? Lan-cet. 2001, 1:314-325.
Borgen, K., Simonsen, GS., Sundsfjord, A., Wasteson, Y., Olsvik, Ö. and Kruse, H. Continuing high prevalence of vanA-type vancomycin-resistant enterococci on Norwegian poultry farms three years after avoparcin was banned. J Appl Bacteriol. 2000a, 89:478-485.
Borgen, K., Sörum, M., Kruse, H. and Wasteson, Y. Persistence of vancomycin-resistant enterococci (VRE) on Norwegian broiler farms. FEMS Microbiol Lett. 2000b, 191:255-258.
Devriese, LA., Pot, B. and Collins, MD. Phenotypic identification of the genus Enterococcus and differentiation of phylogenetically distinct enterococcal species and species groups. J Appl Bacteriol. 1993, 75:399-408.
Dutka-Malen, S., Evers S. and Courvalin, P. Detection of glycopep-tide resistance genotypes and identification to the species level of clin-ically relevant enterococci by PCR. J Clin Microbiol. 1995, 33:24-27.
Egenvall, A., Hedhammar, Å., Bonett, BN. and Olson, P. Survey of the Swedish dog population: age gender, breed, location and enrol-ment in animal insurance. Acta Vet Scand. 1999, 40:231-240.
FASS VET. 2004 (Swedish list of permitted veterinary drugs). Läkeme-delsindustriföreningen, Stockholm, Sweden, 2003. ISSN 0347-1136.
Franklin, A. [Stafylokocker från hud. Biokemi och antibiotikaresistens] Staphylococci from skin. Biochemical tests and antibiotic resistance. In proceedings from: Nordic Veterinary Congress, Åbo, Finland, 1978, p 355.
Franklin, A. Antibiotikakänslighet hos Escherichia coli-stammar isol-erade från spädgrisar i Sverige 1964-68 samt 1974-75 [Antibiotic sus-ceptibility of Escherichia coli-strains isolated from piglets in Sweden 1964-68 and 1974-75]. Svensk VetTidn. 1976, 28:845-852.
Franklin, A. Antimicrobial drug resistance in porcine enterotoxigenic Escherichia coli of O-group 149 and non-enterotoxigenic Escherichia
coli. Vet Microbiol. 1984, 9:467-475.
Goossens, H., Jabes, D., Rossi, R., Lammens, C., Privitera, G. and Courvalin, P. European survey of vancomycin-resistant enterococci in at-risk hospital wards and in vitro susceptibility testing of ramoplanin against these isolates. J Antimicrob Chemother. 2003, 51, Suppl. S3 iii5-iii12.
Greko, C. and Lindblad, J. Vancomycin sensitivity of Enterococci from Swedish poultry and pigs. Proceedings: Food Associated Pathogens. Uppsala, Sweden, 1996, p 255.
Greko, C. Inventering av resistens mot antibakteriella medel hos enterokocker från kyckling (rapport). National Veterinary Institute. 1996.
Gunn, GJ., Hall, M. and Low, JC. Comparison of antibiotic resistance for Escherichia coli populations isolated from groups of diarrhoeic and control calves. Vet J. 2003, 165:172-174.
Hagman, R. and Greko, C. Antimicrobial resistance in Escherichia coli from canine pyometra and urinary tract infections. In press, Vet Rec.
Hammerum, AM., Fussing, V., Aarestrup, FM. and Wegener, HC. Characterization of vancomycin-resistant and vancomycin- suscep-tible Enterococcus faecium isolates from humans, chickens and pigs by RiboPrinting and pulsed field gel electrophoresis. J Antimicrob Chemother. 2000, 45:677-680.
Hedhammar, Å. En jämförelse av Sveriges hundar och katter i ett internationellt perspektiv [Swedish dogs and cats in an international perspective]. Presented at Smådjursdagarna Sept. 3-4, 2004, Kom-petenscentrum smådjur.
Heuer, OE., Pedersen, K., Andersen, JS. and Madsen, M. Vanco-mycin-resistant enterococci (VRE) in broiler flocks 5 years after the avoparcin ban. Microb Drug Resist. 2002a, 8:133-138.
Heuer, OE., Pedersen, K., Jensen, LB., Madsen, M. and Olsen, JE. Persistence of Vancomycin-resistant enterococci (VRE) in broiler houses after the avoparcin ban. Microb Drug Resist. 2002b, 8:355-361.
Heuer, OE., Jensen, VF. and Hammerum, AM. Antimicrobial drug consumption in companion animals. Emerg Infect Dis. 2005, 11:344-345.
Holm, B., Petersson U., Mörner A., Bergström K., Franklin A., and Greko C. Antimicrobial resistance in staphylococci from canine pyo-derma: a prospective study of first-time and recurrent cases. Vet Rec. 2002, 151:600-605.
Hoyle, DV., Knight, HI, Shaw, DJ., Hillman, K., Pearce, MC., Low, JC., Gunn, GJ., Woolhouse, MEJ. Acquisition and epidemiology of antibiotic-resistant Escherichia coli in a cohort of newborn calves. J Antimicrob Chemother. 2004, 53:867-871.
Appendix 5: References

S VA R M 2 0 0 4 47
Johnsen, PJ., Österhus, JI., Sletvold, H., Sörum, M., Kruse, H., Nielsen, K., Simonsen, G.S. and Sundsfjord, A. Persistence of ani-mal and human glycopeptide-resistant enterococci on two Norwegian poultry farms formerly exposed to avoparcin is associated with a polyclonal Enterococcus faecium population. Appl Environ Microbiol. 2005, 71:159-168.
Kerrn, MB., Klemmensen, T., Frimodt-Möller, N. and Espersen, F. Susceptibility of Danish Escherichia coli strains isolated from uri-nary tract infections and bactereremia, and distribution of sul genes conferring sulphonamide resistance. J Antimicrob Chemother. 2002, 50:513-516.
Khachatryan, AR., Hancock, DD., Besser, TE. and Call, DR. Role of calf-adapted Escherichia coli in maintenance of antimicrobial drug resistance in dairy calves. Appl Environ Microbiol. 2003, 70:752-757.
Klare, I., Heier, H., Claus, H., Reissbrodt, R. and Witte, W. vanA-mediated high-level glycopeptide resistance in Enterococcus faecium
from animal husbandry. FEMS Microbiol Lett. 1995, 125:165-172.
Lawson, AJ., Dassama, MU., Ward, LR. and Threlfall, EJ. Multiply resistant (MR) Salmonella enterica serotype Typhimurium DT 12 and DT 120: a case of MR DT 104 in disguise? Emerg Infect Dis. 2002, 8:434-436.
Nachamkin, I. Manual of Clinical Microbiology, 7th ed. 1999, p 716-726.
NCCLS. Performance standards for antimicrobial disk and dilution susceptibility test for bacteria isolated from animals. Approved stan-dard. M31-A2. National Committee for Clinical Laboratory Standards: Wayne, USA, 2002.
NORM/NORM-VET 2003. Usage of Antimicrobial Agents and Occur-rence of Antimicrobial Resistance in Norway. Tromsø/Oslo 2004. ISSN:1502-2307.
Odensvik, K., Grave, K. and Greko, C. Antibacterial drugs prescribed for dogs and cats in Sweden and Norway 1990-1998. Acta Vet Scand. 2001, 42:189-198.
Otten, H., Plempel, M. and Siegenthaler, W. Antibiotika-Fibel. Anti-biotika und Chemotherapeutika Therapie mikrobieller Infektionen. George Thieme Verlag, Stuttgart, 1975, pp 542-545.
Quednau, M., Ahrné, S and Molin, G. Antibiotic resistant Enterococci in Swedish and Danish pork and poultry. Proceedings: Food Associ-ated Pathogens. Uppsala, Sweden, 1996, p 254.
Rao, CR. Linear statistical inference and its applications. John Wiley and Sons, 1965.
Rönner, A-C., Olsson Engvall, E., Andersson, L. and Kaijser, B. Species identification by genotyping and determination of antibiotic resistance in Campylobacter jejuni and Campylobacter coli from humans and chickens in Sweden. Int J Food Microbiol. 2004, 96:173-179.
Sörum. M., Holstad, G., Lillehaug, A. and Kruse, H. Prevalence of vancomycin resistant enterococci on poultry farms established after the ban of avoparcin. Avian Diseases. 2004, 48:823-828.
SVARM 2000, Swedish Veterinary Antimicrobial Resistance Monitor-ing. The National Veterinary Institute (SVA), Uppsala, Sweden, 2001. ISSN 1650-6332.
SVARM 2001, Swedish Veterinary Antimicrobial Resistance Monitor-ing. The National Veterinary Institute (SVA), Uppsala, Sweden, 2002. ISSN 1650-6332.
SVARM 2002, Swedish Veterinary Antimicrobial Resistance Monitor-ing. The National Veterinary Institute (SVA), Uppsala, Sweden, 2003. ISSN 1650-6332.
SVARM 2003, Swedish Veterinary Antimicrobial Resistance Monitor-ing. The National Veterinary Institute (SVA), Uppsala, Sweden, 2004. ISSN 1650-6332.
SWEDRES 2004, The Swedish strategic programme for the rational use of antimicrobial agents (STRAMA) and the Swedish institute for infectious disease control. Ed; Cars, O. and Olsson Liljequist, B. 2005 ISSN 1400-3473.
WHO. Guidelines for ATCvet classification, 4th ed. WHO Collaborating Centre for Drug Statistics Methodology. 2002. Oslo, Norway. ISBN 82-90312-41-5 8.
Zoonoses in Sweden 2003. Trends and sources of zoonotic infec-tions recorded in Sweden during 2003. National Veterinary Institute, Swedish Board of Agriculture, National Food Administration, Swedish Institute for infectious Disease Control. Report to the European Com-mission, 2004.
Österlund, A., Hermann M., and Kahlmeter, G. Antibiotic resistance among Campylobacter jejuni/coli strains acquired in Sweden and abroad: a longitudinal study. Scand J Infect Dis. 2003, 35:478-81.