Swedbank year-end result 2020
30
© Swedbank Public Information class Swedbank year-end result 2020
Transcript of Swedbank year-end result 2020

© Swedbank
Public
Information class
Swedbank year-end result 2020

© Swedbank
Public
Information class
“A flickering light at the end of the tunnel”
2019 2020F 2021F
Swedbank January Forecast
Global 2.8 % -3.4 % (-3.9%) 4.7 % (4.7%)
Sweden 1.2 % -2.8 % (-3.5%) 3.0 % (2.1%)
Estonia 4.4 % -2.7 % (-3.2%) 3.1 % (3.1%)
Latvia 2.2 % -4.5 % (-5.0%) 2.8 % (3.1%)
Lithuania 3.9 % -1.7 % (-1.7%) 2.7 % (4.0%)
2
** Swedbank Economic Outlook, January 2021 https://internetbank.swedbank.se/ConditionsEarchive/download?bankid=1111&id=WEBDOC-PRODE72140614
(Nov.) (Nov.)

© Swedbank
Public
Information class
A challenging year 2020
WHO: 2,120,877deaths from Covid-19

© Swedbank
Public
Information class 4
Meeting customer needs in Covid-19 timesFocused on
sustainability
Addressed AML
shortcomings
Keeping our branches open, video meetings with customers
Deliveries 2020
Online customer advice on support programs, private finance

© Swedbank
Public
Information class
▪
▪
▪
▪
▪
▪
▪

© Swedbank
Public
Information class
Stable result in difficult timesGroup result Q4
SEKm Q4 20 Q3 20 ▲QoQ Q4 19 ▲YoY
Net interest income 6 567 6 714 -147 6 408 159
Net commission income 3 375 3 246 130 3 445 -39
Net gains and losses 910 669 241 1 218 -308
Other income 911 975 -64 915 -4
Total income 11 764 11 604 160 11 956 -192
Total expenses 5 586 4 761 825 5 549 37
Profit before impairments 6 178 6 843 -665 6 407 -229
Credit impairments 523 425 98 988 -465
Tax 1 144 1 155 -11 973 -17
Net profit 4 510 5 261 -751 4 428 82
Q4 2020 6
Ratios Q4 20 Q3 20 Q4 19
ROE, % 11.8 14.3 13.0
C/I ratio 0.47 0.41 0.46
CET1 capital ratio, % 17.5 16.8 17.0
• Increased AuM contributed to strong
NCI
• Positive valuation effect and client
activity improved NGL
• NII impacted by higher full year
deposit guarantee fee
• Seasonal effects and increased
staffing impacts cost
• Credit impairments related to
provisions in the oil and offshore
sector
• Return on Equity of 11.8% and a
CET1 buffer of 510bps

© Swedbank
Public
Information class 7
A stable result considering fine and pandemicFY 2020
• Net profit SEK 12.9bn
• ROE 8.9%, (excluding fine 11.4%), C/I 0.54 (0.45)
• Fine of SEK 4bn + credit impairment provisions of SEK 4.3bn
• CET1 capital ratio buffer of around 510bps
• Dividend proposal SEK 4.35 per share for 2019* (EGM)
• Dividend proposal, SEK 2.90 per share for 2020* (AGM)
*Proposal for EGM (15 Feb, 2021) and AGM (25 Mar, 2021) based on the Swedish FSA’s decision to limit until 30 September 2021 any dividend to 25% of the
aggregate 2019 and 2020 net earnings

© Swedbank
Public
Information class
Group result
Loan and deposit volumes impacted by FX
Q4 2020 8
Of which FX -14
*
*excl. Group functions and other (Group Treasury)
Of which FX -12
-6 +55
Deposits, SEKbnLoans, SEKbn
1144
1 0751 130
Q3 2020* Private Corporate* Q4 2020*
6
-8 -4
1 622 1 616
Q3 2020 Swedishmortgage
loans
Baltic banking Corporateexcl. Baltic
banking
Q4 2020

© Swedbank
Public
Information class
Group result
Stable net interest income
Q4 2020 9
• Continued mortgage loan growth
• Lower corporate loan volumes
• Slightly lower net margin effect due to
decreasing market rates
• Adjustment for higher 2020 deposit
guarantee fee
• Negative FX impact
NII, SEKm
Increase Decrease
262
111
-4-405 -93 -20
6 7156 566
Q3 2020 Lendingvolumes
Lendingmargins
Depositmargins
Treasury Depositguarantee
fee
FX Q4 2020
-32

© Swedbank
Public
Information class
Group result
Strong net commission income
• Lower income from cards due to lower
activity and one-off fee to savings
banks of SEK 130m
• Asset management income positively
impacted by higher AuM
– Positive stock market development
– Net inflows in equity funds
– Annual performance fees
• Advisory contributed positively
Q4 2020 10
NCI, SEKm
Increase Decrease
140
158
-168
3 246
3 376
Q3 2020 Cards &Payments
Assetmanagement
Corporateadvisory
Q4 2020

© Swedbank
Public
Information class
Group result
Higher net gains & losses
Q4 2020 11
NGL, SEKm • Positive valuation effects
– Derivatives, CVA/DVA
– Bond inventories
• Good client FX trading activity
Breakdown, Q4 2020
1 218
-322
1 398
669
910
Q4 2019 Q1 2020 Q2 2020 Q3 2020 Q4 2020
126 114
-45
472
243
910
CVA/DVA Bondinventories
Shares Clienttrading
Other Q4 2020

© Swedbank
Public
Information class
Group result
Stable other income
Q4 2020 12
Other Income, SEKm
• Stable income from insurance and
savings banks
• Lower income from Entercard due to
lower activity
915
645
867975
911
Q4 2019 Q1 2020 Q2 2020 Q3 2020 Q4 2020

© Swedbank
Public
Information class 13
• FY 2020 underlying expenses
according to guidance of SEK 19.7bn
• Increased number of FTEs and
seasonality
• AML investigation expenses higher4 794 4 800 4 698
5 416
57643 63
170
Q120* Q220 Q320 Q420
Other cost AML investigations
4 761
5 5865 3704 843
* Excluding administrative fine
Expenses, SEKm
Group result
Underlying expenses on target
Q4 2020

© Swedbank
Public
Information class
• FY 2020 Credit impairments of SEK 4.3bn
‒ Of which oil-related impairments of around SEK 3bn
• FY credit impairment ratio of 0.26%
‒ Q4 credit impairment ratio of 0.12%
Group
Solid asset quality
Q4 2020 14
1 627
740 521 537
373
432
-140
146
5643
-1
Q1 Q2 Q3 Q4
Swedish bankingBaltic banking
LC&I
Credit impairments per business area, SEKm
2 151
1 235
425 523
Group functions
-8
664
237
3 425
4 334
FY 2020
Q4 2020
8

© Swedbank
Public
Information class Q4 2020 15
IFRS 9 – high uncertainty remains
Expert portfolio
macro
adjustments
Individual
assessment
Macro-
economic
forecast Q4
Credit
impairments
YTD Q3
Credit
impairments FY
2020
Other write-
offs
• Reduced credit impairments under IFRS9
• Counteracted by management adjustments
• Individual assessment – oil-related
Rating
migrations, LGD,
prepayments etc.
672
394 220
-639
- 124 3 811
4 334
523m (Q4)
Q4 2020

© Swedbank
Public
Information class
0
1
2
3
4
5
6
IndustrialShipping
CommodityShipping
Infra-structure
DrillingRigs
OilServices
SupplyVessels
FloatingProduction
Stage 1 Stage 2 Stage 3
Shipping Offshore
Shipping and offshore by sub-sectors- half of portfolio in run-off
Q4 2020 16
Loans carrying amount, SEK 12.6bn (offshore 5.4bn)
Credit impairment provisions, SEK 4.5bn (offshore)
0
1
2
3
4
5
6
IndustrialShipping
CommodityShipping
Infra-structure
DrillingRigs
OilServices
SupplyVessels
FloatingProduction
Loans carrying amount Provisions
Shipping Offshore
Gross loans by stages, SEK 17bn (offshore 9.9bn)
Total stage 3 loans, SEK 6.2bn (offshore)

© Swedbank
Public
Information class
Capital
Stable Risk Exposure Amount (REA)
Q4 2020 17
REA, SEKbn• REA decreased by SEK 1.9bn
– Credit risk decreased mainly due
to stronger SEK
– Market movements decreased
REA for market risk and
derivatives
– Annual calculation of REA for
operational risk
– PD increased Article 3 add-on
5.3
2.1 1.0
-6.2-4.1
691.5 689.6
Q3 2020 Credit riskexcl. FX
Credit riskFX
Market riskand CVA
Operationalrisk
Article 3 andmodelupdate
Q4 2020

© Swedbank
Public
Information class
Capital
Solid capital position
18
• Buffer of around 510bps above
minimum requirements
– Regulatory requirements will lower
the buffer during 2021
– Remaining accrued dividend still
deducted
• CET1 capital increased by SEK 4.1bn
– Positive effect from net profit
– Positive IAS19 pension valuation
effect
– REA decreased by SEK 1.9bn
• Management capital buffer target of
100-300bps
CET1 capital ratio, %
Increase Decrease
CET1 capital, SEKbn
Q4 2020
2.9 0.9 0.3116.4120.5
Q3 2020 Profit IAS19 Other Q4 2020
16.1% 16.4% 16.8% 17.5%
12.4%
Q1 2020 Q2 2020 Q3 2020 Q4 2020 CET1 capitalratio
requirement

© Swedbank
Public
Information class
Looking ahead
Q4 2020 19
• NII development
• 50% dividend policy
• Management capital buffer target
of 100-300bps
20222020 2021
AML investigation costs Underlying expenses
20 50020 50019 700
500852
500• Underlying expenses development reflect a continued
build out of the bank
‒ Improvements in AML, Compliance and Governance
‒ Additional IT investments
• Expenses will peak at SEK 20.5bn for 2021 and 2022
‒ 2021 and 2022 AML investigation cost estimate of SEK 0.5bn
Expected development, SEKm

© Swedbank
Public
Information class
Appendix

© Swedbank
Public
Information class
Group result – FY 2020
A turbulent year led to a weaker resultSEKm FY 2020 FY 2019 ▲YoY
Net interest income 26 853 25 989 864
Net commission income 12 770 12 984 -214
Net gains and losses 2 655 3 629 -974
Other income 3 398 3 358 40
Total income 45 676 45 960 -284
Total expenses 24 560 19 984 4 576
Total expenses excl.
administrative fine20 560 19 984 576
Profit before impairments 21 116 25 976 -4 860
Credit impairments 4 334 1 469 2 865
Other impairments 2 87 -85
Tax 3 851 4 711 -860
Net profit 12 929 19 697 -6 768
Q4 20XX 21
Ratios FY 2020 FY 2019
ROE, % (excl. fine) 8.9 (11.4) 15.3
C/I ratio (excl. fine) 0.54 (0.45) 0.43
CET1 capital ratio, % 17.5 17.0
• ROE of 11.4% excluding fine
• Strong NII development
• Expenses in line with FY expectations
• Higher provisions due to pandemic
– Asset quality remains strong
• Solid capital buffer to requirements
• 50% dividend policy still stands
– Remaining accrued dividend still
deducted

© Swedbank
Public
Information class
Strong financial position to manage uncertainty
Q4 2020 22
• Solid private and SME customer
profile
• Low share of capital markets
related income
• Strong capital generation capacity
Earnings capacity(profit before impairments, SEKbn)
Balance sheet
• Liquidity coverage ratio, 174%
• Net stable funding ratio, 125%
• Liquidity reserve, SEK 485bn
– Of which SEK 315bn (65%) placed with
central banks
• Capital buffer of SEK 35bn to
CET1 capital requirement.
• Credit impairment ratio, bps20
-14
1 0 3 49 8
39
26
2010 2011 2012 2013 2014 2015 2016 2017 2018 2019 2020
* Excluding administrative fine of SEK 4bn in Q1 2020
0
10
20
30
2011 2012 2013 2014 2015 2016 2017 2018 2019 2020*

© Swedbank
Public
Information class
0 5 10 15 20 25 30 35 40
Other corporate lending
Professional services
Property management
Finance and insurance
Information and communication
Hotels and restaurants
Shipping and offshore
Transportation
Retail
Construction
Public sector and utilities
Manufacturing
Agriculture, forestry, fishing
Private other
Tenant owner associations
Private mortgage
Insignificantly impacted Slightly impacted Moderately impacted Materially impacted
Major part of Swedbank’s loan portfolio insignificantly impacted by Covid-19
Q4 2020 23
* Most sectors include at least one sub sector with higher or lower risk compared to the classification of the main sector – which we illustrate in the right hand bar where we bundled together sub-sectors, regardless of the sector, with the same
risk classification (i.e. considerably, moderately, slightly or insignificantly impacted).
Loans carrying amount, SEKbn
Sub-sectors
▪ Considerably impacted sub-
sectors− Extraction & Processing of raw
materials
− Clothing
− Transportation, passenger
− Offshore (oil)
− Hotels
− Restaurants
− Recreation and entertainment
facilities
5022
280
1 258
Distribution by sub-sector sensitivity*
1%
3%
18%
78%
Distribution by sub-sector loan volume and share in stage2
4%
4%
11%
11%
11%
2%
15%
9%
4%
19%
49%
29%
20%
23%
15%
8%

© Swedbank
Public
Information class
Property management – focus on well-known companies with solid finances
24
Residential property management
Share of loan-to-value >75%
Average loan-to-value, %
Property
management
Commercial property management
0.3% 1.7% 0.0% 0.0% 0.0% 0.0%
55% 47% 45% 37% 49% 60%
• Low risk portfolio, supported by;
− Growing population
− High demand, and low supply of new
production
− Stable rent levels
− Low vacancy rates
94.0% 0.1% 0.2% 0.0% 1.9% 3.8%
▪Sweden ▪Estonia ▪Latvia ▪Lithuania ▪Norway ▪Finland
Share of loan-to-value >75%
Average loan-to-value, %
2.3% 0.5% 0.0% 0.3% 1.5% 0.1%
57% 53% 52% 44% 57% 57%
• Office properties with low vacancies in
larger cities, appr. SEK 80bn
• Logistic properties supported by growing
e-commerce, appr. SEK 16bn
• Community properties, appr. SEK 11bn
• Retail real estate, appr. SEK 21bn
• Hotel real estate, appr. SEK 8bn
– Focus on low, to moderate risk segments
78.0% 6.7% 2.3% 3.3% 6.4% 3.3%
▪Sweden ▪Estonia ▪Latvia ▪Lithuania ▪Norway ▪Finland
SEK
74bn
SEK
173bn

© Swedbank
Public
Information class
Strong commitment to sustainabilityA financially sound and sustainable society
25
1980 2003
First SRI mutual fund
launched – excluding
sectors deemed
unethical
First listed Nordic bank to
receive ISO 14001 certification
for its Environmental
Management System
1820
Swedbank’s first Group-
wide sustainability report
complying with GRI G4
2014 2015
Headquarters in
Stockholm received EU
Green Building
certification
Achieved target to
reduce CO2 emissions
by 50% from 2010
2013
Sustainability Report
integrated in the Annual
Report
Group-wide exclusion of
companies whose coal
revenues exceed 30% of
turnover
2016 2017
Inaugural Swedbank
Green Bond issued
Launched Global
Impact Fund
2018
Ensuring a secure
operating environment
✓ Proactive strategy to information
security
✓ Systematic approach to AML with
same governance and processes
in all our home markets
✓ Low losses related to operational
risks
Commitment to govern
with impact
✓ UN Principles for Responsible
Banking – Founding Signatory
✓ TCFD Supporter and committed to
Science Based Target initiative
✓ Committed to SDGs 4, 8, 12, 16
✓ Member of UNEPFI Energy
Efficiency Finance Platform
✓ Aiming to reduce CO2 emissions
by 60% 2019-2030
Help our customers to
make sustainable
decisions
✓ Green mortgages
✓ Unique SDG fund (Global Impact
Fund)
✓ Market leading Green Bond
Nordic book runner
✓ Developed indicators to assess
progress towards the SDGs in our
home markets
Our legacy – roots, values
& conduct
✓ Sweden’s first savings bank in
1820 combating poverty
✓ Increasing financial literacy in
society
✓ Supporting development of
financial infrastructure in our
home markets
✓ Inclusive bank
✓ Our core values: Open, Simple,
Caring
2014
Swedbank acquired a majority
stake in Hansabank in the
Baltics
1998
First savings bank
established in Sweden
1996
Launched fund investing in
companies with industry
leading environmental focus
2019
Launched Green Loans
and Sustainability
Improvement Loans
Launched
Transition Funds
2019 2020
Launched ‘Paris Aligned’
Funds
Group-wide exclusion of
companies whose coal
revenues exceed 5% of
turnover

© Swedbank
Public
Information class
Sustainable value creation Long-term sustainable equals long-term profitability
26
Empower our customers to make
sustainable choices
KEY MESSAGES
▪ We empower the many
people and businesses
to create a better future
▪ A new proactive role of
banking is emerging• Set corporate level targets in
alignment with Paris and the
fulfillment of the UN SDGs
• Provision of finance to
investments with environmental,
social and governance
considerations
• Empower the many People to
create a better future by
supporting sustainable choices
• Offer sustainable savings,
green mortgages, solar cell
loans
• Empower the many Businesses to
create a better future by supporting
the transformation
• Offer green loans, sustainability
improvement loans, ESG-bonds,
renewable energy investments
• The SDGs: 17 global goals
• United Nations General
Assembly’s vision of society
in 2030
▪ The Paris Agreement
and UN SDGs
determine the future
operating environment
• Limit global warming
• Align finance flows with low
greenhouse gas emissions
and climate-resilient
development

© Swedbank
Public
Information class
Sustainability in our DNA – Q4 accomplishments
Swedbank recent commitments and recognitions
Enabling customers to make smart and sustainable choices
Position Statement on Climate change
• Swedbank updated its position statement on climate change stating that the bank will
divest all companies mining and producing coal to more than 5% of its turnover
(previously 30%) from our internal funds and equity offerings.
• Advocate for portfolio companies’ and corporate customers’ adaptation of the TCFD
requirements to ensure their alignment with the Paris Agreement.
• Not directly finance unconventional fossil fuel production such as shale oil/gas, arctic
oil/gas or oil sand.
• Not directly finance exploration of new oil or gas fields, although we can finance
clients with such activities if the business strategy is aligned with the Paris
Agreement.
• During Q4 2020, ESG bonds in SEK, NOK and EUR accounted for ~23% of the total
issuance volume arranged by Swedbank Capital Markets.
Strong ESG footprint in Capital Markets
27
Swedbank Robur's Råvarufond was transformed into a new thematic fund with a focus
on solar, wind and energy transition. The new fund, Transition Energy, will invest in
companies worldwide that will contribute to a future renewable energy system.
Q4 2020
*ESG bonds includes Green, Social & Sustainability bonds
Developed and launched sustainability offerings in Baltic banking focusing on reducing
our climate impact, example of new products; Home Energy efficiency loan (for energy
efficiency improvements in your private house), Green car leasing loan, Solar panels loan
and Renewable energy loan for small business.
• In the beginning of November, the Swedish property company Platzer announced
the launch of its Green Equity Framework, making them the second company in the
world to shade its shares, both current and future, as green. Swedbank acted as
Sole Structuring Advisor for the framework, and CICERO Shades of Green has
provided a Second Opinion.
Financing of green and
energy efficient buildings
Due 2023
NOK 800m
Issued November 2020
CICERO
Joint Lead Manager
Financing according to
Green Financing
Framework
Due 2027
SEK 7bn
Issued November 2020
CICERO
Joint Lead Manager
Financing according to
Green Bond Framework
Due 2027
EUR 750m
Issued October 2020
ISS ESG
Joint Lead Manager
• Included in Dow Jones Sustainability Index
(World and Europe)
• Highest rating among Swedish large banks in
Fair Finance Guides policy review
• Maintains score B in the yearly CDP 2020
Swedbanks Sustainability Report will be published February 25th
• During the quarter Swedbank Robur signed two new initiatives:• Net Zero Assets Managers initiatives – the purpose of the initiative is for asset
managers to undertake and work to reduce the carbon dioxide development in its
investment portfolios.
• Finance for Biodiversity – that involves cooperation around and a commitment to
decrease negative impact on biodiversity, focusing on target setting and reporting.
Proactive initiatives
© Swedbank
Public
Information class
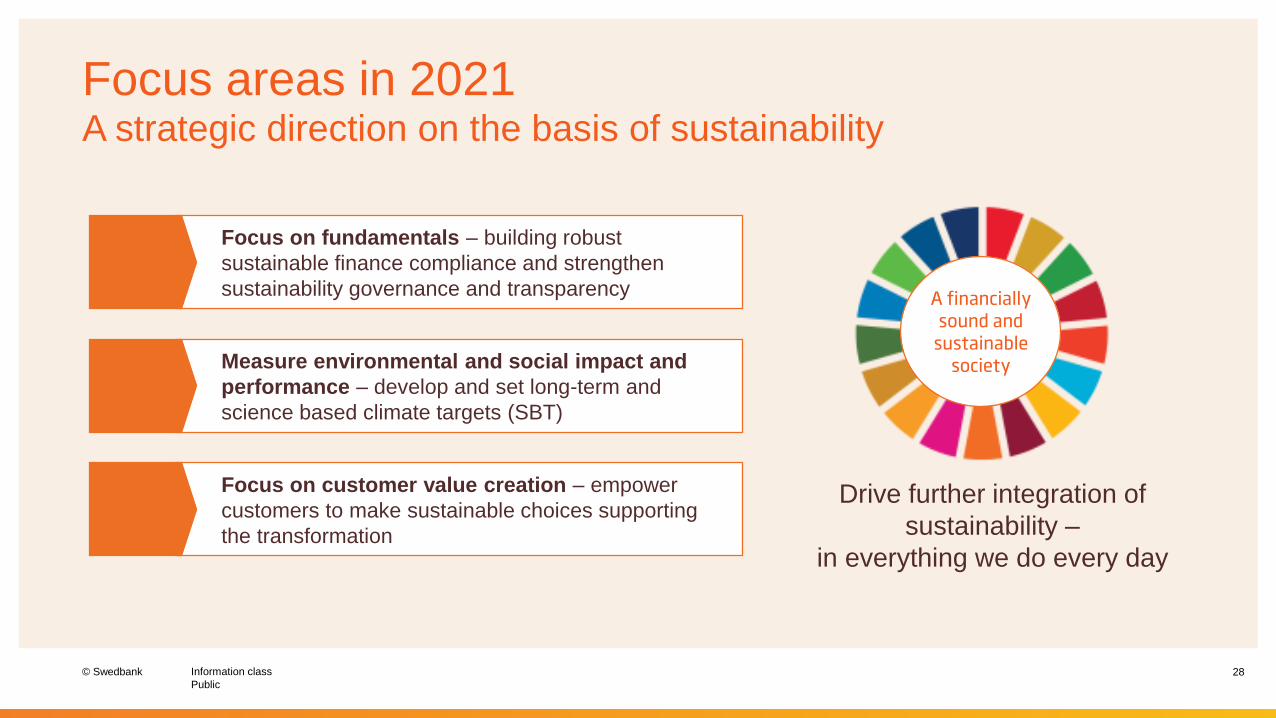
Focus areas in 2021A strategic direction on the basis of sustainability
28
Drive further integration of
sustainability –
in everything we do every day
A financially sound and
sustainable society
Focus on fundamentals – building robust
sustainable finance compliance and strengthen
sustainability governance and transparency
Focus on customer value creation – empower
customers to make sustainable choices supporting
the transformation
Measure environmental and social impact and
performance – develop and set long-term and
science based climate targets (SBT)

© Swedbank
Public
Information class
0
100
200
300
400
500
600
Liquidity reserve
Level 1 assets
...of which cash andbalances with centralbanks
Level 2 assets
Strong liquidity position
Q4 2020 29
Strong funding profile
SEKbn
Liquidity reserve
Stable liquidity key ratios
SEKbn
Net Stable Funding Ratio and Liquidity coverage ratio, %Outstanding volumes
• Solid liquidity buffer – prefunded
for more than 12 months
(survival horizon)
• Term funding, issued SEK 78bn
2020 – FY 2021 maturities of
SEK 124bn
• Significant over-collateralisation
in the cover pool (76.2%)
• No reliance on short-term
funding - central bank holdings in
excess of short-term funding
• Stable deposit base
• LCR 174% and NSFR (CRD2)
125%
Liquidity
and
funding
0
200
400
600
800
1 000
1 200
1 400
Coveredbonds
Seniorunsecured
SNP Structuredretail bonds
Short-termprogrammes
Deposits
Q3 2020 Q4 2020
100
110
120
130
140
150
160
170
180
190
100
105
110
115
120
125
130
Q4 2019 Q1 2020 Q2 2020 Q3 2020 Q4 2020
NSFR, CRD2 (LHS) LCR (RHS)

© Swedbank
Public
Information class
Real-estate price performance – Sweden, 12 month
Q4 2020 30
Single-family homes1 Tenant-owner rights2 Combined3
12M Δ 12M Δ 12M Δ
Jan 20 6% 6% 6%
Feb 20 7% 7% 7%
Mar 20 6% 6% 6%
Apr 20 4% 2% 3%
May 20 6% 2% 5%
Jun 20 7% 3% 6%
Jul 20 11% 4% 8%
Aug 20 11% 4% 8%
Sep 20 11% 5% 9%
Oct 20 13% 6% 10%
Nov 20 13% 6% 10%
Dec 20 16% 5% 12%
Source: Valuegard www.valuegard.se (Based on data from Mäklarstatistik), 1 HOXHOUSESWE, 2 HOXFLATSWE (apartments), 3 HOXSWE
Swedish
housing
and
mortgage
market
House price index, Sweden2005=100
0
50
100
150
200
250
300
350
05 06 07 08 09 10 11 12 13 14 15 16 17 18 19 20
Total
Tenant-owner rights (apartments)
Single-family houses