swcst.or.thswcst.or.th/Report/cooperative/National Soil Survey Hand… · Web view618.17 Drainage...
197
Part 618 – SOIL PROPERTIES AND QUALITIES Table of Contents PART TITLE PAGE 618.00 Definition and Purpose.....................................618-1 618.01 Policy and Responsibilities................................618-1 618.02 Collecting, Testing, and Populating Soil Property Data....618-1 618.03 Soil Properties and Soil Qualities.........................618-1 618.04 Albedo, Dry................................................618-2 618.05 Available Water Capacity...................................618-2 618.06 Bulk Density, One-Tenth Bar or One-Third Bar..............618-4 618.07 Bulk Density, 15 Bar.......................................618-5 618.08 Bulk Density, oven dry.....................................618-7 618.09 Calcium Carbonate Equivalent...............................618-7 618.10 Cation Exchange Capacity NH 4 OAc pH7........................618-8 618.11 Climatic Setting...........................................618-8 618.12 Corrosion..................................................618-9 618.13 Crop Name and Yield.......................................618-10 618.14 Diagnostic Horizon Feature Depth to Bottom...............618-11 618.15 Diagnostic Horizon Feature Depth to Top..................618-11 618.16 Diagnostic Horizon Feature Kind...........................618-12 618.17 Drainage Class............................................618-12 618.18 Effective Cation-Exchange Capacity ........................618-12 618.19 Electrical Conductivity...................................618-13 618.20 Elevation.................................................618-14 618.21 Engineering Classification................................618-14 618.22 Erosion Accelerated, Kind.................................618-16 618.23 Erosion Class.............................................618-17 618.24 Excavation Difficulty Classes.............................618-17 618.25 Extractable Acidity.......................................618-18
Transcript of swcst.or.thswcst.or.th/Report/cooperative/National Soil Survey Hand… · Web view618.17 Drainage...

Part 618 – SOIL PROPERTIES AND QUALITIES
Table of Contents
PART TITLE PAGE
618.00 Definition and Purpose............................................................................618-1618.01 Policy and Responsibilities......................................................................618-1618.02 Collecting, Testing, and Populating Soil Property Data.............................618-1618.03 Soil Properties and Soil Qualities.............................................................618-1618.04 Albedo, Dry.............................................................................................618-2618.05 Available Water Capacity........................................................................618-2618.06 Bulk Density, One-Tenth Bar or One-Third Bar.........................................618-4618.07 Bulk Density, 15 Bar...............................................................................618-5618.08 Bulk Density, oven dry............................................................................618-7618.09 Calcium Carbonate Equivalent................................................................618-7618.10 Cation Exchange Capacity NH4OAc pH7...................................................618-8618.11 Climatic Setting......................................................................................618-8618.12 Corrosion................................................................................................618-9618.13 Crop Name and Yield.............................................................................618-10618.14 Diagnostic Horizon Feature Depth to Bottom.........................................618-11618.15 Diagnostic Horizon Feature Depth to Top..............................................618-11618.16 Diagnostic Horizon Feature Kind............................................................618-12618.17 Drainage Class......................................................................................618-12618.18 Effective Cation-Exchange Capacity......................................................618-12618.19 Electrical Conductivity...........................................................................618-13618.20 Elevation...............................................................................................618-14618.21 Engineering Classification.....................................................................618-14618.22 Erosion Accelerated, Kind......................................................................618-16618.23 Erosion Class........................................................................................618-17618.24 Excavation Difficulty Classes.................................................................618-17618.25 Extractable Acidity................................................................................618-18618.26 Extractable Aluminum...........................................................................618-18618.27 Flooding Frequency, Duration, and Month.............................................618-18618.28 Fragments in the Soil............................................................................618-21

Table of Contents Part 618 – Soil Properties and Qualities
618.29 Free Iron Oxides....................................................................................618-24618.30 Frost Action, Potential...........................................................................618-25618.31 Gypsum................................................................................................618-26618.32 Horizon Depth to Bottom.......................................................................618-27618.33 Horizon Depth to Top............................................................................618-27618.34 Horizon Designation..............................................................................618-27618.35 Horizon Thickness.................................................................................618-28618.36 Hydrologic Group..................................................................................618-29618.37 Landform..............................................................................................618-29618.38 Linear Extensibility Percent...................................................................618-30618.39 Liquid Limit...........................................................................................618-32618.40 Organic Matter......................................................................................618-32618.41 Parent Material, Kind, Modifier, and Origin............................................618-33618.42 Particle Density.....................................................................................618-34618.43 Particle Size..........................................................................................618-34618.44 Percent Passing Sieves..........................................................................618-37618.45 Plasticity Index......................................................................................618-38618.46 Ponding Depth, Duration, Frequency Class, and Month..........................618-38618.47 Pores....................................................................................................618-40618.48 Reaction, Soil (pH)................................................................................618-42618.49 Restriction Kind, Depth, Thickness, and Hardness.................................618-43618.50 Saturated Hydraulic Conductivity..........................................................618-45618.51 Slope Aspect.........................................................................................618-45618.52 Slope Gradient......................................................................................618-46618.53 Slope Length.........................................................................................618-46618.54 Sodium Adsorption Ratio.......................................................................618-47618.55 Soil Erodibility Factors, USLE, RUSLE2...................................................618-47618.56 Soil Erodibility Factors for WEPP............................................................618-50618.57 Soil Moisture Status..............................................................................618-52618.58 Soil Slippage Hazard.............................................................................618-53618.59 Soil Temperature..................................................................................618-54618.60 Subsidence, Initial and Total.................................................................618-54618.61 Sum of Bases........................................................................................618-56618.62 Surface Fragments................................................................................618-56618.63 T Factor................................................................................................618-59618.64 Taxonomic Family Temperature Class...................................................618-59

Table of Contents Part 618 – Soil Properties and Qualities
618.65 Taxonomic Moisture Class.....................................................................618-61618.66 Taxonomic Moisture Subclass. (Subclasses of soil moisture regimes.). .618-61618.67 Taxonomic Temperature Regime. (Soil Temperature Regimes.)...........618-62618.68 Texture Class, Texture Modifier, and Terms Used in Lieu of Texture......618-62618.69 Water, One-Tenth Bar...........................................................................618-67618.70 Water, One-Third Bar............................................................................618-67618.71 Water, 15 Bar........................................................................................618-68618.72 Water, Satiated.....................................................................................618-68618.73 Wind Erodibility Group and Index..........................................................618-68Exhibit 618-1 Guides for Estimating Risk of Corrosion Potential for Uncoated Steel. 1/
......................................................................................................618-70Exhibit 618-2 Guide for Estimating Risk of Corrosion Potential for Concrete......618-71Exhibit 618-3 Crop Names and Units of Measure...............................................618-72Exhibit 618-4 Classification of Soils and Soil-Aggregate Mixtures for the AASHTO
System...........................................................................................618-73Exhibit 618-5 Potential Frost Action..................................................................618-74Exhibit 618-6 Distribution of Design Freezing Index Values in the Continental United
States.............................................................................................618-75Exhibit 618-7 Estimating LL and PI from Percent and Type of Clay....................618-76Exhibit 618-8 Texture Triangle and Particle-Size Limits of AASHTO, USDA, and
Unified Classification Systems........................................................618-77Exhibit 618-9 Guide for Estimating Ksat from Soil Properties.............................618-78Exhibit 618-10 Guide to Estimating Water Movement Through Lithic and
Paralithic Materials. 1/ 2/...............................................................618-81Exhibit 618-11 Rock Fragment Modifier of Texture............................................618-82Exhibit 618-12 Soil Erodibility Nomograph........................................................618-83Exhibit 618-13 Kw Value Associated with Various Fragment Contents...............618-83Exhibit 618-13 Kw Value Associated with Various Fragment Contents...............618-84Exhibit 618-14 General Guidelines for Assigning Soil Loss Tolerance "T"...........618-85Exhibit 618-15 Texture Class, Texture Modifier, and Terms Used in Lieu of Texture.
......................................................................................................618-95Exhibit 618-16 Wind Erodibility Groups (WEG) and Index..................................618-96Exhibit 618-17 Key Landforms and Their Susceptibility to Slippage...................618-98Exhibit 618-18 Example Worksheets for Soil Moisture State by Month and Depth. 618-
99Appendix 618-1 NASIS Calculation for Estimating AASHTO Group Index..........618-101Appendix 618-2 NASIS Calculation for Estimating Cation Exchange Capacity. .618-102

Table of Contents Part 618 – Soil Properties and Qualities
Appendix 618-3 NASIS Calculation for Estimating Effective Cation Exchange Capacity....................................................................................................618-105
Appendix 618-4 NASIS Calculation for Estimating Extractable Acidity..............618-106Appendix 618-5 NASIS Calculation for Estimating Liquid Limit and Plasticity Index618-
110Appendix 618-6 NASIS Calculation for Estimating Particle Size........................618-113Appendix 618-7 NASIS Calculation for Estimating Rock Fragments and
Percent Passing Sieves.................................................................618-117Appendix 618-8 NASIS Calculation for Estimating Water Content Data............618-129

Part 618 - SOIL PROPERTIES AND QUALITIES
618.00 Definition and Purpose.
(a) Soil properties are measured or inferred from direct observations in the field or laboratory. Examples of soil properties are particle-size distribution, cation-exchange capacity, and salinity.
(b) Soil qualities are behavior and performance attributes that are not directly measured. They are inferred from observations of dynamic conditions and from soil properties. Examples of soil qualities are corrosivity, natural drainage, frost action, and wind erodibility.
(c) Soil properties and soil qualities are the criteria used in soil interpretations, as predictors of soil behavior, and for classification and mapping of soils. The soil properties entered should be representative of the soil and the dominant land use for which the interpretations are based.
618.01 Policy and Responsibilities.
(a) Soil property data are collected, tested, and correlated as part of soil survey operations. These data are reviewed, supplemented, and revised as necessary.
(b) The MLRA Soil Survey Office is responsible for collecting, testing, and correlating soil property data and interpretive criteria.
(c) The MLRA Soil Survey Regional Office (MO) is responsible for the development, maintenance, quality assurance, correlation, and coordination of the collection of soil property data that are used as interpretive criteria. This includes all data elements listed in part 618.
(d) The National Soil Survey Center (NSSC) is responsible for the training, review, and periodic update of soil interpretation technologies.
(e) The state soil scientist is responsible for ensuring that the soil interpretations are adequate for the field office technical guide and that they meet the needs of federal, state, and local programs.
618.02 Collecting, Testing, and Populating Soil Property Data.
The collection and testing of soil property data is based on the needs described in the soil survey memorandum of understanding for individual soil survey areas. The collection and testing must conform to the procedures and guides established in this handbook.Soil properties and qualities that are populated in the National Soil Information System (NASIS), as aggregated component data, are not meant to be site-specific. They represent the component as it occurs throughout the extent of the map unit. Most data entries are developed by aggregating information from point data (pedons) to create low, high, and representative values for the component.
(430-VI-NSSH, 2010)

618.03 Soil Properties and Soil Qualities.
The following sections list soil properties and qualities in alphabetical order and provide some grouping for climatic and engineering properties and classes. A definition, classes, significance, method, and guidance for NASIS database entry are given. The listing includes the soil properties and qualities in the NASIS database. For specifics of data structure, attributes, and choices in NASIS, refer to http://www.soils.usda.gov/technical/nasis/Previous databases of soil survey information used metric or English units for soil properties and qualities. Values in English units were converted into metric units during transfer into the NASIS database, except for crop yields. All future edits and entries in NASIS will use metric units, except yields and acreage.Ranges of soil properties and qualities, posted in the NASIS database for map unit components, may extend beyond the established limits of the taxon from which the component gets its name, but only to the extent that interpretations do not change. However, the representative value (RV) is within the range of the taxon.
618.04 Albedo, Dry.
(a) Definition. Albedo, dry, is the estimated ratio of the incident shortwave (solar) radiation that is reflected by the air-dry, less than 2 mm fraction of the soil surface to that received by it.
(b) Significance. Soil albedo, as a function of soil color and angle of incidence of the solar radiation, depends on the inherent color of the parent material, organic matter content, and weathering conditions. Estimates of the evapotranspiration rates and for predicting soil water balances require the albedo. Evapotranspiration and soil hydrology models that are part of Water Quality and Resource Assessment programs require this information.
(c) Measurement. Instruments exist that measure albedo.(d) Estimation. Approximate the values by use of the following formula:
Soil Albedo=0.069 x (Color Value} - 0.ll4.
For albedo, dry, use dry color value. Surface roughness has a separate significant impact on the actual albedo. The equation above is the albedo of <2.0 mm smoothed soil condition, but if the surface is rough because of tillage, the albedo differs.
(e) Entries. Enter the high, low, and representative values of the map unit component using the above formula. Allowable entries range from 0.00 to 1.00, with 2 decimal places.
618.05 Available Water Capacity.
(a) Definition. Available water capacity is the volume of water that should be available to plants if the soil, inclusive of fragments, were at field capacity. It is commonly estimated as the amount of water held between field capacity and wilting point, with corrections for salinity, fragments, and rooting depth.
(430-VI-NSSH, 2010)

(b) Classes. Classes of available water capacity are not normally used except as adjective ratings that reflect the sum of available water capacity in inches to some arbitrary depth. Class limits vary according to climate zones and the crops commonly grown in the areas. The depth of measurement also is variable.
(c) Significance. Available water capacity is an important soil property in developing water budgets, predicting droughtiness, designing and operating irrigation systems, designing drainage systems, protecting water resources, and predicting yields.
(d) Estimates. The most common estimates of available water capacity are made in the field or the laboratory as follows:(1) Field capacity is determined by sampling the soil moisture content just after
the soil has drained following a period of rain and humid weather, after a spring thaw, or after heavy irrigation. The Soil Survey Investigation Report No. 42, Soil Survey Laboratory Methods Manual, Version 4.0, November 2004, provides more information.
(2) The 15-bar moisture content of the samples is determined with pressure membrane apparatus.
(3) An approximation of soil moisture content at field capacity is commonly made in the laboratory using 1/3-bar moisture percentage for clayey and loamy soil materials and 1/10-bar for sandy materials. Recently, some soil physicists have been using 1/10-bar instead of 1/3-bar for clayey and loamy soil materials and 1/20-bar for sandy soil materials.
(4) Measure the bulk density of the moist soil. The Soil Survey Investigation Report No. 42, Soil Survey Laboratory Methods Manual, Version 4.0, November 2004, provides more information.
(5) Calculate available water capacity (AWC) using the following formula:
AWC = W1/3 - W15) X (Db1/3) X cm / 100WhereAWC = volume of water retained in 1 cm3 of whole soil between 1/3-bar and
15-bar tension; reported as cm cm-1, i.e., numerically equivalent to inches of water per inch of soil (in in-1)
W1/3 = weight percentage of water retained at 1/3-bar tensionW15 = weight percentage of water retained at 15-bar tensionDb1/3 = bulk density of <2-mm fabric at 1/3-bar tensionCm = Vol moist <2-mm fabric (cm3) Vol moist whole soil (cm3)Procedure 3B2 is used to determine Vol moist <2-mm fabric (cm3).
AWC (cm cm-1 or in in-1 horizon) = AWC (cm cm-1 or in in-1 ) X horizon thickness
(6) If data are available, estimates are based on available water capacity measurements. If data are not available, data from similar soils are used as a
(430-VI-NSSH, 2010)

guide. The relationship between available water capacity and other soil properties has been studied by many researchers. Soil properties that influence available water capacity are particle size; size, shape, and distribution of pores; organic matter; type of clay mineral; and structure.
(7) amount of water available to plants is nearly zero. Available water capacity values are zero for layers that exclude roots. If roots are restricted but not excluded, estimates of available water capacity are reduced according to the amount of dense material in the layers and the space available for root penetration. Depending on the ability of roots to enter the soil mass and utilize the water, values for the soils with these dense layers may be significantly less than for soils of similar texture that do not have pans. Entries are made for all soil layers below dense layers only if roots are present.
(8) Depending on their abundance and porosity, rock and pararock fragments reduce available water capacity. Nonporous fragments reduce available water capacity in proportion to the volume they occupy, for example, 50 percent nonporous cobbles reduces available water capacity as much as 50 percent. Porous fragments, such as sandstone, may reduce available water capacity to a lesser proportion.
(9) Several factors contribute to a lower amount of plant growth on saline soils. However, as a rough guide, available water capacity is reduced by about 25 percent for each 4 mmhos cm-1 electrolytic conductivity of the saturated extract.
(10) Soils high in gibbsite or kaolinite, such as Oxisols and Ultisols, may have available water capacity values that are about 20 percent lower than those with equal amounts of 2:1 lattice clays.
(11) Soils high in organic matter have higher available water capacity than soils low in organic matter if the other properties are the same.
(e) Entries. Enter high, low, and representative values for available water capacity in cm per cm for each horizon. Enter "0" for layers that exclude roots. The range of valid data entries is 0.00 to 0.70 cm per cm.
618.06 Bulk Density, One-Tenth Bar or One-Third Bar.
(a) Definition. Bulk density one-tenth bar or one-third bar is the oven-dried weight of the less than 2 mm soil material per unit volume of soil at a water tension of 1/10 bar or 1/3 bar.
(b) Significance. Bulk density influences plant growth and engineering applications. It is used to convert measurements from a weight basis to a volume basis. Within a family particle size class, bulk density is an indicator of how well plant roots are able to extend into the soil. Bulk density is used to calculate porosity.(1) Plant growth. Bulk density is an indicator of how well plant roots are able to
extend into the soil. Root restriction initiation and root limiting bulk densities are shown below for various family particle size classes.
Family particle-size
Bulk density (g cm-3)
Classes Restriction- initiation
Root- limiting
Sandy 1.69 >1.85
(430-VI-NSSH, 2010)
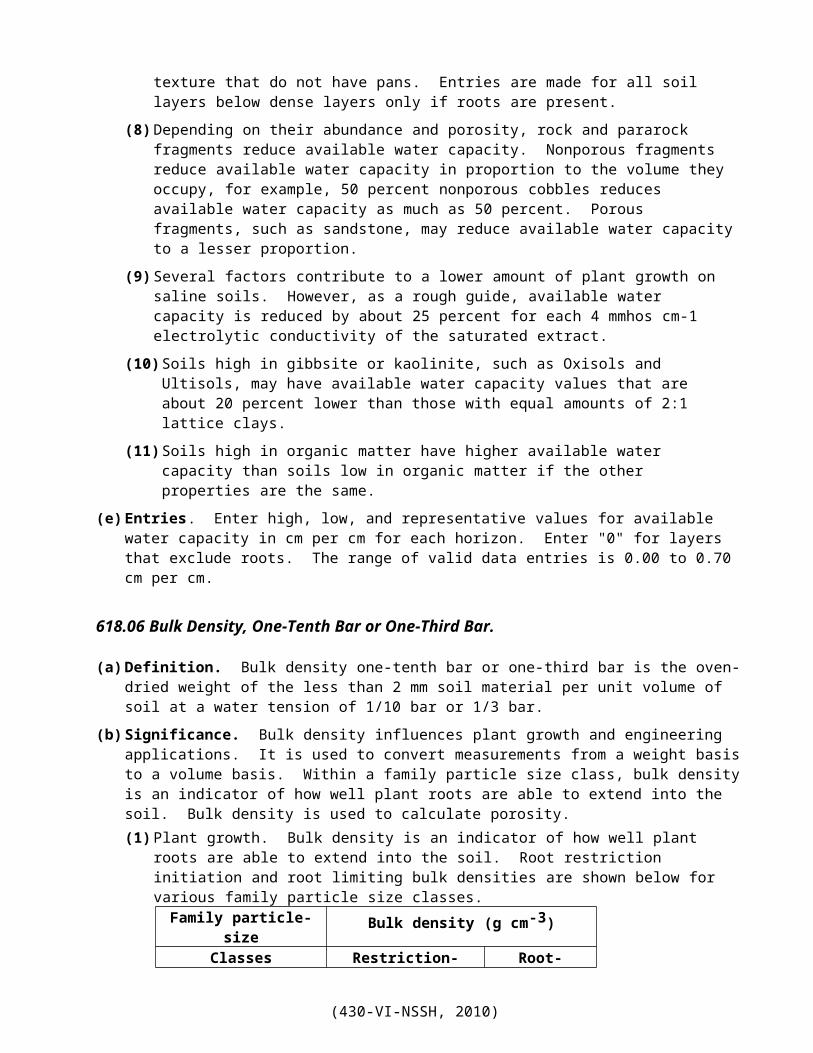
Loamy coarse-loamy 1.63 >1.80 fine-loamy 1.60 >1.78 coarse-silty 1.60 >1.79 fine-silty 1.54 >1.65Clayey* 35-45% clay 1.49 >1.58 >45% clay 1.39 >1.47
* Oxidic and andic materials can initiate restriction at lower bulk densities.
(430-VI-NSSH, 2010)

Part 618 – Soil Properties and Qualities 618-6
(2) Engineering applications. Soil horizons with bulk densities less than those indicated below have low strength and would be subject to collapse if wetted to field capacity or above without loading. They may require special designs for certain foundations.
Family particle-size
Bulk density (g cm-3)
Sandy <1.60Loamy coarse-loamy <1.40 fine-loamy <1.40 coarse-silty <1.30 fine-silty <1.40Clayey <1.10
(c) Estimates. The weight applies to the oven-dry soil, and the volume applies to the soil at or near field capacity. For non-expansive soils, the 1/10-bar and 1/3-bar bulk densities are the same. Bulk density is a use dependent property. The entry should represent the dominant use for the soil.
(d) Entries. Enter bulk density at one tenth bar or one third bar with the low, high, and representative values for each horizon. The range of valid entries is 0.02 to 2.60 g cm-3. Values should be estimated to the nearest 0.05 g cm-3.
618.07 Bulk Density, 15 Bar.
(a) Definition. Bulk density 15 bar (ρb1500) is the oven dry mass per unit volume of the <2 mm soil material at 15 bar water tension.
(b) Significance. Bulk density 15 bar is used in resource assessment models such as water erosion prediction.
(c) Estimation. The value is derived by equation 1.
where:ρb33 (10)...Bulk density at one-third bar (33kPa) or one-tenth bar (10kPa) moisture
content, acquired from lab data, by direct field measurement (e.g., core samples, compliant cavity), or estimated from lab data of similar soils.
ρbod.......Bulk density at oven-dry moisture content, acquired from lab data, by direct field measurement (e.g., core samples, compliant cavity), estimated from lab data of similar soils, or derived by the equation given in NSSH 618.08.
(430-VI-NSSH, 2010)

Part 618 – Soil Properties and Qualities 618-7
Өm33 (10). .Gravimetric water content at one-third bar or one-tenth bar, in weight percent, from lab data, estimated from lab data of similar soils, or derived from equation 2.
where: MRD. .Moisture retention difference, derived from equation 3.
EQUATION 3 MRD = (θm33(10) - θm1500)*100/ρb33(10).
ρb33 (10). Bulk density at one-third bar (33kPa) or one-tenth bar (10kPa) moisture content, acquired from lab data, by direct field measurement (e.g., core samples, compliant cavity), or estimated from lab data of similar soils.
V>2mm. . .fraction greater than 2mm, percent by volume.
Өm1500 Gravimetric water content at 15 bar, in percent by weight. Acquired from lab data, estimated from lab data of similar soils, or derived from equation 4.
where: OM. . .Organic matter, weight percent.
Ө mad......Air dry gravimetric water, in weight percent1 Acquired from lab data, estimated from lab data of similar soils, or derived from equation 5.
where:AD/OD. .Ratio of air-dry mass to oven-dry mass. Acquired from lab data,
estimated from lab data of similar soils, or derived from equation 6.
1 The rationale for using an air-dry moisture value (AD/OD) is that it is a fudge factor. It is based on the assumption of a direct straight line relationship between bulk density and water content, and so the equation given here describes volume change (1/Db) as a function of moisture content. The actual relationship is not a straight line. As moisture content decreases, particularly as it approaches oven dry, the relationship is curved. In the National Soil Survey Laboratory, the air-dry moisture is a point on the moisture line. Using air-dry moisture instead of oven-dry (0%) in the equation adjusts upward the 15 bar bulk density. The fudge factor changes the value in the proper direction, but is likely not the correct magnitude.
(430-VI-NSSH, 2010)

Part 618 – Soil Properties and Qualities 618-8
(d) Entries. Enter the high, low, and representative value for each horizon. Valid entries range from 0.02 to 2.60 and 2 decimal places are allowed.
618.08 Bulk Density, oven dry.
(a) Definition. Bulk density oven dry (Pbod) is the oven dry weight of the less than 2 mm soil material per unit volume of oven-dry soil.
(b) Estimation. The value Pbod is derived by the following formula:
Pbod = [(linear extensibility percent/100) + 1]3
where linear extensibility percent is adjusted to a <2 mm basis.
(c) Entries. Enter the high, low, and representative value for each horizon. Valid entries range from 0.02 to 2.60 and 2 decimal places are allowed.
618.09 Calcium Carbonate Equivalent.
(a) Definition. Calcium carbonate equivalent is the quantity of carbonate (CO3) in the soil expressed as CaCO3 and as a weight percentage of the less than 2 mm size fraction.
(b) Significance. The availability of plant nutrients is influenced by the amount of carbonates in the soil. This is a result of the effect that carbonates have on soil pH and of the direct effect that carbonates have on nutrient availability. Nitrogen fertilizers should be incorporated into calcareous soils to prevent nitrite accumulation or ammonium-N volatilization. The availability of phosphorus and molybdenum is reduced by the high levels of calcium and magnesium which are associated with carbonates. In addition, iron, boron, zinc, and manganese deficiencies are common in soils that have a high calcium carbonate equivalent. In some climates, soils that have a high calcium carbonate equivalent in the surface layer are subject to wind erosion. This effect may occur in soils that have a calcium carbonate equivalent of more than 5 percent. Strongly or violently effervescent reaction to cold dilute HCL defines calcareous in the wind erodibility groups because of the significance of finely divided carbonates.
(c) Measurement. Calcium carbonate equivalent is measured by method 6E1 as outlined in Soil Survey Investigations Report No. 42, Soil Survey Laboratory Methods Manual, Version 4.0, November 2004, USDA, NRCS. It also may be measured in the field using calcimeters.
(430-VI-NSSH, 2010)

Part 618 – Soil Properties and Qualities 618-9
(d) Entries. Enter the high, low, and representative values for each horizon listed. Round values to the nearest 5 percent for horizons that have more than 5 percent CaCO3 and to the nearest 1 percent for those with less than 5 percent. Enter 0 if the horizon does not have free carbonates. The allowable range for entries is 0 to 110.
618.10 Cation Exchange Capacity NH4OAc pH7.
(a) Definition. Cation-exchange capacity is the amount of exchangeable cations that a soil can adsorb at pH 7.0.
(b) Significance. Cation-exchange capacity is a measure of the ability of a soil to retain cations, some of which are plant nutrients. Soils that have a low cation-exchange capacity hold fewer cations and may require more frequent applications of fertilizer than soils that have a high cation-exchange capacity. Soils that have high cation-exchange capacity have the potential to retain cations, which reduces the risk of the pollution of ground water.
(c) Measurement. Cation-exchange capacity is measured by the methods outlined in Soil Survey Investigations Report No. 42, Soil Survey Laboratory Methods Manual, Version 4.0, November 2004. The ammonium acetate method 5A8 gives the cation-exchange capacity value for soils that have pH >5.5 or contain soluble salts. Cation-exchange capacity is reported in centimoles per kilogram (cmol(+) kg-1), which is equivalent to milliequivalents per 100 grams (meq 100g-1), of soil. If the pH is less than 5.5, use effective cation-exchange capacity (refer to part 618.18).
(d) Entries. Enter the high, low, and representative values of the estimated range in cation exchange capacity, in meq 100g-1, for each horizon with pH >5.5. Values in tenths are allowed. Valid entries range from 0.0 to 400.0. A NASIS calculation is available and can be viewed in Appendix 618-2.
618.11 Climatic Setting.
Climatic setting includes frost free period, precipitation, temperature, and evaporation. These elements are useful in determining the types of natural vegetation or crops that grow or can grow in an area and in planning management systems for vegetation. Climatic data are observed nationally by the National Weather Service Cooperative Network, which consists of approximately 10,000 climate stations. The records are available from the Climatic Data Access Facility (CDAF) at Portland, Oregon. Climatic data are delivered to the field through a Climatic Data Access Network. The Climatic Data Access Network consists of climatic data liaisons established in each state and at National Headquarters. Climatic data that are input into NASIS are obtained from the respective climatic data liaison. Climatic data may also be obtained from project weather stations or from the state climatologist. NRCS has selected the standard "normal" period of 1971 to 2000 for climate database entries. Always check with your state's climatic data liaison before using a climate station that has less than 30 years of records or that is located outside a county. Footnote the source of the data, the station, and the starting and ending year of record. Means are given as a range to represent the change of the climate over the geographic extent of the assigned soil.(a) Frost-Free Period.
(430-VI-NSSH, 2010)

Part 618 – Soil Properties and Qualities 618-10
(1) Definition. Frost-free period is the expected number of days between the last freezing temperature (0° C) in spring (January-July) and the first freezing temperature (0° C) in fall (August-December). The number of days is based on the probability that the values for the standard "normal" period of 1971 to 2000 will be exceeded in 5 years out of 10.
(2) Entries. Enter the high, low, and representative values for the map unit component. Enter 365 for each value for taxa that are frost-free all year and 0 for those that have no frost-free period. Entries are rounded to the nearest 5 days.
(b) Precipitation, Mean Annual.(1) Definition. Mean annual precipitation is the arithmetic average of the total
annual precipitation taken over the standard "normal" period, 1971-2000. Precipitation refers to all forms of water, liquid or solid, that fall from the atmosphere and reach the ground.
(2) Entries. Enter the high, low, and representative values in millimeters of water, as integers to represent the spatial range for the map unit component.
(c) Air Temperature, Mean Annual.(1) Definition. Mean annual air temperature is the arithmetic average of the daily
maximum and minimum temperatures for a calendar year taken over the standard "normal" period, 1971-2000.
(2) Entries. Enter the high, low, and representative values as integers for the map unit component to represent the spatial range in degrees centigrade. Use a minus sign to indicate below zero temperatures.
(d) Daily Average Precipitation.(1) Definition. Daily average precipitation is the total precipitation for the month
divided by the number of days in the month for the standard “normal” period, 1971-2000.
(2) Entries. Enter the high, low, and representative value in mm. The range of allowed entries is 0 to 750 mm.
(e) Daily Average Potential Evapotranspiration(1) Definition. Daily average potential evapotranspiration is the total monthly
potential evapotranspiration divided by the number of days in the month for the standard “normal” period, 1971-2000.
(2) Entries. Enter the high, low, and representative value in mm. The range of allowed entries is 0 to 300 mm.
618.12 Corrosion.
Various metals and other materials corrode when they are on or in the soil, and some metals and materials corrode more rapidly when in contact with specific soils than when in contact with others. Corrosivity ratings are given for two of the common structural materials, uncoated steel and concrete.(a) Uncoated steel.
(430-VI-NSSH, 2010)
Part 618 – Soil Properties and Qualities 618-11
(1) Definition. Risk of corrosion for uncoated steel is the susceptibility of uncoated steel to corrosion when in contact with the soil.
(2) Classes. The risk of corrosion classes are low, moderate, and high.(3) Significance. Risk of corrosion on uncoated steel pertains to the potential
soil-induced electrochemical or chemical action that converts iron into its ions, thereby dissolving or weakening uncoated steel.
(4) Guides. Exhibit 618-1 gives the relationship of soil moisture, soil texture, acidity, and content of soluble salts (as indicated by either electrical resistivity at field capacity or electrolytic conductivity of the saturated extract of the soil) to corrosion classes.(i) Soil reaction (pH) correlates poorly with corrosion potential; however, a
pH of 4.0 or less almost always indicates a high corrosion potential.(ii) Ratings, which are based on a single soil property or quality, that place
soils in relative classes for corrosion potential must be tempered by knowledge of other properties and qualities that affect corrosion. A study of soil properties in relation to local experiences with corrosion helps soil scientists and engineers to make soil interpretations. Special attention should be given to those soil properties that affect the access of oxygen and moisture to the metal, the electrolyte, the chemical reaction in the electrolyte, and the flow of current through the electrolyte. A constant watch should be maintained for the presence of sulfides or of minerals, such as pyrite, that can be weathered readily and thus cause a high degree of corrosion in metals.
(iii) The possibility of corrosion is greater for extensive installations that intersect soil boundaries or soil horizons than for installations that are in one kind of soil or in one soil horizon.
(iv) Using interpretations for corrosion without considering the size of the metallic structure or the differential effects of using different metals may lead to wrong conclusions. Activities, such as construction, paving, fill and compaction, and surface additions, that alter the soil can increase possibility of corrosion by creating an oxidation cell that accelerates corrosion. Mechanical agitation or excavation that results in aeration and in a discontinuous mixing of soil horizons may also increase the possibility of corrosion.
(5) Entries. Enter the appropriate class of risk of corrosion for uncoated steel for the whole soil. The classes are LOW, MODERATE, or HIGH.
(b) Concrete.(1) Definition. Risk of corrosion for concrete is the susceptibility of concrete to
corrosion when in contact with the soil.(2) Classes. The risk of corrosion classes are low, moderate, and high.(3) Significance. Risk of corrosion on concrete pertains to the potential soil-
induced chemical reaction between a base (the concrete) and a weak acid (the soil solution). Special cements and methods of manufacturing may be used to reduce the rate of deterioration in soils that have a high risk of corrosion. The rate of deterioration depends on (i) soil texture and acidity, (ii) the amount of
(430-VI-NSSH, 2010)

Part 618 – Soil Properties and Qualities 618-12
sodium or magnesium sulfate present in the soil, singly or in combination, and (iii) the amount of sodium chloride (NaCl) in the soil. The presence of NaCl is one of the factors evaluated not because of its corrosivity of cement but because it is used to identify the presence of seawater. Seawater contains sulfates, which are one of the principal corrosive agents. A soil that has gypsum requires special cement. The calcium ions in gypsum react with the cement and weaken the concrete.
(4) Guides. Exhibit 618-2 gives the relationship of soil texture, soil acidity, sulfates, and NaCl to corrosion classes.
(5) Entries. Enter the appropriate class of risk of corrosion for concrete for the whole soil. The classes are LOW, MODERATE, or HIGH.
618.13 Crop Name and Yield.
(a) Definition. Crop name is the common name for the crop. Crop yield units is crop yield units per unit area for the specified crop.
(b) Classes. The crop names and the units of measure for yields that are allowable as data entries are listed in the data dictionary of the National Soil Information System. (http://nasis.nrcs.usda.gov/documents/metadata/4_1/home.shtml).
(c) Significance. Crop names and units of measure are important as records of crop yield. The crops and yield often are specific to the time when the soil survey was completed, but the ranking and comparison between soils within a soil survey is helpful. These crops and yield data are used to evaluate the soil productive capabilities, cash rent, and land values. Generally, only the most important crops are listed and only the best management is reflected.
(d) Estimates. Crop names and yields are specific to the soil survey area. The listing of crop names is not limited to any number but only the most important crops in the survey area should be used. The yields are derived in a number of ways but should represent a high level of management by leading commercial farmers, which tends to produce the highest economic return per acre. This level of management includes using the best varieties; balancing plant populations and added plant nutrients to the potential of the soil; controlling erosion, weeds, insects, and diseases; maintaining optimum soil tilth; providing adequate soil drainage; and ensuring timely operations.Generally only a representative value is used for each map unit component for non MLRA soil survey areas. MLRA soil survey areas use the high and low representative value from map unit components of non MLRA soil survey areas. High and low values represent the range of representative values for a high level of management across the survey area or across several surveys.
(e) Entries. Enter the common crop name and units of measure. Enter the corresponding irrigated and/or nonirrigated yields as appropriate for the component. Yields can be posted as high, low, and representative values for the map unit component.
(430-VI-NSSH, 2010)

Part 618 – Soil Properties and Qualities 618-13
618.14 Diagnostic Horizon Feature Depth to Bottom.
(a) Definition. Diagnostic horizon feature depth to bottom is the distance from the top of the soil to the base of the identified diagnostic horizon or to the lower limit of the occurrence of the diagnostic feature.
(b) Measurement. Distance is measured from the top of the soil which is defined as the top of the mineral soil, or, for soils with "O" horizons, the top of any "O" layer that is at least partially decomposed. For soils that are covered by 80 percent or more rock or pararock fragments, the top of the soil is the surface of the fragments. See pages 63-64 in the Soil Survey Manual for a complete discussion.
(c) Entries. Diagnostic Horizon Feature Depth to Bottom values used to populate component data in NASIS are not specific to any one point, but rather are a reflection of commonly observed values based on field observations and are intended to model the component as it occurs throughout the map unit. Enter the high, low, and representative values in whole centimeters. The high value represents either the greatest depth to which the base of the diagnostic horizon or feature extends or, for horizons for features extending beyond the limit of field observation, it is the depth to which observation was made (usually no more than 200 cm). In the case of the lithic contact, paralithic contact, and petroferric contact, the entries for depth to the bottom of the diagnostic feature will be the same as the entries for depth to the top of the feature, since the contact has no thickness.
618.15 Diagnostic Horizon Feature Depth to Top.
(a) Definition. Diagnostic horizon feature depth to top is the distance from the top of the soil to the upper boundary of the identified diagnostic horizon or to the upper limit of the occurrence of the diagnostic feature.
(b) Measurement. Distance is measured from the top of the soil, which is defined as the top of the mineral soil, or, for soils with "O" horizons, the top of any "O" layer that is at least partially decomposed. For soils that are covered by 80 percent or more rock or pararock fragments, the top of the soil is the surface of the fragments. See pages 63-64 in the Soil Survey Manual for a complete discussion.
(c) Entries. Diagnostic Horizon Feature Depth to Top values used to populate component data in NASIS are not specific to any one point, but rather are a reflection of commonly observed values based on field observations and are intended to model the component as it occurs throughout the map unit. Enter the high, low, and representative values in whole centimeters.
618.16 Diagnostic Horizon Feature Kind.
(a) Definition. Diagnostic horizon feature kind is the kind of diagnostic horizon or diagnostic feature present in the soil.
(b) Significance. Diagnostic horizons and features are a particular set of observable or measurable soil properties that are used in Soil Taxonomy to classify a soil. They have been chosen because they are thought to be the marks left on the soil
(430-VI-NSSH, 2010)

Part 618 – Soil Properties and Qualities 618-14
as a result of the dominant soil forming processes. In many cases they are thought to occur in conjunction with other important accessory properties. The utilization of diagnostic horizons and features in the classification process allows the grouping of soils that have formed as a result of similar genetic processes. The grouping, however, is done on the basis of observable or measurable properties, rather than speculation about the genetic history of a particular soil.
(c) Entries. The diagnostic horizons and features are listed in the latest Keys to Soil Taxonomy. Allowable codes are given in the NASIS data dictionary.
618.17 Drainage Class.
(a) Definition. Drainage class identifies the natural drainage condition of the soil. It refers to the frequency and duration of wet periods.
(b) Classes. The seven natural drainage classes are: (1) excessively drained, (2) somewhat excessively drained, (3) well drained, (4) moderately well drained, (5) somewhat poorly drained, (6) poorly drained, and (7) very poorly drained. Chapter 3 of the Soil Survey Manual provides a description of each natural drainage class.
(c) Significance. Drainage classes provide a guide to the limitations and potentials of the soil for field crops, forestry, range, wildlife, and recreational uses. The class roughly indicates the degree, frequency, and duration of wetness, which are factors in rating soils for various uses.
(d) Estimates. Infer drainage classes from observations of landscape position and soil morphology. In many soils the depth and duration of wetness relate to the quantity, nature, and pattern of redoximorphic features. Correlate drainage classes and redoximorphic features through field observations of water tables, soil wetness, and landscape position. Record the drainage classes assigned to the series.
(e) Entries. Enter the drainage class name for each map unit component. Utilize separate map unit components for different drainage class phases or for drained versus undrained phases where needed.
Drainage ClassExcessively Somewhat excessively Well Moderately well Somewhat poorly Poorly Very poorly
618.18 Effective Cation-Exchange Capacity
(a) Definition. Effective cation-exchange capacity is the sum of NH4OAc extractable bases plus KCl extractable aluminum (method 5A3b, SSIR #42).
(b) Significance. Cation exchange capacity is a measure of the ability of a soil to retain cations, some of which are plant nutrients. Soils that have a low cation
(430-VI-NSSH, 2010)
Part 618 – Soil Properties and Qualities 618-15
exchange capacity hold fewer cations and may require more frequent applications of fertilizer and amendments than soils that have a high cation exchange capacity. Soils that have high cation exchange capacity have the potential to retain cations. Effective CEC is a measure of CEC that is particularly useful in soils whose ion exchange capacity is largely a result of variable charge components such as allophane, kaolinite, hydrous iron and aluminum oxides, and organic matter, which results in the soil’s CEC being not a fixed number but a function of pH. Examples of such soils might include some andic soils, Oxisols, and more weathered Ultisols with kaolinitic mineralogy.
(c) Measurement. Effective cation exchange capacity is measured by the methods outlined in Soil Survey Investigations Report No. 42, Soil Survey Laboratory Methods Manual, Version 4.0, November, 2004. Method 5A3b gives the effective cation exchange capacity value for soils that have pH <5.5 and that are low in soluble salts. For soils that have a pH of 5.5 or greater, the ECEC equals the sum of NH4OAc extractable bases. Effective cation-exchange capacity is reported in centimoles per kilogram (cmol(+) kg-1), which is equivalent to milliequivalents per 100 grams (meq 100g-1), of soil.
(d) Entries. Enter the high, low, and representative values of the estimated range in effective cation exchange capacity at the field pH of the soil, in meq 100g-1, for the horizon. Values in tenths are allowed. Valid entries range from 0.0 to 400.0. A NASIS calculation is available and can be viewed in Appendix 618-2.
618.19 Electrical Conductivity.
(a) Definition. Electrical conductivity is the electrolytic conductivity of an extract from saturated soil paste.
(b) Classes. The classes of salinity are:
ClassesElectrical Conductivity
(mmhos cm -1)Nonsaline 0-2Very slightly saline 2-4Slightly saline 4-8Moderately saline 8-16Strongly saline 16
(c) Significance. Electrical conductivity is a measure of the concentration of water-soluble salts in soils. It is used to indicate saline soils. High concentrations of neutral salts, such as sodium chloride and sodium sulfate, may interfere with the absorption of water by plants because the osmotic pressure in the soil solution is nearly as high or higher than that in the plant cells. Salts may also interfere with the exchange capacity of nutrient ions, thereby resulting in nutritional deficiencies in plants.
(d) Measurement. The electrolytic conductivity of a saturated extract is the standard measure used to express salinity. Units of measure are decisiemens per meter (dS m-1) which is equivalent to millimhos per centimeter (mmhos cm-1) at 25 degrees C. The laboratory procedure used to measure electrical conductivity is described in
(430-VI-NSSH, 2010)

Part 618 – Soil Properties and Qualities 618-16
Soil Survey Investigations Report No. 42, Soil Survey Laboratory Methods Manual, Version 4.0, November 2004, USDA, NRCS.
(e) Estimates. Field estimates of salts are made from observations of free salt on structural faces or on the soil surface, from plant growth indicators, or from field salinity meters. The occurrences of bare spots, salt-tolerant plants, and uneven crop growth are used as indicators of salinity and high electrical conductivity. When keyed to measurements, these observations help to estimate the amount of salts.
(f) Entries. Enter the high, low, and representative values for the range of electrolytic conductivity of the saturation extract during the growing season for each horizon. Use the following classes: 0-2, 2-4, 4-8, 8-16, and 16-32; or use a combination of classes, for example, 2-8 for the high and low values. The allowable range for entries is 0 to 15000.
618.20 Elevation.
(a) Definition. Elevation is the vertical distance from mean sea level to a point on the earth's surface.
(b) Significance. Elevation, or local relief, exerts a modifying influence of the genesis of natural soil bodies. Elevation also may affect soil drainage within a landscape, salinity or sodicity within a climatic area, or soil temperature.
(c) Estimates. Elevation is normally obtained from U.S. Geological Survey topographic maps or measured using altimeters or global positioning systems.
(d) Entries. Enter the high, low, and representative values for each map unit component. The minimum entry is -300 meters and the maximum entry is 8550 meters. Record elevation to the nearest integer.
618.21 Engineering Classification.
(a) AASHTO group classification.(1) Definition. AASHTO group classification is a system that classifies soils
specifically for geotechnical engineering purposes that are related to highway and airfield construction. It is based on particle-size distribution and Atterberg limits, such as liquid limit and plasticity index. This classification system is covered in AASHTO Standard No. M 145-82 and consists of a symbol and a group index. The classification is based on that portion of the soil that is smaller than 3 inches in diameter.
(2) Classes. The AASHTO classification system identifies two general classifications: (i) granular materials having 35 percent or less, by weight, particles smaller than 0.074 mm in diameter and (ii) silt-clay materials having more than 35 percent, by weight, particles smaller than 0.074 mm in diameter. These two divisions are further subdivided into seven main group classifications. Exhibit 618-4 shows the criteria for classifying soil in the AASHTO classification system.The group and subgroup classifications are based on estimated or measured grain-size distribution and on liquid limit and plasticity index values.
(430-VI-NSSH, 2010)

Part 618 – Soil Properties and Qualities 618-17
(3) Significance. The group and subgroup classifications of this system are aids in the evaluation of soils for highway and airfield construction. The classifications can help to make general interpretations relating to performance of the soil for engineering uses, such as highways and local roads and streets.
(4) Measurements. Measurements involve sieve analyses for the determination of grain-size distribution of that portion of the soil between a 3 inch and 0.074 mm particle size. ASTM methods D 422, C 136, and C 117 have applicable procedures for the determination of grain-size distribution. The liquid limit and plasticity index values (ASTM method D 4318) are determined for that portion of the soil having particles smaller than 0.425 mm in diameter (No. 40 sieve). Measurements, such as laboratory tests, are made on most benchmark soils and on other representative soils in survey areas.
(5) Estimates. During soil survey investigations and field mapping activities, the soil is classified by field methods. This classification involves making estimates of particle-size fractions by a percentage of the total soil, minus the greater than 3-inch fraction. Estimates of liquid limit and plasticity index are based on clay content and mineralogy relationships. Estimates are expressed in ranges that include the estimating accuracy as well as the range of values for the taxon.
(6) Entries. Enter classes and separate them by commas for each horizon, for example, A-7, A-6. Acceptable entries are A-1, A-l-A, A-l-B, A-2, A-2-4, A-2-5, A-2-6, A-2-7, A-3, A-4, A-5, A-6, A-7, A-7-5, A-7-6, and A-8.
(b) AASHTO group index. (1) Definition. The AASHTO group and subgroup classifications may be further
modified by the addition of a group index value. The empirical group index formula was devised for approximate within-group evaluation of the "clayey granular materials" and the "silty-clay" materials.
(2) Significance. The group index is an aid in the evaluation of the soils for highway and airfield construction. The index can help to make general interpretations relating to performance of the soil for engineering uses, such as highways and local roads and streets.
(3) Measurement. The group index is calculated from an empirical formula:GI = (F-35) [0.2 + 0.005 (LL-40)] + 0.01 (F-15) (PI-10)
where: F = Percentage passing sieve No. 200 (75 micrometer), expressed as a whole numberLL = Liquid limitPI = Plasticity index
In calculating the group index of A-2-6 and A-2-7 subgroups, only the PI portion of the formula is used.
(4) Entries. The group index is reported to the nearest integer. If the calculated group index is negative, the group index is zero (0). The minimum index value
(430-VI-NSSH, 2010)

Part 618 – Soil Properties and Qualities 618-18
is 0 and the maximum is 120. A NASIS calculation is available and can be viewed in Appendix 618-5.
(c) Unified soil classification.(1) Definition. The unified soil classification system is a system for classifying
mineral and organic mineral soils for engineering purposes based on particle-size characteristics, liquid limit, and plasticity index.
(2) Classes. The Unified Soil Classification System identifies three major soil divisions: (i) coarse-grained soils having less than 50 percent, by weight, particles smaller than 0.074 mm in diameter; (ii) fine-grained soils having 50 percent or more, by weight, particles smaller than 0.074 mm in diameter, and (iii) highly organic soils that demonstrate certain organic characteristics. These divisions are further subdivided into a total of 15 basic soil groups. The major soil divisions and basic soil groups are determined on the basis of estimated or measured values for grain-size distribution and Atterberg limits. ASTM D 2487 shows the criteria chart used for classifying soil in the Unified system and the 15 basic soil groups of the system and the plasticity chart for the Unified Soil Classification System.
(3) Significance. The various groupings of this classification have been devised to correlate in a general way with the engineering behavior of soils. This correlation provides a useful first step in any field or laboratory investigation for engineering purposes. It can serve to make some general interpretations relating to probable performance of the soil for engineering uses.
(4) Measurement. The methods for measurement are provided in ASTM Designation D 2487. Measurements involve sieve analysis for the determination of grain-size distribution of that portion of the soil between 3 inches and 0.074 mm in diameter (No. 200 sieve). ASTM methods D 422, C 136, and C 117 have applicable procedures that are used where appropriate for the determination of grain-size distribution. Values for the Atterberg limits (liquid limit and plasticity index) are also used. Specific tests are made for that portion of the soil having particles smaller than 0.425 mm in diameter (No. 40 sieve) according to ASTM methods D 423 and D 424. Measurements, such as laboratory tests, are made on most benchmark soils and on other representative soils in survey areas.
(5) Entries for measured data. For measured Unified data, enter up to four classes for each horizon. ASTM D 2487 provides flow charts for classifying the soils. Separate the classes by commas, for example, CL-ML, ML. Acceptable entries are GW, GP, GM, GC, SW, SP, SM, SC, CL, ML, OL, CH, MH, OH, PT, CL-ML, GW-GM, GW-GC, GP-GM, GP-GC, GC-GM, SW-SM, SW-SC, SP-SM, SP-SC, and SC-SM.
(6) Estimates. The methods for estimating are provided in ASTM Designation D 2488. During all soil survey investigations and field mapping activities, the soil is classified by field methods. The methods include making estimates of particle-size fractions by a percentage of the total soil. The Atterberg limits are also estimated based on the wet consistency, ribbon or thread toughness, and other simple field tests. These tests and procedures are explained in ASTM D 2488. If samples are later tested in the laboratory, adjustments are made to field procedures as needed. Estimates are expressed in ranges that include the estimating accuracy as well as the range of values from one location to another within the map unit. If an identification is based on visual-manual procedures it must be clearly stated so in reporting.
(430-VI-NSSH, 2010)

Part 618 – Soil Properties and Qualities 618-19
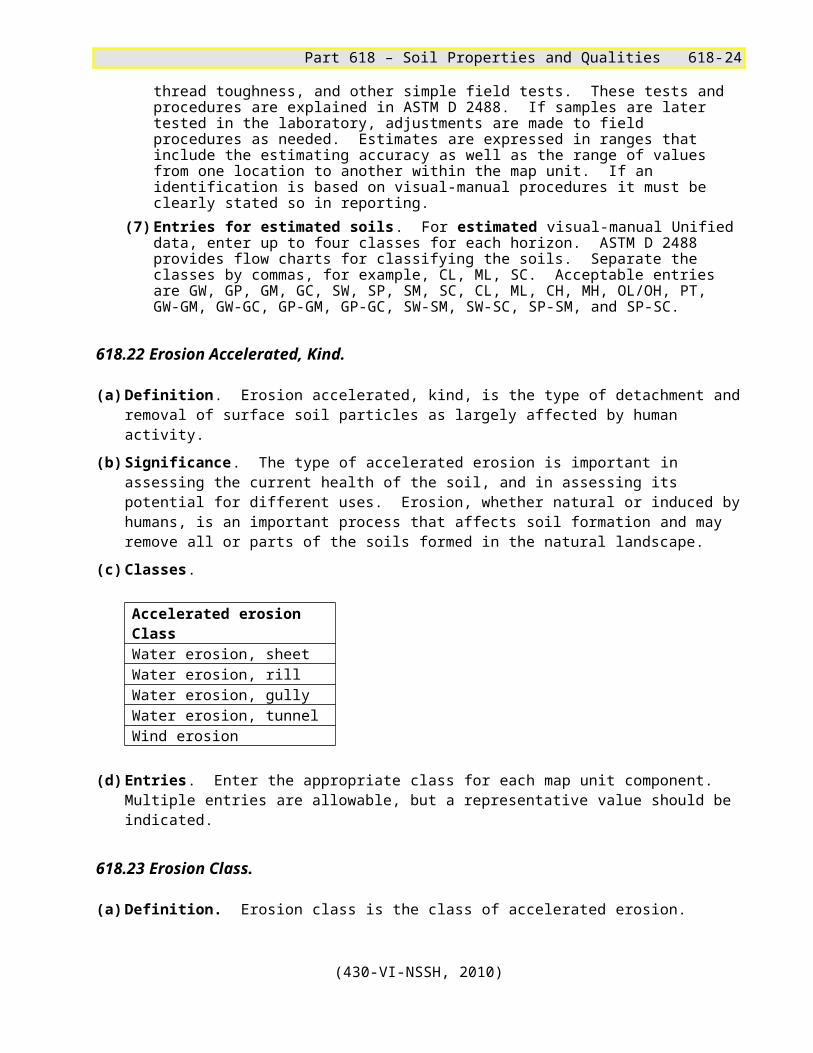
(7) Entries for estimated soils. For estimated visual-manual Unified data, enter up to four classes for each horizon. ASTM D 2488 provides flow charts for classifying the soils. Separate the classes by commas, for example, CL, ML, SC. Acceptable entries are GW, GP, GM, GC, SW, SP, SM, SC, CL, ML, CH, MH, OL/OH, PT, GW-GM, GW-GC, GP-GM, GP-GC, SW-SM, SW-SC, SP-SM, and SP-SC.
618.22 Erosion Accelerated, Kind.
(a) Definition. Erosion accelerated, kind, is the type of detachment and removal of surface soil particles as largely affected by human activity.
(b) Significance. The type of accelerated erosion is important in assessing the current health of the soil, and in assessing its potential for different uses. Erosion, whether natural or induced by humans, is an important process that affects soil formation and may remove all or parts of the soils formed in the natural landscape.
(c) Classes.
Accelerated erosion ClassWater erosion, sheetWater erosion, rillWater erosion, gullyWater erosion, tunnelWind erosion
(d) Entries. Enter the appropriate class for each map unit component. Multiple entries are allowable, but a representative value should be indicated.
618.23 Erosion Class.
(a) Definition. Erosion class is the class of accelerated erosion. (b) Significance. The degree of erosion that has taken place is important in
assessing the health of the soil and in assessing the soil's potential for different uses. Erosion is an important process that affects soil formation and may remove all or parts of the soils formed in natural landscapes. Removal of increasing amounts of soil increasingly alters various properties and capabilities of the soil. Properties and qualities affected include bulk density, organic matter content, tilth, water infiltration. Altering these properties affects the productivity of the soil.
(c) Estimation. During soil examinations, estimate the degree to which soils have been altered by accelerated erosion. The Soil Survey Manual describes the procedures involved.
(d) Classes.
Erosion Classnone -
(430-VI-NSSH, 2010)

Part 618 – Soil Properties and Qualities 618-20
depositionClass 1Class 2Class 3Class 4
(e) Entries. Enter the appropriate class for each map unit component.
618.24 Excavation Difficulty Classes.
(a) Definition. Excavation difficulty is an estimation of soil layers, horizons, pedons, or geologic layers according to the difficulty in making an excavation into them. Excavation difficulty, in most instances, is strongly controlled by water state, which should be specified.
(b) Classes. The excavation difficulty classes are:
Classes DefinitionLow Excavations can be made with a spade using arm-applied
pressure only. Neither application of impact energy nor application of pressure with the foot to a spade is necessary
Moderate Arm-applied pressure to a spade is insufficient. Excavation can be accomplished quite easily by application of impact energy with a spade or by foot pressure on a spade.
High Excavation with a spade can be accomplished with difficulty. Excavation is easily possible with a full length pick, using an over-the-head swing.
Very high Excavation with a full length pick, using an over-the-head swing, is moderately to markedly difficult. Excavation is possible in a reasonable period of time with a backhoe mounted on a 40 to 60 kW (50-80 hp) tractor
Extremely high
Excavation is nearly impossible with a full length pick using an over-the-head arm swing. Excavation cannot be accomplished in a reasonable time period with a backhoe mounted on a 40 to 60 kW (50-80 hp) tractor
(c) Significance. Excavation difficulty classes are important for evaluating the cost and time needed to prepare shallow excavations.
(d) Estimates. Estimates of excavation difficulty classes are made from field observations.
(e) Entries. Enter the appropriate class for each horizon. The allowable entries are Low, Moderate, High, Very high, and Extremely high.
618.25 Extractable Acidity.
(a) Definition. Extractable acidity is a measure of soil exchangeable hydrogen ions that may become active by cation exchange.
(430-VI-NSSH, 2010)

Part 618 – Soil Properties and Qualities 618-21
(b) Significance. Extractable acidity is important for soil classification and for certain evaluations of soil nutrient availability or of the effect of waste additions to the soil.
(c) Measurement. Extractable acidity is determined by method 6H5a, as outlined in Soil Survey Investigations Report No. 42, Soil Survey Laboratory Methods Manual, Version 4.0, November 2004, USDA, NRCS. Units of measure are centimoles per kilogram (cmol(+) kg-1), which is equivalent to milliequivalents per 100 grams (meq 100g-1), of soil.
(d) Entries. Enter the range of extractable acidity as milliequivalents per 100 grams (meq 100g-1) of soil for the horizon. Valid entries range from 0.0 to 250.0. Tenths are allowed. A NASIS calculation is available and can be viewed in Appendix 618-4.
618.26 Extractable Aluminum.
(a) Definition. Extractable aluminum is the amount of aluminum extracted in one normal potassium chloride.
(b) Significance. Extractable aluminum is important for soil classification and for certain evaluations of soil nutrient availability and of toxicities. An aluminum saturation of about 60 percent is usually regarded as toxic to most plants. It may be a useful measurement for assessing potential lime needs for acid soils.
(c) Measurement. Extractable aluminum is determined by method 6G9d, as in Soil Survey Investigations Report No. 42, Soil Survey Laboratory Methods Manual, Version 4.0, November 2004, USDA, NRCS. Units of measure are centimoles per kilogram (cmol(+) kg-1), which is equivalent to milliequivalents per 100 grams (meq 100g-1), of soil.
(d) Entries. Enter the range of extractable aluminum as milliequivalents per 100 grams (meq 100g-1) of soil for the horizon. Valid entries range from 0.0 to 150.0. Tenths are allowed.
618.27 Flooding Frequency, Duration, and Month.
(a) Definition. Flooding is the temporary covering of the soil surface by flowing water from any source, such as streams overflowing their banks, runoff from adjacent or surrounding slopes, inflow from high tides, or any combination of sources. Shallow water standing or flowing that is not concentrated as local runoff during or shortly after rain or snow melt is excluded from the definition of flooding. Chapter 3 of the Soil Survey Manual provides additional information. Standing water (ponding) or water that forms a permanent covering is also excluded from the definition.
(b) Classes. Estimates of flooding class are based on the interpretation of soil properties and other evidence gathered during soil survey field work. Flooding hazard is expressed by (1) flooding frequency class, (2) flooding duration class, and (3) time of year that flooding occurs. Not considered here, but nevertheless important, are velocity and depth of floodwater. Frequencies used to define classes are generally estimated from evidence related to the soil and vegetation. They are expressed in wide ranges that do not indicate a high degree of accuracy. Flooding frequencies that are more precise can be calculated by performing
(430-VI-NSSH, 2010)

Part 618 – Soil Properties and Qualities 618-22
complex analyses used by engineers. The class very frequent is intended for use on areas subject to daily and monthly high tides.(1) Flooding frequency class. Flooding frequency class is the number of times
flooding occurs over a period of time and expressed as a class. The classes of flooding are defined as follows:
Class DefinitionNone No reasonable possibility of flooding; near 0 percent
chance of flooding in any year or less than 1 time in 500 years.
Very Rare Flooding is very unlikely but possible under extremely unusual weather conditions; less than 1 percent chance of flooding in any year or less than 1 time in 100 years but more than 1 time in 500 years.
Rare Flooding unlikely but possible under unusual weather conditions; 1 to 5 percent chance of flooding in any year or nearly 1 to 5 times in 100 years
Occasional Flooding is expected infrequently under usual weather conditions; 5 to 50 percent chance of flooding in any year or 5 to 50 times in 100 years
Frequent Flooding is likely to occur often under usual weather conditions; more than a 50 percent chance of flooding in any year or more than 50 times in 100 years, but less than a 50 percent chance of flooding in all months in any year.
Very Frequent
Flooding is likely to occur very often under usual weather conditions; more than a 50 percent chance of flooding in all months of any year.
(2) Flooding duration classes. The average duration of inundation per flood occurrence is given only for occasional, frequent, and very frequent classes.
Class DurationExtremely brief 0.1 to 4.0 hoursVery brief 4 to 48 hoursBrief 2 to 7 daysLong 7 days to 30 daysVery long 30 days
(3) Assignment. Yearly flooding frequency classes are assigned to months to indicate the months of occurrence and not the frequency of the flooding during the month, except for the very frequent class. The time period expressed includes two-thirds to three-fourths of the occurrences. Time period and duration of the flood are the most critical factors that determine the growth and survival of a given plant species. Flooding during the dormant season has few if any harmful effects on plant growth or mortality and may improve the growth of some species. If inundation from flood water occurs for long periods during the growing season, the soil becomes oxygen deficient and plants may be damaged or killed.
(c) Significance. The susceptibility of soils to flooding is an important consideration for building sites, sanitary facilities, and other uses. Floods may be less costly per
(430-VI-NSSH, 2010)

Part 618 – Soil Properties and Qualities 618-23
unit area of farmland as compared to that of urban land, but the loss of crops and livestock can be disastrous.
(d) Estimates. The most precise evaluation of flood-prone areas for stream systems is based on hydrologic studies. The area subject to inundation during a flood of a given frequency, such as one with a 1 percent or 2 percent chance of occurrence, generally is determined by one of two basic methods.(1) The first method is used if stream flow data are available. In this method, the
data are analyzed to determine the magnitude of floods of different frequencies. Engineering studies are made to determine existing channel capacities and flow on the flood plain by the use of valley cross sections and water surface profiles.
(2) The second method is used if stream flow data are not available. In this method, hydrologists make an estimate of flood potential from recorded data on rainfall. They consider such factors as (i) size, slope, and shape of the contributing watershed, (ii) hydrologic characteristics of the soil, (iii) land use and treatment, and (iv) hydraulic characteristics of the valley and channel system.
(3) With the use of either method, soil surveys can aid in the delineation of flood-prone areas. Possible sources of flooding information are (i) NRCS project-type studies, such as PL 556, FP, RB, or RC&D; (ii) flood hazard analyses; (iii) Corps of Engineers flood plain information reports; (iv) special flood reports; (v) local flood protection and flood control project reports; (vi) HUD flood insurance study reports; (vii) maps by USGS, NRCS, TVA, COE, NOAA; (viii) studies by private firms and other units of government; and (ix) USGS quadrangle sheets and hydrologic atlases of flood-prone areas and stream gauge data.
(4) General estimates of flooding frequency and duration are made for each soil. However, in intensively used areas where construction has materially altered the natural water flow, flood studies are needed to adequately reflect present flooding characteristics.
(5) Soil scientists collect and record evidence of flood events during the course of the soil survey. The extent of flooded areas, flood debris in trees, damage to fences and bridges, and other signs of maximum water height are recorded. Information that is helpful in delineating soils that have a flood hazard is also obtained. Hydrologists may have flood stage predictions that can be related to kinds of soil or landscape features. Conservationists and engineers may have recorded elevations of high flood marks. Local residents may have recollections of floods that can help to relate the events to kinds of soil, topography, and geomorphology.
(6) Certain landscape features have developed as the result of past and present flooding and include former river channels, oxbows, point bars, alluvial fans, meander scrolls, sloughs, natural levees, backswamps, sand splays, and terraces. Most of these features are easily recognizable on aerial photographs by comparing the photo image with on-the-ground observations. Different kinds of vegetation and soils are normally associated with these geomorphic features.
(7) The vegetation that grows in flood areas may furnish clues to past flooding. In central and southeastern United States, the survival of trees in flood-prone
(430-VI-NSSH, 2010)
Part 618 – Soil Properties and Qualities 618-24
areas depends on the frequency, duration, depth, and time of flooding and on the age of the tree.
(8) Past flooding may sometimes leave clues in the soil, such as (1) thin strata of material of contrasting color or texture, or both; (2) an irregular decrease in organic matter content, which is an indication of a buried surface horizon; and (3) soil layers that have abrupt boundaries to contrasting kinds of material, which indicate that the materials were laid down suddenly at different times and were from different sources or were deposited from stream flows of different velocities.
(9) Laboratory analyses of properly sampled layers are often helpful in verifying these observations. Organic carbon and particle-size analyses are particularly useful in verifying flood deposits. Microscopic observations may detect preferential horizontal orientation of plate-like particles; micro-layering, which indicates water-laid deposits; or mineralogical differences between layers.
(e) Entries. Flooding and frequency are posted for each month of the year for each map unit component. Flooding entries reflect the current existing and mapped condition with consideration for dams, levees, and other man-induced changes affecting flooding frequency and duration.(1) Enter the flooding frequency class name: none, very rare, rare, occasional,
frequent, or very frequent.(2) Enter the flooding duration class name that most nearly represents the soil:
extremely brief, very brief, brief, long, or very long.
618.28 Fragments in the Soil
(a) Definition. Fragments are unattached cemented pieces of bedrock, bedrock-like material, durinodes, concretions, and nodules 2 mm or larger in diameter; and woody material 20 mm or larger in organic soils. Fragments are separated into three types: rock fragments; pararock fragments, which are separated based on cementation; and wood fragments.(1) Rock fragments are unattached pieces of rock 2 mm in diameter or larger that
are strongly cemented or more resistant to rupture. Rock fragments from 2 mm to 75 mm (3 inches) are considered when estimating the percent passing sieves as discussed in part 618.44.
(2) Pararock fragments are unattached, cemented bodies or pieces of material 2 mm in diameter or larger that are extremely weakly cemented to moderately cemented. These fragments are not retained on sieves because of the sample preparation by grinding.
(3) Wood fragments are woody materials that cannot be crushed between the fingers when moist or wet and are larger than 20 mm in size. Wood fragments are only used in organic soils. They are comparable to rock and pararock fragments in mineral soils.
(b) Significance. The fraction of the soil 2 mm or larger has an impact on the behavior of the whole soil. Soil properties, such as available water capacity, cation exchange capacity, saturated hydraulic conductivity, structure, and porosity, are affected by the volume, composition, and size distribution of fragments in the soil.
(430-VI-NSSH, 2010)

Part 618 – Soil Properties and Qualities 618-25
Fragments also affect the management of the soil and are used as interpretation criteria. Terms related to volume, size, and hardness of fragments are used as texture modifier terms.Generally, the fraction of soil greater than 75 mm (3 inches) in diameter is not included in the engineering classification systems. However, it can be added as a descriptive term to the group name, for example, poorly graded gravel with silt, sand, cobbles, and boulders. Estimates of the percent of cobbles and boulders are presented in the soil descriptions for a group name. A small amount of these larger particles generally has little effect on soil properties. It may, however, have an effect on the use of a soil in certain types of construction. Often, the larger portions of a soil must be removed before the material can be spread in thin layers, graded, or compacted and graded to a smooth surface. As the quantity of this "oversized" fraction increases, the properties of the soil can be affected. If the larger particles are in contact with each other, the strength of the soil is very high and the compressibility very low. If voids exist between the larger particles, the soil will likely have high saturated hydraulic conductivity and may undergo some internal erosion as a result of the movement of water through the voids. Most of the smaller and more rapid construction equipment normally used in excavating and earthmoving cannot be used if the oversize fraction of a soil is significant.
(c) Measurement. The fraction from 2 to 75 mm may be measured in the field. However, 50-60 kg of sample may be necessary if an appreciable amount of fragments near 75 mm are present. An alternative is to visually estimate the volume of the 20-to 75-mm fraction, then sieve and weigh the 2-to 20-mm fraction. The fraction 75 mm (3 inches) or greater is usually not included in soil samples taken in the field for laboratory testing. Measurements can be made in the field by weighing the dry sample and the portion retained on a 3-inch screen. The quantity is expressed as a weight percentage of the total soil. A sample as large as 200 pounds to more than a ton may be needed to assure that the results are representative. Measurements of the fraction from 75 to 250 mm (3 to 10 inches) and the fraction greater than 250 mm (10 inches) are usually obtained from volume estimates.
(d) Estimates. Estimates are usually made by visual means and are on the basis of percent by volume. The percent by volume is converted to percent by weight, as shown in Exhibit 618-11, by using the average bulk unit weights for soil and rock. These estimates are made during investigation and mapping activities in the field. They are expressed as ranges that include the estimating accuracy as well as the range of values for a component.Measurements or estimates of fragments less than strongly cemented are made prior to any rolling or crushing of the sample.
(e) Rock Fragments greater than 10 inches (250 mm).(1) Definition. Rock fragment greater than 10 inches is the percent by weight of
the horizon occupied by rock fragments greater than 10 inches (250 mm) in size. The upper limit is undefined, but for practical purposes it generally is no larger than a pedon, up to 10 meters square. For nonspherical material, the intermediate dimension is used for the 250 mm (10 inch) measurement. For example, a flat-shaped rock fragment that is 100 mm x 250 mm x 380 mm has an intermediate dimension of 250 mm, and is not counted as greater than 250
(430-VI-NSSH, 2010)

Part 618 – Soil Properties and Qualities 618-26
mm. A flat-shaped rock fragment that is 100 mm x 275 mm x 380 mm has an intermediate dimension of 275 mm, and is counted as greater than 250 mm.
(2) Entries. Enter the high, low, and representative values as whole number percentages for each horizon as appropriate.
(f) Rock fragments 3 to 10 inches (75 to 250 mm).(1) Definition. Rock fragments 3 to 10 inches is the percent by weight of the
horizon occupied by rock fragments 3 to 10 inches (75 to 250 mm) in size.(2) Entries. Enter the high, low, and representative values as whole number
percentages for each horizon as appropriate.(g) Fragment kind.
(1) Definition. Fragment kind is the lithology/composition of the 2 mm or larger fraction of the soil.
(2) Entries. Enter the appropriate class name for the kind of fragment present. More than one choice may be entered. The class names can be found in the NASIS data dictionary.
(h) Fragment roundness.(1) Definition. Fragment roundness is an expression of the sharpness of edges
and corners of fragments. (2) Significance. The roundness of fragments impacts water infiltration, root
penetration, and macropore space.(3) Classes. The fragment roundness classes are:
Roundness classAngularSubangularSubroundedRoundedWell-rounded
(4) Entries. Enter the appropriate class name for the roundness class(es) present. A representative value may be designated.
(i) Fragment rupture resistance cemented.(1) Definition. Fragment rupture resistance cemented is the rupture resistance of
a fragment of specified size that has been air dried and then submerged in water.
(2) Measurements. Measurements are made using the procedures and classes of cementation that are listed with the rupture resistance classes in the Soil Survey Manual. Classes are described for block-like specimens about 25-30 mm on edge, which are air-dried and then submerged in water for at least 1 hour. The specimen is compressed between extended thumb and forefinger, between both hands, or between the foot and a nonresilient flat surface. If the specimen resists compression, a weight is dropped onto it from progressively
(430-VI-NSSH, 2010)

Part 618 – Soil Properties and Qualities 618-27
greater heights until it ruptures. Failure is considered at the initial detection of deformation or rupture. Stress applied in the hand should be over a 1-second period. The tactile sense of the class limits may be learned by applying force to top loading scales and sensing the pressure through the tips of the fingers or through the ball of the foot. Postal scales may be used for the resistance range that is testable with the fingers. A bathroom scale may be used for the higher rupture resistance range.
(3) Significance. The rupture resistance of a fragment is significant where the class is strongly cemented or higher. These classes can impede or restrict the movement of soil water vertically through the soil profile and have a direct impact on the quality and quantity of ground water and surface water.
(4) Classes. The classes are:
Rupture resistance classExtremely weakly Very weakly Weakly Moderately Strongly Very strongly Indurated
(5) Entries. Enter the appropriate class name(s) for the fragments present. A representative value may be designated.
(j) Fragment shape.(1) Definition. Fragment shape is a description of the overall shape of the
fragment.(2) Significance. Fragment shape is important for fragments that are too large to
be called channers or flagstones.(3) Classes. The classes are:
FlatNonflat
(4) Entries. Enter the appropriate class name for the class(es) present. Multiple entries may be made. A representative value may be designated.
(k) Fragment size.(1) Definition. Fragment size is the size based on the multiaxial dimensions of
the fragment.(2) Significance. The size of fragments is significant to the use and management
of the soil. Fragment size is used as criteria for naming map units. It affects equipment use, excavation, construction, and recreational uses.
(430-VI-NSSH, 2010)

Part 618 – Soil Properties and Qualities 618-28
(3) Classes. Classes of fragment size are subdivided according to flat and non-flat fragments.
Flat fragment classes Length (mm)Channers 2-150 Flagstones 150-380 Stones 380-600 Boulders 600
Non-flat fragment classes
Diameter (mm)
Gravel 2-75 fine gravel 2-5 medium gravel 5-20 coarse gravel 20-75 Cobbles 75-250 Stones 250-600 Boulders 600
Gravel is a collection of fragments having a diameter ranging from 2 to 75 mm. Individual fragments in this size range are properly referred to as pebbles, not “gravels”. For fragments that are less than strongly cemented, "para" is added as a prefix to the above terms; i.e., paracobbles or fine paragravel.
(4) Entries. Enter the minimum, maximum, and representative values in whole numbers of each size class being described. Entries are in millimeters and range from 2 to 3,000 mm.
(l) Fragment volume.(1) Definition. Fragment volume is the volume percentage of the horizon
occupied by the 2 mm or larger fraction.(2) Significance. The volume occupied by the 2 mm or larger fraction is
important for naming textural modifiers; i.e., gravelly, very gravelly, extremely paragravelly.
(3) Entries. Enter the high, low, and representative values, in whole numbers, for the percent volume present for each class of fragments being described.
618.29 Free Iron Oxides.
(a) Definition. Free iron oxides are secondary iron oxides, such as goethite, hematite, ferrihydrite, lepidocrocite, and maghemite. This form of iron may occur as discrete particles, as coatings on other soil particles, or as cementing agents between soil mineral grains. It is the iron extracted by dithionite-citrate from the fine earth fraction.
(b) Significance. The amount of iron that is extractable by dithionite-citrate is used in Soil Taxonomy in the Ferritic, Ferruginous, Parasesquic, and Sesquic mineralogy classes. The ratio of dithionite-citrate (free) iron to total iron in a soil is a measure of the degree of soil weathering. Free iron oxides are important in the soil
(430-VI-NSSH, 2010)

Part 618 – Soil Properties and Qualities 618-29
processes of podzolization and laterization and play a significant role in the phosphorous fixation ability of soils.
(c) Measurement. Free iron oxides are measured as the amount extracted by dithionite-citrate using method 6C2b as outlined in Soil Survey Investigations Report No. 42, Soil Survey Laboratory Methods Manual, Version 4.0, November 2004, USDA, NRCS.
(d) Entries. Enter high, low and representative values as percentages for each horizon for which data is available. Valid entries range from 0.00 to 99.99, and hundredths are allowed.
618.30 Frost Action, Potential.
(a) Definition. Potential frost action is the rating for the susceptibility of the soil to upward or lateral movement by the formation of segregated ice lenses. It rates the potential for frost heave and the subsequent loss of soil strength when the ground thaws.
(b) Classes. Classes are used in regions where frost action is a potential problem. Exhibit 618-5 provides more information. The classes are low, moderate, and high and are defined as follows:
Potential frost action classes
Definition
Low Soils are rarely susceptible to the formation of ice lenses.
Moderate Soils are susceptible to the formation of ice lenses, which results in frost heave and subsequent loss of soil strength.
High Soils are highly susceptible to the formation of ice lenses, which results in frost heave and subsequent loss of soil strength.
(c) Significance. Damage from frost action results from the formation of segregated ice crystals and ice lenses in the soil and the subsequent loss of soil strength when the ground thaws. Frost heave damages highway and airfield pavements. It is less of a problem for dwellings and buildings that have footings which extend below the depth of frost penetration. In cold climates, unheated structures that have concrete or asphalt floors can be damaged by frost heave. Driveways, patios, and sidewalks can heave and crack. The thawing of the ice causes a collapse of surface elevation and produces free water perches on the still frozen soil below. Soil strength is reduced. Back slopes and side slopes of cuts and fills can slough during thawing. Seedlings and young plants of clover, alfalfa, wheat, and oats can be raised out of the soil or have their root systems damaged by frost heave.
(d) Estimates. Freezing temperatures, soil moisture, and susceptible soils are needed for the formation of segregated ice lenses. Ice crystals begin to form in the large pores first. Water in small pores or water that was adsorbed on soil particles freezes at lower temperatures. This super cooled water is strongly attracted to the ice crystals, moves toward it, and freezes on contact with them. The resulting ice lens continues to grow in width and thickness until all available water that can be
(430-VI-NSSH, 2010)

Part 618 – Soil Properties and Qualities 618-30
transported by capillary has been added to the ice lens and a further supply cannot be made available because of the energy requirements.Soil temperatures must drop below 0° C for frost action to occur. Generally, the more slowly and deeply the frost penetrates, the thicker the ice lenses are and the greater the resulting frost heave is. Exhibit 618-6 provides a map that shows the design freezing index values in the continental United States. The values are the number of degree days below 0° C for the coldest year in a period of 10 years. The values indicate duration and intensity of freezing temperatures. The 250 isoline is the approximate boundary below which frost action ceases to be a problem. Except on the West Coast, the frost action boundary corresponds closely to the mesic-thermic temperature regime boundary used in Soil Taxonomy. More information is provided in the U.S. Army Engineer School, Student Reference, 1967, Soil Engineering, Section I, Volume II, Chapters VI-IX, Fort Belvoir, Virginia.Water necessary for the formation of ice lenses may come from a high water table or from infiltration at the surface. Capillary water in voids and adsorbed water on particles also contribute to ice lens formation; but unless this water is connected to a source of free water, the amount generally is insufficient to produce significant ice segregation and frost heave.The potential intensity of ice segregation is dependent to a large degree on the effective soil pore size and soil saturated hydraulic conductivity, which are related to soil texture. Ice lenses form in soils in which the pores are fine enough to hold quantities of water under tension but coarse enough to transmit water to the freezing front. Soils that have a high content of silt and very fine sand have this capacity to the greatest degree and hence have the highest potential for ice segregation. Clayey soils hold large quantities of water but have such slow saturated hydraulic conductivity that segregated ice lenses are not formed unless the freezing front is slow moving. Sandy soils, however, have large pores and hold less water under lower tension. As a result, freezing is more rapid and the large pores permit ice masses to grow from pore to pore, entombing the soil particles. Thus, in coarse-grained soils, segregated ice lenses are not formed and less displacement can be expected.Estimates of potential frost action generally are made for soils in mesic or colder temperature regimes. Exceptions are on the West Coast, where the mesic-thermic temperature line crosses below the 250 isoline, as displayed in Exhibit 618-6, and along the East Coast, where the soil climate is moderated by the ocean. Mesic soils that have a design freezing index of less that 250 degree days should not be rated because frost action is not likely to occur. The estimates are based on bare soil that is not covered by insulating vegetation or snow. They are also based on the moisture regime of the natural soil. The ratings can be related to manmade modifications of drainage or to irrigation systems on an on site basis. Frost action estimates are made for the whole soil to the depth of frost penetration, to bedrock, or to a depth of 2 meters (6.6 feet), whichever is shallowest. Exhibit 618-5 is a guide for making potential frost action estimates. It uses the moisture regimes and family textures as defined in Soil Taxonomy.
(e) Entries. Enter one of the following: LOW, MOD, or HIGH for the whole soil. If frost action is not a problem, enter NONE.
(430-VI-NSSH, 2010)

Part 618 – Soil Properties and Qualities 618-31
618.31 Gypsum.
(a) Definition. Gypsum is the percent, by weight, of hydrated calcium sulfates in the <20 mm fraction of soil.
(b) Significance. Gypsum is partially soluble in water and can be dissolved and removed by water. Soils with more than 10 percent gypsum, may collapse if the gypsum is removed by percolating water. Gypsum is corrosive to concrete. Corrosion of concrete is most likely to occur in soils that are more than about 1 percent gypsum when wetting and drying occurs.
(c) Measurement. Gypsum is measured by method 6F4, as outlined in Soil Survey Investigations Report No. 42, Soil Survey Laboratory Methods Manual, Version 4.0, November 2004, USDA, NRCS.
(d) Entries. Enter the high, low, and representative values to represent the range in gypsum content as a weight percent of the soil fraction less than 20 mm in size. Round values to the nearest 5 percent for layers that are more than 5 percent gypsum and to the nearest 1 percent for layers that are less than 5 percent gypsum, for example, 0-1, 1-5, 5-10. If the horizon does not have gypsum, enter "0". The allowable range for entries is 0 to 120.
618.32 Horizon Depth to Bottom.
(a) Definition. Horizon depth to bottom is the distance from the top of the soil to the base of the soil horizon.
(b) Measurement. Distance is measured from the top of the soil, which is defined as the top of the mineral soil, or, for soil with "O" horizons, the top of any "O" layer that is at least partially decomposed. For soils that are covered by 80 percent or more rock or pararock fragments, the top of the soil is the surface of the fragments. See pages 63-64 in the Soil Survey Manual for a complete discussion. Measurement should be estimated to a depth of 200 cm for most soils and to a depth at least 25 cm below a lithic contact if the contact is above 175 cm. For soils, including those that have a root restricting contact such as a paralithic contact, the lowest horizon bottom should extend to a depth of at least 25 cm below the contact or to a depth of 200 cm, whichever is shallower.
(c) Entries. Horizon Depth to Bottom values used to populate component data in NASIS are not specific to any one point, but rather are a reflection of commonly observed values based on field observations and are intended to model the component as it occurs throughout the map unit. Enter the high, low, and representative values in whole centimeters. The high value represents either the greatest depth to which the base of the horizon extends or, for horizons extending beyond the limit of field observation, it is the depth to which observation was made (usually no more than 200 cm but at least 150 cm).
618.33 Horizon Depth to Top.
(a) Definition. Horizon depth to top is the distance from the top of the soil to the upper boundary of the soil horizon.
(430-VI-NSSH, 2010)

Part 618 – Soil Properties and Qualities 618-32
(b) Measurement. Distance is measured from the top of the soil, which is defined as the top of the mineral soil, or, for soils with "O" horizons, the top of any "O" layer that is at least partially decomposed. For soils that are covered by 80 percent or more rock or pararock fragments, the top of the soil is the surface of the fragments. See pages 63-64 in the Soil Survey Manual for a complete discussion.
(c) Entries. Horizon Depth to Top values used to populate component data in NASIS are not specific to any one point, but rather are a reflection of commonly observed values based on field observations and are intended to model the component as it occurs throughout the map unit. Enter the high, low, and representative values in whole centimeters. Refer to the discussion under "horizon designations" as to how to list E/B and E and Bt type horizons.
618.34 Horizon Designation.
(a) Definition. Horizon designation is a concatenation of three kinds of symbols used in various combinations to identify layers of soil that reflect the investigator's interpretations of genetic relationships among layers within a soil.
(b) Significance. Soils vary widely in the degree to which horizons are expressed. The range is from little or no expression to strong expression. Layers of different kinds are identified by symbols. Designations are provided for layers that have been changed by soil formation and for those that have not. Designations are assigned after comparison of the observed properties of the layer with properties inferred for the material before it was affected by soil formation. Designations of genetic horizons express a qualitative judgment about the kind of changes that are believed to have taken place. A more detailed discussion can be reviewed in the Soil Survey Manual, Chapter 3. Horizon designations shown in field pedon descriptions (point data) represent a specific location in the landscape. Horizon designations used to populate component data in NASIS are not specific to any one point, but rather are a reflection of commonly observed horizon sequences based on field observations and are intended to model the component as it occurs throughout the map unit so that accurate interpretations can be derived.
(c) Entries. Enter combinations of symbols to reflect master horizons, and their subdivisions. Commonly occurring master horizon sequences identified in field pedon descriptions should be entered. . It is not possible to include all master horizon sequences observed in individual pedon descriptions. For example in many cases if an Ap is present, the former E horizon is incorporated into the Ap, so a sequence of Ap, E, should not be used because they would not normally occur together. Judgment is required when determining how much detail is required to represent the component adequately for interpretations. Care should be taken to maintain important differences between horizons whose range in properties are specified separately on the official series descriptions. Some general guidance follows. Master horizons (i.e. O, A, E, B, etc.) represent unique sets of pedogenic processes and therefore should not be combined when aggregating data, even if their basic properties are similar. Transitional horizons such as EB and BC should be shown if they are commonly more than about 10 cm thick. After applying careful judgment, some horizons may be combined in order to avoid overly complex horizon sequences representing map unit components. Keep in mind however that once combined, any useful information gained by their separation is
(430-VI-NSSH, 2010)

Part 618 – Soil Properties and Qualities 618-33
lost. Transition horizons thinner than about 10 cm may be combined with an adjacent master horizon if they are not considered important to the interpretation of the component. Master horizon subdivisions showing genetic variations not deemed significant to interpretations may be combined. For example, a sequence of Bt1, Bt2, Bt3 based solely on color variation and having no other significant differences, may be combined and shown simply as Bt. Master horizon subdivisions showing genetic variations that are deemed significant to interpretations should not be combined. For example, a sequence of Bt, Btx, and BC should not be combined. Do not combine horizons that straddle the criteria break to a diagnostic horizon. For example a Bk1 with insufficient calcium carbonate content to qualify as a calcic horizon should not be combined with a Bk2 that is a calcic horizon. Enter only what the documentation can support. Combination horizons (E and Bt, B/E, E/B, etc.) should be entered as two separate horizon records; for example one for the E part of the horizon and the second for the Bt part of the horizon. Both records would have the same horizon depths and horizon designations assigned. Soil property data elements would be populated for each part respectively to describe the characteristics of that part of the horizon. Allowable codes are listed in the NASIS data dictionary. Further discussion of rules for use can be found in the Soil Survey Manual, Chapter 3, and the latest edition of the Keys to Soil Taxonomy.
618.35 Horizon Thickness.
(a) Definition. Horizon thickness is a measurement from the top to bottom of a soil horizon throughout its areal extent.
(b) Measurement. Soil horizon thickness varies on a cyclical basis. Measurements should be made to record the range in thickness as it normally occurs in the soil.
(c) Entries. Horizon thickness values used to populate component data in NASIS are not specific to any one point, but rather are a reflection of commonly observed values based on field observations and are intended to model the component as it occurs throughout the map unit. Enter the high, low, and representative values in whole centimeters. The minimum allowable entry is 1 cm. For horizons extending beyond the limit of field observation, thickness is calculated only to the depth to which observation was made.
618.36 Hydrologic Group.
(a) Definition. The complete definition and official criteria for hydrologic soil group is available online at http://policy.nrcs.usda.gov/22526.wba (U.S. Department of Agriculture, Natural Resources Conservation Service. 2009. National Engineering Handbook, Title 210-VI, Part 630, Chapter 7, Hydrologic Soil Groups. Washington, DC.) .Hydrologic group is a group of soils having similar runoff potential under similar storm and cover conditions. Soil properties that influence runoff potential are those that influence the minimum rate of infiltration for a bare soil after prolonged wetting and when not frozen. These properties are depth to a seasonally high
(430-VI-NSSH, 2010)

Part 618 – Soil Properties and Qualities 618-34
water table, and saturated hydraulic conductivity after prolonged wetting, and depth to a layer with a very slow water transmission rate. Changes in soil properties caused by land management or climate changes also cause the hydrologic soil group to change. The influence of ground cover is treated independently.
(b) Classes. The soils in the United States are placed into four groups, A, B, C, and D, and three dual classes, A/D, B/D, and C/D.
(c) Significance. Hydrologic groups are used in equations that estimate runoff from rainfall. These estimates are needed for solving hydrologic problems that arise in planning watershed-protection and flood-prevention projects, for planning or designing structures for the use, control, and disposal of water. They pertain to the minimum steady ponded infiltration under conditions of a bare wet surface.
(d) Measurements. The original classifications assigned to soils were based on the use of rainfall-runoff data from small watersheds and infiltrometer plots. From these data, relationships between soil properties and hydrologic groups were established.
(e) Estimates. Assignment of soils to hydrologic groups is based on the relationship between soil properties and hydrologic groups. Wetness characteristics, water transmission after prolonged wetting, and depth to very slowly permeable layers are properties that assist in estimating hydrologic groups.
(f) Entries. Enter the soil hydrologic group, such as A, B, C, D, A/D, B/D, or C/D.
618.37 Landform.
(a) Definition. Landform is any physical, recognizable form or feature of the earth's surface, having a characteristic shape and produced by natural causes.
(b) Significance. Geographic order suggests natural relationships. Running water, with weathering and gravitation, commonly sculptures landforms within a landscape. Over the ages, earthy material has been removed from some landforms and deposited on others. Landforms are interrelated. An entire area has unity through the interrelationships of its landform.(1) Each landform may have one kind of soil present, or several. Climate,
vegetation, and time of exposure to weathering of the parent materials are commonly about the same throughout the extent of the landform, depending on the relief of the area. Position on the landform may have influenced the soil-water relationships, microclimate, and vegetation.
(2) The proper identification of the landform is an important part of understanding the formative history of the soil and the materials from which they formed. This aids in the development of the soil mapping model, and in the transfer of information between areas.
(3) Landform terms are also used as phase criteria for separating mapping components or phases of a soil taxon.
(c) Classes. The allowable list of landform terms are included in the NASIS data dictionary. Definitions of the terms are included in part 629 of this handbook.
(430-VI-NSSH, 2010)

Part 618 – Soil Properties and Qualities 618-35
(d) Entries. Enter the appropriate class name for the landform(s) on which each map unit component occurs. A representative value (term) may be indicated. The capability is provided for indicating the presence of one landform occurring on another landform, i.e., a dune on a floodplain.
618.38 Linear Extensibility Percent.
(a) Definition. Linear extensibility percent is the linear expression of the volume difference of natural soil fabric at 1/3 bar or 1/10 bar water content and oven dryness. The volume change is reported as percent change for the whole soil.
(b) Classes. Shrink-swell classes are based on the change in length of an unconfined clod as moisture content is decreased from a moist to a dry state. If this change is expressed as a percent, the value used is LEP, linear extensibility percent. If it is expressed as a fraction, the value used is COLE, coefficient of linear extensibility. The shrink-swell classes are defined as follows:
Shrink-swell Class
LEP COLE
Low <3 <0.03Moderate 3-6 0.03 - 0.06High 6-9 0.06 - 0.09Very High 9 0.09
(c) Significance. If the shrink-swell potential is rated moderate to very high, shrinking and swelling can damage buildings, roads, and other structures. The high degree of shrinkage associated with high and very high shrink-swell potentials can damage plant roots.
(430-VI-NSSH, 2010)

Part 618 – Soil Properties and Qualities 618-36
(d) Measurement. Coefficient of linear extensibility is measured directly as the change in clod dimension from moist to dry conditions and is expressed as a percentage of the volume change to the dry length:
COLE = moist length - dry length dry length
When expressed as LEP (linear extensibility percent):
LEP = COLE X 100
Linear extensibility may be determined by any of the following methods:
(1) For the core method of measurement, select a sample core from a wet or moist soil. Carefully measure the wet length of the cores and set the core upright in a dry place. If the core shrinks in a symmetrical shape without excessive cracking or crumbling, its length can be measured and linear extensibility percent calculated. If the core crumbles or cracks, measurements cannot be accurately determined by this method.
(2) In the coated clod method of measurement, shrink-swell potential can be estimated from the bulk density of soil measured when moist and when dry. The coated clod method is widely used and is the most versatile procedure for determining bulk density of coherent soils. Procedures and calculations are given in Soil Survey Investigations Report No. 42, Soil Survey Laboratory Methods Manual, Version 4.0, November 2004, USDA, NRCS, which is obtainable from the National Soil Survey Center.
(3) Linear extensibility percent can be calculated from bulk density moist (Dbm) and bulk density dry (Dbd) using the following formula:
LEP = 100 [(Dbd/Dbm)1/3 -1] [1-(Volume % >2 mm/100)]
This equation is used to simplify the determination of shrink-swell potential classes. The classes are as follows:
Dbd/Dbm Shrink-Swell Potential
< 1.10 Low1.10 - 1.20 Moderate1.20 - 1.30 High≥ 1.30 Very high
(e) Estimates. Field estimates of shrink-swell potential can be made by observing desiccation cracks, slickensides, gilgai, soil creep, and leaning utility poles. Shrink-swell potential correlates closely with the kind and amount of clay. The greatest shrink-swell potential occurs in soils that have high amounts of 2:1 lattice clays, such as clay minerals in the smectite group. Illitic clays are intermediate, and kaolinitic clays are least affected by volume change as the content in moisture changes.
(430-VI-NSSH, 2010)

Part 618 – Soil Properties and Qualities 618-37
(f) Entries. Enter the low, high, and representative linear extensibility percent values. The high and low values are to correspond to the high and low limits of the appropriate class. The range of valid entries is 0.00 to 30.00 percent.
618.39 Liquid Limit.
(a) Definition. Liquid limit is the water content of the soil (passing 40 sieve) at the change between the liquid and the plastic states.
(b) Significance. The plasticity chart, given in ASTM D 2487, is a plot of liquid limit (LL) versus plasticity index (PI) and is used in classifying soil in the Unified Soil Classification System. The liquid limit is also a criterion for classifying soil in the AASHTO Classification System, as shown in Exhibit 618-4. Generally, the amount of clay- and silt-size particles, the organic matter content, and the type of minerals determine the liquid limit. Soils that have a high liquid limit have the capacity to hold a lot of water while maintaining a plastic or semisolid state.
(c) Measurement. Tests are made on thoroughly puddled soil material that has passed a No. 40 (425 mm) sieve, and is expressed on a dry weight basis, according to ASTM method D 4318. This procedure requires the use of a liquid limit device, a special tool designed to standardize the arbitrary boundary between a liquid and plastic state of a soil. Estimates of liquid limit are made on soils during soil survey investigations and mapping activities. The liquid limit is usually inferred from clay mineralogy and clay content. If soils are tested later in the laboratory, adjustments are made to the field estimates as needed. Generally, experienced personnel can estimate these values with a reasonable degree of accuracy.
(d) Estimates. The formula in Exhibit 618-7 is used within the National Soil Information System to provide default calculated values if no measurements are available.
(e) Entries. Enter the high, low, and representative values as a range of percentages. Entries are allowed to tenths of a percent; however, entries should be rounded to the nearest 10 except where they are measured. Enter "0" for nonplastic soils. The liquid limit for organic soil material is not defined, and is assigned “null.” A NASIS calculation is available and can be viewed in Appendix 618-5.
618.40 Organic Matter.
(a) Definition. Organic matter percent is the weight of decomposed plant and animal residue and expressed as a weight percentage of the soil material less than 2 mm in diameter.
(b) Significance. Organic matter influences the physical and chemical properties of soils far more than the proportion to the small quantities present would suggest. The organic fraction influences plant growth through its influence on soil properties. It encourages granulation and good tilth, increases porosity and lowers bulk density, promotes water infiltration, reduces plasticity and cohesion, and increases the available water capacity. It has a high cation-adsorption capacity and is important to pesticide binding. It furnishes energy to micro-organisms in the soil. As it decomposes, it releases nitrogen, phosphorous, and sulfur. The
(430-VI-NSSH, 2010)

Part 618 – Soil Properties and Qualities 618-38
distribution of organic carbon with depth indicates different episodes of soil deposition or soil formation.(1) Soils that are very high in organic matter have poor engineering properties and
subside upon drying.(c) Measurement. Measurements are made using total combustion to determine
total carbon. Carbonate carbon is then determined and subtracted to provide an estimate of organic carbon. The results are given as the percent of organic carbon in dry soil. To convert the figures for organic carbon to those for organic matter, multiply the organic carbon percentage by 1.724. The detailed procedures will be outlined in the next version of Soil Survey Investigations Report No. 42, Soil Survey Laboratory Methods Manual, USDA, NRCS.
(d) Estimates. Color and "feel" are the major properties used to estimate the amount of organic matter. Color comparisons in areas of similar materials can be made against laboratory data so that a soil scientist can make estimates. In general, black or dark colors indicate high amounts of organic matter. The contrast of color between the A horizon and subsurface horizons is also a good indicator.
(e) Entries. Enter the high, low, and representative values to represent the range for each horizon. Use whole numbers for entries that are 1 and above; use tenths for those that are less than 1.
618.41 Parent Material, Kind, Modifier, and Origin.
Parent material is the unconsolidated material, mineral or organic, from which the soil develops. The soil surveyor uses parent material to develop a model used for soil mapping. Soil scientists and specialists in other disciplines use parent material to help interpret soil boundaries and project performance of the material below the soil. Many soil properties relate to parent material. Among these properties are proportions of sand, silt, and clay; chemical content; bulk density; structure; and the kinds and amounts of fragments. These properties affect interpretations and may be criteria to separate soil series. Soil properties and landscape information infer parent material. Three data elements -- parent material kind, parent material modifier, and parent material origin describe parent material.(a) Parent Material Kind.
(1) Definition. Parent material kind is a term describing the general physical, chemical and mineralogical composition of the material, mineral or organic, from which the soil develops. Mode of deposition and/or weathering may be implied or implicit.
(2) Classes. The list of allowable entries are included in the NASIS data dictionary. Definitions of many of these terms are included in Part 629 of this handbook.
(3) Entries. Enter the applicable class name(s) for each map unit component. Multiple entries are permissible. Multiple layers of parent materials may also be indicated for a single component, such as loess over till over residuum.
(b) Parent Material Modifier.
(430-VI-NSSH, 2010)

Part 618 – Soil Properties and Qualities 618-39
(1) Definition. Parent material modifier is the general description of the texture of the parent material. Class limits correspond to those of textural groupings defined in Soil Survey Manual and family particle-size classes of Soil Taxonomy.
(2) Classes. The classes of parent material modifiers are:Clayey LoamyCoarse-loamy SandyCoarse-silty Sandy and
gravellyFine-loamy Sandy and siltyFine-silty SiltyGravelly Silty and clayey
(3) Entries. Enter the appropriate class name to modify the corresponding layer of parent material kind as desired.
(c) Parent Material Origin.(1) Definition. Parent material origin is the type of bedrock from which the
parent material was derived.(2) Classes. The allowable class names are included in the NASIS data dictionary
and are the same as for the "bedrock kind" data element.(3) Entries. Enter the appropriate "parent material origin" class name(s) to
correspond with each "parent material kind" as desired. This data element is intended to be used when "residuum" is the chosen parent material kind. However, it may also be used with other kinds of parent material.
618.42 Particle Density.
(a) Definition. Particle density is the mass per unit of volume of the solid soil particle, either mineral or organic. Also known as specific gravity.
(b) Significance. Particle density is used in the calculation of weight and volume for soil (porosity). The relationship of bulk density, percent pore space, and the rate of sedimentation of solid particles in a liquid depends on particle density. The term particle density indicates wet particle density or specific gravity.
(c) Measurement. The standard methods of measurement for particle density are the ASTM Standard Test Method for Specific Gravity of Soils, ASTM designation D 854-92, which uses soil materials passing a No. 4 sieve; the method described by Blake and Hartge in Methods of Soil Analysis, Part 1, Agronomy 9; or the method for volcanic soils described by Bielders and others in Soil Sci. Soc. Am. J. 54: 822-826.
(d) Estimates. Particle density is often assumed to be 2.65 g cm-3; however, many minerals and material of various origins exhibit particle densities less than or greater than this "standard." Particle density (Dp) may be calculated using the extractable iron and the organic carbon percentages in the following formula:
Dp = 100 (1.7 X OC) + (1.6 X Fe) + 100 - [(1.7 X OC) + (1.6 X Fe)] Dp1 Dp2 Dp3
(430-VI-NSSH, 2010)

Part 618 – Soil Properties and Qualities 618-40
OC is the organic carbon percentage and Fe is the extractable iron determined by method 6C2 (Soil Survey Laboratory Staff, 1992) or by an equivalent method. The particle density of the organic matter (Dp1) is assumed to be 1.4 g cm-3; that of the minerals from which the extractable iron originates (Dp2) is assumed to be 4.2 g cm-3, and that of the material exclusive of the organic matter and the minerals contributing to the extractable Fe (Dp3) is assumed to be 2.65 g cm-3.
(e) Entries. Enter the representative value. The range of valid entries is 1.0 to 6.0 g cm-3. Hundredths are allowable.
618.43 Particle Size.
(a) Definition. Particle size is the effective diameter of a particle as measured by sedimentation, sieving, or micrometric methods. Particle sizes are expressed as classes with specific, effective diameter class limits. The broad classes are clay, silt, and sand, ranging from the smaller to the larger of the less than 2 mm mineral soil fraction. It includes fragments of weathered or poorly consolidated fragments that disperse to particles less than 2 mm.
(b) Significance. The physical behavior of a soil is influenced by the size and percentage composition of the size classes. Particle size is important for most soil interpretations, for determination of soil hydrologic qualities, and for soil classification.
(c) Measurement. Particle size is measured by sieving and sedimentation. The method used is Method 3A1, which is outlined in Soil Survey Investigations Report No. 42, Soil Survey Laboratory Methods Manual, Version 4.0, November 2004, USDA, NRCS. A NASIS calculation is available and can be viewed in Appendix 618-6.
(d) Classes. The United States Department of Agriculture uses the following size separates for the <2 mm mineral material:
USDA Particle size separates Size (mm)
Clay, total <0.002 Silt, total 0.002 - 0.05 Silt, fine 0.002 - 0.02 Silt, coarse 0.02 - 0.05 Sand total 0.05 - 2.00 Very fine sand 0.05 - 0.10 Fine sand 0.10 - 0.25 Medium sand 0.25 - 0.50 Coarse sand 0.50 - 1.00 Very coarse sand 1.00 - 2.00
(430-VI-NSSH, 2010)

Part 618 – Soil Properties and Qualities 618-41
Exhibit 618-8 compares the USDA system with the AASHTO and Unified Soil Classification System and shows the U.S. standard sieve sizes.
(e) Clay percentage.(1) Definition. Total clay percentage is the weight percentage of the mineral
particles less than 0.002 mm in equivalent diameter in the less than 2 mm soil fraction. Most of the material is in one of three groups of clay minerals or a mixture of these clay minerals. The groups are kaolinite, smectite, and hydrous mica, the best known member of which is illite.
(2) Significance. Physical and chemical activities of a soil are related to the kind and amount of clay minerals. Clay particles may have thousands of times more surface area per gram than silt particles and nearly a million times more surface area than very coarse sand particles. Thus, clay particles are the most chemically and physically active part of mineral soil.(i) Clay mineralogy and clay percentage have a strong influence on
engineering properties and the behavior of soil material when it is used as construction or foundation material. They influence linear extensibility, compressibility, bearing strength, and saturated hydraulic conductivity.
(ii) The kind and amount of clay influence plant growth indirectly by affecting available water capacity, water intake rate, aeration, cation exchange capacity, saturated hydraulic conductivity, erodibility, and workability. Up to a certain point, an increase in the amount of clay in the subsoil is desirable. Clay can increase the amount of water and nutrients stored in that zone. By slightly slowing the rate of water movement, it can reduce the rate of nutrient loss through leaching. If the amount of clay is great, it can impede water and air movement, restrict root penetration, increase runoff and, on sloping land, result in increased erosion.
(iii) Clay particles are removed by percolating water from surface and subsurface horizons and deposited in the subsoil horizons. The amount of clay accumulation and its location in the profile provide clues for the soil scientist about soil genesis. Irregular clay distribution as related to depth may indicate lithologic discontinuities, especially if accompanied by irregular sand distribution.
(3) Measurement. Clay content is measured in the laboratory by the pipette or hydrometer methods after the air-dry soil is pretreated to remove organic matter and soluble salts. Field estimates of clay content are made by manual methods. The way a wet soil ribbons, or develops a long continuous ribbon, when pressed between the thumb and fingers gives a good idea of the amount of clay present. Excessive amounts of sodium can toughen the soil, making the soil feel more clayey. Care should be taken not to overestimate the amount of clay in sodic soils. Accuracy depends largely on frequent and attentive observation. Texture reference samples determined in the laboratory are used by soil scientists to calibrate the feel of soils with various percentages of clay.
(4) Entries. Enter the high, low, and representative values of the clay total separate as a percent of the material less than 2 mm in size for each horizon. Enter a "0" if amount is not significant, as in organic layers or in some andic soil materials. The representative value should equate to the representative (clay total separate) "texture class" posted for each horizon.
(430-VI-NSSH, 2010)

Part 618 – Soil Properties and Qualities 618-42
(f) Sand Percentage.(1) Definition. Sand percentage is the weight percentage of the mineral particles
less than 2 mm and greater than or equal to 0.05 mm in equivalent diameter in the less than 2 mm soil fraction. The sand separates recognized are very coarse, coarse, medium, fine, very fine, and total. Respective size limits are shown in paragraph 618.44(d) above. Much of the sand fraction is composed of fragments of rocks and primary minerals, especially quartz. Therefore, the sand fraction is quite chemically inactive.
(2) Significance. Physical properties of the soil are influenced by the amounts of total sand and of the various sand fractions present in the soil. Sand particles, because of their size, have a direct impact on the porosity of the soil. This influences other properties, such as saturated hydraulic conductivity, available water capacity, water intake rates, aeration, and compressibility related to plant growth and engineering uses.
(3) Measurement. Sand content is measured in the laboratory by the wet sieving method and then fractionated by dry sieving. Field estimates are made by manual methods. The degree of grittiness in a wet soil sample, when worked between the thumb and forefinger, gives an estimate of the sand content. The size of sand grains may be observed with the naked eye or with the aid of a hand lens.
(4) Entries. Enter the high, low, and representative value of each sand size separate (sand coarse separate, sand fine separate, sand medium separate, sand very coarse separate, sand very fine separate, sand total separate) as a percent of the material less than 2 mm in size for each horizon. Enter a "0" if amount is not significant, as in organic layers or in some andic soil materials. The representative value should equate to the representative "texture class" posted for each horizon.
(g) Silt Percentage.(1) Definition. Silt percentage is the weight percentage of the mineral particles
greater than or equal to 0.002 mm but less than 0.05 mm in the less than 2 mm soil fraction. The silt separates recognized are fine, coarse, and total. The respective size limits are listed in paragraph 618.44 (d) above. The silt separate is dominated by primary minerals, especially quartz, and therefore has a low chemical activity.
(2) Significance. The silt separate possesses some plasticity, cohesiveness, and absorption, but to a much lesser degree than the clay separate. Silt particles act to slow water and air movement through the soil by filling voids between sand grains. A very high content of silt in a soil may be physically undesirable for some uses unless supplemented by adequate amounts of sand, clay, and organic matter.
(3) Measurement. The silt content is measured in the laboratory in two phases. The fine silt is measured using the pipette method on the suspension remaining from the wet sieving process. Aliquots of the diluted suspension are removed at predetermined intervals based on Stokes Law. The aliquots are then dried and weighed. The coarse silt fraction is the difference between 100 percent and the sum of the sand, clay, and fine silt percentages.
(430-VI-NSSH, 2010)

Part 618 – Soil Properties and Qualities 618-43
The silt content may be estimated in the field using the ribbon test as described for clay. The content of silt is usually estimated by first estimating the clay and sand portions and then subtracting that number from 100 percent. Silt tends to give the soil a smooth feel.
(4) Entries. Enter the high, low, and representative value of each silt size separate (silt coarse separate, silt fine separate, silt total separate) as a percent of the material less than 2 mm in size for each horizon. Enter a "0" if amount is not significant, as in organic layers or in some andic soil materials. The representative value should equate to the representative "texture class" posted for each horizon.
618.44 Percent Passing Sieves.
(a) Definition. The percent passing sieve numbers 4, 10, 40, and 200 is the weight of material that passes these sieves, based on the material less than 3 inches (75 mm) in size, expressed as a percentage.
(b) Significance. Data for the percent passing sieves are used to classify the soil in the engineering classifications and to make judgments on soil properties and performance. Many soil characteristics are influenced by the depth distribution of grain size for the soil as well as its mode of deposition, stress history, density, and other features.
(c) Measurement. Measurements involve sieve analysis for the determination of grain size distribution of that portion of the soil having particle diameters between 3 inches and 0.074 mm (No. 200 sieve). ASTM methods D 422, C 136, and C 117 have applicable procedures that are used where appropriate. Measurements are made on most benchmark soils and other representative soils in survey areas.
(d) Estimates. Estimates of the content of sand, silt, clay, and rock fragments that are made for soils during soil survey investigations and mapping activities are used to estimate percent passing sieves. If samples are tested later in a laboratory, adjustments are made to the field estimates as needed. Generally, experienced personnel can estimate these values with a high degree of accuracy. Estimates for percent passing sieves can be made from soil texture using the following general guidance:
Percent passing #200 = clay + silt + 1/2 very fine sand
Percent passing #40 = 1/2 very fine sand + fine sand + 1/2 medium sand + percent passing #200
The percent passing #10 equals the less than 2 mm fraction, and soil texture is based on the less than 2 mm fraction. Since sieves represent the less than 3-inch fraction, the #40 and #200 sieve estimates must be adjusted when the percent passing #10 is less than 100 percent. The percent passing #40 and #200 that is determined above by texture must be adjusted by multiplying the percent passing
(430-VI-NSSH, 2010)

Part 618 – Soil Properties and Qualities 618-44
#40 and percent passing #200 by the percent passing #10. Pararock fragments are not cemented strongly enough to be retained on sieves. They are crushed and estimated into percent passing sieves.. ASTM procedures use a roller crusher as a pretreatment of the soil material prior to sieving . Field estimates should try to replicate this procedure.
(e) Entries. Enter the high, low, and representative values to represent the range of percent passing each sieve size for each horizon. The range includes the estimating accuracy as well as the range of values for a soil. Entries are allowable as tenths of a percent and range from 0 to 100 percent. A NASIS calculation is available and can be viewed in Appendix 618-7.
618.45 Plasticity Index.
(a) Definition. The plasticity index is the numerical difference between the liquid limit and the plastic limit. It is the range of water content in which a soil exhibits the characteristics of a plastic solid. The plastic limit is the water content that corresponds to an arbitrary limit between the plastic and semisolid states of a soil.
(b) Significance. The plasticity index, when used in connection with the liquid limit, serves as a measure of the plasticity characteristics of a soil. The plasticity chart, given in ASTM D 2487, is a plot of the liquid limit (LL) versus the plasticity index (PI) and is used in classifying soil in the Unified Soil Classification System. The plasticity index is also a criterion for classifying soil in the AASHTO Classification System, as shown in Exhibit 618-4. Soils that have a high plasticity index have a wide range of moisture content in which the soil performs as a plastic material. Highly and moderately plastic clays have large PI values.
(c) Measurements. Tests are made on that portion of the soil having particles passing the No. 40, (425 micrometer) sieve, according to ASTM Method D 423. Measurements are made on most benchmark soils and on other representative soils in survey areas. Estimates of plasticity index are made on all soils during soil survey investigations and mapping activities. The plasticity index is usually not estimated directly, but a position on the plasticity chart in ASTM D 2487 is estimated. The plasticity index can then be determined from the chart. If soils are later tested in the laboratory, adjustments are made to the field procedures as needed. Generally, experienced personnel can estimate these values with a reasonable degree of accuracy. Estimates are expressed in ranges that include the estimating accuracy as well as the range of values from one location to another within the map unit.
(d) Estimates. The formula in Exhibit 618-7 is used within the National Soil Information System to provide default calculated values if no measurements are available.
(e) Entries. Enter the high, low, and representative values to represent the range for each horizon. Round to the nearest 5 percent unless the values are measured. Entries may range from 0 to 130. Enter "0" for nonplastic soils. The plasticity index for organic soil material is not defined, and is assigned “null.” A NASIS calculation is available and can be viewed in Appendix 618-5.
(430-VI-NSSH, 2010)

Part 618 – Soil Properties and Qualities 618-45
618.46 Ponding Depth, Duration, Frequency Class, and Month.
Ponding is standing water in a closed depression. The water is removed only by deep percolation, transpiration, or evaporation or by a combination of these processes. Ponding of soils is classified according to depth, frequency, duration, and the beginning and ending months in which standing water is observed.(a) Ponding depth.
(1) Definition. Ponding depth is the depth of surface water that is ponding on the soil.
(2) Entries. Enter the high, low, and representative values for the ponding depth, in centimeters, for the map unit component. Entries are whole numbers that range from 0 to 185 centimeters.
(b) Ponding duration class.(1) Definition. Ponding duration class is the average duration, or length of time,
of the ponding occurrence.(2) Classes. The ponding duration classes are:
Ponding Duration Class
Duration of the ponding occurrence
VERY BRIEF Less than 2 daysBRIEF 2 to 7 daysLONG 7 to 30 daysVERY LONG 30 days
(3) Entries. Enter VERY BRIEF, BRIEF, LONG, or VERY LONG for the map unit component. Only use entries if ponding occurs more often than rare.
(c) Ponding frequency class.(1) Definition. Ponding frequency class is the number of times ponding occurs
over a period of time.(2) Classes. The ponding frequency classes are:
Ponding Frequency Class
Definition
NONE No reasonable possibility of ponding, near 0 percent chance of ponding in any year
RARE Ponding unlikely but possible under unusual weather conditions; from nearly 0 to 5 percent chance of ponding in any year or nearly 0 to 5 times in 100 years
OCCASIONAL Ponding is expected infrequently under usual weather conditions; 5 to 50 percent chance of ponding in any year or nearly 5 to 50 times in 100 years
FREQUENT Ponding is likely to occur under usual weather conditions; more than 50 percent chance in any year or more than 50 times in 100 years
(430-VI-NSSH, 2010)

Part 618 – Soil Properties and Qualities 618-46
(3) Entries. Enter NONE, RARE, OCCASIONAL, or FREQUENT as appropriate for the map unit component.
(d) Ponding month.(1) Definition. Ponding month is the calendar month(s) in which ponding is
expected.(2) Classes. The time of year when ponding is likely to occur is expressed in
months for the expected beginning to expected end of the ponding period. The time period expressed includes two-thirds to three-fourths of the occurrences.
(3) Entries. Enter the name of each month of the year in which ponding is expected.
(e) Significance. The susceptibility of soils to ponding is important for homes, building sites, and sanitary facilities. Time and duration of the ponding are critical factors determining plant species. Ponding during the dormant season has few if any harmful effects on plant growth or mortality and, may even improve growth.
(f) Estimates. Generally, estimates of ponding frequency and duration can be made for each soil. Where the natural infiltration, saturated hydraulic conductivity, and surface and subsurface drainage of soils is altered, ponding studies are needed to reflect present ponding characteristics.(1) Evidence of ponding events should be gathered during soil survey field work.
High water lines and other signs of maximum water height are recorded. Other records may also exist.
(2) Certain landform features are subject to ponding. These features are characteristics of closed drainage systems and include potholes, playas, sloughs, and backswamps. Most of these features are recognizable when correlating features on aerial photographs with ground observations. Different kinds of vegetation and soils are normally associated with these geomorphic features.
(3) The vegetation that grows in ponded areas may furnish clues to past ponding and indicate the potential for ponding in the future. Generally, native vegetation in ponded areas consists of obligate and facultative wet hydrophytes. Some plant species are intolerant of ponding and do not grow in areas that are ponded.
(4) The soil provides clues to past ponding, but characteristics vary according to climate and soil conditions. Some of the clues are (i) a dark surface horizon or layer overlying a gleyed subsoil; (ii) many prominent redoximorphic features that have low value and chroma; (iii) capillary transport and concentrations of carbonates or sulfates, or both, in the upper soil horizons; and (iv) dark colors and high levels of organic matter throughout the profile or any combination of these features.
618.47 Pores.
Pore space is a general term for voids in the soil material. The term includes matrix, nonmatrix, and interstructural pore space. For water movement at low suction and
(430-VI-NSSH, 2010)

Part 618 – Soil Properties and Qualities 618-47
conditions of satiation, the nonmatrix and interstructural porosity have particular importance. Matrix pores. Matrix pores are formed by the agents that control the packing of
the primary soil particles. These pores are usually smaller than nonmatrix pores. Additionally, their aggregate volume and size would change markedly with water state for soil horizons or layers with high extensibility.
Nonmatrix pores. Nonmatrix pores are relatively large voids that are expected to be present when the soil is moderately moist or wetter, as well as under drier states. The voids are not bounded by the planes that delimit structural units. Nonmatrix pores may be formed by roots, animal, action of compressed air, and other agents. The size of the distribution of nonmatrix pores usually bears no relationship to the particle size distribution and the related matrix pore size distribution.
Interstructural pores. Interstructural pores are delimited by structural units. Inferences as to the interstructural porosity may be obtained from the structure description. Commonly, interstructural pores are at least crudely planar.
Nonmatrix pores are described by quantity, size, shape, and vertical continuity--generally in that order.(a) Pore quantity.
(1) Definition. Pore quantity is the classes that pertain to the number of a selected size of pores per unit area of undisturbed soils--1 cm2 for very fine and fine pores, 1 dm2 for medium and coarse pores, and 1 m2 for very coarse pores.
(2) Classes. The pore quantity classes are:
Pore Quantity Class
Number of pores per unit area
Few 1 Common 1-5 Many 5
(3) Entries. Enter pore quantity as pores/area. Enter the high, low, and representative values as a whole number between 0 and 99 for the horizon.
(b) Pore size.(1) Definition. Pore size is the average diameter of the pore.(2) Classes. The pore size classes are:
Pore Size Class Pore Size (mm)Very fine <1 Fine 1-2 Medium 2-5 Coarse 5-10 Very Coarse 10
(3) Entries. Enter a single class or a combination of size classes for the horizon. Acceptable entries for pore size class are very fine, very fine and fine, very fine
(430-VI-NSSH, 2010)

Part 618 – Soil Properties and Qualities 618-48
to medium, very fine to coarse, fine, fine and medium, fine to coarse, medium, medium and coarse, coarse, and very coarse.
(c) Pore shape.(1) Definition. Pore shape is a description of the multiarial shape of the pore.
Most nonmatrix pores are either vesicular (approximately spherical or elliptical) or tubular (approximately cylindrical and elongated). Some are irregularly shaped and referred to as interstitial. Additionally, the following designations are utilized:(i) Continuous--if nonmatrix pore extends vertically through the thickness of
the horizon or layer.(ii) Discontinuous--the nonmatrix pore does not extend vertically through the
thickness of the horizon or layer.(iii) Constricted--the tubular pores are plugged with clay.(iv) Dendritic--the tubular pores branch out of a main stem.
(2) Classes. The pore shape classes are:
Constricted tubular Interstitial and tubular
Continuous tubular TubularDendritic tubular VesicularDiscontinuous tubular Vesicular and tubularFilled with coarse material
Void between fragments
Interstitial
(3) Entries. Enter one of the choices from the class list for the horizon.(d) Vertical continuity.
(1) Definition. Vertical continuity is the average vertical distance through which the minimum pore diameter exceeds 0.5 mm when the soil layer is moist or wetter.
(2) Classes. The vertical continuity classes are:
Vertical Continuity Class
Vertical distance (cm)
Low < 1 Moderate 1-10 High 10
(3) Entries. Enter one of the vertical continuity classes.
618.48 Reaction, Soil (pH).
(a) Definition. Soil reaction is a numerical expression of the relative acidity or alkalinity of a soil.
(430-VI-NSSH, 2010)

Part 618 – Soil Properties and Qualities 618-49
(b) Classes. The descriptive terms for reaction and their respective ranges in pH are:
Reaction Class Range in pHUltra acid 1.8-3.4Extremely acid 3.5-4.4Very strongly acid 4.5-5.0Strongly acid 5.1-5.5Moderately acid 5.6-6.0Slightly acid 6.1-6.5Neutral 6.6-7.3Slightly alkaline 7.4-7.8Moderately alkaline 7.9-8.4Strongly alkaline 8.5-9.0Very strongly alkaline 9.1-11.0
(c) Significance. A principal value of soil pH is the information it provides about associated soil characteristics. Two examples are phosphorus availability and base saturation. Soils that have a pH of approximately 6 or 7 generally have the most ready availability of plant nutrients. Strongly acid or more acid soils have low extractable calcium and magnesium, a high solubility of aluminum, iron, and boron, and a low solubility of molybdenum. In addition, these soils have a possibility of organic toxins and generally have a low availability of nitrogen and phosphorus. At the other extreme are alkaline soils. Calcium, magnesium, and molybdenum are abundant with little or no toxic aluminum, and nitrogen will be readily available. If pH is above 7.9, the soils may have an inadequate availability of iron, manganese, copper, zinc, and especially of phosphorus and boron.Soil reaction is one of several properties used as a general indicator of soil corrosivity or its susceptibility to dispersion. In general, soils that are either highly alkaline or highly acid are likely to be corrosive to steel. Soils that have pH <5.5 are likely to be corrosive to concrete. Soils that have pH >8.5 are likely to be highly dispersible, and piping may be a problem.
(d) Measurement. The most common soil laboratory measurement of pH is the 1:1 water method. A crushed and sieved soil sample is mixed with an equal amount of water, and a measurement is made of the suspension using a pH meter. Another method used, especially for Histosols, is the 0.01M calcium chloride method. In NASIS these two methods are shown as separate data elements.(1) The pH values derived from water suspension are affected by field applications
of fertilizer or other salts in the soil, the content of carbon dioxide in the soil, and even moisture content at the time of sampling. The 0.01M calcium chloride method reduces these influences.
(2) The laboratory methods are described in Soil Survey Investigations Report No. 42, Soil Survey Laboratory Methods Manual, Version 4.0, November 2004, USDA, NRCS.
(e) Estimates. A variety of field test kits are available for determination of pH in the field. The methods include a water-soluble dye, which is mixed with soil and thus produces a color that is compared with a chart; a dye-impregnated paper, which changes color according to differences in pH; and portable glass electrodes. Each state office can recommend a suitable pH method for the soils in the state. If
(430-VI-NSSH, 2010)

Part 618 – Soil Properties and Qualities 618-50
requested, the Soil Survey Laboratory makes suggestions for suitable methods for field measurements and furnishes NRCS soil scientists with the proper chemicals.
(f) Entries. Soil reaction (pH) is time and moisture dependent, and water pH can vary up to a whole unit during the growing season. The range of pH should reflect the variations. The 1:1 water method generally is used except for Histosols, which are measured in 0.01M calcium chloride. Separate entries are made for "pH 1 to 1 water" and "pH 0.1M calcium chloride", depending on whether the horizon is mineral or organic. Enter the high, low, and representative values of the appropriate estimated pH range for each horizon. The high and low values are to correspond with the class limits as follows: 1.8-3.4, 3.5-4.4, 4.5-5.0, 5.1-5.5, 5.6-6.0, 6.1-6.5, 6.6-7.3, 7.4-7.8, 7.9-8.4, 8.5-9.0, 9.1-11.0; or enter a combination of classes, for example, 4.5-5.5.
618.49 Restriction Kind, Depth, Thickness, and Hardness.
Identify and describe restrictive soil layers in the field. Observe, measure, and record restriction kind, hardness, depth, and thickness.When describing pedons, if possible, identify types or kinds of restrictions by suffix symbols, such as "d," "f," "m," "r," "v," or "x;" or by the master layer "R."(a) Restriction kind.
(1) Definition. Restriction kind is the type of nearly continuous layer that has one or more physical, chemical, or thermal properties that significantly reduce the movement of water and air through the soil or that otherwise provide an unfavorable root environment. Cemented layers, dense layers, frozen layers, abrupt or stratified layers, strongly contrasting textures, and dispersed layers are examples of soil layers that are restrictions.
(2) Classes. The choices for restriction kind are:Abrupt textural change PetrocalcicBedrock (lithic) PetroferricBedrock (paralithic) PetrogypsicCemented horizon PlacicDense material PlinthiteDuripan SalicFragipan Strongly contrasting textural
stratificationNatric SulfuricOrtstein UndefinedPermafrost
(3) Entries. Enter the appropriate choice for the horizon or layer.(b) Restriction depth.
(1) Definition. Restriction depth is the vertical distance from the soil surface to the upper and to the lower boundary of the restriction.
(2) Entries. Restriction depth values used to populate component data in NASIS are not specific to any one point, but rather are a reflection of commonly observed values based on field observations and are intended to model the
(430-VI-NSSH, 2010)

Part 618 – Soil Properties and Qualities 618-51
component as it occurs throughout the map unit. Enter the high, low, and representative values for upper and lower restriction depths in centimeters using whole numbers.
(c) Restriction thickness.(1) Definition. Restriction thickness is the distance from the top to the bottom of
a restrictive layer.(2) Entries. Restriction thickness values used to populate component data in
NASIS are not specific to any one point, but rather are a reflection of commonly observed values based on field observations and are intended to model the component as it occurs throughout the map unit. Enter the high, low, and representative values for the thickness in whole centimeters using whole numbers from 1 to 999.
(d) Restriction hardness.(1) Definition. Restriction hardness is the rupture resistance of an air-dried, then
submerged block-like specimen of mineral material. Ice is not applicable.(2) Classes. Restriction hardness is rated using the following classes and
operation descriptions:Restriction hardness class
Operation description
Not applicable Specimen not obtainableNoncemented Fails under very slight force applied slowly
between thumb and forefinger (<8N).Extremely weakly cemented
Fails under slight force applied slowly between thumb and forefinger (8 to 20N).
Very weakly cemented
Fails under moderate force applied slowly between thumb and forefinger (20 to 40N).
Weakly cemented Fails under strong force applied slowly between thumb and forefinger (about 80N maximum force can be applied) (40 to 80N).
Moderately cemented Cannot be failed between thumb and forefinger but can be failed between both hands or by placing specimen on a nonresilient surface and applying gentle force underfoot (80 to 160N).
Strongly cemented Cannot be failed in hands but can be failed underfoot by full body weight (about 800N) applied slowly (160 to 800N).
Very strongly cemented
Cannot be failed underfoot by full body weight but can be failed by <3J blow (800N to 3J).
Indurated Cannot be failed by blow of 3J (> 3J).
Both force (Newtons, N) and energy (joules, J) are employed. The number of Newtons is 10 times the kilograms of force. One joule is the energy delivered by dropping a 1 kg weight a distance of 10 cm.
(3) Measurement. For measurements of the restriction hardness, use the procedures and classes of cementation that are listed with the rupture resistance classes. Classes are described for like specimens about 25-30 mm on edge which are air-dried and then submerged in water for at least 1 hour. Compress the specimen between extended thumb and forefinger, between
(430-VI-NSSH, 2010)

Part 618 – Soil Properties and Qualities 618-52
both hands, or between the foot and a nonresilient flat surface. If the specimen resists compression, drop a weight onto it from progressively greater heights until it ruptures. Failure is the point of the initial detection of deformation or rupture. Stress applied in the hand should be over a 1-second period. Learn the tactile sense of the class limits by applying force to top loading scales and sensing the pressure through the tips of the fingers or through the ball of the foot. Use postal scales for the resistance range that is testable with the fingers. Use a bathroom scale for the higher rupture resistance range.
(4) Entries. Enter the appropriate class name without the word "cemented"; i.e., use "moderately" for moderately cemented.
(e) Significance. Restriction layers limit plant growth by restricting the limits of the rooting zone. They also impede or restrict the movement of soil water vertically through the soil profile and have a direct impact on the quality and quantity of ground water and surface water. Restriction hardness and thickness have a significant impact on the ease of mechanical excavation. Use excavation difficulty classes to evaluate the relationships of restriction layers to excavations.
(f) Measurements. Use measurements or observations made throughout the extent of occurrence of a soil as a base for estimates of restriction kind, depth, thickness, and hardness.
618.50 Saturated Hydraulic Conductivity
(a) Definition. The ease with which pores of a saturated soil transmit water. Formally, the proportionality coefficient that expresses the relationship of the rate of water movement to hydraulic gradient in Darcy's Law, a law that describes the rate of water movement through porous media. Expressed in micrometers per second. To convert micrometers per second to inches per hour, multiply micrometers per second by 0.1417.
(b) Significance. Saturated hydraulic conductivity is used in soil interpretations. It is also known as Ksat.
(c) Measurement. Means, such as the Amoozemeter and double ring infiltrometers, provide some basis for estimation of saturated hydraulic conductivity. but no method has been accepted as a standard. Since measurements are difficult to make and are available for relatively few soils, estimates of saturated hydraulic conductivity are based on soil properties.
(d) Estimates. The soil properties that affect saturated hydraulic conductivity are distribution, continuity, size, and shape of pores. Since the pore geometry of a soil is not readily observable or measurable, observable properties related to pore geometry are used to make estimates of saturated hydraulic conductivity. These properties are texture, structure, pore size, density, organic matter, and mineralogy. Exhibit 618-9 provides a guide for estimating saturated hydraulic conductivity from soil texture and bulk density with a guide for use with overriding conditions.(1) In making estimates, the soil characteristic that exerts the greatest control for
many soils is texture.
(430-VI-NSSH, 2010)

Part 618 – Soil Properties and Qualities 618-53
(2) The general relationships in Exhibit 618-9 are adjusted up or down depending on bulk density. Structure, pore size, organic matter, clay mineralogy, and other observations within the soil profile, such as consistency, dry layers in wet seasons, root mats or absence of roots, and evidence of perched water levels or standing water are good field indicators for adjusting estimates.
(3) Water movement through lithic and paralithic materials can be estimated from the guide in Exhibit 618-10.
(e) Entries. Enter the high, low, and representative values of saturated hydraulic conductivity for each horizon. The range of valid entries for saturated hydraulic conductivity is 0.00 to 705.00 µm s-1. Four decimal places are allowed.
618.51 Slope Aspect.
(a) Definition. Slope aspect is the direction toward which the surface of the soil faces.
(b) Significance. Slope aspect may affect soil temperature, evapotranspiration, winds received, and snow accumulation.
(c) Measurement. Slope aspect is measured clockwise from true north as an angle between 0 and 360 degrees..
(d) Entries. Enter the slope aspect counter-clockwise, slope aspect clockwise, and slope aspect representative for each map unit component. The minimum is 0 degrees and the maximum is 360 degrees.(1) Slope aspect counter-clockwise is one end of the range in characteristics
for the slope aspect of a component. This end of the range is expressed in degrees measured clockwise from true north, but in the direction counter-clockwise from the representative slope aspect.
(2) Slope aspect clockwise is one end of the range in characteristics for the slope aspect of a component. This end of the range is expressed in degrees measure clockwise from true north, and in the direction clockwise from the representative slope aspect.
(3) Slope aspect representative is the common, typical, or expected direction toward which the surface of the soil faces, measured in degrees clockwise from true north.
618.52 Slope Gradient.
(a) Definition. Slope gradient is the difference in elevation between two points and is expressed as a percentage of the distance between those points. For example, a difference in elevation of 1 meter over a horizontal distance of 100 meters is a slope of 1 percent.
(b) Significance. Slope gradient influences the retention and movement of water, the potential for soil slippage and accelerated erosion, the ease with which machinery can be used, soil-water states, and the engineering uses of the soil.
(c) Measurement. Slope gradient is usually measured with a hand level or clinometer. The range is determined by summarizing data from several sightings.
(430-VI-NSSH, 2010)

Part 618 – Soil Properties and Qualities 618-54
(d) Entries. Enter the high, low, and representative values to represent the range of slope gradient as a percentage for the map unit component. Entries for high and low are whole number integers and range from 0 to 999. Entries for representative values below 1 percent can be given in tenths of a percent.
618.53 Slope Length.
(a) Definition. Slope length is the horizontal distance from the origin of overland flow to the point where either the slope gradient decreases enough that deposition begins or runoff becomes concentrated in a defined channel. Reference Agriculture Handbook 703.
(b) Significance. Slope length has considerable control over runoff and potential accelerated water erosion. Slope length is combined with slope gradient in erosion prediction equations to account for the effect of topography on erosion.
(c) Measurement. Slope length is measured from the point of origin of overland flow to the point where the slope gradient decreases enough that deposition begins or runoff becomes concentrated in a defined channel. In cropland defined channels are usually ephemeral gullies, in rare instances, near a field edge they may be a classic gully or stream. Surface runoff will usually concentrate in less than 400 feet (120 meters), although longer slope lengths of up to 1,000 feet are occasionally found. The maximum distance allowed in erosion equations is 1000 feet (305 meters). Conversion to the horizontal distance is made in the conversion process within the equation model.Assume no support practices. Ignore practices such as terraces or diversions. Slope length is best determined by pacing or measuring in the field. Do not use contour maps to estimate slope lengths unless contour intervals are one foot or less. Slope lengths estimated from contour maps are usually too long because most maps do not have the detail to indicate all ephemeral gullies and concentrated flow areas that end the slope lengths. Refer to figures -1 through 4-10 within Ag. Handbook 703 for more landscape guidance.
(d) Entries. Enter the high, low, and representative values for the range for each map unit component. Enter a whole number that represents the length in meters from the point of origin of overland flow to the point of deposition or concentrated flow of the slope on which the component lies. The slope length may be fully encompassed within one map unit or it may cross several map units. The minimum value is 0, and the maximum value used in erosion equations is 305 meters.
618.54 Sodium Adsorption Ratio.
(a) Definition. Sodium adsorption ratio (SAR) is a measure of the amount of sodium (Na) relative to calcium (Ca) and magnesium (Mg) in the water extract from saturated soil paste. It is the ratio of the Na concentration divided by the square root of one-half of the Ca + Mg concentration. SAR is calculated from the equation:
SAR = Na / [(Ca + Mg)/2]0.5
(430-VI-NSSH, 2010)

Part 618 – Soil Properties and Qualities 618-55
(b) Significance. Soils that have values for sodium adsorption ratio of 13 or more may have an increased dispersion of organic matter and clay particles, reduced saturated hydraulic conductivity and aeration, and a general degradation of soil structure.
(c) Measurement. The concentration of Na, Ca, and Mg ions is measured in a water extract from saturated soil paste. The procedure is method 5 described in Soil Survey Investigations Report No. 42, Soil Survey Laboratory Methods Manual, Version 4.0, November 2004, USDA, NRCS.
(d) Entries. Enter the high, low, and representative values to represent the range of sodium adsorption ratio as integers for each horizon. Enter "0" where the SAR is negligible. The allowable range for entries is 0 to 9999.
618.55 Soil Erodibility Factors, USLE, RUSLE2.
(a) Definition. Soil erodibility factors (Kw) and (Kf) quantify soil detachment by runoff and raindrop impact. These erodibility factors are indexes used to predict the long-term average soil loss, from sheet and rill erosion under crop systems and conservation techniques. Factor Kw applies to the whole soil, and Kf applies only the fine-earth fraction, which is the <2.0 mm fraction. The procedure for determining the Kf factor is outlined in Agriculture Handbook No. 703, Predicting Soil Erosion by Water: A Guide to Conservation Planning With the Revised Universal Soil Loss Equation (RUSLE), USDA, ARS, 1997. The K factors in Hawaii and the Pacific Basin were extrapolated from local research. The nomograph was not used.
(b) Classes. Experimentally measured Kw factors vary from 0.02 to 0.69. For soil interpretations, the factors are grouped into 14 classes. The classes are identified by a representative class value as follows: .02, .05, .10, .15, .17, .20, .24, .28, .32, .37, .43, .49, .55, and .64.
(c) Significance. Soil erodibility factors Kw or Kf are used in erosion prediction equations USLE and RUSLE. Soil properties that influence rainfall erosion are (1) those that affect infiltration rate, movement of water through the soil, and water storage capacity and (2) those that affect dispersion, detachability, abrasion, and mobility by rainfall and runoff. Some of the most important properties are texture, organic matter content, structure size class, and subsoil saturated hydraulic conductivity.
(d) Estimates. The Kw factor is measured by applying a series of simulated rainstorms on freshly tilled plots. Direct measurement of the Kw is both costly and time consuming and has been conducted only for a few selected soils.Reliable Kf estimates are obtained from the soil erodibility nomograph on page 11 of Agricultural Handbook 537, which is reproduced in Exhibit 618-12, or by using the soil erodibility equation. The nomograph integrates the relationship between the Kf factor and five soil properties: (1) percent silt plus very fine sand, (2) percent sand greater than 0.10 mm, (3) organic matter content, (4) structure, and (5) saturated hydraulic conductivity. The soil erodibility equation which follows also provides an estimate of Kf.
K factor = {2.1 X M1.14 X 10-4 X (12-a)+3.25 X (b-2)+2.5 X (c-3)}/100(430-VI-NSSH, 2010)

Part 618 – Soil Properties and Qualities 618-56
where: M = (percent si + percent vfs) X (100 - percent clay)Example: For a soil with 29.0% silt, 12.3% very fine sand, and 36% clayM = (29.0+12.3) X (100-36) = 2,643.20.a = percent organic matter (nearest whole value) (use worse case organic matter assuming long term cultivation) (0, 1, 2, 3, or 4)b = structure code (1, = very fine granular, 2, = fine granular, 3, = med or coarse granular, or 4 = blocky, platy, or massive)c = profile saturated hydraulic conductivity code (1, 2, 3, 4, 5, or 6). Use the layer with the lowest Ksat RV in the permeability control section. The permeability control section is the zone from the top of the mineral soil layer being evaluated to a depth of 50cm below the top of that soil layer, but not to exceed a profile depth of 200cm. The permeability control section guarantees that a specific zone is only considered relative to the mineral soil layer being evaluated. Include the permeability of any bedrock or other non-soil layers in the permeability control section. Note that the codes were initially established using the 1951 Soil Survey Manual. The codes correspond to the following saturated hydraulic conductivity ranges:
Profile Permeability Class Code
Permeability Class of 1951
Saturated hydraulic
conductivity range μm/sec
Saturated hydraulic
conductivity classes 1993
6 Very slow <0.30 very low to mod. low
5 Slow 0.30 to <1.20 mod. low4 Slow to Mod. 1.20 to <4.80 mod. high3 Moderate 4.80 to <15.00 mod. high to high2 Mod. to Rapid 15.00 to
<30.00high
1 Rapid ≥ 30.00 high to very high
The nomograph and the equation accuracy has been demonstrated for a large number of soils in the United States. However, the nomograph and the equation may not be applicable to some soils having properties that are uniquely different from those used in developing the nomograph. For example, the nomograph does not accurately predict Kf factors for certain Oxisols in Puerto Rico or the Hawaiian Islands, some soils with Andic properties, organic soil materials, low activity clays, and some calcareous or micaceous soils. In these cases, Kf factors are estimated from the best information at hand and knowledge of the potential for rainfall erosion. See Agricultural Handbook 703 for more information.When using the nomograph and the equation, care should be taken to select the organic matter curve that is most representative of the horizon being considered,
(430-VI-NSSH, 2010)

Part 618 – Soil Properties and Qualities 618-57
assuming long term cultivation. For horizons that have organic matter >4 %, use the 4 % curve. Do not extrapolate between whole values when using the equation.Rock or pararock fragments are not taken into account in the nomograph or the equation. If fragments are substantial, they have an armoring effect. Pararock fragments are assumed to break down with cultivation. If a soil has fragments, the Kw factor should reflect the degree of protection afforded by those fragments. Guidelines for determining Kw factors are as follows:(1) Use the nomograph in Exhibit 618-12 or the equation to determine the Kf factor
for material less than 2 mm in diameter.(2) Use Exhibit 618-11 to convert the weight percentage of the material greater
than 3 inches and of the material less than 3 inches, which is retained on the #10 sieve, to a volume percent of the whole soil that is rock fragments, specifically rock fragments >2 mm in diameter. First, find the volume percentage greater than 3 inches on the whole soil basis by taking the midpoint of the weight percentage of material greater than 3 inches and comparing the weight percentage in column 2 to the volume percentage in column 1. On that same line, move to the right to the weight percent passing #10 sieve column to find the volume percent gravel, specifically rock fragments that are 2 to 75 mm in size, on a whole soil basis. Then add the volume greater than 3 inches from column 1 and the volume gravel to find the volume percent of the whole soil that is rock fragments. Add in the percent pararock fragments on noncultivated areas.
(3) Use Exhibit 618-13 to convert the Kf value of the fraction less than 2 mm derived from the nomograph in Exhibit 618-12 or from the equation, to a Kw factor adjusted for volume of rock fragments. The Kw factor is adjusted only when fragment values are ≥ 15%.If the soil on site contains more or less rock fragments than the mean of the range reported, adjustments can be made in Kf by using Exhibit 618-13. Convert the estimates of rock fragments from weight percentages to volume percentages using Exhibit 618-11, then enter Exhibit 618-13 in line with this volume percentage and find in that line the nearest value to the Kf factor. Within that column, read the Kw factor on the line with the percentage of rock fragments of the soil for which you are making the estimate. Round the factor to the closest factor class. This is the new Kw factor adjusted for rock fragments on site.
(e) Entries. Enter the coordinated Kw and Kf classes for each horizon posted, except organic horizons.Acceptable entries for Kw and Kf are .02,. 05, .10, .15, .17, .20, .24, .28, .32, .37, .43, .49, .55, and .64. Soil textures that do not have rock fragments have equal Kw and Kf factors. Where rock fragments exist, Kw is always less than Kf. For example:
Depth (in)
USDA Texture Kw Kf
0-5 GR-L 0.20
0.32
0-5 L 0.3 0.32
(430-VI-NSSH, 2010)

Part 618 – Soil Properties and Qualities 618-58
20-5 GRV-L 0.1
00.32
0-46 CL 0.28
0.28
46-60 SL 0.20
0.20
Soils that have similar properties and erosivity should group in similar K classes.
618.56 Soil Erodibility Factors for WEPP.
Soil erodibility factors for WEPP include Interrill Erodibility (Ki), Rill Erodibility (Kr), and Critical Hydraulic Shear (Tc). These erodibility factors for the WEPP erosion model quantify the susceptibility of soil detachment by water. These erodibility factors predict the long-term average soil loss, which results from sheet and rill erosion under various alternative combinations of crop systems and conservation techniques.Soil erodibility factors Ki, Kr, and Tc are factors in a continuous simulation computer model which predicts soil loss and deposition on a hillslope. Reference the NSERL Report No. 9, USDA, ARS National Erosion Research Laboratory, August 1994, documentation version 94.7. This procedure does not include data for oxidic and andic materials.These values are quantitative and calculated using experimental equations. They are different than soil erodibility factors for USLE and RUSLE.(a) Interrill erodibility (Ki).
(1) Definition. Interrill erodibility (Ki) is the susceptibility of detachment and transport of soil by water. It is the susceptibility of the soil to movement to a rill carrying runoff.
(2) Significance. Interrill erodibility (Ki) is a measure of sediment delivery rate to rills as a function of rainfall intensity. The Ki values for soil need to be adjusted for factors that influence the resistance of soil to detachment, such as live and dead root biomass, soil freezing and thawing, and mechanical and livestock compaction.
(3) Measurement. Interrill erodibility (Ki) measurements result from rainfall simulation experiments. These experiments require specialized equipment and specialized measurement techniques in a research setting.
(4) Calculations. Use the following equations:
For cropland soils with 30 percent or more sand:Ki = 2,728,000 + 192,100 X (% very fine sand)
Very fine sand must be less than or equal to 40 percent; if very fine sand is greater, use 40 percent.
(430-VI-NSSH, 2010)

Part 618 – Soil Properties and Qualities 618-59
For cropland soils with less than 30 percent sand:Ki = 6,054,000 - 55,130 X (% clay)
Clay must not exceed 50 percent: if clay is greater, use 50 percent.
(5) Entries. The computer generates entry values using the above formulas. Allowable Ki values range from 2,000,000 to 11,000,000.
(b) Rill erodibility (Kr).(1) Definition. Rill erodibility (Kr) is a measure of the susceptibility of a soil to
detachment by flowing water. As a rule as rill erodibility (Kr) increases, rill erosion rates increase.
(2) Significance. Rill erodibility (Kr) is a measure of soil susceptibility to detachment concentrated flow, and is often defined as the soil detachment per unit increase in shear stress of clear water flow. Rate of soil detachment in rills varies because of a number of factors including soil disturbance by tillage, living root biomass, incorporated residue, fragments, soil consolidation, freezing and thawing, and wheel and livestock compaction.
(3) Measurement. Rill erodibility (Kr) measurements result from simulated rainfall and simulated flow in a research setting. These experiments require specialized equipment and specialized measurement techniques.
(4) Calculations. Use the following equations:
For cropland soils with 30 percent or more sand:Kr = 0.00197 + 0.00030 X (% very fine sand) + 0.03863 X EXP(-1.84 X ORGMAT)
Where:Organic Matter (ORGMAT) is the organic matter in the surface soil
(assuming that organic matter equals 1.724 times organic carbon content). Organic matter must exceed 0.35 percent; if less, use 0.35 percent.
Very fine sand must be less than or equal to 40 percent; if greater, use 40 percent.
For cropland soils with less than 30 percent sand:Kr = 0.0069 + 0.134 X EXP(-0.20 X % Clay)
Where:Clay must be 10 percent or greater; if less, use 10 percent.
(5) Entries The computer generates the value by using the above formulas. Allowable Kr values range from 0.002 to 0.045 s/m.
(c) Critical shear stress (Tc).(1) Definition. Critical shear stress (Tc) is the hydraulic shear that must be
exceeded before rill erosion can occur. (430-VI-NSSH, 2010)
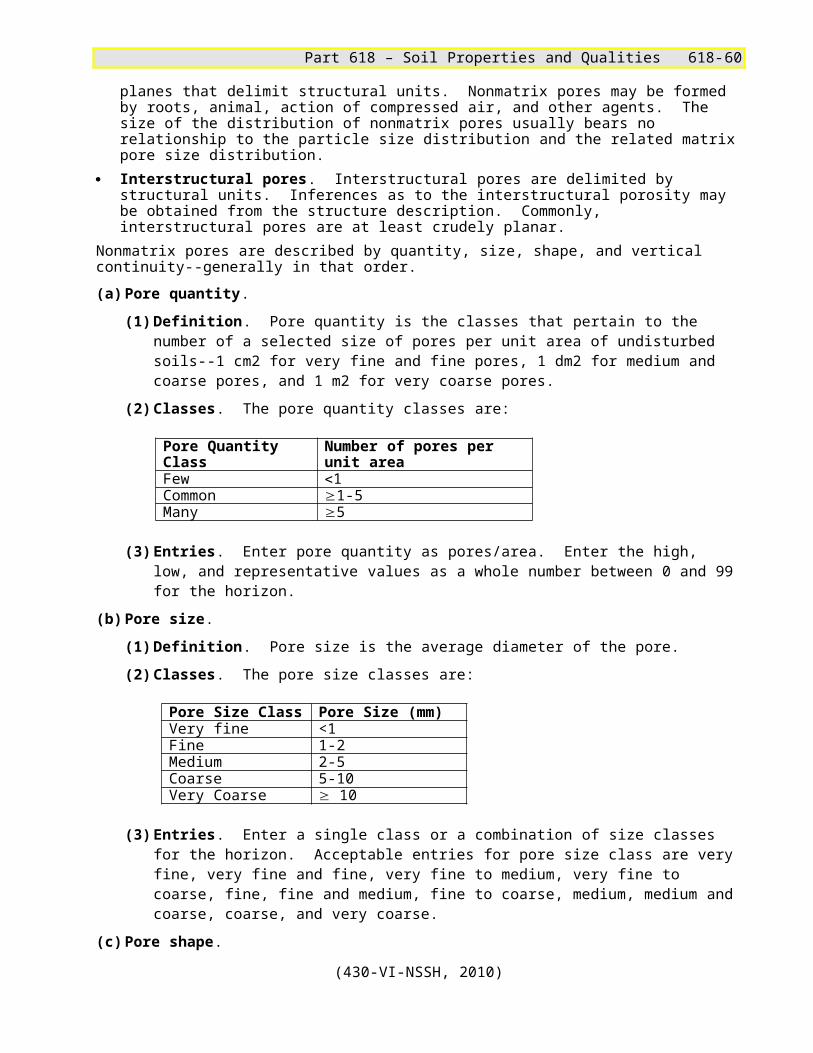
Part 618 – Soil Properties and Qualities 618-60
(2) Significance. Critical shear stress (Tc) is an important term in the rill detachment equation, and is the shear stress below which no soil detachment occurs. Critical shear stress (Tc) is the shear intercept on a plot of detachment by clear water versus shear stress in rills.
(3) Measurements. Critical hydraulic shear (Tc) is a derived variable measured in a specialized research project.
(4) Calculations. Use the following equations:
For cropland soils with 30 percent or more sand:Tc = 2.67 + 0.065 X (% clay) - 0.058 X (% very fine sand)
Where:Very fine sand must be less than or equal to 40 percent; if greater, use 40
percent.
For cropland soils with less than 30 percent sand:Tc = 3.5
(5) Entries. No manual entry is needed. The value will be computer generated using the above formulas. Allowable Tc values range from 1 and 6 N/m2.
618.57 Soil Moisture Status.
(a) Definition. Soil moisture status is the mean monthly soil water state at a specified depth.
(b) Classes. The water state classes used in soil moisture status are dry, moist, and wet. These classes are defined as follows:
Water State Class
Definition
Dry 15 bar suctionMoist < 15 bar to 0.0 bar (moist plus
nonsatiated wet)Wet < 0.0 bar; free water present (satiated wet)
(c) Significance. Soil moisture status is a recording of the generalized water states for a soil component. Soil moisture greatly influences vegetation response, root growth, excavation difficulty, albedo, trafficability, construction, conductivity, soil chemical interactions, workability, chemical transport, strength, shrinking and swelling, frost action, seed germination, and many other properties, qualities, and interpretations. Soil moisture states are significant to soil taxonomic classification, wetland classification, and other classification systems. The recording of soil moisture states helps to document the soil classification as well as convey information for use in crop and land management models.
(d) Measurement. Soil water status can be measured using tensiometers or moisture tension plates. Soil water status also can be field estimated. Chapter 3 of the Soil Survey Manual provides more information. It is important to note that the 3 water
(430-VI-NSSH, 2010)

Part 618 – Soil Properties and Qualities 618-61
state classes and 8 subclasses described in the Soil Survey Manual are used to describe the moisture state at a point in time for individual pedons (spatial and temporal point data), while the water state classes discussed here are used for estimating the mean monthly aggregated moisture conditions for a map unit component. As a consequence, only 3 classes are used, and the definitions for the moist and wet classes are modified from the Soil Survey Manual definitions. The wet class used here includes only the satiated wet class and corresponds to a free water table. The moist class is expanded to include the nonsatiated wet class of the Soil Survey Manual.Dry is separated from moist at 15 bar suction. Wet satiated has a tension of 0.0 bar or less (zero or positive pore pressure)Changes in natural patterns of water movement from dams and levees are considered in evaluating and entering soil moisture status. Infiltration, saturated hydraulic conductivity, and organic matter, which affect soil moisture movement, are strongly impacted by land cover and land use. Land use/land cover should be given consideration as a mapping tool in separating map units or map unit components. The differences in soil moisture status from land use/land cover differences constitute a difference in soil properties. However, conservation practices, such as irrigation and fallow, alter the soil moisture status but are not considered in the map unit component data. Use-dependent databases may allow entries for these altered states in the future. Permanent installations, such as drainage ditches and tile, affect soil moisture status, and the drained condition should be reflected in the soil moisture status entries for map unit components that are mapped as “drained.” Undrained areas are mapped as “undrained” components and the entries for soil moisture status reflect the undrained condition.Irrigation and drainage canals are shown on soil maps; their effects on the soil should be shown in the properties of the soils in mapping and in the property records. Soils that are now wet because of excessive irrigation and leaking canals should be mapped, and their properties should reflect the current soil moisture status.
(e) Guiding Concepts (1) The intent is to describe a mean moisture condition, by month, for a soil
component. Layer depths may or may not be the same as horizon depths in the component horizon table. Layers define the zone having the same soil moisture state. If the soil is wet throughout 0 to 200 cm, then one entry (wet) is made for 0 to 200 cm for that month.
(2) For frozen soils enter the appropriate soil moisture state that the soil would have if thawed. For example, if the soil is frozen and you determine it is wet when thawed, enter wet.
(3) The layers can be subdivided into various soil moisture states as needed, but remember that these are monthly averages for the extent of the component across the landscape.
(4) The entries are expected to come from the best estimates that local knowledge can provide. If local knowledge is supported by data, so much the better. The
(430-VI-NSSH, 2010)

Part 618 – Soil Properties and Qualities 618-62
information as aggregated data is not expected to be exact but to be generalized and to reflect an average condition.
(5) Entries for RV are to reflect the conditions of a “normal year."(6) Make entries for each month by layer. Enter the condition that dominates for
the month. This is the condition for more than 15 days on the long-term average. The low and high values represent the depth range within the component for the normal year; they are not to represent the extremes, such as years of drought.
(7) If the depth to free-water fluctuates during the month, use the depth for the average between the high and low level.
(8) Exhibit 618-18 contains examples of entries.(f) Entries. Enter the soil moisture status with dry, moist, or wet, for each soil layer
for each month. Enter only one soil moisture state within a given layer. The number of layers depends upon the number of changes of soil moisture status in the profile.Enter the value for soil moisture depth to top that represents the distance, in whole centimeters, from the soil surface to the top of each soil layer for each month.
618.58 Soil Slippage Hazard.
(a) Definition. Soil slippage hazard is the possibility that a mass of soil will slip when these conditions are met: 1) vegetation is removed, 2) soil water is at or near saturation, and 3) other normal practices are applied. Increasing the hazard of slippage but not considered in this rating are: 1) the undercutting lower portions or loading the upper parts of a slope or 2) altering the drainage or offsite water contribution to the site such as through irrigation.The publication "Landslides Investigation and Mitigation Special Report 247 Transportation Research Board National Research Council 1996” provides additional information on landscape slippage.
(b) Significance. Slippage is an important consideration for engineering practices, such as constructing roads and buildings, and for forestry practices.
(c) Estimates. Soil slippage hazard classes are estimated by observing slope; lithology, including contrasting lithologies; strike and dip; surface drainage patterns; and occurrences of such features as slip scars and slumps.
(d) Guides. Use Exhibit 618-17 "Key Landforms and Their Susceptibility to Slippage" as a guide for rating soil slippage hazard.
(e) Entries. Enter one of the following classes:High - (Unstable)Medium - (Moderately unstable)Low - (Slightly unstable to stable)
(430-VI-NSSH, 2010)

Part 618 – Soil Properties and Qualities 618-63
618.59 Soil Temperature.
(a) Definition. Soil temperature is the mean monthly soil temperature at the specified depth. (The average of the daily high and daily low temperature for the month.)
(b) Significance. Soil temperature is important to many biological and physical processes that occur in the soil. Plant germination and growth are closely related to soil temperature. Cold soil temperatures effectively create a thermal pan in the soil. Roots cannot uptake moisture or nutrients below the threshold temperatures specific to plant species. Chemical reactions are temperature sensitive. Pesticide breakdown, residue breakdown, microbiological activity in the soil, and nutrient conversions relate to soil temperature. Soil temperature gradients affect soil moisture and salt movement. Soil temperatures below freezing especially affect soil saturated hydraulic conductivity, excavation difficulty, and construction techniques. Soil temperature is used in soil classification and hydric soil determinations. Additional information is provided in Chapter 3 of the Soil Survey Manual.
(c) Estimates. Soil temperature according to depth can be estimated from measured soil temperatures in the vicinity. Air temperature fluctuations, soil moisture, aspect, slope, color, snow cover, plant cover, and residue cover affect soil temperature. Estimates of soil temperature should take these factors into account when soil temperatures are extrapolated from one soil map unit component to another.
(d) Measurement. Soil temperature can be measured by many types of thermometers, including mercury, bimetallic, thermisters, and thermocouples. Many types of thermometers can be configured for remote, unattended operation.
(e) Entries. Each soil temperature layer consists of a zone bounded by a five degree increment; e.g., 0-5, 5-10, 10-15. The allowable range is -10.0 to 50.0 degrees Celsius. The number of layers depends upon the number of changes of soil temperature status in the profile.Enter the value for soil temperature mean monthly using the average soil temperature Celsius increment that corresponds to each soil temperature layer for each month.Enter the value for soil temperature depth to top that represents the distance, in centimeters, from the soil surface to the top of each soil temperature layer for each month. Enter the value for soil temperature depth to bottom that represents the distance, in centimeters, from the soil surface to the bottom of each soil temperature layer for each month.
618.60 Subsidence, Initial and Total.
(a) Definition. Subsidence is the decrease in surface elevation as a result of the drainage of wet soils that have organic layers or semifluid, mineral layers. Initial subsidence is the decrease of surface elevation that occurs within the first 3 years of the drainage of these wet soils. Total subsidence is the potential decrease of surface elevation as a result of the drainage of these wet soils.
(430-VI-NSSH, 2010)

Part 618 – Soil Properties and Qualities 618-64
(b) Significance. The susceptibility of soils to subsidence is an important consideration for organic soils that are drained. If these soils are drained for community development, special foundations are needed for buildings. Utility lines, sidewalks, and roads that lack special foundations may settle at different rates, thus causing breakage, high maintenance costs, and inconvenience. If the soils are drained for farming, the long-term effects of subsidence, the possible destruction of land if it subsides below the water table, and possible legal implications if the soils are in wetlands must be considered.Subsidence, as a result of drainage is attributed to (1) shrinkage from drying, (2) consolidation because of the loss of ground-water buoyancy, (3) compaction from tillage or manipulation, (4) wind erosion, (5) burning, and (6) biochemical oxidation. The first three factors are responsible for the initial subsidence that occurs rapidly, specifically, within about 3 years after the water table is lowered. After the initial subsidence, a degree of stability is reached and the loss of elevation declines to a steady rate primarily because of oxidation. The oxidation and subsidence continues at this slower rate until stopped by the water table or underlying mineral material. The rate of subsidence depends on (1) ground-water depth, (2) amount of organic matter, (3) kind of organic matter, (4) soil temperature, (5) pH, and (6) biochemical activity.
(c) Estimates. A number of studies have been made to measure actual subsidence. Other useful studies have measured the bulk density of organic soils after drainage. Based on these studies, some general guidelines can be given for initial and total subsidence.Initial subsidence, generally is about half of the depth to the lowered water table or to mineral soil, whichever is shallower. It occurs within about 3 years after drainage. Total subsidence is the total depth to the water table or the thickness of the organic layer, whichever is shallower. It is rarely reached except where organic layers are thin or where drainage systems have been installed for a long time.
(d) Measurement. After organic soils have been drained and cultivated for a number of years, they reach a nearly steady rate of subsidence that is reflected by the rather stable bulk density. Unpublished studies by the Soil Survey Laboratory, have shown that the bulk density of the organic component, such as that with the percent mineral calculated out, stabilizes at around 0.27 g/cc for surface layers and 0.18 g/cc for subsurface layers. These values can be used to calculate the amount of subsidence at some time in the future as compared to the thickness of soil at the time of observation or measurement. The procedure is as follows:(1) Sample the surface and subsurface layers for field state bulk density. Methods
are described in the Handbook of Soil Survey Investigations Field Procedures, I 4-2, 1971, USDA, SCS, and Method 4A as described in Soil Survey Investigations Report No. 42, Soil Survey Laboratory Methods Manual, Version 4.0, November 2004, USDA, NRCS.
(2) Calculate out the weight contribution of the mineral component to obtain the bulk density of the organic component (DbOM). This manipulation allows bulk densities to be on a common base so that various layers can be compared. The formula for the computation is as follows:DbOM = Db (1 - percent mineral/100), where Db is the field state bulk density.
(430-VI-NSSH, 2010)

Part 618 – Soil Properties and Qualities 618-65
(3) Calculate the subsidence percent (SP) for surface and subsoil horizons as follows:For surface horizons:
SP = 100 - [(DbOM/0.27) x 100]For subsurface horizons:
SP = 100 - [(DbOM/0.18) x 100]Where DbOM is obtained from step (2).
(4) Convert initial subsidence percent to depth of subsidence in inches as follows:Where:S = SPsur x Tsur + SPsub x TsubS = depth of subsidence in inchesSPsur = subsidence percent of the surface horizonTsur = thickness of the surface horizonSPsub = subsidence percent of the subsurface horizonTsub = thickness of the subsurface horizon above the water table or the
mineral soil, whichever is shallower(e) Entries. Enter the high, low, and representative values, in whole numbers that
represent the range for initial and total subsidence in centimeters for the map unit component. Allowable entries range from 0 to 999. If subsidence is not a concern, enter "0".
618.61 Sum of Bases.
(a) Definition. Sum of bases is the sum of NH4OAc extractable bases (pH7): calcium, magnesium, potassium and sodium ions in the < 2mm soil fraction.
(b) Significance. Sum of bases is important for soil classification and for certain evaluations of soil nutrient availability or of the effect of waste additions to the soil.
(c) Measurement. Sum of bases is determined by method 4B4a1, as outlined in Soil Survey Investigations Report No. 42, Soil Survey Laboratory Methods Manual, Version 4.0, November 2004, USDA, NRCS.
(d) Entries. Enter the range of sum of bases as milliequivalents per 100 grams (meq 100g-1) of soil for the horizon. Valid entries range from 0.0 to 300.0. Tenths are allowed.
618.62 Surface Fragments.
(a) Definition. Surface fragments are unattached, cemented pieces of bedrock or bedrock-like material 2 mm or larger that are exposed at the surface of the soil.Surface fragments can be either rock fragments or pararock fragments, which are defined in part 618.28. Vegetal material is not included.
(b) Surface fragment cover percent.(430-VI-NSSH, 2010)
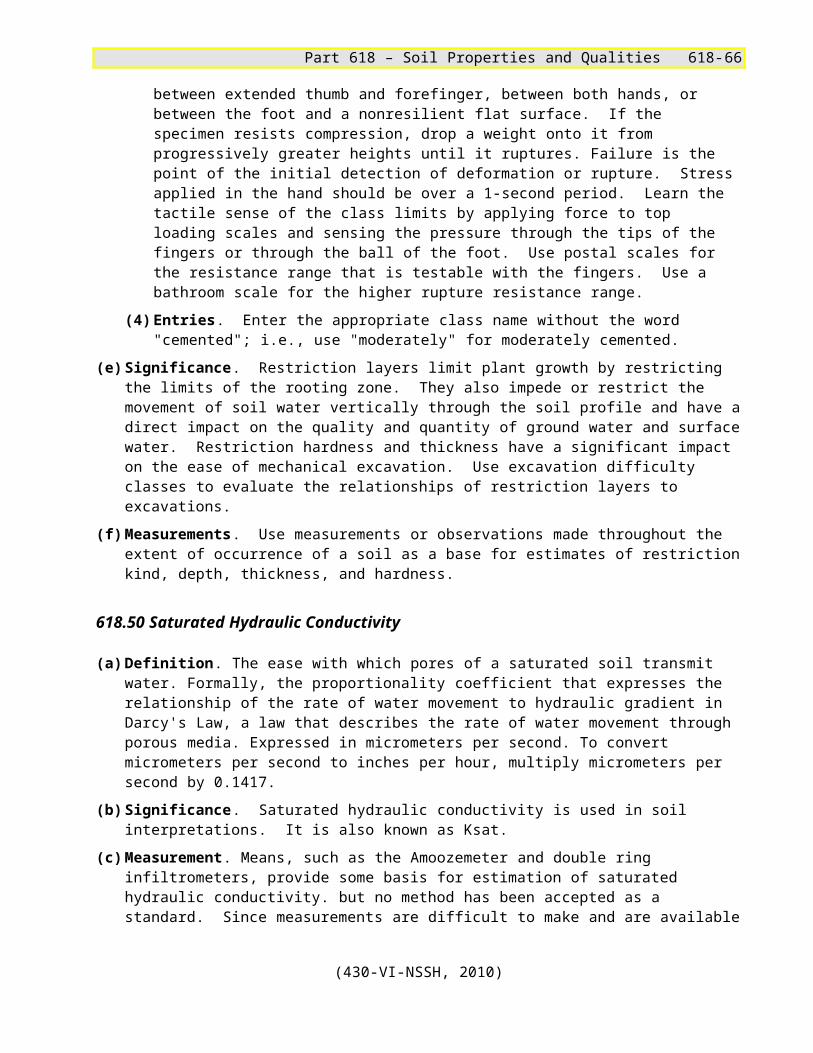
Part 618 – Soil Properties and Qualities 618-66
(1) Definition. Surface fragment cover percent is the percent of ground covered by fragments 2 mm or larger.
(2) Significance. Fragments on the soil surface are used as map unit phase criteria and greatly affect use and management of the soil. They affect equipment use, erosion, excavation, and construction. They act as a mulch, slowing evaporation and armoring the soil from rainfall impact. They also affect the heating and cooling of soils.
(3) Estimates. An estimation of cover by surface fragments can be made visually without quantitative measurement, by transect techniques, or by some combination of visual and quantitative measures. Chapter 3 of the Soil Survey Manual provides more information.
(4) Entries. Enter the high, low, and representative values for the percent of the surface covered by each size class and the kind of fragment described for each map unit component.
(c) Surface fragment kind.(1) Definition. Surface fragment kind is the lithology/composition of the surface
fragments 2mm or larger.(2) Significance. Fragments vary according to their resistance to weathering.
Consequently, fragments of some lithologies are more suited than others for use as building stone, road building material, or riprap to face dams and stream channels.
(3) Entries. Enter the appropriate class name for the kind of fragment present. More than one choice may be entered. The class names can be found in the NASIS data dictionary.
(d) Surface fragment size.(1) Definition. Surface fragment size is the size based on the multiaxial
dimensions of the surface fragments.(2) Significance. The size of surface fragments is significant to the use and
management of the soil. The adjective form of fragment size is used as phase criteria for naming map units. It affects equipment use, excavation, construction, and recreational uses.
(3) Classes. Classes of surface fragment size are subdivided according to flat and non-flat fragments.Flat fragment classes are:
Flat fragment class Length of fragment (mm)
Channers 2-150 Flagstones 150-380 Stones 380-600 Boulders 600
Non-flat fragment classes are:(430-VI-NSSH, 2010)

Part 618 – Soil Properties and Qualities 618-67
Non-flat fragment class Diameter (mm)Gravel 2-75 Fine gravel 2-5 Medium gravel 5-20 Coarse gravel 20-75 Cobbles 75-250 Stones 250-600 Boulders 600
Gravel is a collection of fragments having a diameter ranging from 2 to 75 mm. Individual fragments in this size range are properly referred to as pebbles, not “gravels”. For fragments that are less than strongly cemented, "para" is added as a prefix to the above terms; i.e., paracobbles or fine paragravel.
(4) Entries. Enter the minimum, maximum, and representative values, in whole numbers, of each size class described. Entries are in millimeters and range from 2 to 3,000 mm.
(e) Mean distance between rocks.(1) Definition. Mean distance between rocks is the average distance between
surface stones and/or boulders.(2) Significance. The mean distance between rocks is a field clue for naming
stony or bouldery map units. The closer the distance, the more equipment limitations for harvesting forestland or soil cultivation.
(3) Estimates. Table 3-12 of the Soil Survey Manual shows the distance between stones and boulders if the diameter is 0.25 m, 0.6 m, or 1.2 m. This table should be used with caution because stones and boulders will rarely be equally spaced or have the same diameter.
(4) Entries. Enter the high, low, and representative values for the mean distance in hundredths of meters.
(f) Surface fragment roundness.(1) Definition. Surface fragment roundness is an expression of the sharpness of
edges and corners of surface fragments. (2) Classes. The surface fragment roundness classes are:
AngularSubangularSubroundedRoundedWell-rounded
(3) Entries. Enter the appropriate class name for the roundness class(es) present. A representative value may be designated.
(g) Surface fragment rupture resistance cemented.
(430-VI-NSSH, 2010)

Part 618 – Soil Properties and Qualities 618-68
(1) Definition. Surface fragment rupture resistance cemented is the rupture resistance of a surface fragment of specified size that has been air dried and then submerged in water.
(2) Measurements. Procedures and classes of cementation are listed with the rupture resistance classes. Classes are described for similar specimens about 25-30 mm on edge, which are air-dried and then submerged in water for at least 1 hour. The specimen is compressed between extended thumb and forefinger, between both hands, or between the foot and a hard flat surface. If the specimen resists compression, a weight is dropped onto it from progressively greater heights until it ruptures. Failure is considered at the initial detection of deformation or rupture. Stress applied in the hand should be over a 1-second period. The tactile sense of the class limits may be learned by applying force to top loading scales and sensing the pressure through the tips of the fingers or through the ball of the foot. Postal scales may be used for the resistance range that is testable with the fingers. A bathroom scale may be used for the higher rupture resistance range.
(3) Significance. The rupture resistance is significant where the class is strongly cemented or higher. These classes can impede or restrict the movement of soil water vertically through the soil profile and have a direct impact on the quality and quantity of ground water and surface water.
(4) Classes. The classes are:Extremely weakly Very weakly Weakly Moderately Strongly Very strongly Indurated
(5) Entries. Enter the appropriate class name(s) for each class of fragment present. A representative value may be designated.
(h) Surface fragment shape.(1) Definition. Surface fragment shape is a description of the overall shape of the
surface fragment.(2) Classes. The surface fragment shape classes are:
FlatNonflat
(3) Entries. Enter the appropriate class name(s) for each class present. Multiple entries may be made. A representative value may be designated.
618.63 T Factor.
(i) Definition. The T factor is the soil loss tolerance (in tons per acre). It is defined as the maximum amount of erosion at which the quality of a soil as a medium for plant growth can be maintained. This quality of the soil to be maintained is threefold in focus. It includes maintaining (1) the surface soil as a seedbed for plants, (2) the atmosphere-soil interface to allow the entry of air and water into the
(430-VI-NSSH, 2010)

Part 618 – Soil Properties and Qualities 618-69
soil and still protect the underlying soil from wind and water erosion, and (3) the total soil volume as a reservoir for water and plant nutrients, which is preserved by minimizing soil loss. Erosion losses are estimated by USLE and RUSLE2.
(j) Classes. The classes of T factors are 1, 2, 3, 4, and 5.(k) Significance. Soil loss tolerances commonly serve as objectives for conservation
planning on farms. These objectives assist in the identification of cropping sequences and management systems that will maximize production and also sustain long-term productivity. T factors represent the goal for maximum annual soil loss.
(l) Guidelines. Conservation objectives for soil loss tolerance include on maintaining a suitable seedbed and nutrient supply in the surface soil, maintaining an adequate depth and quality of the rooting zone, and minimizing unfavorable changes in water status throughout the soil. A single T factor is assigned to each map unit component.
(m) Estimates. The T factor is assigned to soils without respect to land use or cover. T factors are assigned to compare soils and do not imply differences to vegetation response directly. Many of the factors used to assign a T factor are also important to vegetation response, but the T factor is not assigned to imply vegetation sensitivity to all vegetation. The general guideline given in Exhibit 618-14 is used to assign T factors but more specific criteria is used to select limiting soil properties.
(n) Entries. The estimated soil loss tolerance should be calculated from the soil properties and qualities posted in the database for each map unit component based generally on the guideline, given in Exhibit 618-14. Acceptable values are 1, 2, 3, 4, or 5.
618.64 Taxonomic Family Temperature Class.
(a) Definition. The soil temperature classes are part of the family level in Soil Taxonomy. They differ from "Soil temperature regimes," (Data Element: taxonomic temp regime), in that the cryic temperature regime is divided between the frigid and isofrigid classes based on differences in mean winter and mean summer soil temperatures. Soil temperature classes are based on mean annual and mean seasonal soil temperatures using the Celsius (centigrade) scale and taken either at a depth of 50 cm from the soil surface or at a lithic or paralithic contact, whichever is shallower.For soil families in Gelisols, Gelic suborders, and Gelic great groups the soil temperature classes, defined in terms of the mean annual soil temperature, are as follows:Hypergelic -10°C or lowerPergelic -4°C to -10°CSubgelic +1°C to -4°C For soil families that have a difference of 6°C or more between mean summer (June, July, and August in the northern hemisphere) temperature and mean winter (December, January, and February in the northern hemisphere) temperature, the
(430-VI-NSSH, 2010)

Part 618 – Soil Properties and Qualities 618-70
soil temperature classes, defined in terms of the mean annual soil temperature, are as follows:Frigid Lower than 8°CMesic 8°C to 15°CThermic 15°C to 22°CHyperthermic 22°C or higherFor soil families that have a difference of less than 6°C between the mean summer and mean winter soil temperatures, the soil temperature classes, defined in terms of the mean annual soil temperature, are as follows:Isofrigid Lower than 8°CIsomesic 8°C to 15°CIsothermic 15°C to 22°CIsohyperthermic 22°C or higher
(b) Significance. All soils have a taxonomic soil temperature class. Soil temperature classes are used as family differentiae in all orders in Soil Taxonomy. The names are used as part of the family name unless the criteria for a higher taxon carry the same limitation. The frigid or isofrigid class is implied in all cryic suborders and great groups, but the class is not used as part of the family name because it would be redundant.
(c) Estimates. Estimates of soil temperature classes are made with models that use climatic data including mean annual and mean seasonal air temperatures, precipitation, and evapotranspiration. Some models include snow cover, topographic, and vegetative inputs.
(d) Measurement. The Celsius (centigrade) scale is the standard. It is assumed that the temperature is that of a nonirrigated soil. The soil temperature classes are based on long term averages of mean annual and mean seasonal soil temperatures taken either at a depth of 50 cm from the soil surface or at a lithic or paralithic contact, whichever is shallower.
(e) Entries. Enter the appropriate soil temperature class from the following list:Frigid IsothermicHypergelic MesicHyperthermic PergelicIsofrigid SubgelicIsohyperthermic ThermicIsomesic
618.65 Taxonomic Moisture Class.
(a) Definition. Soil moisture classes refer to the soil moisture regimes defined in Soil Taxonomy. Soil moisture regimes are defined by the presence or absence either of
(430-VI-NSSH, 2010)

Part 618 – Soil Properties and Qualities 618-71
ground water or of water held at a tension of less than 1500 kPa, in the soil or in specific horizons, by periods of the year.
(b) Significance. All soils have a soil moisture regime. Soil moisture regimes are used as differentiae in all orders in Soil Taxonomy. Examples of the use of the moisture regime are for making interpretations for cropland agriculture, correlating soils to ecological sites, and determining suitability for wildlife habitat. The moisture regime of some soils is not apparent in the classification given in Soil Taxonomy. Ustolls and Xerolls, for example, can have an aridic moisture regime. Some soils can have more than one moisture regime. An example is a soil that meets the requirements of the aquic moisture regime in the wet season and also meets the requirements of the ustic regime.
(c) Estimates. Estimates of soil moisture regimes are made with models that use climatic data, including mean annual and mean seasonal air temperatures, precipitation, and evapotranspiration. Some models include topographic and vegetative inputs. The soil moisture control section, also defined in Soil Taxonomy, is used to facilitate estimation of soil moisture regimes. See Soil Survey Technical Note 9 for more guidance: http://soils.usda.gov/technical/technotes/
(d) Measurement. The soil moisture regimes are based on annual and seasonal soil moisture measurements taken in the soil moisture control section. The soil should not be irrigated or fallowed or influenced by other moisture altering practices.
(e) Entries. Enter the appropriate soil moisture regimes from the following list:Aquic PeraquicAridic (torric) UdicPerudic UsticXeric
618.66 Taxonomic Moisture Subclass. (Subclasses of soil moisture regimes.)
(a) Definition. Subclasses of soil moisture regimes are defined at the subgroup level in Soil Taxonomy. The criteria differ among the great groups. For example aquic, aridic, and udic are subclasses of the soil moisture regime in Haplustalfs. A subclass is entered for all soils in a great group that meet the subclass criteria, even if the subclass is not part of the taxonomic classification. For example, aquic, aridic, udic, or typic should be used as a subclass of the soil moisture regime in Lithic Haplustalfs if the criteria are met.
(b) Significance. Subclasses of soil moisture regimes are used at the subgroup level in all orders in Soil Taxonomy except Histosols. They typically indicate an intergrade between two moisture regimes that affect the use and management of the soil. Examples of the use of subclasses of soil moisture regimes are for making interpretations for cropland agriculture, correlating soils to ecological sites, and determining suitability for wildlife habitat.
(c) Estimates. Estimates of subclasses of soil moisture regimes are made with models that use climatic data, including mean annual and mean seasonal air temperatures, precipitation, and evapotranspiration. Some models include topographic and vegetative inputs. The soil moisture control section, also defined in Soil Taxonomy, is used to facilitate estimation of some subclasses of soil
(430-VI-NSSH, 2010)

Part 618 – Soil Properties and Qualities 618-72
moisture regimes. See Soil Survey Technical Note 9 for more guidance: http://soils.usda.gov/technical/technotes/
(d) Measurement. The subclasses of soil moisture regimes are based on annual and seasonal soil moisture measurements taken in the soil moisture control section. The soil should not be irrigated or fallowed or influenced by other moisture altering practices.
(e) Entries. Enter the appropriate subclass of soil moisture regimes from the following list:Aeric AnthraquicAquic Aridic (torric)Oxyaquic TypicUdic UsticXeric
618.67 Taxonomic Temperature Regime. (Soil Temperature Regimes.)
(a) Definition. Soil temperature regimes refer to the temperature regimes as defined in Soil Taxonomy.
(b) Significance. Soil temperature regimes are used as differentiae above the family level in all orders in Soil Taxonomy. (Soil temperature classes, defined above, are used as family differentiae.) Soil temperature regimes greatly affect the use and management of soils, particularly for the selection of adapted plants. Examples of the use of temperature regimes are for making interpretations for cropland agriculture, correlating soils to ecological sites, and determining suitability for wildlife habitat.
(c) Estimates. Estimates of soil temperature regimes are made with models that use climatic data including mean annual and mean seasonal air temperatures, precipitation, and evapotranspiration. Some models include topographic and vegetative inputs.
(d) Measurement. The soil temperature regime is based on mean annual and seasonal soil temperatures using the Celsius (centigrade) scale and taken either at a depth of 50 cm from the soil surface or at a lithic or paralithic contact, whichever is shallower.
(e) Entries. Enter the appropriate soil temperature regimes from the following list:Gelic IsofrigidCryic Isomesic Frigid Isothermic Mesic IsohyperthermicThermicHyperthermic
618.68 Texture Class, Texture Modifier, and Terms Used in Lieu of Texture.
(a) Definition. Texture class refers to the soil texture classification used by the U.S. Department of Agriculture as defined in the Soil Survey Manual. Soil texture is the relative proportion, by weight, of the particle separate classes finer than 2 mm in
(430-VI-NSSH, 2010)

Part 618 – Soil Properties and Qualities 618-73
equivalent diameter. The material finer than 2 mm is the fine-earth fraction. Material 2 mm or larger is rock or pararock fragments.
Click Interactive Online Soil Texture Calculator to enter the percent sand and clay, and let the calculator do the rest.
(b) Significance. Soil texture influences engineering works and plant growth and is used as an indicator of how soils formed. Soil texture has a strong influence on soil mechanics and the behavior of soil when it is used as construction or foundation material. It influences such engineering properties as bearing strength, compressibility, saturated hydraulic conductivity, shrink-swell potential, and compaction. Engineers are also particularly interested in rock and pararock fragments. Soil texture influences plant growth by its affect on aeration, the water intake rate, the available water capacity, the cation exchange capacity, saturated hydraulic conductivity, erodibility, and workability. Changes in texture as related to depth are indicators of how soils formed. When texture is plotted with depth, smooth curves indicate translocation and accumulation. Irregular changes in particle-size distribution, especially in the sand fraction, may indicate lithologic discontinuities, specifically, differences in parent material.
(c) Measurement. USDA texture can be measured in the laboratory by determining the proportion of the various size particles in a soil sample. The analytical procedure is called particle-size analysis or mechanical analysis. Stone, gravel, and other material 2 mm or larger are sieved out of the sample and do not enter into the analysis of the sample. Their amounts are measured separately. Of the remaining material smaller than 2 mm, the amount of the various sizes of sand is determined by sieving. The amount of silt and clay is determined by a differential rate of settling in water. Either the pipette or hydrometer method is used for the silt and clay analysis. Organic matter and dissolved mineral matter are removed in the pipette procedure but not in the hydrometer procedure. The two procedures are generally very similar, but a few samples, especially those with high organic matter or high soluble salts, exhibit wide discrepancies. The detailed procedures are outlined in Soil Survey Investigations Report No. 42, Soil Survey Laboratory Methods Manual, Version 4.0, November 2004, USDA, NRCS.
(d) Estimates. The determination of soil texture of the less than 2 mm material is made in the field mainly by feeling the soil with the fingers. The soil must be well moistened and rubbed vigorously between the fingers for a proper determination of texture class by feel. This method requires skill and experience but good accuracy can be obtained if the field soil scientist frequently checks his or her estimates against laboratory results. Many NRCS offices collect reference samples for this purpose. The content of particles larger than 2 mm cannot be evaluated by feel. The content of the fragments is determined by estimating the proportion of the soil volume that they occupy. Fragments in the soil are discussed in part 618.28.Each soil scientist must develop the ability to determine soil texture by feel for each genetic soil group according to the standards established by particle-size analysis. Soil scientists must remember that soil horizons that are in the same texture class but are in different subgroups or families may have a different feel. For example, natric horizons generally feel higher in clay than "non-natric" horizons. Laboratory analysis generally shows that the clay in natric horizons is
(430-VI-NSSH, 2010)

Part 618 – Soil Properties and Qualities 618-74
less than the amount estimated from the field method. The scientist needs to adjust judgment and not the size distribution standards.
(e) Entries. Texture is displayed by the use of five data elements in NASIS -- texture class, texture modifier, texture modifier and class, stratified texture flag, and terms used in lieu of texture.As many as four entries can be made for each horizon for each of these data elements. However, only one texture for a surface horizon should be entered for each component. Only use multiple textures if they interpret the same for the horizon. Only textures that represent complete horizons should be entered. A representative value is also identified for each horizon. This choice should match the representative values of the various soil particle size separates posted elsewhere in the database.
(f) Texture class.(1) Definition. Texture class is an expression, based on the USDA system of
particle sizes, for the relative portions of the various size groups of individual mineral soil grains less than 2 mm equivalent diameter in a mass of soil.Each texture class has defined limits for each particle separate class of mineral particles less than 2 mm in effective diameter. The basic texture classes, in the approximate order of increasing proportions of fine particles, are sand, loamy sand, sandy loam, loam, silt loam, silt, sandy clay loam, clay loam, silty clay loam, sandy clay, silty clay, and clay. The sand, loamy sand, and sandy loam classes may be further subdivided into coarse, fine, or very fine. The basic USDA texture classes are given graphically in Exhibit 618-8 as a percentage of sand, silt, and clay. The chart at the bottom of the figure shows the relationship between the particle size and texture classes among the AASHTO, USDA, and Unified Soil Classification systems.
(2) Entries. Enter the texture class code(s) for each horizon using Exhibit 618-15.(g) Terms used in lieu of texture.
(1) Definition. Terms used in lieu of texture are substitute terms applied to materials that do not fit into a texture class because of high organic matter content, high fragment content, high gypsum content, cementation, or another reason. Examples include artifacts, bedrock, gravel, and muck, Exhibit 618-15 provides a list of these terms and their codes. Some of these terms may be modified with terms from the list of texture modifiers, such as cemented, code CEM. For example, cemented diagnostic horizons such as duripans, petrocalcic horizons, and petrogypsic horizons are coded CEM-MAT, using the texture modifier “cemented” with the term in lieu of texture “material”. The concatenated texture term for such horizons in pedon descriptions is “cemented material”.
(2) Application. (i) The terms used in lieu of texture highly decomposed plant material,
moderately decomposed plant material, and slightly decomposed plant material (codes HPM, MPM, and SPM), should only be used to describe near surface horizons composed of plant material in various stages of decomposition that are saturated with water for less than 30 cumulative days in normal years (and are not artificially drained). The terms muck,
(430-VI-NSSH, 2010)

Part 618 – Soil Properties and Qualities 618-75
mucky peat, and peat (codes MUCK, MPT, and PEAT) should be used to describe histic epipedons and organic horizons of any thickness that are saturated with water for 30 or more cumulative days in normal years (or are artificially drained), including those in Histels and Histosols, except for Folists.
(ii) For soil materials with 40 percent or more by weight gypsum in the fine earth fraction, gypsum dominates the physical and chemical properties of the soil and particle-size classes are not meaningful. Two terms in lieu of texture are used. Coarse gypsum material (code CGM) is used for these materials where 50 percent or more of the fine earth fraction is comprised of particles ranging from 0.1 to 2.0 mm. Fine gypsum material (code FGM) is applied to materials where less than 50 percent of the fine earth fraction is comprised of particles ranging from 0.1 to 2.0 mm.
(iii) Material, which uses the code MAT, is generic and requires the use of a texture modifier. Texture modifier terms, such as coprogenous, gypsiferous, and marly, are used to describe material.
(3) Entries. Enter the applicable code(s) for each horizon as appropriate.(h) Texture modifier.
(1) Definition. Texture modifier is a term used to denote the presence of a condition or component other than sand, silt, or clay.
(2) Application. Texture modifier terms may apply to both texture and terms used in lieu of texture. Some may apply to both, others only apply to one or the other. Combinations of some texture modifiers are allowed. A list of allowable texture modifier terms and their codes is given in Exhibit 618-15. Some rules of application are given below.(i) If the content of fragments equals 15 percent or more by volume, texture
modifiers are used. An example is gravelly loam or parachannery loam. The terms very and extremely are used when the content of fragments equals 35 to less than 60 percent, and 60 to less than 90 percent, by volume, respectively.
(ii) “Mucky” and “peaty” are used to modify near surface horizons of mineral soils that are saturated with water for 30 or more cumulative days in normal years (or are artificially drained). An example is mucky loam. Excluding live roots, the horizon has an organic carbon content (by weight) of: 5 to < 12 percent if the mineral fraction contains no clay; or 12 to < 18 percent if the mineral fraction contains 60 percent or more
clay; or (5 + (clay percentage multiplied by 0.12)) to < (12 + (clay percentage
multiplied by 0.10)) if the mineral fraction contains less than 60 percent clay.
(iii) “Highly organic” is used to modify near surface horizons of mineral soils that are saturated with water for less than 30 cumulative days in normal years (and are not artificially drained). Excluding live roots, the horizon has an organic carbon content (by weight) of:
(430-VI-NSSH, 2010)

Part 618 – Soil Properties and Qualities 618-76
5 to < 20 percent if the mineral fraction contains no clay; or 12 to < 20 percent if the mineral fraction contains 60 percent or more
clay; or (5 + (clay percentage multiplied by 0.12)) to < 20 percent if the
mineral fraction contains less than 60 percent clay.(iv) When modifying the texture of soils with greater than 15 percent by
volume artifacts, the following classes, are used:Less than 15 percent:
No texture modifier terms are used.
15 to < 35 percent:
The adjectival term “artifactual” is used as a modifier of the texture class: "artifactual loam”.
35 to < 60 percent:
The adjectival term "very artifactual" is used as a modifier of the texture class: "very artifactual loam”.
60 percent or more:
If enough fine earth is present to determine the texture class (approximately 10 percent or more by volume) the adjectival term "extremely artifactual" is used as a modifier of the texture class: "extremely artifactual loam".
If there is too little fine earth to determine the texture class (less than about 10 percent by volume) the term in lieu of texture "artifacts" is used. In some instances, the soil may contain a combination of both artifacts and rock fragments. In these cases, the rock fragments and artifacts are described separately. Where appropriate, compound texture modifiers can be used, with the modifier for artifacts coming before the modifier for rock fragments. Some examples are artifactual very gravelly sandy loam and very artifactual channery mucky clay.
(v) Compound texture modifiers may be used, such as a term used to indicate the presence of fragments and another used to indicate some non-fragment condition. The term used to indicate fragments should be listed first. Some examples are very gravelly mucky silt loam and paragravelly ashy loam.
(vi) Texture modifiers, such as paragravelly and paracobbly, are used to identify the presence of pararock fragments. The size, shape, and amounts of pararock fragments required for these terms are the same as for rock fragments.
(vii) When a horizon includes both rock and pararock fragments, use the following for selecting texture modifiers: Describe the individual kinds and amounts of rock and pararock
fragments. Do not use a fragment texture modifier when the combined volume of
rock and pararock fragments is less than 15 percent.
(430-VI-NSSH, 2010)

Part 618 – Soil Properties and Qualities 618-77
When the combined volume of rock and pararock fragments is more than 15 percent, and the volume of rock fragments is less than 15 percent, assign pararock fragment modifiers based on the combined volume of fragments. For example, use paragravelly as a texture modifier for soils with 10 percent rock and 10 percent pararock gravel-sized fragments.
When the volume of rock fragments is 15 percent or greater, use the appropriate texture modifier for rock fragments (Exhibit 618-11), regardless of the volume of pararock fragments. (Do not add the volume of rock and pararock fragments to determine the texture modifier).
(viii) The following definitions of texture modifiers guide their usage: Hydrous -- material that has andic soil properties and an undried 15 bar
water content of 100 percent or more of the dry weight. Medial -- material that has andic soil properties and has a 15 bar water
content of less than 100 percent on undried samples and of 12 percent or more on air-dried samples.
Ashy -- material that is neither hydrous nor medial, and the fine earth fraction contains 30 percent or more particles 0.02 to 2.0 mm in diameter, of which 5 percent or more is composed of volcanic glass; and the [(aluminum plus 1/2 iron percent by ammonium oxalate) times 60] plus the volcanic glass percent is equal to or more than 30.
Gypsiferous -- material that contains 15 to < 40 percent, by weight, gypsum.
(ix) Woody, grassy, mossy, and herbaceous texture modifiers are only used to modify muck, peat, or mucky peat terms (histic epipedons and organic horizons of any thickness that are saturated with water for 30 or more cumulative days in normal years (or are artificially drained), including those in Histels and Histosols, except for Folists). Woody
(a) any material that contains 15 percent or more wood fragments larger than 2 cm in size; or
(b) organic soil materials, other than SPM, MPM, or HPM, that contains 15 percent or more fibers that can be identified as wood origin and contain more wood fibers than any other kind of fiber.
Grassy -- organic soil material that contains more than 15 percent fibers that can be identified as grass, sedges, cattails, and other grass-like plants and contains more grassy fibers than any other kind of fiber.
Mossy -- organic soil material that contains more than 15 percent fibers that can be identified as moss and contains more moss fibers than any other kind of fiber.
Herbaceous -- organic soil material that contains more than 15 percent fibers that can be identified as herbaceous plants other than moss and grass or grass-like plants and more of these fibers than any other kind of fiber.
(430-VI-NSSH, 2010)
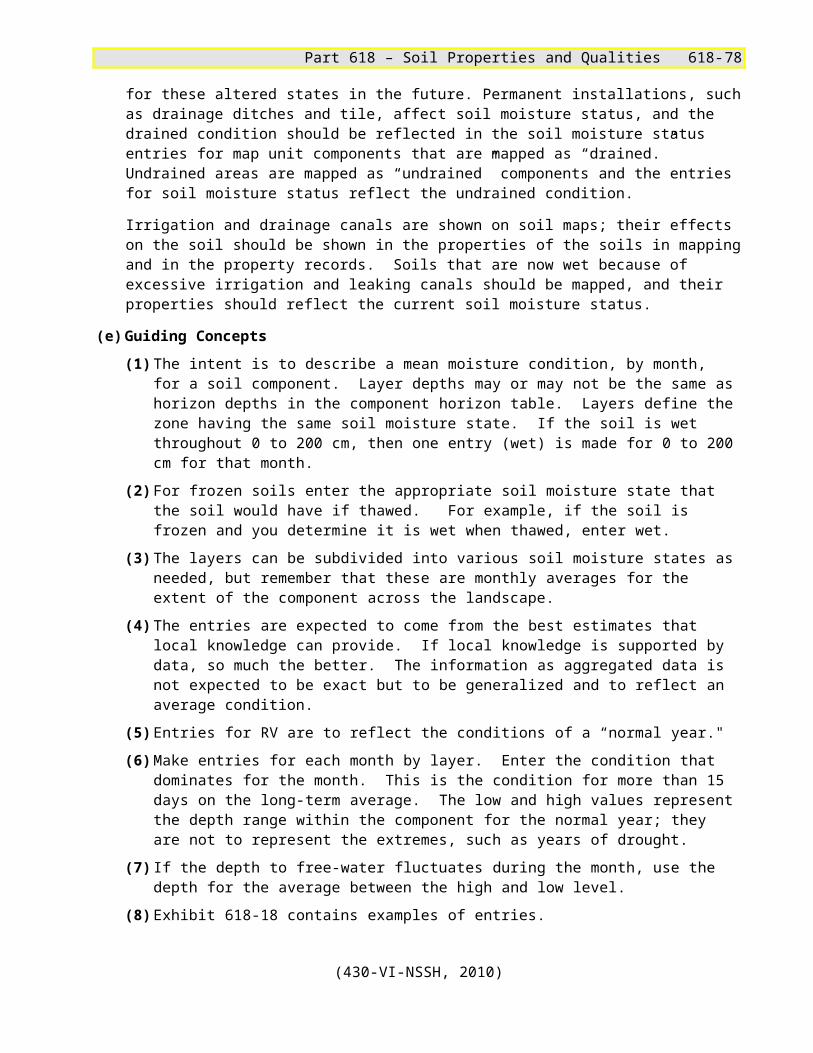
Part 618 – Soil Properties and Qualities 618-78
(x) Some materials can be described by utilizing an apparent texture, even though they do not fit the requirements of texture. These materials use a texture modifier. Examples are marly silt loam and gypsiferous sand.
(xi) Limnic materials are used as modifiers to texture to describe the origin or the material. These materials were deposited in water by precipitation or through the action of aquatic organisms or derived from plants and organisms. These modifiers are used to indicate presence and origin without respect to any set amount. Refer to the Keys to Soil Taxonomy for complete definitions of limnic materials. Coprogenous -- Coprogenous-earth or sedimentary peat is limnic layer
which contains many very small (0.1 to .001mm) fecal pellets.. Diatomaceous -- Diatomaceous-earth is a limnic layer composed of
diatoms. Marly -- Marl is a limnic layer that is light colored and reacts with HCl.
(xii) Permanently frozen -- Term applied to soil layer in which the temperature is perennially at or below 0 degrees C, whether its consistence is very hard or loose.
(3) Entries. Enter the applicable texture modifier code(s). Multiple texture modifiers may be used in some cases.
(i) Texture modifier and class.(1) Definition. Texture modifier and class is a concatenation of texture modifier
and texture class.This data element indicates the full texture classification of the horizon. If texture modifiers are used, they are attached to the texture class by a hyphen, for example, GR-SL. If a layer is stratified, enter SR as a texture modifier and the end members of the textural range and connect them by hyphens, for example, SR-C-L and SR-GR-S-GR-C.
(2) Entries. Enter the appropriate designation for each horizon.(j) Stratified texture flag.
(1) Application. Stratified texture flag is used to identify stratified textures. (2) Entries. An entry of "yes" indicates the textures are stratified. The default
entry is "no."
618.69 Water, One-Tenth Bar.
(a) Definition. Water one-tenth bar is the amount of soil water retained at a tension of 1/10 bar, expressed as a percentage of the whole soil on a volumetric basis.
(b) Significance. Water retained at one-tenth bar is significant in the determination of soil water-retention difference, which is used as the initial estimation of available water capacity for some soils.
(c) Measurement. Measurement in the laboratory is done on natural clods using a pressure desorption method. Measurement for nonswelling soils, loamy sand or coarser soils, and some sandy loams is also done using a pressure desorption method but sieved (< 2 mm) air-dry samples are used. Gravimetric water contents
(430-VI-NSSH, 2010)

Part 618 – Soil Properties and Qualities 618-79
are reported in laboratory measurements as a percentage of the fine-earth (<2 mm) fraction. Conversion to a volumetric basis is made using bulk density and rock fragment content.
(d) Entries. Enter the low, high, and representative values for the horizon. The range of valid entries is 0.00 to 999.00 percent. Tenths of a percent are allowable. A NASIS calculation is available and can be viewed in Appendix 618-8.
618.70 Water, One-Third Bar.
(a) Definition. Water one-third bar is the amount of soil water retained at a tension of 1/3 bar, expressed as a percentage of the whole soil on a volumetric basis.
(b) Significance. Water retained at one-third bar is significant in the determination of soil water-retention difference, which is used as the initial estimation of available water capacity for some soils.
(c) Measurement. Measurement in the laboratory is done on natural clods using a pressure desorption method. Measurement for nonswelling soils, loamy sand or coarser soils, and some sandy loams is also done using a pressure desorption method, but sieved (< 2 mm) air-dry samples are used. Gravimetric water contents are reported in laboratory measurements as a percentage of the fine-earth (< 2 mm) fraction. Conversion to a volumetric basis is made using bulk density and rock fragment content.
(d) Entries. Enter the low, high, and representative values for the horizon. The range of valid entries is 0.00 to 999.00 percent. Tenths of a percent are allowable. A NASIS calculation is available and can be viewed in Appendix 618-8.
618.71 Water, 15 Bar.
(a) Definition. Water 15 bar is the amount of soil water retained at a tension of 15 bars, expressed as a percentage of the whole soil on a volumetric basis.
(b) Significance. Water retained at 15 bar is significant in the determination of soil water-retention difference, which is used as the initial estimation of available water capacity for some soils. Water retained at 15 bar is an estimation of the wilting point.
(c) Measurement. Measurement in the laboratory is done on sieved (< 2 mm) air-dry samples using a pressure desorption method. Gravimetric water contents are reported in laboratory measurements as a percentage of the fine-earth (< 2 mm) fraction. Conversion to a volumetric basis is made using bulk density and rock fragment content.
(d) Entries. Enter the low, high, and representative values for the horizon. The range of valid entries is 0.00 to 220.00 percent. Tenths of a percent are allowable. A NASIS calculation is available and can be viewed in Appendix 618-8.
618.72 Water, Satiated.
(a) Definition. Water, satiated, is the estimated volumetric soil water content at or near zero bar tension, expressed as a percentage of the less than 2 mm fraction of the soil.
(b) Significance. Water, satiated, represents the total possible water content of the soil, including the amount in excess of field capacity, and is used to estimate the
(430-VI-NSSH, 2010)

Part 618 – Soil Properties and Qualities 618-80
amount of water available for leaching and translocation. Satiated water content approximates the water content for the fine-earth fraction at saturated conditions. It is used in such resource assessment tools as Soil Hydrology, Water Budgets, Leaching, and Nutrient/Pesticide Loading models. Correction for rock fragments may be needed when applied to various models since the entry is for the < 2mm fraction.
(c) Estimation. The values are derived by the following formula:(1) Satiated water % = total porosity % - entrapped air %(2) Total porosity % = 100(1-bulk density moist/particle density)(3) Assume approximately 3% entrapped air.
(d) Entries. Enter the high, low, and representative values, as whole integers for the horizon. The range of valid entries is 25 to 80 percent. A NASIS calculation is available and can be viewed in Appendix 618-8.
618.73 Wind Erodibility Group and Index.
(a) Definition. A wind erodibility group (WEG) is a grouping of soils that have similar properties affecting their resistance to soil blowing in cultivated areas. The groups indicate the susceptibility to blowing. The Wind Erodibility Index (I), used in the wind erosion equation, is assigned using the wind erodibility groups.
(b) Significance. There is a close correlation between soil blowing and the size and durability of surface clodiness, fragments, organic matter, and the calcareous reaction. The soil properties that are most important with respect to soil blowing are (1) soil texture, (2) organic matter content, (3) effervescence due to carbonate reaction with HCl, (4) rock and pararock fragment content, and (5) mineralogy. Soil moisture and the presence of frozen soil also influence soil blowing.
(c) Estimates. Soils are placed into wind erodibility groups on the basis of the properties of the soil surface layer. Exhibit 618-16 lists the wind erodibility index assigned to the wind erodibility groups. The wind erodibility index values are assigned because the dry soil aggregates are very use dependent on crop management factors.
(d) Entries. Enter the wind erodibility group and wind erodibility index values for surface layer(s) only. The range of valid entries for wind erodibility group data is 1, 2, 3, 4, 4L, 5, 6, 7, and 8. The lowest valid entry for wind erodibility index data is 0, and the highest is 310. The index values should correspond exactly to their wind erodibility group.
(430-VI-NSSH, 2010)
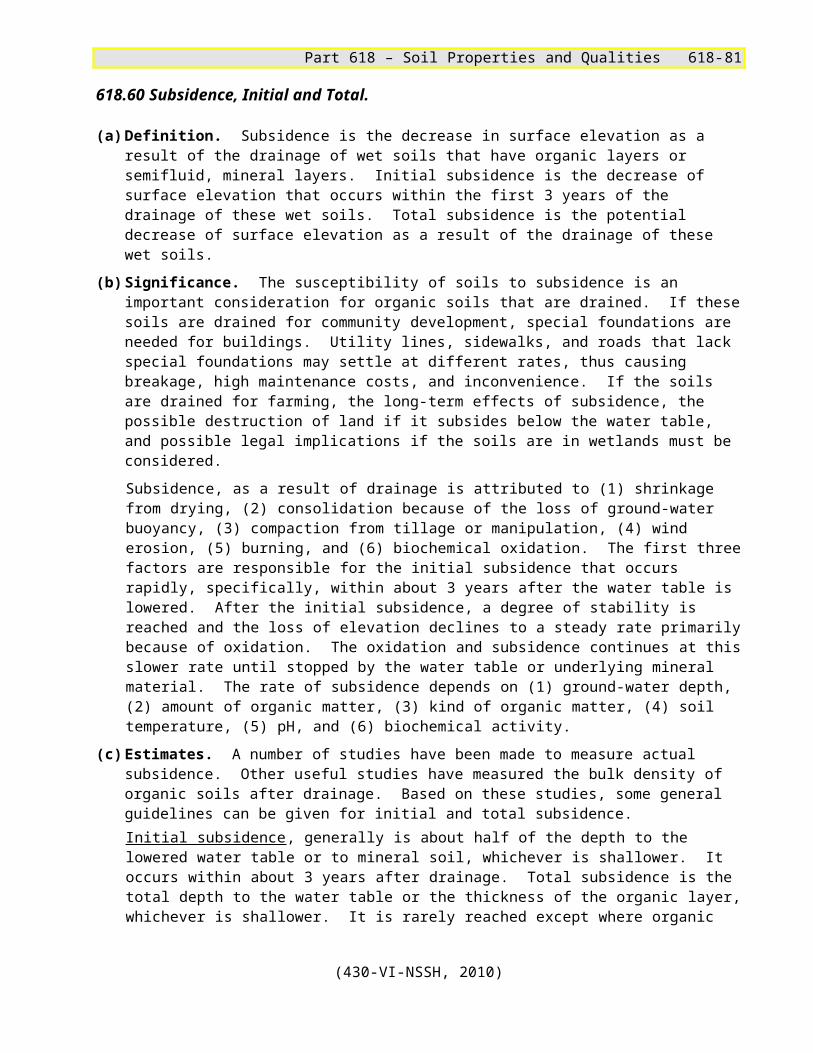
Part 618 – Soil Properties and Qualities 618-81
Exhibit 618-1 Guides for Estimating Risk of Corrosion Potential for Uncoated Steel. 1/
Property LimitsLow Moderate High
Drainage class and texture
Excessively drained, coarse textured or well drained, coarse to medium textured soils; or moderately well drained coarse textured, soils; or some- what poorly drained, coarse textured soils
Well drained, moderate y fine textured soils; or moderately well drained, medium textured soils; or somewhat poorly drained, moderately coarse textured soils; or very poorly drained soils with stable high water table
Well drained, fine textured or stratified soils; or moderately well drained, fine and moderately fine textured or stratified soils; or somewhat poorly drained, medium to fine textured or stratified soils; or poorly drained soils with fluctuating water table
Total acidity 2/(meq/100g)
<8 8-12 >12
Resistivity at saturation(ohm/cm) 3/
>5,000 2,000-5,000 <2,000
Conductivity of saturated extract(mmhos cm-1) 4/
<0.3 0.3-0.8 >0.8
1/ Based on data in the publication "Underground Corrosion," table 99,p. 167, Circular 579, U.S. Dept. of Commerce, National Bureau of Standards.2/ Total acidity is roughly equal to extractable acidity (as determined by Soil Survey Laboratories Method 6Hla, Soil Survey Investigations Report No. 42, Soil Survey Laboratory Methods Manual, Version 4.0, November 2004).3/ Roughly equivalent to resistivity of fine-and medium-textured soils measured at saturation (Method 8E1, Soil Survey Investigations Report No. 42, Soil Survey Laboratory Methods Manual, Version 4.0, November 2004). Resistivity at saturation for coarse-textured soil is generally lower than when obtained at field capacity and may cause the soil to be placed in a higher corrosion class.4/ Method 8Ala, Soil Survey Investigations Report No. 42, Soil Survey Laboratory Methods Manual, Version 4.0, November 2004. The relationship between resistivity of a saturated soil paste (Method 8E1) and electrical conductivity of the saturation extract (Method 8A1a), is influenced by variations in the saturation percentage, salinity, and conductivity of the soil minerals. These two measurements generally correspond closely enough to place a soil in one corrosion class.
(430-VI-NSSH, 2010)

Part 618 – Soil Properties and Qualities 618-82
Exhibit 618-2 Guide for Estimating Risk of Corrosion Potential for Concrete.
Property Limits 1/Low Moderate High
Texture and reaction
Sandy and organic soils with pH>6.5 or medium and fine textured soils with pH>6.0
Sandy and organic soils with pH5.5-6.5 or medium and fine textured soils with pH 5.0 to 6.0
Sandy and organic soils with pH<5.5 or medium and fine textured soils with pH<5.0
Na and/or Mg sulfate (ppm)
Less than 1000 1000 to 7000 More than 7000
NaCl (ppm) Less than 2000 2000 to 10000 More than 10000
1/ Based on data in National Handbook of Conservation Practices, Standard 606,Subsurface Drain, 1980.
(430-VI-NSSH, 2010)

Part 618 – Soil Properties and Qualities 618-83
Exhibit 618-3 Crop Names and Units of Measure.
(Refer to the data dictionary of the National Soil Information System for crop names and crop yield units in ftp://ftp-fc.sc.egov.usda.gov/NASIS/documents/metadata/5_3/n53clr.pdf.
(430-VI-NSSH, 2010)

Part 618 – Soil Properties and Qualities 618-84
Exhibit 618-4 Classification of Soils and Soil-Aggregate Mixtures for the AASHTO System.
General Classification
Granular Materials(35% of less passing No. 200)
Silt-Clay Materials(More than 35% passing No. 200)
Group classification
A-1A-3
A-2A-4 A-5 A-6
A-7A-1-a A-1-b A-2-4 A-2-5 A-2-6 A-2-7 A-7-5
A-7-6Sieve analysis,
% passingNo. 10No. 40No 200
50 max30 max15 max
-50 max25 max
-51 min10 max
--
35 max
--
35 max
--
35 max
--
35 max
--
36 min
--
36 min
--
36 min
--
36 minCharacteristics
of fraction passing No. 40
Liquid limitsPlasticity index
-6 max
-NP
40 max10 max
41 min10 max
40 max11 min
41 min11 min
40 max10 max
41 min10 max
40max11 min
*41 min11 min
Usual types of significant constituent materials
Stone fragments, gravel and sand
Fine sand
Silty or clayey gravel and sand Silty soils Clayey soils
General rating as subgrade
Excellent to good Fair to good
* Plasticity index of A-7-5 subgroup is equal to or less than LL minus 30. Plasticity index of A-7-6 subgroup is greater than LL minus 30.
(430-VI-NSSH, 2010)

Part 618 – Soil Properties and Qualities 618-85
Exhibit 618-5 Potential Frost Action.
Soil moisture regime
Frost action classes 1/, 2/Low Moderate High 3/
Aquic Cindery, Fragmental, Pumiceous
Sandy, Sandy-skeletal
Coarse-loamy, Fine-loamy, Coarse-silty, Fine-silty, Loamy-skeletal, Clayey and clayey-skeletal, Organic soil materials, Ashy, ashy-pumiceous, and ashy-skeletal, Medial, medial-pumiceous, and medial-skeletal, Hydrous-pumiceous, Hydrous-skeletal, Hydrous
Udic, Xeric, Ustic (when irrigated), Aridic (when irrigated)
Fragmental, Cindery, Sandy, Sandy-skeletal, Pumiceous
Coarse-loamy, Fine-loamy, Loamy-skeletal, Clayey, Clayey-skeletal, Ashy-pumiceous, Ashy-skeletal, Hydrous-skeletal, Medial-skeletal, Medial-pumiceous
Coarse-silty, Fine-silty, Ashy Medial, Hydrous-pumiceous, Hydrous
Ustic, Aridic Fragmental, Sandy, Sandy-skeletal, Clayey, Clayey-skeletal, Cindery, Ashy, ashy-pumiceous, and ashy-skeletal, Medial and medial-skeletal, Pumiceous
Coarse-loamy, Fine-loamy, Coarse-silty, Fine-silty, Loamy-skeletal, Medial-pumiceous, Hydrous-pumiceous, Hydrous-skeletal, Hydrous
1/ Taxonomic family particle-size classes apply to the whole soil to the depth of frost penetration, which is not necessarily the same as the taxonomic family particle-size control section.2/ Isomesic and warmer temp regimes would have a "none" frost action class.
(430-VI-NSSH, 2010)

Part 618 – Soil Properties and Qualities 618-86
3/ Organic soil materials with a mesic or greater temperature regime and a udic moisture regime (e.g. Folists) have "high" frost action class.
(430-VI-NSSH, 2010)

Part 618 – Soil Properties and Qualities 618-87
Exhibit 618-6 Distribution of Design Freezing Index Values in the Continental United States.
(430-VI-NSSH, 2010)

Part 618 – Soil Properties and Qualities 618-88
(430-VI-NSSH, 2010)

Part 618 – Soil Properties and Qualities 618-89
Exhibit 618-7 Estimating LL and PI from Percent and Type of Clay.
The following two formulas provide estimates of liquid limit and plasticity index. These calculations are included in the National Soil Information System and provide default values to LL and PI.
LL = 11.60 + [1.49 x 15 bar water %] + [1.35 x org. carbon %] + [0.6 x LEP] + [0.26 x non-carbonate clay %]*
where LL is liquid limitLEP is Linear Extensibility Percent
PI = -1.86 + [0.69 x 15 bar water %] - [1.19 x organic carbon %] +[ 0.13 x LEP] +[0.47 x non-carbonate clay %]*
where PI is Plasticity Index LEP is Linear Extensibility Percent
* When the calculated PI < 0.5, the PI is set to zero (nonplastic). When the calculated LL < 15 or PI < 0.5, the LL is set to zero.
(430-VI-NSSH, 2010)

Part 618 – Soil Properties and Qualities 618-90
Exhibit 618-8 Texture Triangle and Particle-Size Limits of AASHTO, USDA, and Unified Classification Systems.
(430-VI-NSSH, 2010)

Part 618 – Soil Properties and Qualities 618-91
Exhibit 618-9 Guide for Estimating Ksat from Soil Properties.
Estimate saturated hydraulic conductivity (Ksat) from soil texture by first selecting the bulk density class of medium, low or high. Then use the corresponding textural triangle to select the range of saturated hydraulic conductivity in ms-1. Overrides on next page.
……………………………………………………………………………………………………
(430-VI-NSSH, 2010)

Part 618 – Soil Properties and Qualities 618-92
(430-VI-NSSH, 2010)

Part 618 – Soil Properties and Qualities 618-93
Exhibit 618-9 (continued)
Use these overrides in lieu of the textural guide above when these conditions exist. A single property statement is sufficient for an override from the textural guide.
Overriding condition Saturated hydraulic conductivity (m s-1 )
All fragmental, cindery or pumiceous 100Many medium or coarser vertical pores that extend through the layer.
100
Medial-pumiceous, medial-skeletal, ashy-pumiceous, ashy-skeletal, hydrous-pumiceous that is very friable, friable, soft, or loose.
10 – 100
When moderately moist or wetter, structure that is moderate or strong granular, strong blocky or prismatic smaller that is very coarse and no stress surfaces or slickensides.
10 – 100
Common medium or coarser vertical pores that extend through the layer.
10 – 100
Strong very coarse blocky or prismatic and no stress surfaces or slickensides.
1 – 10
35 percent clay, soft, slightly hard, very friable or friable, no stress surfaces or slickensides and the clay is subactive after subtracting the quantity (2 x (OC x 1.7))
1 – 10
Few stress surfaces and/or slickensides.
0.1 – 1
Massive and very firm or extremely firm, or weakly cemented.
0.1 – 1
Continuously moderately cemented. 0.1 – 1Common or many stress surfaces and/or slickensides.
0.01 - 0.1
Continuously indurated or very strongly cemented.
0.01
(430-VI-NSSH, 2010)

Part 618 – Soil Properties and Qualities 618-94
Exhibit 618-10 Guide to Estimating Water Movement Through Lithic and Paralithic Materials. 1/ 2/
MaterialWater
Movementµm s-1
Sandstoneunfracturedfractured weathered
<1010-10010-100
Limestoneunfracturedfracturedweathered
<1<10<10
Limestone, Karst >100Shales and Mudstones
consolidatedweathered
<1<10
Igneous and Metamorphic Rocks
unfracturedfracturedweathered
<11-100
<1
1/ This table is to be used as a guide and may be adjusted to reflect local, regional, or state bedrock permeability data. Fracturing may increase hydraulic conductivity of consolidated rock by a factor of 104 to 106, which is dependent on the degree and interconnection of fracturing. (Freeze and Cherry, 1979; Legget and Karrow, 1983).2/ This table assumes that materials are level bedded. Tilted beds of some materials may have rapid rates of water movement that goes directly to an aquifer.3/ Haan, C.T., Barfield, B.J., and Hayes, J.C.; Design Hydrology and Sedimentology for Small Catchments.
(430-VI-NSSH, 2010)

Part 618 – Soil Properties and Qualities 618-95
Exhibit 618-11 Rock Fragment Modifier of Texture
Instructions for Table 1, Guide for determining rock fragment modifier of texture: First choose the row with the appropriate total rock fragments. Then read the criteria in the columns under “Gravel, cobbles, stones and boulders,” starting from the left-most column and proceeding to the right. Stop in the first column in which a criterion is met.
Table 1– Guide for determining rock fragment modifier of texture. Click here for an MS-Excel spreadsheet that calculates the texture modifiers for flat and nonflat rock fragments.
Total Rock Fragments
(Vol %)
Gravel (GR), cobbles (CB), stones (ST), and boulders (BY)(Substitute channers for gravel, and flagstones for cobbles, where applicable)1
IF GR ≥ 1.5 CB + 2 ST + 2.5BY IF CB ≥ 1.5 ST + 2 BY IF ST ≥ 1.5 BY IF ST < 1.5 BY
≥ 15 < 35 Gravelly Cobbly Stony Bouldery
≥ 35 < 60 Very Gravelly Very Cobbly Very Stony Very Bouldery
≥ 60 < 90 Extremely Gravelly Extremely Cobbly Extremely Stony Extremely Bouldery
≥ 90 Gravel Cobbles Stones Boulders
Example: Determine the rock fragment modifier for a soil that contains 15 percent gravel (GR), 10 percent cobbles (CB), and 3 percent stones (ST).
1. Since total rock fragments are 28 percent, choose the first row (≥ 15 and < 35).
2. Under “Gravel (GR), cobbles (CB), stones (ST), . . .”, test the criterion in the left-most column. Is 15%GR ≥ 1.5 (10% CB) + 2 (3% ST)? Answer: NO.
3. Proceed to the next column. Is 10%CB ≥ 1.5 (3% ST)? Answer: YES. STOP. The modifier is Cobbly.
1 If both flat and nonflat rock fragments are present, the quantity in each size class is summed (e.g. gravel + channers, cobbles + flags). The sums are used to determine the appropriate quantity/size modifier. If the amount of flat and nonflat rock fragments within any given size class are equal, the nonflat modifier takes precedence. For example, if there are 10 percent gravel and 10 percent channers, the modifier is gravelly.
Soils with pararock fragments only–The same basic weighting rules apply with pararock fragments as with flat and nonflat rock fragments. However, the above spreadsheet only outputs modifier terms for rock fragments. To assign the correct pararock fragment modifier to the outputted rock modifier term, simply precede the modifier with “para.” For example, if the calculator outputs “very cobbly,” the correct modifier is “very paracobbly.”
Soils with both rock and pararock fragments–Refer to instructions in NSSH 618.67.h.2.vii.
(430-VI-NSSH, 2010)

Part 618 – Soil Properties and Qualities 618-96
Exhibit 618-12 Soil Erodibility Nomograph.
(430-VI-NSSH, 2010)
Part 618 – Soil Properties and Qualities 618-97
(430-VI-NSSH, 2010)

Part 618 – Soil Properties and Qualities 618-98
Exhibit 618-13 Kw Value Associated with Various Fragment Contents.
Fragment vol. %
Mulch factor 1/
Kf value classes of less than 2 mm soil fraction
.10
.15
.20
.24
.28
32 37 .43
.49
.55
64
5 .90 .09
.14
.18
.22
.25
.29
.33
.39
.44
.50
.58
10 .77 .08
.12
.15
.18
.22
.25
.28
.33
.38
.42
.49
15 .68 .07
.10
.14
.16
.19
.22
.25
.29
.33
.37
.43
20 .61 .06
.09
.12
.15
.17
.20
.23
.26
.30
.37
.39
25 .54 .05
.08
.11
.13
.15
.17
.20
.23
.26
.30
.35
30 .48 .05
.07
.10
.12
.13
.15
.18
.21
.24
.26
.31
35 .43 .04
.06
.09
.10
.12
.14
.16
18 .21
.24
.28
40 .38 .04
.06
.08
.09
.11
.12
.14
.16
.19
.21
.24
45 .34 .03
.05
.07
.08
.10
.11
.13
.15
.17
.19
.22
50 .30 .03
.05
.06
.07
.08
.10
.11
.13
.15
.17
.19
55 26 .03
.04
.05
.06
.07
.08
.09
.11
.13
.12
.14
60 .22 .02
.03
.04
.05
.06
.07
.08
.09
.11
.12
.14
65 .19 .02
.03
.04
.05
.05
.06
.07
.08
.09
.10
.12
70 .16 .02
.02
.03
.04
.04
.05
.06
.07
.08
.09
.10
75 .13 .01
.02
.03
.04
.04
.04
.04
.06
.06
.07
.08
80 .10 .01
.02
.02
.02
.03
.03
.04
.04
.05
.06
.06
85 .08 .01
.02
.02
.02
.02
.03
.03
.03
.04
.04
.05
90 .06 .01
.01
.01
.01
.02
.02
.02
.03
.03
.03
.04
95 .04 .01
.01
.01
.01
.01
.01
.02
.02
.02
.02
.03
100 .03 .01
.01
.01
.01
.01
.01
.01
.01
.02
.02
.02
(430-VI-NSSH, 2010)

Part 618 – Soil Properties and Qualities 618-99
1/ Mulch factor is the ratio of the soil loss from soils with the specified fragment volumes to that from soils with no fragments. The table was constructed from the zero canopy curve, figure 6, page 19 in AH 537 (USDA-SEA 1978).
(430-VI-NSSH, 2010)

Part 618 – Soil Properties and Qualities 618-100
Exhibit 618-14 General Guidelines for Assigning Soil Loss Tolerance "T".
Soil loss tolerance "T" is assigned according to properties of root and plant growth limiting subsurface soil layers. The designation of a limiting layer implies that the material above the layer has more favorable plant growth properties. As limiting or less favorable soil layers become closer to the soil surface, the relative ability of a soil to maintain its productivity through natural and managed processes decreases.
Caution should be used in comparing T factors across soils for soil quality or productivity. Soils with a T factor of 5 may not be the most productive and soils with the same T factor rating may not be equally productive. For example, a soil that has a T factor of 5, and is sandy throughout, is not as naturally fertile nor can it hold as much available water as a soil that has a T factor of 5 which is loamy throughout.
The criteria for assigning "T" factor are estimated from:
1. The severity of physical or chemical properties of subsurface layers; and
2. The economic feasibility of utilizing management practices to overcome limiting layers or conditions.
The following general guide was used with specific soil properties and conditions to write criteria statements for programming "T" factors as a calculation in NASIS.
Depth to limiting layer (cm)
Soil loss tolerance in tons/acre
Group 1 Group 2 Group 3
0 - 25 1 1* 3
25 - 50 1 2 3
50 - 100 2 3 4
100 - 150 3 4 4
>150 5 5 5
*Some soils are assigned a soil loss tolerance of 2.
Group 1 -- The limitations are significant or have permanent layers of root limitation (non-renewable).
Group 2 -- The limitations to roots are moderate, or have a less than permanent loss to productivity (renewable).
Group 3 -- The limitations can be overcome through natural or managed processes to achieve the productivity level of the non-eroded soil (very renewable).
All restrictions in the NASIS component restrictions table are considered root-limiting, either physically or chemically.
(430-VI-NSSH, 2010)
Part 618 – Soil Properties and Qualities 618-101
T factors are assigned based on the criteria presented below. If there is more than one limiting soil characteristic, then the soil is rated based on the most limiting soil characteristic based on the “T” criteria in the table.
"T" Criteria12/31/2009
“T” Criteria 1/
Soil Characteristic
Definition Depth limit (cm)
T Factor
2/
1. Organic A. For Histosols, depth to the first mineral horizon with < 20% organic matter; and not in a lithic, limnic, hydric, or fluvaquentic subgroup, and not in Sulfohemists or Sulfihemists great groups.
≤150 >150
12
OR
B. Soils that are Histosols in a lithic, limnic, hydric, or fluvaquentic subgroup or are in Sulfohemists or Sulfihemists great groups, then T is:
1
OR
C. Except Alaska, mineral soils that are histic intergrades (i.e., histic* subgroup). If the histic epipedon has been destroyed, then ignore this rating and rate T based on other limiting features of the mineral soil.
1
2. Bedrock A. Except Alaska, depth to densic Bedrock as identified in the NASIS component restrictions table. (renewable)
<25 25-50
50-100 100-150
>150
12345
Alaska (non-renewable) <50 50-100
100-150 >150
1235
(430-VI-NSSH, 2010)

Part 618 – Soil Properties and Qualities 618-102
OR
B. Except Alaska, depth to paralithic Bedrock as identified in the NASIS component restrictions table. (renewable)
<25 25-50
50-100 100-150
>150
12345
Alaska (non-renewable) <50 50-100
100-150 >150
1235
OR
C. Depth to lithic Bedrock as identified in the NASIS component restrictions table. (non-renewable)
<50 50-100
100-150 >150
1235
3. Permafrost Depth to permafrost as identified in the NASIS component restrictions table. (non-renewable)
<50 50-100
100-150 >150
1235
4. Cemented layers/pans
A. Depth to duripan, petroferric, petrocalcic, petrogypsic, placic, ortstein, or cemented layer (or contiguous layers) that are ≤ 7.6 cm (3 inches) thick and hardness (i.e. rupture resistance) is extremely weakly, very weakly, weakly, or moderately as identified in the NASIS component restrictions table. (very renewable)
<50 50-150
>150
345
OR
B. Except Alaska, depth to duripan, petroferric, petrocalcic, petrogypsic, placic, ortstein, or cemented layer (or contiguous layers) that are ≤ 7.6 cm (3 inches) thick and hardness (i.e. rupture resistance) is strongly or very strongly as identified in the NASIS component restrictions
<25 25-50
50-100 100-150
>150
12345
(430-VI-NSSH, 2010)

Part 618 – Soil Properties and Qualities 618-103
table. (renewable)
Alaska (non-renewable) <50 50-100
100-150 >150
1235
OR
C. Depth to duripan, petroferric, petrocalcic, petrogypsic, placic, ortstein, or cemented layer that is ≤ 7.6 cm (3 inches) thick and hardness (i.e. rupture resistance) is indurated as identified in the NASIS component restrictions table. (non-renewable)
<50 50-100
100-150 >150
1235
OR
D. Except Alaska, depth to duripan, petrocalcic, petrogypsic, petroferric, placic, ortstein, or cemented layer (or contiguous layers) that are > 7.6 cm (3 inches) thick (or if thickness is not specified) and hardness (i.e. rupture resistance) is extremely, very weakly, weakly, or moderately as identified in the NASIS component restrictions table. (renewable)
<25 25-50
50-100 100-150
>150
12345
Alaska (non-renewable) <50 50-100
100-150 >150
1235
OR
E. Depth to duripan, petrocalcic, petrogypsic, petroferric, placic, ortstein, or cemented layer (or contiguous layers) that are > 7.6 cm (3 inches) thick (or if thickness is not specified) with strongly or greater hardness (i.e. rupture resistance) as identified in the NASIS component restrictions table. (non-renewable)
<50 50-100
100-150 >150
1235
(430-VI-NSSH, 2010)

Part 618 – Soil Properties and Qualities 618-104
5. Fragmental Depth to fragmental layer (i.e., consists of in lieu of textures of artifacts, boulders, cobbles, channers, flagstones, gravel, or stones). (non-renewable)
<50 50-100
100-150 >150
1235
6. Rock fragments
A. Except Alaska, if the weighted average of rock fragments in the 0-25 cm depth is < 35% (by volume); then rate T based on depth to first subsurface layer(s) with ≥ 60% rock fragments that has its lower boundary extending to 150 cm or below. (renewable)
<50 50-100
100-150 >150
2345
Alaska only; if the weighted average of rock fragments in the 0-12 cm depth is < 35% (by volume); then rate T based on depth to first subsurface layer(s) with ≥ 60% rock fragments that has its lower boundary extending to 150 cm or below. (non-renewable)
<50 50-100
100-150 >150
1235
OR
B. Except Alaska, if the weighted average of rock fragments in the 0-25 cm depth is < 35% (by volume); then rate T based on depth to first subsurface layer(s) with ≥ 60% rock fragments and its lower boundary is within 150 cm. (very-renewable)
<50 50-150
>150
345
Alaska only; if the weighted average of rock fragments in the 0-12 cm depth is < 35% (by volume); then rate T based on depth to first subsurface layer(s) with ≥ 60% rock fragments and its lower boundary is within 150 cm. (non-renewable)
<50 50-100
100-150 >150
1235
(430-VI-NSSH, 2010)

Part 618 – Soil Properties and Qualities 618-105
OR
C. Except Alaska, if the weighted average of rock fragments in the 0-25 cm depth is ≤ 15% (by volume); then rate T based on depth to first subsurface layer with ≥ 35% rock fragments that has its lower boundary extending to 150 cm or below. (very renewable)
<50 50-150
>150
345
Alaska only; if the weighted average of rock fragments in the 0-12 cm depth is ≤ 15% (by volume); then rate T based on depth to first subsurface layer with ≥ 35% rock fragments that has its lower boundary extending to 150 cm or below. (non-renewable)
<50 50-100
100-150 >150
1235
7. Plinthite Depth to plinthite as identified in the NASIS component restrictions table. (non-renewable)
<50 50-100
100-150 >150
1235
8. Fragipan and fragic soil properties
A. Depth to fragipan as identified in the NASIS component restrictions table and has ≥ 35% rock fragments. (renewable)
<50 50-100
100-150 >150
2345
OR
B. Depth to fragipan as identified in the NASIS component restrictions table and has < 35% rock fragments. (very renewable)
<50 50-150
>150
345
OR
C. Soils in a fragic subgroup or have an ’x‘ suffix symbol (fragipan character) in any horizon designation. Then rate T based on depth to the layer with the greatest bulk density change (from a lower to higher bulk density) and that has a Ksat ≤ 1.41 µm/s (0.5 cm/h). (very renewable)
<50 50-150
>150
345
(430-VI-NSSH, 2010)

Part 618 – Soil Properties and Qualities 618-106
9. Natric A. Depth to natric horizon as identified in the NASIS component restrictions table. (renewable)
<50 50-100
100-150 >150
2345
OR
B. For soils that have horizons that do not meet natric horizon criteria, but have a subsoil with ≥ 35% clay, Ksat ≤ 1.41 µm/s (0.5 cm/h), and SAR ≥ 13, and the adjacent upper layer(s) has a Ksat > 1.41 µm/s (0.5 cm/h) that extends to the surface (and not glossic). (renewable)
<50 50-100
100-150 >150
2345
10. Dense layers Except Alaska, depth to densic material as identified in the NASIS component restrictions table. (renewable)
<50 50-100
100-150 >150
2345
Alaska (non-renewable) <50 50-100
100-150 >150
1235
11. Abrupt Increase in Clay
A. Depth to layer with an abrupt textural change as identified in the NASIS component restrictions table. (very renewable)
<50 50-150
>150
345
OR
B. Depth to substratum with ≥ 35% clay and has a Ksat < 1.41 µm/s (0.5 cm/h), and has an adjacent upper layer with a Ksat > 4.23 µm/s (1.5 cm/h); or a subsoil Ksat < 0.42 µm/s (0.15 cm/h), and has an adjacent upper surface layer with a Ksat > 1.41 µm/s (0.5 cm/h). The clay increase between the adjacent layers must be ≥ 20%, and the surface or upper layer(s) are greater than or equal to 25 cm thick. (very renewable)
<50 50-150
>150
345
(430-VI-NSSH, 2010)
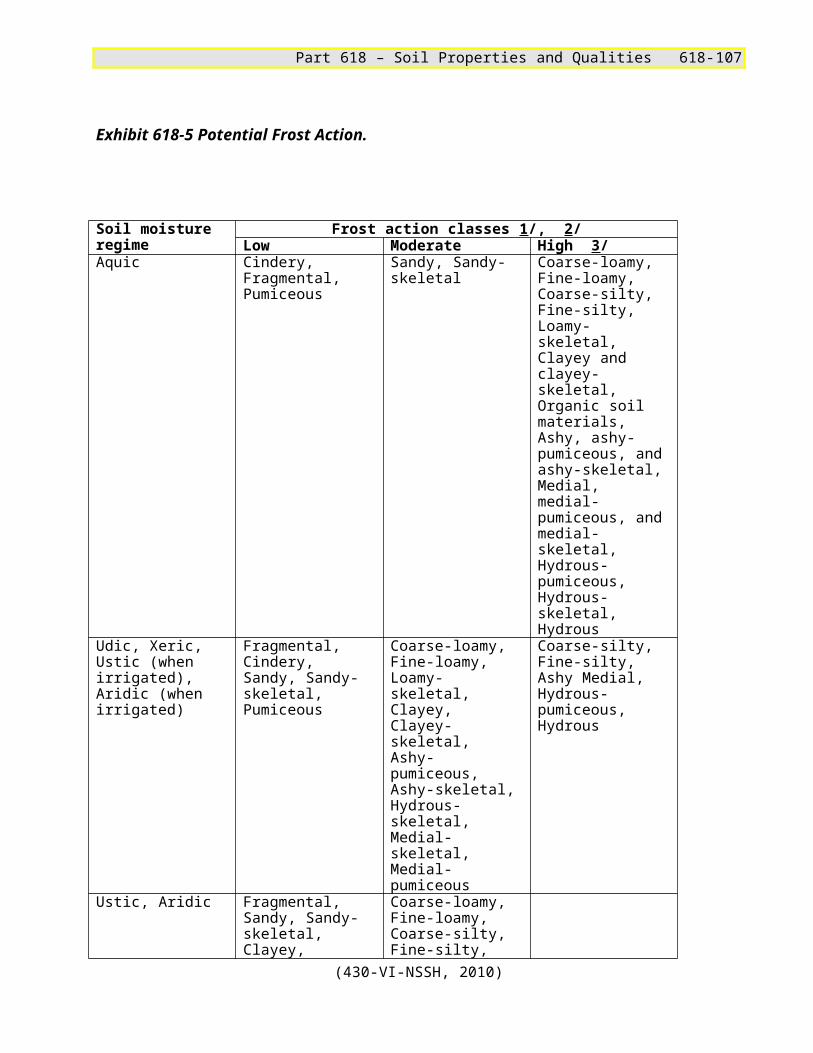
Part 618 – Soil Properties and Qualities 618-107
12. Strongly contrasting textural stratification
Depth to layers that have strongly contrasting textural stratification as identified in the NASIS component restrictions table. (very renewable)
<50 50-150
>150
345
13. Sandy substratum
A. Except Alaska, depth to sandy substratum (COS, S, FS, LS, LCOS, or LFS) with a Ksat > 42.3 µm/s (15.2 cm/h) that extends to 150 cm or below, and the adjacent upper layer(s) have a Ksat < 42.3 µm/s (15.2 cm/h) and have < (0.667*% clay + 50) percent fine or coarser sand separates in the fine earth fraction that extends to the surface 3/. The surface or upper layer(s) are greater than or equal to 25 cm thick. (renewable)
<50 50-100
100-150 >150
2345
Alaska only; depth to sandy substratum (COS, S, FS, LS, LCOS, or LFS) with a Ksat > 42.3 µm/s (15.2 cm/h) that extends to 150 cm or below, and the adjacent upper layer(s) have a Ksat < 42.3 µm/s (15.2 cm/h) and have < (0.667*% clay + 50) percent fine or coarser sand separates in the fine earth fraction that extends to the surface 3/. The surface or upper layer(s) are greater than or equal to 12 cm thick. (renewable)
<50 50-100
100-150 >150
2345
OR
B. Except Alaska, depth to substratum with strongly contrasting sandy textural stratification or stratified with sandy textures of COS, S, LS, FS, LCOS, or LFS and Ksat > 42.3 µm/s (15.2 cm/h) that extends to 150 cm or below, and the adjacent upper layer(s) has a Ksat < 42.3 µm/s (15.2 cm/h) and has < (0.667*% clay + 50) percent fine or coarser sand separates in the fine earth fraction that extends to the surface 3/. The surface or upper layer(s) are greater than or equal to 25 cm thick. (renewable)
<50 50-100
100-150 >150
2345
Alaska only; depth to substratum with strongly <50 2
(430-VI-NSSH, 2010)

Part 618 – Soil Properties and Qualities 618-108
contrasting sandy textural stratification or stratified with sandy textures of COS, S, LS, FS, LCOS, or LFS and Ksat > 42.3 µm/s (15.2 cm/h) that extends to 150 cm or below, and the adjacent upper layer(s) has a Ksat < 42.3 µm/s (15.2 cm/h) and has < (0.667*% clay + 50) percent fine or coarser sand separates in the fine earth fraction that extends to the surface 3/. The surface or upper layer(s) are greater than or equal to 12 cm thick. (renewable)
50-100 100-150
>150
345
14. High Gypsum A. Soils that have a surface layer(s) with ≤ 15% gypsum (by weight) and have subsurface layer(s) with ≥ 25% gypsum, rate T based on depth to the first subsurface layer with ≥ 25% gypsum. (renewable)
<50 50-100
100-150 >150
2345
OR
B. Soils that have a surface layer(s) with > 15 and ≤ 60% gypsum (by weight) and have subsurface layer(s) that exceeds the surface layer in gypsum content by 20% or more, rate T based on depth to the first subsurface layer that exceeds the surface by 20% or more gypsum. (renewable)
<50 50-100
100-150 >150
2345
15. High Salts Depth to salic horizon as identified in the NASIS component restrictions table. (very renewable)
<50 50-150 >150
345
16. High sulfur Depth to sulfuric horizon as identified in the NASIS component restrictions table. (very renewable)
<50 50-150
>150
345
17. High Carbonates
A. Soils that have a surface layer(s) with ≤ 15% calcium carbonate (CaCO3) equivalent and have a subsurface layer(s) with ≥ 40% CaCO3 equivalent, rate T based on depth to the first subsurface layer with ≥ 40% CaCO3 equivalent. (renewable)
<50 50-100
100-150 >150
2345
(430-VI-NSSH, 2010)

Part 618 – Soil Properties and Qualities 618-109
OR
B. Soils that have a surface layer(s) with > 15 and ≤ 60% calcium carbonate (CaC03) equivalent and have a subsurface layer(s) that exceeds the surface layer in CaC03 equivalent by 25% or more, rate T based on depth to the first subsurface layer that exceeds the surface layer by 25% or more CaCO3 equivalent. (renewable)
<50 50-100
100-150 >150
2345
18. Human-manufactured materials
Depth to human-manufactured materials (‘M’ layers) as identified in the NASIS component restrictions table. (non-renewable)
<50 50-100
100-150 >150
1235
19. High aluminum
A. Depth to ≥ 60% Al saturation of the ECEC and soil pH (1:1 water) is ≤ 5.5. (very renewable)
<50 50-150
>150
345
OR
B. Pacific Islands only—For Oxisols or soils in Oxic subgroups, or Ultisols with an isohyperthermic soil temperature regime; depth to ≥ 45% Al saturation of the ECEC and soil pH (1:1 water) is ≤ 5.5. (non-renewable)
<50 50-100
100-150 >150
1235
1/ Subaqueous soils (i.e. soils classified in Wassents or Wassists suborders) are excluded from assignment of T factors.
2/ Severely eroded soils, as designated in the local phase or erosion class is a 3 or 4, are adjusted one class of T factor lower.
3/ Determines the line between the 30% clay and 70% sand point, and the 0% clay and 50% sand point on the texture triangle (see Exhibit
618-8). If the total of the vcos, cos, ms, and fs sand separates and total clay (of the adjacent layers above the sandy substratum) plot
above this line on the texture triangle, then the uppers layers are considered different from the sandy substratum textures. Thus, the sandy
substratum is recognized and T factor is lowered.
(430-VI-NSSH, 2010)

Part 618 – Soil Properties and Qualities 618-110
Exhibit 618-15 Texture Class, Texture Modifier, and Terms Used in Lieu of Texture.
Texture Modifier** Texture Class Terms used in lieu of textureART Artifactual C Clay ART ArtifactsARTV Very artifactual CL Clay loam BR BedrockARTX Extremely artifactual COS Coarse sand BY BouldersASHY Ashy COSL Coarse sandy loam CB CobblesBY Bouldery FS Fine sand CGM Coarse gypsum materialBYV Very bouldery FSL Fine sandy loam CN Channers BYX Extremely bouldery L Loam FGM Fine gypsum material CB Cobbly LCOS Loamy coarse sand FL FlagstonesCBV Very cobbly LFS Loamy fine sand GR GravelCBX Extremely cobbly LS Loamy sand HPM Highly decomposed CEM Cemented LVFS Loamy very plant materialCN Channery fine sand MAT Material CNV Very channery S Sand MPM Moderately decomposed CNX Extremely channery SC Sandy clay plant materialCOP Coprogenous SCL Sandy clay loam MPT Mucky peatDIA Diatomaceous SI Silt MUCK MuckFL Flaggy SIC Silty clay PBY ParabouldersFLV Very flaggy SICL Silty clay loam PCB Paracobbles FLX Extremely flaggy SIL Silt loam PCN Parachanners GR Gravelly SL Sandy loam PEAT Peat GRC Coarse gravelly VFS Very fine sand PFL Paraflagstones GRF Fine gravelly VFSL Very fine PG ParagravelGRM Medium gravelly sandy loam PST ParastonesGRV Very gravelly SPM Slightly decomposed GRX Extremely gravelly plant material GS Grassy ST StonesGYP Gypsiferous W WaterHB HerbaceousHO Highly organicHYDR Hydrous MEDL MedialMK MuckyMR MarlyMS MossyPBY ParaboulderyPBYV Very paraboulderyPBYX Extremely paraboulderyPCB ParacobblyPCBV Very paracobblyPCBX Extremely paracobblyPCN ParachanneryPCNV Very parachanneryPCNX Extremely parachanneryPF Permanently frozenPFL Paraflaggy ** "Texture Modifiers" may apply to both "texture class" and PFLV Very paraflaggy "terms used in lieu of texture". Some apply to both, others only PFLX Extremely paraflaggy apply to one or the other. Refer to part 618.67.PGR ParagravellyPGRV Very paragravellyPGRX Extremely paragravellyPST ParastonyPSTV Very parastony
(430-VI-NSSH, 2010)

Part 618 – Soil Properties and Qualities 618-111
PSTX Extremely parastonyPT PeatyST StonySTV Very stonySTX Extremely stonyWD Woody
(430-VI-NSSH, 2010)

Part 618 – Soil Properties and Qualities 618-112
Exhibit 618-16 Wind Erodibility Groups (WEG) and Index.
WEG 1,3,4,5,7 Properties of Soil Surface Layer
Dry Soil Aggregates More Than 0.84 mm (wt.%)
Wind Erodibility Index (I) (tons/ac/yr)
1 Very fine sand, fine sand, sand or coarse sand2 12357
310250220180160
2 Loamy very fine sand, loamy fine sand, loamy sand, loamy coarse sand; very fine sandy loam and silt loam with 5 or less percent clay and 25 or less percent very fine sand; and sapric soil materials (as defined in Soil Taxonomy); except Folists
10 134
3 Very fine sandy loam (but does not meet WEG criterion 2), fine sandy loam, sandy loam, coarse sandy loam; noncalcareous silt loam that has greater than or equal to 20 to less than 50 percent very fine sand, and greater than or equal to 5 to less than 12 percent clay.
25 86
4 Clay, silty clay, noncalcareous clay loam that has more than 35 percent clay and noncalcareous silty clay loam that has more than 35 percent clay. All of these do not have sesquic, parasesquic, ferritic, ferruginous, or kaolinitic mineralogy (high iron oxide content).
25 86
4L Calcareous6 loam, calcareous silt loam, calcareous silt, calcareous sandy clay, calcareous sandy clay loam, calcareous clay loam and calcareous silty clay loam.
25 86
5 Noncalcareous loam that has less than 20 percent clay; noncalcareous silt loam with greater than or equal to 5 to less than 20 percent clay (but does not meet WEG criterion 3); noncalcareous sandy clay loam; noncalcareous sandy clay; and hemic materials (as defined in Soil Taxonomy).
40 56
6 Noncalcareous loam and silt loam that have greater than or equal to 20 percent clay; noncalcareous clay loam and noncalcareous silty clay loam that has less than or equal to 35 percent clay; silt loam that has parasesquic, ferritic, or kaolinitic mineralogy (high iron oxide content)
45 48
7 Noncalcareous silt; noncalcareous silty clay, noncalcareous silty clay loam, and noncalcareous clay that have sesquic, parasesquic, ferritic, ferruginous, or kaolinitic mineralogy (high content of iron oxide) and are Oxisols or Ultisols; and fibric material (as defined in Soil Taxonomy)
50 38
8 Soils not susceptible to wind erosion due to rock and pararock fragments at the surface and/or wetness; and Folists
-- 0
(430-VI-NSSH, 2010)

Part 618 – Soil Properties and Qualities 618-113
1 For all WEGs except sands and loamy sand textures, if percent rock and pararock fragments (>2mm) by volume is 15-35, reduce “I” value by one group with more favorable rating. If percent rock and pararock fragments by volume is 35-60, reduce “I” value by two favorable groups except for sands and loamy sand textures which are reduced by one group with more favorable rating. If percent rock and pararock fragments is greater than 60, use “I” value of 0 for all textures except sands and loamy sand textures which are reduced by three groups with more favorable ratings. An example of more favorable “I” rating is next lower number - “I” factor of 160 to “I” factor of 134 or “I” factor of 86 to “I” factor of 56. The index values should correspond exactly to their wind erodibility group.
2 The “I” values for WEG 1 vary from 160 for coarse sands to 310 for very fine sands. Use an “I” of 220 as an average figure.
3 All material that meets criterion 3 in the requirements for andic soil properties in the Keys to Soil Taxonomy, 10th edition, regardless of the fine earth texture, are placed in WEG 2.
4 All material that meets criterion 2, but not criterion 3, in the requirements for andic soil properties in the Keys to Soil Taxonomy, 10th edition, regardless of the fine earth texture, are placed in WEG 6 except for medial classes of Cryic Spodosols having MAAT < 40 degrees F., which are placed in WEG 2.
5 Surface layers or horizons that do not meet andic soil properties criteria but do meet Vitrandic, Vitritorrandic, and Vitrixerandic subgroup criteria (thickness requirement excluded) move one group with less favorable rating.
6 Calcareous is a strongly or violently effervescent reaction of the fine-earth fraction to cold dilute (1N) HCL; a paper “Computing the Wind Erodible Fraction of Soils” by D. W. Fryear et.al (1994) in the J. Soil and Water Conservation 49 (2) 183-188 raises a yet unresolved question regarding the effect of carbonates on wind erosion.
7 For soils with thin “O” horizons on mineral soils, WEG is based on the first mineral horizon.
(430-VI-NSSH, 2010)
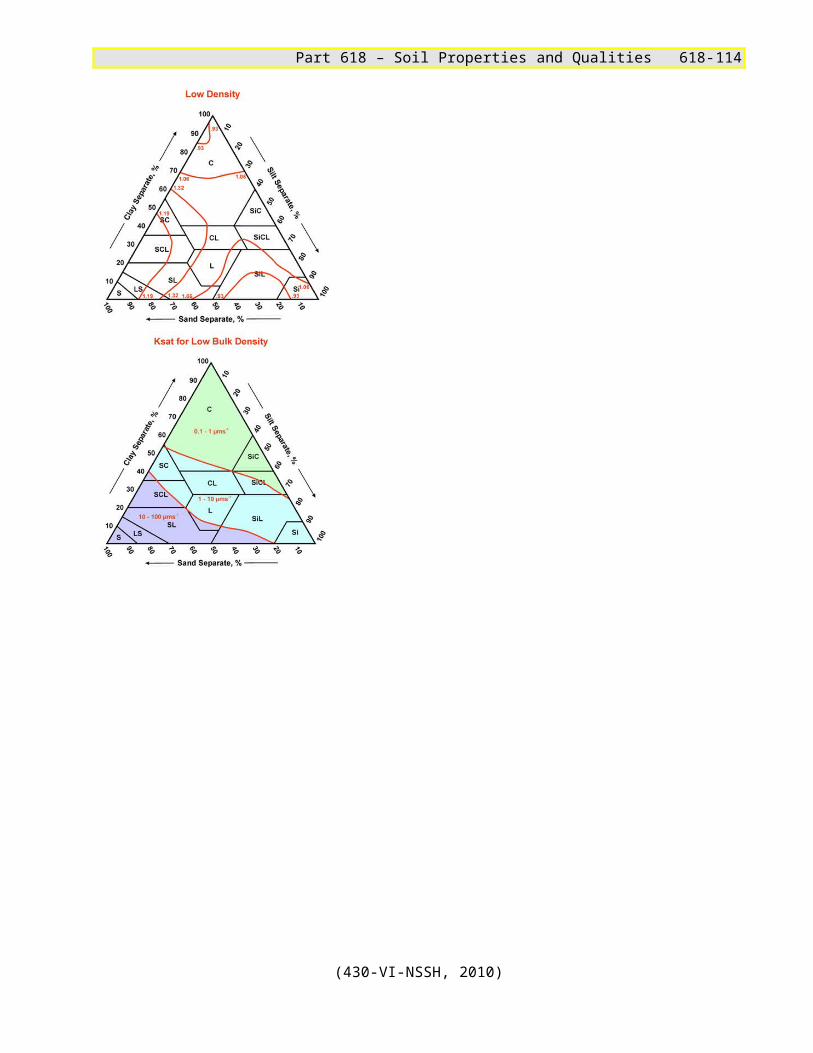
Part 618 – Soil Properties and Qualities 618-114
Exhibit 618-17 Key Landforms and Their Susceptibility to Slippage.
Topography
Landform or Geological Materials
Slippage PotentialA
I. Level TerrainA. Not elevated Floodplain, Till
plain, Lake bed 3B. Elevated
1. Uniform Tones Terrace, Lake bed 2
2. Surface irregularities, sharp cliff Basaltic plateau 13.Interbedded-porous over impervious layers Lake bed,
coastal plain 1II. Hilly Terrain
A. Surface Drainage not well integrated1. Disconnected drainage Limestone 32.Deranged drainage, overlapping hills, associated with lakes and swamps (glaciated areas only)
Moraine2
B. Surface drainage well integrated1. Parallel ridges
a. Parallel drainage, dark tones Basaltic hills 1b. Trellis drainage, ridge-and-valley
topography, banded hillsDownslope tilted sedimentary rock 1
c. Pinnate drainage, vertical-sided gullies Loess 22. Branching ridges, hilltops at common elevation
a. Pinnate drainage. vertical-sided gullies Loess 2b. Dendritic drainage
(1) Banding on slopes Flat-lying sed. rocks 2
(2) No banding on slopes(a) Moderately to highly dissected
ridges, uniform slopesClay Shale 1
(b) Low ridges associated with coastal features
Dissected coastal plains 1
(c) Winding ridges connection conical hills, sparse vegetation
Serpentinite 13. Random ridges or hills
a. Dendritic drainage(1) Low, rounded hills meandering streams Clay shale 1(2) Winding ridges, connecting conical
hills, sparse vegetationSerpentinite 1
(3) Massive, uniform, rounded to A-shaped hills
Granite 2(4) Bumpy topography (glaciated areas
only)Moraines 2
(430-VI-NSSH, 2010)

Part 618 – Soil Properties and Qualities 618-115
III. Level to Hilly TerrainA. Steep slopes Talus, colluvium 1B. Moderate to flat slopes Fan, delta 3C. Hummocky slopes with scarp at head Old slide 1
A.1 = susceptible to slippage (Unstable);2 = susceptible to slippage under certain conditions (Moderately unstable);3 = not susceptible to slippage except in vulnerable locations (Slightly unstable to stable).
Exhibit 618-18 Example Worksheets for Soil Moisture State by Month and Depth
SOIL MOISTURE STATE BY MONTH AND DEPTH
Aridic ThermicJAN FEB MAR APR MAY JUN JUL AUG SEP OCT NOV DEC
Ppt (mm)
10 10 8 4 6 2 8 10 6 4 8 8
0
SOILDEPTH
200 cm
M
D
M
D
M
D
M
D D D D D D D D
M
D
Xeric MesicJAN FEB MAR APR MAY JUN JUL AUG SEP OCT NOV DEC
Ppt (mm)
180 140 110 60 40 30 10 20 40 80 170 200
0
SOILDEPTH
200 cm
M
W
M
W
M
W
M M
D
M
D
M
D
M
M
D
MM M
W
Ustic MesicJAN FEB MAR APR MAY JUN JUL AUG SEP OCT NOV DEC
Ppt (mm)
10 15 50 60 80 100 70 70 70 40 25 15
0
SOILDEPTH
200 cm
M
DM
M
DM
M
DM
M M M
D
MDM D
M
M
DM
M
DM
M
DM
Udic Mesic(430-VI-NSSH, 2010)

Part 618 – Soil Properties and Qualities 618-116
JAN FEB MAR APR MAY JUN JUL AUG SEP OCT NOV DECPpt (mm)
50 60 80 80 100 100 110 90 70 50 80 70
0
SOILDEPTH
200 cm
M
W
M
W
MW
MW
M
WM M
D
M
D
M M M
W
M
W
(430-VI-NSSH, 2010)

Part 618 – Soil Properties and Qualities 618-117
SOIL MOISTURE STATE BY MONTH AND DEPTHJAN FEB MAR APR MAY JUN JUL AUG SEP OCT NOV DEC
Ppt (mm) 0
SOILDEPTH
200 cm
SOIL MOISTURE STATE BY MONTH AND DEPTHJAN FEB MAR APR MAY JUN JUL AUG SEP OCT NOV DEC
Ppt (mm) 0
SOILDEPTH
200 cm
SOIL MOISTURE STATE BY MONTH AND DEPTHJAN FEB MAR APR MAY JUN JUL AUG SEP OCT NOV DEC
Ppt (mm) 0
SOILDEPTH
200 cm
SOIL MOISTURE STATE BY MONTH AND DEPTHJAN FEB MAR APR MAY JUN JUL AUG SEP OCT NOV DEC
Ppt (mm) 0
SOILDEPTH
(430-VI-NSSH, 2010)

Part 618 – Soil Properties and Qualities 618-118
200 cm
(430-VI-NSSH, 2010)

Part 618 – Soil Properties and Qualities 618-119
Appendix 618-1 NASIS Calculation for Estimating AASHTO Group Index
Definition. Computes the AASHTO Group Index for a horizonInputs. This calculation requires the following data to be populated:
number 200 sieve, liquid limit and plasticity index.
Calculation.
DEFINE skip_ll ANY (aashto_class == "a-2-6" or aashto_class == "a-2-7").DEFINE aashind .01*(sieveno200_r-15)*(pi_r-10).
ASSIGN aashind IF skip_ll OR (sieveno200_r<35 and pi_r>=10) THEN aashind ELSE (sieveno200_r - 35)*(.2 + .005*(ll_r - 40)) + aashind.
ASSIGN aashind IF pi_r==0 OR (aashind<0 AND NOT ISNULL(aashind)) THEN 0 ELSE aashind.
(430-VI-NSSH, 2010)

Part 618 – Soil Properties and Qualities 618-120
Appendix 618-2 NASIS Calculation for Estimating Cation Exchange Capacity
Definition. If the rv pH (in water) is greater than or equal to 5.5 then CEC is calculated; if the rv pH is less than 5.5 then ECEC is calculated for a horizon.
Caution: estimates of CEC or ECEC for soil layers with andic soil properties may be unreliable. Read the documentation to this calculation to see if it will work for your soils.
Inputs. This calculation requires the following data to be populated: organic matter (high, low, and rv)pH in water (high, low, and rv)pH in CaCl (for organic layers) (high, low, and rv)total clay (high, low, and rv)carbonate clay (high, low, and rv)total silt (high, low, and rv)caco3 (high, low, and rv) used only for soils containing gypsumgypsum (high, low, and rv) used only for soils containing gypsumtaxonomic family mineralogytaxonomic ordertaxonomic CEC-activity class
1) The calculation is based on Soil Taxonomy (Soil Survey Staff, 1999). The CEC or ECEC is calculated based on the family mineralogy/CEC-activity class first. If an equation does not exist for a mineralogy/CEC-activity class, then the CEC/ECEC is based on the soil order.
2) If the family mineralogy class, CEC-activity class (if appropriate), and soil order are not populated, a null is returned.
3) If there is more than one family mineralogy class populated in the component-taxonomic-family-class table, the first one is used.
4) If the pH in water is not populated, then pH in CaCl is used. If the pH (CaCl) is greater than or equal to 5.1 then CEC is calculated, otherwise ECEC is calculated for a horizon.
5) If any required data element (OM, pH, clay, silt) for an equation is not populated (null entry), a null is returned, except for carbonate clay.
6) If carbonate clay is null, zero carbonate clay is assumed.7) Noncarbonate clay is calculated by subtracting percent carbonate clay from total
clay (noncarbonated clay = total_clay - carbonate_clay).8) Percent organic matter is converted to percent organic C by dividing by 1.72 (OC
= OM/1.72).9) If only low and high values are populated for a data element, an rv is calculated
by taking the average of the low and high values.10) In
the calculation of CEC for isotic and amorphic mineralogies and Andisols, and isotic mineralogy for ECEC; gravimetric 15-bar water is used. An internal calculation calculates the 15-bar water using the following formula: 15-bar water = (total_clay * (1 - organic_matter / 100) * 0.4 + organic_matter)
11) In the calculation of ECEC, if the mineralogy class is not one of the following (parasesquic, smectitic, isotic); and is not mixed or siliceaous with a CEC activity class; and the soil order is Andisols, Gelisols, Aridisols, or Vertisols then no ECEC is calculated (null is returned).
(430-VI-NSSH, 2010)

Part 618 – Soil Properties and Qualities 618-121
Calculation.
Estimate # -------- gypsum soils ------------------------------------------------------------
DEFINE cecr IF ISNULL(ph1) THEN 1/0ELSE IF ph1 =="yes" and gyp2mm > 4 and gyp2mm <= 40 THEN EXP(0.851*ln_clayr - 0.02*caco3_r - 0.009*gyp2mm + 0.174) * (1-(gyp2mm/100))ELSE IF ph1 =="yes" and gyp2mm > 40 THEN 10.035 - 0.093*gyp2mm
# -------- phwat >= 5.5 or phcacl2 >=5.1 and phwat<=7.0 and OC > 8 ------------------ELSE IF ph1 =="yes"and ocr>14.5 and ph2 =="no"and (lieutex1 == "muck" OR lieutex1 == "hpm") THEN ((2.12 * (ocr)) + (9.992 * (phcacl2r)) - 10.684)ELSE IF ph1 =="yes"and ocr>14.5 and ph2 =="no"and(lieutex1 == "mpt" OR lieutex1 == "mpm") THEN ((2.03 * (ocr)) + (3.396 * (phcacl2r)) - 2.939)ELSE IF ph1 =="yes"and ocr>14.5 and ph2 =="no"and (lieutex1 == "peat" or lieutex1 == "spm") THEN ((1.314 * (ocr)) + 27.047) ELSE IF ph1 =="yes"and ocr>8 and ph2 =="no"and ocr <= 14.5 THEN ((1.823 * (ocr)) + (0.398 * (nclayr)) + 15.54)
# ------------ phwat >=5.5 or phcacl2r >= 5.1 and OC >8 and phwat >7.0 ---------------ELSE IF ph1 =="yes"and ocr>8 and ph2 =="yes"and ocr <= 14.5 THEN EXP(1.316 * (ln_ocr) + 1.063 * (ln_nclayr) - 3.211)ELSE IF ph1 =="yes"and ocr>8 and ph2 =="yes"and ocr >14.5 THEN (4.314 * (ocr) - 26.492)
# ------------ phwat >= 5.5 or phcacl2 >= 5.1 and OC <= 8, use Mineralogy --------------ELSE IF (ph1 =="yes"and ocr <= 8 and taxminalogy1 == "ferruginous")THEN (2.48 * (ocr) + 0.128 * (siltr) + 3.208)ELSE IF (ph1 =="yes"and ocr <= 8 and taxminalogy1 == "amorphic")THEN EXP((0.182*(ln_ocr)) + (0.817*(ln_w15barr)) + (0.736*(ln_phwatr)) - 0.608) ELSE IF (ph1 =="yes"and ocr <= 8 and taxminalogy1 == "glassy")THEN EXP((0.102*(ln_ocr)) + (1.219*(ln_w15barr)) - 0.005) ELSE IF (ph1 =="yes"and ocr <= 8 and (taxminalogy1 == "carbonatic" or taxminalogy1 =="calcareous"))THEN EXP((0.253*(ln_ocr)) + (0.828*(ln_nclayr)) + 0.321) ELSE IF (ph1 =="yes"and ocr <= 8 and taxminalogy1 == "magnesic")THEN (2.38*(ocr) + 0.555*(nclayr) - 0.219*(siltr) + 10.428) ELSE IF (ph1 =="yes"and ocr <= 8 and taxminalogy1 == "parasesquic")THEN EXP((0.13*(ln_ocr)) + (0.65*(ln_nclayr)) + (0.340*(ln_phwatr)) - 0.406) ELSE IF (ph1 =="yes"and ocr <= 8 and taxminalogy1 == "kaolinitic")THEN EXP((0.206*(ln_ocr)) + (0.618*(ln_nclayr)) + (0.303*(ln_siltr)) + (0.491*(ln_phwatr)) - 1.786) ELSE IF (ph1 =="yes"and ocr <= 8 and (taxminalogy1 == "smectitic" OR taxminalogy1 == "montmorillonitic"))THEN EXP((0.033*(ln_ocr)) + (0.861*(ln_nclayr)) + 0.246) ELSE IF (ph1 =="yes"and ocr <= 8 and taxminalogy1 == "illitic")THEN EXP((0.102*(ln_ocr)) + (0.596*(ln_nclayr)) - (1.108*(ln_phwatr)) + 2.892) ELSE IF (ph1 =="yes"and ocr <= 8 and taxminalogy1 == "vermiculitic")THEN (0.365*(nclayr) - 9.724*(phwatr) + 90.293) ELSE IF (ph1 =="yes"and ocr <= 8 and taxminalogy1 == "isotic")THEN EXP((0.163*(ln_ocr)) + (0.683*(ln_w15barr)) + (0.812*(ln_phwatr)) - 0.299) ELSE
(430-VI-NSSH, 2010)

Part 618 – Soil Properties and Qualities 618-122
# ----------------- use CEC Activity Class ----------------------IF (ph1 =="yes"and ocr <=8 and taxceactcl1 == "superactive")THEN EXP((0.039*(ln_ocr)) + (0.901*(ln_nclayr)) + 0.131) ELSE IF (ph1 =="yes"and ocr <= 8 and taxceactcl1 == "active")THEN EXP((0.015*(ln_ocr)) + (0.987*(ln_nclayr)) - 0.576) ELSE IF (ph1 =="yes"and ocr <= 8 and taxceactcl1 == "semiactive")THEN EXP((0.02*(ln_ocr)) + (0.974*(ln_nclayr)) - 0.927) ELSE IF (ph1 =="yes" and ocr <= 8 and taxceactcl1 == "subactive")THEN EXP((0.009*(ln_ocr)) + (1.02*(ln_nclayr)) - 1.675) ELSE
# -------------------use Taxonomic Order -------------------------IF (ph1 =="yes"and ocr <= 0.3 and taxorder1 == "alfisols")THEN EXP((0.911*(ln_nclayr)) - 0.308) ELSE IF (ph1 =="yes"and ocr > 0.3 and ocr <= 8 and taxorder1 == "alfisols")THEN EXP((0.158*(ln_ocr)) + (0.805*(ln_nclayr)) + 0.216) ELSE IF (ph1 =="yes"and ocr <= 8 and taxorder1 == "andisols")THEN EXP((0.088*(ln_ocr)) + (0.885*(ln_w15barr)) + (0.867*(ln_phwatr)) - 0.985) ELSE IF (ph1 =="yes"and ocr <= 8 and taxorder1 == "aridisols")THEN EXP((0.042*(ln_ocr)) + (0.828*(ln_nclayr)) + 0.236) ELSE IF (ph1 =="yes"and ocr <= 8 and taxorder1 == "entisols")THEN EXP((0.078*(ln_ocr)) + (0.873*(ln_nclayr)) + 0.084) ELSE IF (ph1 =="yes"and ocr <= 8 and taxorder1 == "inceptisols")THEN EXP((0.134*(ln_ocr)) + (0.794*(ln_nclayr)) + 0.239) ELSE IF (ph1 =="yes"and ocr <= 0.3 and taxorder1 == "mollisols")THEN EXP((0.932*(ln_nclayr)) - 0.174) ELSE IF (ph1 =="yes"and ocr > 0.3 and ocr <= 8 and taxorder1 == "mollisols")THEN EXP((0.113*(ln_ocr)) + (0.786*(ln_nclayr)) + 0.475) ELSE IF (ph1 =="yes"and ocr <= 8 and taxorder1 == "oxisols")THEN (2.738*(ocr) + 0.103*(nclayr) + 0.123*(siltr) - 2.531) ELSE IF (ph1 =="yes"and ocr <= 8 and taxorder1 == "spodosols")THEN EXP((0.045*(ln_ocr)) + (0.798*(ln_nclayr)) + 0.029) ELSE IF (ph1 =="yes"and ocr <= 8 and taxorder1 == "ultisols")THEN EXP((0.184*(ln_ocr)) + (0.57*(ln_nclayr)) + (0.365*(ln_siltr)) - 0.906) ELSE IF (ph1 =="yes"and ocr <= 8 and taxorder1 == "vertisols")THEN EXP((0.059*(ln_ocr)) + (0.86*(ln_nclayr)) + 0.312) ELSE IF (ph1 =="yes"and ocr <= 8 and taxorder1 == "histosols")THEN EXP((0.319*(ln_ocr)) + (0.497*(ln_nclayr)) + 1.075) ELSE 1/0..
(430-VI-NSSH, 2010)

Part 618 – Soil Properties and Qualities 618-123
Appendix 618-3 NASIS Calculation for Estimating Effective Cation Exchange Capacity
Inputs. See documentation for Appendix 618-2 NASIS calculation for estimating Cation Exchange Capacity.
Calculation.
#---------Calculates ECEC when pH(water) < 5.5---------------------------------------------DEFINE ececrIF ISNULL(ph1) THEN 1/0ELSE IF ph1 == "no" AND ocr > 8 AND taxminalogy1 == "andisols"THEN EXP(0.938*ln_ocr - 0.029*phcacl2r - 0.054)ELSE IF ph1 == "no" AND ocr > 8THEN EXP(0.699*ln_ocr + 0.556*phcacl2r - 1.497)ELSE IF ph1 =="no"AND ocr <= 8 AND desgnmaster1 == "E"THEN EXP((0.371*ln_ocr) + (0.728*ln_nclayr) + (0.392*ln_siltr) + (0.728*ln_phwatr) - 2.145)ELSE IF ph1 =="no"AND ocr <= 8 AND taxminalogy1 == "parasesquic"THEN EXP(0.109*ln_ocr + 0.904*ln_clayr - 0.927*ln_phwatr - 0.083)ELSE IF ph1 =="no"AND ocr <= 8 AND (taxminalogy1 == "smectitic" OR taxminalogy1 == "montmorillonitic")THEN EXP(0.965*ln_clayr + 0.939*ln_phwatr - 1.974)ELSE IF ph1 =="no"AND ocr <= 8 AND taxminalogy1 == "isotic"THEN EXP(0.124*ln_ocr + 0.535*ln_w15barr + 0.405*ln_siltr - 0.455)ELSE IF ph1 =="no"AND ocr <= 8 AND taxceactcl1 == "superactive"THEN EXP(0.035*ln_ocr + 0.913*ln_clayr - 0.341)ELSE IF ph1 =="no"AND ocr <= 8 AND taxceactcl1 == "active"THEN EXP(1.15*ln_clayr - 0.115*ln_ocr - 1.725)ELSE IF ph1 =="no"AND ocr <= 8 AND taxceactcl1 == "semiactive"THEN EXP(1.049*ln_clayr - 0.058*ln_ocr - 1.864)ELSE IF ph1 =="no"AND ocr <= 8 AND taxceactcl1 == "subactive"THEN EXP(0.757*ln_clayr - 1.01*ln_phwatr + 0.214*ln_siltr - 0.465)ELSE IF ph1 =="no"AND ocr <= 8 AND taxorder1 == "alfisols"THEN EXP(0.019*ln_ocr + 0.834*ln_clayr + 0.325*ln_phwatr + 0.288*ln_siltr - 1.937)ELSE IF ph1 =="no"AND ocr <= 8 AND taxorder1 == "entisols"THEN EXP(0.387*ln_ocr + 0.818*ln_clayr - 0.343)ELSE IF ph1 =="no"AND ocr <= 8 AND taxorder1 == "inceptisols"THEN EXP(0.283*ln_ocr + 0.541*ln_clayr + 1.913*ln_phwatr - 2.869)ELSE IF ph1 =="no"AND ocr <= 8 AND taxorder1 == "mollisols"THEN EXP(0.122*ln_ocr + 0.721*ln_clayr + 0.6*ln_phwatr - 0.635)ELSE IF ph1 =="no"AND ocr <= 8 AND taxorder1 == "oxisols"THEN EXP(0.21*ln_ocr + 0.685*ln_clayr - 2.381*ln_phwatr + 0.355*ln_siltr + 1.169)ELSE IF ph1 =="no"AND ocr <= 8 AND taxorder1 == "spodosols"THEN EXP(0.309*ln_ocr + 0.526*ln_clayr + 0.25*ln_siltr - 0.535)ELSE IF ph1 =="no"AND ocr <= 8 AND taxorder1 == "ultisols"THEN EXP(0.555*ln_clayr + 0.481*ln_siltr - 1.204*ln_phwatr + 0.016)ELSE IF ph1 =="no"AND ocr <= 8 AND taxorder1 == "histosols"THEN 0.443*clayr + 2.377*ocr - 2.906ELSE 1/0.
(430-VI-NSSH, 2010)

Part 618 – Soil Properties and Qualities 618-124
Appendix 618-4 NASIS Calculation for Estimating Extractable Acidity
Definition. Computes the extractable acidity for a horizonInputs. This calculation requires the following data to be populated: - organic matter (high, low, and rv) - pH in water (high, low, and rv) - pH in CaCl2 (high, low, and rv) only used for organic layers - total clay (high, low, and rv) only used for medial textures - CEC or ECEC (high, low, and rv) - texture (used for identifying hydrous, medial, ashy, and organic soil layers) - taxonomic order
Liimitations.
1) The calculation is based on regression equations developed from measured data in the characterization database. There are regression equations for O horizons of Histosols, O horizons of other soil orders, hydrous textures, medial textures, ashy textures, and mineral layers for each soil order.
2) There are a set of regression equations that use CEC and another set that use ECEC as a predictor variable. IF the pH is < 5.5, then the set of equations that use ECEC is used. IF ECEC in not populated than a null is returned (regardless if CEC is populated or not).
3) If any required data element (OM, pH, CEC or ECEC) for an equation is not populated (null entry), a null is returned.
4) Organic C is used in the equations. Percent organic matter is converted to percent organic C by dividing by 1.72 (OC = OM/1.72).
Calculation.
DEFINE ocr om_r/1.72.DEFINE ocl om_l/1.72.DEFINE och om_h/1.72.
#-----Calculate RV extractable acidity---------------
DEFINE acidr IF NOT ISNULL(cec7_r) AND (ph1to1h2o_r >= 5.5 OR ph01mcacl2_r >= 5.5) THEN IF (hzname matches "*O*" OR texture matches "*MPT*" OR texture matches "*MUCK*" OR texture matches "*PEAT*" OR texture matches "*HPM*" OR texture matches "*MPM*" OR texture matches "*SPM*") AND ph1to1h2o_r > 6.1 THEN 0.19*cec7_r - 11.411*ph1to1h2o_r + 78.341 ELSE IF taxord == "histosols" AND NOT ISNULL(taxord) AND (hzname matches "*O*" OR texture matches "*MPT*" OR texture matches "*MUCK*" OR texture matches "*PEAT*") THEN 0.289*cec7_r + 0.358*ocr - 26.390*ph01mcacl2_r + 149.662 ELSE IF (hzname matches "*O*" AND NOT ISNULL(hzname)) OR ((texture matches "*HPM*" OR texture matches "*MPM*" OR texture matches "*SPM*" OR texture matches "*MPT*" OR texture matches "*MUCK*" OR texture matches "*PEAT*") AND NOT ISNULL(texture)) THEN 0.470*cec7_r + 0.298*ocr - 19.702*ph01mcacl2_r + 100.585 ELSE IF texture matches "*HYDR*" AND NOT ISNULL(texture) THEN -0.312*cec7_r + 3.726*ocr - 20.442*ph1to1h2o_r + 159.093 ELSE IF texture matches "*MEDL*" AND NOT ISNULL(texture) THEN 0.564*cec7_r - 0.326*claytotal_r - 8.825*ph1to1h2o_r + 75.799 ELSE IF texture matches "*ASHY*" AND NOT ISNULL(texture) THEN 0.134*cec7_r + 2.669*ocr - 1.972*ph1to1h2o_r + 14.051 ELSE IF taxord == "histosols" THEN 0.673*cec7_r - 7.659*ph1to1h2o_r + 44.466 ELSE IF taxord == "gelisols" THEN 0.36*cec7_r - 4.301*ph1to1h2o_r + 31.87 ELSE IF taxord == "entisols" THEN 0.148*cec7_r + 1.679*ocr - 1.791*ph1to1h2o_r + 12.254 ELSE IF taxord == "mollisols" THEN 0.112*cec7_r + 0.595*ocr -
(430-VI-NSSH, 2010)

Part 618 – Soil Properties and Qualities 618-125
2.745*ph1to1h2o_r + 19.964 ELSE IF taxord == "alfisols" THEN 0.205*cec7_r + 1.113*ocr - 2.928*ph1to1h2o_r + 19.545 ELSE IF taxord == "aridisols" THEN 0.047*cec7_r + 0.535*ocr - 0.973*ph1to1h2o_r + 7.735 ELSE IF taxord == "ultisols" THEN 0.850*cec7_r + 0.361*ocr - 2.125*ph1to1h2o_r + 11.741 ELSE IF taxord == "inceptisols" THEN 0.496*cec7_r + 0.698*ocr - 5.010*ph1to1h2o_r + 31.299 ELSE IF taxord == "vertisols" THEN 0.061*cec7_r + 0.775*ocr -3.557*ph1to1h2o_r + 26.936 ELSE IF taxord == "spodosols" THEN 1.226*cec7_r - 0.524*ocr - 3.429*ph1to1h2o_r + 20.975 ELSE IF taxord == "oxisols" THEN 0.499*cec7_r + 1.679*ocr - 2.055*ph1to1h2o_r + 16.422 ELSE IF taxord == "andisols" THEN 0.763*cec7_r - 4.328*ph1to1h2o_r + 28.591 ELSE 1/0 ELSE IF NOT ISNULL(ecec_r) THEN IF taxord == "histosols" AND NOT ISNULL(taxord) AND (hzname matches "*O*" OR texture matches "*MPT*" OR texture matches "*MUCK*" OR texture matches "*PEAT*") THEN 0.471*ocr - 20.556*ph01mcacl2_r + 142.732 ELSE IF (hzname matches "*O*" AND NOT ISNULL(hzname)) OR ((texture matches "*HPM*" OR texture matches "*MPM*" OR texture matches "*SPM*" OR texture matches "*MPT*" OR texture matches "*MUCK*" OR texture matches "*PEAT*") AND NOT ISNULL(texture)) THEN 1.03*ocr - 19.587*ph01mcacl2_r + 110.208 ELSE IF taxord == "histosols" THEN 2.717*ocr + 9.247 ELSE IF taxord == "gelisols" THEN 0.965*ocr - 4.503*ph1to1h2o_r + 35.377 ELSE IF taxord == "entisols" THEN 0.147*claytotal_r + 2.7*ocr - 1.484*ph1to1h2o_r + 9.572 ELSE IF taxord == "mollisols" THEN 0.148*claytotal_r + 1.692*ocr - 2.411*ph1to1h2o_r + 15.606 ELSE IF taxord == "alfisols" THEN 0.188*claytotal_r + 2.353*ocr - 4.612*ph1to1h2o_r + 25.601 ELSE IF taxord == "aridisols" THEN 0.033*claytotal_r + 2.392*ocr + 2.391*ph1to1h2o_r - 9.935 ELSE IF taxord == "ultisols" THEN 0.899*ecec_r + 0.111*claytotal_r + 2.438*ocr - 1.254*ph1to1h2o_r + 6.046 ELSE IF taxord == "inceptisols" THEN 0.429*ecec_r + 0.078*claytotal_r + 3.052*ocr - 2.053*ph1to1h2o_r + 15.165 ELSE IF taxord == "vertisols" THEN 0.157*claytotal_r + 2.437*ocr - 2.949*ph1to1h2o_r + 15.531 ELSE IF taxord == "spodosols" THEN 1.581*ecec_r + 3.054*ocr + 6.68 ELSE IF taxord == "oxisols" THEN 0.342*ecec_r + 0.078*claytotal_r + 3.176*ocr + 3.932 ELSE IF taxord == "andisols" THEN 0.879*ocr - 12.847*ph1to1h2o_r + 96.871 ELSE 1/0 ELSE 1/0.
ASSIGN acidr IF acidr < 0 AND NOT ISNULL(acidr) THEN 0 ELSE acidr.
#-----Calculate low extractable acidity---------------
DEFINE acidl IF NOT ISNULL(cec7_l) AND (ph1to1h2o_r >= 5.5 OR ph01mcacl2_r >= 5.5) THEN IF (hzname matches "*O*" OR texture matches "*MPT*" OR texture matches "*MUCK*" OR texture matches "*PEAT*" OR texture matches "*HPM*" OR texture matches "*MPM*" OR texture matches "*SPM*") AND ph1to1h2o_r > 6.1 THEN 0.19*cec7_l - 11.411*ph1to1h2o_h + 78.341 ELSE IF taxord == "histosols" AND NOT ISNULL(taxord) AND (hzname matches "*O*" OR texture matches "*MPT*" OR texture matches "*MUCK*" OR texture matches "*PEAT*") THEN 0.289*cec7_l + 0.358*ocl - 26.390*ph01mcacl2_h + 149.662 ELSE IF (hzname matches "*O*" AND NOT ISNULL(hzname)) OR ((texture matches "*HPM*" OR texture matches "*MPM*" OR texture matches "*SPM*" OR texture matches "*MPT*" OR texture matches "*MUCK*" OR texture matches "*PEAT*") AND NOT ISNULL(texture)) THEN 0.470*cec7_l + 0.298*ocl - 19.702*ph01mcacl2_h + 100.585 ELSE IF texture matches "*HYDR*" AND NOT ISNULL(texture) THEN -0.312*cec7_h + 3.726*ocl - 20.442*ph1to1h2o_h + 159.093 ELSE IF texture matches "*MEDL*" AND NOT ISNULL(texture) THEN 0.564*cec7_l - 0.326*claytotal_h - 8.825*ph1to1h2o_h + 75.799 ELSE IF texture matches "*ASHY*" AND NOT ISNULL(texture) THEN 0.134*cec7_l + 2.669*ocl - 1.972*ph1to1h2o_h + 14.051 ELSE IF taxord == "histosols" THEN 0.673*cec7_l - 7.659*ph1to1h2o_h + 44.466 ELSE IF taxord == "gelisols" THEN 0.36*cec7_l - 4.301*ph1to1h2o_h + 31.87 ELSE IF taxord == "entisols" THEN 0.148*cec7_l + 1.679*ocl - 1.791*ph1to1h2o_h + 12.254 ELSE IF taxord == "mollisols" THEN 0.112*cec7_l + 0.595*ocl - 2.745*ph1to1h2o_h + 19.964 ELSE IF taxord == "alfisols" THEN 0.205*cec7_l + 1.113*ocl - 2.928*ph1to1h2o_h + 19.545 ELSE IF taxord == "aridisols" THEN 0.047*cec7_l + 0.535*ocl - 0.973*ph1to1h2o_h + 7.735 ELSE IF taxord == "ultisols" THEN 0.850*cec7_l + 0.361*ocl - 2.125*ph1to1h2o_h + 11.741 ELSE IF taxord == "inceptisols" THEN 0.496*cec7_l + 0.698*ocl - 5.010*ph1to1h2o_h + 31.299 ELSE IF taxord == "vertisols" THEN 0.061*cec7_l + 0.775*ocl -3.557*ph1to1h2o_h + 26.936 ELSE IF taxord == "spodosols" THEN 1.226*cec7_l - 0.524*och -
(430-VI-NSSH, 2010)

Part 618 – Soil Properties and Qualities 618-126
3.429*ph1to1h2o_h + 20.975 ELSE IF taxord == "oxisols" THEN 0.499*cec7_l + 1.679*ocl - 2.055*ph1to1h2o_h + 16.422 ELSE IF taxord == "andisols" THEN 0.763*cec7_l - 4.328*ph1to1h2o_h + 28.591 ELSE 1/0 ELSE IF NOT ISNULL(ecec_l) THEN IF taxord == "histosols" AND NOT ISNULL(taxord) AND (hzname matches "*O*" OR texture matches "*MPT*" OR texture matches "*MUCK*" OR texture matches "*PEAT*") THEN 0.471*ocl - 20.556*ph01mcacl2_h + 142.732 ELSE IF (hzname matches "*O*" AND NOT ISNULL(hzname)) OR ((texture matches "*HPM*" OR texture matches "*MPM*" OR texture matches "*SPM*" OR texture matches "*MPT*" OR texture matches "*MUCK*" OR texture matches "*PEAT*") AND NOT ISNULL(texture)) THEN 1.03*ocl - 19.587*ph01mcacl2_h + 110.208 ELSE IF taxord == "histosols" THEN 2.717*ocl + 9.247 ELSE IF taxord == "gelisols" THEN 0.965*ocl - 4.503*ph1to1h2o_h + 35.377 ELSE IF taxord == "entisols" THEN 0.147*claytotal_l + 2.7*ocl - 1.484*ph1to1h2o_h + 9.572 ELSE IF taxord == "mollisols" THEN 0.148*claytotal_l + 1.692*ocl - 2.411*ph1to1h2o_h + 15.606 ELSE IF taxord == "alfisols" THEN 0.188*claytotal_l + 2.353*ocl - 4.612*ph1to1h2o_h + 25.601 ELSE IF taxord == "aridisols" THEN 0.033*claytotal_l + 2.392*ocl + 2.391*ph1to1h2o_l - 9.935 ELSE IF taxord == "ultisols" THEN 0.899*ecec_l + 0.111*claytotal_l + 2.438*ocl - 1.254*ph1to1h2o_h + 6.046 ELSE IF taxord == "inceptisols" THEN 0.429*ecec_l + 0.078*claytotal_l + 3.052*ocl - 2.053*ph1to1h2o_h + 15.165 ELSE IF taxord == "vertisols" THEN 0.157*claytotal_l + 2.437*ocl - 2.949*ph1to1h2o_h + 15.531 ELSE IF taxord == "spodosols" THEN 1.581*ecec_l + 3.054*ocl + 6.68 ELSE IF taxord == "oxisols" THEN 0.342*ecec_l + 0.078*claytotal_l + 3.176*ocl + 3.932 ELSE IF taxord == "andisols" THEN 0.879*ocl - 12.847*ph1to1h2o_h + 96.871 ELSE 1/0 ELSE 1/0.
ASSIGN acidl IF acidl < 0 AND NOT ISNULL(acidl) THEN 0 ELSE acidl.
#-----Calculate high extractable acidity---------------
DEFINE acidh IF NOT ISNULL(cec7_h) AND (ph1to1h2o_r >= 5.5 OR ph01mcacl2_r >= 5.5) THEN IF (hzname matches "*O*" OR texture matches "*MPT*" OR texture matches "*MUCK*" OR texture matches "*PEAT*" OR texture matches "*HPM*" OR texture matches "*MPM*" OR texture matches "*SPM*") AND ph1to1h2o_r > 6.1 THEN 0.19*cec7_h - 11.411*ph1to1h2o_l + 78.341 ELSE IF taxord == "histosols" AND NOT ISNULL(taxord) AND (hzname matches "*O*" OR texture matches "*MPT*" OR texture matches "*MUCK*" OR texture matches "*PEAT*") THEN 0.289*cec7_h + 0.358*och - 26.390*ph01mcacl2_l + 149.662 ELSE IF (hzname matches "*O*" AND NOT ISNULL(hzname)) OR ((texture matches "*HPM*" OR texture matches "*MPM*" OR texture matches "*SPM*" OR texture matches "*MPT*" OR texture matches "*MUCK*" OR texture matches "*PEAT*") AND NOT ISNULL(texture)) THEN 0.470*cec7_h + 0.298*och - 19.702*ph01mcacl2_l + 100.585 ELSE IF texture matches "*HYDR*" AND NOT ISNULL(texture) THEN -0.312*cec7_l + 3.726*och - 20.442*ph1to1h2o_l + 159.093 ELSE IF texture matches "*MEDL*" AND NOT ISNULL(texture) THEN 0.564*cec7_h - 0.326*claytotal_l - 8.825*ph1to1h2o_l + 75.799 ELSE IF texture matches "*ASHY*" AND NOT ISNULL(texture) THEN 0.134*cec7_h + 2.669*och - 1.972*ph1to1h2o_l + 14.051 ELSE IF taxord == "histosols" THEN 0.673*cec7_h - 7.659*ph1to1h2o_l + 44.466 ELSE IF taxord == "gelisols" THEN 0.36*cec7_h - 4.301*ph1to1h2o_l + 31.87 ELSE IF taxord == "entisols" THEN 0.148*cec7_h + 1.679*och - 1.791*ph1to1h2o_l + 12.254 ELSE IF taxord == "mollisols" THEN 0.112*cec7_h + 0.595*och - 2.745*ph1to1h2o_l + 19.964 ELSE IF taxord == "alfisols" THEN 0.205*cec7_h + 1.113*och - 2.928*ph1to1h2o_l + 19.545 ELSE IF taxord == "aridisols" THEN 0.047*cec7_h + 0.535*och - 0.973*ph1to1h2o_l + 7.735 ELSE IF taxord == "ultisols" THEN 0.850*cec7_h + 0.361*och - 2.125*ph1to1h2o_l + 11.741 ELSE IF taxord == "inceptisols" THEN 0.496*cec7_h + 0.698*och - 5.010*ph1to1h2o_l + 31.299 ELSE IF taxord == "vertisols" THEN 0.061*cec7_h + 0.775*och -3.557*ph1to1h2o_l + 26.936 ELSE IF taxord == "spodosols" THEN 1.226*cec7_h - 0.524*ocl - 3.429*ph1to1h2o_l + 20.975 ELSE IF taxord == "oxisols" THEN 0.499*cec7_h + 1.679*och - 2.055*ph1to1h2o_l + 16.422 ELSE IF taxord == "andisols" THEN 0.763*cec7_h - 4.328*ph1to1h2o_l + 28.591 ELSE 1/0 ELSE IF NOT ISNULL(ecec_h) THEN IF taxord == "histosols" AND NOT ISNULL(taxord) AND (hzname matches "*O*" OR texture matches "*MPT*" OR texture matches "*MUCK*" OR texture matches "*PEAT*") THEN 0.471*och - 20.556*ph01mcacl2_l + 142.732 ELSE IF (hzname matches "*O*" AND NOT ISNULL(hzname)) OR ((texture matches "*HPM*" OR texture matches "*MPM*" OR texture matches "*SPM*" OR texture matches "*MPT*" OR texture matches "*MUCK*" OR
(430-VI-NSSH, 2010)

Part 618 – Soil Properties and Qualities 618-127
texture matches "*PEAT*") AND NOT ISNULL(texture)) THEN 1.03*och - 19.587*ph01mcacl2_l + 110.208 ELSE IF taxord == "histosols" THEN 2.717*och + 9.247 ELSE IF taxord == "gelisols" THEN 0.965*och - 4.503*ph1to1h2o_l + 35.377 ELSE IF taxord == "entisols" THEN 0.147*claytotal_h + 2.7*och - 1.484*ph1to1h2o_l + 9.572 ELSE IF taxord == "mollisols" THEN 0.148*claytotal_h + 1.692*och - 2.411*ph1to1h2o_l + 15.606 ELSE IF taxord == "alfisols" THEN 0.188*claytotal_h + 2.353*och - 4.612*ph1to1h2o_l + 25.601 ELSE IF taxord == "aridisols" THEN 0.033*claytotal_h + 2.392*och + 2.391*ph1to1h2o_h - 9.935 ELSE IF taxord == "ultisols" THEN 0.899*ecec_h + 0.111*claytotal_h + 2.438*och - 1.254*ph1to1h2o_l + 6.046 ELSE IF taxord == "inceptisols" THEN 0.429*ecec_h + 0.078*claytotal_h + 3.052*och - 2.053*ph1to1h2o_l + 15.165 ELSE IF taxord == "vertisols" THEN 0.157*claytotal_h + 2.437*och - 2.949*ph1to1h2o_l + 15.531 ELSE IF taxord == "spodosols" THEN 1.581*ecec_h + 3.054*och + 6.68 ELSE IF taxord == "oxisols" THEN 0.342*ecec_h + 0.078*claytotal_h + 3.176*och + 3.932 ELSE IF taxord == "andisols" THEN 0.879*och - 12.847*ph1to1h2o_l + 96.871 ELSE 1/0 ELSE 1/0.
ASSIGN acidh IF acidh < 0 AND NOT ISNULL(acidh) THEN 0 ELSE acidh.
# Calcareous soils have little or no acidity. A pH value of 8.2 approximates the pH of calcareous soils.# A check to make sure that zero extractable acidity is included in the acidity range when pH is >= 8.3ASSIGN acidr IF ph1to1h2o_l >= 8.3 THEN 0 ELSE acidr.ASSIGN acidl IF acidr == 0 THEN 0 ELSE acidl.ASSIGN acidl IF ph1to1h2o_r >= 8.3 THEN 0 ELSE acidl.
(430-VI-NSSH, 2010)

Part 618 – Soil Properties and Qualities 618-128
Appendix 618-5 NASIS Calculation for Estimating Liquid Limit and Plasticity Index
Definition. This calculation computes the Atterberg Limits (Plasticity Index and Liquid Limit). The low, rv, and high are calculated.The calculation works on all records (horizons) in your selected set that you have permission to edit, except as described in #7 below. For some horizons, such as bedrock or cemented layers, it may not be appropriate to calculate Atterberg limits. You may wish to tailor your selected set accordingly. There is a companion report available to preview results of this calculation. The calculation script is imbedded in the report script. The report is designed to display your current stored LL and PI values along side the calculated values. Viewing the results in this fashion might be useful in determining whether or not you wish to run the calculation on your selected set. The name of the Pangaea report is "UTIL - Comparison of LL and PI, stored vs calculated".CAUTION: the LI and PI calculations may produce poor estimates for Andisols and Spodosols.
Inputs. This calculation requires the following data to be populated: organic matter percent (l,rv,h)linear extensibility percent (l,rv,h)clay total separate (l,rv,h)clay sized carbonate (l,rv,h)
Guidelines For Implementing Equations for LL and PI In NASIS:
1) Values for LL and PI low, high and rv are computed.2) The calculations are based on the non-carbonate clay fraction.3) If clay sized carbonate is null then non-carbonate clay = total clay.4) The water fifteen bar (volumetric) values from the database are not used.
Instead it is estimated on a gravimetric basis using total clay and organic matter values.
5) If low and/or high values for LEP, clay sized carbonate, or OM are null, set to zero and proceed with estimate (reduced accuracy is < 1.5%).
6) If RV values for these input variables is null, compute as the average of low and high values(L + H/2) and proceed with the calculation.
7) If OM > 25% or total clay is null, then LL or PI are not calculated.8) The PI is estimated first, then LL.9) If PI equals 0, LL rv and low values are set to 0 and the LL high is set to 14.10) If
LL is < 15, LL rv and low values are set to 0 and LL high value is set to 14.11) Co
mputed values for LL and PI are converted to nearest whole number.
Calculation.
# Use zero if inputs are null (l).DEFINE oml IF ISNULL(om_l) THEN 0 ELSE om_l.DEFINE lepl IF ISNULL(lep_l) THEN 0 ELSE lep_l.
(430-VI-NSSH, 2010)

Part 618 – Soil Properties and Qualities 618-129
DEFINE claytotall IF ISNULL(claytotal_l) THEN 0 ELSE claytotal_l.DEFINE claysizedcarbl IF ISNULL(claysizedcarb_l) THEN 0 ELSE claysizedcarb_l.DEFINE ncclayl claytotall - claysizedcarbl.
# Calculate the 15 bar water content (low) on a gravimetric basis.# Assume ratio of 1500KPa to Clay percent is 0.4DEFINE F INITIAL 0.4.DEFINE wfifteenbarl (claytotall * (1 - oml/100) * F + oml).
# Calculate the low assuming all inputs are in range.DEFINE pi_l -1.86 + 0.69*wfifteenbarl - 0.69*oml + 0.13*lepl + 0.47*ncclayl.DEFINE ll_l 11.6 + 1.49*wfifteenbarl + 0.78*oml + 0.6*lepl + 0.26*ncclayl.
# Use zero if inputs are null (h).DEFINE omh IF ISNULL(om_h) THEN 0 ELSE om_h.DEFINE leph IF ISNULL(lep_h) THEN 0 ELSE lep_h.DEFINE claytotalh IF ISNULL(claytotal_h) THEN 0 ELSE claytotal_h.DEFINE claysizedcarbh IF ISNULL(claysizedcarb_h) THEN 0 ELSE claysizedcarb_h.DEFINE ncclayh claytotalh - claysizedcarbh.
# Calculate the 15 bar water content (high) on a gravimetric basis.# Assume ratio of 1500KPa to Clay percent is 0.4# DEFINE F INITIAL 0.4 was done above.DEFINE wfifteenbarh (claytotalh * (1 - omh/100) * F + omh).
# Calculate the high assuming all inputs are in range.DEFINE pi_h -1.86 + 0.69*wfifteenbarh - 0.69*omh + 0.13*leph + 0.47*ncclayh.DEFINE ll_h 11.6 + 1.49*wfifteenbarh + 0.78*omh + 0.6*leph + 0.26*ncclayh.
# Use (low + high)/2 if inputs are null (rv).DEFINE om IF ISNULL(om_r) THEN (oml + omh)/2 ELSE om_r.DEFINE lep IF ISNULL(lep_r) THEN (lepl + leph)/2 ELSE lep_r.DEFINE claytotal IF ISNULL(claytotal_r) THEN (claytotall + claytotalh)/2 ELSE claytotal_r.DEFINE claysizedcarb IF ISNULL(claysizedcarb_r) THEN (claysizedcarbl + claysizedcarbh)/2 ELSE claysizedcarb_r.DEFINE ncclay claytotal - claysizedcarb.
# Calculate the 15 bar water content (rv) on a gravimetric basis.# Assume ratio of 1500KPa to Clay percent is 0.4# DEFINE F INITIAL 0.4 was done above.DEFINE wfifteenbar (claytotal * (1 - om/100) * F + om).
# Calculate the rv assuming all inputs are in range.DEFINE pi_r -1.86 + 0.69*wfifteenbar - 0.69*om + 0.13*lep + 0.47*ncclay.DEFINE ll_r 11.6 + 1.49*wfifteenbar + 0.78*om + 0.6*lep + 0.26*ncclay.
# Check for inputs out of range and set results to null.
(430-VI-NSSH, 2010)

Part 618 – Soil Properties and Qualities 618-130
ASSIGN pi_r IF ISNULL(claytotal_r) OR om > 25 OR ncclay < 0 THEN 1/0 ELSE pi_r.ASSIGN ll_r IF ISNULL(claytotal_r) OR om > 25 OR ncclay < 0 THEN 1/0 ELSE ll_r.ASSIGN pi_l IF ISNULL(claytotal_l) OR oml > 25 OR ncclayl < 0 THEN 1/0 ELSE pi_l.ASSIGN ll_l IF ISNULL(claytotal_l) OR oml > 25 OR ncclayl < 0 THEN 1/0 ELSE ll_l.ASSIGN pi_h IF ISNULL(claytotal_h) OR omh > 25 OR ncclayh < 0 THEN 1/0 ELSE pi_h.ASSIGN ll_h IF ISNULL(claytotal_h) OR omh > 25 OR ncclayh < 0 THEN 1/0 ELSE ll_h.
# If calculated PI is negative, set both PI and LL to zero.
ASSIGN pi_r IF NOT ISNULL(pi_r) AND pi_r < 0 THEN 0 ELSE pi_r.ASSIGN ll_r IF ISNULL(pi_r) THEN 1/0 ELSE IF pi_r < 0.5 OR (NOT ISNULL(ll_r) AND ll_r < 15) THEN 0 ELSE ll_r.ASSIGN pi_l IF NOT ISNULL(pi_l) AND pi_l < 0 THEN 0 ELSE pi_l.ASSIGN ll_l IF ISNULL(pi_l) THEN 1/0 ELSE IF pi_l < 0.5 OR (NOT ISNULL(ll_l) AND ll_l < 15) THEN 0 ELSE ll_l.ASSIGN pi_h IF NOT ISNULL(pi_h) AND pi_h < 0 THEN 0 ELSE pi_h.ASSIGN ll_h IF ISNULL(pi_h) THEN 1/0 ELSE IF pi_h < 0.5 OR (NOT ISNULL(ll_h) AND ll_h < 15) THEN 14 ELSE ll_h.
#Set results to interger values.
ASSIGN pi_r ROUND(pi_r).ASSIGN ll_r ROUND(ll_r).ASSIGN pi_l ROUND(pi_l).ASSIGN ll_l ROUND(ll_l).ASSIGN pi_h ROUND(pi_h).ASSIGN ll_h ROUND(ll_h).
(430-VI-NSSH, 2010)

Part 618 – Soil Properties and Qualities 618-131
Appendix 618-6 NASIS Calculation for Estimating Particle Size
Definition. Computes representative values for the sand fractions, total sand and total silt. The following rules apply:1) The results will be blank if needed data are not entered. Total clay and
texture are always required, and particle size class is required for textures CL, L, SCL, SICL, and SIL.
2) When a horizon has multiple textures the one marked RV is used, or the first texture is used if there is no RV. No results are calculated for stratified textures at this time.
3) If total sand(RV) has been entered the sand fractions will be adjusted so their sum equals the specified total. If you want to calculate a new sand total you must erase the old one before running the calculation.).
Inputs. This calculation requires the following data to be populated: textureclay total separate (l,rv,h)taxonomic particle size class
Calculation.
ASSIGN texcl IF ISNULL(texcl) OR stratextsflag==1 THEN "null" ELSE CODENAME(texcl).
DEFINE sandclass IF (texcl=="sl" or texcl=="cosl" or texcl=="fsl" or texcl=="vfsl") THEN IF ISNULL(sandtotal_r) THEN 1 ELSE IF sandtotal_r > 60 THEN 1 ELSE IF sandtotal_r >= 53 THEN 2 ELSE 3 ELSE IF (texcl=="cl" or texcl=="l" or texcl=="scl" or texcl=="sicl" or texcl=="sil") THEN family_sandclass ELSE 0.
DEFINE paramid_by_tex LOOKUP(1, texcl==texture and (sandcode==0 or sandcode==sandclass), paramid).DEFINE claypct_by_tex LOOKUP(1, texcl==texture and (sandcode==0 or sandcode==sandclass), claypct).DEFINE claydiff_by_tex ABS(claypct_by_tex - claytotal_r).DEFINE closest_clay ARRAYMIN(claydiff_by_tex).DEFINE select_row ARRAYMIN(LOOKUP(closest_clay, claydiff_by_tex, paramid_by_tex)).
# Get the equation number and coefficients from the selected parameter row.
DEFINE eqn lookup(select_row, paramid, equation).DEFINE p1 lookup(select_row, paramid, param1).DEFINE p2 lookup(select_row, paramid, param2).DEFINE p3 lookup(select_row, paramid, param3).DEFINE p4 lookup(select_row, paramid, param4).DEFINE p5 lookup(select_row, paramid, param5).
(430-VI-NSSH, 2010)

Part 618 – Soil Properties and Qualities 618-132
# Compute all the distributions. We compute all 5 equations first then# pick the right result, because this language doesn't have conditional# execution.# Start by computing some things that are used more than once.
DEFINE diamclay LOOKUP("clay", psclass, psdiam). # Upper clay diameter.DEFINE cr2 POW(2, 1/3). # Cube root of 2.DEFINE crdiam POW(psdiam, 1/3). # Cube root of psclass diameter.DEFINE crdiamclay POW(diamclay, 1/3). # Cube root of clay diam.DEFINE sqr2 SQRT(2). # Square root of 2.DEFINE sqrdiam SQRT(psdiam). # Square root of psclass diameter.
DEFINE eq1tmp POW(1 + p4*POW(cr2-crdiam, p3), p2).DEFINE eq2tmp EXP(p3 * POW(cr2-crdiam, p2)).DEFINE eq3tmp EXP(1/POW(p4*cr2,p3) - 1/POW(p4*crdiam,p3)).DEFINE eq4tmp p3*(POW(crdiam,2) - POW(cr2,2)) + p4*(psdiam-2) + p5*(POW(crdiam,4) - POW(cr2,4)).DEFINE eq5tmp p3*(1/psdiam - 1/2) + p4*(sqrdiam - sqr2).
# Next adjust the parameters to make the clay come out the same as the input.
DEFINE tmp LOOKUP("clay", psclass, eq1tmp).DEFINE eq1p1 (tmp * claytotal_r - 100) / (tmp - 1).
ASSIGN tmp LOOKUP("clay", psclass, eq2tmp).DEFINE eq2p1 (tmp * claytotal_r - 100) / (tmp - 1).
ASSIGN tmp LOOKUP("clay", psclass, eq3tmp).DEFINE eq3p2 (claytotal_r - 100 * tmp) / (1 - tmp).
ASSIGN tmp LOOKUP("clay", psclass, eq4tmp).DEFINE eq4p2 (claytotal_r - 100 - tmp) / (crdiamclay - cr2).
ASSIGN tmp LOOKUP("clay", psclass, eq5tmp).DEFINE eq5p2 (claytotal_r - 100 - tmp) / (diamclay - 2).
# Compute the five equations for all particle size classes.
DEFINE eq1 eq1p1 + (100-eq1p1) / eq1tmp.DEFINE eq2 eq2p1 + (100-eq2p1) / eq2tmp.DEFINE eq3 eq3p2 + (100-eq3p2) * eq3tmp.DEFINE eq4 100 + eq4p2*(crdiam - cr2) + eq4tmp.DEFINE eq5 100 + eq5p2*(psdiam - 2) + eq5tmp.
# Select the right equation. The variable psd will have 7 vaules, one# for each particle size class. The value for each class is picked out# of the array with a LOOKUP.
DEFINE psd IF eqn==1 THEN eq1 ELSE IF eqn==2 THEN eq2 ELSE IF eqn==3 THEN eq3 ELSE IF eqn==4 THEN eq4 ELSE IF eqn==5 THEN eq5 ELSE eq5/0. # sets psd to 7 nulls when texcl is null
(430-VI-NSSH, 2010)

Part 618 – Soil Properties and Qualities 618-133
# Pick out the cumulative percents then compute the individual fractions.
DEFINE clay LOOKUP("clay", psclass, psd).DEFINE silt LOOKUP("silt", psclass, psd).DEFINE vfs LOOKUP("vfs", psclass, psd).DEFINE fs LOOKUP("fs", psclass, psd).DEFINE ms LOOKUP("ms", psclass, psd).DEFINE cs LOOKUP("cos", psclass, psd).DEFINE vcs LOOKUP("vcos", psclass, psd).
ASSIGN vcs vcs - cs.ASSIGN cs cs - ms.ASSIGN ms ms - fs.ASSIGN fs fs - vfs.ASSIGN vfs vfs - silt.ASSIGN silt silt - clay.
DEFINE sand vfs + fs + ms + cs + vcs.
# Find an adjustment factor for the sand fractions.# If total sand was given, adjust each sand fraction by the ratio needed to# make the sum equal to the given total.# If total sand was not given, verify that the sand and silt are within the# texture class limits and if not adjust them by the appropriate ratio.
DEFINE sand_diff IF ISNULL (sandtotal_r) THEN IF (texcl=="cos" or texcl=="s" or texcl=="fs" or texcl=="vfs") and ((clay + silt) > (15 - .5*clay)) THEN (clay + silt) - (15 - .5*clay) ELSE IF (texcl=="lcos" or texcl=="ls" or texcl=="lfs" or texcl=="lvfs") and (clay + silt) > (30 - clay) THEN (clay + silt) - (30 - clay) ELSE IF texcl=="sil" and silt < 50 THEN silt - 50 ELSE IF texcl=="sicl" and sand > 20 THEN 20 - sand ELSE IF texcl=="sc" and sand < 45 THEN 45 - sand ELSE IF texcl=="sic" and silt < 40 THEN silt - 40 ELSE 0 ELSE sandtotal_r - sand.DEFINE adj (sand + sand_diff) / sand.
# Adjust the sands and silt by the adjustment factor.# Round to one decimal place before computing total sand to avoid roundoff error.
ASSIGN vfs ROUND(vfs * adj, 1).ASSIGN fs ROUND(fs * adj, 1).ASSIGN ms ROUND(ms * adj, 1).ASSIGN cs ROUND(cs * adj, 1).ASSIGN vcs ROUND(vcs * adj, 1).ASSIGN sand vfs + fs + ms + cs + vcs.
# The rounding may result in a sum that does not equal the target sandtotal,(430-VI-NSSH, 2010)
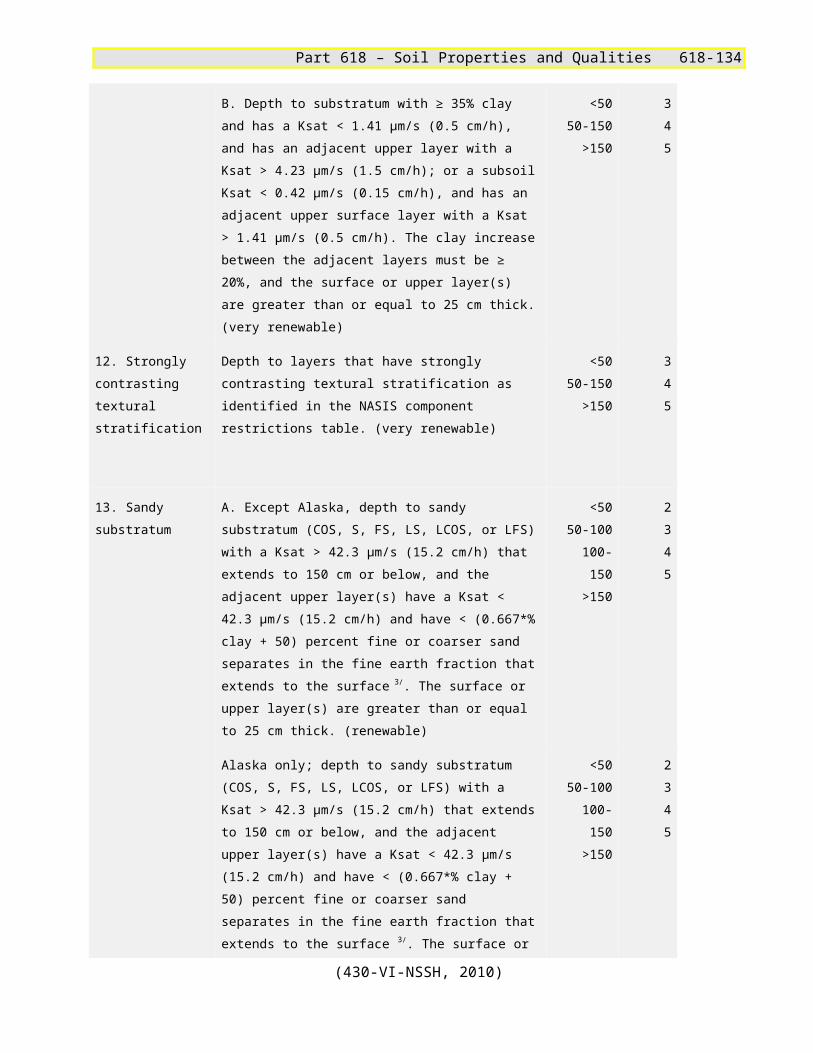
Part 618 – Soil Properties and Qualities 618-134
# so another adjustment has to be made.# This time, apply it to the first non-zero fraction.
ASSIGN adj IF NOT ISNULL(sandtotal_r) THEN sandtotal_r - sand ELSE 0.
ASSIGN vcs IF vfs==0 AND fs==0 AND ms==0 AND cs==0 THEN vcs + adj ELSE vcs.ASSIGN cs IF vfs==0 AND fs==0 AND ms==0 AND cs>0 THEN cs + adj ELSE cs.ASSIGN ms IF vfs==0 AND fs==0 AND ms>0 THEN ms + adj ELSE ms.ASSIGN fs IF vfs==0 AND fs>0 THEN fs + adj ELSE fs.ASSIGN vfs IF vfs > 0 THEN vfs + adj ELSE vfs.ASSIGN sand vfs + fs + ms + cs + vcs.
ASSIGN silt 100 - sand - clay.
# When vcos is < 0.ASSIGN cs IF vcs < 0 AND vfs+fs+ms+cs > sand THEN cs - ((vfs+fs+ms+cs) - sand) ELSE cs.ASSIGN vcs IF vcs < 0 THEN 0 ELSE vcs.
# Store the results as RV values for the horizon.
SET sandtotal_r from sand, sandvc_r from vcs, sandco_r from cs, sandmed_r from ms, sandfine_r from fs, sandvf_r from vfs, silttotal_r from silt.
(430-VI-NSSH, 2010)

Part 618 – Soil Properties and Qualities 618-135
Appendix 618-7 NASIS Calculation for Estimating Rock Fragments and Percent Passing Sieves
Definition. Calculates the percent soil material (< 3 inch basis) passing the #4 (4.7 mm), #10 (2.0 mm), #40 (0.42 mm), and #200 sieves (0.074 mm); and the percent rock fragments 3 to 10 inches and > 10 inches (whole soil basis).
1. Percent passing sieves are placed on a < 3 inch basis and rock fragments are a whole soil basis.
2. The calculation of percent passing sieves and rock fragments excludes pararock, wood, and other noncemented fragments. Pararock fragments are defined by fragment hardness of noncemented, extremely weakly, very weakly, weakly, or moderately cemented.
3) If fragment hardness is not populated, "indurated" is assumed.3. If fragment kind is not populated a fragment density of 2.65 g cm-3 is assumed.4. Fragment density is assigned based on the fragment kind (Table 2). An average
density for each fragment kind may not be available yet, thus a default density of 2.65 g cm-3 is used.
5. If only low and high values are populated for fragment volume, fragment size, total sand, total silt, total clay or sand separates, then RVs are generated from the high and low values (takes the average).
6. The low and high values must be populated for fragment size, otherwise the calculation will produce incorrect or no results.
7. Low and high values for percent passing #40 and #200 sieves are based on the average low and high values for the particle size separates.
8. If low and high values are not populated for total sand, total silt, total clay, or for the sand separates, then low and high values for the #40 and #200 sieves are generated from the low and high values of total clay. If high and low values for total clay are also null, then nulls are returned.
9. Low and high values for percent passing #4 and #10 sieves and the rock fragments are based on the low and high fragment volumes (in Horizon Table, if populated). If low and high fragment volumes (in Horizon Table) are not populated, then total low and high fragment volumes in the Horizon Fragment Table are used. If low and high fragment volumes in the Horizon Fragment Table are null, then nulls are returned.
10. CAUTION: If percent passing sieves are populated, and only clay is populated (l, rv, h) of the particle size separates, the calculation will wipe out the calculated values and put in null values. If there is not enough data to run the calculation, nulls are returned.
11. For stratified textures, if data is populated, the calculation proceeds as normal. If the particle size separates are not populated, then the #40 and #200 sieves are not calculated (nulls are returned).
12. If the organic matter content > 35%, then percent passing sieves are not calculated, only rock fragments (3 to 10 in and >10 in) are calculated.
13. CAUTION: If 1/3 bar bulk density RV is not populated, null values for all sieves and rock fragments are returned.
14. The calculation rounds all sieve values to the nearest whole number.
Limitations. 1) The pararock fragments are not included in the calculation because they can be
crushed to < 2 mm. It is assumed that the pararock fragments, when crushed, will reflect the existing particle size distribution. If there are pararock fragments, when crushed that produce a different particle size distribution, the
(430-VI-NSSH, 2010)

Part 618 – Soil Properties and Qualities 618-136
calculation will over- or under-estimate the percent passing the #40 and #200 sieves.
2) When actually measuring percent passing sieves, the organic matter is not removed. The calculation of percent passing sieves calculates using organic matter free particle size fractions. The calculation does not take into account the distribution of organic matter particles.
3) The fragment densities applied here are average values from the literature and may not represent the true density of fragments in your area. Fragment densities can be highly variable from location to location for a fragment kind.
4) If the total fragment volumes in the Component Horizon Table are not populated, then the low and high calculated values are based on the Horizon Fragment Table volumes and texture ranges in the NASIS database, which may not reflect the actual percent passing sieves and rock fragment ranges. It is assumed that the total of the lows and total of the highs in the Horizon Fragment Table equals the total high and low fragment volumes.
5) If the low and high calculated values are based on the total fragment volumes in the Component Horizon Table, percent passing sieves and rock fragment may not reflect actual ranges; because actual fragment kind distributions (e.g., rock vs. pararock) that make up the fragment volume totals are not known. Computes representative values for the sand fractions, total sand and total silt. The following rules apply:
6) The results will be blank if needed data are not entered. Total clay and texture are always required, and particle size class is required for textures CL, L, SCL, SICL, and SIL.
7) When a horizon has multiple textures the one marked RV is used, or the first texture is used if there is no RV. No results are calculated for stratified textures at this time.
8) If total sand(RV) has been entered the sand fractions will be adjusted so their sum equals the specified total. If you want to calculate a new sand total you must erase the old one before running the calculation.).
Inputs. This calculation requires the following data to be populated: fragment volume total (high, low) in Horizon Tablefragment volume (high, low, and rv) in Horizon Fragment Tablefragment kind in Horizon Fragment Tablefragment size (high, low, and rv) in Horizon Fragment Tablefragment hardness in Horizon Fragment Tabletotal sand (high, low, and rv)total clay (high, low, and rv)total silt (high, low, and rv)very fine sand (high, low, and rv)fine sand (high, low, and rv)medium sand (high, low, and rv)coarse sand (high, low, and rv)very coarse sand (high, low, and rv)one-third bar bulk density (rv)organic matter (rv)
Calculation.
DEFINE curvenum_l 0.56559. #run curve fitting routineDEFINE curvenum_h 0.56559. #run curve fitting routineDEFINE curvenum_r 0.56559. #run curve fitting routine
DEFINE densityrockIF fragkind2 == "`a`a lava" THEN 2.00ELSE IF fragkind2 == "amphibolite" THEN 2.99ELSE IF fragkind2 == "andesite" THEN 2.65
(430-VI-NSSH, 2010)

Part 618 – Soil Properties and Qualities 618-137
ELSE IF fragkind2 == "anorthosite" THEN 2.73ELSE IF fragkind2 == "basalt" THEN 2.69ELSE IF fragkind2 == "calcrete (caliche)" THEN 1.44ELSE IF fragkind2 == "chalk" THEN 2.35ELSE IF fragkind2 == "charcoal" THEN 0.45ELSE IF fragkind2 == "chert" THEN 2.76ELSE IF fragkind2 == "cinders" THEN 1.45ELSE IF fragkind2 == "coal" THEN 1.6ELSE IF fragkind2 == "dacite" THEN 1.67ELSE IF fragkind2 == "diabase" THEN 2.92ELSE IF fragkind2 == "diorite" THEN 2.83ELSE IF fragkind2 == "dolomite (dolostone)" THEN 2.79ELSE IF fragkind2 == "gabbro" THEN 2.99ELSE IF fragkind2 == "gibbsite concretions" THEN 2.35ELSE IF fragkind2 == "gneiss" THEN 2.79ELSE IF fragkind2 == "granite" THEN 2.66ELSE IF fragkind2 == "granodiorite" THEN 2.72ELSE IF fragkind2 == "granulite" THEN 2.91ELSE IF fragkind2 == "graywacke" THEN 2.69ELSE IF fragkind2 == "gypsum, rock" THEN 2.55ELSE IF fragkind2 == "ironstone concretions" THEN 2.93ELSE IF fragkind2 == "limestone, uspecified" THEN 2.61ELSE IF fragkind2 == "marble" THEN 2.74ELSE IF fragkind2 == "monzonite" THEN 2.8ELSE IF fragkind2 == "obsidian" THEN 2.37ELSE IF fragkind2 == "orthoquartzite" THEN 2.41ELSE IF fragkind2 == "peridotite" THEN 3.22ELSE IF fragkind2 == "petroferric fragments" THEN 2.93ELSE IF fragkind2 == "phyllite" THEN 2.74ELSE IF fragkind2 == "pumice" THEN 0.98ELSE IF fragkind2 == "pyroxenite" THEN 3.28ELSE IF fragkind2 == "quartz-diorite" THEN 2.79ELSE IF fragkind2 == "quartzite" THEN 2.7ELSE IF fragkind2 == "rhyolite" THEN 2.51ELSE IF fragkind2 == "sandstone, calcareous" THEN 2.03ELSE IF fragkind2 == "sandstone, unspecified" THEN 2.29ELSE IF fragkind2 == "schist, mica" THEN 2.76ELSE IF fragkind2 == "schist, unspecified" THEN 2.84ELSE IF fragkind2 == "sperpentinite" THEN 2.63ELSE IF fragkind2 == "shale, calcareous" THEN 2.67ELSE IF fragkind2 == "shale, clayey" THEN 2.78ELSE IF fragkind2 == "shale, unspecified" THEN 2.6ELSE IF fragkind2 == "slate" THEN 2.81ELSE IF fragkind2 == "soapstone" THEN 2.7ELSE IF fragkind2 == "syenite" THEN 2.74ELSE IF fragkind2 == "tonalite" THEN 2.67ELSE IF fragkind2 == "trachyte" THEN 2.57ELSE IF fragkind2 == "tuff, unspecified" THEN 1.84ELSE IF fragkind2 == "wood" THEN 0.6ELSE 2.65.
#----------------------------------------------------------------------# Start of percent passing sieves and rock fragments calculation for RV.#----------------------------------------------------------------------
(430-VI-NSSH, 2010)
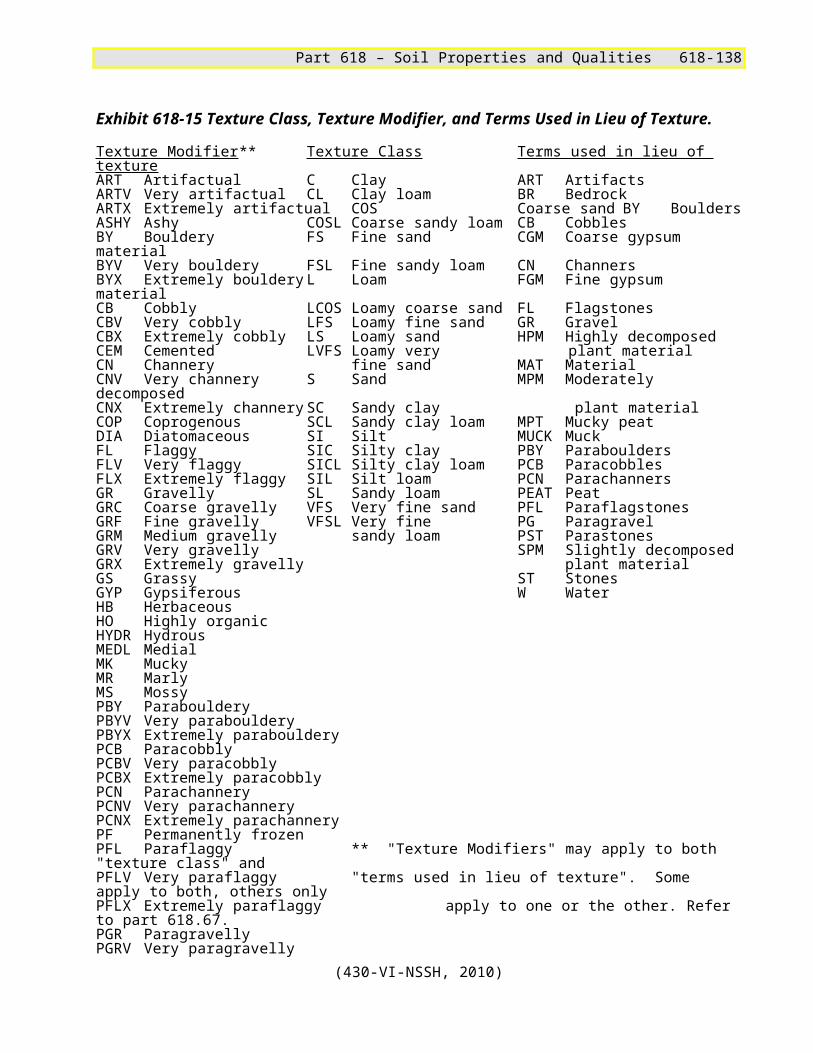
Part 618 – Soil Properties and Qualities 618-138
# Compute total volume percent of rock fragments, minus pararocks, # on a whole soil basis.
DEFINE fragvols IF (fraghard2=="strongly" or fraghard2=="very strongly" or
fraghard2=="indurated" or ISNULL(fraghard2)) AND fragkind2 != "wood"
THEN fragvlr ELSE 0.DEFINE fragvolr ARRAYSUM(fragvols).
# Compute percent volume of rock fragments that are < 75mm for each row# in the rock fragment table.
DEFINE rockfrag_row_r IF (75 >= fragsize_l and 75 <= fragsize_r)THEN ((75-fragsize_l)/(fragsize_r-fragsize_l)/2*fragvlr)ELSE IF (75 > fragsize_r and 75 <= fragsize_h)THEN (((75-fragsize_r)/(fragsize_h-fragsize_r)/2)+0.5)*fragvlrELSE IF 75 > fragsize_h THEN fragvlr ELSE 0.
# Compute total volume percent of rock fragments that are < 75mm on a # whole soil basis, minus pararocks.
DEFINE totalRFvol_s IF (fraghard2=="strongly" or fraghard2=="very strongly" or fraghard2=="indurated" or ISNULL(fraghard2)) AND fragkind2 != "wood"THEN rockfrag_row_r ELSE 0.
DEFINE totalRFvol_r ARRAYSUM(totalRFvol_s).
# Compute volume percent of rock fragments that are < 75mm on a < 75mm basis.
DEFINE vol75mm_r totalRFvol_r/(1-(fragvolr-totalRFvol_r)/100).
# Compute volume percent of rock fragments that are < 75mm# to a weight percent for each row in the rock fragment table.
DEFINE wtRF_row_r IF totalRFvol_r == 0 THEN 0 ELSE (rockfrag_row_r/totalRFvol_r*vol75mm_r)*densityrock/(((vol75mm_r/100)*densityrock)+((1-vol75mm_r/100)*dbthirdbar_r)).
# Compute volume percent of rock fragments that are < 5mm to a weight percent for each row in the rock fragment table.
DEFINE wtRF5mm_row_r IF 5>=fragsize_h THEN wtRF_row_r ELSE IF (5>=fragsize_l and 5<=fragsize_r) THEN (5-fragsize_l)/(fragsize_r-fragsize_l)/2*wtRF_row_rELSE IF (5>fragsize_r and 5<=fragsize_h)THEN (((5-fragsize_r)/(fragsize_h-fragsize_r)/2)+0.5)*wtRF_row_rELSE 0.
# Compute weight percent of rock fragments of the whole soil for each row.
DEFINE wtRFwhole_row_r fragvlr*densityrock/(((fragvlr/100)*densityrock)+((1-fragvlr/100)*dbthirdbar_r)).
(430-VI-NSSH, 2010)

Part 618 – Soil Properties and Qualities 618-139
# Compute weight percent of rock fragments > 75mm of the whole soil for each row.
DEFINE wtRFwhole75mm_row_s IF (75>=fragsize_l and 75<=fragsize_r) THEN ((1-((75-fragsize_l)/(fragsize_r-fragsize_l)/2))*wtRFwhole_row_r)ELSE IF (75>fragsize_r and 75<=fragsize_h)THEN ((1-(((75-fragsize_r)/(fragsize_h-fragsize_r)/2)+0.5))*wtRFwhole_row_r)ELSE IF 75>fragsize_h THEN 0 ELSE wtRFwhole_row_r.
# Compute the percent weight of rock fragments > 75mm of whole soil, minus pararocks.
DEFINE wtRFwhole75mm_row_2 IF ISNULL(fragvlr) and ISNULL(fragvol_l) and ISNULL(fragvol_h)THEN 0 ELSE IF (fraghard2=="strongly" or fraghard2=="very strongly" or fraghard2=="indurated" or ISNULL(fraghard2)) AND fragkind2 != "wood" THEN wtRFwhole75mm_row_s ELSE 0.
DEFINE wtRFwhole75mm_r ARRAYSUM(wtRFwhole75mm_row_2).
# Compute weight percent of rock fragments >250mm of whole soil for each row.
DEFINE wtRFwhole250mm_row_s IF (250>=fragsize_l and 250<=fragsize_r) THEN ((1-((250-fragsize_l)/(fragsize_r-fragsize_l)/2))*wtRFwhole_row_r)ELSE IF (250>fragsize_r and 250<=fragsize_h)THEN ((1-(((250-fragsize_r)/(fragsize_h-fragsize_r)/2)+0.5))*wtRFwhole_row_r)ELSE IF fragsize_l>=250 THEN wtRFwhole_row_r ELSE 0.
# Compute the total weight percent of rock fragments >250mm of whole soil, minus pararocks.
DEFINE wtRFwhole250mm_row_2 IF ISNULL(fragvlr) and ISNULL(fragvol_l) and ISNULL(fragvol_h) THEN 0 ELSE IF (fraghard2=="strongly" or fraghard2=="very strongly" or fraghard2=="indurated" or ISNULL(fraghard2)) AND fragkind2 != "wood" THEN wtRFwhole250mm_row_s ELSE 0.
DEFINE rockfrag_250r ARRAYSUM(wtRFwhole250mm_row_2).
# Compute total weight percent of rock fragments 75 to 250mm, minus pararocks.
DEFINE rockfrag_75r wtRFwhole75mm_r - rockfrag_250r.
# Compute percent passing #10 sieve, minus pararocks.
DEFINE sieve_10s IF (fraghard2=="strongly" or fraghard2=="very strongly" or fraghard2=="indurated" or ISNULL(fraghard2)) AND fragkind2 != "wood" THEN wtRF_row_r ELSE 0.
DEFINE sieve_10r IF ISNULL(ARRAYSUM(fragvlr))THEN 100 ELSE 100-ARRAYSUM(sieve_10s).
# Compute percent passing #4 sieve, minus pararocks.
DEFINE sieve_4s IF (fraghard2=="strongly" or fraghard2=="very strongly" or fraghard2=="indurated" or ISNULL(fraghard2)) AND fragkind2 != "wood"THEN wtRF5mm_row_r ELSE 0.
DEFINE sieve_4r IF ISNULL(ARRAYSUM(fragvlr)) THEN 100 ELSE ARRAYSUM(sieve_4s)+sieve_10r.
# Compute percent passing #40 sieve, minus pararocks.(430-VI-NSSH, 2010)

Part 618 – Soil Properties and Qualities 618-140
DEFINE sieve_40r IF ISNULL(ARRAYSUM(fragvlr)) THEN 100 - (vcos_r + cos_r + ms_r*0.2515) ELSE sieve_10r/100*((0.7485*ms_r)+fs_r+vfs_r+siltr+clayr).
# Compute percent passing #200 sieve, minus pararocks.
DEFINE sieve_200r IF ISNULL(ARRAYSUM(fragvlr))THEN IF vfs_r < 15 THEN (vfs_r*0.56559 + siltr + clayr)ELSE (vfs_r*curvenum_r + siltr + clayr) ELSE IF vfs_r < 15 THEN (vfs_r*0.56559 + siltr + clayr)*sieve_10r/100ELSE (vfs_r*curvenum_r + siltr + clayr)*sieve_10r/100.
ASSIGN sieve_10r IF om_r > 35 OR ISNULL(clayr) OR ISNULL(dbthirdbar_r) THEN 1/0 ELSE sieve_10r.
ASSIGN sieve_4r IF om_r > 35 OR ISNULL(clayr) OR ISNULL(dbthirdbar_r) THEN 1/0 ELSE sieve_4r.
ASSIGN sieve_40r IF om_r > 35 OR (stratextsflag == 1 AND (ISNULL(clayr) OR ISNULL(siltr) OR ISNULL(vcos_r) OR ISNULL(cos_r) OR ISNULL(ms_r))) OR ISNULL(dbthirdbar_r) THEN 1/0 ELSE sieve_40r.
ASSIGN sieve_200r IF om_r > 35 OR (stratextsflag == 1 AND (ISNULL(clayr) OR ISNULL(siltr) OR ISNULL(vfs_r))) OR ISNULL(dbthirdbar_r) THEN 1/0 ELSE sieve_200r.
ASSIGN rockfrag_250r IF om_r > 35 AND ISNULL(fragvolr) THEN 0 ELSE IF (ISNULL(clayr) AND stratextsflag != 1) OR ISNULL(dbthirdbar_r) THEN 1/0 ELSE rockfrag_250r.
ASSIGN rockfrag_75r IF om_r > 35 AND ISNULL(fragvolr) THEN 0 ELSE IF (ISNULL(clayr) AND stratextsflag != 1) OR ISNULL(dbthirdbar_r) THEN 1/0 ELSE rockfrag_75r.
#-----------------------------------------------------------------------------# Start of percent passing sieves and rock fragments calculation of low values.#-----------------------------------------------------------------------------
# Compute total volume percent of rock fragments, minus pararocks, # on a whole soil basis.
DEFINE fragvolls IF (fraghard2=="strongly" or fraghard2=="very strongly" or fraghard2=="indurated" or ISNULL(fraghard2)) AND fragkind2 != "wood" THEN fragvol_l ELSE 0.DEFINE fragvoll ARRAYSUM(fragvolls).
# Uses the low fragment volume total from the Horizon Table.DEFINE sumlowfrags ARRAYSUM(fragvol_l).ASSIGN fragvoll IF (fragvoll / sumlowfrags) < 1 AND fragvoll != 0 AND NOT ISNULL(sumlowfrags) AND sumlowfrags > 0 THEN (fragvoll / sumlowfrags) * fragvoltot_l ELSE IF ISNULL(fragvoltot_l) THEN fragvoll ELSE fragvoltot_l.
# Compute volume percent of rock fragments that are < 75mm for each row# in the rock fragment table.
DEFINE rockfrag_row_l IF (75 >= fragsize_l and 75 <= fragsize_r)THEN ((75-fragsize_l)/(fragsize_r-fragsize_l)/2*fragvol_l)ELSE IF (75 > fragsize_r and 75 <= fragsize_h)THEN (((75-fragsize_r)/(fragsize_h-fragsize_r)/2)+0.5)*fragvol_l
(430-VI-NSSH, 2010)

Part 618 – Soil Properties and Qualities 618-141
ELSE IF 75 > fragsize_h THEN fragvol_l ELSE 0.
# Compute total volume percent of rock fragments that are < 75mm on a # whole soil basis, minus pararocks.
DEFINE totalRFvol_ls IF (fraghard2=="strongly" or fraghard2=="very strongly" or fraghard2=="indurated" or ISNULL(fraghard2)) AND fragkind2 != "wood" THEN rockfrag_row_l ELSE 0.
DEFINE totalRFvol_l ARRAYSUM(totalRFvol_ls).
# Compute volume percent of rock fragments that are < 75mm on a < 75mm basis.
DEFINE vol75mm_l totalRFvol_l/(1-(fragvoll-totalRFvol_l)/100).
# Compute volume percent of rock fragments that are < 75mm# to a weight percent for each row in the rock fragment table.
DEFINE wtRF_row_l IF totalRFvol_l == 0 THEN 0 ELSE (rockfrag_row_l/totalRFvol_l*vol75mm_l) * densityrock/(((vol75mm_l/100)*densityrock)+((1-vol75mm_l/100)*dbthirdbar_r)).
# Compute volume percent of rock fragments that are < 5mm # to a weight percent for each row in the rock fragment table.
DEFINE wtRF5mm_row_l IF 5>=fragsize_h THEN wtRF_row_l ELSE IF (5>=fragsize_l and 5<=fragsize_r)THEN (5-fragsize_l)/(fragsize_r-fragsize_l)/2*wtRF_row_lELSE IF (5>fragsize_r and 5<=fragsize_h)THEN (((5-fragsize_r)/(fragsize_h-fragsize_r)/2)+0.5)*wtRF_row_lELSE 0.
# Compute weight percent of rock fragments of whole soil for each row.
DEFINE wtRFwhole_row_l fragvol_l*densityrock/(((fragvol_l/100)*densityrock)+((1-fragvol_l/100) * dbthirdbar_r)).
# Compute weight percent of rock fragments > 75mm of whole soil, minus pararocks.
DEFINE wtRFwhole75mm_row_ls IF (75>=fragsize_l and 75<=fragsize_r) THEN ((1-((75-fragsize_l)/(fragsize_r-fragsize_l)/2))*wtRFwhole_row_l) ELSE IF (75>fragsize_r and 75<=fragsize_h) THEN ((1-(((75-fragsize_r)/(fragsize_h-fragsize_r)/2)+0.5))*wtRFwhole_row_l)ELSE IF 75>fragsize_h THEN 0 ELSE wtRFwhole_row_l.
DEFINE wtRFwhole75mm_row_l IF ISNULL(fragvlr) and ISNULL(fragvol_l) and ISNULL(fragvol_h) THEN 0 ELSE IF (fraghard2=="strongly" OR fraghard2=="very strongly" or fraghard2=="indurated" or ISNULL(fraghard2)) AND fragkind2 != "wood" THEN wtRFwhole75mm_row_ls ELSE 0.
DEFINE wtRFwhole75mm_l ARRAYSUM(wtRFwhole75mm_row_l).
# Compute weight percent of rock fragments > 250mm of whole soil, minus pararocks.
DEFINE wtRFwhole250mm_row_j IF (250>=fragsize_l and 250<=fragsize_r) THEN ((1-((250-fragsize_l)/(fragsize_r-fragsize_l)/2))*wtRFwhole_row_l) ELSE IF (250>fragsize_r and 250<=fragsize_h) THEN ((1-(((250-fragsize_r)/(fragsize_h-fragsize_r)/2)+0.5))*wtRFwhole_row_l) ELSE IF fragsize_l>=250 THEN wtRFwhole_row_l ELSE 0.
(430-VI-NSSH, 2010)

Part 618 – Soil Properties and Qualities 618-142
DEFINE wtRFwhole250mm_row_l IF ISNULL(fragvlr) and ISNULL(fragvol_l) and ISNULL(fragvol_h) THEN 0 ELSE IF (fraghard2=="strongly" or fraghard2=="very strongly" or fraghard2=="indurated" or ISNULL(fraghard2)) AND fragkind2 != "wood" THEN wtRFwhole250mm_row_j ELSE 0.
DEFINE rockfrag_250l ARRAYSUM(wtRFwhole250mm_row_l).
# Compute weight percent of rock fragments that are 75 to 250mm, minus pararocks.
DEFINE rockfrag_75l wtRFwhole75mm_l - rockfrag_250l.
#-------------------------------------------------------------------------------# Start of percent passing sieves and rock fragments calculation for high values.#-------------------------------------------------------------------------------# Compute total volume percent of rock fragments, minus pararocks, # on a whole soil basis.
DEFINE fragvolhs IF (fraghard2=="strongly" or fraghard2=="very strongly" or fraghard2=="indurated" or ISNULL(fraghard2)) AND fragkind2 != "wood" THEN fragvol_h ELSE 0.
DEFINE fragvolh ARRAYSUM(fragvolhs).ASSIGN fragvolh IF fragvolh > 90 THEN 90 ELSE fragvolh. #Assumes there is at least 10% soil (< 2mm) at the high fragment condition.
# Uses the high fragment volume total from the Horizon Table.DEFINE sumhighfrags ARRAYSUM(fragvol_h).ASSIGN fragvolh IF (fragvolh / sumhighfrags) < 1 AND fragvolh < fragvoltot_h AND fragvolh != 0 AND NOT ISNULL(sumhighfrags) AND sumhighfrags > 0 THEN (fragvolh / sumhighfrags) * fragvoltot_h ELSE IF ISNULL(fragvoltot_h) THEN fragvolh ELSE fragvoltot_h.
# Compute volume percent of rock fragments that are < 75mm for each row# in the fragment table.
DEFINE rockfrag_row_h IF (75 >= fragsize_l and 75 <= fragsize_r) THEN ((75-fragsize_l)/(fragsize_r-fragsize_l)/2*fragvol_h) ELSE IF (75 > fragsize_r and 75 <= fragsize_h) THEN (((75-fragsize_r)/(fragsize_h-fragsize_r)/2)+0.5)*fragvol_h ELSE IF 75 > fragsize_h THEN fragvol_h ELSE 0.
# Compute total volume % of rock fragments that are < 75mm on a # whole soil basis, minus pararocks.
DEFINE totalRFvol_hs IF (fraghard2=="strongly" or fraghard2=="very strongly" or fraghard2 == "indurated" or ISNULL(fraghard2)) AND fragkind2 != "wood" THEN rockfrag_row_h ELSE 0.
DEFINE totalRFvol_h ARRAYSUM(totalRFvol_hs).
# Compute volume percent of rock fragments that are < 75mm on a < 75mm basis.
DEFINE vol75mm_h totalRFvol_h/(1-(fragvolh-totalRFvol_h)/100).
# Compute volume percent of rock fragments that are < 75mm# to a weight percent for each row in the fragment table.
DEFINE wtRF_row_h IF totalRFvol_h == 0 THEN 0 ELSE (rockfrag_row_h/totalRFvol_h *vol75mm_h)*densityrock/ (((vol75mm_h/100)*densityrock)+((1-vol75mm_h/100)*dbthirdbar_r)).
(430-VI-NSSH, 2010)

Part 618 – Soil Properties and Qualities 618-143
# Compute volume percent of rock fragments that are < 5mm to a weight percent for each row in the fragment table.
DEFINE wtRF5mm_row_h IF 5>=fragsize_h THEN wtRF_row_h ELSE IF (5>=fragsize_l and 5<=fragsize_r) THEN (5-fragsize_l)/(fragsize_r-fragsize_l)/2*wtRF_row_h ELSE IF (5>fragsize_r and 5<=fragsize_h) THEN (((5-fragsize_r)/(fragsize_h-fragsize_r)/2)+0.5)*wtRF_row_h ELSE 0.
# Compute weight percent of rock fragments of whole soil for each row.
DEFINE wtRFwhole_row_h fragvol_h*densityrock/(((fragvol_h/100)*densityrock)+ ((1-fragvol_h/100)*dbthirdbar_r)).
# Compute weight percent of rock fragments > 75mm of whole soil, minus pararocks.
DEFINE wtRFwhole75mm_row_k IF (75>=fragsize_l and 75<=fragsize_r) THEN ((1-((75-fragsize_l)/(fragsize_r-fragsize_l)/2))*wtRFwhole_row_h) ELSE IF (75>fragsize_r and 75<=fragsize_h) THEN ((1-(((75-fragsize_r)/(fragsize_h-fragsize_r)/2)+0.5))*wtRFwhole_row_h) ELSE IF 75>fragsize_h THEN 0 ELSE wtRFwhole_row_h.
DEFINE wtRFwhole75mm_row_h IF ISNULL(fragvlr) and ISNULL(fragvol_l) and ISNULL(fragvol_h)THEN 0 ELSE IF (fraghard2=="strongly" or fraghard2=="very strongly" or fraghard2=="indurated" or ISNULL(fraghard2)) AND fragkind2 != "wood" THEN wtRFwhole75mm_row_k ELSE 0.
DEFINE wtRFwhole75mm_h ARRAYSUM(wtRFwhole75mm_row_h).
# Compute weight percent of rock fragments > 250mm of the whole soil, minus pararocks.
DEFINE wtRFwhole250mm_row_k IF (250>=fragsize_l and 250<=fragsize_r) THEN ((1-((250-fragsize_l)/(fragsize_r-fragsize_l)/2))*wtRFwhole_row_h) ELSE IF (250>fragsize_r and 250<=fragsize_h) THEN ((1-(((250-fragsize_r)/(fragsize_h-fragsize_r)/2)+0.5))*wtRFwhole_row_h) ELSE IF fragsize_l>=250 THEN wtRFwhole_row_h ELSE 0.
DEFINE wtRFwhole250mm_row_h IF ISNULL(fragvlr) and ISNULL(fragvol_l) and ISNULL(fragvol_h) THEN 0 ELSE IF (fraghard2=="strongly" or fraghard2=="very strongly" or fraghard2=="indurated" or ISNULL(fraghard2)) AND fragkind2 != "wood" THEN wtRFwhole250mm_row_k ELSE 0.
DEFINE rockfrag_250h ARRAYSUM(wtRFwhole250mm_row_h).
# Compute weight percent of rock fragments that are 75 to 250mm, minus pararocks.
DEFINE rockfrag_75h wtRFwhole75mm_h-rockfrag_250h.
# Compute percent passing #10 sieve, minus pararocks.
DEFINE sieve_10hs IF (fraghard2=="strongly" or fraghard2=="very strongly" or fraghard2=="indurated" or ISNULL(fraghard2)) AND fragkind2 != "wood" THEN wtRF_row_l ELSE 0.
DEFINE sieve_10h IF ISNULL(ARRAYSUM(fragvlr)) THEN 100 ELSE 100- RRAYSUM(sieve_10hs).
# Compute percent passing #4 sieve (minus pararocks).
(430-VI-NSSH, 2010)

Part 618 – Soil Properties and Qualities 618-144
DEFINE sieve_4hs IF (fraghard2=="strongly" or fraghard2=="very strongly" or fraghard2=="indurated" or ISNULL(fraghard2)) AND fragkind2 != "wood" THEN wtRF5mm_row_l ELSE 0.
DEFINE sieve_4h IF ISNULL(ARRAYSUM(fragvlr)) THEN 100 ELSE ARRAYSUM(sieve_4hs)+sieve_10h.
# Compute percent passing #40 sieve (minus pararocks).
DEFINE sieve_40h IF ISNULL(ARRAYSUM(fragvlr)) AND (ISNULL(ms_h) OR ISNULL(fs_h) OR ISNULL(vfs_h) OR ISNULL(silth)) THEN (((0.7485*ms_r)+fs_r+vfs_r+siltr+clayr)+(clayh-clayr)) ELSE IF NOT ISNULL(ARRAYSUM(fragvlr)) and NOT ISNULL(ARRAYSUM(fragvol_l)) and NOT ISNULL(ARRAYSUM(fragvol_h)) AND (ISNULL(ms_h) OR ISNULL(fs_h) OR ISNULL(vfs_h) OR ISNULL(silth)) THEN sieve_10h/100*(((0.7485*ms_r)+fs_r+vfs_r+siltr+clayr)+(clayh-clayr)) ELSE ISNULL(ARRAYSUM(fragvlr)) THEN (((0.7485*ms_r)+fs_r+vfs_r+siltr+clayr)+(((ms_h-ms_r)+(fs_h-fs_r)+(vfs_h-vfs_r)+(silth-siltr)+(clayh-clayr))/5)) ELSE sieve_10h/100 *(((0.7485*ms_r) +fs_r+vfs_r+siltr+clayr) + (((ms_h-ms_r)+(fs_h-fs_r)+(vfs_h-vfs_r)+(silth-siltr)+(clayh-clayr))/5)).
# Compute percent passing #200 sieve (minus pararocks).
DEFINE sieve_200h IF ISNULL(ARRAYSUM(fragvlr)) AND (ISNULL(vfs_h) OR ISNULL(silth)) THEN (((vfs_r*0.56559)+siltr+clayr)+(clayh-clayr)) ELSE IF NOT ISNULL(ARRAYSUM(fragvlr)) and NOT ISNULL(ARRAYSUM(fragvol_l)) and NOT ISNULL(ARRAYSUM(fragvol_h)) AND (ISNULL(vfs_h) OR ISNULL(silth)) THEN sieve_10h/100*(((vfs_r*0.56559)+siltr+clayr)+(clayh-clayr))ELSE ISNULL(ARRAYSUM(fragvlr)) THEN IF (vfs_r) < 15 THEN (((vfs_r*0.56559)+ siltr+clayr)+(((vfs_h-vfs_r)+(silth-siltr)+(clayh-clayr))/3)) ELSE (((vfs_r*curvenum_h)+siltr+clayr)+(((vfs_h-vfs_r)+(silth-siltr)+(clayh-clayr))/3)) ELSE IF vfs_r < 15 THEN sieve_10h/100*(((vfs_r*0.56559)+siltr+clayr)+(((vfs_h-vfs_r)+(silth-siltr)+(clayh-clayr))/3)) ELSE sieve_10h/100*(((vfs_r*curvenum_h)+siltr+clayr)+(((vfs_h-vfs_r)+(silth-siltr)+(clayh-clayr))/3)).
ASSIGN sieve_10h IF om_r > 35 OR ISNULL(clayr) OR ISNULL(dbthirdbar_r) THEN 1/0 ELSE sieve_10h.
ASSIGN sieve_4h IF om_r > 35 OR ISNULL(clayr) OR ISNULL(dbthirdbar_r) THEN 1/0 ELSE sieve_4h.
ASSIGN sieve_40h IF om_r > 35 OR (stratextsflag == 1 AND (ISNULL(clayr) OR ISNULL(siltr) OR ISNULL(vcos_r) OR ISNULL(cos_r) OR ISNULL(ms_r))) OR ISNULL(dbthirdbar_r) THEN 1/0 ELSE sieve_40h.
ASSIGN sieve_200h IF om_r > 35 OR (stratextsflag == 1 AND (ISNULL(clayr) OR ISNULL(siltr) OR ISNULL(vfs_r))) OR ISNULL(dbthirdbar_r) THEN 1/0 ELSE sieve_200h.
ASSIGN rockfrag_250h IF om_r > 35 AND ISNULL(ARRAYSUM(fragvolh)) THEN 0 ELSE IF (ISNULL(clayr) AND stratextsflag != 1) OR ISNULL(dbthirdbar_r) THEN 1/0 ELSE rockfrag_250h.
ASSIGN rockfrag_75h IF om_r > 35 AND ISNULL(ARRAYSUM(fragvolh)) THEN 0 ELSE IF (ISNULL(clayr) AND stratextsflag != 1) OR ISNULL(dbthirdbar_r) THEN 1/0 ELSE rockfrag_75h.
#----------------------------------------------------------------------------# Rest of calculation for low values.#----------------------------------------------------------------------------
# Compute percent passing #10 sieve (minus pararocks).
(430-VI-NSSH, 2010)

Part 618 – Soil Properties and Qualities 618-145
DEFINE sieve_10ls IF (fraghard2=="strongly" or fraghard2=="very strongly" or fraghard2=="indurated" or ISNULL(fraghard2)) AND fragkind2 != "wood" THEN wtRF_row_h ELSE 0.
DEFINE sieve_10l IF ISNULL(ARRAYSUM(fragvlr)) THEN 100 ELSE 100-ARRAYSUM(sieve_10ls).
# Compute percent passing #4 sieve (minus pararocks).
DEFINE sieve_4ls IF (fraghard2=="strongly" or fraghard2=="very strongly" or fraghard2=="indurated" or ISNULL(fraghard2)) AND fragkind2 != "wood" THEN wtRF5mm_row_h ELSE 0.
DEFINE sieve_4l IF ISNULL(ARRAYSUM(fragvlr)) THEN 100 ELSE ARRAYSUM (sieve_4ls) + sieve_10l.
# Compute percent passing #40 sieve (minus pararocks).
DEFINE sieve_40l IF ISNULL(ARRAYSUM(fragvlr)) AND (ISNULL(ms_l) OR ISNULL(fs_l) OR ISNULL(vfs_l) OR ISNULL(siltl)) THEN (((0.7485*ms_r)+fs_r+vfs_r+siltr+clayr)-(clayr-clayl)) ELSE IF NOT ISNULL(ARRAYSUM(fragvlr)) and NOT ISNULL(ARRAYSUM(fragvol_l)) and NOT ISNULL(ARRAYSUM(fragvol_h)) AND (ISNULL(ms_l) OR ISNULL(fs_l) OR ISNULL(vfs_l) OR ISNULL(siltl)) THEN sieve_10l/100*(((0.7485*ms_r)+fs_r+vfs_r+siltr+clayr)-(clayr-clayl)) ELSE ISNULL(ARRAYSUM(fragvlr)) THEN (((0.7485*ms_r)+fs_r+vfs_r+siltr+clayr)-(((ms_r-ms_l)+(fs_r-fs_l)+(vfs_r-vfs_l)+(siltr-siltl)+(clayr-clayl))/5)) ELSE sieve_10l/100 *(((0.7485*ms_r)+fs_r+vfs_r+siltr+clayr) - (((ms_r-ms_l)+(fs_r-fs_l)+(vfs_r-vfs_l)+(siltr-siltl)+(clayr-clayl))/5)).
# Compute percent passing #200 sieve (minus pararocks).
DEFINE sieve_200l IF ISNULL(ARRAYSUM(fragvlr)) AND (ISNULL(vfs_l) OR ISNULL(siltl)) THEN (((vfs_r*0.56559)+siltr+clayr)-(clayr-clayl)) ELSE IF NOT ISNULL(ARRAYSUM(fragvlr)) and NOT ISNULL(ARRAYSUM(fragvol_l)) and NOT ISNULL(ARRAYSUM(fragvol_h)) AND (ISNULL(vfs_l) OR ISNULL(siltl)) THEN sieve_10l/100*(((vfs_r*0.56559)+siltr+clayr)-(clayr-clayl)) ELSE ISNULL(ARRAYSUM(fragvlr)) THEN IF (vfs_r) < 15 THEN (((vfs_r*0.56559)+siltr+clayr)-(((vfs_r-vfs_l)+(siltr-siltl)+(clayr-clayl))/3)) ELSE (((vfs_r*curvenum_l)+siltr+clayr)-(((vfs_r-vfs_l)+ (siltr-siltl)+(clayr-clayl))/3)) ELSE IF vfs_r < 15 THEN sieve_10l/100*(((vfs_r*0.56559)+siltr+clayr)-(((vfs_r-vfs_l)+(siltr-siltl)+(clayr-clayl))/3)) ELSE sieve_10l/100*(((vfs_r*curvenum_l)+siltr+clayr)- (((vfs_r-vfs_l)+(siltr-siltl)+(clayr-clayl))/3)).
ASSIGN sieve_10l IF om_r > 35 OR ISNULL(clayr) OR ISNULL(dbthirdbar_r) THEN 1/0 ELSE sieve_10l.
ASSIGN sieve_4l IF om_r > 35 OR ISNULL(clayr) OR ISNULL(dbthirdbar_r) THEN 1/0 ELSE sieve_4l.ASSIGN sieve_40l IF om_r > 35 OR (stratextsflag == 1 AND (ISNULL(clayr) OR ISNULL(siltr) OR ISNULL(vcos_r) OR ISNULL(cos_r) OR ISNULL(ms_r))) OR ISNULL(dbthirdbar_r) THEN 1/0 ELSE sieve_40l.
ASSIGN sieve_200l IF om_r > 35 OR (stratextsflag == 1 AND (ISNULL(clayr) OR ISNULL(siltr) OR ISNULL(vfs_r))) OR ISNULL(dbthirdbar_r) THEN 1/0 ELSE sieve_200l.
ASSIGN rockfrag_250l IF om_r > 35 AND ISNULL(ARRAYSUM(fragvoll)) THEN 0 ELSE IF (ISNULL(clayr) AND stratextsflag != 1) OR ISNULL(dbthirdbar_r) THEN 1/0 ELSE rockfrag_250l.
ASSIGN rockfrag_75l IF om_r > 35 AND ISNULL(ARRAYSUM(fragvoll)) THEN 0 ELSE IF (ISNULL(clayr) AND stratextsflag != 1) OR ISNULL(dbthirdbar_r) THEN 1/0 ELSE rockfrag_75l.
(430-VI-NSSH, 2010)

Part 618 – Soil Properties and Qualities 618-146
#--------------------------------------------# Checks for high values that are lower than the low values and vise versa for rock fragments.# This occurs when the fragvol_l and fragvol_h are not different from fragvol_r.
ASSIGN rockfrag_250l IF rockfrag_250l > rockfrag_250h THEN rockfrag_250h ELSE IF rockfrag_250l > rockfrag_250r THEN rockfrag_250r ELSE rockfrag_250l.
ASSIGN rockfrag_250h IF rockfrag_250h < rockfrag_250l THEN rockfrag_250l ELSE IF rockfrag_250h < rockfrag_250r THEN rockfrag_250r ELSE rockfrag_250h.
ASSIGN rockfrag_75l IF rockfrag_75l > rockfrag_75h THEN rockfrag_75h ELSE IF rockfrag_75l > rockfrag_75r THEN rockfrag_75r ELSE rockfrag_75l.
ASSIGN rockfrag_75h IF rockfrag_75h < rockfrag_75l THEN rockfrag_75l ELSE IF rockfrag_75h < rockfrag_75r THEN rockfrag_75r ELSE rockfrag_75h.
#--------------------------------------------# Checks that low values are not < 0 and high values are not > 100,# and rounds to whole numbers.
ASSIGN sieve_10l IF NOT ISNULL(sieve_10l) AND sieve_10l < 0 THEN 0 ELSE ROUND(sieve_10l,0).ASSIGN sieve_4l IF NOT ISNULL(sieve_4l) AND sieve_4l < 0 THEN 0 ELSE ROUND(sieve_4l,0).ASSIGN sieve_40l IF NOT ISNULL(sieve_40l) AND sieve_40l < 0 THEN 0 ELSE ROUND(sieve_40l,0).ASSIGN sieve_200l IF NOT ISNULL(sieve_200l) AND sieve_200l < 0 THEN 0 ELSE ROUND(sieve_200l,0).ASSIGN rockfrag_250l IF NOT ISNULL(rockfrag_250l) AND rockfrag_250l < 0 THEN 0 ELSE rockfrag_250l.ASSIGN rockfrag_75l IF NOT ISNULL(rockfrag_75l) AND rockfrag_75l < 0 THEN 0 ELSE rockfrag_75l.
ASSIGN sieve_10r ROUND(sieve_10r,0).ASSIGN sieve_4r ROUND(sieve_4r,0).ASSIGN sieve_40r ROUND(sieve_40r,0).ASSIGN sieve_200r ROUND(sieve_200r,0).
ASSIGN sieve_10h IF NOT ISNULL(sieve_10h) AND sieve_10h > 100 THEN 100 ELSE ROUND(sieve_10h,0).ASSIGN sieve_4h IF NOT ISNULL(sieve_4h) AND sieve_4h > 100 THEN 100 ELSE ROUND(sieve_4h,0).ASSIGN sieve_40h IF NOT ISNULL(sieve_40h) AND sieve_40h > 100 THEN 100 ELSE ROUND(sieve_40h,0).ASSIGN sieve_200h IF NOT ISNULL(sieve_200h) AND sieve_200h > 100 THEN 100 ELSE ROUND(sieve_200h,0).ASSIGN rockfrag_250h IF NOT ISNULL(rockfrag_250h) AND rockfrag_250h > 100 THEN 100 ELSE rockfrag_250h.ASSIGN rockfrag_75h IF NOT ISNULL(rockfrag_75h) AND rockfrag_75h > 100 THEN 100 ELSE rockfrag_75h.
#------------------------------------------------# Rounding errors (rounds to 1 instead of zero, when < 0.5)
ASSIGN rockfrag_250h IF NOT ISNULL(rockfrag_250h) AND rockfrag_250h > 0.05 and rockfrag_250h < 1 THEN 1 ELSE rockfrag_250h.
(430-VI-NSSH, 2010)

Part 618 – Soil Properties and Qualities 618-147
ASSIGN rockfrag_75h IF NOT ISNULL(rockfrag_75h) AND rockfrag_75h > 0.05 and rockfrag_75h < 1 THEN 1 ELSE rockfrag_75h.
#------------------------------------------------assign sieve_10l sieve_10l > sieve_4l ? sieve_4l : sieve_10l.assign sieve_40l sieve_40l > sieve_10l ? sieve_10l : sieve_40l.assign sieve_200l sieve_200l > sieve_40l ? sieve_40l : sieve_200l.
assign sieve_10h sieve_10h > sieve_4h ? sieve_4h : sieve_10h.assign sieve_40h sieve_40h > sieve_10h ? sieve_10h : sieve_40h.assign sieve_200h sieve_200h > sieve_40h ? sieve_40h : sieve_200h.
assign sieve_10r sieve_10r > sieve_4r ? sieve_4r : sieve_10r.assign sieve_40r sieve_40r > sieve_10r ? sieve_10r : sieve_40r.assign sieve_200r sieve_200r > sieve_40r ? sieve_40r : sieve_200r.
Appendix 618-8 NASIS Calculation for Estimating Water Content Data
Definition. Calculates the low, RV, and high values for water_one_tenth_bar (0.1 bar H20), water_one_third_bar (0.33 bar H2O), water_fifteen_bar (15 bar H2O), water_satiated (Satiated H2O), and bulk_density_oven_dry (Db oven dry).
Inputs. This calculation requires the following data to be populated: organic_matter_percent (OM) l,rv,hrock_frag_greater_than_10_in (Rock >10) l,rv,hrock_frag_3_to_10_in (Rock 3-10) l,rv,hsieve_number_10 (#10) l,rv,hbulk_density_one_third_bar (Db 0.33 bar H2O) l,rv,h orbulk_density_one_tenth_bar (Db 0.1 bar H2O) l,rv,hclay_total_separate (Total Clay) l,rv,hlinear_extensibility_percent (LEP) l,rv,htexture_class (Texture) ortexture_modifier_and_class (Tex Mod & Class)*
Limitations. Computes water contents for organic and mineral layers.
If no entry is found for Rock elements, they are assumed to be zero. Missing data in other elements may result in no output.
Uses texture_class if populated, if not uses texture_modifier_and class, but does not work if texture_modifier_and_class contains SR or modifiers.
Uses the texture group marked as RV for each horizon and the first texture sequence number within that texture group. If no texture group is marked RV or no sequence number is used, one texture will be selected at random.
Calculation.
DEFINE lieutex1 CODENAME(lieutex).
DEFINE oc_r IF ISNULL(om_r) THEN 1/0 ELSE om_r/1.72.DEFINE oc_l IF ISNULL(om_l) THEN 1/0 ELSE om_l/1.72.DEFINE oc_h IF ISNULL(om_h) THEN 1/0 ELSE om_h/1.72.
(430-VI-NSSH, 2010)

Part 618 – Soil Properties and Qualities 618-148
DEFINE db_r IF ISNULL(dbthirdbar_r) THEN dbtenthbar_r ELSE dbthirdbar_r.DEFINE db_l IF ISNULL(dbthirdbar_l) THEN dbtenthbar_l ELSE dbthirdbar_l.DEFINE db_h IF ISNULL(dbthirdbar_h) THEN dbtenthbar_h ELSE dbthirdbar_h.
ASSIGN claytotal_l IF claytotal_l == 0 THEN 0.1 ELSE claytotal_l.ASSIGN fragvol_r IF ISNULL(fragvol_r) THEN 0 ELSE fragvol_r.ASSIGN fragvol_l IF ISNULL(fragvol_l) THEN 0 ELSE fragvol_l.ASSIGN fragvol_h IF ISNULL(fragvol_h) THEN 0 ELSE fragvol_h.
# Assume particle density of rock fragments is 2.65 g/ccDEFINE D_p_gt_2 INITIAL 2.65.
# Try to use single texture if available.DEFINE tex IF ISNULL(texcl) THEN texgrp ELSE UPCASE(CODENAME(texcl)).
# 1500kPa to clay ratio vaires with bulk density and texture, # otherwise assume ratio of 1500KPa to Clay is 0.4DEFINE F IF claytotal_r >= 40 AND db_r <= 1.60 THEN 0.65 - 0.189*db_r ELSE IF claytotal_r >= 40 AND db_r > 1.6 THEN 0.3 ELSE IF tex == "SCL" OR tex == "CL" OR tex == "SL" THEN 0.42 ELSE IF tex == "FSL" OR tex == "COSL" OR tex == "LFS" OR tex == "LS" THEN 0.45 ELSE IF tex == "VFSL" OR tex == "LCOS" OR tex == "FS" THEN 0.46 ELSE IF tex == "S" THEN 0.44 ELSE IF tex == "SC" THEN 0.36 ELSE 0.4.
DEFINE F_l IF claytotal_l >= 40 AND db_r <= 1.60 THEN 0.65 - 0.189*db_r ELSE IF claytotal_l >= 40 AND db_r > 1.6 THEN 0.3 ELSE IF tex == "SCL" OR tex == "CL" OR tex == "SL" THEN 0.42 ELSE IF tex == "FSL" OR tex == "COSL" OR tex == "LFS" OR tex == "LS" THEN 0.45 ELSE IF tex == "VFSL" OR tex == "LCOS" OR tex == "FS" THEN 0.46 ELSE IF tex == "S" THEN 0.44 ELSE IF tex == "SC" THEN 0.36 ELSE 0.4.
DEFINE F_h IF claytotal_h >= 40 AND db_r <= 1.60 THEN 0.65 - 0.189*db_r ELSE IF claytotal_h >= 40 AND db_r > 1.6 THEN 0.3 ELSE IF tex == "SCL" OR tex == "CL" OR tex == "SL" THEN 0.42 ELSE IF tex == "FSL" OR tex == "COSL" OR tex == "LFS" OR tex == "LS" THEN 0.45 ELSE IF tex == "VFSL" OR tex == "LCOS" OR tex == "FS" THEN 0.46 ELSE IF tex == "S" THEN 0.44 ELSE IF tex == "SC" THEN 0.36 ELSE 0.4.
# Assume air entrapment ratio is 0.95DEFINE air_entrap INITIAL 0.95.
# Determine coefficients p and q for Gregson equationDEFINE p if tex=="CL" or tex=="L" or tex=="SICL" or tex=="SIL" then 1.415 else if tex=="COSL" or tex=="FSL" or tex=="LVFS" or tex=="SCL" or tex=="SI" or tex=="SL" or tex=="VFS" or tex=="VFSL" or tex=="LCOS" or tex=="LFS" or tex=="LS" then 0.343 else if tex=="S" or tex=="SG" or tex=="G" or tex=="COS" or tex=="FS" then 0.541 else if tex=="C" or tex=="SC" or tex=="SIC" then 0.879 else 1/0.
DEFINE q if tex=="CL" or tex=="L" or tex=="SICL" or tex=="SIL" then 0.839 else if tex=="COSL" or tex=="FSL" or tex=="LVFS" or tex=="SCL" or tex=="SI" or tex=="SL" or tex=="VFS" or tex=="VFSL" or tex=="LCOS" or tex=="LFS" or tex=="LS" then 1.072 else if tex=="S" or tex=="SG" or tex=="G" or tex=="COS" or tex=="FS" then 1.469 else if tex=="C" or tex=="SC" or tex=="SIC" then 0.955 else 1/0.
# Compute particle density based on organic matter#ASSIGN om_r if isnull(om_r) then 0 else om_r.DEFINE Dp 100 / ((om_r / 1.4) + (100 - om_r)/2.65).
# Compute weight percent of rock fragments based on sieves(430-VI-NSSH, 2010)

Part 618 – Soil Properties and Qualities 618-149
ASSIGN fraggt10_r if isnull(fraggt10_r) then 0 else fraggt10_r.ASSIGN frag3to10_r if isnull(frag3to10_r) then 0 else frag3to10_r.DEFINE W_gt_2 fraggt10_r + frag3to10_r + (100 - sieveno10_r) * (100 - fraggt10_r - frag3to10_r) / 100.
ASSIGN fraggt10_l if isnull(fraggt10_l) then 0 else fraggt10_l.ASSIGN frag3to10_l if isnull(frag3to10_l) then 0 else frag3to10_l.DEFINE W_gt_2_l fraggt10_l + frag3to10_l + (100 - sieveno10_h) * (100 - fraggt10_l - frag3to10_l) / 100.
ASSIGN fraggt10_h if isnull(fraggt10_h) then 0 else fraggt10_h.ASSIGN frag3to10_h if isnull(frag3to10_h) then 0 else frag3to10_h.DEFINE W_gt_2_h fraggt10_h + frag3to10_h + (100 - sieveno10_l) * (100 - fraggt10_h - frag3to10_h) / 100.
# Adjust bulk density for rock fragmentsDEFINE D_b 100 / (W_gt_2/D_p_gt_2 + (100 - W_gt_2)/db_r).DEFINE D_b_l 100 / (W_gt_2_l/D_p_gt_2 + (100 - W_gt_2_l)/db_r).DEFINE D_b_h 100 / (W_gt_2_h/D_p_gt_2 + (100 - W_gt_2_h)/db_r).
# Compute volume percent of rock fragmentsDEFINE V_gt_2 (W_gt_2 * D_b) / D_p_gt_2.DEFINE V_gt_2_l (W_gt_2_l * D_b_l) / D_p_gt_2.DEFINE V_gt_2_h (W_gt_2_h * D_b_h) / D_p_gt_2.
# -----------15 Bar Water-------------------------------------------
# Compute 15 bar water content uncorrected (by volume and by weight)DEFINE theta_1500_uc ((claytotal_r * (1 - om_r/100) * F + om_r) * db_r) / 100.DEFINE theta_1500_uc_l ((claytotal_l * (1 - om_l/100) * F_l + om_l) * db_r) / 100.DEFINE theta_1500_uc_h ((claytotal_h * (1 - om_h/100) * F_h + om_h) * db_r) / 100.
DEFINE theta_1500_uc_w (claytotal_r * (1 - om_r/100) * F + om_r) / 100.DEFINE theta_1500_uc_w_l (claytotal_l * (1 - om_l/100) * F_l + om_l) / 100.DEFINE theta_1500_uc_w_h (claytotal_h * (1 - om_h/100) * F_h + om_h) / 100.
# Compute 15 bar water content corrected for rock fragments.# Convert to percent.DEFINE theta_1500 theta_1500_uc * (100 - V_gt_2).DEFINE theta_1500_l theta_1500_uc_l * (100 - V_gt_2_h).DEFINE theta_1500_h theta_1500_uc_h * (100 - V_gt_2_l).
DEFINE theta_1500_w theta_1500_uc_w * (100 - W_gt_2).DEFINE theta_1500_w_l theta_1500_uc_w_l * (100 - W_gt_2_h).DEFINE theta_1500_w_h theta_1500_uc_w_h * (100 - W_gt_2_l).
#-----------Satiated Water--------------------------------------------
# Compute saturated water content uncorrectedDEFINE wcs_uc air_entrap * (1 - db_r / Dp).DEFINE wcs_uc_l air_entrap * (1 - db_h / Dp).DEFINE wcs_uc_h air_entrap * (1 - db_l / Dp).
# Compute saturated water content corrected for rock fragments.# Convert to percent.
(430-VI-NSSH, 2010)

Part 618 – Soil Properties and Qualities 618-150
DEFINE wcs ROUND((wcs_uc * (100 - V_gt_2)),0).DEFINE wcs_l ROUND((wcs_uc_l * (100 - V_gt_2_h)),0).DEFINE wcs_h ROUND((wcs_uc_h * (100 - V_gt_2_l)),0).
# ----------1/3 Bar Water---------------------------------------------
# Compute RV values# Compute slope and intercept for the Gregson equation# Uses volumetric water contentDEFINE ln_1500 INITIAL 7.31322.DEFINE ln_theta logn(theta_1500_uc).DEFINE ln_wcs logn(wcs_uc).
DEFINE cpslope (ln_1500 - p) / (ln_theta + q).DEFINE cpintercept ln_1500 - (cpslope * ln_theta).
# Compute field capacity uncorrectedDEFINE fc_uc_10 exp((logn(10) - cpintercept) / cpslope).DEFINE fc_uc_33 IF tex == "C" THEN exp(0.237*LOGN(claytotal_r)-1.26*db_r+4.162)*db_r/100 ELSE exp((logn(33) - cpintercept) / cpslope).
# Monotonicity check: field capacity between theta_1500_uc and wcs_ucDEFINE cpslope_adj IF not isnull(fc_uc_10) and (fc_uc_10 <= 1.1 * theta_1500_uc or fc_uc_10 >= .95 * wcs_uc) then ln_1500 / (ln_theta - ln_wcs) else cpslope.
DEFINE cpintercept_adj IF not isnull(fc_uc_10) and (fc_uc_10 <= 1.1 * theta_1500_uc or fc_uc_10 >= .95 * wcs_uc) then 0 - (cpslope * ln_wcs) else cpintercept.
ASSIGN fc_uc_10 exp((logn(10) - cpintercept_adj) / cpslope_adj).
ASSIGN cpslope_adj IF not isnull(fc_uc_33) and (fc_uc_33 <= 1.1 * theta_1500_uc or fc_uc_33 >= .95 * wcs_uc) then ln_1500 / (ln_theta - ln_wcs) else cpslope.
ASSIGN cpintercept_adj IF not isnull(fc_uc_33) and (fc_uc_33 <= 1.1 * theta_1500_uc or fc_uc_33 >= .95 * wcs_uc) then 0 - (cpslope * ln_wcs) else cpintercept.
ASSIGN fc_uc_33 IF not isnull(fc_uc_33) AND claytotal_r > 40 THEN fc_uc_33 ELSE exp((logn(33) - cpintercept_adj) / cpslope_adj).
# Correct field capacity for rock fragments.# Convert to percent.DEFINE wtenth_r if tex=="LCOS" or tex=="LFS" or tex=="LS" or tex=="S" or tex=="SG" or tex=="G" or tex=="COS" or tex=="FS" THEN fc_uc_10 * (100 - V_gt_2) ELSE 1/0.DEFINE wthird_r fc_uc_33 *(100 - V_gt_2).
# Compute low values --------------------------# Compute slope and intercept for the Gregson equation# Uses volumetric water contentDEFINE ln_theta_l logn(theta_1500_uc_l).DEFINE ln_wcs_l logn(wcs_uc_l).
DEFINE cpslope_l (ln_1500 - p) / (ln_theta + q).DEFINE cpintercept_l ln_1500 - (cpslope_l * ln_theta_l).
# Compute field capacity uncorrected(430-VI-NSSH, 2010)

Part 618 – Soil Properties and Qualities 618-151
DEFINE fc_uc_10_l exp((logn(10) - cpintercept_l) / cpslope_l).DEFINE fc_uc_33_l IF tex == "C" THEN exp(0.237*LOGN(claytotal_l)-1.26*db_r+4.162)*db_r/100 ELSE exp((logn(33) - cpintercept_l) / cpslope_l).
# Monotonicity check: field capacity between theta_1500_uc_l and wcs_uc_lDEFINE cpslope_adj_l IF not isnull(fc_uc_10_l) and (fc_uc_10_l <= 1.1 * theta_1500_uc_l or fc_uc_10_l >= .95 * wcs_uc_l) then ln_1500 / (ln_theta_l - ln_wcs_l) else cpslope_l.
DEFINE cpintercept_adj_l IF not isnull(fc_uc_10_l) and (fc_uc_10_l <= 1.1 * theta_1500_uc_l or fc_uc_10_l >= .95 * wcs_uc_l) then 0 - (cpslope_l * ln_wcs_l) else cpintercept_l.
ASSIGN fc_uc_10_l exp((logn(10) - cpintercept_adj_l) / cpslope_adj_l).
ASSIGN cpslope_adj_l IF not isnull(fc_uc_33_l) and (fc_uc_33_l <= 1.1 * theta_1500_uc_l or fc_uc_33_l >= .95 * wcs_uc_l) then ln_1500 / (ln_theta_l - ln_wcs_l) else cpslope_l.
ASSIGN cpintercept_adj_l IF not isnull(fc_uc_33_l) and (fc_uc_33_l <= 1.1 * theta_1500_uc_l or fc_uc_33_l >= .95 * wcs_uc_l) then 0 - (cpslope_l * ln_wcs_l) else cpintercept_l.
ASSIGN fc_uc_33_l IF not isnull(fc_uc_33_l) AND claytotal_l > 40 THEN fc_uc_33_l ELSE exp((logn(33) - cpintercept_adj_l) / cpslope_adj_l).
# Correct field capacity for rock fragments.# Convert to percent.DEFINE wtenth_l if tex=="LCOS" or tex=="LFS" or tex=="LS" or tex=="S" or tex=="SG" or tex=="G" or tex=="COS" or tex=="FS" THEN fc_uc_10_l * (100 - V_gt_2_h) ELSE 1/0.DEFINE wthird_l fc_uc_33_l * (100 - V_gt_2_h).
# Compute high values ------------------------# Compute slope and intercept for the Gregson equation# Uses volumetric water contentDEFINE ln_theta_h logn(theta_1500_uc_h).DEFINE ln_wcs_h logn(wcs_uc_h).
DEFINE cpslope_h (ln_1500 - p) / (ln_theta_h + q).DEFINE cpintercept_h ln_1500 - (cpslope_h * ln_theta_h).
# Compute field capacity uncorrectedDEFINE fc_uc_10_h exp((logn(10) - cpintercept_h) / cpslope_h).DEFINE fc_uc_33_h IF tex == "C" THEN exp(0.237*LOGN(claytotal_h)-1.26*db_r+4.162)*db_r/100 ELSE exp((logn(33) - cpintercept_h) / cpslope_h).
# Monotonicity check: field capacity between theta_1500_uc and wcs_ucDEFINE cpslope_adj_h IF not isnull(fc_uc_10_h) and (fc_uc_10_h <= 1.1 * theta_1500_uc_h or fc_uc_10_h >= .95 * wcs_uc_h) then ln_1500 / (ln_theta_h - ln_wcs_h) else cpslope_h.
DEFINE cpintercept_adj_h IF not isnull(fc_uc_10_h) and (fc_uc_10_h <= 1.1 * theta_1500_uc_h or fc_uc_10_h >= .95 * wcs_uc_h) then 0 - (cpslope_h * ln_wcs_h) else cpintercept_h.
ASSIGN fc_uc_10_h exp((logn(10) - cpintercept_adj_h) / cpslope_adj_h).
ASSIGN cpslope_adj_h IF not isnull(fc_uc_33_h) and (fc_uc_33_h <= 1.1 * theta_1500_uc_h or fc_uc_33_h >= .95 * wcs_uc_h) then ln_1500 / (ln_theta_h - ln_wcs_h) else cpslope_h.
(430-VI-NSSH, 2010)

Part 618 – Soil Properties and Qualities 618-152
ASSIGN cpintercept_adj_h IF not isnull(fc_uc_33_h) and fc_uc_33_h <= 1.1 * theta_1500_uc_h or fc_uc_33_h >= .95 * wcs_uc_h) then 0 - (cpslope_h * ln_wcs_h) else cpintercept_h.
ASSIGN fc_uc_33_h IF not isnull(fc_uc_33_h) AND claytotal_h > 40 THEN fc_uc_33_h ELSE exp((logn(33) - cpintercept_adj_h) / cpslope_adj_h).
# Correct field capacity for rock fragments.# Convert to percent.DEFINE wtenth_h if tex=="LCOS" or tex=="LFS" or tex=="LS" or tex=="S" or tex=="SG" or tex=="G" or tex=="COS" or tex=="FS" THEN fc_uc_10_h * (100 - V_gt_2_l) ELSE 1/0.
DEFINE wthird_h fc_uc_33_h * (100 - V_gt_2_l).
#----------------------------------------------------------# Additional calculations for when water contents exceed satiated water contents using the gregson model.# This generally occurs for compacted or dense soil layers.
ASSIGN wtenth_r IF om_r >20 OR ((wtenth_r >= wcs) AND (NOT ISNULL(wtenth_r) OR NOT ISNULL(theta_1500) OR NOT ISNULL(wcs))) THEN 1/0 ELSE wtenth_r.
ASSIGN wthird_r IF om_r <= 20 AND ((wthird_r >= wcs) AND (NOT ISNULL(wthird_r) OR NOT ISNULL(theta_1500) OR NOT ISNULL(wcs))) THEN IF claytotal_r < 40 THEN (exp(logn(theta_1500_uc_w*100)*0.515 - 0.619*db_r + 2.696))/100 * db_r * (100 - V_gt_2) ELSE exp(0.237*LOGN(claytotal_r)-1.26*db_r+4.162)*db_r/100 * (100 - V_gt_2) ELSE IF om_r > 20 THEN 1/0 ELSE wthird_r.
ASSIGN wthird_r IF ((wthird_r >= wcs) AND (NOT ISNULL(wthird_r) OR NOT ISNULL(theta_1500) OR NOT ISNULL(wcs))) THEN wcs-(0.05*wcs) ELSE wthird_r. IF om_r <= 20 AND ((theta_1500 > wcs OR theta_1500 > wthird_r) AND (NOT ISNULL(wthird_r) OR NOT ISNULL(theta_1500) OR NOT ISNULL(wcs))) THEN wthird_r-(0.1*wthird_r) ELSE IF om_r > 20 THEN 1/0 ELSE theta_1500.
ASSIGN wtenth_l IF om_r >20 OR ((wtenth_l >= wcs_l) AND (NOT ISNULL(wtenth_l) OR NOT ISNULL(theta_1500_l) OR NOT ISNULL(wcs_l))) THEN 1/0 ELSE wtenth_l.
ASSIGN wthird_l IF om_r <= 20 AND ((wthird_l >= wcs_l) AND (NOT ISNULL(wthird_l) OR NOT ISNULL(theta_1500_l) OR NOT ISNULL(wcs_l))) THEN IF claytotal_l < 40 THEN (exp(logn(theta_1500_uc_w_l*100)*0.515 - 0.619*db_r + 2.696))/100 * db_r * (100 - V_gt_2_h) ELSE exp(0.237*LOGN(claytotal_l)-1.26*db_r+4.162)*db_r/100 * (100 - V_gt_2_h) ELSE IF om_r > 20 THEN 1/0 ELSE wthird_l.
ASSIGN wthird_l IF ((wthird_l >= wcs_l) AND (NOT ISNULL(wthird_l) OR NOT ISNULL(theta_1500_l) OR NOT ISNULL(wcs_l))) THEN wcs_l-(0.05*wcs_l) ELSE wthird_l.
ASSIGN theta_1500_l IF om_r <= 20 AND ((theta_1500_l > wcs_l OR theta_1500_l > wthird_l) AND (NOT ISNULL(wthird_l) OR NOT ISNULL(theta_1500_l) OR NOT ISNULL(wcs_l))) THEN wthird_l-(0.1*wthird_l) ELSE IF om_r > 20 THEN 1/0 ELSE theta_1500_l.
ASSIGN wtenth_h IF om_r >20 OR ((wtenth_h >= wcs_h) AND (NOT ISNULL(wtenth_h) OR NOT ISNULL(theta_1500_h) OR NOT ISNULL(wcs_h))) THEN 1/0 ELSE wtenth_h.
ASSIGN wthird_h IF om_r <= 20 AND ((wthird_h >= wcs_h) AND (NOT ISNULL(wthird_h) OR NOT ISNULL(theta_1500_h) OR NOT ISNULL(wcs_h))) THEN IF claytotal_h < 40 THEN (exp(logn(theta_1500_uc_w_h*100)*0.515 - 0.619*db_r + 2.696))/100 * db_r * (100 - V_gt_2_l) ELSE
(430-VI-NSSH, 2010)

Part 618 – Soil Properties and Qualities 618-153
exp(0.237*LOGN(claytotal_h)-1.26*db_r+4.162)*db_r/100 * (100 - V_gt_2_l) ELSE IF om_r > 20 THEN 1/0 ELSE wthird_h.
ASSIGN wthird_h IF ((wthird_h >= wcs_h) AND (NOT ISNULL(wthird_h) OR NOT ISNULL(theta_1500_h) OR NOT ISNULL(wcs_h))) THEN wcs_h-(0.05*wcs_h) ELSE wthird_h.
ASSIGN theta_1500_h IF om_r <= 20 AND ((theta_1500_h > wcs_h OR theta_1500_h > wthird_h) AND (NOT ISNULL(wthird_h) OR NOT ISNULL(theta_1500_h) OR NOT ISNULL(wcs_h))) THEN wthird_h-(0.1*wthird_h) ELSE IF om_r > 20 THEN 1/0 ELSE theta_1500_h.
#-------------Organic Soils, 1/3 and 15 bar Water---------------------------------
DEFINE theta_1500_org_w IF om_r <= 20 THEN 1/0 ELSE IF (lieutex1 == "mpt" OR lieutex1 == "mpm") THEN (2.019*oc_r+10.54) *0.75 ELSE IF (lieutex1 == "muck" OR lieutex1 == "hpm") THEN (1.731*oc_r+8.863) *0.75 ELSE IF (lieutex1 == "peat" OR lieutex1 == "spm") THEN (2.122*oc_r+10.539) *0.75 ELSE 1/0.
ASSIGN theta_1500 IF ISNULL(theta_1500_org_w) THEN theta_1500 ELSE theta_1500_org_w*db_r / 100 *(100 - fragvol_r).
DEFINE theta_1500_org_w_l IF om_r <= 20 THEN 1/0 ELSE IF (lieutex1 == "mpt" OR lieutex1 == "mpm") THEN (2.019*oc_l+10.54) *0.75 ELSE IF (lieutex1 == "muck" OR lieutex1 == "hpm") THEN (1.731*oc_l+8.863) *0.75 ELSE IF (lieutex1 == "peat" OR lieutex1 == "spm") THEN (2.122*oc_l+10.539) *0.75 ELSE 1/0.
ASSIGN theta_1500_l IF ISNULL(theta_1500_org_w_l) THEN theta_1500_l ELSE theta_1500_org_w_l*db_r / 100 *(100 - fragvol_h).
DEFINE theta_1500_org_w_h IF om_r <= 20 THEN 1/0 ELSE IF (lieutex1 == "mpt" OR lieutex1 == "mpm") THEN (2.019*oc_h+10.54) *0.75 ELSE IF (lieutex1 == "muck" OR lieutex1 == "hpm") THEN (1.731*oc_h+8.863) *0.75 ELSE IF (lieutex1 == "peat" OR lieutex1 == "spm") THEN (2.122*oc_h+10.539) *0.75 ELSE 1/0.
ASSIGN theta_1500_h IF ISNULL(theta_1500_org_w_h) THEN theta_1500_h ELSE theta_1500_org_w_h*db_r / 100 *(100 - fragvol_l).
DEFINE ln_theta_1500 LOGN(theta_1500_org_w).DEFINE ln_theta_1500_l LOGN(theta_1500_org_w_l).DEFINE ln_theta_1500_h LOGN(theta_1500_org_w_h).DEFINE ln_db_r LOGN(db_r).DEFINE ln_oc_r LOGN(oc_r).DEFINE ln_oc_l LOGN(oc_l).DEFINE ln_oc_h LOGN(oc_h).ASSIGN wthird_r IF om_r <= 20 THEN wthird_r ELSE IF (lieutex1 == "mpt" OR lieutex1 == "mpm") THEN EXP(0.360*ln_theta_1500-1.076*ln_db_r+2.236) * db_r / 100 *(100 - fragvol_r) ELSE IF (lieutex1 == "muck" OR lieutex1 == "hpm") THEN EXP(0.142*ln_theta_1500-1.047*ln_db_r+3.340) * db_r / 100 *(100 - fragvol_r) ELSE IF (lieutex1 == "peat" OR lieutex1 == "spm") THEN EXP(0.427*ln_theta_1500-0.852*ln_db_r+2.282) * db_r / 100 *(100 - fragvol_r) ELSE 1/0.
ASSIGN wthird_l IF om_r <= 20 THEN wthird_l ELSE IF (lieutex1 == "mpt" OR lieutex1 == "mpm") THEN EXP(0.360*ln_theta_1500_l-1.076*ln_db_r+2.236) * db_r / 100 *(100 - fragvol_h) ELSE IF (lieutex1 == "muck" OR lieutex1 == "hpm") THEN EXP(0.142*ln_theta_1500_l-1.047*ln_db_r+3.340) * db_r / 100 *(100 - fragvol_h) ELSE IF (lieutex1 == "peat" OR lieutex1 == "spm") THEN EXP(0.427*ln_theta_1500_l-0.852*ln_db_r+2.282) * db_r / 100 *(100 - fragvol_h) ELSE 1/0.
(430-VI-NSSH, 2010)

Part 618 – Soil Properties and Qualities 618-154
ASSIGN wthird_h IF om_r <= 20 THEN wthird_h ELSE IF (lieutex1 == "mpt" OR lieutex1 == "mpm") THEN EXP(0.360*ln_theta_1500_h-1.076*ln_db_r+2.236) * db_r / 100 *(100 - fragvol_l) ELSE IF (lieutex1 == "muck" OR lieutex1 == "hpm") THEN EXP(0.142*ln_theta_1500_h-1.047*ln_db_r+3.340) * db_r / 100 *(100 - fragvol_l) ELSE IF (lieutex1 == "peat" OR lieutex1 == "spm") THEN EXP(0.427*ln_theta_1500_h-0.852*ln_db_r+2.282) * db_r / 100 *(100 - fragvol_l) ELSE 1/0.
ASSIGN theta_1500 IF om_r > 13 AND om_r <= 20 AND (lieutex1 == "mpt" OR lieutex1 == "mpm" OR lieutex1 == "muck" OR lieutex1 == "hpm" OR lieutex1 == "peat" OR lieutex1 == "spm") THEN (EXP(0.673*ln_oc_r + 1.618)*0.75) * db_r / 100 *(100 - fragvol_l) ELSE theta_1500.
ASSIGN theta_1500_l IF om_r > 13 AND om_r <= 20 AND (lieutex1 == "mpt" OR lieutex1 == "mpm" OR lieutex1 == "muck" OR lieutex1 == "hpm" OR lieutex1 == "peat" OR lieutex1 == "spm") THEN (EXP(0.673*ln_oc_l + 1.618)*0.75) * db_r / 100 *(100 - fragvol_h) ELSE theta_1500_l.
ASSIGN theta_1500_h IF om_r > 13 AND om_r <= 20 AND (lieutex1 == "mpt" OR lieutex1 == "mpm" OR lieutex1 == "muck" OR lieutex1 == "hpm" OR lieutex1 == "peat" OR lieutex1 == "spm") THEN (EXP(0.673*ln_oc_h + 1.618)*0.75) * db_r / 100 *(100 - fragvol_l) ELSE theta_1500_h.
DEFINE ln_theta_1500_A LOGN(EXP(0.673*ln_oc_r + 1.618) *0.75).DEFINE ln_theta_1500_A_l LOGN(EXP(0.673*ln_oc_l + 1.618) *0.75).DEFINE ln_theta_1500_A_h LOGN(EXP(0.673*ln_oc_h + 1.618) *0.75).
ASSIGN wthird_r IF om_r > 13 AND om_r <= 20 AND (lieutex1 == "mpt" OR lieutex1 == "mpm" OR lieutex1 == "muck" OR lieutex1 == "hpm" OR lieutex1 == "peat" OR lieutex1 == "spm") THEN EXP(0.267*ln_theta_1500_A - 1.141*ln_db_r + 2.821) * db_r / 100 *(100 - fragvol_r) ELSE wthird_r.
ASSIGN wthird_l IF om_r > 13 AND om_r <= 20 AND (lieutex1 == "mpt" OR lieutex1 == "mpm" OR lieutex1 == "muck" OR lieutex1 == "hpm" OR lieutex1 == "peat" OR lieutex1 == "spm") THEN EXP(0.267*ln_theta_1500_A_l - 1.141*ln_db_r + 2.821) * db_r / 100 *(100 - fragvol_h) ELSE wthird_l.
ASSIGN wthird_h IF om_r > 13 AND om_r <= 20 AND (lieutex1 == "mpt" OR lieutex1 == "mpm" OR lieutex1 == "muck" OR lieutex1 == "hpm" OR lieutex1 == "peat" OR lieutex1 == "spm") THEN EXP(0.267*ln_theta_1500_A_h - 1.141*ln_db_r + 2.821) * db_r / 100 *(100 - fragvol_l) ELSE wthird_h.
#-------------Oven Dry Bulk Denisty-----------------------------------------------
# Compute oven dry bulk densityDEFINE bdrdr IF NOT ISNULL(lep_r) THEN (((lep_r/100) / (1 - V_gt_2/100) + 1) ** 3) * db_r ELSE 1/0.DEFINE bdrdl IF NOT ISNULL(lep_l) THEN (((lep_l/100) / (1 - V_gt_2/100) + 1) ** 3) * db_r ELSE 1/0.DEFINE bdrdh IF NOT ISNULL(lep_h) THEN (((lep_h/100) / (1 - V_gt_2/100) + 1) ** 3) * db_r ELSE 1/0.
ASSIGN bdrdl IF NOT ISNULL(lep_l) AND bdrdl > db_l THEN bdrdr - (db_r - db_l) ELSE bdrdl.ASSIGN bdrdh IF NOT ISNULL(lep_h) AND bdrdh < db_h THEN bdrdr + (db_h - db_r) ELSE bdrdh.
# Values for median bulk density differences between 1/3 bar and oven-dry divided by the total clay.DEFINE dbdiff IF tex == "L" OR tex == "SCL" OR tex == "SIL" OR tex == "FSL" OR tex == "COSL" OR tex == "SL" OR tex == "VFSL" OR tex == "SI" OR tex == "LVFS" THEN 0.004 ELSE IF tex == "CL" OR tex == "S" OR tex == "LFS" OR tex == "FS" OR tex == "LS" THEN 0.005 ELSE IF tex == "SICL" OR tex == "LCOS" OR tex == "COS" THEN 0.006 ELSE IF tex == "C" OR tex == "SIC" THEN 0.007 ELSE IF tex == "SC" THEN 0.002 ELSE IF tex == "VFS" THEN 0.003 ELSE 0.004.
ASSIGN bdrdr IF (bdrdr - db_r) > 0.75 OR bdrdr > 2.1 THEN dbdiff*claytotal_r + db_r ELSE bdrdr.
(430-VI-NSSH, 2010)

Part 618 – Soil Properties and Qualities 618-155
ASSIGN bdrdl IF ((bdrdl - db_r)*(-1)) > 0.75 OR bdrdl > 2.1 THEN dbdiff*claytotal_l + db_r ELSE bdrdl.
ASSIGN bdrdh IF (bdrdh - db_r) > 0.75 OR bdrdh > 2.1 THEN dbdiff*claytotal_h + db_r ELSE bdrdh.
ASSIGN bdrdr IF bdrdr > 2.1 OR om_r > 20 THEN 1/0 ELSE bdrdr.ASSIGN bdrdl IF bdrdl > 2.1 OR om_r > 20 THEN 1/0 ELSE bdrdl.ASSIGN bdrdh IF bdrdh > 2.1 OR om_r > 20 THEN 1/0 ELSE bdrdh.
DEFINE bdrdr2 IF bdrdr > bdrdh THEN bdrdh ELSE bdrdr.ASSIGN bdrdh IF bdrdr > bdrdh THEN bdrdr ELSE bdrdh.ASSIGN bdrdr bdrdr2.
DEFINE store2 IF bdrdl > bdrdr THEN bdrdl ELSE bdrdr.ASSIGN bdrdl IF bdrdl > bdrdr THEN bdrdr ELSE bdrdl.ASSIGN bdrdr store2.
(430-VI-NSSH, 2010)