
SWAVE o UNDERWATER EXPLOSION - apps.dtic.mil · The British researches reported in the LTER...
175
-/ / ,." 'NSW(/WOL MP 76-15 SWAVE MAKING BY AN o UNDERWATER EXPLOSION • By Gregory K. Hartmann DD- C Cý SEPTEMBER 1976 APR]14 19 W 4 .; . .. CL.~ N S W -11- NAVAL SURFAC WEAPOSCEN ER A 4 W HIE AKLAORTOY • .. • .+:' . .. . .. .... . . .. . .•:.. •. .. . .. _ p . ..... l . •:.,. . .•:.•..•.. r . . ... ... :, . . . • U r.l" ,,. .- • -. - ' , ÷.I" ' • " .--- ". " " S • . . . . , . 1, . : . :• . .:
Transcript of SWAVE o UNDERWATER EXPLOSION - apps.dtic.mil · The British researches reported in the LTER...
-/ / ,." 'NSW(/WOL MP 76-15
SWAVE MAKING BY ANo UNDERWATER EXPLOSION• By Gregory K. Hartmann DD- C
Cý SEPTEMBER 1976APR]14 19
W 4 .;
. ..
CL.~
N S W
-11- NAVAL SURFAC WEAPOSCEN ERA 4 W HIE AKLAORTOY
• .. • .+:' . .. . .. .... . . .. . .•:.. •. .. . .._ p . ..... l .
•:.,. . .•:.•..•.. r . . ... ... :, . . . • U r.l" ,,. .-
• - . - ' , ÷.I" ' • " .--- ". " "
S•-=.:, • . . . . , . 1, . : . :• . . :
S........... .... . " i•. ..". . . ..•
SECURITY CLAS'iFICATION Of" TH14IS PAGE Datan FInftv.dJ ...... ..... .. .. . .-'-: -•-•: REORTDOCUENTAION AGEREAD' INTRUC.T-iNSg-
REPORT DOCUMENTATION PAGE 3BEFORE COMPLETING FORM.IT A3CCSSIO" 04, 3. RECIPIENT'S 1CATAi.0 NUMBEAR
• '~ (7 C . - "1.... .
4 TITLE e•nd Subtit.) S. TrPE OF REPORT 6 PERIOD COVERED
V,.-1, ,•,ori,-i by , Ex prlo-,,?v•,oneG. PERFORMING ORG, REPORT NUMBER
6. CONTRACT OR GRANT NUMBER(s)
oI- .AME AND A0RESS 10. PROGRAM ELEMENT, PROJECT, TASK
AREA, & WORK UNIT NUMBERS
V h k, lilt , k Lý,-i or ,.torv 0 ; 0 ;IThite Oak.,_Silver S•pring, Maryland 20210
I1 CONT'•OIL. ING' OFFICE. NAMIE AND ADDRESS..- - • = "i ..Sepf DiI 7C,
15914 MONITORINU AGENCY NAME & AOD RESS(If diflerent fr.., Controllrng Ofive) I5, SECURITY CLASS. (of this repori)
UNICLASSIFIEDIse. OECL ASSI F;C ATION DOWNORACING
SCHEDULE
16 01 ST•II T1qurON ST ATEMIENT r.(f this Rep.,t)
",os'jv;.)j n•,,uWt* release; distribution arinlimitel
17. DI-TRISUTION STATEMENT ,oi she abe• relt entered I n Bluck 20, II dlfterpen• Iroth Report)
IS. bUPPLEMENTARY NOTES
19 KEY WORDS (Cornirnue on reverse olde it necessary ald Identity by block number)
Underwater explosionsWave makingExplosion bubble containmentExplosion bubble blowout
20 A'kSTMA CT fContlnue on reve.prsi olde If1reCsaar, y end Idonwlby by blockm nrtritt)
"t\Thi,- -narper is a. historical account of wave makIng •-•perimeit, mader-1 ilrmm.di.ately after World War T1, from the smallest to the
rt. �: .•[inclurlin-S the Atom Eaker Bikini. The various theori-asI c-f zpesivc wave making are discussed and comparisons are mq-eb-U.,--in thq ob.servations and the theoreticail expectations:. Scalinqlv -3-o,:r exarminei fuf the two distinct caF.s:s explosion bubblerontninment (deep cqse) and explosion bubble blowout (shallow ,as,).
DD ,JN73 1473 FDITION OF 1 Nov oo ETEA• T-,.•s o ,,, t -
SECURITY CL ASSIFCAIION OF THIS PAGE (When Veto nile*)-¢__26
- v (.1Y CLA SýIFIC i,) OF.
-=.• . ...... .. ... .. . .. • --_-- -i -im ! •-- e.-r .... or 1 .; "- bo• .. .... tt,.om--- • . -K no or. .... iz -•_ . .. .... A: 7 vn oral.. . ec-ei ... o (o u n i - ----------.... ..... ... ..
h is t'-%ach,-- thrit 1 :t to r.- P.. -Ccjj c,.y r .t .........
+lctor ol tvuo Vw'ith ",'- J"',A ti v... thin ewt-' v,,Lth iin to wcm' rir . "h nn,,i3,•. n ,' n-ts.Vhch 3r0
-n Jt c'ectly .•I4oolicb!.O to th,-. . cn" V1'YXm, 11-1 n ";•. i . 'horvsoi norer cases ,ss1mo the r'sCi( 01 a Ti botto i an in othr' ca.we
.-ito ii.-nt•lt . n :h1; i bottom
j n[ of AXoyrith;-s-,. of -',! ,I' -h-1-o1n
""- - '� �; I -,-sct •tion by h; oh 1'. c s •,t• , m
Th conchlsions n~i' : iot liro,ýq-sir trrnt ,,,th lot;' , ',r! in tl,-is --i',on- !n th.-- I ast r-
AT!$VM W IsliStt3m Z
•J! ]D ... ......... l .m o .]..
4~;S '
•,
"U
Dc A-ct;i,-i 7T; ";
SE-11HIT 1 Ck-ASS1FICAr 'IOE C)V T1-41S & FW'1), Ft,-

TABLE OF CONTENTS
Page
Foreword ...................................................... 1
Chronology ..................................................... 6
I TESTS AT SOLOMONS, Maryland (1944) .......................... 8
1. Introduction ..................................... a
2. Site ................................................... U
3. Experimental Arrangement ............................... 9
44. Shot 1 ................................................. 10
5. Camera Arrangement and Details ......................... .3
6. Distances .............................................. 18
7. Wavelength vs. Velocity (aerial data) .................. 21
8. Wavelength vs. Velocity (surface data) ................. 26
9. Addendum (1976) .......... * .. . ............ ....... .. 29
10. Comparison of Surface and Bottom Measurements ......... 3711. Summary of Data.... ..................... ......
II DISCUSSION OF THEORY
1. Historical Introo...... ......................... 48
2. General Considerations ................................ 49
3. Cauchy, Poisson, and the Explosion Problem ............. 51
4. Penney's Crater Assumption .............. ........ 56I,A
pH
-o5. Kirkwood's Basic Theory ................................
6. Influence of Bubble Period .............................
7. Arrival Times ...........................................
8. Comparison of Theory with Experiment ................... 67
9. Remarks on Scaling and the Influence of the Bottom ..... 7
III A2ALYSIS OF SOLOMONS' DATA
1. Bottom Pressure (nonblowout case) ...................... .f
2. Spitzer's Formula For Moderate Charges .................
3. Bottom Pressure (blowout case); Other Estimates of
R7Volume.............................. ........
4. The Duration of the First Negative Phase ................ 91
5. Surface Amplitudes, Trough and Succeeding Crest
(blowout cases).........................................
IV THE BAKER SHOT AT BIKINI
1 Introduction .. ................... 102
2. Penney's Bore Theory ................................... 103
3. An Energy Argument .................... .. ....... 106
*4. Baker Data and High Explosive Scaling .................. 108
5. A Speculative Adjustment to Make Scaling Applicable .... .I.
6. Use of Kirkwood and Seeger's theory To Make
Adjustments ............................................ 116
7. The Cavity at Baker .................................... II
8. Other Baker Predictions ................................ _220
, ii
- V CONCLUSIONS
1. Data Summary ........................................... 121
2. Kirkwood and Seeger Summary ............................ 126
3. Scaling .............. 9 .............. ................... 128
SImpulsive ............................................ 129
...Boe. ............. ............. 130
Deep .................................................. 131
Blowout ................ 0 ............ 132
4. Energy Consideration for Deep or Shallow Scaling ....... 134
5. Prediction of Waves .............................. * .... * 135
6. Correction Factor...... . ........................................... 138
7. Estimate for the Critical Depth Case for a
Large Explosion ........ ... *.... . 0 .............................. 140
8. Ocean Inpact of an Asteroid ........................... 142
REFERENCES ..................................................... 145
DISTRIBUTION LIST ............................................... 160
APPENDIX A - Gravity Waves in Cylindrical Coordinates .......... 147
APPENDIX B - Energy in Waves .................................. 151
APPENDIX C - Dispersive Medium, Yes or No? ................... 156
APPENDIX D - Maximum and Minimum Values of G and Durations on
Sthe Bottom as a Function of T' .........
1 iii
ILLUSTRATIONS
Figure Title Page
1 Prints of Aerial Photos on Shot I ........................ 14
2 Time-Distance Plot for Troughs A, B, C of Shot 2 ......... 22
3 Print of Aerial Photo Shot 2, 34 Seconds after Explosion
with Reproduction of Hydrophone Record at Pole 12 ........ 24
4 Surface Amplitudes Compared with Bottom Pressures,
Shot 2 ......................................... e......... ...a... 27
5 Surface Waves: Wavelength vs. Period for Various
Depths ............ ................. 31
6 Prints of Aerial Photos On Shot 2 ........................ 33
7 Hydrophone Records at Solomons ............................ 40
8 Comparison of Surface and Bottom Waves, Shot 4 ........... 42
9 Reduction of Pressure Fluctuation with Depth ............. 44
10 Surface Wave G (10,l,t') vs. t'......................... 630
11 Reduced Time of Arrival of Crests and Trough ............. 66
12 Comparison of Theory with Charlesworth's Data ............ 70
13 Bottom Pressure vs. Distance (Solomons) .................. 82
14 Extremes of G at the Bottom ............................. 83
S15 Maximum Bubble Radius Equal to Depth ................... 92
16 Duration of First Suction vs. Distance ................... 94
17 Scaled Duration of First Negative Phase................. 95
S18 Surface Amplitude vs. Distance ........................... 98
19 Extremes of G at the Surface ............................. 99
iv

20 Surface Wave Data Summary Scaled to Baker................. 1*
21 Bubble Radius vs. Depth .................................. .. 137
22 Correction Factor vs.- .. 139
TABLES
Table Title Page
1 Charge Schedule and Details .............................. 11
2 Camera Dctails........................................... 19
3 Distances................ 0- ..... 0..*..... ... ... 20
4 Wavelengths and Velocities, Shot 2 ....................... 28
5 Surface and Bottom Amplitudes, Shot 2 ................... 39
6 Data Summary: Amplitudes and Periods .................... 46
7 Pressure on the Bottom, Hydrophone Data .................. 88
8 Surface Amplitudes from Pole Photography ................. 101
9 High Explosive Results Scaled to Baker................... 110
10 Wave Height x Distance, Solomons ........... 2............. 2
11 Data Summary: Wave Height x Distance, All Shots ......... 123
- 4
I
!V
WAVE MAKING BY AN UNDERWATER EXPLOSION
Foreword
Chapter I of this report was written in October 1944. The data
had been analyzed and the results had joined the list of possible
countermeasures for use against the newly deployed German pressure
mine. However, the experiments and their results were not
published, partly because they were not very useful for sweeping
pressure mines, and partly because of the constraints of security at
the time and the demands of other work. During a trip to England in
late August 1944 to discuss the results of the experiments with
Admiralty officials, J. G. Kirkwood, who was a member of the party,
put to paper his general theory of explosion wave making, and this
was first published in the British Undex series as No. 94 under the
title "Memorandum on the Generation of Surface Waves by an
Underwater Explosion." This theory was immediately used for the
analysis of the experimental results obtained in the Bureau of
Ordnance tests which had been conducted at Solomons, Maryland, in
early August, and in later tests conducted by the Underwater
Explosion Research Laboratory, at Woods Hole, Massachusetts. The
( theory, containing numerical evaluations of the necessary integrals
made by the Mathematics Tables Project under the Applied Mathematicsf
j
Panel of the NDRC, and certain suggestions made by R. J.
Finkelstein, J. von Neumann, and F. J. Weyl of the Bureau of
Ordnance Research Group on the theory of explosions, was submitted
to the Compendium of British and American Reports on Underwater
Explosion Research in 1947. The same article minus the tables was
published in the Journal of Applied Physics Vol. 19, 346-360, April
1948 under the title "Surface Waves from an Underwater Explosion" by
J. G. Kirkwood and R. J. Seeger.
The purpose of the present report is to describe the results
obtained in those early experiments which represented a considerable
effort and which would be difficult to repeat. It is also of
interest that questions concerning the size of waves made by large
explosions have arisen from time to tine, an early example being in
the Crossroads Baker shot at Bikini in August 1946. The results
herein reported were of use in the planning for Baker although the
data were not originally obtained for that purpose. The production
of waves by explosions and their effects in harbours or ports will
doubtless continue to be a matter of tactical or strategic interest.
The British researches reported in the LTER Compendium Volume II,
dated early in 1945, were designed in part to calculate or predict
the wave effects following the explosion of a ship-load of
munitions.
In this report I have used the draft essentially as originally
written for the description of the Solomons' experiments and results
2

(i.e., Chapter I). The discussions of other early experimental
data, and of the various early theories and scaling laws have been
added. I have only recently seen some of the work done by Tetra
Tech, Incorporated and by Scripps Institution of Oceanography
described in the "Handbook of Explosion-Generated Waves" TC-130, Oct
1968. I believe that the data given in the Present report may be
useful though belated addition to their worn in the shallow water
regime.
In those urgent days of World War II it goes without saying
that the Bureau of Ordnance had the advice and counsel of many
distinguished men. A meeting was called on 14 August 1944 to
discuss the results of the wave making work done up to that time for
possible use in mine sweeping. I have a draft memo of that date
entitled "Tentative Conclusions" which notes that the optimum charge
weight would be such that the depth of water is approximately ten
times the radius of the charge, this being roughly the equilibrium
bubble radius; that larger charges than that are wastefulr that
experiments on large charges indicate that distance has more effect
on period than does weight; that the effect of weight if any is
mask& by errors; that the effect of depth is uncertain. Appended
to the memo in longhand is the notation; Present: Brunauer
(Commander S.), E. B. Wilson, J. von Neumann, J. G. Kirkwood,
J. Keithly, J. Bardine, P. M. Fye, and G. K. Hartmann.
3

There were many others who participated in this effort: from
NOL (hydrophones and photography); from DTMB (photography); from the
Applied Explosives Group, Buord; from NfWTS Soloinons, and other
segments of the Navy; and from UERL Woods Hole. Their
contributions, although perhaps forgotten by thaom, may, we hope, be
recalled by this belated account and this belated expression of
appreciation.
With regard to this current report- I would like to express
appreciation and thanks to several at the Naval Surface Weapons
Center for their help: to Dr. W. C. Wineland for agreeing to
publish the report, to Drs. George Hudson, Joel Rogers and
George Young for corrections and helpful suggestions, and to Grace
Couldren for administrative assistance, and to the Center generally
for placing its splendid resources in illustrations and typing at
the disposal of this work.
The urgency of these experiments made it impossible to plan
them in such a manner that subsequent tests could profit from
information learned in earlier tests. It is only in the light of
-Ilater insights (and in this case much later) that a reasonably
unified view o these complex phenomena has been achieved. We must
also remember that in this practical world urgency is frequently the
spur to get something done. If a problem is not born in a crisis it
* frequently cannot command the priority to obtain the necessary
resources. But in a crisis there is frequently no time to pursue
4
all .questions :o a solution. There are therefore some questions
which remain open. The role of the bottom and its characteristics
has not been theoretically dealt with when the charge is on the
bottom or when the depth is shallow. The phenomena shaping the
water cavity for shallow explosions in either deep or shallow water
have been treated only in gross approximations. The problem of
making reliable predicticns of wave phenomena caused by large
explosions or of scaling from one experiment to another may still be
a subject of disagreement or at best of uncertainty. The making of
unambiguous predictions should be a part of the repertoire of any
explosion phenomena expert. Perhaps in these less urgent days it
will be possible to complete the missing information and put this
subject to the continued rest that is undoubtedly deserves.
- p
5
J . .... , , ,

ehzronorlhgy-
BuOrd Experiments at Solomons 22 Jul - 4 Aug 1944
Conference on Conclusions 14 Au% 1944
Trip to England Aug - Sep 1944
Kirkwood's memo on "Generation of Surface Waves by an Underwater
Explosion" written on this trip and published as Undex-94 by the
British.
Shot #6 at Solomons in 100 ft water 6 Sep 1944
Writing on Experimental Results (GKH) 8 - 24 Oct 1944 (Interrupted)
Writing on Theory - Kirkwood & Seeger
drafted between Oct 1944 and Feb 1945
Production of Surface Waves by UERL draft by
Underwater Explosion R. W. Spitzer 29 Nov 1944
(Distributed and Lumped Charges)
"Gtavity Waves Produced by Surface W. G. Penney
Sand Underwater Explosions" Imperial College of
Science & Technology,
London Mar 1945
6
"Waves in Baker" W. G. Penney 24 Jul 1946
(Joint Task Force)
Baker Event Bikini Atoll 25 Jul 1946
"Surface Waves from an Underwater submitted to Underwater
Explosion" J. G. Kirkwood Explosion Research
and R. J. Seeger. British-American
Compendium.
27 May 1947
Identical article minus tables appeared in Journal of Applied
Physics Vol. 19, pp 346-360 Apr 1948.
Writing on Experimental Results and Analysis (G. K. H.) resumed and
completed Jan - Feb 1976.
i
I7

I. TESTS AT SOLOMIONS, (1944)
1. Introduction
In the summer of 1944 tests were planned and conducted to
produce gravity waves in water by explosions, and to determine their
suitability for sweeping pressure mines. Although it is well known
from casual observations of underwater explosions that the
detonation of convention.l charges, say depth charges, produces
practically no observable wave system, nevertheless it was felt
desirable to try larger charges and to make specific preparations to
observe whatever surface waves were formed.
2. Site
A site for this series of experiments was chosen in the
Patuxent River at the Naval Vine Warfare Test Station (NMWTS)
Solomons, Maryland. The depth of water at this spot off Sotterley's
Point was about 40 feet over an area at least 2,000 feet by 1,000
feet. The bottom was a soft mud into which for example a mine would
4 sink about three feet. This mud probably influenced the magnitude
of the waves, but the first requirement was to find a large uniform
area sufficiently remote to allow the experiments to be done.
• ' ' , , , , , I i i ] i... "S

3. Experimental Arrangement
Observations on the waves produced were made in three ways: by
aerial photography to determine wavelengths and velocities; by
surface photography to measure surface wave amplitudes and periods;
and by pressure recording systems placed on the bottom. The aerial
photography was accomplished from a blimp. In order to measure the
surface amplitudes a range of telephone poles was set up. Each pole
was 30 feet long and was submerged in the water by a 300 pound
anchor so that about 7 feet of the pole extended into the air. The
top portion of the pole was painted with alternate black and white
strips 6 inches wide. The range consisted of about a dozen poles in
a straight line about 140 feet apart.
The wave motion was found to have very little effect on the
poles, except at distances less than about 300 feet from the
explosion where the outward rush of water caused the poles to sway,
rotating more or less about their anchors and thereby submerging
themselves. The pressure recording systems consisted of units each
composed of a NOL Mk 1 hydrophone, a bridge network and an EstralineJi
Angus recorder. The hydrophone was protected from explosive shock
by a rigid brcnze cone which allowed slow seepage through a small
hole but which screened out very sharp changes in pressure. This
protective device was tried out in a preliminary series of shotsmade 22 July (reported by J. F. Moulton, BuOrd memorandum) in whichit was found that the pressure sensitive diaphragm would operate
9

successfully if the shock impulse from the explosion, making
C-liowance for surface reflection, was less than 0.25 lb sec/in
The main shots were carried out under Explosive Investigation
Memorandum No. 62 under BuOrd forwarding letter S68 005316 of 22
July 1944. The schedule of shots fired is shown in Table 1.
Note to Table 1.
The bombs LC, AN, M56 were initiated by filling the nose fuze
seat liner with Comp C-2 and detonating this statically by means of
an Army Engineer Special detonator. The Demolition charges used
were the 1U. 14 Mod 1 approximately 50 plus pounds Cast TNT no
booster, 13" x 13" x 6½" in cardboard box. Mk 9 approximately 115
pounds cast TNT with 63 grams auxiliary booster Mk 4 (1.6" diameter,
3" length granular TNT) 13" x 13" x 13" in steel container. For
shot 4, the charges were crated in cubical boxes approximately 5
feet on a side. In each crate a Mrk 9 charge was set in the middle
and an electric detonator was used to initiate it. Each crate
contained 180 Mk 14 Mod 1 demolition charges and one Ilk 9, making
about 9,200 pounds of charge in each box.
4. Shot 1
The size of charge for the first shot was chosen by considering
V •that the bubble radius of the expanded gases should be at least
is
t ... • ••... ••"• • Z7
I i i w'- -

' 4-3
4--) 4J 4- 4J) 4-) 4-4
IV 4.) '-4 444444
4J 4- 4j -)40u z o T$ r0 0 0 0 0
0 0 41 4-) 0Lfl U) Ln
Q) (DC
1 >44 -)
CI 4
E) U4E )U
-- 4 U) W () 0 0 0
0 0 >> >4 >4 >4 >
U 0
0
r4 EI) M 0,- Q) ( 1) 0 0 0
>4->i z.C ul
to 0ý4 ý4 U
"4.)) P-
4-4 U) Q
0 0-1 -4H
ko H C)C
HN -T Cl C
v Hn
N U)
z 0)
(Nr k.0(

equal to the depth of the water. Por convenience the charges were
placed oh the bottom although it was realized that this might not be
the most efficient use of the explosive. Since the wave making
process is so inefficient from the standpoint of energy, the
question as to the best possible position for the charge does not
seem to be of prime importance. The maximum bubble radius for an
underwater explosior of TNT at depth D is given in the absence of
free or rigid surfaces by
r 13.5 W1/3 feet(33 + D)1/3
where W is the weight of charge in pounds. This assumes that 45% of
the total explosive energy is retained in the bubble. Putting rmax
= 40 feet gives W = 1,900 pounds. The unit chosen for the first
shot was a 4,000-pound bomb containing 3,362 pounds of TNT. This
choice yielded a charge which was presumably large enough and at the
same time easy to handle.
For Shot No. 1 the range of poles was photographed by means of
especially mounted aircraft cameras having a field of view of 400,
and capable of taking a picture every 2/5 second. In order to save
film an estimate of the time of arrival of the waves at the various
12
IOR
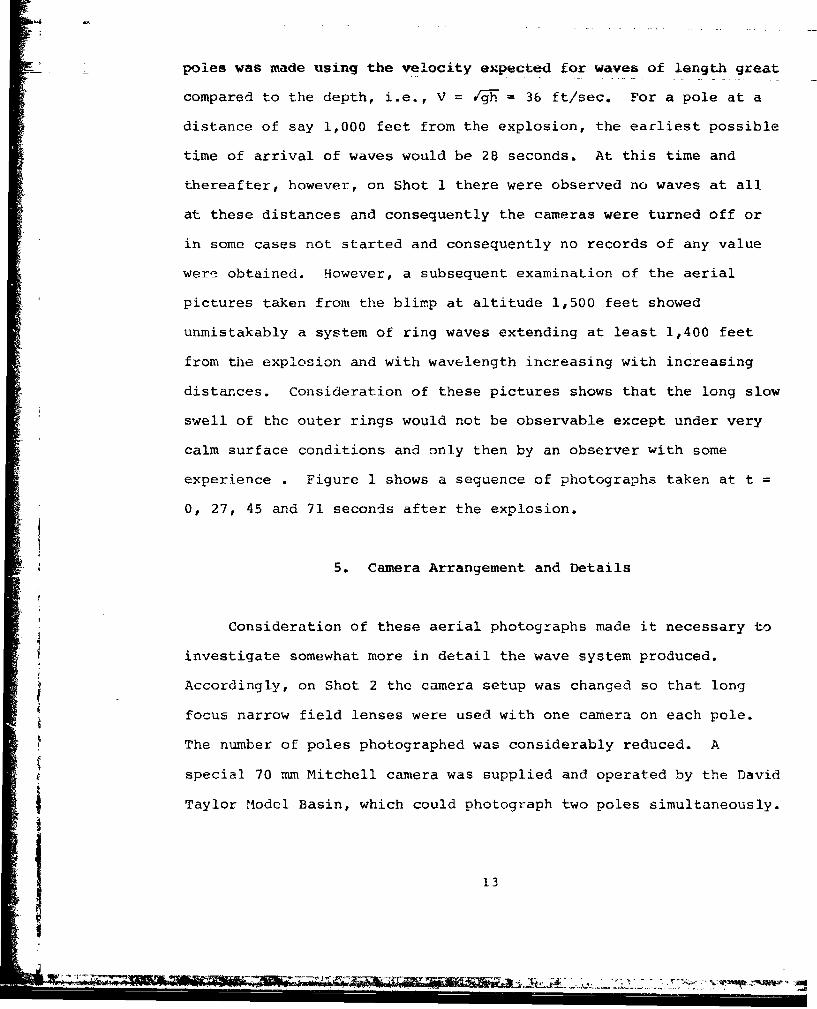
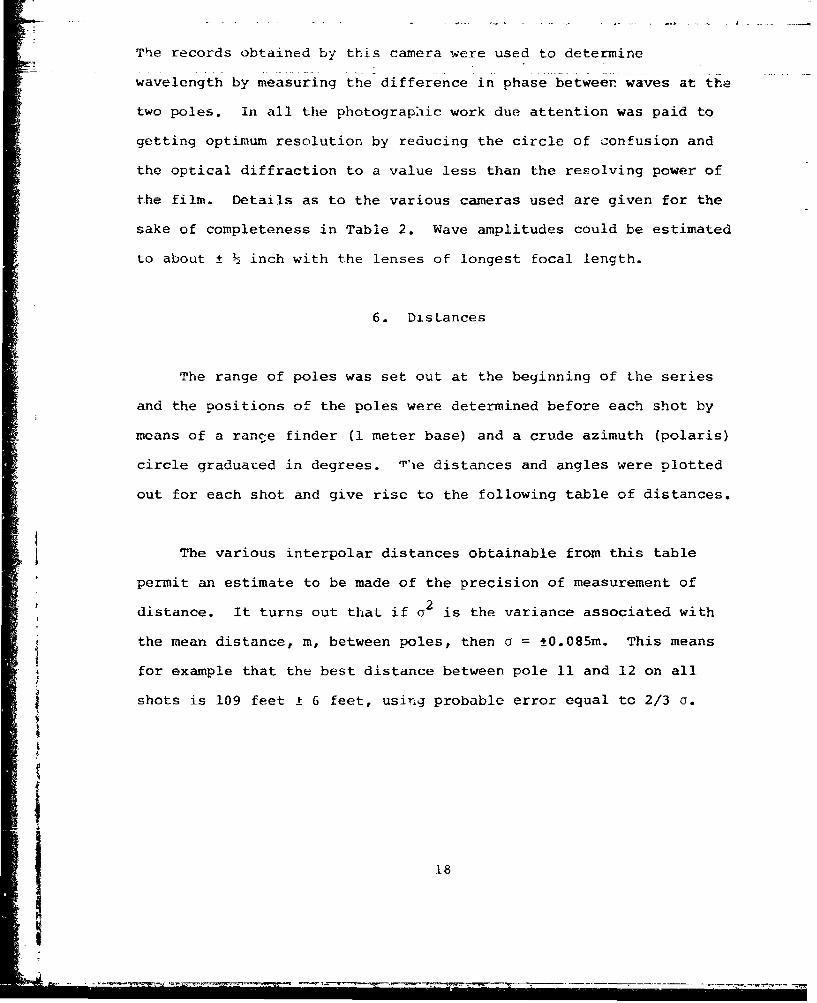
poles was made using the velocity expected for waves of length great
"compared to the depth, i.e., V = 36 ft/sec. For a pole at a
distance of say 1,000 feet from the explosion, the earliest possible
time of arrival of waves would be 28 seconds. At this time and
thereafter, however, on Shot 1 there were observed no waves at all
at these distances and consequently the cameras were turned off or
in some cases not started and consequently no records of any value
were obtained. However, a subsequent examination of the aerial
pictures taken from the blimp at altitude 1,500 feet showed
unmistakably a system of ring waves extending at least 1,400 feet
from the explosion and with wavelength increasing with increasing
distances. Consideration of these pictures shows that the long slow
swell of the outer rings would not be observable except under very
calm surface conditions and only then by an observer with some
experience . Figure 1 shows a sequence of photographs taken at t =
0, 27, 45 and 71 seconds after the explosion.
5. Camera Arrangement and Details
Consideration of these aerial photographs made it necessary to
investigate somewhat more in detail the wave system produced.
Accordingly, on Shot 2 the camera setup was changed so that long
focus narrow field lenses were used with one camera on each pole.
The number of poles photographed was considerably reduced. A
special 70 mm Mitchell camera was supplied and operated by the David
Taylor Model Basin, which could photograph two poles simultaneously.
13
I0

NSWC/WOL/MP 76-15
MIN SEC '
7
7f. -J
... .+ .-. .. ..
1 14 Ft.7.97 F .•-
Figure.....l"Shot Numbe.r 1 . 3362.L.s. ....o Botm- Water.. Det : 0Ft
14,....:TV, .4.M, -:.- .-
I WI- .. +;-- ;,, g' , ... ..- + - •. • .::-•
i •Approximate Pole Distances with Explosion at 0
SPole Number Distance Pole Number DistanceS• •1 142 Ft. 7 976 Ft.
L} 2 284 8 1096S3 3139 9 1264
S4 546 10 1425S •5 714 11 1575
S • Figure Il(a) Shot Number 1 -3362 Lbs. TNT on Bottom - Water Depth*,-40 Ft.i14
•• °•-:•"•+,mmll•+,•.r•+•l•'+,•.=•~ ~ ~ .. . . .. .. .. ... .'• .... ." • . ... . .. - k . .- "< :•I,.

NSWC/WOL/MP 76-15
3 919:917
- to + 27 SEC
51
I4I3
2 ,
"Apoxmt PoeDsacswthEpoinaPol Nubr Dsac ol ubr Dsac
1 14-t.797 t
Figproiuae Iol (bDit ubr1 32 stace wTNT Exon Bto -Wate Det04 t
SPal Numer istace Ple umbe Disanc
S1 1................

?NSWC/WOL/MP 76-15
" 10 " t0 + 45 SEC
-I"
-9
-7
-4
-3
j' : .
Approximate Pole Distances with Explosion at 0
Pole Number Distance Pole Number Distance1 142 Ft. 7 976 Ft.2 284 8 10963 389 9 12644 546 10 14255 714 11 15756 849 12 1669
Figure 1(c) Shot Number 1 - 3362 Lbs. TNT on Bottom - Water Depth'-40 Ft.
I 16

NSWC/WVOL/MP 76-15
20:01
0 i to 71 SEC
$U
1 12,..7 76F.
R--• .
,- .1 ,.
i l Approximate Pole Distances with E'xplosion at 6
SPole Number Distance Pole Number Distance
S1 142 Ft. 7 976 Ft,
2 284 8 10963 389 9 12644 546 10 14255 714 11 15756 849 12 1669
Figure 1 (d) Shot Numbef 1 3362 Lbs. TNT on Bottom - Water Depth -40 Ft.
¶ 17
A
The records obtained by this camera were used to determine
wavelength by measuring the difference in phase between waves at the
two poles. In all the photograpiic work due attention was paid to
getting optimum resolution by reducing the circle of confusion and
the optical diffraction to a value less than the resolving power of
the film. Details as to the various cameras used are given for the
sake of completeness in Table 2. Wave amplitudes could be estimated
to about ± ½ inch with the lenses of longest focal length.
6. Distances
The range of poles was set out at the beginning of the series
and the positions of the poles were determined before each shot by
means of a range finder (1 meter base) and a crude azimuth (polaris)
circle graduated in degrees. Vie distances and angles were plotted
out for each shot and give rise to the following table of distances.
The various interpolar distances obtainable from this table
permit an estimate to be made of the precision of measurement of
distance. It turns out that if u2 is the variance associated with
the mean distance, m, between poles, then a = ±0.085m. This means
for example that the best distance between pole 11 and 12 on all
shots is 109 feet ± 6 feet, using probable error equal to 2/3 a.
18

Table 2 Details as to Cameras
6" at thisField distance
Focal Stop of appears onCamera lenath Speed =n p, View flLstance film as
F54in blimp ltvery7" film 10" 2 sec .. .. 40 2000' .0021"
2½ .0095"-K25 6 3/8" frames/sec 16 335' 400 380'-680' .0049"
35 mm 24Mitchell 17" frames/sec 16 2390' 3.5° 430' .020"
70 itn 10Mitchell 6" frames/sec 16 298' 19° 360' .0069"
Where n = f/d
Resolving power of the film 50 lines/mm = .0008"
Resolving power of lens =f = 1.22 Xn = .0004" if n 16 for alllenses.
C = Diameter of circle of confusion < .00063"
Corresponding hyperfocal distance P p 2 /cn,.
1
4
19
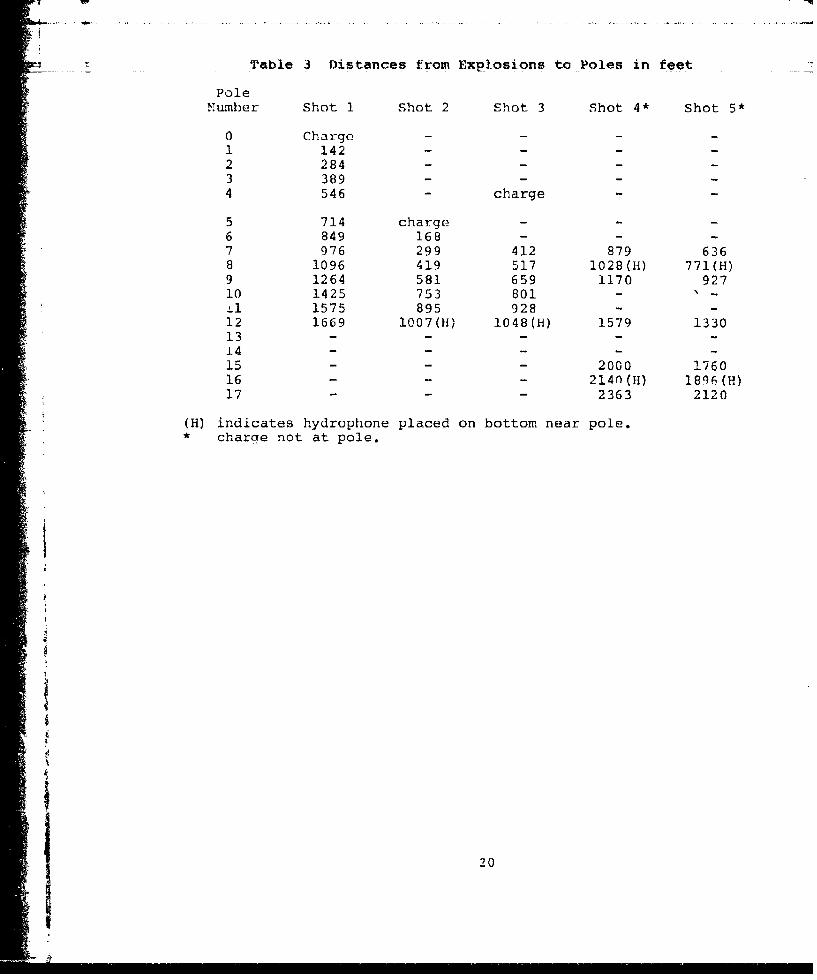
Table 3 Distances from Explosions to Poles in feet
PoleNumber Shot 1 Shot 2 Shot 3 Shot 4* Shot 5*
0 Charge ....1 142 -...
2 284 -...
3 389 -...
4 546 - charge -
5 714 charge - -
6 849 168 - - ~7 976 299 412 879 6368 1096 419 517 1028(11) 771(H)9 1264 581 659 1170 92710 1425 753 801 - -
S1575 895 928 - -12 1669 1007(1f) 1048(H) 1579 133013 - - -.14 . ...15 - - - 2000 176016 - - - 214n(H) 1896(H)17 - - - 2363 2120
(H) indicates hydrophone placed on bottom near pole.*• charge not at pole.
20
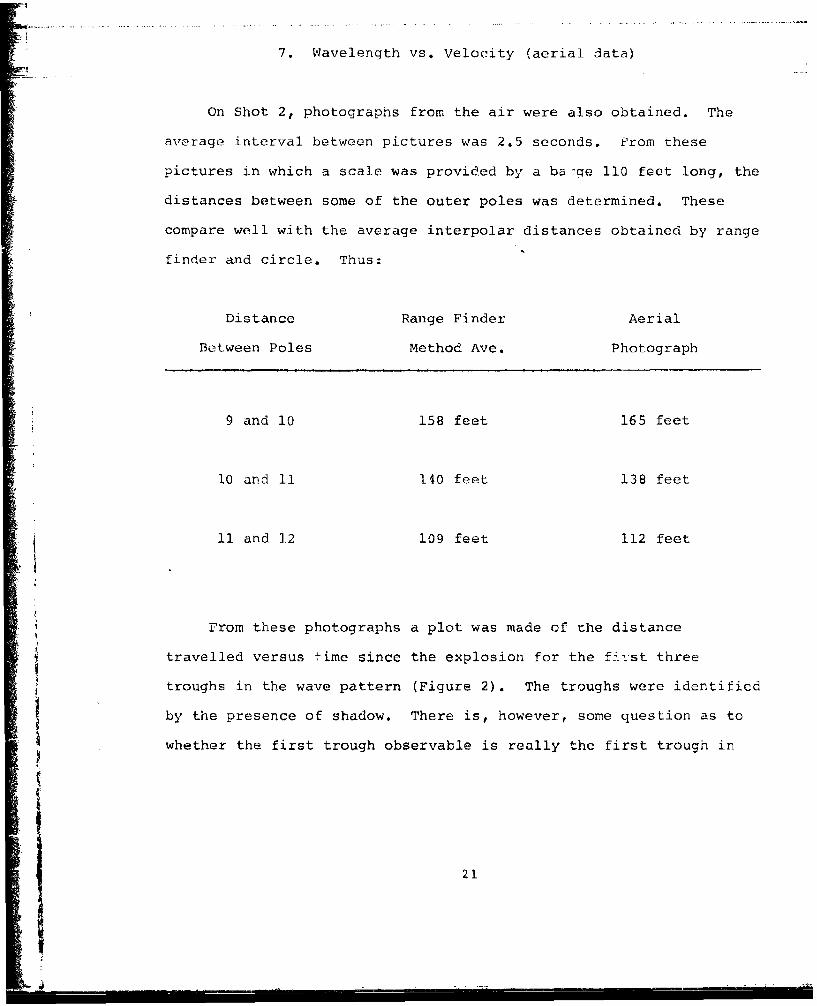
7. Wavelength vs. Velocity (aerial data)
On Shot 2, photographs from the air were also obtained. The
average interval between pictures was 2.5 seconds. From these
pictures in which a scale was provided by a ba -ge 110 feet long, the
distances between some of the outer poles was determined. These
compare well with the average interpolar distances obtained by range
finder and circle. Thus:
Distance Range Finder Aerial
Between Poles Method Ave. Photograph
9 and 10 158 feet 165 feet
10 and 11 140 feet 138 feet
11 and 12 109 feet 112 feet
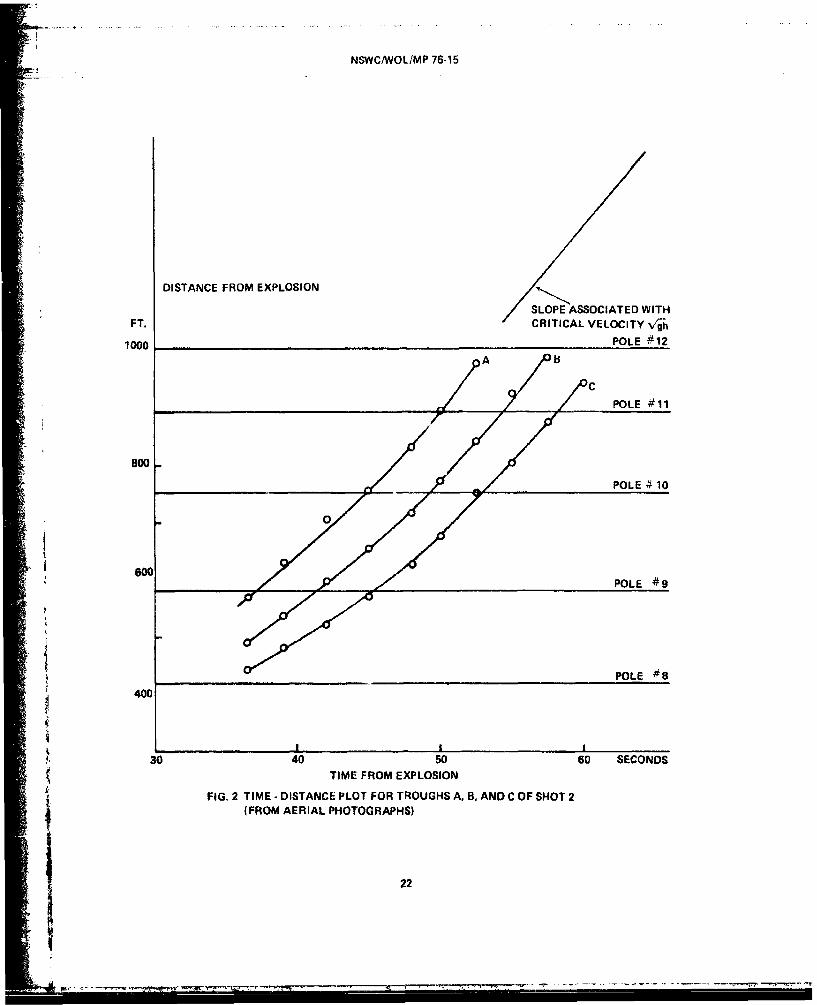
From these photographs a plot was made of the distance
Stravelled versus time since the explosion for the flist three
troughs in the wave pattern (Figure 2). The troughs were identified
i by the presence of shadow. There is, however, some question as to
whether the first trough observable is really the first trough in
i
21
NSWC/WOL/MP 76-15
DISTANCE FROM EXPLOSION
SLOPE ASSOCIATED WITH
FT. CRITICAL VELOCITY v-gh
1000 POLE #12
/ Aoo
/ / POLE #11
Bo POLE # 10
""X POLE #9
0 POLE #8
40
30 40 50 60 SECONDS
TIME FROM EXPLOSION
FIG. 2 TIME - DISTANCE PLOT FOR TROUGHS A, B, AND C OF SHOT 2(FROM AERIAL PHOTOGRAPHS)
22

the series since the glare from the sun makes that part of the water
surface uniformly light in the region into which any rapidly
travelling leading wave would advance. This is illustrated in the
photograph, Figure 3. This is mentioned as a caution in the
application of the aerial technique for measuring wavelength.
Indeed the hydrophone record appended to Figure 3 shows that the
first section has already arrived at pole 12 before a wave
disturbance shows itself from the air.
Various wavelengths in the pattern resulting from Shot 2
reveals that the first one has been missed. The first visible
trough is called A, the second B and the third C.
In Figure 2 it is seen that the slopes of the ttree curves
increase with distance and that the velocity /7 = 35 ft/sec, is
approached. It is also apparent that the separation between
successive troughs increases with distance, which is to say that the
wavelength is increasing with distance. Thus the separation between
A and B varies as follows with distance:
-.I
23
iX•I"U IIxMI• I I I I •

NSVUC(WVOL /MP 76 15,
Fgr3 Shot Nu mber 2 At th,, trýr the hvd raphrun-o rcord at Pole. 1? showerd thE
firsl ti- SICII IhCIi..,uI Thp f,r,t withi. torqlr jir~tw.'rmi Kdels 10 and 11)ipp het to ivPe 5econrd -weCiwi (14beled Al
42
MENO
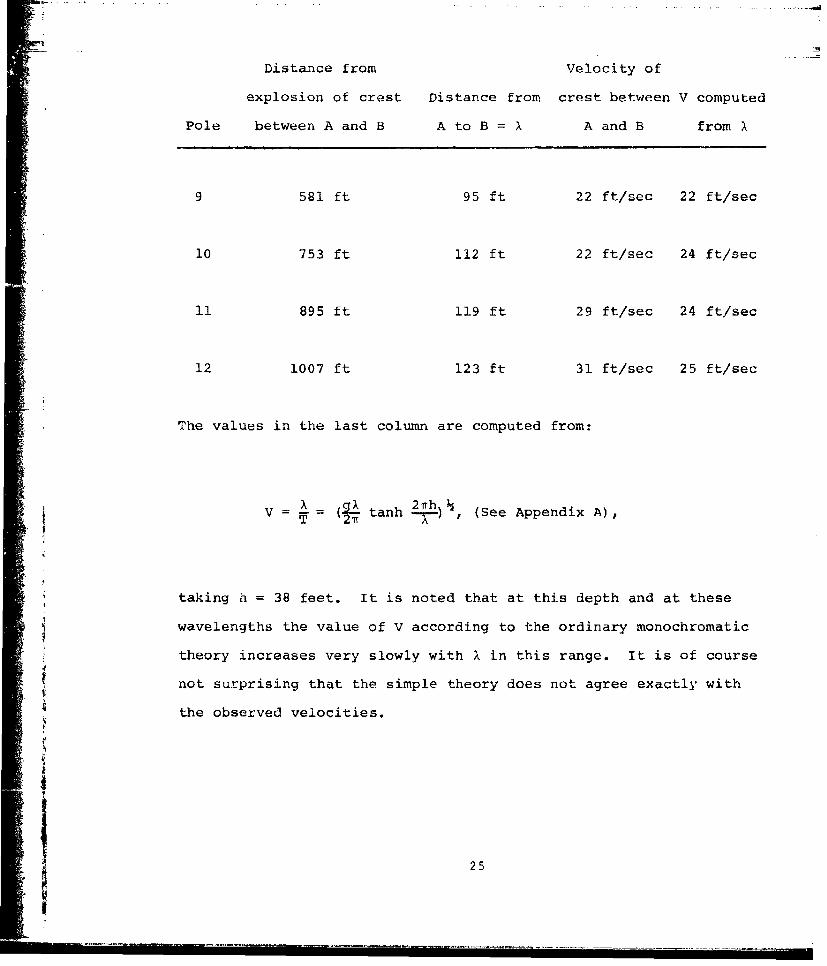
Distance from Velocity of
explosion of crest Distance from crest between V computed
Pole between A and B A to B =X A and B from X
9 581 ft 95 ft 22 ft/sec 22 ft/sec
10 753 ft 112 ft 22 ft/sec 24 ft/sec
11 895 ft 119 ft 29 ft/sec 24 ft/sec
12 1007 ft 123 ft 31 ft/sec 25 ft/sec
The values in the last column are computed from:
V I = (9X tanh m), (See Appendix A),
taking h = 38 feet. It is noted that at this depth and at these
wavelengths the value of V according to the ordinary monochromatic
theory increases very slowly with X in this range. It is of course
not surprising that the simple theory does not agree exactly with
* the observed velocities.
25
8. Wavelength vs. Velocity (surface data)
On Shot 2 the 70 mm Mitchell camera was trained on poles 11 and
12. The distance between these poles is taken as 109 feet. The
surface records obtained are reproduced in Figure 4. The pressure
record obtained near pole 12 is also shown. The correspondence
between the surface amplitude measurements and the bottom pressure
measurements is very good. It is possible to number the positive
pressure peaks after the first suction, and the surface crests after
the first trough and to put these into one to one correspondence.
The camera was set to run at 8 frames/second, but comparison of the
times of arrival of corresponding peaks at the bottom and at the
surface, assuming that the Esterline-Angus timescale was correct,
reveals that the camera was running a little fast. To correct
intervals the following factor must be used
Atrue= .87 (t 7 0 mm camera)
Even this does not provide a perfect correction because of local
variations of speed in the camera.
The wavelengths were measured from the film record as follows:
Let At70 = time of arrival at pole 12 -- time of arrival at pole 11.
The resulting velocities, periods and wavelengths are listed in
Table 4.
26
UJ oz
w.-o wI-
-u 0-0uj1
D 0 CL
- C w
CD-
- ~CA0~0
to0 00
0to Z Lo
w c
wU W CC
Uto
w U0
CY InN
I~wzz N 0 C- 4 t N ( *N
j 27
*1 Ln
CIA m
H N 4('71
(N C
0N 0 N*
c4 C4 co
04 C
N co (N 00
4.)0)
4 co Lf LA
4-) '.0 ((N- C14 Nm0
co *NIDr
.4.J 0. C.)4
0'00)C1 0 CDL
4-) C11 (N H'U
>i 4
¶n 0 14 a)
4-) 0. wOL
IRV (N UlA u)
I- C')
(D V 0 4-) r- 441 :d to 0) 44 4 -
mIC) 04 0J H) >
0. -14 04J 4 go > -
w 1 r- 0
0. II co H
28

NSWC/WOLIMP 76-15
These wavelengths are not comparable with those measured from
aerial photographs, since those were measured from trough to trough,
whereas these are measured from crest to crest. Further, as has
"been mentioned, it is uncertain whether the first trough was visible
at all from the air.
Schematically the situation is thus:
"4----214-1 -o 16
• A
S~This might suggest that perhaps A is really the third trough. This
•" possibility is not ruled out by the comparison of the velocities.
It is certainly truc that difficulties of observation make the
S~measurements from aerial photographs much less reliable than direct
• . measurements on the surface. In subsequent shots the aerial
j1 photography was dispensed with.
1 9. Addendum (1976)
63a4
The consistency of these measurements may be checked as
follows: If At = time taken for a given crest to travel from pole
11 to pole 12, i.e., 110 feet then,
29

velocity = 1-- -
T = period from one crest to the next at pole 12. Hence, X
velocity x T. Having found the value for X we ask what velocity
does this require, from
V2 tanh -- -- (2)
(See Figure 5)
214 ft 162 116 108 97 92 94 88 87 88 95
average
vel from (1) 36 ft/sec 31.5 29.5 27.5 26 26.5 26.5 26 25 26 26
velocity
from (2) 30 27 24 23.4 22 21 21 21 21 21 21
The discrepancy in velocity can be largely eliminated by eliminating
the correction made for the speed of the camera. If in fact the
camera was accurate and the recorder was inaccurate, (and there is
no way to be sure now) then the systematic bias can be relieved.
This means that the values for the periods and durations as
30

b o
qr L
0
0
0
CL
3-
LU L-
LLU
UL
ir -m
0 I0
LA-
a A~
N.N'I -
-LII-31

determined by the hydrophone at least on this shot should be
increased by about 15%. Rather than indulge in such a correction
program I will leave the numbers as originally noted with a caution
as to the general accuracy of all the measurements. Figure 6 shows
the surviving aerial photographs from Shot 2, taken at 11, 27, 46
and 57 seconds after the explosion. In the two earlier pictures the
waves had not appeared whereas in the last picture the earliest
swells have gone beyond the range of poles. The picture taken at 46
seconds, however, lets one with a little imagination list the
distances from the outermost dark ring (beyond pole 12) to the next
* one inside and so on. These distances are wavelengths and are
approximately 178, 113, 97, 86, and 59 feet which brings us just
inside pole 9. This is an instantaneous view of the wave pattern.
The longer waves travel faster than the shorter ones and
consequently the pattern spreads out creating longer waves which
then travel faster. The whole pattern will spread out until all the
waves are long enough to travel at the same maximum speed. By that
time however the waves will have vanished. Even in this photograph
at 46 seconds, the "first" wave has a wavelength which is somewhat
shorter than the wavelength of the first wave obtained from pole
,photography. It is therefore concluded that the waves of very long
length (and hence very slight slopes) cannot be reliably detected by
aerial photography.
I
I32
.c •' - - - -r - -'.- .-- - . -., --

NSWCtWOLiMP 76-15
S10 c+ 11 SEC
=.A.
V- a
Approxim-ate Pole Distances with Explosion at 0
Pole Number Distance Pole Number Distance6168 Ft. 10 753 Ft.
299 11 895
8 419 12 10079 581
Explosion Occurred at to 16:37:09
Figure 6(a) Shot Number 2 -6724 Lbs. TNT on Bottom - W4ater Depth -. 40 Ft.
¶ 33
•,.
i j
NSWCIWOL/MP 76-15
6 168I I Ft 075 t
•g27
9 581
ApoiaePlDitnewihExplosion Ocre at to 1:70
Pole SotNumber 2ist6724Lb. NTmbe r Diept..4
9 54
t, :
Fiur .ib ShtNm e 62 b.T Ton_.on-W tmDph 4 t
I34
w -

NMICAVOLIM11 7C IS~
~4
Appt oximate Pole D istan1ces with Expilosion at 0
Pole~ Ntirnh Distance Pole. Numheq Distance6 168 Ft. 10 753 Ft.7 29i9 11 89r,8 419 12 1007
9 581
E xplosion Occurred mato t 16:37:09
Fuqur, 6(c) 'Ilat Numlher 2 1524 lh.b. TNT Oi Uon B antm 'Lditi; Dcptt; - 40 Ft.
I3

NSWVCWQL/IMP 76. 1 G
___ ___ ___ ___ ___ ___ ___ ___ ___~ VV~7 t0 + 57 SEC
•~~: ;7 Lx!. . ... . . . . . .. .. . . . .... • . .
Approximatet Pole Distainces with Ex plosicm dt 0
Pole Numbe~r Distatictp Pote Numbur Distanc~e6 155 Ft. 10 753 Ft.7 299 11 8958 419 12 1007
9 58 1
Fx(plosulu Ocimiud at to16:37:09
F uit! 6(rl Shot Nutiihpr 2 -6724 Lbs. TNT on Bottoni WAater Depth -40 Ft.
36
10
I,•." :"•" ': ' .. ' % , .• •Y
S•V':. . :: r•'"2 • -•••,. / : '" .• . . . ."
,,, - '. . - .-

-14 -. Comparison of Surface and Bottom Measurements
The pressure record obtained in the vicinity of pole 12 is also
shown in Figure 4. A comparison between the surface and bottom
amplitudes can be made by use of the simple monochromatic theory.
It has already been seen that the surface and bottom amplitudes keep
in phase very well. This is to be expected from the simple theory.
It can be shown (Appendix A) that if n is the surface amplitude
in inches, and Ap is the excess pressure in inches of water at a
height z above the bottom, then
Scosh khn =tsP cosh kz
where h = depth of the water and k = 2ir/X. This relation holds for
either plane waves or cylindrical waves. In the present case the
pressures were measured at a distance of 1.5 feet from the bottom.
The depth of the water on Shot 2 of the hydrophone was 37½ feet.
Hence z = 1.5 feet, h = 37½ feet.
SIn order to apply this relationship it is necessary to know or
estimate X.
1 37
I ..r .... .' ' .....-] .. .. ... .l .... -.. ... 7 ... ...

NEWT-
We associate with each peak and crest a wavelength which is the
average distance to the two neighboring peaks on either side. (See
Table 4). In Table 5 we compare the measured surface amplitudes
with those calculated from the bottom amplitudes. The agreement is
reasonable.
Figure 7 reproduces all the existing hydrophone records
obtained in the Solomons series.
Figure 8 displays the only other measurements of surface and
bottom amplitude over a series of many waves. (For Shot 4.)
Although there are no nearby measurements as in the case of Shot 2
from which the wavelenqth may be inferred, it is possible here to
measure the periods between successive peaks and determine
wavelength assuming that the wave train is at least locally
monochromatic. This assumption does not always apply. The period P
is given by
[2A = tanh 27h]P L27T
Furthermore, at the bottom the pressure change, Ap, in linear
units is related to the surface amplitude n by
___________8
___ __ __

4.4
LA. 0
H .D.~ ý4 U) 4.)
* N ~0 .9: C)~ 41 41 a)o )- M '44
Ln O LA r- 0 9 4
0N1 0 a) 0)0)~ > .4
.Z i 4.)
9 M] 14 1.4 1-4
co LA) w- 0 0) 0.1-4 4- 41 tyl
C1 C)U)E) 0 0o
4-) 4-'Q . 1-i C
4 4J .- : 0* N 0 '4-4
U] N - H 0~0 -1 44
m C14 a) M
4.) 0 0) .- 1 04-J ( ) M] u
.H * -ILn4.
0r 0 n
0 mA a ) 4.i 4.)
1 0H in CHH 04
'V C14 N co)0
0 H* 4 0 44~rd) 0 .-4
00 0 4.W sa) L$ 0r 0) 41i 4.) t
u00 C .4. 4 Q) 0 0co- (n)4) E,4
4-4 (L) 0~
r -~4 -4 04 4
LAW 4J0L 0 4 0 r.C')~ H M .) C
P 0 ** * .) 0 4 .
0) 4J) U] 0
0
Q) 0 4.) 0 0 $
Ul .11 04 e -40
0d d 0) Hd 0s to H) + 4 1.4
4J fo 0) 0 -)
a) 14 ý40 -
fell- E-4 4J 0L
39

NSWC/WOLYMP 76-15
g --
z Cz aE.
C-
EE
00
(40
N'.

NSWC/WOL/MP 76-15
Shot No. 4
I'hine 40'Pl No. 8
Distan D a'c1008' ,
-46,000 , 71,1.
*36 InchesOWIe ~p-,
i_�� �MWi• W
Phoner36' Pole No. 16SWater3 .7'0 Distance 2150'
t52 Inch es Cfharge 46,000 Lbs. TNTZ= of Water .4-
-77'
EUWater 42'SoN.5Dlist ance 765' Shot No. 8 5e
93 Chups~ 2034 Lbs, TNT 4
3 .6 Inci m
Pole No. 16 we~ e36 8Wate38
MO MIRM U-MM Charge 2034 Lbs TNT
Figure 1(b) Hydirophorle Recordsat diSow uj 41

NSWC/WOLIMP 76-15
(0
0L6
LL
0a -
(0 U
1%. .
0) 0
(00
wL 0- Iu
w
0j
(0CL0
'La U..
44
S~2h ~~~N ... .. p cosh -it-
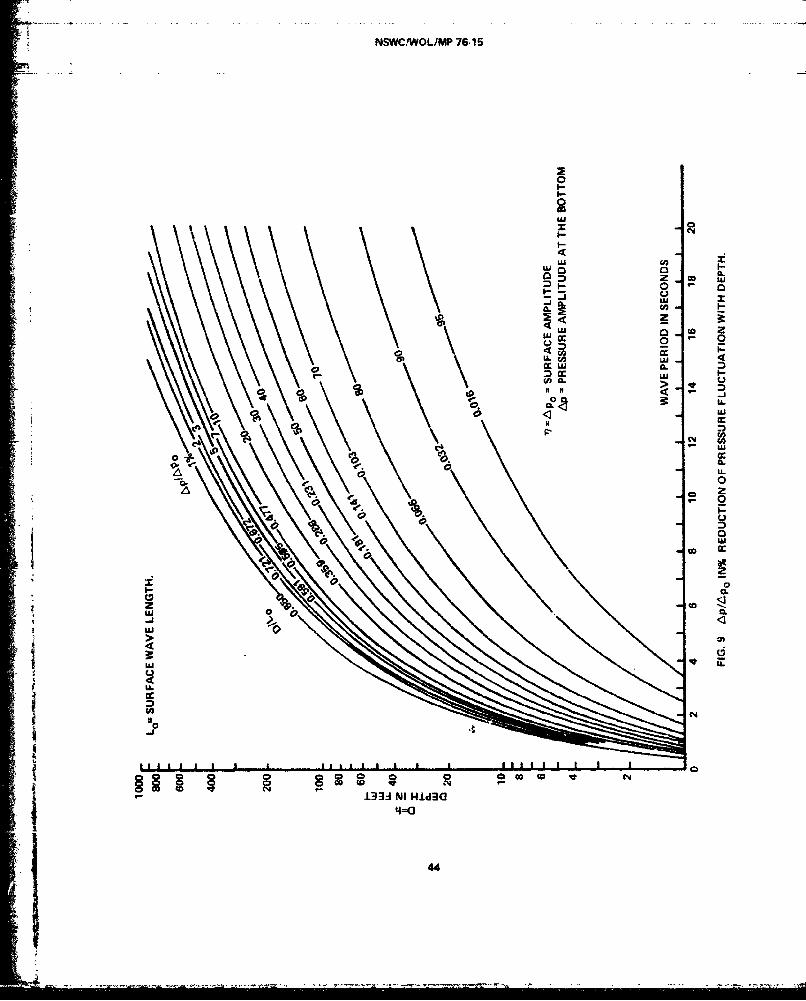
using these relations it is possible to construct the curves of
Figure 9.
Referring to Figure 8, the times between successive wave
crests, P, are:
Wave Number 1 2 3 4 5 6 7 8
Period (sec) 12 8 8 7 6.7 6.0 6.0 5.7
From Figure 9:
Ap/n at 40 ft .83 .65 .65 .55 .50 .41 .41 .37
n ½ (crest + trough) 3.3" 2 5.5 5.5 5.5 5.5 5.5 3.5
Calculated Ap 2.7" 1.3 3.6 3.0 2.7 2.2 2.2 1.3
Measured Ap 2.8" 1.1 2.6 2.6 2.2 1.8 1.6 0.6
The agreement is reasonable.
The other cases where comparison is possible between bottom and
surface measurements give similar results, namely for Shot 3 at 1048
43
NSWC/WOL/MP 76-15
0
I-
LU
z c9-• 0 -
Lu '0
C C (0•
N t
qj c
L >0 ° L
44
feet and for Shot 4 at 1028 feet. As already indicated, if the
slight elevation of the hydrophones above the bottom is neglected,
then under the assumption that the wave motion is monochromatic,
i.e., consists of a set of waves all having the same wavelength
(which is not the case) then n = Ap cosh 2-th/X. If h is taken to be
40 feet, the factor to be applied to Ap in order to calculate n
depends on wavelength A in the following manner:
A feet 400 300 200 150 100 80
n/Ap 1.21 1.37 1.89 2.78 6.19 11.7
If A is small, a small error in X will produce a larger change in
the factor. For this reason and others, one would not expect very
close agreement between measured n and n estimated from bottom
pressure measurements, at short wavelengths.
11. Summary of Data
The original data on the Solomons tests consisted of hydrophone
- irecords and films. The originals and the films have long since
disappeared, but measurements were made from the films at the time.
These results, wave heights, periods, pressures and distances are
Sall summarized in Table 6, which pertains to the 40-foot sites. 2
45

Table 6 Data SummarySuction Phase First Positive Fhasm
Die-srm 6wPee 4W- Sw S9u
from sure face face le64thsxplo- on Ampli- Aspli- Ties of Pree- in Wave
Shot pol. Records sin Duration bottom tude tude Arrival sure ft. Velocity
2 S 3SNO 419 3.2 sec -12' 7' 20.2 sec bFila ft. 80 C
9 35i 581 2.8 sec -3.6" 4.8" 21.3 sec b 95 d 22.1 d ft/sec
ri 135 C
10 3sm 753 112 d 22.0 d
Fils
11 895 6.0 sec -5.2' 4.8' 35.4 sec 119 d 29.0 d
185701:
PFil5.6* 177 30.6
12 1007 (Pressure -2.5* 4.0" 39.0 eec 172 d 30.7Record) to -3.81 .1.9 195 c
inchesFM for 5.0 sac b
Prasaure 4.0 sec -2.2 4.6" a 77.1 sec a 93.2 a 2f.9 ainches
Record (70m) 81 c
3 S 3I5m 659 4.9 sec -11' 15.5' 36.8 sec b 162 cFilA
10 801 6.4 sec -7' 12" 43.9 sec 160205 c
70m
132 25.411 921 4.0 eec -7" b 11.5- 49.4 sec 169
220 c
12 3Ism 5.0 sec -5.5' 13' 47.6 b 210 c
Film 1048 4.5" a 100.3 sec b 55 aec
MN Pres- 6.6 sac -5.064 48.2 " 160 c
sur* 101.2 b 3.2' 55 aC 9.1
4 7 879 4.5 sec -9' 12" 48.8 see 240 C 30.4 012.4 eec-
File6.8 sec -6.5' 13.5" 51.0 see 536 b 67.8
- 1028 13.9 sec- 240 c 3. 43.0'
PHt Pre*- 5.0 eec -8.6' 48.5 sec b +4.3' 220 c 29.2 csuZe 13.1 sec -4.310.0"*
Record
9 351: 1170 7.3 sec -8' 12" 59.3 sec b 245 C 30.2 c
Film 15.8 seae
12 35Ia 1S79 6.3 sec -4.5' 5.5' 53.9 sec 146 C 22Film 12.6 sac'
15 35am 2000Film
16 35n 9.1 sec -5' 6.5' 89.4 sec b 229.0 24.1
Film 2140 18.1 sec' 4.0' 162.1 sec b 109.2 A 10.8 a
FM Free- -2.8' +2.6"sure 8.3 -2.1' 61.8 sec b +3.6' 295 c
Record 14.2 sec* 142.1 seac b 150
17 35ma 2363 9.0 sec -4.5' 5" 98.6 eeC b 290 c 31.6 c
F11m 18.2 see 173.9 sec b
5 8 Pressure 771 7.8 sac -. 94' 38 sec b +.94 20 (dist/tie) b
SRecord16 Pressure 1860 8.5 eec -. 36' 66 sec b +.38 28 (diet/time) b
Record
Remark: "On Shot 4 the suction was divided into two shallow parts. SurfaceRecords x.-dicatc a brief positive phase between them, the pressure record does
not. The tarred times concern the duration of both parts, the unstarred that ofSthe first -,art.
Key: (a) dats for some member of second wave group.(b) unreliable dat 8 . 2h(c) camputed from L A teah
Tz
(d) bliap data.
46
a I I I I I-

Before these data are subjected to analysis_(in Chapter III),,
it will be useful to review in the next chapter some of the
theoretical concepts to be used.
Except for Figure 4 and Figure 8 there are no extant records
from photography. Shot 1 yielded no data except from aerial
photographs. Shot 6 done in 100 feet of water and only with
hydrophone data is listed in Table 7 (Chapter III). Figure 7
reproduces the only hydrophone data, namely: Shot 2 at 1007 feet,
Shot 3 at 1050 feet, Shot 4 at 1008 and 2150, Shot 5 at 765 and
1860, and Shot 6 at 1485 in 100 feet of water. Figure 8 reproduces
film and hydrophone data from Shot 4 at 2140 feet.
44
47
S . . --. .• ,. ,... . .•. . . •...... .- -• • --.. ...- ... . ... .
II DISCUSSION OF THEORY
1. Historical Introduction
The literature of gravity waves is extensive starting in 1776
with Laplace who considered water motion in a rectangular canal.
Results obtained by Lagrange a few years later for shallow water
stated that the velocity of travel depended only on the water depth
and not as Laplace found on the wavelength. As Thorade says in his
"Problems in Water Waves " 1931(1) in the Historical Side Lights
page 4, "At the end of the 1 8 th Century there had been put forth two
different theories in regard to waves, the mutual relation between
which had never been explained, so in 1802 Gerstner put forth a new
theory which assumed that the water was infinitely deep, while the
K scientific study of waves was again promoted by Poisson and Cauchy
(1815), two savants of high rank. Both blamed their predecessors
for having studied only fully developed waves, and they dealt with
the creation of the waves by citing the following illustration:
submerge a solid object, not too large, in water of unlimited depth;
wait until the water has become calm and then suddenly withdraw the
*• object. What kind of waves will be formed?" Of course both Laplace
and Lagrange were right. If the wavelength was small compared with
1 the depth, Laplace was right. If wavelength was long compared with
48
I
I . depth, then Lagrange was right. Poisson and Cauchy introduced
greater complexity as well as insight to the subject by initiating
the wave motion with a mixture of wavelengths needed to describe
their initial conditions. Thorade's book contains much historical
information. The subject of waves is discussed in a few short
paragraphs by Landau and Lifshitz "Fluid Mechanics"'(2) starting with
a deceptively simple introduction: "The free surface of a liquid in
equilibrium in a gravitational field is a plane. If, under the
action of some external perturbation, the surface is moved from its
equilibrium position at some point, motion will occur in the liquid.
This motion will be propagated over the whole surface in the form of
waves, which are called gravity waves, since they are due to the
action of the gravitational field. Gravity waves appear mainly on
the surface of the liquid, they affect the interior also, but less
and less at greater and greater depths."
2. General Considerations
S(a) (4)The gravity waves considered by Cauchy,( 3 ) Poisson,
Penney, (5) Kirkwood and Seeger(6) occur in a medium which is
4 irrotational, nonviscous, incompressible and of uniform density. A
very short and useful book by C. A. Coulson( 7 ) "Waves, a
SMathematical Account of the Common Types of Wave Motion," Oliver and
i Boyd, Ltd. 1941, divides the types of wave motion in liquids into
two groups. One group has been called tidal waves or better long
i waves in shallow water and arises when the wavelength is much
49

greater than the-depth ofthe liquid. With waves of this type the
vertical acceleration of the particles is neglected in comparison
with the horizontal acceleration. Coulson refers to the second
group as surface waves in which the vertical acceleration is no
longer negligible and the wavelength is much less than the depth of
the liquid.
The various treatments all use a linear equation of motion,
neglecting the square of the particle velocity, and assume that the
amplitude is small compared with the water depth. Of course each
treatment insists on the conservation of mass, and requires the
pressure to be constant at the free surface and the normal component
of the velocity at a rigid boundary to be zero. The differences in
treatment then relate to the method of prescribing the initial
conditions or of dealing with the explosion gas bubble. The
solution is made up by a synthesis of individual solutions such that
at t = 0 the function is made to fit the initial surface contour (or
I an initial set of velocities on a flat surface, the impulsive case).
Thereafter, if t is allowed to vary, the solution which was made to
fit initially continues to evolve its own description of what
happens which fits all the conditions and is also unique. The waves
produced depend on the volume of the cavity.
50
3. Cauchy, Poisson, and the Explosion Problem
Note that in the first memoires on the theory of waves (Cauchy,
Poisson) it was seen that a complete solution could be achieved from
one of two possible initial conditions. The problem was initially
treated only for plane waves, i.e., waves that do not spread -- for
example, in a canal.
The variables are distance, height, and time. For these first
papers the medium was infinitely deep and infinitely extended in
directions + x. See Lamb,8) sections 238 and 239.
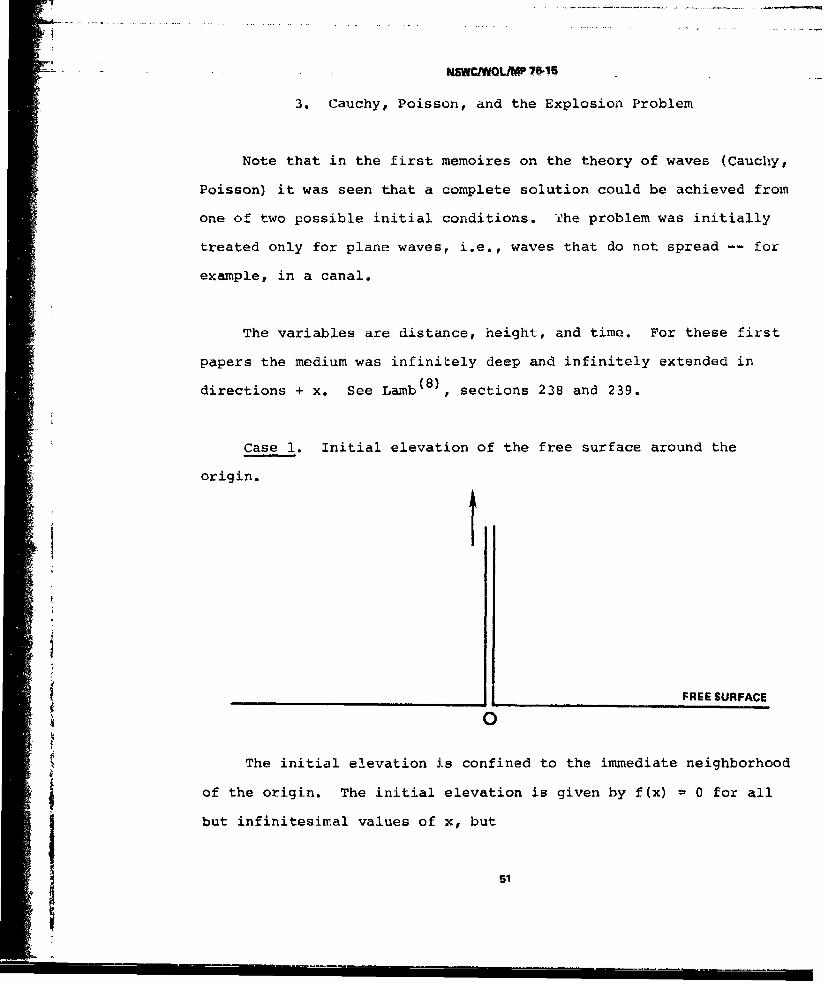
Case 1. Initial elevation of the free surface around the
origin.
_ _" _FREE SURFACE
}0
The initial elevation is confined to the immediate neighborhood
1of the origin. The initial elevation is given by f(x) 0 for all
but infinitesimal values of x, but
51
J f(x) dx = 1,
a so called 6 function. The subsidence of this initial elevation
produces a train of waves at a distance, the first arrival of which
is a positive wave, a crest. The assumption of a delta function
here is mathematically the simplest but physically quite unreal in
that it calls for an infinitely tall infinites simally thin column
of water at the origin which descends under gravity with constant
acceleration to feed the wave system. Poisson preferred to start
with an initial depression in the water formed by a paraboloid which
at t = 0 was suddenly removed. He solved this problem for the case
of propagation in two dimensions.
If one were to start from rest with a crater in the surface,
which is otherwise at the undisturbed level, the first thing to
- I arrive would be a trough. However, an explosion near the surface,
blowing out, cannot produce a pure cavity. There has to be an edge
of water piled up above the undisturbed level at the same time the
cavity reaches its maximum. Further, at this instant the maximum
radius of the cavity may be at rest, but the lower parts of it are
5 already filling in and the outer parts of the annular edge are
moving outward. It might be possible to obtain a solution using the
Cauchy-Poisson method if one could assume the proper "stationary"
i icontour for the water surface in the blowout case. This would be a
4 Icavity surrounded by an annulus all taken to be at rest at a time
f1 52

t zero. It would be necessary to obtain an analytic expression
for this contour, assuming cylindrical symmetry, as a function of r
and z, and depending on the parameters charge weight, charge depth
and water depth. Penney, in fact, achieved this approximately, but
its validity is limited to depths just short of blowout.
Case 2. The other solvable situation is that of an initially
flat surface with a limited part of it endowed at t = 0 with a
distribution of vertical velocities, i.e., initial impulses are
applied to the surface supposed undisturbed. In the case of a deep
explosion, the underwater shock wave is reflected almost immediately
from the free surface imparting upward velocity to successively
deeper layers. The resulting spray dome is flung into the air and
descends much later, in some cases, after the waves have already
left the area. Consequently the velocity imparted upward has
negligible effect on wave formation. The removal of water in the
form of spray by the shock wave reflection leaves a slight
depression in the remaining surface which could contribute to wave
formation but will be neglected. The only remaining cause for wave
formation is then the expanding gas globe which increases to a
maximum size and then decreases in a time equal to the bubble
period. This situation is treated in Kirkwood and Seeger's paper
and is not applicable to the blowout situation. On the other hand,
an explosion in air over water at rest does reproduce the condition
pertaining to the second Cauchy calculation. The initial impulse is
downward into the water as in Cauchy's case. The resulting wave
53
train again begins with a positive pulse. The water surface
initially having to move downward requires the adjacent surface to
move upward, the water being incompressible. It is this elevated
annulus which again causes the initial wave train to proceed.
Because of the poor impedance match between air and water, even for
air compressed in shock, the fraction of the air blast energy
impinging on the water surface which could be taken up by the water
in kinetic energy is small, probably less than 4% or perhaps 1% of
the total explosion energy. (See Appendix B for Energy in Surface
Waves.) On the other hand, the energy in the nonventing underwater
explosion retained in the gas globe is approximately 45% of the
total explosion energy, and all of this energy is available for
moving the water. One therefore expects that an underwater
explosion would be more efficient at making waves than an air burst.
However, if a charge is exploded deep enough, the bubble expansion
will have very little effect on the surface height. Waves are
produced only by a local variation in surface height, not by a
gradual or general slight increase in height. As the deep gas globe
oscillates and rises, it emits pulses at each minimum, causes
* turbulence and otherwise dissipates its energy so that no surface
Swaves are made.
As we shall see l•er, the efficiency of the wave making
process is very low even in the underwater case where the actualt
* wave energy is only a fraction of a percent of the total energy.
54
A&i

Clearly a key question is at what position above or below the
surface are the greatest waves made. It seems reasonable that this
is at some point below the surface rather than above. It is
important to see how the cavity or crater formation varies with
depth near the surface. This question will be considered in a later
section.
It is apparent from Lamb's discussion of wave propagation in
two dimensions (reference (8), Section 255) that Cauchy and Poisson
Sworked this problem and also that the latter considered the
formation of waves from "an initial paraboloidal depression." If we
start with a limited initial displacement, then the description of
this contour will be a superposition of all wavelengths. As these
waves travel outward, the longer ones will travel faster than the
shorter ones so that after a while the original harmonic content of
the disturbance is spread out and displayed on the water surface.
This is true as long as the medium is dispersive, i.e., for those
waves which are short compared with the depth. However, the
asymptotic solution for diverging (cylindrical symmetry) waves in an
unlimited sheet of water of uniform depth (reference (8), Section
194, 195) shows that the amplitude of these waves ultimately varies
inversely as the square root of the distance from the origin. This
is readily seen from the fact that at a large distance the
wavelengths are large compared with the depth and consequently all
travel at the same speed. Therefore, the total energy of a wave is
proportional to the amplitude squared and to the circumference of
55
th-e' circle which the wave has reached, but noc to' the wavelh.n.th
which now is constant as distance is further increased. Assuming
there is no energy dissipation, the result follows. This is
mentioned because close in to explosions the wave amplitude
decreases inversely with distance, not with the square root of the
distance. This is consistant with the dispersive mode of
propagation in which the wavelength is not constant but increases
with distance. The transition from one mode to the other is
gradual. Also, see brief discussion of dispersion in Appendix C.
4. Penney's Crater Assumption
Penney in his paper on Gravity Waves has tried an ingenious
description of the surface crater. The wave system is released from
rest at time zero from a configuration given by
2Df { D 1-i _ 3D2=• ~~ ~- 2(r 2 37"+2• / 2 ' 5%4T/'2'
(This configuration applies to only one position of the explosive
charge, namely that depth, D, at which the ensuing maximum bubble
just reaches the plane of the free surface above it.) The first
56
- term in 4(r) describes the maximum contour of the d .me formeff by- the .
expanding bubble. The volume of this dome above the former free
surface is equal to the volume of the spherical cavity beneath it,
3namely 4/3nD3. The second term replaces the spherical cavity with
another one of the same volume and of the same class as the surface
dome. If r = D/7, r being horizontal distance from a point in the
undisturbed plane directly over the charge, then 4(r) = 0. For
greater values of r the value of 4 is small but positive, so that
the expression for 4 describes an open crater if we subtract the
second term from the first. In practice it takes time for the dome
to fall back into the bubble, and during that time the bubble is
filling in from beneath. However, we can look on the crater as a
closed cavity or an open one; its mathematical description is the
same if we neglect the time of collapse. Using this and other
considerations Penney calculated that the explosion of 2,000 tons at
optimum depth would create a wave system, the leading part of which
was a trough that would be roughly 30 feet deep at a distance of
1,000 feet. The optimum depth was described as the depth at which
the maximum bubble became tangent to the plane of the original
undisturbed surface. The optimum depth for 2,000 (long) tons is
approximately 300 feet depending on the fraction of the total energyI which is assumed to be retained in the bubble. We shall assess in a
later section (Conclusion) how good an estimate this was.
This paper also contains the suggestion that the explosion of a
charge at a depth D less than its optimum depth will produce a wave
57
----------------------------------------------------------------------,"-.

-.. system -which- is exactly the same as a charge of less weigh-, for
which the optimum depth is D. This implies that if a charge is at
optimum depth or less, the wave system cannot be enlarged by
increasing the charge weight at the same depth. The bigger the
charge the more blows out, and the wave system is the same. This
statement neglects the effect of increasing air blast on the wave
formation.
5. Kirkwood's Basic Theory
The Kirkwood and Seeger theory(6) is also plagued by the bubble
behavior near either rigid or free surfaces. The expression for
maximum radius is invalid in these cases but is used as a means of
estimating bubble volume. However, in treating the case of a charge
on the bottom, the calculated bubble volume is arbitrarily divided
by two to compensate for energy loss into the bottom. Although the
volume of gases is the same in these two cases (free water and
bottom), one must remember that the volume of the bubble is
thousands of times greater than the original charge volume and is
more dependent on the distribution of energy than on the original
gas volume. In the case of free water, the theory proceeds quite
elegantly from a simple spherical source and its image in the rigid
bottom, to a solution for a complete potential function P which
satisfies the free surface boundary condition. The strength of the
source is dV/dt where V is the volume of the spherical bubble as a
function of time. The initial configuration of the sea is flat and
58
• - i , I I I I=-- l---i.. . . . ... i" .. ...-- i-"

....a rest. otin from KirkWdod-and Seeger "The evaluation of the
integrals involved in f for an actual gas globe is straightforward,
but lengthy. It is convenient to introduce, therefore, a
simplifying assumption, the value of which must be tested by
analysis of the experimental data. If the period, T, of the first
pulsation of the gas globe is much less than the time interval after
the explosion, it is reasonable to suppose that V(t) = V for O<t<T
where the constant V is some average volume for the period T."
This simplification which then wiped out a term involving dV/dt was
entirely reasonable, although it is amusing that none of the
subsequent experiments was carried out in free water where the
theory could have been properly tested. Now for the first time we
have a theory in which the period of the gas globe oscillation
appears explicitly. If this period is zero, there is not time for
anything to happen and the waves are zero.
The theory reduces to the following basic formula for the wave
-1pressure in dimensionless variables:
p , (r',z',t') pgh(l-z') + p V G , rzE 27Th
. where Gz, ,(r',z',t')= G , (r',z',t') - Gz, (r' ,z',t'-T'),•z E ZE
59

and G~, (r',z',t') . cosh Oz# cosh 6z"E co 'and Gz E cosh o
0
with origin in bottom,
h = water depth; zE is charge position above bottom.
r = horizontal distance, z = vertical distance measured upward.
t = time; T = explosion bubble period.
rt r , Z zI E
2r 27• - 21 8 = kh = 21
T ' A
W tanh 8) (Same as found in Appendix A)
60
a- I i
* ~ ~~ ~~ ~~~~~~~~ .... .- ....* . - ~ ~ . ~ W I ~ f S. ..-.. .. .~ ..- ~
The integrals for G have been evaluated by the Mathematict Tables
Project 'under the Applied Mathematics -ane-lf--the--NDRC and- are-
published in NavOcd Report No. 401. Most of the tables are also
published in the Underwater Explosion Research Compendium Volume II,
pages 707-760. The tables are computed for z' E = 0, i.e., charge on
the bottom. Kirkwood and Seeger remark that the G values are not
vnsitive to the value of Z'E, having calculated G for zE ½ and 1.
It is apparent that there are two major factors which influence
the magnitude of the waves -- first, the value of T which determines
how much the basic function G zE(r',z',t') will be reduced by a
short bubble expansion, and second the quantity V which will. depend
on the charge quantity, the water depth, the charge depth, proximity
to surface or bottom and the time over which the value is to be
averaged. In comparing experiment with theory, it is clear that the
expression given at the end of the Kirkwood and Seeger report(6) is
"applicable only to the nonblowout case. Gross divergences between
it and the measurements for charges blowing out are not a refutation
of the theory.
If the charge is on the bottom, zE, = 0. if z' = 0, then the
basic formula gives pressure variations as observed at the bottom.
If z' = 1, then the formula gives the variations in surface
4displacement, or wave height, n.
r61
rj
A

-. .... ......
S. Infl'aence of Bubble Period
It will be desirable to estimate the change required by the
finite value of TV',. According to the theory, the wave produced by
a disturbance of zero duration (i.e., no disturbance, T' = 0) is
null. The wave produced by the disturbance of longest duration, t'
= c, is determined from the function GO. For intermediate values of
TV, the waves are computed from
G OT, = G0(r',z',t') - o(r',z',t'-T')
The amplitudes thus generated are usually smaller than the G ones0
but not always.
One way to visualize the effect of the bubble period on wave
formation is to plot G0 vs t' at a given distance on transparent
paper and to prepare a duplicate plot. By placing the duplicate
under the original and transposing it to the left by an amount equal
to T0, we have the function G 0 (t'-i'). The difference in the two
curves is G For example, Figure 10 is a plot of G (l0,l,t')O"C" 0
made from the table for this particular distance. In order to
obtain the time variation of the surface displacement at a reduced
4- distance of 10 when a charge is exploded on the bottom, it is
62

NSWCJVOL/MP 76-15
U-
i "iWwccJ
UD.
4
ic
63
I ~ ~I .- I. I I I I A A A C: l i..
63
..necessary to displace this graph to the left by an amount equal to
T', thus obtaining G0 (lO,l,t'-T') and then to subtract this curve
from the previous one obtaining Go,T,(10,lt'). More useful is the
observation first made by R. W. Spitzer(9) that the value of G 0 ,
for the first minimum is proportional to 0'. This is not true if T'
is too large, but does hold for T' up to the value 1.1 and probably
further as the tables in Appendix D show. The values of Go,0 , for
the first and second maxima, and the first and second minima are
tabulated at successive scaled distances and for increasing values
of 0' in Appendix D. The durations of the first and second crests
and troughs are also tabulated. These tables which were computed, I
believe, by the BuOrd Group on Theory of Explosives, are useful for
analysis and prediction of waves from up to a ton of explosive. For
very large explosions the values which pertain are those for T' =
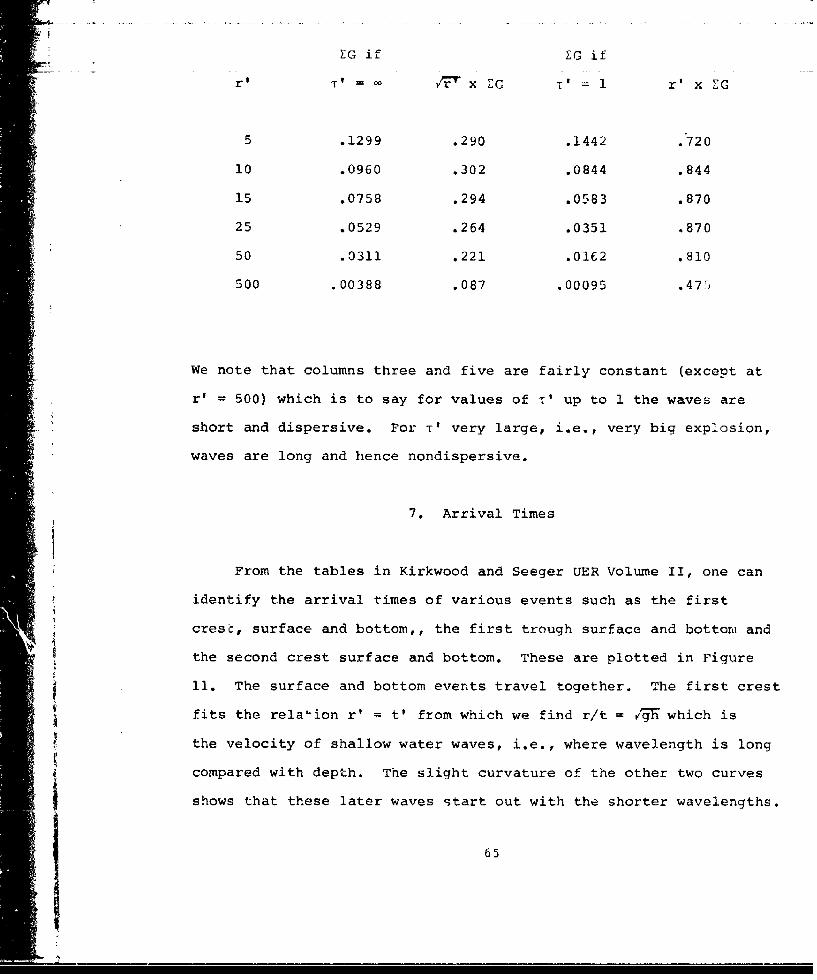
As an example of the use of these tables, we note that the sum
of the first minimum and the second maximum pressure on the bottom
is proportional to the magnitude of the trough to crest wave height
on the surface. Hence, we expect r' x £G to be constant if the
-waves are dispersive and v¶' x EG to be constant if the waves are
of long wavelength.
64
ZG if EG ifr' ' = x ZG = 1 r' x ZG
5 .1299 .290 .1442 .720
10 .0960 .302 .0844 .844
15 .0758 .294 .0583 .870
25 .0529 .264 .0351 .870
50 .0311 .221 .0162 .810
500 .00388 .087 .00095 .475
We note that columns three and five are fairly constant (except at
r' = 500) which is to say for values of T' up to 1 the waves are
short and dispersive. For t' very large, i.e., very big explosion,
waves are long and hence nondispersive.
7. Arrival Times
From the tables in Kirkwood and Seeger UER Volume II, one can
identify the arrival times of various events such as the first
crest, surface and bottom,, the first trough surface and bottonw and
the second crest surface and bottom. These are plotted in Figure
11. The surface and bottom events travel together. The first crest
fits the relation r' = t' from which we find r/t = vgj which is
the velocity of shallow water waves, i.e., where wavelength is long
compared with depth. The slight curvature of the other two curves
shows that these later waves start out with the shorter wavelengths.
65
V&

NSWCAWOLIMP 76-15
•60
60 1ST TROUGHSURFACE & BOTTOM
1ST CREST
40 SUR FACE & BOTTOM
2ND CREST--- SURFACE & BOTTOM
20
"20 40 60
FIG. 11 REDUCED TIME OF ARRIVAL OF CRESTS AND TROUGH.
66
ft.8. Comparison of Theory with Experiment
The only data we have found taken in free water, i.e., off the
bottom and not blowing out, are from Charlesworth's experiments at
the Road Research Laboratory and reported in UER Volume II, page 695
under the date February 1945. (10) Charlesworth measured the wave
amplitude as a function of time at a point 55 feet away from a
series of 32-pound charges of Polar Ammunition Gelignite (equivalent
to TNT) detonated at different depths in 15 feet of water. The data
taken for the charge at 8-foot depth which is just at the point of
breakout, giving maximum waves, were used by A. R. Bryant of the
same laboratory to compare with a prediction made using Penney's
theory. This is reported in UER Volume II, page 701, dated
September 1945. (11) Bryant was able to show almost perfect
agreement between theory and experiment for the first two waves. He
postulated that disagreement thereafter could be due to detailed
differences between the actual shape of the cavity and the assumed
shape. He does point out that since the zero of time was not known
for the experimental curve it was arbitrarily chosen to give the
best fit. In all of Charlesworth's experiments the first thing to
* 1arrive is a trough, and this is consistent with the hypothesis that
the motion starts from rest by filling in a cavity. Other data, at
SSolomons and elsewhere particularly for shallow explosions, show
I that a crest, albeit a low one in some cases, is the first thing to
arrive. The theory of Kirkwood and Sceger also predicts an initial
crest. For this reason one cannot expect the two theories to agree
in minute detail particularly at the beginning of the wave train.
67
__ _ __ _ S
It would be of interest to calculate from the Kirkwood and
Seeger theory what would be expected in the Charlesworth
experiments. This would require the use of the function
GzE(r',z',t') in which zE = ½ and r' = 55/15 = 3.7. Unfortunately
this particular function was not tabulated. The only relevant
calculations displayed in Kirkwood and Seeger show that the G
functions on the bottom, i.e., z' = 0, are virtually the same
whether zE = ½ or zero. We shall assume that the G functions for
surface waves, i.e., z' = 1, are the same whether the charge is on
the bottom or halfway down. We must use the depth of the water not
the depth of the charge for scaling purposes, i.e., r' = 3.7. The
smallest value of r' for which there are any calculations is 5. The
amplitude vs time is computed from
Amplitude at surface = 2 x 441W (r',l't')h (n+33) 0tin ft at r' = 5
OTE: The value 441 in this formula is obtained using
SW 1/3L = 14.0 (Wh+ /3
wl1/3 -If we use L = 13.5 which is more in line with
other data (period observations and so on), then the value in the
Sformula should be 406.
68
-4j
I
where the factor of 2 has been restored since the charge is not on
the bottom, and where h- water depth (I5 feet) and W = 32_pounds,
T =T Vg5h and
4.36W1 /3 ST = 5/6sec
'1>33 5/6S(ýD+33)
T' = 1.26
The results are shown in Figure 12 for r' = 5 (Inner Curve).
The amplitude has also been multiplied by the ratio of distances in
order to estimate the values for r' = 3.7 (Outer Curve). The
agreement with respect to period is fair although there is some
uncertainty at the beginning, as already remarked upon. The
amplitudes do not agree very well at the beginning. Perhaps the
agreement may be considered fair in view of all the approximations
and enabling assumptions which have been made.
If we take the assumption that the G function is the same
whether the charge is halfway down or on the bottom, we can use the
bottom function and say that the water is only 8 feet deep. In this
case r' i 7 and we find from Kirkwood and Seeger, Figure 2e and
Figure 2g, that G (7,l,t') for the maximum of the first positive
phase is +.03 and G (7,l,t') for the minimum of the first negative
phase is -. 10. Predicted wave crest is
69
NSWC/WOL/MP 76-1,5
N Ln
['j
C "
0 to cr
o '
Ul , m
\4
xx<0
-J)
00coU
0
= S3H3NI 3Qt711"ldWV
70

441 x 32 x .03 .16 ft
8 2(8+33)
Similarly the predicted trough is .54 feet.
The experimental measurements presumed for the same waves are
.5 feet and .9 feet, respectively. The agreement for crest to
trough magnitude is .70 theory vs 1.40 measured. This is in rough
agreement with the prediction made before. Note that we have
removed the factor of two because the charge was assumed to be on
the bottom in order to obtain the calculated functions. Such
procedure shows that the theory is more or less self-consistant, but
does not improve agreement with experiment. This is the only shot
(in free water) that matches the Kirkwood and Seeger assumptions,
and it is also the only shot where the experimental result is
greater than the theory. It is regrettable that there were not
available data from more free water shots so that a better test of
the theory could be made.
There are two other shots, one at Woods Hole and one at
Solomons in which the charge is on the bottom and where hydrophone
data taken on the bottom are available. These shots are of interest
because each one is at critical (nonblowout) depth, and one ir
almost exactly twice the scale of the other.
71
S.. . . .. .. . .. .. ...... . . .. . . . . -. .. .. . .. .. • . .... . . . . . • . . . .. .. . .. _ .. . ....... .. . .... . .. .. . . ... .. ,, .. ... .. . . . ... .. . . . .. .=
* T'he- 4ta are# as fi low--
Woods Hole, 300 lbs, depth 20 ft, T' = 1.33, critical depth 23 ft
Duration Period 1st Amplitude ist Crest
Distance 1st Negative to 2nd min. ist min. to trough
500 ft 4.3 (theory 4.6) 6.2 sec -0.8" 1.4"
1000 4.5 (theory 5.5) 7.1 -0.3" 0.7"
Although it was believed at the time that there was good agreement
with theory, a calculation based on the (more recent) Kirkwood and
Seeger's publication shows that the theory overestimates the
amplitudes by 50 to 100%.
Data for the other shot at Solomons (Shot 5) are as follow:
W = 2034 lbs, depth 40 ft, critical depth 42 ft, T' = 1.38
Duration Amplitude Next Positive
Distance Ist Negative 1st minimum Pressure Ampl.
771 ft 7.8 sec -. 94 inches .94
1860 8.5 -3.6 .38
72
' ' , , , ,- -t - i- --• .. i i. . . . . -- i -

values- faer the amplitude of the first %inimM computed from Kirkwood
and Seeger theory are -2.25 and -. 93 inches. Hence in this case the
theory overestimates the measured amplitude at both distances by
150%.
NOTE: For future reference, the surface amplitude on Shot 5 is
estimated from the hydrophone data as follows:
Trough to Calc. Surface
Crest Measured Calc. cosh Trough
Dist. Amplitude Velocity Period X 27h/X to Crest
771 ft 1.88" 1 25 ft/sec "13 sec 325 ft 1.31 .206 ft
1860 .74 35 ft/sec 13.5 sec 470 1.14 .070 ft
We conclude tentatively that the Penney thecry agrees with
Charlesworth's data for 32-pound charges in free water placed at a
depth equal to .6 maximum bubble radius. The Kirkwood and Seeger
theory agrees qualitatively but underestimates the initial phases by
about 100%. For depths greater than and less than this, the wave
amplitudes are lower as determined experimentally by Charlesworth.
However, for two nonblowout cases (Woods Hole and Shot 5 - Solomons)
for charges on the bottom, the Kirkwood and Seeger theory
overestimates the waves by a factor of 1.5 to 2.4. A possible
conclusion from this is that the presence of the bottom reduces the
73
* * *• i i *]..... i'• ..... i • .......

*_ - maki_- -Pat.• . tial _by more th__ .. the •ftr- of two already . ..
allowed, i.e., that more energy is used in grinding out a crater in
the bottom and further that different types of bottom, i.e., at
Woods Hole and at Solomons have different attenuations with the
latter being the greater. Unless the wave measuring data themselves
are faulty, the difference in bottom attenuation is the only
postulate for the inability to scale from one explosion to another
similar one.
9. Remarks on Scaling and the Influence
of the Bottom
The question may be asked: How does one scale from the Woods'
Hole experiment to Solomons' Shot 5? Since for these two explosives
the maximum bubble radius was approximately equal to the water
depth, there was no blowout and therefore the bore method (which see
under "scaling methods" Chapter 5), is inapplicable. However in
each we have
SL= 13.5 (T /3
L = maximum radius of bubble.
D = Depth of charge.
74

We have W1 =300; D1 :20
Sw 2034; D2 = 40
Then L 24; L 41
SL~~1 .8, 2 .9
'I2
Accordinc' to Charlesworth the wave making efficiency is a
function of D/L peaking at about 0.6 and falling off sharply as the
charge gets shallower, and gradually as the charge gets deeper. The
larger value of D/L may account for some decrease in wave efficiency
A in the larger explosion. We may expect the wave heights to be
proportional to the volume ratio, i.e., (L2 /L 1 and inversely
proportional to the square of the depth at the same scaled Jistance.
S(See Equation (5'), Kirkwood and Seeger's paper (6)
5
a and F2 2R1
S 2R =2.5H111R
75

We now summarize the observations on the two scalable shots:
ist min.
Neg. AmpJ.o Ave.
W R on bottom H'R H'R
Source lbs ft r' H' ft 2 ft 2
Woods Hole 300 500 25 .8k' 33.2
"1000 50 .3" 25.0
Kirkwood & Seeger " 500 25 1.2" 50 5-• 50" " i000 50 .6" s0
Solomons #5 2034 771 19.3 .94 60.458
1860 46.6 .36 55.8
Kirkwood & Seeger " 771 19.3 2.25 145i 145
"1860 46.6 .93 145
We can say:
(1) Theory overestimates data for 300 lbs by = 1.7
Theory overestimatee data for 2034 lbs by -1 = 2.5
76

145(2) Theory scales from 300 to 2034 as 145 2.9
(3) Data scales from 300 to 2034 as 58 2.0
(4) Scaling as in preceding paragraph goes as 2.5
(5) It is interesting that = 2.6
The next paragraph comments on the rationale for W scaling.
It hai been ioted by Penney( 5 ) that for example if one scales
from one small charge to another at such depths that D<<33 for both
1/3charges, then L % W / depths, distances and wave heights scale as
Sw/- Further, if the charges are large and D>>33, and if for
example the charges are at depths such that L = D or a fixed
multiple thereof, then D•W¼, and all dimensions including wave
v height vary as W. All of this follows from the bubble radius
formula. Unfortunately in our case, neither of these circumstances
existed. It is curious to note that in the breakout case where the
bubble cavity is no longer spherical and where the wave heights
scale as W /6 from one breakout case to another (cee bore scaling in
77

..... Baer chapter).,..all other dimensions goin qas the product of
HR W 1/6W 1/3 = W 1 . This is the same result as for the deep large
explosions where HR W 1 /4W1/4 W . The magnitude of the waves
will not be the same, presumably the largest occuring for cases
where D = .6L.
Charlesworth 1 0 ) shows data for 2-ounce and 2-pound charges at
depths of about .6L, (3 feet and 1.2 feet), so that these depths can
be neglected compared with 33. Nevertheless he shows the wave
heights reduced by WI/ 4 rather than by W
One infers that the measurements were as follows:
Weight Wave Height Distance HR
2 oz .416 ft 13.0 ft 5.41 ft 2
2 lbs .59 27.6 16.30
Applying WI/ 3 scaling to this the value of HR for 2 pounds inferred
from 2 ounces is 5.41 x (16)2/3 = 34.2 instead of 16.3 measured.
* There is no explanation given for this discrepancy, except that
Charlesworth notes that the 2-ounce charges seem to be more
efficient wave makers. [WI/4 scaling gives 21.6. Closer but not
strictly applicable.] We can also compare 32- and 300-pound data
78

i -. fired- at S-foot -depth and at the bottom in 16 feet of water,
respectively, as quoted by Charlesworth.
We believe the data are:
Weight Wave Height Distance HR
32 lbs .88 ft 55 ft 48.5 ft
300 1.66 83 138.0
00,13= 2.1 HR 48.5 x (2. 1)= 214 (compared with 138
measured)
320 3.06 HR = 48.5 x 3.06 = 149 (compared with 138
measured)
I The W1 / 4 scaling from 32 pounds to 300 pounds works better than WI/3
I •scaling and perhaps it should since charge depths are not small
compared with 33. It must be remembered that the experimental value
79

Iof HR for the charge on the bottom is undoubtedly low. If one were
to double it, A la Kirkwood and Seeger, then the cube root scaling
would look better.
Again it is forced upon us that a large change in wave making
efficiency occurs when the charge interacts with the bottom. The
theory is also ambiguous about this. Even the assumption of an
equal image source in the assumed rigid bottom is not upheld in the
actual situation. We conclude that there is an ambiguity of a
factor of two depending on the type of bottom, and how close it is
to the charge.
We note in passing that on the Solomons' Shot No. 4 an attempt
was made by soundings to determine what had happened to the bottom.
The record shows that the water depth at the explosion site was 7
feet greater when probed after the shot. How extensive the bottom
crater was or how much work was required to make it are not known.
*so
80

III ANALYSIS OF SOLOMON'S DATA
The Solomons' data will be discussed in this chapter under
three topics: first, bottom pressure or the magnitude of the first
negative phase meas,\red by hydrophone data, second, the duration of
the first negative phase; and third, the amplitude of the first
negative pulse at the surface, and of the following peak.
1. Bottom Pressure (Nonblowout Case)
The hydrophone data for the 40-foot site are plotted in
Figure 13. The amplitudes for the blowout shots are all about the
same, and those for Shot 5 are considerably lower. We shall wish to
discuss the blowout and nonblowout cases separately. Figure 14 is a
plot of the dimensionless function G (r'o) for various events.
These curves are the same for all explosions regardless of depth or
size.
The basic Kirkwood and Seeger theory requires the pressure
variation on the bottom to be given by
V
p o, G *(r',o,t') feet2rh
81
NSWC/WOL/MP 76-1b
cn w cnc,• z Z Z Z
'N Q o0 o•r qr" I--
0..0
go
0l unN 1)
0 00
Lu-
z0
0
.I-
0
L.UJ
U., w
uj 0 >
II
0
X LU-
82
I' i•T i'" [ i_...............__-_________..........................
NSWC/WOL!MP 76-15
LL
0
-i
o >
00
Ln 0
I- w-
N- 0
o0S• o0
iu
i11i
'%- <
Sr,
0-z
I -A
to 4N w
83-
where h - water depth and " - "some average volume for the period
T." If the bubble is spherical (charge off the bottom) and of
radius a(t) then
f Ta 3 dt
Now if L is the maximum radius of the expanded bubble, then the
work done against ambient pressure by the gases requires that L be
proportional to the cube root of W/(D+33).
The proportionality constant depends on the energy per pound of
the explosive and on the fraction of this energy which is retained
in the gas globe. We shall take the constant to be equal to 13.5 (W
in pounds, D charge depth in feet) which is consistent with 1060
cal/gr explosion energy (1.48 x 10⁶ foot pounds per pound) and 45%SW 1/3
energy remaining in the bubble. Therefore, L = 13.5 ( -- )
j Kirkwood and Seeger state that the time average over T of the
3dimensionless quantity (a(t)/L) in free water as calculated by
Shiffman and Friedman(12) is 0.4819.
84

* * *..... .... *.. - ... . .... .. -..... W FD fl n ~
-- . H anfcr e- a4/3 g{.4191 in- free water1 no blowout. Kirkwood -...
and Seeger now imply that the volume they are using in the pressure
formula is the volume of the bubble associated with the explosion,
and that when the explosion is on the bottom the actual volume will
be half that for a bubble at the sane depth with no bottom present.
This is certainly wrong if the bottom is rigid, and may be
approximately right if the bottom is mud-deformable and wasteful of
energy. At any rate, the V substituted into the pressure formula
is equal to
iX IT x .4819 L
and then
p 1 .4819 •A 3 (r',o,t') feet
This should work for a charge on a mud bottom but not blowing out.
85

2. Spitzer's Formula for Moderate Charges
it was noted early by R. W. Spitzer(9) that G1 min' which is
the value of GT,(r',o,t') at the bottom of the first trough is
almost exactly proportional to T'v ciithough this is necessarily
limited to values of T' small compared with t', and also typically
less than I or 1.5. This proportionality holds at each reduced
distance. If the ratio GI min/T' is plotted against I/r', one
obtains a good straight line passing through the origin. Spitzer
fits this line with the relation
G 1 min =.42Tr
Hence,
m .42i1 ft 4.6:91 inchesIl min = 7 l _ ft 7
or for charge on the bottom (halving the volume)
|4.64T L34.6in12 inches
(provided T' < 1.5).
86
values calculated for nonblowott cases are shown in Table 7..
The agreement may be said to be fair. if the value of T' is large,
it is necessary to go back to the tables(6a) and find the value of
G . The value of T is determined simply from:
4.36 WI/3
(D+33)
T= 1iT.
Elaborate corrections to T caused by proximity of the bubble to a
rigid plane or a free surface are mostly insignificant and are
herein ignored.
We may conclude that for the three nonblowout cases cited, the
theory predicts the observed amplitudes to within a factor of two.
-13. Bottom Pressure (Blowout Case); Other Estimates of Volume
If there is blowout what should be the value of V? It is
clear that the blind use of the previous formula grossly
overestimates the bottom pressure because a large part of the
87
NSWCIWOL/MP 76- M
....... ... .
wn P . f4
(V
Id 0C in
0 4 (4 IA L
.4
a. un a, CD IVo
(1 LA 'i r- .4
C.)ý
4-))
).4
-4-4 'OD
E 44 .) %Q -q LM44N N ~
- 000 0 0 0 04
o 'o $4
4-3 4Jc 4.) .0 C`4 I
U) C4 fl r
'0 0-'- >4 0q1 %
r P j 44 ell Ul -W LM co a, O
14 00 0o %V
r-4 r- in co Z) Go
E .C 4 .) 4- ( - 4 4 O N *
0) C))ILn m 0 0 C>
4-'a 4) C-' v m20 U N 4iCD en4 in
kv( 0 0 0 . 0 4
o0) 0 0o4J4i
3t N = in 0 4
0~ 0 0
A) 0a a 0A 3t 0
S 0 N '." -4
04 1 0~4
calculated volume is in a sphere or hemisphere which is above the
water level. Th es-stimate. of the proper ep-vol-ur•n- - t-.se-is diffieu-l-t.
It is also necessary to know the cavity volume as a function of
time. This will depend in part on whether the explosion products
are above or below atmospheric pressure when the breakthrough
occurs. As a general rule the explosion products when adiabatically
expanded to a radius of ten times the charge radius have reduced
their pressure to about one atmosphere. The formation of the bubble
will depend on how much work the gases have done when they reach the
surface. Calculations of this have shown that most of the kinetic
energy which the water will acquire has been imparted in the
expansion to the first few charge radii. (For example, at 2 radii
78%, at 3 radii 87% ... ) It does not appear worth while to pursue
this line of reasoning.
However, crudely, one can show the effect of various
simplifying assumptions about the volume. Remembering that
p 2 GO ft
we have, as before,
2 L3
Plp when = V = i (.4819)
89
------- -- -----
(Volume has been reduced by factor of two for charge on bottom.)
If the cavity is a cylinder of radius L and altitude h, then
P = P when V = 2 = 2r(.4819)L 2 h
2 2
"(assuming the same time averaging factor and bottom loss)
If the cavity is a hemisphere with radius equal to h, then
2 h3.
P3 when V = V3 =3. m(.4819)h.
3 3
Hence,
P2 3h P3-1 = and
= L
In the blowout cases it is necessary to adopt a procedure for
estimating Tr. The value is taken as the period which would result
5 if the charge were placed at a depth equal to its maximum bubble
90
- L
radius. T is computed also using that same value for h, not the
actual depth. The critical depth is plotted as a function of W---in-
Figure 15.
The various quantities for the blowout shots are also shown in
Table 7.
We conclude that for the one shot (Shot 5) at critical depth,
namely for which L = h, the theory overestimates the observation by
a factor of about 2½. For the three blowout cases the observations
lie between the cylinder and the hemisphere predictions. One might
suppose therefore that the actual cavity volume is somewhere between
the two. The low observations on all the Solomons shots except Shot
6, whether in blowout or critical mode are possibly attributable to
the muddy river bottom at the 40-foot site. Shot 6 is the only one
where the observation exceeded the prediction, and also the only one
fired in a different location -- somewhere in Chesapeake Bay. If
the bottom there was swept clean and was rocky, it is possible that
the troublesome factor of two should be restored to the theory in
which case we would achieve almost perfect agreement for this shot.
4. The Duration of the First Negative Phase
The duration of first negative is given by examining the sign
of GCT (reference 6a) and determining the reduced time, call it T',
91
NSWCtMOL/MP 76-15
10 6 LBS 109 LBS 10 1 2 LBS
105 108 1011
1 TON I KILPrON 1MEGATON
1031 1 10 109
10 10213 )
amax J FT) = CR IICAL DEPTH.
amax 13.5(imW \13
FIG. 15 MAX BUBBLE RADIUS EQUAL TO DEPTH.
92
between the value of t' when the first zero occurs and the second
zero. The reduced value T' = T j7S1. This time is determined by
G and T and is dependent on W only through the dependence of T on W.
In the case of blowout one suspects that the value of T to be used
depends on how long it takes the cavity to fill in. Such time is
probably longer than the bubble oscillation formula gives.
Indications of this come from considering the volume flow when a dam
breaks. (13) In any case the value of T' is very insensitive to
charge size or bubble period. In determining the durations we are
able to use surface photography as well as hydrophone data. The
data show excellent agreement with theory. The first suction
duration increases gradually with distance and is quite independent
of charge weight.
The Solomons' data are plotted in Figure 16. In Figure 17 are
plotted in dimensionless form all negative phase duration data
available from the shots discussed in the previous section. Data
marked with a H come from the hydrophone records; all other data
come from surface photography. The durations on Shots 5 and 6 which
were critical or nonblowout are longer than theory. On the other
hand, the Woods Hole nonblowout cases have shorter durations than
theory. There is no ready explanation for these differences. TheI dashed curve in Figure 17 represents a visual fit to the calculated
duration points. It also coincides with a curve which would
* Irepresent the calculated durations assuming a fixed value of T'
equal to %1.0. If the value of T' obtained from the basic function,
93

NSWC/WOL/MP 76-15
----- ----- O -N 0
-t o 4ooo z !
0 0-
C4 0
tfN U coacc,
N ICL| CL O (x 1I• • ''
a- (CL.
W2
._.) (I)
0 0
0. -t-
U. >
z
CD
ovo
0(
mo ~ 0
g(a
0cl W , , , , , ,
No4Lo,-r
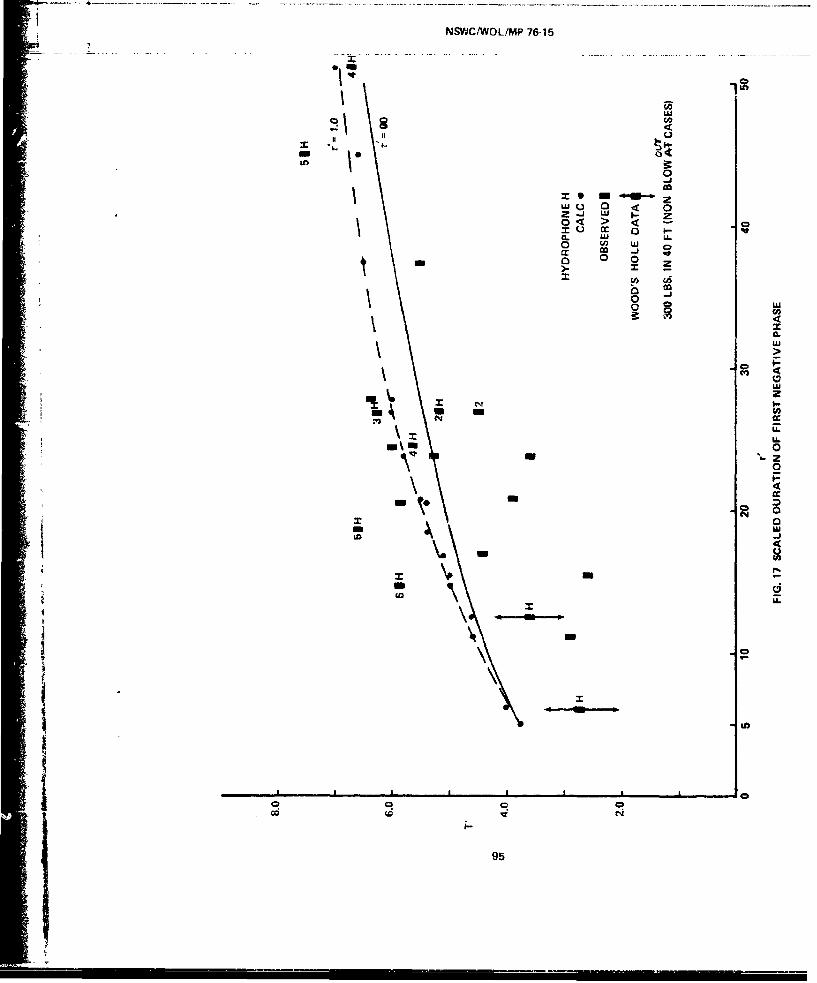
NSVWCIWOL/MP 76-15
ui0 U0
z~f uj , z
0 >
C.. LlJ LL
U)U
It--
h 2_
0
-JU
0. II W I o
o .U.
00
V w
95
•_,
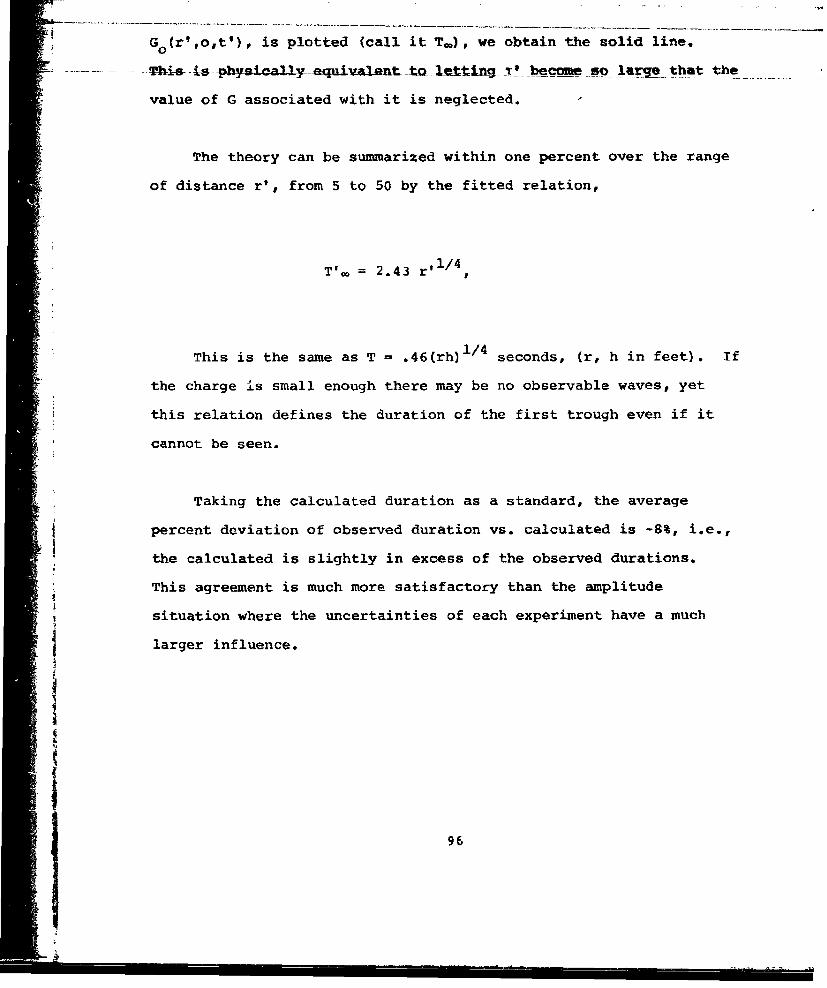
G Go(r',o,t'), is plotted (call it T), we obtain the solid line.
This- Irs-pys44cafly-aequivalant -to l-etting. !' becam 9so large that the
value of G associated with it is neglected.
The theory can be summarized within one percent over the range
of distance r', from 5 to 50 by the fitted relation,
V.T' = 2.43 r' ,
This is the same as T = .46(rh)1/ 4 seconds, (r, h in feet). If
the charge is small enough there may be no observable waves, yet
this relation defines the duration of the first trough even if it
cannot be seen.
Taking the calculated duration as a standard, the average
percent deviation of observed duration vs. calculated is -8%, i.e.,
the calculated is slightly in excess of the observed durations.
This agreement is much more satisfactory than the amplitude
situation where the uncertainties of each experiment have a much
larger influence.
96

.5 Surface Amplitudes, Trough and Succeeding Crest
......... (Blowout Cases)
The two previous summaries complete the data and analysis
related to mine sweeping applications. In this section the surface
waves will be considered which are of interest in connection with
very large explosions.
In Figure 18, the surface amplitudes directly observed at
Solomons by pole photography are plotted against distance. We have
here the first trough followed by the second crest, which is usually
larger than the first crest.
In order to calculate these quantities it is necessary to use
the function G (r',l,t'), tabulated in reference 6a. The extremes
of G (T = -) at the surface have been plotted in Figure 19, as well
as indications of the value of G when T' = 1.5. For the three0
plotted shots in Figure 18, the values of T' are 2.1, 3.1 and 3,9.
These G values as well as the observed and calculated amplitudes are
shown in Table 8. The functions for T' = = have been used for
estimating amplitudes.
As before (p. 68), we have, charge on bottom,
97

NSWC/WOL/MP 76-15
i to co 0N4 r%0
0 0<
-g -
v• q o-
U.
uj
CL
< wL
N 0'to vo LotO Cgo
IL
-- ID .- .r-U.I rNO~l•
I- 0C0mg8j ,L) Q
O.co U),
C4oCo CoGo
3oviuns IV 3(aniiliWV
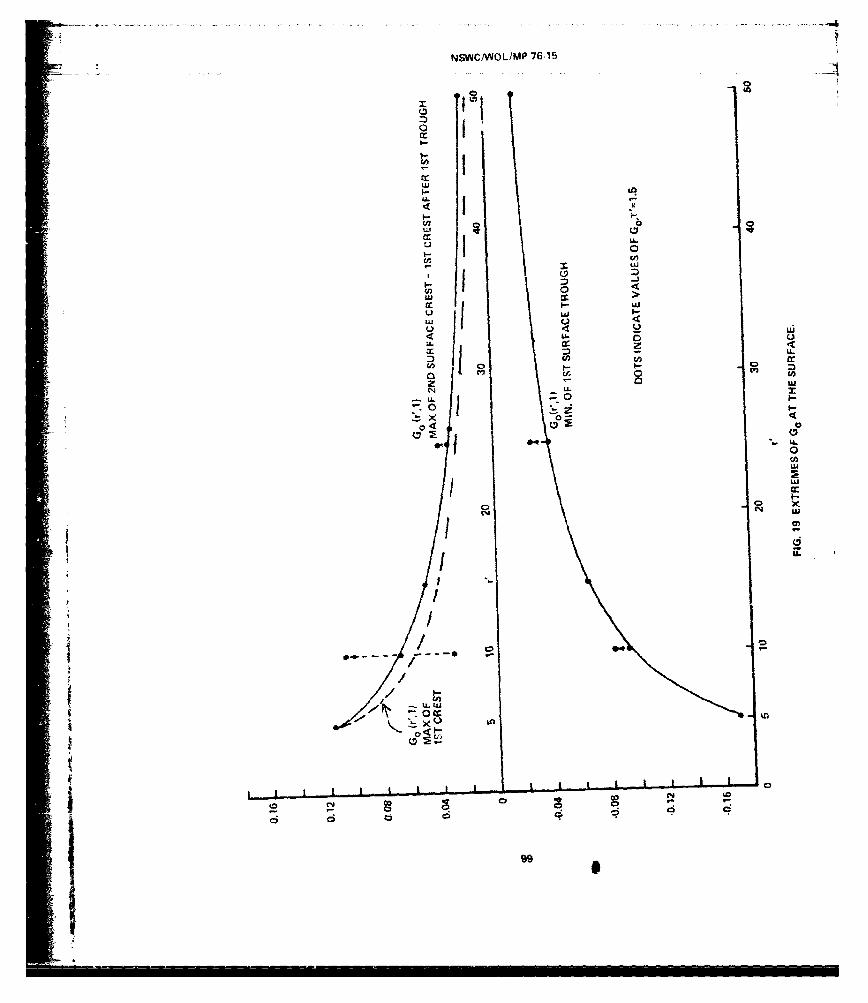
NSWC/NOL/MP 76-15
.-
cc
U.
4 >
0 Iw 0
U LU
-- 0
LEL044
U.
. U.
U- -U.
60
C /

33
Pl ~ = 1.92 L inGhe~ s
and
Pmax 1.92 L G max) inches.h
We find as before that this calculation for the blowout cases
grossly overestimates the amplitudes of the surface waves. If we
reduce these in the ratio of (h/L)3 corresponding to the
hemispherical bubble, the resulting amplitudes are too small by a
factor of 2 or 3. We shall see in the final chapter that the
cylindrical assumption is a near approximation for blowout t-ases.
100
Il__ __
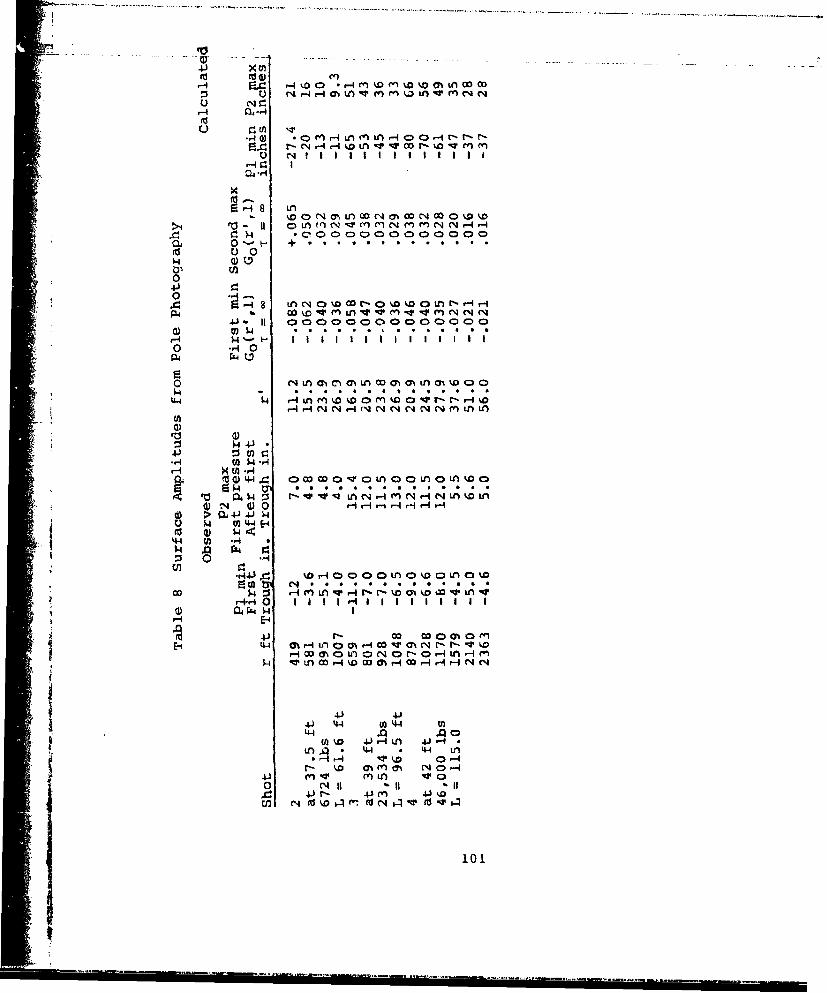
(049-4 ~CH0 c>. o) o o w h L OD
N o-4o -IM0VMMk n-
k*c)0003)t 000 0 nODN00 000 ý
0
o0 .4
o -4P94 44*
944 4 94 D0 0N r4 9 9P- (4N -q r4 N~ r4a N c-' 4 r) ta LA
to t -o* 44 CC)ww0va0 nW
> 04 4J 4 1,
r4 U 44 E-d
ý4 04 4
%0t' r-0 0 00 m k 0HH %Lo 1.4 to4i4E
r~r 0 1 -
a) 04 ýk w
E-0N NH4.- P
P. " n ý D ( H0-4r- - 4 HH N N
43 4.34-) 4 U) t44l to
44 434 JJlw1 0% M 71 No t-
101

IV THE BAKER SHOT AT BIKINI
1. Introduction
On July 25, 1946 (local date) a nominal 20 kiloton Lomb was
exploded at mid-depth in 180 feet of water in Bikini lagoon. A
question of intense interest was what sort of waves would be
produced and how big would they be. Estimates and predictions were
made by many of the participants using different methods. The
sources of uncertainty as we have seen were many. For example, the
Kirkwood and Seeger theory did not apply directly to the blowout
case, and it was not clear how one should correct for this. Another
problem was how to scale up small explosions to big ones. The
charge size was so large that an uncertainty between using say W1/3
"and W1/4 resulted in a factor of W1/12 or 4.3 in predicted wave
height. And finally the various small scale experiments done at
different depths and in different places were difficult to compare.
In view of this it was necessary to take certain risks in the
placement of instruments and cameras, balancing the chance of
getting insufficient data against the chanc' of being wiped out.
The easy solution of course was to cover all possibilities, but then
the costs became higher.
102
4I
..-- .........
n 2. Penney's Bore Theory
On July 24, 1946, W. G. Penney prepared a memorandum in which
he proposed a new mechanism for explosive wave making in shallow
water, derived a new scaling law for such cases and predicted the
Baker wave heights by scaling up relevant small scale experiments,
making predictions which turned out to be nearly exact. His own
statement is so concise that I quote from it:
"Theories of the wave forming mechanism of explosions below the
water surface are not entirely convincing nor do they give a good
description of the waves in the early breaking stage.
Visual observation and photographic studies suggest that the
mechanism for an explosion near the surface is that a volume of
water is hurled away from the charge, a wall of outwardly movingbroken water progressively sweeps up the still water just outside;
the height of this "wall" or "bore" decreases quite quickly and
degenerates into a wave. Soon, by the normal processes of
dispersion of cylindrically expanding waves from a finite central
disturbed area, a wave train is established. The suggestion is made
here that the wave train is caused by the cylindrical bore. This is
in contrast to earlier theories which attributed the waves to the
filling in of a cavity and the subsequent palsations of the water
surface. While the later waves may have their origin in such a
cause, the first two waves, which on the scale of charges of 2000
103
i 1 r -

lbs or less, are much the greatest, leave the center nill before thE'
return flow to the center has developed.
The model proposed here has a scaling law different from that
of the reflux to the crater, and the wave heights calculated on the
"cylindrical bore" model are much smaller than those on the cavity
model. Possibly, the implication is that the crater waves, which
come later, perhaps waves number 4, 5, ... , at one mile from the
Baker atomic bomb at Bikini will be larger, say by a factor 2 or 3
than the earlier ones. [Note, they weren't].
TY 3 '"cylindrical bore" model assumes that the explosion of a
mass of explosive W removes some water into the air and gives to an
annulus of water still in the main body of water an outward impulse.
This water then establishes a bore which picks up still water, thus
reducing the mass velocity of the bore, and hence its height. The
bore degenerates into waves, by the mechanism of the Cauchy-Poisson
generation of surface waves from a distribution of surface elevation
and impulse."
The situation is depicted as follows:
104

HUThe conservation of mass requires u =
D+I-
This together with the conservation of momentum gives
U= ' 2D DH
Note that if H<<D, this reduces to Uo = g". If H is not
negligible, then U>UO. It may be shown that as long as H is not
negligible, the bore provides a mechanism for energy dissipation.
Suppose two explosions are made with charges W and W where W• n~3W
n and linear dimensions, depth of water, depth of charge,
horizontal radius to any observation point are all chosen in the
ratio n to 1. At corresponding points and times the particle
"velocities must be equal. That is u(R,t) = u (Rl,tI).I* Since u = H.2'jjH
we have
H(2fl1+R1 ).(D+H1 (2D+H) D (D 1+H1
105

Since D - nDl,
H ~ H1
An H (2 I +;: +An•
This is an equation for H convenient for iteration. The approximate
solution, holding well for H and H1 small compared with D1 , is
H= v H
Hence, the bore heights (and consequently wave heights at all
distances) are in the ratio of rn, i.e.,
3. An Energy Argument
A rather simpler argument based on energy conservation
indicates the same conclusion for wave height scaling. Consider a
subsequent single wave of height H1 emanating from the original bore
formation. Its potential energy is proportional to XlR H where X
is the "wavelength" and R1 is the distance from the explosion. This
energy is proportional to W1 . If we move to another scale, we must
have
X R H n 3I1 H 1
106
4
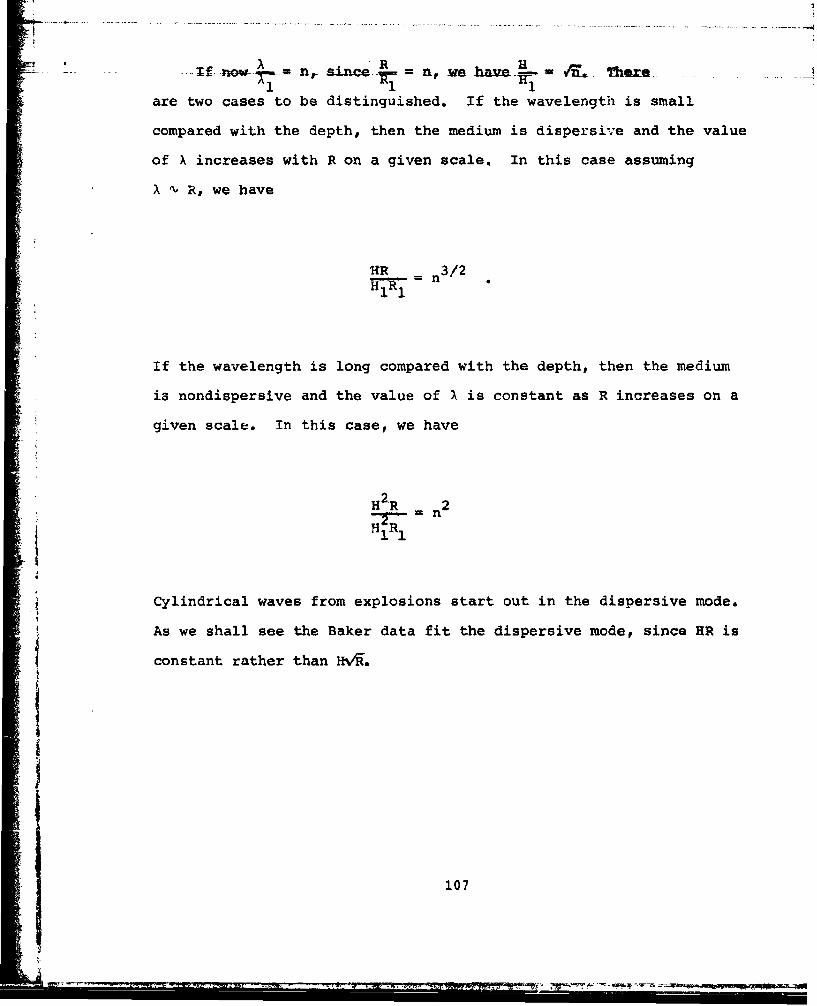
3-1
if now.T-.-~ n-, since _ ,ir7ve =~ hr1. 11
are two cases to be distinguished. If the wavelength is small
compared with the depth, then the medium is dispersive and the value
of X increases with R on a given scale. In this case assuming
XI- R, we have
HR n 3/2- •
If the wavelength is long compared with the depth, then the medium
is nondispersive and the value of X is constant as R increases on a
given scale. In this case, we have
H2 R 2
H 1R
Cylindrical waves from explosions start out in the dispersive mode.
As we shall see the Baker data fit the dispersive mode, since HR is
constant rather than H%4.
107
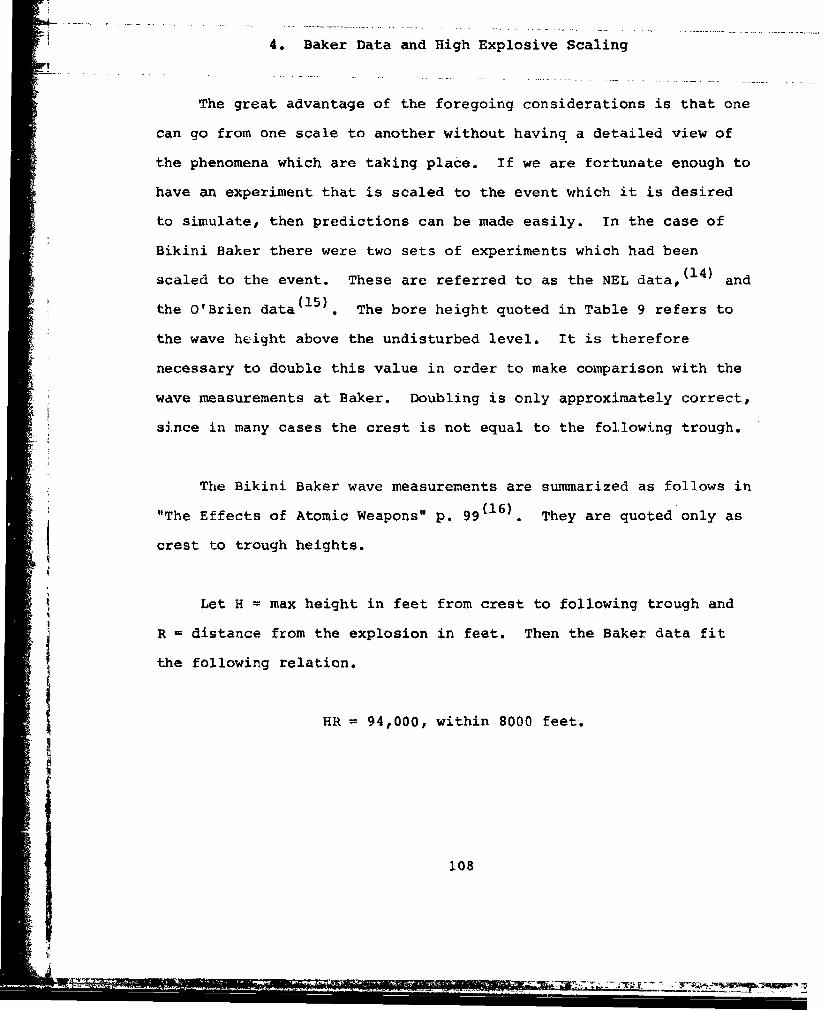
4. Baker Data and High Explosive Scaling
The great advantage of the foregoing considerations is that one
can go from one scale to another without having a detailed view of
the phenomena which are taking place. If we are fortunate enough to
have an experiment that is scaled to the event which it is desired
to simulate, then predictions can be made easily. In the case of
Bikini Baker there were two sets of experiments which had been
scaled to the event. These are referred to as the NEL data,( 1 4 ) and
the O'Brien data{1 5 ). The bore height quoted in Table 9 refers to
the wave height above the undisturbed level. It is therefore
necessary to double this value in order to make comparison with the
wave measurements at Baker. Doubling is only approximately correct,
since in many cases the crest is not equal to the following trough.
The Bikini Baker wave measurements are summarized as follows in
"The Effects of Atomic Weapons" p. 99(16) They are quoted only as
crest to trough heights.
Let H = max height in feet from crest to following trough and
R = distance from the explosion in feet. Then the Baker data fit
the following relation.
HR = 94,000, within 8000 feet.
108
This will be presumed to be the best fit for all data obtained at
these distanees [-Beyond 8000-feet the empirical eqtiato(9 HR) 9 =..
42,700 is given.]
The explosion at Baker occurred in 180 feet of water at
mid-depth. The equivalent charge radius was 45 feet and so the
water was presumably completely removed just as if the charge had
been on the bottom. In fact it is possible that a greater fraction
of the charge energy went into wave making than if it had been
resting on the bottom (because of less damage to the bottom). This
consideration, however, will be ignored, and we will assume that a
high explosive scaled experiment with the charge on the bottom is
equivalent to one with the charge at mid depth. In either case the
water is completely removed from a cylindrical volume surrounding
the charge. In the scaled NEL & O'Brien experiments quoted, it is
not positively stated whether the charges were on the bottom, but it
is assumed that they were. The information is summarized in
Table 9.
109
Table 9 High Explosive Results Scaled to Baker
Original Data Scaled To 20 kt
Source D1 DH D R H1
WI charge water ft inch n ft ft ft RHI
NEL 2040 83
lbs. inch same 161 24 27 187 4350 10.4 45,250.
278 40.5 " 82 15.5 52.4 177 4300 9.4 40,500.
44 23 I 46 12.5 95.5 183 4400 10.2 45,000.
O'Brien 1000. 60 " 330 9.6 34.2 171 11300 4.67 52,500.
These shots were at a depth of four charge radii. In the absence of
definite information it will be assumed that the charges were on the
bottom. The nature of the bottom is not known and presumably wouldI •make a difference, that is, a rocky hard bottom would not absorb
energy as much as a soft mud bottom and would therefore make for
. larger waves. Furthermore, the positive phase height is quoted,
H•, and we are forced to double it to compare with the Baker quotedvalue which goes from crest to trough. It is clear however that the
110
bore scaling applies eedause t9 dept -are•-l --t*he -a e- a .......atated..
in terms of charge radii, and are in the blowout region where the
bubble radius formula does not apply. Hence all dimensions are
scaled as n =I!ll/ and wave heights are scaled as V/n. This
produces for the NEL average HR = 87,200 and for O'Brien, HR
105,000. The corresponding measurement for Baker is HR = 94,000.
This agreement can be taken to mean the nuclear explosion underwater
behaves like a conventional explosion of the same yield, as far as
mechanical effects at a distance are concerned. It may also be
assumed that the mid depth explosion of a nuclear bomb in such
shallow water resolves itself into the same situation as a high
explosive of the same energy sitting on the bottom. There also may
be a compensating effect i.e., that the nuclear explosion at 2
equivalent charge radii from the surface lost the same fractional
energy to the atmosphere that the high explosive at the depth of 4
charge radii lost to the bottom in making a crater. In this way the
scaling up of the high explosive experiment leads to a correct
prediction of the nuclear experiment in this very shallow situation.
The agreement of prediction wi ;h later observation within 2% is
truly remarkable.
5. A Speculative Adjustment to Make Scaling Applicable
We have seen that the "bore" scaling works well when the
dimensions of the experiment are in scale. If, however, we apply
"bore" scaling to say Shot 4 of the Solomons' datap where n = 9.3,
I1
- - - -- ~- - --- -.. ... -...-- -- - --
fwe findthat- the predicted. wave- heights, are too. small and the depth
is too large. That is, the scaled up depth is 370 feet and the
average value of HR is 4900 (crest to trough). If the same weight
had been fired at Solomons' in 20 feet of water, then the scaled up
depth would have been 185 feet and presumably (except for mud
absorption) the height-distance product would have been larger.
This in fact seems backward, that by decreasing the depth we would
expect an increase in wave height. There may be a physical reason
for a possible effect of this sort within limits of course. It is
related to the behavior of the gases as they escape from the water
in the shallow explosion case. In brief, if the explosion is deep,
the gases have to work against the static pressure including the
atmosphere. If the explosion is shallow, the work against the
atmosphere is cancelled when the gases break out. If a large
fraction of the available energy has been converted (i.e., if the
explosion is not too shallow) to kinetic energy in the water, then
it is possible that a cavity can be formed with a larger radius than
L. The range of depths of charge within which this is possible is
quite small, probably between two and about eight charge radii.
Such a larger cavity would produce a higher bore and a larger wave.
To review, if there is no blowout, the maximum bubble size is
determined by the work done against the total hydrostatic pressure
including atmospheric.
112
The pressure inside the bubble at its maximum size is very low,
perhaps .1 atm. In the case of blowout the pressure inside the
cavity at some stage in the expansion phase becomes atmospheric.
Consequently, the expansion can proceed without doing any work
against the atmosphere. The resulting size of the crater will then
depend on how much kinetic energy the water was able to absorb
before blowout.
Let L = max radius in feet.
Experimental data on periods show that 45% of the energy remains in
the bubble. Then,
L = 13.5 (-D--=
where D= depth of charge below surface._ _• c
3 W L3 Dc + 3.3Let n L- D C + 33 (for no blowout)
For the blowout case we have L>D Let D = depth of water. We wishc
to estimate the maximum crater radius, a. The work done to produce
the crater and the elevated annulus is pg w a2 )D+C
113
11

where C is the height of the annulus above sea level. This work is
equal to that part of the explosion energy not sent off in the
shockwave. If the explosion is deep enough to allov: the underwater
shock to be formed - say two charge radii or more, then we can
assume that 45% of the energy is available for crater formation.
This energy is imparted very early to the water as kinetic energy.
Hence, try writing
2 D +C6
pg 7r a D .45W x 1.48 x 106
L A detonation energy of 1060 cal per grant is equivalent to 1.481
106 ft lbs energy per lb of explosive.
In the above p = 2, g = 32.
S2 D(D+C) = 6650W
If D>C, we may approximate a by
66'50 W 1/2 =8 5a 81.5 -
*D D
If on the other hand C is of the order of D, then a = 57 W-
Values of a obtained from either of these relations for small values
of D are of course too large to represent any real cavity radius.
In fact, they suggest that the value of energy assigned to
114

the crater formation is much too large,. recalling that not 45% of
the explosive energy shows up in waves but only perhaps 1/100 of
that. Nevertheless, the temptation is strong to believe that if we
change the depth of this shot from 40 feet to 20 feet, whatever the
value of a was will increase by a factor of two. Hence, the volume
removed from the crater will be greater by a factor of two becaase
volume is proportional to a2 times depth. If the energy available
for waves is likewise doubled, the wave heights at the same distance
would then increase by C. We infer that if we had fired the
46,000 lbs in 20 feet instead of 40 feet the HR product could have
been 2460 instead of 1740, and the scaled up value from this would
be HR = 70,000 for 20 kt in 180 feet of water.
It must be admitted that this is pure speculation, and that a
scruting of Charlesworth's shallow data does not confirm the notion.
Whatever the merits of this discussion it is clear that there
is a change of regima when charge depth is progressively less than
the critical depth. The cavity changes from an expanding sphere to
an expanding ring of some sort. In the first case one can scale
from one size to another and we will have L "' n2/3 (for D>>33) or L
'V n (for D<<33). In the second case the radius of the cylindrical
1/2cavity will scale as n
1
115
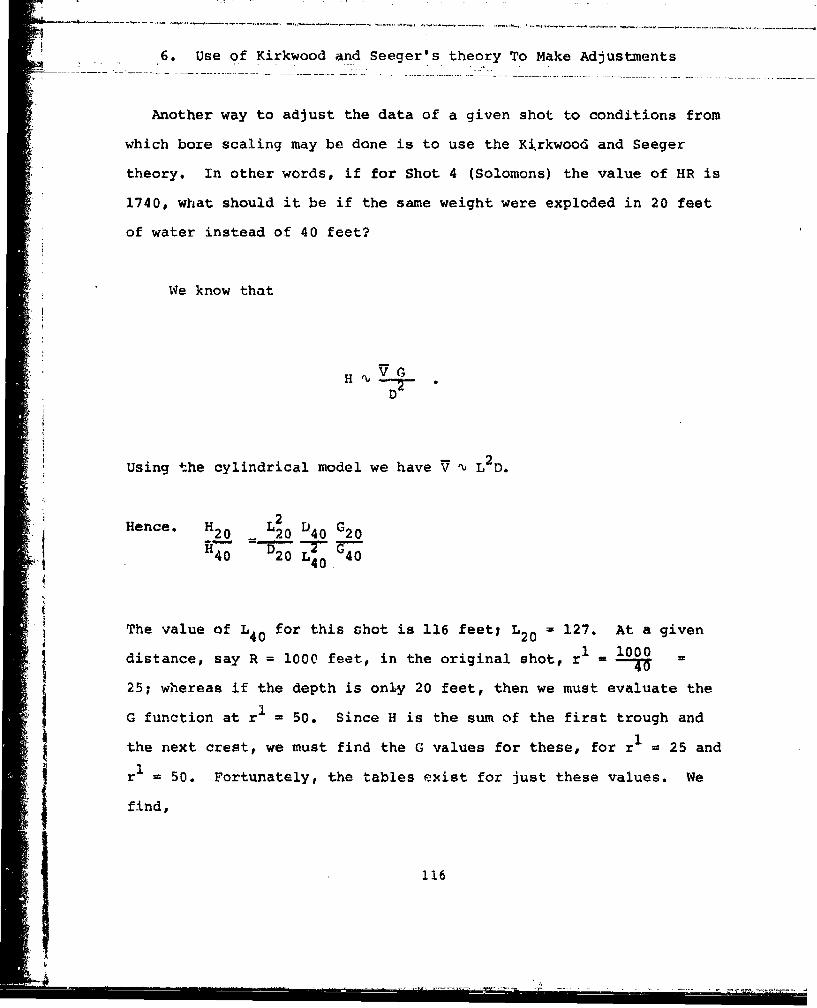
6. Use of Kirkwood and Seeger's theory To Make Adjustments
Another way to adjust the data of a given shot to conditions from
which bore scaling may be done is to use the Kirkwood and Seeger
theory. In other words, if for Shot 4 (Solomons) the value of HR is
1740, what should it be if the same weight were exploded in 20 feet
of water instead of 40 feet?
We know that
H VVG
D
L2Hence. H2 0 L20 D4 0 G2 0
I 40 20 L4 40
The value of L40 for this chot is 116 feetg L2 0 127. At a given
distance, say R = 1000 feet, in the original shot, r 1 1000
25; whereas if the depth is only 20 feet, then we must evaluate the
SG function at rI = 50. Since H is the sum of the first trough and
the next crest, we must find the G values for these, for r1 = 25 and
r = 50. Fortunately, the tables exist for just these values. We
find,
116

-4
SG4 0 oG (25,1) 1 min = -. 0400; G (25,1)2 max = .0318
G 20 G (50 1) 1 min = -. 0207; Go (5011)2 max - .0169
Hence,
H H (127)2 40" .0207 + .016920 40 I .0400 + .0318
H =H x 1.2620 40
We conclude that if the same charge had been fired in 20 feet of
water the waves would have been 26% higher at the same distance.
SHu2 Hence the value of HR would be 2190 feet and the corresponding bore
scaled prediction for Baker would be 2190 x n3 /2 = 62,000.
This result is fairly close to the preceding estimate. Both
depend on guesses as to the proper value of volume to use. The
beauty of a properly scaled experiment is that all such speculations
are avoided. It is nevertheless unfortunately necessary to have to
make such deductions in the absence of scalable data.
117
. . ....-.. ........ .. ..... ..... -The-Cavity at Bake: . ... . . . . . . ...
"The Effects of Atomic Weapons" (16, p. 40, states that the
greatest radius of the "plume" at Baker was 1000 feet. The plume is
described as the entrained water which was propelled upward by the
escaping gases (mostly steam) from the explosion itself. The plume
overtook and exceeded the spray dome at a height "of a few thousand
feet." The spray dome, caused by the reflection of the underwater
shock wave from the water surface, had a radius probably less than
1000 feet. Its radius estimated from dome formation investigation
(Effects p. 97) is about 800 feet. The radius at which the dome
degenerates into the travelling slick is of course not precisely
determined. The base surge appeared at a radius of 1230 feet at 10
seconds after the burst (Effects p. 106). The expression for
spherical bubble radius (Section 5) gives a value of L = 930 feet
which is curiously of the same magnitude as the plume or column
diameter. Although this formula (for L) does not apply to the
blowout case, it appears to give a reasonable estimate of the cavity
radius which was presumably less than the plume radius but must have
been considerably more than the depth. There is another clue to the
possible estimation of the maximum cavity size. The bubble period
for the nonblowout case is given by
= 4.36W1/3
(11+33)85/6
118:1

- -- where- ]Lým depth _of __charqgebelow surface.----------
In case of blowout, use this to estimate time for bubble to
reach its maximum radius. This time should be approximately T/2.
The filling of the cavity is by a different process (similar to the
breaking of a dam).
In the case of Baker,
i = 13.6 sec
This is about the time of maximum diameter of the uater column. See
p. 104 of Effects of Atomic Weapons. In other words, the maximum
diameter of column occurs at approximately the same time and in the
same size as is calculated from the nonblowout formulae., This may
9 1be due to the fact that a large transfer of energy to the water
occurs in the very early stages of the explosion expansion. The
subsequent size of the bubble is determined by expansion against
ambient pressure. It is possible that the energy communicated to
the water in the shallow cases is less than in the deep cases
because of blowout, but that the ambien4 pressure against which the
expansion occurs is less because of the shallower head of water, and
because there is no work done against the atmosphere as there is in
the self contained (deep) case. Consequently these effects are
119

contrary and compensating so that the apparent agreement in the
-- ---Baker- case -betweerr -the- deep -1orru1ae pre-dict n -ahd t''e ..
observations is better than one would originally have guessed.
8. Other Baker Predictions
We have found elsewhere that the Kirkwood and Seeger theory
over estimates by 100% the single observation to which it applies,
namely a nonblowout (critical depth) experiment done in midwater
(not on the bottom) by Charlesworth using a 32-pound charge. In
predicting wave heights for Baker, Kirkwood and Seeger in a
memorandum to O'Brien, dated 29 June 1946, overestimated the wave
heights by a factor of 6 to 8 at distances between 5000 and 10,000
feet. If in their prediction they used the final formula of their
later paper, they overestimated the source volume, by a factor of
about 7, i.e., the ratio of 4/3 w L to iT L2D. A new calculation
based on their subsequent paper overestimates the trough to crest
wave height by a factor of 12. It is not known how the volume was
estimated.
120
___._ __-
V CONCLUSIONS
In this chapter we shall summarize the data, discuss the
scaling and review the procedure for estimating waves for a given
situation.
1i. Data Summary
We have seen first that the wave height (trough to crest)
multiplied by the distance is a constant for a given explosion
provided we are not too far away. At great enough distance we
expect that H R will be constant. Table 10 shows the HR values
observed for the three Solomon's shots where surface measurements
were made.
Table 11 shows averaged products of wave height x distance for
all data previously discussed. Figure 20 represents the data scaled
up in all cases by simply multiply the measured H x R by1+77106
As we have seen this works for different reasons for both blowout
and deep shots. It seems that the blowout data obtained for
freewater explosions and for bottom shots (Solomons) corrected to
121
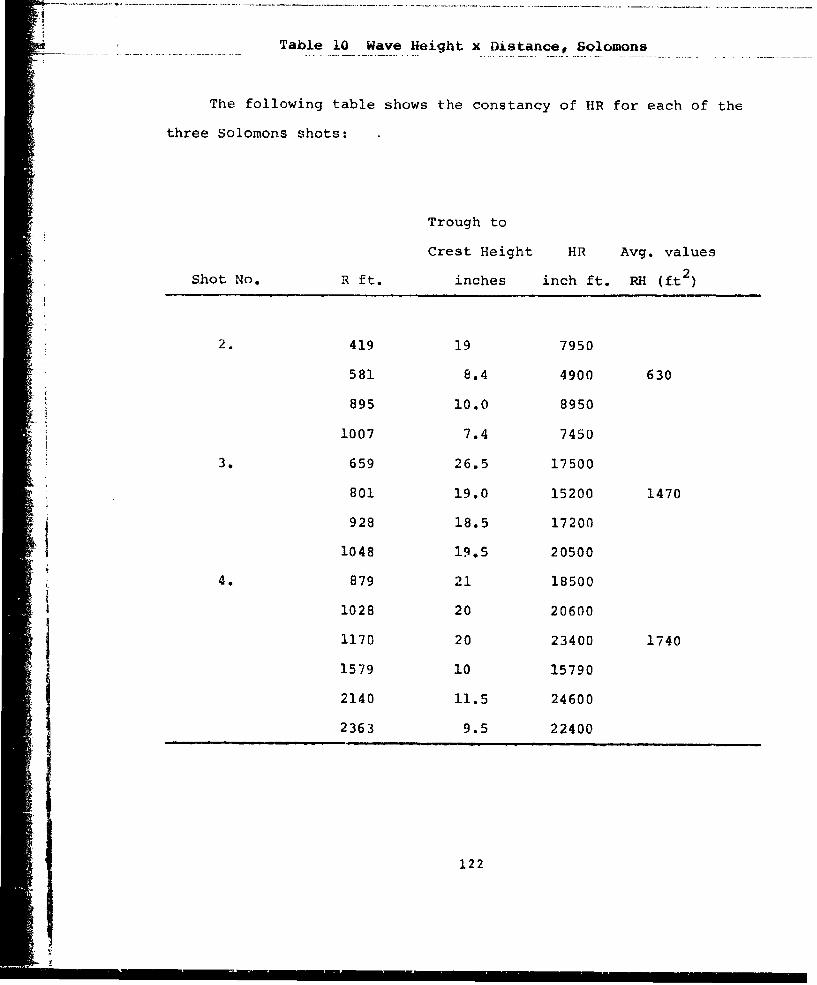
Table 10 Wave Height x Distance, Solomons
The following table shows the constancy of HIR for each of the
three Solomons shots:
Trough to
Crest Height HR Avg. values
Shot No. R ft. inches inch ft. RH (ft )
2. 419 19 7950
581 8.4 4900 630
895 10.0 8950
1007 7.4 7450
3. 659 26.5 17500
801 19.0 15200 1470
928 18.5 17200
1048 19.5 20500
4, 879 21 18500
1028 20 20600
1170 20 23400 1740
1579 10 15790
2140 11.5 24600
2363 9.5 22400
122
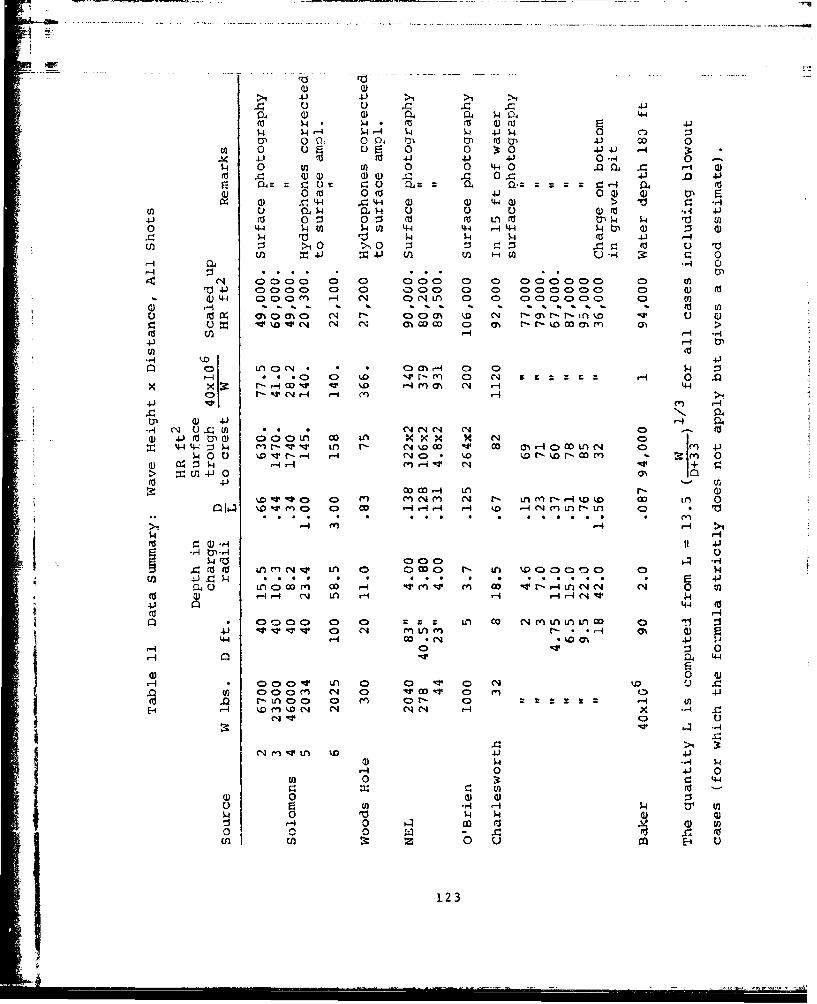
0 0>1 4.J 4-) >C. o C) . .r .rc .•
Q4. 04 0 .4~ 44'
$o- $4 4.4 s- s- 4J oJ5.4 0 oa) o n, 004 ý 01 m 41 0
0I 0 C) 2 u 0 t0 414.) .-4
.. 0 V) 0 ) 0 0 440 .00.Q 0 - a)
rOG) 04 r -0 a, lz 4. LI rd0 m 0 (a 4-) 0 0 0r: 4-4 4 44 a) 4-0 4 ) > 10
ED C.) a, w 04.- H ) C) U. 4 M ~ -,-4M: 0 mE) rd t54 S-4 ,- U0 '44 ý4 to 4U) 4-4 .. •-A W4 $, 0 •-Z
ýC-l ýqS- 1-4 10-Ai 4 1 -4In) >1 0 >10 ý: 91 m
= 4 M ,- Mn H. 0
S0 0
'4 0000 0•1ý u 0 000 0 0 0 D 0 CD t-'4-) 0000 0 0) C0C )00 0 0 00000 0 0 lC 0 Q) (
4-dL)4 0 00t n -I 04 4 ON LI) 0 0 00000lCýC30 0D En
O. I -. u . o - t* - D * t- -" *- -" - (oi
(J r %D''4:r'C,4 r4 m c O DO 0) 0% t-r-..o 00al m >,
4J
C) 4- 0 - :$"" 40 Cax x le r- -sq OD-W.D11 r-I4 O rn (3 A H- 44
(D r- -W C14 ,- -I rl r-4 -I
do 0 •0 -V0..( 0 *. .CN( C14 4 0
a)4)r0 - 1 C(U) 0 oou 0o 'n x xx x N(44 4- Jý Mr R Lf) r C14 WOO .4v 0 Ch -4 0 DLnC'4 IM 4
14 0 10 r.~ -H Hl -i 'a4 0 t .0 N' D r-m n n0~r Hr-4 V) N' ~ 4
En -P
00,- No14m.'~ 0N flc%() czN r- .ncnrýr-,-%D tD co in 0
en~ a. ) 0 cc - -4-r4 r-4 D .- 4 C'14 M LCnUr 0n D 10
>1 -4 v4 -4 -4 >11.4 r-IV rw. -Q) -I.)
n - 0-14C.
IV * n 000 0NV 0 0 i0 - in % 01 r'(-llr~) oý '*3 a
'-n 4J r- 44
Q44 000 LA-ý9 o;4av 44 0~ 0;)
go --44 C L - 4 Wý0 4m 40
ai 0 ( a0 co N nt U nO
'tr ;2 0*)r 4 n f - . .-C. l)- -4 C> 4 0' 0
0.4 0 v0 14 -Ti 0) N w
0~ (1 0~ ) l
ul 0 123
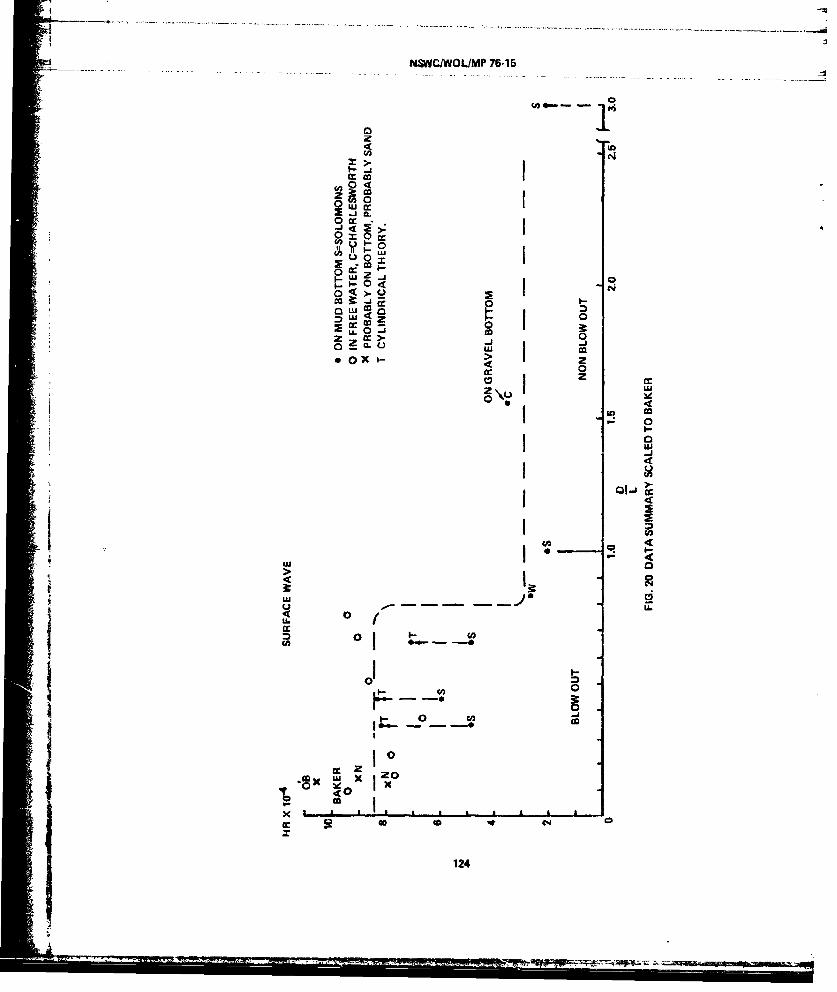
NSWrCWOL/MP 76-15
0z4 tO
j CdCL
=Y 0
0.
W --
"*g I
0 0co --
M 0
o•°w I
0OX- •> z
00
gI o
o -
>0 0 -
01
!
I ZO
o x
.x . , to I •
co C-4
124
' , 13 • • .... ... . '
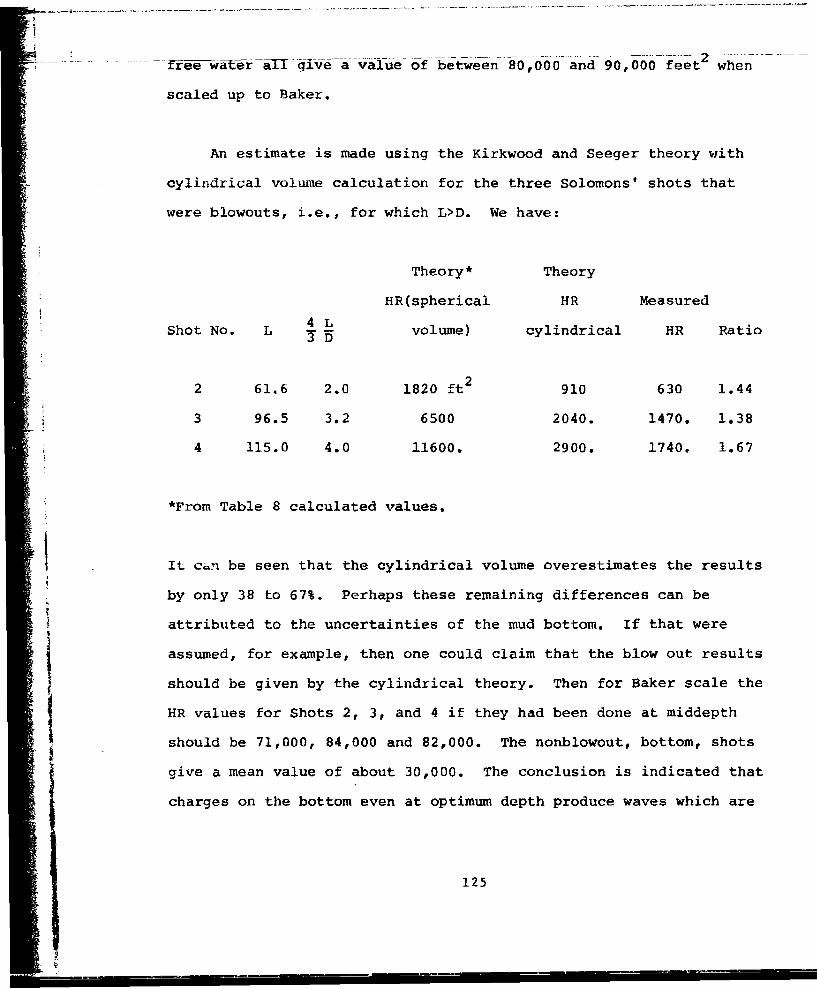
- ree water -a give a value of between 80,000 and 90,000 feet when
scaled up to Baker.
An estimate is made using the Kirkwood and Seeger theory with
cylindrical volume calculation for the three Solomons' shots that
were blowouts, i.e., for which L>D. We have:
Theory* Theory
HR(spherical HR MeasuredS~4L
Shot No. L 4 L volume) cylindrical HR Ratio
2 61.6 2.0 1820 ft 2 910 630 1.44
3 96.5 3.2 6500 2040. 1470. 1.38
4 115.0 4.0 11600. 2900. 1740. 1.67
*From Table 8 calculated values.
It can be seen that the cylindrical volume overestimates the results
by only 38 to 67%. Perhaps these remaining differences can be
attributed to the uncertainties of the mud bottom. If that were
assumed, for example, then one could claim that the blow out results
should be given by the cylindrical theory. Then for Baker scale the
HR values for Shots 2, 3, and 4 if they had been done at middepth
should be 71,000, 84,000 and 82,000. The nonblowout, bottom, shots
give a mean value of about 30,000. The conclusion is indicated that
charges on the bottom even at optimum depth produce waves which are
125
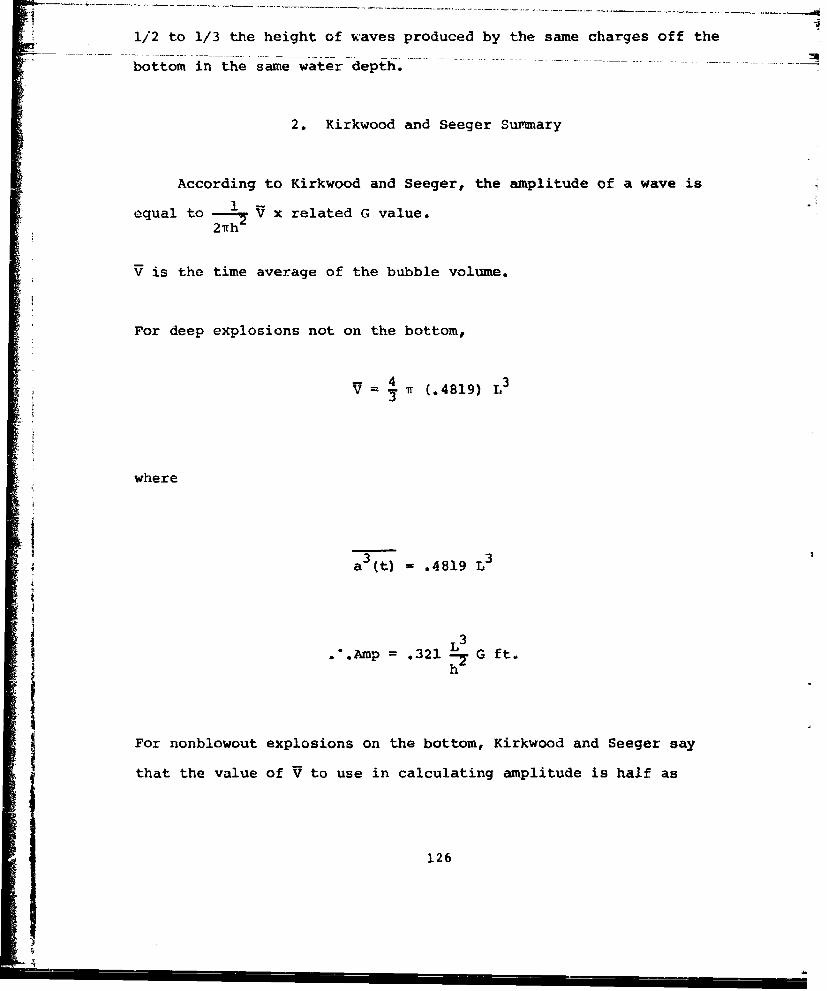
1/2 to 1/3 the height of waves produced by the same charges off the
bottom in the same water depth. .... .
2. Kirkwood and Seeger Summary
According to Kirkwood and Seeger, the amplitude of a wave is1-
equal to =1hV x related G value.
V is the time average of the bubble volume.
For deep explosions not on the bottom,
v 4i (.4819)
where
13 3a M(t .4819 L
L3
.'.Amp= .321 G ft.
For nonblowout explosions on the bottom, Kirkwood and Seeger say
that the value of V to use in calculating amplitude is half as
126
M
23lt.rge,-i.e.- ¶W.----.4#19} Si3. Henee for eharqe -on the bottom the
amplitude is
amp = .1606 - G ft.h
If charge is at a blowout depth but not on the bottom, "a better
approximation is the volume of a cylinder if a height equal to the
depth of the water and a radius slightly less than the maximum
spherical globe in an unbounded liquid," (6). Actually one should
consider the time average of the volume averaged over its life.
This is hard to do in the blowout case because we don't know the
volume mode of expansion or collapse. At any rate take the volume
expression as = h L . If L I sin ot for example, then V = .5
27rhL One could take this time average factor to be the same, i.e.,.4819. If the charge is on the bottom one could, to be consistent
with the previous calculation, assert that the volume was half what
it would be if the charge were at the same depth in deep water.
i Then
i ;hL2
- V = .4819
and
1
•: 12 7

MWW21ch
Half cylindrical on bottom.
also
1 2 3amp = -h , .4819 L G;
Half spherical on bottom.
tio spherical 2 L 4 Lcylindrical 3=
( 7L
The volume for Baker and hence the predicted wave height is
overestimated by a factor of 7 (h = 180, L = 930) by using the
spherical rather than the cylindrical expression.
3. Scaling (Impulsive, Bore, Deep, Blowout)
Surface waves in water are a gravity controlled phenomenon.
When we change from one scale to another, for example by chosing a
different charge weight, the value of gravity is unchanged. The
linear dimensions change in the ratio of n = (t_)/113 This1
128
• ' , a a go oI
includes the charge radius. charge depthý,_waterdextbhanrlsdifatar,,a--- -
Time however goes as AT in order for g to remain constant from cne
scale to another. This requires wave velocity to scale as AT.
Wave displacement and the particle velocity associated with it,
however, may have various scaling laws depending on the method of
wave formation, To see how this comes about let us start with the
case of waves produced by a downward impulsive loading of the water
surface (such as would be caused by an airburst over water). It has
been shown by the Applied Mathematical Group N.Y.U. (%1946), by
Penney (Gravity Waves, etc.) that the wave amplitude in this case is
proportional to the sixth root of the charge weight iatio. This can
be illuminated by the following simplified argument. Let the
vertical wave displacement be represented by n = A sin wt. The
particle velocity then is n = Aw cos wt. On the two scales these
velocities are equal. This is because the tmpulse to an area varies
as n and the mass of ixater affected also varies as n3. Hence all
initial velocities are the same. Note that for the initial loading
phase gravity is not a part of the process and time scales in the
same manner as distance. it is for this reason that the initial
particle velocity acquired by the water is the same on all scales.
Returning, then, to the ensuing wave notion we have,
t
Awn = Aw
129
"The wave velocity is proportional to V-ep, gravity being
uncnlanging, and hence scales as n. Hence it follows that time must
sciac-, /F. Therefore, w scales as 1 and from the above
relatio'm A scales as yE. Note that wave velocity being
proportional to wavelength times frequency requires that X scale as
n. Therefore, all lengths scale as n except the wave height which
goes as .n or w It is this very fact which allows the particle
velocities on different scales to be equal, since time also scales
as /n. For the case of impulsive loading, if the charge weight is
increased the wave amplitude increases as the square root of the
linear dimension or the sixth root of the charge weight.
If we now put the charge into the water in a blowout position,
we see that the bore forming mechanism is somewhat analogous to the
previous instance except that the loading is horizontal instead of
vertical. Water is pushed outward by the explosion gases, and the
outward velocity impulsively acquired is the same on the different
scales. This outward movement causes the bore front to form in the
same fashion as a shock front forms in a shock tube. The
conservation laws (mass and momentum only) applied to this formation
require the bore height and hence ensuing wave heights to vary as
rT, when we go from one scale to another. After the wave system is
formed, time scales as the square root of the linear scale factor as
is generally required for all gravity waves.
130

Let us now consider the nonblowout case and ask how wave ..
heights should change when charge weight is changed from one non-
blowout case to another. We take the Kirkwood and Seeger theory to
be a valid expression for wave height for this situation and can
write
3 WG (r1z1iV LG T ,zl,t)Amplitude % x related G function % h 11, Dh h h (D+33)
If we change charge weight, G is unchanged except for the effect of
W on r. Consider the critical case in which L = D and, in addition,
they both are large compared with 33. Then L3 0 , W or D4 % W and D
W or n 3/4 Let m be proportional to WI/ 4 . If depth is scaled
according to m, time as /rm, wave velocity as /r, distance as m,
then,
Amplitude m mn
We have seen that if the charges are not too large, i.e., the value
of L is limited (less than about 2), then the G function at a given
distance is proportional to T1:. G is also inversely proportional to
1r . This leads to an expression for wave height such that
I!

4 --- -- -- ----------
; .~ ~ - -.--- ... .. ... ... . ............. ... ... .....[2h r
Tih• WI/ 3
Since h W 51/3 we find that(D+33)
Hr lo m and wave heights vary as m = W at corresponding distances
for deep explosions (neglecting 33 compared with D) where W is of
the order of one ton or less. All distances scale as W1/4 and time
scales as W
* Let us now look at the blowout case or the relatively shallow
explosion in which the spherical bubble volume is to be replaced by
a cylindrical crater of radius L and depth h. In this case for
large charges we have
amplitude 2 2•3 G
h (D+ 3 3)
If G is unchanged, i.e., if T is very large and if D>>33, then
according to this, the amplitude " n / nl/3
n .*
132

If D<<33, amplitude would vary as n.
These relations aze incorrect since they are at variance with
bore scaling which is quite straightforward. They fail because the
whole postulate of a simple spherical source assumed in the Kirkwood
and Seeger development is invalidated by the interference of surface
and bottom in the blowout case. The bore scaling does not describe
the wave forming process; it merely identifies corresponding
situations and lets whatever happens on one scale repeat itself on
another. The Kirkwood and Seeger scaling for the deep explosion or
explosion at critical depth predicting wave heights as W1/ 4 at
1/4corresponding W/ distances should be correct. We note that the
cylindrical formula is consistent with wave heights and distances
* •I•scaling as W1 / 4 " However, as the depth is diminished, we expect to
go over to the bore scaling regime, and the cylindrical formula does
not give any indication as to what depth at which this occurs. It
is impossible to scale from a nonblowout case to a blowout case or
vice versa.
Scaling may then be done from one blowout case to another,
scaling wave heights as W1 /6 , other distances as W1 /3 and time as
WI/6. Scaling may also be done from nonblowout to nonblowout,
scaling wave heights as W1/4 other distances as W1/4, and time as
a s/8 Wave velocity in the one case, goes as WI/ 6 and in the other
133
A

.1 ........- sff4 t 69b gi--fowao-a - eeo- or Sal bt Sh&I&-W- Ih.
The potential energy of a cylindrically spreading wave is
proportional to the wavelength, the distance from the center and the
square of the wave height. This quantity should therefore be
proportional to the charge weight.
#2
Hence in all cases W 'v rX H2 initially. Now with bore or0Swl/3 WI/6"
impulsing loading scaling we have r nu X 0 n W H W T •
With deep explosion scaling we have r n. X 0 H v WI/ 4 . The• wI/2.
interesting thing is that in either case we have rH % W This
makes it possible to compare the shallow and deep cases at the same
charge level simply by using W1/2 for the product.
.,If the wavelength is sufficiently long that there is no
dispersion, then A0 is independent of r. If there is dispersion,
00S:• tthen X. = const x r. In one case Hrr is constant for a given
explosion. In the other, HR is constant. We have seen that in the
-• early stages of explosive wave making the waves are short enough for
dispersion to occur. Later, the waves attenuate so that if they
j achieve a constant wavelength, they may be too small to measure.
Whether there is or is not dispersion makes no difference to the
scaling laws which are determined by the wave formation process.
134

-..- S-. - --Predie1-i-r-n --W Ve ..
Knowing the charge weight, depth and water depth how can the
waves resulting from an explosion be predicted? The first step is
to compute L and determine whether the explosion is in the blowout
region or not. Figure 21 illustrates the two regimes and shows the
appropriate formula. -If the explosion is in the blowout region,
determine the value of the HR product in feet by multiplying 13.5 by
the square root of the charge weight in lbs. [This comes from
Figure 20 where HR for W = 40 Y 106 is taken as 85,000 feet 2 ± 5%].
This product will estimate the trough to crest wave height at any
chosen distance R feet, particularly if the charge is not on the
bottom. If the charge is on the bottom then the wave height
estimated by this procedure should be reduced by about one-third.
(Multiply by 2/3). If the explosion is in the nonblowout region,
one can calculate HR for this case by multiplying 4.8 by WI/ 2 . This
will estimate H for any given R for a charge in the nonblowout
regime on the bottom,,. If the charge is not on the bottom the
estimate for H should be increased by a factor of 1.5 (multiply by-
3/2).
For the nonblowout case it is also possible to make the
estimate without having recourse to previous experimental data,
through the use of the Kirkwood and Seeger theory. If the charge is
about 2000 lbs. or less, it is possible to express GTI as
proportional to T From the tables in Kirkwood and Seeger, a
135

ion -f
r " t- first-tid m (trough) and at the-
11we can write#
G Tl1min r1
and
+.66 TG lmax -r
The trough to crest height is
• 2y_•h z (-G I min + G TI• 1 M21Th r T
or
H -I. O ft.
136

* NSWCIWOL/MP 76-15
• ~1,000 •
BLOW OUT R =100
//NON BLOW OUT
100 2____1II ,_.1I •,, II0
L010R0L(13+3301/3
"400 4S R 02 . 3 CHRERDU
i 1010 FIG. 21 BUBBLE RADIUS RVS. DEPTH,0
137

iaor -much -large-r .charges thebalnie. t approaches a. maximumwihi _
shown by the extremes plotted in Figure 19. These values should be
used in the previous expression for H.
In general it may be said that the phenomena are complex, and
that the theory which deals with most of the cases is also complex
and difficult to apply in a simple manner. Predicted durations of
positive or negative phases are awkward to make but quite accurately
reflect the observations. Amplitudes on the other hand are subject
to uncertainty because of bottom interference. Estimates however
can be made with some confidence within a factor of two using ab
initio Kirkwood and Seeger calculations for the nonblowout case
(spherical volume) and for the blowout cases (cylindrical volume).
6. Correction Factor
Let the ratio of the calculated value of amplitude to the
observed value at a distance, computed by the Kirkwood and Seeger
theory, be called a correction factor. This factor becomes larger
as more of the explosive energy blows out. In Figure 22 we have
plotted the correction factor against D/L, where D is the depth of
the charge. In all cases except Baker itself the charge was
actually on the bottom. The numbers have been taken from Table 8
and elsewhere in this report. The curve may be used to adjust
calculated values to values that would be expected to be observed.
"Calculated" here means using the original spherical volume formula
138
NSWC/WOL/MP 76-15
BAKER
4
1.0<0
Lu
0
-0-- CYLINDRICAL CALCU-LAIONS
ISTMIN.+ 2ND MAX.~0 .
1- -- t- - C Y I D2A jAC L A I N
0.ABOW OU 3 OTH BR OPH RUTA
0.1 1.0 10
IL
D/L
FIG. 22 CORRECTION FACTOR VS. jD
139
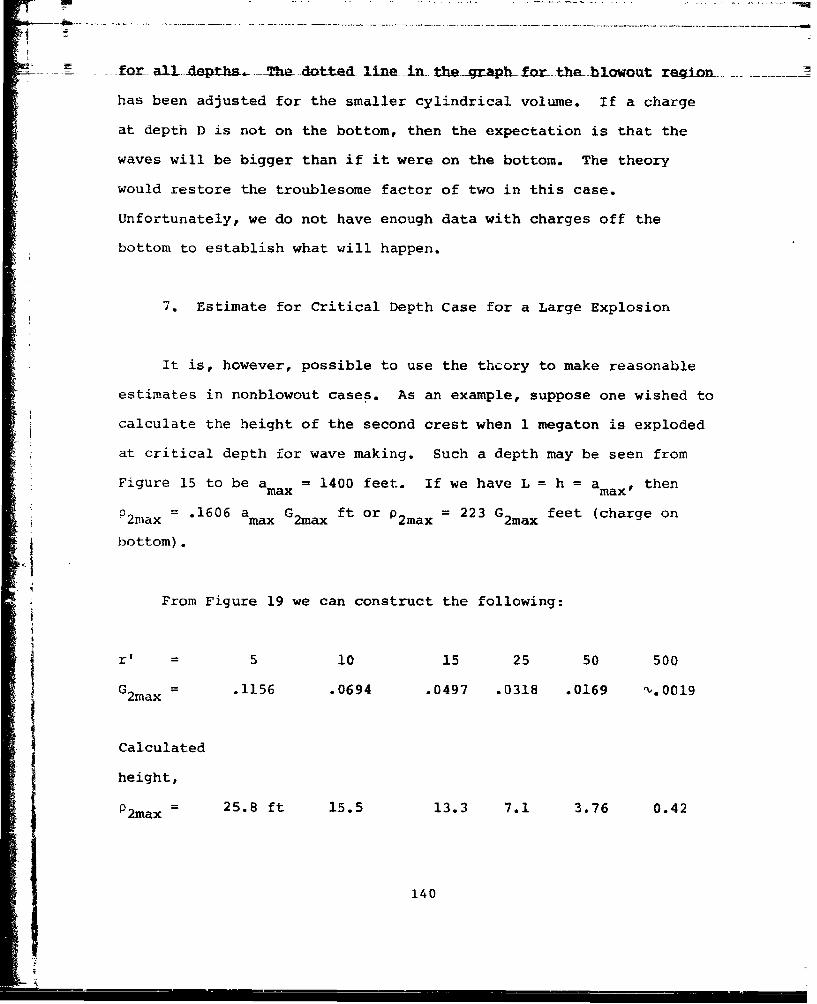
-for_ all deatha.- The_ dott.ed_ line In the -gzraph- for- thebablowont_ e n_..
has been adjusted for the smaller cylindrical volume. If a charge
at depth D is not on the bottom, then the expectation is that the
waves will be bigger than if it were on the bottom. The theory
would restore the troublesome factor of two in this case.
Unfortunately, we do not have enough data with charges off the
bottom to establish what will happen.
7. Estimate for Critical Depth Case for a Large Explosion
It is, however, possible to use the thcory to make reasonable
estimates in nonblowout cases. As an example, suppose one wished to
calculate the height of the second crest when 1 megaton is exploded
at critical depth for wave making. Such a depth may be seen from
Figure 15 to be a = 1400 feet. If we have L = h = amax, thenmax a
P2max - .1606 max G2 max ft or p2max = 223 G2max feet (charge on
bottom).
From Figure 19 we can construct the following:
r' 5 10 15 25 50 500
G2max - .1156 .0694 .0497 .0318 .0169 "'.0019
Calculated
height,
P2max - 25.8 ft 15.5 13.3 7.1 3.76 0.42
140

r = 7000 ft 14,000 21,000 35,000 70,000 700-400.-
r 1.17 2.33 3.5 5.8 11.7 116.5
nautical
miles
According to Figure 22 these calculated heights are about twice what
would be observed.
If water depth is greater than the charge depth, say >2 amax, then
the factor of 2 in the bubble volume should be restored. However,
the values of G are approximately doubled (for half the values of
r'), and the doubled depth requires division by four. Consequently,
the waves should be about the same height at the same distance
whether the charge is halfway down or on the bottom, as long as its
depth is the same neglecting additional energy absorption by the
bottom. The theory predicts that the first crest is 3 to 25% lower
than the second crest as distance increases. The available data oni the first crest are insufficient to confirm or deny this prediction.
We shall therefore take the second crest as the largest predicted
crest. Figure 22 shows that for critical depth the spherical theory
overestimates by a factor of about 2.0. Hence the wave height atI 15.5say 14,000 feet should be 15.5 x 2 (trough to crest) or 15.5
feet. This gives HR = 15.5 x 14,000 = 218,000 feet 2 which is only
2.5 times the value of the corresponding product for Baker.
However, if a megaton were placed at a depth of 2 charge radii in
water 4 radii deep, then we would have a situation exactly scaled to
141

Baker with 50 times the charge weight. The water depth would be 660
U... .eet..and the R .product would ba 85,000 x A or 600,000. We
then predict that at a given distance the wave height (trough to
crest) would be 7 times that observed at Baker and in fact nearly 3
times (2.8) higher than the same charge would produce if placed at
the "critical" depth of 1400 feet.
By arguments of this sort one can estimate the wave effects from
large explosions. It is hoped that the estimate will remain
academic!
8. Ocean Impact of an Asteroid
If a spherical asteroid of radius of say 100 feet were to crash
into the deep ocean, what sort of wave disturbance would be created?
There would, of course, be a huge splash followed by the formation
of a water crater and thereafter the production of surface 'waves.
Consider that the kinetic energy of the asteroid on impact may be
treated as the explosion of a weight of explosive (TNT) at rest
having the same energy. For example, an asteroid of radius 100
* 1 feet, specific gravity 5, and impact velocity of 7 miles/sec would
have 2.8 x 1016 ft/lbs of kinetic energy. This can be equated to
1.9 x Ibs of explosive, (1.48 x 106 ft/lbs per lb of explosive)
or very close to 10 megatons. The critical depth for such an
explosion is 2500 feet (Figure 15). The charge radius would be 362
feet. The chief uncertainty is at what depth thi energy could be
142

- ..... -- ..sidezed. releaed. This- will. depend -on -the -body - -wor--a
case would be to assume a Baker geometry. Hence the water depth will
be presumed to be at least 4 charge radii (to match Baker) or
greater than say 1500 feet deep. An estimate of the waves may then
be made by setting,
HR = 85,000 1.9 x 010/2 1.85 x 06 ft2
4 x 10 /
If R is in nautical miles, H in feet we have
HR = 307.
This also says that if a 10 megaton event were to occur,.in water
1500 feet deep the trough to crest wave height at a distance of ten
miles would be 31 feet in water of uniform depth. If such a wave
were to impinge on a beach or shore line, the resulting breaking
wave could be as much as 2 or even 3 time5 nigher depending on the
bottom contour. If the water were shallov enough so that there wereJ' 1
Sno dispersion, then the waves would fall off as 1 rather than as
R , and hence would be 40% higher at twice the distance. In other
words, if the waves got out to 10 miles at a height of 31 feet, they
143

- , could arrive at 20 miles at a height of 21 feet rather than 15.5
feet. The impact of a 10 megaton equivajen
rather local effect as far as waves are concerned on a global scale.
The trough to crest height would probably be less than ten feet at
40 miles from impact point.
1
144

REFERENCES
1. Thorade, H., "Probleme der Wasserwellen," Henri Grand, Hamburg
1931, Corrected Translation by Beach Erosion Board reproduced
(J. R. Davis, Jr.) as NOLM 5310, April, 1944.
2. Landau and Lifshitz, "Fluid Mechanics," Section 12, Pergamon
Press 1959.
3. Cauchy 1815, "Memoire sur la Theorie des Ondes," Mem. de
l'Acad. Roy. des Sciences, Paris.
4. Poisson 1816, "Memoire sur la Theorie des Ondes," Mem. de
l'Acad. Roy. des Sciences, Paris.
5. Penney, W. G., "Gravity Waves Produced by Surface and
Underwater Explosions," March 1945, Underwater Explosion
Research, Vol. II, pp. 679-693.
6. Kirkwood, J. G. and Seeger, R. J., "Surface Waves from an
Underwater Explosion," Journal of Applied Physics, Vol. 19, pp.
346-360, April 1948. Also (6a), the same paper in Underwater
- Explosion Research* Vol. II, "The Gas Globe," pp. 707-760,
containing tables of the functions G0 (r',o,t') (bottom) and
G (r',l,t') (surface) vs. reduced time for selected values of0
r These integrals had been computed by the Mathematics
Tables Project under the Applied Mathematics Panel of the
National Defense Research Committee by G. Blanch and A. N.
Lowan.
*A Compendium of British and American Reports published in 1950
by ONR; Editors, G. K. Hartmann and E. G. Hill.
145

7. Coulson, C. A., "Waves, a mathemiatical account of the common
types of wave motion," Oliver and Boyd Ltd, 1941.
8. Lamb, H., "Hydrodynamics," 6th revised edition 1932 New York,
Dover Publications, 1945.
9. Spitzer, R. W., "Production of Surface Waves by Underwater
Explosion," (Distributed and Lumped Charges) UERL draft 29 Nov
1944. WHOI
10. Charlesworth, G., "Surface Waves Produced by Firing Underwater
32-lb. charges of Polar Ammon. Gelignite at Various Depths,"
TUER Vol. II, pp. 695-700.
11. Bryant, A. R., "Surface Waves Produced by Underwater Explosion
. - Comparison of the Theory of W. G. Penney with Experimental
Results for a 32-lb charge." UER Vol. II, pp. 701-706.
12. Shiffman, M. and Friedman, B., "Studies on the Gas Bubble
Resulting from Underwater Explosions," Underwater Explosion
Research Vol. II, pp. 245-320.
13. Stoker, J. J., "Water Waves," p. 337, Interscience Publishers,
Inc., New York, 1957.
14. Focke, A. B., Naval Electronics Laboratory, San Diego, Field
Communication (1946).
15. O'Brien, M. P., University of California, Field Communication
(1946).
16. "The Effects of Atomic Weapons" June 1950. U.S. Govt. Printing
Office, Washington, 25, D.C.
146
APPENDIX A
Gravity waves in cylindrical coordinates. The argument is
reproduced here because it is difficult to find in one place.
Assume cylindrical symmetry. V 42 0, where • velocity potential
or
2~ +~ + 0dr r 7
Assume separation of variables,
then =RZ
=Jo(kr) (Aekz + Be-kz
"Chose origin in rigid bottom. Depth of water h.
Boundary conditions:
At the bottom, (1) (•)z=0 0
147

'1 Bernoullis equation, neglecting the square of the particle velocity,
is
S-- a - g(z-h)P t
This equation comes from integrating Euler's equation of motion.
2At the surface, (2) ( + g 0 i.e., pressure at
az zhsurface is constant.
The first boundary condition requires A = B.
Hence 4(r,z) = A1 J (kr) cosh kz, where A1 2A.
2TWTry 41r,z,t) = A1 J (kr) cosh kz cos wt; where t o
Then second boundary condition gives
22 = gk tanh kh
to interpret k, note that if kh is small, we have w = gk2 h
or (7j V) 2 = gk 2h
Ik = -- if V = gh as is known for shallow water waves.
148

-- --- - -
- -. Tofind diplacemen a.mpiJtUde c-r at..any. Point,a, . - .,
A1 k J (kr) sink kz cosw t.
.• kJ 0 (kr)or C -A k sinh kz sin wta
at C=n, (Surface amplitude) z=h,
=-A k J (kr)0 sinh kh sin wt
From Bernoullis equation,
- -- _ A J (kr) cosh kz sin wt - g(z-h).
The static pressure at any point z is p0 + pg (h-z)
jHence excess pressure due to waves at any point z is
p - w A J (kr) cosh kz sin wt
P1 0
149

Combining expressions for Ap and Y, we find:
cosh khpg cosh kz
If we write API p i.e, pressure in linear units, n in
P ie
linear units.
l cosh kh£cosh Tz
If lApi is measured on the bottom where z=o, we have the simple
relation, n = fApj cosh kh which holds for a train of cylindrical or
27rplane waves of wavelength X -
150
El -h

- -- - - ..-- ..-- --.. - ------*--~f .-- -- --
APPENDIX B
Energy in surface waves. [Ref. (8), p. 369]
2 2Kinetic + Potential energy per unit area = ft lb/ft
where a = surface amplitude; p = 2 slug/ft ; g = 32 ft/sec
The area covered by this is that covered by the wave whose amplitude
is a. It is necessary therefore in computing the total wave energy
to know how many waves there are, their wavelengths and their
amplitudes. Since we do not have a measurement of the wave pattern
everywhere at the same instant, we will take the pattern as it
passes a point of observation, namely pole 16, Shot 4 Solomons.
There we find that six major waves went by followed by about six
smaller waves. The first positive disturbance arrived at the pole
2140 feet from the explosion after approximately 60 seconds. Hence
its average velocity was about the same as the shallow water wave
velocity for very long waves tv'Iff = 36 ft/sec). We shall assume
this velocity in order to estimate the wavelengths.
E/Area 2 x 32 a2 2 f... -a= .222a ft lbs/ft 2
(a in inches).
151
• A:• .. .• ....... T '' ... .. ~ '..... '

:1
-r• 0 Ln
!: ,,, •.,;,4 ,- <.,M LA n N 0
I * t * 0 v-I
x
%0 0% CD.
A %0
x
koin) 0D 14D wO % 0 a
to a -I ; aý H- (AIn t, N , 'I
i-
Ln C> t 0 in
tnto% C14 r 4 N
C4
n - 4 C 0in 1 o en , ,-
0
o Lo WD
0; 0; C1 ýj c -1 %!
.4-)
4 0 a (A M 40 1'
• -4 0 ON- 0 6 0 0CU0 N ')In m4 -
44 4-4
4o o 0M N(a-1 4 m N O x '4
1.4 C14 C')*
U)~( 4-)UN
01% 4 41
-I 0 4.x0 0)
_• 15 2

~. .. . ....... .. ..
----- Tckta1 w.av-e-ýery- -in -1~2 waveas- ~-tm-
Charge wt of 46,000 lbs has total energy of 46,000 x 1.48 x 10 6
ft/lbs. or 68,000 x 10 6 .
. Total wave energy is approx 143.8 .21% of total energy.61006
A similar calculation for Shot 2 at pole 12:1007 ft. from 6700 lbs.
1I•
153
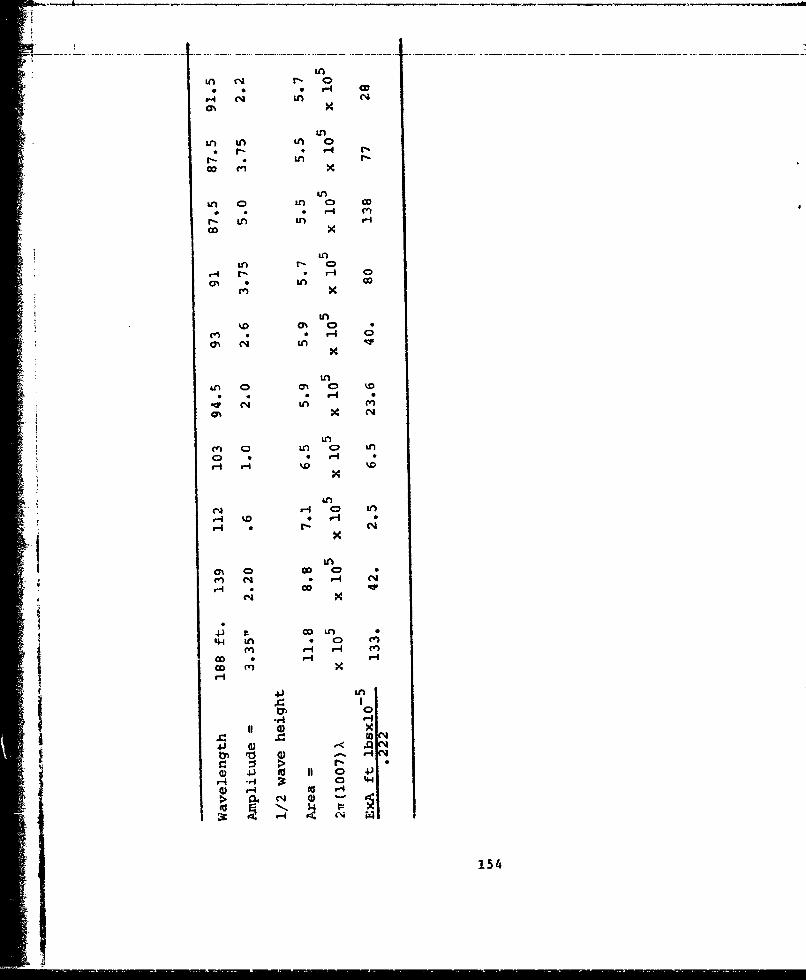
CID
LIA
IA in IA 0ýI- * N
It,
r: N4 0 .
L* en D
(4 inO
in%.0 4~0 *
Ito
40 0l OL' 0 4
v,0 IA 0) IA
C-4 H0 '.0'
vr-4 * 4-
in0
(4 OD (~
44-) co IAIw n * 0 nv
U) * -r-I
OD C"
4-) LA
tp 0
C r441 4) < Q r
> N-
H .-4 <D0 I44
154
. . Total wave energy in 10 waves - 571 x Io5 ft/lbs x .222 127 x 105
ft/lbs.
Total energy is 6700 x 1.48 x 106 ft/lbs.
Fratio inwavs -127 x15Fraction in waves - or .127% of total energy.
1010"The Effects of Atomic Weapons" (16) 102, finds the wave energy
S, ~~~~~~~p. 12 id h aeeeg
at Baker to be between 0.3 and 0.4 percent of the nominal (20 kt)
energy.
The fraction of the total energy which goes into wave making is
so small that it is perhaps not surprising to find large changes in
this fraction with small changes in depth. The estimates made here
for Solomons' Shots 2 and 4 are not accurate but do indicate the
"same order of magnitude as found at Baker with a progressively
larger fraction of the energy going into waves as the relative depth
is diminished.
155

APPENDIX C
Dispersive Medium - Yes & No?
If A >> 27h, then the velocity of all such waves is equal to
gh and this is their maximum velocity. All such wavelengths travel
at this same velocity and hence the medium is nondispersive.
However, if A is not >> 2irh, i.e., if X is of order of 2xh (or less
than 2-h) than the longer waves travel faster than the shorter
waves. If wavelength is small or water is deep, then V2 =
medium is dispersive. Consider three successive peaks in a wave
system, travelling from left to right in deep water.
If the distance from I to 2 is greater than from 2 to 3, the
peaks 1 and 2 will separate faster than 2 and 3 because the
wavelength and hence velocity associated with 1 and 2 are greater
than those associated with 2 and 3.
If a set of waves starts out with a large wavelength or
separation between the first few peaks, and a small separation
between the later peaks, then the first ones should separate from
the later ones. If a set of waves all have the same wavelength,
then they should travel at the same speed and not show a growing
separation. If we start out with a group of different wavelengths,
then the longer ones will separate from the shorter ones, provided
they all are comparable to 2rh or less. All of these remarks are
contained in the expression for wave velocity,
156

-- 3 --- tanh'
where X = wavelength, and h = water depth. This expression holds
for plane waves or cylindrically spreading waves, and is a result of
the linear wave equation derived from neglecting the square of the
particle velocity in the equation of motion. It holds for wave
* amplitude small compared with water depth, and assumes that the
upward component of the acceleration of the water particles has a
negligible effect on the pressure due to the wave which depends only
on the wave amplitude. The expression does hold for the "shallow
water" case as well as for the deep water case, i.e., for the
nondispersive case and the dispersive case. The expression is in
fact the arbiter of the choice.
If 27h is small, then tanh 2¶h - T
Hence V = v%/ for X large compared with h.
If is large, then tanh -7 ÷ I 1.
Hence V =- for h large compared with X.
The latter is called the deep water case. The former is called the
shallow water case (even when it refers to tides in the ocean).
157

NSWC/WOLIMP 76-15
-. . . .. . . . . . . . . A P P E U D I-X - D - - - - --.... . ..... ... .. ... ... . . . ....
Maximum and Minimum Values of G and Durations on the Bottom asa Fcn of T', or Table Showing Influence of Bubble Period
on Amplitude and Duration.'Go 0(r',ot'm) Duration T
Maximum Minimum Maximum MinimumI 1st 2nd ist 2nd ist 2nd 1st 2nd
.059 .0018 .0042 -. 0047 -. 0025 5.05 2.90 3.82 2.26
.1 .0029 .0071 -. 0079 -. 0042 5.05 2.91 3.81 2.26
.2 .0059 .0142 -. 0158 -. 0084 5.05 2.90 3.87 2.26
.3 .0088 .0213 -. 0237 -. 0125 5.15 2.90 3.82 2.29
.4 .0117 .0282 -. 0315 -. 0165 5.26 2.90 3.75 2.28
.5 .0146 .0351 -. 0393 -. 0205 5.25 2.90 3.81 2.28
.6 .0175 .0419 -. 0469 -. 0244 5.30 2.91 3.81 2.27
.7 .0203 .0486 - 0545 -. 0281 5.34 2.91 3.82 2.28
.•8 .0232 .0551 -. 0620 -. 0318 5.39 2.91 3.82 2.28
.9 .0260 .0615 -. 0694 -. 0352 5.44 2.91 3.82 2.281.0 .0288 .0676 -. 0766 -. 0386 5.48 2.92 3.83 2.281.1 .0315 .0736 -. 0837 -. 0417 5.53 2.92 3.83 2.28
.0858 .0311 -. 0988 -. 0296 6.98 2.09 3.76 2.61
r' = 0
.059 .0008 .0027 -. 0025 -. 0021 10.35 3,37 4.49 2.73
.1 .0014 .0046 -. 0042 -. 0036 10.35 3.37 4.48 2.74.2 .0028 .0091 -. 0084 -. 0071 10.41 3.37 4.47 2.79.3 .0042 .0136 -. 0125 -. 0106 10.46 3.37 4.47 2.73.4 .0055 .0180 -. 0166 -. 0142 10.51 3.37 4.47 2.73.5 .0069 .0224 -. 0207 -. 0175 10.56 3.37 4.47 2.73.6 .0083 .0268 -. 0247 -. 0209 10.60 3.37 4.48 2.73.7 .0097 .0311 -. 0288 -. 0242 10.65 3.37 4.48 2.72.8 .0111 .0354 -. 0328 -. 0274 10.69 3.38 4.49 2.68.9 .0124 .0396 -. 0368 -. 0305 10.74 3.37 4.49 2.73
1.0 .0337 .0437 -. 0407 -. 0336 10.79 3.37 4.49 2.731.1 .0150 .0476 -. 0447 -. 0365 10.83 3.37 4.50 2.73
- .0495 .0315 -. 0645 -. 0301 12.59 2.66 4.27 2.83
V - 15
.059 .0005 .0019 -. 0017 -. 0017 15.55 3.66 4.98 3.08
.1 .0009 .0032 -. 0028 -. 0028 15.50 3.70 5.03 3.07
.2 .0018 .0064 -. 0055 -. 0056 1S.60 3.70 4.98 3.07
.3 .0027 .0096 -. 00A3 -. nnf4 15.65 3.69 4.99 3.06
.4 .0035 .0128 -. 0110 -. 0111 15.70 3.70 4.98 3.07
.5 .0044 .0160 -. 0137 -. 0138 15.75 3,72 4.97 3.05
.6 .0052 .0191 -. 0164 -. 0164 15.79 3.72 4.98 3.06
.7 .0061 .0222 -. 0191 -. 0190 15.84 3.71 4.99 3.05
.8 .0069 .0252 -. 0218 -. 0216 15.09 3.72 4.98 3.06
.9 .0078 .0282 -. 0244 -. 0241 15.93 3.73 4.98 3.061.0 .0086 .0312 -. 0271 -. 0266 15.98 3.74 4.98 3.051.1 .0095 .0340 -. 0297 -. 0290 16.03 3.74 4.98 3.05
Co .0349 .0274 -. 0484 -. 0265 18.01 3.03 4.69 3.09
r' 25
.059 .0004 .0012 -. 0009 -. 0011 27.70 4.25 5.84 3.54
.1* .0006 .0021 -. 0016 -. 0019 25.75 4.26 5.82 3.52
.2 .0011 .0040 -. 0932 -. 0037 25.80 4.21 5.82 3.55
.3 .0016 .0061 -. 0048 -. 0055 25.80 4.21 5.86 3.56
.4 .0021 .0081 -. 0063 -. 0073 25.87 4.23 5.83 3.56.5 .0026 .0100 -. 0079 .0090 25.90 4.22 5.86 3.56
.6 .0031 .0120 -. 0095 -. 0108 25.95 4.22 5.86 3.55
.7 .0036 .0139 -. 0110 -. 0125 25.98 4.25 5.87 3.54
.8 .0041 .0158 -. 0126 -. 0142 26.03 4.24 5.87 3.55
.9 .0046 .0176 -. 0141 -. 0159 26.08 4.23 5.87 3.561.0 .0050 .0195 -. 0156 -. 0176 26.13 4.27 5.86 3.531.1 .0055 .0213 -. 0171 -. 0192 26.18 4.24 5.86 3.56
.0220 .0207 -. 0322 -. 0207 28.62 3.55 5.36 3.51
158

APPENDIX D (Continued).
Maximum and Minimum Values of G and Durations on the Bottom asa Fcn of T', or Table Showing Influence of Bubble Period
on Amplitude and Duration.
G G,1'(r',ot' M) Duration T
M Max [m• Mnimum Maximum MinimumT ist 2nd 1st 2nd ist 2nd Ist 2nd
r' 50
.059 .0001 .0006 -. 0004 -. 0006 51.15 5.20 7.05 4.35
.1 .0002 .0010 -. 0007 -. 0010 51.20 5.10 7.05 4.35
.2 .0005 .0019 -. 0014 -. 0019 51.25 5.20 7.02 4.29
.3 .0007 .0029 -. 0021 -. 0029 51.30 5.20 7.03 4.32
.4 .0009 .0038 -. 0028 -. 0038 51.35 5.20 7.00 4.35
.5 .0011 .0047 -. 0035 -. 0047 51.50 5.20 6.90 4.33
.6 .0013 .0056 -. 0042 -. 0057 51.45 5.20 7.00 4.33
.7 .0015 .0066 -. 0049 -. 0066 51.50 5.21 7.00 4.33
.8 .0017 .0075 -. 0055 -. 0075 51.50 5.21 7.05 4.32
.9 .0019 .0084 -. 0062 -. 0084 51.57 5.22 7.03 4.331.0 .0021 .0093 -. 0069 -. 0093 51.63 5.22 7.02 4.321.1 .0023 .0102 -. 0075 -. 03.02 51.65 5.23 7.05 4.31
.0117 .0130 -. 0181 -. 0132 54.61 4.40 6.53 4.25
r'-500
.1 .00001 .00006 -. 00004 502.90 10.65 14.70
.2 .00002 .00012 -. 00008 503.25 10.70 14.35
.3 .00003 .00017 -. 00012 503.23 10.70 14.40
.4 .00005 .00023 -. 00016 503.30 10.75 14.35
.5 .00006 .00029 -. 00019 503.35 10.65 14.45
.6 .00007 .00035 -. 00023 503.40 10.70 14.40
.7 .00008 .00040 -. 00027 503.50 10.65 14.40
.8 .00009 .00046 -. 00031 503.60 10.70 14.30
.9 .00010 .00051 -. 00035 503.65 10.65 14.35:1.0 .00011 .00057 -. 00038 503.65 10.60 14.40
1.1 .00012 .00063 -. 00042 503.65 10.68 14.42- .001Z8 .00177 -. 00211 510.18 13.34
i
15

Lockheed Missiles and Space Company Dr. William Q. Jeffers
320 Logue Avenue Senior Scientist
Mountain View, CA 94040 McDonnell Douglas
Attn: Dr. William F. Whitmore Research LaboratoriesP.O. Box 516
Martin Marietta Aerospace St. Louis, MO 63166
Orlando DivisionPost Office Box 5837 Dr. John F. Moore
Orlando, FL 23805 1121 Denmark Road
Attn: Mr. T. E. Dolan Plainfield, N.J. 07062
Martin Marietta Aerospace Mr. John A. Saxten
1800 K Street NW 135 Via Concha
Washington, DC 20006 Aptos, CA 95003Attn: Mr. J. Sullivan
Professor Jerome Smith
U.S. Naval Institute Associate Professor
Annapolis, mD 21402 Aeronautical EngineeringPrinceton University
National Academy of Sciences Princaton, NJ 08540
2101 Constitution Ave NW
Washington, DC 20418 Goodyear Aerospace Corporat? on
Attn: Lee Hunt 1210 Massillon DriveAkron, OH 44315
National Academy of Sciences Attn: W. F. JC.Anson
Naval Studies Board21st and Pennsylvania Ave Gould, Inc.
Washington, DC 20418 Advanced Technology 3roup18901 Euclid Avenue
Director Cleveland, OH 44117
Naval Eistorical Center Attn: T. E. Lynch
Washington Navy YardWashington, DC 20390 Harry Diamond Laboratories
"Attn: VADM E. Hooper (AMXDO-SAB)Washington, DC 20438
VADM Frederick L. Ashworth, USN Attn: M. B. Ginsberg
Sunlit HillsRoute #3 Honeywell, Inc.
P.O. Box 90T 600 N. 2nd Street
Santa Fe, NM 87501 Hopkins, N21 55343Attn: J. 0. Voss
RADM Alexander S. Goodfellow, USN409 First Street I. E. DuPont De Nemours & Co. Inc.
Coronado, CA 92118 Wilmington, DE 19898Attn: L. 14. Ma~gner
Dr. William B. Graham
Head, Engineering Sciences Dept. Lockheed Ocean Laboratory
RAND Corporation 3380 N. Harbor Drive
1700 Main Street San Diego, CA 92101
Santa Monica, CA 904Q6 Attn: RADM L. D. Coates, USN (Bet)
DISTRIBUTION (Continued)
Presearch, Inc. Commandant8720 Georgia Avenue Naval District WashingtonSilver Spring, MD 20910 Washington Navy YardAttn: G. L. Brubaker Washington, DQ 20390
T. C. CoxJ. R. Penny Applied Research LaboratoriesCAPT D. E. Hihn, USN (Ret) The University of Texas at Austin
P.O. Box 8029The Rand Corporation Austin, TX 787121700 Main Street Attn: Dr. C. M. McKinneySanta Monica, CA 90406 B. F. WeissAttn: Dr. M. M. Balaban
J. W. Higgins ABINC Research CorporationDr. J. E. Neufer 2551 Riva Road
Annapolis, MD 21401Government Plans and Attn: F. C. Townley
Systems DevelopmentRCA Corporation (108-113) Automation Industries: Inc.Borton Landing Road & Marne Highway Vitro Laboratories DivisionMoorestown, NJ 08057 14000 Georgia AvenueAttn: BGEN F. P. Henderson, USMC (Ret) Silver Spring, MD 20910
Attn: CAPT N. B. Atkins, USN (Ret)Leland Stanford Junior University
SStanford University Bendix Corporation7100 Serra Street Electrodynamics DivisionStanford, CA 94305 11600 Sherman WayAttn: Drw D. B. DeBra North Hollywood, CA 91605
Attn; F. GeldertThiokol Chemical CorporationElkton Division Bendix CorporationElkton, MD 21921 1730 K Street, NWAttn: 0. D. Reed Washington, DC 20006
TRACOR, Inc. Attn: F. L. Lundquist
6500 Tracor Lane Burroughs CorporationAustin, TX 78721 P.O. Box 517Attn: D. R. Sanders GVL - DS&SSG
Paoli, PA 19301TRACOR Marine, Inc. Attn: R. M. TillmanP.O. Box 13107Port Everglades, FL 33316 Booz-Allen Applied Research, Inc.Attn: Dr. M. L. Collier 4733 Bethesda Avenue
Bethesda, MA 20014U.S. Steel Corporation Attn: C. F. Willard600 Grant Street, Rm 2175Pittsburga, PA 15219 Edo CorporationAttn: M. A. Burcllo 2001 Jefferson Davis Highway
Arlington, VA 22202Commandant Attn: R. N. Flath15th Naval DistrictFPO New York 09580
2

DISTRIBUTION (Continued)
General Electric Company CommandantP.O. Box 1122 5th Naval DistrictFarrell Road Plant, Bldg 1, Rm M8 Norfolk, VA 23511Syracuse, NY 13201Attn: F. G. Spann Commandant
6th Naval DistrictCommandant Industrial College Naval Base
of the Armed Forces Charleston, SC 29408Fort Lesley J. McNairWashington, DC 20315 Commandant
8th Naval DistrictOfficer in Charge New Orleans, LA 70146Naval Air ReserveASW Tactical School CommandantNaval Air Station 9th Naval DistrictWillow Grove, PA 19090 Building 1
Great Lakes, IL 60088Commanding OfficerNaval Air Reserve Unit CommandantNaval Air Facility 10th Naval DistrictWashington, DC 20390 FPO New York 09551
Commanding Officer CommandantSj Naval Amphibious School, Little Creek 11th Naval District
Naval Amphibious Base San Diego, CA 92132Norfolk, VA 23521
CommandantCommanding Officer and Director 12th Naval DistrictAtlantic Fleet ASW Tactical School Treasure Island, Building 1Norfolk, VA 23511 San Francisco, CA 94130
Commanding Officer Commandanti Fleet Anti-Submarine Warfare School 13th Naval DistrictSan Diego, CA 92147 Seattle, WA 98115
Director Naval Weapons CommandantEngineering Support Activity 14th Naval District
* Washington Navy Yard Box 110Washington, DC 20390 FP0 San Francisco 96610
Commandant Commander Hawaiian Sea Frontierist Naval District Box 110495 Summer St. FP0 San Francisco 96610I Boston, MA 02210
Commander Western Sea FrontierCommandant Treasure Island3rd Naval District San Francisco, CA 94130Flushing and Washington Ayes.Brooklyn, NY 11251 Commander Amphibious Force
U.S. Pacific FleetCommandant San Diego, CA 921554th Naval DistrictPhiladelphia, PA 19112
3

DISTRIBUTION (Continued)
Commander CommandantAntisubmarine Warfare Force Armed Forces Staff CollegeU.S. Pacific Fleet Norfolk, VA 23511FPO San Francisco 96610
Commanding OfficerCommander Fleet Intelligence Center, EuropeU.S. Naval Forces, Japan Box 18, Naval Air StationFP0 Seattle 98762 Jacksonville, FL 32212
Commander Commanding OfficerU.S. Naval Forces, Korea Fleet Weather FacilityAPO San Francisco 96301 Washington, DC 20390
Deputy Commander Operational Test Commander in Chiefand Evaluation Force, Pacific U.S. Pacific Fleet
Naval Air Station, North Island FPO San Francisco 96610San Diego, CA 92135
Commander, Amphibious TrainingCommander Mine Flotilla 3 Command, U.S. Atlantic FleetU.S. Pacific Fleet Naval Amphibious Base, Little CreekFPO San Francisco 96601 Norfolk, VA 23521
Commander Amphibious Group 1 Commander Amphibious ForceFPO San Francisco 96601 U.S. Atlantic Fleet?• Norfolk, VA 23520
Commander Submarine Squadron 1
*FF0 San Francisco 96601 Commander Antisubmarine Warfare ForceU.S. Atlantic Fleet
Commander Fleet Air Wing 1 Norfolk, VA 23511FPO Seattle 98768
Commanding GeneralCommander Fleet Air Wing 2 Fleet Marine Force, AtlanticFPO San Francisco 96601 Norfolk, VA 23511
Commander Fleet Wing 10 CommanderFPO San Francisco 96601 Mine Warfare Force, U.S. Navy
Charleston, SC 29408DirectorInstitute for Defense Analyses Commander400 Army-Navy Drive Mine Warfare Command, U.S. NavyArlington, VA 22202 Charleston, SC 29408
V Chief of Research and Development Commander Naval Air ForceDepartment of the Army U.S. Atlantic FleetWashington, DC 20315 Naval Air Station
Norfolk, VA 23511Commander Army Material Systems
Analysis Agency Commander Operational Test andAberdeen Proving Ground, MD 21005 Evaluation Force
Norfolk, VA 23511
441
Commander Service Force Commanding OfficerU.S. Atlantic Fleet Naval Coastal Systems LaboratoryNorfolk, VA 23511 Panama City, FL 32401
Attn: G; GouldCommander Submarine Force Undersea Warfare Research andU.S. Atlantic Fleet Development Planning CouncilNorfolk, VA 23511
Commanding OfficerCommander, Naval Inshore Naval Torpedo Station
Warfare Command, Atlantic Keyport, WA 98345Naval Amphibious Base, Little CreekNorfolk, VA 23521 Commander
Naval Undersea CenterCommander Submarine San Diego, CA 92132
Development Group 2, Box 70 Attn: Undersea Warfare Research andNaval Submarine Base, New London Development Planning CouncilGroton, CT 06340
Commanding OfficerCommander Mine Squadron 10 Naval Underwater Systems CenterU.S. Atlantic Fleet Newport, RI 02840FPO New York 09501 Attn: Undersea Warfare Research and
Development Planning CouncilCommander Submarine Squadron 4U.S. Atlantic Fleet CommanderFPO New York 09501 Naval Undersea Center
3202 E. Foothill BoulevardCommander, Nuclear Weapon Pasadena, CA 91107Training Group, PacificNaval Air Station, North Island CommanderSan Diego, CA 92135 Naval Weapons Center
China Lake, CA 93555CommanderNaval Ship Research and Commanding Officer
Development Center Naval Weapons StationBethesda, MD 20034 Yorktown, VA 23491Attn: Undersea Warfare Research and
Development Planning Council Officer in ChargeNavy Tactical Doctrine Activity
Commanding Officer Washington Navy YardNaval Ship Research and Washington, DC 23090
Development CenterAnnapolis, MD 21402 Defense Documentation Center
Cameron StationCommander in Chief Alexandria, VA 22314 12U. S. Naval Forces, Europe
FPO New York 09510

. .. . . . . . - . . . . . . . . . . . .. ................ .
U.S. Liaison Officer to Supreme Commanding OfficerAllied Commander, Atlantic Naval Ammunition Depot
Norfolk, VA 23511 Colts Neck, NJ 07722
U.S. National Military Commanding OfficerRepresentative Naval Ammunition Depot
Supreme Headquarters Hawthorne, NV 89415Allied Powers, EuropeAPO New York 09055 Commanding OfficerAttn: US DOCO Naval Ammunition Depot
FPO San Francisco 96612Commander in ChiefU.S. Atlantic Fleet Commanding OfficerNorfolk, VA 23511 Naval Civil Engineering Laboratory
Port Hueneme, CA 93043Commander Second FleetNorfolk, VA 23511 Commander
Naval Electronics Laboratory CenterCommander Sixth Fleet San Diego, CA 92152FPO New York 09501 Attn: Undersea Warfare Researrh and
Development Planning CouncilCommander Seventh FleetFPO San Francisco 96601 Commanding Officer
Naval Explosive Ordnance DisposalSI Commanding Officer Facility
Fleet Intelligence Center, Atlantic Indian Head, MD 20640Norfolk, VA 23511
Officer in ChargeCommandant Naval Mine Engineering FacilityNational War College Yorktown, VA 23491Washington, DC 20305
CommanderCommanding Officer, Naval Reserve Naval Oceanographic OfficeOfficer Corps Training Unit Washington, DC 20390University of Kansas Attn: Undersea Warfare Research andLawrence, KS 66044 Development Planning Council
Director of Central Intelligence Commanding OfficerWashington, DC 20505 Naval Ordnance Station
Louisville, KY 40214DirectorDefense Intelligence Agency Commanding OfficerWashington, DC 20301 Naval Ordnance Systems SupportC d a i e nOffice, AtlanticCommander, Naval Air Development Bldg. 62, Norfolk Naval Shipyard
Center, Johnsville Portsmouth, VA 23T09SWarminst er, PA18T
Attn: Undersea Warfa•re Research andDevelopment Planning Council
%6

fV ~ ~~ ~.. .... .. ......................
DISTRIBUTION (Continued)
Director CommandantNaval Research Laboratory U.S. Army Engineer SchoolWashington, DC 20375 Combat and Training DevelopmentAttn: Undersea Warfare Research and Concepts and Studies Division
Development Planning Council Fort Belvoir, VA 22060
Commander, Naval Safety Center DirectorNaval Air Station Ordnance Research LaboratoryNorfolk, VA 23511 Pennsylvania State University
State College, PA 16801Commanding Officer Attn: Undersea Warfare Research andNaval Intelligence Support Center Development Planning Council4301 Suitland RoadWashington, DC 20390 Director
Scripps Institute of OceanographyCommander P.O. Box 1529Naval Ship Engineering Center La Jolla, CA 92037Prince George's Center Attn: Undersea Warfare Research andHyattsville, MD 20782 Development Planning Council
Commander in Chief DirectorDOX, Headquarters SAC Defense Advanced Research ProjectsOffutt Air Force Base Agency/TTONebraska 68113 1400 Wilson Boulevard
Arlington, VA 22209CommanderArmy Materiel Command Director
* Washington, DC 20315 Woods Bole Oceanographic InstituteWoods Hole, MA 02543
Commanding General Attn: Undersea Warfare Research andArmy Munitions Command Development Planning douncnlPicatinny Arsenal, Bldg 62N
Dover, NJ 07801 Superintendent, Naval AcademyAnnapolis, MD 21402
Commandant* U.S. Coast Guard Superintendent
400 Seventh Street, SW Naval Postgraduate SchoolI Washington, DC 20591 Monterey, CA 93940
Commanding General, Marine Corps Commanding OfficerDevelopment and Education Command Naval School Explosive Ordnance
(Mobility and Support Division) DisposalSQuantico, VA 22134 Indian Head, MD 2064o0I
Director Commanding OfficerApplied Physics Laboratory Fleet and Mine Warfare Training CenterUniversity of Washington Charleston, SC 29408Seattle, WA 98105Attn: Undersea Warfare Research Comnanding Officer
and Development Planning Naval Training Device CenterCouncil Orlando, FL 32813
7

I R . .. .o.. . . . .................
President CommanderNaval War College Naval Air Systems CommandNewport, RI 02840 Washington, DC 20360
Attn: AIR-530Director AIR-5305A (L. E. Wheat)Defense Research and EngineeringDepartment of Defense CommanderWashington, DC 20301 Naval Electronic Systems Command
Washington, DC 20360Assistant Secretary of Defense
(Systems Analysis) CommanderDepartment of Defense Naval Sea Systems CommandWashington, DC 20301 Washington, DC 20360
SEA-0332 I SEA-09G32 2Assistant Secretary of the Navy Director and Chief
(Research and Development) Center for Naval AnatysesNavy Department 1401 Wilson BoulevardWashington, DC 20350 Arlington, VA 22209Attn: Dr. Sam Kosloff Attn: Dr. J. R. Pipal
Director of Navy Laboratories Project ManagerCrystal Plaza Bldg. 5 Deep Submergence Systems Project
Department of the Navy Department of the NavyWashington, DC 20390 6900 Wisconsin Avenue
Chevy Chase, MD 20015Oceanographer of the NavyThe Madison Building Officer in Charge732 North Washington Street Strategic Analysis Support GroupAlexandria, VA 22314 Applied Physics LaboratoryAttn: W. H. Hymes Silver Spring, MD 20910
Chief of Naval Operations DirectorNavy Department Strategic Systems Project OfficeWashington, DC 20350 Washington, DC 20390Attn: Mine Desk
Library BranchChief of Naval Material Technical Information CenterSNavy Department U.S. Army Engineer Waterways ExperimentWashinvton, DC 20350 Stationi Vicksburg, Mississippi 39180i Project ManagerMine Warfare Project (PM-13) Defense Nuclear AgencyDepartment of the Navy Washington, DC 20305Washington, DC 20360
New York UniversityChief of Naval Research 360 Lexington Avenue800 North Quincy Street New York 10017Arlington, VA 22217Attn: Chief Scientist (ONR-102)
8