SWAN Continuous Water Quality Monitoring Cuyler Smith 1 1 1 11 1 1 1 11 11 0 0 0 0 0 0 0 0 0 0 00 0...
16
SWAN Continuous Water SWAN Continuous Water Quality Monitoring Quality Monitoring Cuyler Smith Cuyler Smith 1 1 1 1 1 1 1 1 1 1 1 1 0 0 0 0 0 0 0 0 0 0 0 0 0 0 0 0 1 1 1 1 1 0 0 0 0 0 0 0
-
Upload
gabriella-wilkinson -
Category
Documents
-
view
230 -
download
1
Transcript of SWAN Continuous Water Quality Monitoring Cuyler Smith 1 1 1 11 1 1 1 11 11 0 0 0 0 0 0 0 0 0 0 00 0...
SWAN Continuous Water SWAN Continuous Water Quality MonitoringQuality Monitoring
Cuyler SmithCuyler Smith
11 1
1 11
1
11 1
11
00
0
0
0
00
0
00
00
0
000
1111
1
000
000
0

OverviewOverview
Brief summary of projectBrief summary of project How we handle project dataHow we handle project data WorkaroundsWorkarounds Remaining issues or problemsRemaining issues or problems QuestionsQuestions

Project SummaryProject Summary Water Quality at SWANWater Quality at SWAN
Core ParametersCore Parameters• Temperature, pH, DO, Temperature, pH, DO,
Conductivity, TurbidityConductivity, Turbidity
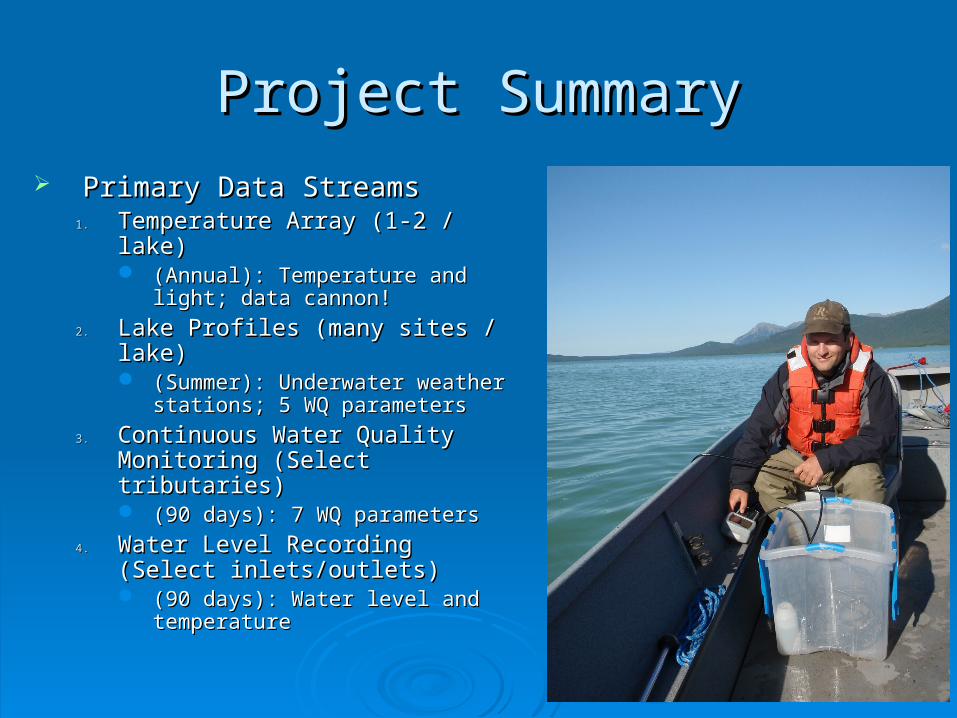
Primary Data StreamsPrimary Data Streams1.1. Temperature Array (1-2 / lake)Temperature Array (1-2 / lake)
(Annual): Temperature and light; (Annual): Temperature and light; data cannon!data cannon!
2.2. Lake Profiles (many sites / lake)Lake Profiles (many sites / lake) (Summer): Underwater weather (Summer): Underwater weather
stations; 5 WQ parametersstations; 5 WQ parameters
3.3. Continuous Water Quality Continuous Water Quality Monitoring (Select tributaries)Monitoring (Select tributaries) (90 days): 7 WQ parameters(90 days): 7 WQ parameters
4.4. Water Level Recording (Select Water Level Recording (Select inlets/outlets)inlets/outlets) (90 days): Water level and (90 days): Water level and
temperaturetemperature
Project SummaryProject Summary

Example: Lake ClarkExample: Lake Clark
3rd largest lake in the NPS, behind Naknek Lake (KATM) and Yellowstone Lake.

Scale of Data: Lake Clark in 2010Scale of Data: Lake Clark in 2010
Middle Basin Temperature Array:Middle Basin Temperature Array: 11 temperature thermistors logging hourly 11 temperature thermistors logging hourly
year round x 24 hrs / day x 365 days = 96,360 year round x 24 hrs / day x 365 days = 96,360 temperature records temperature records
3 light sensors logging hourly year round x 24 3 light sensors logging hourly year round x 24 hrs / day x 365 days = 26,280 light recordshrs / day x 365 days = 26,280 light records
Lake Profiles:Lake Profiles: 5 WQ parameters logged x 15 depth intervals 5 WQ parameters logged x 15 depth intervals
on descent x 2 (repeat log on ascent) x 30 on descent x 2 (repeat log on ascent) x 30 sites lake-wide = 4,500 WQ recordssites lake-wide = 4,500 WQ records

Scale of Data: Lake Clark in 2010Scale of Data: Lake Clark in 2010
Continuous Water Quality Monitoring:Continuous Water Quality Monitoring: 7 WQ parameters logged hourly x 24 hrs / day x approx. 90 days 7 WQ parameters logged hourly x 24 hrs / day x approx. 90 days
x 2 sites = 15,120 WQ recordsx 2 sites = 15,120 WQ records
Water Level Recording:Water Level Recording: Level transducer + temperature sensor logging hourly x 24 hrs / Level transducer + temperature sensor logging hourly x 24 hrs /
day x approx. 90 days x 4 sites = 17,280 recordsday x approx. 90 days x 4 sites = 17,280 records
Date / Time Stamp associated with all records = 136,500Date / Time Stamp associated with all records = 136,500
Total Records for Lake Clark in 2010: 296,040Total Records for Lake Clark in 2010: 296,040(Does NOT include metadata!)(Does NOT include metadata!)

How we handle project dataHow we handle project data
.xls
.xls
.csv
.txt
metadata
metadata
.dat
CurrentCurrent
metadata metadata
.csv
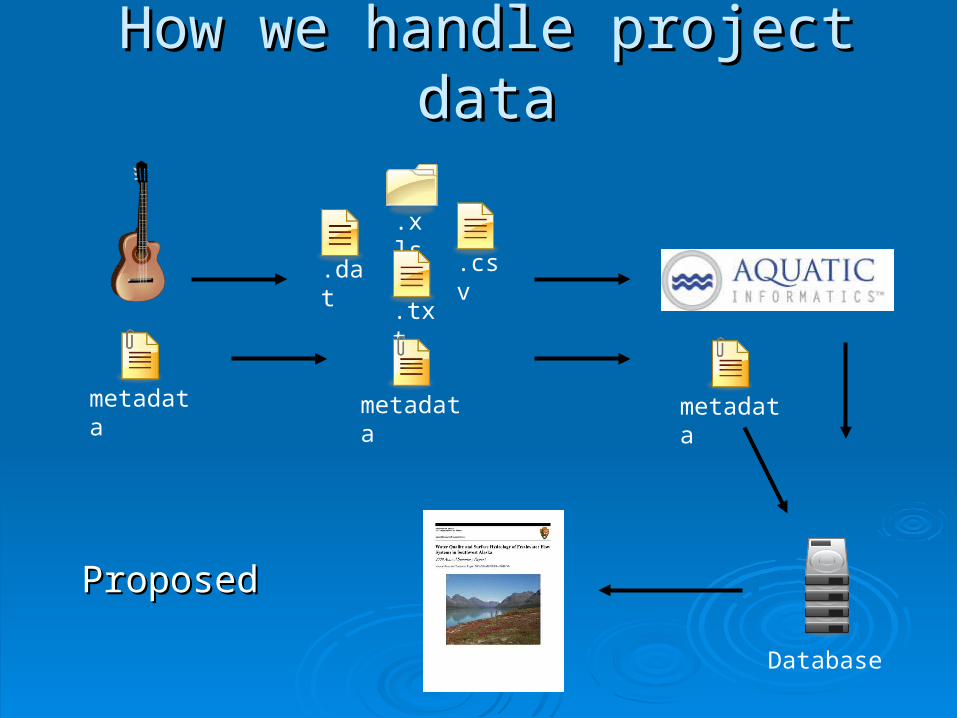
How we handle project dataHow we handle project data
.xls
.csv
.txt
metadata
.dat
ProposedProposed
metadata metadata
Database

In the Age of AquariusIn the Age of Aquarius
WorkaroundsWorkarounds
Organization and storage relies on file Organization and storage relies on file naming and folder structure. naming and folder structure.
Pull from numerous Excel and Aquarius Pull from numerous Excel and Aquarius files to aggregate for analysis and files to aggregate for analysis and reporting. reporting.
Manual consolidation of metadata Manual consolidation of metadata (calibration, deployment info, header info, (calibration, deployment info, header info, etc.)etc.)

Remaining Issues and ProblemsRemaining Issues and Problems
Too much data for our current file-based Too much data for our current file-based method!method! Data spread over too many filesData spread over too many files No central repository, no searchingNo central repository, no searching
Tracking metadata for each recordTracking metadata for each record What instrument recorded what value, when, What instrument recorded what value, when,
instrument condition and calibration history, etc.instrument condition and calibration history, etc. Accountability, HistoryAccountability, History
Analysis and ReportingAnalysis and Reporting Summary and aggregationSummary and aggregation Accessibility to others, sharingAccessibility to others, sharing

A water quality repository gives us insight…A water quality repository gives us insight…

A water quality repository gives us insight…A water quality repository gives us insight…

ParallelsParallels
Water Quality – Underwater weather!Water Quality – Underwater weather! Soil Temperature Loggers – Vegetation Soil Temperature Loggers – Vegetation
Vital SignsVital Signs Temperature and Salinity – Marine Temperature and Salinity – Marine
Nearshore Vital SignsNearshore Vital Signs Weather and ClimateWeather and Climate

Questions