Swallowfield plc is a market leader in theswallowfield.com/wp-content/uploads/2017/10/RA2017_… ·...
88
-
Upload
truongcong -
Category
Documents
-
view
217 -
download
3
Transcript of Swallowfield plc is a market leader in theswallowfield.com/wp-content/uploads/2017/10/RA2017_… ·...


FORWARD-LOOKING STATEMENTS Certain statements in this Swallowfield plc Annual Report and Accounts 2017 constitute “forward-looking statements”. Forward-looking statements may sometimes, but not always, be identified by words such as “will”, “may”, “should”, “continue”, “believes”, “expects”, “intends” or similar expressions. These forward-looking statements are subject to risks, uncertainties and other factors which, as a result, could cause Swallowfield plc’s actual future financial condition, performance and results to differ materially from the plans, goals and expectations set out in the forward-looking statements. Such statements are made only as at the date of this Report and, except to the extent legally required, Swallowfield plc undertakes no obligation to revise or update such forward-looking statements.
Swallowfield plc is a market leader in the development, formulation, and supply of
personal care and beauty products.

ANNUAL REPORT & ACCOUNTS 2017
HIGHLIGHTS
STRATEGIC REPORT
GOVERNANCE
FINANCIAL STATEMENTS
04 HIGHLIGHTS
08 CHAIRMAN’S FOREWORD
12 CHIEF EXECUTIVE’S REPORT
24 PRINCIPLE RISKS AND UNCERTAINTIES
26 FINANCIAL REVIEW
32 PEOPLE AND SUSTAINABILITY
36 CORPORATE GOVERNANCE
38 BOARD OF DIRECTORS
40 DIRECTORS’ REPORT
42 INDEPENDENT AUDITOR’S REPORT
48 GROUP STATEMENT OF COMPREHENSIVE INCOME
49 GROUP AND COMPANY STATEMENTS OF FINANCIAL POSITION
51 GROUP AND COMPANY STATEMENTS OF CHANGES IN EQUITY
53 GROUP AND COMPANY CASH FLOW STATEMENTS
54 NOTES TO THE ACCOUNTS
85 FIVE YEAR SUMMARY
86 CORPORATE DIRECTORY
CONTENTS

HIGHLIGHTS ANNUAL REPORT & ACCOUNTS 2017– 4 –
5
5
6
25
4
4
20
3
3
15
2
2
10
1
1
5
0
0
0
-1
-1
-5
FINANCIAL HIGHLIGHTS
# FY2014 Revenue adjusted from 53 weeks to a 52 week basis* Adjusted operating profit and adjusted earnings per share are calculated before exceptional items and amortisation of acquisition-related intangibles** Underlying operating profit is calculated by adding back the charge for share-based payments to adjusted operating profit. This measure was adopted as the charge for share-based payments is a material £1.76m (2016: £0.22m), and is intended to provide a more representative reflection of the trading performance of the Group.
ADJUSTEDOPERATINGPROFIT*(£ MILLION)
UNDERLYINGOPERATINGPROFIT**(£ MILLION)
REVENUE#
(£ MILLION)
ADJUSTEDBASICEARNINGSPER SHARE*(PENCE)
74.3 2016: 54.5
3.9 2016: 1.8
5.6 2016: 2.0
17.7 2016: 12.6
+36%
+115%
+180%
+40%
60
50
40
30
20
10
0 FY2017FY2016
54.5
FY2015
49.4
FY2014#
49.1
FY2013
48.6
70
80
74.3
FY2017FY2016
2.0
FY2015
1.0
FY2014
0.8
FY2013
-0.4
5.6
FY2017
FY2017
FY2016
FY2016
1.8
12.6
FY2015
FY2015
1.0
6.6
FY2014
FY2014
0.8
3.9
FY2013
FY2013
-0.4
-4.7
3.9
17.7

ANNUAL REPORT & ACCOUNTS 2017 HIGHLIGHTS– 5 –
STATUTORYBASICEARNINGSPER SHARE(PENCE)
STATUTORYOPERATINGPROFIT(£ MILLION)
15.2 2016: 17.7
3.3 2016: 2.4
-14%
+38%
FY2017FY2016FY2015FY2014#FY2013
5
20
4
15
3
10
2
5
1
0
0
-5
-1
-10
FY2017FY2016FY2015FY2014FY2013
FY2017
FY2017
FY2016
FY2016
FY2015
FY2015
FY2014
FY2014
FY2013
FY2013
2.41.00.4-0.9
3.3
17.76.61.4-8.0
15.2
TOTALDIVIDENDSPER SHARE(PENCE)
NET DEBT(£ MILLION)
5.2 2016: 3.1
3.6 2016: 4.3
+68%
-16%
6
6
5
5
4
4
3
3
2
2
1
1
0
0
3.1
4.3
2.0
5.45.1
2.2
5.7
5.2
3.6

HIGHLIGHTS ANNUAL REPORT & ACCOUNTS 2017– 6 –
FINANCIALHIGHLIGHTS
• Strong revenue growth of +36% (+8% excluding The Brand Architekts acquisition) to £74.3m (2016: £54.5m). Sterling weakness benefitted the top-line with revenue growth on a constant currency basis of +31% and +2% respectively.
• Owned brands now represent 24% of revenues.
• Underlying operating profit increased by 180% year on year to £5.6m (2016: £2.0m).
• Adjusted EPS increased by 40% year on year to 17.7 pence (2016: 12.6 pence).
• Net Debt of £3.6m (2016: £4.3m), inclusive of £2.0m additional term-loan funding to support The Brand Architekts acquisition.
• Proposed final dividend of 3.5p per share (2016: 2.3p), in addition to the interim dividend of 1.7p already paid, to give a full year dividend of 5.2p (2016: 3.1p), an increase of 68%.

ANNUAL REPORT & ACCOUNTS 2017 HIGHLIGHTS– 7 –
OPERATIONALHIGHLIGHTS
• The Brand Architekts acquisition now successfully integrated, delivering strong year on year growth driven by several successful new product launches across all key customers.
• Original Swallowfield brands also showing strong growth and extending retail distribution.
• Manufacturing business performing robustly underpinned by successful launches for global brand owners and new contract wins.
• Further improvements in % contribution margin achieved by growth of owned brands, drive category focus and cost base optimisation, despite material and components price increases.
• Strong financial performance allowing investment in brand support and organisational capability whilst still delivering significantly improved profitability.
• E-commerce now live across seven brands, supported by increasing digital marketing activity.

ANNUAL REPORT & ACCOUNTS 2017– 8 –CHAIRMAN’S FOREWORD
£m unless otherwise stated 2017 2016
Reported Results
Revenue £74.3m £54.5m
Adjusted revenue (constant currency) 1 £70.9m £54.5m
Underlying operating profit 3 £5.6m £2.0m
Adjusted operating profit 2 £3.9m £1.8m
Adjusted earnings per share 2 17.7p 12.6p
Statutory Results
Revenue £74.3m £54.5m
Operating profit £3.3m £2.4m
Basic earnings per share 15.2p 17.7p
Total Dividend per share 5.2p 3.1p
Net debt £3.6m £4.3m
BRENDAN HYNES, CHAIRMAN | 18th September 2017
I am delighted to be able to report another year of considerable progress for Swallowfield and one in which we have seen real benefits from consistent focus on the elements of our ‘Building a Better Swallowfield’ strategy which we first
put in place in 2014. Sales, profitability, earnings per share and shareholder value have again increased significantly, through a combination of both organic growth and successful acquisition activity.
RESULTS2017
1 Revenue translated at 2016 exchange rates
2 Adjusted operating profit and adjusted earnings per share are calculated before exceptional items and amortisation of acquisition-related intangibles.
3 Underlying operating profit is calculated by adding back the charge for share-based payments to adjusted operating profit. This measure was adopted as the charge for share-based payments is a material £1.76m (2016: £0.22m), and is intended to provide a more representative reflection of the trading performance of the Group.
CHAIRMAN’SFOREWORD

ANNUAL REPORT & ACCOUNTS 2017 – 9 – CHAIRMAN’S FOREWORD
Our business comprises two complementary streams and it is pleasing that both have performed well over the course of the year. Our manufacturing business focusses on the development, formulation, and supply of personal care and beauty products for customers which include many of the world’s leading brands. Through continued investment and execution of our Drive Category Focus, our offering to those customers has become increasingly differentiated, which has the dual benefit of a positive impact on margin contribution and also improving our competitive advantage, thereby making the Group more resilient.
Over the last three years we have developed, both organically and through acquisition, a growing portfolio of brands that are owned and managed by the Group and which we control from formulation through to distribution. The acquisition of The Brand Architekts in June 2016 has significantly accelerated this owned brand segment of our business and brought critical mass to our portfolio. This now represents 24% of Group revenues in the period.
DIVIDEND Further evidence of our confidence in the business can be seen in the Board’s intention to propose a final dividend of 3.5 pence. Together with the interim dividend already paid of 1.7 pence this represents a total dividend for the year of 5.2 pence, an improvement of 68% over the prior year (2016: 3.1p).
It remains the directors’ intention to align future dividend payments to the underlying earnings and cash flow of the business, taking in to account the gearing and the operational requirements of the business. BOARD SUCCESSIONAfter eight successful years as Group Finance Director, Mark Warren has decided to retire from his full-time executive career and therefore will be stepping down from the Board. Mark has played a significant role in helping the business grow and develop over that period and the Board and his colleagues in the business are grateful for his contribution and wish him continued success in the future.
Advanced notice of Mark’s intentions has allowed the Board to engage in a thorough and structured search for his successor and we are pleased to announce that Matthew Gazzard will be succeeding Mark. Matthew has extensive experience in senior financial leadership roles. He served as Group Finance Director for four years at Thatchers Cider during a period of substantial growth for that business where he delivered the financial support required to underpin both the development of the Thatchers brand itself and the company’s manufacturing facilities. Prior to that he spent nine years as both Group Finance Director and ultimately CEO of British Ceramic Tiles where he successfully navigated the business through challenging times and to a merger with Ceramic Prints Ltd.
Matthew will join Swallowfield on 2 October 2017 and work alongside Mark until the end of the calendar year to ensure a smooth and thorough handover. Matthew will formally replace Mark on the Board with effect from 1 January 2018.
OUTLOOK We have delivered another significant improvement in business performance in the year helped by the acquisition of The Brand Architekts and major new product launches in our manufacturing business.
We expect the strong momentum in our branded business to continue, supported by a steady stream of new products, innovation and continued strong support for our brands across our retail customers.
In our manufacturing business, the outlook is solid with a steady flow of new product development (NPD) and new contract wins that will positively impact the year ahead. As indicated previously, this needs to be balanced against the normalisation of volumes on particularly large product launches that bolstered H2 FY16 and H1 FY17 performance.
In line with the industry, both business segments have been challenged by increasing material and packaging costs resulting from the fall in sterling and global inflationary pressures. Our teams have put in place a wide range of programmes to mitigate the impact of these increases and we believe that these measures and our strong overall trading momentum will compensate.
Having successfully integrated The Brand Architekts, we continue to be alert to further acquisition opportunities should they offer the potential to build incremental shareholder value.
Over the course of the year we have strengthened both sides of our business with an improved ability to deliver the innovation, quality and service demanded by our customers. This combined with the progress made on our owned brands, gives us confidence that we are well positioned for the future.
Brendan HynesChairman18 September 2017

STRATEGIC REPORT ANNUAL REPORT & ACCOUNTS 2017– 10 –
STRATEGICREPORT

ANNUAL REPORT & ACCOUNTS 2017 STRATEGIC REPORT– 11 –
“It has been a year of excellent progress for the Group with the successful execution of our stated strategy”
CHRIS HOW, CHIEF EXECUTIVE OFFICER

STRATEGIC REPORT ANNUAL REPORT & ACCOUNTS 2017– 12 –
It has been a year of tremendous progress for the Group. Our teams have worked extremely hard to maintain the positive momentum in our manufacturing business and to successfully integrate and accelerate the growth of the acquired The Brand Architekts business. Within The Brand Architekts’ portfolio it is pleasing to report that all major brands and major customers are showing year on year growth and that the pace and quality of new product launches have continued seamlessly. This is a great credit to the team at Teddington who have proved themselves to be as talented, professional and committed as we had hoped at the time of acquisition.
In the manufacturing business, our ability to support our customer base with the innovation, quality and service they require has enabled us to continue to grow sales and contribution margins against strong prior year comparators and the headwinds of significant raw material and packaging inflation. Our reputation and relationship has been enhanced across several key customers, both longstanding and new, as we have successfully supported a number of critical product launches for them which contributes to current business performance and augurs well for future projects.
CHIEF EXECUTIVE’SREPORT
OUR BUSINESS AND STRATEGY
WHAT WE DO
MANUFACTURING
Swallowfield plc is a market leader in the development, formulation, and supply of personal care and beauty products, including its own portfolio of brands.
Our business strategy is to leverage our Group expertise, resources and assets across two complimentary and connected value streams, owned brands and manufacturing. Within each value stream we have three strategic pillars which we believe are the critical focus areas to ensure we continue to grow these businesses in the medium and long term.
Our manufacturing business focusses on the development, formulation, and supply of personal care and beauty products for customers which include many of the world’s leading brands. Through continued investment and execution of our Drive Category Focus, our offering to those customers
has become increasingly differentiated, which has the dual benefit of a positive impact on margin contribution and also improving our competitive advantage, thereby making the Group more resilient.
SWALLOWFIELD EXPERTISE AND RESOURCES
MANUFACTURINGVALUE STREAM
• innovation, quality, service, to global brand owners
• drive category focus
• cost base optimisation
OWNED BRANDSVALUE STREAM
• new product development - at pace, consumer and customer relevant
• leverage swallowfield resources
• international growth

ANNUAL REPORT & ACCOUNTS 2017 STRATEGIC REPORT– 13 –
Prestige Brands
27%
OUR MANUFACTURING CUSTOMERS AND MARKETSFigure 1 outlines the range of customer types we supply in our manufacturing business. We are proud to work with some of the world’s leading brands and retailers.
Our manufacturing business invoiced 57% of sales to customers in the United Kingdom, 39% to those in Europe and 4% in Rest of World. With a number of customers onward exporting globally. Swallowfield produced products will be found in many markets around the world.
OUR PRODUCTSFigure 2 outlines the current sales value mix of product types for our Manufacturing business.
Beauty/FashionRetailers
32%
Beauty/FashionRetailers
36%
Prestige Brands
29%
Mass Brands
32%Mass Brands
29%
7% GroceryRetailers 8% Grocery
Retailers
Hot Pour Hot Pour
Premium Liquids, Tubes
Roll-ons
Premium Liquids, Tubes
Roll-ons
Figure 1BY CUSTOMER TYPE FY2017
Figure 1BY CUSTOMER TYPE FY2016
Figure 2BY PRODUCT TYPE FY2017
Figure 2BY PRODUCT TYPE FY2016
Personal CareAerosols
54%
Personal CareAerosols
56%
Fragrance& Gifting
15%
Fragrance& Gifting
17%
6% 6%
7% 7%
Colour Cosmetics& Pencils
18%
Colour Cosmetics& Pencils
14%

STRATEGIC REPORT ANNUAL REPORT & ACCOUNTS 2017– 14 –
InnovationOur talented chemists have an industry-wide reputation for developing great new product formulations, especially in our Drive product categories. Packaging SolutionsOur team works across our customer base to design innovative and effective packaging solutions. Regulatory ExpertiseOur team are able to advise customers on regulatory requirements across a broad range of product types and across a variety of geographies thereby enhancing the potential of these products in export markets.
Quality Customer BaseThe vast majority of our products are developed and produced for strong brands or more premium beauty and fashion retailers.
Expertise In Our “Drive” CategoriesWe have an industry reputation for quality, expertise and cost competitiveness in our drive categories (e.g. Aerosols, Hot Pour Products). These product categories also have significant barriers to entry in terms of skill and assets required.
Geographic FlexibilityOur ability to fill and pack products in the UK, Central Europe and Asia enable us to tailor our offer to meet a variety of customer needs around, cost, quality, complexity and lead-times. Formulatory ExpertiseThe majority of our sales are from formulations that we have either developed ourselves or jointly with our customers. This enables our relationships and specific contracts to be on a more secure, long term partnership basis.
OUR COMPETITIVE STRENGTH
FORMULATORYEXPERTISE
RegulatoryExpertise
PackagingSolutions
Innovation
GeographicalFlexibility
QualityCustomer
Base
Expertise inour ‘Drive’Categories

ANNUAL REPORT & ACCOUNTS 2017 STRATEGIC REPORT– 15 –
Over the last three years we have developed, both organically and through acquisition, a growing portfolio of brands that are owned and managed by the Group and which we control from formulation through to distribution. The acquisition of The Brand Architekts in June 2016 has significantly accelerated this owned brand pillar and brought critical mass to our portfolio, now representing 24% of Group revenues in the period.
The convergence of a number of macro trends has created a significant and demonstrable opportunity for smaller more agile companies to create and profitably grow well-crafted and well positioned brands in the Personal Care and Beauty sector. National retailers are keen to support brands that can differentiate their offering and thereby drive shopper loyalty. Digital channels and social media allow brands to deliver
well targeted, fast and flexible consumer communication campaigns at a fraction of the cost of traditional media. Smaller companies are able to identify trends and develop new products without the time consuming and complex decision-making processes that can often be a feature of larger global companies.
Bringing together the product development, production and supply chain expertise of Swallowfield with the proven, creative and dynamic brand management team of The Brand Architekts creates a strong and broad capability within the group to profitably realise market opportunities through development of our owned brand portfolio.
OWNED BRANDS

STRATEGIC REPORT ANNUAL REPORT & ACCOUNTS 2017– 16 –
OUR OWNED BRANDS CUSTOMERS AND MARKETSFigure 3 outlines the range of customer types we supply in our owned brands business.
Figure 3BRAND SALES BY CHANNEL FY17
UK Grocery Retail
57%International
24%
UK Non-Food Retail
19%

ANNUAL REPORT & ACCOUNTS 2017 STRATEGIC REPORT– 17 –
OUR LOCATIONS
UKWELLINGTON, SOMERSETFACTORY AND GROUP HQOur head office and a manufacturing and development location, predominately focused on aerosol and hot pour deodorant sticks.
BIDEFORD, NORTH DEVONFACTORYManufacturing and development location focused on cosmetic wood pencils and small hot pour lip balms and plastic pencils.
TEDDINGTON, MIDDLESEXTHE BRAND ARCHITEKTS The base of The Brand Architekts, a proven and experienced team.
FRANCEPARISSALES OFFICESales support office, located close to our customers.
CHINASHANGHAIFACTORY A local representative office and location of our 19% investment in Shanghai Colour Cosmetic Technology Company (SCCTC). SCCTC are focused on gift packs and cosmetics.
CZECH REPUBLICTABORFACTORYA filling location focused on cosmetics, fragrance, tubes and roll-ons.
USANEW YORKSALES OFFICESales support office, located close to our customers.

STRATEGIC REPORT ANNUAL REPORT & ACCOUNTS 2017– 18 –
‘CREATING FOR TOMORROW,DELIVERING FOR TODAY’

ANNUAL REPORT & ACCOUNTS 2017 STRATEGIC REPORT– 19 –
“Fast paced new product development that quickly identifies and responds to market trends is a core element of our success”
JANE FLETCHER, GROUP SALES AND MARKETING DIRECTOR

STRATEGIC REPORT ANNUAL REPORT & ACCOUNTS 2017– 20 –
Our business strategy is developed on two complimentary platforms:
• the first ‘Creating for Tomorrow’ identifies within each of the manufacturing and owned brands value streams the three strategic pillars which we believe are the critical focus areas to ensure we continue to grow these businesses in the medium and long term.
• the second ‘Delivering for Today’ identifies some key operational focus areas that we need to drive in order to deliver our more immediate (i.e. current fiscal) performance.
EXECUTING OURSTRATEGY
The three strategic pillars that we are focussing on within our owned brands value stream are:
NEW PRODUCT DEVELOPMENT (NPD)Fast paced NPD that quickly identifies and responds to market trends is a core element of The Brand Architekts business model. We are pleased that this responsiveness continues as part of the Swallowfield Group and that retailer appetite remains high. 78 new lines were launched in the course of the financial year across 11 different brands. Of particular note are a range of new beauty accessories launched under a new brand ‘Beautopia’, a new line of Epsom Salts under the Dr.Salts brand, and a new Retinol Serum in our SuperFacialist range. We are busy on further new ranges to be launched in Autumn 2017.
Progress has also continued on our original Swallowfield brands. The Real Shaving Company has grown strongly in the year thanks in part to the good performance of a new gift range but also the effect of digital marketing activity linked to the sponsorship of Somerset T20 cricket. The Bagsy Savannah Miller collection was launched in the year and has helped us to find new distribution opportunities for the brand. MR, our premium male hair loss brand has seen rate of sale increase even further with the introduction of new packaging for the shampoo, conditioner and styling paste lines and continued innovative and impactful digital marketing activity.
We have also seen very good growth in our range of value brands, such as Tru Shave, aimed at the growing UK value retail sector. We have successfully added new products to our offering and in doing so have extended the number of retail customers to virtually all the major national UK chains in this channel.
On 4 September 2017, we concluded a transaction to acquire a 70% shareholding in Sterling Shave Club Ltd. Over the last two years Sterling has established a presence in the fast-growing on-line subscription shave club sector.
The business is currently at a relatively small scale and our investment is appropriately modest. The entire consideration is to be invested into the business to support a significantly enhanced marketing plan directed at accelerating membership recruitment and expanding the range of products available beyond the current range of blades and shaving products, which currently include our own The Real Shaving Company range.
It offers us the opportunity to further develop our knowledge and capabilities in e-commerce which we believe will be critical to the further development of our owned brands business in the years ahead.
As the business will very much be in an ‘invest to grow’ phase, we expect a broadly neutral impact on group profitability in the current financial year moving to a positive contribution in subsequent years.
OWNED BRANDS

ANNUAL REPORT & ACCOUNTS 2017 STRATEGIC REPORT– 21 –
LEVERAGE SWALLOWFIELD RESOURCESAt the time of acquisition of The Brand Architekts, we identified a number of opportunities to either drive revenue growth or create savings by leveraging the existing resources and capabilities of the parent business. We are pleased to have made excellent progress in this regard through the course of the year.
Several Swallowfield developed and produced products are now on shelf including Dirty Works Body Sprays and Happy Naturals footcare products. Many more projects are in progress covering not only new products but also the transfer of some existing products from other suppliers.
Swallowfield had, prior to the acquisition, developed a very competent digital marketing and e-commerce capability and we have been able to utilise these resources to launch digital marketing programmes and e-commerce functionality across Dirty Works, SuperFacialist, Quick Fix Facials, and Kind Natured.
PR and Marketing agencies were consolidated across the portfolio in the course of the year which has led to better quality output at lower cost.
On the Supply side, we are leveraging our materials and packaging sourcing network (including our China purchasing office), our knowledge of best practice production processes, and our expertise in product design and formulation to drive cost improvements across the inherited The Brand Architekts supply base. As part of this programme we have secured significant savings in freight and duty on shipments of gifts and accessories from China by combining our expertise and our buying power.
INTERNATIONAL EXPANSIONGrowth in international revenues has been strong, led in particular by export sales to North America. Across the full portfolio of our brands, international sales now account for 24% of segment sales and we are investing to grow this further still. We have put in place dedicated resource to grow this area and are pleased in the course of the year to have opened new distribution channels for a number of our brands in France, Netherlands, Austria and Chile. Additionally, we are extending the international reach of our Christmas gifting ranges with orders already having been received for USA, Turkey, Ireland and South Africa.

STRATEGIC REPORT ANNUAL REPORT & ACCOUNTS 2017– 22 –
We have continued to make measurable progress across our three strategic pillars in this segment of our business.
INNOVATIONOur manufacturing business relies on our ability to bring innovative new products to our customer base which consists of some of the leading global brand owners and retailers in the Personal Care and Beauty sector. In the financial year, we introduced over 200 Swallowfield developed new products, a level of innovation activity that compares favourably to prior year. We were particularly active in haircare and colour cosmetic products with a number of our innovations being taken to market by leading brands. Volumes on our innovative plastic aerosol products continued to grow in the period and during the year we have progressed projects which we expect will lead to the technology being introduced by other customers in the new financial year.
DRIVE CATEGORY FOCUSIn the reporting period, we have seen particularly strong growth in Personal Care Aerosols, Cosmetic Pencils, and Premium Liquids. In each case, recently won contracts to support new product launches have been a major contributor, underlining our position as a reliable partner for major global brand owners. The success of our partnership with a major European cosmetics company has supported a project to increase wood pencil capacity and improve cost efficiency at our Bideford site to meet growing demand. Further improvements in capacity and capability have been completed at our Wellington site with particular focus on Personal Care aerosols and Hot Pour products which enabled us to both extend existing contracts and win new ones.
COST BASE OPTIMISATIONEnergy saving improvements continue at the Wellington site and line efficiency programmes continue to contribute to margin improvement across all sites. The investment in pencil automation in Bideford decreases cost per unit and increases capacity. The flexibility of our site footprint has enabled us to accommodate the needs of a major customer who needed to transfer sourcing from a dollar denominated supply chain out of China to a euro-denominated supply chain.
The first wave of products were produced for The Brand Architekts brands in this financial year. This will now be accelerated with significant volumes brought in-house over the next 18 months.
MANUFACTURING

ANNUAL REPORT & ACCOUNTS 2017 STRATEGIC REPORT– 23 –

STRATEGIC REPORT ANNUAL REPORT & ACCOUNTS 2017– 24 –
The Group operates in an environment that is constantly changing and as a result the risks it is facing will change over time. The Group’s management processes assess risks and then develop strategies for dealing with these risks on an ongoing basis. A formal review of these risks is carried out by the Group twice a year. The review process involves the classification of risks, assessment to determine the relative likelihood of them impacting the business and the potential severity of the impact, and determination of whether changes to management processes are needed to manage them effectively. COMPETITIVE ENVIRONMENT AND CUSTOMER REQUIREMENTS The market remains competitive, and the Group therefore has exposure to loss of contracts and/or slow-down in demand for products.
The focus on the six strategic pillars of ‘creating for tomorrow’ outlined earlier in this report are a key part of the risk management process associated with this specific risk. Within the manufacturing business, the drive category focus, product innovation, and cost base optimisation pillars, all help to strengthen customer relations and position the Group as a strong partner, supporting customers’ key needs of innovation, quality, cost efficiency and service. The development of our owned brands adds a further level of diversification to managing this risk, and now represents 24% of Group sales.
PRODUCT QUALITY Product quality is a key strength of the Group and failure to maintain a high standard of quality and safety would have a severe impact on service levels, customer relationships, and have financial repercussions.
We have formalised development protocols to ensure the products we design are safe, fit for purpose and comply with all legal requirements, working with our suppliers to prepare detailed product, component and material specifications and ensure correct materials are chosen and specified, and that the products are clearly labelled for any markets in which they are sold.
The Group’s quality assurance procedures are reviewed continuously with improvements made as appropriate. The Group is subject to frequent internal and external safety, environmental, and quality audits covering both accreditations held and our customers required operating standards.
RISKS ANDUNCERTAINTIES

ANNUAL REPORT & ACCOUNTS 2017 STRATEGIC REPORT– 25 –
LABOUR COSTS, PRICES AND SUPPLY The Group, along with other businesses, will face the risk of inflationary pressures through commodities cost increases, further driven by currency weakness post Brexit, the National Living Wage, and other ongoing legislative changes.
The Group in the normal course of its business, transacts in and holds various currencies, and follows a policy of managing currency exposure through natural hedging wherever possible.
The Group maintains a high level of expertise in its purchasing and supply chain team. The team seeks to cultivate strong relationships with major suppliers to ensure continuity of supply at competitive prices.
The regular renovation and innovation across our products can help to manage margin pressures in an effective manner, as far as the competitive environment allows.
Ongoing capital investment and improvements in operational efficiency help reduce the impacts of inflation.
ECONOMIC ENVIRONMENT The market place remains challenging and there is an uncertain macro-economic outlook following the vote to leave the EU. Our focus on executing our clear strategy, outlined earlier in this report, has improved our ability to deliver the innovation, quality and service requirements of our manufacturing business customers, which, alongside the progress made on our owned brands, both developed internally and through acquisition, leaves us well placed to navigate any potential macro uncertainty.
CYBER SECURITYThe Group, along with other businesses, is exposed to the risk of increasingly sophisticated cyber-attacks aimed at causing business disruption, capture of data for financial gain, general embarrassment and reputational damage, or that the Groups’ data privacy protective measures are considered by regulators to be inadequate. PENSION FUND DEFICIT The revaluation of the one defined benefit pension scheme on a technical provision basis at each reporting date can cause large fluctuations in valuations based on factors outside the Groups control. There is an agreed deficit recovery plan fixed until July 2025 or until a new schedule is agreed based on the next triennial valuation which will be at 5 April 2017. This deficit recovery plan provides certainty over cash flows between triennial reviews. The Group maintains a close relationship and regular communication with the Trustees.

STRATEGIC REPORT ANNUAL REPORT & ACCOUNTS 2017– 26 –
FINANCIALREVIEW

ANNUAL REPORT & ACCOUNTS 2017 STRATEGIC REPORT– 27 –
“The overall re-shaping of the business towards stronger growth and margins has enabled us to deliver a close to three-fold increase in underlying operating profit.”
MARK WARREN, GROUP FINANCE DIRECTOR

STRATEGIC REPORT ANNUAL REPORT & ACCOUNTS 2017– 28 –
£m unless otherwise stated 2017 2016
Reported Results
Revenue £74.3m £54.5m
Adjusted revenue (constant currency) 1 £70.9m £54.5m
Contribution Margin % 32.2% 31.9%
Underlying operating Profit 3 £5.6m £2.0m
Adjusted operating profit 2 £3.9m £1.8m
Adjusted earnings per share 2 17.7p 12.6p
Statutory Results
Revenue £74.3m £54.5m
Operating profit £3.3m £2.4m
Basic earnings per share 15.2p 17.7p
Total Dividend per share 5.2p 3.1p
Net debt £3.6m £4.3m
KEY PERFORMANCE INDICATORS To implement our growth strategy effectively, we have set ambitious targets and milestones. We monitor these goals closely to focus our effort and ensure we deliver both in the short term and long term.
A summary of the financial measures used are:
FINANCIALREVIEW
RESULTS2017
1 Revenue translated at 2016 exchange rates
2 Adjusted operating profit and adjusted earnings per share are calculated before exceptional items and amortisation of acquisition-related intangibles.
3 Underlying operating profit is calculated by adding back the charge for share-based payments to adjusted operating profit. This measure was adopted as the charge for share-based payments is a material £1.76m (2016: £0.22m), and is intended to provide a more representative reflection of the trading performance of the Group.
ANNUAL REPORT & ACCOUNTS 2017 STRATEGIC REPORT– 29 –
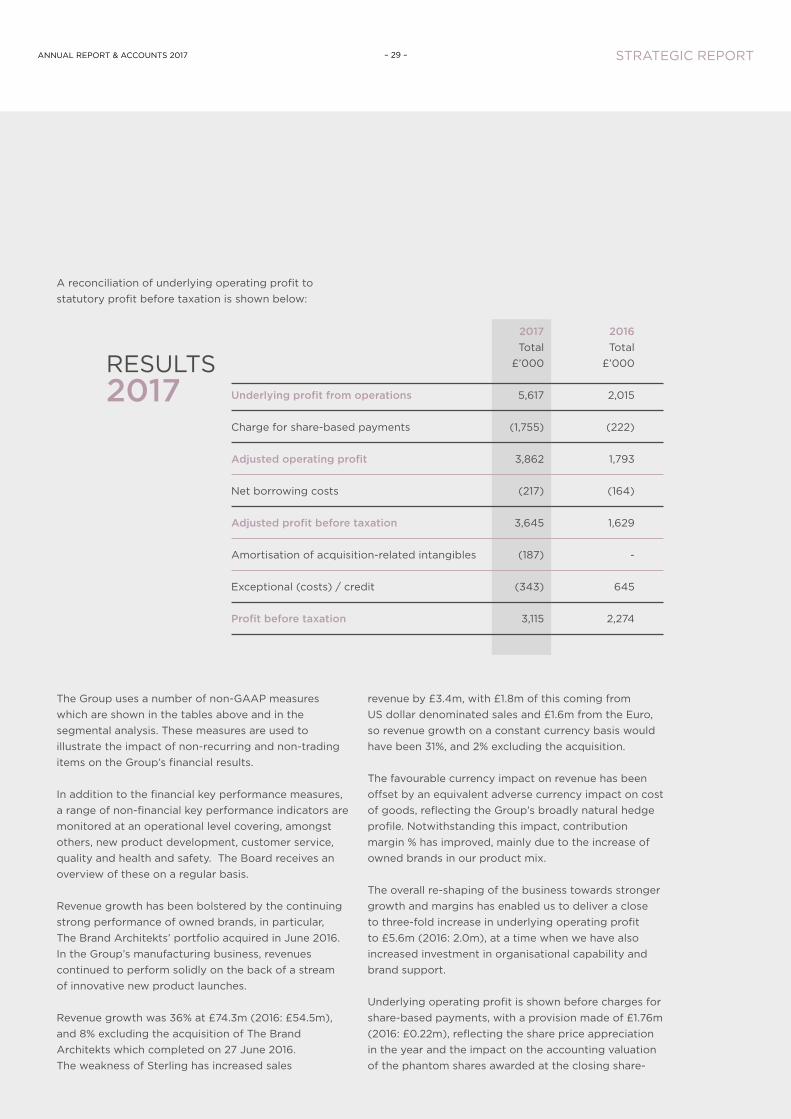
2017 2016 Total Total £’000 £’000
Underlying profit from operations 5,617 2,015
Charge for share-based payments (1,755) (222)
Adjusted operating profit 3,862 1,793
Net borrowing costs (217) (164)
Adjusted profit before taxation 3,645 1,629
Amortisation of acquisition-related intangibles (187) -
Exceptional (costs) / credit (343) 645
Profit before taxation 3,115 2,274
RESULTS2017
A reconciliation of underlying operating profit to statutory profit before taxation is shown below:
The Group uses a number of non-GAAP measures which are shown in the tables above and in the segmental analysis. These measures are used to illustrate the impact of non-recurring and non-trading items on the Group’s financial results.
In addition to the financial key performance measures, a range of non-financial key performance indicators are monitored at an operational level covering, amongst others, new product development, customer service, quality and health and safety. The Board receives an overview of these on a regular basis.
Revenue growth has been bolstered by the continuing strong performance of owned brands, in particular, The Brand Architekts’ portfolio acquired in June 2016. In the Group’s manufacturing business, revenues continued to perform solidly on the back of a stream of innovative new product launches.
Revenue growth was 36% at £74.3m (2016: £54.5m), and 8% excluding the acquisition of The Brand Architekts which completed on 27 June 2016. The weakness of Sterling has increased sales
revenue by £3.4m, with £1.8m of this coming from US dollar denominated sales and £1.6m from the Euro, so revenue growth on a constant currency basis would have been 31%, and 2% excluding the acquisition.
The favourable currency impact on revenue has been offset by an equivalent adverse currency impact on cost of goods, reflecting the Group’s broadly natural hedge profile. Notwithstanding this impact, contribution margin % has improved, mainly due to the increase of owned brands in our product mix.
The overall re-shaping of the business towards stronger growth and margins has enabled us to deliver a close to three-fold increase in underlying operating profit to £5.6m (2016: 2.0m), at a time when we have also increased investment in organisational capability and brand support.
Underlying operating profit is shown before charges for share-based payments, with a provision made of £1.76m (2016: £0.22m), reflecting the share price appreciation in the year and the impact on the accounting valuation of the phantom shares awarded at the closing share-

STRATEGIC REPORT ANNUAL REPORT & ACCOUNTS 2017– 30 –
price of 395p (2016: 180p). The majority of the charge on share-based incentives relates to awards made in 2014 and become exercisable towards the end of 2017. These share options were put in place in order to incentivise the Group’s wider management team (including the executive directors of Swallowfield) and to ensure that their interests are aligned with shareholders. At the time, this incentive plan was introduced the average share price was 95p and since that time shareholders have been rewarded with a capital improvement of over 250% in addition to progressive dividend income.
The net effect is that the Group made an adjusted operating profit of £3.9m (2016: £1.8m). Adjusted profit before tax increased to £3.6m (2016: £1.6m).
The exceptional item of £0.34m in the current period relates to “one off” costs incurred in the acquisition of The Brand Architekts Ltd. In 2016 there was an exceptional credit of £0.65m relating to the closure to future accrual of the defined benefit pension scheme.
The overall effective rate of Group taxation for the period was 17.4% (2016: 12.0%) of pre-tax profits. The prior year benefitted from brought-forward UK tax losses which were fully utilised in the last financial year. The current year tax charge reflects standard UK and the Czech Republic rates of taxation.
This results in adjusted earnings per share of 17.7p (2016: 12.7p).
The Group’s strategic investment of a 19% shareholding in Shanghai Colour Cosmetics Technology Company Limited (SCCTC) was further re-valued upwards by £0.68m during the period, to fair value based on SCCTC’s June 2017 net assets. The initial cost of this investment was £0.14m and this is now valued at £1.24m. This improved valuation reflects a very strong trading performance, supplying customers in Europe and the USA. In addition, a dividend of £0.1m was received in the year (2016: £0.06m).
NET DEBT AND CASH FLOWNet debt decreased to £3.6m (2016: £4.3m). This includes an additional £2m five-year term loan facility taken out to support the acquisition of The Brand Architekts Ltd. The Group maintains a broadly natural hedge position on the Euro and US Dollar, and manages timing differences through a multi-currency invoice finance facility. At the reporting date, the Group was maintaining a hedged position by holding Euro and US Dollar cash balances, whilst drawing on its GBP facility, resulting in an increased cash position in the statement of financial position of £4.1m (2016: £0.8m) whilst retaining an overall net debt position of £3.6m (2016: £4.3m), note 24 provides an analysis of net debt.
The movement in the components of working capital reflect the impact of the four major product launches in our manufacturing business across the prior June year-end, plus the inclusion of The Brand Architekts working capital components in the closing position.
The increase in tax paid reflects the payment of The Brand Architekts prior-year corporation tax, and the re-introduction of quarterly instalments across the enlarged Group.
Financing costs of £0.31m (2016: £0.22m) comprised interest expense of £0.16m (2016: £0.13m) plus a pension scheme notional finance charge of £0.15m (2016: charge £0.08m).
Capital expenditure was £1.4m which was broadly in line with depreciation. We have made a number of investments to improve line efficiencies and support incremental new customer contracts and have an active capital investment programme planned for the new year.

ANNUAL REPORT & ACCOUNTS 2017 STRATEGIC REPORT– 31 –
DEFINED BENEFIT PENSION SCHEMEThe defined benefit pension scheme underwent its last triennial valuation as of 5 April 2014. The deficit on a statutory funding basis was £1.3m and the Group entered into a revised deficit recovery plan and schedule of contributions in July 2015. The deficit reduction payment will be £108k per annum (previously £111.5k per annum) for ten years. The scheme was subsequently closed to future accrual with effect from 31 December 2015. The latest triennial valuation at April 2017 is in process, and it is expected will be finalised during year-ending June 2018.
For accounting purposes at 24 June 2017, the Group recognised under IAS19 ‘employee benefits’, a deficit of £6.1m (25 June 2016: £4.5m). The Accounting Standards require the discount rate to be based on yields on high quality (usually AA-rated) corporate bonds of appropriate currency, taking into account the term of the relevant pension scheme’s liabilities. Corporate bond indices are used as a proxy to determine the discount rate. At the reporting date, the yields on bonds of all types were lower than they were at 25 June 2016. This has resulted in lower discount rates being adopted for accounting purposes compared to last year, which has been coupled with an increase in expectations of long term inflation, with the combination materially increasing the fair value of the scheme liabilities, with the strong investment return performance only partially mitigating. This has translated into an increased liability under the IAS19 methodology.
DIVIDENDSThe Board is pleased to announce that it will be proposing a final dividend of 3.5 pence. Together with the interim dividend already paid of 1.7 pence this represents a total dividend for the year of 5.2 pence, an improvement of 68% over the prior year (2016: 3.1p). If approved, the final dividend will be paid on 8 December 2017 to shareholders on the register on 17 November 2017. The shares will be marked as ex-dividend on 16 November 2017.
GOING CONCERNAs part of its normal business practice, the Group prepares annual and longer-term plans and, in reviewing this information the Directors have a reasonable expectation that the Company and Group have adequate resources to continue in operational existence for the foreseeable future. Accordingly, we continue to adopt the going concern basis in preparing the annual report and accounts.

STRATEGIC REPORT ANNUAL REPORT & ACCOUNTS 2017– 32 –
EMPLOYMENT PRACTICES The success of our business is dependent upon the quality, commitment and behaviour of our employees. Therefore, the Group provides clear policies and direction to our employees and strives for the highest standards of behaviour.
The ‘Building a Better Swallowfield’ agenda outlines the key elements of how we want to build a Swallowfield that is an interesting and rewarding place to work, that consistently exceeds the expectations and needs of our customers, and delivers sustained profitable growth for our shareholders. This has provided a framework that clarifies our values, our short, mid and long-term priorities and the key measures in place to measure our progress.
The foundation of this agenda is our values. These are the behaviours that we believe are critical to be successful in everything we do, and are as follows:
‘Making it happen’ - means being action oriented and being accountable for what we have agreed and committed to do with colleagues, customers and suppliers. If something needs doing, let’s get it done.
‘Making it better’ - means a mindset of continuous improvement in everything we do and a challenge to not only identify things that are not working so well, but to also to do something about it.
‘Making it together’ – reminds us that whatever we are trying to make happen or to make better, we are highly unlikely to be able to do it on our own. We will always need the involvement and support of colleagues, customers and suppliers to ensure solutions work best for all concerned.
Also, within the ‘Building a Better Swallowfield’ agenda we have set out both a clear set of near term and longer-term business priorities and focus areas. The nearer term initiatives are set out under the heading of ‘Delivering for Today’ and the longer-term initiatives are set out under the heading of ‘Creating for Tomorrow’. The ‘Delivering for Today’ initiatives have been varied on an annual basis.
All of these elements come together under our ‘Building a Better Swallowfield’ pyramid, which is used across the business as a visual mnemonic to capture how we want to develop the business.
PEOPLE ANDSUSTAINABILITY

ANNUAL REPORT & ACCOUNTS 2017 STRATEGIC REPORT– 33 –
EMPLOYEE COMMUNICATION The policy of informing and consulting with employees is given prominence and has continued by means of regular briefing groups and consultative committees. Employees are encouraged to present their views and suggestions in respect of the Group’s performance. During the year a number of employee workshops and briefings have taken place to engage employees in the delivery of ‘Building a Better Swallowfield’. This has been supported through the all employee reward and recognition scheme and an on-line facility to capture employee suggestions and questions. EQUALITY AND DIVERSITY The Group continues to carefully consider applications for employment by an individual from any background, including disabled persons. The Group’s training, development and promotion policies aim to ensure all employment decisions are based on fairness and merit.
CORPORATE SOCIAL RESPONSIBILITY The Group recognises the importance of social responsibility in its business and remains strongly committed to reducing the environmental impact of its production and design processes, and advancing its systems and policies to comply with and, wherever possible, anticipate changing legislative and customer demands. This important area is covered as part of regular team briefs to all members of staff, and the Group uses a variety of key performance indicators as part of its regular reporting cycle.
The Group is subject to regular external audits associated with both accreditations held and customer requirements, and during the year hosted over 35 separate audits. These include ISO 9001; ISO 14001; ISO 22716 Cosmetics GMP; ISO 13485 Medical Devices; FDA; CLAS; BRC; FSC; plus, a number of Ethical, Environmental, Health & Safety Executive (COMAH), and Customer audits.
ETHICAL TRADING The Group is a member of SEDEX (Supplier Ethical Data Exchange) and regularly participate in SMETA audits at its production sites to ensure compliance with all applicable Ethical and responsible business practices in global supply chains covering Labour Standards, Business Ethics, Health & Safety and the Environment.
The Group discloses on and is assessed on the EcoVadis CSR platform giving assurance of meeting the highest standards of sustainable procurement, business practices environment and labour practices. EcoVadis gathers information from around 24,000 subscribers, based in 95 different countries and 145 different industry sectors. Over 100 multinational companies use EcoVadis to monitor the CSR performance of their suppliers. The Group was awarded a Gold award following initial assessment in 2015 and this Gold rating was maintained in 2016, placing the Group in the top 13% of all suppliers assessed across all categories.
Within its supply chain, the Group is also certified to FSC (ensuring the ethical supply chain of wood) and members of RSPO (for ethical & sustainable purchase of palm oil), with each organisation giving assurance that correct business practices are being applied. A statement made pursuant to the Modern Slavery Act 2015 setting out the steps the Group has taken to ensure that slavery and human trafficking is not taking place in our supply chains or in any part of our business has been incorporated within our Ethical Policy, and can be found on our website.

STRATEGIC REPORT ANNUAL REPORT & ACCOUNTS 2017– 34 –
HEALTH AND SAFETYThe philosophy of Continuous Improvement remains core to the Group’s approach to Health and Safety Management. There are regular Health and Safety reviews led by senior management involving the Health and Safety Manager and workforce representatives. All areas of the business are audited twice each year to assess any Health and Safety strengths and remedy any identified weaknesses. Action plans for all issues are developed and monitored by the Health and Safety Manager and local management, and are reviewed by senior management. Risk Assessments are prepared for all foreseen issues and are regularly reviewed. The Group’s Health and Safety System is designed to run parallel to BS 18001.
The Group has invested in the IOSH ‘Working safely’ training package which is being rolled out across all UK employees over a two-year period, with over 120 employees receiving the training to date. The ‘Working safely’ package is a completely different approach to safety and health training. It’s a high-impact programme designed to be enjoyable and stimulating, and is aimed at getting people involved at all levels across the organisation. ‘Working safely’ covers:– defining hazard and risk
– identifying common hazards– improving safety performance– protecting our environment
Successful delegates are awarded an IOSH Working safely certificate, a nationally recognised and respected certificate.
Successful delegates are now utilising their training to run proactive hazard spotting workshops in their own areas of work, with employees coming together to spot potential hazards before they could develop into incidents. These potential hazards are then analysed and if necessary corrective actions are raised.
All Accidents, Incidents and Near Misses are fully investigated to identify root cause and preventive actions are developed and put in place and we continue to increase our focus on near-miss reporting. All the above are afforded a score rating which is assessed each year and monitored through the Group’s ‘Building a Better Swallowfield’ Score Card.
The Group Health and Safety Manager is a chartered member of the Institution of Occupational Safety and Health (IOSH).

ANNUAL REPORT & ACCOUNTS 2017 STRATEGIC REPORT– 35 –
ENVIRONMENTThe Group remains strongly committed to continuously reduce the environmental impact of its operations and products.
The Group’s Environmental Management System was certified by BSI to ISO14001 in December 2005. Since that date, all six-monthly surveillance audits have been passed with no major non-conformances. No major non-conformances were reported in the last financial year & the Group transitioned to the new ISO14001:2015 standard in June 2017.
The Group has made significant steps forward in reducing its consumption of energy and its impact on the environment since 2005/6 and uses site based metrics to monitor energy consumption, water usage and CO2 emissions.
The Group has registered under the UK CRC Energy Efficiency Scheme, and a result of energy saving initiatives such as replacing compressors & installing more LED lighting has seen Group electricity consumption reduce by over 17.9% since 2012 and at 4,102 MWh currently falls well below the full compliance thresholds outlined under CRC of 6,000 MWh. The Group also publicly declares its carbon emissions via the CDP scheme, achieving awareness status & has changed over to the use of Zero Carbon Renewable Electricity in the UK from December 2016. The Group was also given a 64% sustainability rating score from Carbon Clear, compared to an industry average of 49%.
The Energy Savings Opportunity Scheme (ESOS) is a mandatory energy assessment and energy saving identification scheme for large undertakings (and their corporate groups). The Group achieved the mandatory requirement under the ESOS scheme to comply by December 2015. The report continues to assist the Group in identifying any further savings opportunities.
Levels of dry waste recycling or reuse for aluminium, metal, cardboard, wood, paper, plastic etc. were maximised and we continue to focus on improving the percentage of waste recycled.
Challenging objectives have been established for the forthcoming year with the aim of continuing to reduce the overall environmental impact of our business, including that of our operations and products.
The Group continues to seek to be ‘environmentally responsible’ in all its activities and to minimise the impact of our activities on the environment.
Copies of our Health and Safety, Environmental, and Ethical policies plus current certifications and accreditations are available on the Swallowfield website (www.swallowfield.com).
By order of the Board
Chris How Mark WarrenChief Executive Officer Group Finance Director18 September 2017

GOVERNANCE ANNUAL REPORT & ACCOUNTS 2017– 36 –
The Group is committed to business integrity, high ethical values and professionalism in all its activities. As an essential part of this commitment the Group supports the highest standards in corporate governance. The Board is accountable to the Company’s shareholders for good governance and this statement describes how the principles of good governance set out in the UK Corporate Governance Code, published by the Financial Reporting Council are applied within the company. We do not comply with the UK Corporate Governance Code. However, we have reported on our Corporate Governance arrangements by drawing upon best practice available, including those aspects of the UK Corporate Governance Code we consider to be relevant to the Company.
RELATIONS WITH SHAREHOLDERSCommunications with shareholders are given high priority. The Chairman’s foreword and Strategic report on pages 8 to 35 include a detailed review of the business and future developments. There is regular dialogue with institutional and other major shareholders including presentations after the Company’s announcement of final and interim results. The Board also uses the Annual General Meeting to communicate with private and institutional investors and welcomes their participation. All Directors will be available to answer questions at the Annual General Meeting on 9 November 2017 and the resolutions to be proposed can be found on the separate circular sent to shareholders with a copy of this Report and Accounts. The Chairman and Non-Executive Directors meet and communicate with shareholders as requested. They also use the Company’s broker and informal discussions after the Annual General Meeting, to maintain open routes of communication with shareholders. All presentations to shareholders are shown in the investors section of the Group’s website.
THE WORKINGS OF THE BOARD AND ITS COMMITTEESThe BoardThe Board currently comprises an Independent Non-Executive Chairman, the Chief Executive Officer, two other Executive Directors and three other Non-Executive Directors. The biographies appearing on page 38-39 demonstrate a range of experience and sufficient calibre to bring independent judgement on issues of strategy, performance, resources and standards of conduct that are vital to the success of the Group. The Board is responsible to shareholders for the proper management of the Group. A statement of the Directors’ responsibilities in respect of the accounts is set out on page 41 and a statement of going concern on page 31.
The Board has overall responsibility for the Group and there is a formal schedule of matters specifically reserved for decision by the Board. Each Executive Director has been given responsibility for specific aspects of the Group’s affairs and independent advice is available to all Directors. Appropriate training is given when Directors are appointed to the Board.
The Board meets a minimum of six times per year to review trading performance, set and monitor strategy, approve matters reserved for decision by the Board and to ensure that adequate funding exists. All Directors are supplied with information in a manner to enable the Board to discharge its duties.
Indemnity InsuranceThe Group carries liability and indemnity insurance for Directors, Officers and Senior Managers.
CORPORATEGOVERNANCE

ANNUAL REPORT & ACCOUNTS 2017 GOVERNANCE– 37 –
Nomination CommitteeThe current members of the Nomination Committee are Brendan Hynes (Committee Chairman), Roger McDowell and Franklin Berrebi. The Committee is responsible for proposing candidates for appointment to the Board, having regard to the balance and structure of the Board. In appropriate cases recruitment consultants are used to assist the process. The terms of reference of the Nomination Committee are published on the Group’s website. All Directors are subject to re–election at least every three years. Audit CommitteeThe current members of the Audit Committee are Edward Beale (Committee Chairman), Brendan Hynes, Roger McDowell and Franklin Berrebi. It meets at least twice a year to review the Group’s accounting policies and reporting procedures, external audit reports and other relevant matters. The external auditors, Group Finance Director and Chief Executive Officer are also invited to attend but are not entitled to vote. The terms of reference of the Audit Committee are published on the Group’s website. The Group receives non-audit services such as taxation and other consultancy advice from the Group’s auditors. The Audit Committee assesses the independence of the external auditors by means of an internal review of relationships with the auditors together with a review of an annual independence report issued by the auditors. The Group does not have an internal audit function.
Remuneration CommitteeThe current members of the Remuneration Committee are Roger McDowell (Committee Chairman), Brendan Hynes, Franklin Berrebi and Edward Beale. The Chief Executive Officer and Group Finance Director attend the Remuneration Committee meetings by invitation but are not entitled to vote. The Committee reviews the terms and conditions of service of Executive Directors, and ensures that salaries, bonuses and share option awards satisfy any relevant performance criteria. Terms of reference of the Remuneration Committee are published on the Group’s website.
INTERNAL CONTROLThe Board is responsible for the Group’s system of internal control and for reviewing its effectiveness. Such a system can only provide reasonable and not absolute assurance against material misstatement or loss. The key procedures established are as follows:
• Responsibility levels, the ethos of the Group, the delegation of authority and other control procedures, together with appropriate accounting policies, are communicated throughout the Group;
• The Group appoints experienced and professional staff of the necessary calibre, both through promotion and recruitment, to fulfil their responsibilities;
• The Group maintains an annual budget process. The Board sets budgets once per year and monitors actual performance against those budgets at every Board meeting. The Board also reviews forecasts and expectations in the light of up-to-date circumstances and takes action as appropriate;
• The Audit Committee considers significant control matters. Management letter points raised by the external auditors are discussed by the Audit Committee and are dealt with as appropriate;
• The Group maintains an expenditure approval process that ensures that the Board approves major expenditure and investments; and
• The Board undertakes a review of internal controls annually.
The Group has established a Group Risk Management Register and the Board has procedures in place for regular reviews.

GOVERNANCE ANNUAL REPORT & ACCOUNTS 2017– 38 –
BRENDAN M HYNESMBA, FCMA
Non-Executive Chairman
CHRIS HOWChief Executive Officer
JANE FLETCHERBSc (Hons)
Group Sales and
Marketing Director
MARK WARRENBSc (Hons) FCCA
Group Finance Director
Brendan joined the Company as Non-Executive Chairman on 1st July 2013. He is also currently the Senior
Independent Non-Executive Director and Chairman of the Audit Committee of Churchill China plc, Non-
Executive Director of private, online education business “Webexaminer”; and a member of the Criticaleye
Advisory Board. He was CEO of Nichols plc from 2007 to 2013 having previously been Group Finance
Director. He has plc main board experience across a range of other sectors including TMT, retail, consumer
goods, buildings and automotive. Previous roles have included Executive Director at Knowledge Management
Software plc and Group Finance Director at William Baird plc a branded clothing business and Director of the
Consumer, Retail and Distribution (CRD) practice of PricewaterhouseCoopers advising Times 100 companies.
Brendan chairs the Nomination Committee and is a member of the Audit and Remuneration Committees.
Chris joined the Company as Chief Executive on 15th July 2013. He has extensive international experience
across the personal care and household sector, having held senior General Management and Sales &
Marketing positions with PZ Cussons and Colgate Palmolive. Chris has previously been Managing Director
PZ Cussons Australia; Regional Director PZ Cussons Europe, Asia, South Pacific; Managing Director PZ
Cussons UK; General Manager, Colgate Palmolive Benelux; as well as holding European and UK Sales Director
positions within Colgate Palmolive. Chris is a member of the Cosmetics, Toiletries and Perfumery Association
(CTPA) executive.
Jane joined the Company in 1996 and was promoted to the position of Group Sales and Marketing Director
in October 2004. Prior to this she gained valuable experience in product buying at Marks and Spencer. Jane
has over 20 years’ experience within the industry, working and developing products with both brands and
retailers.
Mark joined the Company in January 2010 as Group Finance Director. Mark has extensive financial,
commercial and operational management experience from across a range of customer oriented businesses
operating in global markets. Mark previously held senior roles in GEC plc, Whitbread plc, Interbrew SA,
Alpharma Inc. and Actavis.
BOARD OFDIRECTORS

ANNUAL REPORT & ACCOUNTS 2017 GOVERNANCE– 39 –
FRANKLIN BERREBIIndependent
Non-Executive Director
ROGER MCDOWELLIndependent
Non-Executive Director
EDWARD BEALENon-Executive Director
Franklin joined the Company in July 2010 and brings a wealth of international experience in the consumer
goods market having spent 33 years with L’Oréal, latterly as the Managing Director of L’Oréal Consumer
Goods Europe. Since retiring from L’Oréal in 2004 Franklin has worked with AXA Private Equity (now
Ardian) and Activa Capital, and sits on the Board of a number of companies. Franklin is a member of the
Audit, Remuneration and Nomination Committees.
Roger was reappointed to the Board in March 2012 having previously served as a Non-Executive Director
from July 2011 to January 2012. Roger is an experienced director of over 30 years’ standing: he led the
Oliver Ashworth Group through dramatic growth, main market listing and sale to St. Gobain, following which
he was appointed to a number of non-executive roles, including chairmanships in both public and private
equity backed businesses. He is currently Chairman of Avingtrans plc, and is Senior Non-Executive Director
of Servelec Group plc and Tribal Group plc. He is also a Non-Executive Director of D4T4 Solutions plc and
Proteome Sciences plc. Roger chairs the Remuneration Committee and is a member of the Audit and
Nomination Committees.
Edward joined the Company as a Non-Executive Director on 1 July 2014. Mr Beale is a Chartered Accountant
and is the Finance Director of Marshall Monteagle plc. He is a member, previously chairman, of the Corporate
Governance Committee of the Quoted Companies Alliance. He was a member of the Accounting Standards
Board of the Financial Reporting Council for six years to 31st August 2013. He is a non-executive director
of London Finance & Investment Group P.L.C., Western Selection P.L.C., Heartstone Inns Limited, and some
of their subsidiary and associated companies. Edward chairs the Audit Committee and is a member of the
Remuneration Committee.

GOVERNANCE ANNUAL REPORT & ACCOUNTS 2017– 40 –
Significant Shareholdings Shareholding Percentage of issued shares
SFM UK 2,163,000 12.8
WESTERN SELECTION 1,500,000 8.9
R & A PERSEY 1,375,936 8.2
HARGREAVE HALE LIMITED 1,167,134 6.9
OLD MUTUAL PLC 920,540 5.5
CHARLES STANLEY & CO LTD 851,250 5.0
RIVER AND MERCANTILE 750,000 4.4
FIL LIMITED 674,209 4.0
BUSINESS GROWTH FUND PLC 581,000 3.4
DIRECTORSThe Company’s current Directors are listed on page 38-39, together with their biographical details.
The Directors who served at any time during the year and since the year end were as follows:
B M Hynes M W Warren R S McDowellC G How F P Berrebi E J BealeJ M Fletcher
STRATEGIC REPORTThe Strategic Report set out on pages 10-35 provides a fair review of the Group’s business for the year ended June 2017. It also explains the objectives and strategy of the Group, its competition and the markets in which it operates, the principal risks and uncertainties it faces, employee information, the Group’s financial position, key performance indicators and likely future developments of the business.
DIRECTORS’REPORT
SHAREHOLDINGS
Save for these interests, the Directors have not been notified that any person is directly or indirectly interested in 3% or more of the issued ordinary share capital of the Company.
SUBSTANTIAL SHAREHOLDINGSAs at 18 September 2017, the following shareholders had notified the Company that they held an interest in 3% or more of its issued ordinary share capital:

ANNUAL REPORT & ACCOUNTS 2017 GOVERNANCE– 41 –
GENERAL MEETINGThis year’s Annual General Meeting will be held at the Registered Office, on Thursday 9 November 2017, at 12 noon. A separate circular has been sent to shareholders and includes the following:
• Notice of meeting;• Form of proxy;• Details and information on the resolutions to be proposed.
Grant Thornton UK LLP (‘Grant Thornton’) have expressed their willingness to continue in office as auditors and a resolution proposing their reappointment will be presented at the forthcoming Annual General Meeting.
STATEMENT OF DIRECTORS’ RESPONSIBILITIES The Directors are responsible for preparing the Annual Report and the financial statements in accordance with applicable law and regulations.
Company law requires the Directors to prepare financial statements for each financial year. Under that law the Directors have elected to prepare financial statements in accordance with International Financial Reporting Standards (IFRS) as adopted by the European Union. The financial statements are required by law to give a true and fair view of the state of affairs of the Company and the Group and of the profit or loss of the Group for that period. In preparing these financial statements, the Directors are required to:
• select suitable accounting policies and then apply them consistently;
• make judgements and estimates that are reasonable and prudent;
• state whether applicable IFRS’s have been followed, subject to any material departures disclosed and explained in the financial statements; and
• prepare financial statements on the going concern basis unless it is inappropriate to presume that the Company will continue in business.
The Directors are responsible for keeping adequate accounting records which disclose with reasonable accuracy, at any time, the financial position of the Group and enable them to ensure that the financial statements comply with the Companies Act 2006. They are also responsible for safeguarding the assets of the Group and hence for taking reasonable steps for the prevention and detection of fraud and other irregularities.
The Directors are responsible for the maintenance and integrity of the corporate and financial information on the Group’s website. Legislation in the United Kingdom governing the preparation and dissemination of the financial statements and other information included in annual reports may differ from legislation in other jurisdictions.
DISCLOSURE OF INFORMATION TO AUDITORSAt the date of making this report each of the Company’s Directors, as set out on page 38-39, confirm the following:
• so far as each Director is aware, there is no relevant information needed by the Company’s auditors in connection with preparing their report of which the Company’s auditor is unaware; and
• each Director has taken all the steps that they ought to have taken as a director in order to make themselves aware of any relevant information needed by the Company’s auditors in connection with preparing their report and to establish that the Company’s auditor is aware of that information.
By Order of the Board
Mark Warren Group Finance Director and Company Secretary 18 September 2017
Company Number: 01975376

GOVERNANCE ANNUAL REPORT & ACCOUNTS 2017– 42 –
OUR OPINION ON THE FINANCIAL STATEMENTS IS UNMODIFIED We have audited the financial statements of Swallowfield plc (the ‘company’) and its subsidiaries (the ‘group’) for the 52 week period ended 24 June 2017 which comprise the group statement of comprehensive income, the group and company statements of financial position, the group and company statements of changes in equity, the group and company cash flow statements and notes to the financial statements, including a summary of significant accounting policies. The financial reporting framework that has been applied in the preparation of the group financial statements is applicable law and International Financial Reporting Standards (IFRSs) as adopted by the European Union and, as regards the company financial statements, as applied in accordance with the provisions of the Companies Act 2006.
In our opinion:• the financial statements give a true and fair view of the state of the group’s and of the company’s affairs as at 24 June 2017
and of the group’s profit for the period then ended;• the group financial statements have been properly prepared in accordance with IFRSs as adopted by the European Union;• the company financial statements have been properly prepared in accordance with IFRSs as adopted by the European Union
and as applied in accordance with the provisions of the Companies Act 2006; and• the financial statements have been prepared in accordance with the requirements of the Companies Act 2006.
BASIS FOR OPINION We conducted our audit in accordance with International Standards on Auditing (UK) (ISAs (UK)) and applicable law. Our responsibilities under those standards are further described in the Auditor’s responsibilities for the audit of the financial statements section of our report. We are independent of the group and the company in accordance with the ethical requirements that are relevant to our audit of the financial statements in the UK, including the FRC’s Ethical Standard as applied to listed entities, and we have fulfilled our other ethical responsibilities in accordance with these requirements. We believe that the audit evidence we have obtained is sufficient and appropriate to provide a basis for our opinion.
WHO WE ARE REPORTING TOThis report is made solely to the company’s members, as a body, in accordance with Chapter 3 of Part 16 of the Companies Act 2006. Our audit work has been undertaken so that we might state to the company’s members those matters we are required to state to them in an auditor’s report and for no other purpose. To the fullest extent permitted by law, we do not accept or assume responsibility to anyone other than the company and the company’s members as a body, for our audit work, for this report, or for the opinions we have formed.
CONCLUSIONS RELATING TO GOING CONCERNWe have nothing to report in respect of the following matters in relation to which the ISAs (UK) require us to report to you where:• the directors’ use of the going concern basis of accounting in the preparation of the financial statements is not appropriate; or• the directors have not disclosed in the financial statements any identified material uncertainties that may cast significant
doubt about the group’s or the company’s ability to continue to adopt the going concern basis of accounting for a period of at least twelve months from the date when the financial statements are authorised for issue.
INDEPENDENTAUDITOR’S REPORT
TO THE MEMBERS OF SWALLOWFIELD PLC
OPINION

ANNUAL REPORT & ACCOUNTS 2017 GOVERNANCE– 43 –
OVERVIEW OF OUR AUDIT APPROACH• Overall materiality: £372,000, which represents 0.5% of total group revenues for the period ended 24 June 2017• Key audit matters were identified as the acquisition of The Brand Architekts Limited (applicable to the Group), the accounting
treatment applied in relation to share based payments (applicable to the Company), and disclosures in relation to the defined benefit pension scheme (applicable to the Company)
• We performed full scope UK statutory audit procedures on the company and significant components Swallowfield Consumer Products Limited, MR. Haircare Limited, and The Brand Architekts Limited
• Full scope audit procedures were performed by the component auditor Grant Thornton Prague on the significant component Swallowfield s.r.o.
• Analytical procedures at group level were performed by us for non-significant components Swallowfield s.a.r.l., Swallowfield Inc., and Bagsy Beauty Limited
KEY AUDIT MATTERSKey audit matters are those matters that, in our professional judgment, were of most significance in our audit of the financial statements of the current period and include the most significant assessed risks of material misstatement (whether or not due to fraud) that we identified. These matters included those that had the greatest effect on: the overall audit strategy, the allocation of resources in the audit; and directing the efforts of the engagement team. These matters were addressed in the context of our audit of the financial statements as a whole, and in forming our opinion thereon, and we do not provide a separate opinion on these matters.
KEY AUDIT MATTER - GROUP
Acquisition of The Brand Architekts LimitedOn 27 June 2016 the Group acquired the entire issued share capital of The Brand Architekts Limited. The total consideration payable was £12.08m, of which £1.85m was contingent upon The Brand Architekts Limited performance during the first 12 months post acquisition. The contingent consideration was accrued at the period end and was paid on 24 July 2017. The acquisition was financed via the issue of 5,558,985 new £0.05 Ordinary shares to raise £8.6m and a new £2.00m loan facility.
Following the acquisition of The Brand Architekts Limited a purchase price allocation exercise was performed by management to determine how the assets associated with the acquisition should be recognised within the consolidated financial statements.
Following this exercise, intangible assets with a total value of £8.21m were recognised. This total value is classified as brands (£5.09m), customer relationships (£1.65m), and goodwill (£1.47m).
Customer lists are being amortised over a ten-year period. Management considers that the brands have an indefinite useful economic life on the basis that they are well-established brands and there is no foreseeable limit on the period of time over which they are expected to contribute to cash flows. Therefore, brands are not being amortised but instead are being tested for impairment annually. In accordance with IFRSs as adopted by the European Union, goodwill is not being amortised but is being tested for impairment annually.
The acquisition was one of the most significant assessed risks of material misstatement because it is a transaction that is outside of the normal course of business.
HOW THE MATTER WAS ADDRESSED IN THE AUDIT - GROUP
Our audit work included, but was not restricted to: • An assessment of the acquire entity’s statement of financial
position at the date of acquisition to assess whether any fair value adjustments were required;
• An assessment of the reasonableness of the accounting treatment applied in relation to the share issue, directly attributable expenditure, and the contingent consideration;
• A Grant Thornton valuation specialist was engaged to assess managements purchase price allocation exercise and challenge the model and the underlying assumptions; and
• An assessment of the amortisation policies applied by management, including the charge recognised in the period, and the assertion that no impairment charge is required in the period in relation to brands and goodwill.
The group’s accounting policy on intangible assets is shown in note 1 to the financial statements and the related disclosures are included in note 13.
KEY OBSERVATIONSOur audit work did not identify any significant issues that would require us to amend the nature or scope of our planned detailed testing.
Overall, based on our audit work, our assessment is that the accounting treatment applied is considered appropriate.

GOVERNANCE ANNUAL REPORT & ACCOUNTS 2017– 44 –
KEY AUDIT MATTER - COMPANY
Share based paymentsDuring the period a charge of £1.76m (2016: £0.22m) has been recognised in relation to the Long Term Incentive Plans for executive directors (£1.48m) and the management team (£0.28m).
The transaction was one of the most significant assessed risks of material misstatement based on the material nature of the charge and the level of management judgement required in its calculation.
HOW THE MATTER WAS ADDRESSED IN THE AUDIT - COMPANY
Our audit work included, but was not restricted to: • An assessment of the method used to calculate the share
option charge;• Observation of issue documentation for new schemes
during the period; • An assessment of the reasonableness of the underlying
assumptions for all schemes; • Calculation of the expected charge and comparison with
the charge recognised in the financial statements; and • An assessment of whether the associated financial
statement disclosures are in accordance with accounting standards.
The company’s accounting policy on share based payments is shown in note 1 to the financial statements and the related disclosures are included in note 6.
KEY OBSERVATIONSOur audit work did not identify any significant issues, which would require us to amend the nature or scope of our planned detailed testing. The treatment applied is deemed to be appropriate and in accordance with accounting standards.
Defined Benefit Pension SchemeThe Company operates a defined benefit pension scheme. The valuation at 24 June 2017 shows that the pension scheme deficit has increased to £6.1m (2016: £4.5m). The value of the scheme assets is comparable at £23.3m (2016: £20.2m), with the increase in the deficit is primarily due to a decrease in the discount rate.
Accounting Standards require the discount rate to be based on yields on high quality (usually AA-rated) corporate bonds of appropriate currency, taking into account the term of the relevant pension scheme’s liabilities. Corporate bond indices are used as a proxy to determine the discount rate. At the reporting date of 24 June 2017, the yields on bonds of all types were lower than they were at 25 June 2016. This has resulted in lower discount rates being adopted for accounting purposes compared to the prior period, offset by a reduction in expectations of long term inflation, this coupled with the volatile market conditions at the reporting date impacting fair value asset valuations, has translated into an increased liability under International Accounting Standard (IAS) 19.
The transaction was one of the most significant assessed risks of material misstatement as the measurement of pension liabilities involves significant judgement and is subject to a number of complex actuarial assumptions.
Our audit work included, but was not restricted to: • An assessment of the qualifications and competency of the
valuation specialist used by management to prepare the actuarial report as at 24 June 2017;
• An assessment of the assumptions of the actuary included within the actuarial report and the associated financial statement disclosures; and
• Confirmation of all scheme assets directly with the scheme.
The company’s accounting policy on the defined benefit pension scheme is shown in note 1 to the financial statements and the related disclosures are included in note 26.
KEY OBSERVATIONSWhilst confirming the scheme assets it was identified that assets with a value of £2.4m had been omitted from the original valuation by the actuary in error, resulting in the scheme deficit being overstated by £2.4m. The required adjustment has been posted to the financial statements.
The assumptions of the actuary are considered to be appropriate, and derived on a consistent basis with those used in previous valuations. The revised associated financial statement disclosures are also considered to be appropriate.

ANNUAL REPORT & ACCOUNTS 2017 GOVERNANCE– 45 –
OUR APPLICATION OF MATERIALITYWe define materiality as the magnitude of misstatement in the financial statements that makes it probable that the economic decisions of a reasonably knowledgeable person would be changed or influenced. We use materiality in determining the nature, timing and extent of our audit work and in evaluating the results of that work.
MATERIALITY MEASURE GROUP COMPANY
Financial statements as a whole £372,000 which is 0.5% of total group revenues. This benchmark is considered the most appropriate because the business is revenue driven. Materiality for the current period is higher than the level that we determined for the period ended 25 June 2016 to reflect increased revenues following the acquisition of The Brand Architekts Limited.
£292,000 which is 0.5% of company revenues. This benchmark is considered the most appropriate because the business is revenue driven.
Materiality for the current period is higher than the level that we determined for period ended 25 June 2016 to reflect increased revenues.
Performance materiality used to drive the extent of our testing
75% of financial statement materiality. 75% of financial statement materiality.
Communication of misstatements to the audit committee
5% of financial statement materiality and misstatements below that threshold that, in our view, warrant reporting on qualitative grounds.
Directors remuneration and related party transactions and balances are material by nature and any differences identified in these areas warrant reporting.
5% of financial statement materiality and misstatements below that threshold that, in our view, warrant reporting on qualitative grounds.
Directors remuneration and related party transactions and balances are material by nature and any differences identified in these areas warrant reporting.
Materiality was determine as follows:
The graph below illustrates how performance materiality interacts with our overall materiality and the tolerance for potential uncorrected misstatements.
Tolerance forpotential uncorrected mistatements
Tolerance forpotential uncorrected mistatements
Performancemateriality
Performancemateriality
OVERALL MATERIALITY - GROUP OVERALL MATERIALITY - COMPANY
75% 75%
25% 25%

GOVERNANCE ANNUAL REPORT & ACCOUNTS 2017– 46 –
AN OVERVIEW OF THE SCOPE OF OUR AUDITOur audit approach was a risk-based approach founded on a thorough understanding of the group’s business, its environment and risk profile and in particular included: • evaluation by the group audit team of identified components to assess the significance of that component and to determine
the planned audit response based on a measure of materiality. This evaluation focused on the significance of the component based on its percentage of the group’s total assets, revenues and profit before taxation;
• a full scope UK statutory audit in respect of the company. This included an interim review, evaluation of the internal controls environment including its IT systems and controls, and attendance at two perpetual inventory counts, one of which was at period end, at the Wellington and Bideford sites;
• a full scope UK statutory audit was also performed in respect of significant components Swallowfield Consumer Products Limited, MR. Haircare Limited, and The Brand Architekts Limited. These included evaluation of the internal controls environment including IT systems and controls, and attendance at two perpetual inventory counts, one of which was at period end, at The Brand Architekts Limited;
• under instruction from us, full scope audit procedures were performed by Grant Thornton Prague in respect of significant component Swallowfield s.r.o. We performed a full review of the Grant Thornton Prague audit file. This audit included evaluation of the internal controls environment including IT systems and controls, and attendance at the period-end stock take. Regular correspondence was maintained with the component audit throughout the audit process;
• the procedures detailed above covered 100% of group revenue, 100% of group underlying profit before taxation and 100% of total group assets; and
• analytical procedures at group level were performed by us for non-significant components Swallowfield s.a.r.l., Swallowfield Inc., and Bagsy Beauty Limited.
OTHER INFORMATIONThe directors are responsible for the other information. The other information comprises the information included in the annual report, other than the financial statements and our auditor’s report thereon. Our opinion on the financial statements does not cover the other information and, except to the extent otherwise explicitly stated in our report, we do not express any form of assurance conclusion thereon.
In connection with our audit of the financial statements, our responsibility is to read the other information and, in doing so, consider whether the other information is materially inconsistent with the financial statements or our knowledge obtained in the audit or otherwise appears to be materially misstated. If we identify such material inconsistencies or apparent material misstatements, we are required to determine whether there is a material misstatement in the financial statements or a material misstatement of the other information. If, based on the work we have performed, we conclude that there is a material misstatement of this other information, we are required to report that fact.
We have nothing to report in this regard.
OUR OPINION ON OTHER MATTERS PRESCRIBED BY THE COMPANIES ACT 2006 IS UNMODIFIEDIn our opinion, based on the work undertaken in the course of the audit:
• the information given in the strategic report and the directors’ report for the financial period for which the financial statements are prepared is consistent with the financial statements; and
• the strategic report and the directors’ report have been prepared in accordance with applicable legal requirements.

ANNUAL REPORT & ACCOUNTS 2017 GOVERNANCE– 47 –
MATTERS ON WHICH WE ARE REQUIRED TO REPORT UNDER THE COMPANIES ACT 2006In the light of the knowledge and understanding of the group and the company and its environment obtained in the course of the audit, we have not identified material misstatements in the strategic report or the directors’ report.
MATTERS ON WHICH WE ARE REQUIRED TO REPORT BY EXCEPTIONWe have nothing to report in respect of the following matters in relation to which the Companies Act 2006 requires us to report to you if, in our opinion:• adequate accounting records have not been kept by the company, or returns adequate for our audit have not been received
from branches not visited by us; or• the company financial statements are not in agreement with the accounting records and returns; or• certain disclosures of directors’ remuneration specified by law are not made; or• we have not received all the information and explanations we require for our audit.
RESPONSIBILITIES OF DIRECTORS FOR THE FINANCIAL STATEMENTSAs explained more fully in the directors’ responsibilities statement set out on page 41, the directors are responsible for the preparation of the financial statements and for being satisfied that they give a true and fair view, and for such internal control as the directors determine is necessary to enable the preparation of financial statements that are free from material misstatement, whether due to fraud or error.
In preparing the financial statements, the directors are responsible for assessing the group’s and the company’s ability to continue as a going concern, disclosing, as applicable, matters related to going concern and using the going concern basis of accounting unless the directors either intend to liquidate the group or the company or to cease operations, or have no realistic alternative but to do so.
AUDITOR’S RESPONSIBILITIES FOR THE AUDIT OF THE FINANCIAL STATEMENTSOur objectives are to obtain reasonable assurance about whether the financial statements as a whole are free from material misstatement, whether due to fraud or error, and to issue an auditor’s report that includes our opinion. Reasonable assurance is a high level of assurance, but is not a guarantee that an audit conducted in accordance with ISAs (UK) will always detect a material misstatement when it exists. Misstatements can arise from fraud or error and are considered material if, individually or in the aggregate, they could reasonably be expected to influence the economic decisions of users taken on the basis of these financial statements.
A further description of our responsibilities for the audit of the financial statements is located on the Financial Reporting Council’s website at: www.frc.org.uk/auditorsresponsibilities. This description forms part of our auditor’s report.
Norman ArmstrongSenior Statutory Auditorfor and on behalf of Grant Thornton UK LLPStatutory Auditor, Chartered AccountantSouthampton18 September 2017

ANNUAL REPORT & ACCOUNTS 2017– 48 –FINANCIAL STATEMENTS
GROUP STATEMENT OF COMPREHENSIVE INCOME
For the 52 weeks ending 24 June 2017 and 25 June 2016
2017 2016 NOTES £’000 £’000
Revenue 2 74,314 54,455Cost of sales (60,404) (46,393)Gross profit 13,910 8,062Commercial and administrative costs (10,235) (6,269)Operating profit before exceptional items 3,675 1,793Exceptional items 3 (343) 645Operating profit 3,332 2,438Finance income 7 97 55Finance costs 8 (314) (219)Profit before taxation 4 3,115 2,274Taxation 9 (543) (273)Profit for the year 2,572 2,001Other comprehensive income/(loss):Items that will not be reclassified subsequently to profit or loss:Re-measurement of defined benefit liability (1,697) (2,160)Items that will be reclassified subsequently to profit or loss:Exchange differences on translating foreign operations 148 162Gain on available for sale financial assets 675 170Other comprehensive (loss) for the year (874) (1,828)Total comprehensive income for the year 1,698 173
Profit attributable to: Equity shareholders 2,554 2,001Non-controlling interests 18 -
Total comprehensive income attributable to:Equity shareholders 1,680 173Non-controlling interests 18 -
Earnings per share- basic 11 15.2 17.7p- diluted 11 14.7 17.4p
DividendsPaid in year (£’000) 10 675 317Paid in year (pence per share) 10 4.0p 2.8pProposed (£’000) 590 388Proposed (pence per share) 3.5p 2.3p
The accompanying accounting policies and notes form part of the financial statements.

ANNUAL REPORT & ACCOUNTS 2017 – 49 – FINANCIAL STATEMENTS
GROUP STATEMENT OFFINANCIAL POSITION
For the 52 weeks ending 24 June 2017 and 25 June 2016
2017 2016 NOTES £’000 £’000
ASSETSNon-current assetsProperty, plant and equipment 12 11,076 10,852Intangible assets 13 9,145 1,167Deferred tax assets 22 1,088 1,064Investments 14 1,235 560Total non-current assets 22,544 13,643Current assets Inventories 15 11,430 9,043Trade and other receivables 16 16,345 15,358Cash and cash equivalents 4,057 798Current tax receivable 88 104Total current assets 31,920 25,303Total assets 54,464 38,946
LIABILITIESCurrent liabilitiesTrade and other payables 17 23,524 20,540Interest-bearing loans and borrowings 18 534 141Current tax payable 243 122Total current liabilities 24,301 20,803Non-current liabilitiesInterest-bearing loans and borrowings 19 1,559 442Post-retirement benefit obligations 26 6,132 4,495Deferred tax liabilities 22 407 414Total non-current liabilities 8,098 5,351Total liabilities 32,399 26,154Net assets 22,065 12,792
EQUITYShare capital 23 844 566Share premium 23 11,744 3,830Revaluation of investment reserve 23 1,091 416Exchange reserve 23 (142) (290)Pension re-measurement reserve 23 (3,894) (2,197)Retained earnings 23 12,404 10,467Equity attributable to holders of the parent 22,047 12,792Non-controlling interest 18 -Total equity 22,065 12,792
The accompanying accounting policies and notes form part of the financial statements.
Approved by the Board on 18 September 2017 and signed on its behalf by
Mark WarrenGroup Finance Director and Company SecretaryCompany Number: 01975376

ANNUAL REPORT & ACCOUNTS 2017– 50 –FINANCIAL STATEMENTS
COMPANY STATEMENT OF FINANCIAL POSITION
For the 52 weeks ending 24 June 2017 and 25 June 2016
2017 2016 NOTES £’000 £’000
ASSETSNon-current assetsProperty, plant and equipment 12 10,063 9,847Intangible assets 13 1,101 1,167Deferred tax assets 22 1,090 1,059Trade and other receivables 16 - -Investments 14 15,975 3,217Total non-current assets 28,229 15,290Current assets Inventories 15 8,587 9,043Trade and other receivables 16 12,743 15,329Cash and cash equivalents 2,971 714Current tax receivable - -Total current assets 24,301 25,086Total assets 52,530 40,376
LIABILITIESCurrent liabilitiesTrade and other payables 17 23,927 23,101Interest-bearing loans and borrowings 18 534 141Current tax payable 122 100Total current liabilities 24,583 23,342Non-current liabilitiesInterest-bearing loans and borrowings 19 1,559 442Post-retirement benefit obligations 26 6,132 4,495Deferred tax liabilities 22 407 414Total non-current liabilities 8,098 5,351Total liabilities 32,681 28,693Net assets 19,849 11,683
EQUITYShare capital 23 844 566Share premium 23 11,744 3,830Revaluation of investment reserve 23 1,091 416Capital reserve 23 467 467Pension re-measurement reserve 23 (3,894) (2,197)Retained earnings 23 9,597 8,601Total equity 19,849 11,683 Company profit before taxation 1,621 2,303
The accompanying accounting policies and notes form part of the financial statements.
Approved by the Board on 18 September 2017 and signed on its behalf by
Mark WarrenGroup Finance Director and Company SecretaryCompany Number: 01975376

ANNUAL REPORT & ACCOUNTS 2017 – 51 – FINANCIAL STATEMENTS
GROUP STATEMENT OFCHANGES IN EQUITY
For the 52 weeks ending 24 June 2017 and 25 June 2016
Share Share Revaluation Exchange Pension re- Retained Non- Total Capital Premium of investment Reserve measurement Earnings controlling Equity reserve reserve interest £’000 £’000 £’000 £’000 £’000 £’000 £’000 £’000
Group balanceas at June 2016 566 3,830 416 (290) (2,197) 10,467 - 12,792Dividends - - - - - (675) - (675)Issue of new shares 278 7,914 - - - - - 8,192Non-controlling interest - - - - - - 18 18Share based payments - - - - - 58 - 58Transactions with owners 278 7,914 - - - (617) 18 7,593Profit for the year - - - - - 2,554 - 2,554Other comprehensive income: Re-measurement of defined benefit liability - - - - (1,697) - - (1,697)Exchange difference on translating foreign operations - - - 148 - - - 148Gain on available for sale financial assets - - 675 - - - - 675Total comprehensive income for the year - - 675 148 (1,697) 2,554 - 1,680Balance as at June 2017 844 11,744 1,091 (142) (3,894) 12,404 18 22,065
Share Share Revaluation Exchange Pension re- Retained Non- Total Capital Premium of investment Reserve measurement Earnings controlling Equity reserve reserve interest £’000 £’000 £’000 £’000 £’000 £’000 £’000 £’000
Group balanceas at June 2015 566 3,830 246 (452) (37) 8,771 - 12,924Dividends - - - - - (317) - (317)Share based payments - - - - - 12 - 12Transactions with owners - - - - - (305) - (305)Profit for the year - - - - - 2,001 - 2,001Other comprehensive income:Re-measurement of defined benefit liability - - - - (2,160) - - (2,160)Exchange difference on translating foreign operations - - - 162 - - - 162Gain on available for sale financial assets - - 170 - - - - 170Total comprehensive income for the year - - 170 162 (2,160) 2,001 - 173Balance as at June 2016 566 3,830 416 (290) (2,197) 10,467 - 12,792
The accompanying accounting policies and notes form part of the financial statements.

ANNUAL REPORT & ACCOUNTS 2017– 52 –FINANCIAL STATEMENTS
COMPANY STATEMENT OFCHANGES IN EQUITY
For the 52 weeks ending 24 June 2017 and 25 June 2016
Share Share Revaluation Exchange Pension re- Retained Non- Total Capital Premium of investment Reserve measurement Earnings controlling Equity reserve reserve interest £’000 £’000 £’000 £’000 £’000 £’000 £’000 £’000
Company balanceas at June 2016 566 3,830 416 467 (2,197) 8,601 - 11,683Dividends - - - - - (675) - (675)Issue of new shares 278 7,914 - - - - - 8,192Share based payments - - - - - 58 - 58Transactions with owners 278 7,914 - - - (617) - 7,575Profit for the year - - - - - 1,613 - 1,613Other comprehensive income: Re-measurement of defined benefit liability - - - - (1,697) - - (1,697)Gain on available for sale financial assets - - 675 - - - - 675Total comprehensive income for the year - - 675 - (1,697) 1,613 - 591Balance as at June 2017 844 11,744 1,091 467 (3,894) 9,597 - 19,849
Share Share Revaluation Exchange Pension re- Retained Non- Total Capital Premium of investment Reserve measurement Earnings controlling Equity reserve reserve interest £’000 £’000 £’000 £’000 £’000 £’000 £’000 £’000
Group balanceas at June 2015 566 3,830 246 467 (37) 6,860 - 11,932Dividends - - - - - (317) - (317)Share based payments - - - - - 12 - 12Transactions with owners - - - - - (305) - (305)Profit for the year - - - - - 2,046 - 2,046Other comprehensive income:Re-measurement of defined benefit liability - - - - (2,160) - - (2,160)Gain on available for sale financial assets - - 170 - - - - 170Total comprehensive income for the year - - 170 - (2,160) 2,046 - 56Balance as at June 2016 566 3,830 416 467 (2,197) 8,601 - 11,683
The accompanying accounting policies and notes form part of the financial statements.

ANNUAL REPORT & ACCOUNTS 2017 – 53 – FINANCIAL STATEMENTS
CASH FLOWSTATEMENT
For the 52 weeks ending 24 June 2017 and 25 June 2016
Group Company 2017 2016 2017 2016 £’000 £’000 £’000 £’000
Cash flow from operating activitiesProfit before taxation 3,115 2,274 1,621 2,303Depreciation 1,249 1,152 990 973Amortisation 239 67 74 67Loss on disposal of property, plant and equipment - 41 - 41Non-cash pension scheme curtailment gain - (870) - (870)Finance income (97) (55) (1,100) (66)Finance cost 314 219 313 219(Increase)/Decrease in inventories (2,387) (2,550) 456 (2,550)(Increase)/Decrease in trade and other receivables (995) (4,956) 2,555 (4,778)Increase/(Decrease) in trade and other payables 2,074 7,152 (4,534) 6,914Increase in share-based payments provision 1,755 222 1,755 222Contributions to defined benefit plans (108) (321) (108) (321)Current service cost of defined benefit plan - 305 - 305Cash generated from operations 5,159 2,680 2,022 2,459Finance expense paid (165) (134) (164) (134)Taxation paid (1,142) (10) (94) (10)Net cash flow from operating activities 3,852 2,536 1,764 2,315Cash flow from investing activitiesDividend income received 97 55 1,097 66Purchase of property, plant and equipment (1,367) (1,181) (1,207) (1,032)Purchase of intangible assets (8) (34) (8) (34)Purchase of subsidiary (9,401) - (9,401) -Net cash flow from investing activities (10,679) (1,160) (9,519) (1,000)Cash flow from financing activities Proceeds / (repayment) on invoice discounting facility 1,059 (272) 982 (272)Proceeds from new loan 2,000 - 2,000 -Issue of new share capital 8,192 - 8,192 -(Repayment) of loans (490) (137) (490) (137)Finance income received - - 3 -Dividends paid (675) (317) (675) (317)Net cash flow from financing activities 10,086 (726) 10,012 (726)Net increase in cash and cash equivalents 3,259 650 2,257 589Cash and cash equivalents at beginning of year 798 148 714 125Cash and cash equivalents at end of year 4,057 798 2,971 714
The accompanying accounting policies and notes form part of the financial statements.

ANNUAL REPORT & ACCOUNTS 2017– 54 –FINANCIAL STATEMENTS
NOTES TOTHE ACCOUNTS
NOTE 1 SIGNIFICANT ACCOUNTING POLICIES
GENERAL INFORMATIONSwallowfield plc is a Company incorporated in the United Kingdom under the Companies Act 2006. The address of the registered office is given on page 86. The nature of the Group’s operations and its principal activities are set out in the Strategic Report.
BASIS OF PREPARATIONThe Group has prepared its consolidated financial statements in accordance with International Financial Reporting Standards (IFRS) as adopted by the European Union and also in accordance with IFRS issued by the International Accounting Standards Board. These financial statements have been prepared under the historical cost convention, modified to include the revaluation of certain non-current assets and financial instruments.
The Directors have considered trading and cash flow forecasts prepared for the Group, and based on these, and the confirmed banking facilities, are satisfied that the Group will continue to be able to meet its liabilities as they fall due for at least one year from the date of signing of these accounts. On this basis, they consider it appropriate to adopt the going concern basis in the preparation of these accounts.
The consolidated financial statements are presented in sterling and all values are rounded to the nearest thousand (£’000) except where otherwise indicated.
BASIS OF CONSOLIDATIONThe Group financial statements consolidate the financial statements of the Company and its subsidiary undertakings. The results and net assets of undertakings acquired or disposed of during a financial year are included in the Group Statement of Comprehensive Income and Group Statement of Financial Position from the effective date of acquisition or to the effective date of disposal. Subsidiary undertakings have been consolidated using the purchase method of accounting. In accordance with the exemptions given by section 408 of the Companies Act 2006, the Company has not presented its own Statement of Comprehensive Income. The Company’s profit before tax for the year to June 2017 was £1.621m (2016: profit before tax £2.303m).
The Group financial statements consolidate those of the parent company and all of its subsidiaries as of June 2017. The parent controls a subsidiary if it is exposed, or has rights, to variable returns from its involvement with the subsidiary and has the ability to affect those returns through its power over the subsidiary. All subsidiaries have a reporting date of June.
All transactions and balances between Group companies are eliminated on consolidation, including unrealised gains and losses on transactions between Group companies. Amounts reported in the financial statements of subsidiaries have been adjusted where necessary to ensure consistency with the accounting policies adopted by the Group.
Profit or loss and other comprehensive income of subsidiaries acquired or disposed of during the year are recognised from the effective date of acquisition, or up to the effective date of disposal, as applicable.
BUSINESS COMBINATIONSThe acquisition method of accounting is used to account for all business combinations, regardless of whether equity instruments or other assets are acquired. The consideration transferred for the acquisition of a subsidiary comprises the:
• fair values of the assets transferred
• liabilities incurred to the former owners of the acquired business
• equity interests issued by the group
• fair value of any asset or liability resulting from a contingent consideration arrangement, and
• fair value of any pre-existing equity interest in the subsidiary.
Identifiable assets acquired and liabilities and contingent liabilities assumed in a business combination are, with limited exceptions, measured initially at their fair values at the acquisition date. The group recognises any non-controlling interest in the acquired entity on an acquisition-by-acquisition basis either at fair value or at the non-controlling interest’s proportionate share of the acquired entity’s net identifiable assets.
Acquisition-related costs are expensed as incurred.
The excess of the• consideration transferred,• amount of any non-controlling interest in the acquired
entity, and• acquisition-date fair value of any previous equity interest in
the acquired entityover the fair value of the net identifiable assets acquired is recorded as goodwill. If those amounts are less than the fair value of the net identifiable assets of the business acquired, the difference is recognised directly in profit or loss as a bargain purchase.

ANNUAL REPORT & ACCOUNTS 2017 – 55 – FINANCIAL STATEMENTS
Where settlement of any part of cash consideration is deferred, the amounts payable in the future are discounted to their present value as at the date of exchange. The discount rate used is the entity’s incremental borrowing rate, being the rate at which a similar borrowing could be obtained from an independent financier under comparable terms and conditions.
Contingent consideration is classified either as equity or a financial liability. Amounts classified as a financial liability are subsequently remeasured to fair value with changes in fair value recognised in profit or loss.
INTANGIBLE ASSETS(i) Computer softwareComputer software is stated at cost less accumulated amortisation. Computer software is amortised on a straight-line basis over the expected useful life of 3 years.
(ii) Research and developmentExpenditure on the research phase of projects to develop new products is recognised as an expense as incurred.Costs that are directly attributable to a project’s development phase are recognised as intangible assets, provided they meet the following recognition requirements:• the development costs can be measured reliably• the project is technically and commercially feasible• the Group intends to and has sufficient resources to
complete the project• the Group has the ability to use or sell the development• the development will generate probable future economic
benefits.
Development costs not meeting these criteria for capitalisation are expensed as incurred.
Any capitalised development costs that are not yet complete are not amortised but are subject to impairment testing. Complete development projects are amortised on a straight-line basis over 5 years.
(iii) Brand names and customer relationshipsBrand names and customer relationships acquired are recognised as intangible assets at their fair values (see note 13).
Customers relationships are amortised on a straight-line basis over 5 or 10 years, based on evaluation at point of acquisition.
Brand names are considered to have an indefinite life and are tested for impairment annually. This is on the basis that the brand is well established and there is no foreseeable limit on the period of time over which it is expected to contribute to cash flow.
(iv) GoodwillAn impairment test is undertaken where there are indicators of impairment or on an annual basis where intangible assets are determined to have an infinite useful life such as brands and goodwill. Brands and goodwill are combined together as part of the same CGU and tested together using a discounted cash flow approach.
PROPERTY, PLANT AND EQUIPMENTProperty, plant and equipment are stated at cost less accumulated depreciation. Where there is evidence of impairment, property, plant and equipment is written down to its recoverable amount. Any such write down is charged to the profit or loss for the year. Property, plant and equipment are depreciated on a straight-line basis over their expected useful lives as follows:
Freehold buildings 2% per annumPlant and machinery 6.7% to 33% per annum
Freehold land is not depreciated.
IMPAIRMENT OF ASSETSAn impairment test is performed annually where required and whenever events and circumstances indicate that the carrying value of an asset may exceed its recoverable amount. The carrying value is compared against the expected recoverable amount of the asset, generally by reference to the present value of the future net cash flows expected to be derived from that asset.
INVENTORIESInventories are stated at the lower of cost and net realisable value. Costs are those incurred in bringing each product to its present location and condition. In the case of raw materials, cost comprises purchase costs including transport costs, calculated on a first-in, first-out basis. In the case of work in progress and finished goods, cost comprises direct material, direct labour plus attributable overheads. Net realisable value is based on estimated selling price, less further costs expected to be incurred to completion and disposal.
TAXATIONCurrent tax is the tax payable based on taxable profit for the year.
Deferred income taxes are calculated using the liability method on temporary differences. Deferred tax is generally provided on the difference between the carrying amounts of assets and liabilities and their tax bases. Deferred tax on temporary differences associated with shares in subsidiaries is not provided if reversal of these temporary differences can be controlled by the Group and it is probable that reversal will not occur in the foreseeable future. In addition, tax losses

ANNUAL REPORT & ACCOUNTS 2017– 56 –FINANCIAL STATEMENTS
available to be carried forward as well as other income tax credits to the Group are assessed for recognition as deferred tax assets.
Deferred tax liabilities are provided in full, with no discounting. Deferred tax assets are recognised to the extent that it is probable that the underlying deductible temporary differences will be able to be offset against future taxable income. Current and deferred tax assets and liabilities are calculated at tax rates that are expected to apply to their respective period of realisation, provided they are enacted or substantively enacted at the Statement of Financial Position date.
Changes in deferred tax assets or liabilities are recognised in profit or loss as a component of tax expense in the Statement of Comprehensive Income, except where they relate to items that are charged or credited directly to equity (such as the revaluation of land) in which case the related deferred tax is also charged or credited directly to equity.
FOREIGN CURRENCIESTrading transactions denominated in foreign currencies are recorded in sterling at actual rates as at the date of the transaction. Monetary assets and liabilities denominated in foreign currencies are retranslated at the middle market rates ruling at the Statement of Financial Position date. Such exchange differences are recognised in the profit or loss for the year.
The assets and liabilities in the financial statements of foreign subsidiaries are translated at the rate of exchange ruling at the Statement of Financial Position date. Income and expenses are translated at the actual rate. The exchange differences arising from the retranslation of foreign operations are charged / credited to other comprehensive income and recognised in the ‘Exchange reserve’ in equity. On disposal of a foreign operation, the cumulative translation differences are reclassified from equity to profit or loss.
REVENUE RECOGNITIONRevenue is measured at the fair value of the consideration received or receivable and represents amounts receivable for goods provided in the normal course of business, net of discounts and rebates, VAT and other sales-related taxes. Revenue is recognised when the Group has transferred the significant risks and rewards of ownership to the customer, which is generally when the production of goods is complete, the customer has accepted title of the goods under contractual shipping arrangements and collectability of the related receivables is reasonably assured.
LEASED ASSETSOperating lease rental payments are charged to profit or loss on a straight line basis over the term of the lease.
EMPLOYEE BENEFITSPension obligationsThe Group operates both defined benefit and defined contribution pension schemes.
i) Defined benefit schemesScheme assets are measured at fair values. Defined benefit pension scheme liabilities are measured by an independent actuary using the projected unit method and discounted at the current rate of return on high quality corporate bonds of equivalent term and currency to the liability. The increase in the present value of the liabilities of the Group’s defined benefit pension schemes expected to arise from employee service in the year is charged to operating profit. The scheme was closed to future accrual on 31 December 2015. The expected return on the scheme’s assets and the increase during the year in the present value of the scheme’s liabilities, arising from the passage of time, are included in other finance income or cost.
ii) Defined contribution schemesCosts of defined contribution pension schemes are charged to the profit or loss in the year they fall due.
iii) Share-based Payment TransactionsThe value, as at the grant date, of options granted to employees is recognised as an employee expense, with a corresponding increase in equity, over the period in which the employees become unconditionally entitled to the options. The fair value of the options granted is measured using an option valuation model, taking into account the terms and conditions upon which the options were granted.
For cash-settled share-based payment transactions, the liability needs to be re-measured at the end of each reporting period up to the date of settlement, with any changes in fair value recognised in the profit or loss.
FINANCIAL ASSETSThe Group’s financial assets consist of loans and receivables; financial assets at fair value through profit or loss and available-for-sale financial assets. Financial assets are assigned to the different categories by management on initial recognition, depending on the purpose for which they were acquired.
Loans and receivables are non-derivative financial assets with fixed or determinable payments that are not quoted in an active market. Trade and other receivables are classified as loans and receivables. Loans and receivables are measured subsequent to initial recognition at amortised cost using the effective interest method, less provision for impairment. Any change in their value through impairment or reversal of impairment is recognised in the profit or loss.
Provision against trade receivables is made when there is objective evidence that the Group will not be able to collect all amounts due to it in accordance with the original terms

ANNUAL REPORT & ACCOUNTS 2017 – 57 – FINANCIAL STATEMENTS
of those receivables. The amount of the write-down is determined as the difference between the asset’s carrying amount and the present value of estimated future cash flows.
Available for sale financial assets are measured at fair value with gains or losses being recognised in other comprehensive income and reported within the available sales reserve within equity. Where fair value cannot be reliably estimated such assets are reviewed for impairment annually. Impairment charges are recognised in profit or loss.
CASH AND CASH EQUIVALENTSCash and cash equivalents comprise cash on hand and on demand deposits, together with other short-term, highly liquid investments that are readily convertible into known amounts of cash and which are subject to an insignificant risk of changes in value. The Group considers overdrafts (repayable on demand) to be an integral part of its cash management activities and these are included in cash and cash equivalents for the purposes of the Cash Flow Statement.
FINANCIAL LIABILITIESThe Group’s financial liabilities consist of bank borrowings, trade and other payables.
Financial liabilities are obligations to pay cash or other financial assets and are recognised when the Group becomes a party to the contractual provisions of the instrument. Financial liabilities categorised as at fair value through profit or loss are recorded initially at fair value, all transaction costs are recognised immediately in the profit or loss. All other financial liabilities are recorded initially at fair value, net of direct issue costs.
Financial liabilities categorised as at fair value through profit or loss are re-measured at each reporting date at fair value, with changes in fair value being recognised in the profit or loss. All other financial liabilities are carried subsequently at amortised cost using the effective interest method, with interest-related charges recognised as an expense in finance cost in the profit or loss. Finance charges, including premiums payable on settlement or redemption and direct issue costs, are charged to the profit or loss on an accruals basis using the effective interest method and are added to the carrying amount of the instrument to the extent that they are not settled in the period in which they arise.
Financial liabilities are categorised as at fair value through profit or loss where they are classified as held-for-trading or designated as at fair value through profit or loss on initial recognition. A financial liability is derecognised only when the obligation is extinguished, that is, when the obligation is discharged or cancelled or expires.
DISTRIBUTIONS TO SHAREHOLDERSDividends and other distributions to shareholders are reflected in financial statements when approved by shareholders in a general meeting, except for interim dividends which are
included in financial statements when paid by the Company. Accordingly, proposed dividends are not included as a liability in the financial statements.
EXCEPTIONAL ITEMSExceptional items are non-recurring material items which are outside the normal scope of the Group’s ordinary activities such as liabilities and costs arising from a fundamental restructuring of the Group’s operations.
SIGNIFICANT MANAGEMENT JUDGEMENT IN APPLYING ACCOUNTING POLICIESThe following are significant management judgements in applying the accounting policies of the Group that have the most significant impact on the financial statements:
Deferred TaxationThe Group has not made full provision for deferred taxation on the full carrying value of the Group’s land and buildings, on the basis that the full value of these assets will be recovered through sale and not through use and that indexation will result in no taxable gain arising on disposal.
KEY SOURCES OF ESTIMATION UNCERTAINTYIn applying the above accounting policies, the Group has made appropriate estimates in a number of areas and the actual outcome may differ from those calculated. The key sources of estimation uncertainty at the year-end that may have a risk of causing material adjustment to the carrying amounts of assets and liabilities within the next financial year are as follows:
Fair value on acquisition Judgement and estimates arise in the determination and fair value of intangible and tangible assets and contingent and other liabilities arising when acquiring a business. The valuation of externally acquired assets such as brands and customer lists require judgement regarding estimated future cash flows arising for those established assets, discounted to reflect the time value of money. Judgement is also used in determining the useful economic life and amortisation periods. Further information is included in Note 13.
Impairment reviewsAn impairment test is undertaken where there are indicators of impairment or on an annual basis where intangible assets are determined to have an infinite useful life such as brands and goodwill using a discounted cash flow approach. Note 13 discloses the assumptions used.
Share based paymentsThe balance is significant due to its judgemental nature and the high level of estimation uncertainty. The Group’s accounting policy on share based payments is shown in note 1 and related disclosures are included in note 6.

ANNUAL REPORT & ACCOUNTS 2017– 58 –FINANCIAL STATEMENTS
Post-retirement benefitsThe Group’s defined benefit pension scheme is assessed annually. The value in these accounts which has been based on the assumptions of an independent actuary resulted in a deficit of £6.1m (2016: £4.5m) before deferred taxation. The size of the deficit is sensitive to the market value of the underlying scheme investments and the actuarial assumptions which include price inflation, pension and salary increases, the discount rate used in assessing the liabilities, mortality rates, and other demographic factors. Further details are included in Note 26.
STANDARDS IN ISSUE BUT NOT YET EFFECTIVEAt the date of authorisation of these financial statements, certain new standards, amendments and interpretations to existing standards have been published by the IASB but are not yet effective, and have not been adopted early by the Group.
Management anticipates that all of the relevant pronouncements will be adopted in the Group’s accounting policies for the first period beginning after the effective date of the pronouncement. Information on new standards, amendments and interpretations that are expected to be relevant to the Group’s financial statements is provided below. Certain other new standards and interpretations have been issued but are not expected to have a material impact on the Group’s financial statements.
IFRS 9 ‘FINANCIAL INSTRUMENTS’The IASB have released IFRS 9 ‘Financial Instruments’, representing the completion of its project to replace IAS 39 ‘Financial Instruments: Recognition and Measurement’. The new standard introduces extensive changes to IAS 39’s guidance on the classification and measurement of financial assets and introduces a new ‘expected credit loss’ model for the impairment of financial assets. IFRS 9 also provides new guidance on the application of hedge accounting.The Group’s management have yet to assess the impact of IFRS 9 on these consolidated financial statements. The new standard is required to be applied for annual reporting periods beginning on or after 1 January 2018.
IFRS 15 ‘REVENUE FROM CONTRACTS WITH CUSTOMERS’IFRS 15 presents new requirements for the recognition of revenue, replacing IAS 18 ‘Revenue’, IAS 11 ‘Construction Contracts’, and several revenue-related Interpretations. The new standard establishes a control-based revenue recognition model and provides additional guidance in many areas not covered in detail under existing IFRSs, including how to account for arrangements with multiple performance obligations, variable pricing, customer refund rights, supplier repurchase options, and other common complexities.IFRS 15 is effective for reporting periods beginning on or after 1 January 2018. The Group’s management have not yet assessed the impact of IFRS 15 on these consolidated financial statements.
IFRS 16 ‘LEASES’IFRS 16 represents new requirements for the recognition of operating leases, replacing IAS 17 ‘Leases’. The new standard requires that certain operating leases are disclosed within the Statement of Financial Position.The Group’s management have yet to assess the impact of IFRS 16 on these consolidated financial statements. The new standard is required to be applied for annual reporting periods beginning on or after 1 January 2019.

ANNUAL REPORT & ACCOUNTS 2017 – 59 – FINANCIAL STATEMENTS
NOTE 2 SEGMENTAL ANALYSIS
The Group is a market leader in the development, formulation, and supply of personal care and beauty products.
The reportable segments of the Group are aggregated as follows:• Brands – we leverage our skilled resources to develop and market a growing portfolio of Swallowfield owned and managed
brands. These include organically developed Bagsy, MR. and Tru, plus the acquisitions of The Real Shaving Company (in 2015) and the portfolio of brands included in The Brand Architekts acquisition, acquired at the start of this financial year. This latter acquisition brings critical mass to our owned brands and has therefore changed the segmental analysis for this year.
• Manufacturing – the development, formulation and production of quality products for many of the world’s leading personal care and beauty brands.
• Eliminations and Central Costs. Other Group-wide activities and expenses, including defined benefit pension costs (closed defined benefit scheme), share-based payment expenses, amortisation of acquisition-related intangibles, interest, taxation and eliminations of intersegment items, are presented within ‘Eliminations and central costs’.
This is the basis on which the Group presents its operating results to the Directors, which is considered to be the Chief Operating Decision Maker (CODM) for the purposes of IFRS 8.
No comparative figures are shown as it is only since the acquisition of The Brand Architekts that this segmentation has been adopted. Prior to this brand performance was not considered to be sufficiently material to be separately reported. Comparative full year numbers have been presented on the same basis.
a) Principal measures of profit and loss – Income Statement segmental information:
Eliminations and Central 2016 Brands Manufacturing Costs Total Total52 weeks ended 24 June 2017 £’000 £’000 £’000 £’000 £’000
UK revenue 13,630 31,102 - 44,732 31,868International revenue 4,276 25,306 - 29,582 22,587Revenue – External 17,906 56,408 - 74,314 54,455Revenue – Internal - 1,572 (1,572) - -Total revenue 17,906 57,980 (1,572) 74,314 54,455Underlying profit/(loss) from operations 2,910 4,822 (2,115) 5,617 2,015Charge for share-based payments - - (1,755) (1,755) (222)Amortisation of acquisition-related intangibles - - (187) (187) -Exceptional costs - - (343) (343) 645Net borrowing costs - - (217) (217) (164)Profit/(loss) before taxation 2,910 4,822 (4,617) 3,115 2,274Tax charge (543) (543) (273)Profit/(loss) for the period 2,910 4,822 (5,160) 2,572 2,001
The segmental Income Statement disclosures are measured in accordance with the Group’s accounting policies as set out in note 1.
Inter segment revenue earned by manufacturing from sales to brands is determined on normal commercial trading terms as if brands were any other third-party customer.
All defined benefit pension costs and share-based payment expenses are recognised for internal reporting to the CODM as part of Group-wide activities and are included within ‘Eliminations and central costs’ above. Other costs, such as Group insurance and auditors’ remuneration which are incurred on a Group-wide basis are recharged by the head office to segments on a reasonable and consistent basis for all periods presented, and are included within segment results above.

ANNUAL REPORT & ACCOUNTS 2017– 60 –FINANCIAL STATEMENTS
c) Principal measures of assets and liabilities
The Groups assets and liabilities are managed centrally by the CODM and consequently there is no reconciliation between the Group’s assets per the statement of financial position and the segment assets.
d) Additional entity-wide disclosures
The distribution of the Group’s external revenue by destination is shown below:
Eliminations and Central Brands Manufacturing Costs Total52 weeks ended 24 June 2017 £’000 £’000 £’000 £’000
Depreciation 22 1,227 - 1,249Amortisation - 52 - 52
Geographical segments 52 weeks ended 52 weeks ended 24 June 2017 25 June 2016 £’000 £’000UK 44,732 31,868Other European Union countries 23,012 20,577Rest of the World 6,570 2,010 74,314 54,455
b) Other Income Statement segmental information
The following additional items are included in the measures of underlying profit and loss reported to the CODM and are included within (a) above:
In the 52 weeks ended 24 June 2017, the Group had two customers that exceeded 10% of total revenues, being 13% and 12% respectively. In the 52 weeks ended 25 June 2016, the Group had two customers that exceeded 10% of total revenues, this being 18% and 19% respectively.
In 2017 the Group had non-current assets held overseas of £2,229,000 (2016: £1,565,000).
NOTE 3 EXCEPTIONAL ITEMSUnder exceptional Items we have recognised costs associated with The Brand Architekts acquisition which completed on 27 June 2016. The prior year exceptional item is a non-cash curtailment gain arising from the closure of the company’s Defined Benefit pension scheme to further accrual.

ANNUAL REPORT & ACCOUNTS 2017 – 61 – FINANCIAL STATEMENTS
NOTE 4 PROFIT BEFORE TAXATION 2017 2016 £’000 £’000
(a) This is stated after charging/ (crediting) Depreciation of property, plant and equipment of purchased assets 1,249 1,152Amortisation of intangible assets 239 67Research and development 1,049 920Foreign exchange losses 104 49Operating leases: Hire of plant and machinery 58 73Rent of buildings 646 552Loss on disposal of property, plant and equipment - 41
(b) Auditors’ remunerationAudit services:Audit of the Company financial statements 42 42Audit of subsidiary undertakings 23 6Audit related assurance services:Interim review 7 7Taxation compliance services:Corporation tax compliance 13 8Other assurance services:iXBRL tagging 3 2Merger and acquisition advice 5 -Services relating to corporate finance transactions:Acquisition of The Brand Architekts Limited 81 -
(c) Earnings before interest, taxation, depreciation and amortisation (‘EBITDA’)Operating profit before exceptional items 3,675 1,793Depreciation of property, plant and equipment 1,249 1,152Amortisation of intangible assets 52 67Amortisation of acquisition-related intangibles 187 -Loss on disposal of property, plant, and equipment - 41EBITDA before exceptional operating items 5,163 3,053Exceptional operating items (343) 645EBITDA after exceptional operating items 4,820 3,698
NOTE 5 STAFF COSTS 2017 2016 £’000 £’000Wages and salaries 13,528 11,575Social security costs 1,511 1,180Other pension costs 870 777 15,909 13,532

ANNUAL REPORT & ACCOUNTS 2017– 62 –FINANCIAL STATEMENTS
The average monthly number of employees, including executive Directors, during the year was:
All of the 183,620 new Options granted under the LTIP on 15 July 2016 have two performance conditions attached to them. The first 50% of the award is linked to certain share price targets and the remaining 50% is linked to earning per share targets. To the extent that both of the performance conditions are met at the end of the three-year performance cycle, then the Options can be exercised at nil cost. Upon vesting, half of each award will be made in shares with the balance being made in cash.
The mid-market price of the ordinary shares on 24 June 2017 was 395p (2016: 180p) and the range during the 52-week period to 24 June 2017 was 168.5p to 417.5p (52 weeks to 25 June 2016: 108.0p to 207.5p).
The total number of ordinary shares subject to options and which could, in the future, be issued is 547,929. This represents 3.25% of the issued share capital of the Company which comprised 16,865,401 Ordinary Shares at the reporting date.
With effect from April 2016 Mr How has taken additional base salary in lieu of company pension contributions.
2017 2016 Number NumberProduction 433 444Distribution 95 84Administration 63 48 591 576
Remuneration in respect of Directors was as follows:
Salary Pension Total Total /Fees Bonus Benefits Contributions 2017 2016Executive Directors C G How 219 92 32 - 343 355J M Fletcher 117 45 16 30 208 221M W Warren 117 45 16 30 208 234Non-Executive DirectorsB M Hynes 56 - - - 56 50E J Beale 28 - - - 28 26F P Berrebi 32 - - - 32 37R S McDowell 28 - - - 28 26 597 182 64 60 903 949
Number of Number of Number of Number Earliest Exercise Shares Shares Shares Lapsed of Shares Exercise Exercise Expiry at June 2016 Awarded in the year at June 2017 Price Date Date in year
C G How 113,715 - - 113,715 95p 6/12/17 5/12/24J M Fletcher 55,702 - - 55,702 95p 6/12/17 5/12/24M W Warren 55,702 - - 55,702 95p 6/12/17 5/12/24C G How - 46,376 - 46,376 Nil 16/7/19 15/7/26J M Fletcher - 22,717 - 22,717 Nil 16/7/19 15/7/26M W Warren - 22,717 - 22,717 Nil 16/7/19 15/7/26Total share options 225,119 91,810 - 316,929Phantom / cash settledshare options:C G How 230,875 - - 230,875 95p 6/12/17 5/12/24J M Fletcher 113,093 - - 113,093 95p 6/12/17 5/12/24M W Warren 113,093 - - 113,093 95p 6/12/17 5/12/24C G How - 46,376 - 46,376 Nil 16/7/19 15/7/26J M Fletcher - 22,717 - 22,717 Nil 16/7/19 15/7/26M W Warren - 22,717 - 22,717 Nil 16/7/19 15/7/26Total phantom 457,061 91,810 - 548,871

ANNUAL REPORT & ACCOUNTS 2017 – 63 – FINANCIAL STATEMENTS
NOTE 6 SHARE BASED EMPLOYEE REMUNERATIONExecutive and Managers Share Option Scheme
The Group operates both approved and unapproved share option schemes.
There have been a number of options granted during the course of the financial year to 24 June 2017 with further details given below:
The Company has used the QCA-IRS option valuer TM (based on the Black-Scholes-Merton based option pricing model) to calculate the fair value of the outstanding share options. This model was developed by The QCA partnered with Independent Remuneration Solutions (IRS) and City Group Plc. The development was led by Mr Edward Beale, a Director of the Group, and at that time Chief Executive of City Group Plc.
Year-ended June 2015 awards
All of the 225,119 share options and 457,061 phantom share options granted have a performance condition attached to them, linked to certain stretching share price targets ranging from a threshold at £1.80 to the full award at a share price of £2.20; and to the extent that the performance condition is met, have an exercise price of £0.95.
The phantom share options do not result in any dilution. The difference between the share price target achieved and the notional exercise price would become payable in cash. The phantom options are designed to finance the exercise of the share options and cover the tax liabilities.
The performance conditions are as follows:
With the percentage of the quantity of shares vesting pro-rated between these levels.
The performance conditions have exceeded 240p and as a consequence the % awarded will be 120% of the quantity outlined above.
Amount Number Number of expensed of share phantom Fair in year-ended Period of options options Exercise value June 2017 expenseDate of grant granted granted price pence £’000 (restated)
5 December 2014 – exec share options 225,119 - 95.0p 13p 11 3 years5 December 2014 – exec phantom share options - 457,061 95.0p 285p 1,280 3 years31 October 2014 – managers phantom share options - 128,000 100.0p 280p 280 3 years15 July 2016 – exec share options 91,810 - Nil 165p 55 3 years15 July 2016 – exec cash-settled share options - 91,810 Nil 369p 128 3 years16 June 2017 – managers share options 231,000 - 367.5p 47p 1 3 yearsTotal Options Granted 547,929 676,871Charge relating to options granted in the prior year 11Charge relating to phantoms granted in the prior year 1,560Charge relating to options granted in the current year 56Charge relating to phantoms granted in the current year 128Charge included in Administration expenses 1,755
Share price vesting thresholds % awardedShare price below 180p NilShare price 180p 30%Share price 200p 50%Share price 210p 75%Share price 220p 100%Share price 240p 120%

ANNUAL REPORT & ACCOUNTS 2017– 64 –FINANCIAL STATEMENTS
Year-ended June 2017 awards
All of the 183,620 new Options granted under the LTIP on 15 July 2016 have two performance conditions attached to them. The first 50% of the award is linked to certain share price targets and the remaining 50% is linked to earning per share targets. To the extent that both of the performance conditions are met at the end of the three-year performance cycle, then the Options can be exercised at nil cost. Upon vesting, half of each award will be made in shares with the balance being made in cash.
The managers share options were issued on 16 June 2017 under a Company Share Option Scheme (CSOP), and have an exercise price of 367.5p and no performance conditions attached, with vesting after a minimum of three-years and a maximum of ten-years.
The inputs into the Black-Scholes-Merton based option pricing model to calculate the charge for exec share options granted in the financial year were as follows:
Volatility is calculated on a consistent basis for each grant of options and is based on the historic annualised standard deviation of continuously compounded rates of return over the three years preceding the date of award.
Detailed in Note 5 is a summary of awards outstanding at the end of the year.
2017Expected life of option 3 yearsVolatility of share price 23%Dividend yield 1.8%Risk-free interest rate 1.7%Share price at date of grant 180pExercise price (threshold required to exercise option) Nil pBid price discount 3%Estimated conversion rate 100%Fair value per option 165p
NOTE 7 FINANCE INCOME 2017 2016 £’000 £’000 Dividend income 97 55 97 55
NOTE 8 FINANCE COSTS 2017 2016 £’000 £’000 Bank loans and overdrafts 165 134 Net pension scheme costs 149 85 314 219
NOTE 9 TAXATION 2017 2016 £’000 £’000 (a) Analysis of tax charge in the year UK corporation tax: - on profit for the year 718 116 - adjustment in respect of previous years (69) - -foreign tax 10 16 -double tax relief - Total current tax charge 659 132 Deferred tax: -current year (credit) / charge (37) 138 -prior year (credit) (102) (19) -effect of tax rate change on opening balance 23 22 Total deferred tax (116) 141 Tax charge 543 273

ANNUAL REPORT & ACCOUNTS 2017 – 65 – FINANCIAL STATEMENTS
(b) Factors affecting total tax charge for the year
The tax assessed on the profit before taxation for the year is lower (2016: lower) than the standard rate of UK corporation tax of 19.75% (2016: 20%). The differences are reconciled below:
(c) Factors that may affect future tax charges
Provision has not been made for deferred taxation on the Group’s land and buildings on the basis that the principal location will be sold in the short to medium term, and that the majority of its value will therefore be recovered through sale. Because of this no tax liability is expected to arise and therefore no provision has been made in relation to deferred taxation.
There are potential reductions arising from any Research and Development tax credits when received which may affect future tax charges.
2017 2016 £’000 £’000 Profit before taxation 3,115 2,274 Tax at the applicable rate of 19.75% (2016: 20%) 615 455 Effect of: Adjustment in respect of previous years (149) (19) Adjustment to deferred tax 6 (147) Differences between UK and foreign tax rates 12 4 Permanent differences and other 79 - R&D tax credit (20) (20) Actual tax charge 543 273
NOTE 10 PAYMENTS TO SHAREHOLDERS
2017 2016 £’000 £’000
Final dividend paid - 2.3p (2016: 2.0p) per share 388 226Interim dividend paid - 1.7p (2016: 0.8p) per share 287 91 675 317
The Directors have recommended the payment of a final dividend of 3.5p per share (2016: 2.3p).
NOTE 11 EARNINGS PER SHARE
2017 2016 £’000 £’000Basic and Diluted Profit for the year (£’000) 2,554 2,001 Basic weighted average number of ordinary shares in issue during the year 16,834,773 11,306,416 Diluted number of shares 17,382,702 11,531,535 Basic earnings per share 15.2p 17.7p Diluted earnings per share 14.7p 17.4p
Basic earnings per share has been calculated by dividing the profit for each financial year by the weighted average number of ordinary shares in issue at 24 June 2017 and 25 June 2016 respectively. There is a difference at June 2017 between the basic net earnings per share and the diluted net earnings per share of 0.5p due to the 547,929 share options awarded.

ANNUAL REPORT & ACCOUNTS 2017– 66 –FINANCIAL STATEMENTS
Adjusted profit for the current year of £2.98m is shown after adding back Exceptional Items of £0.34m and Amortisation of Acquisition Related Intangibles of £0.19m, and then deducting a notional tax charge of £0.10m. Adjusted earnings per share has been calculated by dividing the adjusted profit of £2.98m by the weighted average number of ordinary shares in issue at 24 June 2017 respectively. The 2016 comparative figures have also been adjusted to a comparable basis.
The Group elected to revalue its Wellington land portfolio only, as allowed under the transitional provisions of IFRS. The revaluation adjustment is based on an independent valuation prepared in April 2005 on the basis of market value assuming existing use to a total of £1.75m (historical value £0.79m).
2017 2016 Adjusted earnings per share Adjusted Profit for the year (£’000) 2,979 1,430 Basic weighted average number of ordinary shares in issue during the year 16,834,773 11,306,416 Diluted number of shares 17,382,702 11,531,535 Basic earnings per share 17.7p 12.6p Diluted earnings per share 17.1p 12.4p
NOTE 12 PROPERTY, PLANT AND EQUIPMENT Freehold Land Plant and and buildings Machinery Total £’000 £’000 £’000 Group Cost: At June 2015 7,694 27,164 34,858 Exchange Movements - 267 267 Additions - 1,181 1,181 Disposals (84) (2,128) (2,212) At June 2016 7,610 26,484 34,094 Exchange Movements - 264 264 Additions - 1,367 1,367 Disposals - (1,984) (1,984) At June 2017 Depreciation: 7,610 26,131 33,741 At June 2015 2,705 21,410 24,115 Exchange Movements - 147 147 Provided during the year 201 951 1,152 Disposals (84) (2,088) (2,172) At June 2016 2,822 20,420 23,242 Exchange Movements - 158 158 Additions - 36 36 Provided during the year 116 1,097 1,213 Disposals - (1,984) (1,984) At June 2017 2,938 19,727 22,665 Net book value: At June 2017 4,672 6,404 11,076 At June 2016 4,788 6,064 10,852

ANNUAL REPORT & ACCOUNTS 2017 – 67 – FINANCIAL STATEMENTS
If none of the freehold land and buildings had been re-valued they would be restated at the following amounts:
2017 2016 Group and Company £’000 £’000 Historical cost 6,272 6,272 Accumulated depreciation based on cost (2,731) (2,615) Net book value 3,541 3,657
Freehold Land Plant and and buildings Machinery Total £’000 £’000 £’000 Company Cost: At June 2015 7,694 25,190 32,884 Additions - 1,032 1,032 Transfers to subsidiary - - - Disposals (84) (2,128) (2,212) At June 2016 7,610 24,09 31,704 Additions - 1,207 1,207 Disposals - (1,984) (1,984) At June 2017 Depreciation: 7,610 23,317 30,927 At June 2015 2,706 20,349 23,055 Provided during the year 201 772 973 Transfers to subsidiary - - - Disposals (84) (2,087) (2,171) At June 2016 2,823 19,034 21,857 Provided during the year 116 875 991 Transfers to subsidiary - - - Disposals - (1,984) (1,984) At June 2017 2,939 17,925 20,864 Net book value: At June 2017 4,671 5,392 10,063 At June 2016 4,787 5,060 9,847
NOTE 13 INTANGIBLE ASSETS
Research & Brand Customer Software Development Names Relationships Goodwill Total £’000 £’000 £’000 £’000 £’000 £’000
Group Cost At June 2015 848 75 924 100 - 1,947 Additions 34 - - - - 34 Disposals (52) - - - - (52) At June 2016 830 75 924 100 - 1,929 Additions 8 - 5,091 1,646 1,473 8,218 Disposals (56) - - - (56) At June 2017 Amortisation: 782 75 6,015 1,746 1,473 10,091 At June 2015 747 - - - - 747 Provided during the year 40 12 - 15 - 67 Disposals (52) - - - - (52) At June 2016 735 12 - 15 - 762 Provided during the year 38 15 - 187 - 240 Disposals (56) - - - - (56) At June 2017 717 27 - 202 - 946 Net book value: At June 2017 65 48 6,015 1,544 1,473 9,145 At June 2016 95 63 924 85 - 1,167

ANNUAL REPORT & ACCOUNTS 2017– 68 –FINANCIAL STATEMENTS
Research & Brand Customer Software Development Names Relationships Total £’000 £’000 £’000 £’000 £’000
Company Cost At June 2015 848 75 924 100 1,947 Additions 34 - - - 34 Disposals (52) - - - (52) At June 2016 830 75 924 100 1,929 Additions 8 - - - 8 Disposals (56) - - - (56) At June 2017 Amortisation: 782 75 924 100 1,881 At June 2015 747 - - - 747 Provided during the year 40 12 - 15 67 Disposals (52) - - - (52) At June 2016 735 12 - 15 762 Provided during the year 38 15 - 21 74 Disposals (56) - - - (56) At June 2017 717 27 - 36 780 Net book value: At June 2017 65 48 924 64 1,101 At June 2016 95 63 924 85 1,167
ACQUISITION OF SUBSIDIARY: THE BRAND ARCHITEKTSOn 27 June 2016, the Group acquired 100% of the issued share capital of The Brand Architekts Ltd. The total consideration for the acquisition along with the fair value of the identified assets and assumed liabilities is shown below:
Recognised amounts of identifiable assets acquired and liabilities assumed Fair Value Provisional adjustments 7 Fair Value Book Value January 2017 £’000 £’000 £’000Tangible assetsFixed assets 30 - 30Inventory 2,416 - 2,416Trade and other receivables 3,332 - 3,332Bank and cash balances 832 - 832Trade and other payables (2,737) - (2,737)Intangible assets - 6,737 6,737Sub total 3,873 6,737 10,610Goodwill - - 1,473Total Fair Value recognised - 12,083
Net cash paid on acquisition £’000Purchase of subsidiary (12,083)Contingent consideration 1,850Cash on acquisition 832Net cash paid on acquisition (9,401)
The acquisition consideration was subject to a contingent payment of £1.85m based on a margin performance target for the 12 months immediately following acquisition. Management can confirm that the margin target was achieved and as such the fair value of the transaction assumed the payment of this deferred consideration in full during July 2017, post the reporting date.
The acquisition costs, including due diligence costs, that relate to the transaction have been expensed as operating costs in compliance with IFRS3 and shown as exceptional items.
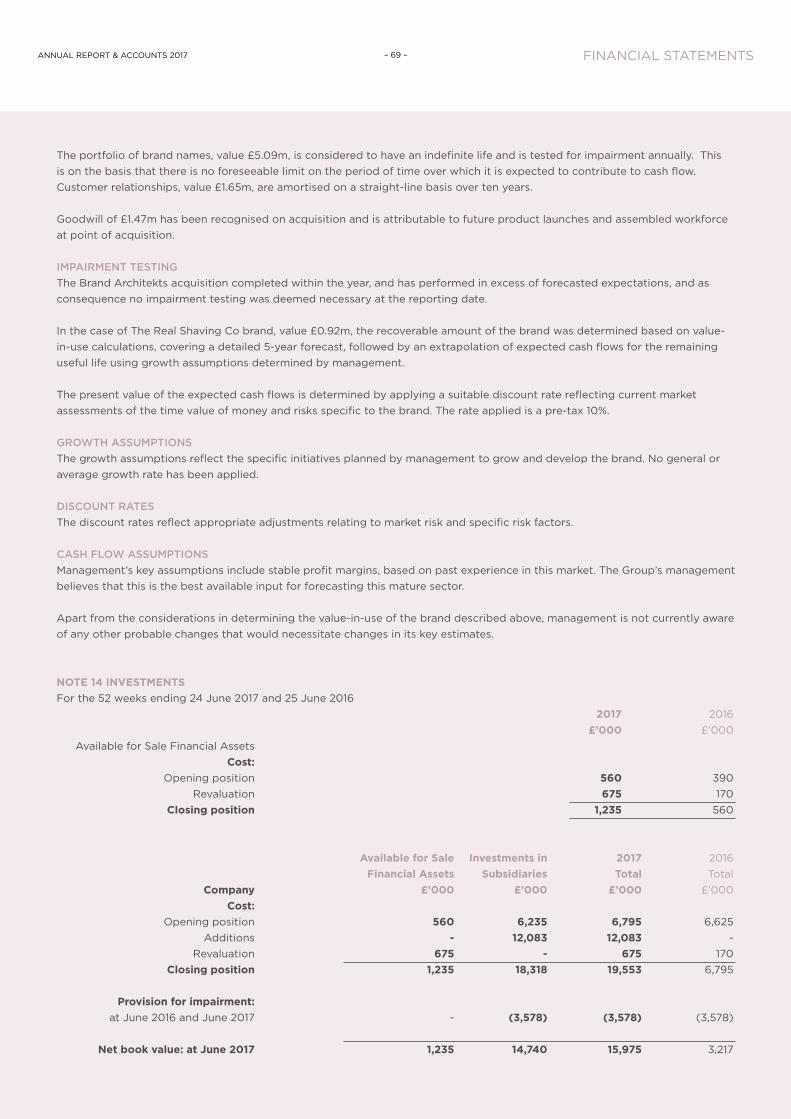
ANNUAL REPORT & ACCOUNTS 2017 – 69 – FINANCIAL STATEMENTS
NOTE 14 INVESTMENTS For the 52 weeks ending 24 June 2017 and 25 June 2016 2017 2016 £’000 £’000 Available for Sale Financial Assets Cost: Opening position 560 390 Revaluation 675 170 Closing position 1,235 560
Available for Sale Investments in 2017 2016 Financial Assets Subsidiaries Total Total Company £’000 £’000 £’000 £’000 Cost: Opening position 560 6,235 6,795 6,625 Additions - 12,083 12,083 - Revaluation 675 - 675 170 Closing position 1,235 18,318 19,553 6,795
Provision for impairment: at June 2016 and June 2017 - (3,578) (3,578) (3,578)
Net book value: at June 2017 1,235 14,740 15,975 3,217
The portfolio of brand names, value £5.09m, is considered to have an indefinite life and is tested for impairment annually. This is on the basis that there is no foreseeable limit on the period of time over which it is expected to contribute to cash flow. Customer relationships, value £1.65m, are amortised on a straight-line basis over ten years.
Goodwill of £1.47m has been recognised on acquisition and is attributable to future product launches and assembled workforce at point of acquisition.
IMPAIRMENT TESTINGThe Brand Architekts acquisition completed within the year, and has performed in excess of forecasted expectations, and as consequence no impairment testing was deemed necessary at the reporting date.
In the case of The Real Shaving Co brand, value £0.92m, the recoverable amount of the brand was determined based on value-in-use calculations, covering a detailed 5-year forecast, followed by an extrapolation of expected cash flows for the remaining useful life using growth assumptions determined by management.
The present value of the expected cash flows is determined by applying a suitable discount rate reflecting current market assessments of the time value of money and risks specific to the brand. The rate applied is a pre-tax 10%.
GROWTH ASSUMPTIONSThe growth assumptions reflect the specific initiatives planned by management to grow and develop the brand. No general or average growth rate has been applied.
DISCOUNT RATESThe discount rates reflect appropriate adjustments relating to market risk and specific risk factors.
CASH FLOW ASSUMPTIONSManagement’s key assumptions include stable profit margins, based on past experience in this market. The Group’s management believes that this is the best available input for forecasting this mature sector.
Apart from the considerations in determining the value-in-use of the brand described above, management is not currently aware of any other probable changes that would necessitate changes in its key estimates.

ANNUAL REPORT & ACCOUNTS 2017– 70 –FINANCIAL STATEMENTS
The shares of Swallowfield s.r.o are owned by Swallowfield Consumer Products Limited.
The non-controlling interest represents the share of earnings within Mr. Haircare Limited due to Jamie Stevens (Media) Limited.
The Group has a total shareholding in the Chinese business, Shanghai Colour Cosmetics Technology Company Limited (SCCTC) of 19% that has been designated as available for sale. Available for sale financial assets are measured at fair value with gains or losses being recognised in other comprehensive income and reported within the available sales reserve within equity.
The estimated fair value of the available for sale financial asset is categorised within Level 3 of the fair value hierarchy. The fair value estimate has been determined using SCCTC’s June 2017 net assets, and was recognised at a fair value of £1,235k, with an increase of £675k recognised through other comprehensive income in the year. No discount factor was applied due to the non-marketability of the shares.
The Company owns 100% of the voting rights and ordinary shares of the following principal subsidiary undertakings, except as indicated below:
NOTE 15 INVENTORIES 2017 2016 Group £’000 £’000 Raw materials 5,143 5,026 Work in progress 320 488 Finished goods and goods for resale 5,967 3,529 11,430 9,043
Name of Company Country of Registration Nature of BusinessAerosols International Limited England DormantAtlas Group Limited England DormantBagsy Beauty Limited (formerly Cosmetics Plus Limited) England DormantSwallowfield Consumer Products Limited England HoldingTru Products Limited England DormantThe Brand Architekts Limited England Trading – owned brand businessMr. Haircare Limited – 51% England Trading – joint venture with Jamie Stevens (Media) LimitedSwallowfield s.r.o Czech Republic Trading – Czech manufacturing facilitySwallowfield SARL France Trading – French sales support officeSwallowfield Inc. United States of Trading – USA sales support America office
2017 2016 Company £’000 £’000 Raw materials 5,143 5,026 Work in progress 320 488 Finished goods and goods for resale 3,124 3,529 8,587 9,043
The Group consumed inventories totalling £48.7m during the year (2016: £36.2m). No items are being carried at fair value less cost to sell (2016: £NIL).

ANNUAL REPORT & ACCOUNTS 2017 – 71 – FINANCIAL STATEMENTS
2017 2016 GROUP AND COMPANY £’000 £’000 Opening balance 12 - Impairment loss recognised - - Amounts recovered - 10 Charged to profit and loss - 2 Closing balance 12 12
Ageing of trade receivables: 2017 2016 GROUP £’000 £’000 Current 13,850 12,998 Overdue but less than 90 days 606 702 More than 90 days overdue 143 94 14,599 13,794
2017 2016 COMPANY £’000 £’000 Current 11,048 12,998 Overdue but less than 90 days 130 702 More than 90 days overdue 143 94 11,321 13,794
The amounts owed by Group undertakings relate to intercompany receivables which have been split between current and greater than 1 year, based on the anticipated repayment profile of these sums.
The Directors consider that the carrying amount of trade and other receivables approximates to their fair value.
Detailed below is the movement on the bad and doubtful debt provision for the Group and Company:
NOTE 16 TRADE AND OTHER RECEIVABLES GROUP COMPANY 2017 2016 2017 2016 £’000 £’000 £’000 £’000 Trade receivables 14,599 13,794 11,321 13,721 Amounts owed by Group undertakings - - 184 93 Other receivables 8 6 8 6 Prepayments and accrued income 1,738 1,558 1,230 1,509 16,345 15,358 12,743 15,329
Included within the total aged receivable balance of £14,599k (2016: £13,794k) is an amount of £nil (2016: £nil) relating to Group only.
Our policy requires customers to pay us in accordance with agreed payment terms. Depending on the geographical location, our settlement terms are generally due within 30 or 60 days from the end of the month of sale and do not bear any effective interest rate. All trade receivables are subject to credit risk exposure. Where the Group identifies a specific concentration of credit risk attached to any individually significant balances these are specifically reviewed for recoverability and suitable provision made having regard to the credit risk identified.

ANNUAL REPORT & ACCOUNTS 2017– 72 –FINANCIAL STATEMENTS
The Directors consider that the carrying value of trade and other payables approximates to their fair value.
Included within accruals and deferred income is an amount of £1,850k, representing the contingent consideration on the acquisition of The Brand Architekts (see Note 13).
The amount due to ‘other payables’ represents a CID facility that allows a regular drawdown of cash funds in Sterling and foreign currency, and which is secured on the book debts of the Company. This facility carries an interest rate of 1.5% over base and is repayable on demand.
NOTE 20 OBLIGATIONS UNDER LEASESOperating leasesAt the Statement of Financial Position date, the Group and Company had outstanding commitments for future minimum lease payments under non-cancellable operating leases, which fall due as follows:
NOTE 17 TRADE AND OTHER PAYABLES GROUP COMPANY 2017 2016 2017 2016 £’000 £’000 £’000 £’000 Trade payables 11,124 12,771 9,387 12,698 Amounts owed to subsidiaries - - 3,053 2,872 Other taxes and social security costs 350 297 299 287 Accruals and deferred income 4,494 2,672 3,709 2,444 Share-based payments accrual 1,951 254 1,951 254 Other payables 5,605 4,546 5,528 4,546 23,524 20,540 23,927 23,101
GROUP OTHER LAND & BUILDINGS 2017 2016 2017 2016 £’000 £’000 £’000 £’000 Within one year 149 118 627 577 In the second to fifth years inclusive 386 251 1,808 1,905 In over five years 13 - 163 482 548 369 2,598 2,964
NOTE 18 INTEREST-BEARING LOANS AND BORROWINGS – AMOUNTS FALLING DUE WITHIN ONE YEAR
2017 2016 GROUP AND COMPANY £’000 £’000 Secured: Loans 534 141 The Directors consider that the carrying value of bank loans and overdrafts approximates to their fair value.
NOTE 19 INTEREST-BEARING LOANS AND BORROWINGS – AMOUNTS FALLING DUE AFTER MORE THAN ONE YEARLoans are repayable by instalments as follows:
2017 2016 GROUP AND COMPANY £’000 £’000 Between one and two years 546 291 Between two and five years 1,013 151 1,559 442 The Group’s loan facilities are secured by fixed and floating charges over certain of the Group’s freehold land and buildings.

ANNUAL REPORT & ACCOUNTS 2017 – 73 – FINANCIAL STATEMENTS
COMPANY OTHER LAND & BUILDINGS 2017 2016 2017 2016 £’000 £’000 £’000 £’000 Within one year 135 118 362 360 In the second to fifth years inclusive 338 251 1,301 1,300 In over five years 13 - 163 482 486 369 1,826 2,142
NOTE 21 FINANCIAL INSTRUMENTSThe Group uses financial instruments comprising borrowings, some cash and cash equivalents, and various items such as trade receivables and trade payables that arise directly from its operations. The main purpose of these financial instruments is to raise finance for the Group’s operations.
The Group also has bank accounts denominated in Euros, US Dollars, Canadian Dollars, Czech Koruna, and Chinese Renminbi. The purpose of these accounts is to manage the currency transactions arising from the Group’s operations overseas. The main risks arising from the Group’s financial instruments are interest rate risk, foreign currency risk and liquidity risk. The Board reviews and agrees policies for managing each of these risks and they are summarised below. These policies have remained unchanged from the previous year.
Interest rate riskThe Group finances its operations through a mixture of debt and equity.
The Group’s loan borrowings bear interest at rates based on the bank’s base rate. The Group Statement of Financial Position also includes financial assets in the form of cash at bank and in hand totalling £4,057,000 (2016: £798,000) which are exposed to floating interest rates based on bank base rates.
A 0.5% increase in bank base rates would reduce pre-tax profits by £39,000 in the period. A 0.5% decrease would have the opposite effect.
Foreign currency riskThe Group is exposed to transactional foreign exchange risk. The Group seeks to hedge its exposures using bank facilities denominated in Euros, US Dollars, Canadian Dollars, Czech Koruna, and Chinese Renminbi and also by buying and selling products in these currencies with the objective of minimising fluctuations in exchange rates on future transactions and cash flows.
Approximately 12% (2016: 14%) of the Group’s sales are invoiced in Euros and 16% (2016: 14%) in US Dollars. These sales are calculated in sterling, but invoiced in Euros / US Dollars. The Group policy is to minimise currency exposures on balances for which settlement is not anticipated until a later date through the use of the respective bank facilities. All other Group sales are denominated in sterling.
At 24 June 2017, there were sums totalling £2,423,000 (2016: £670,000) held in foreign currency bank accounts.
A 5% weakening of sterling would result in a £154,000 increase in reported profits and equity, while a 5% strengthening of sterling would result in a £146,000 decrease in profits and equity.
Liquidity riskThe Group seeks to manage financial risk, to ensure sufficient liquidity is available to meet the identifiable needs of the Group and to invest cash assets safely and profitably.
The Group’s and Company’s liabilities have contractual maturities as summarised below:

ANNUAL REPORT & ACCOUNTS 2017– 74 –FINANCIAL STATEMENTS
GROUP JUNE 2016 CURRENT NON-CURRENT Within 6 months 6-12 months 1-5 years Over 5 years £’000 £’000 £’000 £’000 Loans and receivables 76 76 459 - Financial liabilities at fair value through profit or loss 17,736 - - - 17,812 76 459 -
COMPANY JUNE 2017 CURRENT NON-CURRENT Within 6 months 6-12 months 1-5 years Over 5 years £’000 £’000 £’000 £’000 Loans and receivables 289 289 1,615 - Financial liabilities at amortised cost through profit or loss 13,486 - - - Financial liabilities at fair value through profit or loss 1,850 - - - 15,625 289 1,615 -
COMPANY JUNE 2016 CURRENT NON-CURRENT Within 6 months 6-12 months 1-5 years Over 5 years £’000 £’000 £’000 £’000 Loans and receivables 76 76 459 - Financial liabilities at fair value through profit or loss 17,631 - - - 17,707 76 459 -
Working capitalThe Group’s working capital policy is to fund short-term movements through excess cash generated from the trading business.
The Group had £13.1m (2016: £7.3m) undrawn committed borrowing facilities available at June 2017. The maturity profile of committed bank facilities is regularly reviewed and such facilities are extended or replaced well in advance of their expiry.
Capital maintenanceThe Group’s objectives when managing capital are:• to safeguard the Group’s ability to continue as a going concern, so that it can continue to provide returns for shareholders
and benefits for other stakeholders;• to provide an adequate return to shareholders by pricing products and services commensurately with the level of risk; and• to maintain an optimal capital structure to reduce the cost of capital.
GROUP JUNE 2017 CURRENT NON-CURRENT Within 6 months 6-12 months 1-5 years Over 5 years £’000 £’000 £’000 £’000 Loans and receivables 289 289 1,615 - Financial liabilities at amortised cost through profit or loss 15,472 - - - Financial liabilities at fair value through profit or loss 1,850 - - - 17,611 289 1,615 -

ANNUAL REPORT & ACCOUNTS 2017 – 75 – FINANCIAL STATEMENTS
The Group sets the amount of capital in proportion to risk. The Group manages the capital structure and makes adjustments to it in light of changes in economic conditions and the risk characteristics of the underlying assets. In order to maintain or adjust the capital structure, the Group may adjust the amount of dividends paid to shareholders, return capital to shareholders, issue new shares, or sell assets to reduce debt.
Financial assetsFinancial assets included in the Statement of Financial Position relate to the followings IAS 39 categories:
GROUP COMPANY 2017 2016 2017 2016 £’000 £’000 £’000 £’000 Loans and receivables 18,664 14,598 14,484 14,534 Available for sale 1,235 560 1,235 560 19,899 15,158 15,719 15,094
The financial assets are included in the Statement of Financial Position within the following headings:
GROUP COMPANY 2017 2016 2017 2016 £’000 £’000 £’000 £’000 Non-current assets: Investments 1,235 560 1,235 560 Current assets: Trade receivables 14,599 13,794 11,321 13,721 Other receivables 8 6 8 6 Intercompany receivables - - 184 93 Cash and cash equivalents 4,057 798 2,971 714 19,899 15,158 15,719 15,094
Financial liabilitiesFinancial liabilities included in the Statement of Financial Position relate to the following IAS 39 categories:
GROUP COMPANY 2017 2016 2017 2016 £’000 £’000 £’000 £’000 Current liabilities: Borrowings 534 141 534 141 Trade payables 11,124 12,771 9,387 12,698 Intercompany payables - - 3,053 2,872 Accruals 6,445 2,926 5,660 2,698 Other payables 5,605 4,546 5,528 4,546 Non-current liabilities: Borrowings 1,559 442 1,559 442 25,267 20,826 25,721 23,397

ANNUAL REPORT & ACCOUNTS 2017– 76 –FINANCIAL STATEMENTS
NOTE 22 DEFERRED TAX LIABILITIESThe movement in deferred tax provisions is analysed as follows:
GROUP £’000 Deferred taxation At June 2015 (325) Recognised in profit or loss 141 Recognised in other comprehensive income (474) Temporary exchange differences 8 At June 2016 (650) Recognised in profit or loss (116) Recognised in other comprehensive income 101 Temporary exchange differences (16) At June 2017 (681)
2017 2016 £’000 £’000Deferred tax is represented by: Capital allowances in advance of depreciation 407 414 Temporary difference on post retirement benefit obligations (1,042) (809)
Other temporary differences (46) (255) Temporary exchange differences - (681) (650)Recognised as: Deferred tax assets (1,088) (1,064) Deferred tax liabilities 407 414 (681) (650)
COMPANY Deferred taxation At June 2015 (312) Recognised in profit or loss 141 Recognised in other comprehensive income (474) At June 2016 (645) Recognised in profit or loss (139) Recognised in other comprehensive income 101 At June 2017 (683)

ANNUAL REPORT & ACCOUNTS 2017 – 77 – FINANCIAL STATEMENTS
2017 2016 £’000 £’000Deferred tax is represented by: Capital allowances in advance of depreciation 407 414 Temporary difference on post retirement benefit obligations (1,042) (809) Other temporary differences (48) (250) (683) (645)Recognised as: Deferred tax assets (1,090) (1,059) Deferred tax liabilities 407 414 (683) (645)
Provision has not been made for deferred taxation on the full carrying value of the Group’s land and buildings, on the basis that the full value of these assets will not be recovered through use and that indexation will result in no taxable gain arising on disposal.
NOTE 23 SHARE CAPITAL 2017 2016 £’000 £’000 Equity ordinary share capital Authorised share capital 25,800,000 shares of 5p each 1,290 1,290
Allotted, called-up and fully paid ordinary shares at 24 June 2017 and 25 June 2016 844 566
On 28 June 2016 5,558,985 shares were admitted to trading as part funding of The Brand Architekts Ltd acquisition, increasing the number of Ordinary Shares in issue to 16,865,401 as at 24 June 2017 (2016: 11,306,416)
Share premiumShare premium reserve includes the accumulated premium on the issue of share capital.
Revaluation of investment reserveThe Group has a total shareholding in the Chinese business, Shanghai Colour Cosmetics Technology Company Limited (SCCTC) of 19% that has been designated as available for sale. Available for sale financial assets are measured at fair value with gains or losses being recognised in other comprehensive income and reported within the available sales reserve within equity.
Exchange reserveExchange differences arising on translation of the foreign controlled entity are recognised in other comprehensive income and accumulated in a separate reserve within equity. The cumulative amount is reclassified to profit or loss when the net investment is disposed of.
Pension re-measurement reserveActuarial re-measurement of scheme liabilities recognised in other comprehensive income and accumulated in a separate reserve within equity.
Retained earningsRetained earnings account includes all current and prior period profits and losses.

ANNUAL REPORT & ACCOUNTS 2017– 78 –FINANCIAL STATEMENTS
NOTE 24 NOTES TO CASH FLOW STATEMENT
GROUP (a) Reconciliation of cash and cash equivalents to movement in net debt: 2017 2016 £’000 £’000 Increase in cash and cash equivalents 3,259 650 Net cash (inflow) /outflow from (increase) / decrease in borrowings (2,569) 409 Change in net debt 690 1,059 Opening net debt (4,331) (5,390) Closing net debt (3,641) (4,331)
(b) Analysis of net debt: Non-Cash Closing 2016 Cash Flow Movement Closing 2017 £’000 £’000 £’000 £’000Cash at bank and in hand 798 3,199 60 4,057 Secured debt facility (4,546) (1,059) - (5,605) Borrowings due within one year (141) (393) - (534) Borrowings due after one year (442) (1,117) - (1,559) (4,331) 630 60 (3,641)
COMPANY (a) Reconciliation of cash and cash equivalents to movement in net debt: 2017 2016 £’000 £’000 Increase in cash and cash equivalents 2,257 589 Net cash (inflow) / outflow from (increase) / decrease in borrowings (2,492) 409 Change in net debt (235) 998 Opening net debt (4,415) (5,413) Closing net debt (4,650) (4,415)
(b) Analysis of net debt: Non-Cash Closing 2016 Cash Flow Movement Closing 2017 £’000 £’000 £’000 £’000 Cash at bank and in hand 714 2,206 51 2,971 Secured debt facility (4,546) (982) - (5,528) Borrowings due within one year (141) (393) - (534) Borrowings due after one year (442) (1,117) - (1,559) (4,415) (286) 51 (4,650)
NOTE 25 CAPITAL COMMITMENTSGROUP AND COMPANY 2017 2016 £’000 £’000 Contracted for but not provided 291 52

ANNUAL REPORT & ACCOUNTS 2017 – 79 – FINANCIAL STATEMENTS
NOTE 26 POST RETIREMENT BENEFITSThe Group and Company operates defined contribution pension plans and a defined benefit plan, all of which are funded by the payment of contributions to separately administered plans.
The Group and Company operates a funded defined benefit scheme (the Scheme) in the UK which provides both pensions in retirement and death benefits to members.
Expected future cash flows to and from the Scheme:The Scheme is subject to the scheme funding requirements outlined in UK legislation. The last scheme funding valuation of the Scheme was as at 5 April 2014 and revealed a funding deficit of £1.3m. The liabilities of the Scheme are based on the current value of expected benefit payment cash flows to members of the Scheme over the next 60 to 80 years. The average duration of the liabilities is approximately 21 years.In accordance with the schedule of contributions dated 3 July 2015 the Company is expected to pay contributions to the Scheme to make good any shortfalls in funding and has agreed to pay £108k per annum for 10 years from 18 July 2015 to eliminate the deficit. The magnitude of such payments will be reviewed following the next scheme funding valuation as at April 2017. Prior to July 2015 the Company was paying £111.5k per annum.
In addition, the Company has agreed to meet the cost of administrative expenses and Pension Protection Fund insurance premiums for the Scheme.
Payments made by the Company to the Scheme and in respect of Scheme liabilities were: 2017 2016 £’000 £’000Company pension contributions - 213Deficit recovery payments 108 108Scheme administrative expenses 144 101Pension Protection Fund premium 240 211Total 492 633
The amounts expensed in the Group Statement of Comprehensive Income were:
2017 2016 £’000 £’000In Operating profit:Company pension contributions - 305Scheme administrative expenses 154 86Pension Protection Fund premium 240 211 394 602In Finance costs:Unwinding of notional discount factor 149 85Total 543 687
(a) The service cost is charged as follows:
2017 2016 £’000 £’000Cost of sales - 224Commercial and administration - 81Total - 305

ANNUAL REPORT & ACCOUNTS 2017– 80 –FINANCIAL STATEMENTS
The Accounting Standards require the discount rate to be based on yields on high quality (usually AA-rated) corporate bonds of appropriate currency, taking into account the term of the relevant pension scheme’s liabilities. Corporate bond indices are often used as a proxy to determine the discount rate. At the reporting date, the yields on bonds of all types were lower than they were at June 2016. This has resulted in lower discount rates being adopted for accounting purposes compared to last year, this was coupled by an increase in expectations of long term inflation, the combination of these two factors has translated into an increased liability.
2017 £’000Increase in pension and other benefit obligations (1,637)Decrease in deferred tax 271Decrease in equity (1,366)
IAS19 ‘Employee Benefits’IAS 19 requires a separate valuation of the Scheme on a different basis to the funding valuation referred to above. The effects of the application of IAS19 on the statement of financial position at June 2017 are:
The assumptions used in determining the overall expected return on the scheme’s assets have been set with reference to yields available on corporate bonds.
(a) The principal actuarial assumptions used at the Statement of Financial Position date were as follows:
2017 2016 Discount rate 2.55% 3.35% Inflation assumption (RPI) 3.00% 2.90% Inflation assumption (CPI) 2.00% 1.90%
Deferred revaluation for benefits in excess of GMP Employed deferred members 2.50% 2.40% Deferred members 2.00% 1.90% Rate of increase in pensions in payment: CPI, max 3% (2016: max 3%) 1.85% 1.80% RPI, max 5% (2016: max 5%) 2.95% 2.85% RPI, max 2.5% (2016: max 2.5%) 2.15% 2.10% Mortality assumptions: Life expectancy of male aged 65 now 20.9 21.3 Life expectancy of female aged 65 now 22.7 23.3 Life expectancy of male aged 65 in 20 years 22.2 23.0 Life expectancy of female aged 65 in 20 years 24.2 25.2
(b) The assets in the scheme at the Statement of Financial Position date were as follows:
2017 2016 Market Market Value Value £’000 £’000 Equities 8,383 6,303 Property 1,465 1,424 Index Linked Gilts 2,270 2,353 Corporate Bonds 2,188 3,918 Diversified Growth Funds 6,464 5,941 LDI funds 2,070 - Other 466 260 Fair value of plan assets 23,306 20,199

ANNUAL REPORT & ACCOUNTS 2017 – 81 – FINANCIAL STATEMENTS
The actual return on scheme assets was an increase of £3.4m (2016: increase £0.15m).
The scheme assets do not include any of the Company’s own financial instruments, nor any property occupied by, or assets used by, the Company.
(c) Amounts recognised in the Statement of Financial Position: 2017 2016 £’000 £’000 Present value of funded obligations (29,438) (24,694) Fair value of scheme assets 23,306 20,199 (Deficit) (6,132) (4,495) Net liability recognised in the Statement of Financial Position (6,132) (4,495)
(d) Reconciliation of opening and closing balances of the present value of the defined benefit obligation:
2017 2016 £’000 £’000 Benefit obligation at beginning of year (24,694) (22,970) Movement in the year: Current service cost - (305) Finance cost (820) (912) Employee contributions - (51) Actuarial (losses) - financial (5,326) (1,929) Actuarial gain / (losses) – demographic 895 (132) Actuarial gain - experience 79 100 Net benefits paid out 428 635 Past service cost - 870 Benefit obligation at end of year (29,438) (24,694)
(e) Reconciliation of opening and closing balance of the fair value of scheme assets:
2017 2016 £’000 £’000 Fair value of scheme assets at beginning of year 20,199 20.308 Movement in the year: Interest on scheme assets 671 827 Return on assets, excluding interest income 2,756 (673) Contributions - employer 108 321 Contributions - employee - 51 Benefits paid out (428) (635) Fair value of scheme assets at end of year 23,306 20,199

ANNUAL REPORT & ACCOUNTS 2017– 82 –FINANCIAL STATEMENTS
(g) History of plan - the history of the plan for the current year and prior years is as follows:
2017 2016 2015 2014 2013Statement of Financial Position £’000 £’000 £’000 £’000 £’000Present value of defined benefit obligation (29,438) (24,694) (22,970) (20,922) (19,931) Fair value of scheme assets 23,306 20,199 20,308 18,710 17,019 At end of year (6,132) (4,495) (2,662) (2,212) (2,912)
CHARACTERISTICS OF THE SCHEME AND THE RISKS ASSOCIATED WITH THE SCHEME
a) Information about the characteristics the Scheme
i. The Scheme provides pensions in retirement and death benefits to members. Pension benefits are linked to a member’s final salary at retirement and their length of service. As of 31 December 2015, the Scheme closed to future accrual.
ii. The Scheme is a registered scheme under UK legislation and was contracted out of the State Second Pension.
iii. The Scheme is subject to the scheme funding requirements outlined in UK legislation. The last scheme funding valuation of the Scheme was as at 5 April 2014 and revealed a deficit of £1,298,000.
iv. The Scheme membership as at 5 April 2014 comprised of 128 active members accruing benefits, 171 deferred pensioner members and 118 pensioner members. Since 31 December 2015, the Scheme has been closed to future accrual with those active members if still employed by the Company transferring to a new category of employed deferred member. If no longer employed, they became a deferred member.
v. The Scheme was established from 1 January 1987 under trust and is governed by the Scheme’s trust deed and rules dated 19 January 2001. The Trustees are responsible for the operation and the governance of the Scheme, including making decisions regarding the Scheme’s funding and investment strategy in conjunction with the Company.
b) Information about the risks of the Scheme to the Employer
The Scheme exposes the Company to actuarial risks such as: market (investment) risk, interest rate risk, inflation risk and longevity risk. The small number of Scheme members means that the Scheme and ultimately the Company are exposed to the experience (such as life expectancy and take-up of member options) of individual members. The Scheme does not expose the Employer to any unusual Scheme specific or Company specific risks.
c) Information about any amendments, curtailments and settlements
There has been no allowance for any amendments, curtailments, or settlements within this accounting period.
(f) Re-measurement of the net defined benefit liability to be shown in other comprehensive income 2017 2016 £’000 £’000 Net re-measurement - financial 5,326 1,929 Net re-measurement – demographic (895) 132 Net re-measurement – experience (79) (100) Return on assets, excluding interest income (2,756) 673 1,596 2,634 Deferred taxation 101 (474) Total re-measurement of the net defined benefit liability to be shown in OCI 1,697 2,160

ANNUAL REPORT & ACCOUNTS 2017 – 83 – FINANCIAL STATEMENTS
b) Description of asset-liability matching strategies
The Trustees holds a proportion of the Scheme’s assets in pooled funds invested in gilts, corporate bonds and liability driven investment funds to provide some degree of matching with the Scheme’s liabilities.
Liability driven investment funds and index-linked gilts fund are used to provide a degree of price inflation and interest rate matching with the liabilities.
c) The Scheme’s investment strategy
The Scheme’s investment strategy is to invest broadly 70% in return seeking and 30% in matching assets. This strategy reflects the Scheme’s liability profile and the Trustees’ and Employer’s attitude to risk.
The plan holds a number of annuity policies which match a portion of pensions in payment.
d) Information about the most recent actuarial valuation of the Scheme and the valuation of the defined benefit obligation at the accounting date
The value of the liabilities at the reporting date have been estimated by updating the results of the scheme funding valuation as at 5 April 2014 to allow for the passage of time, the accrual of new benefits up to 31 December 2015, benefits paid out of the Plan and changes in actuarial assumptions over the period from 5 April 2014 to 24 June 2017.
Such an approach is common for the purposes of accounting disclosures. It is not expected that these projections will be materially different from a summation of individual calculations at the accounting date, although there may be some discrepancy between the actual liabilities for the Plan at the accounting date and those included in the disclosures.
June 2017 £’000 Discount rate (increase of 0.25% pa) Decrease by £1,600 Rate of RPI inflation (increase of 0.25% pa) Increase by £1,250 Mortality (1.5% long term rate) Increase by £300
Amount, timing and uncertainty of future cash flows
a) Sensitivity analysis
Please note that the results in the disclosures are inherently volatile, particularly the figures shown on the statement of financial position. The results disclosures are dependent on the assumptions chosen by the Directors’.
The table below shows the approximate impact of varying the key assumptions adopted as at June 2017

ANNUAL REPORT & ACCOUNTS 2017– 84 –FINANCIAL STATEMENTS
The Directors participated in the fundraising to support the acquisition of The Brand Architekts Ltd, so an additional disclosure has been made to show their interests in the Company as at 19 September 2016, the point of signing the 2016 Report & Accounts.
Mr E J Beale’s Director’s fees have been surrendered to his primary employer, City Group PLC to 31 March 2017 and Marshall Monteagle plc since that date. City Group PLC is 49% owned by Western Selection PLC, who have a beneficial interest in 8.9% of the Company’s issued share capital at the reporting date. Director’s Fees of £28,000 were paid or are payable for the year ended June 2017 (2016: £26,000). During the year the Group sold finished goods to the value of £76,000 (2016: £59,000) to Monteagle International Ltd, a subsidiary of Marshall Monteagle plc. Mr E J Beale is a director of Monteagle International Ltd.
In the year to June 2017, Swallowfield plc sold plant and equipment at a net book value of £nil (2016: £nil) to Swallowfield s.r.o., and also purchased goods and services amounting to £2,016,000 (2016: £1,971,000) from the same company.
At the year end the Company had payables due to Swallowfield s.r.o. amounting to £123,000 (2016: £218,000) being disclosed within ‘Trade and other payables’ (see Note 17). ‘Trade and other payables’ also includes an amount of £2,494,000 (2016: £2,494,000) in respect of amounts due to dormant subsidiaries (see Note 17).
In the year to June 2017, the Company purchased services amounting to £203,000 (2016: £169,000) from Swallowfield SARL. At the 2017 year end the Company had a balance due to Swallowfield SARL amounting to £53,000 (2016: £12,000) being disclosed within ‘Trade and other payables’ (see Note 17).
In the year to June 2017, the Company purchased services amounting to £155,000 (2016: £133,000) from Swallowfield Inc. At the 2017 year end the Company had payables due to Swallowfield Inc. amounting to £63,000 (2016: £37,000) being disclosed within ‘Trade and other payables’ (see Note 17).
In the year to June 2017, the Company sold products to the value of £91,000 (2016: £60,000) to MR Haircare Limited, a joint venture with Jamie Stevens (Media) Limited. At the 2017 year end the Company had payables due from MR Haircare Limited of £37,000 (2016: £93,000) being disclosed within ‘Trade and other receivables’ (see Note 16). In the year to June 2017 MR Haircare Limited made a profit of £116,000 (2016: loss £79,000) and this is reported in the Group results.
In the year to June 2017, the Company sold products to the value of £61,000 (2016: £ nil) and also operated an inter-company current account with Brand Architekts Limited, a wholly owned subsidiary acquired in the year. At the 2017 year end the Company had payables due from Brand Architekts Limited of £147,000 (2016: £ nil) being disclosed within ‘Trade and other receivables’ (see Note 16). In the year to June 2017 Brand Architekts Limited made a profit after tax of £2,046,000 and this is reported in the Group results.
NOTE 27 RELATED PARTIESCompensation of key management personnel (including directors): 2017 2016 £’000 £’000 Short term employee benefits 922 930 Post-employment benefits 60 92 982 1,022
Directors and their InterestsThe Directors who served during the year and their interests in the Company’s share capital are as follows:
24 June 2017 19 September 2016 25 June 2016 Ordinary Shares Ordinary Shares Ordinary SharesB M Hynes 74,914 74,914 50,000C G How 89,977 89,977 60,000J M Fletcher 37,374 37,374 25,000M W Warren 30,030 30,030 22,100F P Berrebi - - -R S McDowell 344,189 344,189 71,000E J Beale - - -

ANNUAL REPORT & ACCOUNTS 2017 – 85 – FINANCIAL STATEMENTS
NOTE 28 EVENTS POST STATEMENT OF FINANCIAL POSITIONNo significant adjusting events have occurred between the reporting date and the date of authorisation.
FIVE YEAR SUMMARYThe following five-year summary has been produced to allow improved comparisons to be made between the current results and those of prior years.
In the year to June 2017, the Group purchased finished products for resale amounting to £2,041,000 (2016: £4,165,000) from SCCTC, a Chinese manufacturer of cosmetics products in which the Group holds a 19% shareholding. At the 2017 year end the Group had payables due to SCCTC amounting to £435,000 (2016: £858,000) being disclosed within ‘Trade and other payables’ (see Note 17).
During the year, Swallowfield plc operated an inter-company loan facility with Swallowfield Consumer Products Limited with the balance at the year-end of £157,000 due to Swallowfield Consumer Products Limited (2016: £74,000 due to Swallowfield plc) being disclosed within ‘Trade and other payables’ (see Note 17). Interest of £3,000 (2016: £11,000) was payable on this loan during the year to Swallowfield plc.
Unaudited IFRS audited IFRS audited IFRS audited IFRS audited IFRS audited Financial Year Financial Year Financial Year Financial Year Financial Year 2017 2016 2015 2014 1 2013 (restated) £’000 £’000 £’000 £’000 £’000 Number of weeks in financial year 52 52 52 53 52Statement of Comprehensive Income Reported Revenue 74,314 54,455 49,447 50,033 48,591Adjustment for 53rd week 1 - - - (943) -Revenue 74,314 54,455 49,447 49,090 48,591Operating profit/(loss) before exceptional items 3,675 1,793 996 768 (449)Exceptional items (343) 645 - (366) (491)Operating profit/(loss) after exceptional items 3,332 2,438 996 402 (940)Net interest (217) (164) (182) (262) (394)Profit/(loss) before taxation 3,115 2,274 814 140 (1,334)Taxation (543) (273) (68) 17 424Profit/(loss) attributable to equityshareholders of the parent 2,554 2,001 746 157 (910)Profit attributable to non-controlling interest 18 - - - -Payments to shareholders (675) (317) - - (712) Statement of Financial Position Non-current assets 22,544 13,643 13,061 11,467 12,073Net current assets 7,619 4,500 3,511 3,718 3,307Total assets less current liabilities 30,163 18,143 16,572 15,185 15,380Non-current liabilities: Loans and lease finance (1,559) (442) (583) - (37)Long term employee benefits (6,132) (4,495) (2,662) (2,212) (2,912)Deferred tax (407) (414) (403) (413) (422)Equity 22,065 12,792 12,924 12,560 12,009Net debt 3,641 4,331 5,390 5,077 5,667
Statistics Weighted average number of shares in issue 16,834,773 11,306,416 11,306,416 11,306,416 11,306,416Undiluted earnings/(loss) per share 15.2p 17.7p 6.6p 1.4p (8.1p)Gearing 17% 34% 42% 40% 47%Dividends per share (paid) 4.0p 2.8p - - 2.2p
1 Except for revenue, where the relevant adjustment has been shown above, no material changes would be required to the income statement to adjust the 2014 financial year numbers to a 52-week basis.

ANNUAL REPORT & ACCOUNTS 2017– 86 –FINANCIAL STATEMENTS
DIRECTORSB M Hynes (Chairman)C G How (Chief Executive Officer)J M Fletcher (Group Sales and Marketing Director)M W Warren (Group Finance Director)F P Berrebi (Non–Executive Director)R S McDowell (Non-Executive Director)E J Beale (Non-Executive Director)
SECRETARYM W Warren FCCA
REGISTERED OFFICESwallowfield HouseStation RoadWellingtonSomersetTA21 8NL
STOCKBROKERSN+1Singer Singer Advisory LLP (N+1 Singer)One Bartholomew LaneLondonEC2N 2AX
FINANCIAL PRAlma PRAldwych House71 – 91 AldwychLondon WC2B 4HN
REGISTERED NUMBER01975376
REGISTRARSComputershare Investor Services PLCPO Box 82The PavilionsBridgewater RoadBristolBS99 7NH
AUDITORSGrant Thornton UK LLP5 Benham RoadSouthampton Science ParkChilworthSouthampton SO16 7QJ
SOLICITORSOsborne Clarke2 Temple Back EastTemple QuayBristolBS1 6EG
BANKERSHSBC Bank plc3 RivergateTemple QuayBristolBS1 6ER
WEBSITE ADDRESSwww.swallowfield.com
FINANCIAL CALENDAR2017 Annual General Meeting 9 November 2017Proposed final dividend payment 8 December 2017Interim results announcement March 2018Interim dividend payment May 2018Announcement of 2018 final results September 20182018 Annual General Meeting November 2018
CORPORATEDIRECTORY


www.swallowfield.com