Author’s postprint version of the article on institutional ...

Published in: Computers & Structures (2002), vol. 80, pp. 2361-2373
Status: Postprint (Author’s version)
Swaged bolts: modelling of the installation process and numerical analysis
of the mechanical behaviour
M. Dréan a, A.-M. Habraken
b, A. Bouchaïr
a, J.-P. Muzeau
a,*
a LERMES/CUST, Blaise Pascal University, BP 206, 63174 Aubière Cedex, France b M&S, Bat B5213, Chemin des Chevreuils 1, University of Liège, B4000 Liège 1, Belgium
Abstract
Swaged bolts are an alternative to high strength bolts in steel structures. To clarify the steps of the installation
process, numerical modelling has been carried out. The relevant phenomena are described and evaluated. This
numerical calculation accounts for large displacements, large strains, mechanical plasticity and friction contact
between the components of swaged bolts. The non-linear finite element code "Lagamine" designed for the
simulation of metal forming processes has been used to provide the stress distributions in the components.
Keywords: Swaged bolts; HSFG bolts; Bolt modelling; Installation process; Numerical analysis; Metal forming;
Friction contact
1. Introduction
Swaged bolts are an alternative to high strength friction grip (HSFG) bolts for connections in steel structures.
Because of their automatic installation process, the installed preload is expected to be established with
reasonable confidence. In Europe, the mechanical knowledge about this fastener raised from tests carried out to
qualify the bolts [1-3]. Nevertheless, some unexpected mechanical results (too low preload value, loss of the
preload [2]) appeared during installation tests. Therefore, it was decided to use a numerical modelling to describe
and to evaluate the influences of the different steps of the installation process on the preload. First, this paper
contains a description of the bolt. Then, the finite element software Lagamine is presented. It allows practical
applications with large strains, large rotations and/or large displacements and accounts for friction between
elements. After a detailed description of the modelling of each bolt component (geometry and mechanical
characteristics), the calculation results are given. Especially, the way the force is transferred from the hydraulic
installation tool into the bolt is explained. Finally, the stress distribution is analysed and related to the low-cycle
fatigue behaviour shown during tests.
2. General presentation of swaged bolts
2.1. Description of the basic components
Like classical HSFG bolts, prestressed swaged bolts are made up of two different components (Fig. 1). The pin
acts as a bolt screw with a shank zone chosen according to the thickness of the plates. The collar acts as a nut
whose threads are created during the installation process. The available pin diameters are 12, 16, 20, 24 and 27
mm. Their geometrical and mechanical characteristics are nearly the same as those of high strength bolts grade
10.9 or A490 [1]. The main geometrical characteristic of these bolts is the thread: a helical groove with a special
profile showing a succession of linear and elliptical parts. The flat sides are orientated at 20° and at 40° instead
of 30° as in a traditional thread.

Published in: Computers & Structures (2002), vol. 80, pp. 2361-2373
Status: Postprint (Author’s version)
Fig. 1. Collar and pin of a swaged bolt.
2.2. Installation process and advantages of swaged bolts
The installation process of swaged bolts is completely different from a classical bolt strengthening and it
represents the major advantage of this type of fastener. It consists of swaging the collar onto the pin with a
special hydraulic tool. It is nearly the same installation as rivet installation. The internal diameter of the
hydraulic tool nose (anvil), is smaller than the external diameter of the collar. Therefore, the collar material flows
into the pin grooves. This process of installation creates a bond without any gap. So the self-unscrewing of this
kind of bolts is nearly impossible. It argues for the use of these fasteners in applications under vibrations (truck
body for instance). Moreover, the installation is very fast: less than 30 s per bolt. In civil engineering, where the
number of bolts can be large (thousands), it is beneficial to minimise the installation time without any lack of
accuracy on the preload.
Fig. 2. Installation process.
The sequence of the installation process can be divided into four steps (Fig. 2). First (1), the pin is inserted
through a prepared hole and the collar is threaded onto the pin using a unique small prethread called "tab-lok".
Then, the nose assembly of the hydraulic tool is placed over the pintail. The hydraulic pressure makes the tool

Published in: Computers & Structures (2002), vol. 80, pp. 2361-2373
Status: Postprint (Author’s version)
pull on the pintail and press the plates together (2). The anvil pushes on the collar. Continued pulling on the
pintail moves the anvil forward, swaging the collar into the pin grooves. This swaging action lengthens the
collar. and develops a permanent clamp force (preload) in the pin. When swaging is completed (3), the contact
between the different elements allows the pulling load to increase up to break the breaking groove. So, the pintail
separates from the pin and the anvil disengages from the collar (4).
This automatic and fast installation process allows a preload to be installed when the connected plates respect the
out-of-flatness tolerances. The value of this preload is in the same range of the preload value installed in a HSFG
bolt of the same diameter. Nevertheless, some tests carried out to check the value of the installed preload [2,3]
have shown that a large out-of-flatness defect can affect significantly the value of the preload. So a FEM
simulation of the process has been used to provide a better understanding of the successive phenomena appearing
during the installation process.
3. General presentation of the finite element code Lagamine
3.1. Introduction
Since 1984, the Lagamine software has been developed at the University of Liege by Cescotto's team to simulate
metal forming processes. For instance, rolling [4], deep drawing [5], extrusion and forging [6] processes have
been studied and couplings with microscopic events like recrystallization [7] or texture evolution [8] have been
investigated. Two-dimensional or three-dimensional analyses, mechanical or thermo-mechanical simulations are
available. This code provides both solid and contact finite elements as well as a large library of constitutive laws.
Working in a frame of solid mechanics with large strains, large rotations and/or large displacements, the code is
characterised by different choices:
Lagrangian formulation meaning that the mesh sticks to the solid,
hypo-elastic formulation where elastic and plastic strain rates are directly added and no constitutive
equation is required for plastic spin. This choice remains physically sound as long as elastic strains are
small,
use of Cauchy stresses and Jaumann derivatives to express objective constitutive laws,
implicit approach: the process is subdivided into successive steps where the force equilibrium is
verified.
As metal forming processes often mean large material flow, the choice of a Lagrangian approach has to be
associated with a remeshing procedure as some finite elements become strongly distorted during the simulations.
An automatic two-dimensional remeshing module [9,10] has been developed:
automatic remeshing decision based either on geometric element criteria or on error estimators,
generation of a new mesh according to the updated contour line and to a variable mesh density that
induces mesh refinement or mesh coarsening adapted to error analysis or geometric element criteria,
transfer of velocity field, internal variables and stress tensor between the old mesh and the new one,
restart of the simulation.
In swaged bolts, the collar forging could require remeshing procedure. However the geometric quality of the
deformed elements without remeshing has shown that this step is not required for these simulations.
In the field of steel design, Lagamine code has already been used for the modelling of beam-to-column
connections. Bursi and Jaspart [11,12] propose an overview of the current developments for estimating the
moment-rotation behaviour of bolted moment resisting connections. The calibration of the commercial code
ABAQUS on test data of elementary tee stub connections as well as simulations by Lagamine code were initially
performed to scrutinise issues related to discretization, element type, constitutive laws and step size. Next an
assemblage of three-dimensional beam finite elements was proposed to model the bolt behaviour in a simplified

Published in: Computers & Structures (2002), vol. 80, pp. 2361-2373
Status: Postprint (Author’s version)
yet accurate fashion.
To study the behaviour of swaged bolts in loaded structures is a future goal, this paper focuses on its installation
process to provide a better understanding of the phenomena happening during this step. It must not be forgotten
that the initial stress distribution in the bolt as well as its geometry, result from this installation process.
3.2. Solid element
The bolt geometry allows an axisymmetrical state to be assumed and two dimensional elements to be used. The
temperature increase due to friction and plastic dissipation is limited and a thermo-mechanical analysis is not
required, so mechanical simulations were performed. In practice, the Lagamine code proposes three types of
two-dimensional mechanical solid elements:
PLXLS [4]: classical isoparametric element based on the virtual work principal expressed according to
the displacement field, the numbers of nodes and integration points are variable but in general,
parabolic case with sub integration is adopted (8 nodes and 4 integration points);
JET2D [13] and BLZ2D [14] are mixed type elements with four nodes and one integration point. They
are based on the Hu-Washizu principle which is formulated on three fields: displacement, strain and
stress. Special cares such as anti-hourglass stresses and assumed strain method are taken to avoid
spurious zero-energy modes and incompressibility locking. Different assumptions on these topics have
resulted in two distinct elements.
The helical grooves present in the pin at the initial state and also in the collar at the final state justify PLXLS
choice with eight nodes and four integration points. In fact, this parabolic element brings an accurate geometric
description with a limited number of degrees of freedom.
The installation of a swaged bolt takes into account five bodies: the pin, the collar, two plates and the hydraulic
tool. The model discretizes only three bodies by solid elements: the pin, the collar, and a "work piece"
representing the two plates as the friction and discontinuity between these plates do not affect the installation
process if perfect flat plates are assumed. The hydraulic tool is simulated by a rigid moving body, defined by a
boundary contact condition. For each discretized body, the contour line is given to an automatic mesh generator
which provides the solid elements mesh.
3.3. Contact element principle
The contact is the main feature of the swaged bolt simulation as the loading of each body comes from the contact
and friction conditions. It is simulated by an interface element based on a penalty approach and derived from the
virtual work principle [15]. Kinetically compatible with the associated solid element, this element is defined by
an isoparametrical approach and its numerical integration is carried out by Gaussian points. For some special
choice of reduced integration scheme, this element is equivalent with a mixed one, based on a multi-field
variational principle [16]. The originality of the present approach lies in the fact that the contact conditions
(Signorini's condition and Coulomb friction law) are expressed at some integration points, not at the nodal
points.
The development of contact between deformable solids A and B introduces a coupling between the degrees of
freedom (DOF) of each body. A simple way to treat this kind of problem is to neglect this coupling. This case
called "uncoupled approach" means that at a given time t, the geometry of solid A is "frozen" and the contact
elements belonging to solid B "see" the boundary of solid A as a rigid foundation. Reciprocally, at the same time
t, the contact elements belonging to solid A are also calculated as if the geometry of solid B was frozen. Hence,
the contact forces computed by the contact elements of each solid depend only on the DOF of this solid. As the
stiffness matrix used to iterate and to find the force equilibrium is computed by the force derivatives, in this
uncoupled approach, the stiffness matrix has no term that couples DOF of solids A and B.
On the contrary, if the contact forces are computed exactly and depend on the DOF of the two solids, then the
corresponding stiffness matrix establishes a full coupling between the DOF belonging to the boundary of each
solid. This approach is called the "coupled approach". The uncoupled approach [15] yields no convergence if
solids A and B have similar stiffness. The present swaged bolt simulation is an additional example.

Published in: Computers & Structures (2002), vol. 80, pp. 2361-2373
Status: Postprint (Author’s version)
3.4. Contact law
The contact law formulation is related to an elastic-plastic formalism with an elastic field (sticking contact) and a
plastic field (sliding contact). In this context, the yield surface is expressed by the dry Coulomb friction formula.
For simplicity, this law is presented here for the uncoupled case but Ref. [15] gives all the details for coupled
case. Fig. 3 defines the solid A, its total boundary: ΓA, its contact boundary: and the rigid foundation that
enters into contact with solid A.
Fig. 3. Definition of contact geometry and local axes.
Contact happens when a penetration between the foundation and the solid is detected. This small interpenetration
of the solids results from the used penalty concept. Local axes are defined at each integration point (Fig. 3) of the
contact boundary with inside normal and tangent to , note that this boundary is assumed to be smoothed.
The contact stresses: the pressure p and the tangential stress τ are oriented according to the local axes . In
fact, this non-linear approach works with the contact stress rates: The strain rates , are the relative velocity
components expressed in local axes of the integration point belonging to solid A and the boundary point S of the
foundation (Fig. 3). The case of sticking contact corresponds to the elastic case in the present analogy with
elastoplastic formalism. The stress and strain rates are linked by the relationship (1) in sticking case:
where Kp,Kτ are the penalty coefficients. They are chosen as large as possible to reduce solid interpenetration and
still to give convergence of the Newton-Raphson iterative procedure that computes force balance. The friction or
sliding contact case represents the plastic case. Its appearance depends on a yield locus expressed by Coulomb
condition (Fig. 4):
where Φ is the friction factor. In metal plasticity (standard or associated plasticity), the normality law is used to
express the plastic strain rate:
Fig. 4. Sliding Coulomb criterion in stress space.

Published in: Computers & Structures (2002), vol. 80, pp. 2361-2373
Status: Postprint (Author’s version)
where is the plastic factor. In contact model, this law cannot be applied because no plastic strain is associated to
the contact pressure. This justifies why, a non-associated plasticity law is chosen, where the function ƒ is
replaced by function g:
The relation between stress and strain rates in friction case can be written as:
4. Swaged bolt modelling
4.1. Mechanical characteristics of swaged bolts
During the installation, permanent deformations are observed in the collar. They are due to the forging process of
the collar between the pin and the anvil. Several mechanical phenomena can be remarked: the elastic-plastic
behaviour of the pin and collar steels, the friction contact between the anvil and the collar, the progressive
damage of the breaking groove and the dynamic effect resulting by the break of this breaking groove. As poor
knowledge on the materials is available, it is not possible to use a damage law [17], which could model more
accurately the pin break. A classical isotropic elastic-plastic law of Von Mises type with simple bilinear stress-
strain curve is adopted for all the present materials. The considered mechanical characteristics of the whole
model are given in Table 1.
Table 1 Mechanical characteristics of each component
Young's modulus (MPa) Yield stress (MPa) Strain hardening modulus (MPa)
Pin 210,200 1170 2500
Collar 204,200 313 2090
Plates 210,000 235 0
(a) Mechanical characteristics of the pin. The dimensions of the pin are sufficient to allow standard tension test
coupons to be extracted. Some tests have been performed by Czarnomska et al. [1], some other ones have been
obtained more recently [18]. They can be represented by a bilinear law which is used at the simulation level as
natural strain-true stress reference curve (Fig. 5(a)).
(b) Mechanical characteristics of the collar. Because of the small sizes of the collar, it is not possible tomachine
classical tensile test coupons. So, it was decided to carry out compressive tests on small ring-samples cut in
collars. This testing series present two aspects. The first aspect is the crushing test of the cylindrical sample
measuring the displacement of the moving table. The second aspect is a test (Blank test) without any sample in
order to measure the compressive flexibility of the testing machine. The displacement values of both tests are
subtracted for the same value of crushing force. These last results (Fig. 5(b)) are the most reliable results
according to classical steel values.
(c) Mechanical characteristics of the steel plates. The steel plates are made of S235 steel grade. No specific
tests were performed, elastic modulus and yield stress come from literature. No strain hardening is taken into
account.
(d) Friction coefficient. A correct modelling of the installation must take into account the forces transmitted by
the friction between the anvil and the collar. To define the relevant friction coefficient between the collar and the
anvil, the barrelling of the ring-samples during compression tests of the collar was measured. The covering of the
sample support surfaces was adapted to be as close as possible to the real friction conditions. Then, finite
element simulations of this test have been conducted with the stress-strain curve defined on point (b) associated
to various friction coefficients. Comparing the force and the final shape between experiment and numerical

Published in: Computers & Structures (2002), vol. 80, pp. 2361-2373
Status: Postprint (Author’s version)
models, it has been possible to get the best value for this coefficient: 0.05. For the other contacts (plates/pin,
plates/collar and pin/collar) no information was available and 0.15 value is adopted as it is known as being
reasonable in deep drawing when no special care is applied.
Fig. 5. (a) Strain-stress curves of the pin and (b) strain-stress curves of the collar.
4.2. Geometrical characteristics of swaged bolts
The bolt shape leads to the chosen axisymmetrical model. The hexagonal flange of the collar and the head of the
pin are approximated to cylinders with the same normal sections (Fig. 6).
Fig. 6. Actual and modelled shapes of the pin-head and of the breaking groove.

Published in: Computers & Structures (2002), vol. 80, pp. 2361-2373
Status: Postprint (Author’s version)
(a) The pin: The profile of the head is kept but a cylinder with the same cross-sectional area replaces the
hexagonal part. The equivalent diameter Φeq is calculated using a formula where Φins is the diameter of the
inscribed circle and Φcir, the drawn round circle diameter:
The helical grooves of the pin are transformed into fluting but keeping the actual non-symmetrical profile. All
the dimensions are chosen as close as possible to the theoretical or nominal manufacturer data and to data
obtained by profile projections (Fig. 7). The pintail keeps its real length, 54 mm. And, to respect the full
mechanical behaviour during the installation, the breaking groove is also represented as accurately as possible
(Fig. 6). The dimensions of its profile are also obtained by profile projection measuring.
(b) The collar: As the pin, it is more or less cylindrical. As previously, the hexagonal flange is replaced by a
cylinder with the same cross-sectional area in order to keep the same contact area (Fig. 8). The dimensions are
also taken from a profile projection measuring.
(c) The plates: One cylinder only models the plates. The value of its external diameter is chosen large enough to
allow a realistic stress diffusion to be provided. The manufacturer gives the value of the internal diameter.
Fig. 7. Thread dimensions.
Fig. 8. Collar 16 mm diameter: actual and modelled shapes.
Fig. 9. The whole model of the parametrical study.
4.3. Global mesh
Fig. 9 shows the whole FEM model including the pin, the collar, the steel plates (represented by one rectangle)
and the anvil.

Published in: Computers & Structures (2002), vol. 80, pp. 2361-2373
Status: Postprint (Author’s version)
4.4. Installation load evolution
In order to calibrate the parameters governing the mechanical behaviour of the installation process, it was
necessary to define some reference steps. As it is not possible to measure the forces developed by the hydraulic
tool during the installation, the first reference step is chosen to be the displacement of the anvil measured by a
transducer fixed on the body of the installation tool (Fig. 10(a)). A typical curve representing the evolution of
this displacement versus the installation time is shown on Fig. 10(b). Point A marks the creation of the first
thread in the collar. The swaging process ends at point B and the anvil action stops at point C. The break of the
breaking groove occurs at point D and the anvil begins to come back at point E.
The loading evolution is calibrated to follow the evolution of the forces applied to the body of the installation
tool. The hydraulic power unit imposing the pressure on the piston, creates the force on the anvil. The calculation
is carried out in two steps. The first one is the swaging of the collar onto the pin (Fig. 10(b), between A and B),
the second one is the withdrawal of the tool from the collar (Fig. 10(b), after E to the end of the curve).
Computations are governed by displacements.
4.5. Representation of the contacts
Concerning the contacts, different techniques were tested. The conclusion of these tests is that the best modelling
method, if not the only possible one, is the coupled approach for collar/pin and collar/plates contact, mainly
because the stiffness of all these solids is very close. The uncoupled approach is only used for the collar/anvil
contact, which is classical as the anvil is not meshed but simulated by a moving boundary with infinite stiffness
(foundation).
Fig. 10. (a) Measure of the hydraulic tool displacement and (b) measured displacement of the hydraulic tool.

Published in: Computers & Structures (2002), vol. 80, pp. 2361-2373
Status: Postprint (Author’s version)
4.6. Computations
The computations were carried out in two sequences. The first one was achieved to check the validity of the
model, the second one to analyse some parametrical influences. During the second sequence, and to allow
modifying the numerical conditions of the computation, the whole-modelled swaging process is divided into
different steps. Indeed, the beginning of the calculation reveals to be critical, due to the required penetration to
initiate contact between the anvil and the collar. The preexisting force generates a numerical bound due to the
contact strategy. Lowering the non-equilibrated forces attenuates this effect but slows down the computation.
Then, in the following, this effect is reduced. The choice of the loading step is automatically adapted within the
performance of the convergence. Only the minor value and the major value of the step size are determined by the
user.
5. Results
5.1. First computations
During the first sequence of calculations, the model was divided into two parts, the upside part with the collar
and the downside part with the head pin and the plates (Fig. 11).
Both computations were carried out to check that the contact phenomena do not induce any problems of
convergence. The results showed that each part could be calculated during the swaging process but also during
the anvil withdrawal.
The deformations of the meshes are almost the same as the actual bolt, however high penetration between solids
appeared. Using higher penalty coefficients reduces this penetration between the meshes for next models.
The pintail size appears to be too influential so it was decided to keep its real length and its real shape in the final
model. Indeed, the stress flow is better respected with a long pintail and with fixed nodes further located on the
pintail (Fig. 9).
Fig. 11. First tests of computation meshes.
5.2. Swaged geometry of the parametrical study
The whole bolted joint is modelled now. Both parts previously described are gathered and comparisons are made
on the collar geometry.
Firstly, the shape of the collar mesh at the end of the numerical installation is compared with the shape of a real
swaged collar cut in the middle (Fig. 12). The mesh matches very well with the filling up of the real pin threads:

Published in: Computers & Structures (2002), vol. 80, pp. 2361-2373
Status: Postprint (Author’s version)
• the threads at the top of the collar present gap with the pin, because of the hold of the anvil on the collar
flange at the end of the swaging process,
• the threads in the middle of the collar are well formed,
• the threads at the bottom of the collar are nearly absent. In fact, the threads begin at the top of the collar
flange.
Fig. 12. Cut sample of swaged bolt and mesh at the end of the numerical installation.
Table 2. Geometrical dimensions taken on the swaged collar
Data type Swaged diameter at the collar
top (mm)
Swaged length (mm)
Test average 23.97 (σ = 0.012) 19,9 (σ = 0.23)
Modelling results 23.98 20.35
Control data 24.1 max 17.7 min
An actual swaged bolt installation can be controlled by some specific dimensional data provided by the
manufacturer (control data), such as the length of the swaged part of the collar. Therefore, it was decided to
control the numerical installation with this criterion.
The diameter values of the modelled swaged collar vary from 23.98 mm at the top, to 24.14 mm at the bottom.
The experimental values can only be measured at the top because of the accessibility of the measurement tool
(calliper rule). The swaged length is measured with a ruler and according to the manufacturer method. All the
experimental values match with the controlled values and verify well the numerical modelling values (Table 2).
5.3. Forces acting during the installation
(a) Internal load. Installation tests have been used to compare the numerical results to the actual behaviour. They
consist in measuring the internal load in the pin in function of the displacement of the anvil during the
installation. The internal load is measured with an axial gauge glued in the shank zone of the pin [2]. So, it is
possible to obtain a preload-displacement curve (Fig. 13).
In the computation, the tension in the pin is deduced from the stress value obtained in the finite element
corresponding to the gauge location. The displacement is chosen to be equal to the tool displacement. Therefore,
another internal load-displacement curve can be plotted (Fig. 13).
Curves shown in Fig. 13 have the same shape. Point(a) and point (a') mark the creation of the first thread in the
collar and the collar blocking on the pin. The internal load value reaches 31 kN in the numerical installation and
in the experimental installation. Point (b) and point (b') mark the end of the swaging process. It corresponds to
the point where the final external load value is the highest.
Small differences appear about the final preload. The loss of preload observed on the numerical curves can be
explained by the strategy of computation. Imposing the displacement allows the material to flow; this creates a
force decreasing. The differences of loading levels at each step of the installation are due to the variations of the
mechanical characteristics and of the dimensions of the tool. Notably, the level of preload at the end of the
loading is mainly sensitive to the value of the strain hardening modulus of the pin. Regarding the preload at the
Published in: Computers & Structures (2002), vol. 80, pp. 2361-2373
Status: Postprint (Author’s version)
end of the tool ejection, it appears to be lower than the actual value. The dimensions, but also the shape of the
tool, affect this preload.
Fig. 13. Numerical and experimental internal load-displacement curves.
According to these numerical and experimental results, a comparison of the tensile forces in the pin is made for
each key-step of the installation (Table 3). The only anvil withdrawal phase is not mentioned because it
corresponds to a variation of the tensile force. The comparison of these different values shows that the dimension
order between the experimental data and the numerical data is kept.
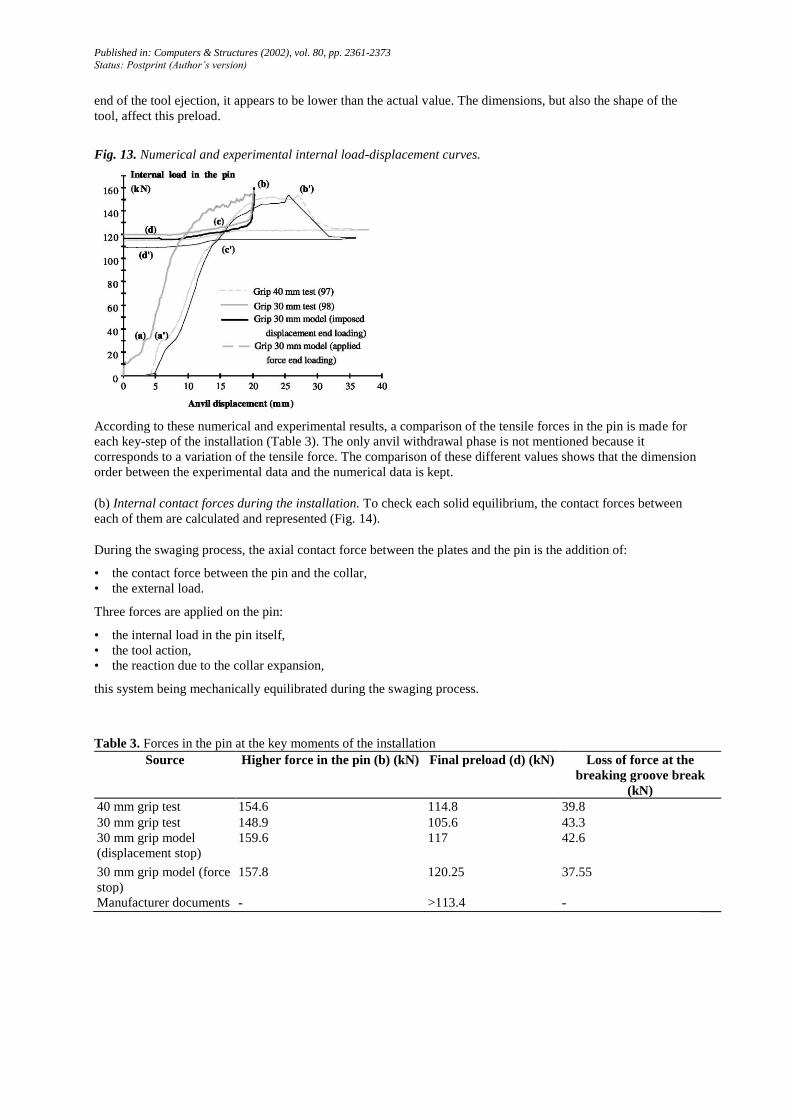
(b) Internal contact forces during the installation. To check each solid equilibrium, the contact forces between
each of them are calculated and represented (Fig. 14).
During the swaging process, the axial contact force between the plates and the pin is the addition of:
• the contact force between the pin and the collar,
• the external load.
Three forces are applied on the pin:
• the internal load in the pin itself,
• the tool action,
• the reaction due to the collar expansion,
this system being mechanically equilibrated during the swaging process.
Table 3. Forces in the pin at the key moments of the installation
Source Higher force in the pin (b) (kN) Final preload (d) (kN) Loss of force at the
breaking groove break
(kN)
40 mm grip test 154.6 114.8 39.8
30 mm grip test 148.9 105.6 43.3
30 mm grip model
(displacement stop)
159.6 117 42.6
30 mm grip model (force
stop)
157.8 120.25 37.55
Manufacturer documents - >113.4 -
Published in: Computers & Structures (2002), vol. 80, pp. 2361-2373
Status: Postprint (Author’s version)
Fig. 14. Computed forces between the different components of the bolt.
Then, during the anvil withdrawal, the loading force applied by the anvil becomes negligible. So, the contact
force between the collar and the pin has the same values as the contact forces between the other solids (plates/
collar and plates/pin). Two equal forces equilibrate each solid. This statement confirms the correct mechanical
equilibrium of the model.
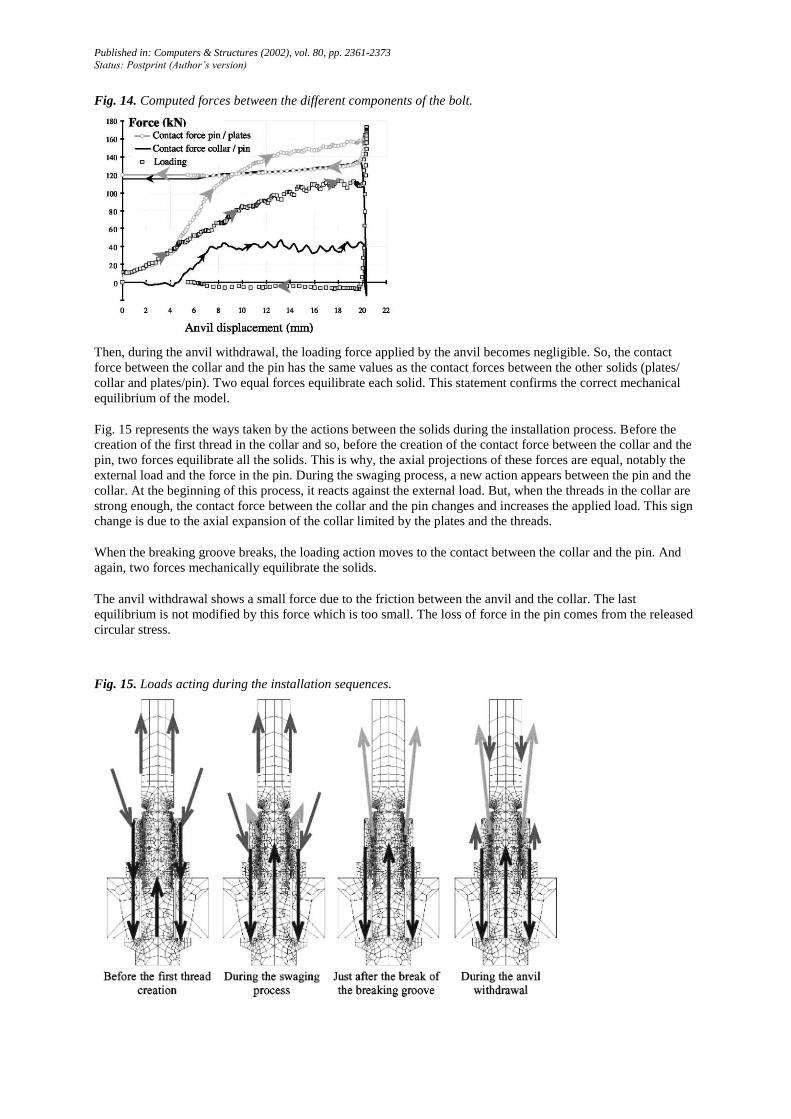
Fig. 15 represents the ways taken by the actions between the solids during the installation process. Before the
creation of the first thread in the collar and so, before the creation of the contact force between the collar and the
pin, two forces equilibrate all the solids. This is why, the axial projections of these forces are equal, notably the
external load and the force in the pin. During the swaging process, a new action appears between the pin and the
collar. At the beginning of this process, it reacts against the external load. But, when the threads in the collar are
strong enough, the contact force between the collar and the pin changes and increases the applied load. This sign
change is due to the axial expansion of the collar limited by the plates and the threads.
When the breaking groove breaks, the loading action moves to the contact between the collar and the pin. And
again, two forces mechanically equilibrate the solids.
The anvil withdrawal shows a small force due to the friction between the anvil and the collar. The last
equilibrium is not modified by this force which is too small. The loss of force in the pin comes from the released
circular stress.
Fig. 15. Loads acting during the installation sequences.

Published in: Computers & Structures (2002), vol. 80, pp. 2361-2373
Status: Postprint (Author’s version)
Fig. 16. Axial stresses.
5.4. Stresses in the bolt during the installation
A zone of high stress values can be noticed in the pin, which follows the displacement of the anvil during the
swaging process (Fig. 16). At the beginning of the anvil withdrawal, the axial stress value reaches 500 MPa in
this area, nearly equal to the stress in the breaking groove zone (570 MPa). Then, this zone of high stress values
remains at the same place but the value of the axial stress decreases down to 400 MPa. It represents 44% of the
yield stress of the pin material. This particular zone corresponds to the location where, in the pin, a fatigue
fracture appears under low-cyclic loading [2] (Fig. 17).

Published in: Computers & Structures (2002), vol. 80, pp. 2361-2373
Status: Postprint (Author’s version)
Fig. 17. Broken pin in the collar after low-cycle fatigue test.
6. Conclusions
Modelling of the installation process of swaged bolts represents several mechanical steps, which cannot be
approached by tests. This is due to the fact that the small size of the collar does not allow any fine
instrumentation to be installed. So, a numerical model is required which needs to use a simulation technique able
to represent the large strains associated with the collar forming process on the pin.
In a first phase, a detailed modelling of a swaged bolt has been presented considering both the pin and the collar.
Then, the software Lagamine, based on the FEM and especially written for large distortions and large
displacements, has been chosen to compute all the different mechanisms involved during the different swaging
steps.
The pin, the collar and the steel plates are modelled as close as possible to their actual shape and to their accurate
mechanical characteristics, these last ones being deduced from several tension or compression tests refined with
a numerical analysis.
To represent the real shape of the anvil, the modelling of the tool is carried out using rigid lines. Its
displacements govern the computation. The Coulomb friction law is used to model the contact between the
different meshes. The numerical results are compared to the experimental ones, which are carried out by
measuring the force with a strain gauge located in the shank zone of the pin. The differences, which appear in the
general behaviour, are due to the difference between the mechanical characteristics taken for the computation
and the actual ones. The simulations allow the sensitivity of some parameters to be evaluated (the strain
hardening of the pin or the tool shape for instance).
This numerical approach gives efficient information about the behaviour of a swaged bolt at each step of the
installation process. It allows the detailed stress distribution to be established with reasonable accuracy. This
leads to better understanding of the parameters acting a role in the mechanical behaviour of this new fastener,
and clarifies the sensitivity of the collar swaging process.
This study shows that the characteristics of each component (pin or collar) have a strong influence on the
mechanical behaviour during the installation, but also that the diameter, and more surprisingly the shape of the
tool, is also very influential on the history of the preload value.
References
[1] Czarnomska M, Muzeau JP, Racher P. Étude expérimentale comparative du comportement d'assemblages par
boulons sertis Huck-Fit ou par boulons HR 10.9. Construction Métallique 1993; 2:9-29.

Published in: Computers & Structures (2002), vol. 80, pp. 2361-2373
Status: Postprint (Author’s version)
[2] Missoum A. Étude expérimentale de boulons sertis précontraints utilisés en construction métallique. PhD
thesis, Blaise Pascal University, Clermont-Ferrand, France, 1997.
[3] Baptista AM, Missoum A, Muzeau JP, Ryan I. Testing of swaged bolts for steel connections. In:
International Conference New Technologies in Structural Engineering, NEW TECH'97, Lisbon, Portugal. 1997.
p. 589-94.
[4] Cescotto S, Grober H, Perdrix C. Calibration of an elastic-visco-plastic constitutive equation for steels in the
hot-rolling conditions. In: Middleton J, Pande GN, editors. Numerical methods in engineering: theory and
applications, Balkema, vol 1. Balkema; 1985. p. 393-9.
[5] Li K, Habraken AM, Bruneel H. Simulation of square cup deep drawing with different finite elements. J
Mater Process Technol 1995;50 (1-4):81-91.
[6] Charles JF, Castagne S, Zhang L, Habraken AM, Cescotto S. Numerical modelling of the forging process of
rolls for rolling mills. In: Pietrzyk M, Kusiak J, Majta J, Hartley P, Pillinger I, editors. Metal forming 2000.
Balkema; 2000.
[7] Habraken AM, Charles JF, Wegria J, Cescotto S. Dynamic recrystallization during zinc rolling. Int J Forming
Processes 1998; 1.
[8] Duchêne L, Habraken AM, Godinas A. Implementation of a texture based interpolated yield locus in FEM
code. In: Mori, editor. NUMIFORM simulation of materials processing: theory, methods and applications, 18-20
June 2001. Tokyo: Balkema Publishers; 2001.
[9] Habraken A-M, Cescotto S. An automatic remeshing technique for finite element simulation of forming
processes. Int J Numer Meth Eng 1990; 30:8.
[10] Dyduch M, Habraken A-M, Cescotto S. Automatic adaptive remeshing for numerical simulations of metal-
forming. Comput Meth Appl Mech Eng 1992; 101.
[11] Bursi OS, Jaspart JP. Finite element-based models for the analysis of bolted beam-to-column steel
connections. Colloquium Istanbul 96 semi-rigid structural connections. HÖnggerberg Zűrich: IABSE-AIPC-
IVBH ETH; 1996.
[12] Bursi OS, Jaspart JP. Basic issues in the finite element simulation of extended end plate connection. J Struct
Eng 1998;69: 361-82.
[13] Jetteur P, Cescotto S. A mixed finite element for the analysis of large inelastic strains. Int J Numer Meth
Eng 1991;31: 229-39.
[14] Zhu YY, Cescotto S. Transient thermal and thermome-chanical analysis by FEM. Comput Struct 1994; 53
(2):275-304.
[15] Habraken AM, Cescotto S. Contact between deformable solids, the fully coupled approach. Math Comput
Modell 1998;28 (4-8):153-69.
[16] Habraken AM, Bourdouxhe M. Coupled thermo-mechan-ical-metallurgical analysis during the cooling of
steel pieces. Eur J Mech: Solids 1992; ll (3):381-402.
[17] Cescotto S, Charlier R. Frictional contact finite element based on mixed variational principles. Int J Numer
Meth Eng 1993; 36: 1681-701.
[18] Dréan M. Étude expérimentale et numérique de la mise en oeuvre de boulons sertis. PhD thesis, Blaise
Pascal University, Clermont-Ferrand, France, 1999.