SW Module 5 - Montana State University
12
Introduction is is the fifth and final module within the Soil and Water (SW) Management series provided by the Montana State University Extension Service and Rocky Mountain Certified Crop Adviser (CCA) program. Used in conjunction with the Nutrient Management (NM) modules, this series is designed to provide useful, applicable information for Extension agents, CCAs, consultants, and producers within Montana and Wyoming on managing their soil and water resources. Specific irrigation methods and equipment are not covered here due to the many sources of information already available. e appendix at the end of the module lists additional resources and contacts concerning plant and water relationships and irrigation. To enhance the learning objective and provide CCAs with the potential to earn continuing education units (CEUs) in Soil and Water Management, a quiz accompanies this module. is module covers the Rocky Mountain CCA Soil and Water Management Competency Area of plant/water relations. Objectives After studying this module, the reader should be able to: • Understand the effects of soil water status on plant nutrients and uptake • Describe how climate and soil water affect plant water relations • Understand plant physiology as it relates to water stress • Discuss management practices to increase water use efficiency and maximize yields Background Water is the major factor limiting agricultural productivity in the northern Great Plains. Many areas within this region often receive very little precipitation depending on topography and location. Increasing use of water resources and lower than average precipitation in recent years have prompted more water conservation research to help producers fine tune management practices. See the appendix for drought related resources. Given that lack of water generally limits crop yields in Montana and Wyoming, producers and crop advisers should benefit from better understanding the relationship between plants and soil water. is relationship is an integration of three interfaces: water movement in the soil, water 5 A self-study course from the MSU Extension Service Continuing Education Series Soil & Wat er MANAGEMENT MODULE 5 1.5 SW PLANT WATER RELATIONS by Evette Allison, Soil Scientist and Clain Jones, Extension Soil Fertility Specialist SOIL & WATER MANAGEMENT C C A C E U 4481-5 NOV. 2005
Transcript of SW Module 5 - Montana State University

Introduction
This is the fifth and final module within the Soil and Water (SW) Management series provided by the Montana State University Extension Service and Rocky Mountain Certified Crop Adviser (CCA) program. Used in conjunction with the Nutrient Management (NM) modules, this series is designed to provide useful, applicable information for Extension agents, CCAs, consultants, and producers within Montana and Wyoming on managing their soil and water resources. Specific irrigation methods and equipment are not covered here due to the many sources of information already available. The appendix at the end of the module lists additional resources and contacts concerning plant and water relationships and irrigation. To enhance the learning objective and provide CCAs with the potential to earn continuing education units (CEUs) in Soil and Water Management, a quiz accompanies this module. This module covers the Rocky Mountain CCA Soil and Water Management Competency Area of plant/water relations.
ObjectivesAfter studying this module, the reader should be able to:• Understand the effects of soil water status on plant nutrients and uptake• Describe how climate and soil water affect plant water relations• Understand plant physiology as it relates to water stress• Discuss management practices to increase water use efficiency and maximize yields
BackgroundWater is the major factor limiting agricultural productivity in the northern Great Plains. Many areas within this region often receive very little precipitation depending on topography and location. Increasing use of water resources and lower than average precipitation in recent years have prompted more water conservation research to help producers fine tune management practices. See the appendix for drought related resources. Given that lack of water generally limits crop yields in Montana and Wyoming, producers and crop advisers should benefit from better understanding the relationship between plants and soil water. This relationship is an integration of three interfaces: water movement in the soil, water
5
A self-study course from the MSU Extension Service Continuing Education Series
Soil &Water M A N AG E M E N T M O D U L E 5
1.5SW
P L A N T WAT E R R E L AT I O N Sby Evette Allison, Soil Scientist and Clain Jones, Extension Soil Fertility Specialist
SOIL
& W
ATE
R M
AN
AG
EM
EN
T
C
C
A
C
E
U
4481-5 NOV. 2005

2 Module 5 · Plant Water Relations
absorption and circulation into plant tissues and the release of water to the atmosphere. This is referred to as the Soil-Plant-Atmosphere Continuum. Figure 1 illustrates the cycling of water and the possible gains and losses through the three interfaces.
Soil Water Energy PotentialAs introduced in SW 4, water moves in the direction from high energy potential to low energy potential.
“Potential” is the quantitative expression of the energy available to do work. For a plant, that “work” is the transport of water and nutrients against gravity to its cells. As the amount of water increases in a given volume of soil, energy potential, also known as water potential, increases. Both the physical effects of absorption of water films to soil colloids (SW 1) and the effects of solutes in solution (SW 4) can affect the water potential.
Plants must rapidly adjust as soil water content changes both with time and space across a field. They adjust by lowering their internal water potential, allowing for the free movement of soil water into their roots. Their total water potential is affected by changes in solute concentration and changes in turgor pressure. Increased solute concentration in plant “sap” lowers total water potential, creating tension to pull in water (Taiz and Zieger, 1991). Conversely, increased solute concentration in the soil makes it more difficult for a plant to absorb water because the water potential has decreased outside the root cells. As cells use water for metabolism, turgor pressure decreases allowing water to move through the cell’s selective semi-permeable membrane. This membrane regulates solute concentration in the cell by permitting larger compounds or ions to pass through only when needed. With the absorption of water, positive pressure increases, maintaining the rigidity of cells for elongation and growth.
Measuring Soil Water StatusSoil water potential can be measured in the field with tensiometers, gypsum blocks and psychrometers. These instruments measure the energy potential of soil water either in negative units of pressure, or with positive units of tension, which is the opposite of pressure. More energy is required to extract water from soil at lower or more negative water potentials. Bars, atmospheres (atm), pounds per square inch (psi), and kilopascals (kPa) are several examples of common pressure units (Table 1).
Transpiration Irrigation
Rainfall
Runoff
Evaporation
CAPILLARYRISE
DEEPPERCOLATION
OUT
Subsurfaceflow
Subsurfaceflow
INRoot Zone
Figure 1. Inputs and losses of water for crops. (FAO, 1998)
Table 1. Pressure potential in different measurement units. (Adapted from Marshall et al., 1996 and Hillel, 1982)
Various Soil, Plant &Atmospheric Conditions
bars & atmospheres(bars) & (atm)
pounds per square inch(psi)
kilopascals(kPa)
Relative Energy Potential
Saturated soil 0 0 0 High
Field Capacity - 0.33 - 5 - 33 Medium
Plant Available Water -0.33 to -15 -5 to -225 -33 to -1500 Medium
Permanent Wilting Point At or below -15 At or below -225 At or below -1500 Low
Air dried soil -31 -465 -3100 Low
Oven dried soil Below - 31 Below -465 Below -3100 Low
Root tissues -3 to -20 -45 to -300 -300 to -2000 Low
Leaf tissues -15 to -30 -225 to -450 -1500 to -3000 Low
The Atmosphere -100 to -500 -1500 to -7500 -10,000 to -50,000 Very low
These values are approximate due to differences in physical or chemical conditions in the soil, plants or the atmosphere.

Module 5 · Plant Water Relations 3
Many of the plant-water relationships introduced in SW 1, such as field capacity and permanent wilting point, are defined by water potential values. Figure 2 depicts when certain plant functions are affected by decreasing water potential. Soil water content can be useful for monitoring changes over the season, or for determining irrigation timing, while soil water potential can be useful in understanding where water will flow and how plants are responding to water content.
Soil Water Conditions that Affect Plants
Soil SaturationSaturated soils have all macro and micro pores filled with water. This creates anoxia (no oxygen) or hypoxia (sub-normal oxygen) and triggers anaerobic respiration in the plant. Soil water potential at this condition is close to zero and water rapidly enters the roots in excess of crop needs. Effects on non-wetland plants from reduced oxygen levels include reduced stem and root growth, decreased rates of photosynthesis, changes in cellular structure and a build up of toxic products from anaerobic respiration such as pyruvate, ethanol and lactate (Levitt, 1980). Low soil temperatures and low oxygen levels from flooding have been shown to retard shoot development in wheat (Sojka, 1975). With a decrease in oxygen, the
concentration of CO2 and other gases increase; this can slow plant growth due to ethylene production in plant tissues. Depending on the length of time that the soil is saturated, plants may experience mineral nutrient deficiencies as active uptake is slowed (Levitt, 1980).
Field CapacityField capacity (FC) occurs after the internal drainage of gravitational water has stopped and a temporary equilibrium has been reached (Marshall et al., 1996). Gravitational water is the excess water that filled macropores during saturation. The pressure under FC is approximately – 0.33 bars for most soils. While frequently quoted as an absolute measurement, various soil types stop draining at different pressure potentials due to their texture and porosity. The rate at which soils reach FC varies; a sandy soil drains more quickly than a clay soil. A shallow water table or an impermeable layer in the soil profile will also slow the FC equilibration process (Kramer and Boyer, 1995), which can keep soils closer to saturation. With soil water content relatively high at field capacity, mass flow of nutrients like nitrate, sulfate, calcium and magnesium is often sufficient for plant needs (NM 3, 6). In addition, diffusion rates of phosphorus (P) and potassium (K) are often relatively high. When soils reach field capacity, 50-80% of P fertilizer can diffuse from fertilizer granules into the soil solution within a 24 hour period (Havlin et al., 2005). Knowledge of nutrient movement at different water potentials can assist irrigation timing for quick delivery of nutrients to crops.
Permanent Wilting PointThe Permanent Wilting Point (PWP) is the amount of water in the soil that is unavailable to plants; at this condition the soil has very low water potential and water content. Air fills most macropores and the thin water films are held tightly to soil particles as illustrated by Figure 3. Under these conditions, plants cannot lower their internal water potential enough to maintain cell turgor, even if transpiration stops (Levitt, 1980). Increased solute concentration in soil water can cause water stress in plants even at potentials greater than PWP. In an effort to conserve water, transpiration does not occur and plant metabolism decreases; both
� �������������������������
����������
��������������������������
�������������������
��������������
��������������������
�����������������
��������������
��������������
������������������
����������������������������
������������������������������
��� ��� ���
Figure 2. Water potential of plants under various growing conditions and their sensitivity to physiological processes with decreasing water potential.Thickness of a bar corresponds to the magnitude of the process. Abscisic acid is a hormone that triggers stomata to close during water stress. (Adapted from Taiz and Zieger, 1991)

4 Module 5 · Plant Water Relations
functions cause lower conductance of water throughout the plant. Soil water is carried through xylem tissue which is made up of conduits of dead cells connected by narrow openings or “pits”. As the xylem pressure decreases from lack of water, air moves into the xylem through these pits, causing cavitation or air bubbles (Sperry et al., 2003). In extreme cases of PWP, cavitation can cause cell walls to crack and break whole stems. Consequently, producers who can irrigate generally avoid reaching PWP by irrigating frequently. Farmers without irrigation capabilities rely on drought tolerant crops and conservation strategies.
Plant Available Water The amount of water between field capacity and
permanent wilting point is termed Plant Available Water (PAW) or Available Water Holding Capacity. Although the water potential for PAW is typically -0.33 to -15.0 bars, wheat planted in fine soils has been observed to absorb water at -25 to -30 bars in some Montana test plots (Jackson, pers. comm.). Qualitatively, PAW is the amount of soil water that can be supplied to the roots relative to the plant’s demand (Kramer and Boyer, 1995). Plant demand for water is affected by transpiration rates, species, and plant size. Water supply to the plant depends on root length density (root length per volume of soil), the
energy potential of the roots (Kramer and Boyer, 1995), soil hydraulic conductivity and soil water content. The water holding capacity of the soil is a function of soil texture and structure. Well aggregated, moderately fine, loamy soils supply the greatest amount of PAW while other textures hold less (Brown et al., 1988). Total plant available water can be calculated using the estimated PAW (inches of water/foot of soil) for a known soil texture and measuring the depth of moist soil (Calculation Box #1). By using a Brown soil moisture probe, soil depth can be measured and a small soil sample can be removed if texture needs to be determined. Data on estimated PAW, moist soil depth, potential crop yields and precipitation probabilities was used as
Figure 3. A diagram of a root cross section and the surrounding soil. (a) Illustrates water in constant contact with the root at saturation or field capacity. Nutrients and water move easily into the root. (b) Illustrates the same root at permanent wilting point. The soil pulls away from the root leaving gaps of air which increases the water stress on the entire plant. Water films between soil particles can not be accessed because of low water potential and physical distance from the root. (Brady and Weil, 2002)
Calculation Box #1
A Havre wheat farmer wants to measure soil water content before planting. The soil in this field is a sandy
loam with an estimated average PAW of 1.5 inches/foot of soil.1
Using a Paul Brown soil probe, he measures moist soil to a depth of 3 feet.
Calculation: 3 feet x 1.5 inches/foot = 4.5 inches total soil moisture 1Estimated value of Plant Available Water Holding Capacity approved by Soils Committee, MSU, Plant and Soil Science Planning Conference, 01/31/1984.
(a) (b)

Module 5 · Plant Water Relations 5
a guideline for “flexible cropping” of barley or wheat in Montana and North Dakota (Brown et al., 1988). By using these pieces of data, producers and crop advisers can come up with a rough calculation of water needed to produce a crop and compare that to yield probabilities in considering whether to plant a field or let it go fallow. Current soil nutrient levels and the possible lack of expected rainfall should also be considered before deciding to plant. Pre-plant PAW, as determined from moist soil depth and soil texture, can also be used to estimate yield potential and thus fertilizer amounts (Bauder et al., 1993). The upper range of PAW is the optimum water potential for easy absorption by plants while the lower range places plants under water stress. At the lower range of PAW, diffusion of P and K slows considerably as water films thin, creating air gaps between soil and roots. Nutrient mineralization and the uptake of soluble nutrients slow down as water content decreases. Additional fertilizer will not increase yields if there is insufficient PAW (Havlin et al., 2005).
Plant Water UseAlmost every plant process is affected directly or indirectly by the water supply (Kramer and Boyle, 1995). Water is required for leaf and stem elongation, photosynthesis, nutrient and gas transport, and plant structure from cell turgor (rigidity). But the main function of water is to cool the plant through transpiration. Only a small percentage of water, less than 1%, remains in the plant tissue for growth (Taiz and Zieger, 1991); the remaining water is released to the atmosphere.
Evapotranspiration‘Evapotranspiration’ (ET) or “crop water use” is the evaporation of water from soil and plant surfaces combined with the transpirational loss of water from the plant. This term more accurately measures total water loss (in inches) of a cropped field than measuring evaporation or transpiration alone. ET can be estimated by measuring the incoming solar radiation, heat movement within the soil and changes in the rate of photosynthesis (Simpson, 1981). In general, three main factors affect ET: climate, plant growth stage and soil water content.
Climate and ETThe amount of water a plant loses to ET changes in response to changes in climate. Higher air temperatures, elevated solar radiation on leaf surfaces, low humidity and wind combine to heat the plant and wick water from it. Less water is lost from ET on cool, overcast days or days with little wind or high humidity. Transpiration rates rise to cool the plant and to take in CO2 due to higher rates of photosynthesis under sunny, warm conditions. Water loss from transpiration occurs through stomata, small openings on the underside of plant leaves, specifically due to the opening of ‘guard’ cells, specialized cells that border each stomate (Figure 4). Depending on plant need, guard cells expand or contract, as they respond to light, temperature, relative humidity, and concentration of internal CO2, hormones and ions (Taiz and Zieger, 1991). When soil water content is insufficient to meet plant water demand, the hormone abscisic acid triggers guard cells to contract. But if soil water is adequate, K can accumulate in guard cells to expand the stomata, allowing for greater production of carbohydrates. Producers can assist their crops’ capacity to adjust to either environmental condition by fertilizing with adequate N, P, and K for optimum plant production of abscisic acid and K uptake.
Figure 4. A stomate magnified 1720 times to show the guard cells that border the opening and regulate gas and water exchange. Electron micrograph courtesy of E. Zeiger and N. Burnstein. (Taiz and Zeiger, 1991)
6 Module 5 · Plant Water Relations
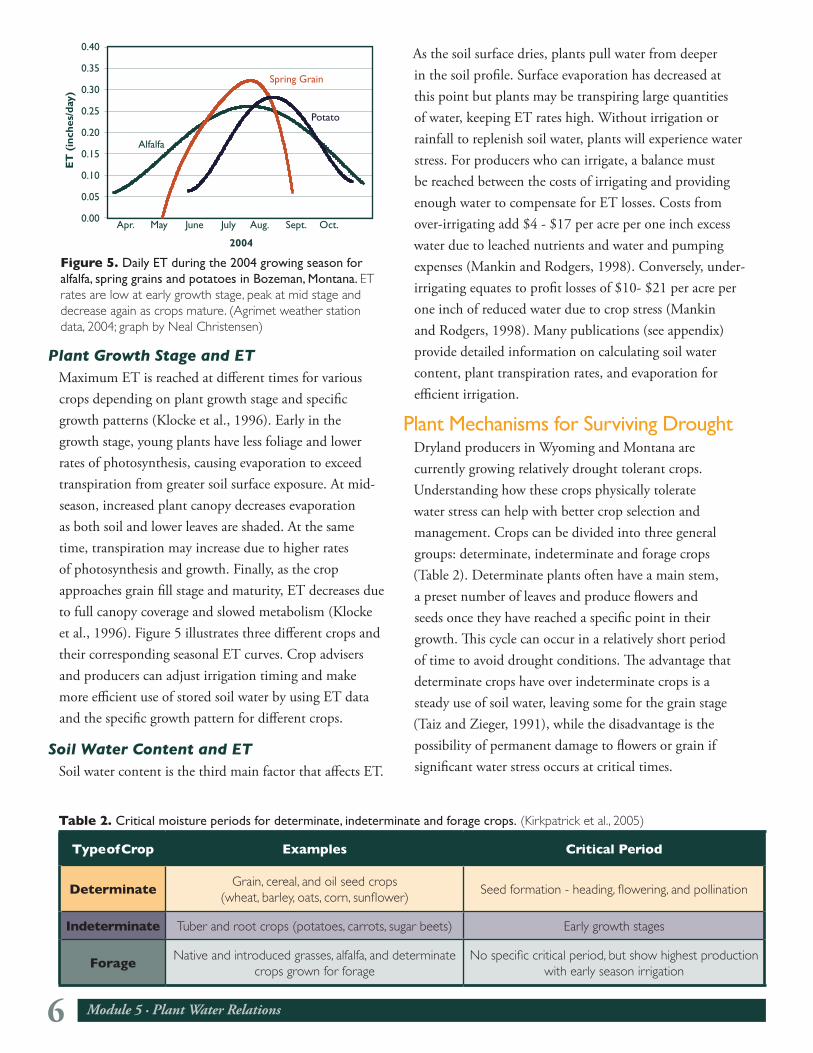
Plant Growth Stage and ETMaximum ET is reached at different times for various crops depending on plant growth stage and specific growth patterns (Klocke et al., 1996). Early in the growth stage, young plants have less foliage and lower rates of photosynthesis, causing evaporation to exceed transpiration from greater soil surface exposure. At mid-season, increased plant canopy decreases evaporation as both soil and lower leaves are shaded. At the same time, transpiration may increase due to higher rates of photosynthesis and growth. Finally, as the crop approaches grain fill stage and maturity, ET decreases due to full canopy coverage and slowed metabolism (Klocke et al., 1996). Figure 5 illustrates three different crops and their corresponding seasonal ET curves. Crop advisers and producers can adjust irrigation timing and make more efficient use of stored soil water by using ET data and the specific growth pattern for different crops.
Soil Water Content and ETSoil water content is the third main factor that affects ET.
As the soil surface dries, plants pull water from deeper in the soil profile. Surface evaporation has decreased at this point but plants may be transpiring large quantities of water, keeping ET rates high. Without irrigation or rainfall to replenish soil water, plants will experience water stress. For producers who can irrigate, a balance must be reached between the costs of irrigating and providing enough water to compensate for ET losses. Costs from over-irrigating add $4 - $17 per acre per one inch excess water due to leached nutrients and water and pumping expenses (Mankin and Rodgers, 1998). Conversely, under-irrigating equates to profit losses of $10- $21 per acre per one inch of reduced water due to crop stress (Mankin and Rodgers, 1998). Many publications (see appendix) provide detailed information on calculating soil water content, plant transpiration rates, and evaporation for efficient irrigation.
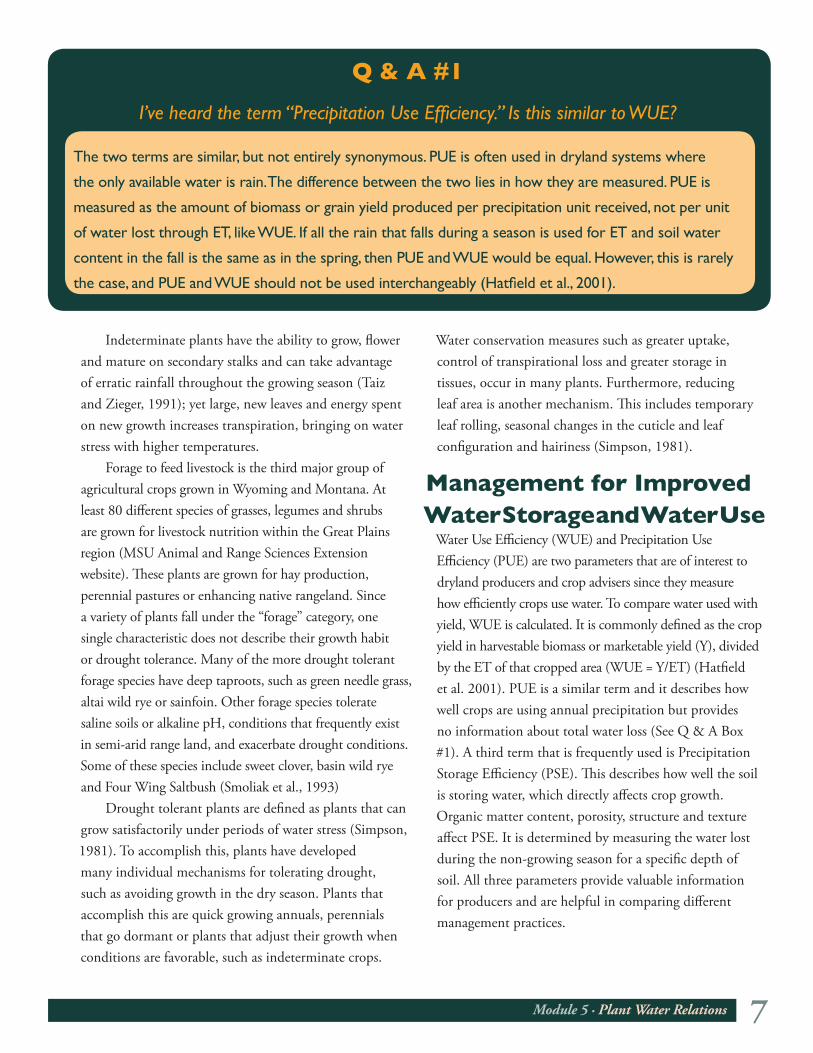
Plant Mechanisms for Surviving DroughtDryland producers in Wyoming and Montana are currently growing relatively drought tolerant crops. Understanding how these crops physically tolerate water stress can help with better crop selection and management. Crops can be divided into three general groups: determinate, indeterminate and forage crops (Table 2). Determinate plants often have a main stem, a preset number of leaves and produce flowers and seeds once they have reached a specific point in their growth. This cycle can occur in a relatively short period of time to avoid drought conditions. The advantage that determinate crops have over indeterminate crops is a steady use of soil water, leaving some for the grain stage (Taiz and Zieger, 1991), while the disadvantage is the possibility of permanent damage to flowers or grain if significant water stress occurs at critical times.
����
���� ��� ���� ���� ���� ����� ����
����
����
����
����
����
����
����
����
����
�������
������������
������
��
����
����
����
�
Figure 5. Daily ET during the 2004 growing season for alfalfa, spring grains and potatoes in Bozeman, Montana. ET rates are low at early growth stage, peak at mid stage and decrease again as crops mature. (Agrimet weather station data, 2004; graph by Neal Christensen)
Table 2. Critical moisture periods for determinate, indeterminate and forage crops. (Kirkpatrick et al., 2005)
Type of Crop Examples Critical Period
DeterminateGrain, cereal, and oil seed crops
(wheat, barley, oats, corn, sunflower)Seed formation - heading, flowering, and pollination
Indeterminate Tuber and root crops (potatoes, carrots, sugar beets) Early growth stages
ForageNative and introduced grasses, alfalfa, and determinate
crops grown for forageNo specific critical period, but show highest production
with early season irrigation
Module 5 · Plant Water Relations 7
Indeterminate plants have the ability to grow, flower and mature on secondary stalks and can take advantage of erratic rainfall throughout the growing season (Taiz and Zieger, 1991); yet large, new leaves and energy spent on new growth increases transpiration, bringing on water stress with higher temperatures. Forage to feed livestock is the third major group of agricultural crops grown in Wyoming and Montana. At least 80 different species of grasses, legumes and shrubs are grown for livestock nutrition within the Great Plains region (MSU Animal and Range Sciences Extension website). These plants are grown for hay production, perennial pastures or enhancing native rangeland. Since a variety of plants fall under the “forage” category, one single characteristic does not describe their growth habit or drought tolerance. Many of the more drought tolerant forage species have deep taproots, such as green needle grass, altai wild rye or sainfoin. Other forage species tolerate saline soils or alkaline pH, conditions that frequently exist in semi-arid range land, and exacerbate drought conditions. Some of these species include sweet clover, basin wild rye and Four Wing Saltbush (Smoliak et al., 1993) Drought tolerant plants are defined as plants that can grow satisfactorily under periods of water stress (Simpson, 1981). To accomplish this, plants have developed many individual mechanisms for tolerating drought, such as avoiding growth in the dry season. Plants that accomplish this are quick growing annuals, perennials that go dormant or plants that adjust their growth when conditions are favorable, such as indeterminate crops.
Water conservation measures such as greater uptake, control of transpirational loss and greater storage in tissues, occur in many plants. Furthermore, reducing leaf area is another mechanism. This includes temporary leaf rolling, seasonal changes in the cuticle and leaf configuration and hairiness (Simpson, 1981).
Management for Improved Water Storage and Water Use
Water Use Efficiency (WUE) and Precipitation Use Efficiency (PUE) are two parameters that are of interest to dryland producers and crop advisers since they measure how efficiently crops use water. To compare water used with yield, WUE is calculated. It is commonly defined as the crop yield in harvestable biomass or marketable yield (Y), divided by the ET of that cropped area (WUE = Y/ET) (Hatfield et al. 2001). PUE is a similar term and it describes how well crops are using annual precipitation but provides no information about total water loss (See Q & A Box #1). A third term that is frequently used is Precipitation Storage Efficiency (PSE). This describes how well the soil is storing water, which directly affects crop growth. Organic matter content, porosity, structure and texture affect PSE. It is determined by measuring the water lost during the non-growing season for a specific depth of soil. All three parameters provide valuable information for producers and are helpful in comparing different management practices.
Q & A #1
I’ve heard the term “Precipitation Use Efficiency.” Is this similar to WUE?
The two terms are similar, but not entirely synonymous. PUE is often used in dryland systems where
the only available water is rain. The difference between the two lies in how they are measured. PUE is
measured as the amount of biomass or grain yield produced per precipitation unit received, not per unit
of water lost through ET, like WUE. If all the rain that falls during a season is used for ET and soil water
content in the fall is the same as in the spring, then PUE and WUE would be equal. However, this is rarely
the case, and PUE and WUE should not be used interchangeably (Hatfield et al., 2001).
8 Module 5 · Plant Water Relations
Nutrient Management Practices that Affect WUE
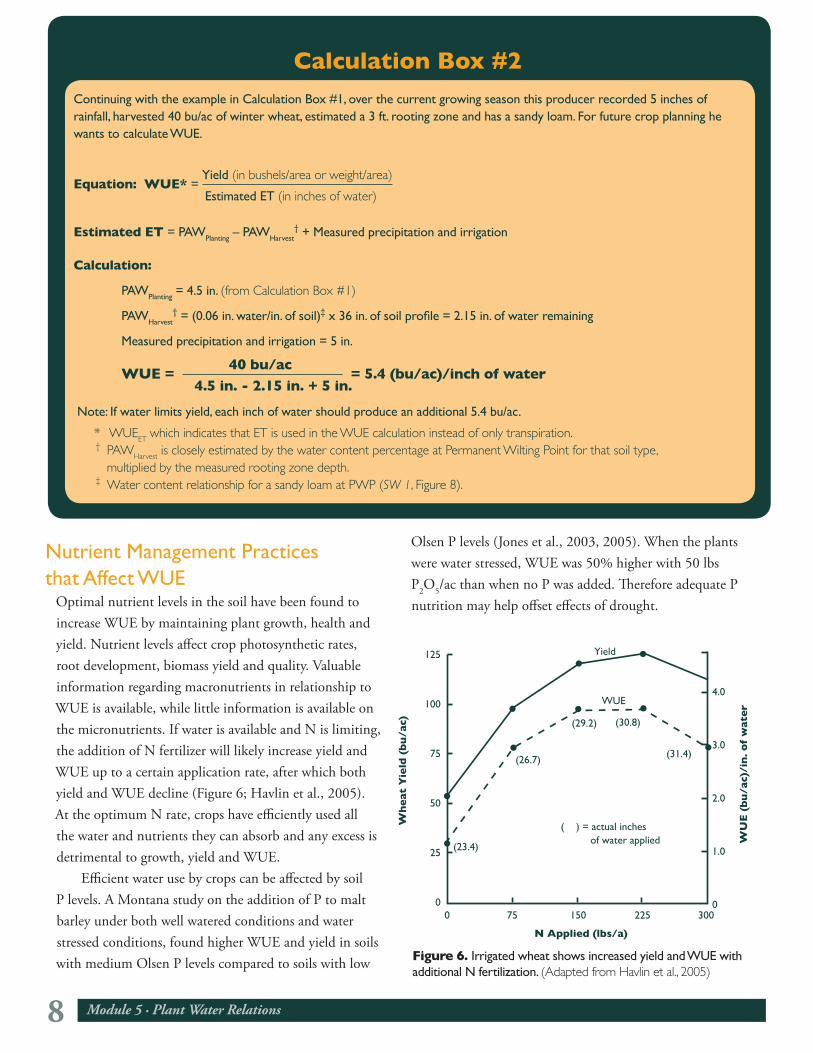
Optimal nutrient levels in the soil have been found to increase WUE by maintaining plant growth, health and yield. Nutrient levels affect crop photosynthetic rates, root development, biomass yield and quality. Valuable information regarding macronutrients in relationship to WUE is available, while little information is available on the micronutrients. If water is available and N is limiting, the addition of N fertilizer will likely increase yield and WUE up to a certain application rate, after which both yield and WUE decline (Figure 6; Havlin et al., 2005). At the optimum N rate, crops have efficiently used all the water and nutrients they can absorb and any excess is detrimental to growth, yield and WUE. Efficient water use by crops can be affected by soil P levels. A Montana study on the addition of P to malt barley under both well watered conditions and water stressed conditions, found higher WUE and yield in soils with medium Olsen P levels compared to soils with low
Olsen P levels (Jones et al., 2003, 2005). When the plants were water stressed, WUE was 50% higher with 50 lbs P2O5/ac than when no P was added. Therefore adequate P nutrition may help offset effects of drought.
Calculation Box #2Continuing with the example in Calculation Box #1, over the current growing season this producer recorded 5 inches of rainfall, harvested 40 bu/ac of winter wheat, estimated a 3 ft. rooting zone and has a sandy loam. For future crop planning he wants to calculate WUE.
Equation: WUE* = Yield (in bushels/area or weight/area)
Estimated ET (in inches of water)
Estimated ET = PAWPlanting – PAWHarvest† + Measured precipitation and irrigation
Calculation:
PAWPlanting = 4.5 in. (from Calculation Box #1)
PAWHarvest† = (0.06 in. water/in. of soil)‡ x 36 in. of soil profile = 2.15 in. of water remaining
Measured precipitation and irrigation = 5 in.
WUE = 40 bu/ac
= 5.4 (bu/ac)/inch of water 4.5 in. - 2.15 in. + 5 in.
Note: If water limits yield, each inch of water should produce an additional 5.4 bu/ac.
* WUEET which indicates that ET is used in the WUE calculation instead of only transpiration. † PAWHarvest is closely estimated by the water content percentage at Permanent Wilting Point for that soil type, multiplied by the measured rooting zone depth. ‡ Water content relationship for a sandy loam at PWP (SW 1, Figure 8).
N Applied (lbs/a)
0 75 150 225 300
Yield
WUE
( ) = actual inches of water applied
(26.7)
(29.2) (30.8)
(31.4)
(23.4)
125
100
75
50
25
0
v
4.0
3.0
2.0
1.0
0
Wh
eat
Yie
ld (
bu
/ac)
WU
E (
bu
/ac)
/in
. of
wat
er
Figure 6. Irrigated wheat shows increased yield and WUE with additional N fertilization. (Adapted from Havlin et al., 2005)

Module 5 · Plant Water Relations 9
Soil Management Practices that Affect WUE
Different soil management practices can affect soil water storage by altering the available water in the profile, and the exchange rate of water between the soil and atmosphere (Hatfield et al., 2001) with tillage and residue management as the most widely researched tools for affecting soil water. Other practices for dryland systems include minimizing fallow periods or switching to crop intensification with various cropping systems (Nielsen et al., 2005).
Tillage Practices during Fallow and Surface ResidueTillage increases evaporation rates by introducing more air to the profile and bringing moist soil to the surface to dry (Hatfield et al., 2001). Frequent tilling during the fallow months is commonly practiced in the Northern Great Plains to control weeds but at a cost of increased water loss from the soil. Figure 7 diagrams the results of four different methods of fallow tillage. The overall trend was an increase in precipitation storage efficiency (PSE) as fallow tillage intensity was reduced (Nielsen et al., 2005). Recent research by Colorado and Nebraska State Universities indicate a PSE range of 40-60% can be achieved with no-till regimes during the fallow period (Croissant et al., 2004). By comparison, soils under conventional tillage during fallow often show a PSE range of 15–25% (Tanaka and Aase, 1987). Increased surface residue remains as tillage is reduced. Surface residue was discussed in SW 3 as a method to
reduce erosion. Residue can also increase PSE by cooling the soil through shading, reducing wind speed at the surface, decreasing evaporation, and capturing snow (Hatfield et al., 2001). Increasing the quantity of wheat residue in a wheat-fallow system from 0 to 4.5 tons/acre resulted in an increase in PSE of 20% (Greb et al., 1967). Standing residue captures more snow than prone residue; approximately 1 inch more stored water was recorded for standing sunflower residue than for prone sunflower residue (Nielsen, 1998). Even the choice of equipment used can affect residue breakdown or water loss with each pass (Tables 3 & 4).
Minimizing Fallow Periods and Crop IntensificationReducing the length of fallow has been shown to increase PSE, contributing more soil water to plants. To accomplish this, producers must include additional crops and alter rotations to take advantage of the stored precipitation. In a 12 year study in Colorado, 2, 3, and 4 year rotation systems were studied (Farahni et al., 1998). By planting crops in the “typical” summer fallow
Table 3. Residue losses for various operations.
(Crossiant et al.,2004)
Operation% Residue Lost Due to
Each Operation
Spraying 0
Sweeps (24 inches) 10
Disk Drills 20
Rod weeder 15
Chisel plow—straight points 25
Chisel plow—twisted points 50
Tandem disk 3” deep 80
Tandem disk 6” deep 90
Moldboard plow 90–100
Over winter weathering 15–25
Table 4. Soil water losses for various operations.
(Crossiant et al.,2004)
OperationAfter 1 Day After 4 Days
Inches of water lost
One way 0.33 0.51
Chisel 0.29 0.48
Rod weeder 0.04 0.22
��������������
���������
������������
����������������������������������������������������
�����������
������
��
��
��
��
����
����
����
���
���
����
����
����
����
���
Figure 7. Effect of decreasing tillage intensity on precipitation storage efficiency. Study data by Unger and Wiese, 1979, Tanaka and Aase. 1987, Smika and Wickes, 1968. (In Nielsen et al., 2005)

10 Module 5 · Plant Water Relations
months, PUE and WUE increased due to the additional harvest. Within the summer period, PSE is generally low due to hot, sunny days with low humidity and drying winds, even though 75% of the precipitation occurs from April – September (Farahni et al., 1998). Conversely, in this study, a longer fallow period occurred in the winter months, a time when PSE was much higher due to cooler temperatures and higher humidity. By applying this system of cropping in a dryland setting, water is used during the months of greatest precipitation while soil water is stored during the optimum conditions. Tanaka et al. (2005) further studied diversity in cropping sequences by using a wider variety of crops, including legumes, non-legumes, oil seed crops and small grains. Benefits of diversification include increased WUE, a variety of soil residues and a greater diversity of soil organisms responding to different plant root exudates in the soil. Producers can choose deeper rooted crops to access more soil water, especially in the summer months, or they can choose crops with residues that capture more snow or provide greater organic matter. Tanaka et al. (2005) suggest that future cropping systems need to take advantage of crop interactions by increasing rotations and the diversity of crops in those rotations.
SummaryWater is the most limiting growth factor in the Northern Great Plains. Management practices, soil properties and crop health play a role in conserving and using precipitation. Water potentials in the soil regulate water and nutrient uptake for crops, with crop damage occurring in soils that are at or near saturated conditions or at permanent wilting point (PWP) for long periods of time. Ideally, producers can maximize Plant Available Water (PAW) by utilizing soil and water management practices that conserve soil water. By choosing management practices that increase soil water storage or increase plant health, producers can raise their water use efficiency (WUE). Adequate fertilization enhances plant physiological functions which can also increase WUE. Minimizing tillage and increasing soil residue can increase soil water storage while crop intensification makes efficient use of stored water. Dryland producers and advisers face the challenge of maximizing crop yield with little precipitation. Understanding the inter-relationship between soil, plants, the atmosphere, and water can help producers and crop advisers choose management practices that meet their needs for sustainability and profitability.

Module 5 · Plant Water Relations 11
References Allen, R.G., L.S. Pereira, D. Raes, and M. Smith.1998. Crop evaporation: Guidelines
for computing crop water requirements. Food and Agriculture Organization (FAO) of the United Nations. FAO Irrigation & Drainage paper 56. 300 p.
Bauder, J., P. Brown, J. Jacobsen and H. Ferguson. 1993. Estimating small grains yield potential from stored rainfall probabilities. MT 8325. Montana State University Extension Service. Bozeman, Montana.
Brady, N.C. and R.R.Weil. 2002. The Nature and Properties of Soils: Thirteenth Edition. Prentice Hall. Upper Saddle River, New Jersey. 960 p.
Brown, P.L., A.L. Black, C.M. Smith, J.W. Enz and J.M. Caprio.1988. Soil water guidelines and precipitation probabilities for barley, spring wheat and winter wheat in flexible cropping systems in Montana and North Dakota. Montana State University Extension Service. Bulletin 356.
Croissant, R.L., G.A. Peterson, and D.G. Westfall. 2004. Dryland cropping systems. Colorado State University Extension publication # 0.516.
Farahani, H.J., G.A. Peterson, and D.G.Westfall. 1998. Dryland cropping intensification: A fundamental solution to efficient use of precipitation. Adv. Agron. 64: 225-265.
Greb, B.W., D.W. Smika, and A.L. Black. 1967. Effect of straw mulch rates on soil water storage during summer fallow in the Great Plains. Soil Sci. Soc. Am. Proc. 31: 556-559.
Hatfield, J.L., T.J. Sauer, and J.H. Prueger. 2001. Managing soils to achieve greater water use efficiency: A review. Agron. J. 93: 271-280.
Havlin, J.L., S.L. Tisdale, J.C. Beaton, and W.L. Nelson. 2005. Soil Fertility and Fertilizers: An Introduction to Nutrient Management 7th edition. Pearson Prentice Hall. Upper Saddle River, New Jersey. 515 p.
Hillel, D. 1982. Introduction to Soil Physics. Academic Press. San Diego, California. 364 p.
Jackson, G. Professor. Western Triangle Agricultural Research Center. Conrad, Montana.
Jones, C., J.S. Jacobsen, A.Mugaas and J.M. Wraith. 2003. Barley response to phosphorus fertilization under dry conditions. Fertilizer Fact. 31. Montana State University Extension Service.
Jones, C., J.S. Jacobsen, and J.M. Wraith. 2005. Barley response to phosphorus fertilization under drought conditions. J. Plant Nutr. 28: 1605-1617.
Kirkpatrick, A., L. Browning, and J. Bauder. 2005. In review. Irrigating with limited water supplies. Montana State University Extension paper # 1262. (first printing, 1981).
Klocke, N.L., K.G. Hubbard, W.L. Kranz, and D.G. Watts. 1990. Evaporation (ET) or crop water use.G90-992-A. Cooperative Extension, Institute of Agriculture and Natural Resources. University of Nebraska-Lincoln.
Kramer, P.J. and J.S. Boyer. 1995. Water Relations of Plants and Soils. Academic Press. San Diego. 495 p.
Levitt, J. 1980. Responses of Plants to Environmental Stresses, Volume II, Water, Radiation, Salt and Other Stresses, 2nd Edition. Academic Press. New York. 606 p.
Mankin, K.R. and D.H. Rogers. 1998. “What is ET?” Irrigation Management Series. MF-2389. Kansas State University Agricultural Experimental Station and Cooperative Extension Service.
Marshall, T.J., J.W. Holmes, and C.W. Rose. 1996. Soil Physics, Third Edition. Cambridge University Press. New York. 453 p.
Nielsen, D. C. 1998. Snow catch and soil water recharge in standing sunflower residue. J. Prod. Agric. 11: 476-480.
Nielsen, D.C., P.W. Unger, and P.R. Miller. 2005. Efficient water use in dryland cropping systems in the Great Plains. Agron. J. 97: 364-372.
Simpson, G.M. 1981. Water Stress on Plants. Praeger, New York. 324 p.
Smika, D.E. and G.A. Wickes. 1968. Soil water storage during fallow in the central Great Plains as influenced by tillage and herbicide treatments. Soil Sci. Soc. Am. Proc. 32: 591-595.
Smoliak, S., R.L. Ditterline, J.D. Scheetz, L.K. Holzworth, J.R. Sims, L.E. Wiesner, D.E. Baldridge, and G.L. Tibke. 1993. Montana Interagency Plant Materials Handbook (EB69). No longer in print, available for viewing in Montana County Extension Service and NRCS offices.
Sojka, R.E., L.H. Stolzy, and M.R. Kaufmann. 1975. Wheat growth related to rhizosphere temperature and oxygen levels. Agron J. 67: 591-596.
Sperry, J. S., V. Stiller and U.G. Hacke. 2003. Xylem hydraulics and the soil-plant-atmosphere continuum: Opportunities and unresolved issues. Agron. J. 95: 1362-1370.
Tanaka, D.L. and J.K. Aase. 1987. Fallow method influences on soil water and precipitation storage efficiency. Soil Tillage Res. 9: 307-316.
Tanaka, D.L., R.L. Anderson, and S.C. Rao. 2005. Crop sequencing to improve use of precipitation and synergize crop growth. Agron J. 97: 385-390.
Taiz L. and Zeiger E. 1991. Plant Physiology. The Benjamin/Cummings Publishing Co. Redwood City, CA. 565 p.
Unger, P.W. and A.F.Wiese. 1979. Managing irrigated winter wheat residues for water storage and subsequent dryland grain sorghum production. Soil Sci. Soc. Am J. 42: 582-588.
Appendix
BooksThe Montana Irrigator’s Pocket Guide Published by the National Center
for Appropriate Technology (NCAT), free, call 1-800-346-9140. http://www.ncat.org
Extension MaterialsIrrigation Water Management—When and How Much to Irrigate
(1989) MT198901AG. Free
Cropping Systems for Central Montana (1981) 1B733. Free
Estimating Small Grains Yield Potential from Stored Rainfall Probabilities (1987) MT198325AG. Free
Precipitation Probabilities in Montana (1984) 1B712. Free
Nutrient Management Modules (1-15) 4449-(1 to 15) Can be obtained from Extension Publications or on-line in PDF format at www.montana.edu/wwwpb/pubs/mt4449.html/ Free
Soil and Water Management Modules (1-5) 4481-(1 to 5) Can be obtained from Extension Publications or on-line in PDF format at www.montana.edu/wwwpb/pubs/4481.html/ Free
PersonnelBauder, Jim. Extension Soil Scientist. Montana State University, Bozeman.
(406) 994-5685. [email protected]
Jackson, Grant. Professor. Western Triangle Agricultural Research Center. Conrad, MT. (406) 278-7707. [email protected]
Jones, Clain. Extension Soil Fertility Specialist. Montana State University, Bozeman. (406) 994-6076. [email protected]
12 Module 5 · Plant Water Relations
Web ResourcesUSDA Natural Resources and Conservation Service (NRCS) irrigation home
page has detailed information on training, techniques, and equipment. http://www.wcc.nrcs.usda.gov/nrcsirrig/
Montana NRIS website has extensive information on the current drought conditions in Montana, including policy and assistance for producers. http://nris.state.mt.us/Drought/default.htm
USGS Wyoming site has real time stream, reservoir and precipitation data along with drought analysis and management publications. http://wy.water.usgs.gov/projects/drought/index.html
Montana Association of Conservation Districts website lists the wide variety of water use and conservation programs for producers and ranchers working with NRCS to implement the CRP and EQIP programs. http://www.macdnet.org/district.htm
Colorado State University Cooperative Extension, water resource online fact sheet, “Crop Water Use and Growth Stages” http://www.ext.colostate.edu/pubs/crops/04715.html, irrigation online fact sheet, “Estimating Soil Moisture” http://www.ext.colostate.edu/pubs/crops/04700.html and “Dryland Cropping Systems”. http://www.ext.colostate.edu/pubs/crops/00516.html
International Certified Crop Adviser website, specific CEU publication, “Economics of Conservation Tillage in a Wheat-Fallow Rotation”. http://www.agronomy.org/cca/exam_pdf/ss01220.pdf
International Certified Crop Adviser website, CEU publication, “Influence of Diverse Cropping Sequences on Durum Wheat Yield and Protein in the Semi-Arid Northern Great Plains”. http://www.agronomy.org/cca/exam_pdf/ss01590.pdf
FARMS (Farm And Research center Matching Systems) is an environmental matching program developed at Montana State University. It helps farm and ranch managers locate agricultural research centers anywhere in the Great Plains with growing conditions similar to their own. This provides accurate information based on environmental conditions not just in proximity to a research station. http://www.montana.edu/places/farms/index.html
U.S. Department of the Interior, Bureau of Reclamation, Great Plains Cooperative Agricultural Weather Network. Look up an Agrimet weather station closest to your area. http://www.usbr.gov/gp/agrimet/
AcknowledgementsWe would like to acknowledge Dr. Jon Wraith, Montana State University, and Dr. Jack Watson, Pennsylvania State University, as contributing authors for this module and Bridget Ashcraft for graphic design.
ReviewersWe would like to extend our utmost appreciation to the following reviewers who provided their time and insight in making this a better document.
Neal Christensen, Agriliance, Rigby, Idaho
Paul Dixon, Yellowstone County Extension Service, Billings, Montana
Dr. Grant Jackson, Western Triangle Agricultural Research Center, Conrad, Montana
Alan Telck, AgTerra Technologies Inc., Sheridan, Wyoming
The U.S. Department of Agriculture (USDA), Montana State University and the Montana State University Extension Service prohibit discrimination in all of their programs and activities on the basis of race, color, national origin, gender, religion, age, disability, political beliefs, sexual orientation, and marital and family status. Issued in furtherance of cooperative extension work in agriculture and home economics, acts of May 8 and June 30, 1914, in cooperation with the U.S. Department of Agriculture, Douglas L. Steele, Vice Provost and Director, Extension Service, Montana State University, Bozeman, MT 59717.
Disclaimer: This information is for educational purposes only. Reference to commercial products or trade names does not imply discrimination or endorsement by the Montana State University Extension Service.
Copyright © 2005 MSU Extension Service We encourage the use of this document for non-profit educational purposes. This document may be linked to or reprinted if no endorsement of a commercial product, service or company is stated or implied, and if appropriate credit is given to the author and the MSU Extension Service (or Experiment Station). To use these documents in electronic formats, permission must be sought from the Ag/Extension Communications Coordinator, Communications Services, 416 Culbertson Hall, Montana State University-Bozeman, Bozeman, MT 59717; (406) 994-2721; E-mail — [email protected].