Svetlana Speight, Sara Connolly Margaret O’Brien · Work‐family conflict: comparing fathers...
60
Work‐family conflict: comparing fathers across selected European countries Svetlana Speight, Sara Connolly & Margaret O’Brien Eloise Poole, Matthew Aldrich 13 th February 2014, City University
Transcript of Svetlana Speight, Sara Connolly Margaret O’Brien · Work‐family conflict: comparing fathers...
Work‐family conflict: comparing fathers across selected European
countriesSvetlana Speight, Sara Connolly & Margaret O’Brien
Eloise Poole, Matthew Aldrich
13th February 2014, City University

Outline• Aims of the study
• Context – welfare, policy and economic
• Changing patterns in household employment
• Theoretical background
• Research questions
• Data, measures & hypotheses
• Findings
• DiscussionThe findings in this presentation are preliminary – please do not quote without authors’ permission

Aims of the study1. To provide a comprehensive profiling of fathers in
21st century Britain in terms of their paid work and family life.
2. To explore factors associated with differences in fathers’ paid work and family life.
3. To analyse time trends in fathers’ working patterns to explore effects of policy changes.
4. To explore the role of institutional factors, by comparing the UK with other European countries.

Context – Welfare, Policy and Economic

Incomplete/ stalled gender revolution: Fatherhood in flux
• Time to reconfigure men’s “two worlds” of work and family‐ an important 21st century agenda.
• Fathers – new 20th century cultural script from ‘father right’ to ‘father love’? Increase in care time but still far from parental equality.
• But also Fathers in crisis‐ unable to care or provide cash? Increase in non‐residential fatherhood.
• Father‐sensitive work‐family policies, Fathers’ access to parental leave – operational marker.

Welfare, gender, family policies, fathers and labour markets – country selection
• Social democratic, dual earner support, high gender equality, high rates of female full‐time employment – Sweden
• Liberal welfare regime, market orientated policies, high rates of female part‐time employment – UK
• Conservative or corporatist welfare, male breadwinner tradition,strong labour rights – Germany, France, Netherlands
• Mediterranean/southern welfare, low rates of female employment – Spain and Greece.
• Post socialist and traditional gender role attitudes – Poland.

Family policy development (1980s, 1990s and 2000s)
Adapted from: Ferragina and Seeleib‐Kaiser, “Determinants of a Silent (R)evolution:Understanding the Expansion of Family Policy in Rich OECD Countries”, CES Amsterdam, 2013
Non‐comprehensive childcare services and short leave
Medium/low comprehensive childcare services and medium/short leave
Medium comprehensive childcare services and medium/long leave
Comprehensive childcare services and long leave
Nl80
UK80De80
Fr80Sw80

Parental leave
✓‐ statutory entitlement, no pay; ✓✓ - statutory entitlement, low pay (< 50%) or not universal; ✓✓✓‐ universal statutory entitlement, reduced pay (> 50%) . Source: International Network on Leave Policies and research, http://www.leavenetwork.org/introducing_the_network/?S=kontrast%3F%3F%3Ftype%3D98%3F
2004/5 2010/1
Paternity leave (weeks)
Parental leave
Incentive Paternity leave (weeks)
Parental leave
Incentive
Sweden ✓✓✓ 0.5 ✓✓✓ Yes ✓✓✓ 2 ✓✓✓ Yes
UK ✓✓ 0.5 ✓ ‐ ✓✓ 2 ✓ ‐
France ✓✓✓ 0.5 ✓✓ ‐ ✓✓ 2 ✓✓ ‐
Germany × ✓✓ ‐ × ✓✓✓ Yes
Netherlands ✓✓✓ <0.5 ✓ ‐ ✓✓✓ <0.5 ✓✓ ‐
Greece ✓✓✓ < 0.5 ✓ ‐ ✓✓✓ < 0.5 ✓ ‐
Spain ✓✓✓ <0.5 ✓ ‐ ✓✓✓ 3 ✓ ‐
Poland × ✓✓ ‐ ✓✓✓ 2 ✓✓✓ ‐

Male employment ratesSource: Eurostat June 2013

Female employment ratesSource: Eurostat June 2013

Changing household employment patterns
Male sole FT earner (%)2001 2011
SwedenUK 23France 25*
Netherlands 27Poland 31*
Germany 31*
Greece 46Spain 49*2003Source: EULFS
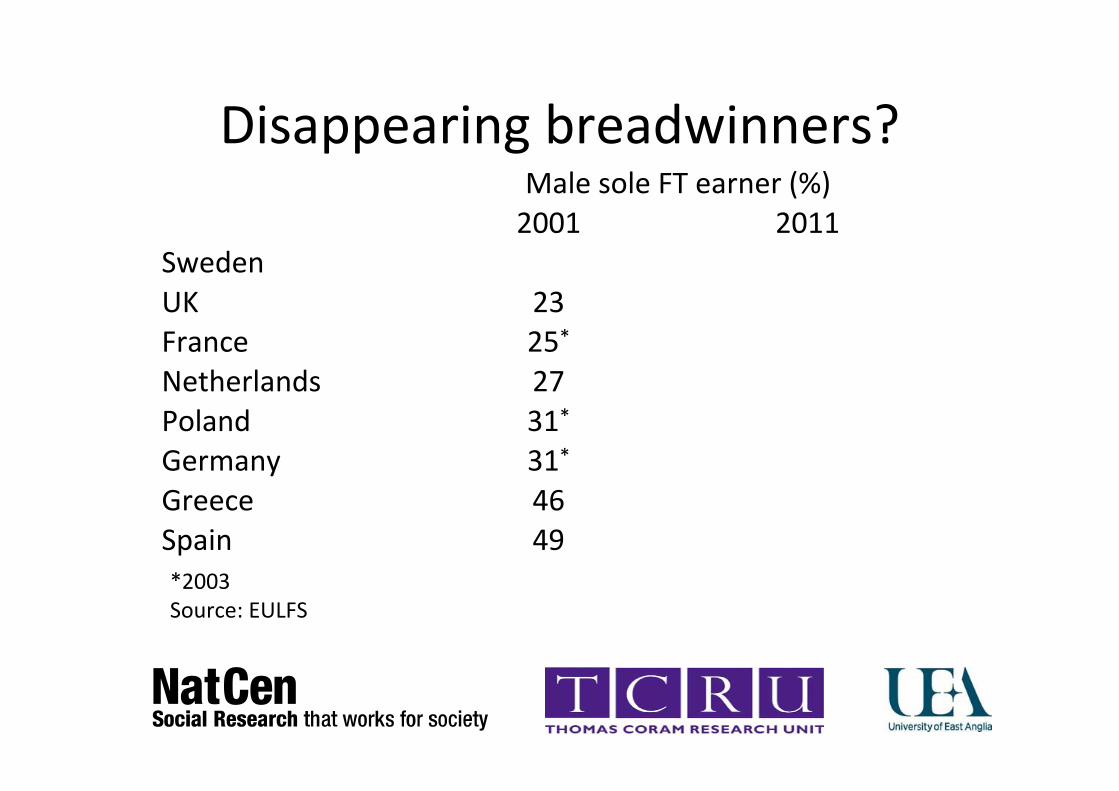
Disappearing breadwinners?

Male sole FT earner (%)2001 2011
Sweden 12UK 23 22France 25* 22Netherlands 27 17Poland 31* 28Germany 31* 25Greece 46 36Spain 49 28*2003Source: EULFS
Disappearing breadwinners?

Established dual FT earnerSource: EULFS
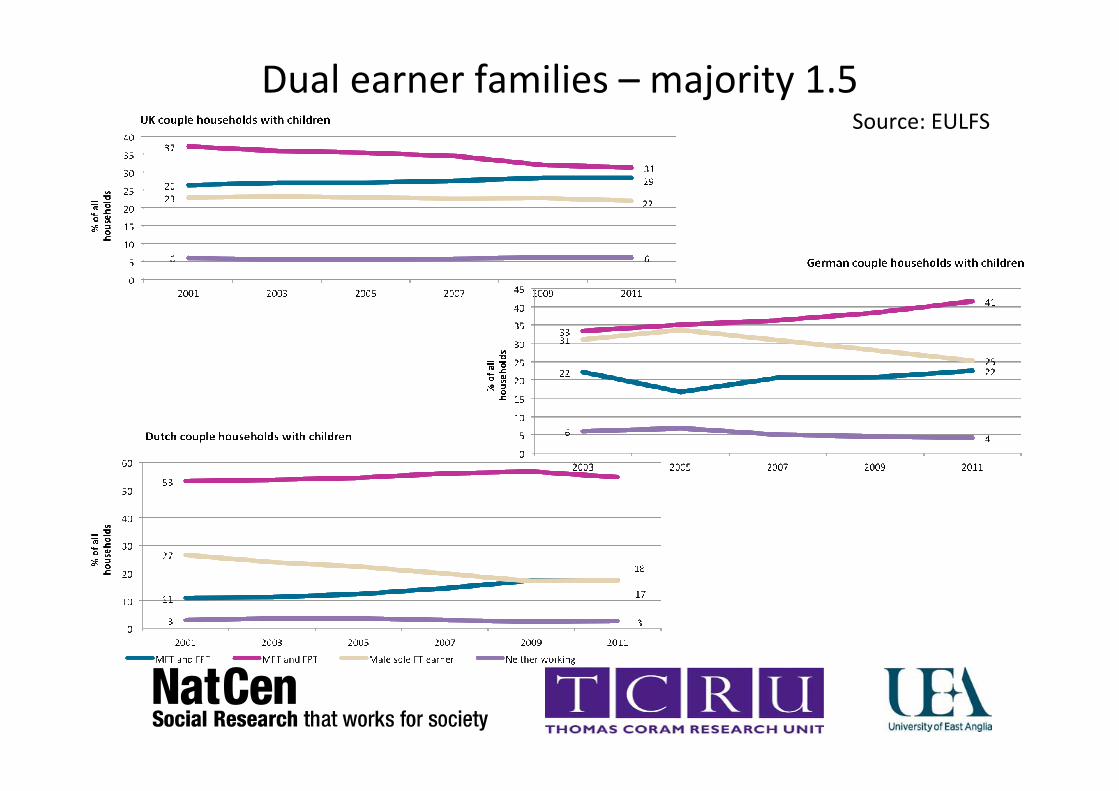
Dual earner families – majority 1.5 Source: EULFS

Polarised sole and dual FT earnersSource: EULFS

Fathers full‐time working hours
Source: EULFS
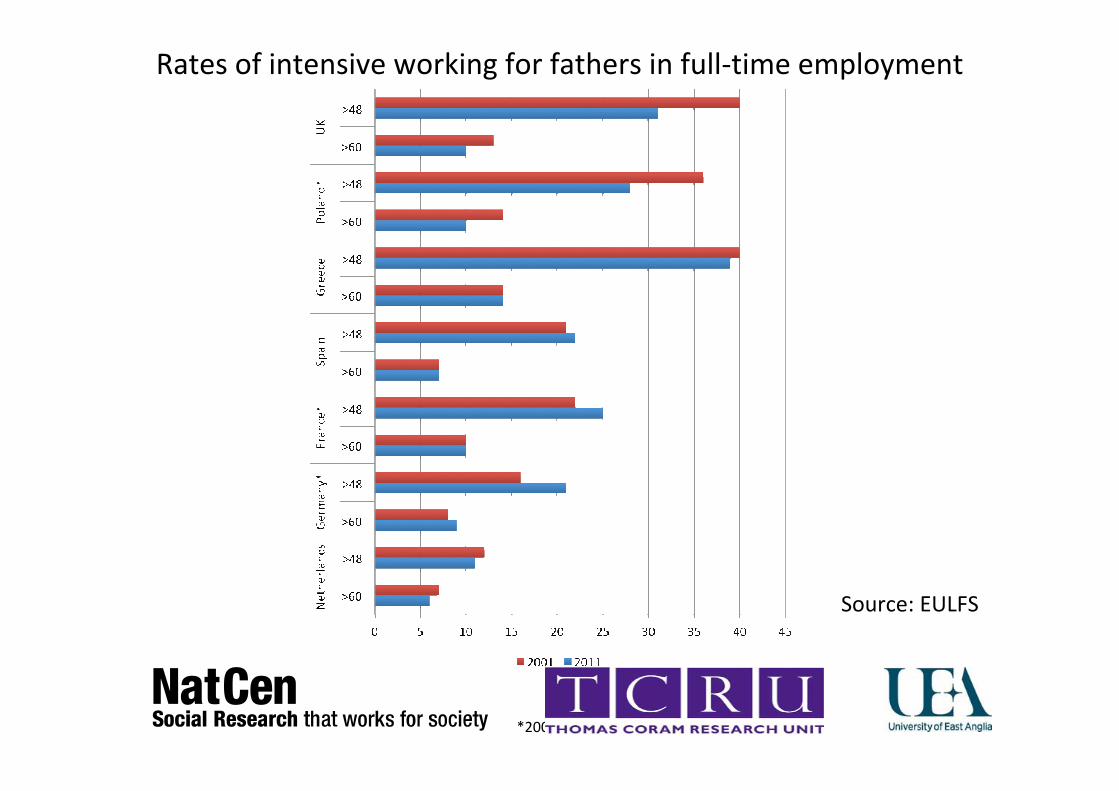
Rates of intensive working for fathers in full‐time employment
*2003
Source: EULFS

Theoretical background & research questions

Concepts
• Work‐to‐family conflict (WFC)
• Family‐to‐work conflict (FWC)
• Work‐life balance (WLB)– WFC+FWC=work‐life balance (Pichler 2009)
– WLB as satisfaction with the balance of time
– WLB as an assessment that work and family resources are sufficient to meet work and family demands such that participation is effective in both domains (Voydanoff 2005)

Work v life/family
• Work – exclusive focus on paid work• ‘Life’ as a black box (Pichler 2009)
– Life = family?– Friends (social life), health, spirit (self) (Byrne, 2005)
• ‘Family’ not well defined either• Debate dominated by concerns about those who work too much (Warren 2013)

Demands and resources approach
• Work demands, family demands, work resources, family resources, boundary‐spanning demands and resources (Voydanoff 2005)
• Demands are structural or psychological claims associated with role requirements, expectations, and norms to which individuals must respond or adapt by exerting physical or mental effort.
• Resources are structural or psychological assets that may be used to facilitate performance, reduce demands or generate additional resources.
• Time‐based & strain‐based demands; physical & psychological
• Work demands – family resources fit
• Family demands – work resources fit

Wider context
• Employment and working conditions– Intensification, flexibilisation, increase in job insecurity, economic crisis
• Female employment rates• Gender roles at home
– Housework and childcare
• ‘The incomplete revolution’ (Esping‐Andersen, 2009)

Focus on fathers• The new ‘male mystique’ (Aumann et al., 2011)

Research questions• What are the levels of work‐to‐family and family‐to‐work conflict experienced by fathers?
• What are the factors affecting the levels of these types of conflict?
• How do fathers compare between the UK and seven other EU countries?
• What do cross‐national differences tell us about the importance of different societal‐level factors facilitating successful work‐family reconciliation?

Data, measures & hypotheses

Data• European Social Survey
– Round 2 (2004‐2005)
– Round 5 (2010‐2011)
• UK, Sweden, the Netherlands, Germany, France, Spain, Greece, Poland
• Fathers in paid work, aged 20‐64, in couples, with children aged 0‐18
• Sample size: about 1,500 per survey year

Work‐to‐family conflict• 2004 & 2010
– Worrying about work problems when not working– Feeling too tired after work to enjoy the things you would like to do at home
– Job prevents you from giving the time you want to your partner and family
– Partner or family gets fed up with the pressure of your job
Scale: from ‘Never’ to ‘Always’ (5‐point scale)
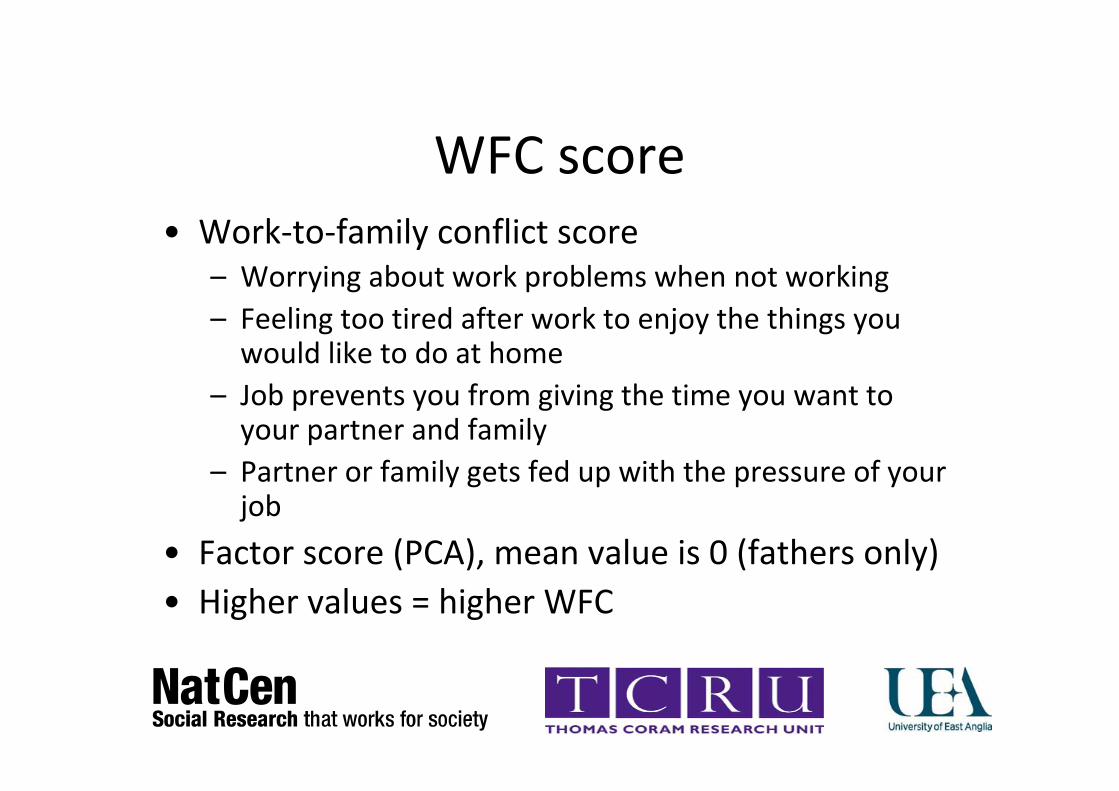
WFC score• Work‐to‐family conflict score
– Worrying about work problems when not working– Feeling too tired after work to enjoy the things you would like to do at home
– Job prevents you from giving the time you want to your partner and family
– Partner or family gets fed up with the pressure of your job
• Factor score (PCA), mean value is 0 (fathers only)• Higher values = higher WFC
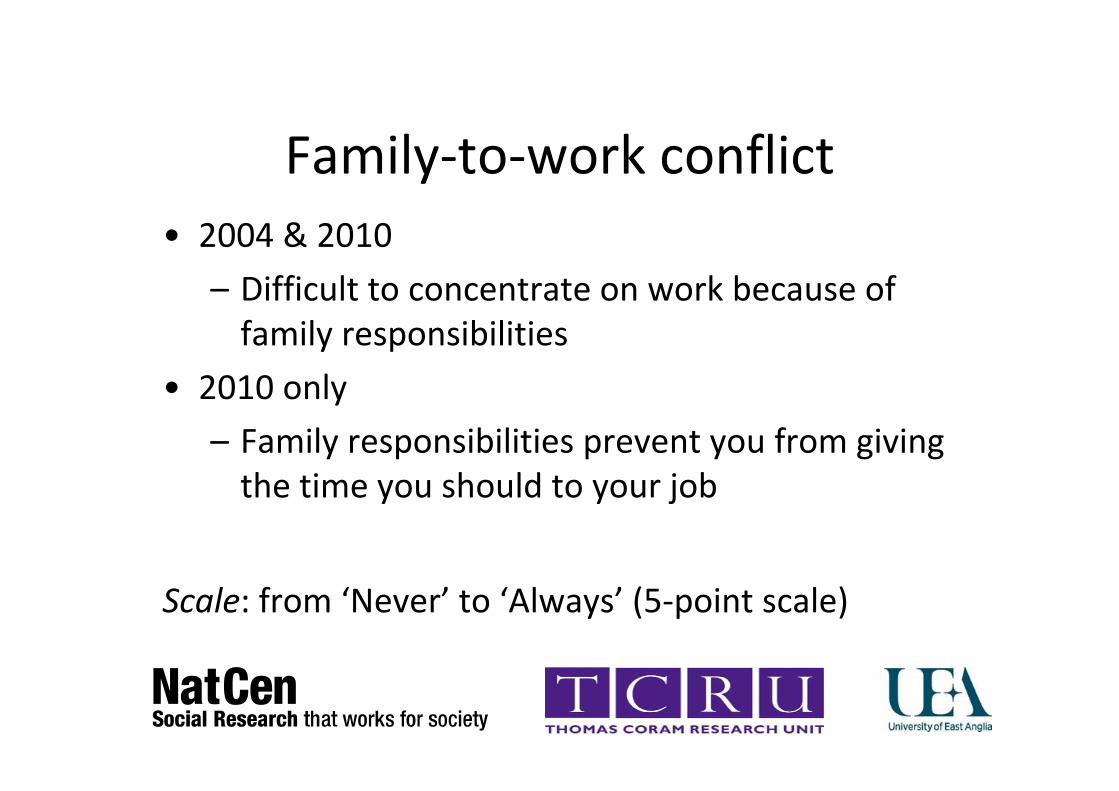
Family‐to‐work conflict• 2004 & 2010
– Difficult to concentrate on work because of family responsibilities
• 2010 only
– Family responsibilities prevent you from giving the time you should to your job
Scale: from ‘Never’ to ‘Always’ (5‐point scale)

Explanatory variables – paid work
– Working hours
– Occupational class (ISCO88 major groups)
– Employee v self‐employed
– Task discretion
– Unsocial hours (weekends, evenings and unpredictable overtime)
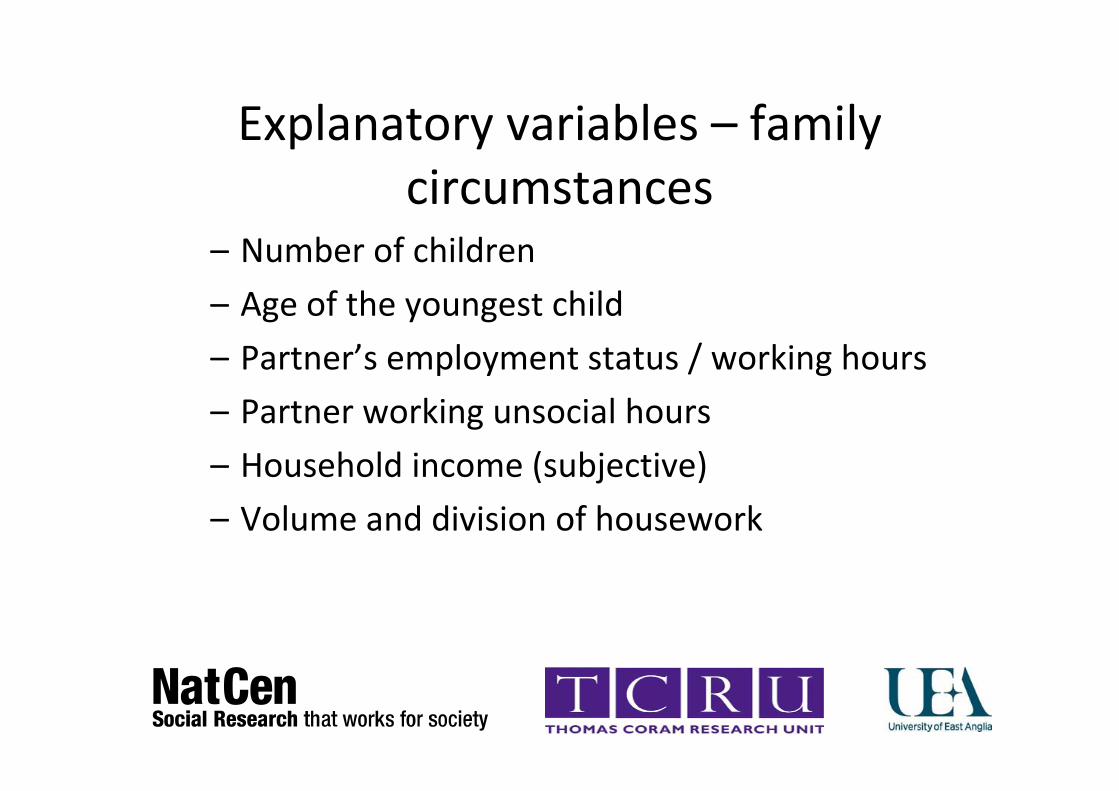
Explanatory variables – family circumstances
– Number of children
– Age of the youngest child
– Partner’s employment status / working hours
– Partner working unsocial hours
– Household income (subjective)
– Volume and division of housework

Explanatory variables – gender‐role attitudes
• Composite measure of egalitarianism in gender‐role attitudes:– A woman should be prepared to cut down on her paid work for the sake of her family
– When jobs are scarce, men should have more right to a job than women
(5‐point agree/disagree scale)
Control variables
• Age
• Education (years)

Hypotheses (work)
• Longer working hours ‐> higher WFC
• Unsocial hours ‐> higher WFC
• Occupational class & task discretion: more demanding jobs ‐> higher WFC, but more task discretion ‐> lower WFC
• Self‐employed ‐> lower WFC as more flexibility and autonomy

Hypotheses (family)
• More children ‐> higher FWC/WFC
• Younger children ‐> higher FWC/WFC
• Partner not working or working part‐time ‐> lower FWC/WFC as this is a resource but also higher WFC, as pressure to provide financially
• Partner working unsocial hours ‐> higher FWC/WFC
• More housework ‐> higher WFC

Hypotheses (boundary spanning)
• More egalitarian gender‐role attitudes ‐> higher pressure to ‘do it all’ ‐> higher WFC/FWC
• Low household income ‐> higher WFC/FWC

WFC v FWC
• Work‐related variables will be more strongly associated with WFC and family‐related variables will be more strongly associated with FWC

Hypotheses (cross‐national comparisons)
• Coordinated market economies / high labour rights standards (Sweden, Germany, Netherlands, France) ‐> lower WFC, liberal market economies (UK, Poland) ‐> higher WFC
• Better provision of formal childcare (Sweden) ‐> lower FWC/WFC
• Informal childcare is common (Greece, NL) ‐> lower FWC/WFC
• Higher father‐care sensitivity in policy regime (Sweden) ‐> lower WFC/FWC
• More traditional gender cultures (Greece, Poland, Spain) ‐> lower FWC, more egalitarian (Sweden, UK) ‐> higher FWC

Findings(work in progress)

Worrying about work problems when not working
15
20
34
24
7
Never Hardly ever Sometimes Often Always
Base: Fathers aged 20-64, in couples, in paid work and with children aged 0-18 (2004+2010)

Feeling too tired after work to enjoy the things you would like to do at home
10
19
44
24
4
Never Hardly ever Sometimes Often Always
Base: Fathers aged 20-64, in couples, in paid work and with children aged 0-18 (2004+2010)

Job prevents you from giving the time you want to your partner or family
12
19
37
26
5
Never Hardly ever Sometimes Often Always
Base: Fathers aged 20-64, in couples, in paid work and with children aged 0-18 (2004+2010)

Partner or family gets feds up with the pressure of your job
2729
32
10
1
Never Hardly ever Sometimes Often Always
Base: Fathers aged 20-64, in couples, in paid work and with children aged 0-18 (2004+2010)

Difficult to concentrate on work because of family responsibilities
38 39
20
30
Never Hardly ever Sometimes Often Always
Base: Fathers aged 20-64, in couples, in paid work and with children aged 0-18
(2004+2010)

Family responsibilities prevent you from giving the time you should to your job
36 35
22
6
1
Never Hardly ever Sometimes Often Always
Base: Fathers aged 20-64, in couples, in paid work and with children aged 0-18 (2010)

WFC score, by country and year
-0.3 -0.3-0.2 -0.2
-0.1
0.0 0.10.1
-0.2
0.4
0.0
0.0 0.00.1
0.10.2
-1.0
-0.5
0.0
0.5
1.0
Netherlands Greece Spain Sweden France Germany Poland UK
2004 2010Base: Fathers aged 20-64, in couples, in paid work and with
children aged 0-18

Difficult to concentrate on work because of family, by country and year (%)
17 19 2124 26 26
32
42
1619
29
16
22
10
2630
0
10
20
30
40
50
60
France Sweden Greece Netherlands Germany Spain Poland UK
2004 2010
Base: Fathers aged 20-64, in couples, in paid work and with
children aged 0-18
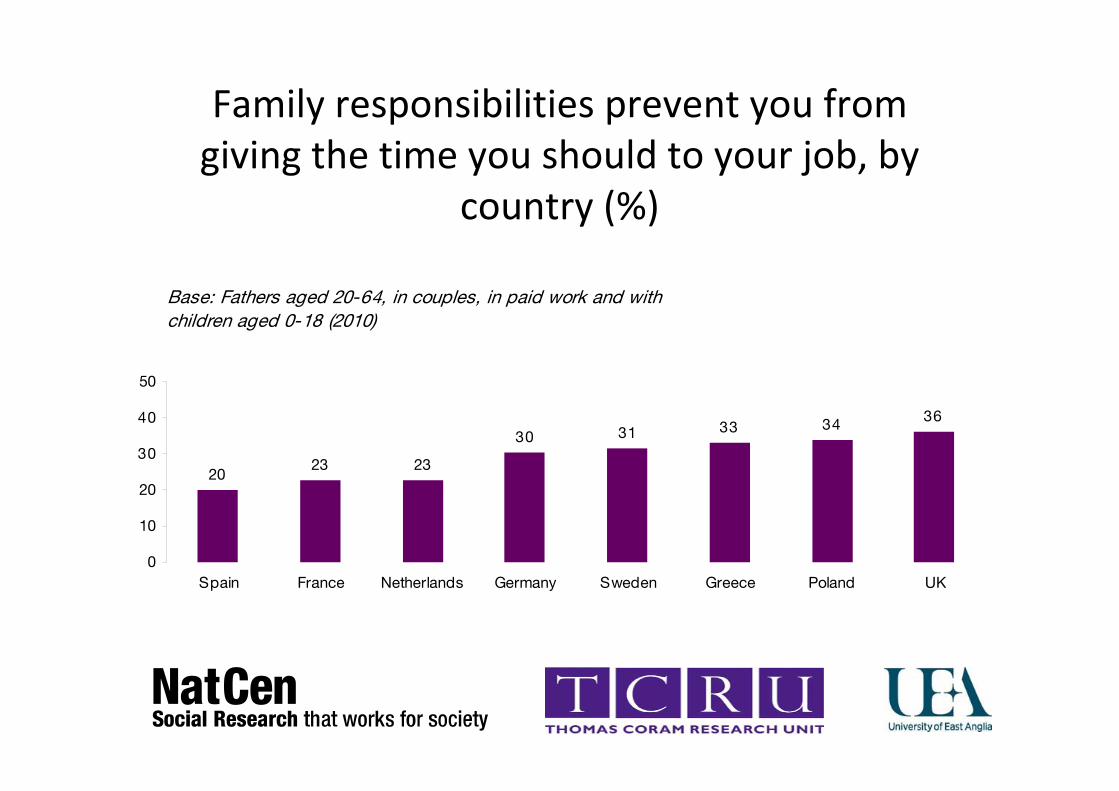
Family responsibilities prevent you from giving the time you should to your job, by
country (%)
2023 23
30 31 33 3436
0
10
20
30
40
50
Spain France Netherlands Germany Sweden Greece Poland UK
Base: Fathers aged 20-64, in couples, in paid work and with
children aged 0-18 (2010)

WFC: linear regression (work and socio‐demographics) Pooled 2004 2010 Coef. P>t Coef. P>t Coef. P>t Age in years 0.04 0.03 0.08 0.00 0.00 0.86Age in years squared 0.00 0.01 0.00 0.00 0.00 0.81Years of education 0.02 0.01 0.02 0.01 0.01 0.18Log working hours 0.58 0.00 0.71 0.00 0.44 0.00Ref.: Managers Professionals ‐0.09 0.17 ‐0.21 0.02 0.03 0.70Technicians and ass professionals ‐0.13 0.04 ‐0.21 0.02 ‐0.07 0.46Clerical support workers ‐0.23 0.01 ‐0.38 0.00 ‐0.11 0.40Services and sales workers ‐0.22 0.01 ‐0.25 0.03 ‐0.22 0.06Skilled agric. workers ‐0.36 0.00 ‐0.33 0.01 ‐0.45 0.01Craft and related trades workers ‐0.16 0.02 ‐0.29 0.00 ‐0.05 0.60Plant and machine operators ‐0.33 0.00 ‐0.46 0.00 ‐0.24 0.03Elementary occupations ‐0.36 0.00 ‐0.57 0.00 ‐0.18 0.19Ref.: employee Self‐employed 0.10 0.04 0.07 0.36 0.11 0.10Unsocial hours (index) 0.25 0.00 0.26 0.00 0.24 0.00Ref.: not difficult to live on income Difficult to live on income 0.37 0.00 0.30 0.00 0.44 0.00

WFC: linear regression (family factors and gender‐role attitudes)
Pooled 2004 2010 Coef. P>t Coef. P>t Coef. P>t Ref.: 1 child 2 kids 0.06 0.14 0.04 0.46 0.07 0.233+ kids 0.05 0.40 0.01 0.87 0.08 0.31Ref.: youngest child 0‐3 Youngest 4‐5 0.02 0.69 ‐0.02 0.84 0.05 0.56Youngest 6‐11 0.03 0.51 ‐0.06 0.40 0.13 0.06Youngest 12‐14 0.00 0.95 ‐0.08 0.46 0.05 0.61Youngest 15‐18 0.05 0.53 ‐0.13 0.24 0.23 0.04Ref.: partner works FT Partner works PT 0.01 0.83 0.03 0.71 ‐0.03 0.68Partner works unknown hrs 0.08 0.62 0.04 0.87 0.16 0.48Partner not in paid work ‐0.01 0.90 ‐0.04 0.58 0.01 0.94Ref.: Low share of housework with partner Medium share of housework 0.02 0.71 0.06 0.36 ‐0.04 0.51High share of housework ‐0.12 0.01 ‐0.13 0.05 ‐0.14 0.03Gender‐role egalitarianism ‐0.05 0.04 ‐0.05 0.09 ‐0.05 0.11

WFC: linear regression (cross‐national comparisons)
2004 2010 Coef. P>t Coef. P>t Ref.: UK Germany ‐0.10 0.34 ‐0.04 0.65 Spain ‐0.13 0.27 ‐0.16 0.09 France ‐0.05 0.71 ‐0.04 0.68 Netherlands ‐0.37 0.00 ‐0.27 0.01 Greece ‐0.50 0.00 ‐0.05 0.68 Poland ‐0.13 0.22 ‐0.16 0.11 Sweden ‐0.11 0.29 ‐0.03 0.76

Difficult to concentrate on work: binary logistic regression (pooled 2004+2010)
Odds ratios P>t Ref.: Partner works FT Partner works PT 0.7 0.01 Partner works unknown hours 2.1 0.09 Partner not in paid work 1.3 0.13 Ref.: Partner does not work unsocial hours Partner works unsocial hours 1.4 0.01 Ref.: Not difficult to live on income Difficult to live on income 1.5 0.00 Age in years 1.1 0.08 Age in years squared 0.999 0.07 Father’s unsocial hours (index) 1.2 0.00 Gender‐role egalitarianism 0.9 0.01
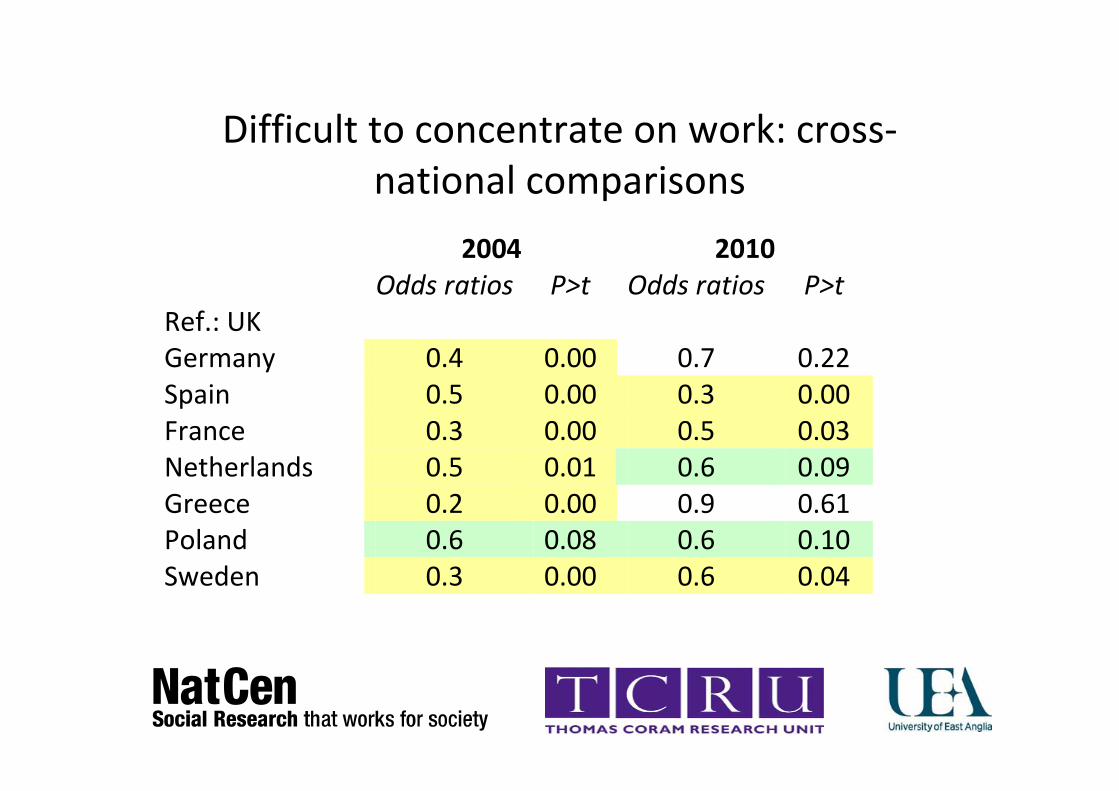
Difficult to concentrate on work: cross‐national comparisons
2004 2010 Odds ratios P>t Odds ratios P>t Ref.: UK Germany 0.4 0.00 0.7 0.22 Spain 0.5 0.00 0.3 0.00 France 0.3 0.00 0.5 0.03 Netherlands 0.5 0.01 0.6 0.09 Greece 0.2 0.00 0.9 0.61 Poland 0.6 0.08 0.6 0.10 Sweden 0.3 0.00 0.6 0.04

Family responsibilities prevent from giving time to job: ordered logistic regression (2010)
Odds ratios P>tRef.: Not difficult to live on income Difficult to live on income 1.6 0.01 Ref.: Low share of housework Medium share of housework 1.3 0.04 High share of housework 1.5 0.01 Ref.: Managers Professionals 0.9 0.68 Technicians and asso professionals 0.7 0.13 Clerical support workers 0.7 0.16 Services and sales workers 0.5 0.02 Skilled agricultural workers 0.5 0.03 Craft and related trades workers 0.6 0.01 Plant and machine operators 0.5 0.00 Elementary occupations 0.5 0.02 Unsocial hours (index) 1.2 0.00 Gender‐role egalitarianism 0.9 0.05
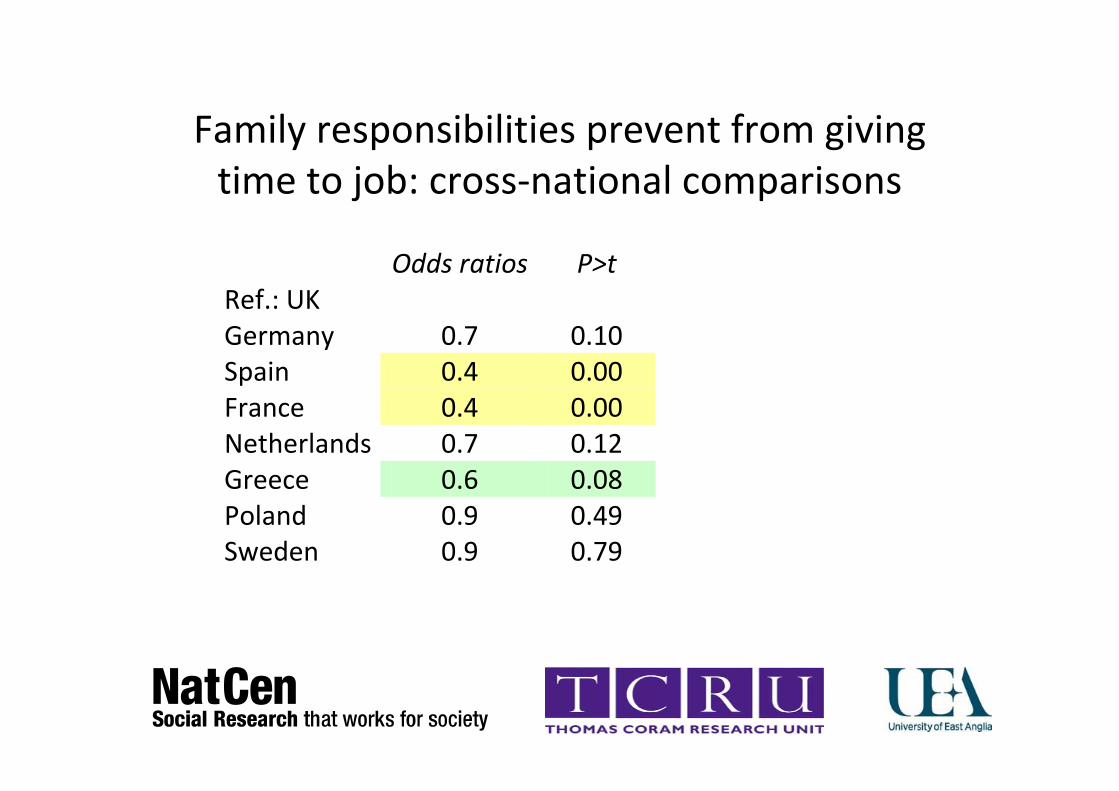
Family responsibilities prevent from giving time to job: cross‐national comparisons
Odds ratios P>t Ref.: UK Germany 0.7 0.10 Spain 0.4 0.00 France 0.4 0.00 Netherlands 0.7 0.12 Greece 0.6 0.08 Poland 0.9 0.49 Sweden 0.9 0.79

Discussion

Discussion: hypotheses• Hypotheses confirmed:
– working hours (WFC only), unsocial hours (fathers and partners),occupational class, financial insecurity, housework (FWC)
• Hypotheses not confirmed:
– Opposite effect: self‐employment, gender‐role attitudes, housework (WFC)
– No effect: number of children, age of the youngest child, (partner’s employment status)
• Work‐related, family‐related and boundary‐spanning variables
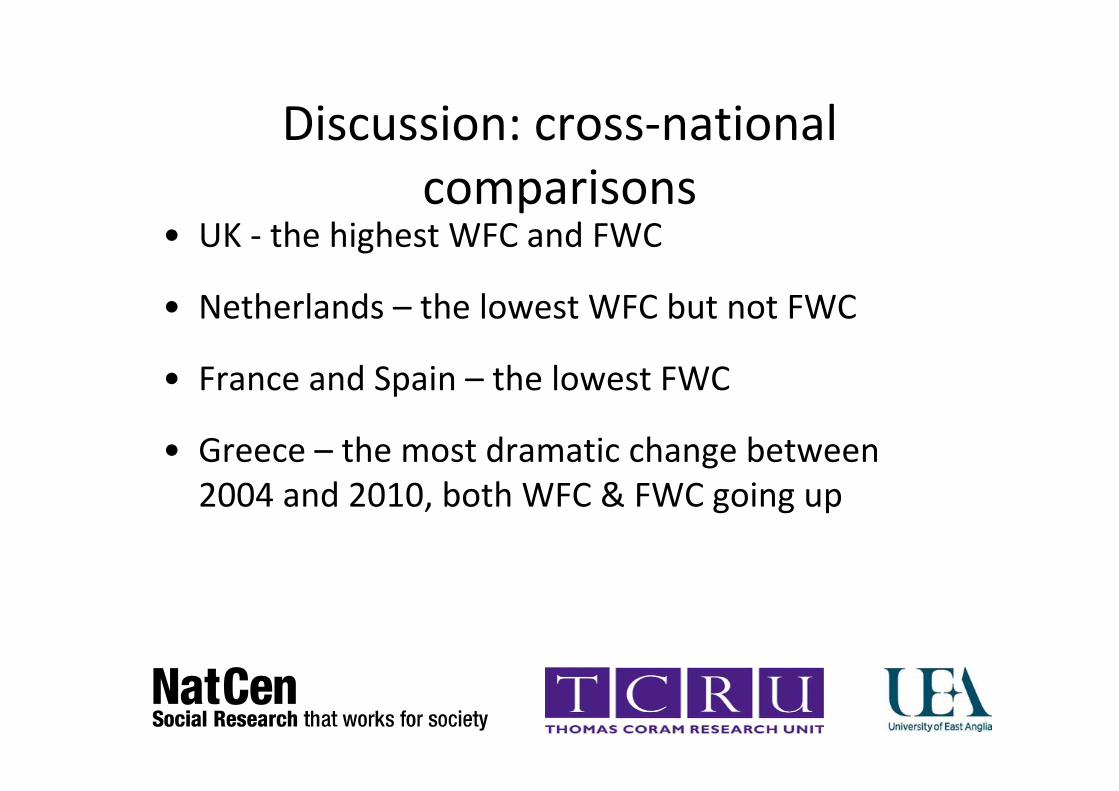
Discussion: cross‐national comparisons
• UK ‐ the highest WFC and FWC
• Netherlands – the lowest WFC but not FWC
• France and Spain – the lowest FWC
• Greece – the most dramatic change between 2004 and 2010, both WFC & FWC going up

Thank‐youDr Svetlana Speight (NatCen Social Research) –[email protected]
Dr Sara Connolly (UEA) – [email protected]
Prof. Margaret O’Brien (IoE) – <[email protected]
Eloise Poole (NatCen) – [email protected]
Dr Matt Aldrich (UEA) – [email protected]