
Sustaining America’s Fisheries and Fishing Communities · Sustaining America’s Fisheries and...
36
AN EVALUATION OF INCENTIVE-BASED MANAGEMENT Sustaining America’s Fisheries and Fishing Communities
Transcript of Sustaining America’s Fisheries and Fishing Communities · Sustaining America’s Fisheries and...
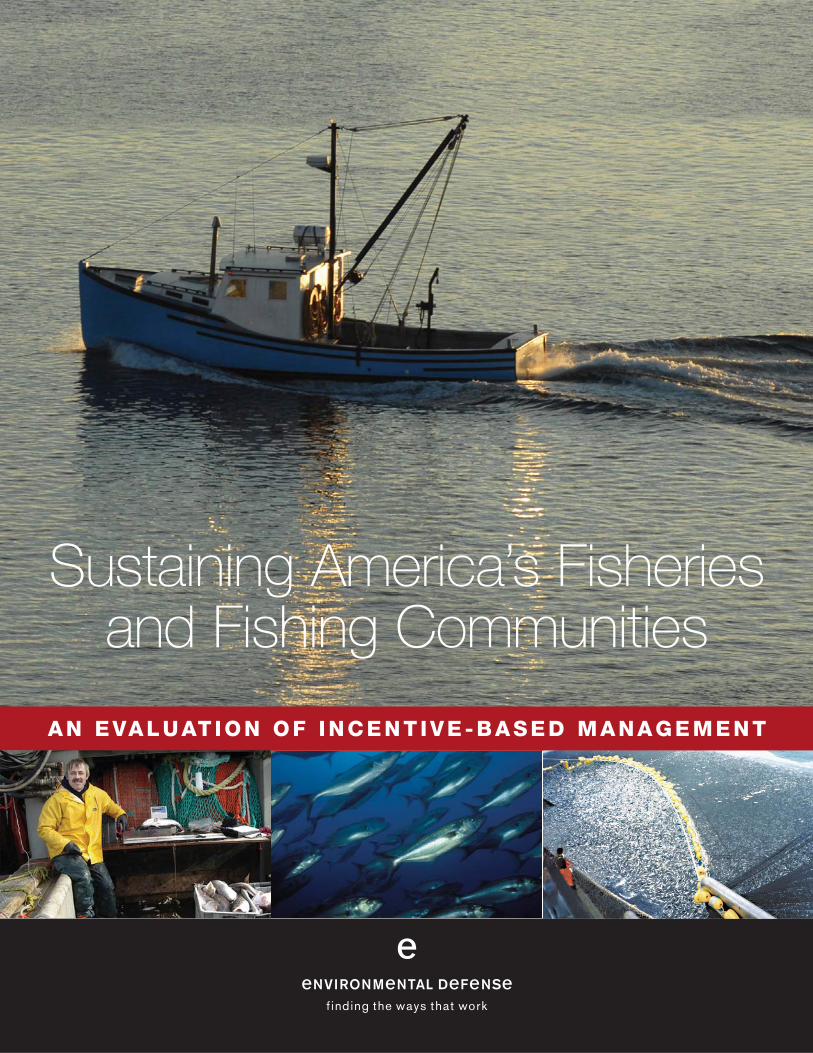
AN EVALUATION OF INCENTIVE-BASED MANAGEMENT
Sustaining America’s Fisheriesand Fishing Communities
C O N T R I B U T I N G P A R T N E R S
ENVIRONMENTAL DEFENSE, a leading national nonprofit organization,
represents more than 500,000 members. Since 1967, Environmental Defense
has linked science, economics, law and innovative private-sector partnerships
to create breakthrough solutions to the most serious environmental problems.
www.environmentaldefense.org
REDSTONE STRATEGY GROUP, LLC is a trusted advisor to businesses,
philanthropies and NGOs around the world. Redstone helps its clients address
pressing business and social policy issues through collaboration, tough-minded
analysis, practical insights and tangible results. www.redstonestrategy.com
THE GORDON AND BETTY MOORE FOUNDATION, established in 2000,
seeks to advance environmental conservation and cutting-edge scientific
research around the world and improve the quality of life in the San Francisco
Bay Area. The goal of Moore’s Marine Conservation Initiative is to achieve
progress towards resilient and productive marine ecosystems in British
Columbia, the California Current, and New England by implementing area-
based management and reforming fisheries management. www.moore.org
LAWRENCE J. WHITE is the Arthur E. Imperatore Professor of Economics
at the Stern School of Business, New York University, and Deputy Chair of
Stern’s Economics Department. He has taken leave from NYU to serve in the
U.S. Government three times: During 1986-89 he was a Board Member on the
Federal Home Loan Bank Board; from 1982-83 he was Chief Economist of the
Antitrust Division of the U.S. Department of Justice; and in 1978-79 he was a
Senior Staff Economist on the President’s Council of Economic Advisers.
http://pages.stern.nyu.edu/~lwhite/
1
ContentsExecutive Summary . . . . . . . . . . . . . . . . . . . . . . . . . . . . . . . . . . . . . . . . . . . . . . 3
Introduction . . . . . . . . . . . . . . . . . . . . . . . . . . . . . . . . . . . . . . . . . . . . . . . . . . . . 7
How Catch Shares Differ From Conventional Management . . . . . . . . . . . . . . . 8
Measuring Catch Shares Against Key Fisheries Management Objectives. . . . . 13
Complying With Catch Limits . . . . . . . . . . . . . . . . . . . . . . . . . . . . . . . . . . . . . . . . . . . 13
Better Science and Monitoring . . . . . . . . . . . . . . . . . . . . . . . . . . . . . . . . . . . . . . . . . . 14
Reducing Bycatch. . . . . . . . . . . . . . . . . . . . . . . . . . . . . . . . . . . . . . . . . . . . . . . . . . . . 15
Limiting Fishing Impact on Habitats . . . . . . . . . . . . . . . . . . . . . . . . . . . . . . . . . . . . . . 16
Making Fishing Safer. . . . . . . . . . . . . . . . . . . . . . . . . . . . . . . . . . . . . . . . . . . . . . . . . . 17
Improving Economic Performance . . . . . . . . . . . . . . . . . . . . . . . . . . . . . . . . . . . . . . . 18
Ensuring Fairness to Fishermen and Communities. . . . . . . . . . . . . . . . . . . . . 20
Recommendations . . . . . . . . . . . . . . . . . . . . . . . . . . . . . . . . . . . . . . . . . . . . . . 23
Appendix A: Comparing Catch Shares With Allocations of Other Public Resources . . . . . 25
Appendix B: Catch Shares Can Help Rebuild Overfished Stocks . . . . . . . . . . . . . . . . . . . 27
Appendix C: Design Tool for Fishery Managers . . . . . . . . . . . . . . . . . . . . . . . . . . . . . . . . . 28
Appendix D: Methodology . . . . . . . . . . . . . . . . . . . . . . . . . . . . . . . . . . . . . . . . . . . . . . . . . 29
End Notes . . . . . . . . . . . . . . . . . . . . . . . . . . . . . . . . . . . . . . . . . . . . . . . . . . . . 31
Copies of this report, along with further background and documentation, are availableonline at www.sustainingfisheries.com
3
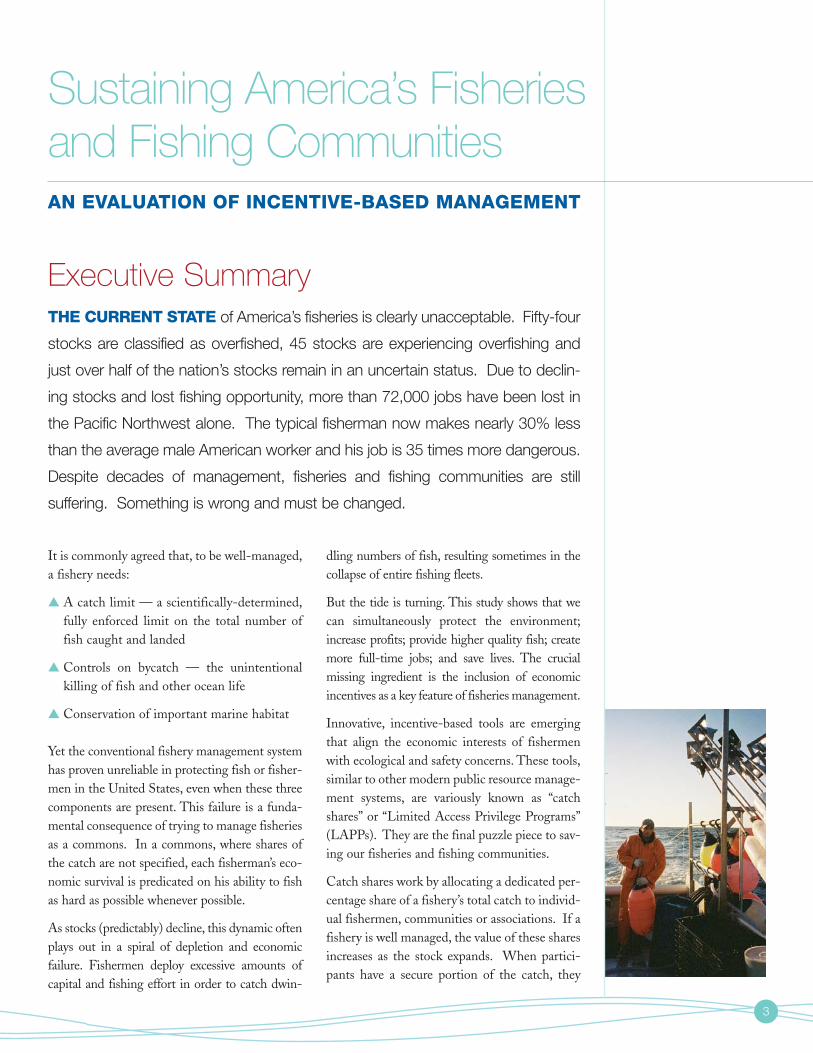
THE CURRENT STATE of America’s fisheries is clearly unacceptable. Fifty-four
stocks are classified as overfished, 45 stocks are experiencing overfishing and
just over half of the nation’s stocks remain in an uncertain status. Due to declin-
ing stocks and lost fishing opportunity, more than 72,000 jobs have been lost in
the Pacific Northwest alone. The typical fisherman now makes nearly 30% less
than the average male American worker and his job is 35 times more dangerous.
Despite decades of management, fisheries and fishing communities are still
suffering. Something is wrong and must be changed.
It is commonly agreed that, to be well-managed,a fishery needs:
▲ A catch limit — a scientifically-determined,fully enforced limit on the total number offish caught and landed
▲ Controls on bycatch — the unintentionalkilling of fish and other ocean life
▲ Conservation of important marine habitat
Yet the conventional fishery management systemhas proven unreliable in protecting fish or fisher-men in the United States, even when these threecomponents are present. This failure is a funda-mental consequence of trying to manage fisheriesas a commons. In a commons, where shares ofthe catch are not specified, each fisherman’s eco-nomic survival is predicated on his ability to fishas hard as possible whenever possible.
As stocks (predictably) decline, this dynamic oftenplays out in a spiral of depletion and economicfailure. Fishermen deploy excessive amounts ofcapital and fishing effort in order to catch dwin-
dling numbers of fish, resulting sometimes in thecollapse of entire fishing fleets.
But the tide is turning. This study shows that wecan simultaneously protect the environment;increase profits; provide higher quality fish; createmore full-time jobs; and save lives. The crucialmissing ingredient is the inclusion of economicincentives as a key feature of fisheries management.
Innovative, incentive-based tools are emergingthat align the economic interests of fishermenwith ecological and safety concerns. These tools,similar to other modern public resource manage-ment systems, are variously known as “catchshares” or “Limited Access Privilege Programs”(LAPPs). They are the final puzzle piece to sav-ing our fisheries and fishing communities.
Catch shares work by allocating a dedicated per-centage share of a fishery’s total catch to individ-ual fishermen, communities or associations. If afishery is well managed, the value of these sharesincreases as the stock expands. When partici-pants have a secure portion of the catch, they
Sustaining America’s Fisheriesand Fishing Communities
Executive Summary
AN EVALUATION OF INCENTIVE-BASED MANAGEMENT
4
gain the flexibility to make business decisionsthat improve safety, enhance the value of theirasset and promote healthy fishing stocks.
This idea is not new. But until now, there hadbeen no comprehensive, data-driven study tomeasure its effectiveness in recent years. Withseven federal fisheries under catch share man-agement, and several more under considerationfor catch shares at the beginning of this study,clearly a need existed to assess performance andprovide guidance going forward.
To fill that void, Environmental Defense assem-bled a team of 30 specialists. They reviewedmore than 150 papers and studies; collected dataon nearly 100 U.S. fisheries; performed in-depthanalysis of the 10 existing U.S. and shared stockU.S.-Canadian catch share fisheries; and con-ducted field work in three existing catch sharefisheries, as well as two others contemplating atransition. [A detailed methodology is includedas Appendix D of this report.]
“Sustaining America’s Fisheries and FishingCommunities” was a 14-month, $1.2 million proj-ect undertaken by Environmental Defense in part-nership with the Gordon and Betty MooreFoundation. A key member of the team was theRedstone Strategy Group, who performed quanti-tative evaluations of the industry as a whole, as wellas each existing catch share program. Redstonebrought to the table objective, cross-industry, glob-al expertise in market-sector research. In addition,Professor Lawrence White of New York Universityconducted a comparative analysis of public resourceallocation processes (see Appendix A).
This project documents how catch share fisheriesin the United States and British Columbia perform against key environmental, economic,and social goals since converting from conven-tional management to catch shares.
CATCH SHARES: TRULY IMPRESSIVE RESULTS
▲ Catching within limits — All catch sharefisheries have catch limits and compliance risesdramatically. In fact, on average, landings were5% below the cap.
▲ Improved science and monitoring — Nearlythree-quarters of catch share fisheries havemonitoring, compared to just one-quarter ofnon-catch share fisheries. Biomass estimateswere significantly more precise.
▲ Reducing bycatch — Bycatch was reduced bymore than 40%, which, together with the ben-efits from complying with catch limits, eachyear saves the equivalent of the annual seafoodconsumption of 16 million Americans.
▲ Limiting fishing impact on habitat — catchshare fisheries deploy 20% less gear to catch thesame amount of fish; less gear in the water likelyresults in reduced habitat destruction. All of thecatch share fisheries also make use of ecosystemprotection tools like time or area-based closures.
▲ Safety — Under catch shares, safety morethan doubled, based on an index of vesselslost, lives lost, search and rescue missions andrecorded safety violations.
▲ Economic performance — Revenues perboat increased by 80% due to higher yieldsand dockside prices.
Despite all their benefits, however, catch sharesdo change the business of fishing.
For example, job stability markedly improvesunder catch shares. But the nature of those jobschanges. Averaged over a year, a typical crewposition before catch shares would have provid-ed the equivalent of just one-half day of workper week. Afterwards, that potential rose tomore than four days of work per week. But thiswelcome increase in full-time employment has
5
consequences; the total number of availablecrew positions decreased by half.
Similarly, while major concentrations in fleetownership did not result from catch share pro-grams, the viability of some small-scale opera-tors and ports may indeed be reduced as fishingbusinesses adapt.
Fortunately, as we discuss in this report, thecareful design of catch share programs can mit-igate these transition costs, and the substantialnew value generated by catch shares makes itpossible to do so.
Over the years, observers have questioned thenecessity and utility of incentive-based fisheriesmanagement. This report responds to thosequestions, and, we believe, demonstrates thataligning fishermen’s economic incentives withsociety’s conservation goals is indeed a powerful,effective and desirable policy outcome.
Simply put, when well-designed catch shares areadded to the fisheries management mix, environ-mental damage decreases significantly and eco-nomic performance increases substantially. Assuch, it’s not surprising that fisheries with catchshare systems are seven times more likely thanconventional systems to be rated “well managed”by the Marine Stewardship Council’s independ-ent third-party certification process.
RECOMMENDATIONS
IMPLEMENT CATCH SHARES
Catch shares, when well-designed, are a keycomponent in successful fisheries managementand should be implemented more widely inorder to build sustainable fisheries and vibrantfishing communities.
ENSURE ROBUST AND EFFECTIVE DESIGN
Educate stakeholders on catch share pro-grams and options. Stakeholders should drawon this detailed body of knowledge regardingdesign elements, frequently encountered barri-ers and successful strategies to create catch sharesystems that maximize benefit and minimizetransition costs for their fisheries.
Improve efficiency of design process. Programdesign should be done by small groups of repre-sentative stakeholders with clear instructionsfrom state and federal managers as to goals andtimetables for decision-making. Another criticalelement is credible conflict-of-interest standardsfor members of the design committee.
Prioritize funding for catch share design process.In light of their ability to help fisheries meet multi-ple objectives, funding should be prioritized toimplement catch shares. In addition, we recom-mend exploring ways to tap improved fishing eco-nomics through public-private financing initiatives.
INVEST IN THE FUTURE
Some of the increase in value created by catchshares should be reinvested in the fisheries andfishing communities. New revenues can helprun catch share systems; improve data collec-tion; achieve the social objectives of particularcommunities; or increase the levels of monitor-ing, enforcement and research.
EMPLOY THOROUGH REVIEW ANDADAPTATION PROCESSES
Catch share programs must be adaptive. Theyneed to have strong regular reviews in order toregularly improve performance and address anynew issues that may arise. This requires updatedscience as well as a robust process for addressingnecessary management changes.
7
In November 2006 newspapers across the countryfeatured a cautionary tale. According to a report inthe journal Science, several of the world’s leadingmarine biologists concluded that, in a worse casescenario and with continued bad practices, all fishand seafood species worldwide would crash by2048.2 Whether this and similar conjectures cometrue depends on how we respond to the demon-strated biological and economic decline of fisheries.
Many fisheries are in trouble. For example,worldwide, it has been estimated that 90% ofspecies of large predatory fish are already gone.3
Domestically, 54 stocks are classified as over-fished, 45 stocks are experiencing overfishingand just over half of the nation’s stocks are inuncertain status due to lack of science.4,5
America’s fishing communities are also suffer-ing. The collapse of the iconic cod fishery inNew England in the early 1990s cost an esti-mated 20,000 jobs.6 An estimated 72,000 jobshave been lost due to decreasing salmon stocksin the Pacific Northwest.7
The demise of fisheries and fishing communitieshas come despite decades of effort to better man-age our fishery resources. But in the process, wehave learned what is truly needed to manage fish-eries sustainably. A fishery needs:
▲ A catch limit — a scientifically-determined,fully enforced limit on the total number offish caught and landed
▲ Controls on bycatch — the unintentionalkilling of fish and other ocean life and
▲ Protection of important marine habitat
Despite this knowledge, implementing andadhering to these bottom-line requirements hasproven a daunting challenge. However, we have
identified the missing puzzle piece and can offersome good news for the future:
The key missing ingredient for successful,
sustainable fisheries is a management tool that
can align fishermen’s economic incentives with
conservation goals: Catch shares, also known as
Limited Access Privilege Programs (LAPPs).
Catch shares, as the name implies, dedicate a shareof the annual catch to an individual fisherman (inthe form of Individual Fishing Quotas), groups offishermen (in the form of a cooperative or sector), ora community (in the form of Community Quotas).
LAPPs can also be geographically-based,dedicating a specific area for management by anindividual, group or community.8
The findings in this report conclusively demon-strate that fisheries under catch share manage-ment perform better against a wide range of keyperformance indicators — from economic gainsfor fishermen and fishing communities, to envi-ronmental goals like catch limits, bycatch con-trols and habitat protection.
Finally, the report examines how fishery alloca-tions compare to other public resource manage-ment systems; describes a design tool that canhelp decision makers implement LAPPs moreeffectively; and offers a series of recommenda-tions for moving forward.
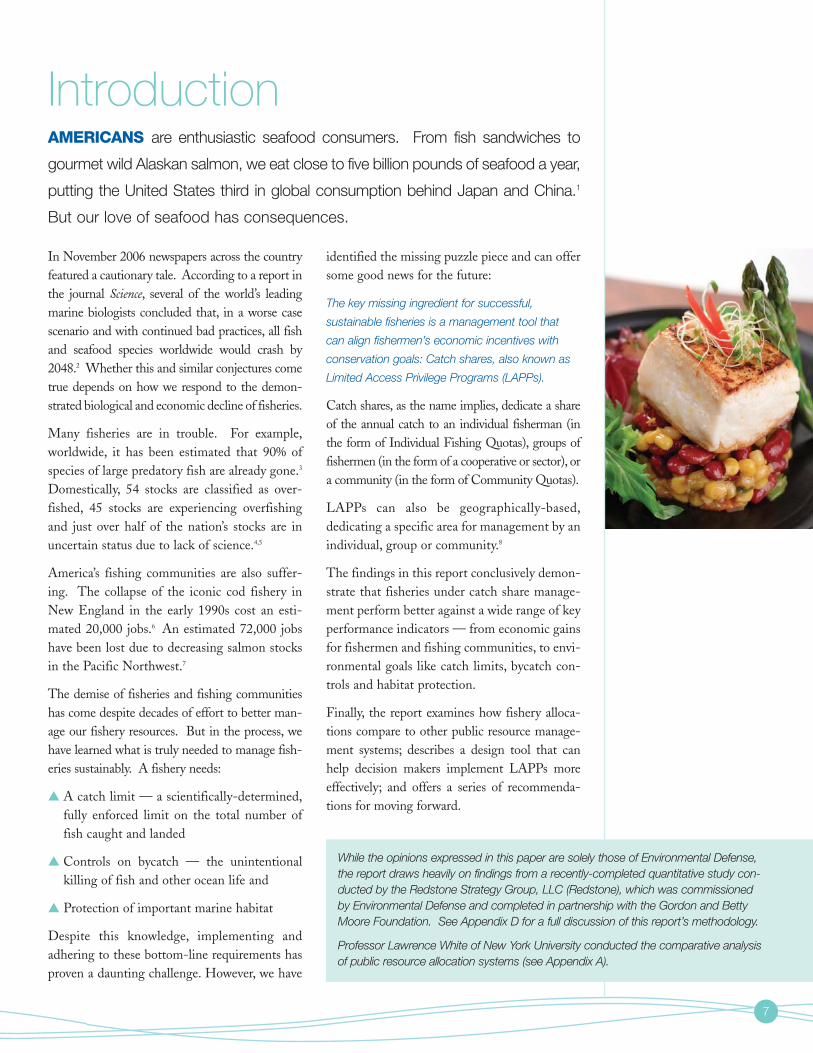
IntroductionAMERICANS are enthusiastic seafood consumers. From fish sandwiches to
gourmet wild Alaskan salmon, we eat close to five billion pounds of seafood a year,
putting the United States third in global consumption behind Japan and China.1
But our love of seafood has consequences.
While the opinions expressed in this paper are solely those of Environmental Defense,the report draws heavily on findings from a recently-completed quantitative study con-ducted by the Redstone Strategy Group, LLC (Redstone), which was commissionedby Environmental Defense and completed in partnership with the Gordon and BettyMoore Foundation. See Appendix D for a full discussion of this report’s methodology.
Professor Lawrence White of New York University conducted the comparative analysisof public resource allocation systems (see Appendix A).
8
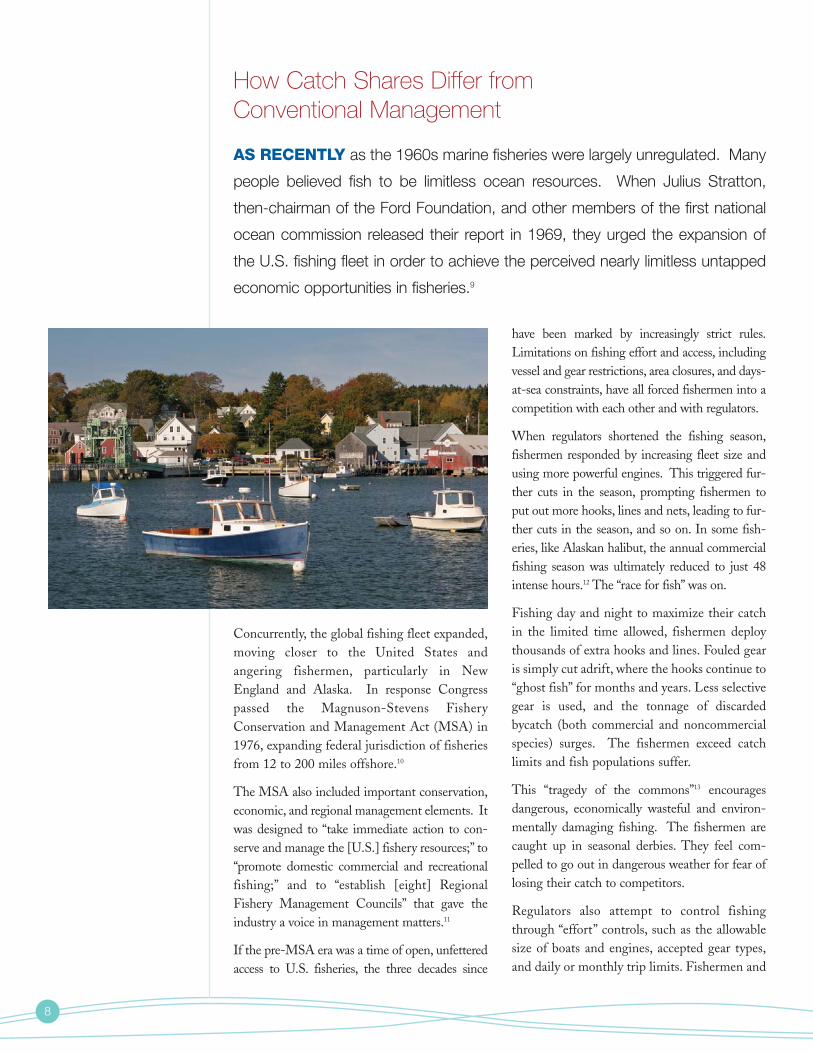
Concurrently, the global fishing fleet expanded,moving closer to the United States and angering fishermen, particularly in NewEngland and Alaska. In response Congresspassed the Magnuson-Stevens FisheryConservation and Management Act (MSA) in1976, expanding federal jurisdiction of fisheriesfrom 12 to 200 miles offshore.10
The MSA also included important conservation,economic, and regional management elements. Itwas designed to “take immediate action to con-serve and manage the [U.S.] fishery resources;” to“promote domestic commercial and recreationalfishing;” and to “establish [eight] RegionalFishery Management Councils” that gave theindustry a voice in management matters.11
If the pre-MSA era was a time of open, unfetteredaccess to U.S. fisheries, the three decades since
have been marked by increasingly strict rules.Limitations on fishing effort and access, includingvessel and gear restrictions, area closures, and days-at-sea constraints, have all forced fishermen into acompetition with each other and with regulators.
When regulators shortened the fishing season,fishermen responded by increasing fleet size andusing more powerful engines. This triggered fur-ther cuts in the season, prompting fishermen toput out more hooks, lines and nets, leading to fur-ther cuts in the season, and so on. In some fish-eries, like Alaskan halibut, the annual commercialfishing season was ultimately reduced to just 48intense hours.12 The “race for fish” was on.
Fishing day and night to maximize their catchin the limited time allowed, fishermen deploythousands of extra hooks and lines. Fouled gearis simply cut adrift, where the hooks continue to“ghost fish” for months and years. Less selectivegear is used, and the tonnage of discardedbycatch (both commercial and noncommercialspecies) surges. The fishermen exceed catchlimits and fish populations suffer.
This “tragedy of the commons”13 encouragesdangerous, economically wasteful and environ-mentally damaging fishing. The fishermen arecaught up in seasonal derbies. They feel com-pelled to go out in dangerous weather for fear oflosing their catch to competitors.
Regulators also attempt to control fishingthrough “effort” controls, such as the allowablesize of boats and engines, accepted gear types,and daily or monthly trip limits. Fishermen and
How Catch Shares Differ from Conventional Management
AS RECENTLY as the 1960s marine fisheries were largely unregulated. Many
people believed fish to be limitless ocean resources. When Julius Stratton,
then-chairman of the Ford Foundation, and other members of the first national
ocean commission released their report in 1969, they urged the expansion of
the U.S. fishing fleet in order to achieve the perceived nearly limitless untapped
economic opportunities in fisheries.9
9
regulators are thus pitted against each other in agame of “cat and mouse.”14 The fishermen con-tinually and creatively find new ways to catchmore fish while staying within the rules regula-tors have laid out.
Capacity in the fishery skyrockets; now thereare significantly more boats and gear trying tocapture the fish than would be necessary if thefishing were being pursued in a more rationalway. Not only are fishermen competing againsteach other, but they (and processors) are invest-ing significantly in capital goods that may sitidle for much of the year. The inevitable resultis declining catches per boat, increased costs tofishermen and declining revenues.
In a few cases, conventional approaches alonehave helped bring back individual fish stocks.The North Pacific has avoided the worst results:Fisheries are sustainable and profitable. In2005, six rebuilding stocks, including BeringSea crab, have recovered and six more fisheriessaw overfishing end in recent years.15 Redfish inthe Gulf of Mexico are on the rebound aftermanagers placed a moratorium on commercialfishing. However, the moratorium lasted 10years and imposed numerous costs on fisher-men, and four species were newly classified as‘overfished’ by NOAA Fisheries in 2005.16
So there is some good news. It shows that wecan indeed recover damaged fisheries.However, these gains are coming much tooslowly and at too high a price.
There ought to be a better way. And there is.
SOLVING THE COMMONS PROBLEM
Fisheries are not alone in the challenge of man-aging a commons. There is a rich history in theUnited States of policy approaches to publicresource management, from water to the elec-tromagnetic spectrum. Commonly, policy mak-ers have implemented a system in which usersare granted exclusive privileges to use aresource, subject to specific rules and conditionsof use. These conditions have proven effectivein achieving policy goals, though they have alsoproven challenging to amend as goals changeover time. Existing users have generally been
given preference in the allocation of privileges.In the past, many such private privileges havebeen granted freely, but today there is move-ment towards capturing more value for the pub-lic, through auctions or use fees. [A more com-plete discussion of public resource allocationpolicies can be found in Appendix A.]
MSA UPDATE
In late 2006 Congress finalized a rewrite of MSA.This is the first such action by Congress to improvefisheries management since 1996, when theSustainable Fisheries Act amendments made criti-cal advancements for restoring depleted fisheries.However, the 1996 amendments also established amoratorium on all catch share systems for fisheries,which stalled progress towards fishery reform, untilthe moratorium was lifted in 2002.
With broader recognition today that catch sharescan improve both fishery conservation and economics, the updated MSA includes new rules for their implementation, including regularmonitoring and reviews of the program, costsharing, a ten-year review and renewal cycle forshares, and a process for initiating LAPPs withinthe regional fishery management councils.17
10
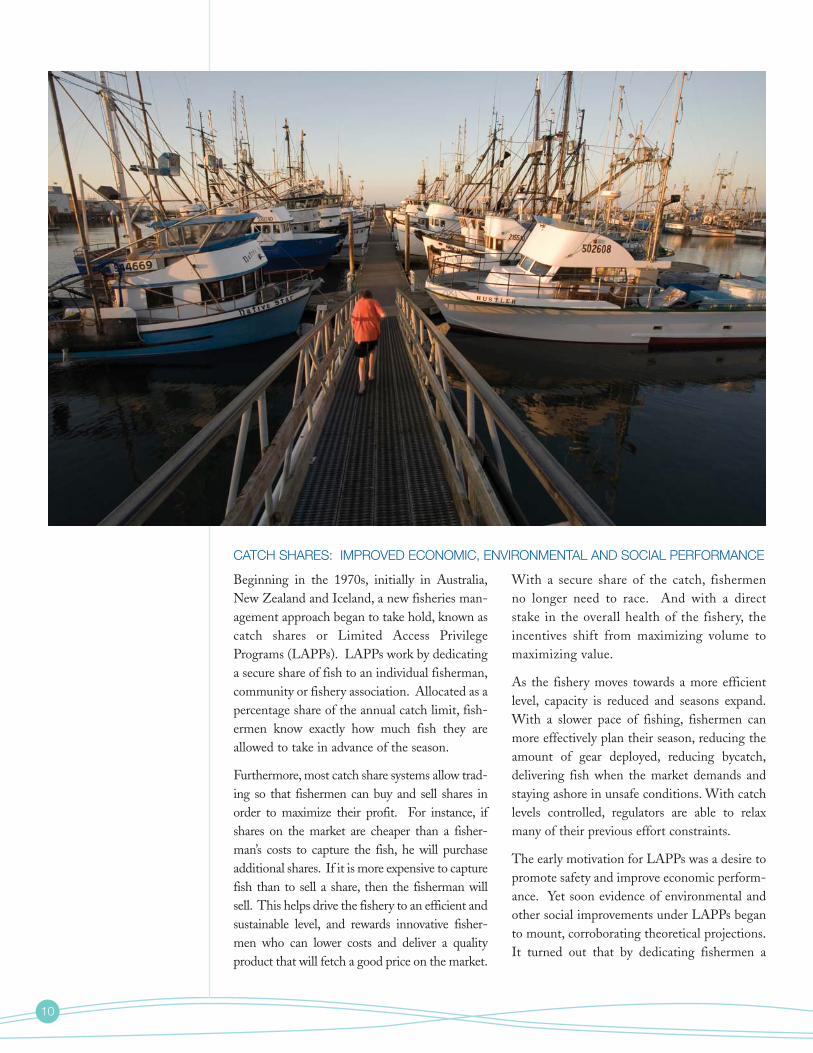
CATCH SHARES: IMPROVED ECONOMIC, ENVIRONMENTAL AND SOCIAL PERFORMANCE
Beginning in the 1970s, initially in Australia,New Zealand and Iceland, a new fisheries man-agement approach began to take hold, known ascatch shares or Limited Access PrivilegePrograms (LAPPs). LAPPs work by dedicatinga secure share of fish to an individual fisherman,community or fishery association. Allocated as apercentage share of the annual catch limit, fish-ermen know exactly how much fish they areallowed to take in advance of the season.
Furthermore, most catch share systems allow trad-ing so that fishermen can buy and sell shares inorder to maximize their profit. For instance, ifshares on the market are cheaper than a fisher-man’s costs to capture the fish, he will purchaseadditional shares. If it is more expensive to capturefish than to sell a share, then the fisherman willsell. This helps drive the fishery to an efficient andsustainable level, and rewards innovative fisher-men who can lower costs and deliver a qualityproduct that will fetch a good price on the market.
With a secure share of the catch, fishermenno longer need to race. And with a directstake in the overall health of the fishery, theincentives shift from maximizing volume tomaximizing value.
As the fishery moves towards a more efficientlevel, capacity is reduced and seasons expand.With a slower pace of fishing, fishermen canmore effectively plan their season, reducing theamount of gear deployed, reducing bycatch,delivering fish when the market demands andstaying ashore in unsafe conditions. With catchlevels controlled, regulators are able to relaxmany of their previous effort constraints.
The early motivation for LAPPs was a desire topromote safety and improve economic perform-ance. Yet soon evidence of environmental andother social improvements under LAPPs beganto mount, corroborating theoretical projections.It turned out that by dedicating fishermen a
share of the catch, LAPPs overcame the“tragedy of the commons,” providing a cleareconomic rationale for resource conservation.
In much the same way that shareholders in acompany want the business to excel so theirshares gain value, fishermen in LAPPs need sus-tainable fisheries in order for their shares toappreciate. Landing and discarding unmar-ketable species, such as bycatch, or spending timedeploying excess gear are costly for fisherman.Under catch shares, they have a way to avoid suchadditional costs. Furthermore, if fishermenexceed their share of the catch, they have to payto buy additional quota on the market. If noquota is available, stiff penalties often ensue.
Environmental gains materialized eventhough the early LAPP programs weren’tdesigned with environmental benefits inmind; they included no additional environ-mental restrictions. Reducing costs, avoidingpenalties, and engaging in other practices thatimproved conservation simply and finallymade good business sense.
In addition, LAPPs provided more secure, full-time jobs and alleviated the substantial stressand instability of short “derby” fishing seasons.
Despite these benefits, however, LAPPs have notbeen without challenges. Any fundamental changein the way a business operates is bound to meetsome resistance, particularly among those whogain the most from the conventional approach.
Some are concerned that LAPPs privatize publicfisheries resources.18 Difficult questions arise aboutresource allocation, trading rules and transition assis-tance, as well as the ability to appropriately monitorcatch share programs. In the United States in par-ticular, finding ways to understand and address thesechallenges has been muddled by a lack of scientificdata and a reliance on anecdotal information.
At the beginning of this study, seven federal fish-eries operated under LAPP management in theUnited States. With several more fisheries underconsideration for LAPPs, clearly a need existedto assess the performance of these programs todate and provide guidance going forward. Thisstudy was designed to fill those needs.
11
13
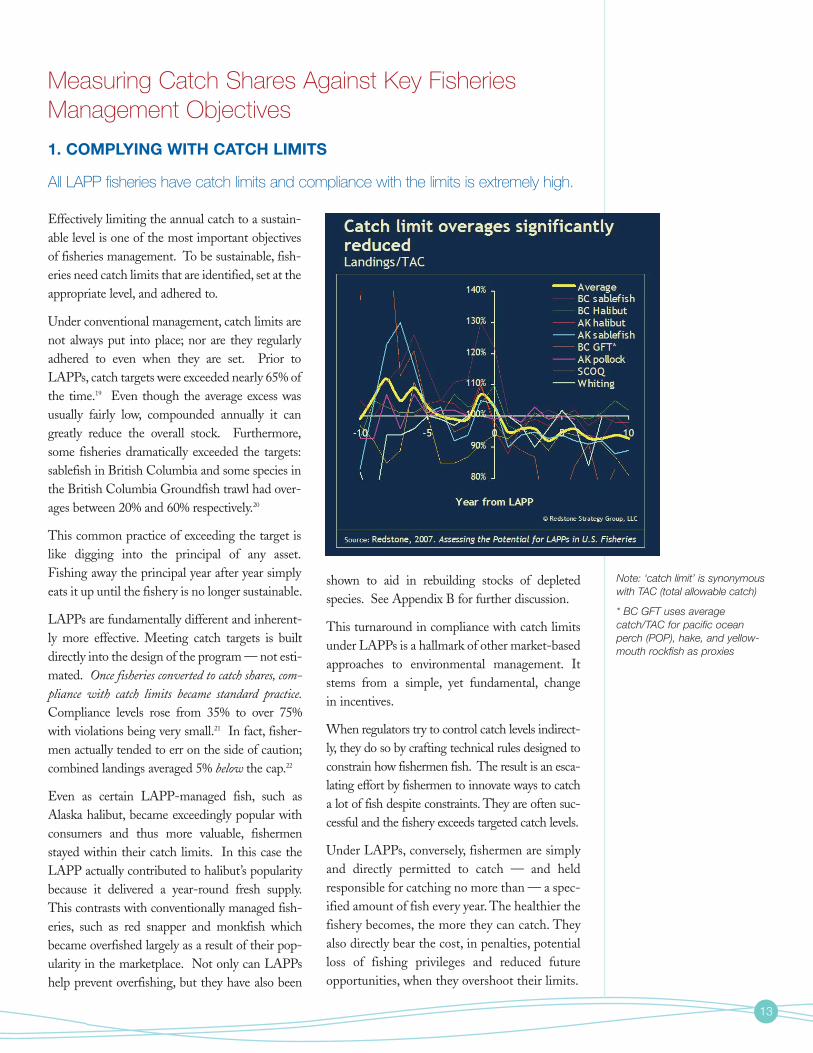
Effectively limiting the annual catch to a sustain-able level is one of the most important objectivesof fisheries management. To be sustainable, fish-eries need catch limits that are identified, set at theappropriate level, and adhered to.
Under conventional management, catch limits arenot always put into place; nor are they regularlyadhered to even when they are set. Prior toLAPPs, catch targets were exceeded nearly 65% ofthe time.19 Even though the average excess wasusually fairly low, compounded annually it cangreatly reduce the overall stock. Furthermore,some fisheries dramatically exceeded the targets:sablefish in British Columbia and some species inthe British Columbia Groundfish trawl had over-ages between 20% and 60% respectively.20
This common practice of exceeding the target islike digging into the principal of any asset.Fishing away the principal year after year simplyeats it up until the fishery is no longer sustainable.
LAPPs are fundamentally different and inherent-ly more effective. Meeting catch targets is builtdirectly into the design of the program — not esti-mated. Once fisheries converted to catch shares, com-pliance with catch limits became standard practice.Compliance levels rose from 35% to over 75%with violations being very small.21 In fact, fisher-men actually tended to err on the side of caution;combined landings averaged 5% below the cap.22
Even as certain LAPP-managed fish, such asAlaska halibut, became exceedingly popular withconsumers and thus more valuable, fishermenstayed within their catch limits. In this case theLAPP actually contributed to halibut’s popularitybecause it delivered a year-round fresh supply.This contrasts with conventionally managed fish-eries, such as red snapper and monkfish whichbecame overfished largely as a result of their pop-ularity in the marketplace. Not only can LAPPshelp prevent overfishing, but they have also been
shown to aid in rebuilding stocks of depletedspecies. See Appendix B for further discussion.
This turnaround in compliance with catch limitsunder LAPPs is a hallmark of other market-basedapproaches to environmental management. Itstems from a simple, yet fundamental, change in incentives.
When regulators try to control catch levels indirect-ly, they do so by crafting technical rules designed toconstrain how fishermen fish. The result is an esca-lating effort by fishermen to innovate ways to catcha lot of fish despite constraints. They are often suc-cessful and the fishery exceeds targeted catch levels.
Under LAPPs, conversely, fishermen are simplyand directly permitted to catch — and heldresponsible for catching no more than — a spec-ified amount of fish every year. The healthier thefishery becomes, the more they can catch. Theyalso directly bear the cost, in penalties, potentialloss of fishing privileges and reduced futureopportunities, when they overshoot their limits.
1. COMPLYING WITH CATCH LIMITS
All LAPP fisheries have catch limits and compliance with the limits is extremely high.
Measuring Catch Shares Against Key FisheriesManagement Objectives
Note: ‘catch limit’ is synonymouswith TAC (total allowable catch)
* BC GFT uses averagecatch/TAC for pacific oceanperch (POP), hake, and yellow-mouth rockfish as proxies
14
Fisheries management is required to be based onthe best available science24 in the United States.And an appropriate, scientifically-determined,well-enforced catch limit is a vital prerequisite tosustainable fisheries. Having high-quality data formodeling, interpretation, and application of scienceto policymaking is key.
Monitoring the catch is also necessary, both toensure we have an accurate assessment of catch andbycatch and to improve our scientific understanding.
While the quality of the science used to informfisheries management varies widely among fish-eries, lack of adequate data is often cited as aproblem. Surveys of fish abundance are oftencriticized because they are not conducted fre-quently enough, within the appropriate habitatsor with unbiased gear and practices. Uncertaintyin abundance estimates, along with a lack of harddata on the life history of fish and their produc-tivity, forces scientists to estimate the importantparameters that help determine the size of thetotal allowable catch. In some cases, the desire toprotect fishermen’s short-term economic inter-ests prevails, and scientific uncertainty leads tothe adoption of unsustainable catch limits.
For example, allowable catch limits for rockfishpopulations off California, Oregon andWashington were set at relatively high levels in1990, based on several erroneous assumptions,including the assumption that these stocks were asproductive as Alaskan stocks. This set the fisheryonto the wrong trajectory. The scientific basis forthe catch limits was then revised in 1993, based onnew evidence that west coast rockfish were notnearly as productive as had been assumed.
However, more restrictive catch limits were notimposed until 1997, by which time some rockfishstocks had already declined to very low levels, pre-cipitating drastic cuts and the declaration of a fish-ery disaster in 2000. Landings dropped 50% andrevenues declined by $11 million.25 Referring tothis disaster, Penny Dalton, then the FisheriesDirector at the National Oceanic and Atmo-spheric Administration, said: “A major underlyingreason for the current situation is the lack of basicscientific data to conduct stock assessments and toset harvest limits that will maintain groundfishstocks at sustainable levels.26”
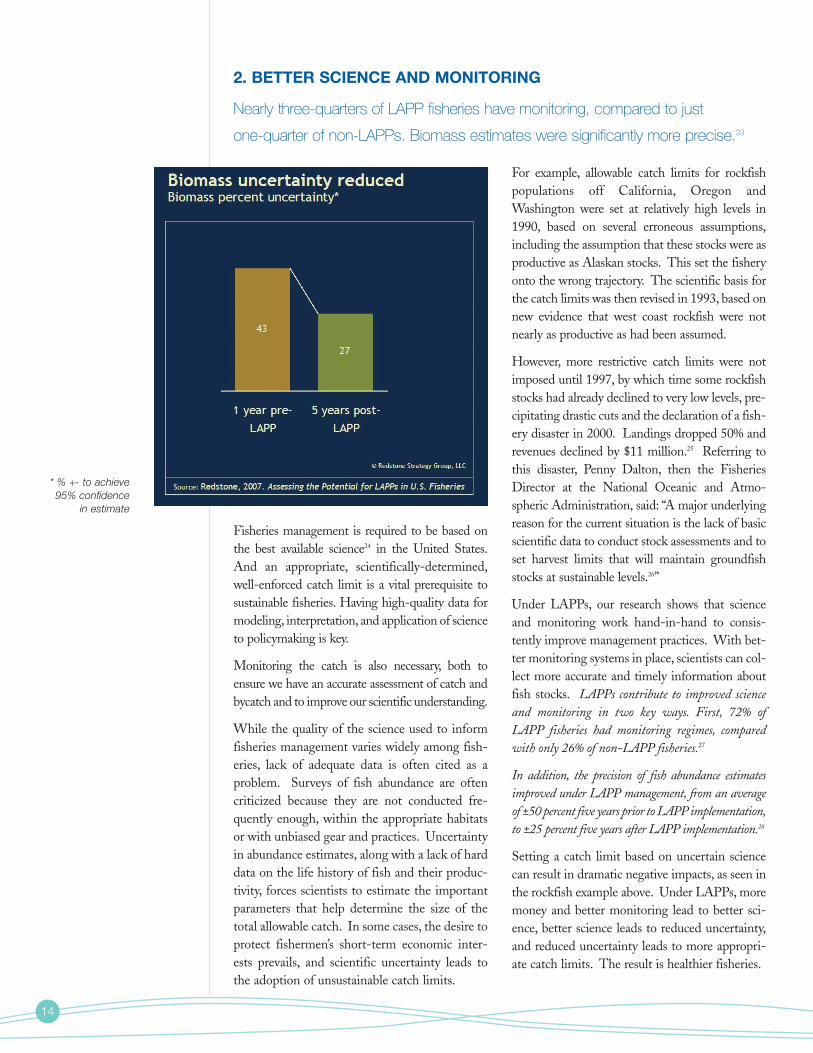
Under LAPPs, our research shows that scienceand monitoring work hand-in-hand to consis-tently improve management practices. With bet-ter monitoring systems in place, scientists can col-lect more accurate and timely information aboutfish stocks. LAPPs contribute to improved scienceand monitoring in two key ways. First, 72% ofLAPP fisheries had monitoring regimes, comparedwith only 26% of non-LAPP fisheries.27
In addition, the precision of fish abundance estimatesimproved under LAPP management, from an averageof ±50 percent five years prior to LAPP implementation,to ±25 percent five years after LAPP implementation.28
Setting a catch limit based on uncertain sciencecan result in dramatic negative impacts, as seen inthe rockfish example above. Under LAPPs, moremoney and better monitoring lead to better sci-ence, better science leads to reduced uncertainty,and reduced uncertainty leads to more appropri-ate catch limits. The result is healthier fisheries.
2. BETTER SCIENCE AND MONITORING
Nearly three-quarters of LAPP fisheries have monitoring, compared to just
one-quarter of non-LAPPs. Biomass estimates were significantly more precise.23
* % +- to achieve95% confidence
in estimate
15
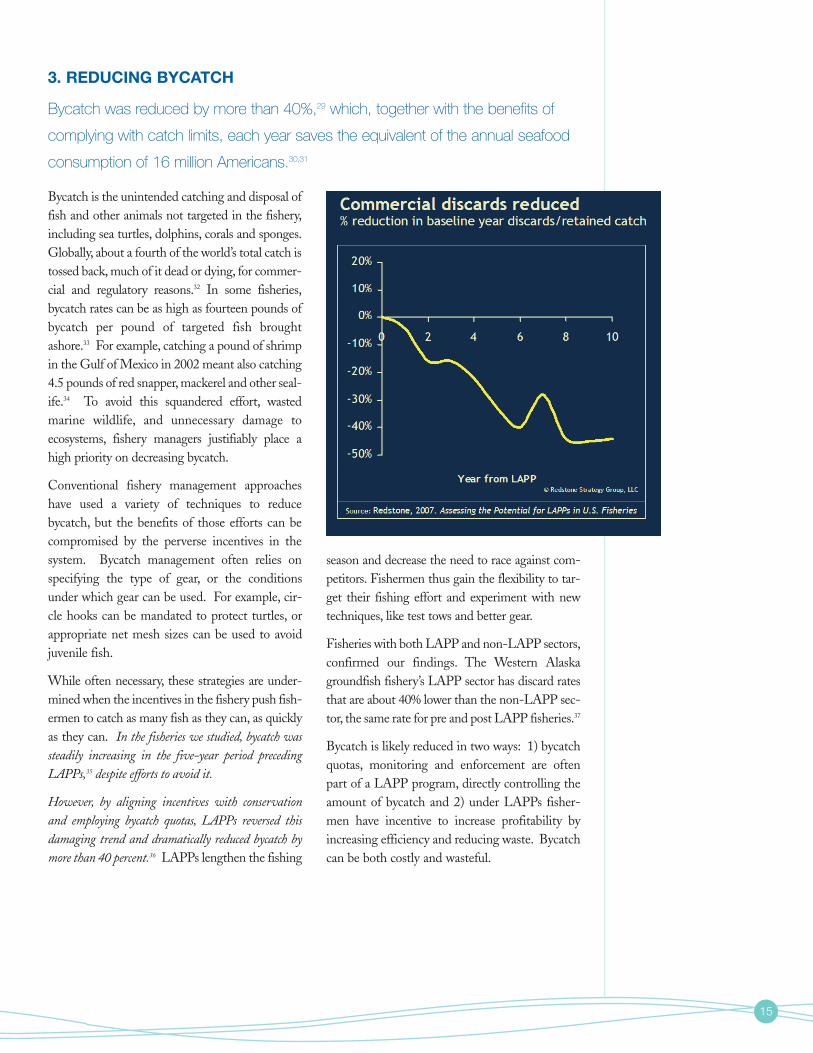
Bycatch is the unintended catching and disposal offish and other animals not targeted in the fishery,including sea turtles, dolphins, corals and sponges.Globally, about a fourth of the world’s total catch istossed back, much of it dead or dying, for commer-cial and regulatory reasons.32 In some fisheries,bycatch rates can be as high as fourteen pounds ofbycatch per pound of targeted fish broughtashore.33 For example, catching a pound of shrimpin the Gulf of Mexico in 2002 meant also catching4.5 pounds of red snapper, mackerel and other seal-ife.34 To avoid this squandered effort, wastedmarine wildlife, and unnecessary damage toecosystems, fishery managers justifiably place ahigh priority on decreasing bycatch.
Conventional fishery management approacheshave used a variety of techniques to reducebycatch, but the benefits of those efforts can becompromised by the perverse incentives in thesystem. Bycatch management often relies onspecifying the type of gear, or the conditionsunder which gear can be used. For example, cir-cle hooks can be mandated to protect turtles, orappropriate net mesh sizes can be used to avoidjuvenile fish.
While often necessary, these strategies are under-mined when the incentives in the fishery push fish-ermen to catch as many fish as they can, as quicklyas they can. In the fisheries we studied, bycatch wassteadily increasing in the five-year period precedingLAPPs,35 despite efforts to avoid it.
However, by aligning incentives with conservationand employing bycatch quotas, LAPPs reversed thisdamaging trend and dramatically reduced bycatch bymore than 40 percent.36 LAPPs lengthen the fishing
season and decrease the need to race against com-petitors. Fishermen thus gain the flexibility to tar-get their fishing effort and experiment with newtechniques, like test tows and better gear.
Fisheries with both LAPP and non-LAPP sectors,confirmed our findings. The Western Alaskagroundfish fishery’s LAPP sector has discard ratesthat are about 40% lower than the non-LAPP sec-tor, the same rate for pre and post LAPP fisheries.37
Bycatch is likely reduced in two ways: 1) bycatchquotas, monitoring and enforcement are oftenpart of a LAPP program, directly controlling theamount of bycatch and 2) under LAPPs fisher-men have incentive to increase profitability byincreasing efficiency and reducing waste. Bycatchcan be both costly and wasteful.
3. REDUCING BYCATCH
Bycatch was reduced by more than 40%,29 which, together with the benefits of
complying with catch limits, each year saves the equivalent of the annual seafood
consumption of 16 million Americans.30,31
16
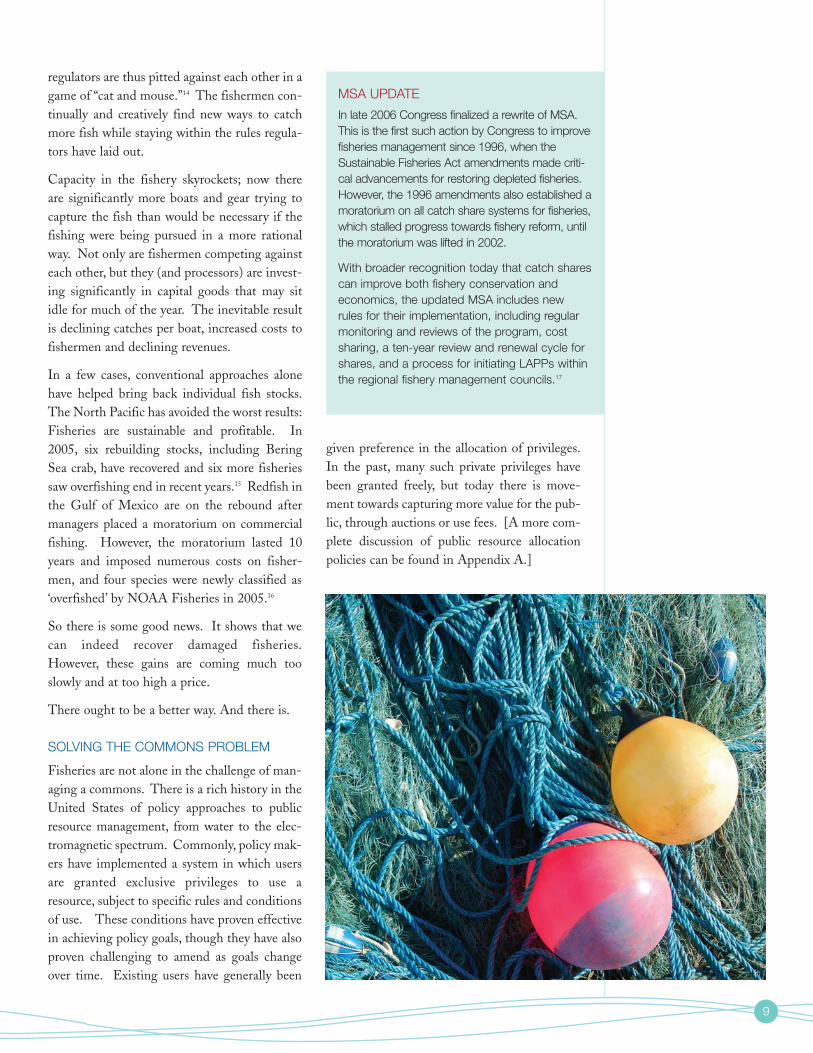
Commercial fishing practices can significantlyharm the habitats of fish populations and a richdiversity of other ocean wildlife. Large trawlsdragging heavy gear across the bottom can alterocean ecosystems and reduce biological diversi-ty. Plus under a severe race for fish resultingfrom conventional management, it sometimesmakes more economic sense for a fisherman tosimply cut loose even expensive tangled gear,and reset new gear, rather than lose scarce allot-ted fishing hours. Ongoing “ghost fishing” bysuch derelict fishing gear is a significant prob-lem — even in the new Northwestern Hawaiian
Islands Marine National Monument, one of themost remote and undisturbed ocean habitats inthe world. Damaged spawning, nursery andfeeding grounds, loss of hiding places anddiminished food sources — all harm fish popu-lations and other ocean wildlife.
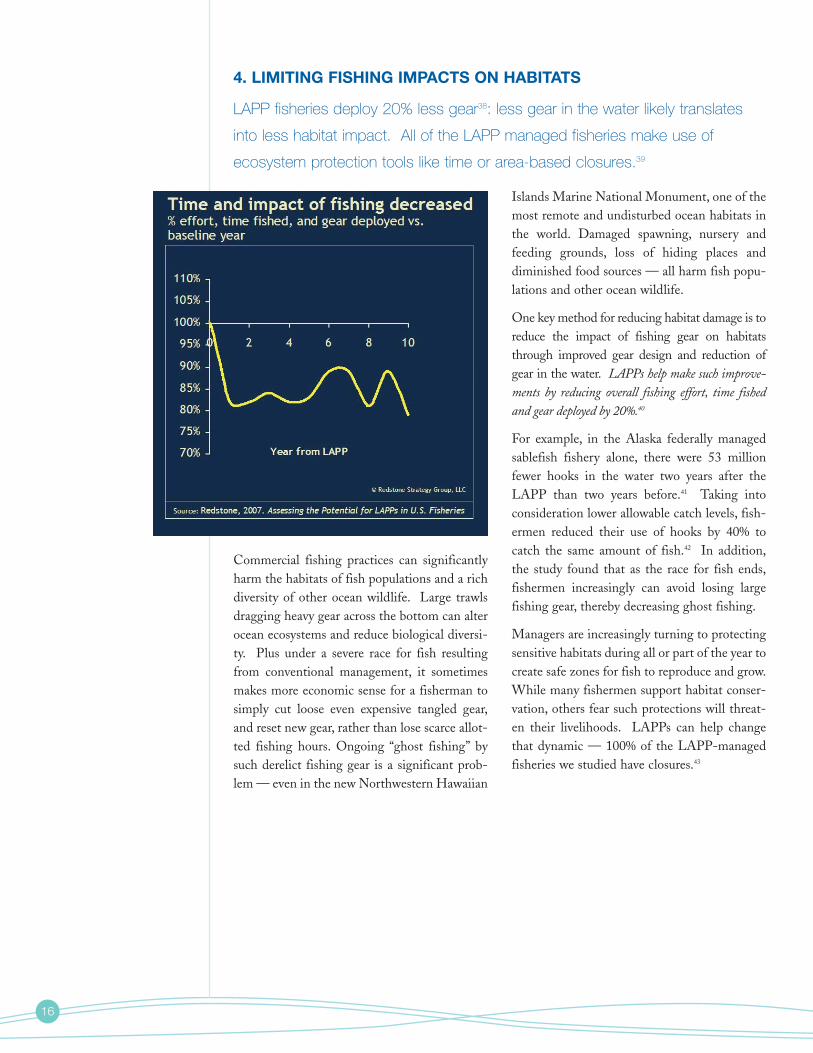
One key method for reducing habitat damage is toreduce the impact of fishing gear on habitatsthrough improved gear design and reduction ofgear in the water. LAPPs help make such improve-ments by reducing overall fishing effort, time fishedand gear deployed by 20%.40
For example, in the Alaska federally managedsablefish fishery alone, there were 53 millionfewer hooks in the water two years after theLAPP than two years before.41 Taking intoconsideration lower allowable catch levels, fish-ermen reduced their use of hooks by 40% tocatch the same amount of fish.42 In addition,the study found that as the race for fish ends,fishermen increasingly can avoid losing largefishing gear, thereby decreasing ghost fishing.
Managers are increasingly turning to protectingsensitive habitats during all or part of the year tocreate safe zones for fish to reproduce and grow.While many fishermen support habitat conser-vation, others fear such protections will threat-en their livelihoods. LAPPs can help changethat dynamic — 100% of the LAPP-managedfisheries we studied have closures.43
4. LIMITING FISHING IMPACTS ON HABITATS
LAPP fisheries deploy 20% less gear38: less gear in the water likely translates
into less habitat impact. All of the LAPP managed fisheries make use of
ecosystem protection tools like time or area-based closures.39
17
Between the power and isolation of the ocean,and the heavy machinery operated on many ves-sels, commercial fishing and its frenetic pace areextremely dangerous. In the United States, theoccupational fatality rate among fishermen is asmuch as 35 times higher than all-industry aver-ages44 (and they make nearly 30% less than theaverage male American worker).45 It’s no exag-geration to say that fishermen continually risklife and limb to deliver seafood to market.
Conventional fisheries management consistent-ly requires fishermen to choose between theirsafety and making a living. In the absence of asecure catch allocation, individual fishermenmust compete against each other and the ele-ments to bring in as much fish as fast as possi-ble. Racing to maximize their catch, boats mayfish in dangerous weather conditions on treach-erous waters, often far from any potential assis-tance, following grueling schedules with littlesleep in order to compete.
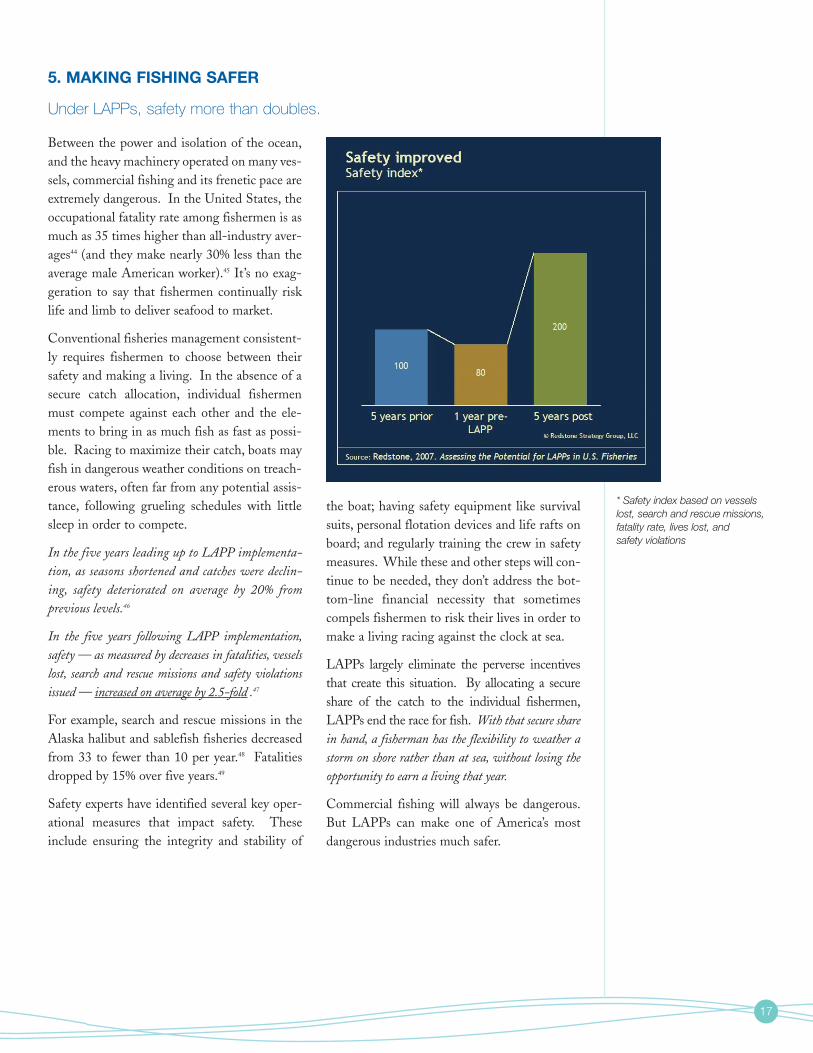
In the five years leading up to LAPP implementa-tion, as seasons shortened and catches were declin-ing, safety deteriorated on average by 20% fromprevious levels.46
In the five years following LAPP implementation,safety — as measured by decreases in fatalities, vesselslost, search and rescue missions and safety violationsissued — increased on average by 2.5-fold .47
For example, search and rescue missions in theAlaska halibut and sablefish fisheries decreasedfrom 33 to fewer than 10 per year.48 Fatalitiesdropped by 15% over five years.49
Safety experts have identified several key oper-ational measures that impact safety. Theseinclude ensuring the integrity and stability of
the boat; having safety equipment like survivalsuits, personal flotation devices and life rafts onboard; and regularly training the crew in safetymeasures. While these and other steps will con-tinue to be needed, they don’t address the bot-tom-line financial necessity that sometimescompels fishermen to risk their lives in order tomake a living racing against the clock at sea.
LAPPs largely eliminate the perverse incentivesthat create this situation. By allocating a secureshare of the catch to the individual fishermen,LAPPs end the race for fish. With that secure sharein hand, a fisherman has the flexibility to weather astorm on shore rather than at sea, without losing theopportunity to earn a living that year.
Commercial fishing will always be dangerous.But LAPPs can make one of America’s mostdangerous industries much safer.
5. MAKING FISHING SAFER
Under LAPPs, safety more than doubles.
* Safety index based on vesselslost, search and rescue missions,fatality rate, lives lost, and safety violations

18
6. IMPROVING ECONOMIC PERFORMANCE
Revenues per boat increased by 80% due to higher yields per boat and
higher dockside prices.50
Historically, a common motivating factor forimplementing LAPPs was poor economic per-formance. And in every case we studied, fisheryeconomics did indeed improve dramatically.
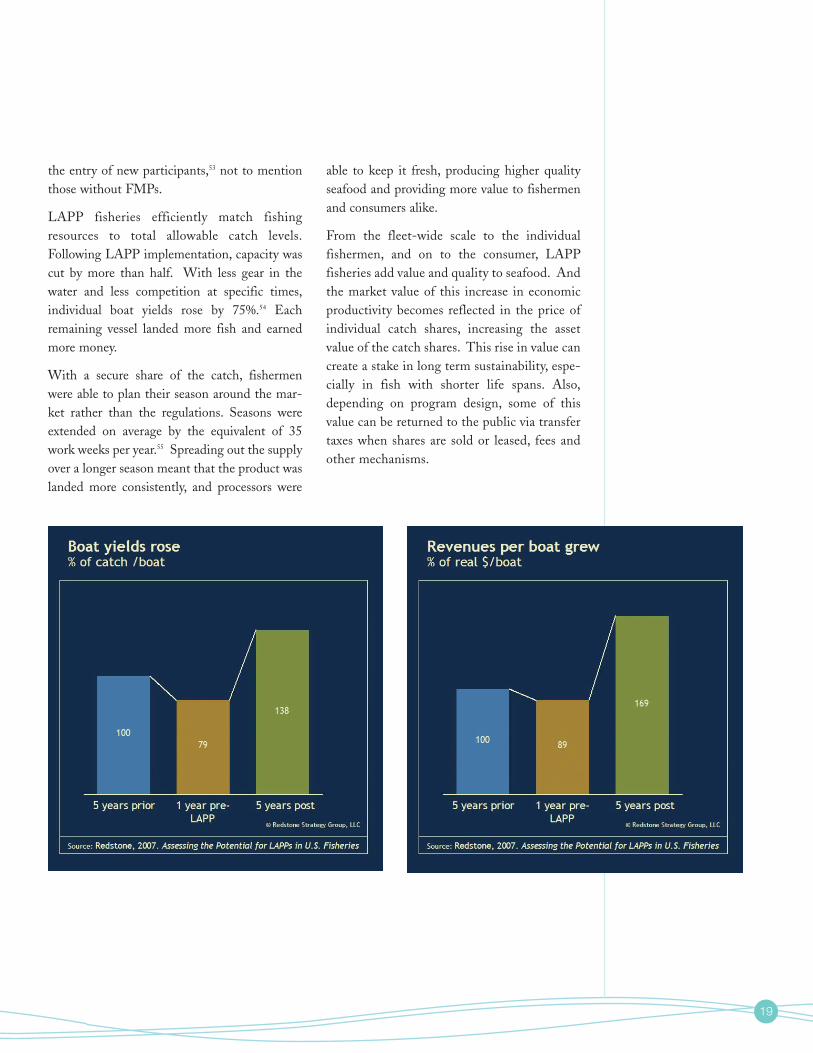
In the five years leading up to the LAPPs, the studyshows that revenue per boat decreased, by an averageof 10%. In the five years after LAPPs, revenuesincreased by an average of 80%.51
Even as revenues were declining pre-LAPP, thefishermen were expending ever more effort tocatch their fish. Prior to the implementation ofLAPPs, fishermen were working on average theequivalent of an extra day every week, just tocatch the same amount of fish they had fiveyears earlier. Fishermen were spending moremoney on fishing equipment, labor, fuel andother expenses, further reducing profitability.
With declining catches, increasing regulations,increasing costs, and relatively low revenues dueto supply gluts and quality, fishermen, fishingcommunities and the public are not receivingoptimal value from our fisheries. In 2005, USdomestic fisheries landed 9.6 billion pounds ofseafood, valued at $3.9 billion. If better man-aged, the same amount of fish could have yield-ed more than $5 billion and provided fresher,higher quality seafood to consumers.52
Most US fisheries are overcapitalized, meaningthere are already too many boats with excessfish-capturing capacity for the allowable catchlevel. This overcapacity is a result of the regula-tions imposed by managers. In addition, nearlya fifth of our fisheries with FisheryManagement Plans (FMPs) do not even limit
19
the entry of new participants,53 not to mentionthose without FMPs.
LAPP fisheries efficiently match fishingresources to total allowable catch levels.Following LAPP implementation, capacity wascut by more than half. With less gear in thewater and less competition at specific times,individual boat yields rose by 75%.54 Eachremaining vessel landed more fish and earnedmore money.
With a secure share of the catch, fishermenwere able to plan their season around the mar-ket rather than the regulations. Seasons wereextended on average by the equivalent of 35work weeks per year.55 Spreading out the supplyover a longer season meant that the product waslanded more consistently, and processors were
able to keep it fresh, producing higher qualityseafood and providing more value to fishermenand consumers alike.
From the fleet-wide scale to the individualfishermen, and on to the consumer, LAPPfisheries add value and quality to seafood. Andthe market value of this increase in economicproductivity becomes reflected in the price ofindividual catch shares, increasing the assetvalue of the catch shares. This rise in value cancreate a stake in long term sustainability, espe-cially in fish with shorter life spans. Also,depending on program design, some of thisvalue can be returned to the public via transfertaxes when shares are sold or leased, fees andother mechanisms.
20
This is a laudable goal. But ironically, as wehave too often seen, such an approach can resultin tremendous dislocations in the long term, ifthe fishery subsequently collapses due to inade-quate conservation measures that result fromtoo many decisions that trade off long-term sus-tainability for short term economic relief.
Catch shares create profound changes in thenature of the fishing business. Not surprisingly,some of the most contested issues in the designof LAPPs involve how these changes affectexisting jobs and fishing-dependent businesses.
Employment. The impact of LAPPs on jobshas been hotly debated, until now without thebenefit of empirical evidence.
We found that the total amount of labor in a fishery— measured in fishing hours per season — actuallyincreases very slightly with a transition to LAPPs.57
However, there are definite changes in the structureof the work force needed for fishing.
Under conventional management systems, thelabor market in the fisheries we assessed was dom-inated by seasonal and/or part-time work opportu-nities. Although these jobs can be dangerous, spo-radic and sometimes are only modestly paid, thereare, relatively speaking, a large number of them.They can be important to the economic structureof small fishing-dependent communities.
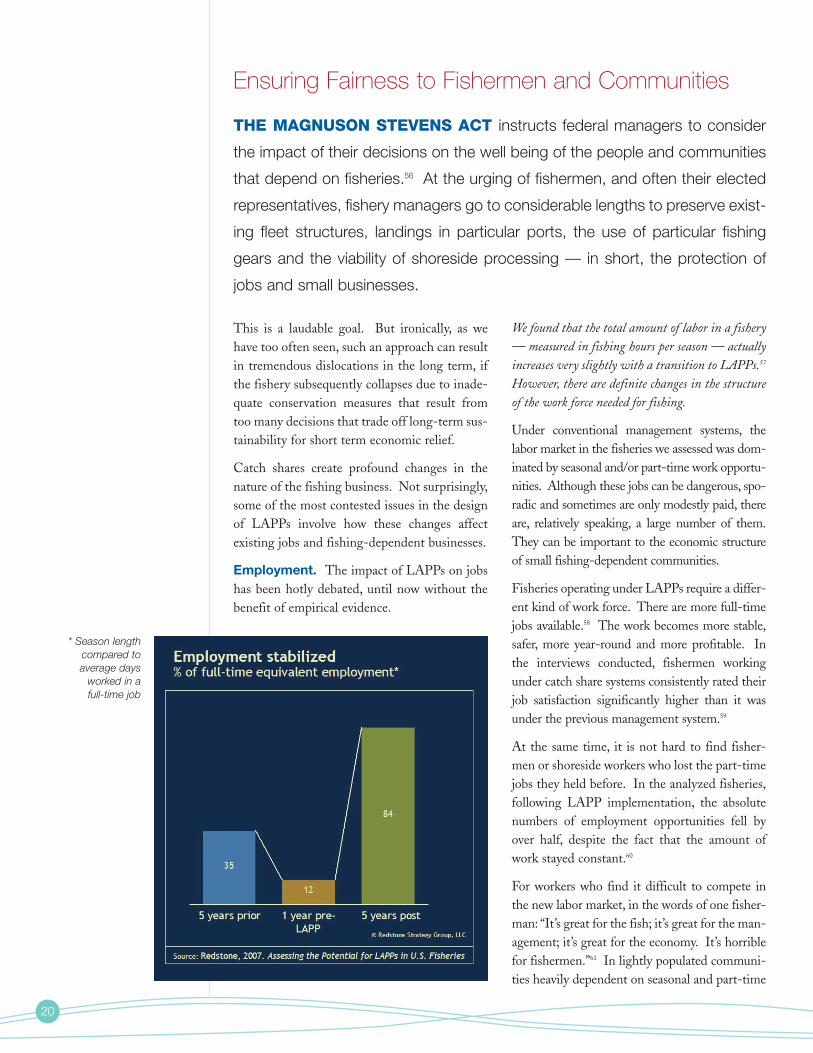
Fisheries operating under LAPPs require a differ-ent kind of work force. There are more full-timejobs available.58 The work becomes more stable,safer, more year-round and more profitable. Inthe interviews conducted, fishermen workingunder catch share systems consistently rated theirjob satisfaction significantly higher than it wasunder the previous management system.59
At the same time, it is not hard to find fisher-men or shoreside workers who lost the part-timejobs they held before. In the analyzed fisheries,following LAPP implementation, the absolutenumbers of employment opportunities fell byover half, despite the fact that the amount ofwork stayed constant.60
For workers who find it difficult to compete inthe new labor market, in the words of one fisher-man: “It’s great for the fish; it’s great for the man-agement; it’s great for the economy. It’s horriblefor fishermen.”61 In lightly populated communi-ties heavily dependent on seasonal and part-time
Ensuring Fairness to Fishermen and Communities
* Season lengthcompared to average days
worked in a full-time job
THE MAGNUSON STEVENS ACT instructs federal managers to consider
the impact of their decisions on the well being of the people and communities
that depend on fisheries.56 At the urging of fishermen, and often their elected
representatives, fishery managers go to considerable lengths to preserve exist-
ing fleet structures, landings in particular ports, the use of particular fishing
gears and the viability of shoreside processing — in short, the protection of
jobs and small businesses.
21
labor, such as Alaska, reports suggest that the lossof these jobs can have a major impact.
But, for other fishermen and communities, anincrease to more stable, full-time employment isa welcome change. Employment stabilizedunder LAPPs. If averaged over a year, a typicalcrew position would have provided the equiva-lent of half a day’s work per week before catchshares were introduced. Afterwards, LAPPswould provide over four days of work a weekaveraged over a year. However, total numbers ofcrew positions decreased by half. 62 This changemay have had a similar effect on the nature ofprocessing jobs and other shoreside supportindustries. While it represents a change fromthe current labor structure, there can be signifi-cant benefits. In addition, increased boat yieldsand revenues that accompanied LAPPs, likelytranslate into higher income for fishermen.
Ownership Concentration. Another objec-tive of fishery policy in recent years has been toreduce the problem of overcapacity in fishingfleets. Overcapacity means that fleets havemore fishing power than fish to catch. Excesscapacity fuels the race for fish, makes it harderfor individual fishermen to make a living, andwastes resources.
LAPPs quickly and efficiently solve the overca-pacity problem. In most fisheries, the totalnumber of quota owners dropped, typically by10-25%. While this is expected and necessaryto reduce capacity, a separate issue is ownershipconcentration. There has been concern thatLAPPs might lead to excessive concentration ofshares in the hands of just a few share owners.Excessive concentration is a problem from aneconomic point of view because it can createmonopoly power. It can also be a problem froma societal point of view, if, for example, a fishingcommunity wants to promote widespread own-ership of LAPP shares in the community.
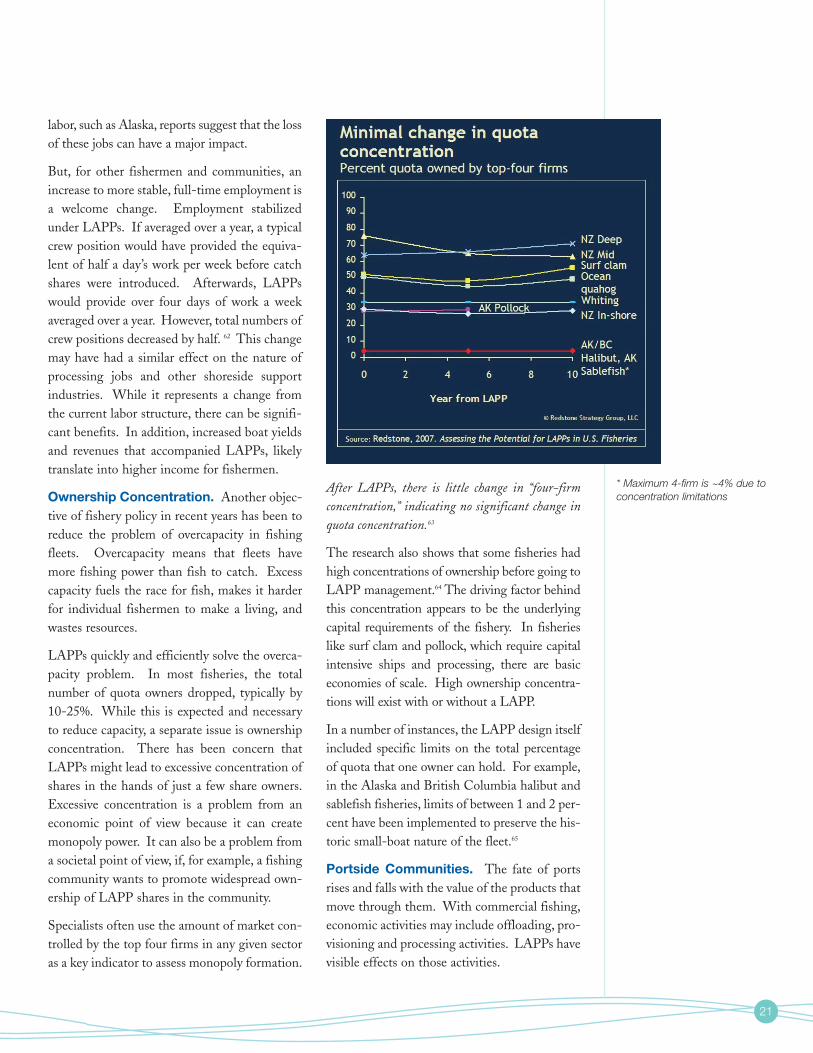
Specialists often use the amount of market con-trolled by the top four firms in any given sectoras a key indicator to assess monopoly formation.
After LAPPs, there is little change in “four-firmconcentration,” indicating no significant change inquota concentration.63
The research also shows that some fisheries hadhigh concentrations of ownership before going toLAPP management.64 The driving factor behindthis concentration appears to be the underlyingcapital requirements of the fishery. In fisherieslike surf clam and pollock, which require capitalintensive ships and processing, there are basiceconomies of scale. High ownership concentra-tions will exist with or without a LAPP.
In a number of instances, the LAPP design itselfincluded specific limits on the total percentageof quota that one owner can hold. For example,in the Alaska and British Columbia halibut andsablefish fisheries, limits of between 1 and 2 per-cent have been implemented to preserve the his-toric small-boat nature of the fleet.65
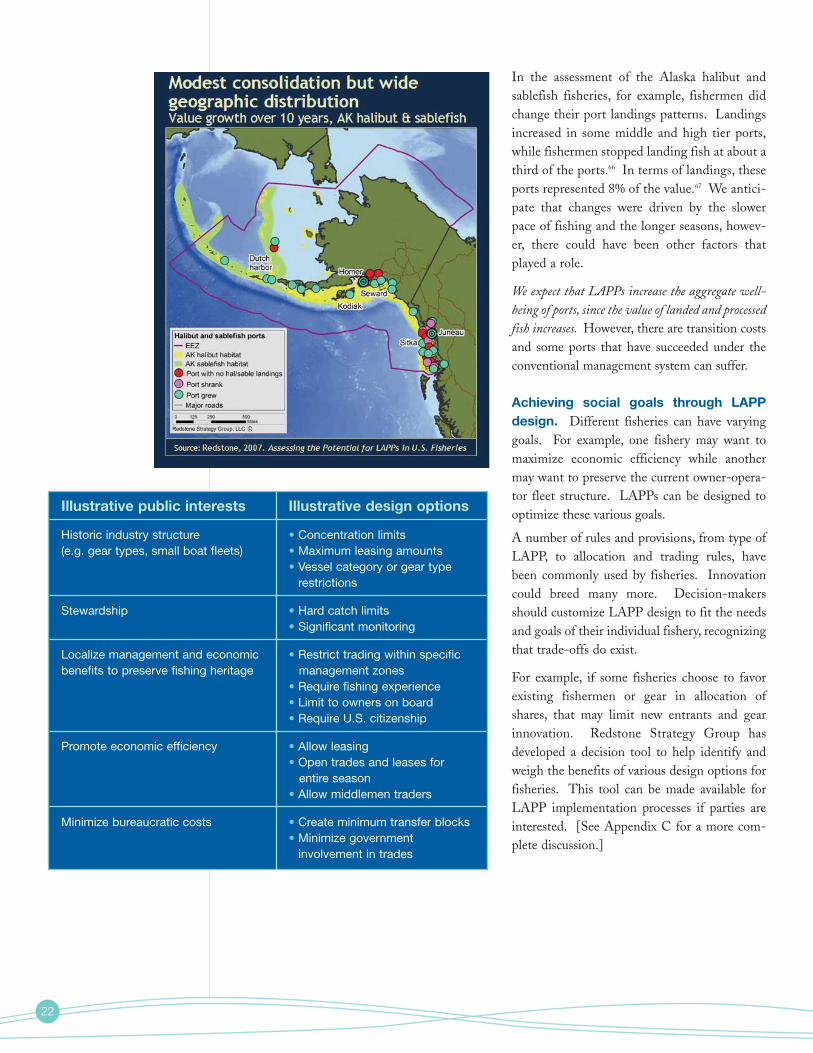
Portside Communities. The fate of portsrises and falls with the value of the products thatmove through them. With commercial fishing,economic activities may include offloading, pro-visioning and processing activities. LAPPs havevisible effects on those activities.
* Maximum 4-firm is ~4% due toconcentration limitations
22
In the assessment of the Alaska halibut andsablefish fisheries, for example, fishermen didchange their port landings patterns. Landingsincreased in some middle and high tier ports,while fishermen stopped landing fish at about athird of the ports.66 In terms of landings, theseports represented 8% of the value.67 We antici-pate that changes were driven by the slowerpace of fishing and the longer seasons, howev-er, there could have been other factors thatplayed a role.
We expect that LAPPs increase the aggregate well-being of ports, since the value of landed and processedfish increases. However, there are transition costsand some ports that have succeeded under theconventional management system can suffer.
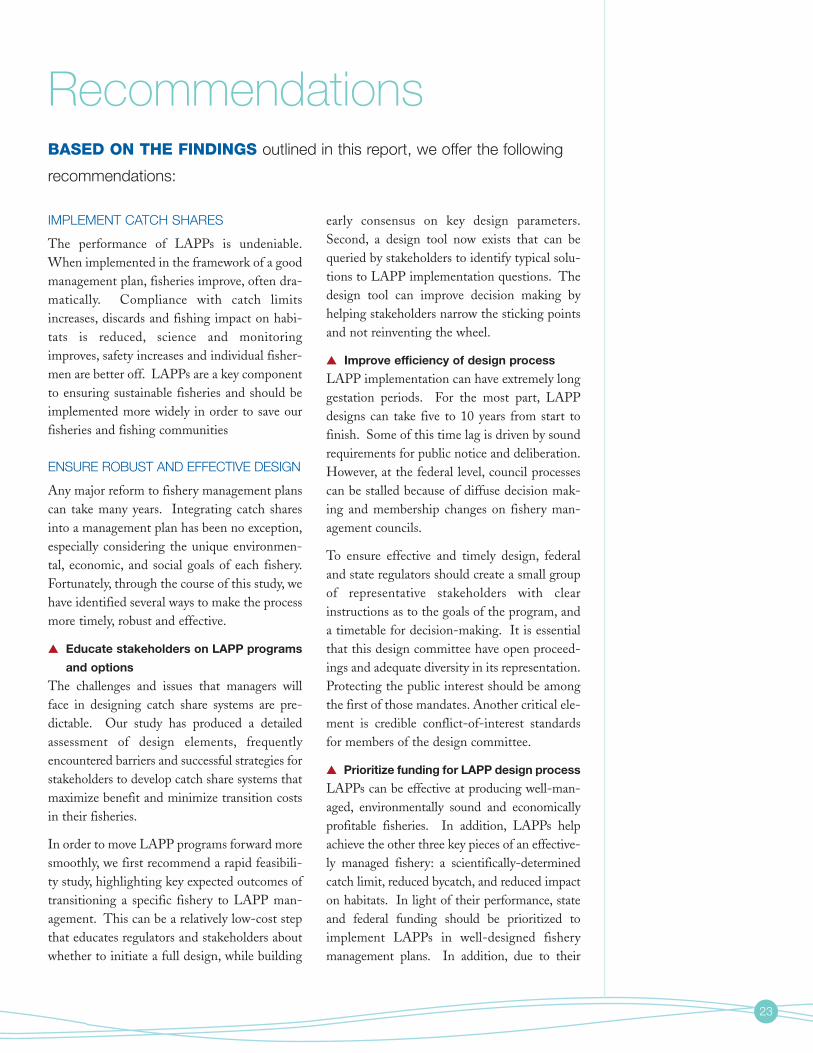
Achieving social goals through LAPPdesign. Different fisheries can have varyinggoals. For example, one fishery may want tomaximize economic efficiency while anothermay want to preserve the current owner-opera-tor fleet structure. LAPPs can be designed tooptimize these various goals.
A number of rules and provisions, from type ofLAPP, to allocation and trading rules, havebeen commonly used by fisheries. Innovationcould breed many more. Decision-makersshould customize LAPP design to fit the needsand goals of their individual fishery, recognizingthat trade-offs do exist.
For example, if some fisheries choose to favorexisting fishermen or gear in allocation ofshares, that may limit new entrants and gearinnovation. Redstone Strategy Group hasdeveloped a decision tool to help identify andweigh the benefits of various design options forfisheries. This tool can be made available forLAPP implementation processes if parties areinterested. [See Appendix C for a more com-plete discussion.]
Illustrative public interests Illustrative design options
Historic industry structure • Concentration limits(e.g. gear types, small boat fleets) • Maximum leasing amounts
• Vessel category or gear typerestrictions
Stewardship • Hard catch limits• Significant monitoring
Localize management and economic • Restrict trading within specific benefits to preserve fishing heritage management zones
• Require fishing experience• Limit to owners on board• Require U.S. citizenship
Promote economic efficiency • Allow leasing• Open trades and leases for
entire season• Allow middlemen traders
Minimize bureaucratic costs • Create minimum transfer blocks• Minimize government
involvement in trades
23
IMPLEMENT CATCH SHARES
The performance of LAPPs is undeniable.When implemented in the framework of a goodmanagement plan, fisheries improve, often dra-matically. Compliance with catch limitsincreases, discards and fishing impact on habi-tats is reduced, science and monitoringimproves, safety increases and individual fisher-men are better off. LAPPs are a key componentto ensuring sustainable fisheries and should beimplemented more widely in order to save ourfisheries and fishing communities
ENSURE ROBUST AND EFFECTIVE DESIGN
Any major reform to fishery management planscan take many years. Integrating catch sharesinto a management plan has been no exception,especially considering the unique environmen-tal, economic, and social goals of each fishery.Fortunately, through the course of this study, wehave identified several ways to make the processmore timely, robust and effective.
▲ Educate stakeholders on LAPP programs
and options
The challenges and issues that managers willface in designing catch share systems are pre-dictable. Our study has produced a detailedassessment of design elements, frequentlyencountered barriers and successful strategies forstakeholders to develop catch share systems thatmaximize benefit and minimize transition costsin their fisheries.
In order to move LAPP programs forward moresmoothly, we first recommend a rapid feasibili-ty study, highlighting key expected outcomes oftransitioning a specific fishery to LAPP man-agement. This can be a relatively low-cost stepthat educates regulators and stakeholders aboutwhether to initiate a full design, while building
early consensus on key design parameters.Second, a design tool now exists that can bequeried by stakeholders to identify typical solu-tions to LAPP implementation questions. Thedesign tool can improve decision making byhelping stakeholders narrow the sticking pointsand not reinventing the wheel.
▲ Improve efficiency of design process
LAPP implementation can have extremely longgestation periods. For the most part, LAPPdesigns can take five to 10 years from start tofinish. Some of this time lag is driven by soundrequirements for public notice and deliberation.However, at the federal level, council processescan be stalled because of diffuse decision mak-ing and membership changes on fishery man-agement councils.
To ensure effective and timely design, federaland state regulators should create a small groupof representative stakeholders with clearinstructions as to the goals of the program, anda timetable for decision-making. It is essentialthat this design committee have open proceed-ings and adequate diversity in its representation.Protecting the public interest should be amongthe first of those mandates. Another critical ele-ment is credible conflict-of-interest standardsfor members of the design committee.
▲ Prioritize funding for LAPP design process
LAPPs can be effective at producing well-man-aged, environmentally sound and economicallyprofitable fisheries. In addition, LAPPs helpachieve the other three key pieces of an effective-ly managed fishery: a scientifically-determinedcatch limit, reduced bycatch, and reduced impacton habitats. In light of their performance, stateand federal funding should be prioritized toimplement LAPPs in well-designed fisherymanagement plans. In addition, due to their
RecommendationsBASED ON THE FINDINGS outlined in this report, we offer the following
recommendations:
24
considerable economic upside, LAPPs offer theopportunity to leverage private capital to aid intheir implementation. Private capital can beapplied in a variety of ways, including financingbuyouts to reduce fishing capacity and lowertransition costs of LAPP management, or aninvestment in the LAPP development processitself. Investments can be repaid through fees onlandings or a share of the wealth increase.
INVEST IN THE FUTURE
We urge stakeholders to see the increase invalue created by catch shares as a way to helpmeet needs including: Helping cover the costsof running catch share systems; improvingdata collection systems to improve the sciencebehind the management; achieving the socialobjectives of particular communities; orincreasing the levels of monitoring, enforce-ment and research.
Stakeholders have a wide range of approaches tochoose from in helping meet these needs,including landings fees; share auctions; fisher-men financing of monitoring; and allocation ofshares to particular ports, communities or fish-ing groups.
Not only does such revenue sharing helpreduce friction; the discussion also helps clar-ify the tradeoffs inherent in various programdesign choices. For example, restricting trad-ing or putting caps on share ownership canreduce changes to the fishery’s post-LAPPownership structure. But it can also decreasefuture profitability, by preventing less efficientfishermen from selling their shares to moreefficient colleagues. This reduced economicgain can translate into fewer funds availablefor other goals.
EMPLOY THOROUGH REVIEW AND PROGRAM ADAPTATION PROCESSES
Catch share programs should be adaptive to regu-larly improve performance of program goals andaddress any new issues that may arise. Thisrequires updated science as well as a robust processfor addressing necessary management changes.
In fact, some LAPPs have performed well in thisregard. For example, the orange roughy LAPPfishery in New Zealand was initially dividedamong participants inappropriately, as fishermenwere provided a dedicated amount to catch ratherthan a proportion of the total catch limit. Assuch, managers were unable to set an annual limitless than the initial total allocation, and the fishpopulations suffered. However, changes to theallocation structure were made when the problemwas identified, and the fishery is now on a recov-ery track. Likewise, regular reviews of the Alaskahalibut/sablefish LAPP fishery by a standingadvisory committee have improved program per-formance. The recently implemented yet contro-versial Alaska crab LAPP is undergoing an earlyreview and is required to have a comprehensivereview at year five, which is likely to lead to sub-stantial program changes.
It is important that all LAPPs be required toundergo strong regular reviews and that any nec-essary changes be made in order to meet programgoals and relevant legal requirements, includingthe National Standards of the Magnuson-StevensFishery Conservation and Management Act(MSA). NOAA Fisheries should provide clearinstructions on program reviews. At the sametime, program designers need to be careful not toconstantly change programs, since participantsneed some certainty and longevity of programstructure in order for them to reap the economicbenefits of conservation.
25
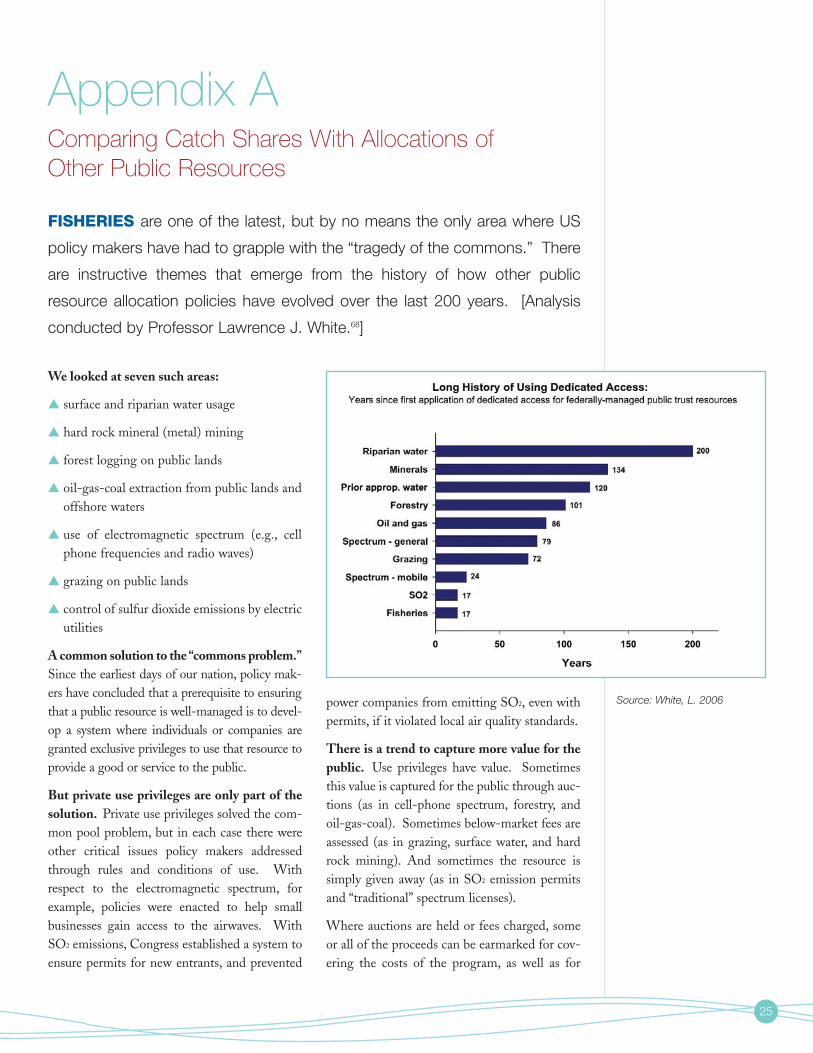
We looked at seven such areas:
▲ surface and riparian water usage
▲ hard rock mineral (metal) mining
▲ forest logging on public lands
▲ oil-gas-coal extraction from public lands andoffshore waters
▲ use of electromagnetic spectrum (e.g., cellphone frequencies and radio waves)
▲ grazing on public lands
▲ control of sulfur dioxide emissions by electricutilities
A common solution to the “commons problem.”Since the earliest days of our nation, policy mak-ers have concluded that a prerequisite to ensuringthat a public resource is well-managed is to devel-op a system where individuals or companies aregranted exclusive privileges to use that resource toprovide a good or service to the public.
But private use privileges are only part of thesolution. Private use privileges solved the com-mon pool problem, but in each case there wereother critical issues policy makers addressedthrough rules and conditions of use. Withrespect to the electromagnetic spectrum, forexample, policies were enacted to help smallbusinesses gain access to the airwaves. WithSO2 emissions, Congress established a system toensure permits for new entrants, and prevented
power companies from emitting SO2, even withpermits, if it violated local air quality standards.
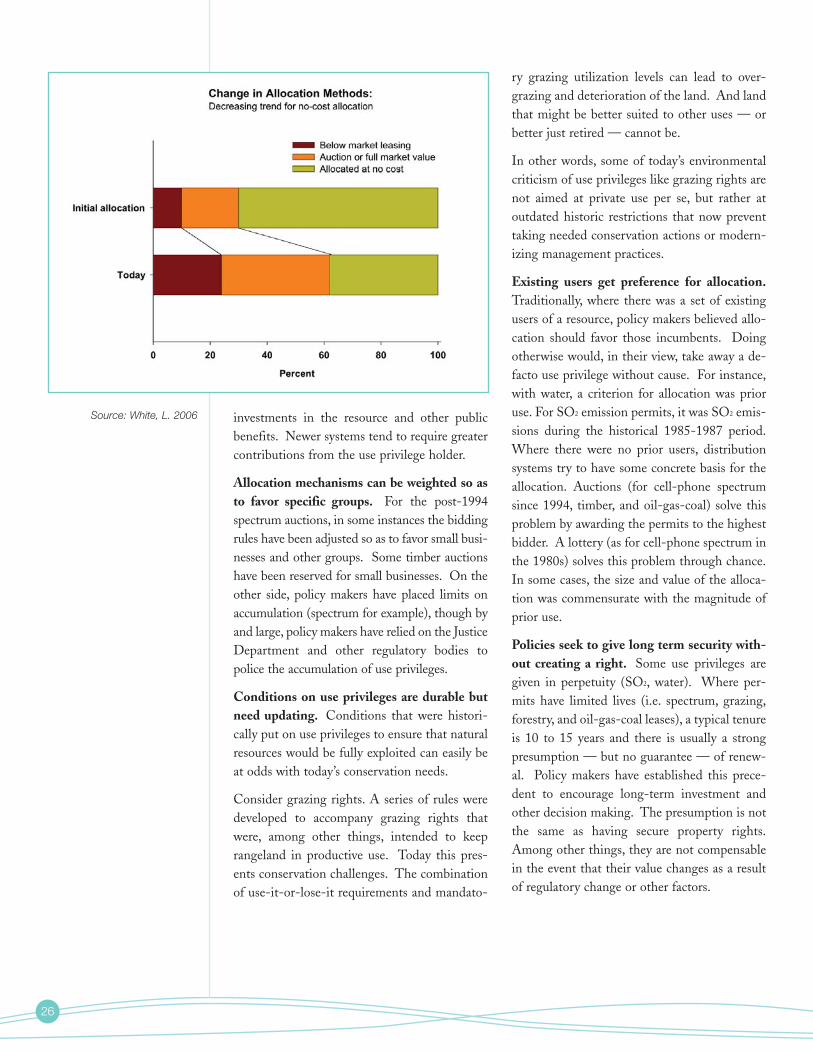
There is a trend to capture more value for thepublic. Use privileges have value. Sometimesthis value is captured for the public through auc-tions (as in cell-phone spectrum, forestry, andoil-gas-coal). Sometimes below-market fees areassessed (as in grazing, surface water, and hardrock mining). And sometimes the resource issimply given away (as in SO2 emission permitsand “traditional” spectrum licenses).
Where auctions are held or fees charged, someor all of the proceeds can be earmarked for cov-ering the costs of the program, as well as for
Appendix AComparing Catch Shares With Allocations of Other Public Resources
FISHERIES are one of the latest, but by no means the only area where US
policy makers have had to grapple with the “tragedy of the commons.” There
are instructive themes that emerge from the history of how other public
resource allocation policies have evolved over the last 200 years. [Analysis
conducted by Professor Lawrence J. White.68]
Source: White, L. 2006
26
investments in the resource and other publicbenefits. Newer systems tend to require greatercontributions from the use privilege holder.
Allocation mechanisms can be weighted so asto favor specific groups. For the post-1994spectrum auctions, in some instances the biddingrules have been adjusted so as to favor small busi-nesses and other groups. Some timber auctionshave been reserved for small businesses. On theother side, policy makers have placed limits onaccumulation (spectrum for example), though byand large, policy makers have relied on the JusticeDepartment and other regulatory bodies topolice the accumulation of use privileges.
Conditions on use privileges are durable butneed updating. Conditions that were histori-cally put on use privileges to ensure that naturalresources would be fully exploited can easily beat odds with today’s conservation needs.
Consider grazing rights. A series of rules weredeveloped to accompany grazing rights thatwere, among other things, intended to keeprangeland in productive use. Today this pres-ents conservation challenges. The combinationof use-it-or-lose-it requirements and mandato-
ry grazing utilization levels can lead to over-grazing and deterioration of the land. And landthat might be better suited to other uses — orbetter just retired — cannot be.
In other words, some of today’s environmentalcriticism of use privileges like grazing rights arenot aimed at private use per se, but rather atoutdated historic restrictions that now preventtaking needed conservation actions or modern-izing management practices.
Existing users get preference for allocation.Traditionally, where there was a set of existingusers of a resource, policy makers believed allo-cation should favor those incumbents. Doingotherwise would, in their view, take away a de-facto use privilege without cause. For instance,with water, a criterion for allocation was prioruse. For SO2 emission permits, it was SO2 emis-sions during the historical 1985-1987 period.Where there were no prior users, distributionsystems try to have some concrete basis for theallocation. Auctions (for cell-phone spectrumsince 1994, timber, and oil-gas-coal) solve thisproblem by awarding the permits to the highestbidder. A lottery (as for cell-phone spectrum inthe 1980s) solves this problem through chance.In some cases, the size and value of the alloca-tion was commensurate with the magnitude ofprior use.
Policies seek to give long term security with-out creating a right. Some use privileges aregiven in perpetuity (SO2, water). Where per-mits have limited lives (i.e. spectrum, grazing,forestry, and oil-gas-coal leases), a typical tenureis 10 to 15 years and there is usually a strongpresumption — but no guarantee — of renew-al. Policy makers have established this prece-dent to encourage long-term investment andother decision making. The presumption is notthe same as having secure property rights.Among other things, they are not compensablein the event that their value changes as a resultof regulatory change or other factors.
Source: White, L. 2006
27
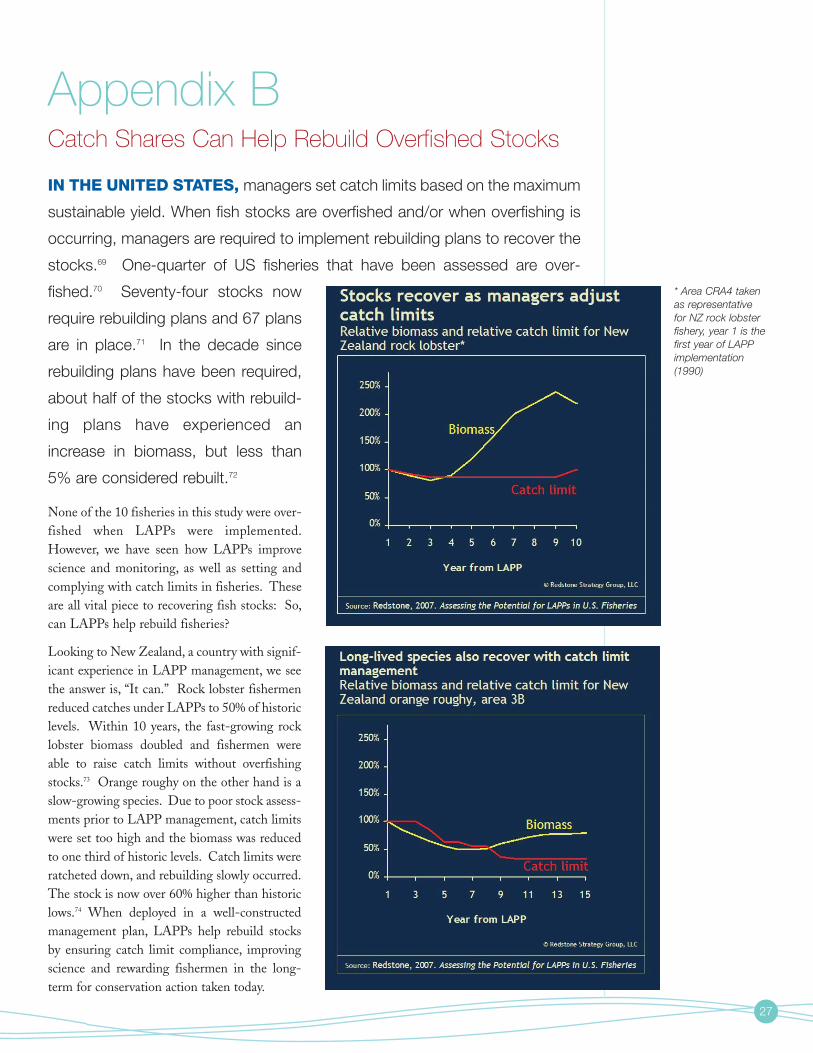
None of the 10 fisheries in this study were over-fished when LAPPs were implemented.However, we have seen how LAPPs improvescience and monitoring, as well as setting andcomplying with catch limits in fisheries. Theseare all vital piece to recovering fish stocks: So,can LAPPs help rebuild fisheries?
Looking to New Zealand, a country with signif-icant experience in LAPP management, we seethe answer is, “It can.” Rock lobster fishermenreduced catches under LAPPs to 50% of historiclevels. Within 10 years, the fast-growing rocklobster biomass doubled and fishermen wereable to raise catch limits without overfishingstocks.73 Orange roughy on the other hand is aslow-growing species. Due to poor stock assess-ments prior to LAPP management, catch limitswere set too high and the biomass was reducedto one third of historic levels. Catch limits wereratcheted down, and rebuilding slowly occurred.The stock is now over 60% higher than historiclows.74 When deployed in a well-constructedmanagement plan, LAPPs help rebuild stocksby ensuring catch limit compliance, improvingscience and rewarding fishermen in the long-term for conservation action taken today.
Appendix BCatch Shares Can Help Rebuild Overfished Stocks
IN THE UNITED STATES, managers set catch limits based on the maximum
sustainable yield. When fish stocks are overfished and/or when overfishing is
occurring, managers are required to implement rebuilding plans to recover the
stocks.69 One-quarter of US fisheries that have been assessed are over-
fished.70 Seventy-four stocks now
require rebuilding plans and 67 plans
are in place.71 In the decade since
rebuilding plans have been required,
about half of the stocks with rebuild-
ing plans have experienced an
increase in biomass, but less than
5% are considered rebuilt.72
* Area CRA4 takenas representativefor NZ rock lobsterfishery, year 1 is thefirst year of LAPPimplementation(1990)
28
Recognizing these challenges, Redstone devel-oped a design tool that identifies options forLAPP design based on past experience and candi-date fishery characteristics. The tool is designed tocomplement the appropriate Council process. Itdoes not identify the right answer, but it does layout options for an effective design. The tool canbe a powerful and appropriate way to streamlinedecision-making; identify, organize and narrowoptions; and illuminate potential trade-offs.
The tool is comprised of five design elements:LAPP form, Allocation, Monitoring, Socio-economic Regulations, and EnvironmentalRegulations. For each design element there area number of historically-used design options.
For any fishery, quantitative and qualitative datais collected on over 50 characteristics, which arethen used to inform a design recommendation.Significant data have already been collected for76 U.S. fisheries. For each design element, aselect number of characteristics contribute todetermining options for consideration.
The tool is driven by the past experience ofLAPP implementation and informed by fish-eries that are currently in progress. The charac-
teristics are given an applicability score based onnecessary conditions for certain design ele-ments, as well as common “best practices” usedin the other 10 LAPP implementations. Theapplicability of each design element is comparedto the other design elements and the one thathas the highest applicability score is reportedout by the design tool. In some cases, morethan one may be reported out.
The tool runs through this framework for eachdesign element. Some are more complicated.For example, the monitoring section estimateshow much each monitoring type will cost andidentifies the most effective, least cost option.The design tool also seeks to identify trade-offsbetween certain trading rules, such as concentra-tion limits, and the ability for a fishery to pay foran effective level of monitoring. In this way, thetool can help decision-makers understand designtrade-offs and make informed decisions.
Fishery managers should work in conjunctionwith the tool developers to understand the tool,groundtruth and update fishery informationand ultimately identify a timely, well-informed,decision about the best design of a LAPP.
Appendix CA Design Tool for Fishery Managers
RESEARCH of past LAPP implementation and extensive interviews with stake-
holders determined that LAPP implementation is both challenging and time-con-
suming. Many of the challenges center on getting a good design in a timely man-
ner. For example, the Gulf of Mexico Fishery Management Council took approx-
imately 10 years to design and implement an IFQ program for red snapper.
29
While the opinions expressed in this paper aresolely those of Environmental Defense, the reportdraws heavily on selected findings from a recent-ly-completed study conducted by RedstoneStrategy Group, LLC that was commissioned byEnvironmental Defense and completed in part-nership with the Gordon and Betty MooreFoundation. The conclusions from that study areavailable in separate documentation at www.red-stonestrategy.com/nonprofit/publications.Professor Lawrence White, New York University,conducted the analysis of public resources alloca-tion.75 The full paper can be found at:http://w4.stern.nyu.edu/emplibrar y/6-18_White.pdf
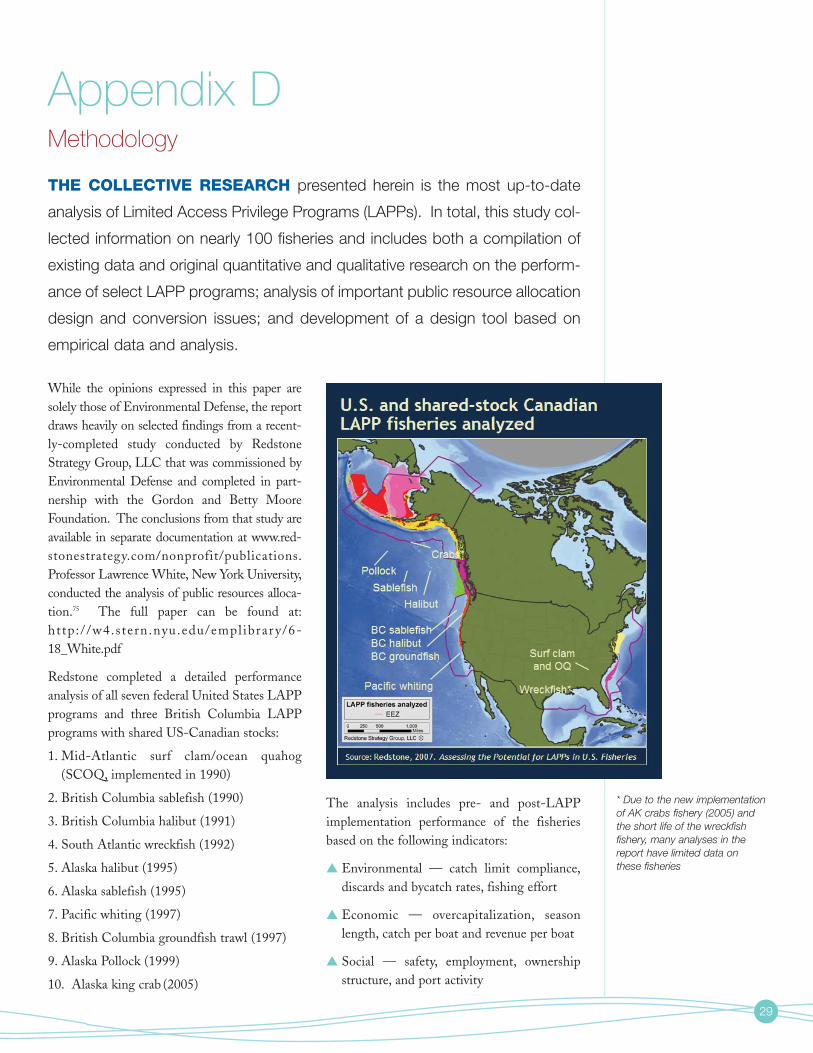
Redstone completed a detailed performanceanalysis of all seven federal United States LAPPprograms and three British Columbia LAPPprograms with shared US-Canadian stocks:
1. Mid-Atlantic surf clam/ocean quahog(SCOQ, implemented in 1990)
2. British Columbia sablefish (1990)
3. British Columbia halibut (1991)
4. South Atlantic wreckfish (1992)
5. Alaska halibut (1995)
6. Alaska sablefish (1995)
7. Pacific whiting (1997)
8. British Columbia groundfish trawl (1997)
9. Alaska Pollock (1999)
10. Alaska king crab (2005)
The analysis includes pre- and post-LAPPimplementation performance of the fisheriesbased on the following indicators:
▲ Environmental — catch limit compliance,discards and bycatch rates, fishing effort
▲ Economic — overcapitalization, seasonlength, catch per boat and revenue per boat
▲ Social — safety, employment, ownershipstructure, and port activity
Appendix DMethodology
* Due to the new implementationof AK crabs fishery (2005) andthe short life of the wreckfishfishery, many analyses in thereport have limited data onthese fisheries
THE COLLECTIVE RESEARCH presented herein is the most up-to-date
analysis of Limited Access Privilege Programs (LAPPs). In total, this study col-
lected information on nearly 100 fisheries and includes both a compilation of
existing data and original quantitative and qualitative research on the perform-
ance of select LAPP programs; analysis of important public resource allocation
design and conversion issues; and development of a design tool based on
empirical data and analysis.
30
For some indicators, indices were developed tocondense and compare varying informationwithin each fishery. For example, safety is anindex based on a compilation of fatalities, searchand rescue missions and other information.
To evaluate performance, Redstone analyzedover 150 sources of data including reports,books, studies, GIS data and raw data, and con-ducted three in-depth case studies (Mid-Atlantic surf clam ocean quahog IndividualTransferable Quota program, British Columbiagroundfish trawl Individual Vessel Quota pro-gram and Georges Bank cod hook sector), gath-ering quantitative and qualitative data on LAPPperformance. Redstone analyzed performanceof fisheries 5 years prior to LAPP implementa-tion, 1 year prior to implementation, and 5 yearsafter implementation, capturing the trends offisheries leading up to and following the LAPP.The results highlighted in this report are aver-ages of all fisheries. Alaska crab is not includedin the post-LAPP analysis because of the new-ness of the program and lack of available data.However, Environmental Defense has commis-sioned a review of the Alaska crab program byPhil Smith that will assess many of the sameperformance indicators outlined in this study.
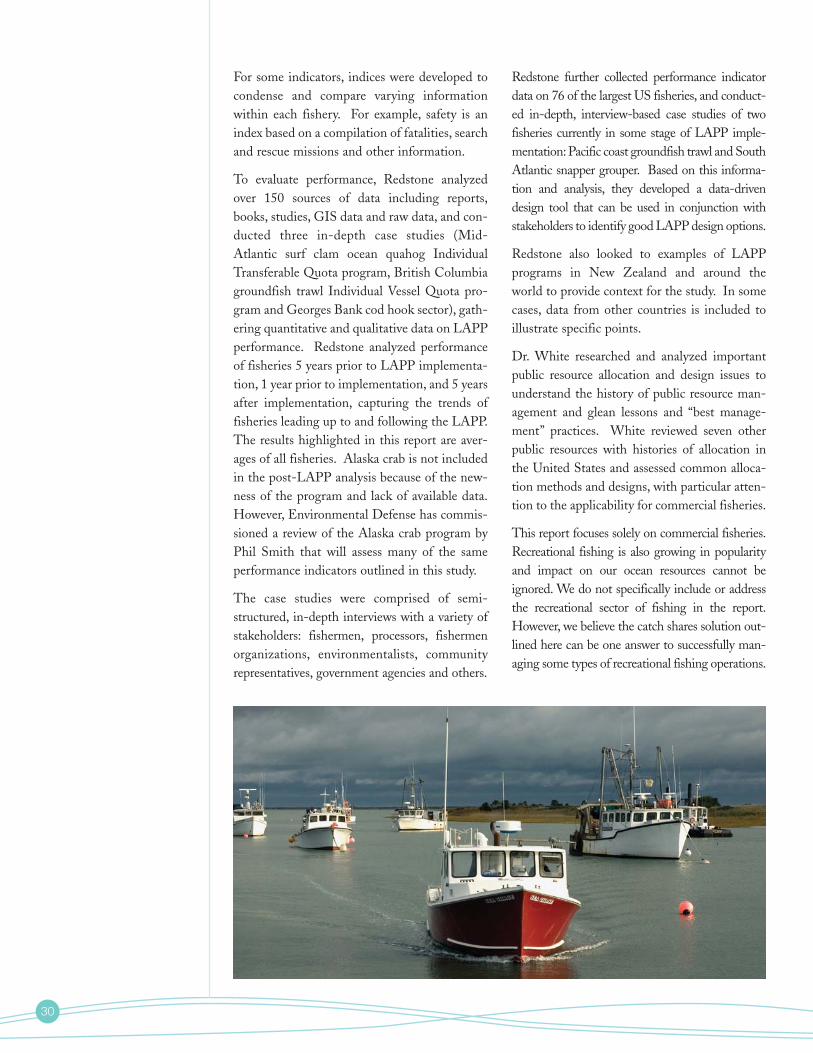
The case studies were comprised of semi-structured, in-depth interviews with a variety ofstakeholders: fishermen, processors, fishermenorganizations, environmentalists, communityrepresentatives, government agencies and others.
Redstone further collected performance indicatordata on 76 of the largest US fisheries, and conduct-ed in-depth, interview-based case studies of twofisheries currently in some stage of LAPP imple-mentation: Pacific coast groundfish trawl and SouthAtlantic snapper grouper. Based on this informa-tion and analysis, they developed a data-drivendesign tool that can be used in conjunction withstakeholders to identify good LAPP design options.
Redstone also looked to examples of LAPPprograms in New Zealand and around theworld to provide context for the study. In somecases, data from other countries is included toillustrate specific points.
Dr. White researched and analyzed importantpublic resource allocation and design issues tounderstand the history of public resource man-agement and glean lessons and “best manage-ment” practices. White reviewed seven otherpublic resources with histories of allocation inthe United States and assessed common alloca-tion methods and designs, with particular atten-tion to the applicability for commercial fisheries.
This report focuses solely on commercial fisheries.Recreational fishing is also growing in popularityand impact on our ocean resources cannot beignored. We do not specifically include or addressthe recreational sector of fishing in the report.However, we believe the catch shares solution out-lined here can be one answer to successfully man-aging some types of recreational fishing operations.
31
1 NOAA Fisheries. February 2, 2007. Seafood con-sumption declines slightly in 2005. [online].ww.nmfs.noaa.gov/mediacenter/
2 Worm, B., Barbier, E.B., Beaumont, N., Duffy, J.E.,Folke, C., Halpern B.S., Jackson, J.B., Lotze, H.K.,Micheli, F., Palumbi, S.R., Sala, E., Selkoe, K.A.,Stachowicz, J.J. and R. Watson. 2006. “Impacts ofbiodiversity loss on ocean ecosystem services”. Science314: 787-790
3 Myers, R. A. and B. Worm. 2003. “Rapid world-wide depletion of predatory fish communities”.Nature 423: 280-283.
4 NOAA Fisheries. 2007. Status of Fisheries 2005.[online]. http://www.nmfs.noaa.gov/sfa/statusoff-isheries/SOSmain.htm
5 NOAA Fisheries. June 20, 2006. Councils inAction: Steps taken for stocks that were determined tobe overfished or subject to overfishing in 2005.[online]. http://www.nmfs.noaa.gov/mediacenter/
6 U.S. Commission on Ocean Policy. 2004. AnOcean Blueprint for the 21st Century. Final Report.Washington, DC. pp.522
7 U.S. Commission on Ocean Policy. 2004. AnOcean Blueprint for the 21st Century. Final Report.Washington, DC. pp.522.
8 U.S. Commission on Ocean Policy. 2004. An OceanBlueprint for the 21st Century. Final Report.Washington, DC. pp. 288
9 Report of the Commission on Marine Science,Engineering and Resources (Stratton CommissionReport). 1969. Our Nation and the Sea. A Plan forNational Action. United States GovernmentPrinting Office. Washington, D.C. pp.305.
10 Originally enacted as the Magnuson FisheryConservation and Management Act, P.L. 94-265.April 1976.
11 Magnuson-Stevens Fishery Conservation andManagement Act. 16 U.S.C. 1801 et. seq
12 International Pacific Halibut Commission.1991. Annual Report 1990. Seattle, WA.[online]. http://www.iphc.washington.edu/hal-com/pubs/annrep/ar1991.pdf
13 Hardin, G. 1968. “The tragedy of the com-mons”. Science 162:1243-1248.
14 National Research Council. 1999. Sharing theFish: Toward a National Policy on Individual FishingQuotas. National Academy Press. Washington,DC. pp. 422.
15 NOAA Fisheries. 2007. Status of Fisheries 2005.[online]. http://www.nmfs.noaa.gov/sfa/statu-soffisheries/SOSmain.htm
16 NOAA Fisheries. 2007. Status of Fisheries 2005.[online]. http://www.nmfs.noaa.gov/sfa/statu-soffisheries/SOSmain.htm
17 Magnuson-Stevens Fishery Conservation andManagement Act. 16 U.S.C. 1801 et. seq.
18 Marine Fish Conservation Network. 2004.Individual Fishing Quotas: Environmental,Public Trust, and Socioeconomic Impacts. [online].http://www.fairifqs.org/media/ifqwhitepaper_lowres.pdf
19 Redstone Strategy Group, LLC, 2007. Assessing thePotential for LAPPS in U.S. Fisheries. Available:www.redstonestrategy.com/nonprofit/publications
20 Redstone 2007
21 Redstone 2007
22 Redstone 2007
23 Redstone 2007
24 Magnuson-Stevens Fishery Conservation andManagement Act. 16 U.S.C. 1801 et. seq.
25 NOAA Fisheries. Commerce Secretary DaleyAnnounces West Coast Groundfish Fishery Failure.June 20, 2006. [online] http://www.publicaffairs.noaa.gov/releases2000/jan00/noaa00r103.html
26 Dalton, Penelope. January 19, 2000. Testimony toSenate Subcommittee on Oceans and Fisheries.[online] http://www.ogc.doc.gov/ogc/legreg/tes-timon/106s/dalton0119.htm
27 Redstone 2007
28 Redstone 2007
29 Redstone 2007
30 Estimated fish saved each year is 596,400 metrictons. Redstone 2007
31 Annual per capita consumption of seafood byAmericans was 16.2 pounds in 2005. NOAA Fish-eries. February 2, 2007. Seafood consumption declinesslightly in 2005. [online] ww.nmfs.noaa.gov/media-center/
32 Pew Oceans Commission. 2003. America’s LivingOceans: Charting a Course for Sea Change. A Reportto the Nation. Arlington, VA. pp.144.
33 Alverson, D.L., Freeberg, M.K., Murawski, S.A.,and J.G. Pope. 1994. “A global assessment of fish-eries bycatch and discards.” FAO FisheriesTechnical Paper No. 339. Rome.
End Notes
32
34 Harrington, J.M., Myers, R.A., and A. Rosenberg.2005. “Wasted fishery resources: discarded by-catch in the USA.” Fish and Fisheries 6: 350-361.
35 Redstone 2007
36 Redstone 2007
37 Redstone 2007
38 Redstone 2007
39 Redstone 2007
40 Redstone 2007
41 M. F., Fujioka, J. T., and Lowe, S. A. 2001.“Alaska Sablefish Assessment for 2001.” [online]http://209.112.168.2/npfmc/SAFE/2000/9sable.bsa.pdf
42 Calculated based on number of hooks deployed andcatch per year. NOAA Fisheries. Annual CommercialLandings Statistics. [online] http://www.st.nmfs.gov/st1/commercial/landings/annual_landings.html
43 Redstone 2007
44 Mode, N.A., Wopat, P., and Conway, G.A., eds.2006. Proceedings of the Second InternationalFishing Industry Safety and Health Conference.Sitka, AK, September 22-24, 2003. [online].http://www.cdc.gov/niosh/docs/2006-114/
45 Median fisherman wage in 2005 was $25,130(http//bls.gov/oes/current/oes453011.htm) andmedian male wage in 2005 was $34,926(http//pubdb3.census.gov/macro/032006/pernic/new10_002.htm)
46 Redstone 2007
47 Redstone 2007
48 Redstone 2007
49 Woodley, Lt. C. 2003. “Quota-based FisheryManagement Regimes.” Proceedings of the Inter-national Fishing Industry Safety and HealthConference. Woods Hole, MA, October 23-35,2000. [online]. http://www.cdc.gov/niosh/docs/2003-102/2003102pd.html
50 Redstone 2007
51 Redstone 2007
52 Calculated from: Fujita R, Bonzon K, Wilen J, et al.Rationality or Chaos? Global Fisheries at a Crossroadsin Defying Oceans End: An Agenda for Action,ed: Glover L and Earle S. Island Press, 2004.
53 Redstone 2007
54 Redstone 2007
55 Redstone 2007
56 Magnuson-Stevens Fishery Conservation andManagement Act. 16 U.S.C. 1801 et. seq
57 Redstone 2007
58 Redstone 2007
59 Redstone 2007
60 Redstone 2007
61 Childers, Hoyt. Feb 2007. “Quotas Down Under.”National Fisherman: 26-27, 54.
62 Redstone 2007
63 Redstone 2007
64 Redstone 2007
65 Redstone 2007
66 Redstone 2007
67 Redstone 2007
68 White, Lawrence J. “The Fishery as a WateryCommons: Lessons from the Experiences of OtherPublic Policy Areas for US Fisheries Policy,”Working Paper EC-06-18, Stern School ofBusiness, N.Y.U. [online]. http://w4.stern.nyu.edu/emplibrary/6-18_White.pdf
69 Magnuson-Stevens Fishery Conservation andManagement Act. 16 U.S.C. 1801 et. seq.
70 NOAA Fisheries. June 20, 2006. Councils inAction: Steps taken for stocks that were determined tobe overfished or subject to overfishing in 2005.[online]. http://www.nmfs.noaa.gov/mediacenter/
71 Rosenberg, A., J. Swasey, and M. Bowman. 2006.“Rebuilding US fisheries: progress and prob-lems”. Front. Ecol. Environ. 4(6): 303-308.
72 Rosenberg, A., J. Swasey, and M. Bowman. 2006.“Rebuilding US fisheries: progress and prob-lems”. Front. Ecol. Environ[0]. 4(6): 303-308.
73 Redstone 2007
74 Redstone 2007
75 White, Lawrence J. “The Fishery as a WateryCommons: Lessons from the Experiences of OtherPublic Policy Areas for US Fisheries Policy,”Working Paper EC-06-18, Stern School ofBusiness, N.Y.U. http://w4.stern.nyu.edu/emplibrary/6-18_White.pdf
Report by Op-Ad Media, www.op-ad.comEdited by Art Siverman. Designed by Michael Molanphy.
Cover: Center photo courtesy of João M. Gonçalves; photo at right courtesyof NOAA Photobank. Photo on page 6 courtesy of NOAA Photobank.Photo on page 30 courtesy of Tim Connor
257 Park Avenue South, New York, NY 10010 • www.environmentaldefense.orgAustin • Boston • Boulder • Los Angeles • New York • Oakland • Raleigh • Washington
Project offices: Los Angeles • Sacramento • Beijing