Sustainable Urban Transport and Land Use Patterns for More ...
56
Sustainable Urban Transport and Land Use Patterns for More Sustainable Cities in Australia: Some Key Policy Implications from An International Comparative Study A Submission to The House of Representatives Standing Committee on Environment and Heritage Inquiry into Sustainable Cities 2025 by Jeff Kenworthy Associate Professor in Sustainable Settlements Institute for Sustainability and Technology Policy Murdoch University, Perth Western Australia
Transcript of Sustainable Urban Transport and Land Use Patterns for More ...

Sustainable Urban Transport and Land Use Patternsfor More Sustainable Cities in Australia: Some Key Policy
Implications from An International Comparative Study
A Submission to The House of Representatives StandingCommittee on Environment and Heritage Inquiry into
Sustainable Cities 2025by
Jeff KenworthyAssociate Professor in Sustainable Settlements
Institute for Sustainability and Technology PolicyMurdoch University, Perth
Western Australia

2
INTRODUCTION
Urban transport and the issue of motorisation or “automobile dependence” have become criticalshaping factors in the future sustainability and livability of all cities. North American and Australiancities bear the strong imprint of the car in every aspect of their form and function, beingcharacterised by sprawling low density patterns of development that are highly dependent upon thecar. However, on a global scale land use and transport patterns in cities vary considerably. Withincities too, urban development patterns can be sprawling or more compact depending, for example,upon whether large freeways or public transport systems lead urban development and whether theplanning system encourages consolidation of development around transit. These patterns of urbandevelopment have significant implications for water management, land available for food productionclose to cities and access to quality open space. These implications are not limited to the physicalenvironment, but extend to social factors such as equitable access to affordable transport, severanceof neighbourhoods and social isolation in remote, low density environments. Economic impactsinclude land lost to non-productive urban sprawl and bitumen, congestion costs, transport deaths andso forth (Newman and Kenworthy, 1999).
Analysts and policy makers in all cities need access to high quality, reliable urban data with which tohelp assess these important issues in cities. In particular, they need to be able to judge their presenttransport and urban development position, to understand the key factors that lie behind this situationand the main areas that need concerted policy attention.
This submission attempts to provide a summary of the implications and policy ramifications of theMillennium Cities Database for Sustainable Transport (Kenworthy and Laube 2001), for theAustralian Federal Government’s “Sustainable Cities 2025” inquiry. This database containscomparative data on a wide range of land use, transport, economic and environmental variables for100 cities worldwide, which are listed by region in Table 1. This submission presents the overallresults of an analysis of the database, exploring a wide range of questions related to relationshipsbetween different urban factors and their policy implications. The submission does not attempt topresent the actual detailed statistical results upon which the implications and policy conclusions arebased. These detailed results can be found in an unpublished work by the author from 2001 entitled“Insights into Some Key Transport and Land Use Policy Questions in Cities: A Statistical Analysisof the Millennium Cities Database for Sustainable Transport”.
The thrust of this submission focuses on Objective 5, which is to “develop sustainable transportnetworks, nodal complementarity and logistics.” It also has significant implications for otherobjectives outlined for the inquiry such as Objective 7, which is to “provide urban plans thataccommodate lifestyle and business opportunities”. Its findings are of central relevance to the overallobjectives of the Sustainable Cities 2025 Inquiry.
The Millennium Cities Database for Sustainable Transport was compiled over 3 years byKenworthy and Laube for the International Union (Association) of Public Transport (UITP) inBrussels. The database contains data on 69 primary variables, which depending on the city and theadministrative complexity and multi-modality of its public transport system, can mean up to 175primary data entries. The methodology of data collection for all the factors was strictly controlled byagreed upon definitions contained in a booklet of over 100 pages and data were carefully checkedand verified before being accepted into the database. A detailed discussion of methodology is notpossible in this submission.

3
From this complex range of primary factors, some 230 standardised variables have been calculated.Cities can thus be compared across the areas of land use, private, public and collective transportperformance, overall mobility and modal split, private and public transport infrastructure, theeconomics of urban transport (operating and investment costs, revenues), energy and environmentalfactors. The data are for the year 1995. Data collection on these cities commenced in 1998 and wasonly completed at the end of 2000. At this point, data for 1995 provides the latest perspective onecan reasonably expect for a study of this magnitude.
The list of primary data items that were collected for the study is provided in Appendix 1. Althougha detailed account of the study’s methodology is not possible here, Appendix 2 does containdefinitions of most of the primary data items, including metropolitan area and CBD definitions forall the higher income cities, which are the focus of this submission. Appendix 3 provides thestandardised variables calculated from these primary data items. Appendix 4 provides a quantitativesummary of some of the key standardised factors examined in the study and averaged for each of theeleven major regions used in the study (both high and low income cities). This allows the reader togain a sense of the key differences that exist between cities in different parts of the world in terms ofthe sustainability of their transport systems.
The results presented in this submission are framed around gaining insights into certain key policyissues in urban transport, in higher income cities. Separate analyses were done for the much poorercities in the overall study and are available from the author but are not generally reported on herebecause of the focus of the enquiry on Australian cities. Appendix 4, as has already been said,provides summary data on key factors for all groups of cities. These data help to highlight howdifferent the lower income cities are from the wealthier cities in more developed parts of the world.
The discussion in this submission therefore confines itself chiefly to cities in Australia and NewZealand, the USA, Canada, Western Europe and the higher income cities of Asia (see Table 1 for thecities that were included). Of the 100 cities in the study, full data were collected for 84 cities (58higher income cities and 26 lower income cities) and it is these cities that have been used in theanalysis from which conclusions are drawn. Cities marked with an asterisk in Table 1 are the citiesfor which full data were collected.
The results of the statistical analysis suggest a series of implications for land use, transport,infrastructure, economic, and environmental issues in cities, which are of direct relevance to theterms of reference of the Sustainable Cities 2025 inquiry. All the implications reported in thissummary have a statistical significance of 5% or better. From these implications flow a range ofrecommended urban policies that are presented in this summary. The special value in these policyrecommendations is that they are backed up by the world’s most detailed and extensive database ontransport and land use ever developed for such a wide range of cities worldwide.
The author has many other already published books, papers and book chapters which describe inmore detail how the policies discussed below have been enacted in cities around the world.Accompanying this work, the author also has a rich resource of visual material from many citiesshowing the positive results for the urban environment of reducing automobile dependence anddeveloping more around public transport, walking and cycling.

4
WESTERNEUROPE
WESTERNEUROPE
HIGH INCOMEASIA
US/CANADA
USAGraz * Milan * Osaka * Atlanta *Vienna * Bologna * Sapporo * Chicago *Brussels * Rome * Tokyo * Denver *Copenhagen * Turin Hong Kong * Houston *Helsinki * Amsterdam * Singapore * Los Angeles *Lille Oslo * Taipei * New York *Lyon * Lisbon Phoenix *Nantes * Barcelona * AUST/NZ San Diego *Paris * Madrid * Brisbane * S. Francisco *Marseilles * Stockholm * Melbourne * Washington *Berlin * Bern * Perth *Frankfurt * Geneva * Sydney * CANADAHamburg * Zurich * Wellington * Calgary *Dusseldorf * London * Montreal *Munich * Manchester * Ottawa *Ruhr * Newcastle * Toronto *Stuttgart * Glasgow * Vancouver *Athens *LOW INCOMEASIA
LATINAMERICA
AFRICA EASTERNEUROPE
SE/E ASIAManila * Buenos Aires Abidjan Prague *Bangkok * Rio de Janeiro Casablanca Budapest *Mumbai * Curitiba * Dakar * Krakow *Chennai * Sao Paulo * Cape Town * WarsawNew Delhi Brasilia Johannesburg * MoscowKuala Lumpur * Salvador Harare * IstanbulJakarta * SantiagoSeoul * Bogota * MIDDLE EASTHo Chi Minh City * Mexico City Tel Aviv *
Caracas Teheran *CHINA Riyadh *Beijing * Cairo *Shanghai * Tunis *Guangzhou *
Table 1. Cities represented in the Millennium Cities Database forSustainable Transport by Region.

5
IMPLICATIONS OF THE “MILLENNIUM CITIES DATABASE FORSUSTAINABLE TRANSPORT” FOR THE “SUSTAINABLE CITIES 2025”INQUIRY
(1) URBAN FORM AND URBAN TRANSPORT PATTERNS
Urban form and its relationship to urban transport is widely debated in urban policy circles. Urban formemerges in this study as a critical factor in understanding urban transport patterns. The urban form factorsof urban density, job density and proportion of jobs in the CBD of cities have the clearest and strongestrelationships to urban transport patterns of all factors in the study. The results are stronger and clearer indeveloped, or wealthier cities, than in developing or less wealthy cities.
Implications – Urban Form and Transport in High Income Cities
Higher densities and greater centralisation in higher income cities are uniformly associated with moreenvironmentally, socially and economically sustainable transport systems. Denser cities have lower levelsof private mobility and higher levels of mobility by public and non-motorised modes, as well as taxis andmotor cycles. Travel distances are shorter overall, and for the journey-to-work. They have much lessextensive provision of infrastructure for private mobility and much higher provision for public transport,especially segregated rights-of-way for public transport operations (mostly rail). They have lower energyuse and external costs from their transport systems and they pay less for their urban transport, despite thefact that private transport costs are higher on a per kilometre basis in higher density environments.
Policy recommendations for urban form in high income cities
Cities need to adopt land use policies that limit the spread of their urbanised area through urbangrowth boundaries and green belts, and provide active incentives for urban redevelopment andconsolidation in existing areas. Both jobs and population growth should focus on centres, both themain CBD and other sub-centres throughout the urban area. These centres will naturally favouraccess by public transport and non-motorised modes, but this tendency needs to be supported byphysical planning policies that give priority to these modes and seek to limit private car access.
(2) FREEWAYS, CONGESTION, PARKING SUPPLY AND URBAN TRANSPORT PATTERNS
The provision of urban freeways and the ancillary parking areas that must be supplied, especially incentral city areas, are major policy issues that confront cities in the developed and developing world.Provision of this infrastructure for private transport is still seen as offering an immediate palliative to thevexed issue of traffic congestion and the need to retain the economic competitiveness of core areas foroffice and business location, and to attract shoppers. In this sense, congestion is almost universallyviewed as a negative condition in cities, to be minimised at all costs.
The analysis in this study casts a negative light over both freeways and the open-ended pursuit of moreparking in the CBD of cities. It also seriously challenges the black and white view that congestion initself is a negative factor in cities.

6
Implications – Freeways and Urban Transport Patterns in High Income Cities
Freeways and transport patterns
Increasing freeway provision in high income cities is associated with all the hallmarks of automobiledependence. Freeways are associated with more extensive road systems overall and more parking in theCBD. They appear to promote higher car ownership and car use (but less motor cycle use) and a higheroverall daily trip-making rate, especially in cars. Freeways are associated with lower provision of publictransport service and lower public transport use. Higher freeway provision is associated with aproliferation of low quality bus lines and greater orientation to park-and-ride systems, both of which dolittle for transit service, quality or usage. In keeping with their negative effect on public transport, morefreeways are associated with lower levels of segregated rights-of-way for public transport, which in effectmeans less rail systems. As a result, public transport speeds are less competitive with general traffic speedin freeway-oriented urban areas, while car speeds are higher. Freeways are also associated with lower useof non-motorised transport and lower supply and use of taxi services. Finally, cities that build freewayscan expect to have longer car trip lengths, overall longer travel distances for all trips and especially longerjourneys to and from work.
Freeways and the economics of urban transport systems
Greater freeway provision is associated with an apparent host of economic advantages to privatetransport, but only in a very limited and ultimately counter-productive context. More freeway-orientedcities tend to have lower fuel prices, lower on-street parking charges and lower parking fines in centralcity areas. They also have lower operating costs per kilometre of travel and lower user costs per kilometretravelled. However, due to the tendency of freeways to generate greater private transport use and to havedeleterious effects on public transport and non-motorised transport, the private transport operating costsper capita and as a proportion of a city’s wealth or GDP, increase as freeway provision rises.Furthermore, the total costs that a city incurs for passenger transport, in other words, the total operatingand investment costs for private and public transport, increase with increasing freeway provision. In anurban system sense, freeways promote greater spending on passenger transport in order to achieve thesame transport ends.
In addition, freeways appear to have a direct association with negative impacts on the economicperformance of public transport. More freeway-oriented cities have higher public transport operatingcosts per passenger kilometre and lower average farebox revenue per vehicle kilometre and per passengerkilometre. Furthermore, higher provision of freeways is associated with lower per capita investmentspending on public transport and lower public transport investment as a proportion of city wealth or GDP.And very importantly, the ratio of spending on public transport compared to spending on roads is lower incities with more freeways.
The implication is that cities which orient themselves more around freeways, actually end up producingan economically counter-productive urban transport system. They spend more on achieving the aim ofproviding proper passenger transport services for their citizens, and they appear to drain money awayfrom investment in new or refurbished public transport systems, and direct it towards greater spending onconstructing and maintaining roads.

7
Freeways and energy and external costs
More extensive freeway systems in cities are associated with negative energy, emissions and transportdeath outcomes. Freeway-oriented cities have higher per capita private passenger transport energy useand higher per capita transport emissions. On a more positive note, cities with more freeways have lowertransport death rates per vehicle kilometre and per passenger kilometre, but unfortunately this is notreflected in any statistically significant reduction in per capita transport deaths. It appears that increasingcar use, and thus automobile exposure, tends to cancel out the better safety performance on a perkilometre travelled basis, so that no real safety benefits can be claimed from urban freeways.
Policy recommendations in relation to urban freeways
All cities appear to reap negative consequences for more sustainable transport from increasing theirfreeway provision. Any possible individual or sectoral benefits in economic, environmental or socialterms, appear to be overwhelmed in a systems sense. The result is that residents of more freeway-oriented environments simply travel more, pay more for that travel, pollute more and do more damageto public transport and other modes than residents of less freeway-oriented cities.
All cities should therefore enact policies that minimise or eliminate altogether, new freewayconstruction. The City of Vancouver is an example of a city in an auto-oriented culture that hassuccessfully banned freeways within its borders and has reaped enormous benefits in terms of publictransport, walking and cycling and high quality mixed use urban re-development. If freewaydevelopment is not eliminated or minimised, then any new freeways constructed should be usedprimarily for the purpose of commercial and freight traffic, with appropriate restrictions on privatecars, as in Singapore. Furthermore, consideration should be given in cities with existing freeways, tothe imposition of disincentives and restrictions on the movement of private passenger transport.Finally, freeways offer ready-made alignments for the development of new busways and passenger railservices where these are lacking. Cities should therefore give serious consideration to the reclamationof freeway lanes for the provision of urban rail and busway systems. This should be done with noreconstruction of removed lanes. There would therefore be a net reduction in freeway capacity, but anet increase in people-moving capacity of the transport system through the new busway or rail line.

8
Implications – Congestion and Urban Transport Patterns in High Income Cities
Measuring congestion levels on a metropolitan scale is an imperfect science at best. However, a numberof factors are used in this study that indicate the level of intensity with which roads in a city are used, andthe average speed that results from this usage pattern. Collectively they provide an insight into relativecongestion levels between cities and permit some statistical and policy explorations.
Congestion and transport patterns
The results in this study clearly indicate that as congestion increases, there is less car use, more motorcycle use, more public transport use, more use of non-motorised modes and more taxi use. Moreover,more congested cities are linked with shorter travel distances across the board and lower public transporttrip times, due in no small part to the development of superior public transport systems with protectedrights-of-way, mostly rail. Naturally, congested cities also have longer duration car trips. Conversely,higher average speed of traffic is associated with more car use, less motor cycle use, less public transportuse, less taxi use and less use of non-motorised modes. It is also linked to higher trip distances andshorter car trip times.
Overall, the results suggest that congestion acts as a brake on per capita car use. Congestion encouragesgreater motor cycle use, and works in favour of public transport and taxis, but only where these optionsoffer speed advantages with respect to cars stuck in congested conditions, and where parking is limited.This is often the case in more congested high income cities, since they commonly have urban railsystems, or less frequently, busways.
It can be said that whilst lower congestion provides better average speed of private travel, and thus onaverage, shorter car trip times for individual car commuters, the urban system effect is negative, since itencourages less sustainable transport patterns as a whole. The reverse is true for cities that are morecongested.
Congestion and the economics of urban transport systems
Overall, it can be said that in high income cities, less congestion appears to work in favour of lowerprivate transport operating costs for individual cars through lower per kilometre costs. However, for theurban system as a whole, the overall cost of passenger transport increases due to increased privatetransport usage. As well, congestion appears to encourage greater investment in public transport systemsand while congestion also increases the operating costs of public and private transport per kilometre,cities with higher congestion spend less money overall on passenger transport. This appears to be due to asuppressing effect of congestion on private travel and a greater shift to more economically efficientpublic transport and non-motorised modes. The reverse is naturally true for cities as they increase theiraverage speed of traffic through measures to increase road capacity. This benefits individual car users incheaper per kilometre costs, but creates disbenefits for the urban system as a whole, such as greateroverall outlays to run the urban passenger transport system, which in turn creates a competitivedisadvantage.
9
Congestion, energy and external costs
Overall, the results in the high income cities suggest that rather than saving fuel, reduced congestionincreases fuel use through its tendency to favour cars, increase urban sprawl and reduce the viability ofother modes. It also tends to increase transport emission rates per person and transport death rates percapita, despite improvements in the latter on a per vehicle kilometre and passenger kilometre basis.
Policy recommendations on congestion in high income cities
It would appear that congestion is not the totally negative social, economic and environmentalphenomenon it is often portrayed as. In an urban system, congestion acts as a mechanism that limitsthe growth in automobile dependence. All things being equal, it tends to promote the search foralternatives to private car use, be that a better public transport system or better land use andenvironmental conditions for walking and cycling. The result tends to be a more sustainable urbantransport system as a whole. Naturally, the reverse situation of increasing average speeds, which hasbeen the trajectory for motorising cities over many decades, tends to push urban systems to a lesssustainable condition. The notion of “slow cities” seems to gain some significant support from thisresearch.
The policy recommendation is therefore that all cities need to carefully review the issue of congestionand its perceived negative consequences on travel patterns, the economy, and the environment of cities.Only in this way will they be able to pursue the best policy responses to congestion, policies that will bemore in line with a well-functioning urban system as a whole. Policies need to be less concerned withremoving congestion per se, but rather be aimed more at promoting a better speed-competitive positionfor public transport and more attractive conditions for walking and cycling. This will generally meanfar greater attention to public transport systems with protected rights-of-way, and superior facilities forpedestrians and cyclists, through traffic calming, pedestrianisation and bicycle facilities. The analysisfrom this database even suggests that there is a case for strategic “planned congestion” in criticalareas around the city. At these points public transport and non-motorised modes would be providedwith the speed advantage they require with respect to private transport. This of course will run counterto the normal response of widening a road, building a bypass or adding a new river crossing to relievecongestion. The alternative approach suggested here will tend to promote a better equilibrium betweenall modes and a more sustainable urban transport system.
Implications – CBD Parking Supply and Urban Transport Patterns in High Income Cities
CBD parking supply and transport patterns
The analysis suggests that the more parking a city has in its centre, the greater is the overall orientation ofthe urban region to private transport, in both transport infrastructure and use. It also suggests that publictransport infrastructure, service levels and use are all consistently lower under a high parking regime inthe city centre. The latter pattern may be understood in the sense that more centralised cities with agreater quantity and quality of public transport service to the city centre (and this typically means anemphasis on rail-based public transport), tend to have less parking supply. Indeed, they have less need forparking when large numbers of people can be delivered to a confined location by a high-capacity publictransport system. Of course, central city bound trips tend still to be a major market share for publictransport, even though CBDs are typically diminishing in their share of metropolitan-wide jobs. Whenthere is less parking in a city centre, public transport can compete more effectively for this market share.

10
CBD parking supply and the economics of urban transport systems
The analysis in higher income cities suggests that as CBD parking supply increases, public transportsystems collect less revenue per unit of service and per user, and have greater operating costs perpassenger km. The cities spend less on investing in public transport, and they spend less operating theirpublic transport systems because they don’t supply as much service. As well, cities with higher parking intheir CBD spend proportionately more of their wealth on total passenger transport (private and publictransport, operating and investment costs).
CBD parking supply, energy and external costs
Cities that provide more CBD parking have higher private transport energy use per capita and perkilometre of travel, higher transport emissions per capita and greater transport deaths per capita. Theyalso have lower public transport energy use per capita due to lower supply and greater public transportenergy use per vehicle kilometre and passenger kilometre. All these results link to the greater automobiledependence and lower orientation to public transport of cities with a generous supply of CBD parking.
Policy recommendations on CBD parking supply in cities
CBD parking supply clearly has an impact on metropolitan scale urban transport patterns. The greaterthe supply, the less sustainable is the urban transport system. In particular, more CBD parking actsdeleteriously upon the role of public transport in the urban system and the economics of its operations.Furthermore, restricting CBD parking supply is a key policy lever that can help encourage thedevelopment of high capacity, high quality, radial public transport systems. Such systems still have akey role to play in the overall transport market, despite a general decline in the proportion of jobs to befound in the CBD of cities. This is especially true for lower income cities where, as a rule, jobs havedispersed less and a very strong market for public transport still exists in the central area.
Cities should therefore place a cap on the provision of CBD parking supply, allowing job growth tooccur without further growth in parking. They should also actively pursue the possibility of buildingout existing parking lots with residential development, as has happened in a number of cities such asToronto and Portland, Oregon. This will enhance the market for public transport and promote walkingand cycling to work by the new residents, or reverse commuting on public transport. Such a policyneeds to be enacted in conjunction with firm strategies to discourage private transport and improvepublic transport services into the CBD. Conditions for pedestrians and cyclists also need to beimproved through better urban design, pedestrianisation and traffic calming in city centres.

11
(3) PUBLIC TRANSPORT SERVICE FACTORS AND URBAN TRANSPORT PATTERNS
It is clear from this study that urban form, as well as private transport infrastructure and operatingconditions, influence overall transport patterns and the balance that exists between travel modes in cities.The other major player in this whole equation is, of course, public transport itself and the extent of itsinfrastructure and quality of the services it offers.
Implications – Public Transport Service Factors and The Use of Public Transport and Taxis inHigh Income Cities
The analysis shows that as all public transport service supply factors such vehicles per capita, vehiclekilometres and seat kilometres per person and per hectare, as well as the ratio of public transport speed togeneral road traffic speed, increase, so does public transport use. In particular, the spatial intensity ofpublic transport service is by far the strongest explanatory factor in the modal share of public transport incities. It is virtually the strongest statistical relationship in the whole study. In addition, an increasingextent of reserved public transport right-of-way per (person and per hectare), is also linked to increasingpublic transport use. This latter factor is primarily measuring the extent of rail in cities, since genuine,fully segregated busways are quite uncommon in cities. These same factors of greater public transportservice and infrastructure are also associated with greater non-motorised mode use in cities, as well asfewer total daily trips per capita. This would appear to be in line with ideas that suggest that morecompact public transport-oriented environments built around transit stops in cities which have moreextensive fixed route transit systems, are symbiotic with good pedestrian and cycling environments.Cities that provide better public transport systems also experience shorter overall trip distances, shorterjourneys-to-work, higher car trip times and higher average public transport trip distances, but not higherpublic transport trip times. This is probably due to more frequent and longer rail journeys at higher speedsin cities where public transport is strongest.
The analysis shows, on the other hand, that the extent of park-and-ride facilities is negatively linked withpublic transport use (and non-motorised mode use). Furthermore, the length of actual public transportlines per capita bears no relationship to public transport use. It would appear that an increasing supply ofpoorly serviced public transport (bus) lines does little to promote usage, but this is, unfortunately, a trendin some cities. Fewer, better located, better serviced and physically segregated public transport linesappear to be more successful at promoting use. At the same time that increasing public transport serviceand infrastructure promotes more public transport use, taxi use also increases. This is not necessarily dueto any direct inherent link or benefit derived by taxis from public transport service per se. However, itdoes tend to suggest that the two systems are not in direct competition. Rather, it suggests that they are insome way complementary in cities that have less cars and less car use (eg someone taking publictransport to work, but needing to make a trip during the day that is not convenient by public transportmay use a taxi).

12
Implications – Public Transport Service Factors and The Economics of Operating and BuildingUrban Transport Systems in High Income Cities
The analysis of public transport service factors in relation to the economics of urban transport reinforcesthe idea of a virtuous circle for public transport in higher income cities. That is, more transit investment,a more extensive reserved route system (mostly rail), and greater service provision are associated withgreater usage and better economic performance of transit (higher farebox returns and lower operatingcosts per kilometre). In particular, greater speed competitiveness, usually through urban rail systems,equates to higher economic returns within the public transport system and a generally better picture forthe mode, indicative of a more central role for transit within urban transport systems.
In other words, if cities want public transport to perform better economically, it is more prudent to investin a better system and to expand services in order to bring public transport into a more pivotal role withinthe urban system. This stands in contrast to the “slash and burn” mentality that has occurred in manycities as a response to declining use and economic performance of public transport. Such cities havesought to cut service in order to reduce costs, only to find that public transport is further marginalised,both in market share and economic performance.
Implications – Public Transport Service Factors and The Energy and External Costs of TransportSystems in High Income Cities
As would be expected from the previous results, increasing public transport infrastructure and service arelinked to lower private transport energy use, lower emissions and fewer transport deaths in cities. Greaterpublic transport line length and more park-and-ride facilities in cities are not, however, associated withany such benefits.
Policy recommendations for public transport service factors in high income cities
It is clear from this comprehensive international study that the role which public transport canpotentially play in high income cities is directly linked to the confidence and investment that arebestowed upon it through the policy and planning process. Only under increasingly superior serviceregimes can public transport expect to compete actively with private transport for modal share and toprovide cities with the economic, environmental and social gains of which public transport is capable.In particular, the provision of public transport systems with fully protected rights-of-way, isparamount. It is only through these systems that public transport can compete in the most fundamentalservice quality factor – better speed compared to the car. It is therefore recommended that citiesactively pursue development of new fully segregated tram, LRT, Metro, suburban rail and buswaysystems, as appropriate. Cities must also strive to improve the service density of public transport and tooffer superior service quality in all facets (vehicles, stops, information systems etc), to build a “virtuouscircle” for public transport.
13
(4) ECONOMIC FACTORS AND THEIR RELATIONSHIP TO URBAN TRANSPORT ANDLAND USE PATTERNS
The data in this study provide an opportunity to explore the impacts of various economic factors on urbantransport patterns. The factors examined are the wealth of cities (GDP per capita), the costs of private andpublic transport, and the level of investment in roads and public transport.
• WEALTH AND URBAN FORM
Implications – Wealth and Urban Form in High Income Cities
Despite claims that increasing wealth will tend towards greater urban sprawl and automobile dependenceas residents of cities develop the financial capacity to buy more space, this study finds no significantrelationships between any of the key indicators of urban form and the wealth of cities. Many people optto exploit greater wealth in order to purchase housing in more spatially constrained, but better located,more culturally rich and diverse central and inner locations (eg an apartment in Manhattan or centralParis, compared to a mansion on a 1 acre-plus property on the urban fringe. Such choices are now alosevident in Australian cities, especially Sydney and Melbourne). Any potential relationship between urbanform and wealth is thus confounded by quite complex and heterogeneous location and lifestyle choices.
Policy recommendations for wealth and urban form
Denser urban forms are clearly associated with more sustainable transport patterns on virtually everyurban transport indicator. It is particularly important therefore, that as cities become wealthier, thatthey provide attractive high density living opportunities to ensure that those with the financial capacityto make location and lifestyle choices, have the opportunity to live in attractive compact urbanenvironments. If the only attractive residential opportunities for those with higher incomes aresprawling, low density communities, particularly distant gated communities or “golf course estates”,then this will work against sustainable transport. It will also tend to deteriorate urban transportoptions for those on lower incomes through increasing traffic and congestion and a lower qualitypublic realm. It is recommended that the environmental quality of existing and planned high densityenvironments be optimised at every opportunity in order to increase the number of people at all incomelevels living in more compact communities.
• WEALTH AND URBAN FREEWAYS
Implications – Wealth and Urban Freeways in High Income Cities
There is absolutely no relationship between the wealth of cities, expressed as GDP per capita, and thelevel of freeway infrastructure provided. It is a conscious policy decision in cities as to whether to buildfreeway infrastructure. Both wealthy and less wealthy cities within the higher income sample makedecisions in favour of and against freeways, depending on their vision for the future of the city. Cities inthis group tend to have strong physical planning capabilities, governance arrangements and civil societygroups, which make it possible for them to better exercise such choices.

14
Policy recommendations on wealth and urban freeway provision
The results suggest that there is no inherent or inevitable relationship between rising wealth andfreeway provision in higher income environments where governance and planning capabilities arewell developed. Decisions to build or not to build freeways are policy driven, irrespective of wealthlevels. Where decision-making may be more susceptible to the undue influence of road interests, thena rising level of affluence may result in significant freeway construction. In keeping with previousrecommendations, all cities regardless of their wealth, should minimise or eliminate altogether theconstruction of new urban freeways if the goal of more sustainable transport is to be realised. Existingfreeway capacity should also be cut back by exploiting freeway capacity for some form of mass transit.
• WEALTH AND URBAN TRANSPORT PATTERNS
Increasing wealth is often thought to be associated with an inevitable move towards greater automobiledependence. The results in this study within the higher income cities runs counter to this.
Implications – Wealth and Urban Transport Patterns in High Income Cities
Unlike the physical factors already discussed, wealth or GDP per capita has a very weak association withmacro-scale transport patterns. In any case, where significant relationships occur, they are in a directionthat perhaps runs counter to conventional wisdom. For example, the significance of public transport,walking and cycling actually increases rather than diminishes with increasing wealth within the highincome cities.
Implications – Wealth and The Economics of Operating and Building Urban Transport Systems inHigh and Low Income Cities
Results of this analysis are consistent across all cities and within the high and low income groups. Greatercapacity to pay results in more per capita expenditure across the board on passenger transport in cities.However, this is not reflected in a higher proportion of city wealth being spent on passenger transport inhigher income cities because the GDP per capita, as cities become wealthier, overwhelms the influence ofthis higher expenditure. The analysis also suggests that as wealth increases across all cities, theproportion of wealth spent on public transport investment decreases and the cost of public transport forthe user rises relative to the user cost of cars.

15
Policy recommendations on wealth and urban transport patterns
Growing wealth in cities is clearly a force to be reckoned within urban transport policy, one that cantend towards greater automobile dependence and lower use of public transport and non-motorisedmodes, if market forces or vested interests alone are allowed to hold sway. However, this analysissuggests that there is nothing inevitable about growing wealth that will lead to consequences that areagainst more sustainable urban transport systems. Cities need to ensure that the expanding capacity topay for urban travel that comes with greater wealth is accompanied by a genuine choice for citizens intheir travel mode. This can be seen, for example, in many very wealthy cities in Europe (eg Zurich)and Japan (eg Tokyo), where quality public transport systems and attractive opportunities for walkingand cycling have grown hand-in hand with increasing wealth. In other words, greater wealth can justas easily be expressed in the development of high quality public transport systems such as new railsystems, pedestrianisation and traffic calming schemes, facilities for bicycles and a better public realm,as it can in rampant motorisation. Public institutions in all cities need to be constantly aboutsafeguarding and strengthening their planning capacities and facilitating citizen-based processes thatallow such choices to be expressed and acted upon.
• THE COSTS OF TRANSPORT AND THE USE OF PRIVATE AND PUBLIC TRANSPORT
The costs of both private and public transport are frequently cited as important factors in the relative useof these modes. The comprehensive economic data in the database allows these issues to be explored indetail across a representative sample of world cities.
Implications – The Costs of Private Transport and The Use of Private Transport in High IncomeCities
It can be concluded from the extensive data in this study that within the high income cities, the cost ofprivate motoring appears to influence the extent of use of private cars, which diminishes as costs becomemore punitive. It also appears that motor cycles become more attractive in a high car cost regime. As theprice of fuel alone rises, there is also a dampening effect on private car use and an increase in motor cycleuse.

16
Implications – The Costs of Public Transport and The Use of Public Transport in High IncomeCities
The cost of public transport to the user of public transport is not a significant determining factor in acity’s overall comparative use of public transport in higher income cities. Public transport use seems to beinfluenced more by urban structural factors and policy environments that determine how competitive andattractive public transport is compared to other modes. This is not to say that in particular circumstancesin certain cities, pricing decisions on public transport fares have no impact. Clearly they can, but sucheffects are, it would seem, not strong enough to determine a city’s overall performance on publictransport use compared to other cities, or to counteract differences between those cities in more importantor fundamental factors. Public transport user costs are also important for equity reasons, in that fare levelsshould not exclude the use of public transport by lower income groups. Interestingly however, higherfarebox revenue per boarding and per passenger kilometre is associated with higher public transport usein high income cities. This is a little counter-intuitive in the sense that higher farebox revenue perboarding and per passenger kilometre is more an indication of higher transit charges to the user. Thiswould normally be thought to reduce the attractiveness of public transport. A possible conclusion here isthat people are prepared to pay more for a higher quality service and this can result in higher, not loweruse of public transport, where a high enough proportion of the population have the capacity to pay.Finally, public transport use does appear to benefit from higher fuel prices in cities.
Policy recommendations on private transport costs
This study suggests that higher costs of private transport do have a significant dampening effect onautomobile dependence, though motor cycle use increases in response to this in higher income cities. Itis therefore recommended that the pricing of private transport be increased to better reflect its truecosts to the urban system. It is further recommended that this be a tool to be used in conjunction withthe development of less auto-dependent urban forms and better alternatives to the car to promote moresustainable transport. The results of this study clearly indicate that physical planning approaches andeconomic approaches to reducing private transport and enhancing public transport and non-motorisedmodes will work much more effectively when combined, than if they are deployed separately, or at oddswith each other. It is, however, very important in increasing the costs of private transport, to ensurethat this is done equitably in both high and low income cities. The best way to ensure this outcome is toprovide high quality, convenient and accessible alternative modes of transport to the car and motorcycle in all areas of the city and for as many daily trips as possible.
Policy recommendations on public transport costs
This study indicates that higher user costs of public transport in high income cities has no bearing onusage. In fact, it tends to suggest that people are prepared to pay more for higher quality publictransport and to use it more. In high income cities it is recommended that higher quality publictransport alternatives be aggressively pursued, even if this means the charging of higher fares to offsetincreasing costs. Whilst doing this, it is also recommended that appropriate social policies be adoptedto ensure affordability for lower income groups.

17
• TRANSPORT INVESTMENT AND TRANSPORT USAGE PATTERNS
The database has examined the possible influence of different levels of investment in roads and publictransport in different cities to see if there is a discernible relationship between these factors and the use ofthe different modes.
Implications – Road Investment and Private Transport Usage in High Income Cities
The road investment variables do not bear significant relationships to private transport use in the highincome cities. The only relationship that suggests some significance is the relative investment in publictransport compared to roads. As this factor increases, car and total private transport use diminish (andmotor cycle use increases, in line with previous discussions). It may be that private transport use is lesssensitive to the level of road investment because a proportion of this investment is for maintenance of theexisting system, not new construction. Road maintenance spending would not be expected to have astrong direct impact on road usage.
Implications – Public Transport Investment and Public Transport Usage in High and Low IncomeCities
The results obtained for the impact of public transport investment on public transport use in cities arehighly consistent across both high and low income cities. Greater investment in public transport leadsconsistently to higher per capita public transport use. The results for public transport may be stronger andclearer than for roads because essentially all the dollars spent have a direct and tangible impact on thequality of public transport, even that of maintenance (eg refurbishment of vehicles and stops).Construction of new lines and purchase of new, more attractive rolling stock will tend to attract greaterpatronage.
Policy recommendations on road and public transport investment
Greater road investment tends towards higher dependence on private transport in low income cities,but the same result for high income cities is not apparent. We do know however, from previous results,that more freeways are associated with greater automobile dependence. In this sense road investmentin the construction of new high capacity roads should be minimised in all cities, or perhaps eliminatedin favour of public transport investment. Greater investment in public transport is associated with clearand consistent benefits in all cities in terms of increased use.
It is recommended that in all cities, public transport investment should have priority over roadinvestment, if sustainable transport is to be realised. This investment should cover strategic investmentin the walking and cycling facilities needed for people to gain efficient, safe and comfortable access topublic transport systems.

18
(5) INTERMODAL INFLUENCES ON TRANSPORT PATTERNS
The database provides an opportunity to explore various intermodal interactions. An examination wasthus made of the possible interactions between private transport factors and the use of taxis and publictransport factors and the use of non-motorised transport.
• PRIVATE TRANSPORT FACTORS AND THE USE OF TAXIS
Implications – Private Transport Factors and The Use of Taxis in High and Low Income Cities
Regular taxi numbers and use are suppressed in high income cities by higher car ownership and use,whereas they increase with increasing motor cycle ownership and use. Shared taxis do not featuresignificantly in these results. The only significant relationship with shared taxis in high income cities is,that as the number of kilometres travelled per motor cycle increases, so does shared taxi supply and use.This perhaps suggests that in developed cities, an increasing usage of motor cycles, as an alternative tothe car, may also be associated with the emergence of shared taxis as a further needed alternative toprivate transport. In terms of economics, the analyses suggest that a higher cost regime for privatetransport, including higher fuel prices, does tend to be associated with a stronger taxi industry and agreater role for regular taxis in higher income cities (including a small association with increasing sharedtaxi use too).
Policy recommendations on taxis
It would appear to be generally true that increasing levels of private car ownership and use in citiestends to suppress the significance of the taxi industry, be it regular or shared taxis. In general, it canbe said that for a door-to-door ‘private transport’ type of trip, a taxi or shared taxi trip is probably amore economically and environmentally efficient way of providing the service (compared to theownership, storage and operation of one extra car within the urban system). Increasing significance oftaxis, along with motor cycles, appears to be symptomatic of an urban system in which automobiledependence is not as advanced or is being better managed. From previous analyses, it is also seen thattaxis and public transport do not appear to compete with one another, but rather to havecomplementary roles. It is recommended therefore that cities seek to optimise the role which taxis canplay within the urban system, especially in relation to helping to feed the public transport system inlower density, less accessible areas, and as a way of helping to minimise private car ownership anduse. Taxis can also perform an important niche role for particular groups of people for whom usingpublic transport is very difficult or in some cases, impossible (eg people with disabilities).
• PUBLIC TRANSPORT USE AND ITS RELATIONSHIP TO NON-MOTORISED MODES
Implications – Public Transport Use and Non-Motorised Mode Use in High and Low Income Cities
High public transport use environments also tend to be high non-motorised mode usage environments inhigh and low income cities alike. This is very much stronger for foot trips than bicycle trips.

19
Policy recommendations on public transport use and its relationship to non-motorised modes.
The strong link between public transport and non-motorised modes is significant in policy terms, in thesense that enhancement of either or both of public transport and non-motorised transport will tend tobe associated with positive synergies between them. This will result in a greater modal share to thesemodes in cities and hence greater urban sustainability. It is recommended that strategies to improvethe modal share of public transport and non-motorised mode use be undertaken in a coordinatedfashion. For example, an excellent public transport system is of much less value if the public realmaround that system, through which people have to walk or ride a bike, is unattractive or dangerous.Coordinated policies on walking, cycling and public transport will reap synergies that exist between themodes.
(6) MODAL INFLUENCES ON TRANSPORT EXTERNALITIES
The database allows an examination of the effects of different modes on important transport externalities.The two analyses undertaken are between private transport factors and emissions and transport deaths andbetween non-motorised transport and transport deaths.
• PRIVATE TRANSPORT USE AND TRANSPORT EXTERNALITIES
Implications – Private Transport Use and Transport Externalities in High Income Cities
An increasing level of motorised mobility in cars is associated with increasing per capita levels of allemissions, but a falling level of total emissions per urban hectare (due to lower density cities having morecar travel and more geographically dispersed emissions). It is also linked to increasing per capita fatalitiesin transport, but declining fatalities per vehicle kilometre and passenger kilometre. In other words, highincome cities with more car travel are associated with greater overall exposure to road traffic and thushigher deaths, even though on a per kilometre travelled basis, their road traffic systems are safer andbetter managed. Of course, it can also be argued that pedestrians and cyclists in high traffic environmentshave retreated from the public realm and this may contribute to the lower death rate per vehicle kilometreand passenger kilometre.
When the motor cycle kilometres per capita is examined as a separate component of private mobility wefind that the picture is different. Increasing motor cycle kilometres per capita is associated with loweremissions per capita and higher emissions per urban hectare. The reason for this is that higher motorcycle use in high income cities is itself an indication of lower levels of overall private mobility andgenerally denser cities within this category. More motor cycle use is also linked to higher transport deathsper capita and per vehicle kilometre and passenger kilometre, which is some support for the idea thatmotor cycles tend to be more dangerous modes of motorised transport.
Policy recommendations on private transport use and externalities
Overall, increasing private mobility increases transport externalities, regardless of the quality ofvehicle technology or strength of the regulatory environment. This is so despite the high income citieshaving some apparent reduction in transport deaths per kilometre of travel as car use increases. It isrecommended that to reduce emissions and transport deaths in cities, improved technologies and areduction in automobile dependence be pursued simultaneously.

20
• NON-MOTORISED TRANSPORT AND TRANSPORT DEATHS
Implications – Non-Motorised Modes and Transport Deaths in High and Low Income Cities
In the high income cities, as the level of both walking and cycling increases, this is actually associatedwith fewer transport deaths per capita, not more. There is one positive correlation between the proportionof daily trips by non-motorised modes and the transport deaths per vehicle kilometre, which suggests ahigher death rate as walking and cycling become more important. However, this is not reflected in the percapita transport deaths, which trend in the opposite direction. The results in low income cities are largelysimilar, where the data show that as bicycling becomes more important, per capita transport deathsactually decline. However, the death rate per kilometre of private motorised travel increases as walkingand cycling increase in a city. This result may be different if the death rate per kilometre actuallyreflected the kilometres of travel contributed by non-motorised transport.
Policy recommendations on non-motorised transport and transport deaths
The database suggests that there is nothing intrinsically unsafe about walking and cycling where anincreasing amount of it occurs, and where the urban environment supports this activity through safer,traffic calmed and pedestrianised streets. It is recommended that non-motorised transport beencouraged for its potential safety benefits, as well as its broader sustainability and health advantages.It is further recommended that cities constantly strive to ensure that existing urban environments areretrofitted for greater pedestrian and cyclist safety and urban amenity, and that new development isoptimised for these modes.
(7) SUMMARY
This submission has attempted to provide a policy perspective on a wide range of factors at work inurban areas that help to determine their degree of sustainability, especially in relation to transport.The data tables in Appendix 4, which summarise a number of the key transport factors discussed inthis submission, allow the reader to see the vast range in automobile dependence and associatedfactors that exists across the world’s cities today. These data show Australian cities to be amongst theworld’s most automobile dependent urban environments. The submission has provided importantperspectives on the interlinked factors of urban form, wealth, private and public transportinfrastructure, the economics of urban transport systems (investment and operating costs) and otherkey variables and how these influence the degree of automobile dependence in cities. It has alsolooked at factors such energy and the external costs of urban transport and their relationship totransport usage patterns and the other urban influences mentioned above. The overall conclusion isthat more sustainable urban transport systems will only be achieved through a coordinated set ofpolicies on urban land use and urban form, transport infrastructure provision, integration between thevarious modes of transport and the correct pricing of urban transport. A unifying theme of urban andtransport planning policy should be the reduction in car use and the promotion of public transport,walking and cycling to encourage more sustainable cities.
(8) REFERENCES
Kenworthy, J. and Laube, F. The Millennium Cities Database for Sustainable Transport. International Union(Association) of Public Transport, Brussels, Belgium and ISTP, Perth, Western Australia (CD-ROM publication). (2001).Newman, P.W.G. and Kenworthy, J.R. Sustainability and Cities: Overcoming Automobile Dependence. Island Press,Washington DC. (1999).
21
APPENDIX 1: List of primary data items in the study.A. Metropolitan Area DefinitionThis should be, as far as possible, the functional urban region and should be specified according towhatever local administrative divisions or boundaries there are in the urban region. A map would beuseful.
B. CBD DefinitionThis should reflect the central area with the highest concentration of employment. We will need toget jobs and parking data for that area.
C. Reference YearPreferably 1995, but there is flexibility.
1. Total land area of the metropolitan areaThis should exclude major water surfaces.
2. Urbanised area of the metropolitan areaThis should reflect the built up area, ie housing, industrial and commercial areas, city parks (but notregional parks), transport infrastructure (roads and railways) and urban wasteland, but notagriculture, forest, large areas of vacant land, region scale parks etc
3. Total population of the metropolitan area
4. Number of jobs (at place of work) in metropolitan area
5. Number of jobs (at place of work) in CBD
6. Gross domestic product of the metropolitan area
7. Qualitative data on the planning systemThis is a brief multiple choice questionnaire which can be filled in in under ten minutes by aknowledgable person. In this case, we need a name of a suitable person who would be prepared todo this for us.
8. Number of private cars and station wagons, RVs, etc. (including company cars, excludingtaxis)
9. Number of two-wheeled motor vehicles (motorcycles)
10. Total vehicle kilometres of travel in private cars (all vehiicle kilometres data here and beloware for the WHOLE YEAR).
11. Vehicle kilometres of travel on two-wheeled motor vehicles (motorcycles)
12. Passenger kilometres in private cars (or average vehicle occupancy, 24 hours per day, 7daysper week, not peak period)
13. Passenger kilometres on two-wheeled vehicles (motorcycles)(or

22
average vehicle occupancy as per definition above)
14. Average road network speed (7day/24hour)
15. Total centreline length of the road network (all roads including residential)
16. Total length of express road network (ALL segregated expressways, irrespective ofownership or status (free- or tollways))
17. Number of parking places in CBD (off-street)Excludes permanent residential parking but includes tenant parking under office buildings.
18. Number of parking places in CBD (on-street)
19. Charge for temporary CBD parking (on-street)This is defined as the maximum 1st hour charge, or if bigger, twice the half-hour charge for thosebays restricted to 1/2 hour of use only, or four times the 15-minute charge for those bays restricted to1/4 hour of use only.
20. Charge for temporary CBD parking (off-street)As per 19.
21/22. Fines for temporary CBD parking:We are looking for 3 offences:- Parking in kerbside no parking zone- Parking in a way which obstructs public transport vehicles (ie on buslane)- Parking longer than paid for on a timed, charged parking stall
23. Park and RideWe are looking for:(a) the number of facilities, and(b) the total capacity (number of parking spaces)
24. Qualitative data on the road transport systemThis is a brief multiple choice questionnaire which can be filled in in under ten minutes by aknowledgable person. In this case, we need a name of a suitable person who would be prepared todo this for us.
25. Total number of taxis
26. Total number of shared taxis (shared taxis being those whichallow a second hirer on WITHOUT consent of the primary hirer)
27. Total vehicle kilometres in taxis
28. Total vehicle kilometres in shared taxis
29. Annual passenger trips in taxis
30. Annual passenger trips in shared taxis
23
31. Annual passenger kilometres in taxis
32. Annual passenger kilometres in shared taxis
33. Qualitative data on the public transport fare systemThis is a brief multiple choice questionnaire which can be filled in in under ten minutes by aknowledgable person. In this case, we need a name of a suitable person who would be prepared todo this for us.
34. Total public transport farebox revenueThis should be the total for all operators which are active in the metropolitan area. It should separateuser fare revenue and any direct government reimbursements for reduced fares.
35. Public transport vehicle fleet by modeThis should be the total for all operators which are active in the metropolitan area. It should separateout minibus, bus, tram, light rail, subway and suburban rail modes as applicable.
36. Length of lines by modeThis should be the total for all operators which are active in the metropolitan area. It should separateout minibus, bus, tram, light rail, subway and suburban rail modes as applicable.This is defined as the sum of the two-way lengths of all lines, ie:Line 1 goes from A to B, distance 4 miles, the return route is identical, total length therefore is 8miles.... and so on for each line. We only require the system total, not the individual lines. Thisindicator is zero for those public transport modes which are not bound to a route.
37. Length of reserved routes by modeThis should be the total for all operators which are active in the metropolitan area. It should separateout minibus, bus, tram, light rail, subway and suburban rail modes as applicable.Any length reported here must be truly exclusive, ie they are a bus only (NOT a HOV) facility, andthey are physically separated from traffic, ie by a concrete barrier or by grade separation. Rail mustbe on segregated right-of-way, ie no on-street running.
38. Average operating speed by modeThis should be the total for all operators which are active in the metropolitan area. It should separateout minibus, bus, tram, light rail, subway and suburban rail modes as applicable.The operating speed is defined as the revenue vehicle kilometres divided by the revenue vehiclehours.
39. Annual revenue vehicle kilometres by modeThis should be the total for all operators which are active in the metropolitan area. It should separateout minibus, bus, tram, light rail, subway and suburban rail modes as applicable.
40. Annual revenue place (seat) kilometres by modeThis should be the total for all operators which are active in the metropolitan area. It should separateout minibus, bus, tram, light rail, subway and suburban rail modes as applicable.
41. Annual boardings by mode

24
This should be the total for all operators which are active in the metropolitan area. It should separateout minibus, bus, tram, light rail, subway and suburban rail modes as applicable. Boardings areUNLINKED passenger trips
42. Annual passenger kilometres by modeThis should be the total for all operators which are active in the metropolitan area. It should separateout minibus, bus, tram, light rail, subway and suburban rail modes as applicable. Where passengerkilometres are not directly available, then we need the average length in kilometres of an unlinkedtrip (boarding) for each mode as above.
43. Qualitative data on the organisation of public transportThis is a brief multiple choice questionnaire which can be filled in in under ten minutes by aknowledgable person. In this case, we need a name of a suitable person who would be prepared todo this for us.
44-51, 62, 63 Travel survey data.
We are looking for the following data (always all purposes, 24hr/7dayunless otherwise specified):
Average daily walk tripsAverage daily bicycle tripsAverage daily trips on urban transit (all publc transport modes)Average daily trips on all other modesAverage trip length (distance) of walk tripsAverage trip length (distance) of trips by all other modesAverage trip length (distance) of trips by private vehicle (car passenger/driver, RV.s etc.)Overall average trip length by all modes (distance)Average trip length (distance) of the journey-to-work (home-based work) by footAverage trip length (distance) of the journey-to-work (home-based work) by all other modesOverall average trip length (distance) of the journey-to-work (home-based work)Average kerb-to-kerb travel time of trips by carAverage kerb-to-kerb travel time of trips by public transport
52. Annual investment spending on ALL public roads (construction and maintenance) for pastfive years.This should include all jurisdictions which are maintaining roads.
53. Annual investment spending on public transport (network development, renovation,modernisation of equipment and rolling stock) for past five yearsThis should be the total for all operators which are active in the metropolitan area.
54. Annual operating expenses on public transportThis should be the total for all operators which are active in the metropolitan area. It shoulddistinguish operations and the cost of finance and depreciation.
56. Cost of driving a private motor vehicleThis should be the representative cost of driving a popular, average car. If motorcycles aresignificantly used, we also need a corresponding value for motor cycles.

25
It needs to be detailed by total variable cost, fuel cost, fuel tax cost, total annual fixed cost andannual registration fees.
60. Private passenger transport energy use (litres of petrol, diesel and LPG used in privatepassenger transport)
61. Public transport energy useThis should be the total for all operators which are active in the metropolitan area. It should separateout minibus, bus, tram, light rail, subway and suburban rail modes as applicable and should includefuel type (diesel, petrol, LPG, electricity)
64. Mortality from motor vehicle accidentsThis is all transport deaths according to the WHO’s International Classification of Diseases (ICD),and should be the number of deaths from ICD codes E810 to E825,
65. Air pollutant inventoryWe are looking for the total annual transport-related emissions for CO, NOx, SO2 and VHC for themetropolitan region
66. Qualitative data on the combat of air pollutionThis is a brief multiple choice questionnaire which can be filled-in in under ten minutes by aknowledgeable person. In this case, we need a name of a suitable person who would be prepared todo this for us.
26
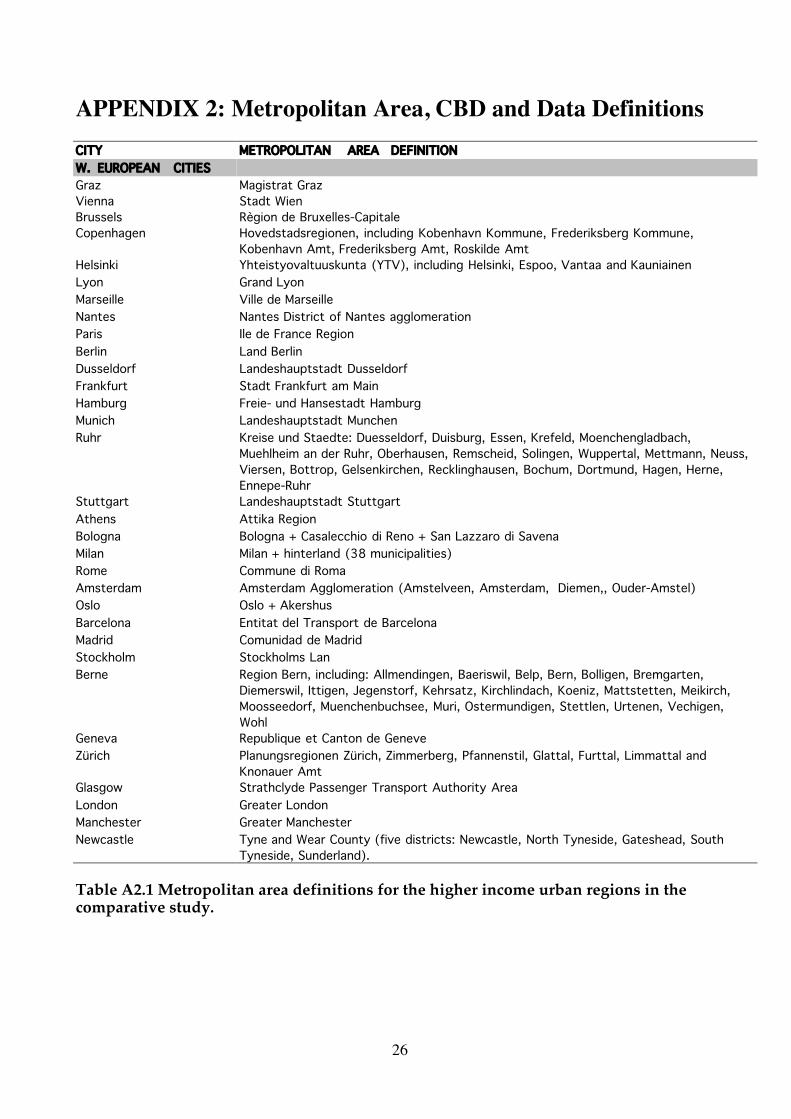
APPENDIX 2: Metropolitan Area, CBD and Data DefinitionsCITY METROPOLITAN AREA DEFINITIONW. EUROPEAN CITIESGrazViennaBrusselsCopenhagen
Magistrat GrazStadt WienRègion de Bruxelles-CapitaleHovedstadsregionen, including Kobenhavn Kommune, Frederiksberg Kommune,Kobenhavn Amt, Frederiksberg Amt, Roskilde Amt
Helsinki Yhteistyovaltuuskunta (YTV), including Helsinki, Espoo, Vantaa and KauniainenLyon Grand LyonMarseille Ville de MarseilleNantes Nantes District of Nantes agglomerationParis Ile de France RegionBerlin Land BerlinDusseldorf Landeshauptstadt DusseldorfFrankfurt Stadt Frankfurt am MainHamburg Freie- und Hansestadt HamburgMunich Landeshauptstadt MunchenRuhr Kreise und Staedte: Duesseldorf, Duisburg, Essen, Krefeld, Moenchengladbach,
Muehlheim an der Ruhr, Oberhausen, Remscheid, Solingen, Wuppertal, Mettmann, Neuss,Viersen, Bottrop, Gelsenkirchen, Recklinghausen, Bochum, Dortmund, Hagen, Herne,Ennepe-Ruhr
Stuttgart Landeshauptstadt StuttgartAthens Attika RegionBologna Bologna + Casalecchio di Reno + San Lazzaro di SavenaMilan Milan + hinterland (38 municipalities)Rome Commune di RomaAmsterdam Amsterdam Agglomeration (Amstelveen, Amsterdam, Diemen,, Ouder-Amstel)Oslo Oslo + AkershusBarcelona Entitat del Transport de BarcelonaMadrid Comunidad de MadridStockholm Stockholms LanBerne Region Bern, including: Allmendingen, Baeriswil, Belp, Bern, Bolligen, Bremgarten,
Diemerswil, Ittigen, Jegenstorf, Kehrsatz, Kirchlindach, Koeniz, Mattstetten, Meikirch,Moosseedorf, Muenchenbuchsee, Muri, Ostermundigen, Stettlen, Urtenen, Vechigen,Wohl
Geneva Republique et Canton de GeneveZürich Planungsregionen Zürich, Zimmerberg, Pfannenstil, Glattal, Furttal, Limmattal and
Knonauer AmtGlasgow Strathclyde Passenger Transport Authority AreaLondon Greater LondonManchester Greater ManchesterNewcastle Tyne and Wear County (five districts: Newcastle, North Tyneside, Gateshead, South
Tyneside, Sunderland).
Table A2.1 Metropolitan area definitions for the higher income urban regions in thecomparative study.

27
CITY METROPOLITAN AREA DEFINITIONAMERICAN CITIESAtlanta State of Georgia Counties of Cherokee, Clayton, Cobb, DeKalb, Douglas, Fayette,
Fulton, Gwinnett, Henry and RockdaleChicago State of Illinois Counties of Cook, DuPage, Kane, Lake, McHenry and WillDenver State of Colorado: Counties of Adams, Arapahoe, Boulder, Denver and JeffersonHouston State of Texas, Counties of Brazoria, Fort Bend, Harris, Liberty, Montgomery and WallerLos Angeles State of California, Los Angeles CountyNew York State of Connecticut: Counties of Fairfield and New Haven plus Towns of Bethlehem,
Thomaston, Watertown, Woodburg, Bridgewater and New Milford; State of New Jersey:Counties of Bergen, Essex, Hudson, Middlesex, Monmouth, Morris, Ocean, Passaic,Somerset, Union; State of New York: Counties of Bronx, Dutchess, Kings, Nassau, NewYork, Orange, Putnam, Queens, Richmond, Rockland, Suffolk and Westchester.
Phoenix State of Arizona, Maricopa CountySan Diego State of California, County of San DiegoSan Francisco State of California, Counties of Alameda, Contra Costa, Marin, San Francisco and San
MateoWashington District of Columbia, State of Maryland Counties of Montgomery and Prince Georges,
State of Virginia Counties of Arlington, Fairfax, Loudoun and Prince William and theVirginia independent Cities of Alexandria, Fairfax, Falls Church, Manassas and ManassasPark
OCEANIAN CITIESBrisbane Brisbane Statistical DivisionMelbourne Melbourne Statistical DivisionPerth Perth Statistical DivisionSydneyWellington
Sydney Statistical DivisionWellington Transport Study Area, including City of Wellington, Lower Hutt, Upper Hutt,Povirua and urbanised section of the Kapiti Coast.
CANADIAN CITIESCalgary City of CalgaryMontreal Grande Region de Montreal' selon le Plan des TransportsOttawa Regional Municipality of Ottawa-Carleton, Municpalite Regionale de Comte
Collines-de-l'Outaouais, Communaute Urbaine de l'OutaouaisToronto Greater Toronto Area, comprising Metropolitan Toronto, Peel, Durham, Halton and YorkVancouver Greater Vancouver Regional DistrictASIAN CITIESHong Kong The Territory of Hong Kong, now the Hong Kong Special Administrative RegionOsaka Osaka-to, Hyogo-to and Kyoto-toSapporo City of Sapporo (shin-Sapporo)Tokyo Tokyo-to, Kanagawa-ken, Saitama-ken and Chiba-kenSingapore Republic of SingaporeTaipei Taipei City plus Taipei County
Table A2.1 Metropolitan area definitions for the higher income urban regions inthe comparative study (cont.).

28
CITY CBD DEFINITIONW. EUROPEAN CITIESGraz 1. Bezirk: Innere StadtVienna 1. BezirkBrussels Zones 1, 6,7, 8, 21, 45Copenhagen Statistikdistrikt A Indre By, C VoldskvarternerneHelsinki The Helsinki Peninsula, including Vironniemi, Ullanlinna, KampinmalmiLyon 2e au Nord de Perrache et 3e Arrondissement a l'ouest de la Rue GaribaldiMarseille Hypercentre de Marseille roughly the areas ofLes Grandes Carmes, Belsunce,
St.Charles, St.Victor, Prefecture, Lodi, St. Lambert, Vauban and CastelloneNantes Part of the inner city on the right side of Loire (Jardin des plantes to Viarme and
Graslin)Paris Arrondissements I to XBerlin Parkraumbewirtschaftungszonen Stadtmitte und westliche InnenstadtDusseldorf Stadtteile Altstadt, Karlstadt, Stadtmitte, Pempelfort, Friedrichstadt, UnterbilkFrankfurt Ortsteile Altstadt, Bahnhofsviertel and InnenstadtHamburg Stadtteile (Ortsteile) Hamburg-Altstadt(101-103) Neustadt(104-107)Munich Stadtbezirke 1, 2 und 3Ruhr Duesseldorf Stadtteile Altstadt, Karlstadt, Stadtmitte, Pempelfort, Friedrichstadt,
UnterbilkStuttgart Bezirk MitteAthens Inner ring road areaBologna Centro Storico di Bologna (Marconi, Irnerio, Malpighi, Galvani)Milan Centro StoricoRome Zona Centrale, comprendo i Rioni di Campo Marzio, Colonna, Trevi, Ponte, Parione,
Sant'Eustacchio, Pigna, Regola, Sant'Angelo, Campitelli, Ludovisi, Sallustiano,Castro Pretorio, Monti, Esquilino, Celio, Trastevere, Ripa, Testaccio, San Saba
Amsterdam Binnenstad AmsterdamOslo Oslo CBDBarcelona Eixample, Ciutat VellaMadrid Almendra Central, comprising Distritos 1-7 of Madird MunicipioStockholm Forsamlingen: Adolf Fredrik, Gustav Vasa, Hedvig Eleonora, Kungsholm, plus
Redovisningsomradet Jakob and KlaraBerne Stadtteil I Innere StadtGeneva Secteurs Statistiques de Cite-Centre et St-Gervais-ChantepouletZürich Kreis 1 AltstadtGlasgow Glasgow City Central AreaLondon Central LondonManchester Inner ring road areaNewcastle Newcastle CBD, bounded by the Central Motorway (E&N), West Central Route (W), and
River Tyne (S)
Table A2.2 CBD definitions for the higher income urban regions in the comparative study.
29
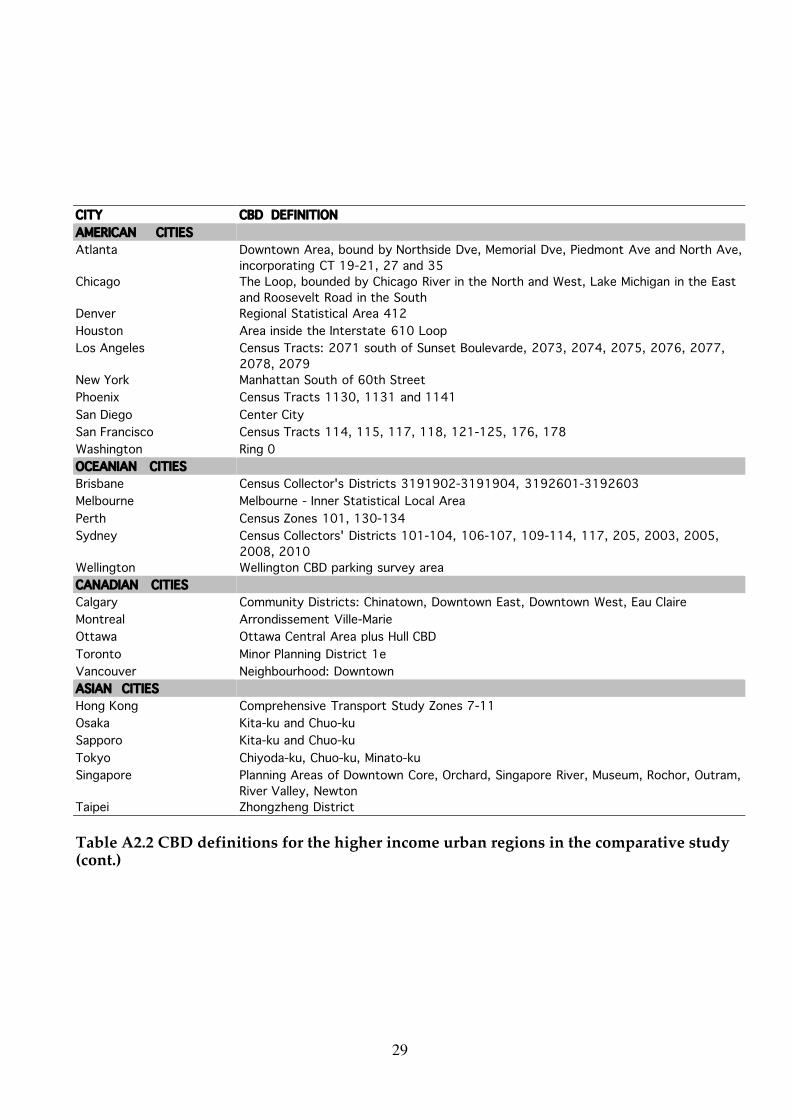
CITY CBD DEFINITIONAMERICAN CITIESAtlanta Downtown Area, bound by Northside Dve, Memorial Dve, Piedmont Ave and North Ave,
incorporating CT 19-21, 27 and 35Chicago The Loop, bounded by Chicago River in the North and West, Lake Michigan in the East
and Roosevelt Road in the SouthDenver Regional Statistical Area 412Houston Area inside the Interstate 610 LoopLos Angeles Census Tracts: 2071 south of Sunset Boulevarde, 2073, 2074, 2075, 2076, 2077,
2078, 2079New York Manhattan South of 60th StreetPhoenix Census Tracts 1130, 1131 and 1141San Diego Center CitySan Francisco Census Tracts 114, 115, 117, 118, 121-125, 176, 178Washington Ring 0OCEANIAN CITIESBrisbane Census Collector's Districts 3191902-3191904, 3192601-3192603Melbourne Melbourne - Inner Statistical Local AreaPerth Census Zones 101, 130-134Sydney Census Collectors' Districts 101-104, 106-107, 109-114, 117, 205, 2003, 2005,
2008, 2010Wellington Wellington CBD parking survey areaCANADIAN CITIESCalgary Community Districts: Chinatown, Downtown East, Downtown West, Eau ClaireMontreal Arrondissement Ville-MarieOttawa Ottawa Central Area plus Hull CBDToronto Minor Planning District 1eVancouver Neighbourhood: DowntownASIAN CITIESHong Kong Comprehensive Transport Study Zones 7-11Osaka Kita-ku and Chuo-kuSapporo Kita-ku and Chuo-kuTokyo Chiyoda-ku, Chuo-ku, Minato-kuSingapore Planning Areas of Downtown Core, Orchard, Singapore River, Museum, Rochor, Outram,
River Valley, NewtonTaipei Zhongzheng District
Table A2.2 CBD definitions for the higher income urban regions in the comparative study(cont.)

30
DATA DEFINITIONS
This section of Appendix 2 provides the primary data definitions from whichthe standardised data in the tables in Appendix 4 were calculated. The samestandardised data were used in the statistical analysis whose results arereported in the submission.
AVERAGE ROAD NETWORK SPEED
The average road network speed is defined as: The average speed of allvehicles over 24 hours per day and seven days per week on all classes ofroads.
The average road network speed is defined as a 24 hour, seven days-of-the-week kerb-to-kerb average. Sources include output from land use/transportmodels which generate vehicle kilometres and vehicle hours, householdtravel survey data and air pollution models.
AVERAGE SPEED OF PUBLIC TRANSPORT
The average public transport speed is defined as: The average 24-hour, 7-daypublic transport commercial operating speed, detailed by mode and byoperator.
Average speed can be calculated, where available, by dividing the revenuevehicle kilometres by the revenue vehicle hours. Revenue vehicle kilometresare all vehicle kilometres in public service, excluding dead-heading. Revenuevehicle hours is the time vehicles spend in operating the revenue vehiclekilometres, and thus excludes lay-overs at termini and time on dead-heading.
The overall average speed of public transport is calculated based upon aweighting of revenue vehicle hours by the various public transport modes.
DAILY TRIPS AND MODAL SPLIT
The average daily number of trips by all modes is defined as: The 365 days-of-the year average daily one-way trips on all modes, for all purposes, by allpersons. The indicator just includes trips within the metropolitan area (andnot trips with only one end in the metropolitan area).
A trip is any travel between an origin and a destination, which may be madeusing several modes. This definition explicitly includes walking trips. Whenspecific age groups are excluded from the survey (for example trips made bypeople under 15, or under 5 years of age) the data providers were asked toclearly state or note this. Where only weekday information can be madeavailable, it was necessary to collect the number of workdays in the countryas well as conversion factors or estimates for trips in the weekend (normallyavailable at road departments). However, whatever information wasavailable was collected.

31
A public mode trip is a trip where at least one public transport mode has beenused. Thus, a trip involving the use of, for example, the car and the metro wascounted as a public mode trip.
The mode split for all modes is defined as: The percentage of total trips bynon-motorised modes, by private and by public transport.
The table below allocates the most common modes to each of these threeclasses.
Mode of transport GroupingWalking Non-motorised,
non mechanisedBicycles, tricycles etc Non-motorised,
but mechanisedRikshaw, becaks etc Non-motorised,
but mechanisedMotor assisted bicycles(«!mopeds!»)
Motorised,Private
Motorcycles Motorised,Private
Private car drivers Motorised,Private
Private car passengers Motorised,Private
Utility vehicles Motorised,Private
Taxi Motorised,Private
Vanpools, carpools etc Motorised,Private
Minibuses (jitneys,bemos etc)
Motorised,Public
Dial-a-bus, demandresponsive bus
Motorised,Public
Conventional bus Motorised,Public
Ferries Motorised,Public
Fixed guidewaymodes (rail, metro,trolleybus, etc)
Motorised,Public
FREEWAY NETWORK LENGTH
The freeway network length is defined as: The total centre-line networklength of segregated express roads (freeways/motorways).
Express roads must be fully controlled access or segregated highways (iewithout any level intersections or traffic lights and no property access).
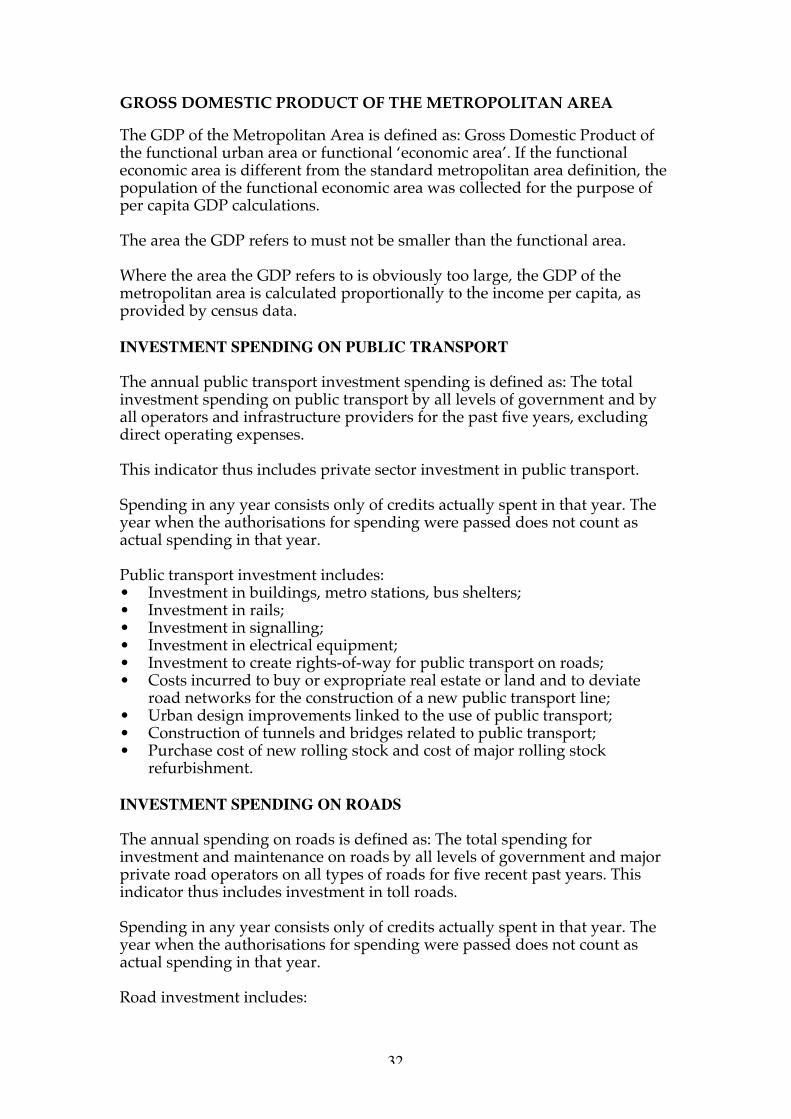
32
GROSS DOMESTIC PRODUCT OF THE METROPOLITAN AREA
The GDP of the Metropolitan Area is defined as: Gross Domestic Product ofthe functional urban area or functional ‘economic area’. If the functionaleconomic area is different from the standard metropolitan area definition, thepopulation of the functional economic area was collected for the purpose ofper capita GDP calculations.
The area the GDP refers to must not be smaller than the functional area.
Where the area the GDP refers to is obviously too large, the GDP of themetropolitan area is calculated proportionally to the income per capita, asprovided by census data.
INVESTMENT SPENDING ON PUBLIC TRANSPORT
The annual public transport investment spending is defined as: The totalinvestment spending on public transport by all levels of government and byall operators and infrastructure providers for the past five years, excludingdirect operating expenses.
This indicator thus includes private sector investment in public transport.
Spending in any year consists only of credits actually spent in that year. Theyear when the authorisations for spending were passed does not count asactual spending in that year.
Public transport investment includes:• Investment in buildings, metro stations, bus shelters;• Investment in rails;• Investment in signalling;• Investment in electrical equipment;• Investment to create rights-of-way for public transport on roads;• Costs incurred to buy or expropriate real estate or land and to deviate
road networks for the construction of a new public transport line;• Urban design improvements linked to the use of public transport;• Construction of tunnels and bridges related to public transport;• Purchase cost of new rolling stock and cost of major rolling stock
refurbishment.
INVESTMENT SPENDING ON ROADS
The annual spending on roads is defined as: The total spending forinvestment and maintenance on roads by all levels of government and majorprivate road operators on all types of roads for five recent past years. Thisindicator thus includes investment in toll roads.
Spending in any year consists only of credits actually spent in that year. Theyear when the authorisations for spending were passed does not count asactual spending in that year.
Road investment includes:
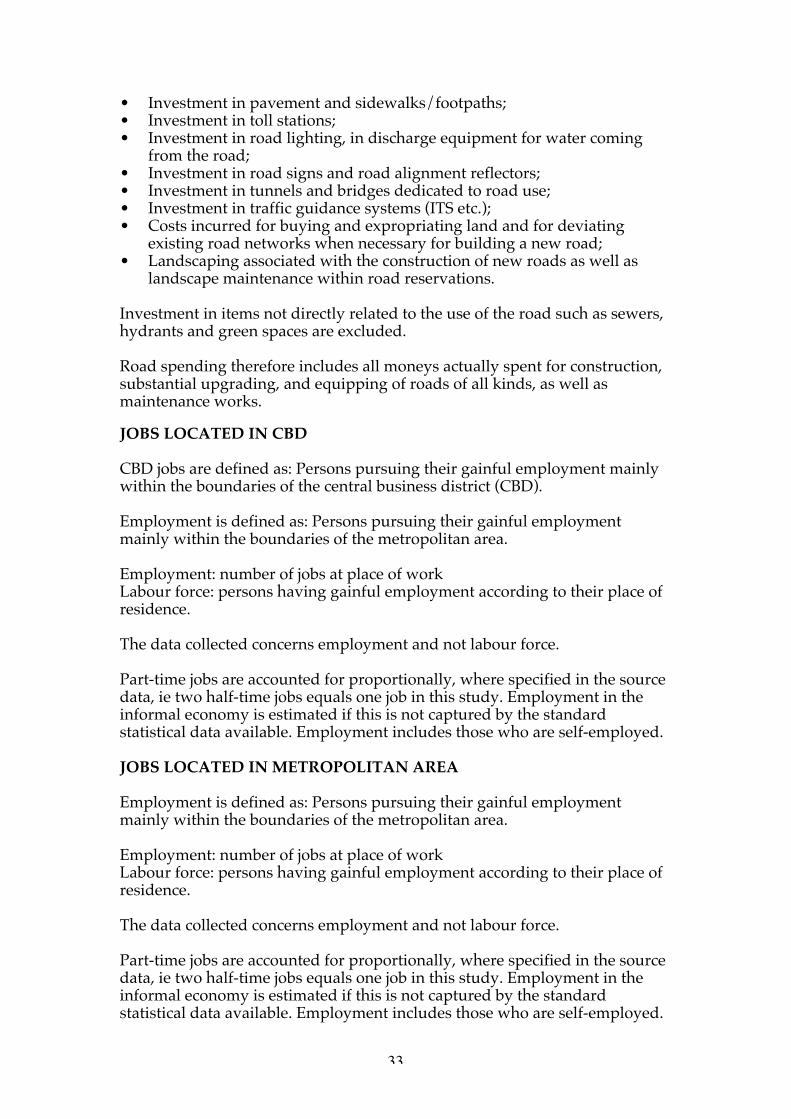
33
• Investment in pavement and sidewalks/footpaths;• Investment in toll stations;• Investment in road lighting, in discharge equipment for water coming
from the road;• Investment in road signs and road alignment reflectors;• Investment in tunnels and bridges dedicated to road use;• Investment in traffic guidance systems (ITS etc.);• Costs incurred for buying and expropriating land and for deviating
existing road networks when necessary for building a new road;• Landscaping associated with the construction of new roads as well as
landscape maintenance within road reservations.
Investment in items not directly related to the use of the road such as sewers,hydrants and green spaces are excluded.
Road spending therefore includes all moneys actually spent for construction,substantial upgrading, and equipping of roads of all kinds, as well asmaintenance works.
JOBS LOCATED IN CBD
CBD jobs are defined as: Persons pursuing their gainful employment mainlywithin the boundaries of the central business district (CBD).
Employment is defined as: Persons pursuing their gainful employmentmainly within the boundaries of the metropolitan area.
Employment: number of jobs at place of workLabour force: persons having gainful employment according to their place ofresidence.
The data collected concerns employment and not labour force.
Part-time jobs are accounted for proportionally, where specified in the sourcedata, ie two half-time jobs equals one job in this study. Employment in theinformal economy is estimated if this is not captured by the standardstatistical data available. Employment includes those who are self-employed.
JOBS LOCATED IN METROPOLITAN AREA
Employment is defined as: Persons pursuing their gainful employmentmainly within the boundaries of the metropolitan area.
Employment: number of jobs at place of workLabour force: persons having gainful employment according to their place ofresidence.
The data collected concerns employment and not labour force.
Part-time jobs are accounted for proportionally, where specified in the sourcedata, ie two half-time jobs equals one job in this study. Employment in theinformal economy is estimated if this is not captured by the standardstatistical data available. Employment includes those who are self-employed.

34
JOURNEY-TO-WORK AVERAGE TRIP LENGTH (KM)
Average length of a journey-to-work trip for all modes is defined as:The average kerb-to-kerb (ie from the boarding into the first vehicle to the exitfrom the last vehicle) length of a home-to-work commute made in themetropolitan area for all modes.The indicator just includes trips within the metropolitan area (and not tripswith only one end in the metropolitan area).
This definition includes all commutes made by residents of the metropolitanarea. A trip is defined as home-to-work if work is the main reason for the trip,even if other purposes are present in the trip (eg. shopping after work).
The distance is defined as a kerb-to-kerb distance (ie. from the boarding intothe first vehicle to the exit from the last vehicle).
NUMBER OF CARS
The total number of cars is defined as: All motor vehicles with three or morewheels, which are primarily used for private passenger transport and in useat the reference date.
This includes cars, station wagons, recreational vehicles (inc. four-wheeldrives), and utility trucks only if they are mainly used for transporting people(excluding any form of public transport). Any commercial minibuses andtaxis are excluded. Only active vehicles are sought (ie. no scrapped vehicleswhich are still registered). Company cars and rental cars are included.
NUMBER OF MOTOR CYCLES
The total number of motorcycles is defined as: All motor vehicles with twowheels, which are admitted to general traffic.
This definition includes all classes of motorcycles as well as motor-assistedbicycles (mopeds) and motorcycles with attached side-cars.
PARK AND RIDE SPACES
Park and Ride Facilities are groups of car parking places which:• are exclusively reserved to those who use public transport from that
location, or• are available at a discounted rate to those that use public transport from
that location, or• are located such that they are only attractive to public transport users.
(eg they are located where there is no other destination than a publictransport stop).
The total capacity is the sum of all P+R places offered in all facilities.

35
PARKING SPACES IN THE CBD
This is the sum of off-street and on-street parking supply in the CBD definedas follows:
Off-street parking is defined as: The total number of off-street parking places(bays), which are publicly accessible or accessible to tenants of commercialbuildings (ie are not private resident’s parking).
This includes surface parking areas or lots and underground/coveredparking areas and parking lots, including tenant parking attached to specificcommercial buildings and parking at workplace. The intention here is tomeasure the publicly available and commercial tenant off-street parkingsupply in the central business district. Permanent, private resident parking isexcluded.
On-street parking is defined as: The total number of on-street parking places(bays).
The intention here is to measure the publicly available on-street parkingsupply in the central business district.
PASSENGER KILOMETRES IN CARS
The total car passenger kilometres are defined as: Total annual passengerkilometres travelled in cars on all classes of roads.
This indicator is often not directly available. In those cases, the average caroccupancy is collected and this is multiplied by the vehicle kms (VKT) in cars.Car occupancy data are generally supplied from surveys conducted byauthorities across a variety of screen-lines. It is also possible to retrieve thisitem from household survey data or accident records.
Data for 24 hour, 7 days-of-the-week averages of car occupancy werecollected. Where it was impossible to retrieve proper 24 hour/7 dayaverages, as much data as possible were collected for as many periods of theday and days of the week as available, and then a reasonable average wasestimated by proper weighting of the occupancy data.
PASSENGER KILOMETRES IN MOTOR CYCLES
The total motorcycle passenger kilometres are defined as: Total annualpassenger kilometres travelled on motorcycles or motor-assisted bicycles onall classes of roads.
This indicator is often not directly available. In those cases, the averagemotorcycle occupancy is collected and this is multiplied by the vehicle kms(VKT) in motor cycles.
Motor cycle occupancy data are generally supplied from surveys conductedby authorities across a variety of screen-lines. It is also possible to retrieve thisitem from household survey data or accident records.

36
Data for 24 hour, 7 days-of-the-week averages of car occupancy werecollected. Where it was impossible to retrieve proper 24 hour/7 dayaverages, as much data as possible were collected for as many periods of theday and days of the week as available, and then a reasonable average wasestimated by proper weighting of the occupancy data.
POPULATION OF METROPOLITAN AREA
The population is defined as: Total residential population of the metropolitanarea.
PRIVATE PASSENGER TRANSPORT ENERGY USE
The total annual private passenger transport energy consumption is definedas: The total annual consumption of propulsion fuel for cars and motorcycles.
For the most part, two items are collected here, namely the total annualconsumption of gasoline, motor spirit or petrol as it is variously known, anddiesel. Where other fuels, generally liquefied petroleum gas (LPG), are usedin significant proportions, they are collected too. It has been necessary toseparate freight fuel use from passenger transport fuel use where fuel figuresare combined. All fuel data are converted into Megajoules according tostandard conversions shown in the table below.
Fuel type Conversion factorMotor spirit(Petrol, Gasoline)
34.69 MJ/litre
AutomotiveDistillate (Diesel)
38.29 MJ/litre
LPG 26.26 MJ/litreElectric power 3.60 MJ/kWh
Note: 1 Imperial gallon = 4.546 litres1 US gallon = 3.785 litresMJ = Megajoules
In some cases it was not possible to collect actual fuel data from any source. Inthese cases an average fuel consumption per unit distance for an average ortypical passenger car and motorcycle was obtained in any units (eg km/l orl/100km or mpg). The figures provided were deemed to represent theaverage or typical car or motorcycle travelling in road conditionscharacteristic of the city. This was mainly an issue in developing cities, not somuch in developed cities.
PRIVATE TRANSPORT OPERATING COSTS
The operating costs of private transport include both variable and fixed costof driving a car:• Depreciation for the car purchase (based on a 10 year life expectancy)• Fuel• Cost of spare parts

37
• Car insurance• Taxes on car ownership
As an average cost of driving a car is frequently not available, typical vehiclesare used in most cases. In Australia and Asia a Toyota Corolla is a typicalreference make of car, while in Europe, the Volkswagen Golf is used. In bothcases, a 1600 cc model is the reference.
In developing cities where motorcycles are a considerable part of the modalshare, the average cost of using a motorcycle is incorporated accordingly.
This indicator excludes the cost of travel time.
PUBLIC TRANSPORT BOARDINGS
The total annual public transport boardings are defined as: The total annualpublic transport boardings, detailed by mode and by operator.
This means, every time a person boards a vehicle, this counts as a boarding.Some operators record linked trips, or revenue trips. This refers to the totalpublic transport journey made by a person, even if the person needed to use anumber of public transport services. The conversion factor between the two isreferred to as the transfer rate. A conversion factor based on the knowntransfer rate is thus applied in the case of revenue trips.Boardings = Linked trips x rate of transfer.
PUBLIC TRANSPORT ENERGY USE
The total annual public transport energy consumption is defined as: Theannual public transport traction energy consumption, detailed by mode andby operator.
All traction energy for all modes of public transport is collected for this item.Station energy use is specifically excluded. The data are collected by type ofpropulsion energy, typically diesel and electricity, but in some cases alsopetrol (gasoline), LPG, CNG or others. All data are converted to megajoulesusing standard conversion factors as shown in the table below.
Fuel type Conversion factorMotor spirit(Petrol, Gasoline)
34.69 MJ/litre
AutomotiveDistillate (Diesel)
38.29 MJ/litre
LPG 26.26 MJ/litreElectric power 3.60 MJ/kWh
Note: 1 Imperial gallon = 4.546 litres1 US gallon = 3.785 litresMJ = Megajoules
On the rare occasion that public transport operators do not know the annualfuel use of their vehicles (eg in some paratransit systems), then it was possible

38
to obtain a typical fuel consumption rate per unit distance of the averagevehicle (in km/l, l/100km or mpg.
PUBLIC TRANSPORT FAREBOX REVENUE
The total farebox revenue is defined as: The total revenue from passengerfares, including supplements or fines charged for fare evasion.
This definition includes all revenue for transport services.It does not include:• Ancilliary revenue (rent, advertising),• Operating subsidies such as reimbursements for operation of non-
profitable lines or direct deficit coverage.
Government reimbursements for subsidised tickets, ie tickets for particulargroups of persons (eg pensioners, students, military, etc) were collected butspecified separately. These were included in the operating cost recovery.
PUBLIC TRANSPORT OPERATING COSTS
The annual public transport operating cost is defined as: The total operatingcost of public transport by all operators.
Public transport operating costs include:• Purchase of energy and of supplies of goods and services (including
subcontractor’s services);• Personnel costs: salaries, charges, retirement pensions, etc;• Overheads (rent, etc.);• Financial charges (interest payments);• Depreciation;• Maintenance of rolling stock and infrastructure;• Taxes and fees.
Financial charges and depreciation are specified separately and are excludedfrom the operating cost recovery.
PUBLIC TRANSPORT OPERATING COST RECOVERY
The public transport operating cost recovery is defined as: The fareboxrevenue including subsidies to fares and community service obligationsdivided by the operating costs, excluding financial charges and depreciation.
PUBLIC TRANSPORT PASSENGER KILOMETRES
The total annual public transport passenger kilometres are defined as: Theannual public transport passenger kilometres, detailed by mode and byoperator.
Should passenger kilometres not be available, it is necessary to instead collectthe average trip length, ie the average kerb-to-kerb length of an unlinkedpublic transport trip (boarding).

39
The passenger kilometres are the result of multiplying these trip lengths withthe number of boardings. Where only revenue trips are provided, theaverage trip length of a revenue trip was collected.
PUBLIC TRANSPORT SEAT KILOMETRES OF SERVICE
The total annual public transport seat kilometres of service is defined as: Thetotal annual public transport revenue seat-kilometres, detailed by mode andby operator.
Revenue seat-kms are calculated for vehicle kms on revenue service runs (ierevenue vehicle kilometres, which exclude trips between the terminal and thedepot (dead-heading).
Only sitting places are counted. It thus excludes standing places.
PUBLIC TRANSPORT VEHICLE FLEET
The active public transport vehicle fleet is defined as: The total active vehiclefleet, detailed by mode and by operator. In the case of rail modes, one vehiclecorresponds to one car or one wagon or one element for light rail systems.Each slip coach is considered as a vehicle.On the contrary, one articulated vehicle will be considered as a single vehicle.
It was necessary to group some smaller operators together in some cities.Typically, there are between one and three (sometimes more) large operatorspresent in any one city, and a large number of small operators.
The definition of minibus will mostly vary according to the local context;though, as a general rule, buses of 8 metres length and less area considered asminibus. Jeepneys, Peseros, Busetas, etc are considered as minibuses.
Automated guideway transit systems (such as Vancouver’s Skytrain or Lille’sVAL) are grouped under metro systems, except for shuttles dedicated tointernal transit of airports.“Other modes” includes ferries, aerial cableways and other modes withgenerally minor significance in the overall network.
PUBLIC TRANSPORT VEHICLE KILOMETRES OF SERVICE
The total annual public transport vehicle kilometres of service is defined as:The total annual public transport revenue vehicle kilometres, detailed bymode and by operator.
Revenue vehicle kilometres is the distance travelled by public transportvehicles on revenue service runs, and thus excludes trips between theterminal and the depot (dead-heading).
Revenue vehicle kilometres measures car or wagon kilometres in the case ofrail modes, not train kilometres. Where no wagon kilometres are available,the average number of wagons per train (ie the average train consist size) wascollected and multiplied by the train kilometres.

40
RESERVED PUBLIC TRANSPORT ROUTE LENGTH
The length of reserved public transport routes is defined as: The total lengthof reserved public transport routes, detailed by mode and by operator.
Reserved routes refer to all route segments that are for exclusive use of publictransport vehicles. This includes dedicated tram alignments, segregatedrailways, and dedicated busways, only if they are separated from the otherlanes by physical obstacles which make the access by other vehicles to the buslane difficult or impossible. For bus lanes, the length of the reserved routes isdefined as the two-way length of the facility divided by two.
ROAD NETWORK LENGTH
The total road network length (Indicator 15) is defined as: The total centre-linenetwork length of all classes of roads.
Road network length is defined as the total centre-line kilometres or miles ofall public roads. Multiple-lane roads are counted the same as single-laneroads. Unpaved public roads are included. Roads which are predominantlyused for forestry and agriculture are excluded. Residential streets areincluded.
TOTAL PASSENGER TRANSPORT COST
The total cost of passenger transport is defined as: The sum of road andpublic transport investment and private and public operating costs in aspecific year.
This indicator excludes the cost of travel time.
TOTAL PASSENGER TRANSPORT COST AS A PERCENTAGE OF GDP
The total cost of passenger transport as a percentage of GDP is defined as: Theratio of the total passenger transport cost divided by metropolitan GDP,expressed as a percentage.
TRANSPORT DEATHS
Transport fatalities are defined as: Persons who have died according to WorldHealth Organisation International Classification of Diseases (ICD) codesE810-E825, and who were residing at the time of death within themetropolitan area.
These statistics are routinely kept by Health or Statistical agencies and areconsiderably more reliable than police records. Police records alwaysunderestimate transport deaths because they only record deaths at the sceneof accidents, not up to 30 days later in hospital, as in the WHO records.

41
TRANSPORT EMISSIONS
Air pollutant emissions are defined as: The total emissions of CO (carbonmonoxide), SO2 (sulfur dioxide), NOx (oxides of nitrogen) and VHC (volatilehydrocarbons or unburnt petrol) from all transport sources.
It is desirable to include the electricity generation component of publictransport, but this will in general not significantly affect the results.
URBANISED LAND AREA
The urbanised area is defined as: Built-up land area of the metropolitanregion.
The table below indicates in detail which land uses are considered urban (u)and which ones non-urban (n-u):
Land use category Type CommentAgricultural n-uMeadows, pastures n-uGardens, parks u small, intensive
usageForest, urban forest n-u large, significant
‘natural’ areasWasteland(natural)
n-u flood plains, rocksand the like
Wasteland (urban) u derelict land,culverts
Transport u Road area, railwayland, airports etc.
Recreational u,n-u
Depending onintensity of use(example: Skiingarea: non-urban,Golf course:urban)
Residential uIndustrial uOffices uCommercial uPublic Utilities uHospitals uSchools, Cultural uSports grounds uWater surfaces n-un-u=non-urban, u=urban

42
VEHICLE KILOMETRES OF TRAVEL IN CARS
The total car VKT is defined as: Total annual vehicle kilometres travelled incars on all classes of roads, including residential streets (definition of a car isas in “number of cars”).
Car VKT is defined as the sum of all distances travelled by private motorisedpassenger vehicles. In some cases this indicator was not directly availablefrom traffic models and was derived from travel surveys, motor vehicle usagesurveys or models other than traffic models, such as energy or pollutionmodels.
Estimates sometimes needed to be based on the number of cars multiplied bythe average annual distance travelled per car (this was mainly developingcities where transport modelling was less developed). Where the transport ortraffic model only produces total vehicle kilometres by all classes of vehicle(cars, trucks, etc.), then an estimate was obtained of the percentage of totalVKT which is accounted for by cars (eg in developed cities, this usually fallsbetween 80% and 95% of total VKT).
VEHICLE KILOMETRES OF TRAVEL IN MOTOR CYCLES
The total motorcycle VKT is defined as: Total annual vehicle kilometrestravelled in two-wheeled motor vehicles on all classes of roads.
Motorcycle VKT are defined as the sum of all distances travelled by two-wheeled motor vehicles. In many cases this indicator was directly availablefrom traffic models and was derived from travel surveys, motor vehicle usagesurveys or models other than traffic models, such as energy or pollutionmodels. Similar comments, as for car VKT, about estimation procedures applyhere.

43
Appendix 3 Standardised comparative variables calculated in the studyStandardised Indicator Units
Characteristics of the metropolitan areaUrban density persons/haJob density jobs/haProportion of jobs in CBD percentage (%)Metropolitan gross domestic product per capita US$
Supply indicators
Private Transport Infrastructure IndicatorsLength of road per person m/personLength of freeway per person m/personLength of road per urban hectare m/haLength of freeway per urban hectare m/haParking spaces per 1000 CBD jobs spaces/1000 jobs
Public Transport Infrastructure IndicatorsTotal length of public transport lines per capita m/personTotal length of reserved public transport routes per capita m/person• Busway length per capita m/person• Segregated tram network length per capita m/person• Metro network length per capita m/person• Suburban rail network length per capita m/person• Heavy rail network length per capita m/personTotal length of reserved public transport routes per urban hectare m/ha• Busway length per urban hectare m/ha• Segregated tram network length per urban hectare m/ha

44
• Metro network length per urban hectare m/ha• Suburban rail network length per urban hectare m/ha• Heavy rail network length per urban hectare m/ha
Intermodal Transport Infrastructure IndicatorsNumber of park and ride facilities per kilometre of reserved public transport route facilities/kmNumber of park and ride spaces per kilometre of reserved public transport route spaces/kmNumber of park and ride facilities per urban hectare facilities/haCar equivalents per number of park and ride spaces units/space
Private transport supply (cars and motorcycles)Passenger cars per 1000 people units/1000 peopleMotor cycles per 1000 people units/1000 peopleTotal private passenger vehicles per 1000 people units/1000 peoplePassenger car kilometres per car km/unitMotor cycle kilometres per motor cycle km/unitTotal private passenger vehicle kilometres per vehicle km/unit
Private collective transport supply (taxis and shared taxis)Taxis per capita units/personShared taxis per capita units/personTaxi vehicle kilometres per capita vehicle km/personShared taxi vehicle kilometres per capita vehicle km/person
Traffic Intensity IndicatorsPassenger cars per kilometre of road units/kmMotor cycles per kilometre of road units/kmTotal private passenger vehicles per kilometre of road unit equivalents/kmTotal single and collective private passenger vehicles per kilometre of road unit equivalents/kmPassenger car kilometres per kilometre of road vehicle km/kmMotor cycle kilometres per kilometre of road vehicle km/kmTotal private passenger vehicle kilometres per kilometre of road vehicle km/km

45
Total private and collective passenger vehicle kilometres per kilometre of road vehicle km/kmPassenger car kilometres per urban hectare vehicle km/haMotor cycle kilometres per urban hectare vehicle km/haTotal private passenger vehicle kilometres per urban hectare vehicle km/haTotal private and collective passenger vehicle kilometres per urban hectare vehicle km/haAverage road network speed km/h
Public Transport Supply and ServiceTotal public transport vehicles per capita units/person• Buses per capita units/person• Tram units per capita units/person• Metro units per capita units/person• Suburban rail units per capita units/person• Heavy rail units per capita units/personTotal public transport vehicle kilometres of service per capita vehicle km/person• Bus vehicle kilometres per capita vehicle km/person• Tram wagon kilometres per capita vehicle km/person• Metro wagon kilometres per capita vehicle km/person• Suburban rail wagon kilometres per capita vehicle km/person• Heavy rail wagon kilometres per capita vehicle km/personTotal public transport vehicle kilometres of service per urban hectare vehicle km/ha• Bus vehicle kilometres per urban hectare vehicle km/ha• Tram wagon kilometres per urban hectare vehicle km/ha• Metro wagon kilometres per urban hectare vehicle km/ha• Suburban rail wagon kilometres per urban hectare vehicle km/ha• Heavy rail wagon kilometres per urban hectare vehicle km/haTotal public transport seat kilometres of service per capita seat km/person• Bus seat kilometres per capita seat km/person• Tram seat kilometres per capita seat km/person• Metro seat kilometres per capita seat km/person• Suburban rail seat kilometres per capita seat km/person• Heavy rail seat kilometres per capita seat km/person

46
Overall average speed of public transport km/h• Average speed of buses km/h• Average speed of trams km/h• Average speed of metro km/h• Average speed of suburban rail km/h• Average speed of heavy rail km/h
Mobility Indicators
Overall mobilityDaily trips by foot per capita trips/personDaily trips by bicycle per capita trips/personDaily public transport trips per capita trips/personDaily private transport trips per capita trips/personTotal daily trips per capita trips/personMode split of all trips percentageMode split of mechanised trips percentageOverall average trip distance kmOverall average trip distance by car kmAverage distance of mechanised trips kmOverall average distance of the journey-to-work kmAverage distance of the journey-to-work by mechanised modes kmAverage time of a car trip minutesAverage time of a public transport trip minutes
Private Mobility Indicators (cars and motorcycles)Passenger car kilometres per capita km/personMotor cycle kilometres per capita km/personTotal private passenger vehicle kilometres per capita km/personPassenger car passenger kilometres per capita p. km per personMotor cycle passenger kilometres per capita p. km per personTotal private passenger kilometres per capita p. km per person

47
Private Mobility Indicators (taxis and shared taxis)Taxi passenger kilometres per capita p.km/personShared taxi passenger kilometres per capita p.km/personTaxi trips per capita trips/personShared taxi trips per capita trips/person
Public Transport Mobility IndicatorsTotal public transport boardings per capita boardings/person• Bus boardings per capita boardings/person• Tram boardings per capita boardings/person• Metro boardings per capita boardings/person• Suburban rail boardings per capita boardings/person• Heavy rail boardings per capita boardings/personTotal public transport passenger kilometres per capita p.km/person• Bus passenger kilometres per capita p.km /person• Tram passenger kilometres per capita p.km /person• Metro passenger kilometres per capita p.km /person• Suburban rail passenger kilometres per capita p.km /person• Heavy rail passenger kilometres per capita p.km /person
User cost of transportAverage user cost of a car trip %GDP/tripAverage user cost of a public transport trip %GDP/tripUser cost of private transport per passenger kilometre %GDP/kmUser cost of public transport per passenger kilometre %GDP/kmCharge for on-street parking in the CBD %GDP/hCharge for off-street parking in the CBD %GDP/hAverage parking charge in the CBD %GDP/hFine for parking in no parking zone %GDPFine for obstructing public transport %GDP
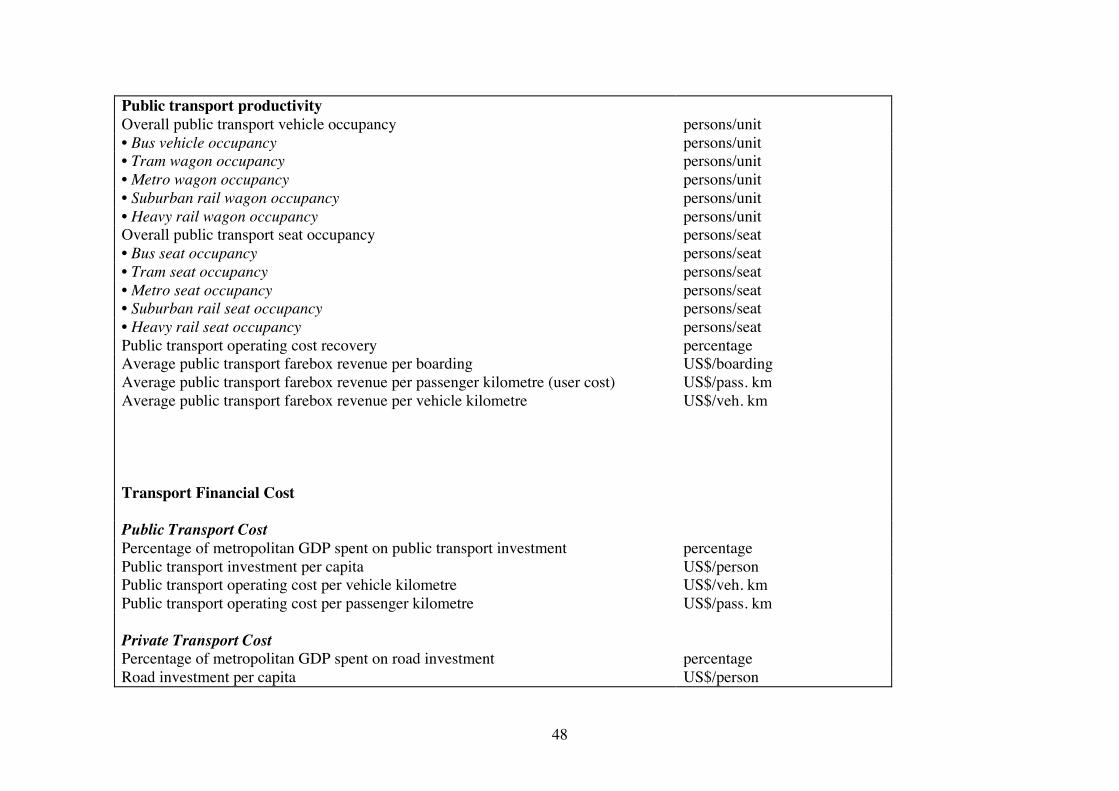
48
Public transport productivityOverall public transport vehicle occupancy persons/unit• Bus vehicle occupancy persons/unit• Tram wagon occupancy persons/unit• Metro wagon occupancy persons/unit• Suburban rail wagon occupancy persons/unit• Heavy rail wagon occupancy persons/unitOverall public transport seat occupancy persons/seat• Bus seat occupancy persons/seat• Tram seat occupancy persons/seat• Metro seat occupancy persons/seat• Suburban rail seat occupancy persons/seat• Heavy rail seat occupancy persons/seatPublic transport operating cost recovery percentageAverage public transport farebox revenue per boarding US$/boardingAverage public transport farebox revenue per passenger kilometre (user cost) US$/pass. kmAverage public transport farebox revenue per vehicle kilometre US$/veh. km
Transport Financial Cost
Public Transport CostPercentage of metropolitan GDP spent on public transport investment percentagePublic transport investment per capita US$/personPublic transport operating cost per vehicle kilometre US$/veh. kmPublic transport operating cost per passenger kilometre US$/pass. km
Private Transport CostPercentage of metropolitan GDP spent on road investment percentageRoad investment per capita US$/person

49
Annual road investment per kilometre of road US$/kmPrivate transport operating cost per vehicle kilometre US$/veh. kmPrivate transport operating cost per passenger kilometre US$/pass. km
Overall Transport CostOverall transport operating and investment cost per passenger kilometre US$/pass. kmTotal passenger transport cost per capita US$/personTotal passenger transport cost as percentage of metropolitan GDP percentage
Transport Externalities Indicators
Transport Energy IndicatorsPrivate passenger transport energy use per capita MJ/personPublic transport energy use per capita MJ/personTotal transport energy use per capita MJ/personEnergy use per private passenger vehicle kilometre MJ/kmEnergy use per public transport vehicle kilometre MJ/km• Energy use per bus vehicle kilometre MJ/km• Energy use per tram wagon kilometre MJ/km• Energy use per metro wagon kilometre MJ/km• Energy use per suburban rail wagon kilometre MJ/km• Energy use per heavy rail wagon kilometre MJ/kmEnergy use per private passenger kilometre MJ/p.kmEnergy use per public transport passenger kilometre MJ/p.km• Energy use per bus passenger kilometre MJ/p.km• Energy use per tram passenger kilometre MJ/p.km• Energy use per metro passenger kilometre MJ/p.km• Energy use per suburban rail passenger kilometre MJ/p.km• Energy use per heavy rail passenger kilometre MJ/p.kmOverall energy use per passenger kilometre MJ/p.km
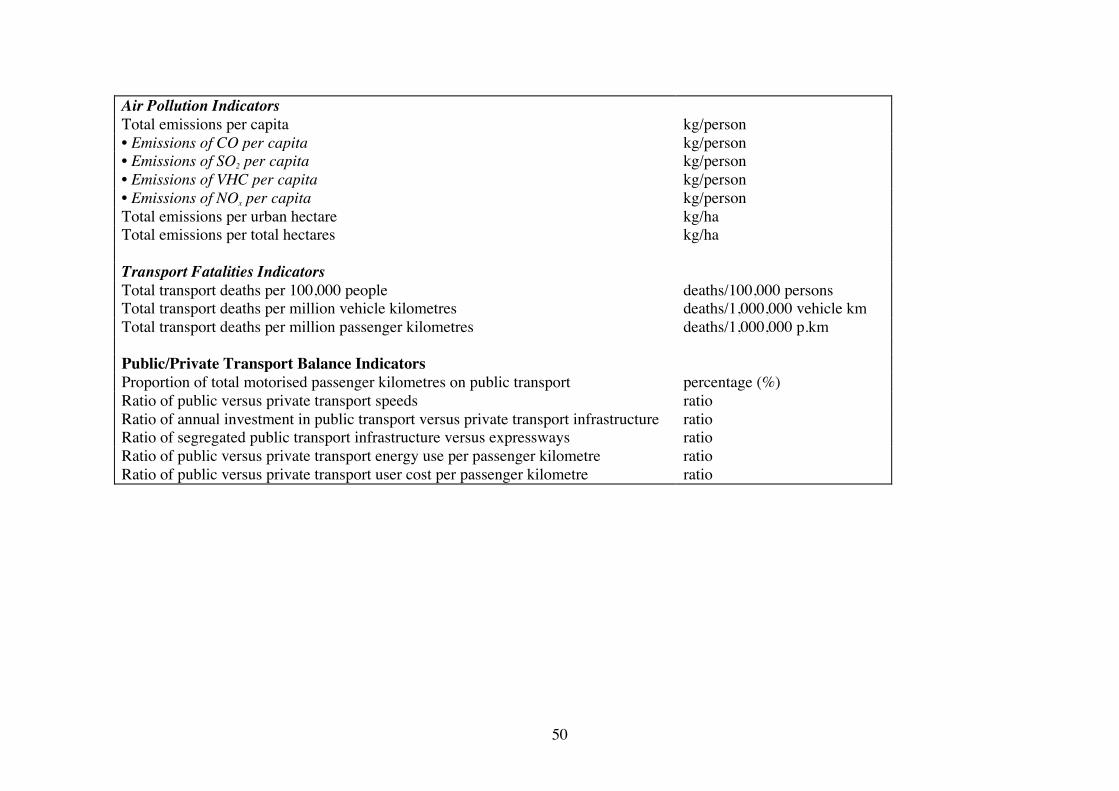
50
Air Pollution IndicatorsTotal emissions per capita kg/person• Emissions of CO per capita kg/person• Emissions of SO2 per capita kg/person• Emissions of VHC per capita kg/person• Emissions of NOx per capita kg/personTotal emissions per urban hectare kg/haTotal emissions per total hectares kg/ha
Transport Fatalities IndicatorsTotal transport deaths per 100,000 people deaths/100,000 personsTotal transport deaths per million vehicle kilometres deaths/1,000,000 vehicle kmTotal transport deaths per million passenger kilometres deaths/1,000,000 p.km
Public/Private Transport Balance IndicatorsProportion of total motorised passenger kilometres on public transport percentage (%)Ratio of public versus private transport speeds ratioRatio of annual investment in public transport versus private transport infrastructure ratioRatio of segregated public transport infrastructure versus expressways ratioRatio of public versus private transport energy use per passenger kilometre ratioRatio of public versus private transport user cost per passenger kilometre ratio
51
APPENDIX 4:Key summary data for cities by world region, 1995

52
USA ANZ CAN WEU HIALand Use and WealthUrban density persons/ha 14.9 15.0 26.2 54.9 150.3Proportion of jobs in CBD % 9.2% 15.1% 15.7% 18.7% 19.1%Metropolitan gross domestic product per capita USD $31,386 $19,775 $20,825 $32,077 $31,579Private Transport Infrastructure IndicatorsLength of freeway per person m/ person 0.156 0.129 0.122 0.082 0.020Parking spaces per 1000 CBD jobs 555 505 390 261 105Public Transport Infrastructure IndicatorsTotal length of reserved public transport routes per 1000 persons m/1000 pers 48.6 215.5 55.4 192.0 53.3Total length of reserved public transport routes per urban hectare m/ha 0.81 3.41 1.44 9.46 5.87Number of P and R spaces per km of reserved public transport route spaces/km 320 44 132 25 19Ratio of segregated transit infrastructure versus expressways 0.41 2.00 0.55 3.12 3.34Private transport supply (cars and motorcycles)Passenger cars per 1000 persons 587.1 575.4 529.6 413.7 210.3Motor cycles per 1000 persons 13.1 13.4 9.5 32.0 87.7Traffic Intensity IndicatorsTotal private passenger vehicles per km of road units/km 98.7 73.1 105.8 181.9 144.4Total single and collective private passenger vehicles per km of road units/km 98.9 73.3 106.1 183.1 149.6Average road network speed km/h 49.3 44.2 44.5 32.9 28.9Public Transport Supply and ServiceTotal public transport seat kilometres of service per capita seat km/pers 1,556.8 3,627.9 2,289.7 4,212.7 4,994.8Rail seat kilometres per capita (Tram, LRT, Metro, Sub. rail) seat km/pers 747.5 2,470.4 676.4 2,608.6 2,282.3% of public transport seat kms on rail % 48.0 68.1 29.5 61.9 45.7Overall average speed of public transport km/h 27.4 32.7 25.1 25.7 29.9 * Average speed of buses km/h 21.7 23.3 22.0 20.2 16.2 * Average speed of metro km/h 37.0 34.4 30.6 36.6 * Average speed of suburban rail km/h 54.9 45.4 49.5 49.5 47.1Ratio of public versus private transport speeds 0.58 0.75 0.57 0.79 1.04Mode split of all trips * non motorised modes % 8.1% 15.8% 10.4% 31.3% 28.5% * motorised public modes % 3.4% 5.1% 9.1% 19.0% 29.9% * motorised private modes % 88.5% 79.1% 80.5% 49.7% 41.6%

53
Private Mobility Indicators USA ANZ CAN WEU HIAPassenger car passenger kilometres per capita p.km/person 18,155 11,387 8,645 6,202 3,614Motor cycle passenger kilometres per capita p.km/person 45 81 21 119 357Public Transport Mobility IndicatorsTotal public transport boardings per capita bd./person 59.2 83.8 140.2 297.1 430.5Rail boardings per capita (Tram, LRT, Metro, Sub. rail) bd./person 21.7 42.5 44.5 162.2 238.3Proportion of public transport boardings on rail % 36.7% 50.7% 31.7% 54.6% 55.4%Proportion of total motorised passenger kilometres on pub. transport % 2.9% 7.5% 9.8% 19.0% 45.9%Public Transport ProductivityPublic transport operating cost recovery % 35.5% 52.7% 54.4% 59.2% 137.9%Transport Investment CostPercentage of metropolitan GDP spent on public transport investment % 0.18% 0.30% 0.18% 0.41% 0.61%Percentage of metropolitan GDP spent on road investment % 0.86% 0.72% 0.87% 0.70% 0.84%Overall Transport CostTotal passenger transport cost as % of metropolitan GDP % 11.79% 13.47% 13.72% 8.30% 7.08%Total private passenger transport cost as % of metropolitan GDP % 11.24% 12.39% 12.87% 6.75% 5.45%Total public passenger transport cost as % of metropolitan GDP % 0.55% 1.08% 0.85% 1.55% 1.62%Transport Energy IndicatorsPrivate passenger transport energy use per capita MJ/person 60,034 29,610 32,519 15,675 9,556Public transport energy use per capita MJ/person 809 795 1,044 1,118 1,423Energy use per private passenger kilometre MJ/p.km 3.25 2.56 3.79 2.49 2.33Energy use per public transport passenger kilometre MJ/p.km 2.13 0.92 1.14 0.83 0.48Air Pollution IndicatorsTotal emissions per capita (CO, SO2, VHC, NOx) kg/person 264.6 188.9 178.9 98.3 36.9Total emissions per urban hectare kg/ha 3,563 2,749 4,588 5,304 5,722Ratio of emissions per capita to private, collective and transit travel 0.020 0.024 0.027 0.020 0.012Transport Fatalities IndicatorsTotal transport deaths per 100,000 people 12.7 8.6 6.5 7.1 8.0Total transport deaths per billion passenger kilometres 7.0 6.8 7.1 9.6 10.8
Table A4.1 Key land use and transport system characteristics in higher income regions, 1995.

54
EEU MEA LAM AFR LIA CHNLand Use and WealthUrban density persons/ha 52.9 118.8 74.7 59.9 204.1 146.2Proportion of jobs in CBD % 20.3% 13.5% 29.4% 15.4% 17.4% 50.8%Metropolitan gross domestic product per capita USD $5,951 $5,479 $4,931 $2,820 $3,753 $2,366Private Transport Infrastructure IndicatorsLength of freeway per person m/ person 0.031 0.053 0.003 0.018 0.015 0.003Parking spaces per 1000 CBD jobs 75 532 90 252 127 17Public Transport Infrastructure IndicatorsTotal length of reserved public transport routes per 1000 persons m/1000 pers 200.8 16.1 19.3 40.2 16.1 2.3Total length of reserved public transport routes per urban hectare m/ha 10.67 2.18 1.15 2.39 2.50 0.32Number of P and R spaces per km of reserved public transport route spaces/km 5 50 4 10 9 0Ratio of segregated transit infrastructure versus expressways 9.11 3.54 3.36 3.16 1.33 0.77Private transport supply (cars and motorcycles)Passenger cars per 1000 persons 331.9 134.2 202.3 135.1 105.4 26.1Motor cycles per 1000 persons 20.8 19.1 14.3 5.5 127.3 55.1Traffic Intensity IndicatorsTotal private passenger vehicles per km of road units/km 168.8 180.7 144.1 58.4 236.1 117.2Total single and collective private passenger vehicles per km of road units/km 170.9 197.1 146.2 60.0 249.1 131.8Average road network speed km/h 30.8 32.1 31.5 39.3 21.9 18.7Public Transport Supply and ServiceTotal public transport seat kilometres of service per capita seat km/pers 4,170.3 1,244.6 4,481.2 5,450.3 2,698.8 1,171.3Rail seat kilometres per capita (Tram, LRT, Metro, Sub. rail) seat km/pers 2,478.8 125.7 316.1 1715.5 402.4 44.6% of public transport seat kms on rail % 59.4 10.1 7.1 31.5 14.9 3.8Overall average speed of public transport km/h 21.4 20.9 18.4 31.4 18.0 13.6 * Average speed of buses km/h 19.3 18.5 17.8 25.8 16.2 12.5 * Average speed of metro km/h 29.5 32.4 33.9 35.4 * Average speed of suburban rail km/h 37.6 36.6 41.0 34.4 33.0Ratio of public versus private transport speeds 0.71 0.68 0.60 0.80 0.81 0.73Mode split of all trips * non motorised modes % 26.2% 26.6% 30.7% 41.4% 32.4% 65.0% * motorised public modes % 47.0% 17.6% 33.9% 26.3% 31.8% 19.0% * motorised private modes % 26.8% 55.9% 35.4% 32.3% 35.9% 15.9%
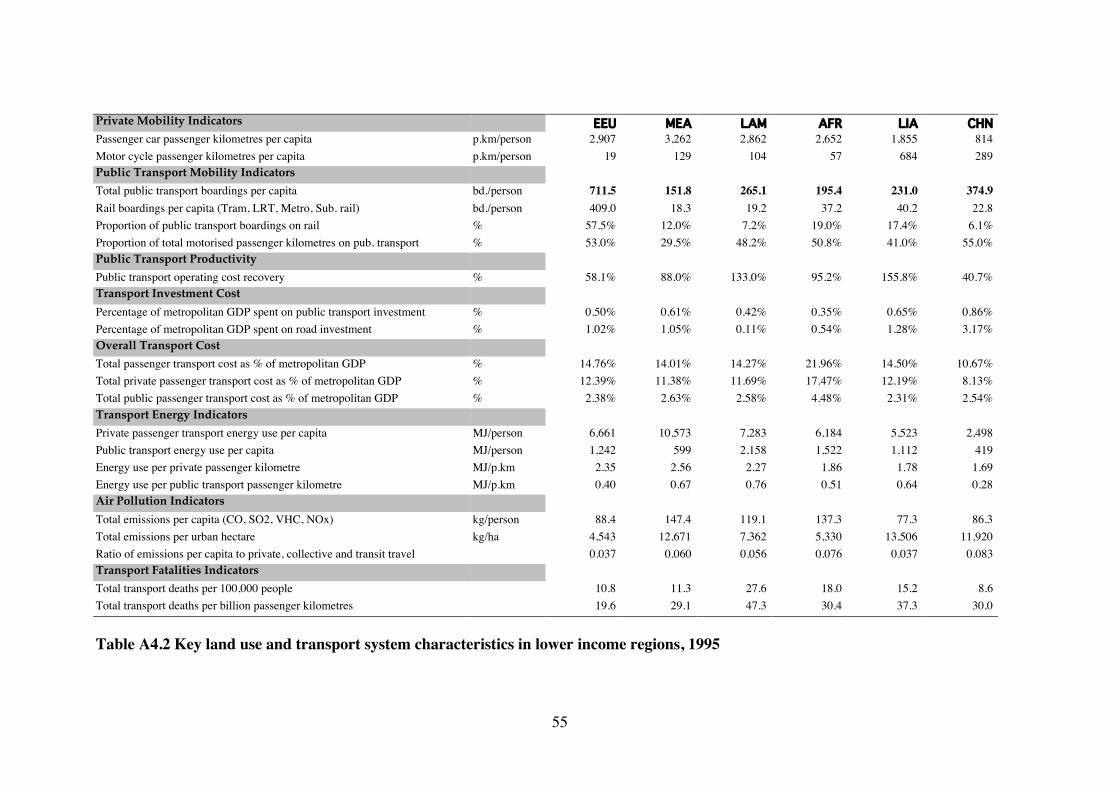
55
Private Mobility Indicators EEU MEA LAM AFR LIA CHNPassenger car passenger kilometres per capita p.km/person 2,907 3,262 2,862 2,652 1,855 814Motor cycle passenger kilometres per capita p.km/person 19 129 104 57 684 289Public Transport Mobility IndicatorsTotal public transport boardings per capita bd./person 711.5 151.8 265.1 195.4 231.0 374.9Rail boardings per capita (Tram, LRT, Metro, Sub. rail) bd./person 409.0 18.3 19.2 37.2 40.2 22.8Proportion of public transport boardings on rail % 57.5% 12.0% 7.2% 19.0% 17.4% 6.1%Proportion of total motorised passenger kilometres on pub. transport % 53.0% 29.5% 48.2% 50.8% 41.0% 55.0%Public Transport ProductivityPublic transport operating cost recovery % 58.1% 88.0% 133.0% 95.2% 155.8% 40.7%Transport Investment CostPercentage of metropolitan GDP spent on public transport investment % 0.50% 0.61% 0.42% 0.35% 0.65% 0.86%Percentage of metropolitan GDP spent on road investment % 1.02% 1.05% 0.11% 0.54% 1.28% 3.17%Overall Transport CostTotal passenger transport cost as % of metropolitan GDP % 14.76% 14.01% 14.27% 21.96% 14.50% 10.67%Total private passenger transport cost as % of metropolitan GDP % 12.39% 11.38% 11.69% 17.47% 12.19% 8.13%Total public passenger transport cost as % of metropolitan GDP % 2.38% 2.63% 2.58% 4.48% 2.31% 2.54%Transport Energy IndicatorsPrivate passenger transport energy use per capita MJ/person 6,661 10,573 7,283 6,184 5,523 2,498Public transport energy use per capita MJ/person 1,242 599 2,158 1,522 1,112 419Energy use per private passenger kilometre MJ/p.km 2.35 2.56 2.27 1.86 1.78 1.69Energy use per public transport passenger kilometre MJ/p.km 0.40 0.67 0.76 0.51 0.64 0.28Air Pollution IndicatorsTotal emissions per capita (CO, SO2, VHC, NOx) kg/person 88.4 147.4 119.1 137.3 77.3 86.3Total emissions per urban hectare kg/ha 4,543 12,671 7,362 5,330 13,506 11,920Ratio of emissions per capita to private, collective and transit travel 0.037 0.060 0.056 0.076 0.037 0.083Transport Fatalities IndicatorsTotal transport deaths per 100,000 people 10.8 11.3 27.6 18.0 15.2 8.6Total transport deaths per billion passenger kilometres 19.6 29.1 47.3 30.4 37.3 30.0
Table A4.2 Key land use and transport system characteristics in lower income regions, 1995

56
The key to regional abbreviations used in Tables A4.1 and 4.2 is as follows. The specificcities comprising the regional averages are found in Table 1 at the beginning of thesubmission.
HIGHER INCOMEUSA US citiesANZ Australia/New Zealand citiesCAN Canadian citiesWEU Western European citiesHIA High income Asian
LOWER INCOMEEEU Eastern European citiesMEA Middle Eastern citiesLAM Latin American citiesAFR African citiesLIA Low income Asian citiesCHN Chinese cities