
Sustainable Transport Infrastructure Charging and ......TRT TRASPORTI E TERRITORIO SRL *Only for...
28
TRT TRASPORTI E TERRITORIO SRL *Only for Milano headquarters Sustainable Transport Infrastructure Charging and Internalisation of Transport Externalities Study for the European Commission, DG MOVE Dr. Silvia Maffii, TRT Managing Director ESPO Conference Livorno, May 24 th , 2019
Transcript of Sustainable Transport Infrastructure Charging and ......TRT TRASPORTI E TERRITORIO SRL *Only for...

TRT TRASPORTI E TERRITORIO SRL
*Only for Milano
headquarters
Sustainable Transport Infrastructure
Charging and Internalisation of
Transport ExternalitiesStudy for the European Commission, DG MOVE
Dr. Silvia Maffii, TRT Managing Director
ESPO Conference
Livorno, May 24th, 2019

2
• This presentation shows the main finding of the
study Sustainable Transport Infrastructure Charging and Internalisation of Transport Externalities
• Project consortium:
• CE-Delft (NL) Team Leader
• TRT (IT)
• Ricardo (UK),
• INFRAS (CH),
• Planco (DE),
• ISL (DE)
• PMR (PL)
Preamble

3
• Project timeline: September 2017 – May 2019
• Main Deliverables:
1. Overview of transport infrastructure expenditures costs
2. Handbook on the external costs of transport: version 2019
3. Transport taxes and charges in Europe: an overview study of
economic internalisation measures applied in Europe
4. State of play of internalisation in the European transport
sector
5. Final report: sustainable transport infrastructure charging
and internalisation of transport externalities
Preamble

Outline of the presentation
4
• Background
• Objectives
• Scope
• Approach
• Methodology
• Infrastructure and external costs
• Transport taxes and charges
• State of play of internalisation
• Conclusions
• Policy applications

Background of the study
• Transport is a precondition for the functioning of
modern society and for the well being of people and
economy
• Transport activities however generate a range of
external effects (pollution, noise, accidents, etc.)
• Construction and management of transport
infrastructures give rise to significant costs
• Without policy interventions the external and
infrastructure costs tend not to be borne by transport
users
5

Objectives of the study
• Provide a very comprehensive overview of external
costs, infrastructure costs and transport related
taxes and charges (*)
• Better understand to what extent existing policies
internalise infrastructure and external costs
• Estimate total, average and marginal figures - the
first two were missing in previous studies
• Investigate options for further internalisation of
transport infrastructure and external costs (market-
based (charges, taxes), regulatory (emission standards)
and voluntary instruments (industrial agreement))
(*) the study does not consider transport subsidies and public service
obligations, with the exception of tax/charge breaks or exemptions.
Subsidies for infrastructure (e.g. CEF funding) are fully accounted
6

Scope of the study
• Transport modes and vehicles
• Geographical coverage
→ Road, rail and IWT for the EU28
→ Maritime 33 selected EU ports
→ Aviation 34 selected EU airports
→ Specific results for NO, CH, US, CA, JP
7
Road Rail IWT Maritime Aviation
▪ Passenger
car
▪ Motorcycle
▪ Bus
▪ Coach
▪ Van
▪ Heavy Goods
Vehicle
▪ High speed
train
▪ Passenger
train electric
▪ Passenger
train diesel
▪ Freight train
electric
▪ Freight train
diesel
▪ Inland vessel ▪ Freight vessel ▪ Passenger
aircraft

For each transport mode and vehicle:
• Elaboration of consistent transport performance
dataset (i.e., v-km, p-km and t-km)
• Estimation of infrastructure and external costs
• Identification and measurement of taxes and charges
• Assessment of the extent to which external and
infrastructure costs are internalised by current taxes
and charges (i.e., cost-coverage ratio)
• 2016 adopted as base year for costs, taxes and
charges
• Purchase Power Standard (PPS) adjustments
8
Methodology for assessing the
internalisation level

Infrastructure costs
9
Infrastructure cost categories:
▪ Construction and enhancement (fixed)
▪ Operational (fixed)
▪ Maintenance and renewal (partly variable and partly
fixed)
Majority of infrastructure costs are fixed
Transport mode Share of fixed costs
Road 83%
Rail 87%
IWT 93%
Aviation 67%
Maritime 97%

Infrastructure costs
10
• Total infrastructure costs for road, rail and IWT
€ 267 billion
0
20
40
60
80
100
120
Pass
enge
r ca
r
Mot
orcy
cle
Bus/
coac
h
HSL
Conv
enti
onal
rai
l
LCV
HG
V
Rail
IWT
Passenger transport Freight transport
To
tal i
nfr
astr
uct
ure
co
sts
69%
30%
1%
Road Rail IWT

Infrastructure costs
11
• For aviation and maritime the study presents results
for 33 airports and 34 ports
• Estimates infrastructure costs
→ 34 EU ports € 1.4 billion
→ 33 EU airports € 14 billion
EU28 ports: Antwerp, Varna, Rijeka, Split, Limassol, Arhus,
Helsingør, Tallinn, Helsinki, Calais, Le Havre, Marseille,
Hamburg, Bremerhaven, Travermünde, Piraeus, Dublin,
Genova, Trieste, Venice, Riga, Klapeida, Marsaxlokk,
Rotterdam, Gdansk, Sines, Constanta, Koper, Algericas,
Barcelona, Bilbao, Valencia, Goteburg, and Felixstowe

Infrastructure costs
12
• Average infrastructure costs of passenger transport
significantly higher for rail than for road: (i) higher fixed
costs (construction) and (ii) (on average) lower utilisation
rate (fixed costs allocated to less p-km)
• Average infrastructure costs of freight transport are
mainly fixed and the highest average costs are found for rail
0
5
10
15
20
25
30
Average infr
ast
ructu
re c
ost
s
Fixed Variable
0
0.5
1
1.5
2
2.5
3
3.5
HGV Rail electric Rail diesel IWT
Avera
ge in
frast
ruct
ure
cost
s
Fixed Variable

External costs
13
“… when the effect of production or consumption of goods and services imposes costs on others which are not reflected in the prices charged for the goods and services being provided” (OECD)
External costs considered(*)
(*) other externalities caused by transport can be identified, including
soil and water pollution, up- and down-stream emissions, separation
impacts in urban areas, etc. They are discussed, but not monetised
in this study
External cost Road Rail IWT Maritime Aviation
Accidents ✓ ✓ ✓ ✓ ✓
Air pollution ✓ ✓ ✓ ✓ ✓
Climate change ✓ ✓ ✓ ✓ ✓
Noise ✓ ✓ ✓
Congestion ✓
Well-to-tank emissions ✓ ✓ ✓ ✓ ✓
Habitat damage ✓ ✓ ✓ ✓

External costs
14
• Total external costs for road, rail, IWT, aviation and
maritime € 716 billion (i.e., 4.8% EU28 GDP) (excluding
congestion)
→ Total external costs for aviation and maritime estimated(*) at
about € 48 billion and € 98 billion
→ External costs for selected airports and ports € 33 and € 44
billion
• Congestion costs only for road modes € 271 billion (delay cost)
• Total annual external costs almost € 1,000 billion
→ of which road transport € 800 billion
→ of which passenger road transport € 600 million
(*) based on extrapolation of the values for the selected (air)ports
assuming that the transport to/from the selected (air)ports (in terms of
aircraft, ships and distances) are representative for the entire EU28.
.[2]

External costs
15
• Total annual external costs by category and mode (billion per year)
0
50
100
150
200
250
300
350
400
Car Bus/Coach MC Rail Aviation° LDV HGV Rail IWT Aviation° Maritime°
Passenger transport § Freight Transport
Habitat damage
Well-to-Tank
Noise
Climate
Air Pollution
Accidents

External costs
16
• Share of annual external costs by category and mode
83%
10%
5%1,8% 0,3%
Road
Maritime
Aviation
Rail
IWT
Key message
• Congestion safety and environmental costs all play a
significant part
• Road is the mode causing the biggest external costs (total
and average)

External costs
17
• Average external costs of passenger (pkm) and freight
(tkm) transport (excluding congestion)
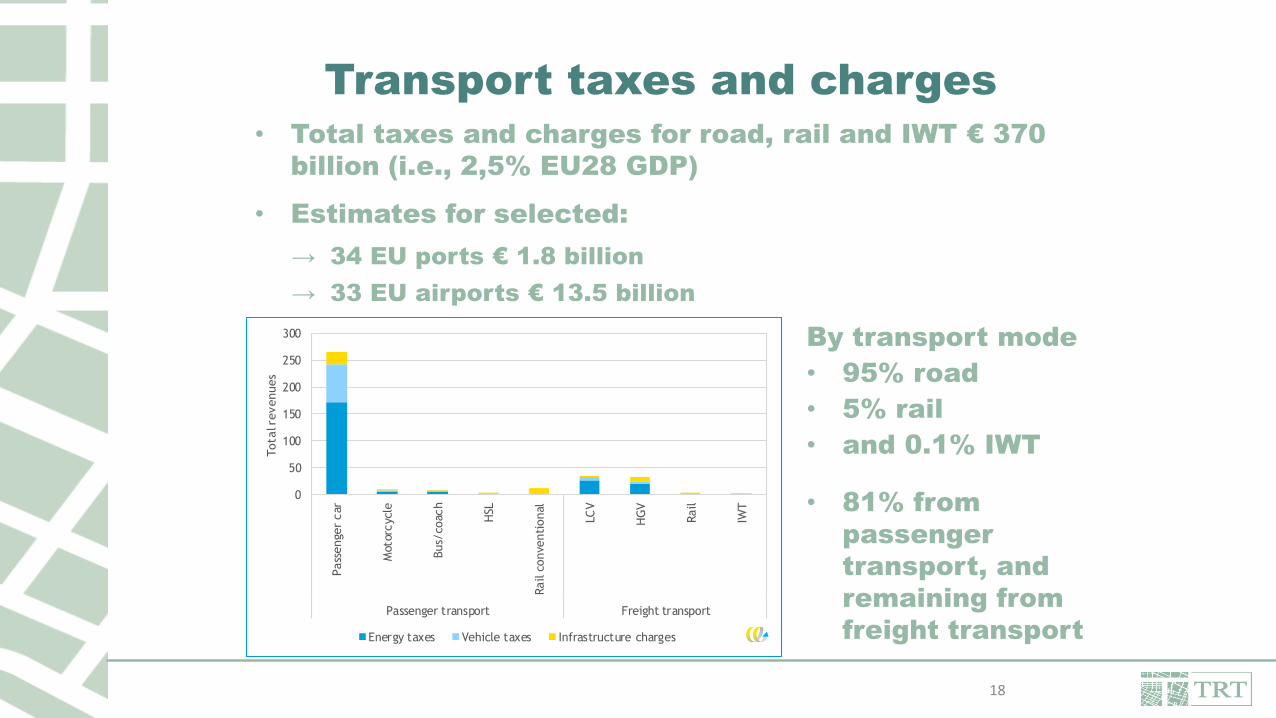
Transport taxes and charges
18
• Total taxes and charges for road, rail and IWT € 370
billion (i.e., 2,5% EU28 GDP)
• Estimates for selected:
→ 34 EU ports € 1.8 billion
→ 33 EU airports € 13.5 billion
0
50
100
150
200
250
300Pass
enge
r car
Mot
orcyc
le
Bus/
coac
h
HSL
Rail c
onve
nti
onal
LCV
HG
V
Rail
IWT
Passenger transport Freight transport
Tota
l revenues
Energy taxes Vehicle taxes Infrastructure charges
By transport mode
• 95% road
• 5% rail
• and 0.1% IWT
• 81% from
passenger
transport, and
remaining from
freight transport

State of play of internalisation
19
Transport mode
Cost coverage
ratio
Road 45%
Rail 20%
IWT 6%
Aviation 29%
Maritime 4%
• Road is the mode paying back the most as share of
total external and infrastructure costs. But it is also
the mode where society pays the most in absolute
terms
All taxes and charges vs all external and all
infrastructure costs

State of play of internalisation
20
Transport mode
Cost coverage
ratio
Road 56%
Rail 69%
IWT 12%
Aviation 36%
Maritime 4%
• There are good reasons for which the users should
pay only for the direct costs (wear and tear)
• Excluding fixed infrastructure costs, rail pays back
the most
All taxes and charges vs all external and variable
infrastructure costs

State of play of internalisation
maritime transport
21
• The overall cost coverage ratio calculated on total
external and infrastructure costs and tax/charge
revenues for the selected 34 ports is equal to 4,1%
• This reflects the limited number of tax/charge schemes in place –
often only port charges are levied, a limited number of ports
differentiate charges to environmental standards
0,00
10,00
20,00
30,00
40,00
50,00
Costs Who Pays
Maritime total external and infra costs vs total taxes
Accidents Air pollution Climate change
WTT Infrastructure Taxes and charges
Society pays

Conclusions
22
• Users pay back only half of the direct generated costs
(excluding fixed infrastructure costs)
• Little evidence of marginal social cost pricing, as variable
external and infrastructure costs generally are not
covered by variable taxes and charges

Conclusions
23
• Limited application of the “user pays” principle
→ for most vehicle categories only 15-30% of
infrastructure costs are covered by infrastructure
charges
→ maritime transport do meet the “user pays”
principle: the total revenues from port charges are in
line with the total infrastructure costs and the cost
coverage ratio of is 127%
• Varying results with respect to earmarking of
revenues
→ revenues from transport taxes and charges are partly
earmarked for infrastructure expenditures
→ significant differences between modes (road 10%, rail
85%)

Policy applications
• Road transport
→ distance-based road charges differentiated by vehicle
characteristics, location and/or time to increase the
overall internalisation rate
→ urban charging schemes to address relatively high
external costs of urban transport
• Rail transport
→ mark-ups on rail access charges to cover fixed
infrastructure costs (although arguments exist for not
internalising)
→ introduction of noise-differentiated rail access charges
to speed-up noise abatement measures
24

Policy applications
• Maritime
→ environmentally differentiated port charges or fairway
dues to further internalise air pollution and
complement IMO emission standards for new vessels;
→ global actions (with IMO) to reduce GHG emissions and
climate change effects (intrinsically global character
of shipping)
• IWT
→ appliance of fairway dues on a larger share of inland
waterways, based on air pollutant emissions (most
important for this mode) to complement new vessels
emission standards
• Aviation
→ environmentally differentiated airport charges or
aviation taxes
25

Broader context for internalisation
• In addition to transport taxes and charges, other policy
instruments (command and control measures and
subsidies) may contribute to achieving the objectives of
internalisation
• non-pricing measures can contribute to establish a
level playing field for investment, and encourage
investments in technologies
• lack of social and political support for implementing
or increasing taxes and charges may also provide
the justification for implementing non-pricing
measures
• non-pricing measures are also key to addressing
externalities which are not targeted by taxes and
charges for example accident costs
26

Overview of key EU-level non-pricing measures -
maritime
27
Non-pricing Measure Relevant Modes DescriptionClimate change
Regulation on the monitoring and reporting of emissions
Maritime Provides insight into robust and verified emissions data and stimulates the uptake of energy efficiency solutions.
Air pollution
Ambient Air Quality Directive Road, Rail, IWT, Maritime, Aviation
Defines ambient air quality standards which require Member States to adopt and implement air quality plans.
National Emission Ceilings Directive
Road, Rail, IWT, Maritime, Aviation
Sets national total emission reduction targets and requires Member States to develop National Air Pollution Control Programmes.
Emissions Standards Road, Rail, IWT, Maritime, Aviation
Defines acceptable emission limit values covering NOx, carbon monoxide, unburned hydrocarbons and non-volatile particular matter emissions.
Accidents
Technical vehicle/vessel/aircraft regulations
Road, IWT, Maritime, Aviation
Regulation on type-approval requirements sets out safety and environmental requirements.
Vehicle/Vessel Inspection Road, Maritime Periodic technical inspection of vehicles/vessels and minimum standards for testing facilities.
Professional Driving Regulations Road, Rail, IWT, Maritime, Aviation
Several measures are in place, such as required training and qualifications, minimum standards for working conditions and requirements for the use of speed limitation devices.
Vessel Traffic Monitoring Maritime Establishes a vessel traffic monitoring and information system.
Passenger Safety Regulations Maritime Sets safety rules and standards for passenger ships, such that safety of life and property on new and existing passenger ships on domestic and international voyages is harmonised.
European Aviation Safety Agency Aviation Establishes the working methods of the European Aviation Safety Agency such that it can conduct standardised inspections.

Thank you for your attention
Comments are welcome
www.trt.it


