
Sustainable, Reliable SNS Operation at 1.4 MW · PDF fileSustainable, Reliable SNS Operation...
20
ORNL is managed by UT-Battelle for the US Department of Energy Sustainable, Reliable SNS Operation at 1.4 MW Presented to Neutron Advisory Board Presented by Kevin Jones Research Accelerator Division Director June 30, 2016 Clinch River Cabin Oak Ridge, Tennessee
Transcript of Sustainable, Reliable SNS Operation at 1.4 MW · PDF fileSustainable, Reliable SNS Operation...

ORNL is managed by UT-Battelle for the US Department of Energy
Sustainable, Reliable SNS Operation at 1.4 MW
Presented toNeutron Advisory Board
Presented byKevin JonesResearch Accelerator Division Director
June 30, 2016Clinch River CabinOak Ridge, Tennessee

2 NAB 2016
Outline
• Recent SNS operational history• Core system reliability• RFQ transmission• Plasma processing to increase beam energy • Smart chopping • Ring injection at high beam power• Summary

The SNS is a complex machine that performs well –overall system reliabilities (excluding targets) > 90%
The front end produces a 60 Hz, ~1 ms long chopped H- beam
Accumulator Ring: Compress ~1 msecpulse to 700 nsec
2.5 MeV
Superconducting LINACSuperconducting LINACFront-EndFront-End
RTBT
HEBT
Injection Extraction
RF
Collimators
945 ns
1 ms macropulse
Cur
rent
Mini-pulses contain RF micro-pulses
LEBT chopper system makes gaps between
mini-pulses
Cur
rent
1ms
Liquid Hg Target
~957 MeV
~1 ms macro-pulse~1 ms
~700 nsec
186 MeV
Warm LinacWarm Linac
• The SNS machine has over 100,000 control points and cycles ~5.2 million times a day
• Power (and base neutron flux) is the product of:– Peak Current– Chopping Fraction– Beam Energy
– Pulse Length– Repetition Rate

4 NAB 2016
The SNS four-year beam power history illustrates both successes and challenges
Bea
m p
ower
on
targ
et
Jun. 1, 2012 to May 31, 2016
1.0 MW
1.2 MW
1.4 MW
*0.85 MW is target conservation
0.85 MW*
Damaged RFQ RF couplers
Damaged DTL5
ceramic RF window
Damaged RFQ RF couplers
Ion source Edump
OE limit restriction Planned
power ramp up
Unp
lann
ed T
arge
t rep
lace
men
t
Unp
lann
ed T
arge
t rep
lace
men
t and
M
EB
T w
ater
leak
1.4 MW 1st time
Unp
lann
ed T
arge
t rep
lace
men
t
Unp
lann
ed T
arge
t rep
lace
men
t
Unp
lann
ed T
arge
t rep
lace
men
t
Unp
lann
ed T
arge
t rep
lace
men
t
Sustained 1.4 MW
1 MW Target
Experiment

5 NAB 2016
Downtime by System
System Sub-system FY14 [hours]
FY15 [hours]
FY16 [hours]
Target Target Module 89.1 560.2 354.8
Beam Instrumentation
Chopper target 24.3 419.1 1.6
RF High Power 133.6 152.7 88.8
Electrical HVCM 70.5 75.6 72.7
Electrical Power Supplies 25.0 44.8 20.6
Electrical AC Distribution 25.6 111.6 3.8
Vacuum 21.7 39.5 0.3
Ion Source 25.2 38.4 23.9
Sustainable and reliable operation at 1.4 MW depends on addressing obsolescence through capital investment
Accumulator Ring
RTBT
Injection
RF
Collimators
• Biggest sources of routine availability limitation are linac high power RF and the associated High Voltage Converter Modulators
• No obvious correlation with high beam power
• Developing AIP plan to mitigate obsolescence and maintain performance
Unique high-consequence
event
*AIP – Accelerator Improvement Project funded by capitalized portion of the accelerator operations field work proposal –currently about $3M annually

6 NAB 2016
SNS has identified and is addressing barriers to operation at 1.4 MW with margin
Plasma processing increases high beta SCL
cavity gradients
Peak current limitation:Poor beam transmission
through RFQ60 – 75%
Energy limitation:SCL cavity gradients
(notably high beta) limit max beam energy to ~957 MeV
Chopper improvements:
Rise/fall time improvements, longer
minipulse length, smart chopping help
overcome power limitations
Plan to install new RFQ April-June 2017
Accelerated peak current and beam energy limitations have been offset by LEBT chopper
improvements, but we need more margin
Source and
LEBT
DTL
2.5 MeV
RFQ CCL
957 MeV86.8 MeV
ToRing
402.5 MHz 805 MHz
SCL β=0.61 SCL β=0.81
186 MeV 387 MeV
MEBT
Foil limitation:Survivability and damage rates at high
power
New foils, new brackets, electron
catcher, laser stripping

7 NAB 2016
SNS has a comprehensive program underway to address our challenges
Today Jul. 2017 Jul. 2018
Test, move, install and commission RFQ
Complete high-beta cryomodule plasma processing
Jan. 2018Jan. 2017
Operate T14 1 MW
Operate T15 1.2 MW
Stage, replace, commission IRP with D2O
Complete HVCM controller upgrades
Operate T16 1.3 MW?
Complete laser-assisted stripping measurements
Re-commission BTF
BTF physics BTF physics
HVCM Cooling Upgrades
MPS Upgrades
Complete smart chopping
Complete warm linac vacuum upgrade
Note: Accelerator Improvement Projects (AIP) shown in italicsBTF: Beam Test Facility (will use RFQ structure not in use in SNS front end)

8 NAB 2016
The new Beam Test Facility is awaiting DOE authorization to demonstrate that the spare RFQ functions as designed
Medium Energy Beam Transport toward 7.5 kW Beam Stop
View from RFQ high energy end toward ion source showing vacuum and RF services

9 NAB 2016
Successful in-situ plasma processing of high-beta cavities is being used to increase the beam energy
R&D with Nb samples and offline cavities
In-situ processing in linac tunnel Processing of cryomodule in test cave
1st phase 2nd phase
4th phase 3rd phase
Processing of 6-cell cavity in HTA*
On-goingFY16FY17
*HTA: Horizontal Test Apparatus
HB52
CM00012CM00023

10 NAB 2016
In-situ plasma processing raises the linac energy by reducing field emission to increase accelerating gradients
• Maximum accelerating gradients in many high-beta cavities significantly below design value of 15 MV/m
• Hydrocarbon contamination is a key contributor to increased field emission
• During last winter outage, processed cryomodule in slot 19
• Average accelerating gradient – 11.2 MV/m before plasma
processing– 14.2 MV/m after plasma
processing
• Beam energy increase from plasma processing of slot 19
– ~11 MeV
62 63 64 655
10
15
20 Sep. 2015 Feb. 2016
cavity number
Eac
c (M
V/m
)
+2.3 MV/m +5.5 MV/m +3.7 MV/m +0.3 MV/m
Operating gradients increased !

11 NAB 2016
“Smart chopping” offers the possibility of further increasing accumulated beam charge in the ring
• Status:– Basic capability
established– Initial experiment
suite complete
• Identified need for additional ramp-down/store software options
• New tools under development
Demonstrated near-nominal
extraction losses with PW of 54
and 200 turns of storage
Up to ~7% increase in “average un-chopped” fraction may be possible
0 0.1 0.2 0.3 0.4 0.5 0.6 0.7 0.8
0 200 400 600 800 1000 1200
Chopping
Fracon
Time (μs)
Generalized Ramped Chopping Pa ern
Ramp-up
Flat-top
Ramp-down
Store
New features

12 NAB 2016
SNS beam injection presents foil survivability challenges at high beam power
H- beam from Linac Thin
Stripping Foil
To InjectionDump
ThickSecondary Foil
pH0
H-Dipole magnets
H- beam from Linac Thin
Stripping Foil
To InjectionDump
ThickSecondary Foil
pH0
H-Dipole magnets
• Evaluating new TZM brackets -almost zero damage at full 1.4 MW beam power
• We are developing laser-assisted stripping (HEP grant through UTK) –recently demonstrated ~10μs stripping at >90% efficiency
H- pulses before stripping
Proton pulses during stripping

13 NAB 2016
0 10 20 30
0.6
0.8
1.0
1.2
x rms,
mm
s, m
Parmila Impact Track
Horizontal RMS vs. Position in DTL-CCL
Integration of beam measurements and simulations is leading to improved beam loss management
Need accurate input distribution for
simulation codesNeed good linac simulation code
Need accurate SNS linac lattice
Simulation determines parameters for minimum beam loss
6D phase space measurement on Integrated Test
Stand
Add linac simulation
capability to PyORBIT
Beam-based measurement of
lattice parameters
Benchmark simulations with measurements
14 NAB 2016
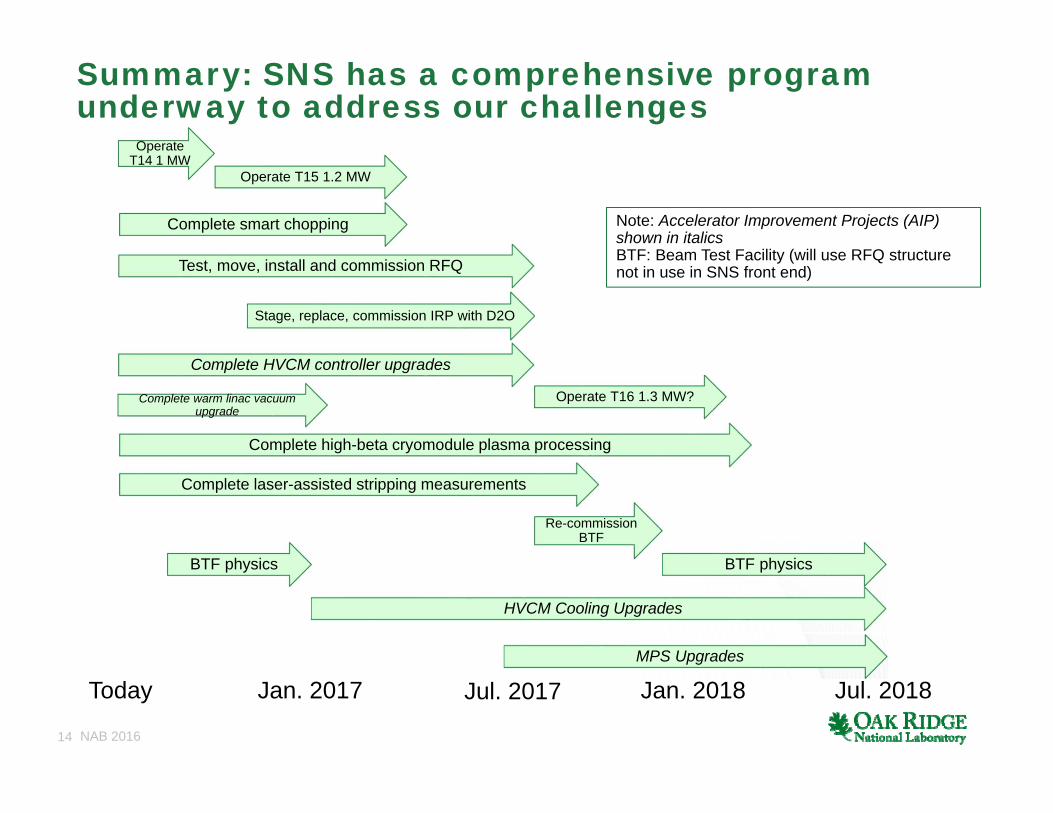
Summary: SNS has a comprehensive program underway to address our challenges
Today Jul. 2017 Jul. 2018
Test, move, install and commission RFQ
Complete high-beta cryomodule plasma processing
Jan. 2018Jan. 2017
Operate T14 1 MW
Operate T15 1.2 MW
Stage, replace, commission IRP with D2O
Complete HVCM controller upgrades
Operate T16 1.3 MW?
Complete laser-assisted stripping measurements
Re-commission BTF
BTF physics BTF physics
HVCM Cooling Upgrades
MPS Upgrades
Complete smart chopping
Complete warm linac vacuum upgrade
Note: Accelerator Improvement Projects (AIP) shown in italicsBTF: Beam Test Facility (will use RFQ structure not in use in SNS front end)

15 NAB 2016
Additional information
16 NAB 2016
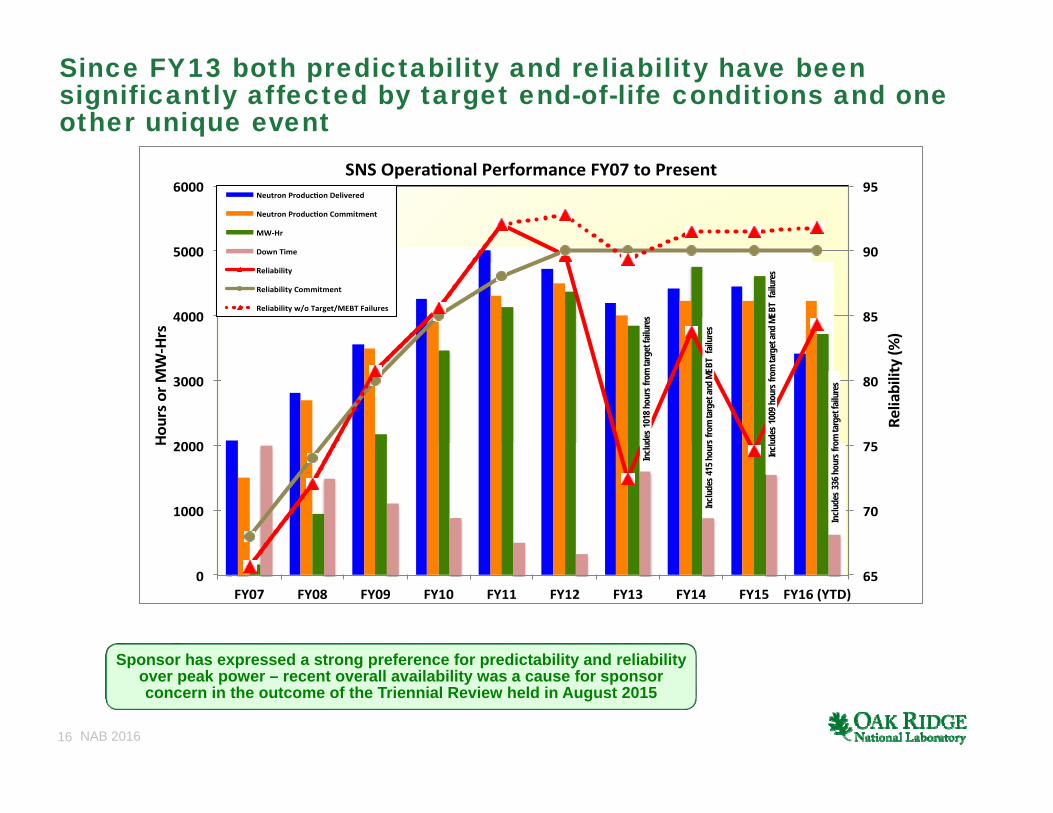
Since FY13 both predictability and reliability have been significantly affected by target end-of-life conditions and one other unique event
Sponsor has expressed a strong preference for predictability and reliability over peak power – recent overall availability was a cause for sponsor concern in the outcome of the Triennial Review held in August 2015
65
70
75
80
85
90
95
0
1000
2000
3000
4000
5000
6000
FY07 FY08 FY09 FY10 FY11 FY12 FY13 FY14 FY15 FY16 (YTD)
Reliability (%)
Hours o
r MW-Hrs
SNS Opera onal Performance FY07 to Present
Neutron Produc on Delivered
Neutron Produc on Commitment
MW-Hr
Down Time
Reliability
Reliability Commitment
Reliability w/o Target/MEBT Failures
Inclu
des 1
018 h
ours
from
targ
et fa
ilure
s
Inclu
des 4
15 h
ours
from
targ
et an
d ME
BT f
ailur
es
Inclu
des 1
009 h
ours
from
targ
et an
d ME
BT f
ailur
es
Inclu
des 3
36 h
ours
from
targ
et fa
ilure
s
17 NAB 2016
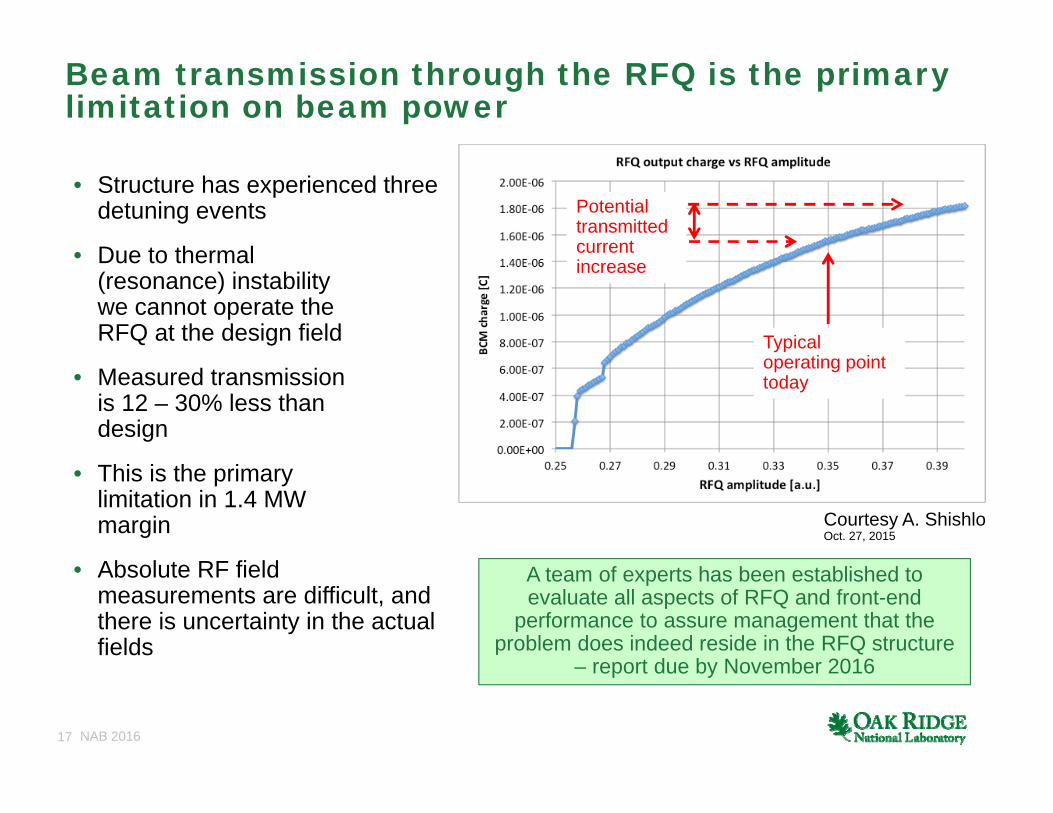
• Structure has experienced three detuning events
• Due to thermal (resonance) instability we cannot operate the RFQ at the design field
• Measured transmissionis 12 – 30% less than design
• This is the primary limitation in 1.4 MW margin
• Absolute RF field measurements are difficult, and there is uncertainty in the actual fields
Beam transmission through the RFQ is the primary limitation on beam power
Courtesy A. ShishloOct. 27, 2015
Typical operating point today
Potential transmitted current increase
A team of experts has been established to evaluate all aspects of RFQ and front-end
performance to assure management that the problem does indeed reside in the RFQ structure
– report due by November 2016

18 NAB 2016
One technique to understand performance is to measure the operating vane voltage using emission x-rays
Measure x-ray spectrum emanating from center of RFQ
Gives absolute measurement of maximum voltage between vane tips, and thus absolute measurement of RFQ field amplitude
Courtesy S. Zhukov, Y. Kang
Spectrum
Linear part [98.- 99.5]%
Rejected tail
Energy=61.0606
30 40 50 60 70 80 900.0
0.5
1.0
1.5
2.0Setpoint = 0.29
Maximum Energy
Spectrum
Linear part [98.- 99.5]%
Rejected tail
Energy=61.0606
0 20 40 60 80 1000
5
10
15
Setpoint = 0.29
98%
1.5%
0.5%
Energy, keV
Cou
nts/
s
Position 1
Position 2
0.0 0.1 0.2 0.3 0.40
20
40
60
80
Setpoint
Ene
rgy,
keV
Design voltage = 83 kV
Today’s operating voltage
Preliminary data!
Absolute field measurements
suggest the voltage is low by
about 15%

19 NAB 2016
Residual activation levels in the machine must be managed for sustainable high-power operation
1.3 MW until 3 to 5 hours before surveySept. 22, 2015All numbers are mrem/h at 30 cm100 mrem/h = 1 mSv/h
90LEDP
50After SCL-1
90DH25
1000strip foil
1000inj kicker
90coll. straight
80Extr Sptm
DTL2 – 30
CCL8 – 60
SCL mb5 – 40
SCL hb5 – 45 5 – 35
70Slot 32
Ring5 – 40
50*DH13
150*QH26
RTBT5 – 25*
* 3 days after 1.3 MW** No survey near this time,
indicated does rates are typical
Except for a few hot spots, the dose rates are relatively low but
improvements are needed
HEBT<5**

20 NAB 2016
Summary: SNS has a well-defined path to high power, high availability operation
• Replace RFQ – Plan to install April 2017, assuming RI RFQ commissioning successful
• Increase high-beta SCL cavity gradients – Started Jan. 2016, ongoing
• Develop gradient improvement for medium-beta SCL
• Smart chopping– Started Fall 2015, ongoing
• Addressing foil support and convoy electron issues
• Implementing analytical tools with fundamental R&D to address halo formation and beam loss control
• AIP program to address reliability issues – In progress


![INDEX [] · sns 인플루언서마케팅(1) sns 인스타그램 셜 네트워크플랫폼의특징은이용자가마케팅에직적으로 참여하며 단기간에빠른콘텐츠확산및글로벌타깃이가능한이](https://static.fdocuments.in/doc/165x107/602506004f28a16c44278cb0/index-sns-oeeoeeoe1-sns-fee-oe-eoeoeeeeoeoeeoe.jpg)


![Sustainable, Reliable SNS Operation at 1.4 MW · 2016. 6. 30. · 1.4 MW 1 MW Target Experiment. 5 NAB 2016 Downtime by System System Sub-system FY14 [hours] FY15 [hours] FY16 ...](https://static.fdocuments.in/doc/165x107/60e38f1a1f6b722880751f60/sustainable-reliable-sns-operation-at-14-mw-2016-6-30-14-mw-1-mw-target.jpg)


