Sustainable Power Planning for the Island of Crete
17
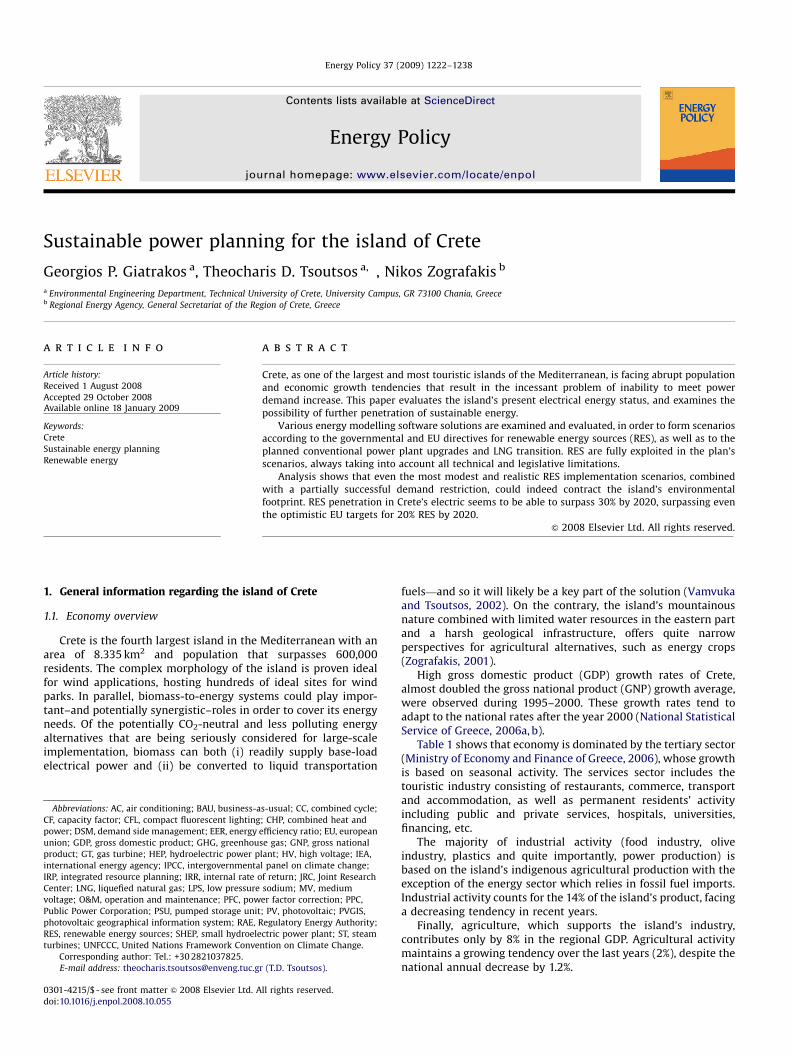
Sustainable power planning for the island of Crete Georgios P. Giatrakos a , Theocharis D. Tsoutsos a, , Nikos Zografakis b a Environmental Engineering Department, Technical University of Crete, University Campus, GR 73100 Chania, Greece b Regional Energy Agency, General Secretariat of the Region of Crete, Greece article info Article history: Received 1 August 2008 Accepted 29 October 2008 Available online 18 January 2009 Keywords: Crete Sustainable energy planning Renewable energy abstract Crete, as one of the largest and most touristic islands of the Mediterranean, is facing abrupt population and economic growth tendencies that result in the incessant problem of inability to meet power demand increase. This paper evaluates the island’s present electrical energy status, and examines the possibility of further penetration of sustainable energy. Various energy modelling software solutions are examined and evaluated, in order to form scenarios according to the governmental and EU directives for renewable energy sources (RES), as well as to the planned conventional power plant upgrades and LNG transition. RES are fully exploited in the plan’s scenarios, always taking into account all technical and legislative limitations. Analysis shows that even the most modest and realistic RES implementation scenarios, combined with a partially successful demand restriction, could indeed contract the island’s environmental footprint. RES penetration in Crete’s electric seems to be able to surpass 30% by 2020, surpassing even the optimistic EU targets for 20% RES by 2020. & 2008 Elsevier Ltd. All rights reserved. 1. General information regarding the island of Crete 1.1. Economy overview Crete is the fourth largest island in the Mediterranean with an area of 8.335 km 2 and population that surpasses 600,000 residents. The complex morphology of the island is proven ideal for wind applications, hosting hundreds of ideal sites for wind parks. In parallel, biomass-to-energy systems could play impor- tant–and potentially synergistic–roles in order to cover its energy needs. Of the potentially CO 2 -neutral and less polluting energy alternatives that are being seriously considered for large-scale implementation, biomass can both (i) readily supply base-load electrical power and (ii) be converted to liquid transportation fuels—and so it will likely be a key part of the solution (Vamvuka and Tsoutsos, 2002). On the contrary, the island’s mountainous nature combined with limited water resources in the eastern part and a harsh geological infrastructure, offers quite narrow perspectives for agricultural alternatives, such as energy crops (Zografakis, 2001). High gross domestic product (GDP) growth rates of Crete, almost doubled the gross national product (GNP) growth average, were observed during 1995–2000. These growth rates tend to adapt to the national rates after the year 2000 (National Statistical Service of Greece, 2006a, b). Table 1 shows that economy is dominated by the tertiary sector (Ministry of Economy and Finance of Greece, 2006), whose growth is based on seasonal activity. The services sector includes the touristic industry consisting of restaurants, commerce, transport and accommodation, as well as permanent residents’ activity including public and private services, hospitals, universities, financing, etc. The majority of industrial activity (food industry, olive industry, plastics and quite importantly, power production) is based on the island’s indigenous agricultural production with the exception of the energy sector which relies in fossil fuel imports. Industrial activity counts for the 14% of the island’s product, facing a decreasing tendency in recent years. Finally, agriculture, which supports the island’s industry, contributes only by 8% in the regional GDP. Agricultural activity maintains a growing tendency over the last years (2%), despite the national annual decrease by 1.2%. ARTICLE IN PRESS Contents lists available at ScienceDirect journal homepage: www.elsevier.com/locate/enpol Energy Policy 0301-4215/$ - see front matter & 2008 Elsevier Ltd. All rights reserved. doi:10.1016/j.enpol.2008.10.055 Abbreviations: AC, air conditioning; BAU, business-as-usual; CC, combined cycle; CF, capacity factor; CFL, compact fluorescent lighting; CHP, combined heat and power; DSM, demand side management; EER, energy efficiency ratio; EU, european union; GDP, gross domestic product; GHG, greenhouse gas; GNP, gross national product; GT, gas turbine; HEP, hydroelectric power plant; HV, high voltage; IEA, international energy agency; IPCC, intergovernmental panel on climate change; IRP, integrated resource planning; IRR, internal rate of return; JRC, Joint Research Center; LNG, liquefied natural gas; LPS, low pressure sodium; MV, medium voltage; O&M, operation and maintenance; PFC, power factor correction; PPC, Public Power Corporation; PSU, pumped storage unit; PV, photovoltaic; PVGIS, photovoltaic geographical information system; RAE, Regulatory Energy Authority; RES, renewable energy sources; SHEP, small hydroelectric power plant; ST, steam turbines; UNFCCC, United Nations Framework Convention on Climate Change. Corresponding author: Tel.: +302821037825. E-mail address: [email protected] (T.D. Tsoutsos). Energy Policy 37 (2009) 1222–1238
Transcript of Sustainable Power Planning for the Island of Crete
ARTICLE IN PRESS
Energy Policy 37 (2009) 1222–1238
Contents lists available at ScienceDirect
Energy Policy
0301-42
doi:10.1
Abbre
CF, capa
power;
union; G
product
internat
IRP, inte
Center;
voltage;
Public P
photovo
RES, ren
turbine� Corr
E-m
journal homepage: www.elsevier.com/locate/enpol
Sustainable power planning for the island of Crete
Georgios P. Giatrakos a, Theocharis D. Tsoutsos a,�, Nikos Zografakis b
a Environmental Engineering Department, Technical University of Crete, University Campus, GR 73100 Chania, Greeceb Regional Energy Agency, General Secretariat of the Region of Crete, Greece
a r t i c l e i n f o
Article history:
Received 1 August 2008
Accepted 29 October 2008Available online 18 January 2009
Keywords:
Crete
Sustainable energy planning
Renewable energy
15/$ - see front matter & 2008 Elsevier Ltd. A
016/j.enpol.2008.10.055
viations: AC, air conditioning; BAU, business-a
city factor; CFL, compact fluorescent lighting
DSM, demand side management; EER, energy
DP, gross domestic product; GHG, greenhou
; GT, gas turbine; HEP, hydroelectric power p
ional energy agency; IPCC, intergovernmenta
grated resource planning; IRR, internal rate o
LNG, liquefied natural gas; LPS, low pressure
O&M, operation and maintenance; PFC, pow
ower Corporation; PSU, pumped storage unit
ltaic geographical information system; RAE, R
ewable energy sources; SHEP, small hydroele
s; UNFCCC, United Nations Framework Conve
esponding author: Tel.: +30 2821037825.
ail address: [email protected]
a b s t r a c t
Crete, as one of the largest and most touristic islands of the Mediterranean, is facing abrupt population
and economic growth tendencies that result in the incessant problem of inability to meet power
demand increase. This paper evaluates the island’s present electrical energy status, and examines the
possibility of further penetration of sustainable energy.
Various energy modelling software solutions are examined and evaluated, in order to form scenarios
according to the governmental and EU directives for renewable energy sources (RES), as well as to the
planned conventional power plant upgrades and LNG transition. RES are fully exploited in the plan’s
scenarios, always taking into account all technical and legislative limitations.
Analysis shows that even the most modest and realistic RES implementation scenarios, combined
with a partially successful demand restriction, could indeed contract the island’s environmental
footprint. RES penetration in Crete’s electric seems to be able to surpass 30% by 2020, surpassing even
the optimistic EU targets for 20% RES by 2020.
& 2008 Elsevier Ltd. All rights reserved.
1. General information regarding the island of Crete
1.1. Economy overview
Crete is the fourth largest island in the Mediterranean with anarea of 8.335 km2 and population that surpasses 600,000residents. The complex morphology of the island is proven idealfor wind applications, hosting hundreds of ideal sites for windparks. In parallel, biomass-to-energy systems could play impor-tant–and potentially synergistic–roles in order to cover its energyneeds. Of the potentially CO2-neutral and less polluting energyalternatives that are being seriously considered for large-scaleimplementation, biomass can both (i) readily supply base-loadelectrical power and (ii) be converted to liquid transportation
ll rights reserved.
s-usual; CC, combined cycle;
; CHP, combined heat and
efficiency ratio; EU, european
se gas; GNP, gross national
lant; HV, high voltage; IEA,
l panel on climate change;
f return; JRC, Joint Research
sodium; MV, medium
er factor correction; PPC,
; PV, photovoltaic; PVGIS,
egulatory Energy Authority;
ctric power plant; ST, steam
ntion on Climate Change.
r (T.D. Tsoutsos).
fuels—and so it will likely be a key part of the solution (Vamvukaand Tsoutsos, 2002). On the contrary, the island’s mountainousnature combined with limited water resources in the eastern partand a harsh geological infrastructure, offers quite narrowperspectives for agricultural alternatives, such as energy crops(Zografakis, 2001).
High gross domestic product (GDP) growth rates of Crete,almost doubled the gross national product (GNP) growth average,were observed during 1995–2000. These growth rates tend toadapt to the national rates after the year 2000 (National StatisticalService of Greece, 2006a, b).
Table 1 shows that economy is dominated by the tertiary sector(Ministry of Economy and Finance of Greece, 2006), whose growthis based on seasonal activity. The services sector includes thetouristic industry consisting of restaurants, commerce, transportand accommodation, as well as permanent residents’ activityincluding public and private services, hospitals, universities,financing, etc.
The majority of industrial activity (food industry, oliveindustry, plastics and quite importantly, power production) isbased on the island’s indigenous agricultural production with theexception of the energy sector which relies in fossil fuel imports.Industrial activity counts for the 14% of the island’s product, facinga decreasing tendency in recent years.
Finally, agriculture, which supports the island’s industry,contributes only by 8% in the regional GDP. Agricultural activitymaintains a growing tendency over the last years (2%), despite thenational annual decrease by 1.2%.
ARTICLE IN PRESS
Table 1GDP per prefecture and activity.
2005 GDP per prefecture (million h)3 Fraction on regional GDP (%) 2005 Growth rate (%)
Heraklion Lassithi Rethimnon Chania Crete
Commercial activity 3.735 893 903 1.741 7.272 64.99
Public authorities 711 170 172 332 1.385 12.38
Services (tertiary) 4.446 1.064 1.075 2.072 8.657 77.36 8.1
Agricultural 438 139 205 241 1.023 9.14 1.9
Industry 776 152 212 369 1.510 13.49 �3.8
Total GDP 5.660 1.355 1.492 2.683 11.190 100.00 5.8
Values refer to year 2000 prices.
Table 2GDP growth and forecasts in year 2000 prices.
Annual GDP (in million h) Linear projections Exponential projections
2000 2001 2002 2003 2004 2005 2015 2030 2015 2030
Heraklion 3.967 4.179 4.665 4.911 5.367 5.660 9.175 14.476 11.939 36.049
Lassithi 1.009 1.096 1.121 1.205 1.284 1.355 2.015 3.019 2.412 5.733
Rethymno 1.103 1.107 1.171 1.243 1.415 1.492 2.293 3.582 2.844 7.650
Chania 1.955 2.045 2.146 2.318 2.543 2.683 4.080 6.277 5.179 13.956
Crete 8.034 8.427 9.103 9.677 10.609 11.189 17.200 26.542 22.313 62.637
Increment 4.66% 7.43% 5.93% 8.79% 5.18% 6.8%
Greece 156.514 163.514 174.529 189.790 205.893 220.671
Increment 4.28% 6.31% 8.04% 7.82% 6.70%
G.P. Giatrakos et al. / Energy Policy 37 (2009) 1222–1238 1223
1.2. The correlation between energy and economy
It is an interesting case that of the correlation between powerrequirements and economic growth, using statistics (historicaldata) (PPC, 2006). Analysis clearly indexes an exponentialgrowth of historical demand time series. Electric demands tendto rise by 6.0% annually; very similar to the rate in which economygrows (6.8%).
By taking a close look to exponential forecasts for years 2015and 2030 (Table 2), it is rendered clear that electricity productiongrowth rates (6%) must definitely be forced to decrease, due toimmense environmental and economical stress posed by theenormous demands. Limiting economic growth is not an option,but establishing sustainable development is considered feasible,mainly by reducing energy intensities on developing activities, inorder to balance increased energy demands due to activitygrowth.
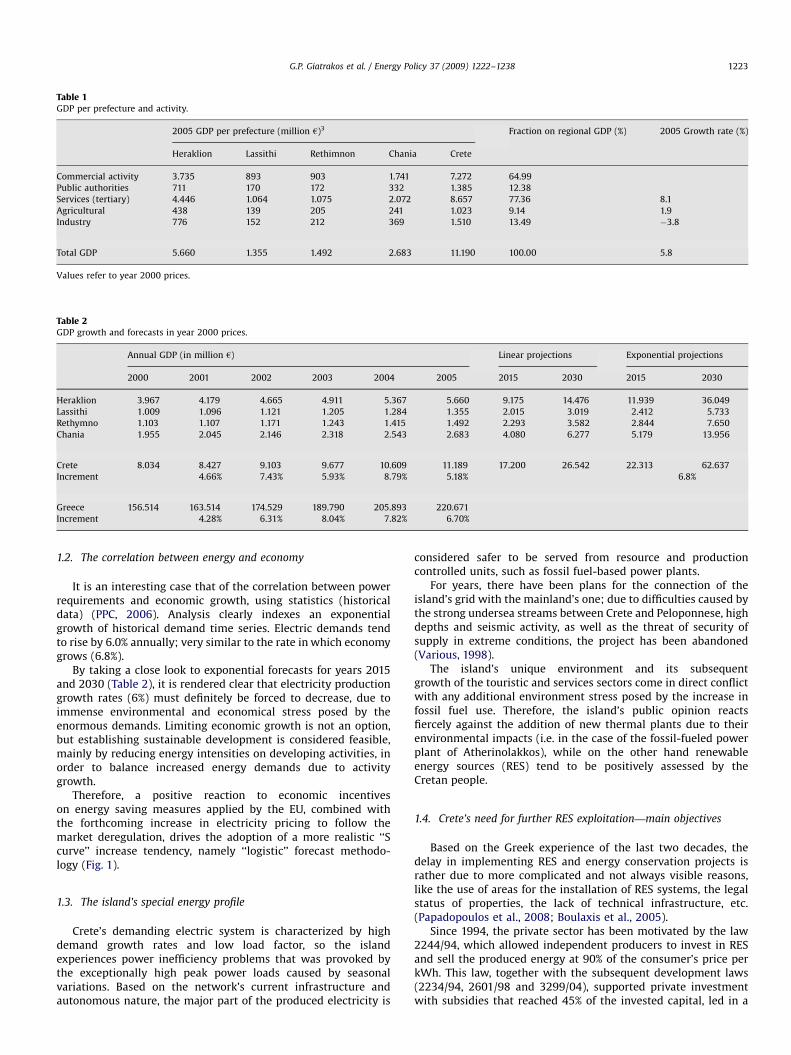
Therefore, a positive reaction to economic incentiveson energy saving measures applied by the EU, combined withthe forthcoming increase in electricity pricing to follow themarket deregulation, drives the adoption of a more realistic ‘‘Scurve’’ increase tendency, namely ‘‘logistic’’ forecast methodo-logy (Fig. 1).
1.3. The island’s special energy profile
Crete’s demanding electric system is characterized by highdemand growth rates and low load factor, so the islandexperiences power inefficiency problems that was provoked bythe exceptionally high peak power loads caused by seasonalvariations. Based on the network’s current infrastructure andautonomous nature, the major part of the produced electricity is
considered safer to be served from resource and productioncontrolled units, such as fossil fuel-based power plants.
For years, there have been plans for the connection of theisland’s grid with the mainland’s one; due to difficulties caused bythe strong undersea streams between Crete and Peloponnese, highdepths and seismic activity, as well as the threat of security ofsupply in extreme conditions, the project has been abandoned(Various, 1998).
The island’s unique environment and its subsequentgrowth of the touristic and services sectors come in direct conflictwith any additional environment stress posed by the increase infossil fuel use. Therefore, the island’s public opinion reactsfiercely against the addition of new thermal plants due to theirenvironmental impacts (i.e. in the case of the fossil-fueled powerplant of Atherinolakkos), while on the other hand renewableenergy sources (RES) tend to be positively assessed by theCretan people.
1.4. Crete’s need for further RES exploitation—main objectives
Based on the Greek experience of the last two decades, thedelay in implementing RES and energy conservation projects israther due to more complicated and not always visible reasons,like the use of areas for the installation of RES systems, the legalstatus of properties, the lack of technical infrastructure, etc.(Papadopoulos et al., 2008; Boulaxis et al., 2005).
Since 1994, the private sector has been motivated by the law2244/94, which allowed independent producers to invest in RESand sell the produced energy at 90% of the consumer’s price perkWh. This law, together with the subsequent development laws(2234/94, 2601/98 and 3299/04), supported private investmentwith subsidies that reached 45% of the invested capital, led in a
ARTICLE IN PRESS
Fig. 1. ‘‘Logistic’’ projection of future electric demands.
G.P. Giatrakos et al. / Energy Policy 37 (2009) 1222–12381224
substantial RES implementation of more than 100 MW of installedcapacity by the end of 2005.
Unfortunately, this law provided uniform feed-in tariffs,regardless the utilized RES, resulting in the sole realization ofwind parks, as the most profitable investment, with the exceptionof a small amount of grid connected photovoltaic (PV) applica-tions. The last RES law, 3468/06 simplifies licensing proceduresfor RES, especially in small-scale applications and simultaneouslysupports the PV and solar thermal applications by increasing thetariffs to 0.50 and 0.30h/kWh, respectively.
As RES installed capacity increases, technical difficultiesregarding their maximum penetration in the island’s systemarise. Therefore, careful physical planning must be commissionedto ensure further RES development and to protect the interests ofexisting and future investors. For this reason, the RegulatoryEnergy Authority (RAE) has applied strict methodologies, espe-cially for the licensing of new wind parks, and halted since 2003the fast development of RES in Crete by characterizing the system‘‘saturated’’.
This study’s main objective is to verify the actual difficultiesregarding further RES implementation and offer various scenariosin order to maximize sustainable RES contribution, in order tominimize greenhouse gas (GHG) emissions and make the island asautonomous as technically possible.
In order to achieve these objectives, available methodologywas evaluated (Section 2) and historical and future electric needswere analyzed (Section 3). We took a coherent look into theisland’s current power production and transmission structure(Section 4) and determined the effectiveness of the proposedsolutions by screening available RES technologies, estimatingavailable resources and analyzing system integration potential,while keeping track with the current legislative and financialdeterminants (Section 5). Finally, results of the implementationschemes are reported in Section 6.
2. Available methodologies
Various approaches for energy planning and GHG mitigationassessment in the energy sector are offered by applying severalavailable methodologies such as optimization models, simulation
models and accounting frameworks. For the purpose of this study,accounting framework software ‘‘LEAP’’ will be used as it isconsidered appropriate given the aspects of Crete’s power systemas well as the available raw data.
2.1. Optimization models
Amongst the important parameters of the optimization modelsare: (a) that they typically assume that energy cost is the onlyfactor in technology choice and (b) that they apply the question-able fundamental assumption of perfect competition (e.g., perfectcompetition, no monopolistic practices, no market power, nosubsidies and all markets in equilibrium) (Heaps, 2002). Trying toimplement this analysis in Crete’s monopolistic and inflexibleenergy status can only lead to unrealistic outcomes.
2.2. Simulation models
This methodology is considered more appropriate for energyplanning in non-ideal communities such as the one underexamination as it is not limited by the assumption of the system’soptimal behavior or that the energy is the only factor affectingtechnology choice. However, this methodology tends to becomplex and data intensive and hard to parameterize (UNFCCC,2006). Therefore, due to the fact that crucial parameters requiredfor input are highly abstracted or poorly known, a more flexiblemethodology is needed.
2.3. Accounting frameworks
Among their many advantages, accounting frameworks featuresimple, transparent and flexible interface with lower datarequirements than the previous methodologies. They arecapable of examining issues that go beyond technology choiceor are hard to specify their cost. They also flexibly operateregardless the amount of input in parameter completion.User may provide analytical data in categories where they areavailable, and aggregate categories using assumptions wherelimited details exist.
ARTICLE IN PRESS
G.P. Giatrakos et al. / Energy Policy 37 (2009) 1222–1238 1225
2.4. Software used for the development of the study: LEAP and more
The LEAP software package proves a capable tool for strategicintegrated energy and environment scenario studies; its userinterface offers a powerful yet friendly, scenario-based, integratedenergy-environment model-building tool, using the accountingframework design approach (Heaps, 2002). Through the model’smain analysis view, the user is able to create custom scenarioswith different data structures for the specific area of interest bysimulating energy demand and energy conversion, specifyingresources and costs, while modeling environmental parametersand impacts.
2.5. Additional tools
While LEAP was the prime integrated resource planning (IRP)and environmental impact mitigation analysis model used for thedevelopment of scenarios included in this work, various addi-tional energy planning tools were used, especially for thetechnology-specific calculations.
The selected tool was the RETscreen International CleanEnergy Project Analysis suite. A straightforward analyticalspreadsheet based tool, capable of specifying the energyproduction, life-cycle costs and GHG emissions reductions fromevery major renewable energy and energy efficient technologyavailable. RETscreen offers a variety of useful modules such aswind, small hydro, PVs, combined heat and power and solar waterheating.
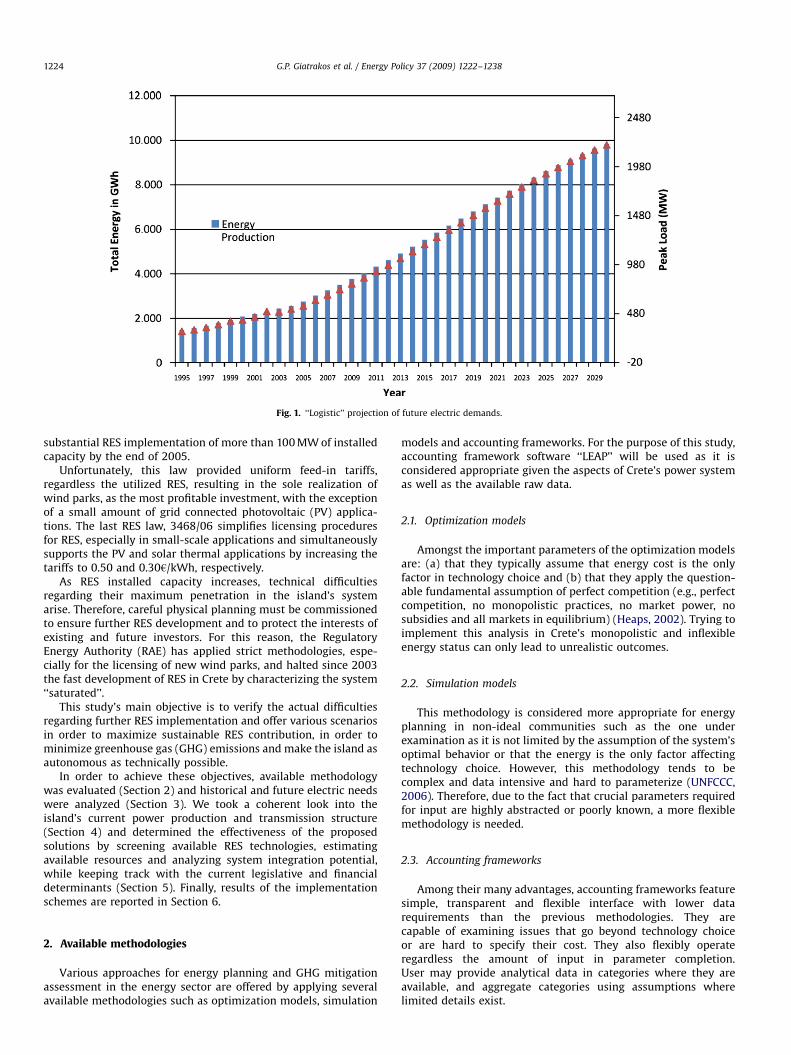
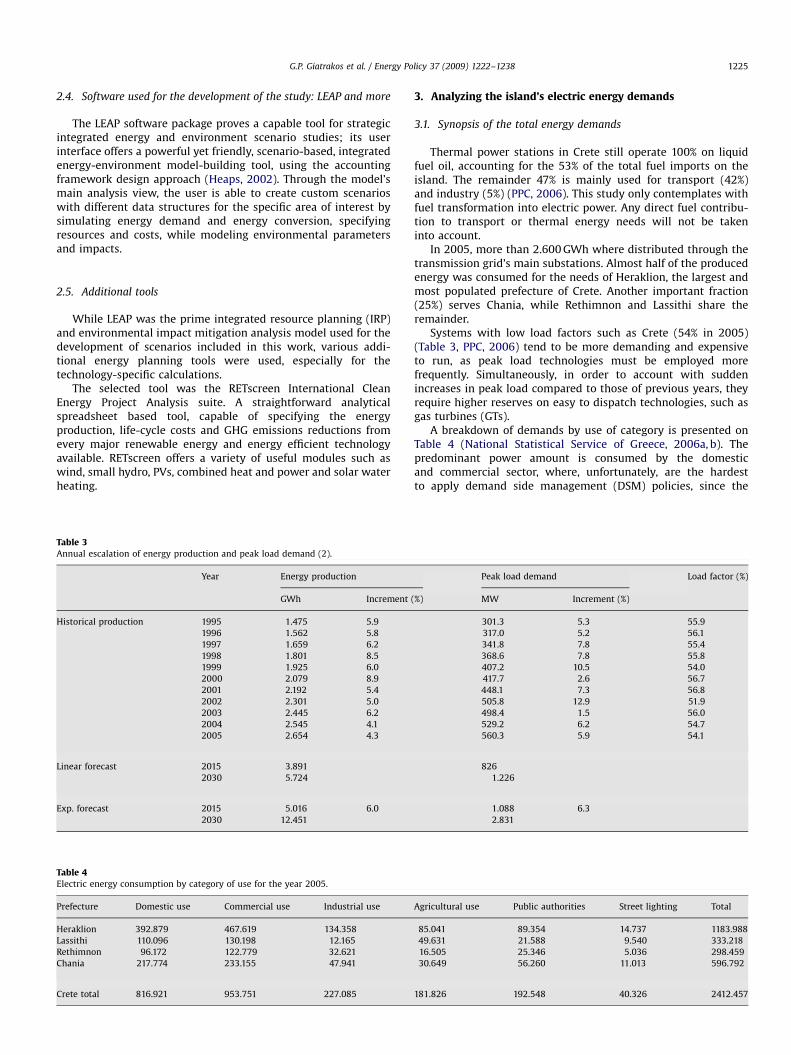
Table 3Annual escalation of energy production and peak load demand (2).
Year Energy production
GWh Increment
Historical production 1995 1.475 5.9
1996 1.562 5.8
1997 1.659 6.2
1998 1.801 8.5
1999 1.925 6.0
2000 2.079 8.9
2001 2.192 5.4
2002 2.301 5.0
2003 2.445 6.2
2004 2.545 4.1
2005 2.654 4.3
Linear forecast 2015 3.891
2030 5.724
Exp. forecast 2015 5.016 6.0
2030 12.451
Table 4Electric energy consumption by category of use for the year 2005.
Prefecture Domestic use Commercial use Industrial use
Heraklion 392.879 467.619 134.358
Lassithi 110.096 130.198 12.165
Rethimnon 96.172 122.779 32.621
Chania 217.774 233.155 47.941
Crete total 816.921 953.751 227.085
3. Analyzing the island’s electric energy demands
3.1. Synopsis of the total energy demands
Thermal power stations in Crete still operate 100% on liquidfuel oil, accounting for the 53% of the total fuel imports on theisland. The remainder 47% is mainly used for transport (42%)and industry (5%) (PPC, 2006). This study only contemplates withfuel transformation into electric power. Any direct fuel contribu-tion to transport or thermal energy needs will not be takeninto account.
In 2005, more than 2.600 GWh where distributed through thetransmission grid’s main substations. Almost half of the producedenergy was consumed for the needs of Heraklion, the largest andmost populated prefecture of Crete. Another important fraction(25%) serves Chania, while Rethimnon and Lassithi share theremainder.
Systems with low load factors such as Crete (54% in 2005)(Table 3, PPC, 2006) tend to be more demanding and expensiveto run, as peak load technologies must be employed morefrequently. Simultaneously, in order to account with suddenincreases in peak load compared to those of previous years, theyrequire higher reserves on easy to dispatch technologies, such asgas turbines (GTs).
A breakdown of demands by use of category is presented onTable 4 (National Statistical Service of Greece, 2006a, b). Thepredominant power amount is consumed by the domesticand commercial sector, where, unfortunately, are the hardestto apply demand side management (DSM) policies, since the
Peak load demand Load factor (%)
(%) MW Increment (%)
301.3 5.3 55.9
317.0 5.2 56.1
341.8 7.8 55.4
368.6 7.8 55.8
407.2 10.5 54.0
417.7 2.6 56.7
448.1 7.3 56.8
505.8 12.9 51.9
498.4 1.5 56.0
529.2 6.2 54.7
560.3 5.9 54.1
826
1.226
1.088 6.3
2.831
Agricultural use Public authorities Street lighting Total
85.041 89.354 14.737 1183.988
49.631 21.588 9.540 333.218
16.505 25.346 5.036 298.459
30.649 56.260 11.013 596.792
181.826 192.548 40.326 2412.457
ARTICLE IN PRESS
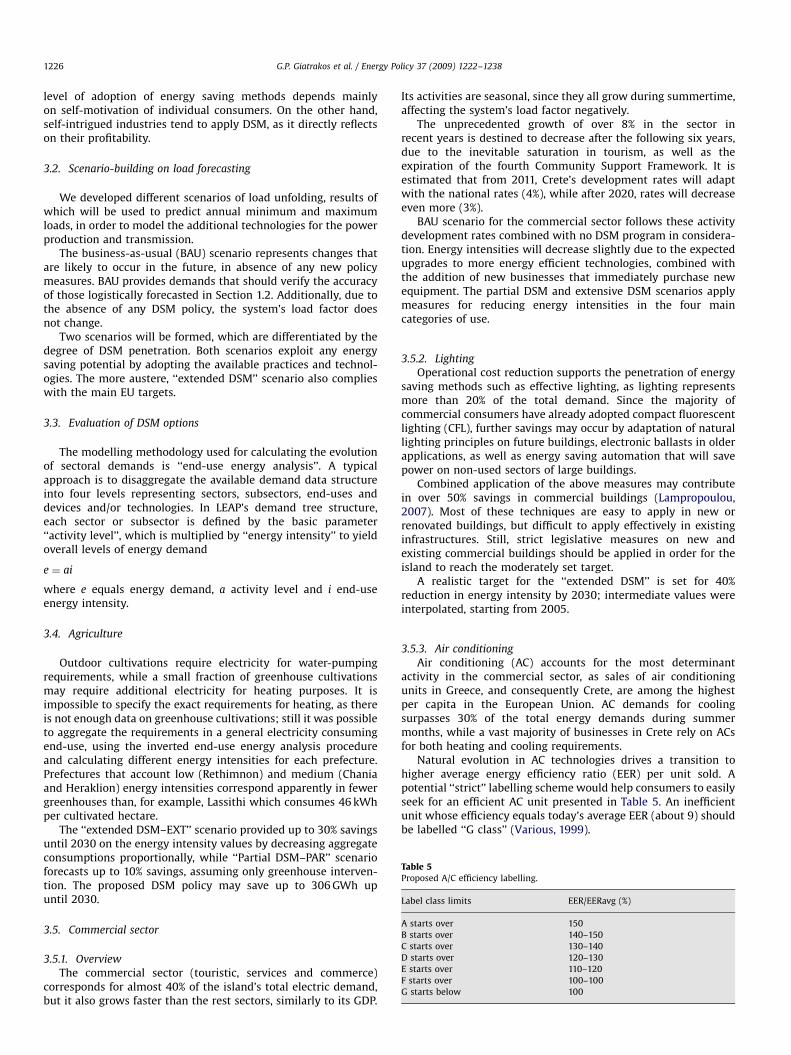
Table 5Proposed A/C efficiency labelling.
Label class limits EER/EERavg (%)
A starts over 150
B starts over 140–150
C starts over 130–140
D starts over 120–130
E starts over 110–120
F starts over 100–100
G starts below 100
G.P. Giatrakos et al. / Energy Policy 37 (2009) 1222–12381226
level of adoption of energy saving methods depends mainlyon self-motivation of individual consumers. On the other hand,self-intrigued industries tend to apply DSM, as it directly reflectson their profitability.
3.2. Scenario-building on load forecasting
We developed different scenarios of load unfolding, results ofwhich will be used to predict annual minimum and maximumloads, in order to model the additional technologies for the powerproduction and transmission.
The business-as-usual (BAU) scenario represents changes thatare likely to occur in the future, in absence of any new policymeasures. BAU provides demands that should verify the accuracyof those logistically forecasted in Section 1.2. Additionally, due tothe absence of any DSM policy, the system’s load factor doesnot change.
Two scenarios will be formed, which are differentiated by thedegree of DSM penetration. Both scenarios exploit any energysaving potential by adopting the available practices and technol-ogies. The more austere, ‘‘extended DSM’’ scenario also complieswith the main EU targets.
3.3. Evaluation of DSM options
The modelling methodology used for calculating the evolutionof sectoral demands is ‘‘end-use energy analysis’’. A typicalapproach is to disaggregate the available demand data structureinto four levels representing sectors, subsectors, end-uses anddevices and/or technologies. In LEAP’s demand tree structure,each sector or subsector is defined by the basic parameter‘‘activity level’’, which is multiplied by ‘‘energy intensity’’ to yieldoverall levels of energy demand
e ¼ ai
where e equals energy demand, a activity level and i end-useenergy intensity.
3.4. Agriculture
Outdoor cultivations require electricity for water-pumpingrequirements, while a small fraction of greenhouse cultivationsmay require additional electricity for heating purposes. It isimpossible to specify the exact requirements for heating, as thereis not enough data on greenhouse cultivations; still it was possibleto aggregate the requirements in a general electricity consumingend-use, using the inverted end-use energy analysis procedureand calculating different energy intensities for each prefecture.Prefectures that account low (Rethimnon) and medium (Chaniaand Heraklion) energy intensities correspond apparently in fewergreenhouses than, for example, Lassithi which consumes 46 kWhper cultivated hectare.
The ‘‘extended DSM–EXT’’ scenario provided up to 30% savingsuntil 2030 on the energy intensity values by decreasing aggregateconsumptions proportionally, while ‘‘Partial DSM–PAR’’ scenarioforecasts up to 10% savings, assuming only greenhouse interven-tion. The proposed DSM policy may save up to 306 GWh upuntil 2030.
3.5. Commercial sector
3.5.1. Overview
The commercial sector (touristic, services and commerce)corresponds for almost 40% of the island’s total electric demand,but it also grows faster than the rest sectors, similarly to its GDP.
Its activities are seasonal, since they all grow during summertime,affecting the system’s load factor negatively.
The unprecedented growth of over 8% in the sector inrecent years is destined to decrease after the following six years,due to the inevitable saturation in tourism, as well as theexpiration of the fourth Community Support Framework. It isestimated that from 2011, Crete’s development rates will adaptwith the national rates (4%), while after 2020, rates will decreaseeven more (3%).
BAU scenario for the commercial sector follows these activitydevelopment rates combined with no DSM program in considera-tion. Energy intensities will decrease slightly due to the expectedupgrades to more energy efficient technologies, combined withthe addition of new businesses that immediately purchase newequipment. The partial DSM and extensive DSM scenarios applymeasures for reducing energy intensities in the four maincategories of use.
3.5.2. Lighting
Operational cost reduction supports the penetration of energysaving methods such as effective lighting, as lighting representsmore than 20% of the total demand. Since the majority ofcommercial consumers have already adopted compact fluorescentlighting (CFL), further savings may occur by adaptation of naturallighting principles on future buildings, electronic ballasts in olderapplications, as well as energy saving automation that will savepower on non-used sectors of large buildings.
Combined application of the above measures may contributein over 50% savings in commercial buildings (Lampropoulou,2007). Most of these techniques are easy to apply in new orrenovated buildings, but difficult to apply effectively in existinginfrastructures. Still, strict legislative measures on new andexisting commercial buildings should be applied in order for theisland to reach the moderately set target.
A realistic target for the ‘‘extended DSM’’ is set for 40%reduction in energy intensity by 2030; intermediate values wereinterpolated, starting from 2005.
3.5.3. Air conditioning
Air conditioning (AC) accounts for the most determinantactivity in the commercial sector, as sales of air conditioningunits in Greece, and consequently Crete, are among the highestper capita in the European Union. AC demands for coolingsurpasses 30% of the total energy demands during summermonths, while a vast majority of businesses in Crete rely on ACsfor both heating and cooling requirements.
Natural evolution in AC technologies drives a transition tohigher average energy efficiency ratio (EER) per unit sold. Apotential ‘‘strict’’ labelling scheme would help consumers to easilyseek for an efficient AC unit presented in Table 5. An inefficientunit whose efficiency equals today’s average EER (about 9) shouldbe labelled ‘‘G class’’ (Various, 1999).
ARTICLE IN PRESS
G.P. Giatrakos et al. / Energy Policy 37 (2009) 1222–1238 1227
3.5.4. Water heating
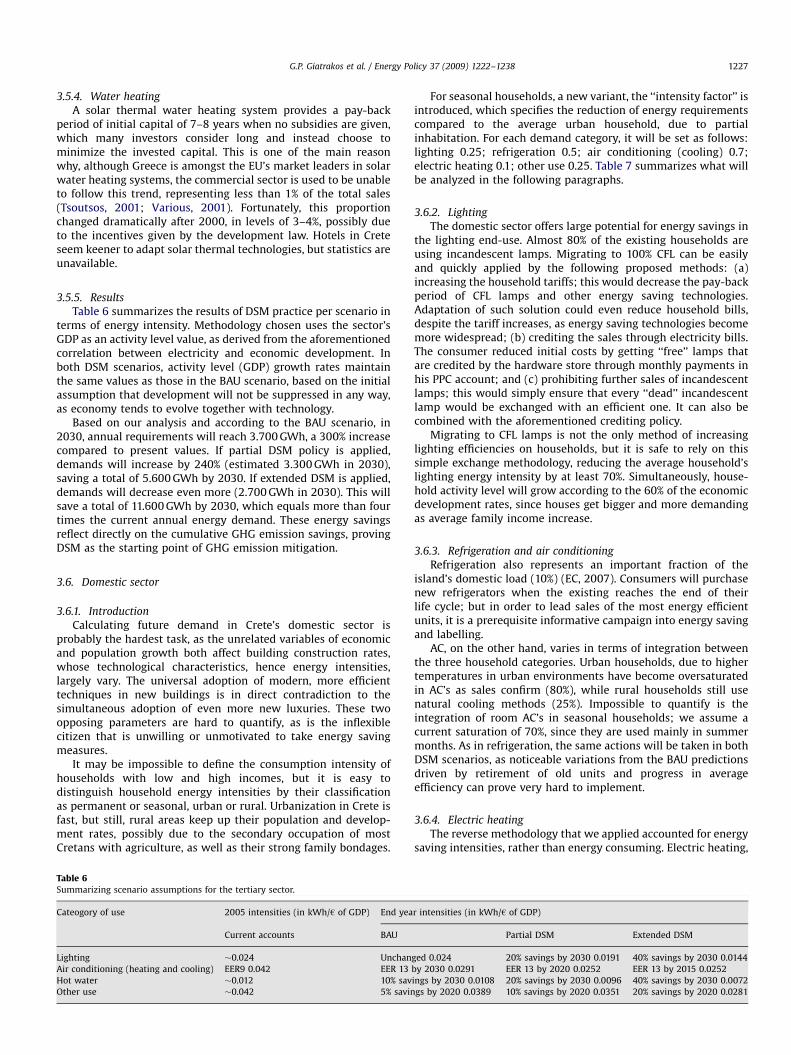
A solar thermal water heating system provides a pay-backperiod of initial capital of 7–8 years when no subsidies are given,which many investors consider long and instead choose tominimize the invested capital. This is one of the main reasonwhy, although Greece is amongst the EU’s market leaders in solarwater heating systems, the commercial sector is used to be unableto follow this trend, representing less than 1% of the total sales(Tsoutsos, 2001; Various, 2001). Fortunately, this proportionchanged dramatically after 2000, in levels of 3–4%, possibly dueto the incentives given by the development law. Hotels in Creteseem keener to adapt solar thermal technologies, but statistics areunavailable.
3.5.5. Results
Table 6 summarizes the results of DSM practice per scenario interms of energy intensity. Methodology chosen uses the sector’sGDP as an activity level value, as derived from the aforementionedcorrelation between electricity and economic development. Inboth DSM scenarios, activity level (GDP) growth rates maintainthe same values as those in the BAU scenario, based on the initialassumption that development will not be suppressed in any way,as economy tends to evolve together with technology.
Based on our analysis and according to the BAU scenario, in2030, annual requirements will reach 3.700 GWh, a 300% increasecompared to present values. If partial DSM policy is applied,demands will increase by 240% (estimated 3.300 GWh in 2030),saving a total of 5.600 GWh by 2030. If extended DSM is applied,demands will decrease even more (2.700 GWh in 2030). This willsave a total of 11.600 GWh by 2030, which equals more than fourtimes the current annual energy demand. These energy savingsreflect directly on the cumulative GHG emission savings, provingDSM as the starting point of GHG emission mitigation.
3.6. Domestic sector
3.6.1. Introduction
Calculating future demand in Crete’s domestic sector isprobably the hardest task, as the unrelated variables of economicand population growth both affect building construction rates,whose technological characteristics, hence energy intensities,largely vary. The universal adoption of modern, more efficienttechniques in new buildings is in direct contradiction to thesimultaneous adoption of even more new luxuries. These twoopposing parameters are hard to quantify, as is the inflexiblecitizen that is unwilling or unmotivated to take energy savingmeasures.
It may be impossible to define the consumption intensity ofhouseholds with low and high incomes, but it is easy todistinguish household energy intensities by their classificationas permanent or seasonal, urban or rural. Urbanization in Crete isfast, but still, rural areas keep up their population and develop-ment rates, possibly due to the secondary occupation of mostCretans with agriculture, as well as their strong family bondages.
Table 6Summarizing scenario assumptions for the tertiary sector.
Cateogory of use 2005 intensities (in kWh/h of GDP) End yea
Current accounts BAU
Lighting �0.024 Unchan
Air conditioning (heating and cooling) EER9 0.042 EER 13
Hot water �0.012 10% sav
Other use �0.042 5% savin
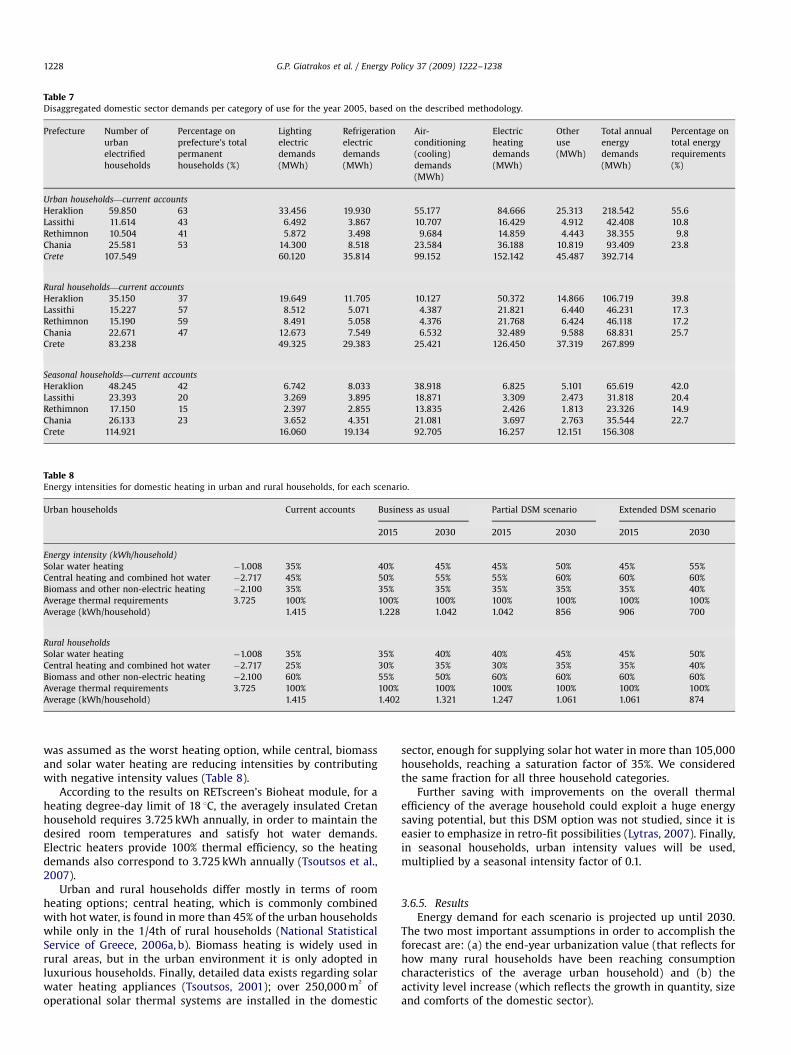
For seasonal households, a new variant, the ‘‘intensity factor’’ isintroduced, which specifies the reduction of energy requirementscompared to the average urban household, due to partialinhabitation. For each demand category, it will be set as follows:lighting 0.25; refrigeration 0.5; air conditioning (cooling) 0.7;electric heating 0.1; other use 0.25. Table 7 summarizes what willbe analyzed in the following paragraphs.
3.6.2. Lighting
The domestic sector offers large potential for energy savings inthe lighting end-use. Almost 80% of the existing households areusing incandescent lamps. Migrating to 100% CFL can be easilyand quickly applied by the following proposed methods: (a)increasing the household tariffs; this would decrease the pay-backperiod of CFL lamps and other energy saving technologies.Adaptation of such solution could even reduce household bills,despite the tariff increases, as energy saving technologies becomemore widespread; (b) crediting the sales through electricity bills.The consumer reduced initial costs by getting ‘‘free’’ lamps thatare credited by the hardware store through monthly payments inhis PPC account; and (c) prohibiting further sales of incandescentlamps; this would simply ensure that every ‘‘dead’’ incandescentlamp would be exchanged with an efficient one. It can also becombined with the aforementioned crediting policy.
Migrating to CFL lamps is not the only method of increasinglighting efficiencies on households, but it is safe to rely on thissimple exchange methodology, reducing the average household’slighting energy intensity by at least 70%. Simultaneously, house-hold activity level will grow according to the 60% of the economicdevelopment rates, since houses get bigger and more demandingas average family income increase.
3.6.3. Refrigeration and air conditioning
Refrigeration also represents an important fraction of theisland’s domestic load (10%) (EC, 2007). Consumers will purchasenew refrigerators when the existing reaches the end of theirlife cycle; but in order to lead sales of the most energy efficientunits, it is a prerequisite informative campaign into energy savingand labelling.
AC, on the other hand, varies in terms of integration betweenthe three household categories. Urban households, due to highertemperatures in urban environments have become oversaturatedin AC’s as sales confirm (80%), while rural households still usenatural cooling methods (25%). Impossible to quantify is theintegration of room AC’s in seasonal households; we assume acurrent saturation of 70%, since they are used mainly in summermonths. As in refrigeration, the same actions will be taken in bothDSM scenarios, as noticeable variations from the BAU predictionsdriven by retirement of old units and progress in averageefficiency can prove very hard to implement.
3.6.4. Electric heating
The reverse methodology that we applied accounted for energysaving intensities, rather than energy consuming. Electric heating,
r intensities (in kWh/h of GDP)
Partial DSM Extended DSM
ged 0.024 20% savings by 2030 0.0191 40% savings by 2030 0.0144
by 2030 0.0291 EER 13 by 2020 0.0252 EER 13 by 2015 0.0252
ings by 2030 0.0108 20% savings by 2030 0.0096 40% savings by 2030 0.0072
gs by 2020 0.0389 10% savings by 2020 0.0351 20% savings by 2020 0.0281
ARTICLE IN PRESS
Table 8Energy intensities for domestic heating in urban and rural households, for each scenario.
Urban households Current accounts Business as usual Partial DSM scenario Extended DSM scenario
2015 2030 2015 2030 2015 2030
Energy intensity (kWh/household)
Solar water heating �1.008 35% 40% 45% 45% 50% 45% 55%
Central heating and combined hot water �2.717 45% 50% 55% 55% 60% 60% 60%
Biomass and other non-electric heating �2.100 35% 35% 35% 35% 35% 35% 40%
Average thermal requirements 3.725 100% 100% 100% 100% 100% 100% 100%
Average (kWh/household) 1.415 1.228 1.042 1.042 856 906 700
Rural households
Solar water heating �1.008 35% 35% 40% 40% 45% 45% 50%
Central heating and combined hot water �2.717 25% 30% 35% 30% 35% 35% 40%
Biomass and other non-electric heating �2.100 60% 55% 50% 60% 60% 60% 60%
Average thermal requirements 3.725 100% 100% 100% 100% 100% 100% 100%
Average (kWh/household) 1.415 1.402 1.321 1.247 1.061 1.061 874
Table 7Disaggregated domestic sector demands per category of use for the year 2005, based on the described methodology.
Prefecture Number of
urban
electrified
households
Percentage on
prefecture’s total
permanent
households (%)
Lighting
electric
demands
(MWh)
Refrigeration
electric
demands
(MWh)
Air-
conditioning
(cooling)
demands
(MWh)
Electric
heating
demands
(MWh)
Other
use
(MWh)
Total annual
energy
demands
(MWh)
Percentage on
total energy
requirements
(%)
Urban households—current accounts
Heraklion 59.850 63 33.456 19.930 55.177 84.666 25.313 218.542 55.6
Lassithi 11.614 43 6.492 3.867 10.707 16.429 4.912 42.408 10.8
Rethimnon 10.504 41 5.872 3.498 9.684 14.859 4.443 38.355 9.8
Chania 25.581 53 14.300 8.518 23.584 36.188 10.819 93.409 23.8
Crete 107.549 60.120 35.814 99.152 152.142 45.487 392.714
Rural households—current accounts
Heraklion 35.150 37 19.649 11.705 10.127 50.372 14.866 106.719 39.8
Lassithi 15.227 57 8.512 5.071 4.387 21.821 6.440 46.231 17.3
Rethimnon 15.190 59 8.491 5.058 4.376 21.768 6.424 46.118 17.2
Chania 22.671 47 12.673 7.549 6.532 32.489 9.588 68.831 25.7
Crete 83.238 49.325 29.383 25.421 126.450 37.319 267.899
Seasonal households—current accounts
Heraklion 48.245 42 6.742 8.033 38.918 6.825 5.101 65.619 42.0
Lassithi 23.393 20 3.269 3.895 18.871 3.309 2.473 31.818 20.4
Rethimnon 17.150 15 2.397 2.855 13.835 2.426 1.813 23.326 14.9
Chania 26.133 23 3.652 4.351 21.081 3.697 2.763 35.544 22.7
Crete 114.921 16.060 19.134 92.705 16.257 12.151 156.308
G.P. Giatrakos et al. / Energy Policy 37 (2009) 1222–12381228
was assumed as the worst heating option, while central, biomassand solar water heating are reducing intensities by contributingwith negative intensity values (Table 8).
According to the results on RETscreen’s Bioheat module, for aheating degree-day limit of 18 1C, the averagely insulated Cretanhousehold requires 3.725 kWh annually, in order to maintain thedesired room temperatures and satisfy hot water demands.Electric heaters provide 100% thermal efficiency, so the heatingdemands also correspond to 3.725 kWh annually (Tsoutsos et al.,2007).
Urban and rural households differ mostly in terms of roomheating options; central heating, which is commonly combinedwith hot water, is found in more than 45% of the urban householdswhile only in the 1/4th of rural households (National StatisticalService of Greece, 2006a, b). Biomass heating is widely used inrural areas, but in the urban environment it is only adopted inluxurious households. Finally, detailed data exists regarding solarwater heating appliances (Tsoutsos, 2001); over 250,000 m
2
ofoperational solar thermal systems are installed in the domestic
sector, enough for supplying solar hot water in more than 105,000households, reaching a saturation factor of 35%. We consideredthe same fraction for all three household categories.
Further saving with improvements on the overall thermalefficiency of the average household could exploit a huge energysaving potential, but this DSM option was not studied, since it iseasier to emphasize in retro-fit possibilities (Lytras, 2007). Finally,in seasonal households, urban intensity values will be used,multiplied by a seasonal intensity factor of 0.1.
3.6.5. Results
Energy demand for each scenario is projected up until 2030.The two most important assumptions in order to accomplish theforecast are: (a) the end-year urbanization value (that reflects forhow many rural households have been reaching consumptioncharacteristics of the average urban household) and (b) theactivity level increase (which reflects the growth in quantity, sizeand comforts of the domestic sector).
ARTICLE IN PRESS
160
Urban\Refrigeration
Gig
awat
t-H
ours
Rural\Refrigeration
Urban\Other Uses
Rural\Other Uses
Urban\Lighting
Rural\Lighting
Urban\Heating DemandsUrban\Air Conditioning
Rural\Heating DemandsRural\Air Conditioning
1701601501401301201101009080706050403020100
155150145140135130125
110
120115
10510095908580757065605550454035302520151050
2005 2007 2009 2011 2013 2015 2017 2019 2021 2023 2025 2027 2029 2005 2007 2009 2011 2013 2015 2017 2019 2021 2023 2025 2027 2029
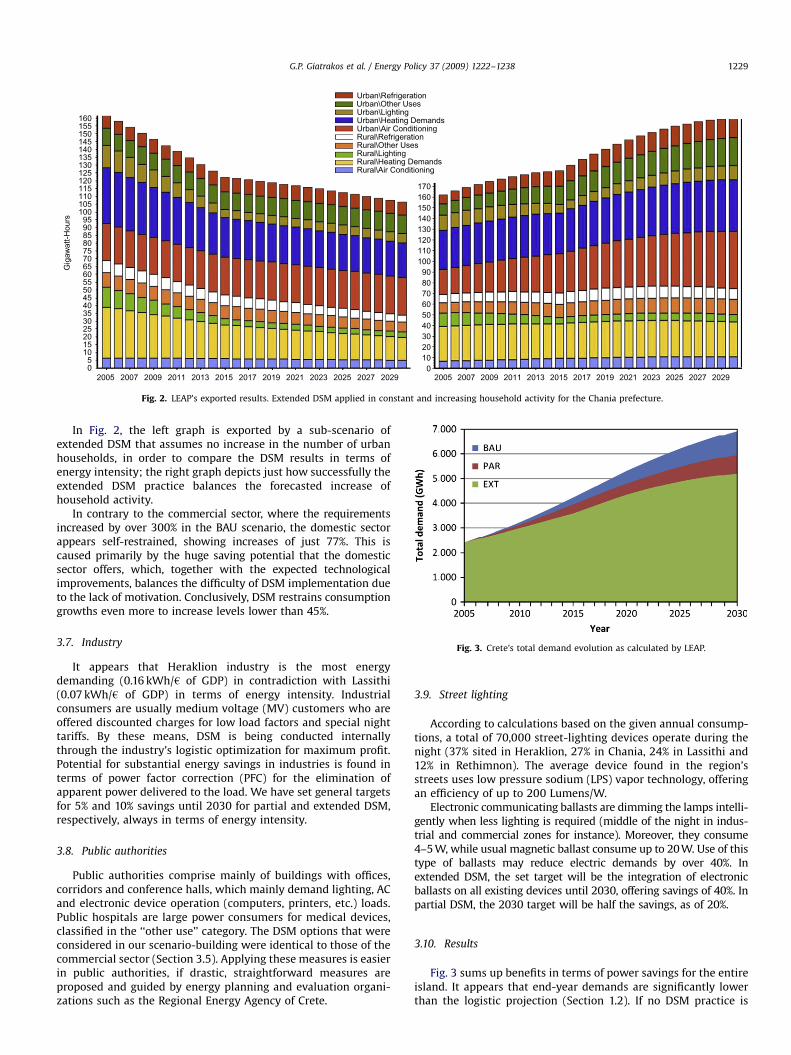
Fig. 2. LEAP’s exported results. Extended DSM applied in constant and increasing household activity for the Chania prefecture.
Fig. 3. Crete’s total demand evolution as calculated by LEAP.
G.P. Giatrakos et al. / Energy Policy 37 (2009) 1222–1238 1229
In Fig. 2, the left graph is exported by a sub-scenario ofextended DSM that assumes no increase in the number of urbanhouseholds, in order to compare the DSM results in terms ofenergy intensity; the right graph depicts just how successfully theextended DSM practice balances the forecasted increase ofhousehold activity.
In contrary to the commercial sector, where the requirementsincreased by over 300% in the BAU scenario, the domestic sectorappears self-restrained, showing increases of just 77%. This iscaused primarily by the huge saving potential that the domesticsector offers, which, together with the expected technologicalimprovements, balances the difficulty of DSM implementation dueto the lack of motivation. Conclusively, DSM restrains consumptiongrowths even more to increase levels lower than 45%.
3.7. Industry
It appears that Heraklion industry is the most energydemanding (0.16 kWh/h of GDP) in contradiction with Lassithi(0.07 kWh/h of GDP) in terms of energy intensity. Industrialconsumers are usually medium voltage (MV) customers who areoffered discounted charges for low load factors and special nighttariffs. By these means, DSM is being conducted internallythrough the industry’s logistic optimization for maximum profit.Potential for substantial energy savings in industries is found interms of power factor correction (PFC) for the elimination ofapparent power delivered to the load. We have set general targetsfor 5% and 10% savings until 2030 for partial and extended DSM,respectively, always in terms of energy intensity.
3.8. Public authorities
Public authorities comprise mainly of buildings with offices,corridors and conference halls, which mainly demand lighting, ACand electronic device operation (computers, printers, etc.) loads.Public hospitals are large power consumers for medical devices,classified in the ‘‘other use’’ category. The DSM options that wereconsidered in our scenario-building were identical to those of thecommercial sector (Section 3.5). Applying these measures is easierin public authorities, if drastic, straightforward measures areproposed and guided by energy planning and evaluation organi-zations such as the Regional Energy Agency of Crete.
3.9. Street lighting
According to calculations based on the given annual consump-tions, a total of 70,000 street-lighting devices operate during thenight (37% sited in Heraklion, 27% in Chania, 24% in Lassithi and12% in Rethimnon). The average device found in the region’sstreets uses low pressure sodium (LPS) vapor technology, offeringan efficiency of up to 200 Lumens/W.
Electronic communicating ballasts are dimming the lamps intelli-gently when less lighting is required (middle of the night in indus-trial and commercial zones for instance). Moreover, they consume4–5 W, while usual magnetic ballast consume up to 20 W. Use of thistype of ballasts may reduce electric demands by over 40%. Inextended DSM, the set target will be the integration of electronicballasts on all existing devices until 2030, offering savings of 40%. Inpartial DSM, the 2030 target will be half the savings, as of 20%.
3.10. Results
Fig. 3 sums up benefits in terms of power savings for the entireisland. It appears that end-year demands are significantly lowerthan the logistic projection (Section 1.2). If no DSM practice is
ARTICLE IN PRESS
G.P. Giatrakos et al. / Energy Policy 37 (2009) 1222–12381230
applied, demands will reach 6.900 GWh, which is 30% lower thanlogistically forecasted. This is justified by the inevitable introduc-tion of energy saving technologies in the BAU scenario as theresult of an emphasis given on efficiency from manufacturersworldwide.
DSM restrains growths even further; only 5.100 GWh will beconsumed in 2030 according to the extended DSM scenario, whichwill save an extra 27% of energy annually and a total of21,000 GWh until 2030. This counts for 8,5 years of systemdemand in present terms.
Table 9Available power units in the island’s system, during the year 2005.
Power production units Capacity (MW) Gross production (MWh)
Steam turbine and CC units
Linoperamata steam (6 units) 111.2 685.3237
Chania CC (3 units) 133.4 477.3700
Total 111.2 685.3237
Diesel units
Linoperamata (4 units) 49.2 260.3570
Atherinolakkos (2 units) 102.0 649.3347
4. Analyzing the system’s current transmission andgeneration structure
4.1. Transmission network in Crete
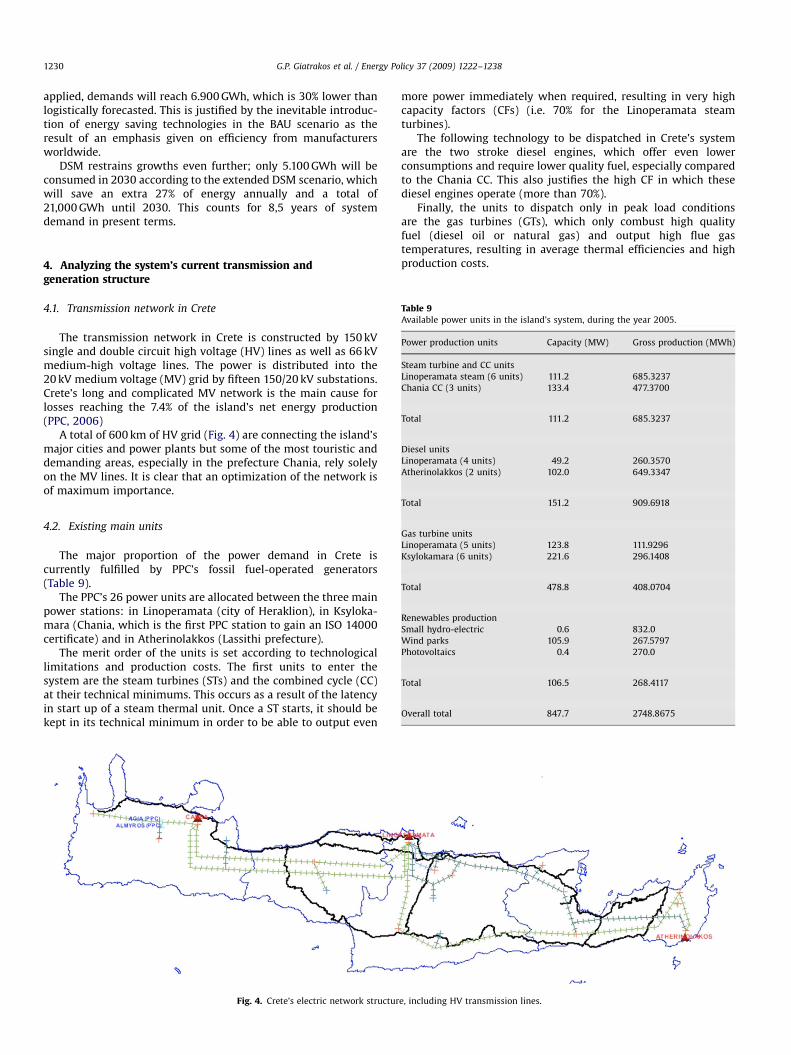
The transmission network in Crete is constructed by 150 kVsingle and double circuit high voltage (HV) lines as well as 66 kVmedium-high voltage lines. The power is distributed into the20 kV medium voltage (MV) grid by fifteen 150/20 kV substations.Crete’s long and complicated MV network is the main cause forlosses reaching the 7.4% of the island’s net energy production(PPC, 2006)
A total of 600 km of HV grid (Fig. 4) are connecting the island’smajor cities and power plants but some of the most touristic anddemanding areas, especially in the prefecture Chania, rely solelyon the MV lines. It is clear that an optimization of the network isof maximum importance.
Total 151.2 909.6918
Gas turbine units
Linoperamata (5 units) 123.8 111.9296
Ksylokamara (6 units) 221.6 296.1408
Total 478.8 408.0704
Renewables production
Small hydro-electric 0.6 832.0
Wind parks 105.9 267.5797
Photovoltaics 0.4 270.0
Total 106.5 268.4117
Overall total 847.7 2748.8675
4.2. Existing main units
The major proportion of the power demand in Crete iscurrently fulfilled by PPC’s fossil fuel-operated generators(Table 9).
The PPC’s 26 power units are allocated between the three mainpower stations: in Linoperamata (city of Heraklion), in Ksyloka-mara (Chania, which is the first PPC station to gain an ISO 14000certificate) and in Atherinolakkos (Lassithi prefecture).
The merit order of the units is set according to technologicallimitations and production costs. The first units to enter thesystem are the steam turbines (STs) and the combined cycle (CC)at their technical minimums. This occurs as a result of the latencyin start up of a steam thermal unit. Once a ST starts, it should bekept in its technical minimum in order to be able to output even
Fig. 4. Crete’s electric network structur
more power immediately when required, resulting in very highcapacity factors (CFs) (i.e. 70% for the Linoperamata steamturbines).
The following technology to be dispatched in Crete’s systemare the two stroke diesel engines, which offer even lowerconsumptions and require lower quality fuel, especially comparedto the Chania CC. This also justifies the high CF in which thesediesel engines operate (more than 70%).
Finally, the units to dispatch only in peak load conditionsare the gas turbines (GTs), which only combust high qualityfuel (diesel oil or natural gas) and output high flue gastemperatures, resulting in average thermal efficiencies and highproduction costs.
e, including HV transmission lines.
ARTICLE IN PRESS
G.P. Giatrakos et al. / Energy Policy 37 (2009) 1222–1238 1231
4.3. Wind energy
The majority of existing wind parks in Crete can be found inLassithi, in eastern, where numerous sites experience averagewind speeds exceeding 10 m/s (Christakis, 2002).
PPC made a head start before year 2000 with five wind parks ofa total capacity of 16.8 MW, in Itanos Municipality, Lassithi. Sincethe market deregulation, PPC and independent producers havebeen licensed for an extra 195.5 MW of wind capacity (20), fromwhich only 105 MW are in operation (January 2006).
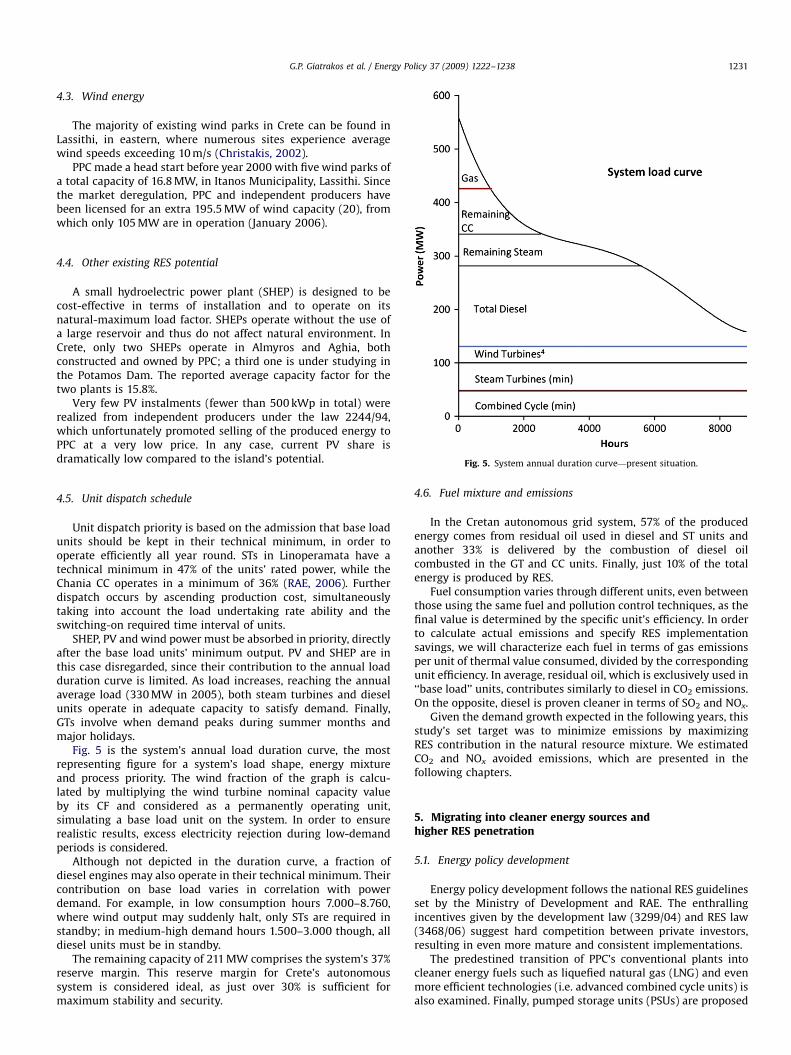
Fig. 5. System annual duration curve—present situation.
4.4. Other existing RES potential
A small hydroelectric power plant (SHEP) is designed to becost-effective in terms of installation and to operate on itsnatural-maximum load factor. SHEPs operate without the use ofa large reservoir and thus do not affect natural environment. InCrete, only two SHEPs operate in Almyros and Aghia, bothconstructed and owned by PPC; a third one is under studying inthe Potamos Dam. The reported average capacity factor for thetwo plants is 15.8%.
Very few PV instalments (fewer than 500 kWp in total) wererealized from independent producers under the law 2244/94,which unfortunately promoted selling of the produced energy toPPC at a very low price. In any case, current PV share isdramatically low compared to the island’s potential.
4.5. Unit dispatch schedule
Unit dispatch priority is based on the admission that base loadunits should be kept in their technical minimum, in order tooperate efficiently all year round. STs in Linoperamata have atechnical minimum in 47% of the units’ rated power, while theChania CC operates in a minimum of 36% (RAE, 2006). Furtherdispatch occurs by ascending production cost, simultaneouslytaking into account the load undertaking rate ability and theswitching-on required time interval of units.
SHEP, PV and wind power must be absorbed in priority, directlyafter the base load units’ minimum output. PV and SHEP are inthis case disregarded, since their contribution to the annual loadduration curve is limited. As load increases, reaching the annualaverage load (330 MW in 2005), both steam turbines and dieselunits operate in adequate capacity to satisfy demand. Finally,GTs involve when demand peaks during summer months andmajor holidays.
Fig. 5 is the system’s annual load duration curve, the mostrepresenting figure for a system’s load shape, energy mixtureand process priority. The wind fraction of the graph is calcu-lated by multiplying the wind turbine nominal capacity valueby its CF and considered as a permanently operating unit,simulating a base load unit on the system. In order to ensurerealistic results, excess electricity rejection during low-demandperiods is considered.
Although not depicted in the duration curve, a fraction ofdiesel engines may also operate in their technical minimum. Theircontribution on base load varies in correlation with powerdemand. For example, in low consumption hours 7.000–8.760,where wind output may suddenly halt, only STs are required instandby; in medium-high demand hours 1.500–3.000 though, alldiesel units must be in standby.
The remaining capacity of 211 MW comprises the system’s 37%reserve margin. This reserve margin for Crete’s autonomoussystem is considered ideal, as just over 30% is sufficient formaximum stability and security.
4.6. Fuel mixture and emissions
In the Cretan autonomous grid system, 57% of the producedenergy comes from residual oil used in diesel and ST units andanother 33% is delivered by the combustion of diesel oilcombusted in the GT and CC units. Finally, just 10% of the totalenergy is produced by RES.
Fuel consumption varies through different units, even betweenthose using the same fuel and pollution control techniques, as thefinal value is determined by the specific unit’s efficiency. In orderto calculate actual emissions and specify RES implementationsavings, we will characterize each fuel in terms of gas emissionsper unit of thermal value consumed, divided by the correspondingunit efficiency. In average, residual oil, which is exclusively used in‘‘base load’’ units, contributes similarly to diesel in CO2 emissions.On the opposite, diesel is proven cleaner in terms of SO2 and NOx.
Given the demand growth expected in the following years, thisstudy’s set target was to minimize emissions by maximizingRES contribution in the natural resource mixture. We estimatedCO2 and NOx avoided emissions, which are presented in thefollowing chapters.
5. Migrating into cleaner energy sources andhigher RES penetration
5.1. Energy policy development
Energy policy development follows the national RES guidelinesset by the Ministry of Development and RAE. The enthrallingincentives given by the development law (3299/04) and RES law(3468/06) suggest hard competition between private investors,resulting in even more mature and consistent implementations.
The predestined transition of PPC’s conventional plants intocleaner energy fuels such as liquefied natural gas (LNG) and evenmore efficient technologies (i.e. advanced combined cycle units) isalso examined. Finally, pumped storage units (PSUs) are proposed
ARTICLE IN PRESS
G.P. Giatrakos et al. / Energy Policy 37 (2009) 1222–12381232
in a separate scenario in order to achieve an even higher windpenetration margin in the island’s system and also increase itsreserve margin.
A summary of the main targets of the adopted energy policy inthis study follows: (a) direct increase of production capacity,giving priority to RES, in order to satisfy the additional energydemand in the following years; (b) ensuring an adequate reservemargin, capable of dealing with suddenly increased peak loads,while simultaneously minimizing the recurring use of the reserveunits; (c) decentralizing the system by adding RES units inscattered locations, preferably near consumption areas, therefore,reducing transmission losses and adding to local development in asustainable way and (d) full exploitation of the available naturalresources in a profitable and environment-caring way; keyresources for Crete which can be directly used through maturetechnologies are considered wind, solar, hydro and biomass.
5.2. Expansion and alternative fuels for controllable resource units
5.2.1. Methodology approach
In the following paragraphs, we examine the evolution inCrete’s thermal plants. New technologies and power stations areconsidered ‘‘exogenous capacity additions’’, while power upgradesthrough expanded units in existing stations appear as endogenousadditions, which will be deployed by the model, whenever it isconsidered necessary to increase capacity reserve margin.
We emulate transition to LNG for each process according to ourforecasts and assumptions. Importing LNG in Crete aims toeliminate SO2, NOx and flying ashes which deteriorate nearbyenvironment. Still, unlike RES, in terms of thermal pollution andCO2 emissions, LNG only offers small advantages over fuel oil.
5.2.2. PPC’s existing power plants
Atherinolakkos, the newest PPC station, is planned for addi-tional 93 MW of GT capacity; migration to LNG is temporarily outof the question; it would be safe to consider LNG adaptation after2020, since priority will be given to the near-city stations ofChania and Linoperamata.
Regarding Linoperamata, the Heraklion station, PPC intends totransfer all the existing GT units to the upcoming Corakies station.Old units will be replaced and new ones will be added accordingto the indefinite emergency demand coverage license acquired byRAE, until the Corakies station finally starts operating. Heavy oil-burning STs and diesel engines will be discontinued by theirestimated end of life.
There are no plans for retirement of existing units andreduction of capacity on the Chania thermal station. On theopposite, PPC intends to replace units at the end of their lifespanand possibly add new GT and CC units to cope with increaseddemands. Evolution of the plant is bound to persist at least untilthe 300 MW Corakies station is expected to enter the system.Chania will adopt LNG quite possibly concurrently with Linoper-amata, after 2015.
5.2.3. The Corakies future station
During the previous decade, the erection of a new thermalpower station that would replace the degrading Linoperamataplant was heavily discussed. The Corakies location (in betweenRethimnon and Heraklion) was finally selected as it combinessome key advantages.
Although the area suffers from difficulties in the constructionof the docking station due to steep depths, this new station willboast a capacity of at least 350 MW, which will comprise of CC andgas turbine units.
In terms of fuel use, it is expected that the units will be usingLNG, which will be imported after 2010 due to the difficulties inthe installation of an LNG terminal station in the island; till thenCorakies units will operate with low-sulfur residual fuel oil.
5.2.4. LNG terminal facility
LNG, has been discussed for years as the ultimate importedresource that would solve the environmental problem, based onthe appropriate siting a LNG terminal (Kapros, 2006), whichaffects the cost of the entire project, since, among others, itdetermines the course and size of LNG transfer pipes.
A study conducted in 2004, proposes an implementationsolution that would include LNG storage in 160,000 m3 tanksand transportation though ships which would not require adocking bay. The solution would provide up to 900 million m3 ofLNG annually, satisfying a total of 900 MW of installed capacity inCC-based operation (Katsaprakis and Christakis, 2004). The samestudy reports that direct adaptation of LNG would be 15% cheaperin terms of overall running costs, at 78h/MWh produced from LNGvs. 91.5h/MWh from fuel oil, in 2006 prices. Concluding, we willset 2012 as an optimistic yet achievable target for LNG adoption.In the following three years, the constructed pipelines areexpected to supply LNG to Chania and Heraklion, and requiredmodifications in equipment will allow all units to operate on LNG.Finally, after 2020, it is possible that Atherinolakkos will also bepowered by LNG.
5.3. Wind power, evolution
5.3.1. Feasibility and economic evaluation
The RETscreen wind module was used to conduct ourfeasibility analysis on new wind energy applications in the island.We considered a minimum average wind speed of 8.5 m/s, asprojects in locations that fall below this set limit fail to getlicensed; another important design parameter in autonomousgrids is the park’s minimum CF, which should be at least 27.5%.The CF is in no direct correlation to the average wind speed, sinceup to 25% of the annual production is being rejected (Kaldellis etal., 2004). In fact, as was proven by the module’s sensitivityanalysis overview, these two parameters are some of the mostcrucial in terms of internal rate of return (IRR) and pay-backperiod indicators.
Feed-in tariffs and escalation rates were in accordance to law3468/06, while the funding scheme follows track of law 3299/04,with 50% subsidies and 25% debt ratio. Costs for a completeturnkey wind park, including wind turbine foundation anderection, road construction, transmission line, substation, controland O&M buildings and transportation costs were calculated at1.400h/kWe for mid-range instalments. System O&M costs wereset at 0.025 h/kWh produced by the wind turbines.
Financial summary unveiled rewarding results; pre tax IRR of21.0% in terms of invested capital and simple pay-back period of5.2 years can be characterized as prosperous. It is, therefore,certain that many, even more fruitful implementations will beachieved if: (a) wind speeds surpass 9 m/s, (b) much cheapermaterial is assured, (c) O&M costs are reduced by optimizationand most importantly and (d) smaller amounts of electricityare rejected.
5.3.2. Wind penetration potential
Regulations on the determination of wind penetration poten-tial in autonomous islands are based on the following basicadmissions: (a) technical minima of the incorporated conven-tional production units must never be breached; this measureensures that no excess electricity resolving from polluting fossil
ARTICLE IN PRESS
G.P. Giatrakos et al. / Energy Policy 37 (2009) 1222–1238 1233
fuels is produced and (b) total wind capacity must not exceed acertain fraction of the total controllable production units’capacity; this is limited to 30% for Crete in order to preserve thecapability of compensating through conventional units forthe frequency fluctuations, due to sheer variations in windpower output.
Contracts between PPC and independent wind power produ-cers limit wind absorption to 30% of the operating units’ nominalcapacity in hourly basis, giving PPC the authority of discardingexcess wind power. The higher the wind penetration gets, themore electricity gets rejected during low consumption periods, asis confirmed by recent studies resulting in lower annual produc-tions, hence incomes for producers.
From an environmental point of view, the set limit might beconsidered conservative, as results show that wind contribution inthe annual energy mixture are still low, but studies carried out byRAE show that limitations are rather reasonable.
In 2005, Crete’s wind production achieved a disappointing CFof 28.8%, which is set to decrease even below the set limits, aslicensed projects are brought to life. RAE intends to license futurewind parks judging by the system’s ‘‘viable capacity’’; thisindicator is set as the fraction of the island’s average load that ifimplemented though new wind parks, will result in the minimalCF of 27.5%, preserving viability of existing instalments.
A simple tactic for increasing penetration is scattering windparks between different locations in all of Crete’s territories.Except from decreasing transmission losses and frequency drops,this decentralization approach utilizes the wide differentiation ofwind conditions throughout the island, resulting in a moreuniform allocation of wind output. This tactic was applied byRAE recently, as most wind parks due for implementation within2007 and 2008 are set in different, unexploited locations (RAE,2003). Even more recent simulations were conducted by RAEusing, instead of one wind time series, three independent butsimultaneous time series of 8.5 m/s average wind speed. Theresults showed that the system is far from saturated, ensuring atleast 50 MW of safe wind capacity additions.
Another more aggressive tactic is the storage of the excesselectricity through PSUs. Specific case studies (Georgiadis et al.,2002) have shown that the addition of a PSU that equals theisland’s wind capacity that can drive to safe penetration of windcapacity to an hourly fraction of 36.4%, whereas current limit of30% without a PSU is considered critical for the system’s stability.Determination of size, cost and economic viability of the plant aremainly depending on the location and the hydraulic head betweenthe two reservoirs.
PSUs is examined separately through a special scenario,allowing for higher wind penetration in terms of installedcapacity and simultaneously, overall CF increase due to excessenergy utilization.
5.4. Solar power, photovoltaic revolution
5.4.1. Feasibility and economic evaluation
Crete offers excellent solar potential; solar data for the island isacquired by the PV geographical information system (PVGIS)created by the European Commission’s Joint Research Centre (JRC-PVGIS). PVGIS calculates more than 4.8 kWh/m2/day of averagesolar irradiation at optimal angle (281) for the largest part of Crete,which equals to 1.600 kWh/kWp of fixed crystalline siliconmodules including ambient temperature losses. CorrespondingPV system CF is 15.1% for a fixed panel setup, while two-axistracking systems are capable of increasing it to 19.6%.
In terms of scale, a medium range non-tracked PV park will beexamined, as investment interest peaks at 100 kWp, which is
caused by three important variables: (a) high-production credit at0.50 h/kWh, (b) possibility of connecting at low voltage distribu-tion lines and (c) ease of authorization by facilitated licensingprocedures. Costs for a complete turnkey PV park of 100 kWp,including modules, mounting structures, inverters, land formationand other essentials are estimated around 6.000 hkWp based oncurrent prices.
Financial summary, using a similar funding scheme to the oneseen previously in wind parks resulted in pre tax IRR of 29.0% anda simple pay-back period of 3.4 years, again in terms of investedcapital. It seems unquestionable that immense interest will beshown by private investors, which will be attracted by theprofitability and ease of implementation of PV systems; therefore,all set targets for solar penetration in the island will be easilyaccomplished.
5.4.2. Penetration potential
Reports (RAE, 2007) showed that PV adaptation up to15% of the average system load interferes minimally with theobtained wind capacity factor, reducing it only by 0.5–1.0%.According to the same source, total RES maximum hourlypenetration limit should increase up to 35% after the additionof PV units in wind-saturated islands. This policy will ensure thatthe operating units’ technical minima will not be breached on a99% probability.
For year 2007, RAE and the Ministry of Development haveproclaimed a total of 49 MW on PV licenses, which correspond tothe 15% of the estimated year 2006 average loads. RAE intends tokeep licensing PV parks accordingly, as system loads increaseduring the following years. According to LEAP’s BAU demandcalculations, our adopted policy will consider a total capacity of140 MWp up to 2030.
5.5. Small hydro
Unlike solar technologies, law 3468/06 did not provide anyadditional production credit for hydro-produced electricity, yet itsimplifies licensing procedures by granting ‘‘application exempts’’for applications smaller than 40 kWe. Unfortunately, given theisland’s total needs, only considerably sized SHEPs can noticeablycontribute to its energy status.
An important number of sites are suitable for exploitation inthe scale of 0.5–10 kMWe. For the needs of our plan, we examineda total of 30 MWe of SHEPs until 2030. Economic analysis cannotbe investigated as observed CFs may vary dramatically betweenlocations and historical hydraulic data for credible locationscannot be obtained.
5.6. Biomass
Among the potentially CO2-neutral and less polluting energyalternatives that are being seriously considered for large-scaleimplementation, biomass offers (a) controllable base-load elec-trical power depending on annual biomass supply and (b)possibility to be converted into liquid transportation fuels;therefore, it could become a key part of the solution (Vamvukaand Tsoutsos, 2002). Several plans have been formulated,suggesting that biomass residues can substitute a large part ofconventional fuels. Most of these technologies are mature and canbe embodied in the Cretan energy system that contribute in thelocal-regional development and create new jobs (Umealu et al.,1991).
Exploitation of biomass will be based (a) on the island’smajor agricultural residues such as olive kernel, citrus fruitsand grapes, (b) tree branches and (c) forestry biomass. In order
ARTICLE IN PRESS
G.P. Giatrakos et al. / Energy Policy 37 (2009) 1222–12381234
to implement a large-scale CHP application, ensuring theuninterrupted resource availability via contracting and finding astrategic location near a populated area is compulsory.
Studies regarding the island’s endogenous biomass potentialhave shown that, even with low-source retrieval factors ofagricultural residues, instalments of the 10 MWe scale are possiblenear the agricultural areas, such as Heraklio’s Messara. Intenseexploitation of all sources beyond residues with increasedretrieval factors may result up to 60 MWe, in different locationsaround Crete. For the needs of our model, we have set this targetto be accomplished in 2025; implementation shall be concludedin 10 MWe steps, starting from 2010.
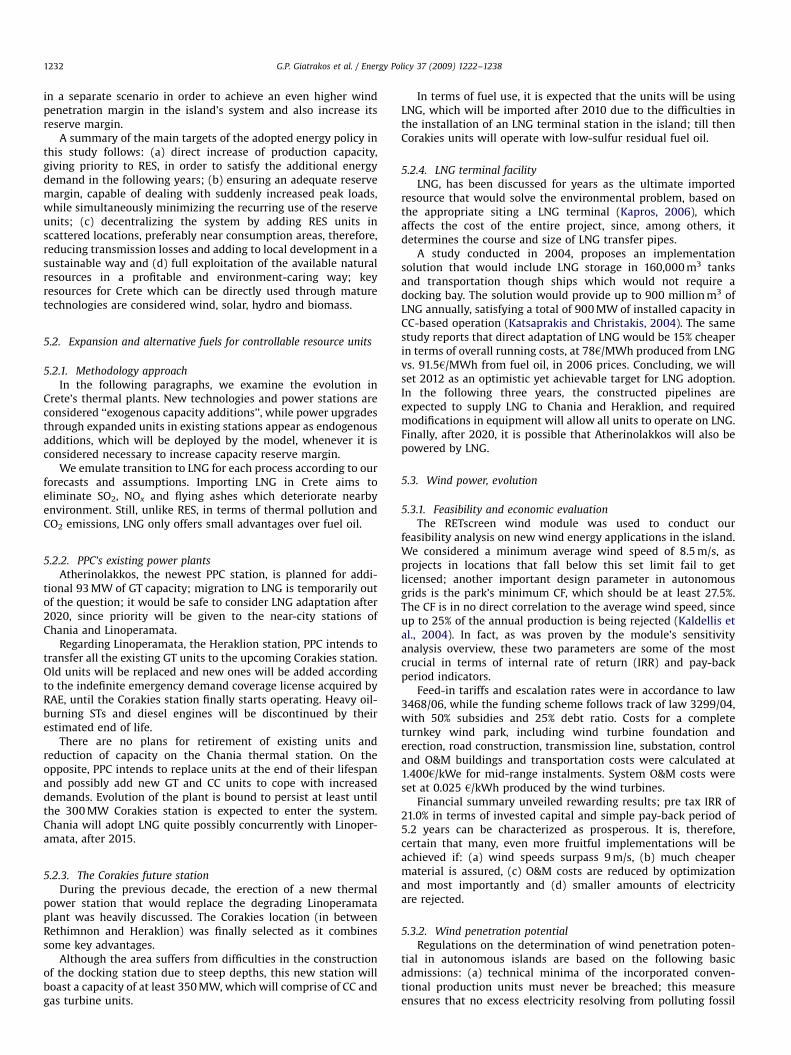
Fig. 6. Scenario relationship schematic.
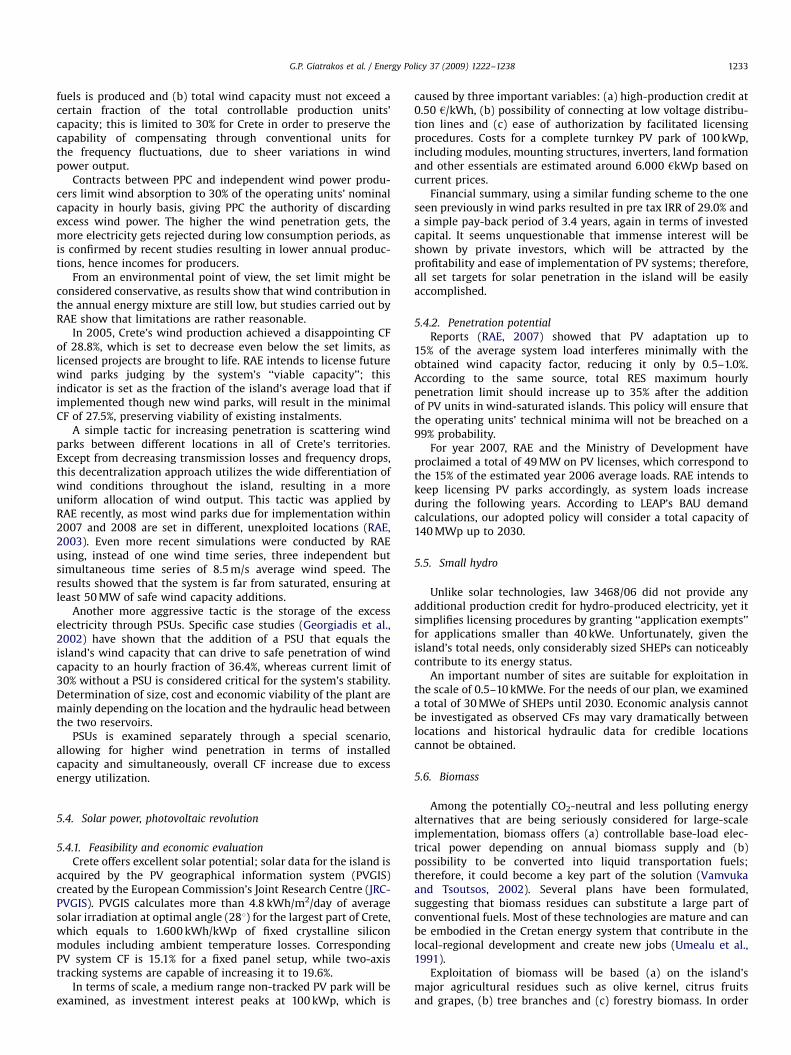
Fig. 7. Energy generation annual out
6. Modelling and implementation
6.1. Scenario formation on power generation
For reference purposes, we initially examined the RESimplementation policy using BAU load status, so we compareimplementation results with forecasts that use the current energymixture.
The ‘‘RES’’ scenario applies all RES and LNG penetration plansin accordance with EU and National targets, as well as remotenetwork and national security regulations. Furthermore, the sameRES policy is enhanced by the addition of PSU hydroelectricity(‘‘PSU’’ scenario).
Finally, the RES and PSU scenarios are also examined inconjunction with extended DSM (‘‘EXT’’ scenario) load status; thisincorporates the most aggressive GHG mitigation course of actionthat this study has to offer. An overview of the described scenariostructure is seen in Fig. 6.
6.2. Power generation simulation
6.2.1. Endogenous and exogenous capacities
Exogenous capacity values reflect existing capacities as well asplanned capacity additions and retirements. New power plants,such as Corakies and new technologies, such as CC in theAtherinolakkos plant are set implicitly in a user-defined period.New controllable RES plants, such as biomass CHP, or low-contribution applications such as SHEPs, are also appliedexogenously, as their set capacity could not interfere with systemsafety limits.
Endogenous capacity values are calculated in order to maintaina minimum planning reserve margin. Existing thermal plant unitexpansions are set as endogenous potential, leaving the model tojudge for the launch period. RES unit additions also appear only asendogenously calculated capacity.
puts for the BAU + RES scenario.
ARTICLE IN PRESS
G.P. Giatrakos et al. / Energy Policy 37 (2009) 1222–1238 1235
6.2.2. Planning reserve margin and capacity credit
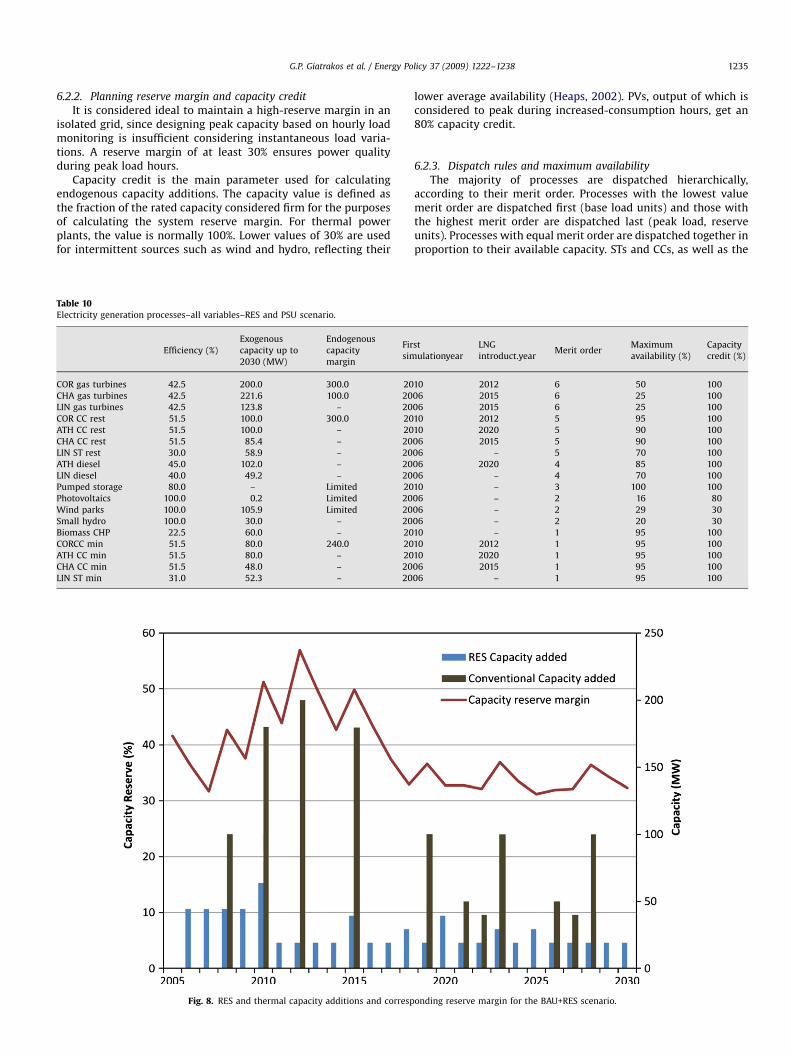
It is considered ideal to maintain a high-reserve margin in anisolated grid, since designing peak capacity based on hourly loadmonitoring is insufficient considering instantaneous load varia-tions. A reserve margin of at least 30% ensures power qualityduring peak load hours.
Capacity credit is the main parameter used for calculatingendogenous capacity additions. The capacity value is defined asthe fraction of the rated capacity considered firm for the purposesof calculating the system reserve margin. For thermal powerplants, the value is normally 100%. Lower values of 30% are usedfor intermittent sources such as wind and hydro, reflecting their
Table 10Electricity generation processes–all variables–RES and PSU scenario.
Efficiency (%)
Exogenous
capacity up to
2030 (MW)
Endogenous
capacity
margin
Fir
sim
COR gas turbines 42.5 200.0 300.0 20
CHA gas turbines 42.5 221.6 100.0 20
LIN gas turbines 42.5 123.8 – 20
COR CC rest 51.5 100.0 300.0 20
ATH CC rest 51.5 100.0 – 20
CHA CC rest 51.5 85.4 – 20
LIN ST rest 30.0 58.9 – 20
ATH diesel 45.0 102.0 – 20
LIN diesel 40.0 49.2 – 20
Pumped storage 80.0 – Limited 20
Photovoltaics 100.0 0.2 Limited 20
Wind parks 100.0 105.9 Limited 20
Small hydro 100.0 30.0 – 20
Biomass CHP 22.5 60.0 – 20
CORCC min 51.5 80.0 240.0 20
ATH CC min 51.5 80.0 – 20
CHA CC min 51.5 48.0 – 20
LIN ST min 31.0 52.3 – 20
Fig. 8. RES and thermal capacity additions and corresp
lower average availability (Heaps, 2002). PVs, output of which isconsidered to peak during increased-consumption hours, get an80% capacity credit.
6.2.3. Dispatch rules and maximum availability
The majority of processes are dispatched hierarchically,according to their merit order. Processes with the lowest valuemerit order are dispatched first (base load units) and those withthe highest merit order are dispatched last (peak load, reserveunits). Processes with equal merit order are dispatched together inproportion to their available capacity. STs and CCs, as well as the
st
ulationyear
LNG
introduct.yearMerit order
Maximum
availability (%)
Capacity
credit (%)
10 2012 6 50 100
06 2015 6 25 100
06 2015 6 25 100
10 2012 5 95 100
10 2020 5 90 100
06 2015 5 90 100
06 – 5 70 100
06 2020 4 85 100
06 – 4 70 100
10 – 3 100 100
06 – 2 16 80
06 – 2 29 30
06 – 2 20 30
10 – 1 95 100
10 2012 1 95 100
10 2020 1 95 100
06 2015 1 95 100
06 – 1 95 100
onding reserve margin for the BAU+RES scenario.
ARTICLE IN PRESS
G.P. Giatrakos et al. / Energy Policy 37 (2009) 1222–12381236
proposed biomass plant operate as base load units and, therefore,are granted merit order ‘‘1’’. Implicitly for these units, only theirtechnical minimums have priority over renewables. RES produc-tion is granted ‘‘2’’, while PSU hydro gets ‘‘3’’ as it operates onexcess renewable electricity. Diesel units, which offer lower
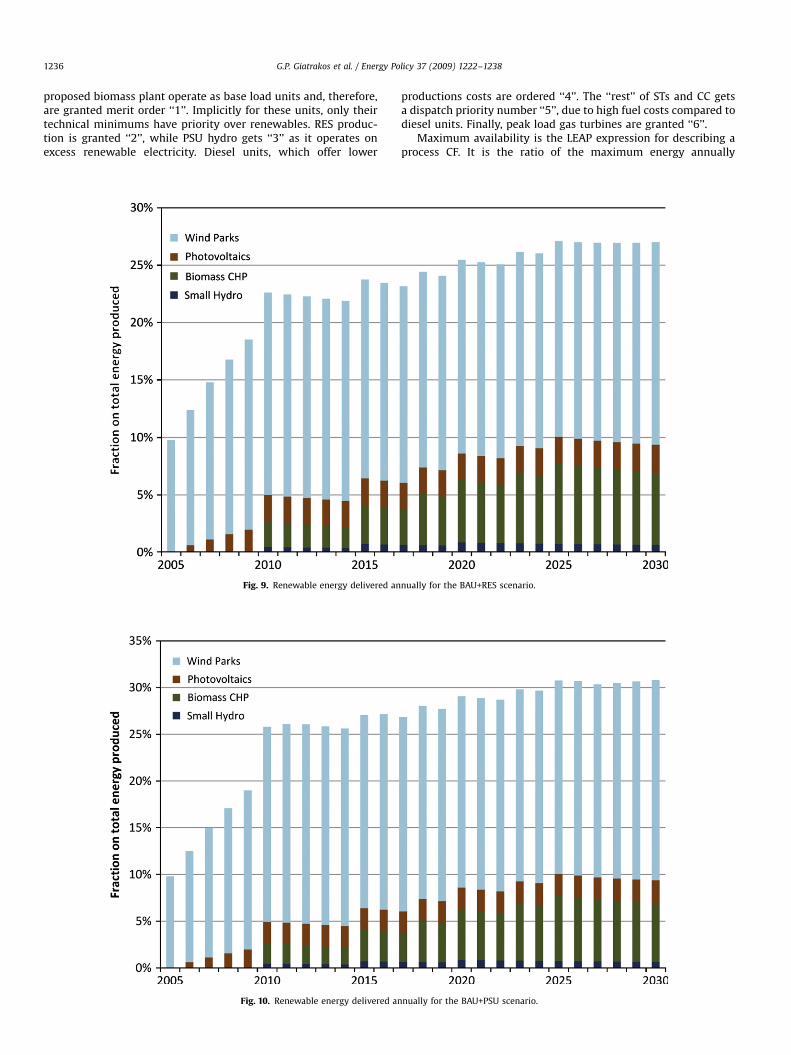
Fig. 9. Renewable energy delivered an
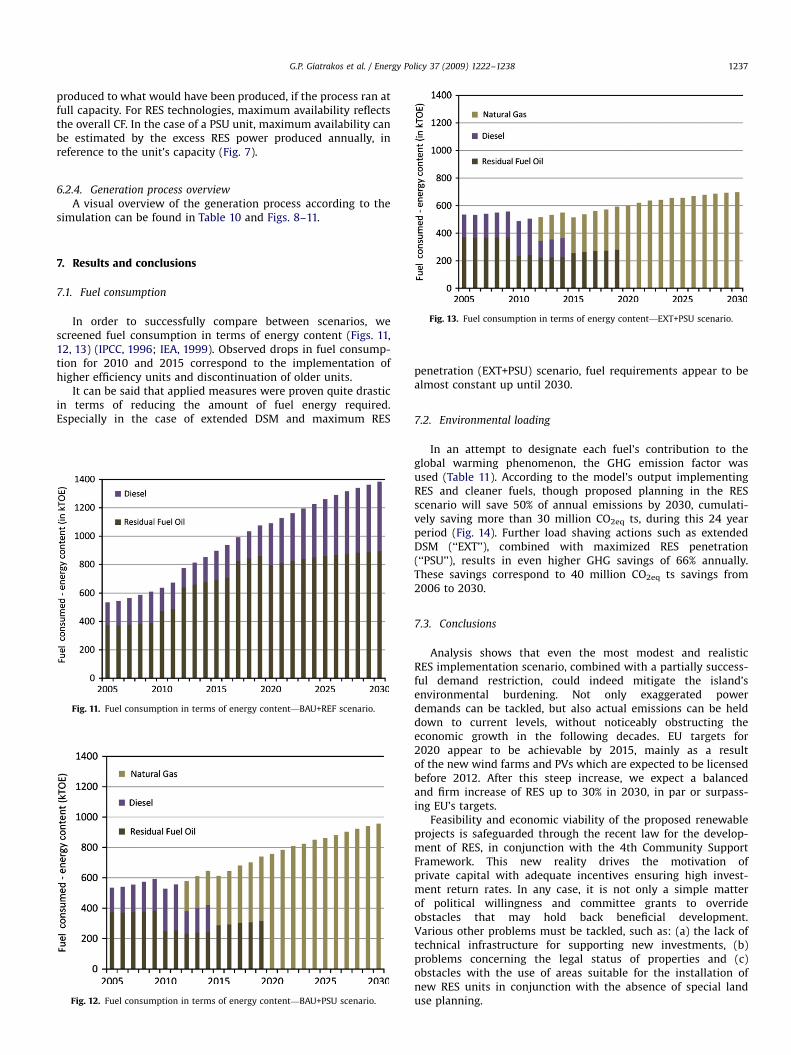
Fig. 10. Renewable energy delivered an
productions costs are ordered ‘‘4’’. The ‘‘rest’’ of STs and CC getsa dispatch priority number ‘‘5’’, due to high fuel costs compared todiesel units. Finally, peak load gas turbines are granted ‘‘6’’.
Maximum availability is the LEAP expression for describing aprocess CF. It is the ratio of the maximum energy annually
nually for the BAU+RES scenario.
nually for the BAU+PSU scenario.
ARTICLE IN PRESS
G.P. Giatrakos et al. / Energy Policy 37 (2009) 1222–1238 1237
produced to what would have been produced, if the process ran atfull capacity. For RES technologies, maximum availability reflectsthe overall CF. In the case of a PSU unit, maximum availability canbe estimated by the excess RES power produced annually, inreference to the unit’s capacity (Fig. 7).
6.2.4. Generation process overview
A visual overview of the generation process according to thesimulation can be found in Table 10 and Figs. 8–11.
Fig. 13. Fuel consumption in terms of energy content—EXT+PSU scenario.
7. Results and conclusions
7.1. Fuel consumption
In order to successfully compare between scenarios, wescreened fuel consumption in terms of energy content (Figs. 11,12, 13) (IPCC, 1996; IEA, 1999). Observed drops in fuel consump-tion for 2010 and 2015 correspond to the implementation ofhigher efficiency units and discontinuation of older units.
It can be said that applied measures were proven quite drasticin terms of reducing the amount of fuel energy required.Especially in the case of extended DSM and maximum RES
Fig. 11. Fuel consumption in terms of energy content—BAU+REF scenario.
Fig. 12. Fuel consumption in terms of energy content—BAU+PSU scenario.
penetration (EXT+PSU) scenario, fuel requirements appear to bealmost constant up until 2030.
7.2. Environmental loading
In an attempt to designate each fuel’s contribution to theglobal warming phenomenon, the GHG emission factor wasused (Table 11). According to the model’s output implementingRES and cleaner fuels, though proposed planning in the RESscenario will save 50% of annual emissions by 2030, cumulati-vely saving more than 30 million CO2eq ts, during this 24 yearperiod (Fig. 14). Further load shaving actions such as extendedDSM (‘‘EXT’’), combined with maximized RES penetration(‘‘PSU’’), results in even higher GHG savings of 66% annually.These savings correspond to 40 million CO2eq ts savings from2006 to 2030.
7.3. Conclusions
Analysis shows that even the most modest and realisticRES implementation scenario, combined with a partially success-ful demand restriction, could indeed mitigate the island’senvironmental burdening. Not only exaggerated powerdemands can be tackled, but also actual emissions can be helddown to current levels, without noticeably obstructing theeconomic growth in the following decades. EU targets for2020 appear to be achievable by 2015, mainly as a resultof the new wind farms and PVs which are expected to be licensedbefore 2012. After this steep increase, we expect a balancedand firm increase of RES up to 30% in 2030, in par or surpass-ing EU’s targets.
Feasibility and economic viability of the proposed renewableprojects is safeguarded through the recent law for the develop-ment of RES, in conjunction with the 4th Community SupportFramework. This new reality drives the motivation ofprivate capital with adequate incentives ensuring high invest-ment return rates. In any case, it is not only a simple matterof political willingness and committee grants to overrideobstacles that may hold back beneficial development.Various other problems must be tackled, such as: (a) the lack oftechnical infrastructure for supporting new investments, (b)problems concerning the legal status of properties and (c)obstacles with the use of areas suitable for the installation ofnew RES units in conjunction with the absence of special landuse planning.
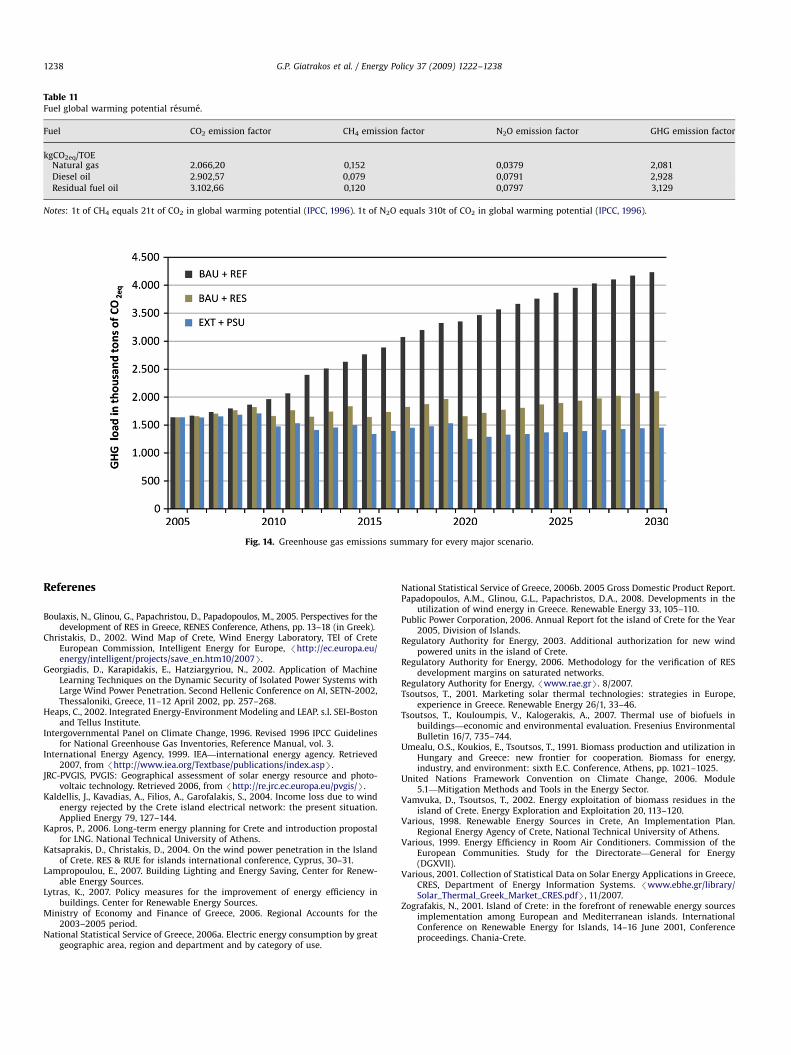
ARTICLE IN PRESS
Table 11Fuel global warming potential resume.
Fuel CO2 emission factor CH4 emission factor N2O emission factor GHG emission factor
kgCO2eq/TOENatural gas 2.066,20 0,152 0,0379 2,081
Diesel oil 2.902,57 0,079 0,0791 2,928
Residual fuel oil 3.102,66 0,120 0,0797 3,129
Notes: 1t of CH4 equals 21t of CO2 in global warming potential (IPCC, 1996). 1t of N2O equals 310t of CO2 in global warming potential (IPCC, 1996).
Fig. 14. Greenhouse gas emissions summary for every major scenario.
G.P. Giatrakos et al. / Energy Policy 37 (2009) 1222–12381238
Referenes
Boulaxis, N., Glinou, G., Papachristou, D., Papadopoulos, M., 2005. Perspectives for thedevelopment of RES in Greece, RENES Conference, Athens, pp. 13–18 (in Greek).
Christakis, D., 2002. Wind Map of Crete, Wind Energy Laboratory, TEI of CreteEuropean Commission, Intelligent Energy for Europe, /http://ec.europa.eu/energy/intelligent/projects/save_en.htm10/2007S.
Georgiadis, D., Karapidakis, E., Hatziargyriou, N., 2002. Application of MachineLearning Techniques on the Dynamic Security of Isolated Power Systems withLarge Wind Power Penetration. Second Hellenic Conference on AI, SETN-2002,Thessaloniki, Greece, 11–12 April 2002, pp. 257–268.
Heaps, C., 2002. Integrated Energy-Environment Modeling and LEAP. s.l. SEI-Bostonand Tellus Institute.
Intergovernmental Panel on Climate Change, 1996. Revised 1996 IPCC Guidelinesfor National Greenhouse Gas Inventories, Reference Manual, vol. 3.
International Energy Agency, 1999. IEA—international energy agency. Retrieved2007, from /http://www.iea.org/Textbase/publications/index.aspS.
JRC-PVGIS, PVGIS: Geographical assessment of solar energy resource and photo-voltaic technology. Retrieved 2006, from /http://re.jrc.ec.europa.eu/pvgis/S.
Kaldellis, J., Kavadias, A., Filios, A., Garofalakis, S., 2004. Income loss due to windenergy rejected by the Crete island electrical network: the present situation.Applied Energy 79, 127–144.
Kapros, P., 2006. Long-term energy planning for Crete and introduction propostalfor LNG. National Technical University of Athens.
Katsaprakis, D., Christakis, D., 2004. On the wind power penetration in the Islandof Crete. RES & RUE for islands international conference, Cyprus, 30–31.
Lampropoulou, E., 2007. Building Lighting and Energy Saving, Center for Renew-able Energy Sources.
Lytras, K., 2007. Policy measures for the improvement of energy efficiency inbuildings. Center for Renewable Energy Sources.
Ministry of Economy and Finance of Greece, 2006. Regional Accounts for the2003–2005 period.
National Statistical Service of Greece, 2006a. Electric energy consumption by greatgeographic area, region and department and by category of use.
National Statistical Service of Greece, 2006b. 2005 Gross Domestic Product Report.Papadopoulos, A.M., Glinou, G.L., Papachristos, D.A., 2008. Developments in the
utilization of wind energy in Greece. Renewable Energy 33, 105–110.Public Power Corporation, 2006. Annual Report fot the island of Crete for the Year
2005, Division of Islands.Regulatory Authority for Energy, 2003. Additional authorization for new wind
powered units in the island of Crete.Regulatory Authority for Energy, 2006. Methodology for the verification of RES
development margins on saturated networks.Regulatory Authority for Energy, /www.rae.grS. 8/2007.Tsoutsos, T., 2001. Marketing solar thermal technologies: strategies in Europe,
experience in Greece. Renewable Energy 26/1, 33–46.Tsoutsos, T., Kouloumpis, V., Kalogerakis, A., 2007. Thermal use of biofuels in
buildings—economic and environmental evaluation. Fresenius EnvironmentalBulletin 16/7, 735–744.
Umealu, O.S., Koukios, E., Tsoutsos, T., 1991. Biomass production and utilization inHungary and Greece: new frontier for cooperation. Biomass for energy,industry, and environment: sixth E.C. Conference, Athens, pp. 1021–1025.
United Nations Framework Convention on Climate Change, 2006. Module5.1—Mitigation Methods and Tools in the Energy Sector.
Vamvuka, D., Tsoutsos, T., 2002. Energy exploitation of biomass residues in theisland of Crete. Energy Exploration and Exploitation 20, 113–120.
Various, 1998. Renewable Energy Sources in Crete, An Implementation Plan.Regional Energy Agency of Crete, National Technical University of Athens.
Various, 1999. Energy Efficiency in Room Air Conditioners. Commission of theEuropean Communities. Study for the Directorate—General for Energy(DGXVII).
Various, 2001. Collection of Statistical Data on Solar Energy Applications in Greece,CRES, Department of Energy Information Systems. /www.ebhe.gr/library/Solar_Thermal_Greek_Market_CRES.pdfS, 11/2007.
Zografakis, N., 2001. Island of Crete: in the forefront of renewable energy sourcesimplementation among European and Mediterranean islands. InternationalConference on Renewable Energy for Islands, 14–16 June 2001, Conferenceproceedings. Chania-Crete.