SUSTAINABLE PACKAGING & BRAND IDENTITY › wp-co… · SUSTAINABLE PACKAGING & BRAND IDENTITY...
24
QP | 1 SUSTAINABLE PACKAGING & BRAND IDENTITY Understanding How Sustainable Messaging Influences Consumer Decisions
Transcript of SUSTAINABLE PACKAGING & BRAND IDENTITY › wp-co… · SUSTAINABLE PACKAGING & BRAND IDENTITY...
QP | 1
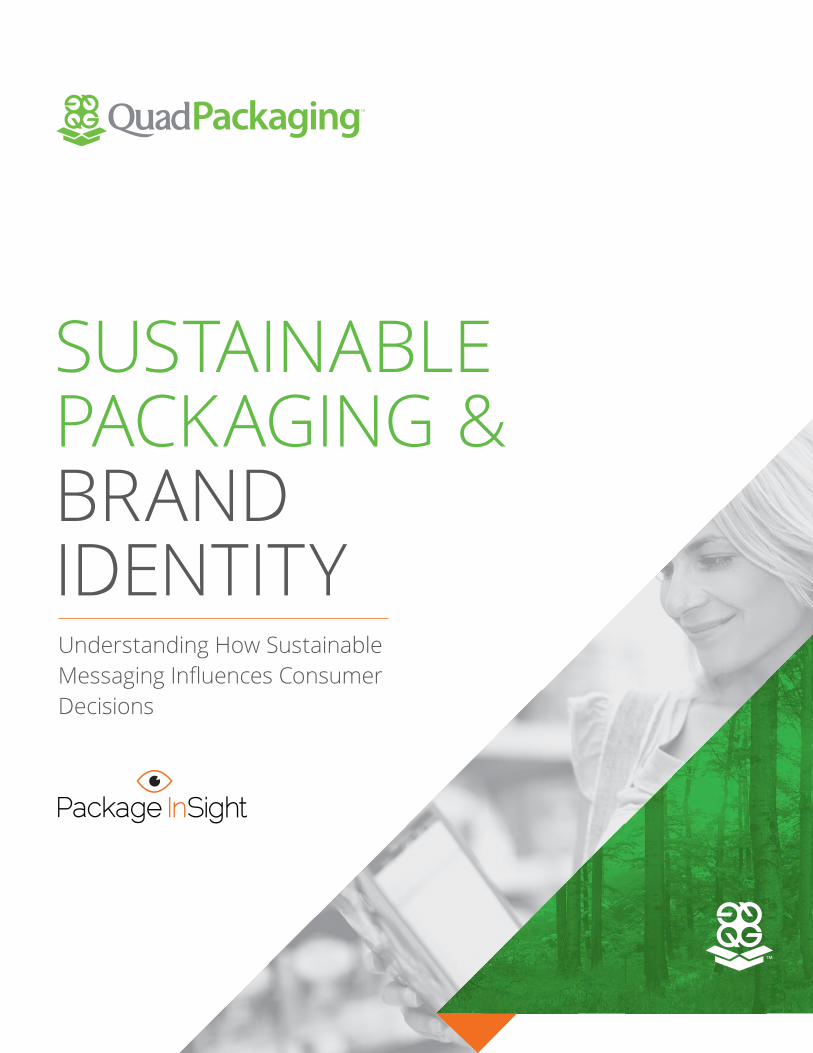
SUSTAINABLEPACKAGING &BRAND IDENTITYUnderstanding How SustainableMessaging Infl uences ConsumerDecisions
QUADPACKAGING | SPC IMPACT 2018
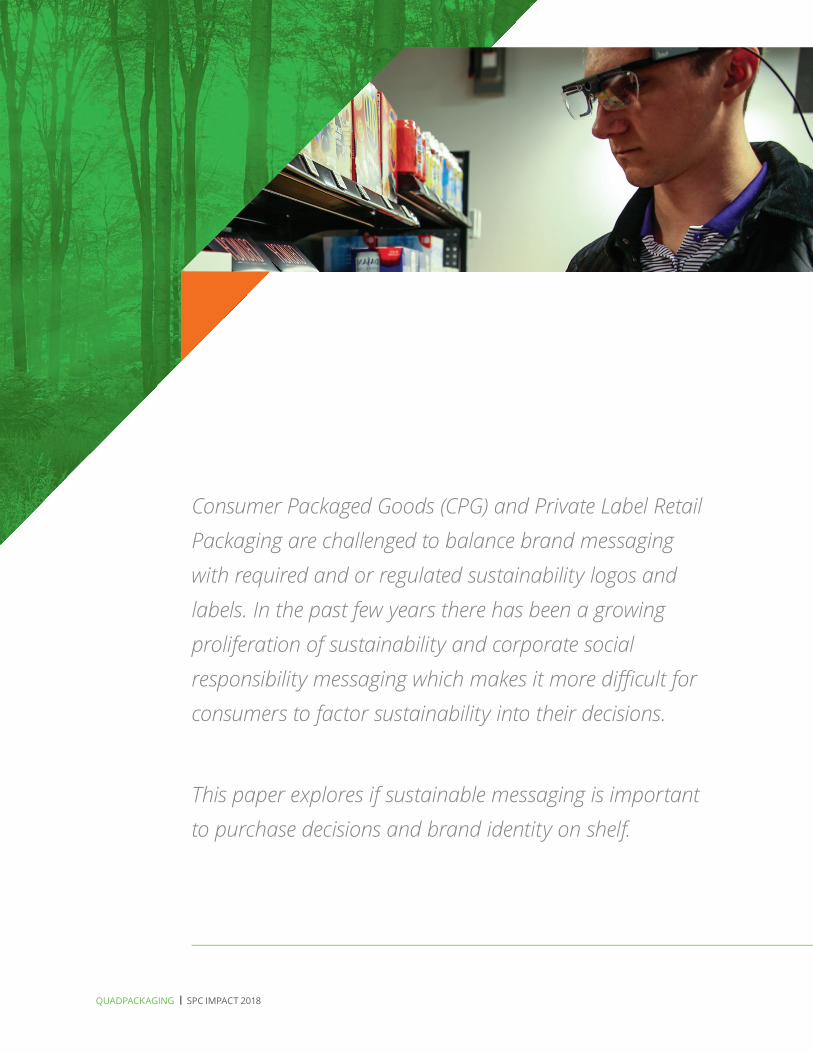
Consumer Packaged Goods (CPG) and Private Label Retail Packaging are challenged to balance brand messaging with required and or regulated sustainability logos and labels. In the past few years there has been a growing proliferation of sustainability and corporate social responsibility messaging which makes it more diffi cult for consumers to factor sustainability into their decisions.
This paper explores if sustainable messaging is important to purchase decisions and brand identity on shelf.
QP | 3
THE QUESTION . . . . . . . . . . . . . . . . . . . . . . . . . . . . . . . . . . . . . . . . . . . . . . . . . 2
BACKGROUND . . . . . . . . . . . . . . . . . . . . . . . . . . . . . . . . . . . . . . . . . . . . . . . . . . 3
OUR METHOD . . . . . . . . . . . . . . . . . . . . . . . . . . . . . . . . . . . . . . . . . . . . . 4
SUSTAINABILITY RATING LOGO 5
STATISTICAL RELEVANCE 5
PACKAGE DESIGN 6
EYE-TRACKING TECHNOLOGY 7
VARIABLES TESTED . . . . . . . . . . . . . . . . . . . . . . . . . . . . . . . . . . . . . . . . 8
EXECUTION SEQUENCE 9
DEMOGRAPHICS . . . . . . . . . . . . . . . . . . . . . . . . . . . . . . . . . . . . . . . . . . . . . . . 10
FINDINGS . . . . . . . . . . . . . . . . . . . . . . . . . . . . . . . . . . . . . . . . . . . . . . . . . . . . . 12
TIME TO FIRST FIXATION: LOGO VS. NO LOGO SKUS 14
TOTAL FIXATION DURATION: LOGO VS. NO LOGO SKUS 15
FIXATION COUNT: LOGO VS. NO LOGO SKUS 16
RATING SYSTEM 17
RECOMMENDATION. . . . . . . . . . . . . . . . . . . . . . . . . . . . . . . . . . . . . . . . . . . . 18
FOUR QUESTIONS. . . . . . . . . . . . . . . . . . . . . . . . . . . . . . . . . . . . . . . . . . . . . . 19
Contents
QUADPACKAGING | SPC IMPACT 2018
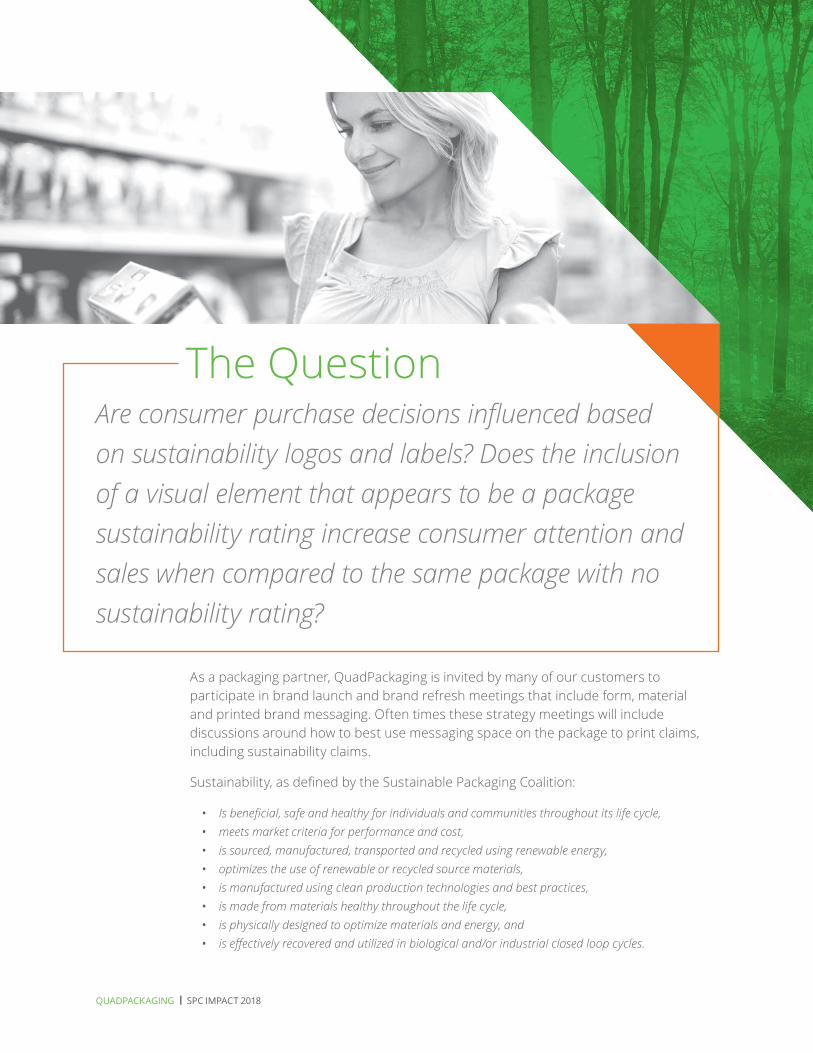
As a packaging partner, QuadPackaging is invited by many of our customers to participate in brand launch and brand refresh meetings that include form, material and printed brand messaging. Often times these strategy meetings will include discussions around how to best use messaging space on the package to print claims, including sustainability claims.
Sustainability, as defi ned by the Sustainable Packaging Coalition:
• Is benefi cial, safe and healthy for individuals and communities throughout its life cycle, • meets market criteria for performance and cost, • is sourced, manufactured, transported and recycled using renewable energy, • optimizes the use of renewable or recycled source materials, • is manufactured using clean production technologies and best practices, • is made from materials healthy throughout the life cycle, • is physically designed to optimize materials and energy, and • is eff ectively recovered and utilized in biological and/or industrial closed loop cycles.
The QuestionAre consumer purchase decisions infl uenced based on sustainability logos and labels? Does the inclusion of a visual element that appears to be a package sustainability rating increase consumer attention and sales when compared to the same package with no sustainability rating?
QP | 5
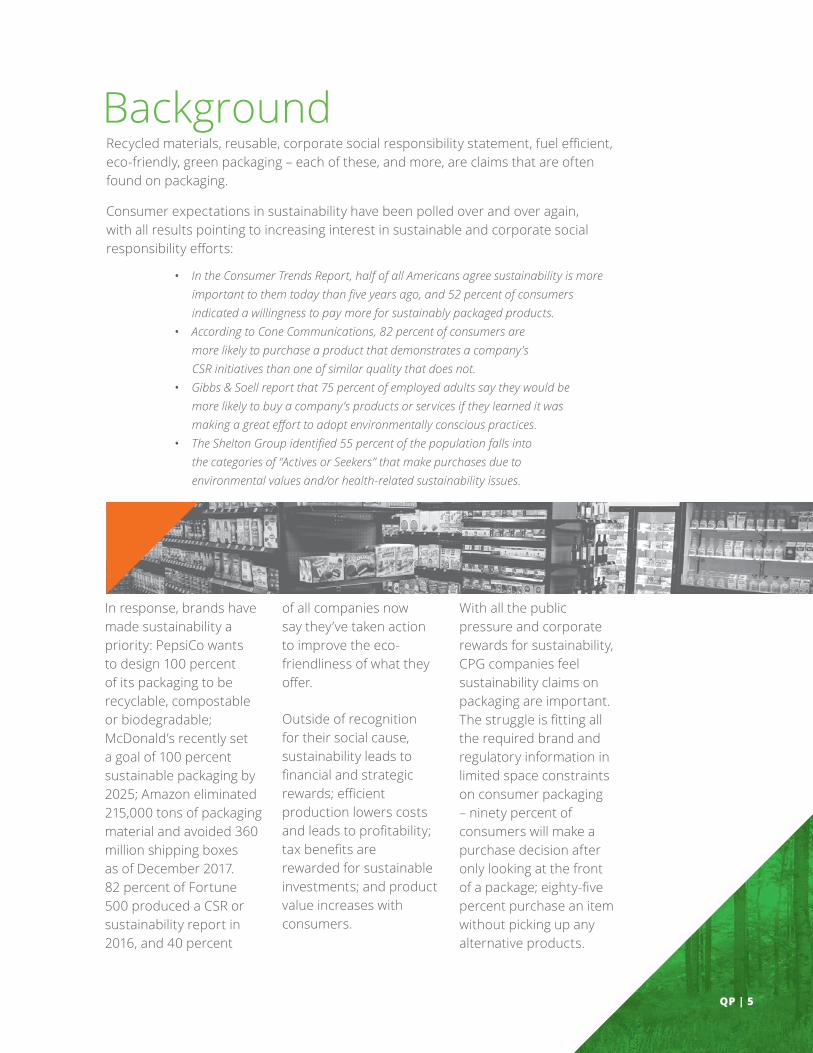
BackgroundRecycled materials, reusable, corporate social responsibility statement, fuel effi cient, eco-friendly, green packaging – each of these, and more, are claims that are often found on packaging.
Consumer expectations in sustainability have been polled over and over again, with all results pointing to increasing interest in sustainable and corporate social responsibility eff orts:
In response, brands have made sustainability a priority: PepsiCo wants to design 100 percent of its packaging to be recyclable, compostable or biodegradable; McDonald’s recently set a goal of 100 percent sustainable packaging by 2025; Amazon eliminated 215,000 tons of packaging material and avoided 360 million shipping boxes as of December 2017. 82 percent of Fortune 500 produced a CSR or sustainability report in 2016, and 40 percent
of all companies now say they’ve taken action to improve the eco-friendliness of what they off er.
Outside of recognition for their social cause, sustainability leads to fi nancial and strategic rewards; effi cient production lowers costs and leads to profi tability; tax benefi ts are rewarded for sustainable investments; and product value increases with consumers.
With all the public pressure and corporate rewards for sustainability, CPG companies feel sustainability claims on packaging are important. The struggle is fi tting all the required brand and regulatory information in limited space constraints on consumer packaging – ninety percent of consumers will make a purchase decision after only looking at the front of a package; eighty-fi ve percent purchase an item without picking up any alternative products.
• In the Consumer Trends Report, half of all Americans agree sustainability is more important to them today than fi ve years ago, and 52 percent of consumers indicated a willingness to pay more for sustainably packaged products.
• According to Cone Communications, 82 percent of consumers are more likely to purchase a product that demonstrates a company’s CSR initiatives than one of similar quality that does not.
• Gibbs & Soell report that 75 percent of employed adults say they would be more likely to buy a company’s products or services if they learned it was making a great eff ort to adopt environmentally conscious practices.
• The Shelton Group identifi ed 55 percent of the population falls into the categories of “Actives or Seekers” that make purchases due to environmental values and/or health-related sustainability issues.
QUADPACKAGING | SPC IMPACT 2018
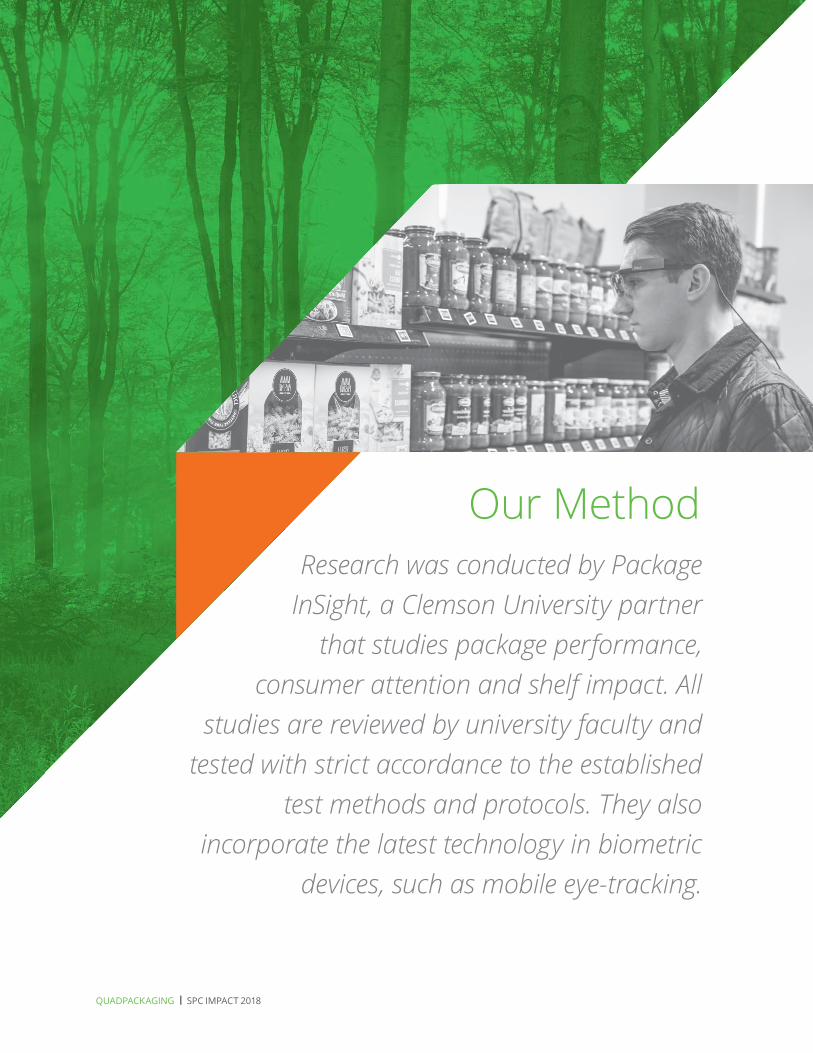
Research was conducted by Package InSight, a Clemson University partner
that studies package performance, consumer attention and shelf impact. All
studies are reviewed by university faculty and tested with strict accordance to the established
test methods and protocols. They also incorporate the latest technology in biometric
devices, such as mobile eye-tracking.
Our Method
QP | 7
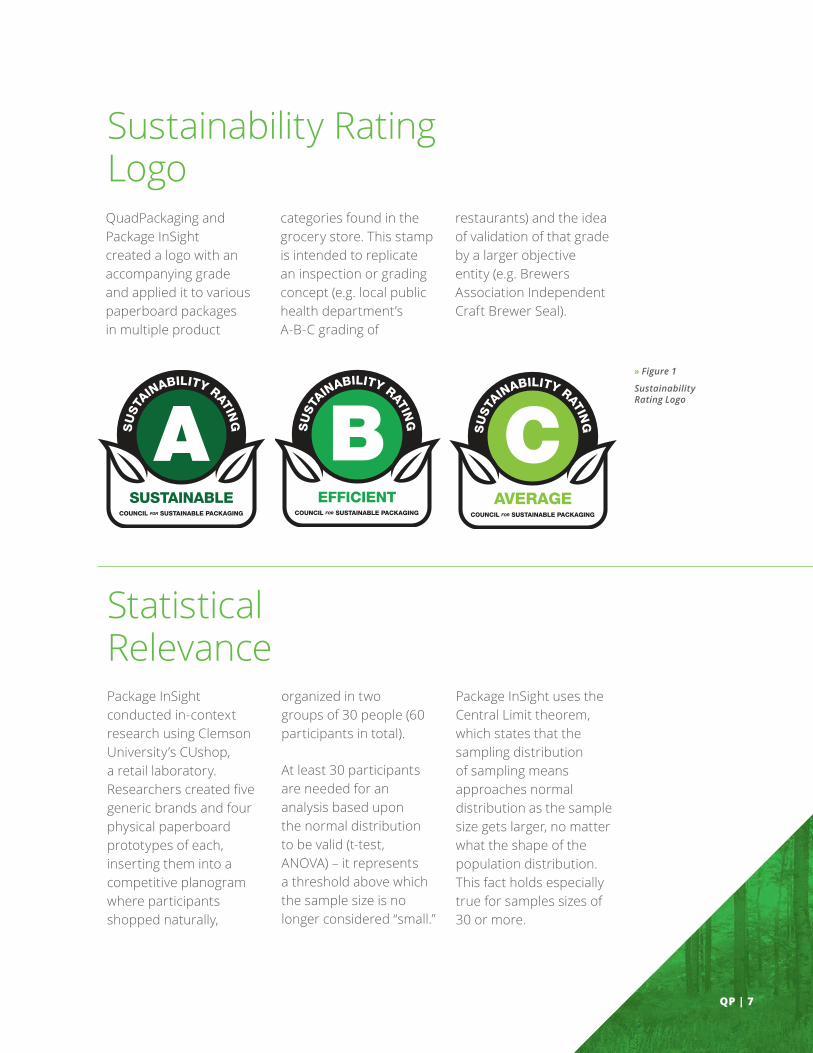
QuadPackaging and Package InSight created a logo with an accompanying grade and applied it to various paperboard packages in multiple product
categories found in the grocery store. This stamp is intended to replicate an inspection or grading concept (e.g. local public health department’s A-B-C grading of
restaurants) and the idea of validation of that grade by a larger objective entity (e.g. Brewers Association Independent Craft Brewer Seal).
» Figure 1
Sustainability Rating Logo
Sustainability Rating Logo
Statistical RelevancePackage InSight conducted in-context research using Clemson University’s CUshop, a retail laboratory. Researchers created fi ve generic brands and four physical paperboard prototypes of each, inserting them into a competitive planogram where participants shopped naturally,
organized in two groups of 30 people (60 participants in total).
At least 30 participants are needed for an analysis based upon the normal distribution to be valid (t-test, ANOVA) – it represents a threshold above which the sample size is no longer considered “small.”
Package InSight uses the Central Limit theorem, which states that the sampling distribution of sampling means approaches normal distribution as the sample size gets larger, no matter what the shape of the population distribution. This fact holds especially true for samples sizes of 30 or more.
QUADPACKAGING | SPC IMPACT 2018
Package Design
Project Set-Up
1 2 3 4 5
Frozen Food Pasta Beverage Snack Medical
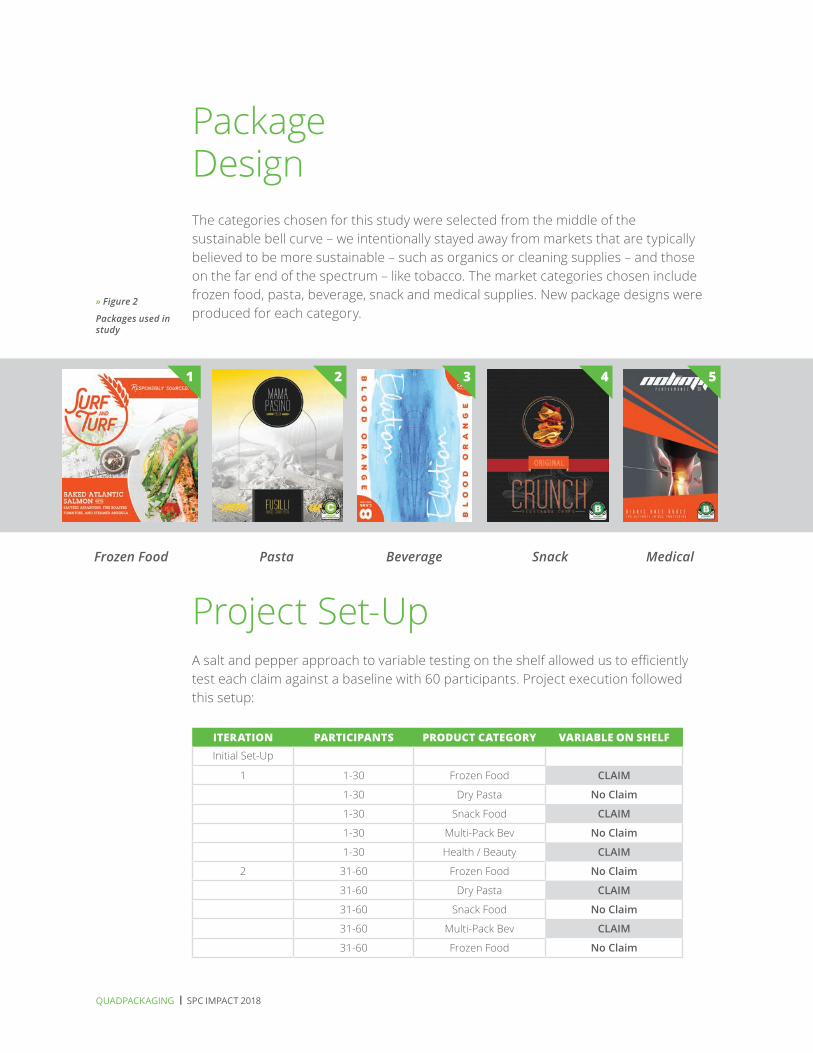
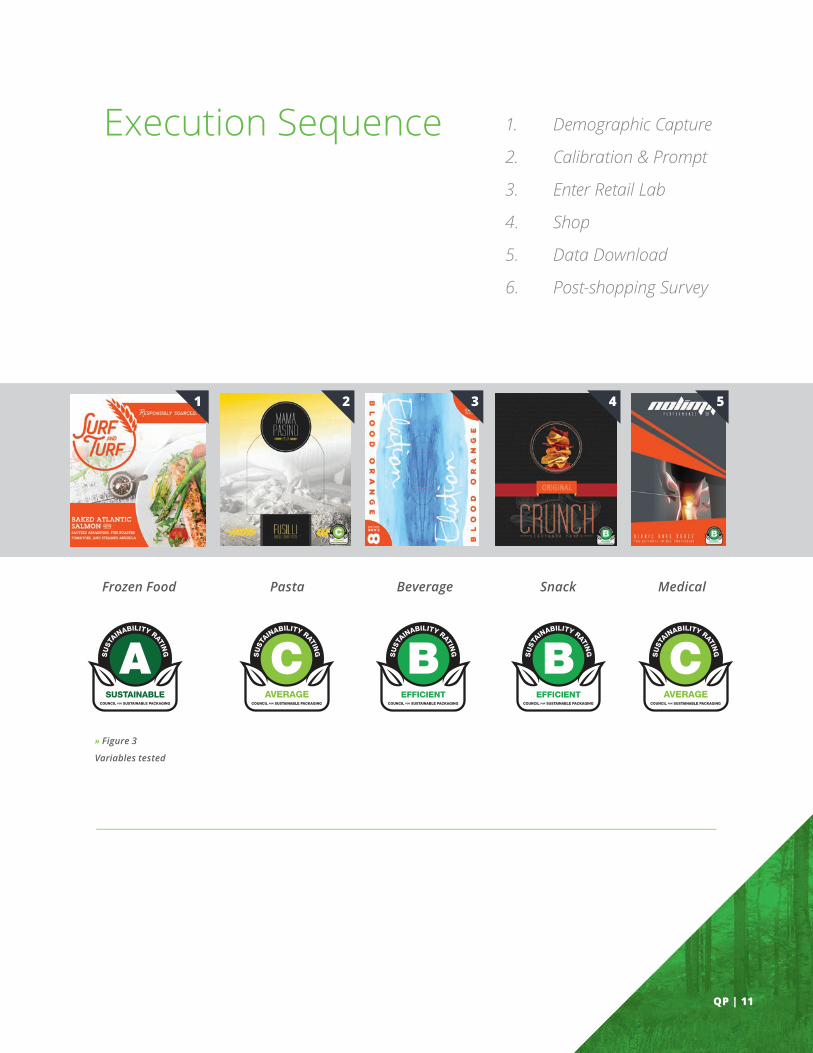
The categories chosen for this study were selected from the middle of the sustainable bell curve – we intentionally stayed away from markets that are typically believed to be more sustainable – such as organics or cleaning supplies – and those on the far end of the spectrum – like tobacco. The market categories chosen include frozen food, pasta, beverage, snack and medical supplies. New package designs were produced for each category.
A salt and pepper approach to variable testing on the shelf allowed us to effi ciently test each claim against a baseline with 60 participants. Project execution followed this setup:
ITERATION PARTICIPANTS PRODUCT CATEGORY VARIABLE ON SHELFInitial Set-Up
1 1-30 Frozen Food CLAIM
1-30 Dry Pasta No Claim
1-30 Snack Food CLAIM
1-30 Multi-Pack Bev No Claim
1-30 Health / Beauty CLAIM
2 31-60 Frozen Food No Claim
31-60 Dry Pasta CLAIM
31-60 Snack Food No Claim
31-60 Multi-Pack Bev CLAIM
31-60 Frozen Food No Claim
» Figure 2
Packages used in study
QP | 9
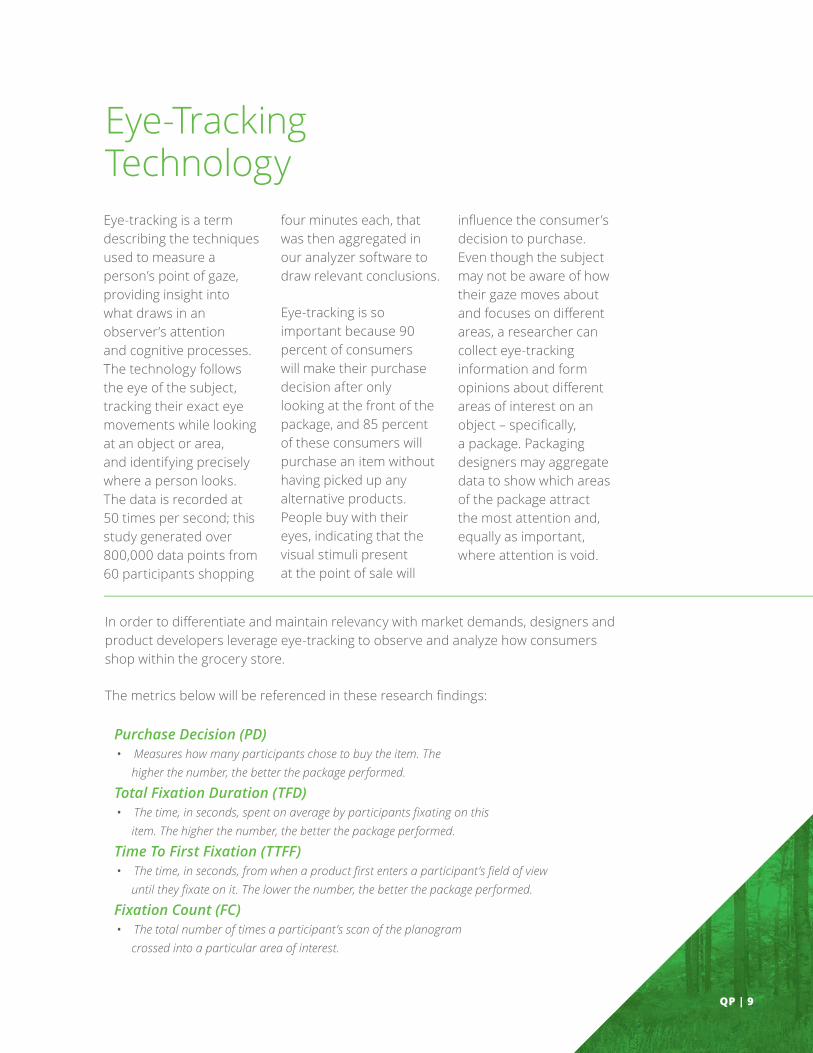
In order to diff erentiate and maintain relevancy with market demands, designers and product developers leverage eye-tracking to observe and analyze how consumers shop within the grocery store.
The metrics below will be referenced in these research fi ndings:
Purchase Decision (PD)• Measures how many participants chose to buy the item. The
higher the number, the better the package performed.
Total Fixation Duration (TFD)• The time, in seconds, spent on average by participants fi xating on this
item. The higher the number, the better the package performed.
Time To First Fixation (TTFF)• The time, in seconds, from when a product fi rst enters a participant’s fi eld of view
until they fi xate on it. The lower the number, the better the package performed.
Fixation Count (FC)• The total number of times a participant’s scan of the planogram
crossed into a particular area of interest.
Eye-Tracking TechnologyEye-tracking is a term describing the techniques used to measure a person’s point of gaze, providing insight into what draws in an observer’s attention and cognitive processes. The technology follows the eye of the subject, tracking their exact eye movements while looking at an object or area, and identifying precisely where a person looks. The data is recorded at 50 times per second; this study generated over 800,000 data points from 60 participants shopping
four minutes each, that was then aggregated in our analyzer software to draw relevant conclusions.
Eye-tracking is so important because 90 percent of consumers will make their purchase decision after only looking at the front of the package, and 85 percent of these consumers will purchase an item without having picked up any alternative products. People buy with their eyes, indicating that the visual stimuli present at the point of sale will
infl uence the consumer’s decision to purchase. Even though the subject may not be aware of how their gaze moves about and focuses on diff erent areas, a researcher can collect eye-tracking information and form opinions about diff erent areas of interest on an object – specifi cally, a package. Packaging designers may aggregate data to show which areas of the package attract the most attention and, equally as important, where attention is void.
QUADPACKAGING | SPC IMPACT 2018
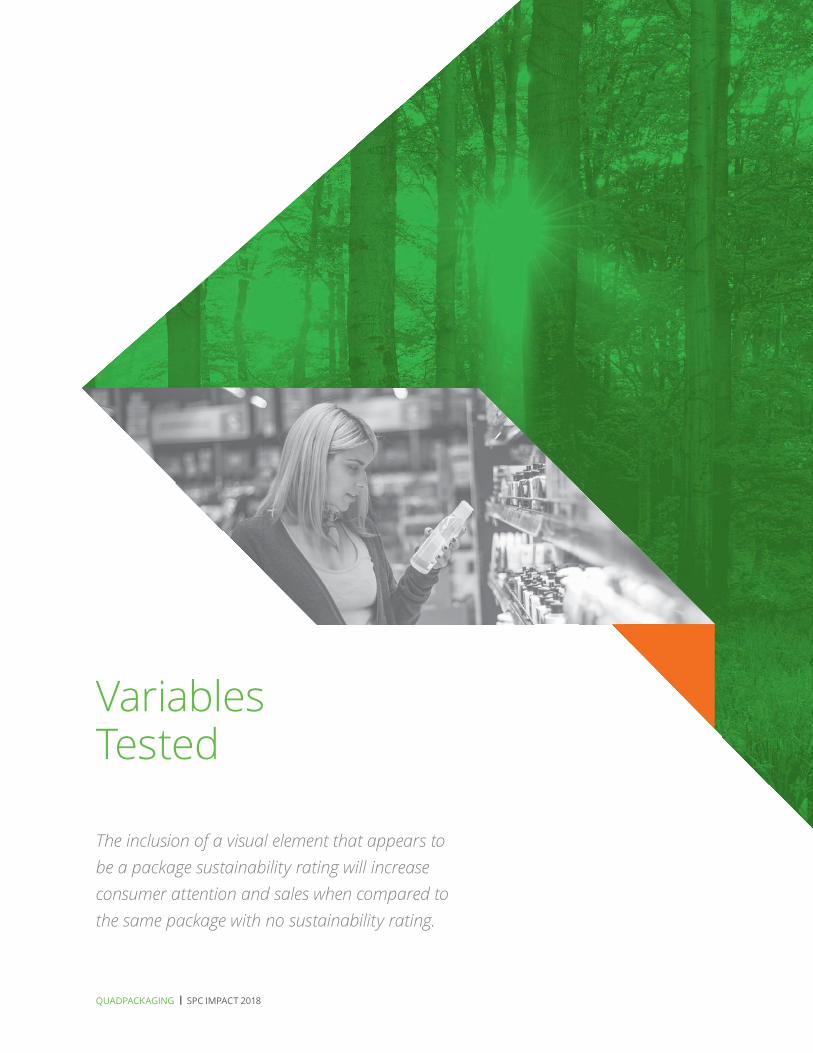
Variables Tested
The inclusion of a visual element that appears to be a package sustainability rating will increase consumer attention and sales when compared to the same package with no sustainability rating.
QP | 11
1. Demographic Capture
2. Calibration & Prompt
3. Enter Retail Lab
4. Shop
5. Data Download
6. Post-shopping Survey
1 2 3 4 5
Frozen Food Pasta Beverage Snack Medical
Execution Sequence
» Figure 3
Variables tested
QUADPACKAGING | SPC IMPACT 2018
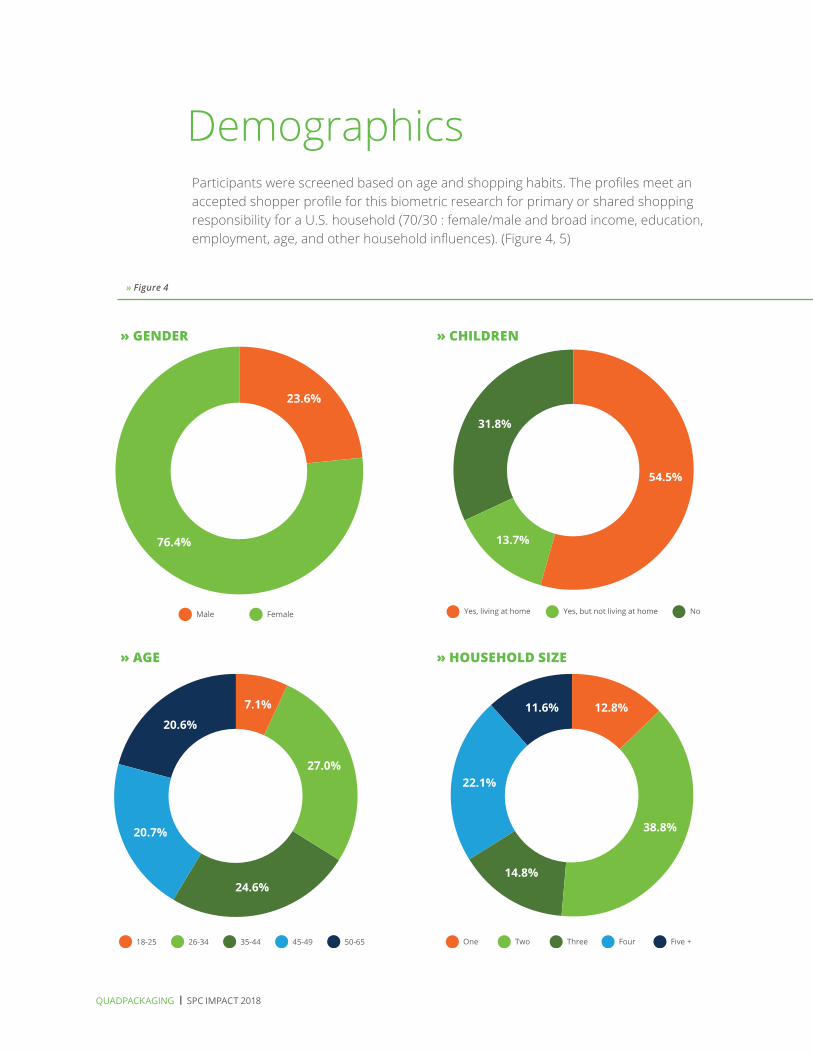
Demographics
» GENDER
Participants were screened based on age and shopping habits. The profiles meet an accepted shopper profile for this biometric research for primary or shared shopping responsibility for a U.S. household (70/30 : female/male and broad income, education, employment, age, and other household influences). (Figure 4, 5)
» Figure 4
FemaleMale
76.4%
23.6%
NoYes, but not living at homeYes, living at home
13.7%
31.8%
54.5%
50-6545-4935-4426-3418-25
24.6%
20.7%
20.6%
7.1%
27.0%
Five +FourThreeTwoOne
14.8%
22.1%
38.8%
11.6% 12.8%
» CHILDREN
» AGE » HOUSEHOLD SIZE
QP | 13
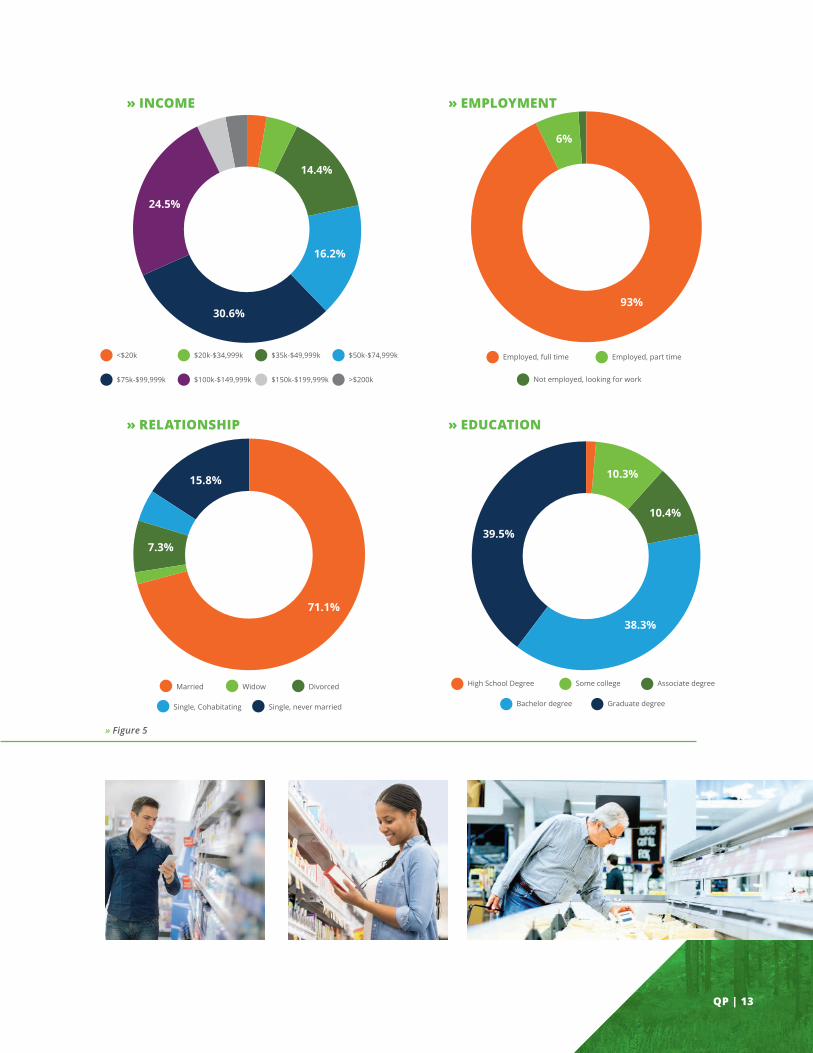
>$200k$150k-$199,999k$100k-$149,999k$75k-$99,999k
$50k-$74,999k$35k-$49,999k$20k-$34,999k<$20k
30.6%
24.5%
16.2%
14.4%
Not employed, looking for work
Employed, part timeEmployed, full time
93%
6%
Single, never marriedSingle, Cohabitating
DivorcedWidowMarried
7.3%
71.1%
15.8%
Graduate degreeBachelor degree
Associate degreeSome collegeHigh School Degree
39.5%
10.4%
38.3%
10.3%
» INCOME » EMPLOYMENT
» RELATIONSHIP » EDUCATION
» Figure 5
QUADPACKAGING | SPC IMPACT 2018
00
20
40
60
80
CLEANINGPRODUCTSBEVERAGEFOOD PKG HOUSEHOLD
PAPER GOODSBABY CAREPRODUCTSAPPARELPET PRODUCTSHEALTHCARE
PERC
ENTA
GE
(%)
73%
67%
40%
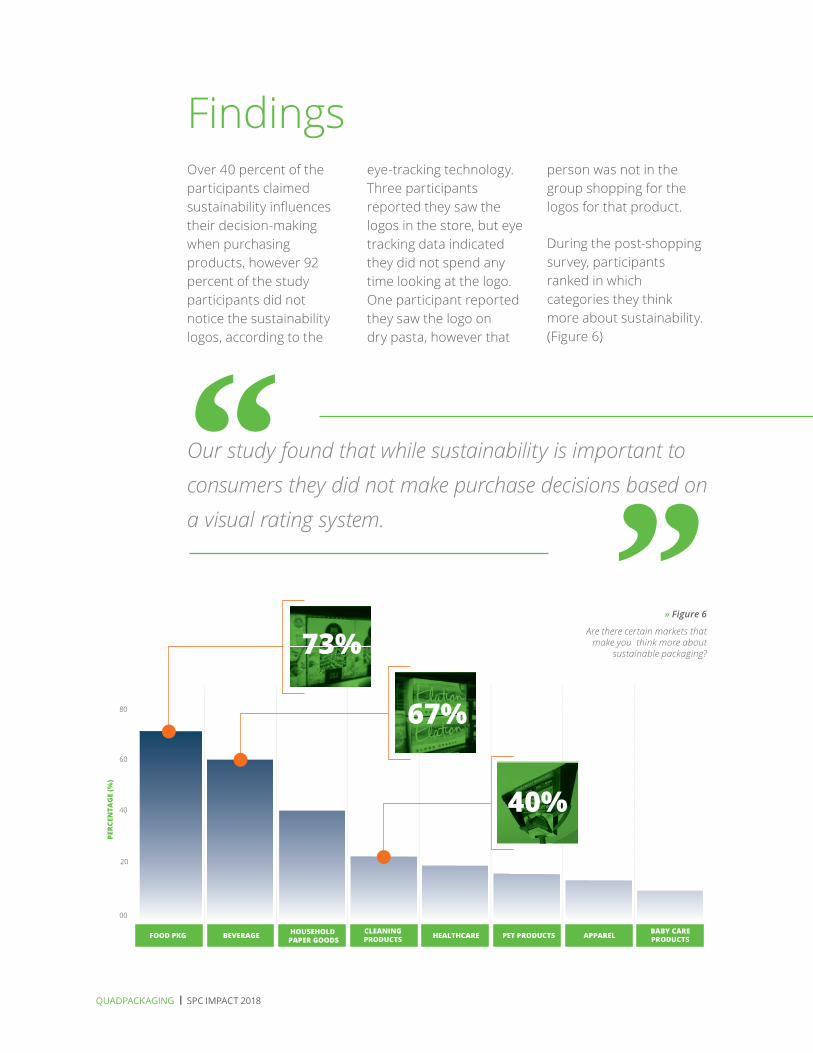
Over 40 percent of the participants claimed sustainability infl uences their decision-making when purchasing products, however 92 percent of the study participants did not notice the sustainability logos, according to the
eye-tracking technology. Three participants reported they saw the logos in the store, but eye tracking data indicated they did not spend any time looking at the logo. One participant reported they saw the logo on dry pasta, however that
person was not in the group shopping for the logos for that product.
During the post-shopping survey, participants ranked in which categories they think more about sustainability.(Figure 6)
Findings
» Figure 6
Are there certain markets that make you think more about
sustainable packaging?
Our study found that while sustainability is important to consumers they did not make purchase decisions based on a visual rating system.“ “
QP | 15
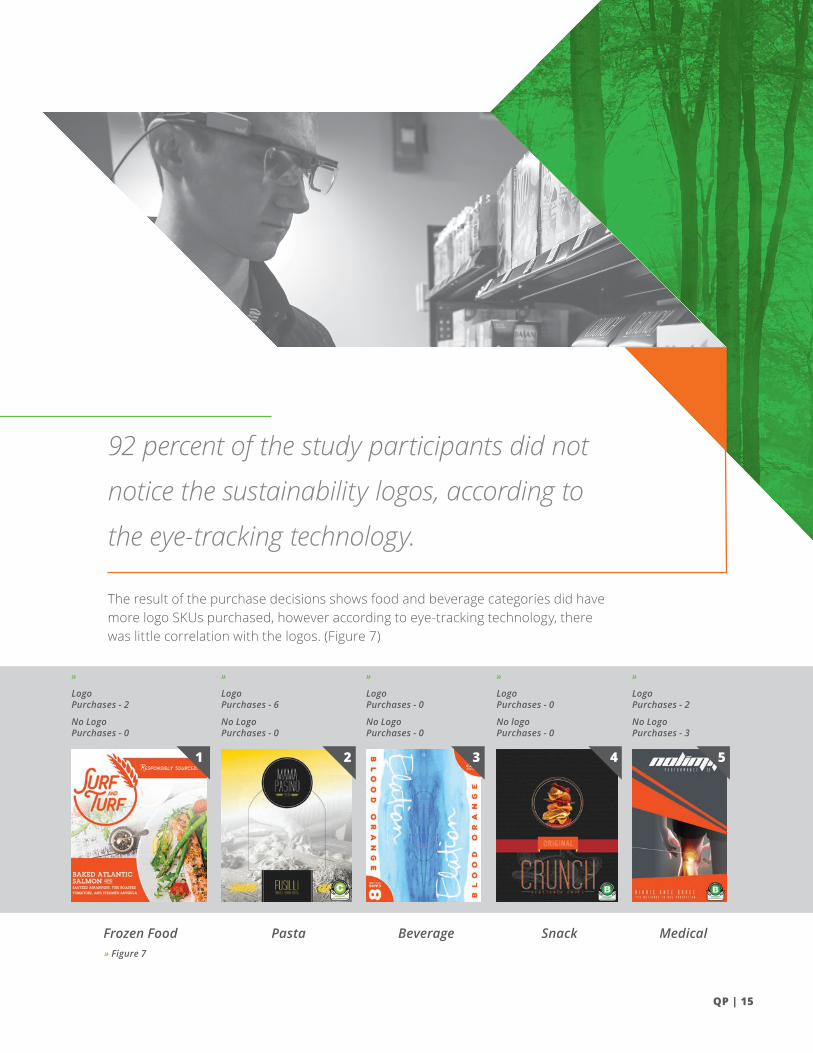
92 percent of the study participants did not
notice the sustainability logos, according to
the eye-tracking technology.
1 2 3 4 5
Frozen Food Pasta Beverage Snack Medical
The result of the purchase decisions shows food and beverage categories did have more logo SKUs purchased, however according to eye-tracking technology, there was little correlation with the logos. (Figure 7)
»
Logo Purchases - 2
No Logo Purchases - 0
»
Logo Purchases - 6
No Logo Purchases - 0
»
Logo Purchases - 0
No Logo Purchases - 0
»
Logo Purchases - 0
No logo Purchases - 0
»
Logo Purchases - 2
No Logo Purchases - 3
» Figure 7
QUADPACKAGING | SPC IMPACT 2018
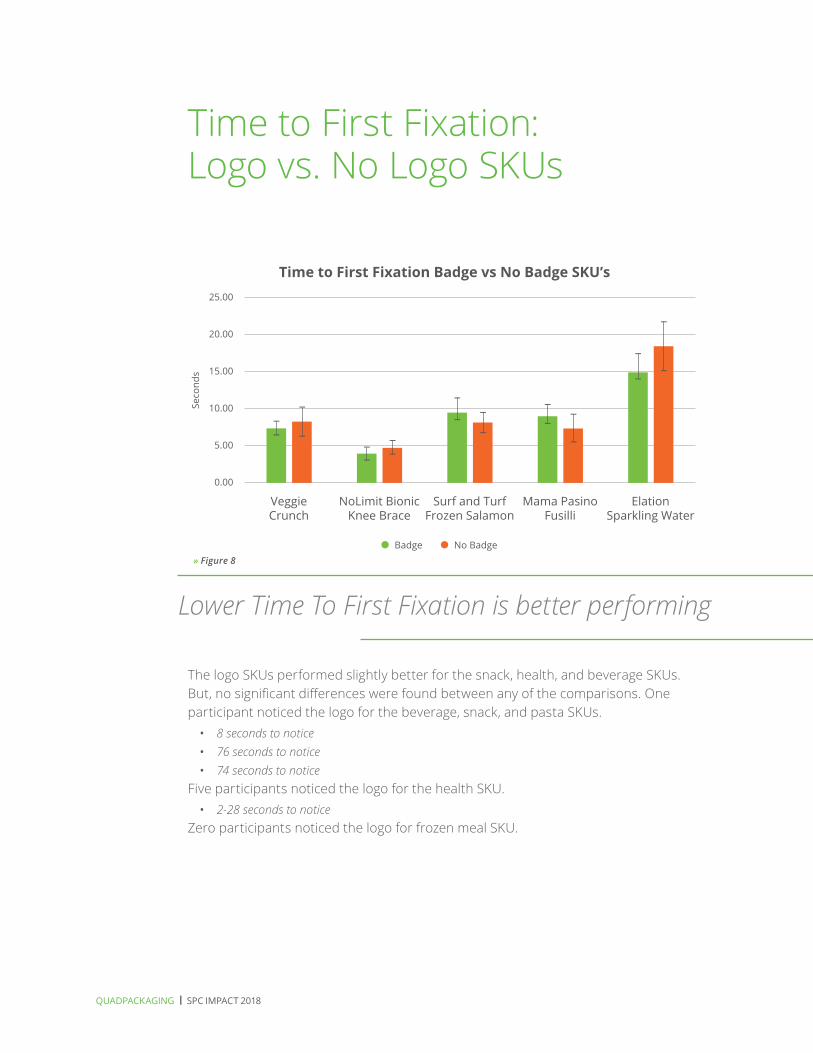
Time to First Fixation: Logo vs. No Logo SKUs
The logo SKUs performed slightly better for the snack, health, and beverage SKUs. But, no significant differences were found between any of the comparisons. One participant noticed the logo for the beverage, snack, and pasta SKUs.• 8 seconds to notice• 76 seconds to notice• 74 seconds to notice
Five participants noticed the logo for the health SKU.• 2-28 seconds to notice
Zero participants noticed the logo for frozen meal SKU.
Time to First Fixation Badge vs No Badge SKU’s25.00
20.00
15.00
10.00
5.00
0.00
Seco
nds
Badge
VeggieCrunch
NoLimit BionicKnee Brace
Surf and TurfFrozen Salamon
Mama PasinoFusilli
ElationSparkling Water
No Badge
Lower Time To First Fixation is better performing
» Figure 8
QP | 17
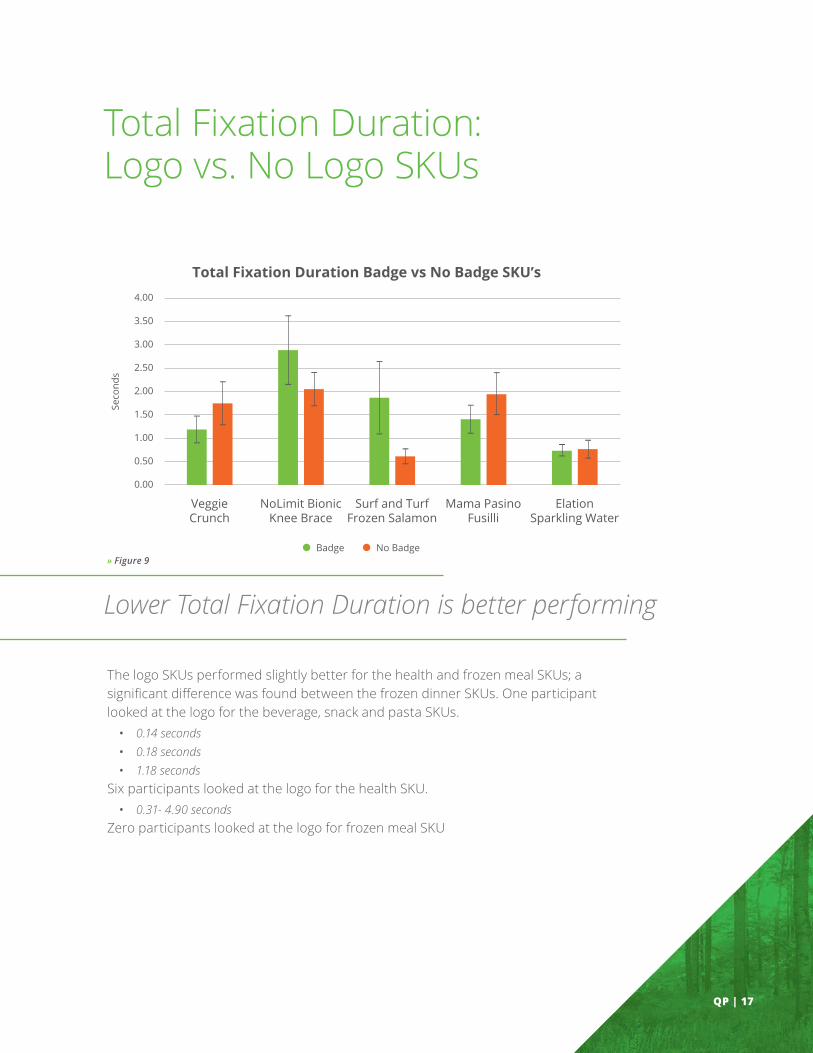
Total Fixation Duration: Logo vs. No Logo SKUs
Total Fixation Duration Badge vs No Badge SKU’s4.00
3.50
2.50
3.00
1.50
2.00
0.50
1.00
0.00
Seco
nds
Badge
VeggieCrunch
NoLimit BionicKnee Brace
Surf and TurfFrozen Salamon
Mama PasinoFusilli
ElationSparkling Water
No Badge
The logo SKUs performed slightly better for the health and frozen meal SKUs; a signifi cant diff erence was found between the frozen dinner SKUs. One participant looked at the logo for the beverage, snack and pasta SKUs.• 0.14 seconds• 0.18 seconds• 1.18 seconds
Six participants looked at the logo for the health SKU.• 0.31- 4.90 seconds
Zero participants looked at the logo for frozen meal SKU
Lower Total Fixation Duration is better performing
» Figure 9
QUADPACKAGING | SPC IMPACT 2018
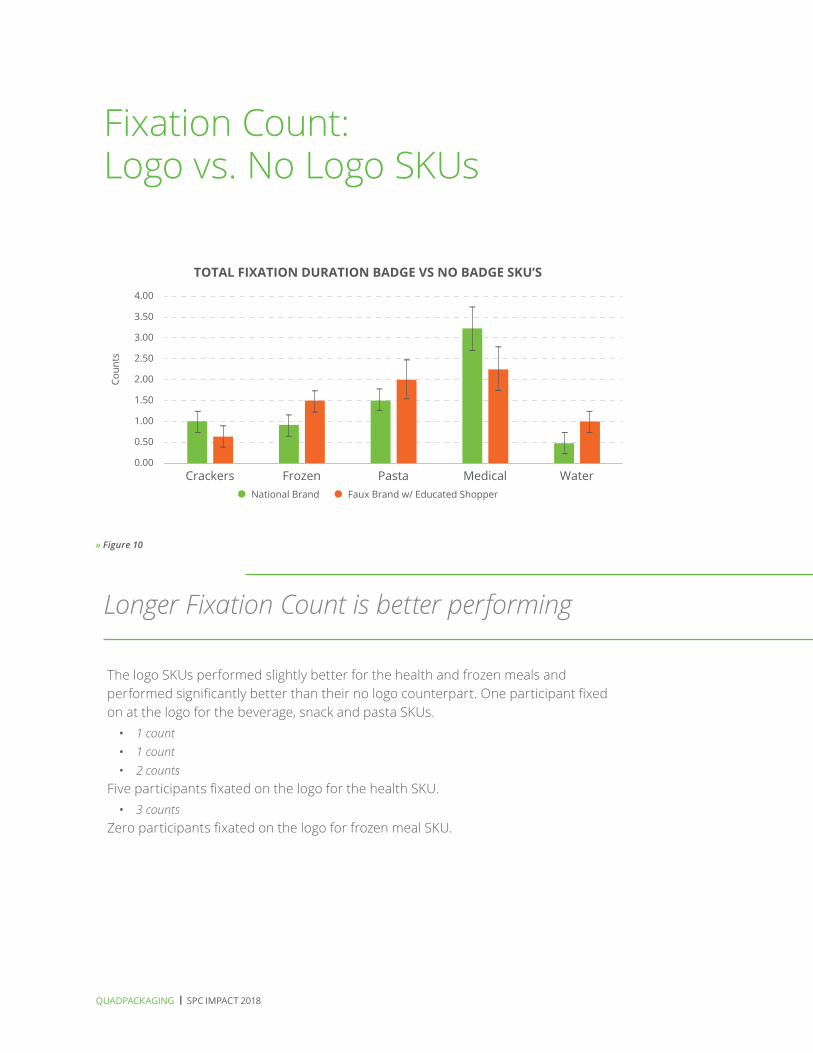
Fixation Count: Logo vs. No Logo SKUs
Crackers Frozen Pasta Medical WaterNational Brand Faux Brand w/ Educated Shopper
TOTAL FIXATION DURATION BADGE VS NO BADGE SKU’S
4.00
3.50
2.50
3.00
1.50
2.00
0.50
1.00
0.00
Coun
ts
The logo SKUs performed slightly better for the health and frozen meals and performed significantly better than their no logo counterpart. One participant fixed on at the logo for the beverage, snack and pasta SKUs.• 1 count• 1 count• 2 counts
Five participants fixated on the logo for the health SKU.• 3 counts
Zero participants fixated on the logo for frozen meal SKU.
Longer Fixation Count is better performing
» Figure 10
QP | 19
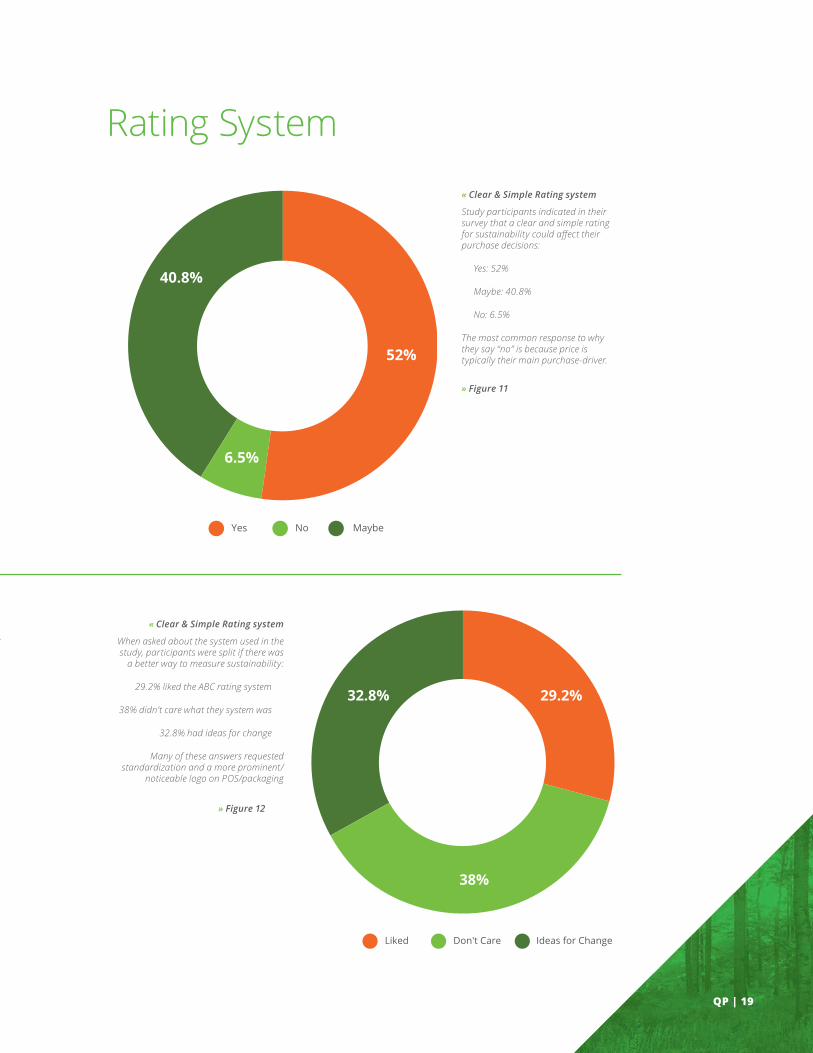
Rating System
« Clear & Simple Rating system
Study participants indicated in their survey that a clear and simple rating for sustainability could aff ect their purchase decisions:
Yes: 52%
Maybe: 40.8%
No: 6.5%
The most common response to why they say “no” is because price is typically their main purchase-driver.
MaybeNoYes
6.5%
40.8%
52%
Ideas for ChangeDon't CareLiked
38%
32.8% 29.2%
« Clear & Simple Rating system
When asked about the system used in the study, participants were split if there was
a better way to measure sustainability:
29.2% liked the ABC rating system
38% didn’t care what they system was
32.8% had ideas for change
Many of these answers requested standardization and a more prominent/
noticeable logo on POS/packaging
» Figure 11
» Figure 12
QUADPACKAGING | SPC IMPACT 2018
Based on the study results, we conclude that sustainability logos do not make an impact on consumer purchase decisions. This led to two fi rm recommendations for including sustainability logos on CPG and Private Label Retail Packaging:
1. Educate consumers on your brand’s commitment to sustainability through integrated marketing and legitimate follow-through on package design and education.
2. Include sustainability messaging in a secondary location on your packaging to unify your overall brand message.
Recommendation
QP | 21
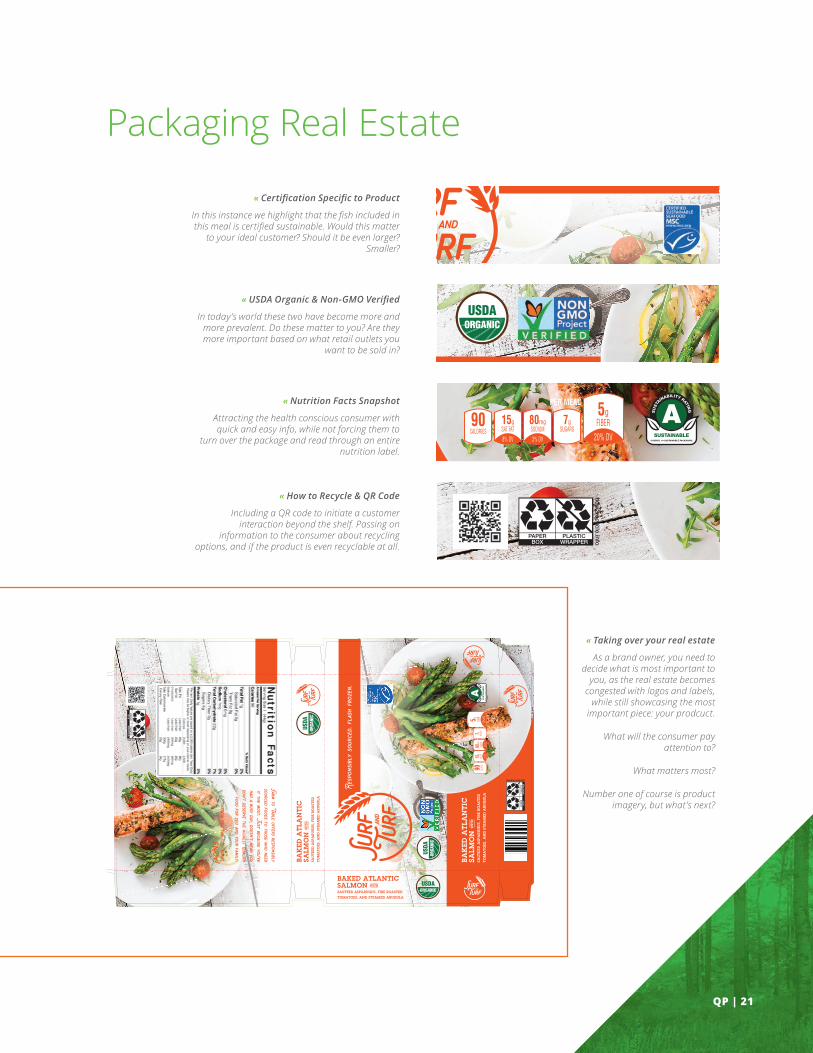
« Taking over your real estate
As a brand owner, you need to decide what is most important to
you, as the real estate becomes congested with logos and labels,
while still showcasing the most important piece: your prodcuct.
What will the consumer pay attention to?
What matters most?
Number one of course is product imagery, but what’s next?
CALORIES90
SAT FAT15g
8% DVSODIUM80mg
SUGARS7g
3% DV
FIBER5g
20% DV
PER MEAL
CALORIES90
SAT FAT15g
8% DVSODIUM80mg
SUGARS7g
3% DV
FIBER5g
20% DV
PER MEAL
CALORIES90
SAT FAT15g
8% DVSODIUM80mg
SUGARS7g
3% DV
FIBER5g
20% DV
PER MEAL
CALO
RIES
90SA
T FAT
15g
8% DV
SODIU
M80
mg
SUGA
RS7g3%
DV
FIBER5g 20% DV
PER
MEA
L
« Certifi cation Specifi c to Product
In this instance we highlight that the fi sh included in this meal is certifi ed sustainable. Would this matter
to your ideal customer? Should it be even larger? Smaller?
« USDA Organic & Non-GMO Verifi ed
In today’s world these two have become more and more prevalent. Do these matter to you? Are they more important based on what retail outlets you
want to be sold in?
« Nutrition Facts Snapshot
Attracting the health conscious consumer with quick and easy info, while not forcing them to
turn over the package and read through an entire nutrition label.
CALORIES 90SAT FAT 15g
8% DVSODIUM 80mg
SUGARS 7g
3% DV
FIBER 5g
20% DV
PER MEAL
« How to Recycle & QR Code
Including a QR code to initiate a customer interaction beyond the shelf. Passing on
information to the consumer about recycling options, and if the product is even recyclable at all.
Packaging Real Estate
QUADPACKAGING | SPC IMPACT 2018
When participants were asked if there’s an effective way to promote and educate the public about sustainability and packaging, solutions included:
• Marketing campaigns• Advertisements, social media, landing pages, videos, in-store POP • Setups in-store with an educator to talk about the change and the process• Add information to the nutrition label• Many consumers already carefully scrutinize nutrition labels
Many of the study’s participants also noted standardization of the rating system should be marketed – a consistency that goes across an entire company, and someday, possibly across all industries. Consumers are aware that marketing and packaging can be misleading; they’re jaded and suspect of claims found on packaging and how unregulated and inconsistent it can be.
A poll from the University of Texas, Austin that found 36 percent of those surveyed do not believe claims from companies that state they are trying to “save energy” or “be energy efficient.” As one participant said, just “…be consistent, clear, and honest.”
While education on the rating systems used may take some work, there’s already a
positive perception and relationship between sustainability and consumer packaged goods. If you take the time to create a system and educate your consumers, the return will be seen in recognition for investing in a social cause, efficient production lowering costs and generating greater profitability, tax benefits and an increase in product value with consumers.
...be consistent, clear, honest.“
“
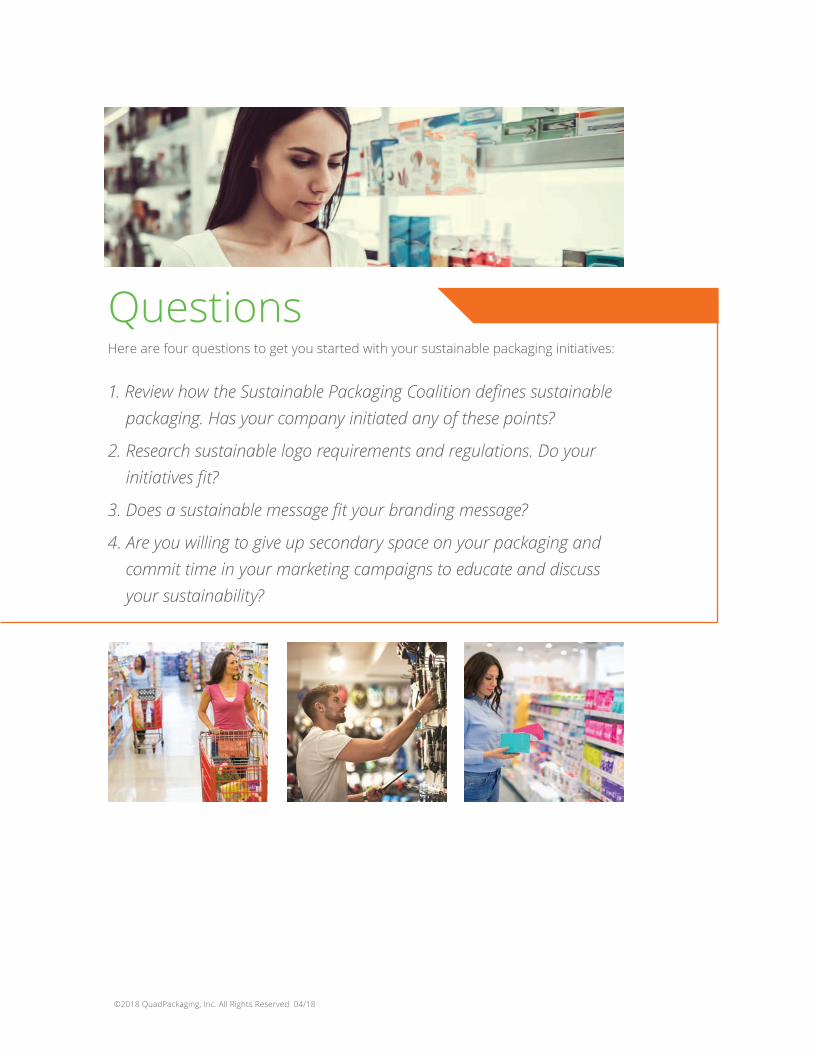
QuestionsHere are four questions to get you started with your sustainable packaging initiatives:
1. Review how the Sustainable Packaging Coalition defines sustainable packaging. Has your company initiated any of these points?
2. Research sustainable logo requirements and regulations. Do your initiatives fit?
3. Does a sustainable message fit your branding message?
4. Are you willing to give up secondary space on your packaging and commit time in your marketing campaigns to educate and discuss your sustainability?
©2018 QuadPackaging, Inc. All Rights Reserved 04/18
Report produced by
in conjunction with