SUSTAINABLE IRON AND STEEL MAKING SYSTEMS INTEGRATED …
185
SUSTAINABLE IRON AND STEEL MAKING SYSTEMS INTEGRATED WITH CARBON SEQUESTRATION Xiaozhou Zhou Submitted in partial fulfillment of the requirements for the degree of Doctor of Philosophy in the Graduate School of Arts and Science COLUMBIA UNIVERSITY 2015
Transcript of SUSTAINABLE IRON AND STEEL MAKING SYSTEMS INTEGRATED …

SUSTAINABLE IRON AND STEEL MAKING SYSTEMS
INTEGRATED WITH CARBON SEQUESTRATION
Xiaozhou Zhou
Submitted in partial fulfillment of the
requirements for the degree of
Doctor of Philosophy
in the Graduate School of Arts and Science
COLUMBIA UNIVERSITY
2015

© 2015
Xiaozhou Zhou
All Rights Reserved

ABSTRACT
Sustainable Iron and Steel Making Systems Integrated with Carbon Sequestration
Xiaozhou Zhou
As the world population has exceeded 7 billion in 2011, the global awareness of sustainability
arises more than ever since we are facing unprecedented challenges in energy, water, material and
climate change, in order to sustain our current and future generations on this planet. The Guardian
has named the Iron Bridge opened in 1781 across the River Severn, Shropshire, UK as the cradle
of the modern world, which is the world’s first cast-iron bridge and remains as the enduring symbol
of the Industrial Revolution (Guardian, 2009). Ever since, in the spanning of 250 years, iron and
steel have been the cornerstone of modern industries from developed countries to developing ones
especially for those which are still experiencing their major urbanization process. Nevertheless,
iron and steel making are among the most raw material-dependent and energy intensive industries
with large gaseous pollutants, CO2 and waste generations in the world. Therefore there is a pressing
need to solve these resource and environmental problems associated with the iron and steel making.
This work addresses a number of challenges stated above by focusing on the improvement of the
overall sustainability of this highly energy-intensive industry via (1) utilizing inexpensive iron ore
tailings to enhance the material sustainability, (2) CO2 reduction by mineral carbonation using its
own solid waste stream, i.e., iron and steel slags, and (3) slag valorization through the use of
carbonated slags as sustainable construction materials.

This work begins with the study of an ironmaking plant using the direct reduced iron (DRI)
process, which is a molten iron production method utilizing fluidized bed and melter-gasifier
technologies. This technology allows the direct production of the molten iron using the
inexpensive iron ore tailings and the non-coking coal, during a gas-solid reaction in the fluidized
bed. Practically, a higher percentage of the fine particles (i.e., iron ore tailings) is favored to mix
in the feedstock because it is cheaper than the traditionally used coarse particles (i.e., bulk and fine
iron ores). The challenge of this novel technology is attributed to the entrainment of the fine
particles during the gas-solid fluidization. Since the electrostatic phenomenon was significant
during the particulate fluidization systems which might affect the particle entrainment, the
electrostatic charge generation and accumulation were investigated for binary and quaternary
particulate systems. Specifically, the effect of the addition of two different iron ore tailings (i.e.,
hematite and magnetite) in the fluidized bed was studied in terms of particle-particle interactions,
electrostatics, and entrainment rates. The behaviors of different particulate systems were found to
be highly dependent on the chemical and physical properties of the particles. The results suggested
that the enhanced electrostatic forces between the fine and coarse particles due to the electrostatic
charging during the fluidized bed operation retained the fines to some extent and the sintering of
the fine particles could happen on the surface of the coarse particles during the iron ore reduction.
Therefore, for this fluidized bed based DRI process, iron ore tailings are proved to be able to
replace the coarse iron ores to the extent that fine particles will sinter but not be entrained and thus
the overall cost of raw materials could decrease.
In iron and steel making, limestone and dolomite are also mixed in the feedstock to remove
the impurities of the iron ores, mostly silica, which forms slag as a silicate-based material in the
downstream of this process. Slags of different types have been reused as cement clinker, aggregate,

road base and fertilizer. Recently, iron and steel slags have also been deemed as alternatives for
mineral sequestration because these slags are similar to natural Ca/Mg-bearing silicate minerals.
The accelerated weathering of natural minerals or industrial wastes is an environmentally benign
route to thermodynamically stabilize carbon. Thus, another study of this work is fixing the CO2,
especially emitted from the iron and steel plant, into the slag, a solid waste generated from the
same processing stream. In particular, the stainless steel slag has been a focus since its application
in construction materials has been limited due to the high content of FeO and the environmental
concern of heavy metals leaching (e.g., Cr).
Along with the iron and steel making, the cement industry is also among the largest industrial
CO2 emitters. Mixing carbonated slags as a filler material in the cement mortar while guaranteeing
the overall quality of the cementitious material could reduce the usage of limestone and the carbon
emissions from limestone calcination and reduce energy input during the cement production. In
this study, the production of environmentally benign cementitious material was coupled with the
direct carbonation of stainless steel slag. Compressive strength, exothermic behavior and leaching
behavior of the mixed cement mortar were investigated. Particularly, mixing 10 wt% of the direct
carbonated stainless steel slag sample prepared at 30 °C in a Portland cement did enhance the
compressive strength of the cement mortar. Also, the mixing retarded the hydration and overall
setting time. Finally, the Cr leaching of the cement mortar with the addition of the direct carbonated
stainless steel slag was minimized. Thus, the iron and steel industry and cement industry should
collaborate, to minimize their overall material input, energy usage and carbon emission jointly.
During the direct carbonation, stainless steel slag and CO2 flows are introduced into the solvent
simultaneously. Whereas for the two-step process, calcium ions are extracted from the solid matrix
into an aqueous phase, and then the CO2 is bubbled through and reacts with the Ca. The two-step

route allows optimizing the conditions for both the dissolution and the carbonation. Moreover, the
precipitated end products (e.g., precipitated calcium carbonates, PCC) from the two-step process,
normally with higher quality compared to direct carbonated slags, can be adapted for various
industrial and construction applications.
However, the overall reaction is constrained by the kinetics of the stainless steel slag
dissolution. Thus several organic and inorganic chelating agents were applied in order to accelerate
the dissolution. Some of these agents were found to be desirable for the dissolution of stainless
steel slag at different pH via the differential bed study. Ligand concentration and temperature
affected the extent of the extraction in the batch reactor. For the carbonation step, PCC from the
modeled chemical solution and the dissolved stainless steel slag solution were non-identical, which
was also affected by the reaction pH and temperature. The properties of the PCC prepared in the
batch reactor and the bubble column reactor were also found to be dissimilar. Thus, for an iron and
steel plant that adopts the two-step carbonation of slags for CO2 reduction, the end products could
be engineered by tuning the reaction conditions to meet different end-user requirements.
On the other hand, there have been significant efforts to reduce the cost of the two-step
carbonation, including the utilization of value-added byproducts like iron oxide. In particular,
silicate minerals or industrial waste often contain 5~20 wt% of Fe and by dissolving the iron into
aqueous phase, a variety of Fe-based materials can be synthesized by precipitation. In this work,
Fe-based catalysts were synthesized from serpentine and stainless steel slag (SSS) and applied to
the biomass-to-hydrogen conversion via an alkaline thermal treatment pathway. The synthesized
Fe-based materials were compared with the purchased hematite and magnetite and the reduced Fe-
based catalyst derived from SSS was found to be catalytically active. This suggests an opportunity
to produce inexpensive catalysts from the solid waste of the iron and steel making.

Finally, a novel iron making scheme based on a fluidized bed DRI system was proposed by
this study. It combined all the studies above that inexpensive iron ore tailings were used as a
feedstock for the iron production, slags were utilized for sequestering CO2 and ended as filler
materials for cement mortar. Preliminary economical and life cycle assessment was investigated
based on the current scale of an existing industrial plant. An economically, environmentally and
ecologically favored iron, steel and cement production system could be potentially achieved with
improved overall material sustainability and carbon footprint.

i
TABLE OF CONTENTS
LIST OF FIGURES ..................................................................................................................... vi
LIST OF TABLES ...................................................................................................................... xii
NOMENCLATURE ................................................................................................................... xiv
ACKNOWLEDGMENTS ........................................................................................................ xvii
CHAPTER 1 INTRODUCTION ................................................................................................. 1
CHAPTER 2 BACKGROUND .................................................................................................... 8
2.1 Iron Making Technology .................................................................................................. 8
2.1.1 Overview of Iron & Steel Industry ........................................................................... 8
2.1.2 Blast Furnace Iron ................................................................................................... 11
2.1.3 Direct Reduced Iron ................................................................................................ 12
2.2 Carbon Mineralization.................................................................................................... 13
2.3 Slag Generation and Utilization ..................................................................................... 15
2.4 Research Objectives ....................................................................................................... 17
CHAPTER 3 DIRECT UTILIZATION OF INEXPENSIVE IRON ORE TAILINGS VIA
FLUIDIZED BED FOR DIRECT REDUCED IRONMAKING............................................ 19
3.1 Introduction .................................................................................................................... 20
3.2 Experimental .................................................................................................................. 22
3.2.1 Procurement and characterization of minerals ........................................................ 22

ii
3.2.2 Experimental setup.................................................................................................. 24
3.2.3 Electrostatic charging via particle-particle interaction ........................................... 27
3.2.4 Electrostatics and entrainment measurements in fluidized beds............................. 28
3.3 Results and discussion .................................................................................................... 30
3.3.1 Physical and chemical properties of minerals ......................................................... 30
3.3.2 Electrostatic charging of mixed mineral systems ................................................... 34
3.3.3 Fluidization and electrostatic behaviors of binary system ...................................... 38
3.3.4 Entrainment behaviors of binary/quaternary fluidization systems ......................... 43
3.3.5 Effect of sintering ................................................................................................... 46
3.4 Conclusions .................................................................................................................... 48
CHAPTER 4 CARBON SEQUESTRATION AND WASTE VALORIZATION VIA
DIRECT CARBONATION OF SLAG ..................................................................................... 49
4.1 Introduction .................................................................................................................... 50
4.2 Materials and Experimental ........................................................................................... 54
4.2.1 Carbonation of SSS ................................................................................................. 54
4.2.2 Material characterization ........................................................................................ 55
4.2.3 Formation and characterization of cement mortar with CSSS ................................ 56
4.2.4 Leaching test ........................................................................................................... 57
4.3 Results and discussion .................................................................................................... 58
4.3.1 Effect of aqueous system w/wo NaHCO3 on the carbonation of SSS .................... 58
iii
4.3.2 Effect of temperature on the extent of the carbonation of SSS ............................... 59
4.3.3 Characterization of SSS and CSSS ......................................................................... 61
4.3.4 Exothermic behavior of cement mortar w/wo CSSS during hydration .................. 68
4.3.5 Effect of wt% of CSSS on the compressive strength of mixed cement mortar ...... 71
4.3.6 Leaching Effect of SSS ........................................................................................... 73
4.4 Conclusions .................................................................................................................... 75
CHAPTER 5 ACCELERATED CARBONATION OF SLAG FOR CARBON
SEQUESTRATION AND WASTE VALORIZATION .......................................................... 77
5.1 Introduction .................................................................................................................... 78
5.2 Materials and Experimental ........................................................................................... 81
5.2.1 Materials and Characterization ............................................................................... 81
5.2.2 Fast dissolution kinetics of SSS .............................................................................. 82
5.2.3 SSS dissolution and carbonation ............................................................................. 83
5.2.4 Leaching tests.......................................................................................................... 85
5.3 Results and discussion .................................................................................................... 86
5.3.1 Characterization of procured SSS ........................................................................... 86
5.3.2 Fast dissolution kinetics of SSS with chelating agents ........................................... 87
5.3.3 Kinetic model of the fast dissolution of SSS .......................................................... 92
5.3.4 SSS dissolution in batch reactor ............................................................................. 94
5.3.5 PCC synthesis ......................................................................................................... 97
iv
5.3.6 Chemical stability of SSS ..................................................................................... 102
5.4 Conclusions .................................................................................................................. 104
CHAPTER 6 INVESTIGATION OF A VALUE-ADDED BY-PRODUCT DURING TWO-
STEP MINERAL CARBONATION ....................................................................................... 105
6.1 Introduction .................................................................................................................. 106
6.2 Experimental ................................................................................................................ 110
6.2.1 Synthesis of Fe-based particles from serpentine and SSS .................................... 110
6.2.2 Characterizations................................................................................................... 111
6.2.3 Biomass to H2 conversion with Fe-based particles ............................................... 112
6.3 Results and Discussions ............................................................................................... 113
6.3.1 Effect of Ksp on the formation of the metal hydroxide ......................................... 113
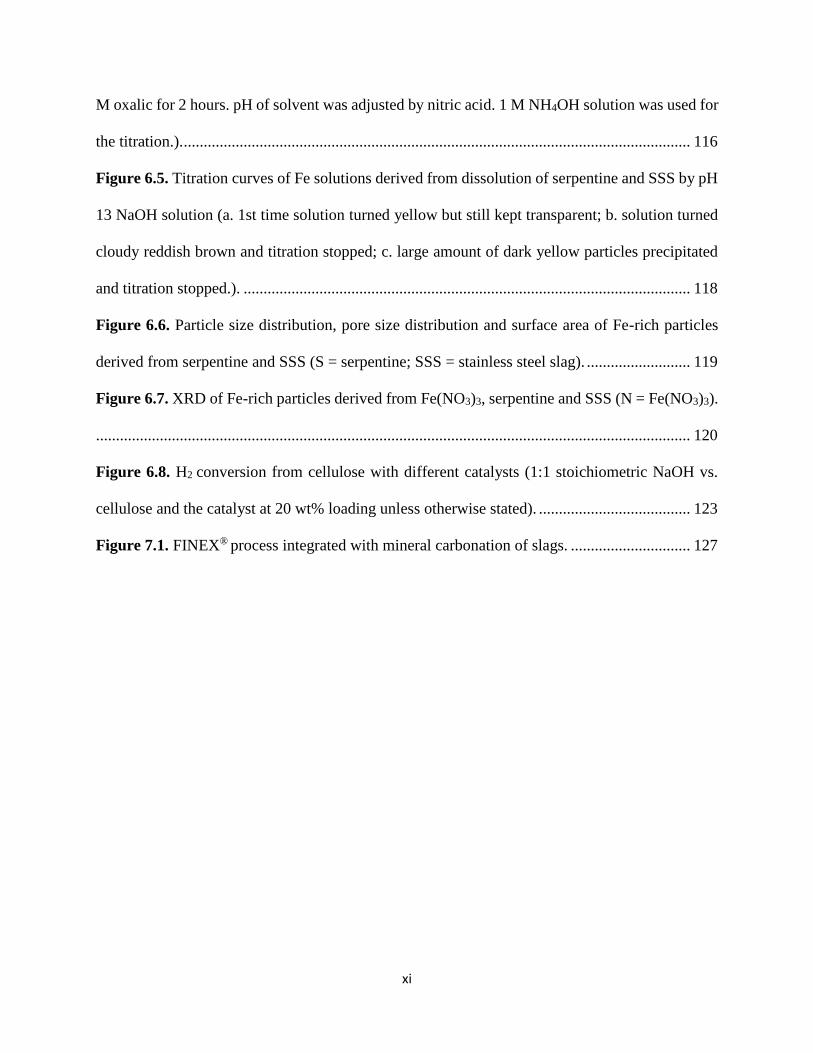
6.3.2 Titration of Fe solutions ........................................................................................ 115
6.3.3 Size, porosity and surface area of synthesized Fe-based particles ........................ 118
6.3.4 Phase analysis and elemental concentration of synthesized Fe-based particles ... 120
6.3.5 Catalyst testing ...................................................................................................... 122
6.4 Conclusions .................................................................................................................. 124
CHAPTER 7 PRELIMINARY LIFE CYCLE AND ECONOMIC ASSESSMENT OF
CARBONATION OF SLAGS AND ITS INTEGRATION WITH CEMENT MAKING . 126
7.1 Introduction .................................................................................................................. 126
7.2 Raw Materials and Energy Requirement ..................................................................... 127

v
7.3 Preliminary Life Cycle Analysis .................................................................................. 128
7.3.1 Slag for Mineral Carbonation ............................................................................... 128
7.3.2 Carbonated slag for cement application ................................................................ 131
7.4 Economic Analysis ....................................................................................................... 133
7.5 Conclusions .................................................................................................................. 135
CHAPTER 8 CONCLUSIONS AND FUTURE WORK ...................................................... 136
8.1 Conclusions .................................................................................................................. 136
8.2 Future Work ................................................................................................................. 140
References .................................................................................................................................. 143
vi
LIST OF FIGURES
Figure 1.1. World steel production in 2012 (World Steel Association, 2013). ............................. 1
Figure 1.2. U.S. GHGs emissions by sectors in 2008 (U.S. EPA, 2008a). .................................... 2
Figure 1.3. Stockpile of (a) Blast furnace (BF) slag/iron slag and (b) Basic oxygen furnace (BOF)
slag (X.Z. Zhou, 07/24/14). ............................................................................................................ 3
Figure 3.1. X-ray diffraction pattern of the procured minerals used in this study analyzed by XRD.
....................................................................................................................................................... 24
Figure 3.2. Illustration of the fluidization system including cold mist generator, fluidized bed,
particle collection apparatus, and data acquisition system. .......................................................... 26
Figure 3.3. Electrostatic measurement systems used in this study: (a) Mixer/Mill for particle
mixing and a faraday cup connected with a Picoammeter, and (b) Correstat 3410 electrostatic probe
system mounted in the fluidized bed and simplified circuit of electrostatic probe system mounted
in the fluidized bed and simplified circuit of electrostatic signal acquisition unit. ...................... 27
Figure 3.4. Electrostatic signals of PBR particulate system at Ug = 0.92 m/s for 30 s measured by
the Correstat 3410 electrostatic probe: (a) Raw data of electrostatic current, and (b) Integration of
electrostatic current to accumulated electrostatic charge with the slope of the fitting curve
representing the charge transfer rate. ............................................................................................ 29
Figure 3.5. Particle size distributions of minerals: (a) as received and (b) after size reduced. Inset:
Geldart’s particle classification (Geldart, 1973). .......................................................................... 33
Figure 3.6. Real time electrostatic current and accumulated electrostatic charge of PBR after
mixing and charging. .................................................................................................................... 34
Figure 3.7. Total transferred charge of binary and quaternary mineral mixtures: (a) PBR+NMP (b)
PBR+BSP (c) PLD+NMP and (d) PLD+BSP, mean ± 1SD. ....................................................... 36
vii
Figure 3.8. Change of the electrostatic charge (average ± 1SD) of PBR/BSP (90/10) binary
mixture, mixed by the system (a) in section 2.3, as a function of mixing time. ........................... 37
Figure 3.9. (a) Pressure drop of fluidization systems of PBR, NMP, and PBR+NMP (90/10) (0 ~
4 zones), (b) Pressure drop of fluidization systems of PBR, BSP, and PBR+BSP (90/10) and (c)
Predicted particle-particle interaction model of PBR and NMP. Filled circle indicates PBR
particles and empty circle indicates NMP particles. ..................................................................... 38
Figure 3.10. Standard deviation of pressure drop of (a) PBR, NMP, and PBR+NMP (90/10) and
(b) PBR, BSP, and PBR+BSP (90/10). ......................................................................................... 40
Figure 3.11. Electrostatic charge transferred rates of the binary system in fluidized beds measured
by the Correstat 3410 electrostatic probe: (a) PBR only, NMP only, and PBR/NMP (90/10), and
(b) PBR only, BSP only, and PBR/BSP (90/10). Insets indicate standard deviations of the
electrostatic current, Itotal. .............................................................................................................. 41
Figure 3.12. Initial entrainment of the binary/quaternary systems with Ug = Umf,PBR = 0.75m/s: (a)
10% NMP, (b) 70% NMP, (c) 10% BSP and (d) 70% BSP, mean ± 1SD. .................................. 43
Figure 3.13. Initial entrainment rate K* of the binary/quaternary systems at Ug = Umf,PBR = 0.75m/s.
Subscripts of K* indicates, (1) 10 % NMP, 90 % PBR, (2) 70 % NMP, 30 % PBR, (3) 10 % NMP,
90 % PLD, (4) 70 % NMP, 30 % PLD, (5) 10 % BSP, 90 % PBR, (6) 70 % BSP, 30 % PBR, (7)
10 % BSP, 90 % PLD, and (8) 70 % BSP, 30 % PLD, respectively. ........................................... 45
Figure 3.14. Microscope photos of the binary mixture (10wt% BSP+90wt% PBR) mixed by the
system (a) in section 2.3 with different mixing time in ambient conditions: (a) 0.5 hour (b) 1 hour
and (c) 2 hours. ............................................................................................................................. 46

viii
Figure 3.15. SEM images of the binary particulate systems before and after heat treating at 700
ºC for 2 hours (left, X85, right X200): (a) untreated PBR+NMP, (b) heat-treated PBR+NMP, (c)
untreated PBR+BSP and (d) heat-treated PBR+BSP. .................................................................. 47
Figure 4.1. Comparison of iron and steel slag valorization in Germany vs. in China. ................ 51
Figure 4.2. Schematic flow chart of experimental setup: (a) direct carbonation of SSS and (b)
formation and characterization of cementitious material w CSSS. .............................................. 55
Figure 4.3. pH conditions of direct carbonation: (a) DI water vs. 1 M NaHCO3 with CO2 injection
and (b) stainless steel slag in DI water vs. 1 M NaHCO3 with CO2 injection. ............................. 59
Figure 4.4. Effect of temperature on the extent of one-step carbonation of stainless steel slag: (a)
TGA analysis and (b) Carbon analyzer analysis. .......................................................................... 60
Figure 4.5. (a) Particle size distribution of SSS and CSSS, (b) pore size distribution and surface
area of SSS CSSS and (c) particle size distribution of the materials for calorimetric tests. ......... 62
Figure 4.6. SEM photos of SSS wo/w carbonation...................................................................... 64
Figure 4.7. Elemental distribution in SSS w/wo carbonation. ..................................................... 65
Figure 4.8. Phase analysis by X-ray diffraction for SSS and CSSS at different temperatures. ... 67
Figure 4.9. Calorimetric test of cement mixed with SSS, CSSS 70°C and 2-Step CSSS of different
weight fractions (10 wt%, 15 wt%, 20 wt% and 30 wt%). Left, distributive heat flow; right,
accumulative heat flow. ................................................................................................................ 69
Figure 4.10. Comprehensive strength of cementitious material w CSSS prepared at different
temperatures. ................................................................................................................................. 72
Figure 5.1. Particle size distribution of sieved stainless steel slag (the fraction smaller than mesh
diameter of 175 µm). .................................................................................................................... 81

ix
Figure 5.2. Schematic of reactor systems for SSS dissolution and carbonation: (a) differential bed
reactor and (b) batch reactor and bubble column reactor. ............................................................ 82
Figure 5.3. X-ray diffraction pattern of un-dissolved SSS. ......................................................... 87
Figure 5.4. Cumulative values for Ca/Si extraction of the differential bed dissolution experiments:
(a) Ca extraction at initial pH 5, (b) Si extraction at initial pH 5, (c) Ca extraction at initial pH 2,
and (d) Si extraction at initial pH 2. .............................................................................................. 88
Figure 5.5. Linear fitting of extraction rate constants for citrate systems using three kinds of kinetic
models: (a) pH 5 and (b) pH 2. ..................................................................................................... 90
Figure 5.6. Linear fitting of extraction rate constants for citrate systems using three kinds of kinetic
models: (a) pH 5 and (b) pH 2. ..................................................................................................... 93
Figure 5.7. Effect of solvent concentration on SSS dissolution in terms of Ca extraction rate in
filtrate and final pH at ambient temperature and pressure (68 mg/ml initial solid concentration,
mixing rate = 1000 rpm, reaction time = 1 hour). ......................................................................... 95
Figure 5.8. Effect of temperature on SSS dissolution in terms of Ca extraction rate in filtrate (68
mg/ml initial solid concentration, acid concentration = 0.1 M, mixing rate = 1000 rpm, reaction
time = 1 hour). .............................................................................................................................. 96
Figure 5.9. Effect of pH on morphological characteristics of PCC synthesized from 25 mL of 1 M
Ca(NO3)2 and 50 ml of 1 M K2CO3 solutions at ambient temperature and pressure (mixing rate =
750 rpm, reaction time = 15 minutes, the reaction pH was adjusted by adding NH4Cl, HNO3 or
KOH)............................................................................................................................................. 97
Figure 5.10. Effect of temperature on morphological characteristics of PCC synthesized from (a)
25 ml 1 M Ca(NO3)2 solution and (b) 25 ml Ca-rich solution obtained from SSS dissolution using

x
1 M NH4Cl at ambient temperature. Note that in both cases, 50 ml 1 M K2CO3 solution was used
as the source of carbonate ions. (mixing rate = 750 rpm, reaction time = 15 minutes). ............... 99
Figure 5.11. pH variation in bubble column reactor during PCC precipitation from Ca-rich
solution obtained from SSS dissolution using 1 M NH4Cl and 0.15 M CaCl2 solution with Ca
concentration equivalent to the extracted Ca solution from SSS and pH adjusted with 1 M NH4OH.
..................................................................................................................................................... 100
Figure 5.12. Effect of CO32- concentrations on morphological characteristics of PCC synthesized
from (a) 0.5 M Ca(NO3)2 solution in a batch reactor, (c) 0.5 M CaCl2 solution in a bubble column
reactor, and (b)&(d) Ca-rich solution obtained from SS dissolution using 1 M NH4Cl. For (c) and
(d) the carbonate source was gaseous CO2 bubbled through the reactor, whereas for (a) and (b),
those were 1 M K2CO3 solution. ................................................................................................. 101
Figure 6.1. Schemes of (a) production of value-added solids integrated with carbon mineralization
of serpentine/steel slag via pH swing and (b) biomass to hydrogen conversion via alkaline
hydrothermal treatment. .............................................................................................................. 108
Figure 6.2. Experimental Setup of (a) Fe-based material synthesis and (b) biomass to hydrogen
conversion. .................................................................................................................................. 112
Figure 6.3. Equilibrium concentrations of metal ions vs. metal hydroxides at different pH. .... 115
Figure 6.4. Titration curves of (a) 0.007 M Fe(NO3)3 solution (1 M NH4OH solution , pH 10
NH4OH/NH4Cl buffer solution and 0.25 M HMTA solution were used for the titration.) and (b)
FeS solutions derived from serpentine dissolution. (FeS solution A: serpentine was dissolved in pH
2 0.01 M sodium oxalate solution for 1 hour; FeS solution B: serpentine was dissolved in pH 2
0.01 M sodium oxalate solution for 2 hours; FeS solution C: serpentine was dissolved in pH 2 0.01
xi
M oxalic for 2 hours. pH of solvent was adjusted by nitric acid. 1 M NH4OH solution was used for
the titration.). ............................................................................................................................... 116
Figure 6.5. Titration curves of Fe solutions derived from dissolution of serpentine and SSS by pH
13 NaOH solution (a. 1st time solution turned yellow but still kept transparent; b. solution turned
cloudy reddish brown and titration stopped; c. large amount of dark yellow particles precipitated
and titration stopped.). ................................................................................................................ 118
Figure 6.6. Particle size distribution, pore size distribution and surface area of Fe-rich particles
derived from serpentine and SSS (S = serpentine; SSS = stainless steel slag). .......................... 119
Figure 6.7. XRD of Fe-rich particles derived from Fe(NO3)3, serpentine and SSS (N = Fe(NO3)3).
..................................................................................................................................................... 120
Figure 6.8. H2 conversion from cellulose with different catalysts (1:1 stoichiometric NaOH vs.
cellulose and the catalyst at 20 wt% loading unless otherwise stated). ...................................... 123
Figure 7.1. FINEX® process integrated with mineral carbonation of slags. .............................. 127

xii
LIST OF TABLES
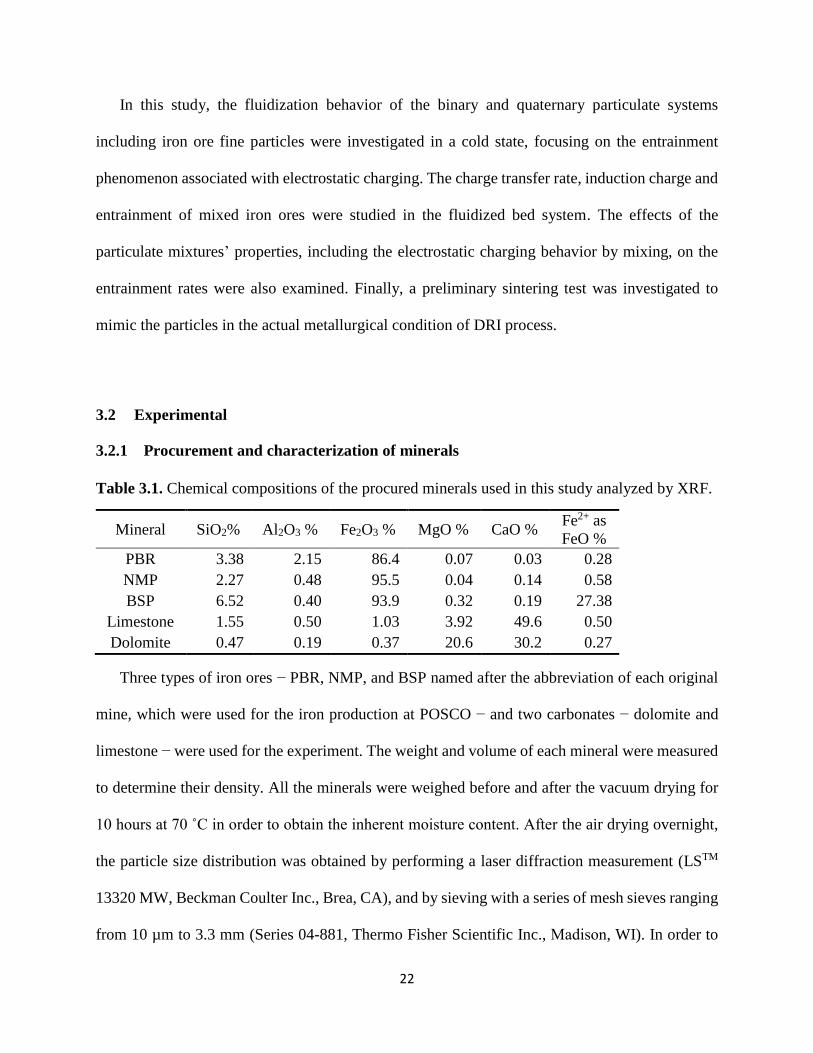
Table 3.1. Chemical compositions of the procured minerals used in this study analyzed by XRF.
....................................................................................................................................................... 22
Table 3.2. Compositions of binary and quaternary particulate systems used in this study (wt%).
....................................................................................................................................................... 27
Table 3.3. Physical and chemical properties of minerals used in this study. ............................... 30
Table 4.1. Chemical compositions of the procured SSS from ThyssenKrupp plant at Terni
measured by Atomic Absorption Spectrometer (AAS). Data is provided by ThyssenKrupp plant
environmental office. .................................................................................................................... 54
Table 4.2. Chemical compositions of Lafarge ASTM C 150 Type I Portland cement. ............... 56
Table 4.3. Elemental composition of SSS w/wo carbonation by SEM/EDS mapping associated
with Figure 4.7. ............................................................................................................................. 66
Table 4.4. Leaching tests of SSS w/wo carbonation (Tests were performed based on the European
Standard Method EN 12-457). ...................................................................................................... 73
Table 4.5. Leaching tests of hydrated cement w/wo CSSS mixed (Tests were performed based on
the European Standard Method EN 12-457). ................................................................................ 74
Table 5.1. Chemical compositions of procured SSS from ThyssenKrupp plant at Terni measured
by Atomic Absorption Spectrometer (AAS). Data is provided by ThyssenKrupp plant
environmental office. .................................................................................................................... 86
Table 5.2. Properties of various chelating agents (β = stability constant). .................................. 91
Table 5.3. Leaching tests of SSS and dissolved SSS using 1 M ammonium chloride for 30 minutes
(Tests were performed based on the European Standard Method EN 12-457). ......................... 103
Table 6.1. Compositions of serpentine and SSS measured by XRF (wt%) ............................... 113

xiii
Table 6.2. Elemental composition of Fe-based catalysts prepared from serpentine and SSS
measured by EDS (wt%). ............................................................................................................ 121
Table 7.1. Categories of iron ore ................................................................................................ 127

xiv
NOMENCLATURE
AC alternating current
BET Brunauer, Emmett and Teller
BF blast furnace
BOF basic oxygen furnace
Cb solvent concentration in the bulk fluid
CCUS carbon capture, utilization and sequestration
C3A 3CaO·Al2O3, tricalcium aluminate
CS CaSiO3
CS2 CaSi2O5
C2S Ca2SiO4, dicalcium silicate
C3S Ca3SiO5, tricalcium silicate
CSSS carbonated stainless steel slag
Deff effective diffusion coefficient
DC direct current
dp particle diameter
DRI direct reduced iron
EAF electric arc furnance
EJ Exajoule, 1018 joules
Eq Equation
∆r𝐺ѳ standard change of reaction in Gibbs free energy
GtCO2 billion metric tons of CO2
GDT gas discharge tube

xv
GHG greenhouse gas
I current
Itotal total current
ICP-AES inductively coupled plasma atomic emission spectroscopy
ICP-MS inductively coupled plasma mass spectrometry
IS iron slag
K* initial entrainment rate
K’ 𝑑𝐾′
𝑑𝑡= K∗
KA acid dissociation constant
kl mass transfer coefficient
kr reaction rate constant
Ksp solubility product constant
LCA life cycle assessment
M molecular weight
Mfine, entrained mass of entrained fines
Mfine, total total mass of fines
MT metric ton
MMT million metric ton
MtCO2 million metric tons of CO2
n number of moles
NOx mono-nitrogen oxides NO and NO2
OHF open hearth furnace
P pressure

xvi
pKA −log10KA
Q charge
R electrical resistance
R0 radius of particle,
RH relative humidity
Rxn reaction
SOx sulfur oxides
SS steel slag
SSS stainless steel slag
t time
TCA total carbon analyzer
TGA thermal gravimetric analysis
T temperature
Ug superficial gas velocity
Umf, PBR minimum fluidization velocity of PBR
V volume
wt% weight percentage
X extraction rate
XRD X-ray diffraction
XRF X-ray fluorescence
ρs particle density

xvii
ACKNOWLEDGMENTS
First and foremost, I would like to express my sincere appreciation to my advisor, Professor
Ah-Hyung Alissa Park, for the opportunity to pursue the doctoral degree in her group, for her
continuous support and for her life mentoring. Her knowledge, enthusiasm and patience guided
me throughout my course at Columbia since the first day of Fall 2009.
I would like to thank my defense committee, Professors Paul Duby, Martin Stute, Huiming
Yin and Tuncel Yegulalp, for their time and feedback on my work. I also want to thank Professors
Klaus Lackner and Robert Farrauto who also offered generous and extremely valuable comments
on my research.
Thank you to all the summer, undergraduate and master students who helped with my work,
in particular Hanna Chao, Naimun Siraj, Haojun Zhu, Lameng Lei, Andy Keller and Giovanna de
Simone.
Thank you to all of my research collaborators, Dr. Laura Simone who graduated from
University of Rome, Ph.D. candidates Sung-Hwan Jiang and Ye Qian in Civil Engineering, and
Mohamed Haroun and Robert Stark in Machine Shop of Mechanical Engineering and Keith
Yeager in Machine Shop of Biomedical Engineering.
My sincere gratitude also goes to the members of Park research group, for their encouragement,
advice, assistance and collaboration. In particular, thanks to Dr. Youngjune Park, Dr. Camile Petit
and Dr. Junfeng Wang for revising my papers.
Last but not the least, I would like to thank my wife, Chen Claire Xu, for her sacrifice, support
and love and my parents, Ping Wang and Degeng Zhou, from the bottom of my heart. I cannot
thank you all enough for everything

1
CHAPTER 1
INTRODUCTION
The iron and steel industry ranks as the fourth largest energy-consuming industry in the U.S.
It consumes estimated 5.2% of the total energy usage in the U.S. manufacturing sector (U.S. EIA
MECS, 2010). The unit energy consumption of this industry in other countries around the world
could be even higher and it is actually more dominant in developing countries (e.g., China).
According to the geographic distribution of the world steel production by major countries in 2012,
China is by far the largest manufacturer with almost 50% of the world production (Figure 1.1)
(Ernst & Young, 2014; World Steel Association, 2013). Also, the price of iron ore has more than
tripled in the past decade before 2012 due to the increasing demand from China although it declines
below
Figure 1.1. World steel production in 2012 (World Steel Association, 2013).

2
$ 80/metric ton on average within a year since 2014 due to the global demand shrink and
oversupply (USGS, 2012). It is a time of high price volatility for both global energy and raw
materials. Therefore, the traditional iron and steel industry that will survive in the current
competitive global business environment has a strong incentive towards improved energy
efficiency and raw materials utilization by technology innovation. The iron and steel industry has
to be reshaped into a more cost-effective manner while maintaining the capacity and quality of the
products to meet the enduring global demand.
Figure 1.2. U.S. GHGs emissions by sectors in 2008 (U.S. EPA, 2008a).
In 2008, the greenhouse gas (GHG) emissions of the U.S. iron and steel industry accounted
1.3% of the total U.S. emissions and 6% of total U.S. industrial emissions (Figure 1.2) (IEA, 2008;
U.S. EPA, 2008a). The direct emissions from U.S. iron and steel making was 123 MtCO2 (million
tonnes of CO2, 1 tonne = 1 metric ton (i.e., MT) = 1000 kg) compared to 2.16 GtCO2 (billions
tonnes of CO2) emissions from the global iron and steel making in 2008, mainly attributed to the

3
coke production, sintering plant, pig iron production and steelmaking (IEA, 2009; U.S. EPA,
2008b). Besides the GHG emissions, the iron and steel industry also generates a substantial amount
of pollutant emissions such as NOx and SOx which need to be abated. In the context that the world
economy is developing towards a greener and sustainable fashion, it is an effective and efficient
strategy for the iron and steel industry to work towards the so-called “triple bottom line” which
focuses on the social, economic and environmental aspects of a business (WBCSD, 2004).
Figure 1.3. Stockpile of (left) Blast furnace (BF) slag/iron slag and (right) Basic oxygen furnace
(BOF) slag (X.Z. Zhou, 07/24/14).
Along with the production of iron and steel, the manufacturing process also generates large
amount of by-products such as slags, gases, dusts and sludges. Unless they are recycled, reused or
treated adequately, these by-products could cause huge environmental concerns and loss of
resources (World Steel Association, 2010). Today, more than 400 MMT (million metric tons) of
iron and steel slag is produced each year world-wide, containing silicon, calcium, magnesium,
aluminum and iron based oxides or silicates (Van Oss and Hendrik G., 2007). Typical iron and
steel slags are shown in Figure 1.3 provided by Baotou Steel Group in Inner-Mongolia, China. In
some countries, up to 80% of the cement contains granulated blast furnace (BF) slags and almost
all the BF slags could be reused. Steel slag is cooled like air-cooling BF slag. Nevertheless, the

4
composition of the steel slag may vary a lot according to its origin of what type of steel is made.
Some of the recovered slags are used internally in the steelmaking furnace or the sinter plant and
roughly 50% of the recovered steel slags are used in construction applications, largely roads. One
of the major hurdles to utilize steelmaking slags at large are their high content of free lime and
FeO, which is not ideal for construction applications especially for cement (The European Slag
Association, 2006). Currently, there are many technologies under development to further improve
the recovery rate of iron and steel slags, especially steel slag. An early-stage technology is
currently trying to mimic the natural weathering of rocks in order to sequester CO2, known as
mineral carbonation, one of the techniques of carbon capture, utilization and storage (CCUS) (U.S.
DOE, 2007).
The idea of mineral carbonation was first proposed by Seifritz in 1990, and then Lackner and
his colleagues at Los Alamos National Laboratory applied this idea to fix CO2 (Lackner et al.,
1997; Seifritz, 1990). Mineral carbonation involves exothermic carbonation of naturally occurring
Mg- or Ca-bearing silicate minerals. The well-recognized advantages of carbon mineralization
include (i) large storage capacity far exceeding the coal reserve, (ii) no need for long-term
monitoring, (iii) ease of accounting and verification of stored CO2, and (iv) the production of
environmentally-benign and thermodynamically stable mineral carbonate products with potential
re-utilization (IPCC, 2005; IPCC, 2007a).
Nevertheless, the immaturity of this technology is also quite obvious. The current limitation is
the slow reaction kinetics, since the natural weathering of silicate minerals occurs on geological
time-scales. Researchers have been working on the enhancement of mineral carbonation thermally
and chemically (Sipilä et al., 2008). Another issue of mineral carbonation is that the cost of this
process is dominated by up front energy costs during mineral processing and carbonation (Huijen
5
et al., 2007). Therefore, industrial wastes, e.g. iron and steel slags, fly ash, municipal solid waste
incinerator (MSWI) and etc., have been proposed as the alternative for these minerals because they
are zero- or low- cost and generally more reactive due to their chemical instability (Huijgen and
Comans, 2005a). It is predicted that 200 to 300 MtCO2 can be stored using worldwide industrial
wastes annually which has to be compared to the 26 GtCO2 produced per year globally (Kirchofer
et al., 2013). Although the available quantity of industrial waste for carbonation remains small,
taking iron and steel industry as an example, it may solve the issue of the large amount of unused
slags, which are either landfilled or stockpiled now, by coupling with CO2 sequestration.
In this particular work, on one hand, the possibility of utilizing inexpensive fine iron ore
tailings directly with coarse iron ores in the fluidized bed based on the FINEX® technology is
investigated in terms of their electrostatic and entrainment behaviors during the fluidization of
multi-particulate systems. On the other hand, the sequestration of CO2 with stainless steel slag via
both the direct and two-step carbonation is studied. After carbonation, the end-products and by-
products via both routes have been studied for various application e.g. mixing in the cement mortar
and potential catalyst for the alkaline thermal treatment of biomass for H2 production. The content
of this research has been organized into the following chapters based on their relevance.
In Chapter 2, a detailed background of existing iron making technologies is described. A
general overview of CCUS technology, mineral carbonation in particular, has also been introduced.
Further, the current status and major problem of the iron and steel slag utilization has been stated.
At the end of this chapter, research objectives of this work are listed.
In Chapter 3, in order to assess the possibility of the direct utilization of fine iron ore tailings
in the fluidized bed DRI system, the electrostatic charge generation and accumulation are
investigated for binary and quaternary particulate systems (i.e., coarse and fine iron ores, limestone

6
and dolomite in various combinations). Specifically, the effect of the addition of two different fine
iron ores (i.e., hematite and magnetite) in the fluidized bed is studied in terms of particle-particle
interactions, electrostatics and entrainment rates. The effects of the chemical and physical
properties of particles and sintering are also studied.
In Chapter 4, the direct carbonation of stainless steel slag (SSS) is discussed. Carbonated SSS
is then mixed in the cement mortar at different ratios. Compressive strength, exothermic behavior
and leaching behavior of mixed cement mortar have been investigated. In particular, the
characteristics of the hydration and setting of mixed cement mortar and the leachability of Cr and
Ni have been described.
In Chapter 5, several organic and inorganic chelating agents are applied in order to accelerate
the dissolution of stainless steel slag during the two-step carbonation. Some of them are found to
be desirable for stainless steel slag dissolution at different pH values via kinetic study in a
differential bed reactor. The effect of ligand concentration and temperature for reactions in the
batch reactor is also discussed. For the carbonation step, precipitated calcium carbonates (PCC)
from modeled chemical solutions and the dissolved stainless steel slag solution prepared at
different reaction pH and temperature are compared. The properties of PCC synthesized in the
batch reactor and the bubble column reactor are also evaluated.
In Chapter 6, in order to reduce the cost of the mineral carbonation including the carbonation
of industrial waste, one of the value-added byproducts, Fe-based materials are synthesized from
both serpentine and stainless steel slag (SSS) and applied for the biomass-to-hydrogen conversion
via an alkaline thermal treatment pathway. The synthesized Fe-based materials are compared with
the pure hematite and magnetite particles and one of the effective catalytic materials synthesized
has been identified.
7
In Chapter 7, a novel iron making scheme based on FINEX® technology has been proposed by
combining the above studies that the slags are applied for sequestering CO2 and end as a filler
material for cement. Preliminary economical and life cycle assessment have been investigated
based on the current scale of FINEX® process and the scenario of North America economy. A
sustainable iron, steel and cement production system has been sketched with a basic study on its
economic viability in terms of the cost of the mineral carbonation with iron and steel slags.
In Chapter 8, conclusions of this work and recommendations for future study are summarized.

8
CHAPTER 2
BACKGROUND
2.1 Iron Making Technology
2.1.1 Overview of Iron & Steel Industry
Iron and steel production - blast furnace iron (i.e., BF iron or pig iron) and direct reduced iron
(DRI) and crude steel - is one of several major indexes of societal prosperity and industrial maturity
scale. Pig iron, accounting over 94% of the global iron production, is essential for steel production
in a typical integrated steelmaking process (Encyclopedia Britannica, 2014). Crude steel
production is the basis for different industrial mass productions over the world. Construction,
automotive, energy, machinery, equipment and other sectors make up these major application areas,
where construction is still the principal objective market – accounting for about 40% of 2013 steel
shipments, followed by automotive, 26%, and machinery, ship building, 10% (Molinari et al.,
2000).
Pig iron production in 2013 summed up to 1.17 billion MT. Annual pig iron output in Asia is
about 897.30 million MT, with a 79.0% portion up to 708.97 million MT produced in China as the
current largest supplier in the world, followed by EU (92.53 million MT), CIS Russia (81.99
million MT) and North America (41.44 million MT) (Encyclopedia Britannica, 2014).
DRI, on the other hand, from later developed direct iron reducing and smelting processes has
shown an increasing annual production with the global production attained 67.70 million MT,
accounting for 5.8% of total iron output in 2013. The principal DRI output countries contribute to
about 87% annual production. India accomplished 14.60 million MT DRI output, 21.6% global

9
share, followed by Iran 14.40 million MT, Mexico 6.10 million MT in 2013 (Encyclopedia
Britannica, 2014).
Crude steel production in 2013 was up to 1.61 billion MT. Annual crude steel output in Asia
is about 1080.9 million MT, with a 72.1% portion up to 779.0 million MT produced in China,
followed by EU (165.60 million MT), North America (119.25 million MT) and CIS Russia (108.74
million MT). However, because of proximity and cheaper price of feedstock and fuels, other
regions also maintain a certain steel production capacity in global market, e.g. the Middle East
(Encyclopedia Britannica, 2014).
The iron and steel making is one of the most energy-intensive manufacturing industries in the
world, its global energy consumption was estimated to be 18 ~ 19 EJ (1018 J), 10 ~ 15% of the
annual total industry energy consumption (WEC, 1995). The EU has the strictest environmental
and energy use regulation in the world, but still shows a big portion of energy use in the iron and
steel industry. Energy consumption in developing countries, which still use the older BF-BOF
integrated process as the major adoption, is higher.
The iron and steel industry has made tremendous effort to improve energy efficiency, including
enhancing reduction of heat loss, recovery of waste energy and process gases, efficient design of
furnaces, e.g. scrap preheating, high volume/capacity furnaces, foamy slagging and injection of
fuel and oxygen. Energy efficiency improvement potential is based on the production route used,
product mix, energy and carbon intensities of fuel and electricity (Antonio, M.R.J. and Nicolas,
P.G., 2013). As the largest producer, China has made significant improvements in energy
efficiency, reducing its consumption per MT of steel from 32.30 GJ in 1990 to 25.35 GJ in 2000,
about 21% energy conservation improvement (IPCC, 2007b). Similarly, indexed energy
consumption per MT steel produced in U.S. has decreased over 40% from 1975 to 2005 mainly

10
due to the EAF process and recycled steel scraps (World Steel Association, 2014a). The EU has
made a great effort to minimize the net energy consumption in the steel industry to achieve
approximately 36% energy use reduction from 32.52 GJ/MT to 20.83 GJ/MT over the past 40
years. Credit should be given to efforts in process technologies, energy recovery (use of recycled
scrap iron from a 20% share of feedstock in the 1970s to 40% today), process control, and cross
process optimization at different phases (Siemens, 2015).
Even with the efficiency improvements mentioned above, the iron and steel industry is still
one the largest industrial emitters. Its mass reliance on carbon-based fuels and reducing agents,
and the large production volume - 1500 ~ 1600 MtCO2 (410 ~ 440 MT carbon) - emitted in 2013,
result in a significant contributor to the rising atmospheric CO2 concentration (Antonio and Nicolas,
2013). CO2 emission amount in developing countries is higher than the EU because of relatively
lagging technologies, even some low-cost outdated plants still adopting open hearth furnace (OHF)
process, and blast furnaces (BF) followed by the sinter, pellet and coking facilities are the largest
emitters of CO2 on the iron making side. Another recycling route – DRI and EAF, of which energy
mainly comes from electricity and char coal instead coke, can be able to achieve a reduction of up
to 50% in GHG emission compared to the conventional approach – BF and BOF, the former of
which are promoted widely in the EU. Lower emissions will drive increased DRI use in the future.
Further, the easier integration of CCUS technology into the DRI process due to its stream of
gaseous reactants to wastes in an enclosed system and the utilization of iron and steel slags, could
eventually approach zero carbon emissions.

11
2.1.2 Blast Furnace Iron
Conventional iron production involves two steps: coke and sinter processing in a coking plant
and a sinter plant, respectively, and then iron making in the blast furnace. Iron ore, coke and
limestone are the three basic feedstock, of which iron ores are usually sintered into ball-size shapes
from fine ores. The coke is made from pulverized coal by heating to drive off the volatile oil and
tar, usually screened 1-4 inches in diameter. Limestone with size range of 0.5-1.5 inches works as
an impurity remover, converting into a molten mass that readily separates from the pig iron. All
of the feedstock is charged into the top of the blast furnace and form layers inside.
Sintered or pelletized iron ore, is injected into the furnace and a series of chemical reduction
reactions take place with a high temperature to promote reaction kinetics and shift thermodynamic
equilibrium. CO is regarded as the dominant reductant than C. Two-stage reactions – gasification
of carbon and reduction of ore by CO in a blast furnace are described as follows:
Preheated air and coke C + O2 → 2CO (Rxn. 2.1)
540 ~ 650 ºC 2CO → C + CO2 (Rxn. 2.2)
400 ~ 600 ºC 3Fe2O3 + CO → 2Fe3O4 + CO2 (Rxn. 2.3)
600 ~ 800 ºC Fe3O4 + CO → 3FeO + CO2 (Rxn. 2.4)
800 ~ 1100 ºC FeO + CO → Fe + CO2 (Rxn. 2.5)
900 ºC CaCO3 → CaO + CO2 (Rxn. 2.6)
Onset of slag formation at ~ 1100 ºC
CaO + SiO2 → CaSiO3 (Rxn. 2.7)
CaO + S + C → CaS + CO (Rxn. 2.8)
1200-1800 ºC FeO + C → Fe + CO (Rxn. 2.9)

12
CO2 + C → 2CO (Rxn. 2.10)
C + O2 → CO2 (Rxn. 2.11)
Different temperature and corresponding reaction sets of high to low range indicates divided
reaction zones existing in a blast furnace. Gasification of coke at the bottom concentrated with
higher temperature (1200 ~ 1800 ºC) provides activation heat necessary for endothermic indirect
reduction of iron oxides with CO in upper zones of lower temperature. The heat generated in the
exothermic reaction raises the temperature at the bottom of the furnace to 1800 ºC and the heat
absorbed in the endothermic reaction lowers the temperature of the top to 1300 ºC. These indirect
series of iron reduction predominates the iron formation from hematite and magnetite below 1000
ºC, also known as the Boudouard or carbon deposition reaction. Onset of direct reduction or known
as hearth reaction exist at about 1100 ºC and above, where FeO is in the liquid phase from its
melting point of 1370 ºC or above is directly reduced to form Fe by carbon (Hosford, 2013; Zhou,
2005).
2.1.3 Direct Reduced Iron
The most important and recently developed alternative to the blast furnace is the direct
reduction or direct smelting reduction of iron processes. DRI, also called sponge iron, is produced
from direct reduction of iron ores (usually in the forms of lumps, pellets, fines and even iron ore
tailings) by a reducing gas from different feedstock – natural gas or coal gasification. The reducing
agents are a mixture mainly of hydrogen and carbon monoxide. The basic principle is that DRI
retains the approximate porous shape and size of iron oxides fed to the process for one-step direct
conversion to iron. Iron reduction is accomplished by the same chemical reactions that occur in a
blast furnace (describe in 2.1.2), but metallic iron is produced by a series of reduction at

13
temperatures below the melting point of iron (1536 ºC) and carried out in reactions below
approximately 1000 ºC – the iron oxide reduced at 800-1050 ºC by interaction with reducing agents
(H2 + CO). DRI lumps, pellets, and cold-molded briquettes are three forms of iron raw feed. Cold-
molded briquettes are formed at a temperature less than 650 ºC. Hot briquetted iron is compacted
from DRI with enhanced physical characteristics. In particular, FINEX® which has been studied
in this work is one of recent DRI technologies being developed (McBride and Feinman, 2010;
Siemens, 2013).
2.2 Carbon Mineralization
Mineral carbonation includes in-situ and ex-situ processes. In-situ mineral carbonation is
integrating geological storage and underground mineral carbonation. Due to the very slow reaction
between minerals and CO2 in geological reservoir, the potential of carbon storage by in-situ
mineral carbonation is limited. Therefore ex-situ mineral carbonation is a more attractive process.
The most common candidate minerals in the earth’s crust are silicate minerals, especially
magnesium silicates (Krevor and Lackner, 2009). Silicate minerals can be carbonated, because
carbonic acid is stronger than silicic acid. Thus it is commonly accepted that magnesium silicate
minerals are the most suitable feedstock for carbon mineral sequestration.
Calcium silicate minerals are another type of media for mineral carbonation. However, the
global reserve of calcium silicates is far less than magnesium silicates. As mineral carbonation
occurs in nature, due to the high reactivity with CO2, most calcium silicate minerals are already
carbonated. Among the various silicate minerals, olivine, serpentine and wollastonite have been
studied most. Although serpentine is more difficult to be carbonated compared to olivine and

14
wollastonite, serpentine is considered to be the most useful silicate mineral for carbon mineral
sequestration due to its large global capacity (Sanna et al., 2014).
The main drawback of ex-situ mineral carbonation is the relatively slow kinetics. While some
studies are focused on developing or modifying the process routes, other studies are looking for
modifying the surface of the feedstock to increase the reaction rate. Most of the pre-treatment
methods have been focused on chemically or physically enlarging the surface area of minerals
(Huijgen and Comans, 2003, 2005b). In general, the overall process of ex-situ mineral carbonation
can be divided into two stages, dissolution of calcium or magnesium into the solution from the
minerals and the precipitation of calcium or magnesium carbonates from the solution. Direct
carbonation, which is also known as one-step carbonation, is a simple process pathway of mineral
carbonation. In direct carbonation, the dissolution and precipitation occur simultaneously.
On the other hand, the processes of mineral carbonation, which includes two or more stages,
is classified as indirect carbonation. Usually the process of indirect mineral carbonation can be
divided into dissolution and precipitation steps. By segregating the dissolution and precipitation
steps, it is easier to determine the optimal reaction condition for each, which results in the
enhancement of the overall reaction pace. Furthermore, enhancing catalysts or chelating agents for
dissolution and precipitation steps could be targeted separately. In direct mineral carbonation,
however, by combining the dissolution and precipitation together, one-step carbonation has to
compromise with conditions of solution pH and reaction temperature to accommodate both steps.
It is known that dissolution of silicate minerals favors low pH and high temperature conditions
(Sanna, 2014). However, the optimal condition for precipitation of carbonates from CO2 is high
pH and low temperature depending on the CO2 dissolution (Reid, 1987). Recently, the indirect
mineral carbonation process has attracted increased attention. However, since this process is
15
dominated by up front energy costs during the mineral processing and carbonation, the cost of
indirect mineral carbonation is still a challenge (Huijgen et al., 2007).
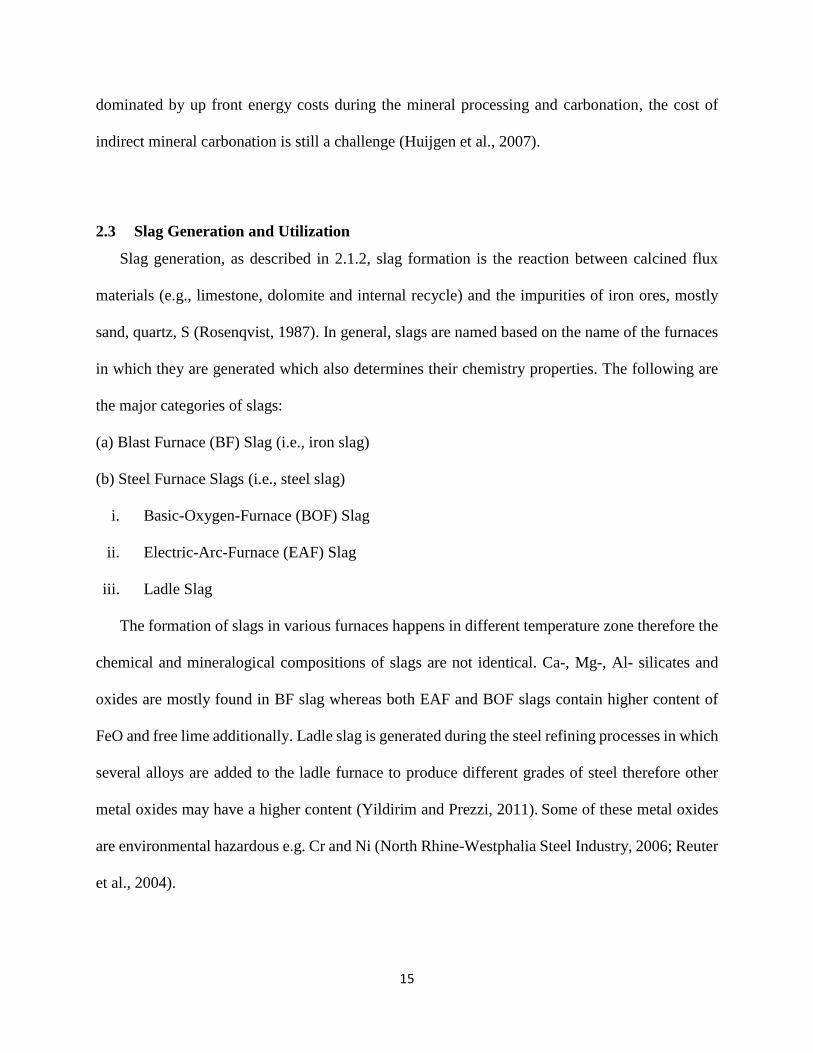
2.3 Slag Generation and Utilization
Slag generation, as described in 2.1.2, slag formation is the reaction between calcined flux
materials (e.g., limestone, dolomite and internal recycle) and the impurities of iron ores, mostly
sand, quartz, S (Rosenqvist, 1987). In general, slags are named based on the name of the furnaces
in which they are generated which also determines their chemistry properties. The following are
the major categories of slags:
(a) Blast Furnace (BF) Slag (i.e., iron slag)
(b) Steel Furnace Slags (i.e., steel slag)
i. Basic-Oxygen-Furnace (BOF) Slag
ii. Electric-Arc-Furnace (EAF) Slag
iii. Ladle Slag
The formation of slags in various furnaces happens in different temperature zone therefore the
chemical and mineralogical compositions of slags are not identical. Ca-, Mg-, Al- silicates and
oxides are mostly found in BF slag whereas both EAF and BOF slags contain higher content of
FeO and free lime additionally. Ladle slag is generated during the steel refining processes in which
several alloys are added to the ladle furnace to produce different grades of steel therefore other
metal oxides may have a higher content (Yildirim and Prezzi, 2011). Some of these metal oxides
are environmental hazardous e.g. Cr and Ni (North Rhine-Westphalia Steel Industry, 2006; Reuter
et al., 2004).

16
In terms of utilization, BF slags are divided into three categories by the way they are cooled –
air-cooled, granulated, and pelletized. Air-cooled slag is hard and dense and is especially suitable
for construction aggregate. It is also used in ready-mixed concrete, concrete products, asphaltic
concrete, road bases and surfaces, fill, clinker raw material, railroad blast, roofing, mineral wood
for insulation and soil conditioner or fertilizer. Granulated slag is sand-like glass particles and is
primarily used to make cementitious material. Concretes mixed with granulated slag generally
hydrate slower but with stronger long-term strength, reduced permeability and generally exhibit
better resistance to chemical attack. Pelletized slag has a volcanic rock texture and is mostly used
as lightweight aggregate, and it also shows cementitious properties if finely ground (Das et al.,
2007). The utilization of BOF and EAF slags (i.e., steel slags) has thus far been limited due to their
high content of FeO and free lime. Some of these slags are recycled internally in the steelmaking
furnace or sinter plant while roughly 50% of them are used for road construction (The European
Slag Association, 2006; Van Oss and Hendrik G., 2007; World Steel Association, 2010). However,
excessive steel slag generation, especially in China, is still a burden for the local stockpile and
landfill sites (Li et al., 2013).
The current development of mineral carbonation with alkaline industrial wastes raises one
attractive option of utilizing these steel slags. Due to the content of Ca- and Mg- silicate, oxide
and hydroxide in iron and steel slags, they could serve as alternatives to natural Ca- and Mg-
silicate minerals. In general, slags require grinding as the pretreatment before carbonation.
However, the cost of mining and transportation is eliminated since the carbonation facilities could
be close to the iron and steel making plants (Sanna et al., 2014). Because slags contain CaO and
are chemically instable due to their origin from the high temperature reactor, they tend to be more
reactive and thus the carbonation might consume less energy (Meima et al., 2002). In most cases,
17
carbonation of slag happened in slurry phases or elevated pressure and temperature (Bonenfant et
al., 2008; Chang et al., 2012, 2013; Uibu et al., 2011). Also, possible conversion of slag as
precipitated CaCO3 via two-step carbonation has been studied in various solution systems with
chelating agents which are applied to enhanced dissolution of natural minerals (Eloneva et al.,
2008; Kodama et al., 2008; Teir et al., 2007).
2.4 Research Objectives
The overall objective of this work is to develop a sustainable production system upon which
the overall material & energy utilization, carbon emission and waste valorization of iron making
could be optimized. The key research questions addressed by this study include:
• What is the electrostatic charging behavior of binary/quaternary particulate systems
containing different types of iron ore with limestone and dolomite?
• What is the entrainment behavior of fine iron ore tailings correlated to its particle-particle
interaction, electrostatics and chemical and physical properties?
• Can direct carbonated stainless steel slag be utilized as a filler material in cement mortar
after direct carbonation?
• What kind of chelating agent could enhance the dissolution of stainless steel slag via two-
step carbonation.
• Are carbonated stainless steel slag environmentally hazardous?

18
• Can the byproduct of two-step carbonation, Fe-based material, be used as catalyst for the
alkaline thermal treatment of biomass to H2?
• How can CCUS be integrated with slag utilization in iron and steel industry and cement
industry?

19
CHAPTER 3
DIRECT UTILIZATION OF INEXPENSIVE IRON ORE TAILINGS VIA
FLUIDIZED BED FOR DIRECT REDUCED IRONMAKING
The contents of this chapter titled “Electrostatic Charging and Entrainment Behaviors of Binary
and Quaternary Particulate Systems in Fluidized Beds” are to be submitted to the Journal of
Chemical Engineering Science (X.Z. Zhou, Y. Park, D.H. Lee and A.-H. A. Park).
Abstract
A number of commercial fluidization processes involve binary or quaternary particulate
systems with different particle sizes and densities. During the operation of multiphase systems
such as fluidized beds, electrostatic charges are generated primarily via triboelectric or frictional
charging due to the dielectric nature of materials. The accumulation of the electrostatic charge
within the system can impact the fluidization behavior and in some cases can be operationally
hazardous. In this study, the electrostatic charge generation and accumulation are investigated for
binary and quaternary particulate systems using a faraday cup system and an on-line electrostatic
probe system. Specifically, the effect of the addition of two different iron ore tailings (i.e., hematite
and magnetite) with coarse iron ores in the fluidized bed is studied in terms of particle-particle
interactions, electrostatics, and entrainment rates. The behaviors of different particulate systems
are found to highly depend on the chemical and physical properties of particles such as
composition, size, density, hydrophobicity/hydrophilicity, surface roughness and even magnetism.
The results suggest that the enhanced electrostatic forces between fine and coarse particles due to
the significant electrostatic charging during the fluidization can retain the fines to some extent until
the hydrodynamic force dominates. Sintering of fine particles on coarse ones also happens and

20
therefore the limited entrainment of iron ore tailings in the fluidized bed is not only because of the
intensified inter-particle forces but also the sintering effect.
3.1 Introduction
The world-wide trend towards sustainability imposes inevitable challenges to the iron and steel
making industry to consider the economic and environmental impact of their operation. The iron
and steel production is a highly energy-intensive process which makes this industry one of the
largest industrial sources of greenhouse gases (GHGs) emissions (IEA, 2008; U.S. EIA MECS,
2010; U.S. EPA, 2008a); therefore, an appropriate way to reduce the substantial amount of
pollutions including NOx and SOx as well as GHGs, must be achieved. In order to reduce the
emissions associated with the iron and steel production, various processes have been developed so
far (EMEP/EEA, 2009; U.S. EPA, 2012).
Recently developed FINEX® technology is a molten iron production process utilizing fluidized
bed and melter-gasifier technologies (Siemens, 2013), whereas the conventional iron production
involves two steps of (i) coke and sinter processing in a coking plant and a sinter plant, and (ii)
iron reduction in a blast furnace (Bugayev et al., 2001). The novel technology allows the direct
production of molten iron using inexpensive iron ore tailings and non-coking coal, since the syngas
derived from the coal gasification is applied as the reducing agent for the purpose of generating
direct reduced iron (DRI) during a gas-solid reaction in the fluidized bed. The DRI is then hot-
compacted and smelted in the melter-gasifier. By eliminating the preliminary processing in the
coking and sintering plants, this process produces less pollutant than traditional methods. For
example, the remaining gas exiting from the fluidized beds can be used to generate power and be
integrated with the carbon capture, utilization and storage (CCUS) technology to further reduce

21
the overall GHGs emissions (IPCC, 2005). In addition, NOx emission can be prevented due to the
reducing environment of the metallurgical reactions unlike the oxidizing environment inherent in
the coke oven and sinter plant (Energetics Incorporated, 2000). Furthermore, SOx derived from the
coal utilization can be eliminated by binding with the limestone and dolomite during the reaction.
Practically, a higher percentile of the fine particles (i.e., iron ore tailings) is favored because it
is cheaper than coarse particles (i.e., bulk and fine iron ore). So fine particles are often mixed with
coarse ones as well as limestone and dolomite at various ratios to form the feedstock for DRI
production. Therefore, the challenge of this novel technology arises from the entrainment of fine
particles occurring during the gas-solid fluidization. Although the gas-solid fluidization is a
common process found in many chemical industries (Sowinski et al., 2010) and the entrainment
phenomenon of fine particles has been studied over a half century (Li and Kato, 2001; Smolders
and Baeyens, 2001; Wen and Hashinger, 1960), the entrainment behavior associated with the
electrostatic force has not been fully investigated in the DRI production process.
The electrostatic charges are generated by continuous particle-to-particle and/or particle-to-
wall collision and, more specifically, triboelectrification, frictional charging, ion collection and
thermionic emission have been determined to be the major types of electrostatic charging in gas-
solid fluidized beds (Cross, 1987; Park and Fan, 2007). The presence of electrostatic charging
phenomenon is quite significant in the operation of the multiphase system such as fluidized beds.
For example, the existence of the electrostatic charges is known to have profound impact on the
hydrodynamics, bubble size and shape, particle mixing rate, fines elutriation, etc (Briens et al.,
1992; Hendrickson, 2006; Park et al., 2002a). Thus, the occurrence of the electrostatic charging
can be one of the major factors influencing the operation of this iron making fluidized bed system.
22
In this study, the fluidization behavior of the binary and quaternary particulate systems
including iron ore fine particles were investigated in a cold state, focusing on the entrainment
phenomenon associated with electrostatic charging. The charge transfer rate, induction charge and
entrainment of mixed iron ores were studied in the fluidized bed system. The effects of the
particulate mixtures’ properties, including the electrostatic charging behavior by mixing, on the
entrainment rates were also examined. Finally, a preliminary sintering test was investigated to
mimic the particles in the actual metallurgical condition of DRI process.
3.2 Experimental
3.2.1 Procurement and characterization of minerals
Table 3.1. Chemical compositions of the procured minerals used in this study analyzed by XRF.
Mineral SiO2% Al2O3 % Fe2O3 % MgO % CaO % Fe2+ as
FeO %
PBR 3.38 2.15 86.4 0.07 0.03 0.28
NMP 2.27 0.48 95.5 0.04 0.14 0.58
BSP 6.52 0.40 93.9 0.32 0.19 27.38
Limestone 1.55 0.50 1.03 3.92 49.6 0.50
Dolomite 0.47 0.19 0.37 20.6 30.2 0.27
Three types of iron ores − PBR, NMP, and BSP named after the abbreviation of each original
mine, which were used for the iron production at POSCO − and two carbonates − dolomite and
limestone − were used for the experiment. The weight and volume of each mineral were measured
to determine their density. All the minerals were weighed before and after the vacuum drying for
10 hours at 70 ˚C in order to obtain the inherent moisture content. After the air drying overnight,
the particle size distribution was obtained by performing a laser diffraction measurement (LSTM
13320 MW, Beckman Coulter Inc., Brea, CA), and by sieving with a series of mesh sieves ranging
from 10 µm to 3.3 mm (Series 04-881, Thermo Fisher Scientific Inc., Madison, WI). In order to

23
study the particles in a narrow size range with the ratio of average particle size between coarse and
fine particles fixed, PBR, dolomite and limestone were sieved using the 589 µm and 1400 µm
mesh sieves, and NMP and BSP, which are used as fine particles (dp < 106 µm), were sieved using
106 µm mesh sieve. All the sieved samples were dried for 5 hours at 70 ˚C and stored securely in
a dry environment. The compositions of the minerals used in this study were measured via X-ray
fluorescence (XRF), as shown in Table 3.1. The crystal structures of the minerals were identified
by a X-ray diffractometer (XRG-3000, Inel Inc., Stratham, NH) shown in Figure 3.1. The surface
area was measured using a BET analyzer (NOVA-2000, Quantachrome Corp., Boynton Beach,
FL). The water absorption measurements were also conducted to characterize the hydrophilicity
or hydrophobicity of the minerals used in this study by employing the method reported by Fang
(Fang et al., 2010). Morphologies of mineral samples were observed by a scanning electron
microscope (JSM 5600LV, JEOL Ltd., Japan).

24
Figure 3.1. X-ray diffraction pattern of the procured minerals used in this study analyzed by XRD.
3.2.2 Experimental setup
A fluidized bed reactor was constructed of polycarbonate to simulate the direct reduced iron
making process (Figure 3.2). This system composed of a cold mist generator, a fluidized bed, and
a particle collection system. Pressure transducers (PX419-001G5V, Omegadyne Inc., Sunbury,
OH) were installed above and below the gas distributor to measure the pressure drop with the top
one immersed in the particles. The gas distributor was made by filling the wind box with
polyethylene spheres to distribute the gas on the porous base. At the same level of the top pressure
transducer but opposite to it, an electrostatic probe (Correstat 3410, Progression Inc., Haverhill,
MA) was installed to measure the electrostatic current in the fluidized bed. The laboratory
compressed air with controlled humidity by a lab-fabricated cold mist generator was applied

25
throughout the experiment with humidity measured by a hygrometer (TPI 597, Test Products
International, Inc., Beaverton, OR). Overall, this laboratory-built system facilitated the
simultaneous online measurements of pressure, electrostatic current and fluidizing gas humidity
while periodically collecting entrained particles.
In order to evaluate the electrostatic charge associated with the particle mixing, a faraday cup
system was fabricated as shown in Figure 3.3 (a). A stainless steel faraday cup was connected to a
grounded digit Picoammeter (Model 6485, Tektronix Inc., Beaverton, OR). The Picoammeter
measures the signal at speeds up to 1000 Hz, ranging from 20 fA to 20 mA with 10 fA resolution.
Since the charged particulate flow via a mixer/mill which was transferred into the faraday cup right
after its mixing could form short-term current due to the dissipation of the charge through the
faraday cup to the ground, the Picoammeter in the circuit could accurately capture the current
signal while being synchronized with a computing system.
The electrostatic probe system was fabricated similarly to that reported by Park et al (Park et
al., 2002b) (Figure 3.3 (b)). Briefly, the insulated probe made of stainless steel
(a)

26
Figure 3.2. Illustration of the fluidization system including cold mist generator, fluidized bed,
particle collection apparatus, and data acquisition system.
captures (i) a direct current (DC) component derived from the striking of particles on the probe
which was proportional to the mass flow, (ii) a low-frequency alternating current (AC) component
induced by particulates passing by the probe in a nearby domain but not interacting with the probe
and short-term intermittent variations or fluctuations in the particulate mass flow, and (iii) a high-
frequency AC component which was the high-frequency modulation resulting from equipment,
vibration and other factors (Ramsay, 1998). The high-frequency AC component, or so-called high
frequency impedance, had to be filtered, and thus Gas Discharge Tubes (GDTs) were installed in
routes 1 and 2 of the electrical circuit as shown in Fig 3.3 (b) (Rosen, 2000). The measured signal
was a voltage containing only the DC component and the low-frequency AC component.
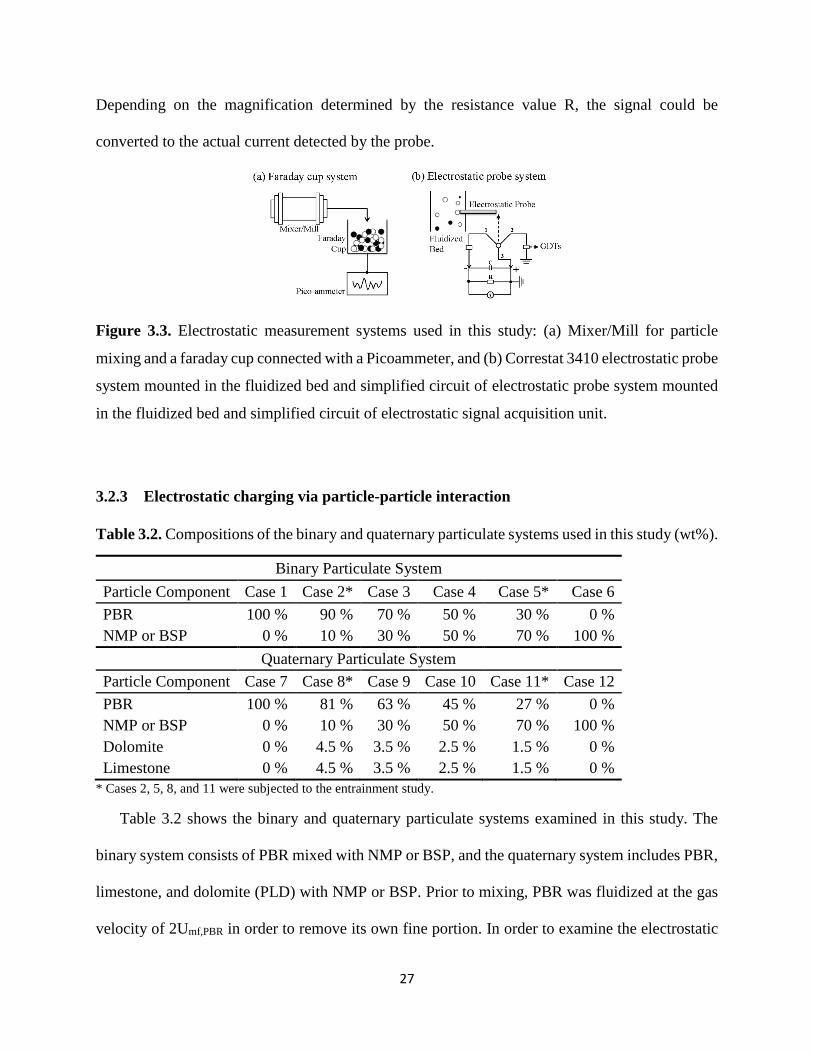
27
Depending on the magnification determined by the resistance value R, the signal could be
converted to the actual current detected by the probe.
Figure 3.3. Electrostatic measurement systems used in this study: (a) Mixer/Mill for particle
mixing and a faraday cup connected with a Picoammeter, and (b) Correstat 3410 electrostatic probe
system mounted in the fluidized bed and simplified circuit of electrostatic probe system mounted
in the fluidized bed and simplified circuit of electrostatic signal acquisition unit.
3.2.3 Electrostatic charging via particle-particle interaction
Table 3.2. Compositions of the binary and quaternary particulate systems used in this study (wt%).
Binary Particulate System
Particle Component Case 1 Case 2* Case 3 Case 4 Case 5* Case 6
PBR 100 % 90 % 70 % 50 % 30 % 0 %
NMP or BSP 0 % 10 % 30 % 50 % 70 % 100 %
Quaternary Particulate System
Particle Component Case 7 Case 8* Case 9 Case 10 Case 11* Case 12
PBR 100 % 81 % 63 % 45 % 27 % 0 %
NMP or BSP 0 % 10 % 30 % 50 % 70 % 100 %
Dolomite 0 % 4.5 % 3.5 % 2.5 % 1.5 % 0 %
Limestone 0 % 4.5 % 3.5 % 2.5 % 1.5 % 0 %
* Cases 2, 5, 8, and 11 were subjected to the entrainment study.
Table 3.2 shows the binary and quaternary particulate systems examined in this study. The
binary system consists of PBR mixed with NMP or BSP, and the quaternary system includes PBR,
limestone, and dolomite (PLD) with NMP or BSP. Prior to mixing, PBR was fluidized at the gas
velocity of 2Umf,PBR in order to remove its own fine portion. In order to examine the electrostatic
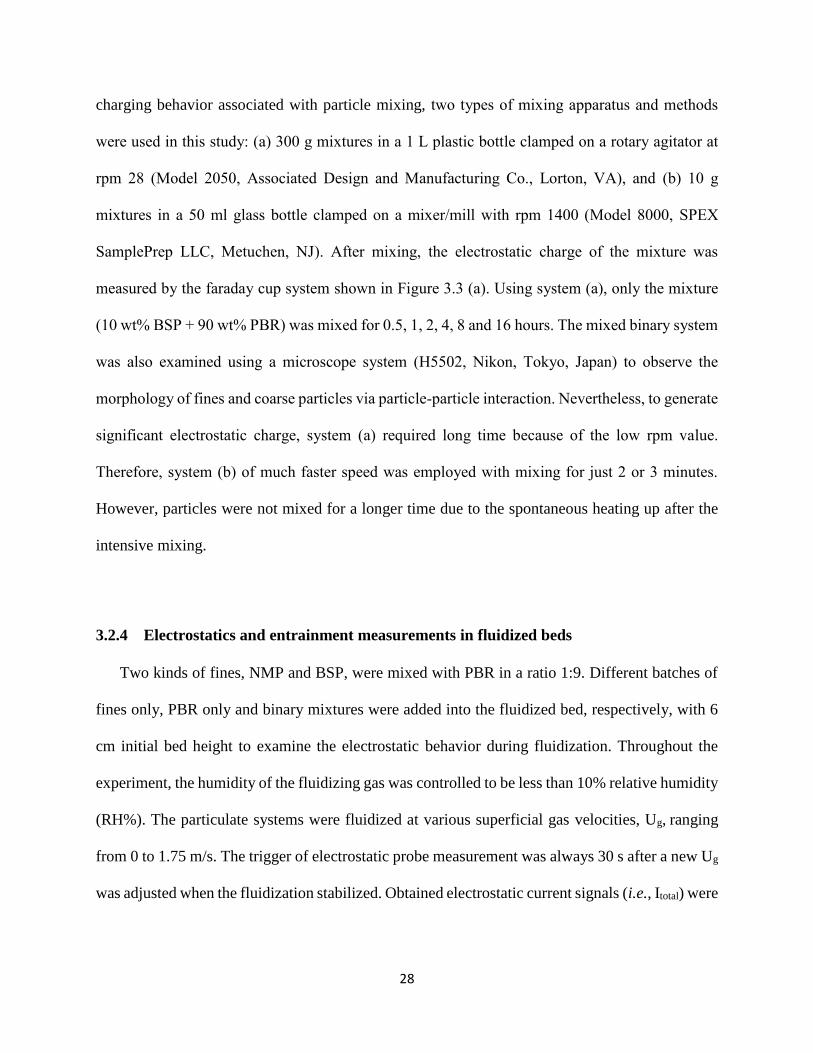
28
charging behavior associated with particle mixing, two types of mixing apparatus and methods
were used in this study: (a) 300 g mixtures in a 1 L plastic bottle clamped on a rotary agitator at
rpm 28 (Model 2050, Associated Design and Manufacturing Co., Lorton, VA), and (b) 10 g
mixtures in a 50 ml glass bottle clamped on a mixer/mill with rpm 1400 (Model 8000, SPEX
SamplePrep LLC, Metuchen, NJ). After mixing, the electrostatic charge of the mixture was
measured by the faraday cup system shown in Figure 3.3 (a). Using system (a), only the mixture
(10 wt% BSP + 90 wt% PBR) was mixed for 0.5, 1, 2, 4, 8 and 16 hours. The mixed binary system
was also examined using a microscope system (H5502, Nikon, Tokyo, Japan) to observe the
morphology of fines and coarse particles via particle-particle interaction. Nevertheless, to generate
significant electrostatic charge, system (a) required long time because of the low rpm value.
Therefore, system (b) of much faster speed was employed with mixing for just 2 or 3 minutes.
However, particles were not mixed for a longer time due to the spontaneous heating up after the
intensive mixing.
3.2.4 Electrostatics and entrainment measurements in fluidized beds
Two kinds of fines, NMP and BSP, were mixed with PBR in a ratio 1:9. Different batches of
fines only, PBR only and binary mixtures were added into the fluidized bed, respectively, with 6
cm initial bed height to examine the electrostatic behavior during fluidization. Throughout the
experiment, the humidity of the fluidizing gas was controlled to be less than 10% relative humidity
(RH%). The particulate systems were fluidized at various superficial gas velocities, Ug, ranging
from 0 to 1.75 m/s. The trigger of electrostatic probe measurement was always 30 s after a new Ug
was adjusted when the fluidization stabilized. Obtained electrostatic current signals (i.e., Itotal) were

29
split into DC and AC (maximum) represented as the slope of the fitting curve of accumulated
electrostatic charge and standard deviation of Itotal, respectively, shown in Figure 3.4.
Figure 3.4. Electrostatic signals of PBR particulate system at Ug = 0.92 m/s for 30 s measured by
the Correstat 3410 electrostatic probe: (a) Raw data of electrostatic current, and (b) Integration of
electrostatic current to accumulated electrostatic charge with the slope of the fitting curve
representing the charge transfer rate.
In Table 3.2, only the particulate mixture groups containing 10 wt% and 70 wt% of fines (cases
2, 5, 8, and 11) were subject to the entrainment study. Two kinds of fine/coarse particle ratios were
applied: 1:9 and 7:3. The particulate systems were added up to 6 cm initial bed height and then
fluidized at fixed fluidizing gas velocity, 0.75 m/s, which was the minimum fluidization velocity

30
of PBR (Umf, PBR). Entrained particles were collected and weighed every 30 s in the first 2 minutes
and then at 5 minutes. Each batch with the same particulate component was repeated three times.
3.3 Results and discussion
3.3.1 Physical and chemical properties of minerals
Table 3.3. Physical and chemical properties of minerals used in this study.
Minerals Major chemical
component
Particle
density
[kg/m3]
Moisture
content
[wt%]
Surface
area
[m2/g]
H2O
adsorption
constant
[mol/m2]
Contact
angle
[˚]
PBR Fe2O3 3509 7.59 6.96 5.47E-3 881
NMP Fe2O3 4711 5.88 0.79 1.13E-2 702
BSP Fe3O4 3117 2.94 1.03 1.92E-3 107~1103
Dolomite CaMg(CO3)2 2687 2.78 0.28 1.10E-1 284
Limestone CaCO3 2478 3.17 0.24 8.85E-2 40~445 1(Crawford and Ralston, 1988), 2(Kvitek et al., 2002), 3(Gray et al., 1994), 4(Mittal, 2009) and 5(Fort et al., 2006).
In order to estimate on the dielectric constant, hydrophilicity and minimum fluidization
velocity of each mineral, the particles’ fundamental properties such as major components, particle
densities, H2O adsorption constants, and particle size distributions were measured. The major
components of the materials were identified by XRF and XRD measurements (Table 3.3). PBR
and NMP contained predominantly hematite (Fe2O3), 86.4 wt% and 95.5 wt%, respectively. NMP
was more concentrated than PBR therefore it had higher density. The major component of BSP
was magnetite (Fe3O4), 63.48 wt% Fe2O3 and 27.38 wt% FeO, which had a lower iron
concentration than hematite, and therefore resulted in a lower density of 3,117 kg/m3. Dolomite
corresponded to calcium and magnesium carbonate with 20.6 wt% MgO and 30.2 wt% CaO, while
limestone corresponded to calcium carbonate with 49.6 wt% CaO, both of which were lighter than
the iron ore particles with densities of 2,687 kg/m3 and 2,478 kg/m3, respectively.

31
Since electrostatic charging phenomenon is quite sensitive to the surface conductivities of
particles being mixed or fluidized (Moughrabiah et al., 2012; Park et al., 2002a), all the
experiments in this study were performed in dry conditions with less than 10 RH% as reported
previously. However, even at the low relative humidity, some materials such as limestone are
known to absorb moisture easily from the fluidizing gas during fluidization (Vutukuri, 1974), and
thus it could increase the surface conductivity of the particles (Ciborowski and Wlodarski, 1962;
Katz and Sears, 1969). A series of water absorption tests were performed for all the minerals in
order to characterize their relative hydrophobicity or hydrophilicity. The absorption tests were
performed via a two-step process previously reported by Fang et al (Fang et al., 2010). In the first
step, a blank water vapor saturation curve was obtained under ambient conditions, by monitoring
the pressure at a constant temperature, in an empty sample chamber. In the second step, a sample
was placed in the chamber and the water vapor saturation curve was acquired similarly to the first
step. The amount of water absorbed on the sample was then derived using the ideal gas law
Equation 3.1:
ΔP × V = Δ n × R × T (Eq. 3.1)
where ΔP represents the pressure difference between the two experimental steps, V is the volume
of the experimental chamber, Δn is the number of moles of water absorbed on the surface of the
sample, R is the gas constant, and T is the chamber temperature. Eventually, the adsorption
constant is represented as mole/m2 by normalizing to the surface area of each sample. Comparing
the adsorption constant of each sample in Table 3.3, the relative hydrophilicity and hydrophobicity
sequence is listed as following; dolomite > limestone > NMP > PBR > BSP with dolomite being
the most hydrophilic and BSP the most hydrophobic. Contact angle is another parameter to
estimate material’s wettability. More hydrophilic material exhibits smaller contact angle, while

32
hydrophobic one shows large contact angle. Reported contact angles of all the minerals are listed
in Table 3.3, and the tendency agrees with the result of the absorption test.
Figure 3.5 (a) shows the particle size distribution of each mineral sample by the laser
diffraction. The laser diffraction measures particle size distributions by measuring the angular
variation in intensity of light scattered as the laser beam passes through dispersed particulate
samples of different sizes. The angular scattering intensity data is then analyzed to calculate the
size of the particles using the Mie theory of light scattering (Malvern, 2015). The particle size is
reported as a volume equivalent sphere diameter in volume fraction by default. It was found that,
by volume percentage, over 90% of dolomite was larger than 1 mm, 50% of limestone was between
1 mm and 3 mm and PBR had the broadest size distribution among all ranging from < 50 µm to >
3 mm. For the fines, NMP and BSP particles were mostly smaller than 100 µm with less than 15%
by volume larger than 100 µm. In this study, the fluidized bed was designed to mimic the industrial
system, but the maximum superficial gas velocity was limited by the compressed air pressure of
5.5 atm. Therefore, the designed bench-scale fluidized beds cannot process particles of several
millimeters. Broad particle size distributions would also make investigating the effect of particle
size on electrostatic charging and fluidization behaviors excessively complicated. Therefore, all
the above minerals were sieved with appropriate size fractions in order to better understand the
mechanisms of electrostatic charging and fluidization characteristics. Figure 3.5 (b) depicts the
particle size distributions of five mineral samples after size reduction. The average particle size of
PBR, dolomite and limestone were found to be ~1 mm defined as coarse particles, while those for
NMP and BSP were both about 50 µm in average noted as fine particles in Figure 3.5 (a). Sieved
PBR still had 10% fine particles from 0.3 µm to 25 µm and almost all the sieved NMP was between
10 µm and 200 µm but sieved BSP had 12.5% fines smaller than 10 µm. Nearly all the dolomite

33
was between 300 µm and 2000 µm, but roughly 5% of limestone was in the range of 200 µm to
300 µm. These size-reduced minerals were used throughout this study.
Figure 3.5. Particle size distributions of minerals: (a) as received and (b) after size reduced. Inset:
Geldart’s particle classification (Geldart, 1973).
According to Geldart’s particle classification (Figure 3.5 (b) inset) (Geldart, 1973), which
basically predicts the fluidization behavior of particles, PBR are mostly Group D particles (i.e.,
spoutable powder) before and after size reduction. BSP are partly Group B particles (i.e., sandlike
powder) before sieving, and partly Group A particles (i.e., aeratable powder) after sieving. NMP
are considered as partly Group B particles before and after sieving. However, both size-reduced
NMP and BSP are located in the region where the transition between Group A and B occurs so
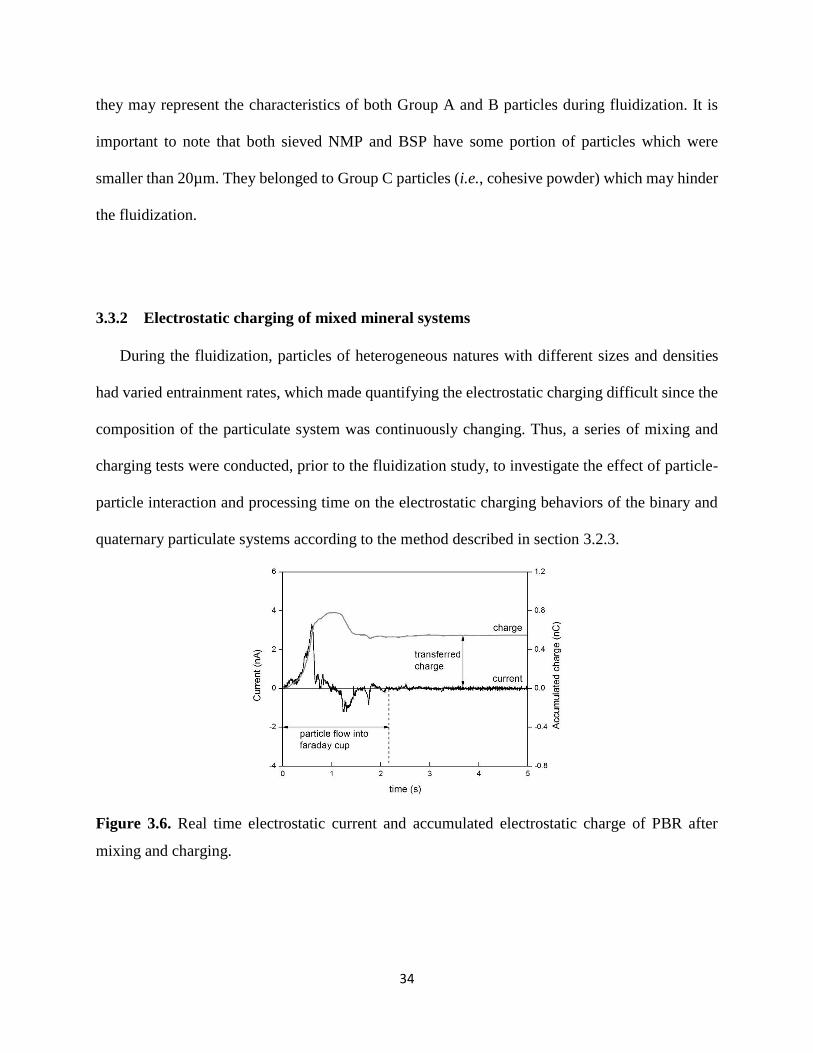
34
they may represent the characteristics of both Group A and B particles during fluidization. It is
important to note that both sieved NMP and BSP have some portion of particles which were
smaller than 20µm. They belonged to Group C particles (i.e., cohesive powder) which may hinder
the fluidization.
3.3.2 Electrostatic charging of mixed mineral systems
During the fluidization, particles of heterogeneous natures with different sizes and densities
had varied entrainment rates, which made quantifying the electrostatic charging difficult since the
composition of the particulate system was continuously changing. Thus, a series of mixing and
charging tests were conducted, prior to the fluidization study, to investigate the effect of particle-
particle interaction and processing time on the electrostatic charging behaviors of the binary and
quaternary particulate systems according to the method described in section 3.2.3.
Figure 3.6. Real time electrostatic current and accumulated electrostatic charge of PBR after
mixing and charging.

35
Figure 3.6 shows the real time electrostatic current signal of charged PBR transferred into the
faraday cup, captured by the Picoammeter and the accumulated charge was converted using
Equation 3.2:
Q = I × t (Eq. 3.2)
where Q, I, and t represent the charge, current, and time, respectively. The time was accounted
since the particle flow entered the faraday cup promptly after the mixing until the charge was fully
dissipated which was about 6 s or less. In Figure 3.6, there was one large positive peak and the
other small negative peak including the static charge carried by the mixed particles and the
induction charge induced by the operator when entering and leaving the zone where the
electrostatic charge measured would be affected. By accumulating the current signal, these induced
signals derived from both the operator and the environmental fluctuation could be filtered, leaving
only the charge transferred from the charged particulate flow which was about 0.44 nC for the
PBR (Park et al., 2002b).
Figure 3.7 shows the summary of the total transferred charge of each binary and quaternary
particulate system listed in Table 3.2 mixed by the system (b) in section 3.2.3. The NMP or BSP
only particulate systems did not gain significant static charges after mixing. This observation was
not in agreement with the hypothesis that the smaller is the particle size of the particulate system,
the higher the static charges of Group B and Group A particles generated (Moughrabiah et al,
2012). This apparent contradiction may be due to the fact that the same composition of the particles
in the NMP or BSP only systems with a small range of particle size distribution could barely
generate high electrostatic charge similar to the result reported by Lacks and Sankaran (Lacks and
Sankaran, 2011). Another reason could be the agglomeration of fine particles, thereby inhibiting
the electrostatic charging (Fan and Zhu, 1998). However, for the purpose of this study, the constant
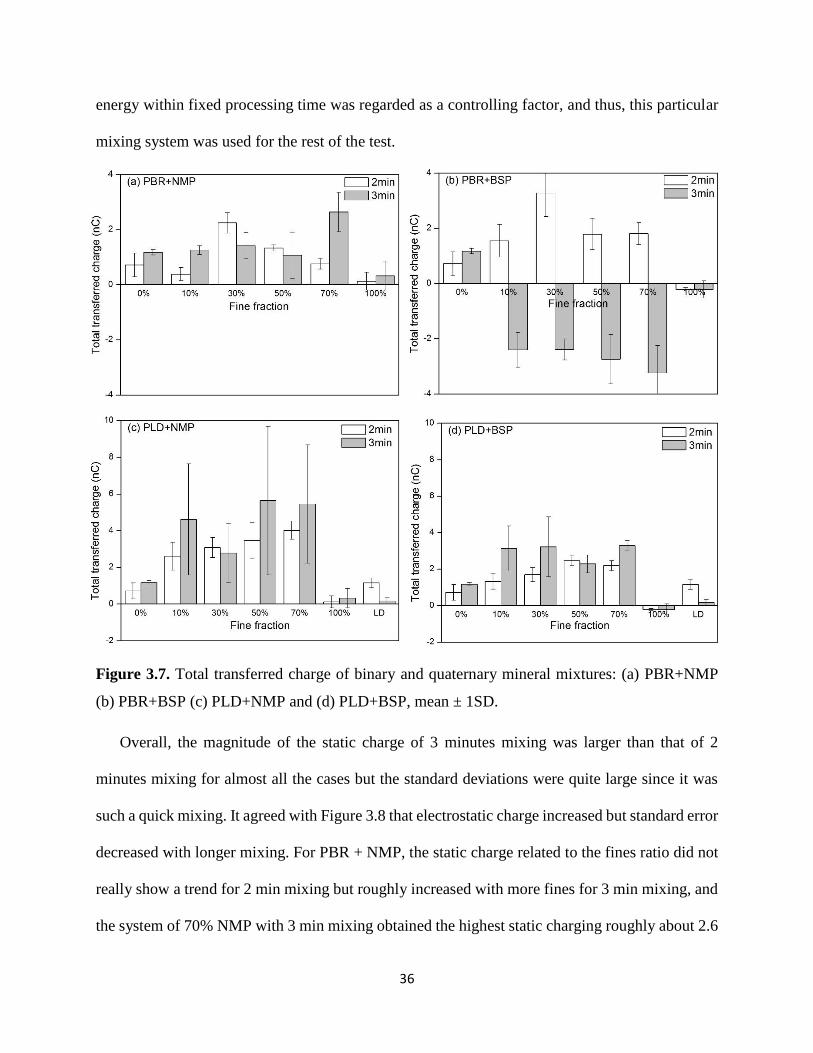
36
energy within fixed processing time was regarded as a controlling factor, and thus, this particular
mixing system was used for the rest of the test.
Figure 3.7. Total transferred charge of binary and quaternary mineral mixtures: (a) PBR+NMP
(b) PBR+BSP (c) PLD+NMP and (d) PLD+BSP, mean ± 1SD.
Overall, the magnitude of the static charge of 3 minutes mixing was larger than that of 2
minutes mixing for almost all the cases but the standard deviations were quite large since it was
such a quick mixing. It agreed with Figure 3.8 that electrostatic charge increased but standard error
decreased with longer mixing. For PBR + NMP, the static charge related to the fines ratio did not
really show a trend for 2 min mixing but roughly increased with more fines for 3 min mixing, and
the system of 70% NMP with 3 min mixing obtained the highest static charging roughly about 2.6

37
nC in average. For PBR + BSP, the phenomenon was particularly interesting. After mixing, PBR
only and BSP only exhibited positive charge and negative charged, respectively. When PBR and
BSP were mixed at different ratios, the particle systems were all positively charged with 2 minute
mixing. On the contrary, those were all negatively charged with 3 minute mixing. This indicated
that the charge generation and dissipation mechanism of BSP was different from NMP when they
were mixed with PBR considering that their compositions were different. When limestone and
dolomite were added, the static charges of quaternary systems were increased for the mixture
containing NMP, whereas the polarity of the static charges for BSP containing mixtures all turned
positive with slightly increased absolute static charging magnitude. With same fine fractions, the
electrostatic charge of binary mixtures with BSP was higher than those of binary mixtures
containing NMP whereas it was an opposite trend when dolomite and limestone were added.
Nevertheless, for both binary and quaternary system, the differences of average total transferred
charge of mixtures with the same fine ratio but different fines were smaller than 1 nC, i.e. less than
25% of their total static charge.
Figure 3.8. Change of the electrostatic charge (average ± 1SD) of PBR/BSP (90/10) binary
mixture, mixed by the system (a) in section 2.3, as a function of mixing time.

38
3.3.3 Fluidization and electrostatic behaviors of binary system
Figure 3.9. (a) Pressure drop of fluidization systems of PBR, NMP, and PBR+NMP (90/10) (0 ~
4 zones), (b) Pressure drop of fluidization systems of PBR, BSP, and PBR+BSP (90/10) and (c)
Predicted particle-particle interaction model of PBR and NMP. Filled circle indicates PBR
particles and empty circle indicates NMP particles.

39
The particulate systems of PBR only (case 1), NMP or BSP only (case 6), and binary mixtures
of PBR (90 wt%) with NMP or BSP (10 wt%) (case 2) in Table 3.2 were subjected to the
fluidization test. Their pressure drop, standard deviation of pressure, electrostatic current and its
standard deviation during fluidizations were measured shown in Figure 3.9, Figure 3.10 and Figure
3.11, respectively. According to Figure 3.9 (a), based on the first peak, the minimum fluidization
velocity of PBR was 0.75 m/s (Fan and Zhu, 1998). Since both of the sieved NMP and BSP partly
contained Group C particles, NMP only and BSP only particulate systems started spraying at
superficial gas velocities of 0.003 m/s and 0.006 m/s shown in Figure 3.9 (a) and Figure 3.9 (b),
respectively, and both systems were hard to fully fluidize. Figure 3.9 (c) shows the particle-particle
interaction model of PBR and NMP. The fluidization of the binary system could be distinguished
in five phases (Zone 0 ~ 4) and the case of PBR and BSP was quite similar according to
experimental observation. The feature of each zone was as following: Zone 0, PBR and NMP were
well mixed prior to experiment; Zone 1, NMP and PBR segregated with NMP moving upward and
PBR fixed, and layers of NMP and PBR formed; Zone 2, NMP above PBR layers fluidized and
entrained with PBR fixed; Zone 3, PBR fluidized and the entrainment of NMP continued; Zone 4,
NMP was almost entrained.
According to the fluidization features of different particulate systems, significant charge
transfer rate and standard deviation of Itotal were observed only after 0.75 m/s for PBR shown in
Figure 3.11. However, for NMP, the charge transfer rate quickly increased from 0 nC/s to 2 nC/s
when Ug was up to 0.15 m/s and started decreasing from 0.15 m/s to 0.35 m/s (Figure 3.11 (a)).
For BSP, the charge transfer rate initially was of positive polarity but became negative with
increasing magnitude as the Ug increasing from 0 m/s to 0.35 m/s (Figure 3.11 (b)). This is in
agreement with the results of Figure 3.7 showing that NMP and BSP would be charged with

40
Figure 3.10. Standard deviation of pressure drop of (a) PBR, NMP, and PBR+NMP (90/10) and
(b) PBR, BSP, and PBR+BSP (90/10).
opposite polarities. Oguchi and Tamatani studied the electrostatic charging for metal oxide
insulator and concluded that the charge to mass ratio of particles shifted linearly towards a negative
direction with an increase in the normalized electronegativity (Oguchi and Tamatani, 1993).
Although the nature of its electrostatic charging was not fully understood, it was believed that the
different polarities were related to their composition difference, and therefore their different
electronegativity. Regarding the standard deviation of Itotal, it kept increasing for both NMP and
BSP systems and the value was slightly higher for BSP than for NMP (Figure 3.11, insets).
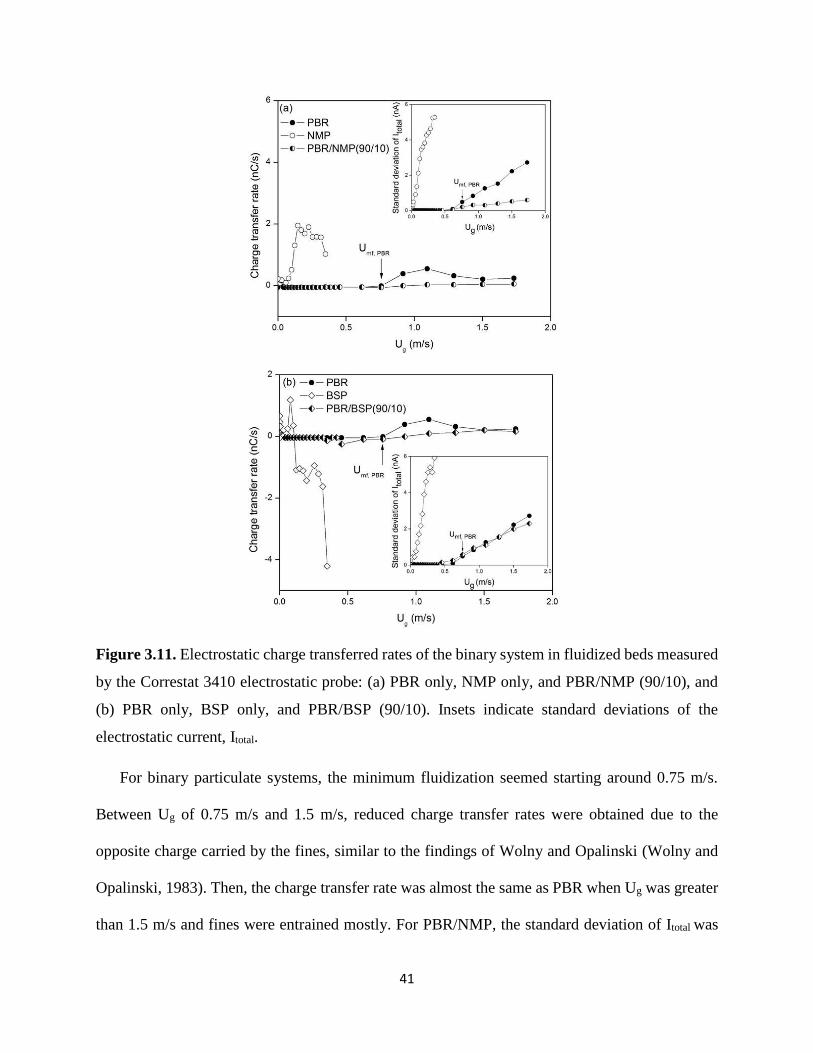
41
Figure 3.11. Electrostatic charge transferred rates of the binary system in fluidized beds measured
by the Correstat 3410 electrostatic probe: (a) PBR only, NMP only, and PBR/NMP (90/10), and
(b) PBR only, BSP only, and PBR/BSP (90/10). Insets indicate standard deviations of the
electrostatic current, Itotal.
For binary particulate systems, the minimum fluidization seemed starting around 0.75 m/s.
Between Ug of 0.75 m/s and 1.5 m/s, reduced charge transfer rates were obtained due to the
opposite charge carried by the fines, similar to the findings of Wolny and Opalinski (Wolny and
Opalinski, 1983). Then, the charge transfer rate was almost the same as PBR when Ug was greater
than 1.5 m/s and fines were entrained mostly. For PBR/NMP, the standard deviation of Itotal was

42
always lower than PBR starting from the minimum fluidization and it was negligible before that.
However, for PBR/BSP, the standard deviation was slightly higher than PBR from 0.5 m/s to 1
m/s and it became a little bit lower than PBR afterwards. Standard deviations of ΔP and Itotal were
related to the bubble size reported by Park et al (Park et al., 2002b; Park and Fan, 2007). Therefore
the above results could be driven by the average bubble size of PBR/NMP being smaller than those
of PBR/BSP and PBR only. Furthermore, stronger inter-particle forces between PBR/BSP than
PBR/NMP were proposed because the bubble broke up easier in the PBR/NMP system than the
PBR/BSP system at the same Ug.
Overall, in the slow superficial gas velocity range, the significant charge transfer of fines was
eliminated in the binary systems. Fines were attracted to coarse particles and did not fluidize
separately due to the electrostatic forces, though other factors may influence the phenomenon (the
very fine particles may agglomerate), too, The fluidization behaviors of binary particulate systems
were changed compared to the system of coarse particle only due to the inter-particle forces.
Nevertheless, to some extent, the hydrodynamic force overtook the electrostatic forces between
fine and coarse particles or the cluster of very fine particles broke. That was why the charge transfer
rates of binary systems were almost the same as the PBR when the fluidizing gas was fast enough
since the majority of fines had been entrained. Therefore, to eliminate the entrainment during
fluidization, optimal gas velocity and appropriate fraction of fines should be considered. In order
to further understand the entrainment mechanism, other inter-particle forces should also be
evaluated, such as Van der Waals force.

43
3.3.4 Entrainment behaviors of binary/quaternary fluidization systems
Entrainment tests were performed by examining the fine particles elutriated from binary and
quaternary systems in ambient condition. The mixtures were prepared according to Table 3.2 but
only fine fractions of 10% and 70% were utilized (cases 2, 5, 8, and 11).
Figure 3.12. Initial entrainment of the binary/quaternary systems with Ug = Umf,PBR = 0.75m/s:
(a) 10% NMP, (b) 70% NMP, (c) 10% BSP and (d) 70% BSP, mean ± 1SD.
As shown in Figure 3.12, within two minutes, for both the binary and the quaternary mixtures
containing NMP or BSP, the particulate systems with 10 wt% fines (Figure 3.11 (a) & (c)) had a
higher entrainment rate than the ones with 70 wt% fines (Figure 3.11 (b) & (d)) every 30 s.
44
Particulate systems containing BSP always had lower entrainment rate than the ones with NMP.
For the particulate systems of 10 wt% fines, adding dolomite and limestone increased the
entrainment rate for both NMP and BSP containing quaternary systems compared to binary ones.
However, for the particulate systems of 70% fines, the entrainment rate of quaternary systems were
slightly less than the binary ones. All the above trends could be extended to 5 minutes except the
case of 70 wt% BSP + 30 wt% PBR. Comparing the total transferred charges for binary systems
in Figure 3.7 (discussed in section 3.3.2), mixtures with BSP had higher electrostatic charge than
the ones with NMP. BSP was also the most hydrophobic one, which may lead to a slower
discharging than others. Therefore, stronger electrostatic forces may exist between BSP and PBR
particles than between NMP and PBR particles. This could explain the lower entrainment rate of
BSP containing systems than the NMP containing ones. On the other hand, 12.5% of the sieved
BSP particles were smaller than 10 µm and belonged to Group C particles which could easily be
attached to PBR or form clusters due to adhesion (Geldart, 1986). This was why, for quaternary
systems, BSP containing particulate systems still had lower entrainment rate although the NMP
containing ones had slightly higher overall electrostatic charge. Although the addition of dolomite
and limestone slightly increased the electrostatic charging level of the binary and quaternary
systems, whether it would give rise to stronger electrostatic forces between fine and coarse
particles was uncertain considering that the total amount of dolomite and limestone was only 1.5
wt% or 4.5 wt%. Therefore, the effect of adding dolomite and limestone is an area for further
investigation.
The initial entrainment rates K*, given in Fig. 3.13, reflect the entrainment flux with the linear
fitting slope rate for both binary and quaternary groups with NMP or BSP. Although the 70 wt%
fines containing systems had lower entrainment rate, the actual entrained flux were dozens of folds

45
Figure 3.13. Initial entrainment rate K* of the binary/quaternary systems at Ug = Umf,PBR =
0.75m/s. Subscripts of K* indicates, (1) 10 % NMP, 90 % PBR, (2) 70 % NMP, 30 % PBR, (3) 10
% NMP, 90 % PLD, (4) 70 % NMP, 30 % PLD, (5) 10 % BSP, 90 % PBR, (6) 70 % BSP, 30 %
PBR, (7) 10 % BSP, 90 % PLD, and (8) 70 % BSP, 30 % PLD, respectively.
of that for the 10 wt% fines containing cases. Kim reported that the elutriation rate would increase
with increasing amount of Geldart C particles in the beds (Kim et al., 2012). However, with
mixtures containing up to 30 wt% of Geldart C particles, the elutriation rate decreased. In this
study, when the fines portion was up to 70%, the fines became the dominant component. The fines
would adhere together rather than attach to coarse particles due to limit of the total surface area of
coarse particle. Also, the cohesive nature of Group C particles led to difficult fluidization of the

46
fines. Therefore, the clusters of fine particles other than the fines attracted on the coarse particles
would affect the overall entrainment rate. This may lead to that binary and quaternary systems
with 70% fines had less entrainment by percentage.
3.3.5 Effect of sintering
Since this study was performed in the ambient condition other than the metallurgical reaction
environment, sintering of the iron ore particles could be another factor for the restrained
entrainment of fine particles besides the inter-particle forces. Figure 3.14 showed the increasing
Figure 3.14. Microscope photos of the binary mixture (10wt% BSP+90wt% PBR) mixed by the
system (a) in section 2.3 with different mixing time in ambient conditions: (a) 0.5 hour (b) 1 hour
and (c) 2 hours.
amount of fines attached on the surface of the coarse particles with longer mixing time due to the
strengthened electrostatic force. Therefore, it was hypothesized that the fine particles would fuse
on the coarse particles or agglomerate when exposed to high temperatures which would also lead
to reduced entrainment of fine particles. Binary mixtures of PBR + NMP or BSP (9:1) were first
mixed for 4 hours using the mixing unit mentioned in section 3.2.3. Next, the charged binary
mixtures were heated to 700 ˚C for 2 hours. SEM images were taken before and after heat-
treatment to investigate the morphological changes of binary mixtures shown in Figure 3.15.
First, Figure 3.15 (a) and (c) showed the difference between binary mixtures containing NMP
and BSP. After the same mixing procedure, they both adhered to PBR. For NMP, it formed a

47
relatively thin layer on PBR, but BSP seemed to form its own clusters first and then they were
attracted on PBR. The magnetic properties of BSP, which was magnetite inherently, may lead to
BSP forming bigger particle agglomerates than NMP. Therefore it seemed that there were more
BSP attached to PBR than NMP overall. When these binary mixtures were heated at 700 ºC for 2
hours, as shown in Figure 3.15 (b) and (d), most of NMP and BSP layers which were previously
adhered on the surface of PBR disappeared. Therefore, it was estimated that the sintering of iron
ore fines did happen which could be one of the reasons for the restrained entrainment.
Figure 3.15. SEM images of the binary particulate systems before and after heat treating at 700
ºC for 2 hours (left, X85, right X200): (a) untreated PBR+NMP, (b) heat-treated PBR+NMP, (c)
untreated PBR+BSP and (d) heat-treated PBR+BSP.

48
3.4 Conclusions
Complex particle behaviors, representative of the condition in the fluidized bed based direct
reduced iron making process but in a cold state, was investigated in terms of the particle-particle
interaction, electrostatic charging phenomenon and entrainment. Overall, the fines were retained
by the enhanced electrostatic forces between fine and coarse particles due to the significant
electrostatic charging occurring during fluidizations, though other factors are at play, including the
agglomeration of fines and other inter-particle forces. Nevertheless, the units of fine and coarse
particles or fine and fine particles would be segregated when the hydrodynamic force becomes
dominating at a high fluidizing gas velocity, eventually driving the fine particles entrained. Aside
from the fraction of Group C particles contained within the system, the hydrophobic properties of
particles and the inherent magnetic particles contained in the fines would also be factors which
may lead to the reduced entrainment of the fines in ambient conditions. Most likely, the sintering
of fines would be the main cause for the limited entrainment observed in the real practice.
Therefore, in order to have a clear estimate of the maximum fine particle loading, the kinetics of
the sintering of the fines should be compared with the transport feature of this multi-particulate
system. Fines had already sintered before reaching the top of the fluidized bed would not be
entrained. The intensified inter-particle forces would also change the fluidization feature of the
fines and assist their sintering.

49
CHAPTER 4
CARBON SEQUESTRATION AND WASTE VALORIZATION VIA
DIRECT CARBONATION OF SLAG
The contents of this chapter titled “Chemical and Physical Properties of Direct Carbonated
Stainless Steel Slag for Mixing in Cement Mortar” are to be submitted to the Journal of
ChemSusChem (X.Z. Zhou, S.-H. Jang, Y. Qian, S. Kawashima, H. Yin and A.-H. A. Park).
Abstract
Iron and steel slags of different types have been used as cement clinker material, aggregate,
road base and fertilizer for several decades; however, utilizing stainless steel slag (SSS) has always
been a challenge due to the environmental concern of the heavy metal leaching (e.g., Cr). Recently,
iron and steel slags have been regarded as alternatives for mineral sequestration considering that
slags contain roughly 40 ~ 50 wt% of Ca and Mg in total, similar to natural Ca/Mg-based silicate
minerals. This study assesses converting the SSS into environmentally benign cementitious
material after its carbonation. Since the cement and iron and steel industries are among the few
largest industrial CO2 emitters, replacing the cement mortar with the carbonated slag while
guaranteeing the quality of this material could eliminate the carbon emission from the limestone
calcination and relevant energy usage. Furthermore, exothermic behavior during hydration,
compressive strength, and leaching behavior of mixed cement mortar have been investigated in
order to evaluate its hydration characteristics, mechanical properties, and environmental safety.
Cement mortar containing up to 15 wt% carbonated SSS with relative low conversion (~ 33%) or
carbon content, is found to have comparable strength but higher mixing ratio and carbon content
will sacrifice the overall strength. Carbonated SSS is also found to be able to retard the hydration

50
of the cement mortar. Particularly, carbonation and hydration of SSS together is able to minimize
the leaching of Cr and Ni.
4.1 Introduction
Iron and steel as well as cement industries have been considered to be the cornerstones for
world economic development in the past century since the modern industrial revolution (GEA,
2012; IEA, 2014). Especially in developing countries today, the urbanization process cannot
proceed without these two basic structural materials (Fung, 2009). Nevertheless, in the context of
the world-wide trend towards sustainable development, the overall sustainability of these heavy
industries still has a large room to improve (U.S. EIA MECS, 2012). In order to sustain the
business both economically and environmentally, elevating material and energy efficiencies,
emission control standard and waste management level are all quite essential (U.S. EPA, 2012).
Among them, waste valorization (i.e., iron and steel slag treatment and utilization) and carbon
capture, utilization and storage (CCUS) are of particular interests for both academia and industry,
especially in the past two decades and even earlier (IPCC, 2007a).
In iron and steel making process, limestone and dolomite after calcination in blast furnace (i.e.,
CaO or MgO) react with impurities of iron ores, mostly SiO2, which forms slag as a silicate-based
material (Rosenqvist, 1983; Yildirim and Prezzi, 2011). In 2010, Germany produced 28.56 MMT
(million metric tons) of iron and 43.83 MMT of steel, which were 2.76% and 10.13% of the world
iron and steel production, respectively. In 2010, China produced 595.60 MMT of iron and 638.74
MMT of steel, which were 57.54% and 44.58% of world production, respectively (World Steel
Association, 2014b). At the same time, the American Iron and Steel Institute estimated that the
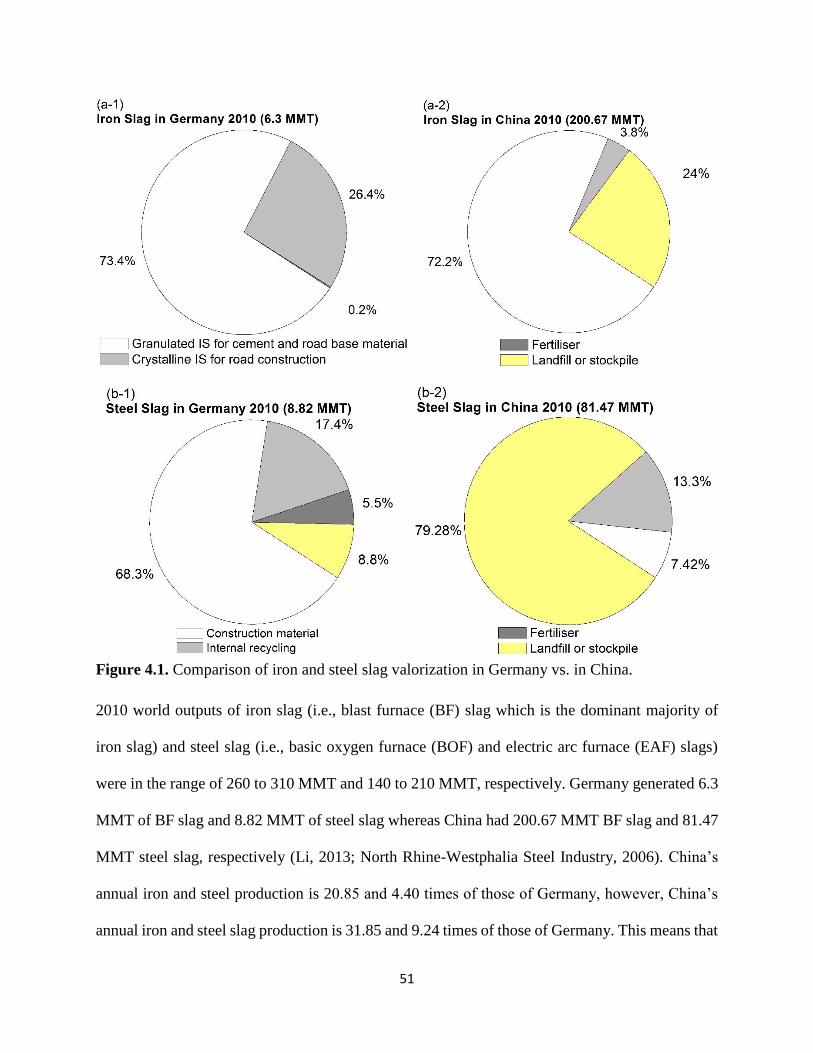
51
Figure 4.1. Comparison of iron and steel slag valorization in Germany vs. in China.
2010 world outputs of iron slag (i.e., blast furnace (BF) slag which is the dominant majority of
iron slag) and steel slag (i.e., basic oxygen furnace (BOF) and electric arc furnace (EAF) slags)
were in the range of 260 to 310 MMT and 140 to 210 MMT, respectively. Germany generated 6.3
MMT of BF slag and 8.82 MMT of steel slag whereas China had 200.67 MMT BF slag and 81.47
MMT steel slag, respectively (Li, 2013; North Rhine-Westphalia Steel Industry, 2006). China’s
annual iron and steel production is 20.85 and 4.40 times of those of Germany, however, China’s
annual iron and steel slag production is 31.85 and 9.24 times of those of Germany. This means that
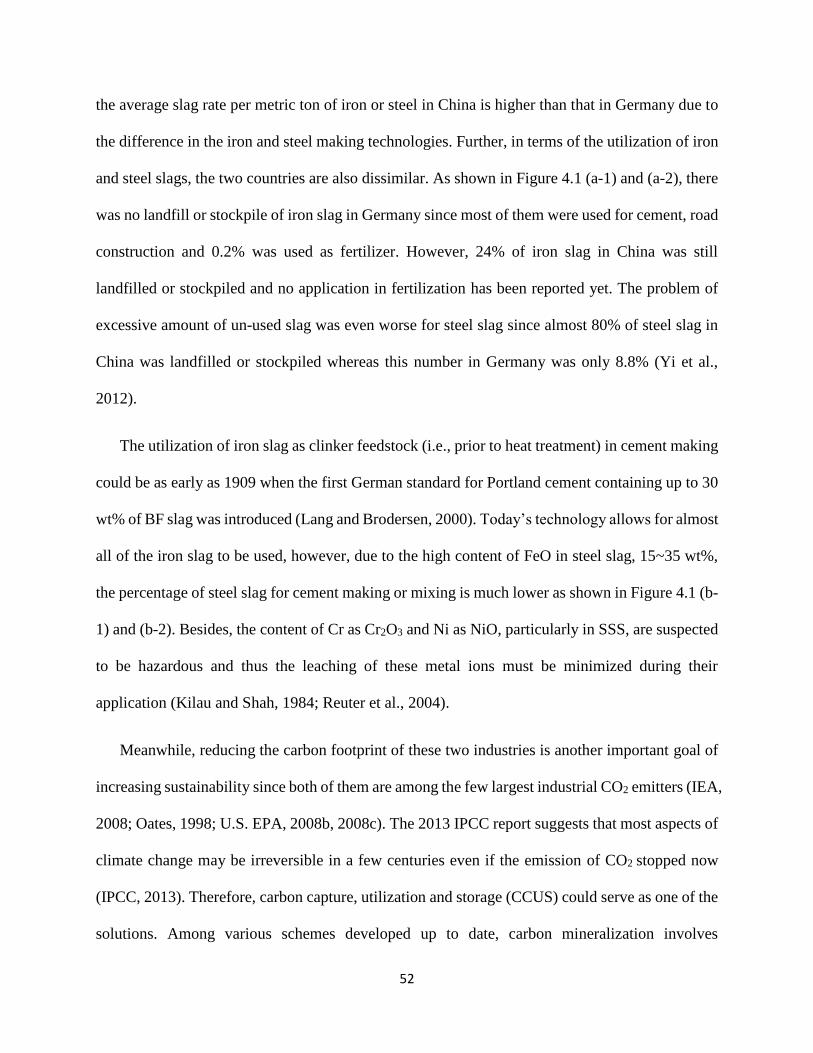
52
the average slag rate per metric ton of iron or steel in China is higher than that in Germany due to
the difference in the iron and steel making technologies. Further, in terms of the utilization of iron
and steel slags, the two countries are also dissimilar. As shown in Figure 4.1 (a-1) and (a-2), there
was no landfill or stockpile of iron slag in Germany since most of them were used for cement, road
construction and 0.2% was used as fertilizer. However, 24% of iron slag in China was still
landfilled or stockpiled and no application in fertilization has been reported yet. The problem of
excessive amount of un-used slag was even worse for steel slag since almost 80% of steel slag in
China was landfilled or stockpiled whereas this number in Germany was only 8.8% (Yi et al.,
2012).
The utilization of iron slag as clinker feedstock (i.e., prior to heat treatment) in cement making
could be as early as 1909 when the first German standard for Portland cement containing up to 30
wt% of BF slag was introduced (Lang and Brodersen, 2000). Today’s technology allows for almost
all of the iron slag to be used, however, due to the high content of FeO in steel slag, 15~35 wt%,
the percentage of steel slag for cement making or mixing is much lower as shown in Figure 4.1 (b-
1) and (b-2). Besides, the content of Cr as Cr2O3 and Ni as NiO, particularly in SSS, are suspected
to be hazardous and thus the leaching of these metal ions must be minimized during their
application (Kilau and Shah, 1984; Reuter et al., 2004).
Meanwhile, reducing the carbon footprint of these two industries is another important goal of
increasing sustainability since both of them are among the few largest industrial CO2 emitters (IEA,
2008; Oates, 1998; U.S. EPA, 2008b, 2008c). The 2013 IPCC report suggests that most aspects of
climate change may be irreversible in a few centuries even if the emission of CO2 stopped now
(IPCC, 2013). Therefore, carbon capture, utilization and storage (CCUS) could serve as one of the
solutions. Among various schemes developed up to date, carbon mineralization involves

53
exothermic carbonation of naturally occurring Ca/Mg-bearing silicate minerals (e.g., serpentine,
olivine, wollastonite and etc.) or alkaline industrial wastes (e.g., iron and steel slag and etc.) due
to their similar chemistry. The carbonated products could be used for mine reclamation or value-
added products such as filler material depending on the processes (Zevenhoven and Fagerlund,
2010). Overall, on the global scale, it is predicted that 200 to 300 MtCO2 can be stored using
industrial wastes annually which has to be compared to the 26 GtCO2 produced per year (Huijgen
et al., 2007). Although the available quantity of industrial waste for carbonation remains small, it
is still attractive since it may solve the issue of slag accumulation while coupling with CO2
sequestration.
The carbonation of iron or steel slag could be achieved via the one-step or two-step route under
various conditions (e.g., T, P, solvent and etc.) (Chang et al., 2011; Doucet, 2010; Eloneva et al.,
2008; Teir et al, 2005). The direct carbonation (one-step) of slag could be very similar to the
carbonation of wollastonite with the overall reaction shown in Reaction 4.1 (Huijgen et al., 2006).
𝐶𝑎𝑆𝑖𝑂3(𝑠) + 𝐶𝑂2(𝑔) ↔ 𝐶𝑎𝐶𝑂3(𝑠) + 𝑆𝑖𝑂2(𝑎𝑞) (Rxn. 4.1)
In this study, considering that SSS is more reactive than natural minerals (Meima et al., 2002),
direct carbonation under 100 °C and ambient pressure was investigated in order to develop an
economic treatment method with low parasitic energy and material consumption. Previously,
besides using iron/steel slag as feedstock for cement clinker production, they were also directly
mixed in cement mortar (Kourounis et al., 2007). Therefore carbonated SSS (CSSS) in this study
was also mixed in the cement mortar in order to explore the possibility of utilizing CSSS as
construction filler material. Particularly, a leaching test was also conducted for SSS before and
after carbonation and CSSS mixed in cement before and after hydration.

54
4.2 Materials and Experimental
4.2.1 Carbonation of SSS
SSS sample was procured from the ThyssenKrupp steel production plant at Terni of Italy by
collaboration with the University of Rome. The material was sampled from the outflow of the
metal recovery process following electric arc furnace (EAF). Since the material had a high
moisture content, it was dried at 70 °C for 48 hours prior to experiments. The compositions of SSS
were shown in Table 4.1.
Table 4.1. Chemical compositions of the procured SSS from ThyssenKrupp plant at Terni
measured by Atomic Absorption Spectrometer (AAS). Data is provided by the ThyssenKrupp
plant environmental office.
Elemental concentration (wt%)
Ca Si Cr Mg Fe Al Mn Ni
35.21 15.09 4.03 2.92 2.82 1.21 0.83 0.06
The direct carbonation reaction was conducted in the lab-fabricated continuous stirred tank
reactor (CSTR) shown in Figure 4.2 (a). SSS slurry of 15 wt% was prepared in either DI water or
1 M NaHCO3 solution with the chemical purchased from Sigma-Aldrich Co. LLC (St. Louis, MO).
Reaction was under ambient pressure and at 30, 50 and 70 °C maintained by the water bath
(ISOTEMP 205, Fisher Scientific, Hampton, NH). A pH meter (Accument basic AB 15, Fisher
Scientific, Hampton, NH) was connected to a computer monitoring the pH fluctuation in the
reactor system. The homogenizer (Glas-Col, LLC, Terre Haute, IN) was set at a speed of 200 rpm
and the flow rate of CO2 was 0.25 SCFM. After 12 hours of carbonation, slurry was filtered through
a filter paper of 2.5 µm pore size. The collected solid particles were vacuum oven dried at 70 °C
overnight and securely stored in dehumidified box. The preparation of 2-step CSSS was introduced
in detail in section 5.2.3.
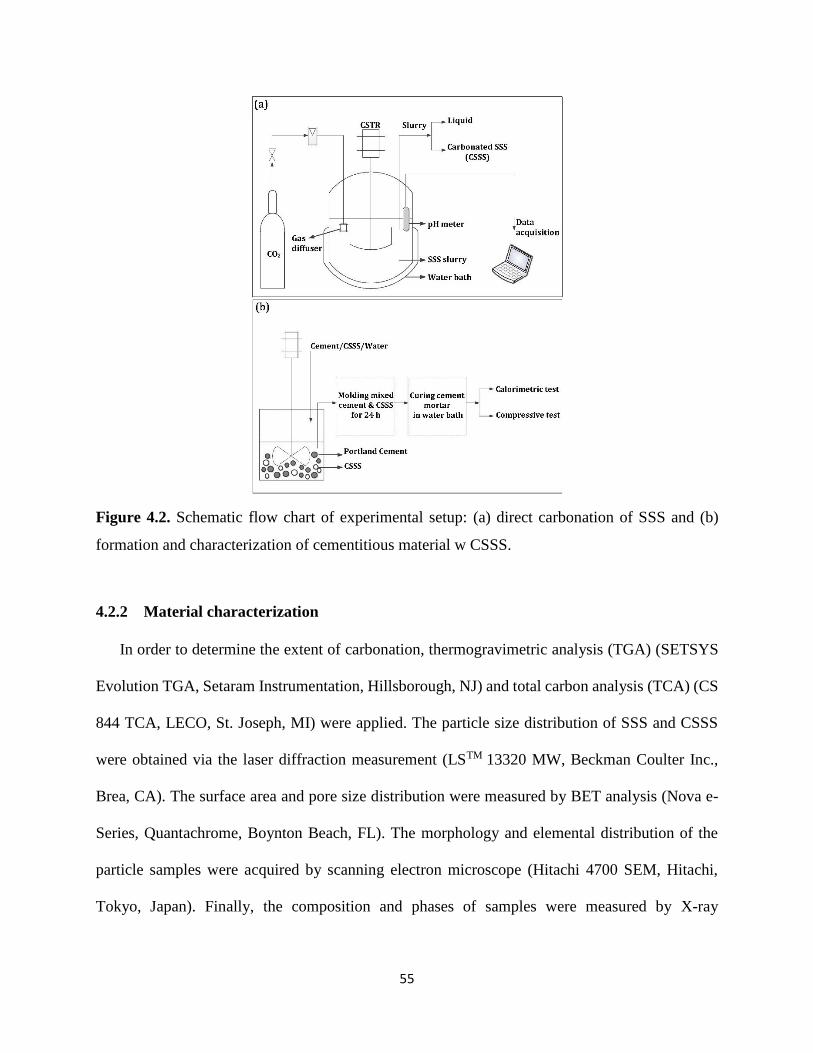
55
Figure 4.2. Schematic flow chart of experimental setup: (a) direct carbonation of SSS and (b)
formation and characterization of cementitious material w CSSS.
4.2.2 Material characterization
In order to determine the extent of carbonation, thermogravimetric analysis (TGA) (SETSYS
Evolution TGA, Setaram Instrumentation, Hillsborough, NJ) and total carbon analysis (TCA) (CS
844 TCA, LECO, St. Joseph, MI) were applied. The particle size distribution of SSS and CSSS
were obtained via the laser diffraction measurement (LSTM 13320 MW, Beckman Coulter Inc.,
Brea, CA). The surface area and pore size distribution were measured by BET analysis (Nova e-
Series, Quantachrome, Boynton Beach, FL). The morphology and elemental distribution of the
particle samples were acquired by scanning electron microscope (Hitachi 4700 SEM, Hitachi,
Tokyo, Japan). Finally, the composition and phases of samples were measured by X-ray

56
fluorescence (WD-XRF, Pananalytical Axios, Westborough, MA) and X-ray diffraction (XRD
3000, Inel Inc., Artenay, France).
4.2.3 Formation and characterization of cement mortar with CSSS
As shown in Figure 4.2 (b), cement mortar samples with different wt% of CSSS (i.e., 0%, 10%,
15%, 20% and 30%) mixed with Portland cement (ASTM C 150 Type I, Lafarge, Reston, VA)
were prepared for the compression test and the calorimetry test, respectively. The compositions of
the SSS and Portland cement were shown in Table 4.1 and Table 4.2, respectively.
Table 4.2. Chemical compositions of Lafarge ASTM C 150 Type I Portland cement.
Oxide composition
(wt%)
Mineralogical phases
(wt%)
CaO
SiO2
Fe2O3
SO3
Al2O3
MgO
SrO
K2O
TiO2
ZnO
ZrO2
Compton
Reyleigh
Sum
63.7
12.9
7.97
5.25
4.14
3.50
0.915
0.907
0.279
0.251
0.119
0.98
1.19
100
Tricalcium silicate (C3S)
Dicalcium silicate (C2S)
Tricalcium alumina (C3A)
Tetra-calcium aluminoferrite (C3AF)
Magnesite
Calcite
Periclase
Dolomite
Anhydrite
Hemihydrite
Arcanite
Ankerite
Aphtitalite
Quartz
Syngenite
52.4
16.0
10.2
8.6
0.3
0.5
0.9
1.2
2.3
2.0
2.5
0.6
0.4
0.2
2.0
The water/binder ratio was 0.5 and the sand/binder ratio was 2.75. For the calorimetry test, 5
g of fresh cement paste or cement/CSSS mixture was added into a glass vial with water and it was
hand-shaken for 2 minutes to mix them evenly. Each vial was put in the sample chamber and the
heat release rate were recorded by an isothermal calorimetry meter (TAM 48, TA Instrument, New
Castle, DE). For the compressive test, Portland cement/Portland cement with CSSS and sand were
57
respectively well-blended in a shear mixer for 3 minutes before water was added and then mixed
for another 5 minutes. Specimens of 50×50×50 mm were prepared in a cubic mold in accordance
with ASTM C109/C109M. A plastic sheet was used to wrap the molds to prevent
moisture evaporation. Mortar samples were de-molded after 24 hours and cured into water tank at
the designed ages of 3, 7 and 28 days. The compressive strength test was conducted on universal
test machine (UTM) (600DX 135k, Instron, Norwood, MA) according to ASTM C39/C39M-90a.
4.2.4 Leaching test
According to the European Standard Method EN 12-457-2 (CEN, 1999), an amount of solid
sample of approximately 20 g was weighed on an analytical balance. Herein, SSS, CSSS, Portland
cement and ground hydrated cement mortar w/wo CSSS were tested. The solid sample was put
into a 250 ml plastic bottle with 200 ml of water. The bottle was sealed and put on a rolling table
(Model 2050, Associated Design and Manufacturing Co., Lorton, VA), at a speed of approximately
10 rpm for 24 hours. At the end of the mixing, part of the mixture (~ 80 ml) was sampled and
filtered with a syringe filter of 0.2 µm pore size. The leachate was acidified by the addition of 20
ml of 2% nitric acid. After dilution, the samples were analyzed on the ICP-MS (Neptune Plus,
Thermo Fisher, Waltham, MA) to determine the elemental concentrations.
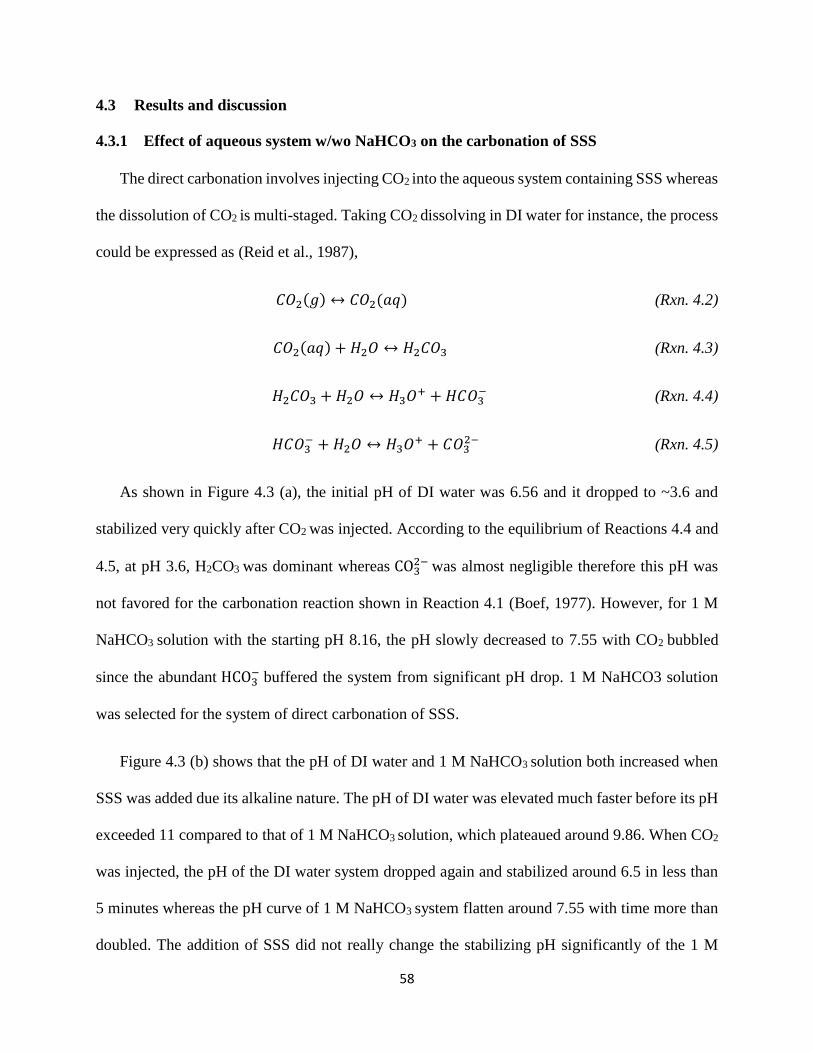
58
4.3 Results and discussion
4.3.1 Effect of aqueous system w/wo NaHCO3 on the carbonation of SSS
The direct carbonation involves injecting CO2 into the aqueous system containing SSS whereas
the dissolution of CO2 is multi-staged. Taking CO2 dissolving in DI water for instance, the process
could be expressed as (Reid et al., 1987),
𝐶𝑂2(𝑔) ↔ 𝐶𝑂2(𝑎𝑞) (Rxn. 4.2)
𝐶𝑂2(𝑎𝑞) + 𝐻2𝑂 ↔ 𝐻2𝐶𝑂3 (Rxn. 4.3)
𝐻2𝐶𝑂3 + 𝐻2𝑂 ↔ 𝐻3𝑂+ + 𝐻𝐶𝑂3− (Rxn. 4.4)
𝐻𝐶𝑂3− + 𝐻2𝑂 ↔ 𝐻3𝑂+ + 𝐶𝑂3
2− (Rxn. 4.5)
As shown in Figure 4.3 (a), the initial pH of DI water was 6.56 and it dropped to ~3.6 and
stabilized very quickly after CO2 was injected. According to the equilibrium of Reactions 4.4 and
4.5, at pH 3.6, H2CO3 was dominant whereas CO32− was almost negligible therefore this pH was
not favored for the carbonation reaction shown in Reaction 4.1 (Boef, 1977). However, for 1 M
NaHCO3 solution with the starting pH 8.16, the pH slowly decreased to 7.55 with CO2 bubbled
since the abundant HCO3− buffered the system from significant pH drop. 1 M NaHCO3 solution
was selected for the system of direct carbonation of SSS.
Figure 4.3 (b) shows that the pH of DI water and 1 M NaHCO3 solution both increased when
SSS was added due its alkaline nature. The pH of DI water was elevated much faster before its pH
exceeded 11 compared to that of 1 M NaHCO3 solution, which plateaued around 9.86. When CO2
was injected, the pH of the DI water system dropped again and stabilized around 6.5 in less than
5 minutes whereas the pH curve of 1 M NaHCO3 system flatten around 7.55 with time more than
doubled. The addition of SSS did not really change the stabilizing pH significantly of the 1 M

59
NaHCO3 system with CO2 injection which was a decent pH condition for carbonation. Therefore,
1 M NaHCO3 solution was used for all the experiments.
Figure 4.3. pH conditions of direct carbonation: (a) DI water vs. 1 M NaHCO3 with CO2 injection
and (b) stainless steel slag in DI water vs. 1 M NaHCO3 with CO2 injection.
4.3.2 Effect of temperature on the extent of the carbonation of SSS
Comparing to natural Ca/Mg-bearing silicate minerals, all types of iron and steel slag including
SSS were more reactive due to its generation in high temperature condition, > 1500 °C, which
made them similar to thermally treated natural minerals with faster dissolution and carbonation

60
kinetics (O’Connor et al., 2005). Therefore, this study tried to make the reaction happen under
ambient condition with minimum parasitic energy input but, at the same time, the extent of
carbonation would not be sacrificed significantly.
Figure 4.4. Effect of temperature on the extent of one-step carbonation of stainless steel slag: (a)
TGA analysis and (b) Carbon analyzer analysis.
Three kinds of CSSS prepared at 30, 50, 70 °C and CSSS via the two-step route (i.e., mostly
CaCO3) were compared with non-treated SSS in terms of their carbon content by TCA and TGA.
Since SSS normally contained some amount of free lime (i.e., CaO), when exposed to air, the free
lime would absorb moisture and ambient CO2 (Yildirim and Prezzi, 2011). Therefore, in Figure
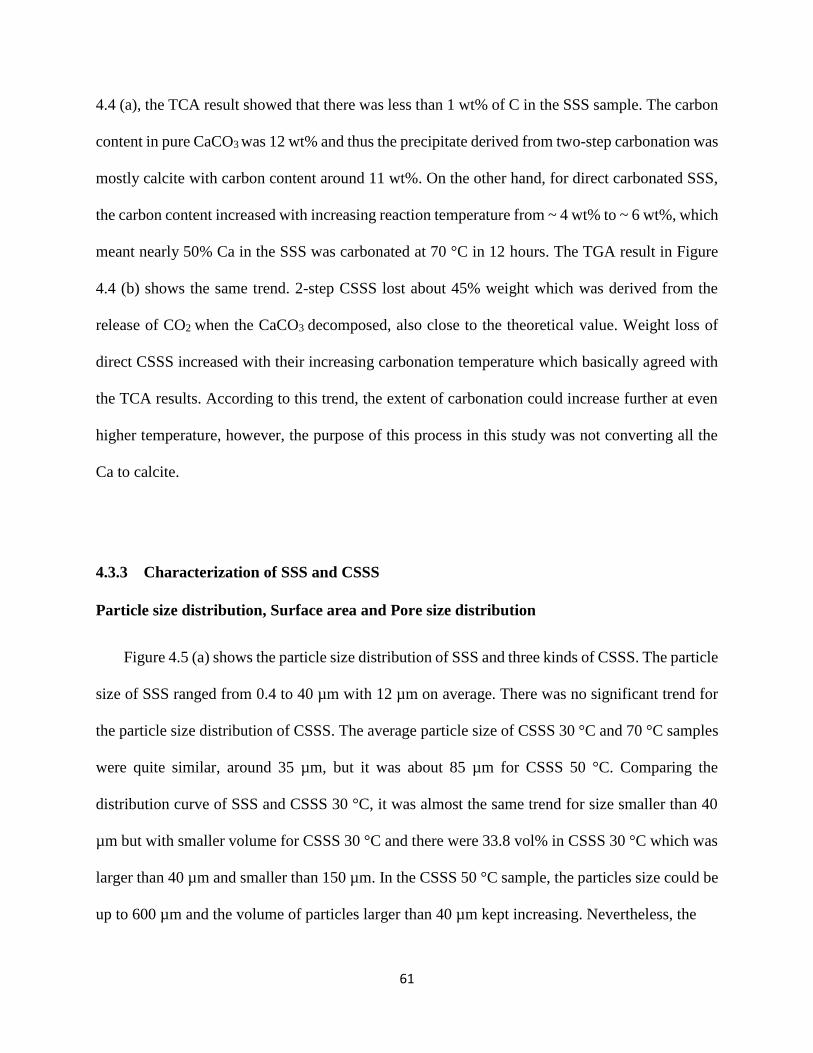
61
4.4 (a), the TCA result showed that there was less than 1 wt% of C in the SSS sample. The carbon
content in pure CaCO3 was 12 wt% and thus the precipitate derived from two-step carbonation was
mostly calcite with carbon content around 11 wt%. On the other hand, for direct carbonated SSS,
the carbon content increased with increasing reaction temperature from ~ 4 wt% to ~ 6 wt%, which
meant nearly 50% Ca in the SSS was carbonated at 70 °C in 12 hours. The TGA result in Figure
4.4 (b) shows the same trend. 2-step CSSS lost about 45% weight which was derived from the
release of CO2 when the CaCO3 decomposed, also close to the theoretical value. Weight loss of
direct CSSS increased with their increasing carbonation temperature which basically agreed with
the TCA results. According to this trend, the extent of carbonation could increase further at even
higher temperature, however, the purpose of this process in this study was not converting all the
Ca to calcite.
4.3.3 Characterization of SSS and CSSS
Particle size distribution, Surface area and Pore size distribution
Figure 4.5 (a) shows the particle size distribution of SSS and three kinds of CSSS. The particle
size of SSS ranged from 0.4 to 40 µm with 12 µm on average. There was no significant trend for
the particle size distribution of CSSS. The average particle size of CSSS 30 °C and 70 °C samples
were quite similar, around 35 µm, but it was about 85 µm for CSSS 50 °C. Comparing the
distribution curve of SSS and CSSS 30 °C, it was almost the same trend for size smaller than 40
µm but with smaller volume for CSSS 30 °C and there were 33.8 vol% in CSSS 30 °C which was
larger than 40 µm and smaller than 150 µm. In the CSSS 50 °C sample, the particles size could be
up to 600 µm and the volume of particles larger than 40 µm kept increasing. Nevertheless, the
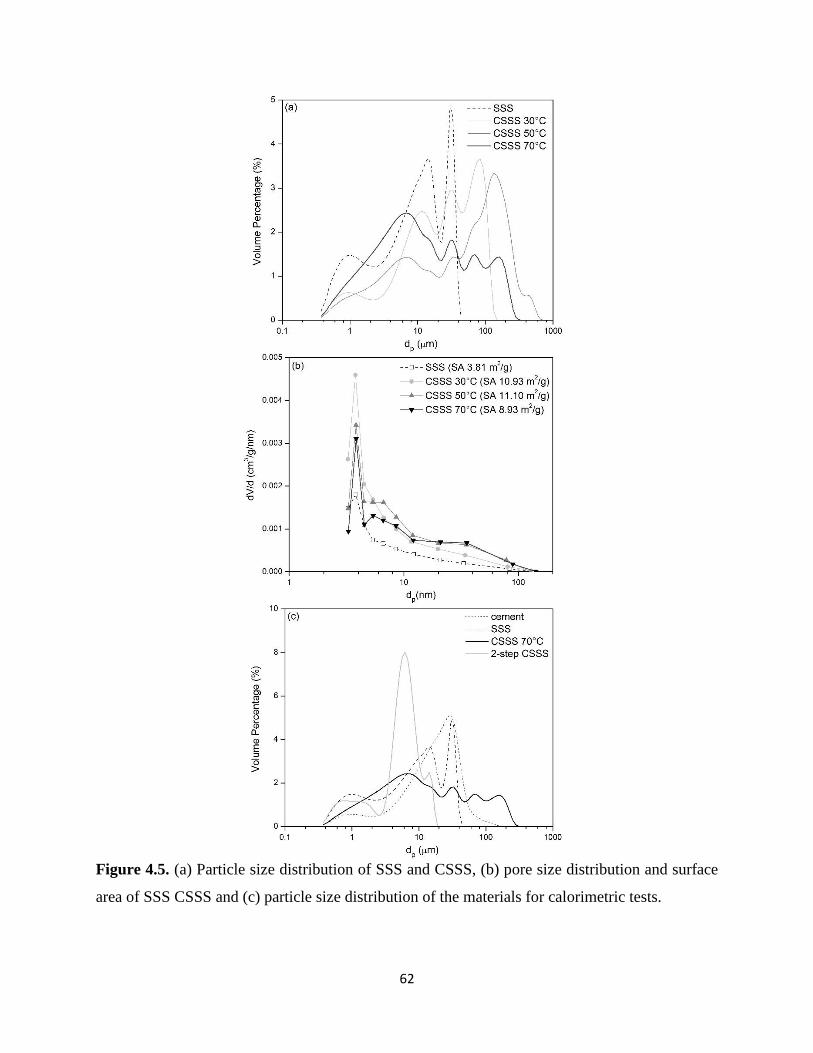
62
Figure 4.5. (a) Particle size distribution of SSS and CSSS, (b) pore size distribution and surface
area of SSS CSSS and (c) particle size distribution of the materials for calorimetric tests.

63
volume of particles smaller than 40 µm was larger in CSSS 70 °C especially for particles less than
10 µm compared to CSSS prepared at a lower temperature.
As shown in Figure 4.5 (b), the surface area of SSS was 3.81 m2/g and the three kinds of CSSS
had very close surface area around 10 m2/g on average. All the CSSS samples had increased pore
volumes from 4 ~ 100 nm. Particularly, for the mesopores around 4 nm, the increased reaction
temperature decreased the pore volume.
Herein, based on the increased carbon content in CSSS with increasing temperature, the
hypothesis was made that carbonation on the surface of SSS particle was dominant compared to
precipitation of CaCO3 but not attached to original SSS particle at lower temperature. Therefore,
when this condition was maintained with the temperature up to some extent, the particle size of
the carbonated sample would keep increasing. However, the rate of dissolution of SSS into Ca2+
followed by precipitation of calcite could surpass the formation of the surface carbonation layer at
certain higher temperatures such that the amount of small calcite particles increased at relative
stable pH environment.
Particle morphology and elemental distribution
Morphologies of SSS as well as direct and two-step carbonated SSS were shown in the SEM
images. SSS had an almost non-porous surface particularly for particles larger than 10 µm, as
shown in Figure 4.6 (a). CSSS 30 °C, 50 °C, 70 °C in Figure 4.6 (b-1) - (b-3) displayed more
porous structure compared to SSS and the extent of particle porosity decreased with increasing
reaction temperature. It was relatively consistent with the pore size distribution results. Also, in
Figure 4.6 (b-3), the ratio of CSSS 70 °C particles smaller than 5 µm was higher than the other
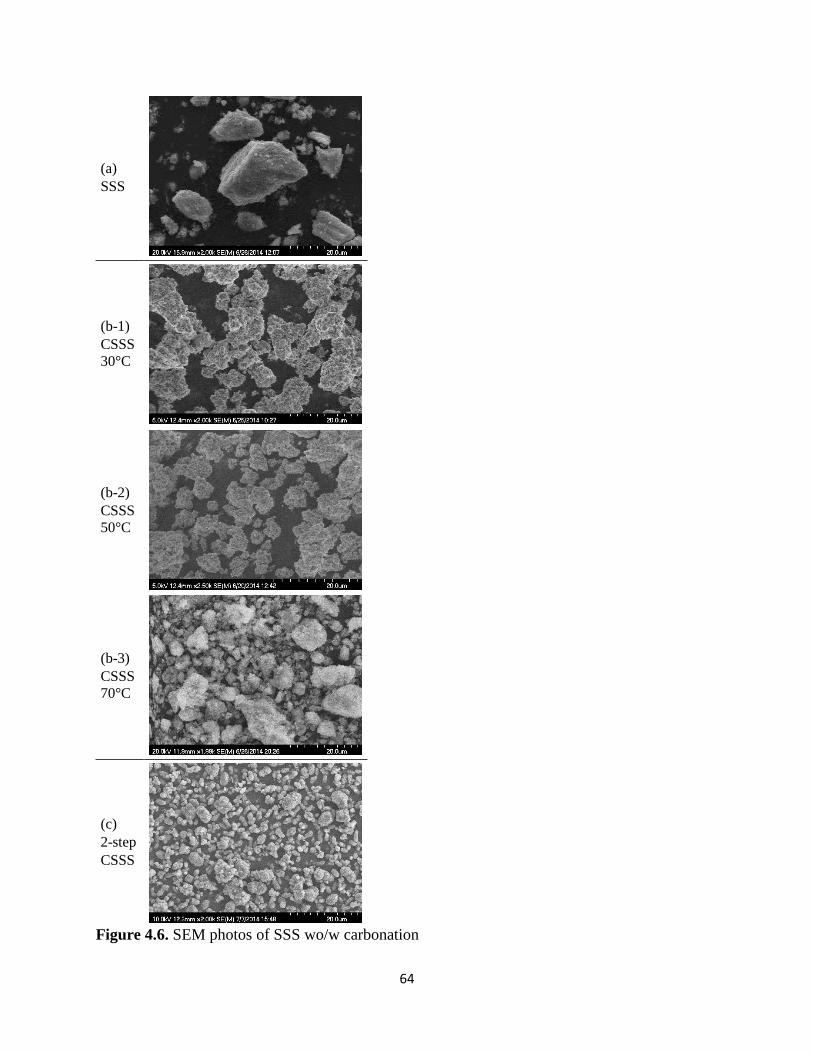
64
(a)
SSS
(b-1)
CSSS
30°C
(b-2)
CSSS
50°C
(b-3)
CSSS
70°C
(c)
2-step
CSSS
Figure 4.6. SEM photos of SSS wo/w carbonation
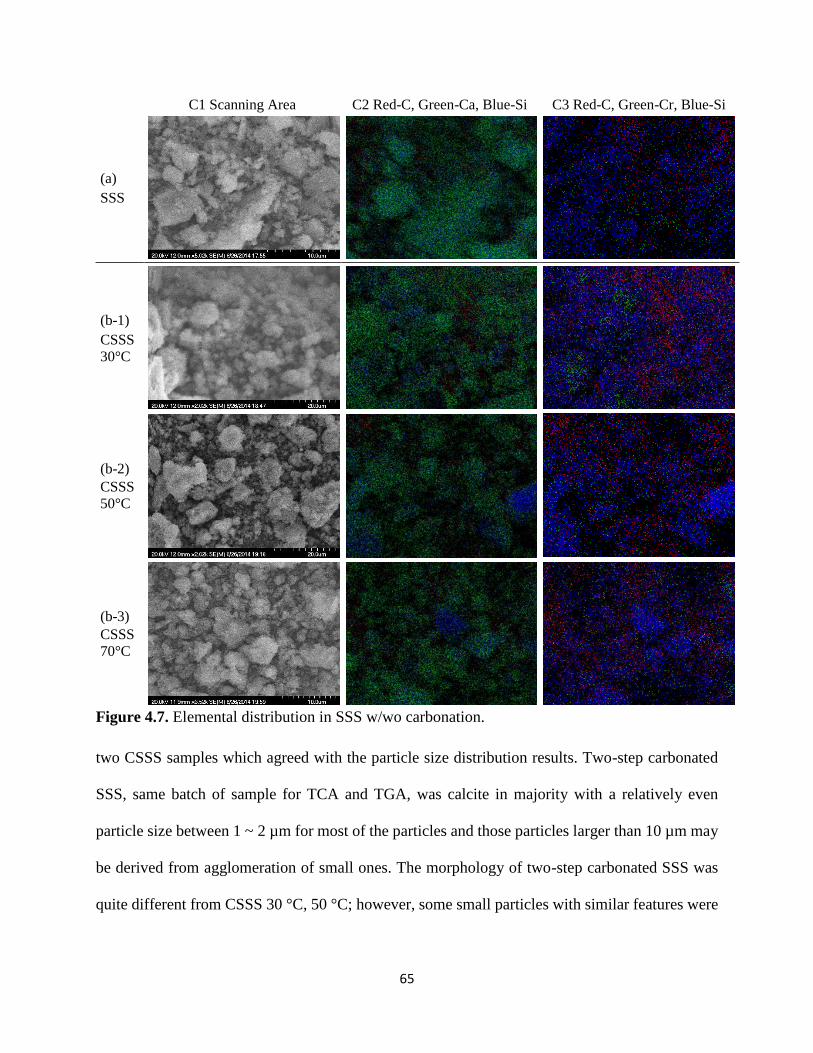
65
C1 Scanning Area C2 Red-C, Green-Ca, Blue-Si C3 Red-C, Green-Cr, Blue-Si
(a)
SSS
(b-1)
CSSS
30°C
(b-2)
CSSS
50°C
(b-3)
CSSS
70°C
Figure 4.7. Elemental distribution in SSS w/wo carbonation.
two CSSS samples which agreed with the particle size distribution results. Two-step carbonated
SSS, same batch of sample for TCA and TGA, was calcite in majority with a relatively even
particle size between 1 ~ 2 µm for most of the particles and those particles larger than 10 µm may
be derived from agglomeration of small ones. The morphology of two-step carbonated SSS was
quite different from CSSS 30 °C, 50 °C; however, some small particles with similar features were
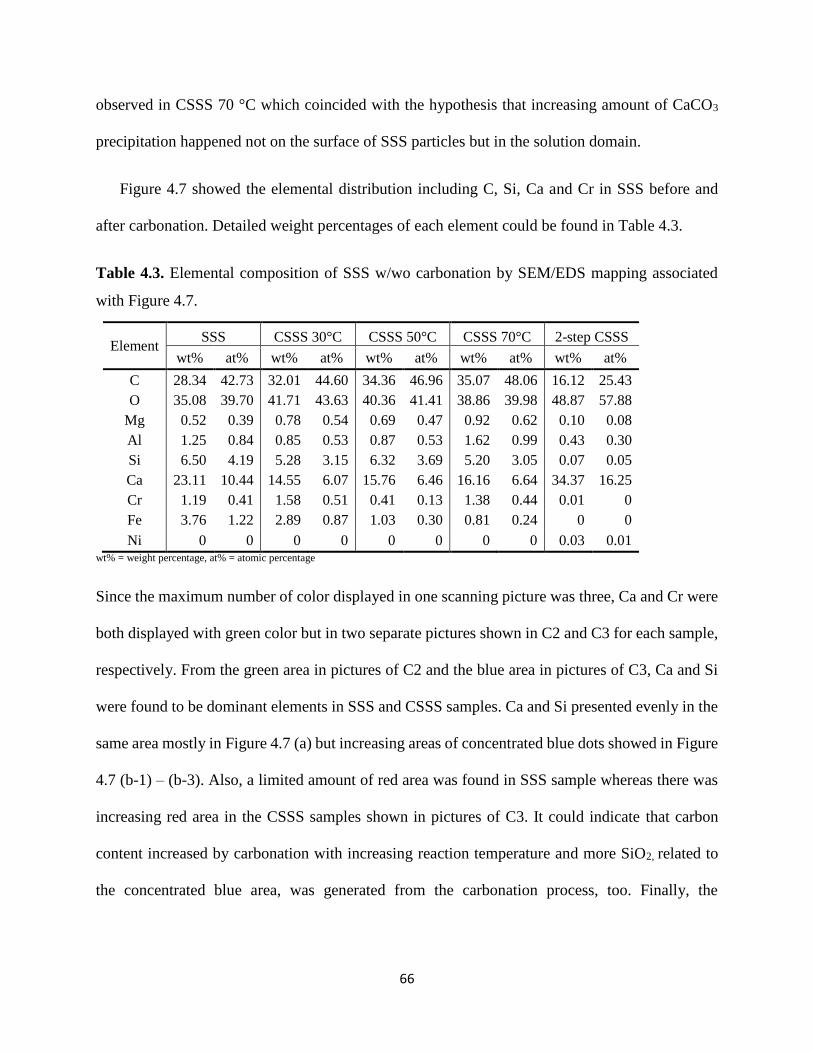
66
observed in CSSS 70 °C which coincided with the hypothesis that increasing amount of CaCO3
precipitation happened not on the surface of SSS particles but in the solution domain.
Figure 4.7 showed the elemental distribution including C, Si, Ca and Cr in SSS before and
after carbonation. Detailed weight percentages of each element could be found in Table 4.3.
Table 4.3. Elemental composition of SSS w/wo carbonation by SEM/EDS mapping associated
with Figure 4.7.
Element SSS CSSS 30°C CSSS 50°C CSSS 70°C 2-step CSSS
wt% at% wt% at% wt% at% wt% at% wt% at%
C 28.34 42.73 32.01 44.60 34.36 46.96 35.07 48.06 16.12 25.43
O 35.08 39.70 41.71 43.63 40.36 41.41 38.86 39.98 48.87 57.88
Mg 0.52 0.39 0.78 0.54 0.69 0.47 0.92 0.62 0.10 0.08
Al 1.25 0.84 0.85 0.53 0.87 0.53 1.62 0.99 0.43 0.30
Si 6.50 4.19 5.28 3.15 6.32 3.69 5.20 3.05 0.07 0.05
Ca 23.11 10.44 14.55 6.07 15.76 6.46 16.16 6.64 34.37 16.25
Cr 1.19 0.41 1.58 0.51 0.41 0.13 1.38 0.44 0.01 0
Fe 3.76 1.22 2.89 0.87 1.03 0.30 0.81 0.24 0 0
Ni 0 0 0 0 0 0 0 0 0.03 0.01 wt% = weight percentage, at% = atomic percentage
Since the maximum number of color displayed in one scanning picture was three, Ca and Cr were
both displayed with green color but in two separate pictures shown in C2 and C3 for each sample,
respectively. From the green area in pictures of C2 and the blue area in pictures of C3, Ca and Si
were found to be dominant elements in SSS and CSSS samples. Ca and Si presented evenly in the
same area mostly in Figure 4.7 (a) but increasing areas of concentrated blue dots showed in Figure
4.7 (b-1) – (b-3). Also, a limited amount of red area was found in SSS sample whereas there was
increasing red area in the CSSS samples shown in pictures of C3. It could indicate that carbon
content increased by carbonation with increasing reaction temperature and more SiO2, related to
the concentrated blue area, was generated from the carbonation process, too. Finally, the

67
distribution of C and Cr in CSSS samples shown in pictures of C3 was not always overlapped but
mostly segregated therefore the formation of chromium carbonate was quite unlikely.
Major phases in SSS and CSSS
Figure 4.8 shows the XRD analysis of SSS and CSSS samples. In SSS, the majority was
Ca2SiO4 (C2S) and it also contained some CaSiO3 (CS), CaSi2O5 (CS2), Ca-Mg-Fe silicate and a
tiny amount of CaCO3. After carbonation, most of the C2S peaks disappeared and peaks of calcite
increased but most CS and CS2 peaks remained. Particularly, around 2Ɵ value of 29° ~ 30°, the
original peak of C2S was gradually shifted towards the peak of (Mg0.06Ca0.94)CO3 with increasing
carbonation temperature. It was found that co-precipitation of Ca and Mg ions could not be avoided
in both the one-step and two-step carbonation processes. It seemed that the carbonation of C2S was
prior to other forms of calcium silicate probably due to its higher Ca/S ratio which was favored for
the dissolution and carbonation.
Figure 4.8. Phase analysis by X-ray diffraction for SSS and CSSS at different temperatures.

68
4.3.4 Exothermic behavior of cement mortar w/wo CSSS during hydration
Hydration of cement mortar is an exothermal process. By tracking the real-time heat release
rate of cement hydration, the hydration kinetics and qualitative extent of hydration could be
estimated and related to the compressive strength of cement mortar (i.e., higher rate of early
strength gain associated with higher hydration heat release) (Pane and Hansen, 2005).
Calorimetry tests were performed on cement pastes with different replacement levels of cement
by SSS, CSSS 70 °C and two-step CSSS. As shown in Figure 4.9, the dashed line was the heat
release curve for only Portland cement, which showed that the major peak appeared around 10
hours and another minor peak around 16 hours. It is well accepted that, following the peak that
occurs during initial dissolution, the 1st peak is primarily due to the hydration of tricalcium silicate
(C3S) and the 2nd peak is attributed to the reaction of tricalcium aluminate (C3A) (Bensted, 1987;
Mindess et al., 2002; Mostafa and Browan, 2005; Young, 1985). Figure 4.9 (a-1) shows that the
addition of SSS in cement paste had mainly a dilution effect, where the overall heat release
decreased with simultaneous increase in the amount of SSS and decrease in C3S within cement
content. However, the duration of the induction period (which occurred between the initial
dissolution and acceleration) was not significantly affected. Similar hydration kinetics have been
reported in studies on blast furnace slag in cement pastes (Hwang and Shen, 1991; Roy and Idorn,
1982; Sato and Beaudoin, 2010). In contrast, Figure 4.9 (b-1) shows that CSSS 70 °C prolonged
the induction period substantially, by up to 10 hours, more than doubling the overall curing time.
This can also be tied to the dilution effect. However, given the extent of the effect at even relatively
modest replacements of 10 and 15%, there are likely other factors that are contributing to this delay
of the acceleration period. This is presently unclear but a potential topic of future work. In addition,
the 2nd peak is more pronounced compared to the paste with SSS. This can be attributed to the
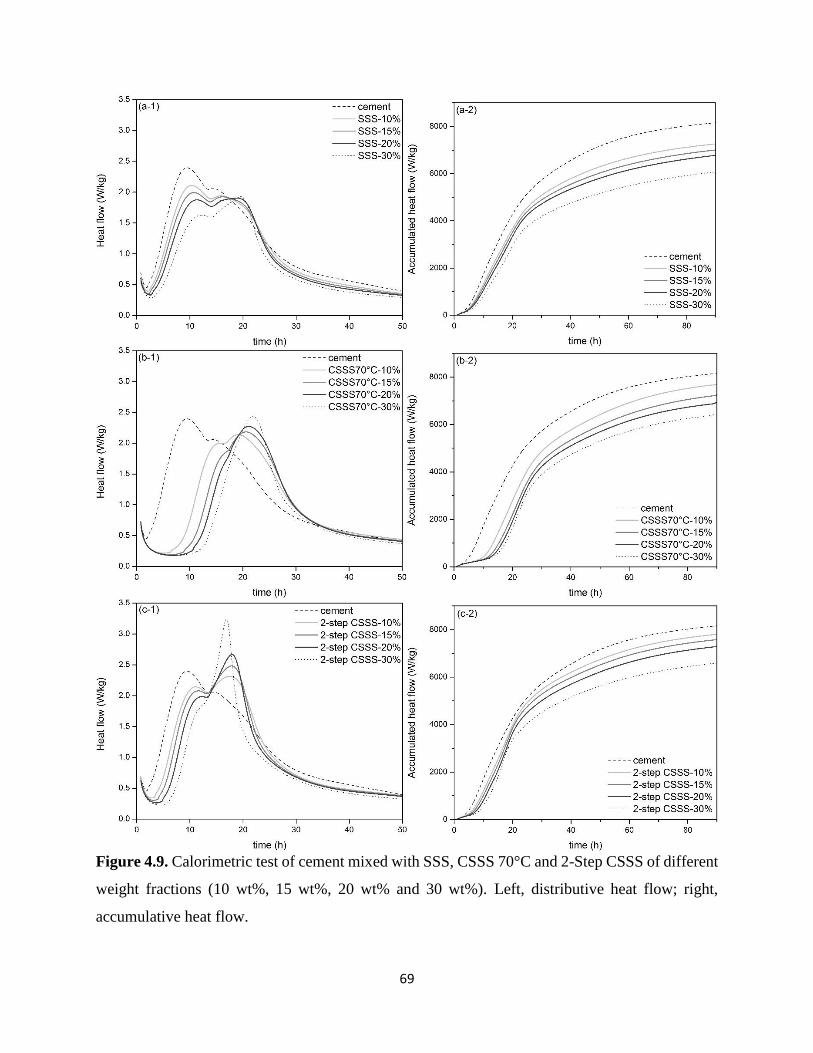
69
Figure 4.9. Calorimetric test of cement mixed with SSS, CSSS 70°C and 2-Step CSSS of different
weight fractions (10 wt%, 15 wt%, 20 wt% and 30 wt%). Left, distributive heat flow; right,
accumulative heat flow.

70
calcite content in CSSS 70 °C – CaCO3 can react with C3A to produce calcium aluminate hydrate.
In Figure 4.9 (c-1) for the cement paste with 2-step CSSS added, the same effect on the induction
period is not seen. And although there is a similar increase in the 2nd peak, which is due to reaction
of calcite with C3A, it is more pronounced. By comparing Figure 4.9 (b-1) and (c-1), it is apparent
that the 2-step CSSS is introducing an accelerating effect on the hydration of both C3S and C3A to
shorten the induction period and increase the 2nd peak, respectively. Influence of CaCO3 on
cement hydration is still not well understood, where decelerating, accelerating, and negligible
effects have all been observed and found to be dependent on various factors, e.g. mixing protocol
and calcite content (Hawkins et al., 2003). The mechanisms underlying the difference in measured
rates of hydration between CSSS 70 °C and 2-step CSSS are presently unclear. It may be tied to
calcite content, where 2-step CSSS exhibits a higher content according to TCA and TGA results.
On the other hand, it may be tied to differences in size and morphology. Particle size distribution
in Figure 4.5 (c) and SEM images in Figure 4.6 (b-3) & (c) indicate that 2-step CSSS exhibited
finer precipitated CaCO3 particles than CSSS 70 °C. Therefore 2-step CSSS may be introducing a
seeding effect, which is commonly observed when very fine particles are added to cement-based
systems. And accelerating effects on hydration by nanoCaCO3 have been measured in other
studies (Kawashima et al., 2014; Sato and Beaudoin, 2010).
Looking at Figures 4.9 (a-2) – (c-2), the decrease in the cumulative heat flow with increase in
replacement level of cement confirms the dilution effect. It is worth noting, as well, that CSSS
70 °C and 2-step CSSS appear to increase cumulative heat flow overall compared to SSS. This is
likely due to the increased reaction introduced by calcite, compared to the slower reaction of C2S
and pozzolanic reaction of SSS with calcium hydroxide, as well as difference in morphology. And
this is more apparent at lower replacement levels, i.e. 10 – 20%, particularly for 2-step CSSS. This

71
can be tied to a threshold level that exists for CaCO3 – within a certain level it will have a
predominantly “reactive” effect, whereas above a certain level it will primarily have a “filler”
(inert) effect (Kakli et al., 2000; Matschei, 2007). This was observed in the strength results of
CSSS 70 °C, as well. Finally, the decreasing trend of cumulative heat flow with increasing
replacement of cement with CSSS 70 °C agrees with the compressive strength results discussed
later. The setting of the cement mortar could be extended by addition of direct CSSS which could
be applied for some practical requirement of decelerated hydration kinetics (e.g. cement with
retarders for oil well cementing) (Nelson and Guillot, 2006).
4.3.5 Effect of wt% of CSSS on the compressive strength of mixed cement mortar
The compressive strength of cement mortar w/wo CSSS was shown in Figure 4.10. Cement
mortar without CSSS had strengths of 30, 35, 40 MPa on average for 3, 7, 28 days curing,
respectively. Figure 4.10 (a) shows that the mixing of 10 wt% of CSSS 30 °C in the cement mortar
could increase the compressive strength for all lengths of curing (e.g. 8% increase for 28 days
curing). The addition of CSSS 30 °C could go up to 15 wt% such that the average strength of
cement mortar after 3 and 7 days curing was still slightly higher than pure cement mortar whereas,
for 28 days cured samples, the strength was almost identical to that of pure cement mortar. When
the weight percentage of CSSS 30 °C was further increased to 20 and 30 wt%, the strength kept
decreasing for all cases. Nevertheless, as shown in Figure 4.10 (b) and (c), addition of CSSS 50 °C
and CSSS 70 °C with all the mixing ratios would decrease the overall compressive strength of the
mixed cement mortar. In particular, cement mortar with CSSS 70 °C had a bigger drop in strength
compared to that of CSSS 50 °C by all the mixing ratios. The biggest strength decreasing could be
72
Figure 4.10. Compressive strength of cementitious material w CSSS prepared at different
temperatures.

73
more than 25% in the case of mixing 30 wt% of CSSS 70 °C in the cement mortar cured for 28
days.
According to 4.3.2, the amount of calcite increased in direct CSSS with rising carbonation
temperature. The change in the compressive strength of cement mortar may be attributed to the
reduction of hydraulically active clinker fraction of cement as increasing CSSS replacement. There
should be a threshold percentage of calcite added into the cement mortar which could improve the
overall compressive strength. Beyond that, increasing the percentage of calcite would decrease its
overall compressive strength. Also, the decreasing amount of C2S discussed in 4.3.3 might be
another factor that the compressive strength was lower in the cement mortar mixed with CSSS 50
and 70 °C.
4.3.6 Leaching Effect of SSS
Table 4.4. Leaching tests of SSS w/wo carbonation (Tests were performed based on the European
Standard Method EN 12-457).
SSS CSSS
30 °C
CSSS
50 °C
CSSS
70 °C
2-Step
CSSS
30 °C
Limit
*
Cr
Pb
Cu
Ni
Cd
[μg/l]
[μg/l]
[μg/l]
[μg/l]
[μg/l]
80.90
3.11
3.75
2.47
0.52
403.03
4.63
1.79
2.58
1.19
321.73
1.45
3.79
3.18
1.66
314.62
1.36
8.25
5.80
0.45
2.32
1.01
3.63
5.00
0.17
50
50
50
10
5
Limits were set by Italian Ministry Decree 5/2/1998
During the application of SSS and CSSS in the cementitious material, leaching of heavy metals
was suspected to be hazardous (Eloneva, 2010). Therefore the leachability of these materials

74
should be compared with the environmental regulation standard. First, SSS and both one-step and
two-step carbonated SSS were tested in order to investigate the effect of carbonation on their
leachability. As shown in Table 4.4, Cr leaching in SSS was higher than the limit and therefore it
should be refrained from directly being used in cement mortar. Leaching of other metal ions were
all below controlled levels. 2-step CSSS had 2.32 μg/l Cr leaching which was quite lower than the
50 μg/l limit. However, unfortunately, all the direct CSSS had surged Cr leaching. Thus, direct
carbonation could not help prevent the leaching of Cr and 2-step CSSS may not be massively
applied in cement material considering the process was still relatively pricy (Huijgen et al., 2007).
Table 4.5. Leaching tests of hydrated cement w/wo CSSS mixed (Tests were performed based on
the European Standard Method EN 12-457).
Cr [μg/l]
Ni [μg/l]
Non-hydrated cement 0.00 10.96
Hydrated cement 1.91 6.25
Cement w
CSSS 30 °C
10 wt% 4.85 7.87
20 wt% 4.86 7.82
30 wt% 6.22 8.84
Cement w
CSSS 50 °C
10 wt% 1.27 12.41
20 wt% 1.85 12.22
30 wt% 2.87 13.94
Cement w
CSSS 70 °C
10 wt% 1.39 12.43
20 wt% 1.81 13.59
30 wt% 2.38 15.32
Limit* 50 10 Limits were set by Italian Ministry Decree 5/2/1998
Although the discussion in 4.3.6 stated that the direct CSSS had the Cr leaching increased by
several folds, the leaching of the cement mortar mixture with CSSS 30, 50, 70 °C was further
studied and compared to Portland cement shown in Table 4.5. Before hydration, Cr leaching was
minimal but Ni leaching was slightly above the limit of 10 μg/l. Hydration of the cement increased
the Cr leaching to 1.91 μg/l but decreased the Ni leaching to 6.25 μg/l. For cement mortar

75
containing direct CSSS samples, Cr leaching increased with more addition of the same type of
CSSS. Also, comparing cement mortar with different CSSS samples added but with the same ratio,
it showed that the leaching of Cr relatively decreased from CSSS samples prepared at 30 °C to
70 °C. It basically agreed with the fact that there was more calcite in CSSS 70 °C and Cr leaching
of calcite (i.e., 2-step CSSS) was low. Although, for some of the mixed cement mortar, the Ni
leaching was above the limit, the contribution from CSSS should be under the limit due to leaching
of Ni in Portland cement paste was relatively high.
This test suggested that it was still possible to utilize the direct CSSS in the cement mortar
since Cr leaching was significantly minimized when they were mixed with raw cement paste after
hydration.
4.4 Conclusions
1 M NaHCO3 was a good buffer for the direct carbonation of SSS in this work. The extent of
carbonation would increase with the rising reaction temperature below 100 °C and in ambient
pressure. It could achieve 50% carbonation of Ca in 12 hours under this mild condition. The
formation of carbonate precipitation could be either on the surface of the particles or in the solution
which might determine the particle size and pore size of the carbonated SSS particles. SEM/EDS
pictures suggested that the amount of SiO2 increased in a large chunk with increasing extent of
carbonation in the SSS samples whereas these SiO2 should be amorphous since XRD could not
identify the specific peak of silica. Also, the pictures showed that the Cr and C after carbonation
in the CSSS samples were quite segregated therefore the formation of chromium carbonate was
unlikely. XRD results showed that the Ca being carbonated in SSS may largely derive from C2S
other than CS and CS2. Based on the calorimetry test, adding direct CSSS could retard the cement

76
hydration therefore extend the overall setting time. Mixing some direct CSSS sample of certain
amount in Portland cement could enhance the comprehensive strength of cement mortar, however,
those substitutes with higher percentage of calcite would eventually decrease their strength. This
was because of the reaction of calcite with C3S and C3A in the Portland cement but calcite would
become inert (i.e., only as a filler material) beyond a threshold value. Finally, the leaching tests
showed that the Cr leaching of the direct CSSS was significantly increased due to the carbonation,
however, Cr leaching of hydrated cement mortar with addition of direct CSSS was minimized,
mostly below 10% of the regulation concentration. The current work suggests that an
environmentally benign cementitious material containing CSSS is achievable that might be
suitable for the application that requires longer setting time (e.g., oil well casing). Future research
could be focused on how to keep or even increase the compressive strength with carbonated SSS
with relatively higher calcite content therefore SSS could sequester more CO2 initially.

77
CHAPTER 5
ACCELERATED CARBONATION OF SLAG FOR CARBON
SEQUESTRATION AND WASTE VALORIZATION
The contents of this chapter titled “Accelerated Carbonation of Stainless Steel Slag via Two-Step
Carbon Mineralization” are to be submitted to the Journal of Energy & Environmental Science
(X.Z. Zhou, L. Simone, Y. Park, J. Wang, A. Polettini and A.-H. A. Park).
Abstract
Iron and steel slag is one of the industrial wastes which could be an alternative to Ca/Mg
based silicate minerals for mineral carbonation and stainless steel slag is one of them. The
carbonation process could happen in either a one-step or a two-step route. In the one-step process
(i.e., direct carbonation), the stainless steel slag and CO2 flow are introduced into the solvent
simultaneously. Whereas for the two-step one, which is investigated in this study, Ca is extracted
from the solid matrix into the aqueous phase, and then the carbon dioxide is bubbled through and
reacted with the Ca ion. Particularly, the two-step route allows optimizing the conditions for the
dissolution and carbonation, respectively. Moreover, the precipitated end products from the two-
step route can be adapted towards purer quality for industrial applications. In this work, several
organic and inorganic chelating agents are applied in order to accelerate the dissolution. Citrate,
glutamate and picolinate sodium salt solutions are found to be desirable for the stainless steel slag
dissolution at different pH values which is adjacent to their pKA values. Besides, increasing the
ligand concentration and temperature could also increase the extent of Ca extraction. However, the
differential bed reactor and batch reactor are found to be quite different in terms of the dissolution
efficiency. For the carbonation step, spherical PCCs (precipitated calcium carbonate) are formed
at a low pH and a low temperature, however, the PCCs with crystal structures prepared at a high

78
pH and a high temperature are observed. PCCs synthesized from the Ca-rich solution from SSS
are always crystalline. Also, PCCs synthesized in bubble column reactor are found to be flake-
shape for both the model system and the Ca-rich solution from SSS. The leaching tests of SSS
before and after dissolution have shown that concentrations of most elements except Cr can meet
relevant environmental regulations.
5.1 Introduction
The rapid increase in the atmospheric carbon dioxide (CO2) concentration from industrial
emissions is considered as one of the major causes for the changing climate (IPCC, 2007a).
Reduction of CO2 emissions can be achieved by improving energy efficiency, implementing
renewable energy, and developing carbon capture, utilization and storage (CCUS) technologies.
Global energy demand continues increasing (IEA, 2010), and fossil fuel will still be the major
source while renewable energy technologies evolve. Therefore by sequestering CO2, the
atmospheric CO2 concentration can be stabilized or reduced in this context. Various schemes have
been proposed and developed for efficient CO2 capture and sequestration (Haszeldine, 2009;
Lackner, 2003) including geological storage (Holloway, 2001; Orr, 2009), ocean storage (Brewer
et al., 1999; Martin et al., 1994), and mineral sequestration (Zevenhoven and Fagerlund, 2010).
Among them, CO2 mineral sequestration involves the exothermic carbonation of naturally
occurring Ca/Mg-bearing silicate minerals, such as serpentine group minerals (X3Si2O5(OH)4, X
= Mg, Fe, Fe, Ni, Al, Zn or Mn), olivine group minerals (X2SiO4, X = Ca, Fe, Mn, Ni, Mg) and
wollastonite (CaSiO3 or Ca3(Si3O9)) (Mindat.org, 2015). Recently, the occurrence of Ca or Mg
elements in industrial wastes also draws the attention of researchers toward the re-use of these
wastes as the mineral alternative. Overall, the global potential of CO2 sequestration by using the
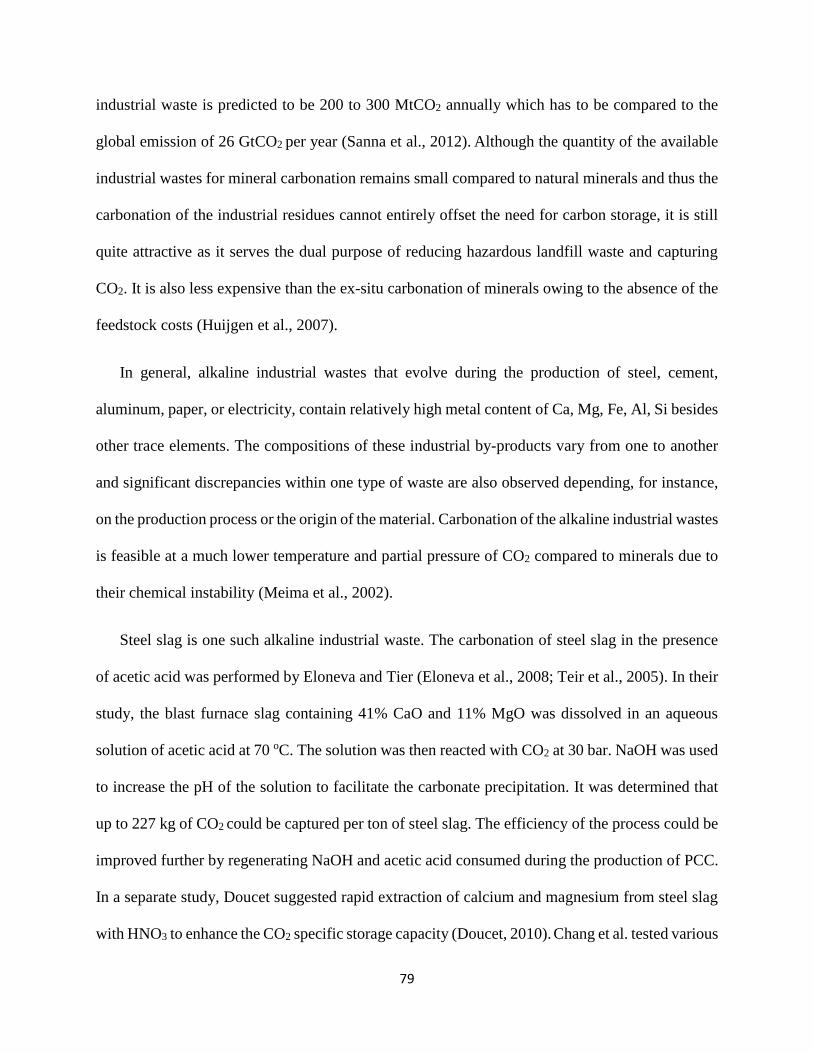
79
industrial waste is predicted to be 200 to 300 MtCO2 annually which has to be compared to the
global emission of 26 GtCO2 per year (Sanna et al., 2012). Although the quantity of the available
industrial wastes for mineral carbonation remains small compared to natural minerals and thus the
carbonation of the industrial residues cannot entirely offset the need for carbon storage, it is still
quite attractive as it serves the dual purpose of reducing hazardous landfill waste and capturing
CO2. It is also less expensive than the ex-situ carbonation of minerals owing to the absence of the
feedstock costs (Huijgen et al., 2007).
In general, alkaline industrial wastes that evolve during the production of steel, cement,
aluminum, paper, or electricity, contain relatively high metal content of Ca, Mg, Fe, Al, Si besides
other trace elements. The compositions of these industrial by-products vary from one to another
and significant discrepancies within one type of waste are also observed depending, for instance,
on the production process or the origin of the material. Carbonation of the alkaline industrial wastes
is feasible at a much lower temperature and partial pressure of CO2 compared to minerals due to
their chemical instability (Meima et al., 2002).
Steel slag is one such alkaline industrial waste. The carbonation of steel slag in the presence
of acetic acid was performed by Eloneva and Tier (Eloneva et al., 2008; Teir et al., 2005). In their
study, the blast furnace slag containing 41% CaO and 11% MgO was dissolved in an aqueous
solution of acetic acid at 70 oC. The solution was then reacted with CO2 at 30 bar. NaOH was used
to increase the pH of the solution to facilitate the carbonate precipitation. It was determined that
up to 227 kg of CO2 could be captured per ton of steel slag. The efficiency of the process could be
improved further by regenerating NaOH and acetic acid consumed during the production of PCC.
In a separate study, Doucet suggested rapid extraction of calcium and magnesium from steel slag
with HNO3 to enhance the CO2 specific storage capacity (Doucet, 2010). Chang et al. tested various

80
types of steelmaking slags such as ultra-fine, fly-ash and blended hydraulic cement at 40-160 oC
and 49 bar for 12 hours and determined that the blended hydraulic cement with the highest content
of CaO and lowest content of SiO2 resulted in the best conversion. The highest carbonation
conversion reported was 68% with a storage capacity of 283 kg of CO2 per ton of blended hydraulic
cement (Chang, 2011).
In this paper, a two-step CO2 mineral sequestration process using stainless steel slag (SSS)
including the dissolution and carbonation was explored. Different from the solvents reported
previously, several other organic chelating agents were included in order to enhance the dissolution
kinetics and improve the extraction efficiency. Particularly, a differential bed reactor was used in
order to feed the steel slag with a continuous flow of fresh solvent. The dissolution step was also
performed in the batch reactor with factors such as pH, temperature, type of chelating agent and
ligand concentration investigated. The carbonation process was performed in a batch reactor and
a CO2 bubble column reactor. Morphologies and sizes of PCC from the Ca-containing solution
prepared by pure chemicals and the Ca-rich solution from dissolved steel slag were compared in
order to examine the nucleation process of the carbonates which might determine its crystal
structures. Effects of reaction pH, temperature, reactor type and CO2 dissolution kinetics were
studied. Finally, a leaching test was applied to obtain concentrations of the elemental constituents,
which would release from stainless steel slag when they were placed in a landfill disposal site, in
order to investigate their fate in the environment and associated risks.

81
5.2 Materials and Experimental
5.2.1 Materials and Characterization
Stainless steel slag sample was procured from the ThyssenKrupp steel production plant at Terni
of Italy. The material was sampled from the outflow of the metal recovery process following
electric arc furnace (EAF). Since the material had high moisture content, it was dried at 60 °C for
48 hours prior to experiments. In order to control the particle size for the fast kinetic dissolution
study, the raw material was sieved to collect particles smaller than 175 μm and the particles larger
than 175 μm were grounded further to meet the particle size requirement. The particle size
distribution of SSS was obtained via a laser diffraction measurement (LSTM 13320 MW, Beckman
Coulter Inc., Brea, CA) shown in Figure 5.1. The crystal structure of SSS particle was
characterized by a X-ray diffractometer (XRG-3000, Inel Inc., Stratham, NH).
Figure 5.1. Particle size distribution of sieved stainless steel slag (the fraction smaller than mesh
diameter of 175 µm).
In order to investigate the effect of the chelating agents on the dissolution kinetics of SSS
particle in the differential bed reactor, several ligand containing salts were selected: sodium acetate
(C2H3NaO2), sodium gluconate (C6H11NaO7), sodium glutamate (C5H8NNaO4), sodium picolinate

82
(C6H4NNaO2), and sodium citrate (C6H5Na3O7). In addition to the chelating agents, various
solvents such as de-ionized (DI) water, ammonium chloride (NH4Cl) and ammonium nitrate
(NH4NO3) were also tested for the comparison.
For the dissolution experiments in the batch reactor, gluconate in the form of acid was used
because it was the only chelating agent which was still soluble at the concentration of 1 M at room
temperature. In addition, NH4Cl was also selected. Then calcium nitrate (Ca(NO3)2) and calcium
chloride (CaCl2) were used for providing Ca ions, and potassium carbonate (K2CO3) was applied
to offer carbonate ions during the production of PCC with pH adjusted by the ammonium chloride,
nitric acid (HNO3) and potassium hydroxide (KOH). All the chemicals above were supplied by
Sigma-Aldrich Co. LLC (St. Louis, MO).
5.2.2 Fast dissolution kinetics of SSS
Figure 5.2. Schematic of reactor systems for SSS dissolution and carbonation: (a) differential bed
reactor and (b) batch reactor and bubble column reactor.
First, 0.01 M solutions of each chelating agent were prepared by dissolving relevant amount
of their salts in 500 ml DI water, separately. DI water only was also used for the dissolution.

83
Second, the pH of the chelating agents prepared were adjusted to the final values of 5 and 2,
respectively.
The differential bed reactor consisted of a 60 ml syringe with a screwed filter holder on the top
coupled with a syringe pump (NE-1000, New Ear Pump System Inc., Farmingdale, NY), which
was illustrated in Figure 5.2 (a). The injection rate and the total injection volume were programmed
manually on the pump system. The reusable filter holder was composed of a top and a bottom part.
The top part was connected to the syringe. A filter paper coated with specified sample of SSS (100
mg) was applied to the bottom part and covered with a second filter, both of pore size 11 µm.
Before bolting these two parts together, an O-ring was used on the second filter to seal the system.
Upon the dissolution, the process time had to be recorded by a chronometer starting from the
very first drop falling into the sample tube. The syringe pump was set to a speed of 10 ml per
minute, and therefore each experiment was carried out about six minutes. Afterwards, the liquid
samples were collected every 20 s in a 10 ml syringe with a screwed filter of 0.2 μm pore size. The
liquids were immediately pushed through the filter into a test tube to remove all the fines and,
therefore, to avoid the continuance of the dissolution progress. The collected samples were diluted
accordingly for the subsequent elemental analysis by ICP-AES (ACTIVA-M, Horiba Jobin Yvon
Inc., Edison, NJ). During the process, the pH of the untreated solvent, the samples collected at 20
s and at 360 s were measured, respectively.
5.2.3 SSS dissolution and carbonation
The other reaction system applied in this study was a continuous stirring batch reactor for the
SSS dissolution combined with a bubble column reactor for the CO2 carbonation shown in Figure
5.2 (b). The SSS was mixed with solvent in the batch reactor. Water bath (ISOTEMP 205, Fisher

84
Scientific, Hampton, NH) was used in order to maintain different reaction temperatures. An
immersible stirrer unit (EW-04636-50, Cole-Parmer, Vernon Hills, IL) was applied to mix the
reactants constantly. Afterwards, the carbonation was performed in the bubble column reactor, in
which, Ca-rich solution after the SSS dissolution was transferred from the batch reactor and carbon
dioxide was bubbled through the gas distributor. The gas distributor was made by filling the cavity
with polyethylene spheres to distribute the gas on the porous base. A pH meter probe (Accument
basic AB 15, Fisher Scientific, Hampton, NH) was placed in the column continuously measuring
the pH in the solution.
For the dissolution experiments, 6.8 g of SSS was mixed with 100 ml of different solvents for
each batch and the dissolution reaction last for 1 hour with a mixing rate 1000 rpm. 0.01 M, 0.1 M
and 1 M of gluconic acid and ammonium chloride were compared in terms of the extent of the Ca
extraction at room temperature and pressure. Furthermore, 0.1 M of gluconic acid and ammonium
chloride were studied under similar reaction conditions to the above but with varied reaction
temperatures: 25 ˚C, 40 ˚C, 60 ˚C and 80 ˚C.
For the carbonation in the batch reactor, 25 ml of 1 M calcium nitrate, calcium chloride or the
Ca-rich solution obtained from SSS dissolution (dissolved by 1 M ammonium chloride at 80 ˚C
for 1 hour) were mixed with 50 ml of 1 M potassium carbonate in the batch reactor with stirring
rate of 750 rpm at ambient temperature and pressure. The batch reactor was also kept in a water
bath, in order to reduce the temperature fluctuations caused by the heat emitted during the
exothermic reaction (ΔHºf, CaCO3 = -1207.6 kJ/mol) (Huijgen and Comans, 2005a). The fixed
retention time was measured from the moment when the solutions were added until the stirring
was stopped which was 15 minutes. Another set of batch reactor experiments were carried out
using 0.5 M Ca(NO3)2 and the dissolved SSS solution, respectively, compared to the experiments

85
in the bubble column reactor using 0.5 M CaCl2 and the dissolved SSS solution separately. 1 M
K2CO3 was added as the carbonate ion source for the batch reactor reactions while CO2 was
bubbled through the column reactor.
All the above solutions after reaction were immediately vacuum filtered through a filter paper
of 2.5 µm pore size, and then filtered again with syringe filters with a pore size of 0.2 µm.
Ammonium chloride, nitric acid or potassium hydroxide were used for adjusting the pH of the
reaction. The sizes and morphologies of all collected PCC were observed with a Scanning Electron
Microscope (JSM-5600 LV, JEOL, Ltd., Japan).
5.2.4 Leaching tests
According to the European Standard Method EN 12-457-2 (CEN, 1999), the moisture content
of the samples was measured first, by keeping part of the sample in an oven at a temperature of
105 °C until it had reached a constant weight. However, the solids used for this measurement were
not used for the test, avoiding the changing properties of the samples by applying a thermal
treatment.
In this test, an amount of solid sample of approximately 20 g has been weighed on an analytical
balance. Herein, SSS and dissolved SSS (in 1 M of ammonium chloride in the batch reactor for 30
minutes) were applied. The solid sample was put into a 250 ml plastic bottle with 200 ml of water.
The bottle was sealed and put on a rolling table (Model 2050, Associated Design and
Manufacturing Co.), at a speed of approximately 10 rpm for 24 hours. At the end of the mixing,
part of the mixture (~ 80 ml) was sampled and filtered with a syringe filter of 0.2 µm pore size.
The conductivity and pH of the filtered sample were measured. The leachate was acidified by the

86
addition of an appropriate amount of nitric acid. After dilution, the samples were analyzed on the
ICP-AES to determine the elemental concentrations.
5.3 Results and discussion
5.3.1 Characterization of procured SSS
Table 5.1. Chemical compositions of procured SSS from ThyssenKrupp plant at Terni measured
by Atomic Absorption Spectrometer (AAS). Data is provided by ThyssenKrupp plant
environmental office.
Elemental concentration (wt%)
Ca Si Cr Mg Fe Al Mn Ni
35.21 15.09 4.03 2.92 2.82 1.21 0.83 0.06
Prior to the dissolution study, the compositional and structural analyses of SSS particle were
performed. As listed in Table 5.1, approximately 35 wt% of Ca and 3 wt% of Mg were found in
the slag which was due to the addition of limestone and dolomite to the scrap during the melting
process to remove impurities (i.e. silica, sulfur, and phosphorous) (Hogan, 1994). Besides, it
contained other valuable elements such as Fe, Ni, Cr, etc., which could potentially reduce the
overall cost of the carbonation integrated with the extraction schemes.
The crystal structure of the slag particle was identified from X-ray diffraction (XRD)
spectrum (Figure 5.3). The result indicates that the slag sample dominantly contains Ca in forms
of Ca2SiO4 and CaO. Besides, Ca is also bonded with other elements in the form of CaSO4,
Ca3Mg(SiO4)2, CaAl2Si2O8, KCaAl2F9, KCaP3O9. The mineral species identified via XRD are
coherent with the composition showed in Table 5.1.

87
Figure 5.3. X-ray diffraction pattern of un-dissolved SSS.
5.3.2 Fast dissolution kinetics of SSS with chelating agents
In order to investigate the effect of the chelating agents on the fast dissolution kinetics of SSS,
several chelating agents were selected. The chelating agents’ properties are listed in Table 5.2.
Each chelating agent forms complexes and/or can be precipitated by reacting with metal ions in
the solution. The reaction between the metal ion and chelating agent via the ligand interaction can
be expressed as,
mM + lL + hH+ ↔ MmLlHh (Rxn. 5.1)
where M and L indicated metal ion species and chelating agents, respectively. Thus, it was
expected that the extracted calcium species in aqueous solution from steel slag via chelating agent
existed as dissolved free Ca2+ ions or a complexed Ca species with chelating agent.
First, the effect of the chelating agents on Ca and Si extraction were investigated. Since it has
been know that pH plays a significant role in the dissolution process (Park et al, 2003), initial pH
condition of each solvent had been adjusted to pH 2 or pH 5 for the comparison. Figure 5.4 shows
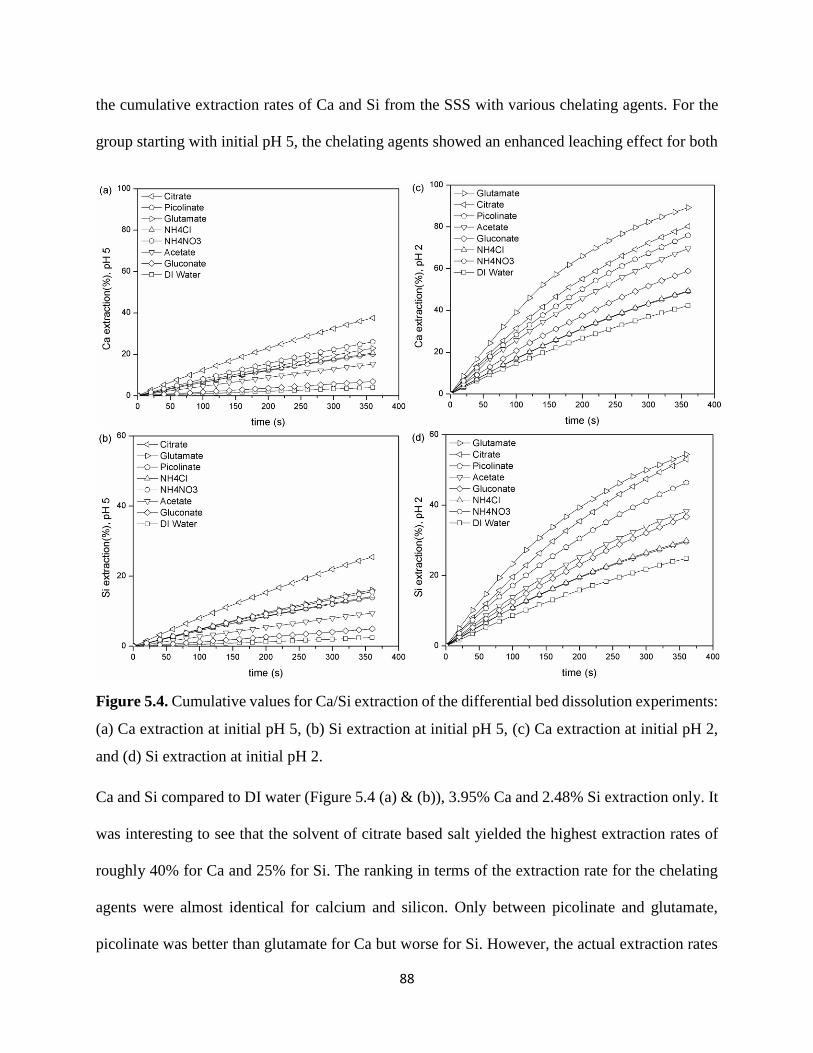
88
the cumulative extraction rates of Ca and Si from the SSS with various chelating agents. For the
group starting with initial pH 5, the chelating agents showed an enhanced leaching effect for both
Figure 5.4. Cumulative values for Ca/Si extraction of the differential bed dissolution experiments:
(a) Ca extraction at initial pH 5, (b) Si extraction at initial pH 5, (c) Ca extraction at initial pH 2,
and (d) Si extraction at initial pH 2.
Ca and Si compared to DI water (Figure 5.4 (a) & (b)), 3.95% Ca and 2.48% Si extraction only. It
was interesting to see that the solvent of citrate based salt yielded the highest extraction rates of
roughly 40% for Ca and 25% for Si. The ranking in terms of the extraction rate for the chelating
agents were almost identical for calcium and silicon. Only between picolinate and glutamate,
picolinate was better than glutamate for Ca but worse for Si. However, the actual extraction rates

89
for both chelating agents were quite close to each other about 20% for Ca and 15% for Si. NH4Cl
and NH4NO3 achieved very similar extraction rates for both Ca and Si. Their extraction rates were
slightly lower than picolinate and glutamate. Acetate was between ammonium based salts and
gluconate with about 15% extraction for Ca and 10% for Si. Gluconate didn’t show a significant
effect on enhancing the dissolution of the slag which was just a little bit better than the DI water.
Overall, the calcium was easier than the silicon to be extracted from the slag due to that most of
the chelating agents were Ca-targeted and the same trend was also observed in the set of
experiments with pH 2 as shown in Figure 5.4 (c) & (d). The dissolution of steel slag with the
same solvents, but with initial pH lowered to 2, was improved uniformly. For Ca, DI water
achieved 40% extraction mostly due to the increased concentrations of protons compared to 3.95%
at pH 5. Glutamate was the best one instead of citrate with an extraction close to 90%. Citrate was
still one of the best solvents with an extraction about 80% and the extraction went up to 76% for
picolinate. Acetate greatly improved the extraction from 15% to almost 70% and similar case
happened to gluconate with an extraction from 7% to 59%. The two ammonium-based solvents
still achieved very similar extraction rates with the value roughly doubled to 40%. Dissolution of
Si was also enhanced following the same trend and similar ranking of different solvents but with
only 55% extraction in maximum.
The pH values at the reaction time of 20 s and 360 s were measured for each batch with their
final extent of the Ca extraction in Figure 5.5. Because the observed pH increments happened in
all the collected solvents after the contact with steel slag, it proved that the steel slag waste was
alkaline. Generally, the gap between the pH values of the un-reacted chelating agent and the
dissolved liquid sample at different times indicated the relative extent of ion exchange between
the H+ and Ca during the dissolution. It was higher in the beginning and decreased as the reaction

90
went on. It meant that the extent of dissolution was greater earlier and then it gradually decreased
and flattened when reaching the limit. However, for the case of gluconate and DI water of pH 5,
the pH of the samples at 360 s were slightly higher than those at 20 s. Considering the relative low
extraction rate for these two solvents, there was still excessive slag depleting the protons in the
solvent therefore the pH were still high. Also, it was interesting to see that for the best three
chelating agents, citrate, picolinate and glutamate, the pH changes were basically smaller than
others which could be a clue that a good buffering system was favored in terms of the steel slag
dissolution.
Figure 5.5. Linear fitting of extraction rate constants for citrate systems using three kinds of kinetic
models: (a) pH 5 and (b) pH 2.
In general, the extraction rate of Ca from steel slag is determined by three factors: pH, buffer
strength and chelating effect. The effect of pH can be proved by the case of DI water and low pH
is favored which could provide more protons. At the same time, the buffer capacity of each solvent
is also important. The pH range of a buffer system could be expressed as (Morel and Hering, 1993):
pH = pKA ± 1 (Eq. 5.1)

91
Table 5.2. Properties of various chelating agents (β = stability constant).
Ligands Complex log(β) Acid form Molecular structure pKA
Acetate CaL+ 1.2 C2H4O2
pKA = 4.76
Gluconate CaL2 1.21 C6H12O7
pKA = 3.86
Glutamate CaL 2.1 C5H9NO4
pKA,1 = 2.13
pKA,2 = 4.31
pKA,3 = 9.67
Picolinate CaL2 3.8
C6H5NO2
pKA,1 = 1.01
CaL+ 2.2 pKA,2 = 5.39
Citrate
CaH2L+ 12.3
C6H8O7
pKA,1 = 3.13
CaHL 9.5 pKA,2 = 4.76
CaL- 4.7 pKA,3 = 6.40
For inorganic solvents, both ammonium chloride and ammonium nitrate are salts of weak base and
strong acid but the strength of the buffer system is weak. For organic solvents, polyprotic acids
normally have a stronger buffer strength than monoprotic acids. It is because of that the depletion
of the protons due to the dissolution will further drive the dissociation of the acid to offset the drop
of the proton concentration. Particularly, both picolinate and glutamate aqueous solutions contain
the zwitterions part and NH3+ is a weak acid and thus the last level ionization of their acids is
derived from the NH3+ group (Neuberger, 1936). Base on the Equation 5.1, the buffer strength of
each solvent could be calculated from the pKA values of each chelating agent in the form of its
acid in Table 5.2. At pH 5, it is close to the pKA,2 of both citrate and picolinate which are the best
two buffer systems and they are also the best two solvents towards Ca extraction. At pH 2, it is
close to the pKA,1 value of glutamate which is the best one in terms of both buffer strength and Ca
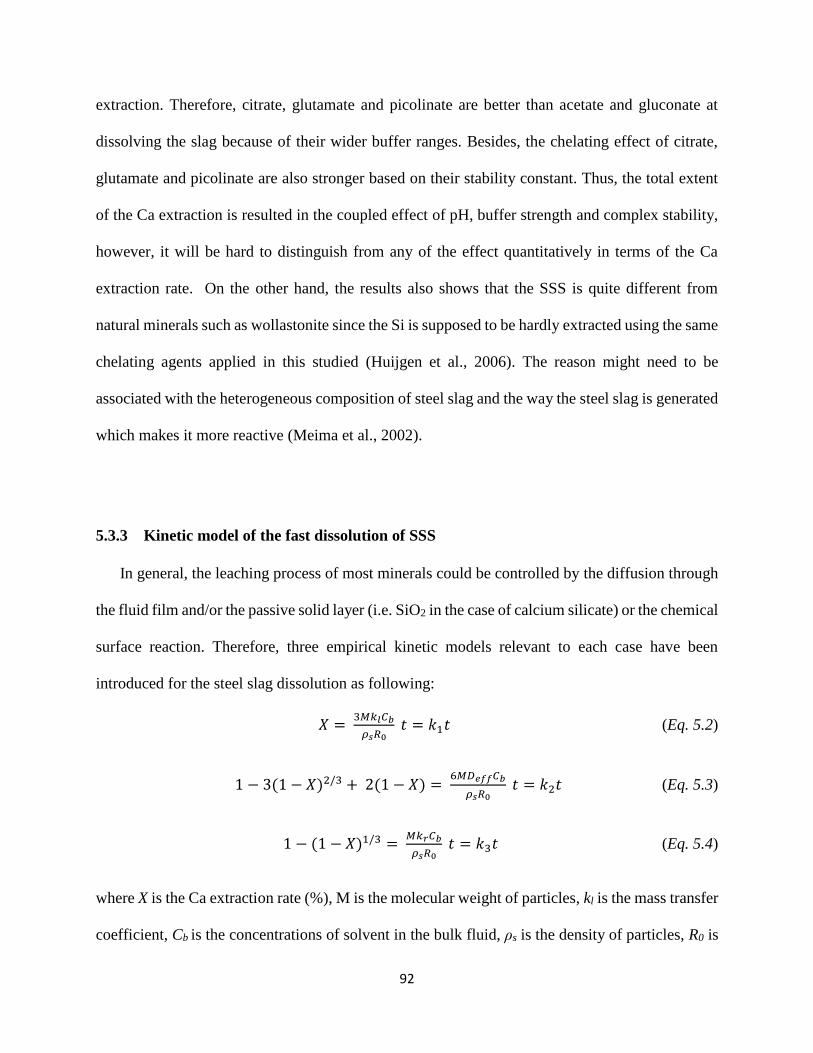
92
extraction. Therefore, citrate, glutamate and picolinate are better than acetate and gluconate at
dissolving the slag because of their wider buffer ranges. Besides, the chelating effect of citrate,
glutamate and picolinate are also stronger based on their stability constant. Thus, the total extent
of the Ca extraction is resulted in the coupled effect of pH, buffer strength and complex stability,
however, it will be hard to distinguish from any of the effect quantitatively in terms of the Ca
extraction rate. On the other hand, the results also shows that the SSS is quite different from
natural minerals such as wollastonite since the Si is supposed to be hardly extracted using the same
chelating agents applied in this studied (Huijgen et al., 2006). The reason might need to be
associated with the heterogeneous composition of steel slag and the way the steel slag is generated
which makes it more reactive (Meima et al., 2002).
5.3.3 Kinetic model of the fast dissolution of SSS
In general, the leaching process of most minerals could be controlled by the diffusion through
the fluid film and/or the passive solid layer (i.e. SiO2 in the case of calcium silicate) or the chemical
surface reaction. Therefore, three empirical kinetic models relevant to each case have been
introduced for the steel slag dissolution as following:
𝑋 = 3𝑀𝑘𝑙𝐶𝑏
𝜌𝑠𝑅0 𝑡 = 𝑘1𝑡 (Eq. 5.2)
1 − 3(1 − 𝑋)2/3 + 2(1 − 𝑋) = 6𝑀𝐷𝑒𝑓𝑓𝐶𝑏
𝜌𝑠𝑅0 𝑡 = 𝑘2𝑡 (Eq. 5.3)
1 − (1 − 𝑋)1/3 = 𝑀𝑘𝑟𝐶𝑏
𝜌𝑠𝑅0 𝑡 = 𝑘3𝑡 (Eq. 5.4)
where X is the Ca extraction rate (%), M is the molecular weight of particles, kl is the mass transfer
coefficient, Cb is the concentrations of solvent in the bulk fluid, ρs is the density of particles, R0 is
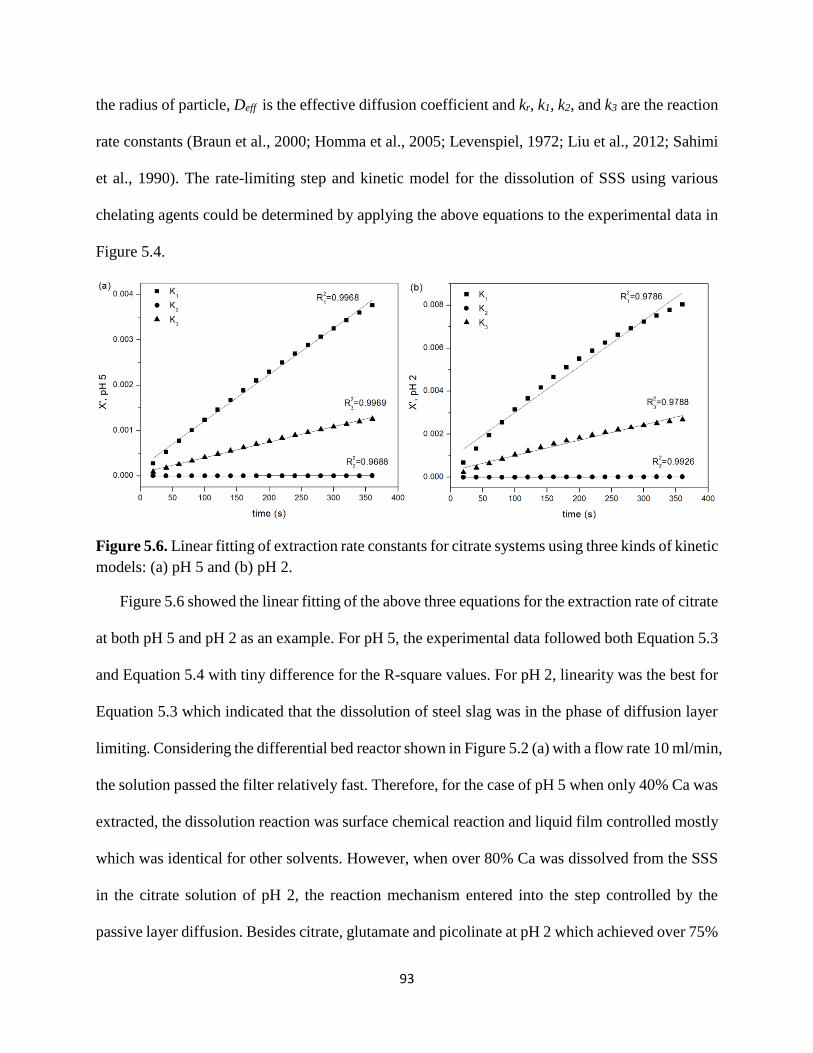
93
the radius of particle, Deff is the effective diffusion coefficient and kr, k1, k2, and k3 are the reaction
rate constants (Braun et al., 2000; Homma et al., 2005; Levenspiel, 1972; Liu et al., 2012; Sahimi
et al., 1990). The rate-limiting step and kinetic model for the dissolution of SSS using various
chelating agents could be determined by applying the above equations to the experimental data in
Figure 5.4.
Figure 5.6. Linear fitting of extraction rate constants for citrate systems using three kinds of kinetic
models: (a) pH 5 and (b) pH 2.
Figure 5.6 showed the linear fitting of the above three equations for the extraction rate of citrate
at both pH 5 and pH 2 as an example. For pH 5, the experimental data followed both Equation 5.3
and Equation 5.4 with tiny difference for the R-square values. For pH 2, linearity was the best for
Equation 5.3 which indicated that the dissolution of steel slag was in the phase of diffusion layer
limiting. Considering the differential bed reactor shown in Figure 5.2 (a) with a flow rate 10 ml/min,
the solution passed the filter relatively fast. Therefore, for the case of pH 5 when only 40% Ca was
extracted, the dissolution reaction was surface chemical reaction and liquid film controlled mostly
which was identical for other solvents. However, when over 80% Ca was dissolved from the SSS
in the citrate solution of pH 2, the reaction mechanism entered into the step controlled by the
passive layer diffusion. Besides citrate, glutamate and picolinate at pH 2 which achieved over 75%

94
extraction are all in the same phase eventually. Nevertheless, reactions of steel slag with acetate
or gluconate at pH 2 are still controlled by the surface chemical reaction. Thus, considering the
heterogeneous nature of steel slag, it can be hypothesized that the dissolution of steel slag initially
is surface chemical reaction and liquid film diffusion controlled, of which, the period depends on
the concentration and pH of the solvent. After most of the non- or thin-layered particles in the slag
are dissolved, the reaction will be passive layer diffusion controlled with those particles with shell
structure left mostly.
5.3.4 SSS dissolution in batch reactor
Effect of ligand concentrations. Gluconic acid and ammonium chloride were selected as the
solvents for the SSS dissolution in the batch reactor. Figure 5.7 showed the extent of the Ca
extraction for those two solvents with different concentrations. By increasing the concentration of
the chelating agents, the pH was lowered and therefore the Ca extraction was also enhanced. For
gluconic acid the final pH after reaction was decreased more significant from 0.1 M to 1 M,
because it was a stronger acid than ammonium chloride (pKa of gluconic acid was 3.86, as opposed
to 9.25 of ammonium chloride) (Morel and Hering, 1993). Nevertheless, ammonium chloride
achieved higher Ca dissolution rate probably due to its buffer effect consistent with the results in
the fast dissolution experiments. The percentage of the Ca leached out from SSS by 1 M gluconic
acid was 21% and it was 29% for 1 M NH4Cl both of which were greatly improved comparing to
the case of 0.01 M. Therefore, in order to obtain a decent extraction rate of Ca, the higher
concentration of solvents is favored.

95
Figure 5.7. Effect of solvent concentration on SSS dissolution in terms of Ca extraction rate in
filtrate and final pH at ambient temperature and pressure (68 mg/ml initial solid concentration,
mixing rate = 1000 rpm, reaction time = 1 hour).
Effect of temperature. Temperature was expected to influence the kinetics of the reaction and
enhance the dissolution rate. Huijgens et al. (Huijgen and Comans, 2006) identified 200 °C as the
optimum temperature, but in their experiments the carbonation took place along with dissolution
in the same reactor. Lekakh (Lekakh et al., 2008a, 2008b), on the other hand, observed that even
if the dissolution rate was improved, the final concentration of Ca in the leached solution was
almost the same, independently from the temperature. Since the extent of Ca extraction was
measured after 1 hour dissolution, it was impossible to observe the change in the dissolution rate.
Nevertheless, as far as the dissolution efficiency was the only concern, the behavior found in the
experiments was coherent to the observations of Lekakh in the case of gluconic acid, while it was
completely different for NH4Cl shown in Figure 5.8. From 25 ˚C to 80 ˚C, the Ca extraction barely
changed when using gluconic acid. In the experiments when NH4Cl was used, the extent of
dissolution was related to temperature, so that the Ca2+ leached increased as the temperature
increased. This behavior could be explained by the fact that the dissolution of the calcium in an
ammonium chloride solution happened according to the following reaction (Kodama et al., 2006):

96
Figure 5.8. Effect of temperature on SSS dissolution in terms of Ca extraction rate in filtrate (68
mg/ml initial solid concentration, acid concentration = 0.1 M, mixing rate = 1000 rpm, reaction
time = 1 hour).
4NH4Cl (aq) + 2CaO ∙ SiO2 (s) → SiO2 (s) ↓ + 2CaCl2 (aq) + 4NH3 (aq) + 2H2O (l) (Rxn. 5.2)
The NH3 formed was found to be evaporated especially at a higher temperature, therefore driving
the reaction towards the dissolution direction. In other words, the release of the ammonia from the
solution influenced the reaction equilibrium therefore improving the yield of the dissolved Ca.
This explanation was in consistent with the vapor pressure curve for NH3 as a function of
temperature also presented in Figure 5.8. This result implies that an appropriate temperature should
be selected when applying different chelating agents. For some chelating agents, increasing the
temperature will not enhance the dissolution therefore other means should be considered.
Comparing the extent of the Ca extraction in the differential bed reactor and the batch reactor,
0.01 M NH4Cl with pH adjusted to 5 extracted 20% Ca in only six minutes but 0.01 M NH4Cl of
pH 5.13 extracted only 1.44% Ca in a 1 hour reaction. The possible reason leading to this great
discrepancy is that the way of pH change in these two types of reactors are different. In the
differential bed reactor, fresh solvent with constant pH value goes through the reaction cell,
however, pH goes up in the batch reactor due to the proton depletion as the dissolution moves

97
forward. Therefore, for industrial application, the type of the reactor with continuous reactant
inflow and product outflow would be favored.
5.3.5 PCC synthesis
Figure 5.9. Effect of pH on morphological characteristics of PCC synthesized from 25 mL of 1 M
Ca(NO3)2 and 50 ml of 1 M K2CO3 solutions at ambient temperature and pressure (mixing rate =
750 rpm, reaction time = 15 minutes, the reaction pH was adjusted by adding NH4Cl, HNO3 or
KOH).
Effect of initial pH. In order to study the influence of the pH on the precipitation of the calcium
carbonate, the pH of either the calcium salt solution or the carbonate salt solutions previously
described in section 5.2.1 was tuned by either adding nitric acid or ammonium chloride to the
calcium nitrate solution, or by adding potassium hydroxide to the potassium carbonate solution.
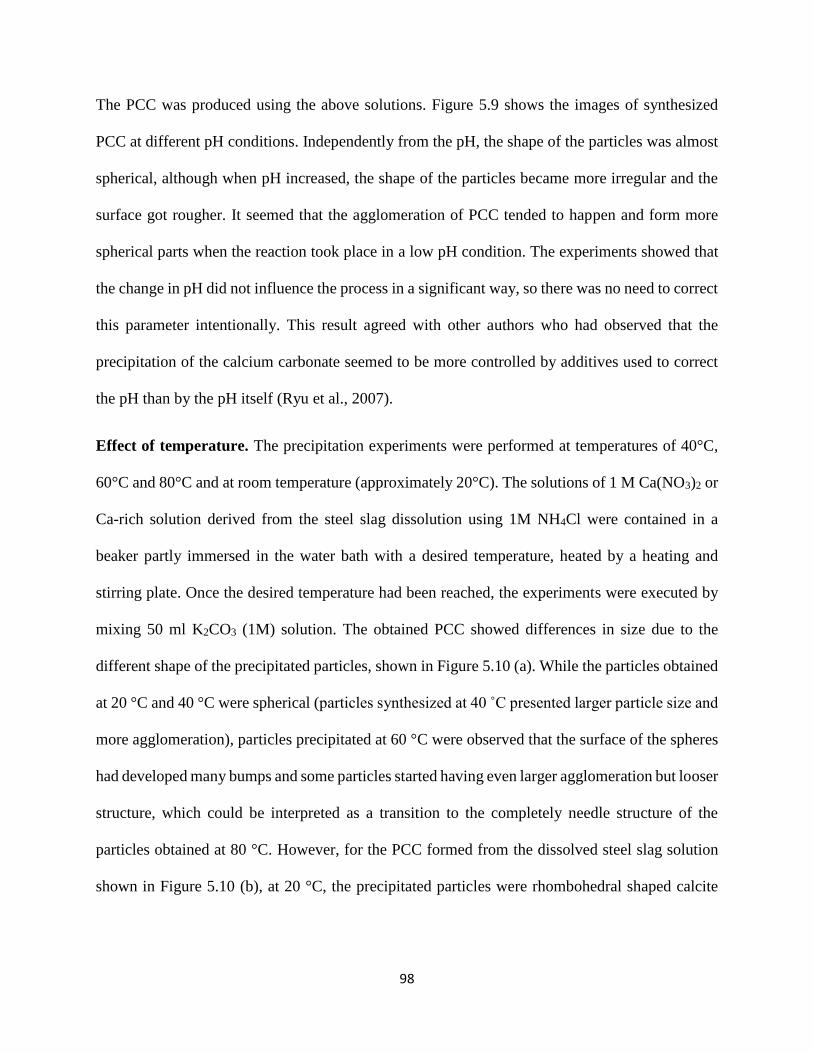
98
The PCC was produced using the above solutions. Figure 5.9 shows the images of synthesized
PCC at different pH conditions. Independently from the pH, the shape of the particles was almost
spherical, although when pH increased, the shape of the particles became more irregular and the
surface got rougher. It seemed that the agglomeration of PCC tended to happen and form more
spherical parts when the reaction took place in a low pH condition. The experiments showed that
the change in pH did not influence the process in a significant way, so there was no need to correct
this parameter intentionally. This result agreed with other authors who had observed that the
precipitation of the calcium carbonate seemed to be more controlled by additives used to correct
the pH than by the pH itself (Ryu et al., 2007).
Effect of temperature. The precipitation experiments were performed at temperatures of 40°C,
60°C and 80°C and at room temperature (approximately 20°C). The solutions of 1 M Ca(NO3)2 or
Ca-rich solution derived from the steel slag dissolution using 1M NH4Cl were contained in a
beaker partly immersed in the water bath with a desired temperature, heated by a heating and
stirring plate. Once the desired temperature had been reached, the experiments were executed by
mixing 50 ml K2CO3 (1M) solution. The obtained PCC showed differences in size due to the
different shape of the precipitated particles, shown in Figure 5.10 (a). While the particles obtained
at 20 °C and 40 °C were spherical (particles synthesized at 40 ˚C presented larger particle size and
more agglomeration), particles precipitated at 60 °C were observed that the surface of the spheres
had developed many bumps and some particles started having even larger agglomeration but looser
structure, which could be interpreted as a transition to the completely needle structure of the
particles obtained at 80 °C. However, for the PCC formed from the dissolved steel slag solution
shown in Figure 5.10 (b), at 20 °C, the precipitated particles were rhombohedral shaped calcite
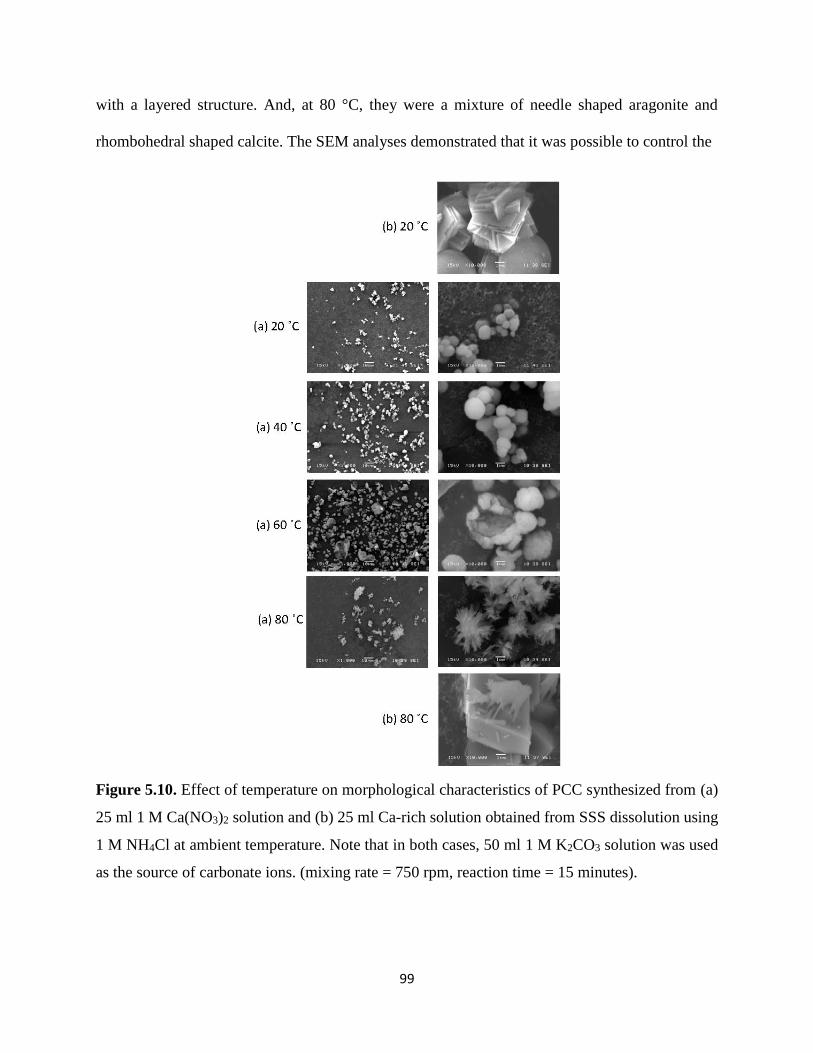
99
with a layered structure. And, at 80 °C, they were a mixture of needle shaped aragonite and
rhombohedral shaped calcite. The SEM analyses demonstrated that it was possible to control the
Figure 5.10. Effect of temperature on morphological characteristics of PCC synthesized from (a)
25 ml 1 M Ca(NO3)2 solution and (b) 25 ml Ca-rich solution obtained from SSS dissolution using
1 M NH4Cl at ambient temperature. Note that in both cases, 50 ml 1 M K2CO3 solution was used
as the source of carbonate ions. (mixing rate = 750 rpm, reaction time = 15 minutes).

100
particle shape by changing the temperature. Owing to the fact that spherical shaped particles were
used in the paper industry as fillers (Stratton, 2012) and the reaction temperature was related to
heat supply and energy costs, room temperature was favored as the operating condition in the
following experiments.
Figure 5.11. pH variation in bubble column reactor during PCC precipitation from Ca-rich
solution obtained from SSS dissolution using 1 M NH4Cl and 0.15 M CaCl2 solution with Ca
concentration equivalent to the extracted Ca solution from SSS and pH adjusted with 1 M NH4OH.
Effect of CO2 dissolution kinetics. During the formation of the PCC in the bubble column reactor,
the pH variation was plotted in Figure 5.11 for both cases: calcium chloride solution with pH
adjusted using 1 M NH4OH vs. Ca-rich solution by dissolving steel slag using 1 M NH4Cl. For
both cases, the CO2 dissolution kinetics was buffered by the NH4+ existed in the solvent. For the
dissolved steel slag solution, the pH descended relatively slowly until a sudden drop at 200 s. For
0.15 M CaCl2 containing equivalent amount of Ca2+ as the leached steel slag solution, similar pH
variation curve was obtained with the sudden drop appeared at 100 s. For both cases, after the big
drop, the pH curve both flattened around the value of 6 which similar to the environment of CO2
hydration. This meant that the PCC formation was faster in CaCl2 than that in the dissolved steel
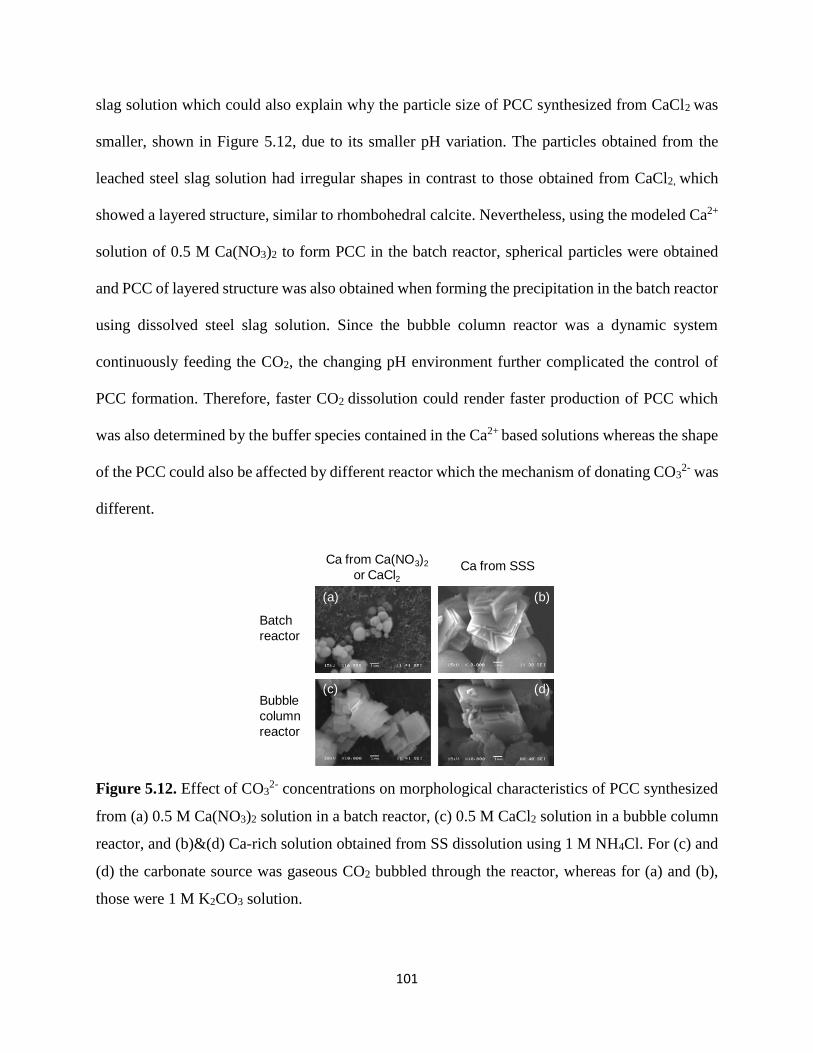
101
slag solution which could also explain why the particle size of PCC synthesized from CaCl2 was
smaller, shown in Figure 5.12, due to its smaller pH variation. The particles obtained from the
leached steel slag solution had irregular shapes in contrast to those obtained from CaCl2, which
showed a layered structure, similar to rhombohedral calcite. Nevertheless, using the modeled Ca2+
solution of 0.5 M Ca(NO3)2 to form PCC in the batch reactor, spherical particles were obtained
and PCC of layered structure was also obtained when forming the precipitation in the batch reactor
using dissolved steel slag solution. Since the bubble column reactor was a dynamic system
continuously feeding the CO2, the changing pH environment further complicated the control of
PCC formation. Therefore, faster CO2 dissolution could render faster production of PCC which
was also determined by the buffer species contained in the Ca2+ based solutions whereas the shape
of the PCC could also be affected by different reactor which the mechanism of donating CO32- was
different.
Figure 5.12. Effect of CO32- concentrations on morphological characteristics of PCC synthesized
from (a) 0.5 M Ca(NO3)2 solution in a batch reactor, (c) 0.5 M CaCl2 solution in a bubble column
reactor, and (b)&(d) Ca-rich solution obtained from SS dissolution using 1 M NH4Cl. For (c) and
(d) the carbonate source was gaseous CO2 bubbled through the reactor, whereas for (a) and (b),
those were 1 M K2CO3 solution.
Batch
reactor
Bubble
column
reactor
Ca from SSSCa from Ca(NO3)2
or CaCl2
(a) (b)
(c) (d)

102
Si is another major component in the dissolved steel slag solution. When CO2 is bubbled
through, SiO2 is also possible to precipitate out during the carbonation process which will affect
the purity of PCC. Park developed a pH swing method in a system of Mg-based minerals (Park
and Fan, 2004). By increasing the pH step-wisely, SiO2, Fe2O3, and Mg(OH)2 could be separated
from the solution, respectively. Similarly, by accurately controlling the pH, Si could be removed
from the dissolved steel slag solution at low pH prior to the Ca carbonation process. Therefore, the
co-precipitation of SiO2 with CaCO3 could be greatly eliminated.
5.3.6 Chemical stability of SSS
In order to evaluate the leachate species and other chemical properties of SSS, the leaching test
was performed therefore the fate of steel slag and associated risk could be investigated when it
was disposed by landfilling. The results obtained were shown in Table 5.3. The treated steel slag,
as expected, showed lower conductivity, probably due to the fact that less ionic species were
leached after the dissolution. Also the decrease in the pH was due to the decrease of a relevant
percentage of the calcium, which was an alkaline compound. Most of the elements selected for the
analyses on the ICP-AES were according to the limits imposed by the Italian Ministry Decree
5/2/1998 for the reuse of waste materials. Calcium and magnesium, instead, although they were
not regulated, were measured because they were the targeted elements in the study. In some cases,
the amount of the analyzed element was below the detection limit, therefore the result was reported
as “< LOD”. In all the other cases, the concentrations of the elements in the treated steel slag were
lower than those in the untreated one. The concentrations of the trace elements were all under the
regulation limits, except for the chromium. In particular, Cu and Pb seemed to have been
immobilized or removed from the solid matrix during the dissolution process, because the leaching
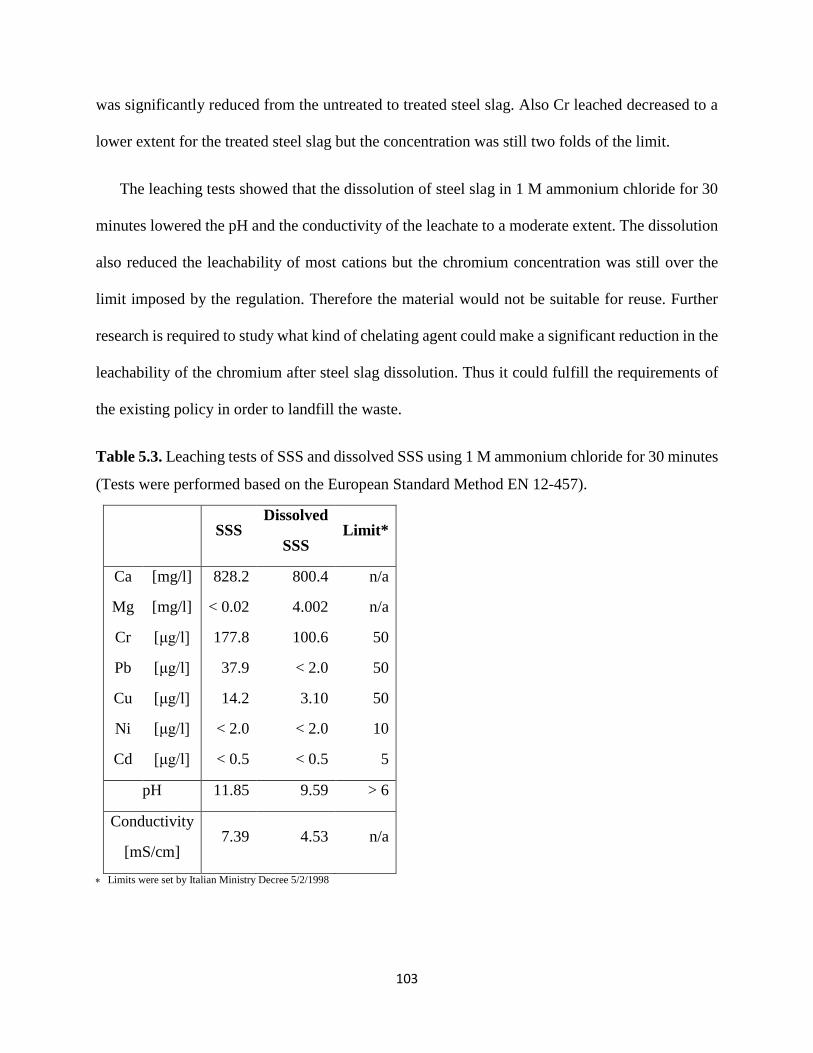
103
was significantly reduced from the untreated to treated steel slag. Also Cr leached decreased to a
lower extent for the treated steel slag but the concentration was still two folds of the limit.
The leaching tests showed that the dissolution of steel slag in 1 M ammonium chloride for 30
minutes lowered the pH and the conductivity of the leachate to a moderate extent. The dissolution
also reduced the leachability of most cations but the chromium concentration was still over the
limit imposed by the regulation. Therefore the material would not be suitable for reuse. Further
research is required to study what kind of chelating agent could make a significant reduction in the
leachability of the chromium after steel slag dissolution. Thus it could fulfill the requirements of
the existing policy in order to landfill the waste.
Table 5.3. Leaching tests of SSS and dissolved SSS using 1 M ammonium chloride for 30 minutes
(Tests were performed based on the European Standard Method EN 12-457).
SSS Dissolved
SSS Limit*
Ca
Mg
Cr
Pb
Cu
Ni
Cd
[mg/l]
[mg/l]
[μg/l]
[μg/l]
[μg/l]
[μg/l]
[μg/l]
828.2
< 0.02
177.8
37.9
14.2
< 2.0
< 0.5
800.4
4.002
100.6
< 2.0
3.10
< 2.0
< 0.5
n/a
n/a
50
50
50
10
5
pH 11.85 9.59 > 6
Conductivity
[mS/cm] 7.39 4.53 n/a
Limits were set by Italian Ministry Decree 5/2/1998

104
5.4 Conclusions
Chelating compound such as citrate, glutamate and picolinate were proved to be good options
towards Ca extractions. The dissolution mechanism of stainless steel slag was different from
natural minerals due to its heterogeneous nature, which depends on each crystal phase dissolved.
Basically, the pH, buffer strength, and chelating effect would influence the total Ca and Si
extraction. These chelating agents with pKA value close to the initial solvent pH were found to be
good buffers and can achieve a higher dissolution rate. Temperature seems to have a minimum
effect on enhancing the Ca dissolution for gluconic acid but becomes significant for NH4Cl due to
the volatile property of ammonia generated during the dissolution reaction in the batch reactor.
Initial pH of the reactants and temperature were proved to be able to affect the size and shape of
PCC. Spherical PCC formed with low pH and temperatures, however, PCC with crystal structures
formed at high pH and temperatures. PCC from the Ca-rich solution from SSS dissolution were
always crystalline. Also, PCC synthesized in the bubble column reactor are found to be flake-
shape for both the model system and the Ca-rich solution from SSS. Therefore the bubble column
reactor would be favored for future experiments in order to get more uniform products, in which
the pH could be assumed to be constant, comparing to the batch reactor. The industrial application
of PCC requires it having certain crystal structure therefore the PCC derived from 2-step CSSS
should have a good chance. Moreover, the leachability of chromium was found similar to the direct
CSSS discussed in Chapter 4 which should be further investigated in terms of its leaching
mechanism in order to reduce the leaching below the regulation therefore the reuse of the waste
residue or landfill could be feasible and environmentally benign.

105
CHAPTER 6
INVESTIGATION OF A VALUE-ADDED BY-PRODUCT DURING TWO-
STEP MINERAL CARBONATION
The contents of this chapter titled “Synthesis of Fe-based Catalyst from Stainless Steel Slag for
Biomass to H2 Conversion” are to be submitted to the Journal of Green Chemistry (X.Z. Zhou, M.
Stonor, J. Chen and A.-H. A. Park).
Abstract
Exploring clean but inexpensive energy and ceasing the changing climate are two of the most
pressing issues being faced in the 21st century. Global energy demand is projected to continue
increasing while fossil fuel will still remain big for decades ahead but with significant CO2
emissions. Therefore, the missions to deal with the global constraints of energy production and
carbon emission are coupled more than ever. One of the methods to store CO2 permanently is
carbon mineralization. This method is achieved by chemically fixing gaseous CO2 into the Ca/Mg-
bearing solid matrix as carbonates, which is claimed to be the safest and most permanent method
of carbon storage to date. Unfortunately, most of these processes are energy intensive and
expensive (e.g., two-step carbonation). Thus, there have been significant efforts to reduce the cost
including utilization of value-added byproducts. One of them derived from the two-step
carbonation (i.e., dissolution and carbonation are separated) is Fe-based material containing mostly
iron oxides. In particular, silicate minerals or industrial waste often contain 5~20 wt% of Fe. Since
iron is extracted into the aqueous phase by dissolution along with Ca, Mg and etc., a variety of Fe-
based materials can be synthesized by precipitation. In this study, Fe-based catalysts are
synthesized from serpentine and stainless steel slag (SSS) and applied for a biomass-to-hydrogen
conversion therefore the mineral carbonation is coupled with the energy production. The effects
106
of ionic strength, chelating agents, alkali, and pH are investigated. NaOH is found to be an effective
alkaline precipitation agent with a low consumption but the system pH varies in a wide range
which affects the properties of the precipitated materials. HMTA is a good alkaline buffer that
could minimize the extent of the co-precipitation but it requires a large amount. After the synthesis,
the Fe-based particles are tested in the cellulose to H2 conversion compared with the pure hematite
and magnetite particles w/wo pre-reduction. The reduced Fe-based catalyst derived from SSS is
found to be able to enhance the conversion from 33% to 55.5%. The trace metals in SSS are
suspected to contribute to this enhancement.
6.1 Introduction
The combustion of the fossil fuel causes the increasing atmospheric CO2 concentration and the
continuous growth in the U.S. and global energy use is expected (GEA, 2012; IPCC, 2013). Since
fossil fuel will remain the major source of energy in the next few decades, the inevitable rise of
the CO2 concentration could be predicted if the current energy mix does not change. Although
whether CO2 directly leads to the climate change is controversial, the CO2 concentration in the
atmosphere needs to be prevented from reaching an unacceptable level. Therefore, replacing the
fossil fuel with non-fossil energies such as solar, wind, hydro, geothermal, nuclear and etc. or
applying the carbon capture, utilization and storage (CCUS) technology have been considered as
solutions for the current carbon-intensive energy structure (Haszeldine, 2009; Lackner, 2003). In
this context, with an increasing interest in CCUS in the past two decades, various technologies for
capture, storage and utilization have been investigated, respectively (Holloway, 2001; Yu et al.,
2008; Yu et al., 2012). Particularly current storage methods include geological storage, ocean

107
storage and mineral carbonation (Brewer et al., 1999; Martin et al., 1994; Orr., 2009; Zevenhoven
and Fagerlund, 2010).
Among the three options, the idea of mineral carbonation was first introduced by Seifritz in
1990 (Seifritz, 1990), and then Lackner and his colleagues at Las Almos National Laboratory
(LANL) applied the process to trap CO2 between 1995 and 1997 (Lackner et al., 1995). The general
idea of mineral sequestration mimics the natural weathering of rocks, bonding CO2 with mineral
matrix by forming metal carbonates, through which, CO2 is immobilized. Among different metal
carbonates, the calcium and magnesium compounds have been favored and widely studied due to
the stability of the carbonated products and the abundance of the calcium and magnesium silicate
minerals in nature such as serpentine group minerals (X3Si2O5(OH)4, X = Mg, Fe, Fe, Ni, Al, Zn
or Mn), olivine group minerals (X2SiO4, X = Ca, Fe, Mn, Ni, Mg) and wollastonite (CaSiO3 or
Ca3(Si3O9)) (Mindat.org, 2015). Besides, the occurrence of Ca or Mg elements in the industrial
wastes such as iron and steel slag also draws the attention of researchers towards the re-use of
these wastes as mineral alternatives (IPCC, 2007a). Nevertheless, the challenge of the mineral
sequestration up to date is that the process is energy intensive thus expensive, especially for
enhancing the kinetics of the dissolution and carbonation process which hurdles its industrial
application (Huijgen et al., 2007). Hence, lots of efforts have been made to make it economically
feasible (Sanna et al., 2012).
Producing value-added byproducts towards the end of the process is considered as one of the
methods to offset the cost of the mineral sequestration. Previously, calcium or magnesium
carbonates have been proposed to be used as paper fillers, plastic fillers and construction materials
(Bonney et al., 2000). Since silicate minerals such as serpentine could contain 5~10 wt% of iron,
Fe-based materials could also be recovered by the magnetic separation and chemical precipitation

108
(Park et al., 2003). The brief scheme of the mineral sequestration with serpentine is shown in
Figure 6.1. Previous findings by Park in the mineral dissolution studies have successfully proposed
the step-wise precipitation of main elemental contents of serpentine so-called “pH swing” method
which is highlighted in the box (Park and Fan, 2005). This method could also be applied to SSS
but with an altered reaction condition due to their composition difference. In this study, the ionic
strength of Fe, chelating agents, alkaline selection, and pH are investigated for the dissolution and
carbonation. Synthesized particles have been compared with pure chemicals in terms of size,
porosity, surface area and chemical compositions.
Figure 6.1. Schemes of (a) production of value-added solids integrated with carbon mineralization
of serpentine/steel slag via pH swing and (b) biomass to hydrogen conversion via alkaline
hydrothermal treatment.

109
Eventually, the synthesized Fe-based materials could be potentially applied in various areas
attributed to their different features by varied synthesis methods. Previously, both the un-promoted
and promoted iron oxide were applied for heavy oil cracking and styrene synthesis through
dehydrogenation of ethylbenzene (Braga et al., 2009; Fumoto et al., 2009; Fumoto et al., 2012;
Shekhah et al., 2003). Un-promoted iron oxide was also determined as a desirable sorbent (oxygen
carrier) for chemical looping (Kim et al., 2009). Besides, the iron-based and cobalt-based catalysts
are two of the most common and commercialized catalysts for Fischer-Tropsch process at Sasol,
South Africa for many years (Steynberg, 2004). What’s more, other areas where Fe-based catalysts
could be applied particularly for the development towards the hydrogen-based fuel cell technology
have been explored such as water gas shift (WGS) reaction and biomass to hydrogen (BTH)
conversion. Conventionally, iron oxide catalysts work for WGS at temperatures higher than 300 °C
(Kochloefl et al, 1997; Ladebeck and Wagner, 2003). Catalytic abilities of iron oxide and other
metal oxide for COx-free BTH have also been evaluated by Japanese researchers and Ferguson
and etc (Ferguson et al., 2012; Ishida et al., 2006). Although Fe-based catalyst might not be as
effective as noble metals (Steen and Claeys, 2008), considering that these catalysts are derived
from the waste stream of the carbon mineralization, it is proposed as cheap, abundant and cost-
effective catalysts. In this paper, Fe-based catalysts synthesized from serpentine and SSS have
been tested in the cellulose to hydrogen conversion and Fe-based catalyst from SSS with reduction
is found to be able to enhance H2 conversion from 33% (baseline conversion) to 56%.

110
6.2 Experimental
6.2.1 Synthesis of Fe-based particles from serpentine and SSS
Two-step carbonation involves the dissolution of minerals before the carbonation. For
serpentine, ground samples of 80 µm particle size on average, were dissolved by the chelating
agents for 1 or 2 hours. Herein, two chelating agents were used: sodium oxalate and oxalic acid
solutions both with the final pH 2 adjusted by adding nitric acid. The fast dissolution of serpentine
and SSS (12 µm particle size in average) was also conducted at 80 °C and with 200 rpm stirring
for 1 hours. Each batch contained 50 g of solid samples in 1L 7% nitric acid. All the above solutions
after the reaction were immediately vacuum filtered through a filter paper of 2.5 µm pore size, and
then filtered again with syringe filters with a pore size of 0.2 µm. Recovered Mg-rich or Ca-rich
solutions were used for the Fe-based material synthesis and carbonation afterwards.
Prior to the synthesis, a few titration tests were performed in order to determine the pH
condition, alkaline selection and mixing ratio between the base and Fe solution. A model system
of 0.007 M Fe(NO3)3 was prepared along with the extractions from dissolving serpentine and SSS
(i.e., Fes solution and Fesss solution; S = serpentine and SSS = stainless steel slag). The Fe(NO3)3
concentration was comparable to [Fe] in Fes solution, by 1 hour dissolution in pH 2 sodium oxalate
solution, which was tested by ICP-AES (ACTIVA-M, Horiba Jobin Yvon Inc., Edison, NJ). Bases
were drop-wise added into the Fe solutions of 50 ml. pH change was measured by a pH meter
(Accument basic AB 15, Fisher Scientific, Hampton, NH). The accumulative volumes of the bases
at the visible starting point of solution color change and the end point of the precipitation were
recorded and the titration curves were plotted accordingly. For model system, 1 M ammonium
hydroxide, pH 10 ammonium hydroxide/ammonium chloride buffer and 0.25 M
hexamethylenetetramine (HMTA) solutions were applied as alkali sources. For titrating Fes

111
solution, 1 M ammonium hydroxide was used. For titrating Fes and Fesss solutions derived from the
fast dissolution, pH 13 NaOH was used. DI water was used throughout the experiment. All the
chemicals were purchased from Fisher Scientific (Pittsburgh, PA).
According to the titration curve, appropriate amount of alkali for precipitating iron ions was
determined for each solution. pH 13 NaOH was selected and mixed with the Fe solutions. The
precipitation happened all of a sudden when the two solutions were mixed and the mixture was
immediately vacuum filtered through a filter paper of 2.5 µm pore size, and then filtered again
with syringe filters with a pore size of 0.2 µm. Collected solids were first air dried and then dried
in a vacuum oven at 80 °C for 24 hours. Filtrate was used for the next step of the carbonation.
6.2.2 Characterizations
The particle size distribution of the synthesized Fe-based materials was obtained via the laser
diffraction measurement (LSTM 13320 MW, Beckman Coulter Inc., Brea, CA). The surface area
and pore size distribution were measured by a BET analyzer (Nova e-Series, Quantachrome,
Boynton Beach, FL). The morphology and elemental distribution of the particle samples were
acquired by a scanning electron microscope (Hitachi 4700 SEM, Hitachi, Tokyo, Japan). Finally,
the compositions and phases of the samples were measured by X-ray fluorescence (WD-XRF,
Pananalytical Axios, Westborough, MA) and X-ray diffraction (XRD 3000, Inel Inc., Artenay,
France), respectively.

112
6.2.3 Biomass to H2 conversion with Fe-based particles
Samples were prepared by mixing the cellulose (Micro-crystalline 50μm particle size, Fisher
Scientific, Pittsburgh, PA) powder with 50 wt% NaOH solution (Sigma-Aldrich Co. LLC, St.
Louis, MO) at a 1:12 molar ratio as per the stoichiometry. A ground mixture of reactants with
catalysts (e.g., 20 wt% loading in this study unless otherwise instructed) was then loaded into a
1.05 cm ID quartz tube and held in place between two pieces of quartz wool. The mass of the
sample was always kept between 600 and 800 mg although all the results were normalized to the
moles of cellulose used to enable comparisons. Some catalysts were reduced in a tube furnace in
pure H2 atmosphere at 850 °C for 1 hour before mixing with the samples.
Figure 6.2. Experimental Setup of (a) Fe-based material synthesis and (b) biomass to hydrogen
conversion.
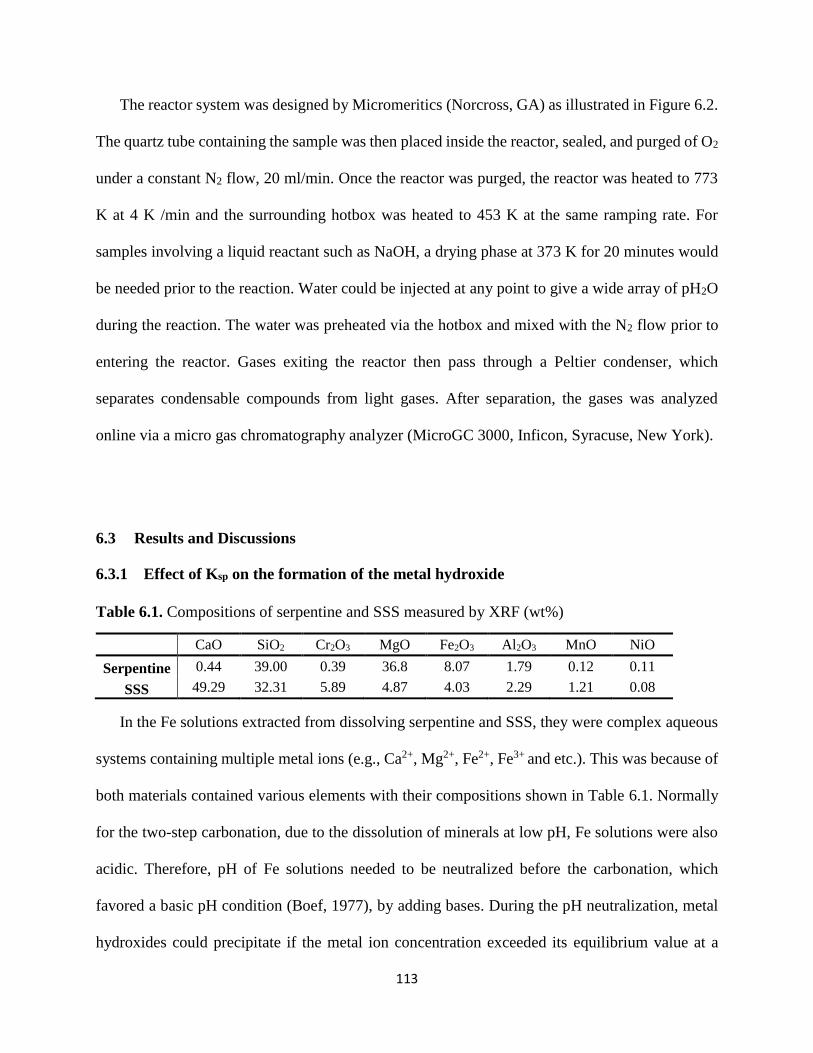
113
The reactor system was designed by Micromeritics (Norcross, GA) as illustrated in Figure 6.2.
The quartz tube containing the sample was then placed inside the reactor, sealed, and purged of O2
under a constant N2 flow, 20 ml/min. Once the reactor was purged, the reactor was heated to 773
K at 4 K /min and the surrounding hotbox was heated to 453 K at the same ramping rate. For
samples involving a liquid reactant such as NaOH, a drying phase at 373 K for 20 minutes would
be needed prior to the reaction. Water could be injected at any point to give a wide array of pH2O
during the reaction. The water was preheated via the hotbox and mixed with the N2 flow prior to
entering the reactor. Gases exiting the reactor then pass through a Peltier condenser, which
separates condensable compounds from light gases. After separation, the gases was analyzed
online via a micro gas chromatography analyzer (MicroGC 3000, Inficon, Syracuse, New York).
6.3 Results and Discussions
6.3.1 Effect of Ksp on the formation of the metal hydroxide
Table 6.1. Compositions of serpentine and SSS measured by XRF (wt%)
CaO SiO2 Cr2O3 MgO Fe2O3 Al2O3 MnO NiO
Serpentine 0.44 39.00 0.39 36.8 8.07 1.79 0.12 0.11
SSS 49.29 32.31 5.89 4.87 4.03 2.29 1.21 0.08
In the Fe solutions extracted from dissolving serpentine and SSS, they were complex aqueous
systems containing multiple metal ions (e.g., Ca2+, Mg2+, Fe2+, Fe3+ and etc.). This was because of
both materials contained various elements with their compositions shown in Table 6.1. Normally
for the two-step carbonation, due to the dissolution of minerals at low pH, Fe solutions were also
acidic. Therefore, pH of Fe solutions needed to be neutralized before the carbonation, which
favored a basic pH condition (Boef, 1977), by adding bases. During the pH neutralization, metal
hydroxides could precipitate if the metal ion concentration exceeded its equilibrium value at a

114
certain pH. In contrary, the metal hydroxide could also decompose via the hydrolysis therefore it
was a dynamic equilibrium in both pathways (Schwertmann and Cornell, 2003).
For the general hydrolysis of the metal ions: A(OH)n ↔ An+ + nOH-, the equilibrium constant
could be expressed as K = [An+] [OH-]n. Also, the Gibbs free energy of the hydrolysis reaction was
correlated with K by the equation: ∆r𝐺ѳ= - RT ln𝐾ѳ(Morel and Herning, 1993). The solubility
constant Ksp was the K value at equilibrium. When the K > Ksp , precipitation would occur whereas
precipitation could be dissolved when the K < Ksp. In this study, the major hydrolysis reactions
with their solubility constants were shown in Reaction 6.1 – 6.4.
Fe(OH)3 ↔ Fe3+ + 3OH- Ksp = 2.79E-39 (Rxn. 6.1)
Fe(OH)2 ↔ Fe2+ + 2OH- Ksp = 4.87E-17 (Rxn. 6.2)
Mg(OH)2 ↔ Mg2+ + 2OH- Ksp = 5.61E-12 (Rxn. 6.3)
Ca(OH)2 ↔ Ca2+ + 2OH- Ksp = 5.02E-6 (Rxn. 6.4)
Typically for Fe3+, the actual precipitation pathway might be as shown in Reaction 6.5
(Schwertmann and Cornell, 2003).
Fe3+ ↔ [FeOH]2+ ↔ [Fe4(OH)6]6+ ↔ [Fen(OH)2n]
n+ ↔ α-FeOOH (Rxn. 6.5)
Also, some of the iron ions were divalent instead of trivalent. However, forming Fe(OH)3 as the
final product was assumed for the overall reaction happened in the system.

115
Figure 6.3. Equilibrium concentrations of metal ions vs. metal hydroxides at different pH.
Since the solubility product of Fe(OH)3 was much lower than the other competing species,
primary precipitate formed in the Fe solution system was Fe(OH)3. Quantitatively, the inter-
relations of different metal ion equilibriums between pH 7 and 10 were plotted in Figure 6.3. As
the increasing concentration of hydroxyl (i.e., pH increase), the minimum concentration of the
metal ions forming precipitate decreased. At any point in this plot (e.g., Fe3+), if it was above the
equilibrium line, there would be precipitation otherwise the metal remained as a soluble ion.
Therefore, Fe precipitation could happen at even lower pH than 7 whereas Ca and Mg would
precipitate mostly in the basic condition. Also, since there were big discrepancies between the
equilibrium lines of Fe3+ with Mg2+ or Ca2+, co-precipitation was expected to be minimum
depending on the actual concentrations of the metal ions in the Fe solutions.
6.3.2 Titration of Fe solutions
In general, the purpose of titrating the Fe solutions was to determine the minimal amount of
the bases needed in order to precipitate the iron ions while minimizing the co-precipitation of the

116
Figure 6.4. Titration curves of (a) 0.007 M Fe(NO3)3 solution (1 M NH4OH solution , pH 10
NH4OH/NH4Cl buffer solution and 0.25 M HMTA solution were used for the titration.) and (b)
Fes solutions derived from serpentine dissolution. (Fes solution A: serpentine was dissolved in pH
2 0.01 M sodium oxalate solution for 1 hour; Fes solution B: serpentine was dissolved in pH 2 0.01
M sodium oxalate solution for 2 hours; Fes solution C: serpentine was dissolved in pH 2 0.01 M
oxalic for 2 hours. pH of solvent was adjusted by nitric acid. 1 M NH4OH solution was used for
the titration.).
Ca/Mg ions. For the model system shown in Figure 6.4 (a), 0.007 M Fe(NO3)3 solution was titrated
with three different bases. 1 M NH4OH and pH 10 NH4OH/NH4Cl were found very effective at
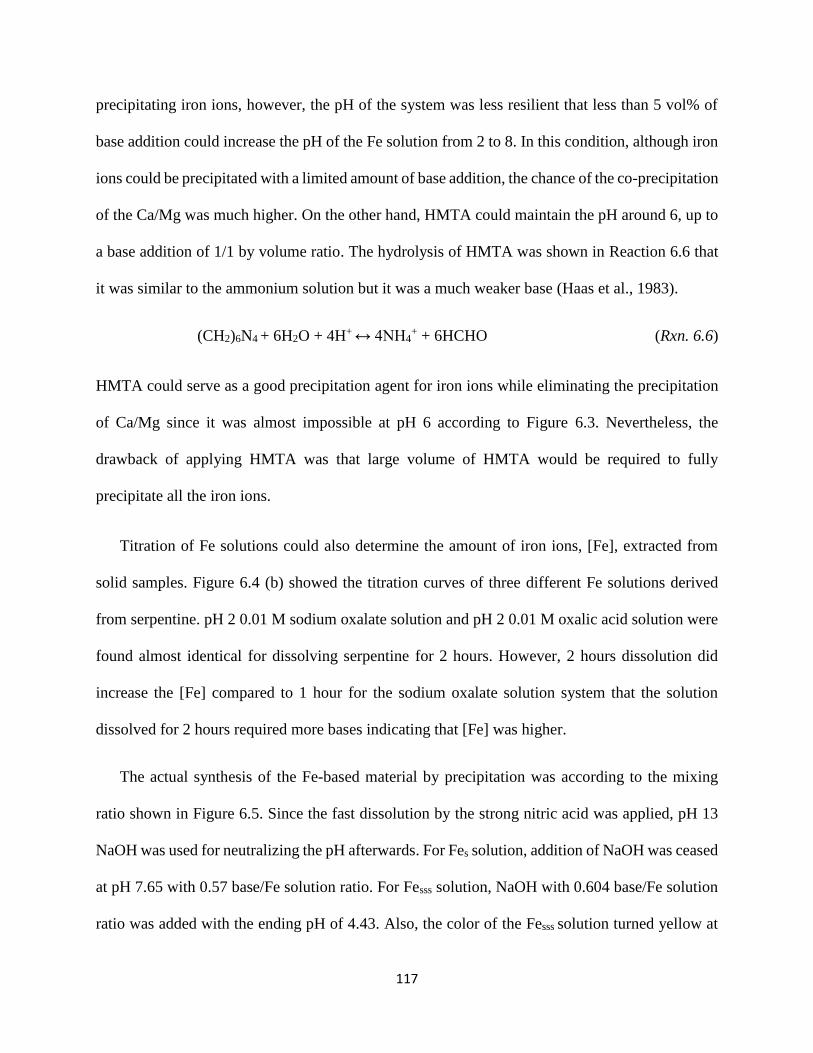
117
precipitating iron ions, however, the pH of the system was less resilient that less than 5 vol% of
base addition could increase the pH of the Fe solution from 2 to 8. In this condition, although iron
ions could be precipitated with a limited amount of base addition, the chance of the co-precipitation
of the Ca/Mg was much higher. On the other hand, HMTA could maintain the pH around 6, up to
a base addition of 1/1 by volume ratio. The hydrolysis of HMTA was shown in Reaction 6.6 that
it was similar to the ammonium solution but it was a much weaker base (Haas et al., 1983).
(CH2)6N4 + 6H2O + 4H+ ↔ 4NH4+ + 6HCHO (Rxn. 6.6)
HMTA could serve as a good precipitation agent for iron ions while eliminating the precipitation
of Ca/Mg since it was almost impossible at pH 6 according to Figure 6.3. Nevertheless, the
drawback of applying HMTA was that large volume of HMTA would be required to fully
precipitate all the iron ions.
Titration of Fe solutions could also determine the amount of iron ions, [Fe], extracted from
solid samples. Figure 6.4 (b) showed the titration curves of three different Fe solutions derived
from serpentine. pH 2 0.01 M sodium oxalate solution and pH 2 0.01 M oxalic acid solution were
found almost identical for dissolving serpentine for 2 hours. However, 2 hours dissolution did
increase the [Fe] compared to 1 hour for the sodium oxalate solution system that the solution
dissolved for 2 hours required more bases indicating that [Fe] was higher.
The actual synthesis of the Fe-based material by precipitation was according to the mixing
ratio shown in Figure 6.5. Since the fast dissolution by the strong nitric acid was applied, pH 13
NaOH was used for neutralizing the pH afterwards. For Fes solution, addition of NaOH was ceased
at pH 7.65 with 0.57 base/Fe solution ratio. For Fesss solution, NaOH with 0.604 base/Fe solution
ratio was added with the ending pH of 4.43. Also, the color of the Fesss solution turned yellow at
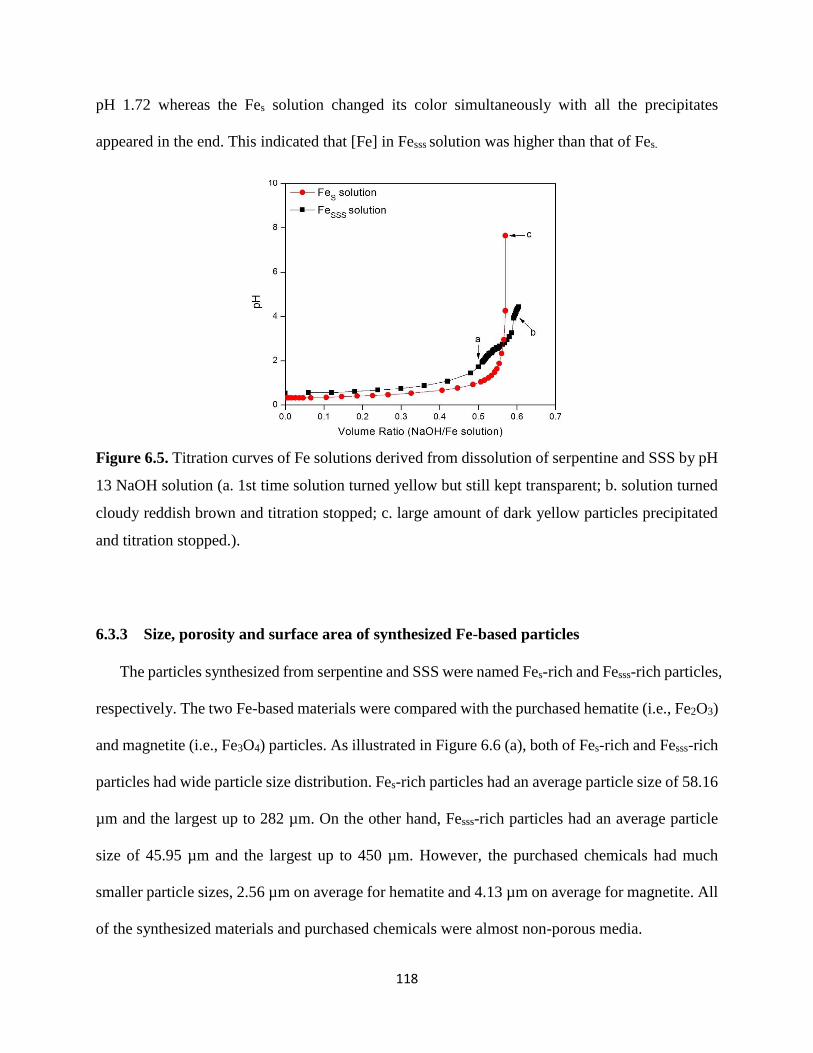
118
pH 1.72 whereas the Fes solution changed its color simultaneously with all the precipitates
appeared in the end. This indicated that [Fe] in Fesss solution was higher than that of Fes.
Figure 6.5. Titration curves of Fe solutions derived from dissolution of serpentine and SSS by pH
13 NaOH solution (a. 1st time solution turned yellow but still kept transparent; b. solution turned
cloudy reddish brown and titration stopped; c. large amount of dark yellow particles precipitated
and titration stopped.).
6.3.3 Size, porosity and surface area of synthesized Fe-based particles
The particles synthesized from serpentine and SSS were named Fes-rich and Fesss-rich particles,
respectively. The two Fe-based materials were compared with the purchased hematite (i.e., Fe2O3)
and magnetite (i.e., Fe3O4) particles. As illustrated in Figure 6.6 (a), both of Fes-rich and Fesss-rich
particles had wide particle size distribution. Fes-rich particles had an average particle size of 58.16
µm and the largest up to 282 µm. On the other hand, Fesss-rich particles had an average particle
size of 45.95 µm and the largest up to 450 µm. However, the purchased chemicals had much
smaller particle sizes, 2.56 µm on average for hematite and 4.13 µm on average for magnetite. All
of the synthesized materials and purchased chemicals were almost non-porous media.
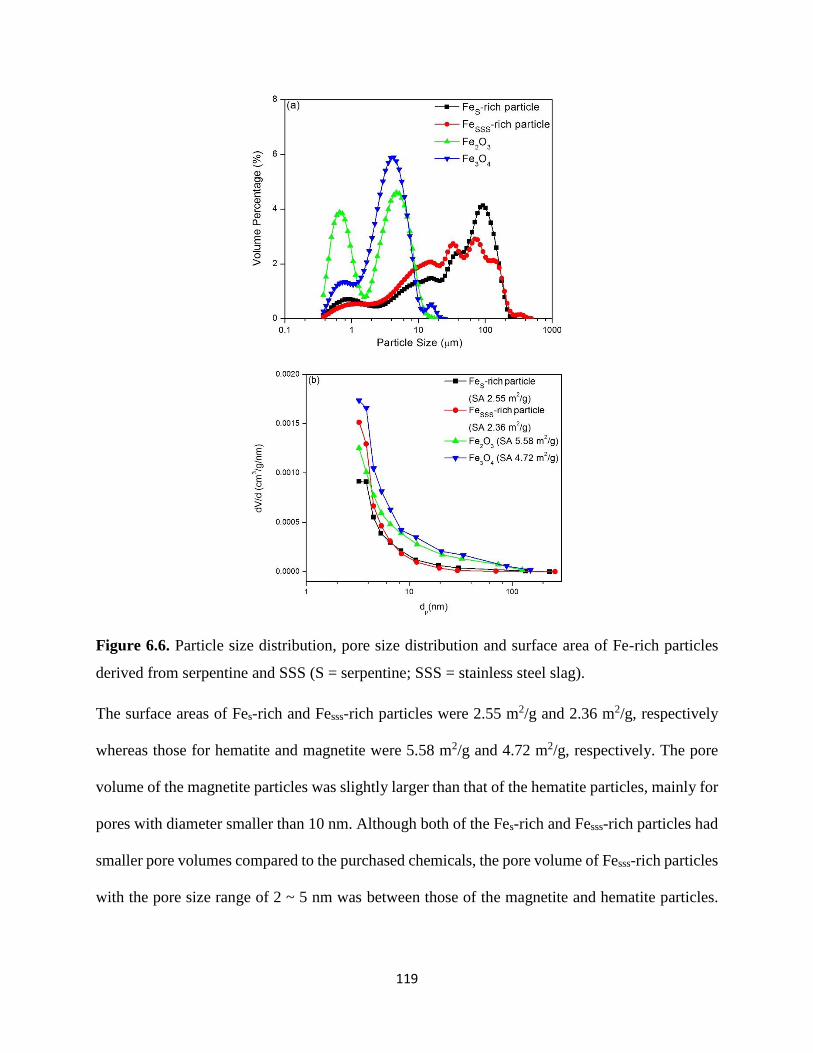
119
Figure 6.6. Particle size distribution, pore size distribution and surface area of Fe-rich particles
derived from serpentine and SSS (S = serpentine; SSS = stainless steel slag).
The surface areas of Fes-rich and Fesss-rich particles were 2.55 m2/g and 2.36 m2/g, respectively
whereas those for hematite and magnetite were 5.58 m2/g and 4.72 m2/g, respectively. The pore
volume of the magnetite particles was slightly larger than that of the hematite particles, mainly for
pores with diameter smaller than 10 nm. Although both of the Fes-rich and Fesss-rich particles had
smaller pore volumes compared to the purchased chemicals, the pore volume of Fesss-rich particles
with the pore size range of 2 ~ 5 nm was between those of the magnetite and hematite particles.

120
Since the BTH reaction was solid-solid base, the particle size and pore size of the heterogeneous
catalysts mixing could really affect whether they could enhance the reaction or not (Carter, 1961).
6.3.4 Phase analysis and elemental concentration of synthesized Fe-based particles
Figure 6.7. XRD of Fe-rich particles derived from Fe(NO3)3, serpentine and SSS (N = Fe(NO3)3).
The actual compositions of these precipitates needed to be understood before utilizing them as
potential catalysts. The Fes-rich particles derived from serpentine and Fesss-rich particles derived
from SSS were compared with the precipitation from the model system 0.007 M Fe(NO3)3 (i.e.,
FeN particles). XRD results in Figure 6.7 showed that the FN particles were amorphous therefore
the typical X-ray diffraction peak of α-hematite appeared only after the FN particles were calcined
at 900 °C for 5 hours. Nevertheless, the XRD profiles of Fes-rich and Fesss-rich particles were not
identical and they did not match with the one of α-hematite. The major phases determined in Fes-
rich particles were Ca2Fe2O5 and Ca3(Al,Fe)2O6 while Ca4Fe14O25 was found in Fesss-rich particles
which indicated that the co-precipitation still happened although the pH was controlled during the

121
synthesis. Since neither Fes-rich nor Fesss-rich particles were calcined, the amorphous Fe2O3 may
also be present in both materials.
Table 6.2. Elemental composition of Fe-based catalysts prepared from serpentine and SSS
measured by EDS (wt%).
Element From
Serpentine
From
SSS
N 8.46 n/a
O 27.66 30.97
Na 4.54 3.44
Al 4.94 4.37
Si 5.67 2.01
Mg 0.01 0.01
Ca 1.56 1.80
Ti n/a 5.50
Cr 1.23 4.88
Fe 40.53 39.68
Co 0.48 0.40
Ni n/a n/a
Nb 0.98 2.64
Pd 1.80 2.65
Au 2.14 1.65
Since only the crystalline phase in the synthesized materials could be identified by XRD, EDS
tests were also conducted in order to determine the content of the Fe-based particles including
major and trace elements. Table 6.2 showed that Fe and O were the major two elements in both
particles. The Fe/O ratio in Fesss-rich particles was close to Fe2O3 which was 0.7. However, Fe/O
ratio of 0.59 in Fes-rich particles indicated that the oxygen content was excessive. Ca and Al were
also found in the materials, however, their weight percentages were much smaller than those in
the molecules identified by the XRD. Therefore, it proved that some of the iron oxide particles in
the synthesized Fe-based materials were also amorphous. Most interestingly, Co, Nb, Pd, Au were
all identified in both materials. In particular, Fesss-rich particles also contained 5.50 wt% Ti and
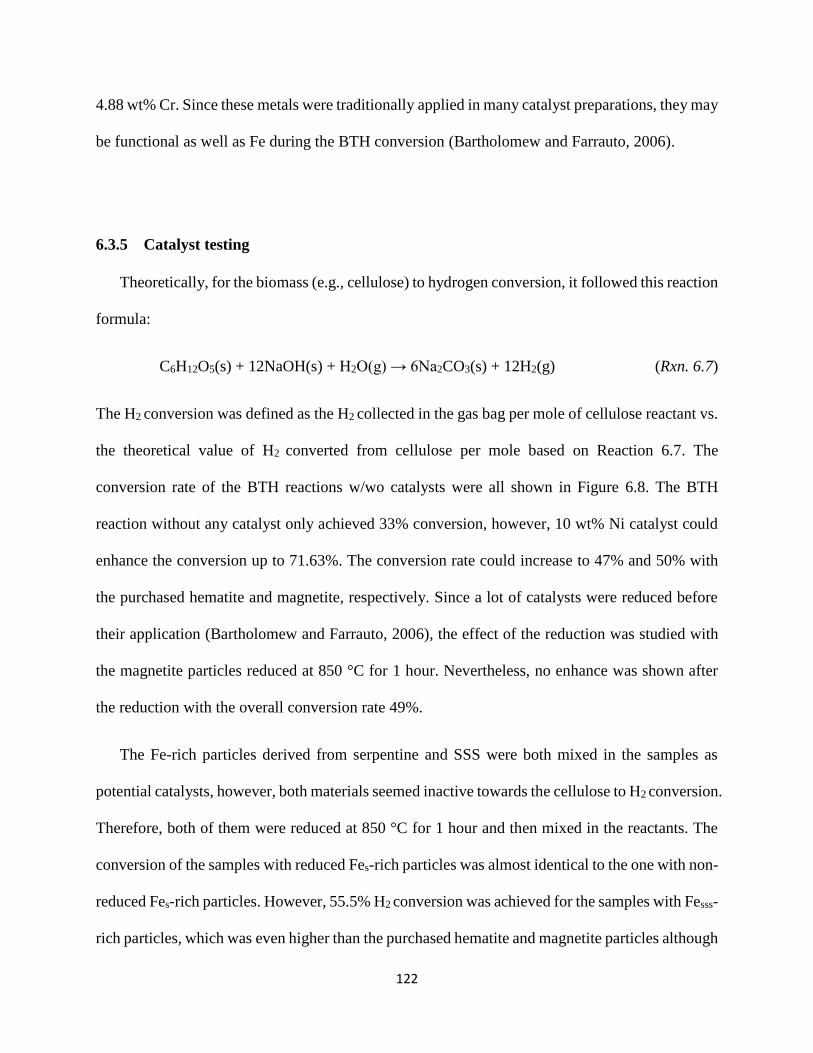
122
4.88 wt% Cr. Since these metals were traditionally applied in many catalyst preparations, they may
be functional as well as Fe during the BTH conversion (Bartholomew and Farrauto, 2006).
6.3.5 Catalyst testing
Theoretically, for the biomass (e.g., cellulose) to hydrogen conversion, it followed this reaction
formula:
C6H12O5(s) + 12NaOH(s) + H2O(g) → 6Na2CO3(s) + 12H2(g) (Rxn. 6.7)
The H2 conversion was defined as the H2 collected in the gas bag per mole of cellulose reactant vs.
the theoretical value of H2 converted from cellulose per mole based on Reaction 6.7. The
conversion rate of the BTH reactions w/wo catalysts were all shown in Figure 6.8. The BTH
reaction without any catalyst only achieved 33% conversion, however, 10 wt% Ni catalyst could
enhance the conversion up to 71.63%. The conversion rate could increase to 47% and 50% with
the purchased hematite and magnetite, respectively. Since a lot of catalysts were reduced before
their application (Bartholomew and Farrauto, 2006), the effect of the reduction was studied with
the magnetite particles reduced at 850 °C for 1 hour. Nevertheless, no enhance was shown after
the reduction with the overall conversion rate 49%.
The Fe-rich particles derived from serpentine and SSS were both mixed in the samples as
potential catalysts, however, both materials seemed inactive towards the cellulose to H2 conversion.
Therefore, both of them were reduced at 850 °C for 1 hour and then mixed in the reactants. The
conversion of the samples with reduced Fes-rich particles was almost identical to the one with non-
reduced Fes-rich particles. However, 55.5% H2 conversion was achieved for the samples with Fesss-
rich particles, which was even higher than the purchased hematite and magnetite particles although

123
still lower than Ni catalyst. Further investigation of the mechanism of this enhancement was quite
necessary, however, several hypotheses were also made. First, for the purchased hematite and
magnetite which were both crystalline particles, the enhancement of the BTH conversion may be
attributed to their smaller particle size both of which were mostly smaller than 10 µm with a narrow
distribution and their crystallinity. Second, since the reduction did not improve the catalytic ability
of the purchased hematite, purchased magnetite and Fes-rich particles, the enhancement of the
reduced Fesss-rich particles derived from SSS may be not attributed to the iron content in the
material. The iron part in these synthesized materials could be either amorphous iron oxide which
was catalytic inactive or the phases detected by XRD was also non-catalytic. Third, according to
the elemental concentration in Table 6.2, Ti and Cr with more than 5 wt% might along with other
trace metals such as Co, Nb, Pd, Au might enhance the reaction after reduction although Co, Nb,
Pd and Au were also found in Fe-rich particles derived from serpentine.
Figure 6.8. H2 conversion from cellulose with different catalysts (1:1 stoichiometric NaOH vs.
cellulose and the catalyst at 20 wt% loading unless otherwise stated).
124
6.4 Conclusions
A new method of synthesizing Fe-based materials coupled with the two-step mineral
carbonation was studied in this work. Serpentine and stainless steel slag were both applied in the
pH-swing method by having the dissolution of solids and the carbonation of the extracted Ca/Mg-
rich solutions, separately. Prior to the carbonation, Fe-based materials were precipitated in the
form of metal hydroxide by adding appropriate amount of alkali. Strong base such as NaOH could
minimize the total use of the solution whereas it was relatively harder to control the pH of the
aqueous system therefore it might increase the chance of the co-precipitation and also affect the
particle size distribution of the synthesized material. Weak base such as HMTA could control the
pH fairly well but the amount of the bases required would be several folds. The possible pathway
for the future study would be, at the low pH range, using strong bases (e.g., NaOH) to neutralize
the solution whereas, for the precipitation of the Fe-based material, using weak bases (e.g., HMTA)
in order to maintain the pH increment in a very limited range. Regarding the catalyst testing, the
purchased crystalline hematite and magnetite with the average particle size smaller than 5 µm
could both enhance the BTH conversion whereas the reduction of magnetite didn’t gain a further
improvement. The inactive Fe-based materials synthesized from serpentine and SSS should
contain certain amount of amorphous iron oxide therefore they did not improve the conversion.
Nevertheless, the enhancement by the reduced Fe-based material derived from SSS may be
attributed to other elements co-precipitated during the catalyst synthesis such as Ti, Co, Cr an etc,
which was similar to the promoted iron oxide catalyst. This study also makes it very interesting to
compare the SSS with other types of slag in the future since different special metal elements are
added to steel of various categories. In general, based on this study, it is possible to generate some
value-added byproduct from the two-step slag carbonation process and use this byproduct as a
catalyst for a particular energy conversion system or probably others. Therefore, in the future, the

125
cost of the mineral carbonation could be offset by the byproduct value thus sequestering more CO2
per dollar investment and energy sources of the iron and steel plant could be diversified by using
the catalyst generated.
126
CHAPTER 7
PRELIMINARY LIFE CYCLE AND ECONOMIC ASSESSMENT OF
CARBONATION OF SLAGS AND ITS INTEGRATION WITH CEMENT
MAKING
7.1 Introduction
The majorities of current iron making processes are using blast furnaces (Siemens, 2012);
however, the FINEX® technology has been claimed to have multiple merits compared to blast
furnace, particularly in terms of economic and environmental advantages. Therefore,
comprehensive assessments of this process coupled with carbon mineralization of iron and steel
slag and utilization of carbonated slag in cement materials have been performed based on the
economics of raw materials and overall carbon footprint. The FINEX® process integrated with
carbonation of slag shown in Figure 7.1 is a plant with iron production of 1.5 MMT (million metric
ton)/y. The annual consumption of raw materials are 2.15 MMT iron ore, 1.1 MMT coal and 0.24
MMT limestone/dolomite. The annual production of iron slag is 0.435 MMT. The off-gas from
fluidized beds contained 33% CO2 but after pressure-swing CO2 separation, concentrated off-gas
with less than 3% CO2 is mixed with syngas from coal gasification with volume fraction of 30%.
Some of the off gas is also directly fed into the power plant for electricity generation which mainly
supplies the power demand of oxygen plant. In particular, general power plant off-gas only contain
12~14% CO2 which could make the capture and sequestration very inefficient (Xu et al., 2003).
Nevertheless, the tail gas after CO2 removal of the fluidized bed off-gas could have 66% CO2
which is desirable for direct mineral carbonation of the slag from the melter-gasifier (POSCO,
2008). The assessment quantifies the carbon footprint reduction via this integration and measures
the overall economic viability.

127
Figure 7.1. FINEX® process integrated with mineral carbonation of slags (POSCO, 2008).
7.2 Raw Materials and Energy Requirement
The feedstock of iron making process includes
coal (e.g. coking coal for BF vs. non-coking coal
for FINEX®) and iron ores shown in Table 7.1.
Coke is prepared by treating the coking coal in the
coke plant prior to its addition into the BF whereas non-coking coal is gasified in the melter-
gasifier of the FINEX® process. Fine iron ore has to be sintered as sintered ore with average size
of 15~30 mm and inexpensive iron ore tailings normally bond with limestone and dolomite as
pellet before adding them into BF. The pretreatment of coking coal, fine ore and iron ore tailings
Table 7.1. Categories of iron ore
Iron Ore Category Average Size
High Grade Lump ore 10~40 mm
Fine ore 2~3 mm
Inexpensive Tailings < 74 µm

128
is energy intensive (Bugayev et al., 2001; Kawasaki Steel 21st Century, 2003). In the contrary, fine
ore and iron ore tailings are added into the serial fluidized bed reactor of FINEX® process from
the top directly, in a counter-current mode with syngas. Both processes need certain amount of O2
injection. The output of iron-making process includes off-gas and slags. Generally, the off-gases
contain CO, CO2, H2, N2, H2O and CH4 (the Iron and Steel Institute of Japan, 2012).On the other
hand, slag generation has been described in Chapter 2.
The operations of coke plant, sinter plant and blast furnace all require energy. By eliminating
the coke plant and the sinter plant and utilizing the fluidized bed reactor, the total energy input and
consumption of FINEX® process could be different especially fluidized bed reactor runs at a much
lower temperature compared to BF therefore the energy input is lower. In addition, the off-gas has
also been recycled in the FINEX® process by using pressure swing method to separate CO2 and is
re-fed along with syngas into fluidized bed or generates electricity. Therefore, the efficiency of
coal utilization can be increased and the total energy consumption could be offset.
7.3 Preliminary Life Cycle Analysis
7.3.1 Slag for Mineral Carbonation
Based on the material and energy input, Life Cycle Analysis (LCA) of integrated FINEX®
process, DRI-FB-II, has been conducted to evaluate its overall carbon footprint and economics of
this new processes. Particularly, if the slags could all be utilized for carbon mineralization to
reduce the CO2 emission during the iron making process, the carbon footprint of the FINEX®
process could be further improved. What’s more, if the carbonated slag could be filler material
mixed in cement, the overall consumption of raw material (i.e., limestone) and energy could also
be reduced per unit weight of cement produced. Since the difficult access to the industrial data of

129
detailed energy usage of this new technology, calculation has been mainly focused on the material
balance and CO2 emission.
Assumptions for LCA
The overall analysis is based on the North America economic scenarios.
Assuming that all the iron ore feedstock is hematite (i.e., Fe2O3).
Limestone and dolomite are normally fed with 1:1 ratio, however, it is assumed that
limestone is the only feedstock.
CaO totally, including free lime, in slag is from 30 wt% to 50 wt%.
The mass balance between iron ore and coal is based on this reaction:
2Fe2O3 + 3C → 4Fe + 3CO2
Feedstock
2.15 MMT/y iron ore
0.24 MMT/y limestone (iron ore : limestone = 9:1)
0.24 MMT/y limestone contains 0.134 MMT/y CaO
Slag
Slag rate for FINEX®: 290 kg/thm (tonne/metric ton hot metal)
290 kg/thm × 1.5 MMT/y iron = 0.435 MMT/y slag
CaO in slag is from 30 wt% to 50 wt% which converts to 0.131 MMT/y to 0.218 MMT/y
CaO on the basis of 0.435 MMT/y slag. This is in line with 0.134 MMT/y CaO in limestone.
Therefore, the amount of CaO in slag is assumed to be 0.134 MMT/y.
Potential CO2 sequestration based on 0.134 MMT/y CaO in slag is 0.1056 MtCO2/y
assuming all the CaO would convert into CaCO3. Nevertheless, the best to date technology
130
only claims average 75% conversion via direct carbonation (Sanna, 2014). The practical
amount of CO2 sequestered by 0.435 MMT/y slag is 0.1056 MtCO2/y * 0.75 = 0.0792
MtCO2/y.
Coal
2.15 MMT/y iron ore requires 0.24 MMT/y coal based on the stoichiometric ratio of the
above reaction.
Actual coal rate for FINEX®: 732 kg/thm
Actual coal consumption: 732 kg/thm × 1.5 MMT/y iron = 1.098 MMT/y coal in total
CO2 Emission from Raw Materials
CO2 emission from 1.098 MMT/y coal, assuming the coal is U.S. bituminous coal with
average carbon content 70% (Wadleigh, 1921), is 1.098 MMT/y * (44/12) * 0.7 = 2.8182
MtCO2/y
CO2 emission from 0.24 MMT/y limestone calcination is 0.1056 MtCO2/y
The gap between CO2 generation and potential CO2 sequestration using its own slag is
(2.8182 + 0.1056 – 0.0792) MtCO2/y = 2.8446 MtCO2/y
From the above calculations, we can see that in order to store all the CO2 of this plant, the
amount of slag is far less than enough. The additional amount of slag required is 15.6238 MMT/y
to abate the 2.8446 MtCO2/y. As discussed in Chapter 4, European countries such as Germany
could achieve almost 100% iron slag and ~ 90% steel slag reutilization (North Rhine-Westphalia
Steel Industry, 2006) therefore there wouldn’t be extra slags for European counties to abate the
carbon emission from its own process. Nevertheless, in developing countries where the slag
landfill and stockpile rate is still high, e.g. China, it becomes easier to conduct the mineral
carbonation of slags onsite at the iron and steel plants. As discussed in Chapter 4, in 2010, there

131
was 113.34 MMT iron and steel slag in total generated in China, assuming the average CaO content
of 40 wt%, 26.716 MtCO2 could be sequestered based on 75% efficiency. This is a little bit more
than the overall CO2 emission of nine FINEX® plants with capacity of 13.7 MMT iron/y.
Apparently, the slag rate and coal rate of FINEX are lower than BF due to its higher efficiency,
the error in estimating this situation in China should be adjusted according to the actual industrial
data. Considering that, in 2010, China produced 595.60 MMT iron and 638.74 MMT steel, which
were 57.5% and 44.58% of world production, respectively (Li et al., 2013). The amount of CO2
reduction with overall un-used amount of iron slag plus steel slag in China is still an extremely
small fraction of the entire carbon emission of the whole industry, ~ 1%. Nevertheless, from the
perspective of waste management, land use and environmental impact, carbonation of these un-
used slags is a better option than landfill and stockpile not to say the potential integration into
cement material.
7.3.2 Carbonated slag for cement application
Further LCA along with economic analysis has been done for utilizing the carbonated slag as
cement filler materials.
Assumptions
According to the results in Chapter 4, carbonated slag could be applied as filler material in
cement mortar, however, the cement mixture maintaining a good compressive strength
could only contain carbonated slag at 30 °C up to 15 wt%. This carbonated slag only
achieved CO2 conversion about 1/3 of the stoichiometric ratio between CaO and CO2.
Herein, the emission due to the carbonation process is not included.

132
CaO content in 0.435 MMT/y slag is assumed to be 0.134 MMT/y earlier. It is assumed
that 1 MT (metric ton) Portland cement production requires 1 MT limestone roughly based
on the weight fraction of CaO.
The emission of cement making is 0.41 MT CO2/MT cement, 46.3% from calcination of
limestone, 36.8% from fuel usage (ClimateTechWiki Organization, 2015).
Quarrying and processing natural limestone generate 0.077 MT CO2/MT limestone
(University of Tennessee, 2008).
Transportation of limestone is mainly based on railroads and the emission is 16.64 g
CO2/metric ton-km (Freight Railroads 7 Greenhouse Gas Emissions, 2008).
Average distance between mining site and iron & steel plant is 248 km (Miller, 2004; U.S.
Map Network, 2010).
Carbonated iron slag as cement filler materials.
1 MT mixed cement contains 0.15 MT carbonated slag.
CO2 reduction by substituting with 0.15 MT carbonated slag is 0.41 MT CO2/MT cement
* 0.15 = 0.0615 MT CO2/MT cement
Originally, the replaced 0.15 MT cement requires 0.15 MT limestone based on the
conversion ratio of 1
CO2 emission from quarrying and process of 0.15 MT limestone:
0.077 MT CO2/MT limestone × 0.15 MT limestone = 0.01155 MT CO2
CO2 emission from limestone transportation:
16.64 g CO2/metric ton-km × 248km × 0.15 MT limestone = 0.000619 MT CO2

133
Overall emission reduction is the sum of all the above for 0.15 MT carbonated slag or 1
MT mixed cement mortar: 0.0615 MT + 0.01155 MT + 0.000619 MT = 0.07367 MT CO2.
This converts to 0.491 MT CO2/ MT carbonated slag.
0.435 MMT/y slag after direct carbonation at 30 °C converts to 0.47 MMT/y carbonated
slag with overall conversion rate of 33%.
Therefore, the overall CO2 emission reduction is 0.491 MT CO2/ MT carbonated slag ×
0.470 MMT/y carbonated slag = 0.231 MtCO2/y
Compared to 0.0792 MtCO2/y reduction by slag carbonation, the integration with cement
making could achieve nearly 200% more carbon reduction. Also, further study may improve the
quality of mixed cement with carbonated slag of higher carbon content and thus the overall carbon
reduction could be even more. Therefore, this integration is preferred for the comprehensive waste
management, carbon management and sustainable material production for iron and steel and
cement industries in the future.
7.4 Economic Analysis
Average value of slag is $17/MT (USGS, 2013)
$ 17/MT slag * 0.435 MMT/y slag = $7.395 million/y
Since these slags which will be carbonated are those excessive ones that cannot be
consumed by the market especially the cement and construction industries, the value of
slags are not accounted for the current analysis.
Average price of limestone is $10/MT (USGS, 2012) thus savings of substituting limestone
with carbonated slag equals to $10/MT * 0.47 MMT limestone equivalent/y = $4.7
million/y

134
Transportation cost saving (Association of American Railroads, 2014): $0.0257/metric ton-
km × 0.47 MMT limestone equivalent/y × 248 km = $2.9956 million/y
Cost of carbonation of 0.435 MMT steel slag = Cost of capturing 0.0353 MtCO2 if 1/3 of
Ca in the iron slag had been converted to CaCO3
First, excluding the potential charges of slag from iron and steel plants, in order to achieve
break even for the mineral carbonation process, the cost for the carbonation of slag should not
exceed ($4.7 million/y + $2.9956 million/y) / 0.0353 MtCO2/y = $218/MT CO2. Since there is not
enough data reported for the price of carbonation of slag, for reference, NETL estimates that the
cost of CO2 mineralization using wollastonite (CaSiO3) is roughly $100/MT CO2 with total cation
conversion 82% (Penner et al., 2004). Since the carbonated slag at 30 °C only has a conversion of
33%, the actual cost should also be cheaper than $100/MT CO2. This means the overall process
could achieve $4.15 million/y profit at least for the iron/steel and cement plant jointly assuming
the carbonation cost is $100/MT CO2.
If the charge of slag cannot be avoided, the break even cost for the carbonation of slag is ($4.7
million/y + $2.9956 million/ – $7.395 million/y) / 0.0353 MtCO2/y = $8.52/MT CO2 which is
almost impossible based on the future trend of this technology. Thus, in the U.S. and E.U. scenario
where there is a relatively stable market price and end-user of slag, it is not economical for
iron/steel and cement plants to produce this kind of cement based on the carbonation of slag
considering that there is no price for carbon now. The only possibility is that carbon is priced and
the cost of carbonation of slag could be lower in the future. Nevertheless, in developing countries,
where there is excessive amount of stockpiled or landfilled slag, this scheme should work
economically.

135
7.5 Conclusions
In general, based on the above analysis, utilizing the slag generated from 1.5 MMT/year
FINEX® process for carbon sequestration and mixed in the cement material could both decrease
the overall carbon footprint either from the CO2 sequestered or from the elimination of the
calcination of equivalent amount of limestone along with corresponding energy usage. In order to
use the carbonated slag in the cement material as well, according to the findings in Chapter 4, only
33% of the CO2 capture capacity of slag could be achieved otherwise the more carbonated slag
material may not guarantee the standard of Portland cement. On the other hand, in order to afford
the mineral carbonation without additional cost, the price of mineral carbonation with slag should
be lower than $218/MT CO2 in the condition that cement plant does not need to pay for the slag
which is achievable for sure based on the current technology. Therefore, future work could be
focused on: (1) increasing the carbon content in the carbonated slag while guaranteeing the quality
of the mixed cement material thus more carbon reduction could be achieved and (2) improving the
carbonation technology and decrease the cost of slag carbonation further. Based on the above
preliminary analysis, especially in developing countries like China, where slag is normally an
overburden and treating the slag even costs money, $9~10/MT slag (Baotou Steel, 2014), the
integration of slag carbonation and utilization with cement production sees more practical sense.
It could not only solve the waste problem but also reduce the carbon emission of both industries
and even make profits.
136
CHAPTER 8
CONCLUSIONS AND FUTURE WORK
8.1 Conclusions
In this study, on one hand, utilization of inexpensive iron ore tailings directly in the fluidized
bed based on the FINEX® technology was investigated in terms of their electrostatic and
entrainment behaviors during the fluidization of binary or quaternary systems. On the other hand,
mineral carbonation with stainless steel slag via both the direct and two-step carbonation was also
studied. During carbonation, solvent, reactor type, pH, temperature, particle properties had all been
examined. After carbonation, the end-product and by-product from both routes had been studied
for various applications. Carbonated stainless steel slags, derived from one step or two-step
carbonation, were mixed in the cement mortar by investigating their chemical, physical and
mechanical properties and Fe-based material precipitated during the two-step carbonation was
applied as catalysts for an alkaline thermal treatment of biomass for H2 production. Environmental
safety of stainless steel slag or its derivative materials during these applications was also studied.
First, multi-particulate system in a fluidized bed mimicking the decoupled single-step
ironmaking process but in a cold state, was investigated. This work found that the fines were
retained by the enhanced electrostatic forces between fine and coarse particles due to the
significant electrostatic charging phenomenon occurring during fluidization, though other factors
also affected, including the agglomeration of fines and other inter-particle forces. Nevertheless,
the aggregate of fine and coarse particles or fine and fine particles would be segregated when the
hydrodynamic force became dominating at high fluidizing gas velocities. Besides the fraction of
adhesive Group C particles in the system, the hydrophobic properties of particles, the inherent
magnetic particles contained in the fines would also be factors which may lead to the reduced

137
entrainment of fines. Especially, at the temperature of DRI condition, sintering of iron ore fine
particles on the coarse particles would happen which eventually prevent the entrainment of fines.
Then, mineral carbonation was studied using the end-product of iron and steel making as the
mineral alternative. In the direct carbonation system, 1 M NaHCO3 was selected as a good buffer
solution. The extent of carbonation would increase with the increasing reaction temperature. It
could still achieve 50% carbonation of overall Ca in 12 hours under a mild condition (i.e., low
temperature and ambient condition). SEM/EDS pictures suggested that the amount of SiO2
increased in large chunk with the increasing extent of carbonation of the SSS samples whereas
these SiO2 should be amorphous since XRD didn’t show any specific peak of silica. Also, the
pictures illustrated that the Cr and C after carbonation in the CSSS samples were quite apart
therefore the formation of chromium carbonate would not likely happen. XRD results showed that
the Ca for carbonation in SSS may largely derive from C2S other than CS and CS2. Mixing direct
CSSS sample in Portland cement could enhance the comprehensive strength of cement mortar such
as adding CSSS 30 °C sample of 10 ~ 15 wt%, however, those substitute sample containing higher
percentage of calcite would eventually decrease their strength because the excessive calcite would
not contribute to the hydration reaction anymore but became as a filler only. Based on the
calorimetry measurement, adding CSSS could enhance the pozzolanic reaction of cement mortar
and retard the hydration and setting time. In the end, Cr leaching of direct CSSS was found
significantly increased after carbonation. Nevertheless, Cr leaching of cement mortar with addition
of direct CSSS was controlled under environmental regulation. The current work suggests that an
environmentally benign cementitious material containing CSSS is achievable typically suitable for
the application that requires longer setting time (e.g., oil well casing).

138
For two-step carbonation, organic chelating compound such as citrate, glutamate and picolinate
were proved to be good options towards Ca extractions. The dissolution mechanism of stainless
steel slag was different from natural minerals due to its heterogeneous nature, which depended on
different crystal phases in terms of the extent of Ca extracted. Basically, the pH, buffer strength,
and chelating effect would influence the total Ca extraction as well as Si extraction. Temperature
seemed having minimum effect on enhancing the Ca dissolution for gluconic acid but became
significant for NH4Cl due to the gaseous species generated during reactions in the batch reactor
system. Initial pH of the reactants and temperature were proved to be able to affect the size and
shape of the PCC. Spherical PCC formed with low pH and temperature, however, PCC with crystal
structures formed at high pH and temperature. PCC from Ca-rich solution from SSS were always
crystalline. Besides, the bubble column reactor is favored for future experiments in order to get
more uniform crystalline products, in which the pH could be assumed to be constant, comparing
to batch experiment, in which pH increased with the depletion of protons. The industrial
application of PCC requires it having certain crystal structure therefore the PCC derived from 2-
step CSSS should have a good chance. The SSS and SSS residue after two-step carbonation were
found with Cr leaching higher than the E.U. regulation which needed further investigation.
Still in the two-step carbonation process, Fe-based materials could be synthesized from
minerals or industrial waste via precipitation. Serpentine and stainless steel slag were both applied
in the pH-swing method. The amount of base. vs. the metal ion-rich solution was strictly controlled.
Strong base such as NaOH could minimize the volume of the solution to handle whereas it was
relatively harder to control the pH of the system therefore it might increase the chance of co-
precipitation. Weak base such as HMTA could control the pH fairly well but the amount of the
base required would be several folds. The possible pathway for future study would be, at low pH
139
range, using strong base to neutralize the solution whereas, for the precipitation of the Fe-based
material, using the weak base in order to maintain the pH increment in a very limited range.
Regarding the catalyst testing, purchased crystalline hematite and magnetite with average particle
size smaller than 5 µm could both enhance the BTH conversion whereas the reduction of magnetite
didn’t gain further improvement. The inactive Fe-based materials synthesized from serpentine and
SSS should contain certain amount of amorphous iron oxide therefore they did not improve the
conversion. Nevertheless, the enhancement by the reduced Fe-based material derived from SSS
may be attributed to other elements co-precipitated during the catalyst synthesis such as Ti, Co
and Cr, which was similar to the promoted iron oxide catalyst. In general, based on this study, it
is possible to generate some value-added byproduct from the two-step slag carbonation process
and use this byproduct as a catalyst for a particular energy conversion system and probably others.
Therefore, for an iron and steel plant, the cost of mineral carbonation could be offset by the
byproduct value thus sequestering more CO2 per dollar investment and they could also diversify
the energy sources by utilizing the catalyst generated.
Finally, LCA was performed in order to evaluate the integration of FINEX® with mineral
carbonation of iron and steel slag. The primary assessment suggested that, to sequestering all the
CO2 of the FINEX® plant, the amount of its own slag is far less than enough. The additional amount
of slag required is 15.62 MMT/year on top of 0.435 MMT/year. In Europe, since the slag
valorization rate is high for both iron and steel slag, there wouldn’t be enough slag for them to
abate their carbon emission with their own slags. In developing countries where the slag landfill
and stockpile of slag are a big issue, e.g. China, it becomes easier to conduct the mineral
carbonation of slags nearby the plants. However, transportation of enough slag from different
sources to meet one plant’s emission might not be practical. Also, the amount of CO2 reduction

140
which could be achieved with the overall un-used slag in China is still an extremely small fraction
of the entire carbon emission of the whole industry, ~ 1%. Nevertheless it can still help solve their
challenges in the waste management of excessive amount of slags.
Furthermore, in order to use the carbonated slag in the cement material as well, according to
the findings in Chapter 4, only 33% of the CO2 capture capacity of slag could be achieved without
compromising the quality of cement mortars. On the other hand, in order to afford the mineral
carbonation without additional cost, the price of mineral carbonation with slag in this study should
be lower than $218/MT CO2 in the condition that cement plant does not need to pay for the slag
which is achievable for sure based on the current technology. According to this preliminary
analysis, especially in developing countries like China, where slag is normally an overburden and
treating the slag even costs money ($9~10/MT slag) (Baotou Steel, 2014), the integration of slag
carbonation and utilization with cement production sees more practical sense. It could not only
solve the waste problem but also reduce the carbon emission of both iron & steel and cement
industries while still being profitable.
8.2 Future Work
A fluidization study of particulate system including iron ores of different compositions, sizes
and etc. in the same condition of DRI reaction should be investigated. In-situ monitoring the
electrostatic behaviors of particles could be improved with electrostatic tomography technique
currently being developed in Park group instead of the single probe measurement. The intensified
inter-particle forces would also change the fluidization feature of fines and may assist their
sintering. Real-time sintering study could help better understand the entrainment behavior of fine
particles in the metallurgical temperature environment. Also, the kinetics of the sintering of fines

141
should be compared with the transport feature of this multi-particulate system that fines had
already sintered before reaching the top of the fluidized bed would not be entrained. So, the iron
making plant could be better informed of the extreme loading of iron ore fines and its relevant
controlling factors.
During the application of steel slag, efforts should not only be focused on converting or
removing the content of free lime but also the non-magnetic FeO component therefore improve
the overall utilization rate of steel slag. Particularly, understanding the mechanism of Cr leaching
during the mineral carbonation, either one-step or two-step, is necessary to make sure that the
products and waste are environmentally manageable. For two step carbonation, reaction scheme
with recycling solvent and chelating agent should be designed in order to sustain the continuous
operation while minimizing the cost. Cement mortar with addition of different carbonated slag
sample should be analyzed based on their macro and micro features in order to select their most
appropriate application, e.g. construction cement or oil well cement. Fundamental study should
be continued on understanding the hydration behavior due the crystal phase change of steel slag
before and after the carbonation in order to better engineer this type of new material.
For the Fe-based material derived from various minerals or industrial wastes, particles
synthesized by applying good buffer solvents (e.g., HMTA) should be compared with current
materials in terms of the extent of co-precipitation and particle sizes. Additional fundamental
studies need to be done in order to prove that why amorphous iron oxide cannot enhance,
whether and which trace metals presented can catalyze the cellulose to H2 conversion by
coupling with the unveiling mechanism of this overall process studied by colleagues in Park
group. Also, the mechanism of pure hematite and magnetite enhancing this conversion should be
studied. This study also makes it very interesting to compare the SSS with other types of slag in

142
the future since different special metal elements are added to steel of various categories and these
metal elements have been widely reported for catalyst application.
Finally, a systematical design of combining iron and steel making, cement application and
CO2 sequestration in order to achieve the optimal overall carbon footprint of an integrated system
should be further developed both technically and economically. The future work towards
industrial application in an economical manner could be focused on: (1) increasing the carbon
content in the carbonated slag while guaranteeing the quality of the mixed cement material thus
more carbon reduction could be achieved and (2) improving the carbonation technology and
decrease the cost of slag carbonation further.

143
References
Antonio, M.R.J. and Nicolas, P.G., 2013. Prospective scenarios on energy efficiency and CO2
emissions in the European Union Iron & Steel Industry. Energy, 54, 113-128.
Association of American Railroads, 2014. The Cost Effectiveness of America’s Freight Railroads.
https://www.aar.org/KeyIssues/Background-
Papers/Cost%20Effectiveness%20of%20Freight%20RRs.pdf
Bartholomew, C.H. and Farrauto, R.J., 2006. Fundamentals of Industrial Catalytic Processes. John
Wiley & Sons, Inc., Hoboken, New Jersey.
Baotou Steel, 2014. Baotou Steel 2013 Manufacturing Statistics Report. Retrieved from
http://www.btsteel.com/.
Boef, G.D, 1977. Theoretische grondslagen van de analyse in watreige oplossingen, 4th Edition,
Elsevier: Amsterdam and Brussel.
Bensted, J., 1987. Some applications of conduction calorimetry 10 cement hydration. Adv. Cement
Res., 1, 35-44.
Briens, C.L., Bergougnou, M. A., Inculet, I. I., 1992. Size distribution of particles entrained from
fluidized beds: electrostatic effects. Powder Technology, 70, 57-62.
Brewer, P.G., Friederich, G., Pelzer, E.T., Orr., F.M., Jr., 1999. Direct experiments on the ocean
disposal of fossil fuel CO2. Science, 284, 943−945.
Bonney, C.F., Fenton, V.P., Clark, R.J., Barrett, W.L., Ziogas, A-P., Harrison, D., Grossou-Valta,
M., 2000. Production of Low-cost By-product Fillers. Waste Materials in Construction:
Science and Engineering of Recycling for Environmental Protection, Elsevier Science Ltd:
Oxford, UK.
144
Braun, A., Bӓrtsch, M., Schnyder, B., Kӧtz, R., 2000. A model for the film growth in samples with
two moving reaction frontiers-An application and extension of the unreacted-core model.
Chemical Engineering Science, 55, 5273-5282.
Bugayev, K., Bychkov, Y., Konovalov, Y., Kovalenko, V, Tretyakov, E., 2001. Iron and steel
production, Books for Business: New York and Hong Kong.
Bonenfant, D., Kharoune, L., Sauve, S., Hausler, R., Niquette, P., Mimeault, M. and M. Kharoune,
2008. Ind. Eng. Chem. Res., 47, 7610–7616.
Braga, T.P., Pinheiro, A.N., Teixeira, C.V., Valentini, A., 2009. Dehydrogenation of ethylbenzene
in presence of CO2 using a catalyst synthesized by polymeric precursor method. Applied
Catalyssis A: General, 366, 193-200.
Carter, R.E., 1961. Kinetic model of solid-state reactions. J. Chem. Phys., 34, 2010.
Ciborowski, J.S., Wlodarski, A., 1962. On electrostatic effects in fluidized beds. Chemical
Engineering Science, 17, 23-32.
Cross, J., 1987. Electrostatics: Principle, Problems and Applications, Adam Higler: Bristol.
Crawford, R., Ralston, J., 1988. The influence of particle size and contact angle in mineral flotation.
International Journal of Mineral Processing, 23, 1-24.
CEN, 1999. Characterization of waste leaching compliance test for leaching of granular waste
materials sludge-Part 2, EN 12457-2. http://www.sipe-rtd.info/directive/characterisation-
waste-leaching-compliance-test-leaching-granular-waste-materials-and-sl-0
Chang, E-E; Pan, S-Y; Chen, Y-H; Chu, H-W; Wang, C-F; Chiang, P-C., 2011. CO2 sequestration
by carbonation of steelmaking slags in an autoclave reactor. J. Hazard. Mater., 195, 107– 114.
ClimateTechWiki Organization, 2015. “Energy Efficiency and Saving in the Cement Industry”.
http://www.climatetechwiki.org/technology/energy-saving-cement.

145
Das, B., Prakash, S., Reddy, P.S.R., Misra, V.N., 2007. An overview of utilization of slag and
sludge from steel industries. Resources, Conservation and Recycling, 50 (1), 40-57.
Doucet, F.J., 2010. Effective CO2-specific sequestration capacity of steel slags and variability in
their leaching behavior in view of industrial mineral carbonation. Mineral Engineering, 23,
262-269.
Energetics Incorporated, 2000. Energy and environmental profile of the U.S. iron and steel
industry. U.S. Department of Energy Office of Industrial Technologies DOE/EE-0229.
http://www.energy.gov/sites/prod/files/2013/11/f4/steel_profile.pdf
Eloneva, S., Teir, S., Salminen, J., Fogelholm, C.-J. and Zevenhoven, C.-J., 2008. Ind. Eng. Chem.
Res., 47, 7104–7111.
Eloneva, S., Teir, S., Salminen, J., Revitzer, H., Kontu, K., Forsman, A.-M., Zevenhoven, R.,
Fogelholm, C.-J., 2008. Pure calcium carbonate product from the carbonation of a steelmaking
slag. Proceedings of “ACEME 08, 2nd International Conference on Accelerated Carbonation
for Environmental and Materials Engineering”. Rome, Italy, October, 2008.
Eloneva, S., Puheloinen, E.M., Kanerva, J., Ekroos, A., Zevenhoven, R., Fogelholm, C.J., 2010.
Co-utilisation of CO2 and steelmaking slags for production of pure CaCO3 – legislative issues.
Journal of Cleaner Production, 18 (18), 1833-1839.
EMEP/EEA, 2009. EMEP/EEA emission inventory guidebook 2009. Retrieved from
http://www.eea.europa.eu/publications.
Chang, E. E., Pan, S.-Y., Chen, Y.-H., Tan, C.-S., Chiang, P.-C., 2012. J. Hazard. Mater., 227–
228, 97–106.

146
Ernst & Young, 2014. Global Steel 2014: Planning to profit from opportunity: preparing for future
demand, accessed August 2014.
Encyclopedia Britannica, 2014. “Building Material” Encyclopedia Britannica, Encyclopedia
Britannica Online Academic Edition, Encyclopedia Britannica Inc.: Chicago, IL.
Fan, L.-S. and Zhu, C., 1998. Principles of Gas-Solid Flows, Cambridge University Press: London,
UK.
Fang, X., Li, B., Chernyshova, I.V., Somasundaran, P., 2010. Ranking of as-received
micro/nanoparticles by their surface energy values at ambient conditions. J. Phys. Chem., C
114, 15473–15477.
Fort, R., Buergo, M.A., Gomez-Heras, M., Vazquez-Calvo, C., Chenel, C., Varas, M.J., Perez-
Monserrat, E., 2006. Heritage, Weathering and Conservation: Proceedings of the International
Conference, 21-24 June 2006, Madrid, Spain, Taylor & Francis: New York, NY.
Freight Railroads & Greenhouse Gas Emissions, 2008. Railroads: The Vital Link to North
America’s Economic Future, Association of American Railroads.
http://siteresources.worldbank.org/EXTRAILWAYS/Resources/515244-
1268663980770/greenhouse.pdf
Fung, J., Michael, D., Nettesheim, C., Finamore, B., Jin, R., Mo, K., 2009. From Gray to Green:
How Energy-Efficient Buildings Can Help Make China’s Rapid Urbanization Sustainable.
Boston Consulting Group: Boston, MA.
Fumoto, E., Matsumura, A., Sato, S., Takanohashi, T., 2009. Recovery of Lighter Fuels by
Cracking Heavy Oil with Zirconia-Alumin-Iron Oxide Catalysis in a Steam Atmosphere.
Energy & Fuels, 23, 1338-1341.
147
Fumoto, E., Sato, S., Taknohashi, T., 2012. Catalytic Cracking of Heavy Oil over a Complex Metal
Oxide Catalyst in a Steam Atmosphere. Nanocatalysis for Fuels and Chemicals, ACS
Symposium Series, Vol. 1092., Chapter 6, 75-85.
Ferguson, T.E., Park, Y.J., Petit, C., Park, A.-H.A., 2012. Novel Approach to Hydrogen Production
with Suppressed COx Generation from a Model Biomass Feedstock. Energy & Fuels, 26(7),
4486-4496.
Geldart, D., 1973. Types of gas fluidization. Powder Technology, 7, 285.
Geldart, D., 1986. Gas fluidization Technology, John Wiley & Sons: New York, NY.
Gray, S.R., Langberg, D.E., Gray, N.B., 1994. Fine mineral recovery with hydrophobic magnetite.
International Journal of Mineral Processing, 41, 183-200.
Guardian, 2009. The world-famous bridge, Ironbridge, Shropshire. Guardian, June 9, 2009.
http://www.theguardian.com/travel/2009/jun/09/walk-guides-ironbridge-shropshire
Guardiola, J., Rojo, V., Ramos, G., 1996. Influence of particle size, fluidization velocity and
relative humidity on fluidized bed electrostatics. Journal of Electrostatics, 37, 1-20.
GEA, 2012. Global Energy Assessment - Toward a Sustainable Future, Cambridge University
Press, Cambridge, UK and New York, NY, USA and the International Institute for Applied
Systems Analysis, Laxenburg, Austria.
Haas, P.A., Pitt, W.W., Robison, J.S.M, Ryon, A.D., 1983. Preparation of Metal Oxide Gel
Spheres with Hexamethylenetetramine as an Ammonia Donor. Ind. Eng. Chem. Prod. Res.
Dev., 22, 461-466.
Hawkins, Tennis and Detwiler, PCA, 2003. The Use of Limestone in Portland Cement: A State-

148
of-the-Art Review. Portland Cement Association: Skokie, IL.
Haszeldine, R.S., 2009. Carbon capture and storage: how green can black be? Science, 325,
1647−1652.
Hendrickson, G., 2006. Electrostatics and gas phase fluidized bed polymerization reactor wall
sheeting. Chemical Engineering Science, 61, 1041-1064.
Hogan, W.T., 1994. Steel in the 21st century: competition forges a new world order. Macmillan
Inc.: New York.
Holloway, S., 2001. Storage of fossil fuel-derived carbon dioxide beneath the surface of the earth.
Annu. Rev. Energy Environ, 26, 145−166.
Homma, S., Ogata, S., Koga, J., Matsumoto, S., 2005. Gas-solid reaction model for a shrinking
spherical particle with unreacted shrinking core. Chemical Engineering Science, 60, 4971-
4980.
Hosford, W. F., 2012. Iron and Steel [M]. Cambridge University Press: Cambridge, UK.
Huijgen, W.J.J., Comans, R.N.J., 2003, Carbon dioxide sequestration by mineral carbonation:
Literature review, ECN-C--03-016, Energy Research Centre of the Netherlands.
Huijgen, W.J.J., Comans, R.N.J., 2005a. Mineral CO2 Sequestration by Steel Slag Carbonation,
Environmental Science & Technology, 39, 9676-9682.
Huijgen, W.J.J., Comans, R.N.J., 2005b. Carbon dioxide sequestration by mineral carbonation:
Literature review update 2003-2004, ECN-C—05-022, Energy Research Centre of The
Netherlands.
149
Huijgen W.J.J.; Witkamp, G.J.; Comans, R.N.J., 2006. Mechanisms of aqueous wollastonite
carbonation as a possible CO2 sequestration process. Chemical Engineering Science, 61 (13),
4242-4251.
Huijgen, W.J.J., Comans, R.N.J., 2006. Carbonation of steel slag for CO2 sequestration: Leaching
of products and reaction mechanisms. Environ. Sci. Technol., 40, 2790-2796.
Huijgen, W.J.J., Comans, R.N.J., Witkamp, G.-J, 2007. Cost evaluation of CO2 sequestration by
aqueous mineral carbonation. Energy Conversion and Management, 48, 1923-1935.
Hwang, C.L., Shen, D.H., 1991. The effects of blast-furnace GGBS and FA on the hydration of
portland cement. Cem. Concr. Res., 21:410-426.
IEA, 2008. Energy Technology Perspectives Executive Summary 2008, OECD Publishing.
http://www.iea.org/media/etp/etp2008.pdf
IEA, 2009. Energy Technology Transitions for Industry, 2009. Retrieved from
http://www.iea.org/publications/freepublications/publication/industry2009.pdf.
IEA, 2010. Organisation for Economic Co-operation and Development, World Energy Outlook
2010. http://www.worldenergyoutlook.org/media/weo2010.pdf
IEA, 2014. Organisation for Economic Co-operation and Development. International Energy
Outlook 2014. http://www.eia.gov/forecasts/ieo/pdf/0484(2014).pdf
IPCC, 2005. IPCC Special Report: Carbon Dioxide Capture and Storage. Cambridge University
Press: New York, NY.
IPCC, 2007a. Climate Change 2007: Synthesis Report. Cambridge Univ. Press: New York, NY.
IPCC, 2007b. IPCC 4th Assessment Report: Climate Change 2007, Iron and Steel, Chap. 7.4.1.
http://www.ipcc.ch/publications_and_data/ar4/wg3/en/ch7s7-4-1.html

150
IPCC, 2013. Climate Change 2013: The Physical Science Basis. Cambridge University Press:
Cambridge, UK.
Ishida, M., Takenaka, S., Yamanaka, I., Otsuka, K., 2006. Production of COx-free hydrogen from
biomass and NaOH mixture: effect of catalysts. Energy & Fuels, 20, 748-753.
Katz, H., Sears, J.T., 1969. Electric field phenomena in fluidized and fixed bed. Canadian Journal
of Chemical Engineering, 47, 50-53.
Kawasaki Steel 21st Century, 2003. An Introduction to Iron and Steel Processing. Retrieved from
http://www.jfe-21st-cf.or.jp/index2.html.
Kawashima, S., J. Seo, D. Corr, M. Hersam and S.P. Shah., 2013. Dispersion of
CaCO3 nanoparticles by sonication and surfactant treatment for application in fly ash-cement
systems. Materials and Structures, 1-13, 2013.
Kakli et al., 2000. Hydration products of C3A, C3S and Portland cement in the presence of CaCO3.
Cem. Concr. Res., 30(7), 1073-1077.
Kilau, H.W.; Shah, I.D., 1984. Preventing Chromium Leaching From Waste Slag Exposed to
Simulated Acid Precipitation: A Laboratory Study. Bureau of Minds Report of Investigation,
U.S. Department of Interior.
Kim, J.H., Bae, J.W., Nam, J.W., Kim, S.D., Choi, J.H., Lee, D.H., 2013. 62nd Canadian Chemical
Engineering Conference, Special Sessions in Honour of Professor John R. Grace.
Kim, H. R., Lee, D. H., Fan, L.-S., Park, A.-H., 2009. Synthesis of iron-based chemical looping
sorbents integrated with pH swing carbon mineral sequestration. Journal of nanoscience and
nanotechnology, 9 (12), 7422-7427.

151
Kirchofer, A., Brandt, A., Krevor, S., Prigiobbe, V., Becker, A., Wilcox, J., 2013. Assessing the
Potential of Mineral Carbonation with Industrial Alkalinity Sources in the U.S. Energy
Procedia, 37, 5858-5869.
Kochloefl, K., Ertl, G., Knözinger, H., Weitkamp, J., 1997. Water Gas Shift and COS Removal,
Handbook of Heterogeneous Catalysis, vol. 4; VCH, Weinheim: Germany, p. 1831.
Kodama, S., Nishimoto, T., Yamamoto, N., Yogo, K., Yamada, K., 2006. Development of a new
pH-swing CO2 mineralization process with a recyclable reaction solution. Energy, 33, 776-784.
Kourounis, S., Tsivilis, S., Tsakiridis, P.E., Papdimitriou, G.D., Tsibouki, Z., 2007. Properties and
hydration of blended cements with steelmaking slag. Cement and Concrete Research, 37, 815-
822.
Krevor, S.C., Lackner, K.S., 2009, Enhancing process kinetics for mineral carbon sequestration,
Energy Procedia, (1), 4867-4871.
Kvitek, L., Pikal, P., Kovarikova, L., Hrbac, J., 2002. The study of the wettability of powder
inorganic pigments based on dynamic contact angle measurements using wilhelmy method.
Acta Universitatis Palackianae Olomucensis Facultas Rerum Naturalium Chemica, 41, 27-35.
Lackner, K.S., Wendt, C.H., Butt, D.P., Joyce, E.L., Sharp, D.H., 1995. Carbon dioxide disposal
in carbonate minerals, Energy, 20 (11), 1153-1170.
Lackner, K. S., Butt, D. P., Wendt, C. H., 1997. Progress on binding CO2 in mineral substrates.
Energ. Convers. Manage., 38, 259−264.
Lackner, K. S., 2003. A guideline to CO2 sequestration. Science, 300, 1677−1678.
Lacks, D.J., and Sankaran, R. M., 2011. Contact electrification of insulating materials. Journal of
Physics D: Applied Physics, 44, 45.

152
Ladebeck, J.R., Wagner, J.P., 2003. Catalyst development for water-gas shift. Handbook of Fuel
Cells – Fundamentals, Technology and Applications, 3(2), p. 190-201. John Wiley & Sons,
Ltd, Chichester, Germany.
Lang, E.; Brodersen, H.A., 2000. The Performance of Blast Furnace Slag Cement, Proceedings of
2nd European Slag Conference, Duesseldorf, pp. 37-50.
Lekakh, S.N., Rawlins, C.H., Robertson, D.G.C., Richards, V.L., Peaslee, K.D., 2008a. Kinetics
of aqueous leaching and carbonization of steelmaking slag. Metallurgical and Materials
Transactions B, 39, 125-134.
Lekakh, S.N., Robertson, D.G.C., Rawlins, C.H., Richards, V.L., Peaslee, K.D., 2008b.
Investigation of a two-stage aqueous reactor design for carbon dioxide sequestration using
steelmaking slag. Metallurgical and Materials Transactions B., 39, 484-492.
Levenspiel, O., 1972. Chemical Reaction Engineering, 2nd Edition. John Wiley and Sons: New
York, NY.
Li, G.; Zhang, H.; Ni, H.; Guo, M., 2013. Current Development of Slag Valorisation in China.
Proceedings of the 3rd International Slag Valorisation Symposium.
Li, J., Kato, K., 2001. A correlation of the elutriation rate constant for adhesion particles (group C
particles). Powder Technology, 118, 3, 209-218.
Liu, B., Du, H., Wang, S.N., Zhang, Y., Zheng, S.L., Li, L.J., Chen, D.H., 2012. A novel method
to extract vanadium and chromium from vanadium slag using molten NaOH-NaNO3 binary
system. AIChE Journal, 00, 1-12.
Malvern, 2015. Retrieved from http://www.malvern.com/en/products/technology/laser-
diffraction/

153
Martin et al., 1994. Testing the iron hypothesis in ecosystems of the equatorial Pacific Ocean.
Nature, 371, 123−129.
Matschei, T., Lothenbach, B., Glasser, F.P., 2007. The role of calcium carbonate in cement
hydration. Cem. Concr. Res., 37(40), 551-558.
Meima, J.A., Weijden van der, R.D., Eighmy, T.T., Comans, R.N.J., 2002. Carbonation processes
in municipal solid waste incinerator bottom ash and their effect on the leaching of copper and
molybdenum. Appl. Geochem, 17 (12), 1503-1513.
McBride, D.L. and Feinman J., 2000. Iron by Direct Reduction. Kirk-Othmer Encyclopedia of
Chemical Technology [C], United States Steel Corp.
Miller, 2004. 2003 Directory of lime plants in the United States. Pages 1–15 in U.S. Geological
Survey Mineral Industry Surveys. Washington, DC: U.S. Government Printing Office.
http://minerals.usgs.gov/minerals/pubs/commodity/lime/limedir04.pdf. Accessed June 2013.
Mindat.org, 2015. http://www.mindat.org/
Mindess, S., Young, J.F., Darwin, D., 2002. “Concrete”. Prentice Hall; 2 edition: Upper Saddle
River, NJ.
Mittal, K.L., 2009. Contact Angle, Wettability and Adhesion, CRC Press: Boca Raton, FL.
Molinari A, Straffelini G, Tomasi A, et al., 2000. Oxidation Behavior of Ledeburitic Steels for Hot
Rolls [J]. Materials Science and Engineering, 280(2): 255-262.
Morel, F. M. M., Herning, J. G., 2003. Principles and application of aquatic chemistry. Wiley,
Germany.
Mostafa, N.Y., Brown, P.W., 2005. Heat of hydration of higher reactive pozzolans in blended

154
cements: Isothermal conduction calorimetry. Thermochimica Acta., 435, 162-167.
Moughrabiah, W.O., Grace, J.R., Bi, X.T., 2012. Electrostatics in gas-solid fluidized beds for
different particle properties. Chemical Engineering Science, 75, 198-208.
Nelson, E.B., Guillot, D., 2006. Well Cementing, 2nd Edition. Schlumberger: Houston, TX.
Neuberger, A., 1936. Dissociation constant and structures of glutamic acid and its esters. Biochem
J., 30(11), 2085-2094.
North Rhine-Westphalia Steel Industry, 2006. Slag: A sound choice in favor of ecology, Germany.
http://www.fehs.de/uploads/media/slag_english.pdf.
Oates, J.A.H., 1998. Lime and Limestone: Chemistry and Technology, Production and Uses. Wiley
VCH Verlag: Germany; pp. 81.
O’Connor, W. K., Dahlin, D. C., Rush, G. E., Gerdemann, S. J., Penner, L. R., Nilsen, D. N., 2005.
Aqueous mineral carbonation: mineral availability, pretreatment, reaction parameters, and
process studies. Albany Research Center.
Oguchi, T., Tamatani, M., 1993. Contact electrification phenomena and powder surface
treatments. Wear, 168, 91-98.
Orr., F. M., Jr., 2009. Onshore geologic storage of CO2. Science, 325, 1656−1658.
Pane, I., Hansen, W., 2005. Investigation of blended cement hydration by isothermal calorimetry
and thermal analysis. Cement and Concrete Research, 35, 1155-1164.
Park, A.-H. A., Bi, H.T., Grace., J.R., 2002a. Reduction of electrostatic charges in gas-solid
fluidized beds. Chemical Engineering Science, 57, 153-162.

155
Park, A.-H. A., Bi, H.T., Grace., J.R., Chen, A., 2002b. Modeling charge transfer and induction in
gas-solid fluidized beds. Journal of Electrostatics, 55, 135-158.
Park, A.-H.A., Jadhav, R., Fan, L.S., 2003. CO2 mineral sequestration: chemically enhanced
aqueous carbonation of serpentine. CJChE., 81, 885-890.
Park, A.-H.A., Fan, L.S., 2004. CO2 mineral sequestration: physically activated dissolution of
serpentine and pH swing process. Chemical Engineering Science, 59, 5241-5247.
Park, A.-H, Fan, L.-S., 2005. Carbon dioxide sequestration using earth metal-bearing minerals.
Pub. No.: US 2005/0180910 A1.
Park, A.-H. A., Fan L.-S., 2007. Electrostatic charging phenomenon in gas-liquid-solid flow
systems. Chemical Engineering Science, 62, 371-386.
POSCO, 2008. The FINEX® Innovative Ironmaking Process. The Asia-Pacific Partnership on
Clean Development and Climate, 4th Steel Task Force Workshop.
Penner, L., O’Connor, K., Dahlin, D.C., Gerdemann, S., Rush, G.E., 2004. Mineral Carbonation:
Energy Costs of Pretreatment Options and Insights Gained from Flow Loop Reaction Studies.
Albany Research Center, Office of Fossil Energy, U.S. DOE.
Ramsay, K., 1998. The Emergence of Triboelectric Technology. Pollution Engineering,
September, 1998.
Reid, R.C.; Prausnitz, J.M.; Poling, B.E., 1987. The Propertiels of Gases & Liquids, 4th Edition.
McGraw-Hill: Boston.
Reuter, M.; Xiao, Y.; Boin, U., 2004. Recycling and environmental issues of metallurgical slags
and salt fluxes. VII International Conference on Molton Slags Fluxes and Salts, The South
African Institute of Mining and Metallurgy, 16 (1-3), 59−63.

156
Rosenqvist, T., 1983. Priciples of Extractive Metallurgy, 2nd Edition. Mc-Graw-Hill Book
Company: United States.
Rosen, R., 2000. Application of carbon nanotubes as electrodes in gas discharge tubes. Applied
Physics Letter, 76, 13, 1668-1670.
Roy, D.M., Idorn, G.M., 1982. Hydration, Structure, and Properties of Blast Furnace Slag Cements,
Mortars, and Concrete. ACI Journal, 79(6), 444-457.
Ryu, M.Y., You, K.S., Ahn, J.W., Kim, H., 2007. Effect of the pH and basic additives on the
precipitation of a calcium carbonate during carbonation reaction. Resources Processing, 54,
14-18.
Sahimi, M., Gavalas G.R., Tsotsis, T., 1990. Statistical and continuum models of fluid-solid
reactions in porous media. Chemical Engineering Science, 45, 1449-1452.
Sanna, A.; Hall, M. R.; Maroto-Valer, M., 2012. A review of post-processing pathways in carbon
capture and storage by mineralization. Energy and Environ Sci., 5, 7781-7796.
Sanna, A., Uibu, M., Caramanna, G., Kuusik, R., Maroto-Valer, M.M., 2014. A review of mineral
carbonation technologies to sequester CO2. Chem. Soc. Rev. DOI: 10.1039/c4cs00035h.
Sato, T., Beaudoin, J.J., 2010. Effect of nano-CaCO3 on hydration of cement containing
supplementary cementitious materials. Advances in Cement Research, 23(1), 1-29.
Schwertmann, U., Cornell, R. M., 2003. The Iron Oxides. WILEY-VCH: Weinheim, Germany.
Shekhah, O., Ranke, W., Schüle, A., Kolios, G., Schlögl, R. Styrene Synthesis: High Conversion
over Unpromoted Iron Oxide Catalysts under Practical Working Conditions. Angew. Chem.
Int. Ed. 2003, 42, 5760-5763.
Seifritz, W., 1990. CO2 disposal means by silicates. Nature, 345, 486.

157
Sipilä, J., Teir, S., Zevenhoven, R., 2008. Carbon dioxide sequestration by mineral carbonation:
Literature review update 2005-2007.
Siemens, 2012. Energy Efficiency in Iron & Steelmaking. Sustainable Chemistry, April..eral
carbonation technologies to sequester CO2. Chem. Soc. Rev. DOI: 10.1039/c4cs00035h.
Siemens, 2013. Siemens VAI Metals Technologies: FINEX®. Retrieved from
http://www.industry.usa.siemens.com/verticals/us/en/metals/ironmaking/finex/pages/home.as
px.
Siemens, 2015. Siemens VAI Metals Technologies: Energy Efficiency in Iron & Steelmaking.
Smolders, K., Baeyens, J., 2001. Hydrodynamic modelling of the axial density profile in the riser
of a low-density circulating fluidized bed. Canadian Journal of Chemical Engineering, 3, 79,
422-429.
Sowinski, A., Miller, L., Mehrani, P., 2010. Investigation of electrostatic charge distribution in
gas-solid fluidized beds. Chemical Engineering Science, 65, 2771-2781.
Stratton, P., 2012. An overview of the North American calcium carbonate market. Roskill
Information Services Ltd. http://www.roskill.com/news/download-roskills-paper-on-the-
north-american-calcium-carbonate-market/at_download/attachment1
Steen, V.E., Claeys, M., 2008. Fischer-Tropsch Catalysts for the Biomass-to-Liquid Process.
Chem. Eng. Technol., 31(5), 655-666.
Steynberg, A., Dry, M., 2004. Fischer Tropsch Technology, Studies in surface science and
catalysis. Elsevier, 152.
The European Slag Association, 2006. Legal Status of Slags, 10, pp. 2, January, 2006.
158
The Iron and Steel Institute of Japan, 2012. Green Energy Ironmaking and Steelmaking:
Production of Green Energy and the Use for Ironmaking and Steelmaking. ISIJ International,
52, 8.
Teir, S.; Eloneva, S.; Fogelholm, C.-J.; Zevenhoven, R., 2005. Dissolution of steelmaking slags in
acetic acid for precipitated calcium carbonate production. Energy, 32, 528-539.
Teir, S., Eloneva, S., Fogelholm, C.-J., Zevenhoven, R., 2007. Energy, 32, 528–539.
Uibu, M., Kuusik, R., Andreas, L.,Kirsimäe, K., Energy Procedia, 2011, 4, 925–932.
University of Tennessee, 2008. Limestone Quarrying and Processing: A Life-Cycle Inventory,
2008. A Report Prepared for: The Natural Stone Council. University of Tennessee, Center for
Clean Products.
U.S. DOE, 2007. Industrial Technologies Program: “Geological Sequestration of CO2 by
Hydrogen Carbonate Formation with Reclaimed Slag: CO2 Sequestration Method Could
Create Saleable New Products”. Retried from http://www.doe.gov.
U.S. EIA, 2010. U.S. Energy Information Administration, Manufacturing Energy Consumption
Survey (MECS). Retrieved from http://www.eia.gov/consumption/manufacturing/data/2010/.
U.S. EPA, 2008a. Inventory of U.S. Greenhouse Gas Emissions and Sinks: 1990 – 2006, U.S.
Environmental Protection Agency, 2008. Retrieved from http://www.epa.gov.
U.S. EPA, 2008b. Quantifying Greenhouse Gas Emissions from Key Industrial Sectors in the
United States, 2008. Retrieved from http://www.epa.gov/sectors/pdf/greenhouse-report.pdf.
U.S. EPA, 2008c. 2008 Sector performance report: Iron & Steel, at a glance 1996-2005 Sector
Strategies Program, U.S. Environmental Protection Agency, 2008. Retrieved from
http://www.epa.gov.

159
U.S. EPA, 2012. Available and emerging technologies for reducting greenhouse gas emissions
from the iron and steel industry. Retrieved from http://www.epa.gov.
USGS, 2012. Iron ore statistics, in Kelly, T.D., and Matos, G.R., comps., Historical statistics for
mineral and material commodities in the United States: U.S. Geological Survey Data Series
140, accessed March 2013 at http://pubs.usgs.gov/ds/2005/140/.
USGS, 2012. U.S. Geological Survey, Minerals Yearbook 2011, Stone (Crushed).
USGS, 2013. U.S. Geological Survey, Mineral Commodity Summaries, Iron and Steel Slag.
U.S. Map Network, 2010. Steel Plants of North America. AIM Market Research, 2010.
Van Oss and Hendrik G., 2007. “Iron and Steel, Slag: 2007 Minerals Yearbook”, USGS.
Vutukuri, V.S., 1974. The effect of liquids on the tensile strength of limestone. International
Journal of Rock Mechnics and Mining Science & Geomechanics Abstracts, 11, 1, 27-29.
Wadleigh, F.R., 1921. A coal manual for salesmen, buyers and users. National coal mining news,
p. 113.
WBCSD, 2004. World Business Council on Sustainable Development (WBCSD) Annual Review,
2004.
WEC, 1995. Energy Efficiency Improvement Utilizing High Technology – An Assessment of
Energy Use in Industry and Buildings. World Energy Council, London.
Wen, C.Y., Hashinger, R.F., 1960. Elutriation of solid particles from a dense phase fluidized bed.
AIChE Journal, 6, 2, 220.
Wolny, A., Opalinski, I., 1983. Electric charge neutralization by addition of fines to a fluidized
bed composed of coarse dielectric particles. Journal of Electrostatics, 14, 3, 279-289

160
World Steel Association, 2010. Steel Industry By-product: Achieving the goal of zero-waste.
Retrieved from http://www.worldsteel.org.
World Steel Association, 2013. World Steel in Figures 2013, 2013. Retrieved from
http://www.worldsteel.org/dms/internetDocumentList/bookshop/Word-Steel-in-Figures-
2013/document/World%20Steel%20in%20Figures%202013.pdf.
World Steel Association, 2014a. Steel’s Contribution to a Low Carbon Future, 2014.
http://www.worldsteel.org/publications/position-papers/Steel-s-contribution-to-a-low-carbon-
future.html.
World Steel Association, 2014b. Statistics Archive: Iron and Steel Production. Retrieved from
http://www.worldsteel.org/statistics/statistics-archive.html.
Xu, X.C., Song, C.S., Wincek, R., Andresen, J.M., Miller, B.., Scaroni, A.W., 2003. Separation of
CO2 from Power Plant Flue Gas Using a Novel CO2 “Molecular Basket” Adsorbent. Fuel
Chemistry Division Preprints, 48(1), 162.
Yildirim, I.Z.; Prezzi, M., 2011. Chemical, Mineralogical, and Morphological Properties of Steel
Slag. Advances in Civil Engineering, 463638, pp. 13.
Yi, H.; Xu, G.; Cheng, H.; Wang, J.; Wan, Y.; Chen, H., 2012. An overview of utilization of steel
slag. The 7th International Conference on Waste Management and Technology, 16, 791-801.
Young, J. K. Ch., 1985. Hydration of Portland cement. Instructional modulus in cement science,
ed. D. M. Roy, Materials education Council. Materials Research Laboratory, University Park,
PA. USA.
Yu, C.-H., Huang, C.-H., Tan, C.-S., 2012. A Review of CO2 Capture by Absorption and
Adsorption. Aerosol and Air Quality Research, 12, 745-769.

161
Yu, K.M.K., Curcic, I., Gabriel, J., Tsang, S.C.E., 2008. Recent Advances in CO2 Capture and
Utilization. ChemSusChem, 1(11), 893-899.
Zhou, Y., 2005. Review of current development of coal-based smelting reduction ironmaking
process. Iron and Steel, 2005-11.
Zevenhoven, R., Fagerlund, J., 2010. Fixation of CO2 into inorganic carbonates: the natural and
artificial “weathering of silicates”. In Carbon Dioxide as Chemical Feedstock; Aresta, M., Eds.;
Wiley VCH Verlag: Germany; p. 353.