Sustainable Infrastructure for Urban Growth · sustainable infrastructure for urban growth 271 This...
27
269 10 Sustainable Infrastructure for Urban Growth Katherine Sierra I n June 2012, world leaders made their way to Rio de Janeiro for the 20th anniversary of the 1992 United Nations Conference on Environment and Development—the Earth Summit—to attempt to provide a new political mo- mentum for sustainable development. They faced a vastly different, and more difficult, terrain than their predecessors encountered when they met 20 years ear- lier. Increases in population—today’s global population of 7 billion is projected to reach 9 billion by 2050—are putting pressure on both the natural and built environments. Urbanization is surging, and Asia and Africa in particular will ex- perience tremendous growth in their urban populations, which will strain urban service delivery systems and infrastructure (table 10.1). The Challenge The effects of climate change make these challenges more acute. Global green- house gas (GHG) emissions continue to grow to dangerous levels, and cities are responsible for most of the emissions and their projected growth (Solomon et al. 2007). The United Nations climate negotiations set a goal of limiting global tem- perature increases to no more than 2°C over preindustrial levels. However, this goal is not likely to be reached under current policies. Indeed, the world’s GHG emissions growth is on a path consistent with a long-term average temperature increase of more than 3.5°C (International Energy Agency 2011). 1 The effects of 1. The International Energy Agency’s most recent World Energy Outlook 2011 concluded that the world “cannot afford to delay further action to tackle climate change if the long-term
Transcript of Sustainable Infrastructure for Urban Growth · sustainable infrastructure for urban growth 271 This...

269
10Sustainable Infrastructure
for Urban Growth
Katherine Sierra
I n June 2012, world leaders made their way to Rio de Janeiro for the 20th anniversary of the 1992 United Nations Conference on Environment and Development—the Earth Summit—to attempt to provide a new political mo-
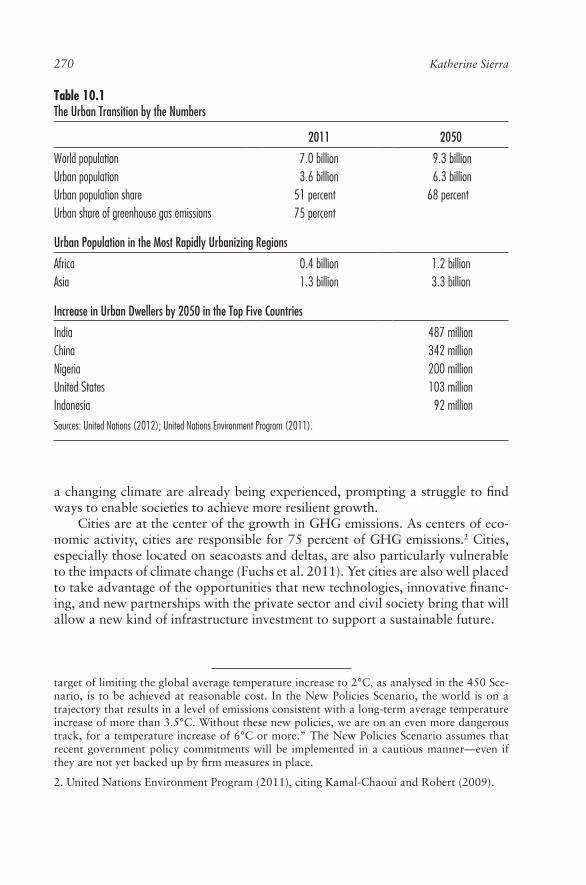
mentum for sustainable development. They faced a vastly different, and more difficult, terrain than their predecessors encountered when they met 20 years ear-lier. Increases in population—today’s global population of 7 billion is projected to reach 9 billion by 2050—are putting pressure on both the natural and built environments. Urbanization is surging, and Asia and Africa in particular will ex-perience tremendous growth in their urban populations, which will strain urban service delivery systems and infrastructure (table 10.1).
The Challenge
The effects of climate change make these challenges more acute. Global green-house gas (GHG) emissions continue to grow to dangerous levels, and cities are responsible for most of the emissions and their projected growth (Solomon et al. 2007). The United Nations climate negotiations set a goal of limiting global tem-perature increases to no more than 2°C over preindustrial levels. However, this goal is not likely to be reached under current policies. Indeed, the world’s GHG emissions growth is on a path consistent with a long-term average temperature increase of more than 3.5°C (International Energy Agency 2011).1 The effects of
1. The International Energy Agency’s most recent World Energy Outlook 2011 concluded that the world “cannot afford to delay further action to tackle climate change if the long-term
270 Katherine Sierra
a changing climate are already being experienced, prompting a struggle to find ways to enable societies to achieve more resilient growth.
Cities are at the center of the growth in GHG emissions. As centers of eco-nomic activity, cities are responsible for 75 percent of GHG emissions.2 Cities, especially those located on seacoasts and deltas, are also particularly vulnerable to the impacts of climate change (Fuchs et al. 2011). Yet cities are also well placed to take advantage of the opportunities that new technologies, innovative financ-ing, and new partnerships with the private sector and civil society bring that will allow a new kind of infrastructure investment to support a sustainable future.
target of limiting the global average temperature increase to 2°C, as analysed in the 450 Sce-nario, is to be achieved at reasonable cost. In the New Policies Scenario, the world is on a trajectory that results in a level of emissions consistent with a long-term average temperature increase of more than 3.5°C. Without these new policies, we are on an even more dangerous track, for a temperature increase of 6°C or more.” The New Policies Scenario assumes that recent government policy commitments will be implemented in a cautious manner—even if they are not yet backed up by firm measures in place.
2. United Nations Environment Program (2011), citing Kamal-Chaoui and Robert (2009).
Table 10.1The Urban Transition by the Numbers
2011 2050
World population 7.0 billion 9.3 billionUrban population 3.6 billion 6.3 billionUrban population share 51 percent 68 percentUrban share of greenhouse gas emissions 75 percent
Urban Population in the Most Rapidly Urbanizing Regions
Africa 0.4 billion 1.2 billionAsia 1.3 billion 3.3 billion
Increase in Urban Dwellers by 2050 in the Top Five Countries
India 487 millionChina 342 millionNigeria 200 millionUnited States 103 millionIndonesia 92 million
Sources: United Nations (2012); United Nations Environment Program (2011).

sustainable infrastructure for urban growth 271
This chapter describes how sustainable urban infrastructure is being rede-fined in the wake of these trends. It looks at how transformative city sustainabil-ity strategies and associated infrastructure investment plans are being supported by a menu of policy tools and innovative financing. The chapter then discusses how these trends are playing out in the provision of sustainable urban infrastruc-ture in three settings: scaling up sustainable urban transportation in Mexico, building resilience in Jakarta, and driving innovation through new energy busi-ness models in Austin, Texas.
New Directions: Green Growth and Sustainable Urban Infrastructure
Sustainable development was defined by the Brundtland Commission as devel-opment that meets the needs of the present without compromising the ability of future generations to meet their own needs (United Nations 1987).3 Sustain-ability looks for balance between three dimensions of development: economic, environmental, and social. Although this definition still stands after more than 25 years, the sense of urgency resulting from today’s economic, demographic, and environmental trends has prompted a debate on how to best achieve sustain-able development with a “green growth” focus.
The Organisation for Economic Co-operation and Development (OECD) describes green growth as a way to foster “economic growth and development while ensuring that natural assets continue to provide the resources and ecosys-tem services on which our well-being relies. To do this it must catalyse invest-ment, competition and innovation, which will underpin sustained growth and give rise to new economic opportunities” (2011b, 9). The World Bank calls for inclusive green growth as necessary, efficient, and affordable (2012). The vision of the United Nations Environment Program is for green cities that “combine greater productivity and innovation capacity with lower costs and reduced envi-ronmental impact” (2011, 454).
Green growth advocates call for sustainable, green urban infrastructure strategies that provide a platform for
efficiency, with more compact and denser cities with lower infrastructure and energy costs per capita as density rises, and with further efficiencies in energy and water use through demand management;high quality of life, with better air quality attained by reducing emissions and investing in cleaner energy solutions; fast, affordable, and low- emission mass transportation to employment and schools; and efficient provision of clean water and use of advanced waste systems;
3. The Brundtland Commission’s formal name was the United Nations World Commission on Environment and Development.
•
•

272 Katherine Sierra
inclusion, with affordable and accessible transportation, modern energy, and clean water and waste management services for the poor;resiliency, with infrastructure built to withstand a wider range of weather risks given uncertainties about the local effects of climate change and the use of ecosystem services, such as preservation of mangroves or other natural buffers, and institutional and social development such as that needed to support early warning systems, instead of always turning to hard infrastructure solutions;innovation, taking advantage of the proximity of economic activities to support technological breakthroughs, particularly in the area of renewable energy technologies, and capitalizing on advances in information and com-munications technologies; andproductivity and competitiveness, with green growth strategies creating new jobs and growth based on new technologies and new ways of doing business.4
Leading cities are taking action without waiting for global policies. These first-mover cities, such as those that have come together as part of the C40 Cli-mate Leadership Group,5 are starting to design and implement new strategies that reduce their carbon and water footprints, build resilience, and address social inclusion while also looking to create jobs and grow their economies. Sometimes these cities are working in concert with supportive national policies, and some-times they are innovating ahead of national policies (Carbon Disclosure Project 2011).
Cities are taking advantage of new energy technologies and promoting en-ergy efficiency as a way to reduce their carbon footprint. A revolution in infor-mation and communications technologies has allowed connectivity to drive new “smart” solutions that are bringing infrastructure costs down through increased efficiency. This revolution has also upended business models and has prompted entrepreneurs and policy makers alike to look for new approaches that can leap-frog old technologies. Cities in emerging economies like China, India, Brazil, and South Africa are joining with those in countries that belong to the OECD as sources of innovation. New types of multi-stakeholder partnerships are forming, with businesses, universities, and civil society organizations joining with public
4. A recent study found that U.S. clean technology industries—sectors like the solar thermal, solar photovoltaic, wind, fuel cell, biofuel, and smart grid industries—together grew at twice the rate of the rest of the economy, adding jobs at over 8 percent a year between 2003 and 2010 (Muro, Rothwell, and Saha 2011). The study also concluded that there were more than 830,000 jobs in energy efficiency (including public mass transit, energy-saving building materi-als, green architecture and construction, and other categories).
5. The C40 Cities Climate Leadership Group is a network of large cities from around the world that are committed to implementing meaningful and sustainable climate-related actions locally that will help address climate change globally. See http://live.c40cities.org/.
•
•
•
•

sustainable infrastructure for urban growth 273
policy makers to look for game-changing solutions to local, national, and global challenges.
These strategies need to be pursued in ways tailored to the particular con-text. Urban infrastructure networks have already been largely laid down in the developed world. Planners can only make incremental changes to city form, but they can focus on strategies for rehabilitation and retrofitting, along with the use of information and communications technologies to drive efficiencies and more aggressive demand management to reduce resource use and lower emissions.6 In the developing and emerging economies, particularly those in Africa and Asia that are the center of today’s urban transition, cities can make infrastructure decisions now that will use emerging technologies and processes to create a more efficient, denser footprint. They can also take advantage of more advanced tech-nologies where they are affordable.
A transformative strategy is needed, given the scale of the challenge. Thus, green and sustainable urban growth will require a supportive enabling environ-ment and innovative financing methods to facilitate the introduction of new in-frastructure technologies and new ways of doing business.
The Policy Challenge: An Enabling Environment for Transformative Action
The NaTioNal Policy FrameworkAlthough urban policy makers can work within their own spheres of influence to develop and implement sustainability strategies, supportive national policies are critical to achieve change at the scale and speed needed.7 National policies can best do this by setting the right pricing signals, particularly by setting a price on carbon through either a cap-and-trade arrangement or a carbon tax. Australia has just joined Europe in introducing a cap-and-trade system, while China is using multiple local experiments to develop its own cap-and-trade policy. The elimination of fossil fuel subsidies is also needed to level the playing field with new technologies. The Group of 20 (G-20) leaders agreed on this at a meeting in Pittsburgh, but implementation has been elusive (Hultman, Sierra, and Carlock 2011). Governments are supporting an acceleration of renewable energy invest-ments through subsidies, but these are under pressure in the countries that belong to the OECD because of fiscal constraints.
6. The International Energy Agency (IEA) estimates that four-fifths of the total energy-related CO2 emissions permissible by 2035 to maintain the global temperature increases to within 2°C are already “locked in” by existing global capital stock, such as power plants, buildings, and factories (International Energy Agency 2011).
7. See Organisation for Economic Co-operation and Development (2011a), which provides a rich analysis of policy options, and Organisation for Economic Co-operation and Develop-ment (2012).

274 Katherine Sierra
City leaders have also called for a simplification of national policy frame-works, citing the high costs and uncertainties they face in dealing with complex sets of policies. For example, in the United States the absence of a national cli-mate policy has given way to a web of national and state energy sector mandates and incentive programs. Many of these are set to expire in the next few years, introducing both significant uncertainty for public and private investments alike and also fiscal risks for local authorities (Jenkins et al. 2012).8
National water strategies are also laying the groundwork for improved sus-tainability of local infrastructure investment and services, with examples coming from countries that are experiencing acute water stress (Wallis et al. 2009). For instance, Chile was a pioneer in the use of water markets; it made legislative reforms in 2005 that seek to improve both river basin governance and the coor-dination of multiple water uses, solutions to water conflicts, and environmental protection. In Australia, the National Water Initiative aims to deal with overallo-cated and overstressed water systems by introducing registers of water rights and standards for water accounting, improving pricing for water storage and delivery, and expanding water trade.9 China’s Five-Year Plan calls for investing $600 bil-lion over a period of 10 years on measures to cope with serious water scarcity in both urban and rural settings. This plan relies heavily on infrastructure solutions (e.g., the South-North Water Transfer Project, a massive infrastructure project that would transfer water from the Yangtze River to relieve acute water stress and environmental pollution in China’s northern regions and cities).10
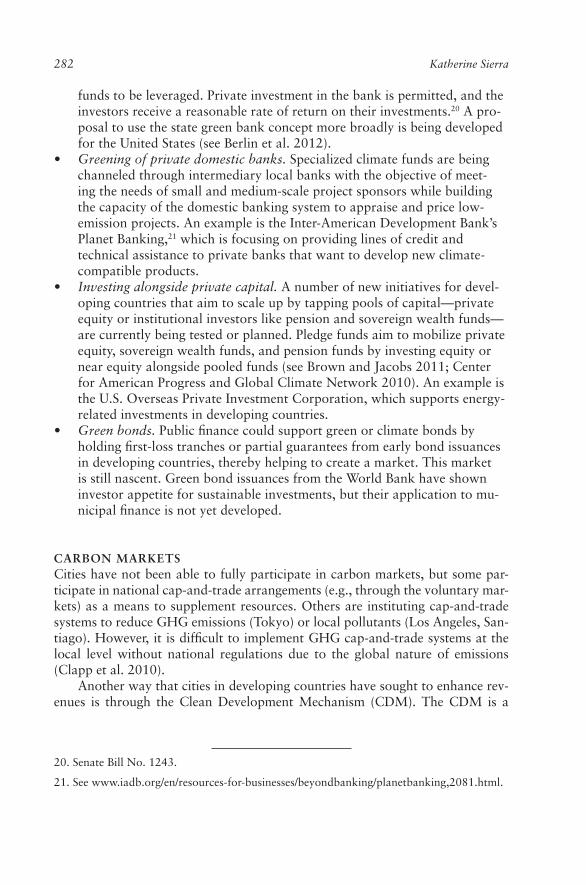
The local Policy FrameworkCity sustainability strategies can set the vision, provide a mandate for action, and guide the development of incentives for consumers and business, while also driving infrastructure investment priorities. An analysis of C40 city master plans carried out by the Carbon Disclosure Project (2011) looked at sustainability strategies that leading cities have adopted to reduce their GHG emissions and enhance resilience (figure 10.1).11 Common themes in city master plans include first focusing on energy savings and building efficiency, and then investing in in-
8. Jenkins et al. (2012) argue for a reform of U.S. energy deployment subsidies and policies so that they reward technology improvements and cost reductions while strengthening energy innovation systems to drive down costs.
9. See http://nwc.gov.au/nwi and www.environment.gov.au/water/australia/nwi/index.html.
10. See www.wantchinatimes.com/news-subclass-cnt.aspx?cid=1105&MainCatID=&id=2011 0711000040.
11. This section draws, where noted, on the findings from 42 of 58 C40 cities, which submit-ted responses to a questionnaire from the Carbon Disclosure Project covering governance, greenhouse gas emissions, adaptation, and strategy. The findings were documented by the Carbon Disclosure Project (2011).

sustainable infrastructure for urban growth 275
frastructure and creating incentives to increase the share of renewable energy and green transportation measures.
For example, Seoul has adopted a citywide target of 40 percent GHG emis-sions reduction by 2030, focusing on buildings, energy efficiency, transportation, and an increased share of renewable energy in its mix. The Sustainable Sydney 2030 plan calls for a 70 percent reduction in emissions by 2030. This is expected to be achieved through Sydney’s partnerships with businesses to increase energy efficiency; investments in LED streetlights and solar panels on city buildings; and the use of combined cooling, heating, and power trigeneration techniques to supply local power, heating, and cooling in city buildings. The city’s new water master plan anticipates that half of its water supply will come from a citywide de-centralized recycled water network. It is also investing in light rail and bikeways
Figure 10.1C40 Cities’ Mitigation Measures
0 10 20 30 40 50 60 70
Percentage(Number of responding cities = 32)
Technical solutions
Water management
Tree planting
District heating
Permitting incentives
Waste treatment
Retrofitting
Renewable energies
Transport
Infrastructure and urban planning
Awareness and consultation
Building standards
Subsidies and fiscal incentives
Figure 10.1Lincoln_Ingram_Infrastructure
3%
9%
9%
9%
13%
25%
25%
25%
28%
34%
53%
66%
59%

276 Katherine Sierra
(Sydney 2011). Jakarta has adopted climate change goals, preparing a road map for a 30 percent reduction in GHG emissions across the transportation, waste, and energy sectors (Soehodo 2011).
The local Policy Tool kiTLocal policy makers, in turn, have a wide set of tools that they can use to build an attractive regulatory environment for sustainable development (table 10.2). Indeed, subsidies and fiscal incentives, along with building standards, were the most popular GHG reduction activities reported by C40 cities (figure 10.1) and were commonly used by the cities studied by researchers at the OECD (2011a, 2011b). Incentives include property tax reductions for high-density development
Table 10.2Greening the Local Fiscal Tool Kit
Goal Tools to Incentivize Sustainable Behavior and Investment
More compact cities Reformation of property tax on multifamily dwellings to incentivize high-density developmentSplit-rate property tax to incentivize infill developmentCascading property taxes that rise with distance from coreDevelopment charges that internalize externalities of sprawlReformation of land sale plans
•
••••
Sustainable transportation Congestion pricing and cordon tollsHigher and variable parking chargesTaxes on vehicle ownership and useValue-capture tax to finance public transportation
••••
Efficient environmental services Cost-recovery water and waste charges to incentivize efficient useTariff-based incentives for waste recyclingWater rebates for conversion to water-efficient appliances and fixtures
•••
Improved building and industrial energy efficiency
Tax incentives, credits for investment in building energy efficiencyTax credits, subsidies for industrial energy efficiency; tradable permitsTax incentives, rebates for investment in Smart GridPublic utility charges to fund energy conservation programs
••••
Increased share of renewables in energy mix
Feed-in tariffs and long-term power purchase agreementsTax rebates for installation of solar photovoltaic systemsNet metering that allows consumers and producers that produce energy to sell to gridPrograms that give households and businesses option to purchase renewable energy at premium price
•••
•
Sources: Adapted from Banks et al. (2011); Carbon Disclosure Project (2011); Organisation for Economic Co-operation and Development (2011a, 2011b).

sustainable infrastructure for urban growth 277
and the reformation of land sale plans, which in countries like China fund infra-structure development yet also exacerbate sprawl. Congestion pricing, variable parking rates, and value capture taxes can support sustainable transit. Water and wastewater recovery charges, along with incentives for recycling and investment in water-efficient appliances, help manage demand while also reducing the cost of infrastructure investments and improving utilities’ finances (Sykes et al. 2010). In those cities that manage energy utilities, feed-in tariffs and power purchase agree-ments support renewable goals. Decentralized energy is being encouraged with net metering programs and tax incentives for investments in solar photovoltaic systems and participation in community-based smart grid programs.
The use of these tools will be important for sustainable infrastructure strat-egies because they will help set the course for city density and the intensity of public improvements, and services like public transit (which in turn drives in-frastructure costs and emissions); improve demand management and efficiency; provide incentives for businesses and consumers to invest in new approaches, like renewables; and enhance financial sustainability through cost recovery.
The Financing Challenge: Scaling Up Through Innovative Finance
Global infrastructure investment requirements over the next several decades will be significant. The OECD (2007) estimates that investments in electricity, transportation, water, and telecommunications could average some 2.5 percent of the world’s gross domestic product. The International Energy Agency (2011) estimates that $38 trillion in global investment in energy-supply infrastructure will be required from 2011 to 2035. Two-thirds of this is required in non-OECD countries.12 The amount of financing needed to reduce GHG emissions and for ad-aptation is large, and public finance is insufficient to meet this need, particularly in developing countries. Net climate change mitigation costs in developing countries, over and above the cost of business-as-usual investment needed for economic de-velopment, are estimated in the range of $60 to $175 billion a year (World Bank 2010d). Even if the United Nations’ 2°C goal were to be achieved, countries would already be facing the costs of a changing climate. Adaptation costs are estimated to range from $75 to $100 billion a year over and above the investment costs of a business-as-usual development trajectory (World Bank 2011a).
The menu for financing urban infrastructure that will shift communities to a sustainable path shares the same core elements well known to urban policy makers. Cities raise revenue from taxation, fees, and (especially in developing countries) land sales; and utilities cover their costs through user fees. As discussed earlier, these can enhance sustainable outcomes through demand management while also
12. This is according to the IEA “New Policies Scenario” (see International Energy Agency 2011).

278 Katherine Sierra
bolstering city and utility finances. Intergovernmental transfers through grants or subsidized loans cofinance public investments when there are broader national, state, and global public good considerations that are not captured by local ben-efits. The green stimulus packages introduced in South Korea, the United States, and China in response to the financial crisis are one example. Cities can benefit from renewable energy subsidies—directly where they are responsible for power generation or indirectly through national clean energy investment programs. Private capital is leveraged through public-private partnerships, while municipal bonds and investments by pools of private capital (e.g., pension funds13) provide long-tenor financing for low-risk, steady returns from infrastructure investments for cities and utilities with investment-grade policies.
However, though the core financing menu may be similar, new types of sus-tainable infrastructure and associated services face financing barriers beyond the already-large challenge of meeting growing demands for infrastructure to simply meet population growth and to replace aging infrastructure stocks. Four broad categories of barriers are most commonly cited:14
Investment climate and borrowing capacity at the national and local levels.Sector-specific barriers, which include concerns about the stability and certainty of the sector policy and regulatory framework—such as the lon-gevity of power purchase agreements or feed-in tariff programs; technol-ogy risks for investments in new and relatively untried technologies and systems; and execution and unfamiliarity risks where there are concerns about capacity to execute projects. Other barriers include stakeholder resistance to the often-complex changes implied by new approaches that may undermine project delivery.Capacity and knowledge gaps, which include the low capacity available to prepare project pipelines and to structure projects,15 a lack of skilled and semiskilled labor for new industries, and a lack of established engineering, procurement, and construction contractors.Technology cost gaps, which are the residual cost gaps between high- and low-emission alternatives after accounting for the costs of carbon that are built into existing international and national policies (e.g., efficiency stan-dards, carbon taxes, removal of fossil fuel subsidies, and intergovernmen-
13. OECD pension funds in 2007 were estimated to total $18 trillion, up from $13 trillion in 2001 (Organisation for Economic Co-operation and Development 2007).
14. This section has been adapted from Sierra (2011b), and it also draws on work by Brown and Jacobs (2011) and United Nations (2010).
15. Grants for advisory services and technical assistance can be used to accelerate the de-velopment of a viable pipeline through feasibility studies, including technical, engineering, economic, financial, social, and environmental studies, and to provide support for legal and advisory services.
••
•
•

sustainable infrastructure for urban growth 279
tal grants or subsidies like feed-in tariffs). These costs may also be derived from inadequate network infrastructure, such as transmission lines linking renewable resources to the main grid.
Given these barriers to the introduction of new technologies, cities are hard-pressed to move to higher-cost or higher-risk approaches in the absence of finan-cial support and capacity building. The 2008 global financial and economic crisis continues to have an impact on the economies of the United States, the European countries, and Japan, and worrying fiscal deficits mean that public resources for investment will be scarce for the near to medium terms. At the international level, though developed countries have pledged as part of the United Nations Frame-work Convention on Climate Change negotiations to provide $100 billion per year in climate finance by 2020 to help developing countries move to low-carbon and resilient growth pathways, the source of that funding is highly uncertain.
As a result of these trends, policy makers are looking for innovative financ-ing solutions that seek to create new, or to redirect existing, international climate funds to support transformation in developing countries. Experiments are under way on the use of public funds to leverage private capital. Finally, carbon mar-kets could also support investments in urban sustainable infrastructure, but this avenue is still relatively underdeveloped (World Bank 2011b).
iNTerNaTioNal climaTe FiNaNceInternational transfers of grants or highly concessional loans aim to accelerate the introduction of new technologies to developing countries by reducing costs and risks. In theory, they also support the additional costs imposed by a chang-ing climate, but the level of funding available is far below needs. Support for developing countries was initially channeled through the Global Environment Facility (GEF), which helped pilot new renewable energy and energy-efficient technologies by providing grants to cover the additional costs associated with their deployment (Global Environment Facility 2009).
In 2008, the Climate Investment Funds (CIFs) were created to channel more than $6 billion in highly concessional funds to mitigate and adapt to the effects of climate change.16 The majority of the funding goes to the Clean Technology Fund (CTF), which finances programs that aim to make a transformative im-pact in encouraging renewable energy, energy efficiency, and clean transporta-tion.17 The CTF supports both public and private investment. Support for private investment aims to reduce the barriers for early market entrants so that later
16. The author managed the negotiations and creation of the CIFs.
17. Sector-specific country investment plans financed by the Clean Technology Fund were undertaken for Egypt, Mexico, the Philippines, Vietnam, Colombia, and Nigeria (see Clean Technology Fund 2009a, 2009b, 2009c, 2009d, 2010a, 2010b, 2010c, and 2011).

280 Katherine Sierra
investors, developers, and financial intermediaries will subsequently enter the market without additional support. The Adaptation Fund and the CIF Pilot Pro-gram for Climate Resilience are the main multilateral sources of funding for ad-aptation. A new Green Climate Fund (GCF) was agreed to at the 2010 climate negotiations in Cancún and was finalized in Durban in 2011. The board for this fund met for the first time in August 2012, and work to operationalize the fund is ongoing.
The multilateral development banks—like the World Bank, the European In-vestment Bank, and the regional development banks—cofinance climate-related projects in cooperation with the GEF and the CIFs. They are also looking to direct more of their own financing to sustainable infrastructure.18 Funding also comes from bilateral sources, such as the German International Climate Initia-tive and the United Kingdom’s International Climate Fund, and from bilateral institutions, such as the United States’ Overseas Private Investment Corporation, national export-import banks, and credit guarantee agencies.
National development banks in the developing world are also supporting sustainable infrastructure investments, though this is still nascent. BNDES (Banco Nacional de Desenvolvimento Econômico e Social), Brazil’s national development bank, and Banobras (Banco Nacional de Obras y Servicios Públicos), Mexico’s national development bank, are examples of domestic institutions that are begin-ning to channel intergovernmental transfers for sustainable development.
leveragiNg PrivaTe caPiTalDespite an increased interest in specialized funding for investments related to cli-mate and sustainable infrastructure, the current tight fiscal situation means that public funds will fall far short of the need. As a result, there is growing interest in using scarce public funds to leverage private capital. A number of new instru-ments are being rolled out or are under development (table 10.3):
Green banks. Green investment banks could provide debt financing and, depending on the national legal setting, issue bonds and seek patient inves-tors looking for a long-term conservative rate of return, such as pension fund investors (Berlin et al. 2012). In the United Kingdom a green bank is being created that will be capitalized with national government funds but allowed to raise its own financing. It is expected that the bank will fill a gap in the market for government-backed bonds, bring in banking exper-tise, and offer a range of commercially driven interventions—loans, equity, and risk-reduction finance (Environmental Audit Committee 2011). In June 2011 Connecticut created the Clean Energy Finance and Investment
18. The World Bank’s Sustainable Infrastructure Action Plan is one example; see http://water .worldbank.org/publications/world-bank-group-sustainable-infrastructure-action-plan.
•

sustainable infrastructure for urban growth 281
Authority.19 This quasi-public green bank combines several existing state clean energy and energy efficiency funds in a structure that allows these
19. Section 99 of Public Act 11-80, An Act Concerning the Establishment of the Department of Energy and Environmental Protection and Planning for Connecticut’s Energy Future. For more information, see www.cga.ct.gov/2011/act/pa/pdf/2011PA-00080-R00SB-01243-PA.pdf.
Table 10.3Using Public Finance to Leverage Private Capital for Sustainable Infrastructure
Goal Tool
Increase local access to large pools of private capital—pension funds, private equity, sovereign wealth funds—for sustainable infrastructure
Green or sustainable infrastructure banks of funds to attract private capital while lowering debt service costs and increasing tenors:
Direct intergovernmental or intragovernmental transfers to bankable projects.Lower debt service costs where investors perceive more risk in projects or approaches without a track record, including concerns that cities may lack capacity or implementation experience. Support private sector participation by reducing risk through policy guarantees, insurance, first-loss instruments, subordi-nated debt, or equity. Promote local commercial banking capacity building by providing risk sharing for new products (energy efficiency lines of credit).Bundle and securitize small and dispersed investments (build-ing energy efficiency).
Pledge funds: Public fund pledges to provide a small amount of equity to pooled funds to encourage much larger pledges from private inves-tors like sovereign wealth funds, private equity, and pension funds for investments in sustainable urban infrastructure under public-private partnership arrangements.
Fund of funds: The public funder invests as a limited partner in a private fund that holds a portfolio of other private investment funds.
•
•
•
•
•
Speed up and deepen bond market for sustainable investments allowing access to large pools of capital, reduce the average cost of capital, and provide a low-cost exit for construction-phase capital and for bank long-term debt
Green bonds: Public financing (through public institutions like the green banks or international financial institutions) supports first-loss tranches or partial guarantees from early bond issuances in new asset classes and/or in countries with less developed capital markets; these have not yet been adapted for the municipal bond market.
Source: Adapted from Sierra (2011b).
282 Katherine Sierra
funds to be leveraged. Private investment in the bank is permitted, and the investors receive a reasonable rate of return on their investments.20 A pro-posal to use the state green bank concept more broadly is being developed for the United States (see Berlin et al. 2012).Greening of private domestic banks. Specialized climate funds are being channeled through intermediary local banks with the objective of meet-ing the needs of small and medium-scale project sponsors while building the capacity of the domestic banking system to appraise and price low-emission projects. An example is the Inter-American Development Bank’s Planet Banking,21 which is focusing on providing lines of credit and technical assistance to private banks that want to develop new climate- compatible products.Investing alongside private capital. A number of new initiatives for devel-oping countries that aim to scale up by tapping pools of capital—private equity or institutional investors like pension and sovereign wealth funds—are currently being tested or planned. Pledge funds aim to mobilize private equity, sovereign wealth funds, and pension funds by investing equity or near equity alongside pooled funds (see Brown and Jacobs 2011; Center for American Progress and Global Climate Network 2010). An example is the U.S. Overseas Private Investment Corporation, which supports energy-related investments in developing countries.Green bonds. Public finance could support green or climate bonds by holding first-loss tranches or partial guarantees from early bond issuances in developing countries, thereby helping to create a market. This market is still nascent. Green bond issuances from the World Bank have shown investor appetite for sustainable investments, but their application to mu-nicipal finance is not yet developed.
carboN markeTsCities have not been able to fully participate in carbon markets, but some par-ticipate in national cap-and-trade arrangements (e.g., through the voluntary mar-kets) as a means to supplement resources. Others are instituting cap-and-trade systems to reduce GHG emissions (Tokyo) or local pollutants (Los Angeles, San-tiago). However, it is difficult to implement GHG cap-and-trade systems at the local level without national regulations due to the global nature of emissions (Clapp et al. 2010).
Another way that cities in developing countries have sought to enhance rev-enues is through the Clean Development Mechanism (CDM). The CDM is a
20. Senate Bill No. 1243.
21. See www.iadb.org/en/resources-for-businesses/beyondbanking/planetbanking,2081.html.
•
•
•

sustainable infrastructure for urban growth 283
market mechanism developed under the Kyoto Protocol that allows entities with emission reduction requirements in developed countries to buy Certified Emission Reduction (CER) credits from projects in developing countries. The voluntary carbon market is another, albeit small, source of finance. It is being used, among other things, for energy and water projects that deliver climate change mitiga-tion co-benefits (Nakhooda et al. 2011). The CDM provides support alongside other sources of funding (e.g., tax revenues and user fees) to complete a project’s financing package. Payments are received after projects have started being imple-mented and contribute to the project’s cash flow. Because of uncertainties about the post-2012 carbon market plan and carbon prices in the future and the com-plexities of project CER certification, these flows are often not seen as integral to a financing decision but instead are a way to improve an already-viable financial rate of return. An OECD review (Clapp et al. 2010) noted that whereas carbon markets could offer support to viable urban mitigation projects, market activity has been limited.
Projects focused on urban mitigation account for only 10 percent of all projects in the compliance market (Clapp et al. 2010). These are concentrated in a few sectors (energy efficiency, waste management, and energy distribution networks). Barriers include limited city authority to regulate GHG emissions, limited budgets and access to start-up capital, and lack of knowledge and insti-tutional capacity. Further, many types of mitigation programs do not lend them-selves to easy measurement (e.g., citywide transportation strategies).
New products, such as those being developed by the Carbon Partnership Fa-cility (CPF), are looking to develop new methodologies for scaled-up, program-matic approaches while targeting areas that have not been reached effectively by the Clean Development Mechanism. These products aim to pilot citywide carbon finance programs. The first CPF operation currently being planned would support the Green Growth Program of Jordan’s Amman Municipality, which includes potential opportunities in municipal waste, urban transportation, sus-tainable energy, and urban forestry.22
Moving to Practice
The following three cases illustrate several of the strategies and approaches dis-cussed in this chapter. In Mexico the national government is setting a policy framework that, along with innovative financing, is setting the stage to scale up sustainable urban transportation. Jakarta, which has suffered from devastat-ing floods, is working to build resilience by improving its flood management infrastructure while it copes with weak institutional capacity. Austin, a city with vibrant technological and entrepreneurial capacities, is testing new partnerships
22. See http://wbcarbonfinance.org/Router.cfm?Page=Projport&ProjID=65753.

284 Katherine Sierra
and business models to drive innovation as it promotes sustainable energy infra-structure.
scaliNg UP bUs raPid TraNsiT iN mexicoBus rapid transit (BRT) has become increasingly popular among cities seeking to move large numbers of people at a low cost.23 Mexico’s climate change strategy looks to accelerate a shift to energy-efficient, low-carbon mass transit systems, building on the BRT demonstration projects in Mexico City and León.24 Mexi-co’s transportation sector represents 18 percent of the country’s GHG emissions, with emissions from transportation increasing by more than 2 percent a year. This increase is driven by motorization rates that are increasing by about 10 per-cent a year. Mexico’s goal is to have national deployment of BRT and other mass transit solutions in place by 2040, with the country’s carbon footprint from the transportation sector at 2007 levels despite expected growth in the country’s economy (Clean Technology Fund 2009b).
The $2.7 billion program (table 10.4) supports the introduction of citywide BRT programs as part of an integrated package of land use planning, traffic man-agement, and infrastructure investment. The plan is to expand the program in the larger GHG emitters like Mexico City, Guadalajara, Monterrey, Puebla, and León and begin to introduce it in small and medium-size cities like Chihuahua and Mexicali. The program calls for introduction of lower carbon emission ve-hicles, reorganizing fragmented owner-operated services into more efficient pri-vately owned companies, and scrapping displaced vehicles.
Institutional and Political Economy Risks Globally, there are good examples of BRT systems and useful knowledge about implementing them. But individual cities and policy makers seeking to implement BRT systems continue to face knowledge risks (i.e., how to adapt to local circumstances), political risks (re-sistance from fragmented, informal private operators and motorists), and insti-tutional risks (the complexity of managing across the jurisdictions and agencies needed to implement a fully integrated sustainability plan). Mexico’s program is designed to address these barriers by providing a national vision accompanied by supportive policy and regulatory frameworks. This includes a policy frame-work for reorganizing private operators and promoting public-private partner-
23. This trend was documented in a recent review of the BRT literature, which confirmed that BRT systems have mostly been successful in combining the characteristics of rail systems but in a relatively cost-efficient way and with short implementation time. The effects on land use, city form, and land values are not yet well understood (Deng and Nelson 2011).
24. This section draws on project documents prepared for the CTF and World Bank loans for this program (Clean Technology Fund 2009b; World Bank 2010c). It also benefited from input from the World Bank team leader, Arturo Ardita-Gomez. See also www.cambioclimatico.gob .mx/index.php/en/politica-nacional-sobre-cambio-climatico.html.

sustainable infrastructure for urban growth 285
ships in infrastructure development. A national interagency working group was established to facilitate better coordination of planning and implementation at the city level, along with a funding mechanism, which is discussed below.
Competition for Scarce Public Investment Funds These programs require significant capital investment, potentially crowding out other public investment priorities. Mexico is providing incentives to local authorities through the Federal Fund for Infrastructure (FONADIN), which is run by the national development bank (Banobras) and is funded by revenues from toll concessions. PROTRAM, an arm of FONADIN, helps direct resources to finance studies and transport in-frastructure investments through the provision of grants, loans, and guarantees. These resources are complemented by low-cost financing from the CTF, which will further lower capital costs and mitigate risks.25
High Up-Front Costs of Low-Emission Technologies Low-carbon, high- capacity bus technologies have higher capital costs than conventional technolo-gies, and introducing them entails incurring a number of transition costs. These costs include fleet scrapping and replacement programs as well as investment in fueling stations. Mexico has estimated that by adopting advanced hybrid sys-tems for its buses, it could reduce GHG emissions by 40 percent, as compared with standard articulated diesel-powered buses. Yet this would mean incurring high up-front capital costs for procurement that would be expected to be 30 to 40 percent more than for conventional vehicles. Although operating and main-tenance costs would be expected to offset the higher capital costs, the transition costs would remain a barrier.
25. The CTF’s terms are no-interest 20-year loans, with 10 years’ grace on principal repay-ments, a 0.75 percent service charge, and a 0.25 percent management fee.
Table 10.4Mexico’s Urban Transportation Transformation Program Investment Plan
Financing Source Millions of Dollars (US$)
FONADIN 768.5Local governments 738.5Private sector 839.0World Bank 150.0Clean Technology Fund 200.0Total program cost 2,694.0
Note: The GEF is also supporting the program through grants for capacity building.Source: World Bank (2010c).

286 Katherine Sierra
Nascent Domestic Financing for Private Sector Engagement Mexico has implemented a national policy framework for private investment in infrastruc-ture, including provisions for competitive tenders for service provision and con-struction concessions. At the same time, the experiences of Mexico and other de-veloping countries indicate that innovative financing—such as financial products supported by public finance that provide first-loss provisions, equity or quasi-equity, and other forms of risk-sharing guarantees—will be needed to unlock pri-vate capital (Sierra 2011b). FONADIN is tasked with facilitating private capital for infrastructure projects, and it is prepared to take risks that the market will not yet take, including attracting private investors to projects with low yields but high social impact, while providing long-term financing at competitive rates.
bUildiNg resilieNce iN JakarTaJakarta’s floods are an example of the stress experienced by the 890 million peo-ple living in cities that face a high risk of exposure to natural hazards (United Nations 2012).26 A major event in 2007 resulted in the flooding of 70 percent of Jakarta’s metropolitan area, with financial losses topping $880 million. Fac-tors that contribute to the city’s vulnerability include its topography, with 40 per-cent of its area below sea level and 13 rivers flowing through the city, and land subsidence averaging 5 to 10 centimeters a year in the north of the city. The encroachment of the built-up area on critical water catchment areas has resulted in increased rainwater runoff and a lack of natural water retention both in the city and upstream. Canals and drainage systems are in poor condition due to a backlog of maintenance, with significant sediment in the canals and solid waste buildup contributing to flooding (Soehodo 2011).27
Adaptation will require the integration of climate risks into urban manage-ment strategies and investment plans through a combination of soft measures that focus on policies, institutions, knowledge and social cohesion, and ecosys-tem management and hard measures that focus on capital investments. Hard measures will include investment in infrastructure, such as flood protection and seawalls, as well as measures to climate-proof urban infrastructure, like increas-ing the capacity of drains (Satterwaithe et al. 2007; World Bank 2011a). In this vein, Jakarta is moving to integrate climate change adaptation into its devel-opment plans, most recently integrating adaptation and mitigation policies into its 2030 spatial plan.28 Its flood prevention program includes the development
26. This case builds on Sierra (2011a).
27. Related government case studies prepared by the city can be found at http://siteresources .worldbank.org/INTURBANDEVELOPMENT/Resources/336387-1306291319853/CS _ Jakarta.pdf and www.scribd.com/doc/59919883/Jakarta-s-Adaptation-Strategy-Edit.
28. A summary of the Spatial Plan 2030 climate policies can be found in Table 1 of a World Bank case study on the intersection between climate change, disaster risk, and the urban poor (World Bank n.d.).

sustainable infrastructure for urban growth 287
of flood control infrastructure, the improvement of canal drainage systems, the conservation of water areas, the building of sea dikes in the north coastal region, the rehabilitation of mangrove forests, a resettlement policy along the rivers and channels, and the raising of critical road infrastructure (Texier 2008). Commu-nities are also adapting through early warning systems, neighborhood-level ca-nal dredging, and increased house elevations. Nongovernmental organizations are supporting these efforts with education and planning. Jakarta’s government plans to reinforce the use of existing social networks to complement physical interventions through a community empowerment program. Implementation of this plan will be challenging.
Financing Challenges Developed countries have promised global adapta-tion finance as part of their pledge to provide $100 billion a year by 2020 to support both mitigation and adaptation. Grants for adaptation mainly support least developed nations and small island states and will likely provide little to emerging economies like Indonesia. As such, adaptation demands will put pres-sure on local and regional government budgets and move those governments to use other channels for funding, like multilateral development banks.29 The city’s initial $190 million program will finance dredging and rehabilitation of flood-ways, canals, and retention basins, along with development of a flood manage-ment information system. The program is being financed by the local, regional, and national governments ($50 million) along with a $140 million loan from the World Bank and a $500,000 grant from the government of the Netherlands.30 The project is helping implement a new system to transfer funds from the central to local governments as part of Indonesia’s fiscal decentralization program.
Knowledge Gaps Availability of data for decision making is a key con-straint. Spatial information on local impacts is poor and not well integrated with information on socioeconomic vulnerability (Firman et al. 2011). At the same time, there are a number of international efforts under way to fill knowl-edge gaps. Japan has supported studies of the river catchment areas and work on a sewerage master plan; Australia is supporting an urban resilience study; and the Dutch government is providing flood hazard mapping and development
29. Indeed, given the strong linkage between good development practice and the actions needed to build resilience, traditional development assistance programs are also beginning to incor-porate climate adaptation considerations into strategy, programming, and project design. For the urban sector, examples include the review Cities and Climate Change: An Urgent Agenda (World Bank 2010a), which sets out the issues, approaches, and partnerships that will guide its work; flagship studies like the Asian Development Bank/JICA (Japan’s bilateral development agency)/ World Bank report Climate Risks and Adaptation in Asian Coastal Megacities (World Bank 2010b); and the United Nations Habitat report Cities and Climate Change: Policy Direc-tions (United Nations Habitat 2011).
30. The project is described in World Bank (2011c). Amounts are rounded.

288 Katherine Sierra
of a master plan for coastal management and protection. Jakarta has signed an agreement with the city of Rotterdam for knowledge exchange on best practices, and a joint research program to develop climate adaptation tools for Jakarta is bringing together academic researchers from the Netherlands and Indonesia (Ja-karta Climate Adaptation Tools n.d.). Jakarta has also been active in a number of international knowledge-sharing platforms. These include the C40; the Asian Cities Climate Change Resilience Network, which supports a network of cities in Asia (Rockefeller Foundation n.d.); and the Delta Alliance network, which aims to improve the resilience of the world’s deltas through knowledge sharing (Delta Alliance n.d.).
Governance Challenges Jakarta’s own assessment of its implementation experience so far points to poor coordination between the city and provincial governments as a significant barrier. This is especially evident with respect to preserving natural resources, particularly water resource management and en-vironmental protection. Another assessment points to inadequate commitment to the programs by local officials despite public statements (Firman et al. 2011), while the World Bank/government case study points to the complexity of inte-grating climate change, spatial planning, and poverty alleviation. Community engagement is critical, but still a work in progress. The use of community-led processes to support local adaptive responses, despite government plans, has been assessed as uneven.31 The government has also been criticized for inad-equate engagement with the community in the preparation of the Spatial Plan 2030.32 These issues are common in many emerging and developing countries where the demands of implementing complex adaptation strategies strain al-ready low institutional capacity. Building capacity and investing in the soft el-ements of the adaptation agenda will be as important as hard infrastructure investment.
TraNsFormiNg eNergy sysTems ThroUgh iNNovaTioN iN aUsTiNAustin’s Climate Protection Plan, adopted in 2007, aims to build a sustainable city by enacting “policies, procedures, timelines and targets as are necessary to make Austin the leading city in the nation in the effort to reduce and reverse the negative impacts of global warming” (Office of Sustainability 2012, 2). The Austin plan covers the energy, water, waste, transportation, land use, and food sectors. Its energy goals focus on greening the power supply and conserving en-ergy. The city met its goal to have all city facilities powered by renewable energy
31. This was documented in a case study prepared by the World Bank in coordination with the government of Jakarta, which solicited feedback from stakeholders (World Bank n.d.).
32. For example, see the article by Sabarini (2010), which reported on feedback from NGOs concerned about limited public participation.

sustainable infrastructure for urban growth 289
by 2012. The plan also calls for 800 megawatts (MW) of new energy savings through energy efficiency and conservation by 2020. All city facilities, fleets, and operations should also be carbon neutral by that date.
Austin Energy, the city’s utility, is also seeking to be a leader in the field of clean energy. It is the nation’s ninth-largest community-owned electric utility, and its slogan is “More Than Electricity.” It was mandated to achieve a 35 percent share of renewable energy in its portfolio by 2020, and it expects to meet this goal mainly through the purchase of wind-generated power, with current wind contracts for 200 MW expected to increase to 1,000 MW by 2020. Austin En-ergy also aims to increase the commercial solar component in its energy mix to 200 MW.33 It has doubled the share of renewables in its portfolio, from 5.1 per-cent in 2007 to 10.3 percent in 2011 (Austin Energy 2010). The utility has also implemented a number of energy efficiency programs, most recently taking ad-vantage of social media by launching a Facebook application that lets consumers benchmark their own home energy use against that of similar homes (Rule 2012). Austin Energy began to experiment with distributed energy in 2004, with a pro-gram of up-front rebates for the installation of commercial and residential solar systems. In 2010, it introduced a performance-based incentive system that pays for each kilowatt-hour of electricity produced over a 10-year period. Customer-owned solar generation totals 4 MW.
Although Austin’s energy innovation mandates are particularly ambitious, the tools that the city and its utility are using are nonetheless fairly representative of action being taken by other cities in the United States, albeit not always with the same vigor. But Austin—along with San Francisco and other cities leading the way to clean energy—strives to be a technology innovation leader. To this end, the Pecan Street Project was launched in 2008 when a group of public and private stakeholders came together to consider opportunities for Austin to build on its leadership in the semiconductor industry to become a national leader in clean energy.34 These stakeholders went on to form a public-business research consortium to enable the Pecan Street Project to pursue opportunities to reduce carbon emissions (Austin Icons Revisit MCC 2012), jump-start widespread re-newable generation, start companies, create spin-offs, and create new jobs (Pe-can Street Project 2010). The consortium’s members include the city of Austin, Austin Energy, the University of Texas’s Austin Technology Incubator and Clean Energy Incubator, the Chamber of Commerce, the Environmental Defense Fund,
33. As a first installment, it has contracted to purchase the annual output of a 30 MW solar farm, one of the largest in the United States.
34. The Texas Workforce Commission estimated that in 2009 green industries in Austin (in-cluding clean energy technologies) employed 45,672 people. In 2010, there were 175 clean energy technology companies, according to the Chamber of Commerce (Office of Sustain-ability 2012).

290 Katherine Sierra
and 11 private corporate technology partners.35 The project’s key goals are to nurture the development of Austin’s smart grid and to accelerate the introduction of distributed energy systems.
In helping implement the Pecan Street Project, Austin Energy has as a first stage invested in the backbone of a smart grid telecommunications network and its associated hardware (computers and meters) and software applications, con-necting 1 million consumers and 43,000 businesses to power plants and back. The project has championed the emergence of Smart Grid 2.0, which would man-age distributed energy generation, build and manage energy storage, power and communicate with smart consumer appliances, and charge plug-in hybrid and electric vehicles. The project aims to deploy 300 MW of distributed energy by 2020 while using the creation of the Austin Energy smart grid as a “ ‘test lab’ for the many companies that will create the clean technology that the future system will require” (Pecan Street Project 2010, 19).
Testing New Business Models The Pecan Street Project’s working group calls for testing new Austin Energy business models that shift the utility from a volume-driven commodity provider to one that provides services that use the smart grid to integrate energy efficiency and distributed generation. One pos-sibility the group is considering is to pursue a fee-based business model for the provision of services. Customers would become “energy partners” with Austin Energy, and for a fixed fee would make their rooftops available for solar equip-ment and would agree to demand management practices, such as limiting use during peak hours (Pecan Street Project 2010, 16). A new business model, how-ever, must consider the interaction between a traditional energy services business that is based on increasing sales volume and a new partnership service provi-sion model that seeks to conserve energy and therefore decrease energy sales. In Austin, maintaining the utility’s financial integrity is critical not simply for its own sustainability but also because the utility is a major source of revenue for the city.
The Quest for Affordability and Cost Competitiveness Although Austin En-ergy is a partner in the Pecan Street Project, its own strategy continues to stress the achievement of its renewable goals through purchasing commercial-scale renewable wind energy (Austin Energy 2012). The utility is concerned about the potential higher costs of distributed energy, though it is not clear whether it is taking into account benefits like the ability to dynamically respond to minute-by-minute demand throughout the day. The utility’s concern with costs and af-fordability mirrors the findings of a recent Brookings–Hoover Institution report (Banks et al. 2011) on distributed power systems in the United States, which
35. The corporate partners are Applied Materials, Cisco, Dell, Freescale Semiconductor, GE Energy, Gridpoint, IBM, Intel, Microsoft, Oracle, and Sematech.
sustainable infrastructure for urban growth 291
concluded that in most places the levelized costs of distributed energy systems are currently not competitive with those of central station fossil fuel generation. It did note that in some regions, distributed systems are cost competitive, includ-ing medium- and community-scale wind generation. It concluded that traditional economic analysis may not fully capture the range of benefits from decentral-ized systems, such as greater reliability and environmental benefits. The study recommended sustained investment in research and development, concluding that distributed power systems have “the potential to make a significant positive contribution to the US power system” (Banks et al. 2011, xi).
Conclusions
Today, in the face of critical global environmental issues, leading cities are seiz-ing opportunities to meet rising demands for infrastructure while capitalizing on new technologies and approaches to reducing resource use. International and national policy environments that provide incentives, such as the pricing of natu-ral resources like fossil fuels and water to reflect externalities, are needed, as are local policies that promote efficiency. Capital costs of some alternative technolo-gies remain high, and a number of barriers and risks must be overcome. Also needed to bridge this gap is financial support from market mechanisms or from national or international subsidies in the absence of appropriate price signals. But public finance is stretched, so policy makers are looking to innovative financing tools to use scarce public funds to leverage private capital. Cities are also forging new partnerships with the public sector, civil society, business, academia, and researchers that can help them accelerate the implementation of sustainability strategies by sharing their knowledge and by creating an environment for innova-tion in sustainable solutions.
Examples of green growth approaches to support sustainable infrastruc-ture development are found throughout the developed, emerging, and develop-ing economies. Countries like Mexico are showing how they can use national approaches, accompanied by innovative finance, to scale up sustainable trans-portation to provide more efficient services, improve the quality of life through improved air quality, and increase access for the poor. Whether the momentum for innovation will survive Mexico’s change in presidential administrations bears watching. Proponents hope that the grounding of policy changes in legislation, the creation of a stable funding source, and support from a broad base of cities will allow the bus rapid transit program to endure.
Cities like Jakarta are implementing urgent and difficult programs to build resiliency to a changing climate. They are trying to balance a focus on urgently needed infrastructure investments with strategies to strengthen ecosystems and social capacity while building new institutions. Partnerships are forming to im-prove data, share knowledge, and build capacity. The international community needs to support these efforts more vigorously with international climate finance for adaptation.

292 Katherine Sierra
Finally, cities like Austin are setting ambitious targets for reducing their en-ergy footprints. They look to innovate by taking advantage of the proximity of technology centers and partnerships with businesses and researchers to capitalize on advances in information and communications technologies. In doing so, they hope to improve competitiveness and create jobs while also learning lessons that can help create a national energy future with a smaller carbon footprint. But the Austin case also suggests the need for stronger incentives by reflecting the cost of carbon emissions through either a carbon tax or a cap-and-trade scheme, smart grid development, and modifications to energy pricing or reliable but transitional national subsidies.
referencesAustin Energy. 2012. Quarterly briefing (26 January). www.austinenergy.com
/aboutpercent20us/newsroom/Reports/QuarterlyReportJan2012.pdf.———. 2010. Austin Energy resource, generation and climate protection plan to 2020
(22 April). Austin: Austin Energy.Austin icons revisit MCC. 2012. Pecan Street Inc. (8 March). www.pecanstreet.org
/2012/03/austin-icons-revisit-mcc.Banks, J. P., J. Carl, K. Massy, P. Mokrian, J. Simjanovic, D. Slayton, A. G. Wagner,
and L. V. Wood. 2011. Assessing the role of distributed power systems in the U.S. power sector. Washington, DC: Brookings Institution Energy Security Initiative and Hoover Institution Shultz-Stephenson Task Force on Energy Policy.
Berlin, K., R. Hundt, M. Muro, and D. Saha. 2012. State clean energy finance banks: New investment facilities for clean energy deployment. Washington, DC: Brookings-Rockefeller Project on State and Metropolitan Innovation.
Brown, J., and M. Jacobs. 2011. Leveraging private investment: The role of public sec-tor climate finance. London: Overseas Development Institute.
Carbon Disclosure Project. 2011. Cities 2011: Global report on C40 cities. Prepared by KPMG. London: Carbon Disclosure Project.
Center for American Progress and the Global Climate Network. 2010. Leveraging pri-vate finance for clean energy. Washington, DC: Center for American Progress and Global Climate Network.
Clapp, C., A. Leseur, O. Sartor, G. Briner, and J. Corfee-Morlot. 2010. Cities and carbon market finance: Taking stock of cities’ experience with clean development mechanism (CDM) and joint implementation (JI). OECD Environmental Working Paper No. 29. Paris: Organisation for Economic Co-operation and Development.
Clean Technology Fund. 2009a. Investment plan for Egypt, January 29, 2009. Washing-ton, DC: Clean Technology Fund.
———. 2009b. Investment plan for Mexico, January 16, 2009. Washington, DC: Clean Technology Fund.
———. 2009c. Investment plan for the Philippines, December 2009. Washington, DC: Clean Technology Fund.
———. 2009d. Investment plan for Vietnam, November 2009. Washington, DC: Clean Technology Fund.

sustainable infrastructure for urban growth 293
———. 2010a. Investment plan for Colombia, April 2010. Washington, DC: Clean Technology Fund.
———. 2010b. Investment plan for Nigeria, November 2010. Washington, DC: Clean Technology Fund.
———. 2010c. Investment plan for Vietnam supplemental note, June 2010. Washing-ton, DC: Clean Technology Fund.
———. 2011. Update of the investment plan for the Philippines, December 2011. Washington, DC: Clean Technology Fund.
Delta Alliance. N.d. Welcome to the Delta Alliance website. www.delta-alliance.org.Deng, T., and J. D. Nelson. 2011. Recent developments in bus rapid transit: A review of
the literature. Transport Reviews 31(1):69–96.Environmental Audit Committee, House of Commons. 2011. The Green Investment
Bank: Second report of session 2010–11. London: Stationery Office Limited. www.parliament.uk/business/committees/committees-a-z/commons-select /environmental-audit-committee/inquiries/green-investment-bank.
Firman, T., I. Surbakti, I. Idroes, and H. Simarmata. 2011. Potential climate-change related vulnerabilities in Jakarta: Challenges and current status. Habitat Interna-tional 35(2):372–378.
Fuchs, R., M. Conran, and E. Louis. 2011. Climate change and Asia’s coastal urban cit-ies: Can they meet the challenge? Environment and Urbanization Asia 2(1):13–28.
Global Environment Facility. 2009. Investing in sustainable urban transit: The GEF experience, 2009. Washington, DC: Global Environment Facility.
Hultman, N., K. Sierra, and G. Carlock. 2011. Energy and green growth: Recasting the options, re-envisioning sustainability. Washington, DC: Brookings Institution.
International Energy Agency. 2011. World energy outlook 2011. Paris: International Energy Agency.
Jakarta climate adaptation tools. N.d. Delta Alliance. www.delta-alliance.org/projects /jakarta-climate-change-adaptation-tools.
Jenkins, J., M. Muro, T. M. Nordhaus, M. Shellenberger, L. Tawney, and A. Trembath. 2012. Beyond boom and bust: Putting clean tech on a path to subsidy inde-pendence. Washington, DC: Brookings Institution.
Kamal-Chaoui, L., and A. Robert. 2009. Competitive cities and climate change. OECD Regional Development Working Papers 2009/2. Paris: Organisation for Economic Co-operation and Development, Public Governance and Territorial Development Directorate.
Muro, M., J. Rothwell, and D. Saha. 2011. Sizing the clean economy: A national and regional green jobs assessment. Washington, DC: Brookings Institution.
Nakhooda, S., A. Caravani, A. Wenzel, and L. Schalateck. 2011. The evolving climate finance architecture. Climate Fundamentals Briefing 2. London: Overseas Develop-ment Institute and Washington, DC: Heinrich Böll Stiftung North America.
Office of Sustainability, City of Austin. 2012. Climate action annual report, 2010–11. Austin: Office of Sustainability.
Organisation for Economic Co-operation and Development. 2007. Infrastructure to 2030, vol. 2: Mapping policy for electricity, water and transport. Paris: Organisa-tion for Economic Co-operation and Development.
———. 2011a. Cities and climate change, 2011. Paris: Organisation for Economic Co-operation and Development.

294 Katherine Sierra
———. 2011b. Towards green growth: A summary for policy makers and tools for delivering green growth. Paris: Organisation for Economic Co-operation and Development.
———. 2012. The Chicago Proposal for Financing Sustainable Cities, OECD Round-table of Mayors and Ministers, Mobilizing Investments for Urban Sustainability, Job Creation, and Resilient Growth, 8–9 March, Chicago.
Pecan Street Project. 2010. Working group recommendations. Austin: Pecan Street Project.Rockefeller Foundation. N.d. Asian Cities Climate Change Resilience Network
(ACCCRN). www.rockefellerfoundation.org/what-we-do/current-work/developing -climate-change-resilience/asian-cities-climate-change-resilience.
Rule, H. 2012. Facebook app lets Austin Utilities customers compare energy use. Austin Post-Bulletin (4 April). http://postbulletin.com/news/stories/display .php?id=1492061.
Sabarini, P. 2010. Administration open to feedback on spatial plan. Jakarta Post (12 January). www.thejakartapost.com/news/2010/01/12/administration-open -feedback-spatial-plan.html.
Satterthwaite, D., P. Saleemul, H. Reid, and P. R. Lankao. 2007. Adapting to climate change in urban areas: The possibilities and constraints in low- and middle-income nations. International Institute for Environment and Development Human Settle-ments Discussion Paper Series.
Sierra, K. 2011a. Adaptation to climate change in developing country urban deltas: Issues and approaches. Lincoln Institute Working Paper. Cambridge, MA: Lincoln Institute of Land Policy.
———. 2011b. The green climate fund: Options for mobilizing the private sector. Lon-don: Climate and Development Knowledge Network.
Soehodo, S. 2011. Adaptation and vulnerability of Jakarta capital city. Presentation by deputy governor of Jakarta capital city at C40 São Paulo Summit, 30 May–3 June. http://c40citieslive.squarespace.com/storage/Jakarta%20Adaptation.pdf.
Solomon, S., D. Qin, M. Manning, Z. Chen, M. Marquis, K. B. Avery, M. Tignor, and H. L. Miller, eds. 2007. Climate change 2007: The physical science basis—Contri-bution of Working Group I to the Fourth Assessment Report of the Intergovern-mental Panel on Climate Change. New York: Cambridge University Press.
Sydney. 2011. State of the city 2011: Sustainable Sydney 2030. Sydney: Government of Sydney.
Sykes, R., C. Chan, R. Encarnacion, and K. Richards. 2010. How should water utilities prepare for climate change? In Climate change and water: International perspec-tives on mitigation and adaptation, ed. C. Howe, J. B. Smith, and J. Henderson. London: IWA Publishing and Denver: American Water Works Association.
Texier, P. 2008. Floods in Jakarta: When the extreme reveals daily structural constraints and mismanagement. Disaster Prevention and Management 17(3):358–372.
United Nations. 1987. Our common future: Report of the United Nations World Com-mission on Environment and Development. New York: United Nations.
———. 2010. Work stream 7 paper: Public interventions to stimulate private invest-ment in adaptation and mitigation. New York: United Nations High Level Advi-sory Group on Climate Finance.
———. 2012. World urbanization prospects: The 2011 revision. New York: United Nations.

sustainable infrastructure for urban growth 295
United Nations Environment Program. 2011. Cities: Investing in energy and resource efficiency. Nairobi: United Nations Environment Program.
United Nations Habitat. 2011. Global report on human settlements 2011: Cities and climate change—Policies directions. Nairobi: UN Habitat.
Wallis, M., M. Ambrose, and C. Chan. 2009. Climate change: Charting a water course in an uncertain future. In Climate change and water: International perspectives on mitigation and adaptation, ed. C. Howe, J. B. Smith, and J. Henderson. London: IWA Publishing and Denver: American Water Works Association.
World Bank. 2010a. Cities and climate change: An urgent agenda. Washington, DC: World Bank.
———. 2010b. Climate risks and adaptation in Asian coastal megacities: A synthesis report. Washington, DC: World Bank, Asian Development Bank, and Japan Inter-national Cooperation Agency.
———. 2010c. Mexico urban transportation transformation program project appraisal document. www.wds.worldbank.org/external/default/WDSContentServer /WDSP/IB/2010/03/08/000333037_20100308232051/Rendered/PDF/515820 PAD0P107101Official0Use0Only1.pdf.
———. 2010d. World development report 2010: Development and climate change. Washington, DC: World Bank.
———. 2011a. The economics of adaptation to climate change: Synthesis report. Wash-ington, DC: World Bank.
———. 2011b. State and trends of the carbon market: 2011. Washington, DC: World Bank.
———. 2011c. Indonesia: Jakarta urgent flood mitigation project (Jakarta Emergency Dredging Initiative) project appraisal document. 27 December.
———. 2012. Inclusive green growth: The pathway to sustainable development. Wash-ington, DC: World Bank.
———. N.d. Climate change case study: Jakarta—Climate change, disaster risk man-agement and the urban poor. Washington, DC: World Bank. http:// siteresources.worldbank.org/INTURBANDEVELOPMENT/Resources/336387 -1296405826983/Ellis-Lee.pdf.